UNITED STATES
SECURITIES AND EXCHANGE COMMISSION
Washington, D.C. 20549
FORM N-CSR
CERTIFIED SHAREHOLDER REPORT OF
REGISTERED MANAGEMENT INVESTMENT COMPANIES
Investment Company Act file number: 811-22975
AllianzGI Institutional Multi-Series Trust
(Exact name of registrant as specified in charter)
1633 Broadway, New York, NY 10019
(Address of principal executive offices) (Zip code)
Lawrence G. Altadonna
1633 Broadway, New York, NY 10019
(Name and address of agent for service)
Registrant’s telephone number, including area code: 212-739-3371
Date of fiscal year end: September 30
Date of reporting period: March 31, 2017
Item 1. Report to Shareholders
AllianzGI Institutional Multi-Series Trust
Semi-Annual Report
March 31, 2017
Table of Contents
| 2 - 9 | ||
| 10-11 | ||
| 12-38 | ||
| 39-40 | ||
| 41 | ||
| 42-43 | ||
| 44-45 | ||
| 46-61 | ||
| 62-63 | ||
AllianzGI Advanced Core Bond Portfolio
(unaudited)
For the period of October 1, 2016 through March 31, 2017, as provided by Christian Tropp, CFA, Portfolio Manager.
| Portfolio Insights |
Performance Overview
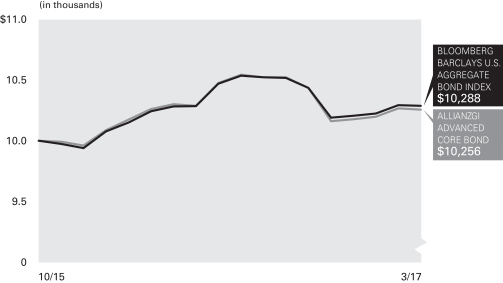
For the six-month period ended March 31, 2017, the AllianzGI Advanced Core Bond Portfolio (the “Portfolio”) returned -2.54%, underperforming the Bloomberg Barclays US Aggregate Bond Index (the “benchmark”), which returned -2.18%.
Market Overview
Recent moves in yields seem to have been driven by inflation expectations and term premia, as headline inflation figures rose over the last year due to positive base effects, as well as higher energy and raw material prices. Even after the termination of asset purchases, the monetary base remains large. The US Federal Reserve (the “Fed”) is not selling its holdings yet and is reinvesting maturing bonds, although the Federal Open Market Committee (the “FOMC”) minutes from the March 2017 meeting revealed that “most participants anticipated that gradual increases in the federal funds rate would continue and judged that a change to the Committee’s reinvestment policy would likely be appropriate later this year.” Speculative futures traders seem to have recently reduced their short positions. With regard to economic dynamics, industrial production and capacity utilization increased in March 2017, while the Philadelphia Fed Business Outlook Survey fell sharply, as did the
Empire Manufacturing Index. Housing starts fell in March, while building permits and existing home sales increased.
Portfolio Review
We conducted an attribution analysis for the reporting period using a factor attribution model. The results indicated that duration positioning, term structure allocation and quality allocation have been positive contributors to relative performance. At the same time, sector and yield allocation seem to have been negative contributors, while currency positioning has been neutral. In addition to these factors, individual bond selection was a positive contributor to performance, either due to bonds that have performed well for idiosyncratic reasons on the secondary market or which have delivered a premium to others which materialized, such as new issue premia.
Outlook
Generally, we still expect a slight improvement in economic dynamics. This is supported by domestic demand given the good labor market conditions, including a healthy housing market. Risks stem mainly from slow investment activity and from global uncertainties. Additionally, slow wage growth could become a problem for recovery in the US, while the unspecified
economic plans of President Trump have also added to the uncertainty. Concerning inflation, especially in the upcoming months, we believe the impact of positive base effects, as well as higher energy and raw material prices, will abate. We believe this lead to a stabilization of inflation figures. In regards to monetary policy, if the Fed’s outlook remains broadly intact, we expect two more interest rate hikes this year. Moreover, we expect a change to the Fed’s balance sheet reinvestment policy later this year, although we regard a phasing out of reinvestments as more prudent rather than a complete end to reinvestments all at once. Additionally, a potential fiscal stimulus program represents an upside risk to the Fed’s dot chart indication, but more so for 2018. The expected rate hikes are not fully priced in as of yet, and might exert pressure on the long end of the curve. The unexpected inflationary pressures or changes in Fed communication, with respect to the gradual path of rate increases and the lower terminal rate, could trigger a repricing. However, feedback loops (stronger US dollar & rising yields), global geopolitical, and economic risk factors, as well as central bank policy divergence, could limit the pace of monetary policy normalization and might lead to slower rate hikes.
| Average Annual Total Return for the period ended March 31, 2017 |
| 6 Month* | 1 Year | Since Inception† | ||||||
| AllianzGI Advanced Core Bond Portfolio | -2.54% | -0.06% | 1.80% | |||||
| Bloomberg Barclays US Aggregate Bond Index †† | -2.18% | 0.44% | 2.02% | |||||
* Cumulative Returns
† The Portfolio began operations on 10/30/15. Benchmark return comparisons began on the portfolio inception date.
†† The Bloomberg Barclays US Aggregate Bond Index is composed of securities from the Bloomberg Barclays Government/Credit Bond Index, Mortgage-Backed Securities Index, and Asset-Backed Securities Index. It is generally considered to be representative of the domestic, investment grade fixed rate, taxable bond market (as of March 31, 2017). Index returns reflect the reinvestment of income dividends and capital gains, if any, but do not reflect fees, brokerage commissions or other expenses of investing. It is not possible to invest directly in an index.
Performance quoted represents past performance and is no guarantee of future results. Current performance may be lower or higher than performance shown. Investment return and the principal value will fluctuate. Shares may be worth more or less than original cost when redeemed. Returns do not reflect deduction of taxes that a shareholder would pay on portfolio distributions or redemption of portfolio shares. Total return performance assumes that all dividends and capital gain distributions were reinvested on the payable date. The Portfolio’s gross expense ratio is 0.55%. This ratio does not include an expense reduction, contractually agreed to through January 31, 2018. The Portfolio’s expense ratio net of this reduction is 0.35%. Expense ratio information is as of the Portfolio’s current Private Placement Memorandum (“PPM”) dated February 1, 2017.
Portfolio Review commentary is based on the Wilshire Axiom Performance Attribution Analysis. Wilshire Axiom uses a position based approach and performance is linked daily. Please note that the different prices and different methodologies used in this attribution report, among others, may cause deviation in return figures to official performance.
| 2 | Semi-Annual Report / March 31, 2017 |
AllianzGI Advanced Core Bond Portfolio
(unaudited) (continued)
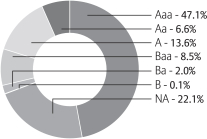
Industry/Sectors (as of March 31, 2017) |
| |||
| U.S. Treasury Notes | 44.1% | |||
| Banks | 12.9% | |||
| Sovereign Debt Obligations | 12.5% | |||
| Fannie Mae | 12.0% | |||
| Ginnie Mae | 7.9% | |||
| Freddie Mac | 7.7% | |||
| U.S. Treasury Bonds | 6.4% | |||
| Telecommunications | 2.1% | |||
| Other | 20.0% | |||
| Cash & Equivalents — Net | -25.6% | |||
Moody’s Ratings* (as of March 31, 2017)
(as a % of total investments)
Cumulative Returns Through March 31, 2017 |
* As a percentage of total investments. Bond ratings refer to the underlying holdings of the Portfolio and are categorized from highest to lowest credit quality using ratings provided by Moody’s. Moody’s ratings have been selected for several reasons, including the access to information and materials provided by Moody’s, as well as the Portfolio’s consideration of industry practice. See “Important Information” for more detail on the selection of Moody’s for the Portfolio’s ratings presentation. Bonds not rated by Moody’s and bonds that do not currently have a rating available are designated in the chart above as “NR” and “NA”, respectively.
| Shareholder Expense Example | Actual Performance | |
Beginning Account Value (10/1/16) | $1,000.00 | |
Ending Account Value (3/31/17) | $ 974.60 | |
Expenses Paid During Period | $ 1.72 | |
| Hypothetical Performance | ||
| (5% return before expenses) | ||
Beginning Account Value (10/1/16) | $1,000.00 | |
Ending Account Value (3/31/17) | $1,023.19 | |
Expenses Paid During Period | $ 1.77 | |
Expenses (net of reimbursement, if any) are equal to the annualized expense ratio (0.35%), multiplied by the average account value over the period, multiplied by 182/365.
| 3 | Semi-Annual Report / March 31, 2017 |
AllianzGI Best Styles Global Managed Volatility Portfolio
(unaudited)
For the period of October 1, 2016 through March 31, 2017, as provided by Christian McCormick, Senior Product Specialist.
| Portfolio Insights |
Performance Overview
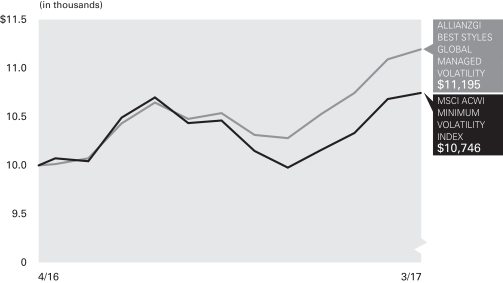
For the six-month period ended March 31, 2017, the AllianzGI Best Styles Global Managed Volatility Portfolio (the “Portfolio”) returned 6.22%, outperforming the MSCI ACWI Minimum Volatility Index (the “benchmark”), which returned 2.72%.
Market Overview
Global equities closed 2016 with strong returns, despite suffering the worst start to a year in decades, as renewed fears about a slowdown in China and a further decline in oil prices led to a significant sell-off in the first six weeks of 2016. Having recouped these losses, the UK’s unexpected vote in favor of leaving the EU led to another bout of weakness in late June 2016. Share prices recovered once more, ending the year with a Trump-inspired rally amid hopes of tax cuts and a more pro-growth policy stance. Global equities rallied over the first three months of 2017, buoyed by signs of strengthening growth and optimism over company earnings, although the rally faded towards the end of the first quarter of 2017. In
terms of monetary policy, the European Central Bank and Bank of Japan continued with their easing policy, while the US Federal Reserve (the “Fed”) raised interest rates in December 2016 by 25 basis points and then again in the first quarter of 2017 by an additional 25 basis points, reflecting an improving macro-economic environment in the US.
Portfolio Review
The Best Styles strategies implement a well-diversified blend of the five long-term successful investment styles value, momentum, earnings revisions, growth and quality. Over the reporting period, the value style outperformed the benchmark by approximately 8%, delivering a rebound in relative performance after having been mostly stagnant since 2009. The majority of the performance came in the fourth quarter of 2016. The other four investment styles had negative relative performance.
The Best Styles strategy has only moderate leeway for sector allocation with a maximum deviation of 3% versus the benchmark for active sector weightings. The overall contribution
from active sector allocation was positive at about 60 basis points. Financials and real estate were the largest relative contributors at 21 basis points and 25 basis points, respectively. Country allocation effect was also neutral with no attribution of note.
Best Styles holds a broad number of stocks to implement a well-diversified mix of investment styles and assigns a maximum active weighting of 1% to individual stocks. Individual stocks contributed positively during the reporting period. Stocks from the financials and real estate sectors contributed 80 and 60 basis points, respectively. In addition, over half of the outperformance came from stock selection in North America, in which US and Canadian stocks contributed an aggregate 190 basis points.
Outlook
Best Styles will continue to be overweight in stocks with attractive valuation and stocks with positive momentum and positive revisions, in line with the longer term strategic investment style mix.
| Cumulative Return for the period ended March 31, 2017 |
| 6 Month | Since Inception† | |||
| AllianzGI Best Styles Global Managed Volatility Portfolio | 6.22% | 11.96% | ||
| MSCI ACWI Minimum Volatility Index †† | 2.72% | 7.46% | ||
† The Portfolio began operations on April 11, 2016. Benchmark return comparisons began on the portfolio inception date.
†† The MSCI ACWI Minimum Volatility Index aims to reflect the performance characteristics of a minimum variance strategy applied to large and mid cap equities across Developed Markets and Emerging Markets countries. The index is calculated by optimizing the MSCI ACWI Index, its parent index, for the lowest absolute risk (within a given set of constraints). Historically, the index has shown lower beta and volatility characteristics relative to the MSCI ACWI Index.
Performance quoted represents past performance and is no guarantee of future results. Current performance may be lower or higher than performance shown. Investment return and the principal value will fluctuate. Shares may be worth more or less than original cost when redeemed. Returns do not reflect deduction of taxes that a shareholder would pay on portfolio distributions or redemption of portfolio shares. Total return performance assumes that all dividends and capital gain distributions were reinvested on the payable date. The Portfolio’s gross expense ratio is 0.95%. This ratio does not include an expense reduction, contractually agreed to through January 31, 2018. The Portfolio’s expense ratio net of this reduction is 0.45%. Expense ratio information is as of the Portfolio’s current PPM dated February 1, 2017.
| 4 | Semi-Annual Report / March 31, 2017 |
AllianzGI Best Styles Global Managed Volatility Portfolio
(unaudited) (continued)
Country Allocation (as of March 31, 2017) |
| |||
| United States | 55.7% | |||
| Japan | 11.4% | |||
| Taiwan | 4.7% | |||
| Canada | 3.6% | |||
| Switzerland | 2.5% | |||
| France | 2.5% | |||
| Hong Kong | 2.0% | |||
| Korea (Republic of) | 1.7% | |||
| Other | 13.5% | |||
| Cash & Equivalents — Net | 2.4% | |||
Cumulative Returns Through March 31, 2017 |
| Shareholder Expense Example | Actual Performance | |
Beginning Account Value (10/1/16) | $1,000.00 | |
Ending Account Value (3/31/17) | $1,062.20 | |
Expenses Paid During Period | $ 2.31 | |
| Hypothetical Performance | ||
| (5% return before expenses) | ||
Beginning Account Value (10/1/16) | $1,000.00 | |
Ending Account Value (3/31/17) | $1,022.69 | |
Expenses Paid During Period | $ 2.27 | |
Expenses (net of reimbursement, if any) are equal to the annualized expense ratio (0.45%), multiplied by the average account value over the period, multiplied by 182/365.
| 5 | Semi-Annual Report / March 31, 2017 |
AllianzGI Discovery U.S. Portfolio
(unaudited)
For the period of October 1, 2016 through March 31, 2017, as provided by Raymond Cunha, CFA, Lead Portfolio Manager.
| Portfolio Insights |
Performance Overview
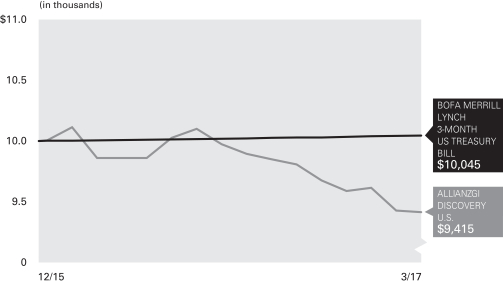
For the six-month period ended March 31, 2017, the AllianzGI Discovery U.S. Portfolio (the “Portfolio”) returned -4.40%, underperforming the BofA Merrill Lynch 3-Month US Treasury Bill Index (the “benchmark”), which returned 0.19%.
Market Overview
During the reporting period, the US equity market surged 14.3% post presidential election, as measured by the S&P 500. This gain reflected a variety of factors which included optimism that the Trump administration would provide a relatively more pro-business and less regulatory environment than the Obama administration. This optimism would hopefully help reaccelerate sluggish US corporate profitability; energy prices, particularly crude oil prices, further recovering and stabilizing over $50 per barrel versus the high $20’s low seen in early 2016; and a pickup in emerging market economies and their stock markets. Meanwhile, the US Federal Reserve (the “Fed”), sighting progress in achieving its dual inflation and employment goals, lifted interest rates 25 basis points in both December 2016 and March 2017. The Fed has signaled its intention to raise rates several more times in 2017, as well as possibly shrinking its massive balance sheet. For the most part, the United States economy has performed solidly, although the most recent April employment report missed expectations.
Portfolio Review
The Portfolio’s negative 4.4% return reflected a confluence of several factors, affecting both the long and short portfolios. It was a difficult period for shorting in general. In the short portfolio, the impact was due to negative stock selection in technology, consumer discretionary and industrials. After President Trump’s election, many low quality stocks that the Portfolio was short, rose as what we believe was either structurally impaired or cyclically challenged companies rallied. Additionally, it was an active period for mergers and acquisitions (“M&A”) as some companies the Portfolio were short were acquired. Finally, despite the S&P 500’s strong gain during the period, the long book was negatively impacted by losses or low positive contributions in several sectors including consumer staples, industrials and energy.
The Portfolio’s individual GICS sector net exposure is generally limited to the range of +/-5%. For the reporting period, the top three positive net sector contributions were generated from largest to smallest, in financials, healthcare and materials, respectively. Net sector detractors (in the same order) included technology, industrials and consumer discretionary. In financials, the Portfolio benefited from its net long exposure post presidential election as financials rallied on the
prospect of higher interest rates and the hope for deregulation. The negative contribution from technology was a result of adverse stock selection in both the long and short books.
During the reporting period, the top long contributor was JP Morgan Chase & Co. and the largest long detractor was Palo Alto Networks. JP Morgan rose with strong operating results and the surge in financials post-election. The largest individual company short contributor was Brookdale Senior Living. The largest short detractor was the I Shares PHLX Semiconductor ETF, as the semiconductor industry was helped by the continued wave of M&A and the expected iPhone refresh for Apple.
Outlook
In general, given the Fed’s and other developed world’s dovish monetary policy bias, it has been a relatively difficult environment for shorting stocks, as the easy monetary policy has encouraged the “risk on” trade and financial asset inflation. However, as we enter the new reporting period, we are hopeful that the environment for shorting will improve as the Fed has embarked on normalizing monetary policy. As we enter the second quarter of 2017, the Portfolio is positioned with modest positive net exposure (about 5%).
| Average Annual Total Return for the period ended March 31, 2017 |
| 6 Month* | 1 Year | Since Inception† | ||||||||
| AllianzGI Discovery U.S. Portfolio | -4.40% | -4.53% | -4.62% | |||||||
| BofA Merrill Lynch 3-Month US Treasury Bill Index †† | 0.19% | 0.36% | 0.35% | |||||||
* Cumulative Returns
† The Portfolio began operations on December 21, 2015. Benchmark return comparisons began on the portfolio inception date.
†† The BofA Merrill Lynch 3-Month US Treasury Bill Index tracks the performance of the 3-month US Treasury markets. Index returns reflect the reinvestment of income dividends and capital gains, if any, but do not reflect fees, brokerage commissions or other expenses of investing. It is not possible to invest directly in an index.
Performance quoted represents past performance and is no guarantee of future results. Current performance may be lower or higher than performance shown. Investment return and the principal value will fluctuate. Shares may be worth more or less than original cost when redeemed. Returns do not reflect deduction of taxes that a shareholder would pay on portfolio distributions or redemption of portfolio shares. Total return performance assumes that all dividends and capital gain distributions were reinvested on the payable date. The Portfolio’s gross expense ratio is 5.55%. This ratio does not include an expense reduction, contractually agreed to through January 31, 2018, where the manager agrees to irrevocably waive its management fee and/or reimburse the Portfolio to the extent that gross expense ratio, excluding interest, tax, dividend expenses on short sales, and extraordinary expenses, and certain credits and other expenses , exceed 1.50%. The Portfolio’s expense ratio net of this reduction is 3.20%, which includes dividend expenses on short sales which are estimated to be 1.70%. Expense ratio information is as of the Portfolio’s current PPM dated February 1, 2017.
| 6 | Semi-Annual Report / March 31, 2017 |
AllianzGI Discovery U.S. Portfolio
(unaudited) (continued)
Industry/Sectors (as of March 31, 2017) |
| |||
| Banks | 9.2% | |||
| Software | 8.9% | |||
| Semiconductors & Semiconductor Equipment | 8.4% | |||
| Capital Markets | 5.0% | |||
| Biotechnology | 4.8% | |||
Food Products | 4.5% | |||
| Pharmaceuticals | 4.5% | |||
| Other | 50.2% | |||
| Securities Sold Short* | -88.8% | |||
| Cash & Equivalents — Net | 93.3% | |||
* Table below details the industry/sectors allocation for securities sold short
Industry/Sectors — Securities Sold Short |
| |||
| Exchange-Traded Funds | -7.6% | |||
| Food & Staples Retailing | -5.0% | |||
| Software | -4.5% | |||
Banks | -4.0% | |||
| Equity Real Estate Investment Trusts (REITS) | -3.8% | |||
| Air Freight & Logistics | -3.5% | |||
| Health Care Providers & Services | -3.4% | |||
| Capital Markets | -3.1% | |||
| Specialty Retail | -2.8% | |||
| Other | -51.1% | |||
Cumulative Returns Through March 31, 2017 |
| Shareholder Expense Example | Actual Performance | |
Beginning Account Value (10/1/16) | $1,000.00 | |
Ending Account Value (3/31/17) | $ 956.00 | |
Expenses Paid During Period | $ 15.46 | |
| Hypothetical Performance | ||
| (5% return before expenses) | ||
Beginning Account Value (10/1/16) | $1,000.00 | |
Ending Account Value (3/31/17) | $1,009.12 | |
Expenses Paid During Period | $ 15.88 | |
Expenses (net of reimbursement, if any) are equal to the annualized expense ratio (3.17%, multiplied by the average account value over the period, multiplied by 182/365.
| 7 | Semi-Annual Report / March 31, 2017 |
AllianzGI Global Small-Cap Opportunities Portfolio
(unaudited)
For the period of October 1, 2016 through March 31, 2017, as provided by Mark P. Roemer, Portfolio Manager.
| Portfolio Insights |
Performance Overview
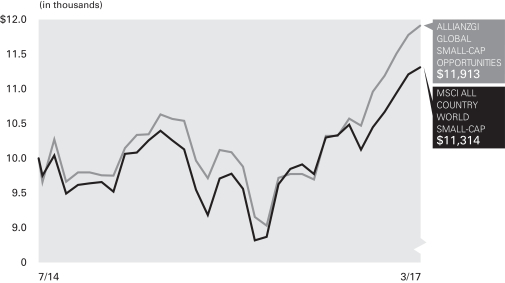
For the six-month period ended March 31, 2017, the AllianzGI Global Small-Cap Opportunities Portfolio (the “Portfolio”) returned 12.67%, outperforming the MSCI All Country World Small-Cap Index (the “benchmark”), which returned 7.90%.
Market Overview
During the reporting period, the macroeconomic environment was constructive, with higher global growth expectations and positive investor sentiment, translating to steady gains for global small-cap equities.
Initially, the benchmark posted a loss in October 2016 amid election uncertainty in the United States. Donald Trump’s surprise presidential victory raised hopes that his pro-growth policies would boost global profits, outweighing fears of greater protectionism. The benchmark performance was consistent, posting positive low-single-digit returns in the latter five months of the reporting period. Commodities delivered mixed returns, with energy prices initially strengthened following the news that the Organization of Petroleum Exporting Companies (“OPEC”) had agreed to cut production, only to see those gains subside toward the end of the reporting period due to concerns of rising supply. A more optimistic growth outlook boosted prices for many industrial metals, such as copper, but gold lost ground. In this environment, the returns for global small-cap equity results were in line with their large-cap counterparts.
During the reporting period, the majority of countries in the benchmark were positive, led by results in emerging markets, which generally outpaced their developed market counterparts. Russia, Poland and Greece were the top performers for the reporting period, while larger benchmark names, including the United States, Japan and the United Kingdom advanced more modestly.
Meanwhile, Egypt, Turkey and the United Arab Emirates were among the decliners due in part to country-specific geopolitical volatility. Sector results were broadly positive, with 10 out of 11 sectors advancing. Financials, utilities, industrials and materials were among the double-digit gainers, while real estate posted only a modest loss during the reporting period.
Portfolio Review
The Portfolio seeks to benefit from the vast inefficiencies in global small-cap equities. During the reporting period, the Portfolio outpaced the benchmark thanks to positive stock selection as well as allocation decisions at the country level.
Specifically, country results were led by bottom-up selections in the United States. Stockpicking in Thailand and South Korea contributed positively to results, as did an overweight allocation to Russia. Conversely, selections in China trailed the benchmark, as did an overweight allocation to New Zealand and an underweight to India. Sector performance was led by bottom-up stockpicking in the information technology, energy, real estate and
industrials sectors. Meanwhile, health care was the primary laggard due to selections in health care providers and pharmaceutical industries. An underweight allocation to the financials sector, the top performer for the benchmark, detracted more modestly.
Outlook
Our outlook for global small-cap equities is positive against the backdrop of accelerating global GDP growth expectations and generally accommodative monetary policies. The United States, which is more than half of the weight of the benchmark, is a key driver of global expectations. The low unemployment rate of 4.7% and the healthy housing market directly translate to a high level of consumer confidence. The potential for health care reform, decreased regulation and corporate tax cuts provide investors a carrot, although any hiccups in the road could lead to bouts of higher volatility. The wildcard remains how the new Trump administration will carry through with campaign promises to transform the economy, and the corresponding impact on global growth expectations. Although the price-to-earnings ratio of global small-cap equities has increased in recent quarters, this valuation ratio is in line with historical figures and by no means excessive. We believe that company-specific earnings results will ultimately dictate performance, which bodes well for our behavioral finance-focused investment process.
| Average Annual Total Return for the periods ended March 31, 2017 |
| 6 Month* | 1 Year | Since Inception† | ||||||||
| AllianzGI Global Small-Cap Opportunities Portfolio | 12.67% | 22.57% | 6.73% | |||||||
| MSCI All Country World Small-Cap Index †† | 7.90% | 17.50% | 4.70% | |||||||
* Cumulative Returns
† The Portfolio began operations on July 23, 2014. Benchmark return comparisons began on the portfolio inception date.
†† The MSCI All Country World Small-Cap Index captures small-cap representation across developed markets and emerging markets countries. The Index covers about 14% of the free float-adjusted market capitalization in each country (as of September 30, 2016). Index returns reflect the reinvestment of income dividends and capital gains, if any, but do not reflect fees, brokerage commissions or other expenses of investing. It is not possible to invest directly in an index.
Performance quoted represents past performance and is no guarantee of future results. Current performance may be lower or higher than performance shown. Investment return and the principal value will fluctuate. Shares may be worth more or less than original cost when redeemed. Returns do not reflect deduction of taxes that a shareholder would pay on portfolio distributions or redemption of portfolio shares. Total return performance assumes that all dividends and capital gain distributions were reinvested on the payable date. The Portfolio’s gross expense ratio is 5.48%. This ratio does not include an expense reduction, contractually agreed to through January 31, 2018. The Portfolio’s expense ratio net of this reduction is 1.20%. Expense ratio information is as of the Portfolio’s current PPM dated February 1, 2017.
| 8 | Semi-Annual Report / March 31, 2017 |
AllianzGI Global Small-Cap Opportunities Portfolio
(unaudited) (continued)
Country Allocation (as of March 31, 2017) |
| |||
| United States | 51.4% | |||
| Japan | 11.5% | |||
| China | 6.1% | |||
| Singapore | 4.9% | |||
| Taiwan | 3.9% | |||
| Russian Federation | 3.2% | |||
| Korea (Republic of) | 3.2% | |||
Poland | 3.1% | |||
| Other | 12.8% | |||
| Cash & Equivalents — Net | -0.1% | |||
Cumulative Returns Through March 31, 2017 |
| Shareholder Expense Example | Actual Performance | |
Beginning Account Value (10/1/16) | $1,000.00 | |
Ending Account Value (3/31/17) | $1,126.70 | |
Expenses Paid During Period | $ 6.36 | |
| Hypothetical Performance | ||
| (5% return before expenses) | ||
Beginning Account Value (10/1/16) | $1,000.00 | |
Ending Account Value (3/31/17) | $1,018.95 | |
Expenses Paid During Period | $ 6.04 | |
Expenses (net of reimbursement, if any) are equal to the annualized expense ratio (1.20%), multiplied by the average account value over the period, multiplied by 182/365.
| 9 | Semi-Annual Report / March 31, 2017 |
AllianzGI Institutional Multi-Series Trust
Important Information (unaudited)
As of March 31, 2017, AllianzGI Institutional Multi-Series Trust (the “Trust”) consisted of four investment series, AllianzGI Advanced Core Bond Portfolio, AllianzGI Best Styles Global Managed Volatility Portfolio, AllianzGI Discovery U.S. Portfolio and AllianzGI Global Small-Cap Opportunities Portfolio, (each a “Portfolio” and collectively the “Portfolios”). The Portfolios each currently offer one share class.
The Cumulative Returns charts for each Portfolio assume the initial investment was made on the first day of each Portfolio’s initial fiscal year. Results assume that all dividends and capital gain distributions, if any, were reinvested. They do not take into account the effect of taxes. The benchmark cumulative return began on the last day of the month of each Portfolio’s inception date.
The following disclosure provides important information regarding each Portfolio’s Shareholder Expense Example, which appears on each Portfolio Summary page in this Semi-Annual report. Please refer to this information when reviewing the Shareholder Expense Example for each Portfolio.
Shareholder Expense Example
Shareholders incur two types of costs: (1) transaction costs; and (2) ongoing costs, including investment management fees and other Portfolio expenses. The Shareholder Expense Example is intended to help shareholders understand ongoing costs (in dollars) of investing in a Portfolio and to compare these costs with the ongoing costs of investing in other mutual funds. The Shareholder Expense Example is based on $1,000.00 invested at the beginning of the period, as indicated, and held for the entire period through March 31, 2017.
Actual Expenses
The information in the table under the heading “Actual Performance” provides information about actual account values and actual expenses. You may use the information in this column, together with the amount you invested, to estimate the expenses that you paid over the period. Simply divide your account value by $1,000.00 (for example, an $8,600.00 account value divided by $1,000.00 = 8.6), then multiply the result by the number in the row titled “Expenses Paid During Period” to estimate the expenses you paid on your account during this period.
Hypothetical Example for Comparison Purposes
The information in the tables for “Hypothetical Performance (5% return before expenses)” provides information about hypothetical account values and hypothetical expenses based on a Portfolio’s actual expense ratio and an assumed rate of return of 5% per year before expenses, which is not each Portfolio’s actual return. The hypothetical account values and expenses may not be used to estimate the actual ending account balance or expenses you paid for the period. You may use this information to compare the ongoing costs of investing in a Portfolio and other funds. To do so, compare this 5% hypothetical example with the 5% hypothetical examples that appear in the shareholder reports of other funds.
Please note that the expenses shown in the table are meant to highlight your ongoing costs only and do not reflect any transactional costs. Therefore, the information for “Hypothetical Performance (5% return before expenses)” is useful in comparing ongoing costs only, and will not help you determine the relative total costs of owning different funds. In addition, if these transactional costs were included, your costs would have been higher.
Proxy Voting
The Portfolios’ Investment Manager has adopted written proxy voting policies and procedures (“Proxy Policy”) as required by Rule 206(4)-6 under the Investment Advisers Act of 1940. The Proxy Policy has been adopted by the Trust as the policies and procedures that the Investment Manager will use when voting proxies on behalf of each Portfolio. Copies of the written Proxy Policy and the factors that the Investment Manager may consider in determining how to vote proxies for each Portfolio, and information about how each Portfolio voted proxies relating to portfolio securities held during the most recent twelve-month period ended June 30, are available without charge, upon request, by calling 1-800-498-5413, on the Allianz Global Investors Distributions website at us.allianzgi.com and on the Securities and Exchange Commission’s (“SEC”) website at http://www.sec.gov.
| 10 | Semi-Annual Report/ March 31, 2017 |
Form N-Q
The Trust files complete schedules of each Portfolio’s holdings with the SEC on Form N-Q for the first and third quarters of each fiscal year, which are available on the SEC’s website at http://www.sec.gov. A copy of the Trust’s Form N-Q is available without charge, upon request, by calling 1-800-498-5413. In addition, the Trust’s Form N-Q may be reviewed and copied at the SEC’s Public Reference Room in Washington, DC. Information on the operation of the Public Reference Room may be obtained by calling 1-800-SEC-0330.
Credit Ratings
Bond ratings apply to the underlying holdings of a Portfolio and not the Portfolio itself and are divided into categories ranging from highest to lowest credit quality, determined for purposes of presentations in this report by using ratings provided by Moody’s Investors Service, Inc. (“Moody’s”).
Unless otherwise noted, presentations of credit ratings information in this report use ratings provided by Moody’s because of, among other reasons, the access to background information and other materials provided by Moody’s, as well as the Portfolios’ considerations of industry practice.
Bonds not rated by Moody’s or bonds that do not have a rating available are designated as “NR” and “NA”, respectively. Credit quality ratings assigned by a rating agency are subjective opinions, not statements of fact, and are subject to change periodically, even as frequently as daily. Ratings assigned by Moody’s or another rating agency are not absolute standards of credit quality and do not evaluate market risk. Rating agencies may fail to make timely changes in credit ratings, and an issuer’s current financial condition may be better or worse than a rating indicates. In formulating investment decisions for the applicable Portfolios, Allianz Global Investors U.S. LLC, the sub-adviser to the Portfolios, develops its own analysis of the credit quality and risks associated with individual debt instruments, rather than relying exclusively on rating agencies or third-party research.
All the information on the Portfolio Summary pages, including Portfolio Insights, Average Annual Total Return Tables, Cumulative Return Charts, Shareholder Expense Examples and Allocation/Credit Rating Summaries is unaudited.
Allianz Global Investors Distributors LLC, 1633 Broadway, New York, NY, 10019, us.allianzgi.com, 1-800-498-5413.
| 11 | Semi-Annual Report/ March 31, 2017 |
March 31, 2017 (unaudited)
AllianzGI Advanced Core Bond Portfolio
| Principal Amount (000s) | Value | |||||||
U.S. TREASURY OBLIGATIONS - 50.5% | ||||||||
U.S. Treasury Bonds, | ||||||||
2.25%, 8/15/46 | $ | 1,300 | $ 1,099,871 | |||||
2.50%, 2/15/45 | 1,170 | 1,051,264 | ||||||
3.125%, 2/15/42 | 1,305 | 1,335,306 | ||||||
3.125%, 2/15/43 | 1,300 | 1,325,822 | ||||||
3.50%, 2/15/39 | 1,550 | 1,705,969 | ||||||
4.75%, 2/15/41 | 1,260 | 1,649,887 | ||||||
5.50%, 8/15/28 | 1,300 | 1,688,197 | ||||||
6.00%, 2/15/26 | 650 | 840,226 | ||||||
U.S. Treasury Notes, | ||||||||
0.75%, 9/30/18 | 5,600 | 5,564,451 | ||||||
1.125%, 9/30/21 | 3,000 | 2,902,266 | ||||||
1.25%, 10/31/18 (d) | 22,260 | 22,279,121 | ||||||
1.375%, 3/31/20 | 1,670 | 1,662,824 | ||||||
1.50%, 12/31/18 | 3,150 | 3,165,013 | ||||||
1.50%, 8/15/26 | 1,000 | 925,157 | ||||||
1.625%, 3/31/19 | 1,500 | 1,510,605 | ||||||
1.625%, 5/15/26 | 350 | 328,296 | ||||||
1.75%, 10/31/20 | 1,530 | 1,533,615 | ||||||
1.75%, 3/31/22 | 1,170 | 1,158,986 | ||||||
1.75%, 1/31/23 | 1,490 | 1,462,295 | ||||||
1.875%, 10/31/22 | 1,620 | 1,604,686 | ||||||
2.00%, 11/15/26 | 1,500 | 1,448,935 | ||||||
2.125%, 1/31/21 | 3,240 | 3,284,741 | ||||||
2.125%, 6/30/22 | 2,900 | 2,919,937 | ||||||
2.125%, 5/15/25 | 500 | 492,432 | ||||||
2.25%, 3/31/21 | 2,530 | 2,575,166 | ||||||
4.25%, 11/15/17 | 17,080 | 17,422,608 | ||||||
|
| |||||||
Total U.S. Treasury Obligations (cost-$83,935,827) |
|
82,937,676
|
| |||||
|
| |||||||
CORPORATE BONDS & NOTES - 35.0% | ||||||||
Aerospace & Defense - 0.5% | ||||||||
Boeing Co., | ||||||||
2.125%, 3/1/22 | 480 | 474,643 | ||||||
United Technologies Corp., | ||||||||
1.95%, 11/1/21 | 400 | 392,322 | ||||||
|
| |||||||
|
866,965
|
| ||||||
|
| |||||||
Agriculture - 0.7% | ||||||||
Altria Group, Inc., | ||||||||
5.375%, 1/31/44 | 300 | 343,357 | ||||||
Philip Morris International, Inc., | ||||||||
2.00%, 2/21/20 | 800 | 798,411 | ||||||
|
| |||||||
|
1,141,768
|
| ||||||
|
| |||||||
Auto Manufacturers - 2.1% | ||||||||
American Honda Finance Corp., | ||||||||
2.00%, 2/14/20 | 800 | 802,817 | ||||||
Daimler Finance North America LLC, | ||||||||
2.00%, 8/3/18 | 400 | 401,002 | ||||||
2.00%, 7/6/21 (a)(b) | 500 | 486,549 | ||||||
PACCAR Financial Corp., | ||||||||
1.65%, 8/11/21 | 900 | 867,615 | ||||||
Toyota Motor Credit Corp., | ||||||||
1.70%, 2/19/19 | 300 | 300,614 | ||||||
2.25%, 10/18/23 | 600 | 580,221 | ||||||
|
| |||||||
|
3,438,818
|
| ||||||
|
| |||||||
Banks - 12.9% | ||||||||
Banco Bilbao Vizcaya Argentaria S.A., | ||||||||
3.00%, 10/20/20 | 1,000 | 1,013,498 | ||||||
Bank Nederlandse Gemeenten NV (a)(b), | ||||||||
1.625%, 4/19/21 | 800 | 783,226 | ||||||
2.375%, 3/16/26 | 500 | 484,098 | ||||||
Bank of America Corp., Ser. L, | ||||||||
2.65%, 4/1/19 | 800 | 809,601 | ||||||
Bank of Montreal, | ||||||||
2.375%, 1/25/19 | 600 | 605,336 | ||||||
See accompanying Notes to Financial Statements | 12 | Semi-Annual Report/ March 31, 2017 |
Schedule of Investments
March 31, 2017 (unaudited)
AllianzGI Advanced Core Bond Portfolio
| Principal Amount (000s) | Value | |||||||
Bank of New York Mellon Corp., | ||||||||
2.60%, 2/7/22 | 800 | 801,223 | ||||||
Bank of Nova Scotia, | ||||||||
1.875%, 4/26/21 | 1,500 | 1,471,380 | ||||||
2.80%, 7/21/21 | 300 | 303,777 | ||||||
Barclays PLC, | ||||||||
4.375%, 1/12/26 | 550 | 558,416 | ||||||
Citigroup, Inc., | ||||||||
8.125%, 7/15/39 | 500 | 736,713 | ||||||
Commonwealth Bank of Australia (a)(b), | ||||||||
2.85%, 5/18/26 | 500 | 483,688 | ||||||
Deutsche Bank AG, | ||||||||
3.375%, 5/12/21 | 400 | 402,772 | ||||||
Dexia Credit Local S.A. (a)(b), | ||||||||
1.875%, 3/28/19 | 400 | 398,109 | ||||||
Goldman Sachs Group, Inc., | ||||||||
2.375%, 1/22/18, Ser. GLOB | 500 | 502,844 | ||||||
2.55%, 10/23/19 | 500 | 504,819 | ||||||
JPMorgan Chase & Co., | ||||||||
2.972%, 1/15/23 | 800 | 799,823 | ||||||
3.625%, 5/13/24 | 450 | 460,104 | ||||||
5.40%, 1/6/42 | 250 | 291,997 | ||||||
KFW, | ||||||||
1.125%, 8/6/18 | 650 | 648,260 | ||||||
1.25%, 9/30/19 | 800 | 792,509 | ||||||
Macquarie Bank Ltd. (a)(b), | ||||||||
2.35%, 1/15/19 | 300 | 301,409 | ||||||
3.90%, 1/15/26 | 700 | 723,277 | ||||||
Morgan Stanley, | ||||||||
2.50%, 1/24/19 | 600 | 606,184 | ||||||
2.50%, 4/21/21 | 500 | 497,728 | ||||||
National Australia Bank Ltd., | ||||||||
2.625%, 1/14/21 | 200 | 200,985 | ||||||
Royal Bank of Canada, | ||||||||
2.125%, 3/2/20 | 800 | 800,594 | ||||||
2.30%, 3/22/21 | 1,500 | 1,502,289 | ||||||
Svenska Handelsbanken AB, | ||||||||
2.50%, 1/25/19 | 500 | 505,363 | ||||||
Swedbank AB, | ||||||||
1.75%, 3/12/18 | 400 | 400,031 | ||||||
Toronto-Dominion Bank, | ||||||||
1.80%, 7/13/21 | 900 | 876,151 | ||||||
UBS AG, | ||||||||
2.375%, 8/14/19 | 550 | 553,829 | ||||||
Wells Fargo & Co., | ||||||||
2.50%, 3/4/21 | 600 | 598,574 | ||||||
3.45%, 2/13/23 | 400 | 403,917 | ||||||
Westpac Banking Corp., | ||||||||
2.00%, 3/3/20 | 350 | 348,061 | ||||||
|
| |||||||
|
21,170,585
|
| ||||||
|
| |||||||
Biotechnology - 0.5% | ||||||||
Amgen, Inc., | ||||||||
2.25%, 8/19/23 | 900 | 863,123 | ||||||
|
| |||||||
Chemicals - 0.8% | ||||||||
Dow Chemical Co., | ||||||||
7.375%, 11/1/29 | 300 | 407,410 | ||||||
Potash Corp. of Saskatchewan, Inc., | ||||||||
4.00%, 12/15/26 | 500 | 512,831 | ||||||
WPP Finance 2010, | ||||||||
4.75%, 11/21/21 | 300 | 323,211 | ||||||
|
| |||||||
��
|
1,243,452
|
| ||||||
|
| |||||||
Diversified Financial Services - 0.2% | ||||||||
General Electric Co., | ||||||||
3.10%, 1/9/23 | 300 | 308,552 | ||||||
|
| |||||||
Electric Utilities - 1.7% | ||||||||
Consolidated Edison Co. of New York, Inc., Ser. 12-A, | ||||||||
4.20%, 3/15/42 | 300 | 304,277 | ||||||
Electricite de France S.A. (a)(b), | ||||||||
2.15%, 1/22/19 | 600 | 600,804 | ||||||
4.875%, 1/22/44 | 600 | 598,391 | ||||||
See accompanying Notes to Financial Statements | 13 | Semi-Annual Report/ March 31, 2017 |
Schedule of Investments
March 31, 2017 (unaudited)
AllianzGI Advanced Core Bond Portfolio
| Principal Amount (000s) | Value | |||||||
Enel Finance International NV, | ||||||||
5.125%, 10/7/19 (a)(b) | 400 | 426,769 | ||||||
6.80%, 9/15/37 | 150 | 186,129 | ||||||
Pacific Gas & Electric Co., | ||||||||
4.00%, 12/1/46 | 300 | 297,507 | ||||||
8.25%, 10/15/18 | 300 | 328,546 | ||||||
|
| |||||||
|
2,742,423
|
| ||||||
|
| |||||||
Electronics - 0.2% | ||||||||
Honeywell International, Inc., | ||||||||
1.85%, 11/1/21 | 400 | 392,404 | ||||||
|
| |||||||
Food & Beverage - 1.1% | ||||||||
Anheuser-Busch InBev Finance, Inc., | ||||||||
2.65%, 2/1/21 | 500 | 504,161 | ||||||
4.90%, 2/1/46 | 300 | 325,200 | ||||||
Diageo Capital PLC, | ||||||||
3.875%, 4/29/43 | 400 | 388,184 | ||||||
Dr. Pepper Snapple Group, Inc., | ||||||||
4.42%, 12/15/46 | 300 | 302,203 | ||||||
PepsiCo, Inc., | ||||||||
2.15%, 10/14/20 | 300 | 301,823 | ||||||
|
| |||||||
|
1,821,571
|
| ||||||
|
| |||||||
Healthcare-Products - 0.3% | ||||||||
Thermo Fisher Scientific, Inc., | ||||||||
3.00%, 4/15/23 | 500 | 496,809 | ||||||
|
| |||||||
Household Products - 0.2% | ||||||||
Procter & Gamble Co., | ||||||||
2.45%, 11/3/26 | 400 | 383,079 | ||||||
|
| |||||||
Insurance - 0.7% | ||||||||
Allstate Corp., | ||||||||
3.28%, 12/15/26 | 500 | 502,973 | ||||||
MetLife, Inc., | ||||||||
5.70%, 6/15/35 | 550 | 661,075 | ||||||
|
| |||||||
|
1,164,048
|
| ||||||
|
| |||||||
IT Services - 0.2% | ||||||||
International Business Machines Corp., | ||||||||
1.80%, 5/17/19 | 300 | 301,389 | ||||||
|
| |||||||
Machinery-Construction & Mining - 0.5% | ||||||||
Caterpillar Financial Services Corp., | ||||||||
2.40%, 8/9/26 | 900 | 852,566 | ||||||
|
| |||||||
Machinery-Diversified - 1.3% | ||||||||
CNH Industrial Capital LLC, | ||||||||
3.875%, 7/16/18 | 600 | 612,000 | ||||||
4.875%, 4/1/21 | 500 | 526,250 | ||||||
John Deere Capital Corp., | ||||||||
2.75%, 3/15/22 | 400 | 403,396 | ||||||
2.80%, 3/6/23 | 500 | 501,530 | ||||||
|
| |||||||
|
2,043,176
|
| ||||||
|
| |||||||
Media - 1.9% | ||||||||
CBS Corp., | ||||||||
2.30%, 8/15/19 | 400 | 401,728 | ||||||
Comcast Corp., | ||||||||
6.45%, 3/15/37 | 300 | 383,071 | ||||||
Discovery Communications LLC, | ||||||||
3.80%, 3/13/24 | 500 | 494,918 | ||||||
6.35%, 6/1/40 | 300 | 317,901 | ||||||
Time Warner Cable LLC, | ||||||||
4.00%, 9/1/21 | 300 | 311,250 | ||||||
6.75%, 6/15/39 | 300 | 353,361 | ||||||
Time Warner, Inc., | ||||||||
4.875%, 3/15/20 | 300 | 322,017 | ||||||
Walt Disney Co., | ||||||||
2.45%, 3/4/22 | 500 | 501,440 | ||||||
|
| |||||||
|
3,085,686
|
| ||||||
|
| |||||||
See accompanying Notes to Financial Statements | 14 | Semi-Annual Report/ March 31, 2017 |
Schedule of Investments
March 31, 2017 (unaudited)
AllianzGI Advanced Core Bond Portfolio
| Principal Amount (000s) | Value | |||||||
Mining - 0.1% | ||||||||
Barrick Gold Corp., | ||||||||
4.10%, 5/1/23 | 95 | 101,985 | ||||||
|
| |||||||
Miscellaneous Manufacturing - 0.2% | ||||||||
Siemens Financieringsmaatschappij NV (a)(b), | ||||||||
4.40%, 5/27/45 | 300 | 314,166 | ||||||
|
| |||||||
Oil, Gas & Consumable Fuels - 1.8% | ||||||||
BP Capital Markets PLC, | ||||||||
2.315%, 2/13/20 | 800 | 806,925 | ||||||
3.723%, 11/28/28 | 400 | 407,136 | ||||||
Occidental Petroleum Corp., | ||||||||
3.00%, 2/15/27 | 500 | 482,955 | ||||||
Shell International Finance BV, | ||||||||
6.375%, 12/15/38 | 150 | 194,076 | ||||||
Sinopec Group Overseas Development 2012 Ltd., | ||||||||
2.75%, 5/17/17 | 400 | 400,588 | ||||||
Sinopec Group Overseas Development 2016 Ltd. (a)(b), | ||||||||
2.125%, 5/3/19 | 200 | 199,207 | ||||||
Statoil ASA, | ||||||||
2.90%, 11/8/20 | 400 | 409,173 | ||||||
|
| |||||||
|
2,900,060
|
| ||||||
|
| |||||||
Pharmaceuticals - 1.4% | ||||||||
AstraZeneca PLC, | ||||||||
1.95%, 9/18/19 | 400 | 399,676 | ||||||
Johnson & Johnson, | ||||||||
2.95%, 3/3/27 | 800 | 800,871 | ||||||
4.375%, 12/5/33 | 250 | 275,981 | ||||||
Novartis Capital Corp., | ||||||||
1.80%, 2/14/20 | 800 | 801,025 | ||||||
|
| |||||||
|
2,277,553
|
| ||||||
|
| |||||||
Pipelines - 0.4% | ||||||||
Enterprise Products Operating LLC, | ||||||||
4.85%, 3/15/44 | 300 | 304,464 | ||||||
TransCanada PipeLines Ltd., | ||||||||
7.125%, 1/15/19 | 350 | 380,818 | ||||||
|
| |||||||
|
685,282
|
| ||||||
|
| |||||||
Retail - 1.0% | ||||||||
CVS Health Corp., | ||||||||
4.00%, 12/5/23 | 300 | 315,015 | ||||||
Macy’s Retail Holdings, Inc., | ||||||||
4.50%, 12/15/34 | 300 | 261,494 | ||||||
McDonald’s Corp., | ||||||||
4.875%, 12/9/45 | 500 | 533,733 | ||||||
Walgreens Boots Alliance, Inc., | ||||||||
2.70%, 11/18/19 | 300 | 304,164 | ||||||
4.50%, 11/18/34 | 300 | 300,392 | ||||||
|
| |||||||
|
1,714,798
|
| ||||||
|
| |||||||
Software - 0.5% | ||||||||
Microsoft Corp., | ||||||||
3.30%, 2/6/27 | 800 | 813,897 | ||||||
|
| |||||||
Technology Hardware, Storage & Peripherals - 1.1% | ||||||||
Apple, Inc., | ||||||||
2.25%, 2/23/21 | 500 | 501,743 | ||||||
3.35%, 2/9/27 | 800 | 808,458 | ||||||
4.65%, 2/23/46 | 500 | 537,447 | ||||||
|
| |||||||
|
1,847,648
|
| ||||||
|
| |||||||
Telecommunications - 2.1% | ||||||||
AT&T, Inc., | ||||||||
4.25%, 3/1/27 | 800 | 813,240 | ||||||
4.80%, 6/15/44 | 900 | 846,214 | ||||||
Cisco Systems, Inc., | ||||||||
2.45%, 6/15/20 | 700 | 711,524 | ||||||
5.50%, 1/15/40 | 250 | 306,041 | ||||||
See accompanying Notes to Financial Statements | 15 | Semi-Annual Report/ March 31, 2017 |
Schedule of Investments
March 31, 2017 (unaudited)
AllianzGI Advanced Core Bond Portfolio
Principal (000s) | Value | |||||||
Telefonica Emisiones SAU, | ||||||||
4.103%, 3/8/27 | 800 | 806,818 | ||||||
|
| |||||||
|
3,483,837
|
| ||||||
|
| |||||||
Transportation - 0.6% | ||||||||
CSX Corp., | ||||||||
2.60%, 11/1/26 | 400 | 375,856 | ||||||
FedEx Corp., | ||||||||
4.10%, 4/15/43 | 600 | 557,097 | ||||||
|
| |||||||
|
932,953
|
| ||||||
|
| |||||||
Total Corporate Bonds & Notes (cost-$57,369,932) |
|
57,388,593
|
| |||||
|
| |||||||
U.S. GOVERNMENT AGENCY SECURITIES - 27.6% | ||||||||
Fannie Mae, MBS, TBA (c), | ||||||||
2.50%, 4/18/32, 15 Year | 1,630 | 1,630,637 | ||||||
3.00%, 4/18/32, 15 Year | 1,540 | 1,578,861 | ||||||
3.00%, 4/13/47, 30 Year | 4,660 | 4,621,774 | ||||||
3.50%, 4/18/32, 15 Year | 1,040 | 1,082,128 | ||||||
3.50%, 4/13/47, 30 Year | 4,730 | 4,839,012 | ||||||
4.00%, 4/13/47, 30 Year | 3,010 | 3,157,443 | ||||||
4.50%, 4/13/47, 30 Year | 1,220 | 1,308,402 | ||||||
5.00%, 4/13/47, 30 Year | 580 | 633,798 | ||||||
5.50%, 4/13/47, 30 Year | 770 | 855,411 | ||||||
Freddie Mac, | ||||||||
2.50%, 4/18/32 MBS, TBA, 15 Year (c) | 1,220 | 1,220,834 | ||||||
3.00%, 4/18/32 MBS, TBA, 15 Year (c) | 1,060 | 1,086,987 | ||||||
3.00%, 4/13/47 MBS, TBA, 30 Year (c) | 3,110 | 3,081,087 | ||||||
3.50%, 4/18/32 MBS, TBA, 15 Year (c) | 560 | 583,228 | ||||||
3.50%, 4/13/47 MBS, TBA, 30 Year (c) | 3,050 | 3,119,697 | ||||||
4.00%, 8/1/44 | 158 | 165,601 | ||||||
4.00%, 4/13/47 MBS, TBA, 30 Year (c) | 1,680 | 1,762,425 | ||||||
4.50%, 4/13/47 MBS, TBA, 30 Year (c) | 720 | 771,651 | ||||||
5.00%, 4/13/47 MBS, TBA, 30 Year (c) | 370 | 402,910 | ||||||
5.50%, 4/13/47 MBS, TBA, 30 Year (c) | 410 | 454,879 | ||||||
Ginnie Mae, MBS, TBA, 30 Year (c), | ||||||||
3.00%, 4/20/47 | 4,080 | 4,116,019 | ||||||
3.50%, 4/20/47 | 4,580 | 4,748,708 | ||||||
4.00%, 4/20/47 | 2,100 | 2,218,289 | ||||||
4.50%, 4/20/47 | 1,820 | 1,943,632 | ||||||
|
| |||||||
Total U.S. Government Agency Securities (cost-$45,138,733) |
|
45,383,413
|
| |||||
|
| |||||||
SOVEREIGN DEBT OBLIGATIONS - 12.5% | ||||||||
Argentina - 0.2% | ||||||||
Argentine Republic Government International Bond (a)(b), | ||||||||
6.25%, 4/22/19 | 250 | 264,625 | ||||||
|
| |||||||
Brazil - 0.2% | ||||||||
Brazilian Government International Bond, | ||||||||
4.25%, 1/7/25 | 300 | 295,875 | ||||||
|
| |||||||
Canada - 0.5% | ||||||||
Export Development Canada, | ||||||||
1.25%, 12/10/18 | 350 | 350,924 | ||||||
Province of New Brunswick Canada, | ||||||||
2.75%, 6/15/18 | 500 | 507,680 | ||||||
|
| |||||||
|
858,604
|
| ||||||
|
| |||||||
Chile - 0.3% | ||||||||
Chile Government International Bond, | ||||||||
3.25%, 9/14/21 | 400 | 414,600 | ||||||
|
| |||||||
Colombia - 0.2% | ||||||||
Colombia Government International Bond, | ||||||||
4.00%, 2/26/24 | 400 | 412,600 | ||||||
|
| |||||||
Croatia - 0.7% | ||||||||
Croatia Government International Bond, | ||||||||
6.25%, 4/27/17 | 600 | 601,594 | ||||||
6.75%, 11/5/19 | 500 | 545,080 | ||||||
|
| |||||||
|
1,146,674
|
| ||||||
|
| |||||||
See accompanying Notes to Financial Statements | 16 | Semi-Annual Report/ March 31, 2017 |
Schedule of Investments
March 31, 2017 (unaudited)
AllianzGI Advanced Core Bond Portfolio
Principal (000s) | Value | |||||||
Germany - 0.2% | ||||||||
FMS Wertmanagement AoeR, | ||||||||
1.00%, 11/21/17 | 300 | 299,622 | ||||||
|
| |||||||
Hungary - 0.3% | ||||||||
Hungary Government International Bond, | ||||||||
4.00%, 3/25/19 | 500 | 519,362 | ||||||
|
| |||||||
Iceland - 0.4% | ||||||||
Iceland Government International Bond, | ||||||||
5.875%, 5/11/22 | 600 | 678,367 | ||||||
|
| |||||||
Indonesia - 0.8% | ||||||||
Indonesia Government International Bond, | ||||||||
3.75%, 4/25/22 | 550 | 562,083 | ||||||
11.625%, 3/4/19 | 600 | 710,286 | ||||||
|
| |||||||
|
1,272,369
|
| ||||||
|
| |||||||
Latvia - 0.4% | ||||||||
Latvia Government International Bond, | ||||||||
2.75%, 1/12/20 | 700 | 710,427 | ||||||
|
| |||||||
Lithuania - 0.8% | ||||||||
Lithuania Government International Bond, | ||||||||
5.125%, 9/14/17 | 700 | 712,250 | ||||||
7.375%, 2/11/20 (a)(b) | 500 | 569,500 | ||||||
|
| |||||||
|
1,281,750
|
| ||||||
|
| |||||||
Mexico - 0.6% | ||||||||
Mexico Government International Bond, | ||||||||
4.75%, 3/8/44 | 400 | 390,000 | ||||||
5.95%, 3/19/19 | 600 | 647,250 | ||||||
|
| |||||||
|
1,037,250
|
| ||||||
|
| |||||||
Morocco - 0.3% | ||||||||
Morocco Government International Bond, | ||||||||
4.25%, 12/11/22 | 550 | 570,625 | ||||||
|
| |||||||
Panama - 0.4% | ||||||||
Panama Government International Bond, | ||||||||
7.125%, 1/29/26 | 550 | 696,437 | ||||||
|
| |||||||
Peru - 0.5% | ||||||||
Peruvian Government International Bond, | ||||||||
4.125%, 8/25/27 | 300 | 324,000 | ||||||
7.125%, 3/30/19 | 500 | 550,000 | ||||||
|
| |||||||
|
874,000
|
| ||||||
|
| |||||||
Philippines - 0.2% | ||||||||
Philippine Government International Bond, | ||||||||
6.50%, 1/20/20 | 300 | 336,611 | ||||||
|
| |||||||
South Africa - 0.2% | ||||||||
Republic of South Africa Government International Bond, | ||||||||
4.875%, 4/14/26 | 290 | 292,103 | ||||||
|
| |||||||
Supranational - 4.7% | ||||||||
African Development Bank, | ||||||||
1.375%, 12/17/18 | 1,000 | 999,302 | ||||||
Asian Development Bank, | ||||||||
1.375%, 1/15/19 | 200 | 199,887 | ||||||
1.625%, 3/16/21 | 700 | 691,480 | ||||||
Corp. Andina de Fomento, | ||||||||
2.00%, 5/10/19 | 300 | 299,599 | ||||||
Council of Europe Development Bank, | ||||||||
1.00%, 3/7/18 | 1,000 | 997,469 | ||||||
1.00%, 2/4/19 | 1,400 | 1,386,388 | ||||||
European Investment Bank, | ||||||||
1.00%, 3/15/18 | 1,700 | 1,696,489 | ||||||
See accompanying Notes to Financial Statements | 17 | Semi-Annual Report/ March 31, 2017 |
Schedule of Investments
March 31, 2017 (unaudited)
AllianzGI Advanced Core Bond Portfolio
Principal (000s) | Value | |||||||
Inter-American Development Bank, | ||||||||
3.20%, 8/7/42 | 400 | 385,426 | ||||||
International Bank for Reconstruction & Development, | ||||||||
1.875%, 10/7/19 | 500 | 503,105 | ||||||
Nordic Investment Bank, | ||||||||
0.75%, 1/17/18 | 500 | 498,140 | ||||||
|
| |||||||
|
7,657,285
|
| ||||||
|
| |||||||
Turkey - 0.6% | ||||||||
Turkey Government International Bond, | ||||||||
4.875%, 10/9/26 | 300 | 289,561 | ||||||
6.75%, 4/3/18 | 600 | 624,054 | ||||||
|
| |||||||
|
913,615
|
| ||||||
|
| |||||||
Total Sovereign Debt Obligations (cost-$20,429,220) |
|
20,532,801
|
| |||||
|
| |||||||
Repurchase Agreements - 0.8% | ||||||||
State Street Bank and Trust Co., | 1,258 | 1,258,000 | ||||||
|
| |||||||
Total Investments (cost-$208,131,712)-126.4% | 207,500,483 | |||||||
|
| |||||||
Liabilities in excess of other assets (e)-(26.4)% | (43,300,691) | |||||||
|
| |||||||
Net Assets-100.0% | $ 164,199,792 | |||||||
|
| |||||||
Notes to Schedule of Investments:
| (a) | Private Placement—Restricted as to resale and may not have a readily available market. Securities with an aggregate value of $6,633,818, representing 4.0% of net assets. |
| (b) | 144A—Exempt from registration under Rule 144A of the Securities Act of 1933. These securities may be resold in transactions exempt from registration, typically only to qualified institutional buyers. Securities with an aggregate value of $6,633,818, representing 4.0% of net assets. |
| (c) | When-issued or delayed-delivery. To be settled/delivered after March 31, 2017. |
| (d) | All or partial amount segregated for the benefit of the counterparty as collateral for when-issued or delayed delivery securities. |
| (e) | Includes net unrealized appreciation (depreciation) of other financial instruments. See Note 6(a) in the Notes to Financial Statements. |
Glossary:
MBS - Mortgage-Backed Securities
TBA - To Be Announced
See accompanying Notes to Financial Statements | 18 | Semi-Annual Report/ March 31, 2017 |
Schedule of Investments
March 31, 2017 (unaudited)
AllianzGI Best Styles Global Managed Volatility Portfolio
| Shares | Value | |||||||
COMMON STOCK - 97.5% | ||||||||
Australia - 1.5% | ||||||||
Automotive Holdings Group Ltd. | 10,818 | $ | 34,036 | |||||
Breville Group Ltd. | 3,781 | 29,840 | ||||||
Brickworks Ltd. | 5,800 | 65,056 | ||||||
Cochlear Ltd. | 1,871 | 193,279 | ||||||
Harvey Norman Holdings Ltd. | 44,539 | 154,051 | ||||||
Regis Resources Ltd. | 42,307 | 106,885 | ||||||
Saracen Mineral Holdings Ltd. (d) | 36,737 | 27,685 | ||||||
St. Barbara Ltd. (d) | 44,961 | 81,901 | ||||||
Tassal Group Ltd. | 10,892 | 37,694 | ||||||
Wesfarmers Ltd. | 8,595 | 295,908 | ||||||
|
| |||||||
|
1,026,335
|
| ||||||
|
| |||||||
Austria - 0.2% | ||||||||
BUWOG AG (d) | 2,405 | 60,606 | ||||||
Flughafen Wien AG | 961 | 30,341 | ||||||
Telekom Austria AG (d) | 6,385 | 43,512 | ||||||
|
| |||||||
|
134,459
|
| ||||||
|
| |||||||
Belgium - 0.3% | ||||||||
Elia System Operator S.A. | 999 | 52,624 | ||||||
Groupe Bruxelles Lambert S.A. | 2,051 | 186,135 | ||||||
|
| |||||||
|
238,759
|
| ||||||
|
| |||||||
Bermuda - 0.2% | ||||||||
Genpact Ltd. | 4,493 | 111,247 | ||||||
|
| |||||||
Brazil - 0.0% | ||||||||
Linx S.A. | 3,300 | 17,498 | ||||||
|
| |||||||
Canada - 3.6% | ||||||||
AG Growth International, Inc. | 926 | 35,213 | ||||||
Bank of Montreal | 2,013 | 150,356 | ||||||
BCE, Inc. | 10,642 | 471,182 | ||||||
Canadian Imperial Bank of Commerce | 2,043 | 176,163 | ||||||
Canadian Real Estate Investment Trust REIT | 1,237 | 45,095 | ||||||
Canadian Tire Corp., Ltd., Class A | 1,585 | 188,291 | ||||||
Cascades, Inc. | 4,131 | 42,588 | ||||||
Cogeco Communications, Inc. | 1,783 | 95,260 | ||||||
Dorel Industries, Inc., Class B | 834 | 19,893 | ||||||
George Weston Ltd. | 2,307 | 201,287 | ||||||
Great-West Lifeco, Inc. | 3,093 | 85,707 | ||||||
Intact Financial Corp. | 924 | 65,716 | ||||||
Killam Apartment REIT | 2,174 | 20,729 | ||||||
Laurentian Bank of Canada | 1,286 | 56,639 | ||||||
Martinrea International, Inc. | 2,083 | 16,165 | ||||||
Milestone Apartments Real Estate Investment Trust | 4,637 | 75,246 | ||||||
NorthWest Healthcare Properties Real Estate Investment Trust | 3,841 | 30,471 | ||||||
Power Corp. of Canada | 7,194 | 168,997 | ||||||
Pure Industrial Real Estate Trust | 25,694 | 117,665 | ||||||
Rogers Sugar, Inc. | 4,478 | 21,045 | ||||||
Saputo, Inc. | 5,663 | 195,417 | ||||||
Transcontinental, Inc., Class A | 2,390 | 44,175 | ||||||
Valener, Inc. | 1,411 | 23,194 | ||||||
Waste Connections, Inc. | 2,382 | 210,140 | ||||||
|
| |||||||
|
2,556,634
|
| ||||||
|
| |||||||
China - 1.4% | ||||||||
China Construction Bank Corp., Class H | 378,748 | 305,160 | ||||||
China Dongxiang Group Co., Ltd. | 128,883 | 24,720 | ||||||
China Evergrande Group | 68,517 | 63,528 | ||||||
China Mobile Ltd. | 5,000 | 54,988 | ||||||
Jiangsu Expressway Co., Ltd., Class H | 16,811 | 24,149 | ||||||
Longfor Properties Co., Ltd. | 29,155 | 47,998 | ||||||
Orient Securities Co., Ltd., Class H (a)(d) | 62,400 | 60,881 | ||||||
Postal Savings Bank of China Co., Ltd., Class H (a)(d) | 194,000 | 120,073 | ||||||
Shenzhen Expressway Co., Ltd., Class H | 46,300 | 41,969 | ||||||
Tianneng Power International Ltd. | 79,658 | 72,415 | ||||||
Tong Ren Tang Technologies Co., Ltd., Class H | 10,274 | 18,248 | ||||||
XTEP International Holdings Ltd. | 23,349 | 9,196 | ||||||
Yuzhou Properties Co., Ltd. | 264,204 | 110,590 | ||||||
|
| |||||||
|
953,915
|
| ||||||
|
| |||||||
See accompanying Notes to Financial Statements | 19 | Semi-Annual Report/ March 31, 2017 |
Schedule of Investments
March 31, 2017 (unaudited)
AllianzGI Best Styles Global Managed Volatility Portfolio
| Shares | Value | |||||||
Colombia - 0.0% | ||||||||
Corp. Financiera Colombiana S.A. | 1,034 | 10,128 | ||||||
|
| |||||||
Czech Republic - 0.0% | ||||||||
O2 Czech Republic AS | 1,324 | 14,793 | ||||||
|
| |||||||
Denmark - 0.1% | ||||||||
Matas A/S | 1,323 | 18,792 | ||||||
Solar A/S, Class B | 333 | 18,384 | ||||||
Spar Nord Bank A/S | 3,578 | 39,604 | ||||||
|
| |||||||
|
76,780
|
| ||||||
|
| |||||||
Finland - 0.3% | ||||||||
Neste Oyj | 5,147 | 201,262 | ||||||
|
| |||||||
France - 2.5% | ||||||||
Atos SE | 1,863 | 230,230 | ||||||
Cegereal S.A. REIT | 2,277 | 90,023 | ||||||
Eiffage S.A. | 175 | 13,695 | ||||||
Nexity S.A. (d) | 1,869 | 91,887 | ||||||
SCOR SE | 4,592 | 173,546 | ||||||
SEB S.A. | 1,216 | 169,847 | ||||||
Sodexo S.A. | 2,023 | 237,695 | ||||||
Teleperformance | 1,653 | 178,473 | ||||||
Thales S.A. | 2,377 | 229,609 | ||||||
Vinci S.A. | 3,906 | 310,170 | ||||||
|
| |||||||
|
1,725,175
|
| ||||||
|
| |||||||
Germany - 0.4% | ||||||||
Muenchener Rueckversicherungs-Gesellschaft AG in Muenchen | 216 | 42,282 | ||||||
Rhoen Klinikum AG | 1,973 | 53,819 | ||||||
Talanx AG (d) | 3,095 | 109,121 | ||||||
TLG Immobilien AG | 1,393 | 27,123 | ||||||
WCM Beteiligungs & Grundbesitz AG (d) | 5,562 | 18,168 | ||||||
|
| |||||||
|
250,513
|
| ||||||
|
| |||||||
Hong Kong - 2.0% | ||||||||
CK Hutchison Holdings Ltd. | 3,703 | 45,591 | ||||||
CLP Holdings Ltd. | 74,219 | 776,959 | ||||||
Fairwood Holdings Ltd. | 11,000 | 44,239 | ||||||
Hang Seng Bank Ltd. | 2,600 | 52,745 | ||||||
Link REIT | 17,508 | 122,709 | ||||||
Swire Pacific Ltd., Class A | 14,344 | 143,372 | ||||||
WH Group Ltd. (a) | 244,000 | 210,406 | ||||||
Yue Yuen Industrial Holdings Ltd. | 2,802 | 11,011 | ||||||
|
| |||||||
|
1,407,032
|
| ||||||
|
| |||||||
Hungary - 0.4% | ||||||||
Magyar Telekom Telecommunications PLC | 28,291 | 46,922 | ||||||
MOL Hungarian Oil & Gas PLC | 2,372 | 162,414 | ||||||
Richter Gedeon Nyrt | 4,294 | 97,524 | ||||||
|
| |||||||
|
306,860
|
| ||||||
|
| |||||||
Indonesia - 0.6% | ||||||||
Telekomunikasi Indonesia Persero Tbk PT | 1,375,100 | 427,443 | ||||||
|
| |||||||
Ireland - 0.1% | ||||||||
Irish Residential Properties REIT PLC | 15,872 | 20,996 | ||||||
Origin Enterprises PLC | 5,430 | 38,597 | ||||||
|
| |||||||
|
59,593
|
| ||||||
|
| |||||||
Israel - 0.9% | ||||||||
Bank Hapoalim BM | 41,518 | 253,018 | ||||||
Bank Leumi Le-Israel BM (d) | 23,092 | 101,946 | ||||||
Elbit Systems Ltd. | 765 | 87,503 | ||||||
Mizrahi Tefahot Bank Ltd. | 9,569 | 162,192 | ||||||
Teva Pharmaceutical Industries Ltd. | 80 | 2,616 | ||||||
|
| |||||||
|
607,275
|
| ||||||
|
| |||||||
See accompanying Notes to Financial Statements | 20 | Semi-Annual Report/ March 31, 2017 |
Schedule of Investments
March 31, 2017 (unaudited)
AllianzGI Best Styles Global Managed Volatility Portfolio
| Shares | Value | |||||||
Italy - 0.1% | ||||||||
Fila SpA | 1,621 | 28,533 | ||||||
Societa Iniziative Autostradali e Servizi SpA | 1,168 | 11,152 | ||||||
|
| |||||||
|
39,685
|
| ||||||
|
| |||||||
Japan - 11.4% | ||||||||
ADEKA Corp. | 374 | 5,465 | ||||||
Alpen Co., Ltd. | 1,215 | 21,164 | ||||||
ANA Holdings, Inc. | 111,543 | 341,155 | ||||||
Aoyama Trading Co., Ltd. | 3,189 | 109,670 | ||||||
Astellas Pharma, Inc. | 30,308 | 399,730 | ||||||
Bandai Namco Holdings, Inc. | 4,200 | 125,898 | ||||||
BML, Inc. | 1,682 | 37,168 | ||||||
Canon, Inc. | 4,190 | 130,848 | ||||||
Daiichi Sankyo Co., Ltd. | 8,453 | 190,709 | ||||||
DCM Holdings Co., Ltd. | 11,975 | 110,724 | ||||||
Doshisha Co., Ltd. | 1,215 | 22,548 | ||||||
Doutor Nichires Holdings Co., Ltd. | 2,149 | 42,081 | ||||||
DTS Corp. | 1,401 | 35,125 | ||||||
DyDo Group Holdings, Inc. | 974 | 45,606 | ||||||
EDION Corp. | 4,727 | 43,584 | ||||||
Fuji Media Holdings, Inc. | 7,505 | 104,003 | ||||||
Fuji Oil Holdings, Inc. | 6,184 | 145,044 | ||||||
Fuji Soft, Inc. | 1,028 | 26,338 | ||||||
FUJIFILM Holdings Corp. | 7,979 | 312,760 | ||||||
Fukuyama Transporting Co., Ltd. | 9,274 | 55,652 | ||||||
Geo Holdings Corp. | 4,164 | 45,799 | ||||||
Hankyu Hanshin Holdings, Inc. | 4,730 | 154,344 | ||||||
Heiwa Corp. | 4,397 | 109,593 | ||||||
Hogy Medical Co., Ltd. | 561 | 35,337 | ||||||
Honeys Holdings Co., Ltd. | 561 | 5,612 | ||||||
Japan Airlines Co., Ltd. | 9,580 | 304,164 | ||||||
Kagome Co., Ltd. | 5,300 | 138,016 | ||||||
Kajima Corp. | 33,000 | 215,855 | ||||||
KOMEDA Holdings Co., Ltd. (d) | 2,600 | 41,907 | ||||||
Kyowa Exeo Corp. | 8,500 | 123,402 | ||||||
LaSalle Logiport REIT | 68 | 63,010 | ||||||
Mitsubishi Shokuhin Co., Ltd. | 841 | 26,129 | ||||||
Mitsubishi Tanabe Pharma Corp. | 17,914 | 374,027 | ||||||
NEC Networks & System Integration Corp. | 1,235 | 23,920 | ||||||
Nichias Corp. | 5,604 | 56,436 | ||||||
Nifco, Inc. | 654 | 32,868 | ||||||
Nihon Unisys Ltd. | 9,379 | 128,335 | ||||||
Nippon Flour Mills Co., Ltd. | 1,402 | 20,753 | ||||||
Nippon Paper Industries Co., Ltd. | 6,571 | 118,284 | ||||||
NIPPON REIT Investment Corp. | 31 | 80,542 | ||||||
Nippon Telegraph & Telephone Corp. | 7,744 | 331,082 | ||||||
Nisshin Oillio Group Ltd. | 6,538 | 37,277 | ||||||
NTT Data Corp. | 4,557 | 216,396 | ||||||
NTT DOCOMO, Inc. | 30,557 | 713,575 | ||||||
Obayashi Corp. | 9,573 | 89,764 | ||||||
Okamura Corp. | 3,269 | 29,077 | ||||||
Pacific Industrial Co., Ltd. | 576 | 8,208 | ||||||
Prima Meat Packers Ltd. | 6,538 | 28,947 | ||||||
Raito Kogyo Co., Ltd. | 4,537 | 46,232 | ||||||
Recruit Holdings Co., Ltd. | 3,900 | 199,468 | ||||||
Right On Co., Ltd. | 943 | 8,149 | ||||||
S Foods, Inc. | 2,728 | 79,381 | ||||||
Sakata INX Corp. | 2,802 | 38,668 | ||||||
Sanyo Chemical Industries Ltd. | 561 | 23,598 | ||||||
Sawai Pharmaceutical Co., Ltd. | 1,875 | 101,797 | ||||||
Sekisui House Ltd. | 11,700 | 192,919 | ||||||
Senko Co., Ltd. | 5,604 | 36,185 | ||||||
Stella Chemifa Corp. | 3,189 | 91,021 | ||||||
Sumitomo Dainippon Pharma Co., Ltd. | 9,632 | 159,384 | ||||||
Taisho Pharmaceutical Holdings Co., Ltd. | 700 | 56,997 | ||||||
Takasago Thermal Engineering Co., Ltd. | 1,103 | 15,559 | ||||||
Takeda Pharmaceutical Co., Ltd. | 4,457 | 209,823 | ||||||
Tokyo Electron Ltd. | 1,000 | 109,476 | ||||||
Toppan Printing Co., Ltd. | 16,679 | 170,479 | ||||||
Toray Industries, Inc. | 9,274 | 82,539 | ||||||
Toshiba Plant Systems & Services Corp. | 5,800 | 84,889 | ||||||
Towa Pharmaceutical Co., Ltd. | 262 | 13,299 | ||||||
Toyo Construction Co., Ltd. | 2,989 | 10,746 | ||||||
Tv Tokyo Holdings Corp. | 934 | 21,395 | ||||||
Unipres Corp. | 483 | 10,105 | ||||||
See accompanying Notes to Financial Statements | 21 | Semi-Annual Report/ March 31, 2017 |
Schedule of Investments
March 31, 2017 (unaudited)
AllianzGI Best Styles Global Managed Volatility Portfolio
| Shares | Value | |||||||
Wacoal Holdings Corp. | 5,604 | 69,230 | ||||||
West Japan Railway Co. | 3,199 | 208,618 | ||||||
Yorozu Corp. | 841 | 12,954 | ||||||
Yoshinoya Holdings Co., Ltd. | 7,025 | 102,189 | ||||||
Yurtec Corp. | 1,868 | 12,863 | ||||||
|
| |||||||
|
8,025,894
|
| ||||||
|
| |||||||
Korea (Republic of) - 1.7% | ||||||||
CJ Hellovision Co., Ltd. | 2,652 | 24,077 | ||||||
Daekyo Co., Ltd. | 2,318 | 16,686 | ||||||
Easy Bio, Inc. | 6,217 | 33,619 | ||||||
Hansol Paper Co., Ltd. | 1,424 | 24,258 | ||||||
Hyundai Engineering Plastics Co., Ltd. | 2,575 | 19,431 | ||||||
Hyundai Motor Co. | 1,906 | 268,616 | ||||||
KC Tech Co., Ltd. | 519 | 6,384 | ||||||
Kia Motors Corp. | 1,598 | 52,962 | ||||||
KT Corp. | 660 | 18,839 | ||||||
KT&G Corp. | 2,614 | 227,904 | ||||||
Kukdo Chemical Co., Ltd. | 388 | 17,097 | ||||||
Macquarie Korea Infrastructure Fund | 8,231 | 61,237 | ||||||
Samjin Pharmaceutical Co., Ltd. | 1,581 | 45,879 | ||||||
Samsung Electronics Co., Ltd. | 198 | 364,402 | ||||||
Samyang Holdings Corp. | 267 | 29,486 | ||||||
Ubiquoss Holdings, Inc. | 1,318 | 8,485 | ||||||
Ubiquoss, Inc. (d) | 420 | 9,183 | ||||||
|
| |||||||
|
1,228,545
|
| ||||||
|
| |||||||
Luxembourg - 0.2% | ||||||||
RTL Group S.A. | 1,888 | 151,908 | ||||||
|
| |||||||
Malaysia - 0.5% | ||||||||
KNM Group Bhd. (d) | 94,600 | 6,413 | ||||||
Maxis Bhd. | 9,800 | 14,258 | ||||||
MISC Bhd. | 33,000 | 54,552 | ||||||
Supermax Corp. Bhd. | 59,900 | 26,953 | ||||||
Tenaga Nasional Bhd. | 75,900 | 235,218 | ||||||
|
| |||||||
|
337,394
|
| ||||||
|
| |||||||
Morocco - 0.1% | ||||||||
Douja Promotion Groupe Addoha S.A. | 10,225 | 43,771 | ||||||
Maroc Telecom | 2,136 | 29,177 | ||||||
|
| |||||||
|
72,948
|
| ||||||
|
| |||||||
Netherlands - 0.3% | ||||||||
NN Group NV | 5,675 | 184,308 | ||||||
Vastned Retail NV REIT | 596 | 22,539 | ||||||
|
| |||||||
|
206,847
|
| ||||||
|
| |||||||
New Zealand - 0.5% | ||||||||
Air New Zealand Ltd. | 32,303 | 55,705 | ||||||
Arvida Group Ltd. | 26,315 | 23,416 | ||||||
Auckland International Airport Ltd. | 32,832 | 155,461 | ||||||
Fonterra Co-operative Group Ltd. UNIT | 7,445 | 31,627 | ||||||
Kiwi Property Group Ltd. | 20,620 | 20,598 | ||||||
Summerset Group Holdings Ltd. | 16,234 | 58,827 | ||||||
Tourism Holdings Ltd. | 9,034 | 23,748 | ||||||
|
| |||||||
|
369,382
|
| ||||||
|
| |||||||
Norway - 0.4% | ||||||||
Avance Gas Holding Ltd. (a) | 1,384 | 4,546 | ||||||
Gjensidige Forsikring ASA | 4,268 | 65,019 | ||||||
Marine Harvest ASA (d) | 2,103 | 32,080 | ||||||
Orkla ASA | 18,550 | 166,172 | ||||||
|
| |||||||
|
267,817
|
| ||||||
|
| |||||||
Philippines - 0.1% | ||||||||
Aboitiz Equity Ventures, Inc. | 19,950 | 29,602 | ||||||
Bank of the Philippine Islands | 2,810 | 5,668 | ||||||
BDO Unibank, Inc. | 12,250 | 28,711 | ||||||
|
| |||||||
|
63,981
|
| ||||||
|
| |||||||
See accompanying Notes to Financial Statements | 22 | Semi-Annual Report/ March 31, 2017 |
Schedule of Investments
March 31, 2017 (unaudited)
AllianzGI Best Styles Global Managed Volatility Portfolio
| Shares | Value | |||||||
Poland - 0.3% | ||||||||
Asseco Poland S.A. | 1,494 | 20,456 | ||||||
Ciech S.A. | 1,701 | 34,314 | ||||||
Polski Koncern Naftowy Orlen S.A. | 6,512 | 164,246 | ||||||
|
| |||||||
|
219,016
|
| ||||||
|
| |||||||
Portugal - 0.2% | ||||||||
Jeronimo Martins SGPS S.A. | 6,202 | 110,825 | ||||||
|
| |||||||
Russian Federation - 0.1% | ||||||||
PhosAgro PJSC GDR | 3,290 | 48,034 | ||||||
|
| |||||||
Singapore - 1.5% | ||||||||
Accordia Golf Trust UNIT | 37,500 | 19,704 | ||||||
BOC Aviation Ltd. (a) | 15,600 | 83,229 | ||||||
China Aviation Oil Singapore Corp., Ltd. | 22,500 | 24,526 | ||||||
Fortune Real Estate Investment Trust REIT | 32,000 | 35,832 | ||||||
Frasers Logistics & Industrial Trust REIT | 106,900 | 75,271 | ||||||
Keppel DC REIT | 39,000 | 33,453 | ||||||
Mapletree Industrial Trust REIT | 24,100 | 30,667 | ||||||
SATS Ltd. | 63,000 | 219,781 | ||||||
Sheng Siong Group Ltd. | 67,800 | 45,802 | ||||||
Singapore Airlines Ltd. | 43,000 | 309,531 | ||||||
Sino Grandness Food Industry Group Ltd. | 77,400 | 13,274 | ||||||
Venture Corp., Ltd. | 19,300 | 158,252 | ||||||
|
| |||||||
|
1,049,322
|
| ||||||
|
| |||||||
South Africa - 0.2% | ||||||||
Harmony Gold Mining Co., Ltd. | 26,046 | 63,254 | ||||||
Tsogo Sun Holdings Ltd. | 23,626 | 48,541 | ||||||
|
| |||||||
|
111,795
|
| ||||||
|
| |||||||
Spain - 0.2% | ||||||||
Axiare Patrimonio SOCIMI S.A. REIT | 630 | 9,403 | ||||||
Ebro Foods S.A. | 5,628 | 113,718 | ||||||
Lar Espana Real Estate Socimi S.A. REIT | 1,947 | 14,996 | ||||||
|
| |||||||
|
138,117
|
| ||||||
|
| |||||||
Sweden - 0.0% | ||||||||
Cloetta AB, Class B | 7,145 | 28,227 | ||||||
|
| |||||||
Switzerland - 2.5% | ||||||||
Bachem Holding AG, Class B | 875 | 103,529 | ||||||
Baloise Holding AG | 1,297 | 178,224 | ||||||
Banque Cantonale Vaudoise | 79 | 54,503 | ||||||
BKW AG | 433 | 23,408 | ||||||
Cembra Money Bank AG (d) | 151 | 12,484 | ||||||
Emmi AG (d) | 65 | 44,270 | ||||||
Garmin Ltd. | 4,003 | 204,593 | ||||||
Intershop Holding AG | 49 | 24,362 | ||||||
Komax Holding AG | 287 | 69,769 | ||||||
Kudelski S.A. | 1,293 | 21,161 | ||||||
Nestle S.A. | 2,854 | 219,049 | ||||||
Partners Group Holding AG | 421 | 226,251 | ||||||
Schweiter Technologies AG | 24 | 26,620 | ||||||
Siegfried Holding AG (d) | 141 | 37,126 | ||||||
Swiss Life Holding AG (d) | 619 | 199,604 | ||||||
Swiss Re AG | 2,733 | 245,467 | ||||||
Valora Holding AG | 201 | 69,482 | ||||||
|
| |||||||
|
1,759,902
|
| ||||||
|
| |||||||
Taiwan - 4.7% | ||||||||
Accton Technology Corp. | 75,000 | 165,365 | ||||||
Arcadyan Technology Corp. | 24,000 | 47,852 | ||||||
Asia Vital Components Co., Ltd. | 37,000 | 31,893 | ||||||
Chang Hwa Commercial Bank Ltd. | 44,520 | 27,133 | ||||||
Cheng Uei Precision Industry Co., Ltd. | 16,000 | 20,721 | ||||||
Chicony Power Technology Co., Ltd. | 16,000 | 25,655 | ||||||
Chin-Poon Industrial Co., Ltd. | 21,000 | 42,704 | ||||||
China Airlines Ltd. | 148,000 | 51,454 | ||||||
China Metal Products | 25,000 | 25,577 | ||||||
China Motor Corp. | 30,000 | 27,490 | ||||||
Chunghwa Telecom Co., Ltd. | 158,000 | 536,549 | ||||||
Elite Material Co., Ltd. | 41,000 | 159,438 | ||||||
See accompanying Notes to Financial Statements | 23 | Semi-Annual Report/ March 31, 2017 |
Schedule of Investments
March 31, 2017 (unaudited)
AllianzGI Best Styles Global Managed Volatility Portfolio
| Shares | Value | |||||||
Farglory Land Development Co., Ltd. | 48,000 | 64,934 | ||||||
First Financial Holding Co., Ltd. | 308,000 | 187,789 | ||||||
Formosa Petrochemical Corp. | 120,000 | 419,164 | ||||||
Formosa Plastics Corp. | 24,000 | 71,568 | ||||||
Getac Technology Corp. | 49,000 | 70,405 | ||||||
Gintech Energy Corp. (d) | 19,000 | 11,083 | ||||||
Grape King Bio Ltd. | 5,000 | 31,456 | ||||||
Hon Hai Precision Industry Co., Ltd. | 168,500 | 505,346 | ||||||
Hua Nan Financial Holdings Co., Ltd. | 47,790 | 26,694 | ||||||
King Yuan Electronics Co., Ltd. | 80,000 | 73,827 | ||||||
Kinsus Interconnect Technology Corp. | 20,000 | 52,859 | ||||||
Powertech Technology, Inc. | 48,000 | 139,683 | ||||||
Sercomm Corp. | 37,000 | 92,692 | ||||||
Sinbon Electronics Co., Ltd. | 43,139 | 105,933 | ||||||
Sitronix Technology Corp. | 11,000 | 35,744 | ||||||
Taiwan Business Bank | 211,350 | 58,505 | ||||||
Taiwan Hon Chuan Enterprise Co., Ltd. | 17,000 | 32,938 | ||||||
TXC Corp. | 42,000 | 60,078 | ||||||
Wistron NeWeb Corp. | 15,450 | 43,436 | ||||||
WT Microelectronics Co., Ltd. | 17,000 | 24,853 | ||||||
Yageo Corp. | 11,206 | 30,544 | ||||||
|
| |||||||
|
3,301,362
|
| ||||||
|
| |||||||
Thailand - 0.7% | ||||||||
Bangkok Bank PCL | 31,800 | 172,208 | ||||||
Charoen Pokphand Foods PCL (c) | 205,700 | 166,135 | ||||||
Siam Cement PCL | 12,000 | 188,562 | ||||||
|
| |||||||
|
526,905
|
| ||||||
|
| |||||||
United Kingdom - 1.6% | ||||||||
British American Tobacco PLC | 1,406 | 93,282 | ||||||
Burford Capital Ltd. | 4,254 | 41,040 | ||||||
Compass Group PLC | 24,270 | 458,223 | ||||||
Gamma Communications PLC | 6,635 | 40,817 | ||||||
HSBC Holdings PLC | 12,133 | 98,967 | ||||||
Imperial Brands PLC | 5,648 | 273,723 | ||||||
Johnson Service Group PLC | 17,486 | 25,906 | ||||||
Marston’s PLC | 15,385 | 25,880 | ||||||
Northgate PLC | 2,990 | 20,604 | ||||||
Primary Health Properties PLC REIT | 14,934 | 20,675 | ||||||
RSA Insurance Group PLC | 7,011 | 51,488 | ||||||
|
| |||||||
|
1,150,605
|
| ||||||
|
| |||||||
United States - 55.7% | ||||||||
AbbVie, Inc. | 5,231 | 340,852 | ||||||
Accenture PLC, Class A | 3,515 | 421,378 | ||||||
Aetna, Inc. | 3,168 | 404,078 | ||||||
Aflac, Inc. | 3,576 | 258,974 | ||||||
AG Mortgage Investment Trust, Inc. REIT | 6,418 | 115,845 | ||||||
AGNC Investment Corp. REIT | 20,807 | 413,851 | ||||||
Agree Realty Corp. REIT | 2,485 | 119,181 | ||||||
Align Technology, Inc. (d) | 1,701 | 195,122 | ||||||
Altria Group, Inc. | 11,893 | 849,398 | ||||||
American Electric Power Co., Inc. | 4,091 | 274,629 | ||||||
American Financial Group, Inc. | 1,877 | 179,103 | ||||||
American Public Education, Inc. (d) | 838 | 19,190 | ||||||
AmerisourceBergen Corp. | 562 | 49,737 | ||||||
Amgen, Inc. | 2,306 | 378,345 | ||||||
AngioDynamics, Inc. (d) | 5,716 | 99,173 | ||||||
Annaly Capital Management, Inc. REIT | 51,236 | 569,232 | ||||||
Anthem, Inc. | 1,776 | 293,715 | ||||||
Anworth Mortgage Asset Corp. REIT | 25,370 | 140,803 | ||||||
Apollo Commercial Real Estate Finance, Inc. REIT | 6,001 | 112,879 | ||||||
Ares Commercial Real Estate Corp. REIT | 5,619 | 75,182 | ||||||
ARMOUR Residential REIT, Inc. | 3,566 | 80,984 | ||||||
AT&T, Inc. | 28,368 | 1,178,690 | ||||||
Atmos Energy Corp. | 2,195 | 173,383 | ||||||
Automatic Data Processing, Inc. | 5,810 | 594,886 | ||||||
AutoZone, Inc. (d) | 657 | 475,044 | ||||||
AvalonBay Communities, Inc. REIT | 533 | 97,859 | ||||||
AVX Corp. | 2,990 | 48,976 | ||||||
Axis Capital Holdings Ltd. | 5,725 | 383,747 | ||||||
Baxter International, Inc. | 9,529 | 494,174 | ||||||
Becton Dickinson and Co. | 266 | 48,795 | ||||||
Bemis Co., Inc. | 153 | 7,476 | ||||||
See accompanying Notes to Financial Statements | 24 | Semi-Annual Report/ March 31, 2017 |
Schedule of Investments
March 31, 2017 (unaudited)
AllianzGI Best Styles Global Managed Volatility Portfolio
| Shares | Value | |||||||
Blackstone Mortgage Trust, Inc., Class A REIT | 4,380 | 135,605 | ||||||
Brixmor Property Group, Inc. REIT | 586 | 12,576 | ||||||
CA, Inc. | 6,142 | 194,824 | ||||||
Capitol Federal Financial, Inc. | 6,849 | 100,201 | ||||||
Capstead Mortgage Corp. REIT | 9,708 | 102,322 | ||||||
Cardinal Health, Inc. | 3,180 | 259,329 | ||||||
Carriage Services, Inc. | 1,268 | 34,388 | ||||||
CenturyLink, Inc. | 7,431 | 175,149 | ||||||
Chimera Investment Corp. REIT | 7,430 | 149,937 | ||||||
Chubb Ltd. | 2,543 | 346,484 | ||||||
Cincinnati Financial Corp. | 3,104 | 224,326 | ||||||
Cisco Systems, Inc. | 15,867 | 536,305 | ||||||
Clorox Co. | 5,356 | 722,149 | ||||||
CME Group, Inc. | 2,273 | 270,032 | ||||||
CMS Energy Corp. | 4,735 | 211,844 | ||||||
Colgate-Palmolive Co. | 2,734 | 200,101 | ||||||
Computer Sciences Corp. | 2,765 | 190,813 | ||||||
Consolidated Edison, Inc. | 12,129 | 941,938 | ||||||
Convergys Corp. | 2,300 | 48,645 | ||||||
Cooper Cos., Inc. | 1,127 | 225,276 | ||||||
CYS Investments, Inc. REIT | 14,907 | 118,511 | ||||||
Darden Restaurants, Inc. | 2,642 | 221,056 | ||||||
DineEquity, Inc. | 1,369 | 74,501 | ||||||
Dominion Resources, Inc. | 179 | 13,885 | ||||||
Domino’s Pizza, Inc. | 1,021 | 188,170 | ||||||
Dr. Pepper Snapple Group, Inc. | 2,606 | 255,180 | ||||||
DTE Energy Co. | 2,286 | 233,423 | ||||||
Duke Energy Corp. | 10,338 | 847,819 | ||||||
Dynex Capital, Inc. REIT | 3,574 | 25,340 | ||||||
Ennis, Inc. | 3,369 | 57,273 | ||||||
Equity LifeStyle Properties, Inc. REIT | 2,259 | 174,079 | ||||||
Everest Re Group Ltd. | 2,374 | 555,065 | ||||||
Express Scripts Holding Co. (d) | 3,796 | 250,194 | ||||||
Exxon Mobil Corp. | 1,807 | 148,192 | ||||||
Federal Agricultural Mortgage Corp., Class C | 365 | 21,013 | ||||||
Fidelity & Guaranty Life | 4,707 | 130,855 | ||||||
First Busey Corp. | 1,059 | 31,135 | ||||||
FirstEnergy Corp. | 5,705 | 181,533 | ||||||
Ford Motor Co. | 22,201 | 258,420 | ||||||
General Mills, Inc. | 12,291 | 725,292 | ||||||
German American Bancorp, Inc. | 125 | 5,918 | ||||||
Getty Realty Corp. REIT | 1,279 | 32,320 | ||||||
Gilead Sciences, Inc. | 3,916 | 265,975 | ||||||
Hanover Insurance Group, Inc. | 1,435 | 129,236 | ||||||
HCA Holdings, Inc. (d) | 2,303 | 204,944 | ||||||
Henry Schein, Inc. (d) | 111 | 18,867 | ||||||
Hewlett Packard Enterprise Co. | 10,987 | 260,392 | ||||||
Huntington Ingalls Industries, Inc. | 234 | 46,856 | ||||||
Independence Realty Trust, Inc. REIT | 3,309 | 31,005 | ||||||
Ingredion, Inc. | 1,536 | 184,980 | ||||||
Insight Enterprises, Inc. (d) | 184 | 7,561 | ||||||
Intel Corp. | 11,561 | 417,005 | ||||||
Intuitive Surgical, Inc. (d) | 1,016 | 778,734 | ||||||
Invesco Mortgage Capital, Inc. REIT | 1,887 | 29,098 | ||||||
John B Sanfilippo & Son, Inc. | 170 | 12,442 | ||||||
Johnson & Johnson | 11,809 | 1,470,811 | ||||||
Johnson Controls International PLC | 4,596 | 193,584 | ||||||
Kellogg Co. | 845 | 61,355 | ||||||
Kimberly-Clark Corp. | 4,351 | 572,722 | ||||||
Laboratory Corp. of America Holdings (d) | 3,702 | 531,126 | ||||||
McDonald’s Corp. | 8,268 | 1,071,615 | ||||||
MedEquities Realty Trust, Inc. REIT | 8,327 | 93,346 | ||||||
Merck & Co., Inc. | 622 | 39,522 | ||||||
MFA Financial, Inc. REIT | 17,228 | 139,202 | ||||||
Mid-America Apartment Communities, Inc. REIT | 1,672 | 170,109 | ||||||
Monmouth Real Estate Investment Corp. REIT | 2,481 | 35,404 | ||||||
Motorola Solutions, Inc. | 2,498 | 215,378 | ||||||
MTGE Investment Corp. REIT | 6,422 | 107,569 | ||||||
NextEra Energy, Inc. | 3,220 | 413,351 | ||||||
Northfield Bancorp, Inc. | 1,980 | 35,680 | ||||||
NVR, Inc. (d) | 38 | 80,061 | ||||||
Old Republic International Corp. | 2,534 | 51,896 | ||||||
Omega Protein Corp. | 2,656 | 53,253 | ||||||
Omnicom Group, Inc. | 2,690 | 231,905 | ||||||
Orchid Island Capital, Inc. REIT | 12,119 | 121,069 | ||||||
Oritani Financial Corp. | 3,824 | 65,008 | ||||||
Owens & Minor, Inc. | 3,031 | 104,873 | ||||||
See accompanying Notes to Financial Statements | 25 | Semi-Annual Report/ March 31, 2017 |
Schedule of Investments
March 31, 2017 (unaudited)
AllianzGI Best Styles Global Managed Volatility Portfolio
| Shares | Value | |||||||
Paychex, Inc. | 3,565 | 209,978 | ||||||
PepsiCo, Inc. | 1,550 | 173,383 | ||||||
PetMed Express, Inc. | 3,809 | 76,713 | ||||||
PG&E Corp. | 5,603 | 371,815 | ||||||
Pinnacle Foods, Inc. | 3,189 | 184,547 | ||||||
Pinnacle West Capital Corp. | 2,114 | 176,265 | ||||||
Procter & Gamble Co. | 4,368 | 392,465 | ||||||
Progressive Corp. | 6,497 | 254,552 | ||||||
Quest Diagnostics, Inc. | 2,308 | 226,623 | ||||||
Republic Services, Inc. | 11,857 | 744,738 | ||||||
Reynolds American, Inc. | 6,289 | 396,333 | ||||||
Ross Stores, Inc. | 4,735 | 311,894 | ||||||
Southern Co. | 20,733 | 1,032,089 | ||||||
State National Cos., Inc. | 1,596 | 22,982 | ||||||
Stryker Corp. | 4,545 | 598,349 | ||||||
SunTrust Banks, Inc. | 4,838 | 267,541 | ||||||
Symantec Corp. | 4,365 | 133,918 | ||||||
Target Corp. | 8,879 | 490,032 | ||||||
Teleflex, Inc. | 1,019 | 197,411 | ||||||
TJX Cos., Inc. | 332 | 26,255 | ||||||
Towne Bank | 2,363 | 76,561 | ||||||
Travelers Cos., Inc. | 4,488 | 540,984 | ||||||
Triple-S Management Corp., Class B (d) | 1,294 | 22,736 | ||||||
Two Harbors Investment Corp. REIT | 4,285 | 41,093 | ||||||
Ulta Salon Cosmetics & Fragrance, Inc. (d) | 767 | 218,771 | ||||||
United Financial Bancorp, Inc. | 1,393 | 23,695 | ||||||
UnitedHealth Group, Inc. | 4,115 | 674,901 | ||||||
Unum Group | 4,367 | 204,769 | ||||||
Vail Resorts, Inc. | 1,017 | 195,162 | ||||||
Validus Holdings Ltd. | 2,310 | 130,261 | ||||||
Verizon Communications, Inc. | 20,326 | 990,892 | ||||||
Waste Management, Inc. | 12,214 | 890,645 | ||||||
Waterstone Financial, Inc. | 2,057 | 37,540 | ||||||
WEC Energy Group, Inc. | 10,717 | 649,772 | ||||||
Westar Energy, Inc. | 3,966 | 215,235 | ||||||
Xcel Energy, Inc. | 14,425 | 641,191 | ||||||
XL Group Ltd. | 5,032 | 200,576 | ||||||
Xylem, Inc. | 3,958 | 198,771 | ||||||
|
| |||||||
|
39,013,471
|
| ||||||
|
| |||||||
Total Common Stock (cost-$63,355,306) |
|
68,347,683
|
| |||||
|
| |||||||
PREFERRED STOCK - 0.1% | ||||||||
Colombia - 0.1% | ||||||||
Grupo Aval Acciones y Valores S.A. (cost-$10,562) | 27,464 | 11,177 | ||||||
|
| |||||||
| Principal Amount (000s) | ||||||||
Repurchase Agreements - 1.7% | ||||||||
State Street Bank and Trust Co., | $ | 1,208 | 1,208,000 | |||||
|
| |||||||
Total Investments (cost-$64,573,868) (b)-99.3% | 69,566,860 | |||||||
|
| |||||||
Other assets less liabilities (e)-0.7% |
|
523,261
|
| |||||
|
| |||||||
Net Assets-100.0% | $ | 70,090,121 | ||||||
|
| |||||||
See accompanying Notes to Financial Statements | 26 | Semi-Annual Report/ March 31, 2017 |
Schedule of Investments
March 31, 2017 (unaudited)
AllianzGI Best Styles Global Managed Volatility Portfolio
Notes to Schedule of Investments:
| (a) | 144A—Exempt from registration under Rule 144A of the Securities Act of 1933. These securities may be resold in transactions exempt from registration, typically only to qualified institutional buyers. Securities with an aggregate value of $479,135, representing 0.7% of net assets. |
| (b) | Securities with an aggregate value of $24,774,236, representing 35.3% of net assets, were valued utilizing modeling tools provided by a third-party vendor. See Note 1(a) and Note 1(b) in the Notes to Financial Statements. |
| (c) | Fair-Valued—Security with a value of $166,135, representing 0.2% of net assets. See Note 1(a) and Note 1(b) in the Notes to Financial Statements. |
| (d) | Non-income producing. |
| (e) | Includes net unrealized appreciation (depreciation) of other financial instruments. See Note 6(a) in the Notes to Financial Statements. |
Glossary:
GDR - Global Depositary Receipt
REIT - Real Estate Investment Trust
UNIT - More than one class of securities traded together.
See accompanying Notes to Financial Statements | 27 | Semi-Annual Report/ March 31, 2017 |
Schedule of Investments
March 31, 2017 (unaudited)
AllianzGI Best Styles Global Managed Volatility Portfolio
The industry classification of portfolio holdings and other assets less liabilities shown as a percentage of net assets were as follows:
Electric Utilities | 7.6% | |||
Insurance | 7.4% | |||
Diversified Telecommunication Services | 6.2% | |||
Health Care Providers & Services | 4.6% | |||
Pharmaceuticals | 4.5% | |||
Food Products | 4.4% | |||
Health Care Equipment & Supplies | 4.1% | |||
Hotels, Restaurants & Leisure | 4.0% | |||
Mortgage Real Estate Investment Trusts (REITs) | 3.5% | |||
Banks | 3.5% | |||
IT Services | 3.2% | |||
Commercial Services & Supplies | 3.1% | |||
Multi-Utilities | 2.9% | |||
Household Products | 2.7% | |||
Tobacco | 2.6% | |||
Equity Real Estate Investment Trusts (REITs) | 2.4% | |||
Specialty Retail | 2.1% | |||
Electronic Equipment, Instruments & Components | 1.7% | |||
Technology Hardware, Storage & Peripherals | 1.7% | |||
Oil, Gas & Consumable Fuels | 1.6% | |||
Communications Equipment | 1.6% | |||
Airlines | 1.5% | |||
Biotechnology | 1.4% | |||
Construction & Engineering | 1.3% | |||
Semiconductors & Semiconductor Equipment | 1.2% | |||
Multi-line Retail | 1.2% | |||
Wireless Telecommunication Services | 1.1% | |||
Household Durables | 1.0% | |||
Real Estate Management & Development | 1.0% | |||
Food & Staples Retailing | 1.0% | |||
Capital Markets | 0.9% | |||
Media | 0.9% | |||
Automobiles | 0.9% | |||
Road & Rail | 0.7% | |||
Transportation Infrastructure | 0.7% | |||
Beverages | 0.6% | |||
Chemicals | 0.6% | |||
Software | 0.6% | |||
Professional Services | 0.5% | |||
Aerospace & Defense | 0.5% | |||
Metals & Mining | 0.4% | |||
Machinery | 0.4% | |||
Building Products | 0.4% | |||
Thrifts & Mortgage Finance | 0.4% | |||
Construction Materials | 0.4% | |||
Leisure Equipment & Products | 0.3% | |||
Gas Utilities | 0.3% | |||
Diversified Financial Services | 0.3% | |||
Auto Components | 0.3% | |||
Paper & Forest Products | 0.2% | |||
Life Sciences Tools & Services | 0.2% | |||
Textiles, Apparel & Luxury Goods | 0.2% | |||
Trading Companies & Distributors | 0.2% | |||
Containers & Packaging | 0.1% | |||
Internet & Catalog Retail | 0.1% | |||
Industrial Conglomerates | 0.1% | |||
Diversified Consumer Services | 0.1% | |||
Marine | 0.1% | |||
Personal Products | 0.1% | |||
Repurchase Agreements | 1.7% | |||
Other assets less liabilities | 0.7% | |||
|
| |||
| 100.0% | ||||
|
|
See accompanying Notes to Financial Statements | 28 | Semi-Annual Report/ March 31, 2017 |
Schedule of Investments
March 31, 2017 (unaudited)
AllianzGI Discovery U.S. Portfolio
Shares
| Value
| |||||||
COMMON STOCK - 95.5% | ||||||||
Airlines - 0.9% | ||||||||
Delta Air Lines, Inc. (a) | 1,835 | $ | 84,337 | |||||
|
| |||||||
Banks - 9.2% | ||||||||
Bank of America Corp. (a) | 14,159 | 334,011 | ||||||
JPMorgan Chase & Co. (a) | 3,997 | 351,096 | ||||||
Signature Bank (a)(b) | 1,240 | 184,004 | ||||||
|
| |||||||
|
869,111
|
| ||||||
|
| |||||||
Biotechnology - 4.8% | ||||||||
BioMarin Pharmaceutical, Inc. (a)(b) | 2,006 | 176,087 | ||||||
Celgene Corp. (a)(b) | 1,379 | 171,589 | ||||||
Regeneron Pharmaceuticals, Inc. (a)(b) | 257 | 99,590 | ||||||
|
| |||||||
|
447,266
|
| ||||||
|
| |||||||
Capital Markets - 5.0% | ||||||||
BlackRock, Inc. (a) | 563 | 215,916 | ||||||
Intercontinental Exchange, Inc. (a) | 4,232 | 253,370 | ||||||
|
| |||||||
|
469,286
|
| ||||||
|
| |||||||
Chemicals - 3.7% | ||||||||
Albemarle Corp. (a) | 824 | 87,047 | ||||||
Chemours Co. (a) | 3,084 | 118,734 | ||||||
Dow Chemical Co. (a) | 2,170 | 137,882 | ||||||
|
| |||||||
|
343,663
|
| ||||||
|
| |||||||
Communications Equipment - 1.3% | ||||||||
Palo Alto Networks, Inc. (a)(b) | 1,114 | 125,525 | ||||||
|
| |||||||
Construction & Engineering - 1.4% | ||||||||
Fluor Corp. (a) | 2,560 | 134,707 | ||||||
|
| |||||||
Construction Materials - 1.8% | ||||||||
Vulcan Materials Co. (a) | 1,382 | 166,503 | ||||||
|
| |||||||
Energy Equipment & Services - 3.9% | ||||||||
Patterson-UTI Energy, Inc. (a) | 3,415 | 82,882 | ||||||
Schlumberger Ltd. (a) | 2,116 | 165,260 | ||||||
Weatherford International PLC (a)(b) | 18,430 | 122,559 | ||||||
|
| |||||||
|
370,701
|
| ||||||
|
| |||||||
Food & Staples Retailing - 1.5% | ||||||||
Walgreens Boots Alliance, Inc. (a) | 1,710 | 142,015 | ||||||
|
| |||||||
Food Products - 4.5% | ||||||||
Hain Celestial Group, Inc. (a)(b) | 4,005 | 148,986 | ||||||
Mondelez International, Inc., Class A (a) | 3,562 | 153,451 | ||||||
Tyson Foods, Inc., Class A (a) | 1,992 | 122,926 | ||||||
|
| |||||||
|
425,363
|
| ||||||
|
| |||||||
Health Care Equipment & Supplies - 3.1% | ||||||||
DexCom, Inc. (a)(b) | 1,775 | 150,396 | ||||||
Intuitive Surgical, Inc. (a)(b) | 179 | 137,198 | ||||||
|
| |||||||
|
| 287,594
|
| ||||||
|
| |||||||
Health Care Providers & Services - 2.4% | ||||||||
UnitedHealth Group, Inc. (a) | 1,395 |
|
228,794
|
| ||||
|
| |||||||
Hotels, Restaurants & Leisure - 3.3% | ||||||||
MGM Resorts International (a) | 4,662 | 127,739 | ||||||
Royal Caribbean Cruises Ltd. (a) | 1,890 | 185,428 | ||||||
|
| |||||||
|
313,167
|
| ||||||
|
| |||||||
Industrial Conglomerates - 2.4% | ||||||||
General Electric Co. (a) | 7,474 | 222,725 | ||||||
|
| |||||||
Insurance - 2.3% | ||||||||
Lincoln National Corp. (a) | 3,334 |
|
218,210 |
| ||||
|
| |||||||
See accompanying Notes to Financial Statements | 29 | Semi-Annual Report/ March 31, 2017 |
Schedule of Investments
March 31, 2017 (unaudited)
AllianzGI Discovery U.S. Portfolio
| Shares | Value | |||||||
Internet & Catalog Retail - 0.7% | ||||||||
Amazon.com, Inc. (a)(b) | 68 | 60,285 | ||||||
|
| |||||||
IT Services - 3.7% | ||||||||
International Business Machines Corp. (a) | 1,143 | 199,042 | ||||||
Visa, Inc., Class A (a) | 1,680 | 149,302 | ||||||
|
| |||||||
|
348,344
|
| ||||||
|
| |||||||
Machinery - 3.1% | ||||||||
Fortive Corp. (a) | 2,325 | 140,012 | ||||||
Stanley Black & Decker, Inc. (a) | 1,168 | 155,192 | ||||||
|
| |||||||
|
295,204
|
| ||||||
|
| |||||||
Media - 2.7% | ||||||||
Comcast Corp., Class A (a) | 6,852 | 257,567 | ||||||
|
| |||||||
Oil, Gas & Consumable Fuels - 2.0% | ||||||||
Continental Resources, Inc. (a)(b) | 2,144 | 97,380 | ||||||
PDC Energy, Inc. (a)(b) | 1,485 | 92,590 | ||||||
|
| |||||||
|
189,970
|
| ||||||
|
| |||||||
Personal Products - 1.5% | ||||||||
Estee Lauder Cos., Inc., Class A (a) | 1,700 | 144,143 | ||||||
|
| |||||||
Pharmaceuticals - 4.5% | ||||||||
Allergan PLC (a) | 838 | 200,215 | ||||||
Merck & Co., Inc. (a) | 3,502 | 222,517 | ||||||
|
| |||||||
|
422,732
|
| ||||||
|
| |||||||
Road & Rail - 1.6% | ||||||||
Kansas City Southern (a) | 1,710 | 146,650 | ||||||
|
| |||||||
Semiconductors & Semiconductor Equipment - 8.4% | ||||||||
Applied Materials, Inc. (a) | 4,752 | 184,853 | ||||||
Broadcom Ltd. (a) | 590 | 129,186 | ||||||
Intel Corp. (a) | 5,835 | 210,469 | ||||||
Microsemi Corp. (a)(b) | 1,795 | 92,496 | ||||||
Skyworks Solutions, Inc. (a) | 1,795 | 175,874 | ||||||
|
| |||||||
|
792,878
|
| ||||||
|
| |||||||
Software - 8.9% | ||||||||
Microsoft Corp. (a) | 5,657 | 372,570 | ||||||
Mobileye NV (b) | 4,683 | 287,536 | ||||||
Salesforce.com, Inc. (a)(b) | 2,129 | 175,621 | ||||||
|
| |||||||
|
835,727
|
| ||||||
|
| |||||||
Specialty Retail - 3.0% | ||||||||
GameStop Corp., Class A (a) | 2,640 | 59,532 | ||||||
Home Depot, Inc. (a) | 1,502 | 220,539 | ||||||
|
| |||||||
|
280,071
|
| ||||||
|
| |||||||
Technology Hardware, Storage & Peripherals - 2.2% | ||||||||
Apple, Inc. (a) | 1,460 |
| 209,744
|
| ||||
|
| |||||||
Trading Companies & Distributors - 1.7% | ||||||||
WW Grainger, Inc. (a) | 681 | 158,509 | ||||||
|
| |||||||
Total Common Stock (cost-$7,911,185) |
|
8,990,791
|
| |||||
|
| |||||||
| Principal Amount (000s) | ||||||||
Repurchase Agreements - 76.0% | ||||||||
State Street Bank and Trust Co., | $ | 7,156 |
| 7,156,000
|
| |||
|
| |||||||
See accompanying Notes to Financial Statements | 30 | Semi-Annual Report/ March 31, 2017 |
Schedule of Investments
March 31, 2017 (unaudited)
AllianzGI Discovery U.S. Portfolio
| Shares | Value | |||||||
Total Investments, before securities sold short (cost-$15,067,185)-171.5% | 16,146,791 | |||||||
|
| |||||||
SECURITIES SOLD SHORT - (88.8)% | ||||||||
Common Stock - (81.2)% | ||||||||
Aerospace & Defense - (0.7)% | ||||||||
United Technologies Corp. | 625 | (70,131) | ||||||
|
| |||||||
Air Freight & Logistics - (3.5)% | ||||||||
CH Robinson Worldwide, Inc. | 1,234 | (95,376) | ||||||
Expeditors International of Washington, Inc. | 1,798 | (101,569) | ||||||
United Parcel Service, Inc., Class B | 1,200 | (128,760) | ||||||
|
| |||||||
|
(325,705)
|
| ||||||
|
| |||||||
Airlines - (1.1)% | ||||||||
Alaska Air Group, Inc. | 1,100 | (101,442) | ||||||
|
| |||||||
Auto Components - (1.8)% | ||||||||
BorgWarner, Inc. | 2,336 | (97,621) | ||||||
Goodyear Tire & Rubber Co. | 2,010 | (72,360) | ||||||
|
| |||||||
|
(169,981)
|
| ||||||
|
| |||||||
Automobiles - (1.3)% | ||||||||
Ford Motor Co. | 10,858 | (126,387) | ||||||
|
| |||||||
Banks - (4.0)% | ||||||||
BB&T Corp. | 1,052 | (47,024) | ||||||
Citigroup, Inc. | 1,644 | (98,344) | ||||||
U.S. Bancorp | 861 | (44,342) | ||||||
Wells Fargo & Co. | 3,379 | (188,075) | ||||||
|
| |||||||
|
(377,785)
|
| ||||||
|
| |||||||
Beverages - (1.6)% | ||||||||
Coca-Cola Co. | 3,492 | (148,200) | ||||||
|
| |||||||
Biotechnology - (1.9)% | ||||||||
Amgen, Inc. | 1,100 | (180,477) | ||||||
|
| |||||||
Capital Markets - (3.1)% | ||||||||
FactSet Research Systems, Inc. | 601 | (99,111) | ||||||
Invesco Ltd. | 3,122 | (95,627) | ||||||
T Rowe Price Group, Inc. | 1,425 | (97,114) | ||||||
|
| |||||||
|
(291,852)
|
| ||||||
|
| |||||||
Chemicals - (1.1)% | ||||||||
Ashland Global Holdings, Inc. | 821 | (101,648) | ||||||
|
| |||||||
Communications Equipment - (2.1)% | ||||||||
Cisco Systems, Inc. | 2,914 | (98,493) | ||||||
Juniper Networks, Inc. | 3,500 | (97,405) | ||||||
|
| |||||||
|
(195,898)
|
| ||||||
|
| |||||||
Consumer Finance - (1.5)% | ||||||||
American Express Co. | 1,797 | (142,161) | ||||||
|
| |||||||
Containers & Packaging - (2.7)% | ||||||||
Ball Corp. | 1,146 | (85,102) | ||||||
Crown Holdings, Inc. (b) | 1,400 | (74,130) | ||||||
International Paper Co. | 1,837 | (93,283) | ||||||
|
| |||||||
|
(252,515)
|
| ||||||
|
| |||||||
Electrical Equipment - (0.6)% | ||||||||
Acuity Brands, Inc. | 300 | (61,200) | ||||||
|
| |||||||
Electronic Equipment, Instruments & Components - (1.0)% | ||||||||
Amphenol Corp., Class A | 1,381 | (98,286) | ||||||
|
| |||||||
Equity Real Estate Investment Trusts (REITs) - (3.8)% | ||||||||
Apartment Investment & Management Co., Class A | 1,599 | (70,916) | ||||||
AvalonBay Communities, Inc. | 433 | (79,499) | ||||||
Boston Properties, Inc. | 366 | (48,462) | ||||||
Equity Residential | 1,200 | (74,664) | ||||||
Essex Property Trust, Inc. | 350 | (81,035) | ||||||
|
| |||||||
|
(354,576)
|
| ||||||
|
| |||||||
See accompanying Notes to Financial Statements | 31 | Semi-Annual Report/ March 31, 2017 |
Schedule of Investments
March 31, 2017 (unaudited)
AllianzGI Discovery U.S. Portfolio
| Shares | Value | |||||||
Food & Staples Retailing - (5.0)% | ||||||||
Costco Wholesale Corp. | 424 | (71,101) | ||||||
CVS Health Corp. | 1,167 | (91,609) | ||||||
Kroger Co. | 2,402 | (70,835) | ||||||
Wal-Mart Stores, Inc. | 2,013 | (145,097) | ||||||
Whole Foods Market, Inc. | 3,139 | (93,291) | ||||||
|
| |||||||
|
(471,933)
|
| ||||||
|
| |||||||
Food Products - (0.8)% | ||||||||
Hormel Foods Corp. | 2,100 | (72,723) | ||||||
|
| |||||||
Health Care Equipment & Supplies - (0.8)% | ||||||||
DENTSPLY SIRONA, Inc. | 1,133 | (70,745) | ||||||
|
| |||||||
Health Care Providers & Services - (3.4)% | ||||||||
AmerisourceBergen Corp. | 815 | (72,127) | ||||||
Envision Healthcare Corp. (b) | 1,500 | (91,980) | ||||||
Express Scripts Holding Co. (b) | 1,269 | (83,640) | ||||||
Patterson Cos., Inc. | 1,691 | (76,484) | ||||||
|
| |||||||
|
(324,231)
|
| ||||||
|
| |||||||
Hotels, Restaurants & Leisure - (1.0)% | ||||||||
McDonald’s Corp. | 746 | (96,689) | ||||||
|
| |||||||
Household Durables - (2.6)% | ||||||||
Leggett & Platt, Inc. | 1,486 | (74,776) | ||||||
PulteGroup, Inc. | 3,351 | (78,916) | ||||||
Whirlpool Corp. | 555 | (95,088) | ||||||
|
| |||||||
|
(248,780)
|
| ||||||
|
| |||||||
Household Products - (2.6)% | ||||||||
Colgate-Palmolive Co. | 1,986 | (145,355) | ||||||
Procter & Gamble Co. | 1,100 | (98,835) | ||||||
|
| |||||||
|
(244,190)
|
| ||||||
|
| |||||||
Industrial Conglomerates - (0.6)% | ||||||||
3M Co. | 273 | (52,233) | ||||||
|
| |||||||
Insurance - (2.6)% | ||||||||
Aflac, Inc. | 1,310 | (94,870) | ||||||
Cincinnati Financial Corp. | 1,048 | (75,739) | ||||||
Hartford Financial Services Group, Inc. | 1,482 | (71,240) | ||||||
|
| |||||||
|
(241,849)
|
| ||||||
|
| |||||||
Internet & Catalog Retail - (0.8)% | ||||||||
TripAdvisor, Inc. (b) | 1,736 | (74,926) | ||||||
|
| |||||||
Internet Software & Services - (2.3)% | ||||||||
Akamai Technologies, Inc. (b) | 1,200 | (71,640) | ||||||
Alphabet, Inc., Class A (b) | 110 | (93,258) | ||||||
eBay, Inc. (b) | 1,424 | (47,804) | ||||||
|
| |||||||
|
(212,702)
|
| ||||||
|
| |||||||
IT Services - (2.4)% | ||||||||
Accenture PLC, Class A | 599 | (71,808) | ||||||
EPAM Systems, Inc. (b) | 712 | (53,770) | ||||||
Western Union Co. | 4,705 | (95,747) | ||||||
|
| |||||||
|
(221,325)
|
| ||||||
|
| |||||||
Leisure Equipment & Products - (0.9)% | ||||||||
Polaris Industries, Inc. | 1,052 | (88,158) | ||||||
|
| |||||||
Life Sciences Tools & Services - (0.8)% | ||||||||
PerkinElmer, Inc. | 1,286 | (74,665) | ||||||
|
| |||||||
Machinery - (2.8)% | ||||||||
Caterpillar, Inc. | 1,273 | (118,084) | ||||||
ITT, Inc. | 1,200 | (49,224) | ||||||
See accompanying Notes to Financial Statements | 32 | Semi-Annual Report/ March 31, 2017 |
Schedule of Investments
March 31, 2017 (unaudited)
AllianzGI Discovery U.S. Portfolio
| Shares | Value | |||||||
Pentair PLC | 1,576 | (98,941) | ||||||
|
| |||||||
|
(266,249)
|
| ||||||
|
| |||||||
Media - (1.2)% | ||||||||
Walt Disney Co. | 1,009 | (114,411) | ||||||
|
| |||||||
Multi-Utilities - (1.1)% | ||||||||
Dominion Resources, Inc. | 1,300 | (100,841) | ||||||
|
| |||||||
Oil, Gas & Consumable Fuels - (2.0)% | ||||||||
Exxon Mobil Corp. | 887 | (72,743) | ||||||
Phillips 66 | 1,493 | (118,275) | ||||||
|
| |||||||
|
(191,018)
|
| ||||||
|
| |||||||
Pharmaceuticals - (1.5)% | ||||||||
Bristol-Myers Squibb Co. | 2,600 | (141,388) | ||||||
|
| |||||||
Professional Services - (2.4)% | ||||||||
Dun & Bradstreet Corp. | 500 | (53,970) | ||||||
Robert Half International, Inc. | 1,500 | (73,245) | ||||||
Verisk Analytics, Inc., Class A (b) | 1,200 | (97,368) | ||||||
|
| |||||||
|
(224,583)
|
| ||||||
|
| |||||||
Road & Rail - (1.1)% | ||||||||
JB Hunt Transport Services, Inc. | 1,100 | (100,914) | ||||||
|
| |||||||
Semiconductors & Semiconductor Equipment - (2.9)% | ||||||||
Qorvo, Inc. (b) | 1,121 | (76,856) | ||||||
QUALCOMM, Inc. | 2,156 | (123,625) | ||||||
Texas Instruments, Inc. | 886 | (71,376) | ||||||
|
| |||||||
|
(271,857)
|
| ||||||
|
| |||||||
Software - (4.5)% | ||||||||
ANSYS, Inc. (b) | 699 | (74,702) | ||||||
CA, Inc. | 3,042 | (96,492) | ||||||
Oracle Corp. | 3,477 | (155,109) | ||||||
Ultimate Software Group, Inc. (b) | 510 | (99,557) | ||||||
|
| |||||||
|
(425,860)
|
| ||||||
|
| |||||||
Specialty Retail - (2.8)% | ||||||||
Advance Auto Parts, Inc. | 412 | (61,083) | ||||||
AutoNation, Inc. (b) | 1,108 | (46,857) | ||||||
AutoZone, Inc. (b) | 84 | (60,736) | ||||||
Bed Bath & Beyond, Inc. (b) | 2,443 | (96,401) | ||||||
|
| |||||||
|
(265,077)
|
| ||||||
|
| |||||||
Textiles, Apparel & Luxury Goods - (0.5)% | ||||||||
Hanesbrands, Inc. | 2,400 | (49,824) | ||||||
|
| |||||||
Total Common Stock (proceeds received-$7,464,280) |
|
(7,645,415)
|
| |||||
|
| |||||||
Exchange-Traded Funds - (7.6)% | ||||||||
Health Care Select Sector SPDR | 1,979 | (147,158) | ||||||
iShares Nasdaq Biotechnology Index | 607 | (178,015) | ||||||
iShares PHLX Semiconductor | 1,057 | (144,693) | ||||||
Technology Select Sector SPDR | 4,554 | (242,774) | ||||||
|
| |||||||
Total Exchange-Traded Funds (proceeds received-$644,987) |
|
(712,640)
|
| |||||
|
| |||||||
Total Securities Sold Short (proceeds received-$8,109,267) |
| (8,358,055)
|
| |||||
|
| |||||||
Total Investments, net of securities sold short (cost-$6,957,918)-82.7% | 7,788,736 | |||||||
|
| |||||||
Other assets less other liabilities-17.3% |
|
1,625,702
|
| |||||
|
| |||||||
Net Assets-100.0% | $ 9,414,438 | |||||||
|
| |||||||
See accompanying Notes to Financial Statements | 33 | Semi-Annual Report/ March 31, 2017 |
Schedule of Investments
March 31, 2017 (unaudited)
AllianzGI Discovery U.S. Portfolio
Notes to Schedule of Investments:
| (a) | All or partial amount segregated for the benefit of the counterparty as collateral for securities sold short. |
| (b) | Non-income producing. |
See accompanying Notes to Financial Statements | 34 | Semi-Annual Report/ March 31, 2017 |
Schedule of Investments
March 31, 2017 (unaudited)
AllianzGI Global Small-Cap Opportunities Portfolio
| Shares | Value | |||||||
COMMON STOCK - 100.1% | ||||||||
Canada - 0.7% | ||||||||
Canfor Pulp Products, Inc. | 2,168 | $ 19,710 | ||||||
Celestica, Inc. (b) | 813 | 11,823 | ||||||
|
| |||||||
|
31,533
|
| ||||||
|
| |||||||
China - 6.1% | ||||||||
Central China Real Estate Ltd. (b) | 37,000 | 9,140 | ||||||
China Everbright Bank Co., Ltd., Class H | 143,000 | 69,939 | ||||||
China Overseas Grand Oceans Group Ltd. (b) | 49,000 | 25,872 | ||||||
Chongqing Rural Commercial Bank Co., Ltd., Class H | 27,000 | 18,241 | ||||||
Jumei International Holding Ltd. ADR (b) | 12,975 | 47,878 | ||||||
Kingboard Chemical Holdings Ltd. | 13,000 | 48,029 | ||||||
Weichai Power Co., Ltd., Class H | 28,000 | 49,460 | ||||||
|
| |||||||
|
268,559
|
| ||||||
|
| |||||||
Czech Republic - 0.3% | ||||||||
Philip Morris CR AS | 24 | 12,858 | ||||||
|
| |||||||
Germany - 0.2% | ||||||||
DIC Asset AG | 862 | 8,562 | ||||||
|
| |||||||
Greece - 2.1% | ||||||||
Motor Oil Hellas Corinth Refineries S.A. | 5,264 | 89,809 | ||||||
|
| |||||||
Indonesia - 0.6% | ||||||||
Indo Tambangraya Megah Tbk PT | 18,000 | 27,288 | ||||||
|
| |||||||
Israel - 0.8% | ||||||||
Orbotech Ltd. (b) | 1,105 | 35,636 | ||||||
|
| |||||||
Italy - 0.3% | ||||||||
ASTM SpA | 1,018 | 15,269 | ||||||
|
| |||||||
Japan - 11.5% | ||||||||
Asahi Holdings, Inc. | 1,400 | 25,380 | ||||||
Fukuda Denshi Co., Ltd. | 300 | 17,165 | ||||||
Geo Holdings Corp. | 3,700 | 40,695 | ||||||
GungHo Online Entertainment, Inc. | 22,900 | 51,126 | ||||||
Gunma Bank Ltd. | 16,600 | 86,601 | ||||||
Ines Corp. | 1,600 | 15,489 | ||||||
Kamei Corp. | 2,300 | 25,654 | ||||||
Noritz Corp. | 700 | 13,309 | ||||||
Okamura Corp. | 1,800 | 16,010 | ||||||
Sankyu, Inc. | 11,000 | 66,907 | ||||||
Ship Healthcare Holdings, Inc. | 2,100 | 56,090 | ||||||
Sumitomo Forestry Co., Ltd. | 4,500 | 68,589 | ||||||
Tokyo Steel Manufacturing Co., Ltd. | 1,300 | 10,957 | ||||||
Unipres Corp. | 400 | 8,368 | ||||||
|
| |||||||
|
502,340
|
| ||||||
|
| |||||||
Korea (Republic of) - 3.2% | ||||||||
DGB Financial Group, Inc. | 2,390 | 23,170 | ||||||
KB Insurance Co., Ltd. | 564 | 13,615 | ||||||
Poongsan Corp. | 1,677 | 58,677 | ||||||
Unid Co., Ltd. | 1,067 | 42,697 | ||||||
|
| |||||||
|
138,159
|
| ||||||
|
| |||||||
Malaysia - 0.8% | ||||||||
Malaysian Pacific Industries Bhd. | 14,100 | 36,640 | ||||||
|
| |||||||
Philippines - 1.4% | ||||||||
Cebu Air, Inc. | 12,340 | 23,094 | ||||||
Semirara Mining & Power Corp. | 12,600 | 37,065 | ||||||
|
| |||||||
|
60,159
|
| ||||||
|
| |||||||
Poland - 3.1% | ||||||||
Energa S.A. | 32,058 | 85,883 | ||||||
PGE Polska Grupa Energetyczna S.A. | 16,862 | 48,432 | ||||||
|
| |||||||
|
134,315
|
| ||||||
|
| |||||||
See accompanying Notes to Financial Statements | 35 | Semi-Annual Report/ March 31, 2017 |
Schedule of Investments
March 31, 2017 (unaudited)
AllianzGI Global Small-Cap Opportunities Portfolio
| Shares | Value | |||||||
Russian Federation - 3.2% | ||||||||
Acron PJSC | 180 | 10,501 | ||||||
Magnitogorsk Iron & Steel OJSC | 89,100 | 58,134 | ||||||
Severstal PJSC | 4,930 | 71,439 | ||||||
|
| |||||||
|
140,074
|
| ||||||
|
| |||||||
Singapore - 4.9% | ||||||||
RHT Health Trust UNIT | 55,200 | 35,120 | ||||||
Venture Corp., Ltd. | 9,600 | 78,716 | ||||||
Yanlord Land Group Ltd. | 76,000 | 98,610 | ||||||
|
| |||||||
|
212,446
|
| ||||||
|
| |||||||
Switzerland - 1.9% | ||||||||
BKW AG | 1,568 | 84,767 | ||||||
|
| |||||||
Taiwan - 3.9% | ||||||||
China Life Insurance Co., Ltd. | 37,000 | 36,589 | ||||||
Chong Hong Construction Co., Ltd. | 6,000 | 14,640 | ||||||
Greatek Electronics, Inc. | 46,000 | 63,066 | ||||||
King’s Town Bank Co., Ltd. | 33,000 | 32,796 | ||||||
Sigurd Microelectronics Corp. | 25,000 | 22,822 | ||||||
|
| |||||||
|
169,913
|
| ||||||
|
| |||||||
Thailand - 1.7% | ||||||||
Bangchak Petroleum PCL | 42,300 | 40,630 | ||||||
Thai Vegetable Oil PCL | 36,300 | 35,389 | ||||||
|
| |||||||
|
| 76,019
|
| ||||||
|
| |||||||
Turkey - 2.0% | ||||||||
Tupras Turkiye Petrol Rafinerileri AS | 3,610 | 89,687 | ||||||
|
| |||||||
United States - 51.4% | ||||||||
Advanced Energy Industries, Inc. (b) | 1,465 | 100,440 | ||||||
Alliance Holdings GP L.P. | 2,455 | 67,341 | ||||||
American Axle & Manufacturing Holdings, Inc. (b) | 2,835 | 53,241 | ||||||
ANI Pharmaceuticals, Inc. (b) | 1,055 | 52,233 | ||||||
Brady Corp., Class A | 1,020 | 39,423 | ||||||
Brooks Automation, Inc. | 3,680 | 82,432 | ||||||
BWX Technologies, Inc. | 1,215 | 57,834 | ||||||
Central Garden & Pet Co. (b) | 1,810 | 67,097 | ||||||
Comfort Systems USA, Inc. | 995 | 36,467 | ||||||
Compass Diversified Holdings | 975 | 16,185 | ||||||
Copa Holdings S.A., Class A | 340 | 38,165 | ||||||
CoreCivic, Inc. REIT | 2,470 | 77,607 | ||||||
EnerSys | 120 | 9,473 | ||||||
Exactech, Inc. (b) | 1,730 | 43,596 | ||||||
Extended Stay America, Inc. UNIT | 4,085 | 65,115 | ||||||
Financial Institutions, Inc. | 1,760 | 57,992 | ||||||
First Merchants Corp. | 810 | 31,849 | ||||||
Halyard Health, Inc. (b) | 755 | 28,758 | ||||||
Hooker Furniture Corp. | 1,355 | 42,073 | ||||||
Huntington Bancshares, Inc. | 5,980 | 80,072 | ||||||
Hyster-Yale Materials Handling, Inc. | 345 | 19,455 | ||||||
Innophos Holdings, Inc. | 600 | 32,382 | ||||||
John Bean Technologies Corp. | 900 | 79,155 | ||||||
Koppers Holdings, Inc. (b) | 920 | 38,962 | ||||||
Lear Corp. | 185 | 26,192 | ||||||
Lydall, Inc. (b) | 720 | 38,592 | ||||||
Manpowergroup, Inc. | 775 | 79,492 | ||||||
MarineMax, Inc. (b) | 1,450 | 31,392 | ||||||
Moog, Inc., Class A (b) | 1,160 | 78,126 | ||||||
MSA Safety, Inc. | 1,130 | 79,880 | ||||||
Phibro Animal Health Corp., Class A | 650 | 18,265 | ||||||
Plantronics, Inc. | 880 | 47,617 | ||||||
Quintiles IMS Holdings, Inc. (b) | 880 | 70,866 | ||||||
RMR Group, Inc., Class A | 965 | 47,767 | ||||||
Rogers Corp. (b) | 760 | 65,261 | ||||||
Sanmina Corp. (b) | 2,490 | 101,094 | ||||||
Schweitzer-Mauduit International, Inc. | 1,635 | 67,722 | ||||||
Seacoast Banking Corp. of Florida (b) | 3,350 | 80,333 | ||||||
Take-Two Interactive Software, Inc. (b) | 710 | 42,082 | ||||||
Tower International, Inc. | 1,200 | 32,520 | ||||||
Universal Forest Products, Inc. | 385 | 37,938 | ||||||
See accompanying Notes to Financial Statements | 36 | Semi-Annual Report/ March 31, 2017 |
Schedule of Investments
March 31, 2017 (unaudited)
AllianzGI Global Small-Cap Opportunities Portfolio
| Shares | Value | |||||||
Viad Corp. | 1,925 | 87,010 | ||||||
|
| |||||||
|
2,249,496
|
| ||||||
|
| |||||||
Total Investments (cost-$3,786,175) (a)-100.1% |
|
4,383,529 |
| |||||
|
| |||||||
Liabilities in excess of other assets-(0.1)% |
|
(3,004)
|
| |||||
|
| |||||||
Net Assets-100.0% | $ 4,380,525 | |||||||
|
| |||||||
Notes to Schedule of Investments:
| (a) | Securities with an aggregate value of $1,569,811, representing 35.8% of net assets, were valued utilizing modeling tools provided by a third-party vendor. See Note 1(a) and Note 1(b) in the Notes to Financial Statements. |
| (b) | Non-income producing. |
Glossary:
ADR - American Depositary Receipt
REIT - Real Estate Investment Trust
UNIT - More than one class of securities traded together.
See accompanying Notes to Financial Statements | 37 | Semi-Annual Report/ March 31, 2017 |
Schedule of Investments
March 31, 2017 (unaudited)
AllianzGI Global Small-Cap Opportunities Portfolio
The industry classification of portfolio holdings and liabilities in excess of other assets shown as a percentage of net assets were as follows:
Banks | 11.0% | |||
Oil, Gas & Consumable Fuels | 8.0% | |||
Electronic Equipment, Instruments & Components | 7.8% | |||
Semiconductors & Semiconductor Equipment | 7.0% | |||
Metals & Mining | 5.1% | |||
Commercial Services & Supplies | 5.1% | |||
Electric Utilities | 5.0% | |||
Real Estate Management & Development | 4.7% | |||
Machinery | 4.3% | |||
Aerospace & Defense | 3.1% | |||
Chemicals | 2.8% | |||
Auto Components | 2.8% | |||
Household Durables | 2.5% | |||
Software | 2.1% | |||
Health Care Providers & Services | 2.1% | |||
Health Care Equipment & Supplies | 2.0% | |||
Paper & Forest Products | 2.0% | |||
Professional Services | 1.8% | |||
Equity Real Estate Investment Trusts (REITs) | 1.8% | |||
Specialty Retail | 1.6% | |||
Life Sciences Tools & Services | 1.6% | |||
Pharmaceuticals | 1.6% | |||
Household Products | 1.5% | |||
Road & Rail | 1.5% | |||
Hotels, Restaurants & Leisure | 1.5% | |||
Airlines | 1.4% | |||
Building Products | 1.2% | |||
Insurance | 1.1% | |||
Internet & Catalog Retail | 1.1% | |||
Communications Equipment | 1.1% | |||
Construction & Engineering | 0.8% | |||
Food Products | 0.8% | |||
Trading Companies & Distributors | 0.6% | |||
Diversified Financial Services | 0.4% | |||
IT Services | 0.4% | |||
Transportation Infrastructure | 0.4% | |||
Tobacco | 0.3% | |||
Electrical Equipment | 0.2% | |||
Liabilities in excess of other assets | (0.1)% | |||
|
| |||
| 100.0% | ||||
|
|
See accompanying Notes to Financial Statements | 38 | Semi-Annual Report/ March 31, 2017 |
Statements of Assets and Liabilities
March 31, 2017 (unaudited)
| AllianzGI Advanced Core Bond | AllianzGI Best Styles Global Managed Volatility | AllianzGI Discovery U.S. | AllianzGI Global Small-Cap Opportunities | |||||||||||||||||||||||||||||
Assets: | ||||||||||||||||||||||||||||||||
Investments, at value | $206,242,483 | $68,358,860 | $8,990,791 | $4,383,529 | ||||||||||||||||||||||||||||
|
|
|
|
|
|
|
|
| ||||||||||||||||||||||||
Repurchase agreements, at value | 1,258,000 | 1,208,000 | 7,156,000 | – | ||||||||||||||||||||||||||||
|
|
|
|
|
|
|
|
| ||||||||||||||||||||||||
Cash | 899 | 857 | 376 | 21,070 | ||||||||||||||||||||||||||||
|
|
|
|
|
|
|
|
| ||||||||||||||||||||||||
Foreign currency, at value | – | 17,494 | – | 22,361 | ||||||||||||||||||||||||||||
|
|
|
|
|
|
|
|
| ||||||||||||||||||||||||
Dividends and interest receivable (net of foreign withholding taxes) | 1,111,590 | 238,137 | 8,347 | 9,355 | ||||||||||||||||||||||||||||
|
|
|
|
|
|
|
|
| ||||||||||||||||||||||||
Receivable for Fund shares sold | 423,766 | – | – | – | ||||||||||||||||||||||||||||
|
|
|
|
|
|
|
|
| ||||||||||||||||||||||||
Deposits with brokers for derivatives collateral | 221,397 | 273,516 | – | – | ||||||||||||||||||||||||||||
|
|
|
|
|
|
|
|
| ||||||||||||||||||||||||
Receivable for variation margin on futures contracts | – | 9,834 | – | – | ||||||||||||||||||||||||||||
|
|
|
|
|
|
|
|
| ||||||||||||||||||||||||
Receivable for investments sold | – | – | 857,508 | – | ||||||||||||||||||||||||||||
|
|
|
|
|
|
|
|
| ||||||||||||||||||||||||
Tax reclaims receivable | – | 19,104 | – | 1,266 | ||||||||||||||||||||||||||||
|
|
|
|
|
|
|
|
| ||||||||||||||||||||||||
Receivable from Investment Manager | – | – | 8,450 | 8,376 | ||||||||||||||||||||||||||||
|
|
|
|
|
|
|
|
| ||||||||||||||||||||||||
Deposits with brokers for securities sold short collateral | – | – | 1,369,290 | – | ||||||||||||||||||||||||||||
|
|
|
|
|
|
|
|
| ||||||||||||||||||||||||
Uninvested Cash - Trustees Deferred Compensation Plan (see Note 4) | 1,633 | 542 | 92 | 71 | ||||||||||||||||||||||||||||
|
|
|
|
|
|
|
|
| ||||||||||||||||||||||||
Deferred offering costs | – | 1,516 | – | – | ||||||||||||||||||||||||||||
|
|
|
|
|
|
|
|
| ||||||||||||||||||||||||
Investments in Affiliated Funds - Trustees Deferred Compensation Plan (see Note 4) | 6,237 | 1,668 | 297 | 738 | ||||||||||||||||||||||||||||
|
|
|
|
|
|
|
|
| ||||||||||||||||||||||||
Prepaid expenses and other assets | 2,364 | 1,750 | 1,329 | 1,251 | ||||||||||||||||||||||||||||
|
|
|
|
|
|
|
|
| ||||||||||||||||||||||||
Total Assets | 209,268,369 | 70,131,278 | 18,392,480 | 4,448,017 | ||||||||||||||||||||||||||||
|
|
|
|
|
|
|
|
| ||||||||||||||||||||||||
Liabilities: | ||||||||||||||||||||||||||||||||
Payable for investments purchased | – | – | 554,312 | – | ||||||||||||||||||||||||||||
|
|
|
|
|
|
|
|
| ||||||||||||||||||||||||
Payable for TBA investments purchased | 44,971,936 | – | – | – | ||||||||||||||||||||||||||||
|
|
|
|
|
|
|
|
| ||||||||||||||||||||||||
Payable for securities sold short expenses | – | – | 8,718 | – | ||||||||||||||||||||||||||||
|
|
|
|
|
|
|
|
| ||||||||||||||||||||||||
Payable for variation margin on futures contracts | 16,087 | 3,811 | – | – | ||||||||||||||||||||||||||||
|
|
|
|
|
|
|
|
| ||||||||||||||||||||||||
Investment management fees payable | 17,913 | 4,773 | – | – | ||||||||||||||||||||||||||||
|
|
|
|
|
|
|
|
| ||||||||||||||||||||||||
Trustees Deferred Compensation Plan payable (see Note 4) | 7,870 | 2,210 | 389 | 809 | ||||||||||||||||||||||||||||
|
|
|
|
|
|
|
|
| ||||||||||||||||||||||||
Securities sold short, at value | – | – | 8,358,055 | – | ||||||||||||||||||||||||||||
|
|
|
|
|
|
|
|
| ||||||||||||||||||||||||
Due to Investment Manager | – | 1,516 | – | – | ||||||||||||||||||||||||||||
|
|
|
|
|
|
|
|
| ||||||||||||||||||||||||
Dividends payable on securities sold short | – | – | 7,281 | – | ||||||||||||||||||||||||||||
|
|
|
|
|
|
|
|
| ||||||||||||||||||||||||
Accrued expenses and other liabilities | 54,771 | 28,847 | 49,287 | 66,683 | ||||||||||||||||||||||||||||
|
|
|
|
|
|
|
|
| ||||||||||||||||||||||||
Total Liabilities | 45,068,577 | 41,157 | 8,978,042 | 67,492 | ||||||||||||||||||||||||||||
|
|
|
|
|
|
|
|
| ||||||||||||||||||||||||
Net Assets | $164,199,792 | $70,090,121 | $9,414,438 | $4,380,525 | ||||||||||||||||||||||||||||
|
|
|
|
|
|
|
|
| ||||||||||||||||||||||||
Net Assets Consist of: | ||||||||||||||||||||||||||||||||
Paid-in-capital | $167,935,156 | $64,032,505 | $9,999,395 | $3,614,123 | ||||||||||||||||||||||||||||
|
|
|
|
|
|
|
|
| ||||||||||||||||||||||||
Undistributed (dividends in excess of) net investment income | (1,621,512 | ) | 365,251 | (189,430 | ) | (26,153 | ) | |||||||||||||||||||||||||
|
|
|
|
|
|
|
|
| ||||||||||||||||||||||||
Accumulated net realized gain (loss) | (1,466,536 | ) | 717,342 | (1,226,345 | ) | 194,878 | ||||||||||||||||||||||||||
|
|
|
|
|
|
|
|
| ||||||||||||||||||||||||
Net unrealized appreciation (depreciation) | (647,316 | ) | 4,975,023 | 830,818 | 597,677 | |||||||||||||||||||||||||||
|
|
|
|
|
|
|
|
| ||||||||||||||||||||||||
Net Assets | $164,199,792 | $70,090,121 | $9,414,438 | $4,380,525 | ||||||||||||||||||||||||||||
|
|
|
|
|
|
|
|
| ||||||||||||||||||||||||
See accompanying Notes to Financial Statements | 39 | Semi-Annual Report/ March 31, 2017 |
Common Shares Issued and Outstanding | 11,151,129 | 4,266,946 | 666,667 | 250,412 | ||||||||||||||||||||||||||||
|
|
|
|
|
|
|
|
| ||||||||||||||||||||||||
Net Asset Value Per Share* | $14.72 | $16.43 | $14.12 | $17.49 | ||||||||||||||||||||||||||||
|
|
|
|
|
|
|
|
| ||||||||||||||||||||||||
Cost of Investments | $206,873,712 | $63,365,868 | $7,911,185 | $3,786,175 | ||||||||||||||||||||||||||||
|
|
|
|
|
|
|
|
| ||||||||||||||||||||||||
Cost of Repurchase Agreements | $1,258,000 | $1,208,000 | $7,156,000 | $– | ||||||||||||||||||||||||||||
|
|
|
|
|
|
|
|
| ||||||||||||||||||||||||
Cost of Foreign Currency | $– | $16,992 | $– | $22,148 | ||||||||||||||||||||||||||||
|
|
|
|
|
|
|
|
| ||||||||||||||||||||||||
Proceeds Received on Securities Sold Short | $– | $– | $8,109,267 | $– | ||||||||||||||||||||||||||||
|
|
|
|
|
|
|
|
| ||||||||||||||||||||||||
| * | Net asset value and redemption price per share may not recalculate exactly due to rounding. |
| See accompanying Notes to Financial Statements | 40 | Semi-Annual Report/ March 31, 2017 |
Six Months ended March 31, 2017 (unaudited)
| AllianzGI Advanced Core Bond | AllianzGI Best Styles Global Managed Volatility | AllianzGI Discovery U.S. | AllianzGI Global Small-Cap Opportunities | |||||||||||||||||||||||||||||||
Investment Income: | ||||||||||||||||||||||||||||||||||
Interest | $1,581,112 | $679 | $1,276 | $7 | ||||||||||||||||||||||||||||||
|
|
|
|
|
|
|
|
| ||||||||||||||||||||||||||
Dividends, net of foreign withholdingtaxes* | – | 820,814 | 65,682 | 26,934 | ||||||||||||||||||||||||||||||
|
|
|
|
|
|
|
|
| ||||||||||||||||||||||||||
Total Investment Income | 1,581,112 | 821,493 | 66,958 | 26,941 | ||||||||||||||||||||||||||||||
|
|
|
|
|
|
|
|
| ||||||||||||||||||||||||||
Expenses: | ||||||||||||||||||||||||||||||||||
Investment management | 239,655 | 132,340 | 47,963 | 22,034 | ||||||||||||||||||||||||||||||
|
|
|
|
|
|
|
|
| ||||||||||||||||||||||||||
Legal | 46,737 | 16,026 | 14,418 | 16,799 | ||||||||||||||||||||||||||||||
|
|
|
|
|
|
|
|
| ||||||||||||||||||||||||||
Custodian and accounting agent | 35,700 | 76,017 | 30,402 | 45,851 | ||||||||||||||||||||||||||||||
|
|
|
|
|
|
|
|
| ||||||||||||||||||||||||||
Audit and tax services | 21,641 | 18,169 | 18,080 | 20,195 | ||||||||||||||||||||||||||||||
|
|
|
|
|
|
|
|
| ||||||||||||||||||||||||||
Trustees | 8,385 | 3,510 | 498 | 259 | ||||||||||||||||||||||||||||||
|
|
|
|
|
|
|
|
| ||||||||||||||||||||||||||
Shareholder communications | 5,713 | 3,973 | 3,156 | 3,968 | ||||||||||||||||||||||||||||||
|
|
|
|
|
|
|
|
| ||||||||||||||||||||||||||
Insurance | 4,723 | 3,497 | 2,651 | 2,503 | ||||||||||||||||||||||||||||||
|
|
|
|
|
|
|
|
| ||||||||||||||||||||||||||
Offering | 4,583 | 40,319 | 5,495 | – | ||||||||||||||||||||||||||||||
|
|
|
|
|
|
|
|
| ||||||||||||||||||||||||||
Transfer agent | 2,634 | 2,378 | 1,920 | 1,944 | ||||||||||||||||||||||||||||||
|
|
|
|
|
|
|
|
| ||||||||||||||||||||||||||
Dividends on securities sold short | – | – | 79,954 | – | ||||||||||||||||||||||||||||||
|
|
|
|
|
|
|
|
| ||||||||||||||||||||||||||
Organizational | – | 120 | – | – | ||||||||||||||||||||||||||||||
|
|
|
|
|
|
|
|
| ||||||||||||||||||||||||||
Securities sold short | – | – | 55,667 | – | ||||||||||||||||||||||||||||||
|
|
|
|
|
|
|
|
| ||||||||||||||||||||||||||
Line of credit commitment | 650 | 267 | 39 | 45 | ||||||||||||||||||||||||||||||
|
|
|
|
|
|
|
|
| ||||||||||||||||||||||||||
Miscellaneous | 2,516 | 2,176 | 1,031 | 1,965 | ||||||||||||||||||||||||||||||
|
|
|
|
|
|
|
|
| ||||||||||||||||||||||||||
Total Expenses | 372,937 | 298,792 | 261,274 | 115,563 | ||||||||||||||||||||||||||||||
|
|
|
|
|
|
|
|
| ||||||||||||||||||||||||||
Less: Fee Waiver/Reimbursement from Investment Manager | (92,620) | (149,601) | (109,336) | (86,140) | ||||||||||||||||||||||||||||||
|
|
|
|
|
|
|
|
| ||||||||||||||||||||||||||
Net Expenses | 280,317 | 149,191 | 151,938 | 29,423 | ||||||||||||||||||||||||||||||
|
|
|
|
|
|
|
|
| ||||||||||||||||||||||||||
Net Investment Income (Loss) | 1,300,795 | 672,302 | (84,980) | (2,482) | ||||||||||||||||||||||||||||||
Realized and Change in Unrealized Gain (Loss): |
| |||||||||||||||||||||||||||||||||
Net realized gain (loss) on: | ||||||||||||||||||||||||||||||||||
Investments | (861,131) | 415,750 | 228,600 | 566,619 | ||||||||||||||||||||||||||||||
|
|
|
|
|
|
|
|
| ||||||||||||||||||||||||||
Securities sold short | – | – | (1,156,275) | – | ||||||||||||||||||||||||||||||
|
|
|
|
|
|
|
|
| ||||||||||||||||||||||||||
Futures contracts | 136,112 | 363,952 | – | – | ||||||||||||||||||||||||||||||
|
|
|
|
|
|
|
|
| ||||||||||||||||||||||||||
Foreign currency transactions | – | (12,463) | 3 | 38 | ||||||||||||||||||||||||||||||
|
|
|
|
|
|
|
|
| ||||||||||||||||||||||||||
Net change in unrealizedappreciation/depreciation of: | ||||||||||||||||||||||||||||||||||
|
|
|
|
|
|
|
|
| ||||||||||||||||||||||||||
Investments | (4,625,071) | 2,601,979 | 510,928 | 28,063 | ||||||||||||||||||||||||||||||
|
|
|
|
|
|
|
|
| ||||||||||||||||||||||||||
Securities sold short | – | – | 69,107 | – | ||||||||||||||||||||||||||||||
|
|
|
|
|
|
|
|
| ||||||||||||||||||||||||||
Futures contracts | (20,481) | (52,993) | – | – | ||||||||||||||||||||||||||||||
|
|
|
|
|
|
|
|
| ||||||||||||||||||||||||||
Foreign currency transactions | – | (613) | 3 | 874 | ||||||||||||||||||||||||||||||
|
|
|
|
|
|
|
|
| ||||||||||||||||||||||||||
Net realized and change in unrealized gain (loss) | (5,370,571 | 3,315,612 | (347,634) | 595,594 | ||||||||||||||||||||||||||||||
|
|
|
|
|
|
|
|
| ||||||||||||||||||||||||||
Net Increase (Decrease) in Net Assets Resulting from Investment Operations | $(4,069,776) | $3,987,914 | $(432,614) | $593,112 | ||||||||||||||||||||||||||||||
|
|
|
|
|
|
|
|
| ||||||||||||||||||||||||||
*Foreign withholding taxes | $– | $27,112 | $– | $2,269 | ||||||||||||||||||||||||||||||
|
|
|
|
|
|
|
|
| ||||||||||||||||||||||||||
See accompanying Notes to Financial Statements | 41 | Semi-Annual Report/ March 31, 2017 |
Statements of Changes in Net Assets
| AllianzGI Advanced Core Bond | AllianzGI Best Styles Global Managed Volatility | |||||||||||||||||||||||||
| Six Months ended March 31, 2017 (unaudited) | Period from 10/30/2015(1) through 9/30/2016 | Six Months ended March 31, 2017 | Period from 9/30/2016 | |||||||||||||||||||||||
Increase (Decrease) in Net Assets from: | ||||||||||||||||||||||||||
Investment Operations: | ||||||||||||||||||||||||||
Net investment income (loss) | $1,300,795 | $1,879,718 | $672,302 | $975,920 | ||||||||||||||||||||||
Net realized gain (loss) | (725,019) | 1,132,615 | 767,239 | 74,698 | ||||||||||||||||||||||
Net change in unrealized appreciation/depreciation | (4,645,552) | 3,998,236 | 2,548,373 | 2,451,997 | ||||||||||||||||||||||
Net increase (decrease) in net assets resulting from investment operations | (4,069,776) | 7,010,569 | 3,987,914 | 3,502,615 | ||||||||||||||||||||||
Dividends and Distributions to Shareholders from: | ||||||||||||||||||||||||||
Net investment income | (4,512,111) | (367,778) | (1,285,431) | – | ||||||||||||||||||||||
Net realized gains | (1,796,268) | – | (147,482) | – | ||||||||||||||||||||||
Total dividends and distributions to shareholders | (6,308,379) | (367,778) | (1,432,913) | – | ||||||||||||||||||||||
Fund Share Transactions: | ||||||||||||||||||||||||||
Net proceeds from the sale of shares | 31,387,640 | 181,178,096 | 10,754,112 | 75,229,813 | ||||||||||||||||||||||
Issued in reinvestment of dividends and distributions | 6,308,379 | 367,778 | 1,432,913 | – | ||||||||||||||||||||||
Cost of shares redeemed | (36,528,906) | (14,827,831) | (21,991,208) | (1,443,125) | ||||||||||||||||||||||
Net increase (decrease) from Fund share transactions | 1,167,113 | 166,718,043 | (9,804,183) | 73,786,688 | ||||||||||||||||||||||
Total increase (decrease) in net assets | (9,211,042) | 173,360,834 | (7,249,182) | 77,289,303 | ||||||||||||||||||||||
Net Assets: | ||||||||||||||||||||||||||
Beginning of period | 173,410,834 | 50,000 | 77,339,303 | 50,000 | ||||||||||||||||||||||
End of period* | $164,199,792 | $173,410,834 | $70,090,121 | $77,339,303 | ||||||||||||||||||||||
*Including undistributed (dividends in excess of) net investment income of: | $(1,621,512 | ) | $1,589,804 | $365,251 | $978,380 | |||||||||||||||||||||
Shares Activity: | ||||||||||||||||||||||||||
Issued | 2,035,857 | 11,957,770 | 692,627 | 4,984,429 | ||||||||||||||||||||||
Issued in Reinvestment of dividends and distributions | 429,983 | 24,700 | 92,545 | – | ||||||||||||||||||||||
Shares redeemed | (2,352,267) | (944,914) | (1,411,442) | (91,213) | ||||||||||||||||||||||
Net Increase (Decrease) | 113,573 | 11,037,556 | (626,270) | 4,893,216 | ||||||||||||||||||||||
| (1) | Commencement of operations. |
See accompanying Notes to Financial Statements | 42 | Semi-Annual Report/ March 31, 2017 |
Statements of Changes in Net Assets (continued)
| AllianzGI Discovery U.S. | AllianzGI Global Small-Cap Opportunities | |||||||||||||||||||||||||||
| Six Months ended March 31, 2017 (unaudited) | Period from 12/21/2015(1) through 9/30/2016 | Six Months ended March 31, 2017 | Year ended September 30, 2016 | |||||||||||||||||||||||||
|
$(84,980 |
) |
|
$(120,043 |
) |
|
$(2,482 |
) |
|
$50,785 |
| |||||||||||||||||
| (927,672 | ) | (283,685 | ) | 566,657 | (141,061 | ) | ||||||||||||||||||||||
| 580,038 | 250,780 | 28,937 | 521,287 | |||||||||||||||||||||||||
| (432,614 | ) | (152,948 | ) | 593,112 | 431,011 | |||||||||||||||||||||||
|
– |
|
|
– |
|
|
(70,039 |
) |
|
(29,791 |
) | |||||||||||||||||
| – | – | – | – | |||||||||||||||||||||||||
| – | – | (70,039 | ) | (29,791 | ) | |||||||||||||||||||||||
|
– |
|
|
– |
|
|
– |
|
|
– |
| |||||||||||||||||
| – | – | 70,039 | 29,791 | |||||||||||||||||||||||||
| – | – | (1,499,999 | ) | – | ||||||||||||||||||||||||
|
– |
|
|
– |
|
|
(1,429,960 |
) |
|
29,791 |
| |||||||||||||||||
| (432,614 | ) | (152,948 | ) | (906,887 | ) | 431,011 | ||||||||||||||||||||||
|
9,847,052 |
|
|
10,000,000 |
|
|
5,287,412 |
|
|
4,856,401 |
| |||||||||||||||||
| $9,414,438 | $9,847,052 | $4,380,525 | $5,287,412 | |||||||||||||||||||||||||
|
$(189,430 |
) |
|
$(104,450 |
) |
|
$(26,153 |
) |
|
$46,368 |
| |||||||||||||||||
|
– |
|
|
666,667 |
|
|
– |
|
|
– |
| |||||||||||||||||
|
– |
|
|
– |
|
|
4,255 |
|
|
2,035 |
| |||||||||||||||||
| – | – | (90,199 | ) | – | ||||||||||||||||||||||||
| – | 666,667 | (85,944 | ) | 2,035 | ||||||||||||||||||||||||
See accompanying Notes to Financial Statements | 43 | Semi-Annual Report/ March 31, 2017 |
For a share of common stock outstanding throughout each period:
| AllianzGI Best Styles Global | ||||||||||||
| AllianzGI Advanced Core Bond | Managed Volatility | AllianzGI Discovery U.S. | ||||||||||
| ||||||||||||
| Six Months ended March 31, 2017 (unaudited) | Period from 10/30/2015* through 9/30/2016 | Six Months ended March 31, 2017 (unaudited) | Period from 4/11/2016* through 9/30/2016 | Six Months ended March 31, 2017 (unaudited) | Period from 12/21/2015* through 9/30/2016 | |||||||
| ||||||||||||
Net asset value, beginning of period | $15.71 | $15.00 | $15.81 | $15.00 | $14.77 | $15.00 | ||||||
Investment Operations: | ||||||||||||
Net investment income (loss)(a) | 0.12 | 0.21 | 0.16 | 0.22 | (0.13) | (0.18) | ||||||
Net realized and change in unrealized gain (loss) | (0.53) | 0.57 | 0.80 | 0.59 | (0.52) | (0.05) | ||||||
Total from investment operations | (0.41) | 0.78 | 0.96 | 0.81 | (0.65) | (0.23) | ||||||
Dividends and Distributions to Shareholders from: | ||||||||||||
Net investment income | (0.41) | (0.07) | (0.30) | — | — | — | ||||||
Net realized gains | (0.17) | — | (0.04) | — | — | — | ||||||
Total dividends and distributions to shareholders | (0.58) | — | (0.34) | — | — | — | ||||||
Net asset value, end of period | $14.72 | $15.71 | $16.43 | $15.81 | $14.12 | $14.77 | ||||||
Total Return(b) | (2.54)% | 5.23% | 6.22% | 5.40% | (4.40)% | (1.53)% | ||||||
RATIOS/SUPPLEMENTAL DATA: | ||||||||||||
Net assets, end of period (000s) | $164,200 | $173,411 | $70,090 | $77,339 | $9,414 | $9,847 | ||||||
Ratio of expenses to average net assets with fee reimbursement(c)(d) | 0.35% | 0.41% | 0.45% | 0.45% | 3.17%(e) | 3.22%(f) | ||||||
Ratio of expenses to average net assets without fee reimbursement(c)(d) | 0.46% | 0.62% | 0.84% | 0.99% | 5.39%(e) | 6.59%(f) | ||||||
Ratio of net investment income (loss) to average net assets(c)(d) | 1.63% | 1.52% | 2.03% | 2.96% | (1.77)% | (1.55)% | ||||||
Portfolio turnover rate | 155% | 260% | 32% | 1% | 126% | 214% | ||||||
| * | Commencement of operations. |
| (a) | Calculated on average shares outstanding during the period. |
| (b) | Total return is calculated assuming a purchase of a share on the first day of the period and a sale of a share on the last day of each period reported. |
Dividends and distributions, if any, are assumed, for purposes of this calculation, to be reinvested. Total return does not reflect sales charges and includes the effect of expense reimbursements. Total return may reflect adjustments to conform to U.S. GAAP. Total return for a period of less than one year is not annualized.
| (c) | Annualized, unless otherwise noted. |
| (d) | Certain expenses incurred were not annualized. |
| (e) | Inclusive of expenses for dividends on securities sold short of 1.67% . |
| (f) | Inclusive of expenses for dividends on securities sold short of 1.70% . |
| I | ||||
See accompanying Notes to Financial Statements | 44 | Semi-Annual Report/ March 31, 2017 |
Financial Highlights (continued)
For a share of common stock outstanding throughout each period:
| AllianzGI Global Small-Cap Opportunities | ||||||||
| Six Months ended March 31, 2017 (unaudited) | Year ended September 30, 2016 | Period from 12/1/2014 through 9/30/2015# | Period from 7/23/2014* through 11/30/2014 | |||||
Net asset value, beginning of period | $15.72 | $14.53 | $14.70 | $15.00 | ||||
Investment Operations: | ||||||||
Net investment income (loss)(a) | (0.01) | 0.15 | 0.12 | 0.05 | ||||
Net realized and change in unrealized gain (loss) | 1.99 | 1.13 | (0.25) | (0.35) | ||||
Total from investment operations | 1.98 | 1.28 | (0.13) | (0.30) | ||||
Dividends and Distributions to Shareholders from: | ||||||||
Net investment income | (0.21) | (0.09) | (0.04) | — | ||||
Net asset value, end of period | $17.49 | $15.72 | $14.53 | $14.70 | ||||
Total Return(b) | 12.67% | 8.85% | (0.86)% | (2.00)% | ||||
RATIOS/SUPPLEMENTAL DATA: | ||||||||
Net assets, end of period (000s) | $4,381 | $5,287 | $4,856 | $4,899 | ||||
Ratio of expenses to average net assets with fee reimbursement | 1.20%(c) | 1.20% | 1.22%(c)(d) | 1.20%(c)(d) | ||||
Ratio of expenses to average net assets without fee reimbursement | 4.72%(c) | 5.48% | 7.06%(c)(d) | 4.88%(c)(d) | ||||
Ratio of net investment income (loss) to average net assets | (0.10)%(c) | 1.04% | 0.91%(c)(d) | 0.88%(c)(d) | ||||
Portfolio turnover rate | 76% | 177% | 152% | 56% | ||||
| # | Fiscal year end changed from November 30th to September 30th. |
| * | Commencement of operations. |
| (a) | Calculated on average shares outstanding during the period. |
| (b) | Total return is calculated assuming a purchase of a share on the first day of the period and a sale of a share on the last day of each period reported. |
Dividends and distributions, if any, are assumed, for purposes of this calculation, to be reinvested. Total return does not reflect sales charges and includes the effect of expense reimbursements. Total return may reflect adjustments to conform to U.S. GAAP. Total return for a period of less than one year is not annualized.
| (c) | Annualized, unless otherwise noted. |
| (d) | Certain expenses incurred were not annualized. |
See accompanying Notes to Financial Statements | 45 | Semi-Annual Report/ March 31, 2017 |
AllianzGI Institutional Multi-Series Trust
Notes to Financial Statements
March 31, 2017 (unaudited)
1. ORGANIZATION AND SIGNIFICANT ACCOUNTING POLICIES
AllianzGI Institutional Multi-Series Trust (the “Trust”) was organized on June 3, 2014 and is registered under the Investment Company Act of 1940, as amended (the “1940-Act”), as an open-end registered investment company. The Trust follows the investment company accounting and reporting guidance of the Financial Accounting Standards Board (“FASB”) Accounting Standard Codification Topic 946 Financial Services-Investment Companies. As of March 31, 2017, the Trust consisted of four separate investment series, (each a “Portfolio” and together the “Portfolios”). Allianz Global Investors U.S. LLC (“AllianzGI U.S.” or the “Investment Manager”) serves as the Portfolios’ investment manager. AllianzGI U.S. is an indirect, wholly-owned subsidiary of Allianz Asset Management of America L.P. (“AAM”). AAM is an indirect, wholly-owned subsidiary of Allianz SE, a publicly traded European insurance and financial services company. Prior to October 1, 2016, Allianz Global Investors Fund Management LLC (“AGIFM”) and AllianzGI U.S. served as the Portfolios’ investment manager and sub-adviser, respectively. On October 1, 2016, AGIFM merged with and into AllianzGI U.S. (the “Merger”). Following the Merger, AllianzGI U.S. assumed the services and responsibilities previously provided by AGIFM as investment adviser and all Portfolios for which AllianzGI U.S. served as sub-adviser on September 30, 2016, no longer have a sub-adviser. Shares of the Portfolios have not been registered for public sale and are currently offered and sold on a private placement basis in accordance with Rule 506(c) of Regulation D under the Securities Act of 1933, as amended. Currently, the Trust has authorized one class of shares.
The following Portfolios sold and issued shares of beneficial interest to Allianz Fund Investments, Inc. (“AFI”), an indirect wholly-owned subsidiary of Allianz SE, during the year ended September 30, 2016:
| AllianzGI Advanced Core Bond Portfolio | ||||||||||
Date | Shares | Amount | ||||||||
| ||||||||||
10/30/15 | 3,333 | $50,000 | ||||||||
| ||||||||||
AllianzGI Best Styles Global Managed Volatility Portfolio | ||||||||||
Date | Shares | Amount | ||||||||
| ||||||||||
4/11/16 | 3,333 | $50,000 | ||||||||
| ||||||||||
AllianzGI Discovery U.S. Portfolio | ||||||||||
Date | Shares | Amount | ||||||||
| ||||||||||
12/21/15 | 666,667 | $10,000,000 | ||||||||
| ||||||||||
The investment objective of AllianzGI Advanced Core Bond is to seek long-term risk adjusted total net return. The investment objective of AllianzGI Best Styles Global Managed Volatility, AllianzGI Discovery U.S. and AllianzGI Global Small-Cap Opportunities is to seek long-term capital appreciation. There can be no assurance that the Portfolios will meet their stated objective.
The preparation of the Portfolios’ financial statements in accordance with accounting principles generally accepted in the United States of America (“U.S. GAAP”) requires the Portfolios’ management to make estimates and assumptions that affect the reported amounts and disclosures in each Portfolio’s financial statements. Actual results could differ from those estimates.
In the normal course of business, the Portfolios enter into contracts that contain a variety of representations that provide general indemnifications. The Portfolios’ maximum exposure under these arrangements is unknown as this would involve future claims that may be made against the Portfolios that have not yet occurred.
In October 2016, the SEC adopted new rules and forms, and amendments to certain current rules and forms, to modernize reporting and disclosure of information by registered investment companies. The amendments to Regulation S-X will require standardized, enhanced disclosure about derivatives in investment company financial statements, and will also change the rules governing the form and content of such financial statements. The amendments to Regulation S-X take effect on August 1, 2017. At this time, management is assessing the anticipated impact of these regulatory developments.
| 46 | Semi-Annual Report/ March 31, 2017 |
AllianzGI Institutional Multi-Series Trust
Notes to Financial Statements
March 31, 2017 (unaudited) (continued)
The following is a summary of significant accounting policies consistently followed by the Portfolios:
(a) Valuation of Investments. Portfolio securities and other financial instruments for which market quotations are readily available are stated at market value. Market value is generally determined on the basis of official closing prices, last reported sales prices, or if no sales or closing prices are reported, on the basis of quotes obtained from a quotation reporting system, established market makers, or independent pricing services. The Portfolios’ investments are valued daily using prices supplied by an independent pricing service or broker/dealer quotations, or by using the last sale or settlement price on the exchange that is the primary market for such securities, or the mean between the last bid and ask quotations. The market value for NASDAQ Global Market and NASDAQ Capital Market securities may also be calculated using the NASDAQ Official Closing Price instead of the last reported sales price. Independent pricing services use information provided by market makers or estimates of market values obtained from yield data relating to investments or securities with similar characteristics. Exchange traded futures are valued at the price determined by the relevant exchange. Securities purchased on a when-issued or delayed-delivery basis are marked to market daily until settlement at the forward settlement date.
The Board of Trustees of each Portfolio (together, the “Board”) has adopted procedures for valuing portfolio securities and other financial instruments in circumstances where market quotations are not readily available (including in cases where available market quotations are deemed to be unreliable), and has delegated primary responsibility for applying the valuation methods to the Investment Manager. The Trust’s Valuation Committee was established by the Board to oversee the implementation of the Portfolios’ valuation methods and to make fair value determinations on behalf of the Board, as necessary. The Investment Manager monitors the continued appropriateness of methods applied and identifies circumstances and events that may require fair valuation. The Investment Manager determines if adjustments should be made in light of market changes, events affecting the issuer, or other factors. If the Investment Manager determines that a valuation method may no longer be appropriate, another valuation method previously approved by the Trust’s Valuation Committee may be selected or the Trust’s Valuation Committee will be convened to consider the matter and take any appropriate action in accordance with procedures adopted by the Board. The Board shall review and ratify the appropriateness of the valuation methods and these methods may be amended or supplemented from time to time by the Trust’s Valuation Committee.
Short-term debt instruments maturing in 60 days or less are valued at amortized cost, if their original term to maturity was 60 days or less, or by amortizing premiums or discounts based on their value on the 61st day prior to maturity, if the original term to maturity exceeded 60 days.
Investments initially valued in currencies other than the U.S. dollar are converted to the U.S. dollar using exchange rates obtained from pricing services. As a result, the net asset value (“NAV”) of each Portfolio may be affected by changes in the value of currencies in relation to the U.S. dollar. The value of securities traded in markets outside the United States or denominated in currencies other than the U.S. dollar may be affected significantly on a day that the New York Stock Exchange (“NYSE”) is closed.
The prices used by the Portfolios to value investments may differ from the value that would be realized if the investments were sold, and these differences could be material to the Portfolios’ financial statements. The NAV of each Portfolio is normally determined as of the close of regular trading (normally, 4:00 p.m. Eastern Time) on the NYSE on each day the NYSE is open for business.
The prices of certain portfolio securities or financial instruments may be determined at a time prior to the close of regular trading on the NYSE. When fair-valuing the securities, the Portfolios may, among other things, consider significant events (which may be considered to include changes in the value of U.S. securities or securities indices) that occur after the close of the relevant market and before the time the NAV of a Portfolio is calculated. With respect to certain foreign securities, the Portfolios may fair-value securities using modeling tools provided by third-party vendors. The Portfolios have retained a statistical research service to assist in determining the fair value of foreign securities. This service utilizes statistics and programs based on historical performance of markets and other economic data to assist in making fair value estimates. Fair value estimates used by the Portfolios for foreign securities may differ from the value realized from the sale of those securities and the difference could be material to the financial statements. Fair value pricing may require subjective determinations about the value of a security or other assets, and fair values used to determine the NAV of a Portfolio may differ from quoted or published prices, or from prices that are used by others, for the same investments. In addition, the use of fair value pricing may not always result in adjustments to the prices of securities or other assets held by a Portfolio.
| 47 | Semi-Annual Report/ March 31, 2017 |
AllianzGI Institutional Multi-Series Trust
Notes to Financial Statements
March 31, 2017 (unaudited) (continued)
(b) Fair Value Measurements. Fair value is defined as the price that would be received to sell an asset or paid to transfer a liability (i.e., the “exit price”) in an orderly transaction between market participants. The three levels of the fair value hierarchy are described below:
| • | Level 1 – quoted prices in active markets for identical investments that the Portfolios have the ability to access |
| • | Level 2 – valuations based on other significant observable inputs, which may include, but are not limited to, quoted prices for similar assets or liabilities, interest rates, yield curves, volatilities, prepayment speeds, loss severities, credit risks and default rates or other market corroborated inputs |
| • | Level 3 – valuations based on significant unobservable inputs (including the Investment Manager’s or Trust’s Valuation Committee’s own assumptions and securities whose price was determined by using a single broker’s quote) |
The valuation techniques used by the Portfolios to measure fair value during the six months ended March 31, 2017 were intended to maximize the use of observable inputs and to minimize the use of unobservable inputs.
The Portfolios’ policy is to recognize transfers between levels at the end of the reporting period. An investment asset’s or liability’s level within the fair value hierarchy is based on the lowest level input, individually or in aggregate, that is significant to the fair value measurement. The objective of fair value measurement remains the same even when there is a significant decrease in the volume and level of activity for an asset or liability and regardless of the valuation techniques used. Investments categorized as Level 1 or 2 as of period end may have been transferred between Levels 1 and 2 since the prior period due to changes in the valuation method utilized in valuing the investments.
The inputs or methodology used for valuing securities are not necessarily an indication of the risk associated with investing in those securities. The following are certain inputs and techniques that the Portfolios generally use to evaluate how to classify each major category of assets and liabilities within Level 2 and Level 3, in accordance with U.S. GAAP.
Equity Securities (Common and Preferred Stock) — Equity securities traded in inactive markets and certain foreign equity securities are valued using inputs which include broker-dealer quotes, recently executed transactions adjusted for changes in the benchmark index, or evaluated price quotes received from independent pricing services that take into account the integrity of the market sector and issuer, the individual characteristics of the security, and information received from broker-dealers and other market sources pertaining to the issuer or security. To the extent that these inputs are observable, the values of equity securities are categorized as Level 2. To the extent that these inputs are unobservable, the values are categorized as Level 3.
U.S. Treasury Obligations — U.S. Treasury obligations are valued by independent pricing services based on pricing models that evaluate the mean between the most recently quoted bid and ask price. The models also take into consideration data received from active market makers and broker-dealers, yield curves, and the spread over comparable U.S. Treasury issues. The spreads change daily in response to market conditions and are generally obtained from the new issue market and broker-dealer sources. To the extent that these inputs are observable, the values of U.S. Treasury obligations are categorized as Level 2. To the extent that these inputs are unobservable, the values are categorized as Level 3.
Government Sponsored Enterprise and Mortgage-Backed Securities — Government sponsored enterprise and mortgage-backed securities are valued by independent pricing services using pricing models based on inputs that include issuer type, coupon, cash flows, mortgage prepayment projection tables and Adjustable Rate Mortgage evaluations that incorporate index data, periodic life caps and the next coupon reset date. To the extent that these inputs are observable, the values of government sponsored enterprise and mortgage-backed securities are categorized as Level 2. To the extent that these inputs are unobservable, the values are categorized as Level 3.
Sovereign Debt Obligations — Sovereign debt obligations are valued by independent pricing services based on discounted cash flow models that incorporate option adjusted spreads along with benchmark curves and credit spreads. In addition, international bond markets are monitored regularly for information pertaining to the issuer and/or the specific issue. To the extent that these inputs are observable, the values of sovereign debt obligations are categorized as Level 2. To the extent that these inputs are unobservable, the values are categorized as Level 3.
| 48 | Semi-Annual Report/ March 31, 2017 |
AllianzGI Institutional Multi-Series Trust
Notes to Financial Statements
March 31, 2017 (unaudited) (continued)
Corporate Bonds & Notes — Corporate bonds & notes are generally comprised of two main categories: investment grade bonds and high yield bonds. Investment grade bonds are valued by independent pricing services using various inputs and techniques, which include broker-dealer quotations, live trading levels, recently executed transactions in securities of the issuer or comparable issuers, and option adjusted spread models that include base curve and spread curve inputs. Adjustments to individual bonds can be applied to recognize trading differences compared to other bonds issued by the same issuer. High yield bonds are valued by independent pricing services based primarily on broker-dealer quotations from relevant market makers and recently executed transactions in securities of the issuer or comparable issuers. The broker-dealer quotations received are supported by credit analysis of the issuer that takes into consideration credit quality assessments, daily trading activity, and the activity of the underlying equities, listed bonds and sector-specific trends. To the extent that these inputs are observable, the values of corporate bonds & notes are categorized as Level 2. To the extent that these inputs are unobservable, the values are categorized as Level 3.
A summary of the inputs used at March 31, 2017 in valuing each Portfolio’s assets and liabilities is listed below (refer to the Schedules of Investments and Note 6(a) for more detailed information on Investments in Securities and Other Financial Instruments.):
| AllianzGI Advanced Core Bond: | ||||||||||||||||
| Level 1 - Quoted Prices | Level 2 - Inputs | Level 3 - Significant Unobservable Inputs | Value at 3/31/17 | |||||||||||||
Investments in Securities - Assets | ||||||||||||||||
U.S. Treasury Obligations | $ | — | $ | 82,937,676 | $ | — | $ | 82,937,676 | ||||||||
Corporate Bonds & Notes | — | 57,388,593 | — | 57,388,593 | ||||||||||||
U.S. Government Agency Securities | — | 45,383,413 | — | 45,383,413 | ||||||||||||
Sovereign Debt Obligations | — | 20,532,801 | — | 20,532,801 | ||||||||||||
Repurchase Agreements | — | 1,258,000 | — | 1,258,000 | ||||||||||||
| — | 207,500,483 | — | 207,500,483 | |||||||||||||
Other Financial Instruments* – Liabilities | ||||||||||||||||
Interest Rate Contracts | (16,087) | — | — | (16,087) | ||||||||||||
Totals | $ | (16,087) | $ 207,500,483 | $ | — | $ | 207,484,396 | |||||||||
| AllianzGI Best Styles Global Managed Volatility: | ||||||||||||||||
Level 1 - Quoted Prices | Level 2 - Inputs | Level 3 - Significant Unobservable Inputs | Value at 3/31/17 | |||||||||||||
Investments in Securities - Assets | ||||||||||||||||
Common Stock: | ||||||||||||||||
Australia | $ | — | $ | 1,026,335 | $ | — | $ | 1,026,335 | ||||||||
Austria | 73,853 | 60,606 | — | 134,459 | ||||||||||||
Belgium | — | 238,759 | — | 238,759 | ||||||||||||
China | — | 953,915 | — | 953,915 | ||||||||||||
Denmark | 18,384 | 58,396 | — | 76,780 | ||||||||||||
Finland | — | 201,262 | — | 201,262 | ||||||||||||
France | 181,910 | 1,543,265 | — | 1,725,175 | ||||||||||||
Germany | — | 250,513 | — | 250,513 | ||||||||||||
Hong Kong | — | 1,407,032 | — | 1,407,032 | ||||||||||||
Hungary | — | 306,860 | — | 306,860 | ||||||||||||
Indonesia | — | 427,443 | — | 427,443 | ||||||||||||
Israel | — | 607,275 | — | 607,275 | ||||||||||||
Japan | — | 8,025,894 | — | 8,025,894 | ||||||||||||
Korea (Republic of) | 344,496 | 884,049 | — | 1,228,545 | ||||||||||||
Luxembourg | — | 151,908 | — | 151,908 | ||||||||||||
Malaysia | — | 337,394 | — | 337,394 | ||||||||||||
Morocco | 29,177 | 43,771 | — | 72,948 | ||||||||||||
Netherlands | 22,539 | 184,308 | — | 206,847 | ||||||||||||
New Zealand | 131,678 | 237,704 | — | 369,382 | ||||||||||||
Norway | 4,546 | 263,271 | — | 267,817 | ||||||||||||
Philippines | 35,270 | 28,711 | — | 63,981 | ||||||||||||
Poland | 54,770 | 164,246 | — | 219,016 | ||||||||||||
Portugal | — | 110,825 | — | 110,825 | ||||||||||||
Singapore | 19,704 | 1,029,618 | — | 1,049,322 | ||||||||||||
South Africa | — | 111,795 | — | 111,795 | ||||||||||||
Spain | 24,399 | 113,718 | — | 138,117 | ||||||||||||
Switzerland | 418,234 | 1,341,668 | — | 1,759,902 | ||||||||||||
Taiwan | — | 3,301,362 | — | 3,301,362 | ||||||||||||
Thailand | — | 360,770 | 166,135 | 526,905 | ||||||||||||
United Kingdom | 149,042 | 1,001,563 | — | 1,150,605 | ||||||||||||
| 49 | Semi-Annual Report/ March 31, 2017 |
AllianzGI Institutional Multi-Series Trust
Notes to Financial Statements
March 31, 2017 (unaudited) (continued)
All Other | 41,899,310 | — | — | 41,899,310 | ||||||||||||
Preferred Stock | 11,177 | — | — | 11,177 | ||||||||||||
Repurchase Agreements | — | 1,208,000 | — | 1,208,000 | ||||||||||||
| 43,418,489 | 25,982,236 | 166,135 | 69,566,860 | |||||||||||||
Other Financial Instruments* – Assets | ||||||||||||||||
Market Price | 9,834 | — | — | 9,834 | ||||||||||||
Other Financial Instruments* – Liabilities | ||||||||||||||||
Market Price | (3,811) | — | — | (3,811) | ||||||||||||
Totals | $ | 43,424,512 | $ | 25,982,236 | $ | 166,135 | $ | 69,572,883 | ||||||||
AllianzGI Discovery U.S.: | ||||||||||||||||
| Level 1 - Quoted Prices | Level 2 - Inputs | Level 3 - Significant Unobservable Inputs | Value at 3/31/17 | |||||||||||||
Investments in Securities - Assets | ||||||||||||||||
Common Stock | $ | 8,990,791 | $ | — | $ | — | $ | 8,990,791 | ||||||||
Repurchase Agreements | — | 7,156,000 | — | 7,156,000 | ||||||||||||
| 8,990,791 | 7,156,000 | — | 16,146,791 | |||||||||||||
Investments in Securities - Liabilities | ||||||||||||||||
Securities Sold Short, at value | (8,358,055) | — | — | (8,358,055) | ||||||||||||
Totals | $ | 632,736 | $ | 7,156,000 | $ | — | $ | 7,788,736 | ||||||||
AllianzGI Global Small-Cap Opportunities: | ||||||||||||||||
Level 1 - Quoted Prices | Level 2 - Other Significant Inputs | Level 3 - Significant Unobservable Inputs | Value at 3/31/17 | |||||||||||||
Investments in Securities - Assets | ||||||||||||||||
Common Stock: | ||||||||||||||||
China | $ | 47,878 | $ | 220,681 | $ | — | $ | 268,559 | ||||||||
Germany | — | 8,562 | — | 8,562 | ||||||||||||
Greece | — | 89,809 | — | 89,809 | ||||||||||||
Indonesia | — | 27,288 | — | 27,288 | ||||||||||||
Japan | 17,165 | 485,175 | — | 502,340 | ||||||||||||
Korea (Republic of) | 42,697 | 95,462 | — | 138,159 | ||||||||||||
Poland | — | 134,315 | — | 134,315 | ||||||||||||
Russian Federation | 10,501 | 129,573 | — | 140,074 | ||||||||||||
Singapore | 133,730 | 78,716 | — | 212,446 | ||||||||||||
Taiwan | — | 169,913 | — | 169,913 | ||||||||||||
Thailand | 35,389 | 40,630 | — | 76,019 | ||||||||||||
Turkey | — | 89,687 | — | 89,687 | ||||||||||||
All Other | 2,526,358 | — | — | 2,526,358 | ||||||||||||
Totals | $ | 2,813,718 | $ | 1,569,811 | $ | — | $ | 4,383,529 | ||||||||
At March 31, 2017, the following Portfolios had transfers between Levels 1 and 2:
| Transfers | ||||||
| Level 1 to Level 2 | Level 2 to Level 1 | |||||
AllianzGI Best Styles Global Managed Volatility |
$285,900(a) |
$760,237(b) | ||||
AllianzGI Global Small-Cap Opportunities | — | 149,268(b) | ||||
(a) This transfer was a result of securities trading outside the U.S. whose values were not adjusted by the application of a modeling tool at September 30, 2016, which was applied on March 31, 2017.
(b) This transfer was a result of securities trading outside the U.S. whose values were adjusted by the application of a modeling tool at September 30, 2016, which was not applied on March 31, 2017.
| 50 | Semi-Annual Report/ March 31, 2017 |
AllianzGI Institutional Multi-Series Trust
Notes to Financial Statements
March 31, 2017 (unaudited) (continued)
A roll forward of fair value measurements using significant unobservable inputs (Level 3) for the six months ended March 31, 2017, was as follows:
AllianzGI Best Styles Global Managed Volatility:
Beginning Balance 9/30/16 | Purchases | Sales | Accrued Discount (Premiums) | Net Realized Gain (Loss) | Net Change in Unrealized | Transfers into Level 3 | Transfers out of | Ending Balance 3/31/17 | ||||||||||||||||||||||||||||||||
| ||||||||||||||||||||||||||||||||||||||||
Investments in Securities - Assets |
| |||||||||||||||||||||||||||||||||||||||
Common Stock: | ||||||||||||||||||||||||||||||||||||||||
Thailand | $ | 679,583 | $ | 167,989 | $ | (678,206 | ) | $ | — | $ | (9,075 | ) | $ | 5,844 | $ | — | $ | — | $ | 166,135 | ||||||||||||||||||||
| ||||||||||||||||||||||||||||||||||||||||
The following tables present additional information about valuation techniques and inputs used for investments that are measured at fair value and categorized within Level 3 at March 31, 2017:
AllianzGI Best Styles Global Managed Volatility:
Ending Balance at 3/31/17 | Valuation Technique Used | Unobservable Inputs | Input Values | |||||||||||||
| ||||||||||||||||
Investments in Securities - Assets | ||||||||||||||||
Common Stock | $ | 166,135 | Value of Foreign Security Traded on Foreign Exchange | Price of Non-Resident Shares on Foreign Exchange | THB 27.75 | |||||||||||
THB- Thai Baht
*Other financial instruments are derivatives, such as futures contracts, which are valued at the unrealized appreciation (depreciation) of the instrument.
The net change in unrealized appreciation/depreciation of Level 3 investments which AllianzGI Best Styles Global Managed Volatility held at March 31, 2017, was $(1,855).
(c) Investment Transactions and Investment Income. Investment transactions are accounted for on the trade date. Securities purchased and sold on a when-issued or delayed-delivery basis may be settled a month or more after the trade date. Realized gains and losses on investments are determined on an identified cost basis. Interest income adjusted for the accretion of discounts and amortization of premiums is recorded on an accrual basis. Discounts or premiums on debt securities purchased are accreted or amortized, respectively, to interest income. Dividend income is recorded on the ex-dividend date, except for certain dividends from foreign securities where the ex-dividend date may have passed, and then are recorded as soon after the ex-dividend date as the Portfolios, using reasonable diligence, become aware of such dividends. Dividend and interest income on the Statements of Operations are shown net of any foreign taxes withheld on income from foreign securities. Payments received from real estate investment trust securities may be comprised of dividends, realized gains and return of capital. The payment may initially be recorded as dividend income and may subsequently be reclassified as realized gains and/or return of capital upon receipt of information from the issuer. Payments considered return of capital reduce the cost basis of the respective security. Distributions, if any, in excess of the cost basis of a security are recognized as capital gains.
(d) Federal Income Taxes. The Portfolios intend to distribute all of their taxable income and to comply with the other requirements of Subchapter M of the U.S. Internal Revenue Code of 1986, as amended, applicable to regulated investment companies. Accordingly, no provision for U.S. federal income taxes is required. The Portfolios may be subject to excise tax based on distributions to shareholders.
Accounting for uncertainty in income taxes establishes for all entities, including pass-through entities such as the Portfolios, a minimum threshold for financial statement recognition of the benefit of positions taken in filing tax returns (including whether an entity is taxable in a particular jurisdiction), and requires certain expanded tax disclosures. In accordance with provisions set forth under U.S. GAAP, the Investment Manager has reviewed the Portfolios’ tax positions for all open tax years. As of March 31, 2017, the Portfolios have recorded no liability for net unrecognized tax benefits relating to uncertain income tax positions they have taken. The Portfolios’ federal income tax returns since inception remain subject to examination by the Internal Revenue Service.
| 51 | Semi-Annual Report/ March 31, 2017 |
AllianzGI Institutional Multi-Series Trust
Notes to Financial Statements
March 31, 2017 (unaudited) (continued)
(e) Dividends and Distributions to Shareholders. The Portfolios (except AllianzGI Advanced Core Bond) declare dividends and distributions from net investment income and net realized capital gains, if any, annually. AllianzGI Advanced Core Bond declares dividends from net investment income quarterly and distributions from net realized capital gains, if any, annually. The Portfolios record dividends and distributions to their respective shareholders on the ex-dividend date. The amount of dividends from net investment income and distributions from net realized capital gains is determined in accordance with federal income tax regulations, which may differ from U.S. GAAP. These “book-tax” differences are considered either temporary or permanent in nature. To the extent these differences are permanent in nature, such amounts are reclassified within the capital accounts based on their federal income tax treatment; temporary differences do not require reclassification. To the extent dividends and/or distributions exceed current and accumulated earnings and profits for federal income tax purposes, they are reported as dividends and/or distributions to shareholders from return of capital.
(f) Foreign Currency Translation. The Portfolios’ accounting records are maintained in U.S. dollars as follows: (1) the foreign currency market values of investments and other assets and liabilities denominated in foreign currencies are translated at the prevailing exchange rate at the end of the period; and (2) purchases and sales, income and expenses are translated at the prevailing exchange rate on the respective dates of such transactions. The resulting net foreign currency gain (loss) is included in the Portfolios’ Statements of Operations.
The Portfolios do not generally isolate that portion of the results of operations arising as a result of changes in foreign currency exchange rates from the fluctuations arising from changes in the market prices of securities. Accordingly, such foreign currency gain (loss) is included in net realized and unrealized gain (loss) on investments. However, the Portfolios do isolate the effect of fluctuations in foreign currency exchange rates when determining the gain (loss) upon the sale or maturity of foreign currency denominated debt obligations pursuant to U.S. federal income tax regulations; such amount is categorized as foreign currency gain (loss) for both financial reporting and income tax reporting purposes.
(g) Repurchase Agreements. The Portfolios are parties to Master Repurchase Agreements (“Master Repo Agreements”) with select counterparties. The Master Repo Agreements maintain provisions for initiation, income payments, events of default, and maintenance of collateral.
The Portfolios enter into transactions, under the Master Repo Agreements, with their custodian bank or securities brokerage firms whereby they purchase securities under agreements to resell such securities at an agreed upon price and date (“repurchase agreements”). The Portfolios, through their custodian, take possession of securities collateralizing the repurchase agreement. Such agreements are carried at the contract amount in the financial statements, which is considered to represent fair value. Collateral pledged (the securities received), which consists primarily of U.S. government obligations and asset-backed securities, is held by the custodian bank for the benefit of the Portfolios until maturity of the repurchase agreement. Provisions of the repurchase agreements and the procedures adopted by the Portfolios require that the market value of the collateral, including accrued interest thereon, be sufficient in the event of default by the counterparty. If the counterparty defaults under the Master Repo Agreements and the value of the collateral declines or if the counterparty enters an insolvency proceeding, realization of the collateral by the Portfolios may be delayed or limited. The gross values are included in the Portfolios’ Schedules of Investments. The value of the related collateral exceeded the value of the repurchase agreements at March 31, 2017.
(h) Securities Sold Short. Certain Portfolios engage in short sales for investment and risk management purposes. Short sales are transactions in which a Portfolio sells a security or other instrument (such as an option, forward, future or other derivative contract) it does not own. When a Portfolio engages in a short sale, it must borrow the security sold short and deliver it to the counterparty. The Portfolios will ordinarily have to pay a fee or premium to borrow a security and be obligated to repay the lender of the security any dividend or interest that accrues on the security during the period of the loan. Until a short position is closed out, the net proceeds of the short sale will be retained by the lending broker to the extent necessary to meet margin requirements, together with any additional assets the broker requires as collateral. A Portfolio is also required to designate, on its books or the books of its custodian, liquid assets (less any additional collateral held by the broker) to cover the short sale obligation, marked to market daily. Short sales expose the Portfolios to the risk that they will be required to cover the short position at a time when the security or other asset has appreciated in value, thus resulting in losses to the applicable Portfolio. A short sale is “against the box” if a Portfolio holds in its portfolio or has the right to acquire the security sold short at no additional cost. The Portfolios will be subject to additional risks to the extent that they engage in short sales that are not “against the box.” A Portfolio’s loss on a short sale could theoretically be unlimited in cases where the Portfolio is unable, for whatever reason, to close out its short position.
| 52 | Semi-Annual Report/ March 31, 2017 |
AllianzGI Institutional Multi-Series Trust
Notes to Financial Statements
March 31, 2017 (unaudited) (continued)
(i) U.S. Government Agencies or Government-Sponsored Enterprises. Securities issued by U.S. Government agencies or government-sponsored enterprises may not be guaranteed by the U.S. Treasury. The Government National Mortgage Association (“GNMA” or “Ginnie Mae”), a wholly-owned U.S. Government corporation, is authorized to guarantee, with the full faith and credit of the U.S. Government, the timely payment of principal and interest on securities issued by institutions approved by GNMA and backed by pools of mortgages insured by the Federal Housing Administration or guaranteed by the Department of Veterans Affairs. Government-related guarantors not backed by the full faith and credit of the U.S. Government include the Federal National Mortgage Association (“FNMA” or “Fannie Mae”) and the Federal Home Loan Mortgage Corporation (“FHLMC” or “Freddie Mac”). Pass-through securities issued by FNMA are guaranteed as to timely payment of principal and interest by FNMA, but are not backed by the full faith and credit of the U.S. Government. FHLMC guarantees the timely payment of interest and ultimate collection of principal, but its participation certificates are not backed by the full faith and credit of the U.S. Government.
(j) Exchange-Traded Funds. Certain Portfolios may invest in exchange-traded-funds (“ETFs”), which typically are index-based investment companies that hold substantially all of their assets in securities representing their specific index, but may also be actively-managed investment companies. Shares of ETFs trade throughout the day on an exchange and represent an investment in a portfolio of securities and other assets. As a shareholder of another investment company, the Portfolios would bear their pro rata portion of the other investment company’s expenses, including advisory fees, in addition to the expenses the Portfolios bear directly in connection with their own operations.
(k) When-Issued/Delayed-Delivery Transactions. When-issued or delayed-delivery transactions involve a commitment to purchase or sell securities for a predetermined price or yield, with payment and delivery taking place beyond the customary settlement period. When delayed-delivery purchases are outstanding, the Portfolios will set aside and maintain until the settlement date in a designated account, liquid assets in an amount sufficient to meet the purchase price. When purchasing a security on a delayed-delivery basis, the Portfolios assume the rights and risks of ownership of the security, including the risk of price and yield fluctuations; consequently, such fluctuations are taken into account when determining the NAV. The Portfolios may dispose of or renegotiate a delayed-delivery transaction after it is entered into, and may sell when-issued securities before they are delivered, which may result in a realized gain or loss. When a security is sold on a delayed-delivery basis, the Portfolios do not participate in future gains and losses with respect to the security.
(l) Organizational and Offering Costs. Organizational costs are expensed at the inception of the Portfolios. Offering costs are amortized over a twelve-month period from the inception of each Portfolio.
2. PRINCIPAL RISKS
In the normal course of business, the Portfolios trade financial instruments and enter into financial transactions where risk of potential loss exists due to, among other things, changes in the market (market risk) or failure of the other party to a transaction to perform (counterparty risk). The Portfolios are also exposed to other risks such as, but not limited to, interest rate, foreign currency, credit and leverage risks.
Interest rate risk is the risk that fixed income securities’ valuations will change because of changes in interest rates. During periods of rising nominal interest rates, the values of fixed income instruments are generally expected to decline. Conversely, during periods of declining nominal interest rates, the values of fixed income instruments are generally expected to rise. A nominal interest rate can be described as the sum of a real interest rate and an expected inflation rate. Fixed income securities with longer durations tend to be more sensitive to changes in interest rates, usually making them more volatile than securities with shorter durations. Duration is used primarily as a measure of the sensitivity of a fixed income security’s market price to interest rate (i.e. yield) movements. Interest rate changes can be sudden and unpredictable, and the Portfolios may lose money as a result of movements in interest rates. The Portfolios may not be able to hedge against changes in interest rates or may choose not to do so for cost or other reasons. In addition, any hedges may not work as intended.
Variable and floating rate securities generally are less sensitive to interest rate changes but may decline in value if their interest rates do not rise as much, or as quickly, as interest rates in general. Conversely, floating rate securities will not generally increase in value if interest rates decline. Inverse floating rate securities may decrease in value if interest rates
| 53 | Semi-Annual Report/ March 31, 2017 |
AllianzGI Institutional Multi-Series Trust
Notes to Financial Statements
March 31, 2017 (unaudited) (continued)
increase. Inverse floating rate securities may also exhibit greater price volatility than a fixed rate obligation with similar credit quality. When the Portfolios hold variable or floating rate securities, a decrease (or, in the case of inverse floating rate securities, an increase) in market interest rates will adversely affect the income received from such securities and the NAV of the Portfolios’ shares.
The Portfolios are exposed to credit risk, which is the risk of losing money if the issuer or guarantor of a fixed income security is unable or unwilling, or is perceived (whether by market participants, rating agencies, pricing services or otherwise) as unable or unwilling, to make timely principal and/or interest payments, or to otherwise honor its obligations. Securities are subject to varying degrees of credit risk, which are often reflected in credit ratings.
To the extent the Portfolios directly invest in foreign currencies or in securities that trade in, and receive revenues in, foreign currencies, or in derivatives that provide exposure to foreign currencies, they will be subject to the risk that those currencies will decline in value relative to the U.S. dollar, or, in the case of hedging positions, that the U.S. dollar will decline in value relative to the currency being hedged. Currency rates in foreign countries may fluctuate significantly over short periods of time for a number of reasons, including economic growth, inflation, changes in interest rates, intervention (or the failure to intervene) by U.S. or foreign governments, central banks or supranational entities such as the International Monetary Fund, or the imposition of currency controls or other political developments in the United States or abroad. As a result, the Portfolios’ investments in foreign currency-denominated securities may reduce the returns of the Portfolios. The local emerging markets currencies in which the Portfolios may be invested may experience substantially greater volatility against the U.S. dollar than the major convertible currencies in developed countries.
The Portfolios are subject to elements of risk not typically associated with investments in the U.S., due to concentrated investments in foreign issuers located in a specific country or region. Such concentrations will subject the Portfolios to additional risks resulting from future political or economic conditions in such country or region and the possible imposition of adverse governmental laws or currency exchange restrictions affecting such country or region, which could cause the securities and their markets to be less liquid and prices more volatile than those of comparable U.S. companies.
The market values of securities may decline due to general market conditions (market risk) which are not specifically related to a particular company, such as real or perceived adverse economic conditions, changes in the general outlook for corporate earnings, changes in interest or currency rates, adverse changes to credit markets or adverse investor sentiment. They may also decline due to factors that affect a particular industry or industries, such as labor shortages or increased production costs and competitive conditions within an industry. Equity securities and equity-related investments generally have greater market price volatility than fixed income securities, although under certain market conditions fixed income securities may have comparable or greater price volatility. Credit ratings downgrades may also negatively affect securities held by the Portfolios. Even when markets perform well, there is no assurance that the investments held by the Portfolios will increase in value along with the broader market. In addition, market risk includes the risk that geopolitical events will disrupt the economy on a national or global level.
The Portfolios are exposed to counterparty risk, or the risk that an institution or other entity with which the Portfolios have unsettled or open transactions will default. The potential loss to the Portfolios could exceed the value of the financial assets recorded in the Portfolios’ financial statements. Financial assets, which potentially expose the Portfolios to counterparty risk, consist principally of cash due from counterparties and investments. The Investment Manager seeks to minimize the Portfolios’ counterparty risk by performing reviews of each counterparty and by minimizing concentration of counterparty risk by undertaking transactions with multiple customers and counterparties on recognized and reputable exchanges. Delivery of securities sold is only made once the Portfolios’ have received payment. Payment is made on a purchase once the securities have been delivered by the counterparty. The trade will fail if either party fails to meet its obligation.
The Portfolios are exposed to risks associated with leverage. Leverage may cause the value of the Portfolios’ shares to be more volatile than if the Portfolios did not use leverage. This is because leverage tends to exaggerate the effect of any increase or decrease in the value of the Portfolios’ portfolio securities. The Portfolios may engage in transactions or purchase instruments that give rise to forms of leverage. In addition, to the extent the Portfolios employ dividend and interest costs may not be recovered by any appreciation of the securities purchased with the leverage proceeds and could exceed the Portfolios’ investment returns, resulting in greater losses.
| 54 | Semi-Annual Report/ March 31, 2017 |
AllianzGI Institutional Multi-Series Trust
Notes to Financial Statements
March 31, 2017 (unaudited) (continued)
The Portfolios are party to International Swaps and Derivatives Association, Inc. Master Agreements (“ISDA Master Agreements”) with select counterparties that govern transactions, over-the-counter derivatives and foreign exchange contracts entered into by the Portfolios and those counterparties. The ISDA Master Agreements contain provisions for general obligations, representations, agreements, collateral and events of default or termination. Events of termination include conditions that may entitle counterparties to elect to terminate early and cause settlement of all outstanding transactions under the applicable ISDA Master Agreement. Any election to terminate early could be material to the financial statements of the Portfolios.
The considerations and factors surrounding the settlement of certain purchases and sales made on a delayed-delivery basis are governed by Master Securities Forward Transaction Agreements (“Master Forward Agreements”) between the Portfolios and select counterparties. The Master Forward Agreements maintain provisions for, among other things, initiation and confirmation, payment and transfer, events of default, termination, and maintenance of collateral.
3. FINANCIAL DERIVATIVE INSTRUMENTS
Disclosure about derivatives and hedging activities requires qualitative disclosure regarding objectives and strategies for using derivatives, quantitative disclosure about fair value amounts of gains and losses on derivatives, and disclosure about credit-risk-related contingent features in derivative agreements. The disclosure requirements distinguish between derivatives which are accounted for as “hedges”, and those that do not qualify for such accounting. Although the Portfolios at times use derivatives for hedging purposes, the Portfolios reflect derivatives at fair value and recognize changes in fair value through the Portfolios’ Statements of Operations, and such derivatives do not qualify for hedge accounting treatment.
Futures Contracts. The Portfolios use futures contracts to manage their exposure to the securities markets or the movements in interest rates and currency values. A futures contract is an agreement between two parties to buy and sell a financial instrument at a set price on a future date. Upon entering into such a contract, the Portfolios are required to pledge to the broker an amount of cash or securities equal to the minimum “initial margin” requirements of the exchange. Pursuant to the contracts, the Portfolios agree to receive from or pay to the broker an amount of cash or securities equal to the daily fluctuation in the value of the contracts. Such receipts or payments are known as “variation margin” and are recorded by the Portfolios as unrealized appreciation or depreciation. When the contracts are closed, the Portfolios record a realized gain or loss equal to the difference between the value of the contracts at the time they were opened and the value at the time they were closed. Any unrealized appreciation or depreciation recorded is simultaneously reversed. The use of futures transactions involves various risks, including the risk of an imperfect correlation in the movements in the price of futures contracts, interest rates and underlying hedging assets, and possible inability or unwillingness of counterparties to meet the terms of their contracts.
Forward Foreign Currency Contracts. A forward foreign currency contract is an agreement between two parties to buy and sell a currency at a set exchange rate on a future date. The Portfolios enter into these contracts for purposes of increasing exposure to a foreign currency or shifting exposure to foreign currency fluctuations from one country to another. The market value of a forward foreign currency contract fluctuates with changes in foreign currency exchange rates. All commitments are marked to market daily at the applicable exchange rates and any resulting unrealized appreciation or depreciation is recorded. Realized gains or losses are recorded at the time the forward contract matures or by delivery of the currency. Risks may arise upon entering into these contracts from the potential inability of counterparties to meet the terms of their contracts and from unanticipated movements in the value of a foreign currency relative to the U.S. dollar. In addition, these contracts may involve market risk in excess of the unrealized appreciation (depreciation) reflected in the Portfolios’ Statements of Assets and Liabilities.
| 55 | Semi-Annual Report/ March 31, 2017 |
AllianzGI Institutional Multi-Series Trust
Notes to Financial Statements
March 31, 2017 (unaudited) (continued)
The following is a summary of the Portfolios’ derivatives categorized by risk exposure.
The effect of derivatives on the Statements of Assets and Liabilities at March 31, 2017:
AllianzGI Advanced Core Bond: |
| |||
| Location | Interest Rate Contracts | |||
| ||||
Liability derivatives: | ||||
Payable for variation margin on futures contracts* | $ | (16,087) | ||
| ||||
| * | Included in net unrealized depreciation of $16,087 on futures contracts as reported in Note 6(a). |
AllianzGI Best Styles Global Managed Volatility: |
| |||
| Location | Market Price | |||
| ||||
Asset derivatives: | ||||
Receivable for variation margin on futures contracts* | $ | 9,834 | ||
| ||||
Liability derivatives: | ||||
Payable for variation margin on futures contracts* | $ | (3,811) | ||
| ||||
| * | Included in net unrealized appreciation of $6,023 on futures contracts as reported in Note 6(a). |
The effect of derivatives on the Statements of Operations for the six months ended March 31, 2017:
AllianzGI Advanced Core Bond: |
| |||
| Location | Interest Rate Contracts | |||
| ||||
Net realized gain on: | ||||
Futures contracts | $ | 136,112 | ||
| ||||
Net change in unrealized appreciation/depreciation of: | ||||
Futures contracts | $ | (20,481) | ||
| ||||
AllianzGI Best Styles Global Managed Volatility: |
| |||||||||||
Location | Market Price | | Foreign Exchange Contracts | | Total | |||||||
| ||||||||||||
Net realized gain on: | ||||||||||||
Futures contracts | $ | 363,952 | — | $ | 363,952 | |||||||
| ||||||||||||
Foreign currency transaction (forward currency contracts) | — | $ | 1,464 | 1,464 | ||||||||
| ||||||||||||
Total net realized gain | $ | 363,952 | $ | 1,464 | $ | 365,416 | ||||||
| ||||||||||||
Net change in unrealized appreciation/depreciation of: | ||||||||||||
Futures contracts | $ | (52,993 | ) | — | $ | (52,993) | ||||||
| ||||||||||||
AllianzGI Global Small-Cap Opportunities: |
| |||||||||||
Location | | Foreign Exchange Contracts | | |||||||||
| ||||||||||||
Net realized loss on: | ||||||||||||
Foreign currency transaction (forward currency contracts) | $ | (1,243) | ||||||||||
| ||||||||||||
| 56 | Semi-Annual Report/ March 31, 2017 |
AllianzGI Institutional Multi-Series Trust
Notes to Financial Statements
March 31, 2017 (unaudited) (continued)
The average volume (based on open positions at each fiscal month end) of derivative activity during the period ended March 31, 2017:
| Forward Foreign | Futures | |||||||||
| Currency Contracts (2) | Contracts (1) | |||||||||
| Purchased | Sold | Long | Short | |||||||
AllianzGI Advanced Core Bond | $— | $— | — | 109 | ||||||
AllianzGI Best Styles Global Managed Volatility | —† | —† | 50 | — | ||||||
AllianzGI Global Small-Cap Opportunities | —† | —† | — | — | ||||||
† Fund had derivative activity during the period but it did not have open positions at any month-end in the period.
(1) Number of contracts
(2) U.S. $ value on origination date
4. INVESTMENT MANAGER/DISTRIBUTOR FEES/DEFERRED COMPENSATION
Investment Management Fee. During the reporting period, each Portfolio had an Investment Management Agreement (for the purpose of this section, collectively the “Agreements”) with the Investment Manager. Subject to the supervision of the Trust’s Board, the Investment Manager was responsible for managing, either directly or through others selected by it, each Portfolio’s investment activities, business affairs and administrative matters. Pursuant to the Agreements, the Investment Manager received an annual fee, payable monthly, at an annual rate of each Portfolio’s average daily net assets (the “Investment Management Fee”).
“Due to Investment Manager” on the Statements of Assets and Liabilities represents the remaining payable for the Portfolios’ offering costs that were paid by the Investment Manager.
The Investment Management fee was charged at an annual rate as indicated in the following table:
| Management Fee | ||
AllianzGI Advanced Core Bond | 0.30% | |
AllianzGI Best Styles Global Managed Volatility | 0.40 | |
AllianzGI Discovery U.S. | 1.00 | |
AllianzGI Global Small-Cap Opportunities | 0.90 |
Distribution Fees. Allianz Global Investors Distributors LLC (the “Distributor”), an affiliate of AAM and the Investment Manager, serves as the distributor of the Portfolios’ shares pursuant to a Distribution Contract. The Distributor, for each of the Portfolios, currently receives no compensation in connection with the services it provides under the Distribution Contract.
Deferred Compensation. Trustees do not currently receive any pension or retirement benefits from the Trust. The Trust has adopted a deferred compensation plan (the “Plan”) for the Trustees, which permits the Trustees to defer their receipt of compensation from the Trust, at their election, in accordance with the terms of the Plan. Under the Plan, each Trustee may elect not to receive all or a portion of his or her fees from the Trust on a current basis but to receive in a subsequent period chosen by the Trustee an amount equal to the value of such compensation if such compensation had been invested in one or more series of the Trust or Allianz Funds selected by the Trustees from and after the normal payment dates for such compensation. The deferred compensation program is structured such that the Trust remains in substantially the same financial position whether Trustee fees are paid when earned or deferred.
| 57 | Semi-Annual Report/ March 31, 2017 |
AllianzGI Institutional Multi-Series Trust
Notes to Financial Statements
March 31, 2017 (unaudited) (continued)
5. EXPENSE LIMITATION AND RECOUPMENT
The Trust and the Investment Manager have entered into Expense Limitation and Management Fee Waiver Agreements as indicated below:
Expense Limitation | ||
AllianzGI Advanced Core Bond (1) | 0.35% | |
AllianzGI Best Styles Global Managed Volatility (2) | 0.45 | |
AllianzGI Discovery U.S (3) | 1.50 | |
AllianzGI Global Small-Cap Opportunities (4) | 1.20 |
(1.) The Investment Manager has contractually agreed to irrevocably waive its management fee or reimburse the Portfolio through January 31, 2018, to the extent that Total Annual Portfolio Operating Expenses, including payment of organizational expenses but excluding interest, tax and extraordinary expenses, and certain credits and other expenses, exceed 0.35%. Under the Expense Limitation Agreement, the Investment Manager may recoup waived or reimbursed amounts for three years, provided total expenses, including such recoupment, do not exceed the annual expense limit in effect at the time of such waiver/reimbursement or recoupment. The Expense Limitation Agreement is terminable by the Trust upon 90 days’ prior written notice to the Manager or at any time by mutual agreement of the parties.
(2.) The Investment Manager has contractually agreed to irrevocably waive its management fee or reimburse the Portfolio through January 31, 2018, to the extent that Total Annual Portfolio Operating Expenses, including payment of organizational expenses but excluding interest, tax and extraordinary expenses, and certain credits and other expenses, exceed 0.45%. Under the Expense Limitation Agreement, the Investment Manager may recoup waived or reimbursed amounts for three years, provided total expenses, including such recoupment, do not exceed the annual expense limit in effect at the time of such waiver/reimbursement or recoupment. The Expense Limitation Agreement is terminable by the Trust upon 90 days’ prior written notice to the Manager or at any time by mutual agreement of the parties.
(3.) The Investment Manager has contractually agreed to irrevocably waive its management fee or reimburse the Portfolio through January 31, 2018, to the extent that Total Annual Portfolio Operating Expenses, including payment of organizational expenses but excluding interest, tax, dividend expenses on short sales and extraordinary expenses, and certain credits and other expenses, exceed 1.50%. Under the Expense Limitation Agreement, the Investment Manager may recoup waived or reimbursed amounts for three years, provided total expenses, including such recoupment, do not exceed the annual expense limit in effect at the time of such waiver/reimbursement or recoupment. The Expense Limitation Agreement is terminable by the Trust upon 90 days’ prior written notice to the Manager or at any time by mutual agreement of the parties.
(4.) The Investment Manager has contractually agreed to irrevocably waive its management fee or reimburse the Portfolio through January 31, 2018, to the extent that Total Annual Portfolio Operating Expenses, including payment of organizational expenses but excluding interest, tax and extraordinary expenses, and certain credits and other expenses, exceed 1.20%. Under the Expense Limitation Agreement, the Investment Manager may recoup waived or reimbursed amounts for three years, provided total expenses, including such recoupment, do not exceed the annual expense limit in effect at the time of such waiver/reimbursement or recoupment. The Expense Limitation Agreement is terminable by the Trust upon 90 days’ prior written notice to the Manager or at any time by mutual agreement of the parties.
During the six months ended March 31, 2017, the Investment Manager did not recoup any expenses from the Portfolios. The following represents the amounts that still can be recouped by the Investment Manager:
Unrecouped Expenses Waived/Reimbursed through Fiscal Period or Year ended | ||||||||
| 11/30/2014 | 9/30/2015 | 9/30/2016 | Totals | |||||
AllianzGI Advanced Core Bond | — | — | $275,685 | $275,685 | ||||
AllianzGI Best Styles Global Managed Volatility | — | — | 205,431 | 205,431 | ||||
AllianzGI Discovery U.S. | — | — | 289,229 | 289,229 | ||||
AllianzGI Global Small-Cap Opportunities | $132,292 | $260,824 | 209,673 | 602,789 | ||||
6. INVESTMENTS IN SECURITIES
For the six months ended March 31, 2017, purchases and sales of investments, other than short-term securities and U.S. government obligations were:
| Purchases | Sales | |||
AllianzGI Advanced Core Bond | $20,478,804 | $26,714,699 | ||
AllianzGI Best Styles Global Managed Volatility | 20,461,820 | 28,307,929 | ||
AllianzGI Discovery U.S.* | 24,440,530 | 22,714,057 |
| 58 | Semi-Annual Report/ March 31, 2017 |
AllianzGI Institutional Multi-Series Trust
Notes to Financial Statements
March 31, 2017 (unaudited) (continued)
AllianzGI Global Small-Cap Opportunities | 3,735,129 | 5,155,044 |
| * | Securities sold short of $20,622,025; covers on securities sold short of $17,959,084. |
Purchases and sales in U.S. government obligations were:
| Purchases | Sales | |||||||||||||
AllianzGI Advanced Core Bond | $ | 296,467,231 | $ | 298,000,288 | ||||||||||
| (a) | Futures contracts outstanding at March 31, 2017: |
AllianzGI Advanced Core Bond:
| Type | Contracts | Market Value (000s) | Expiration Date | Unrealized Depreciation | ||||||||||||||
Short: | 2-Year Treasury Note | (85) | $ | (18,399) | 6/30/17 | $ | (16,087) | |||||||||||
|
| |||||||||||||||||
| AllianzGI Best Styles Global Managed Volatility: | ||||||||||||||||||
| Type | Contracts | Market Value (000s) | Expiration Date | Unrealized Appreciation (Depreciation) | ||||||||||||||
Long: | E-mini S&P 500 Index | 8 | $ | 944 | 6/16/17 | $ | (3,811) | |||||||||||
Mini MSCI Emerging Markets Index | 9 | 432 | 6/16/17 | 9,834 | ||||||||||||||
|
| |||||||||||||||||
| $ | 6,023 | |||||||||||||||||
|
| |||||||||||||||||
At March 31, 2017, the following Portfolios pledged cash as collateral for derivatives:
| Collateral | ||||
AllianzGI Advanced Core Bond | $ | 221,397 | ||
AllianzGI Best Styles Global Managed Volatility | 273,516 | |||
7. INCOME TAX INFORMATION
At March 31, 2017, the aggregate cost basis and the net unrealized appreciation (depreciation) of investments (before securities sold short) for federal income tax purposes were:
| Federal Tax Cost Basis(1) | Unrealized Appreciation | Unrealized Depreciation | Net Unrealized Appreciation (Depreciation) | |||||||||||||
AllianzGI Advanced Core Bond | $209,525,678 | $821,435 | $2,846,630 | $(2,025,195) | ||||||||||||
AllianzGI Best Styles Global Managed Volatility | 64,578,692 | 6,206,036 | 1,217,868 | 4,988,168 | ||||||||||||
AllianzGI Discovery U.S. | 15,072,249 | 1,198,478 | 123,936 | 1,074,542 | ||||||||||||
AllianzGI Global Small-Cap Opportunities | 3,786,553 | 652,544 | 55,568 | 596,976 | ||||||||||||
(1) Differences, if any, between book and tax cost basis were attributable to wash sale loss deferrals and the differing treatment of bond premium amortization.
8. SIGNIFICANT ACCOUNT HOLDERS
From time to time, a Portfolio may have a concentration of shareholders, which may include the Investment Manager or affiliates of the Investment Manager, holding a significant percentage of shares outstanding. Investment activities of these shareholders could have a material impact to a Portfolio.
| 59 | Semi-Annual Report/ March 31, 2017 |
AllianzGI Institutional Multi-Series Trust
Notes to Financial Statements
March 31, 2017 (unaudited) (continued)
At March 31, 2017, the significant account-holders, owners of 5% or greater of each respective Portfolio’s outstanding shares, were as follows:
Unaffiliated
| Affiliated Approximate Ownership
| |||||||||||||||||||
| Number of Account Holders | Approximate Ownership | AFI | AllianzGI Retirement 2020 | AllianzGI Global Allocation | ||||||||||||||||
AllianzGI Advanced Core Bond | 1 | 24% | — | 5% | 68% | |||||||||||||||
AllianzGI Best Styles Global Managed Volatility | 1 | 31% | — | — | 69% | |||||||||||||||
AllianzGI Discovery U.S. | — | — | 100% | — | — | |||||||||||||||
AllianzGI Global Small-Cap Opportunities | — | — | 100% | — | — | |||||||||||||||
9. IN-KIND TRANSACTIONS
During the six months ended March 31, 2017, AllianzGI Best Styles Global Managed Volatility transferred securities and cash to its shareholders in connection with redemption in-kind transactions. These transactions were treated as a sale of securities for U.S. GAAP, and the resulting gains of $189,228 and losses of $227,828 were recognized based on the market value of the securities on the date of the transfer. For tax purposes, no gains or losses were recognized. The realized gains and losses from the redemption in-kind are netted and recorded as net realized gain on investments on the Statements of Operations.
AllianzGI Best Styles Global Managed Volatility redeemed 281,327 shares with a redemption value of $4,428,093. The number of shares redeemed and redemption value are included in the cost of shares redeemed on the Statements of Changes in Net Assets.
10. BORROWINGS
During a portion of the reporting period, the Trust was party to a credit agreement (the “Northern Trust Agreement”), among the Trust, Allianz Funds, Allianz Funds Multi-Strategy Trust and Premier Multi-Series VIT, as borrowers (collectively, the “AllianzGI Borrowers” and each series thereof, an “AllianzGI Borrower Fund”), and Northern Trust Company, as lender, for a committed line of credit. The Northern Trust Agreement permitted the AllianzGI Borrowers to borrow up to $200 million in aggregate, subject to (i) a requirement that each AllianzGI Borrower Fund’s asset coverage with respect to senior securities representing indebtedness be 300% or higher, and (ii) certain other limitations and conditions. Each AllianzGI Borrower Fund paid interest on any amounts borrowed under the facility at the greater of (i) the federal funds overnight rate plus 1.00% or (ii) 1.50%, subject to upward adjustment when any past-due payments are outstanding. The AllianzGI Borrowers also paid a usage fee at an annualized rate of 0.15% on undrawn amounts, allocated pro rata among the AllianzGI Borrower Funds on the basis of net assets.
The Northern Trust Agreement had an original maturity date of July 29, 2016, which was extended by 90 days and expired on October 27, 2016.
On October 27, 2016, the Trust entered into a credit agreement (the “State Street Agreement”), among the Trust, Allianz Funds, Allianz Funds Multi-Strategy Trust and Premier Multi-Series VIT, as borrowers (collectively, the “AllianzGI Borrowers” and each series thereof, an “AllianzGI Borrower Fund”), and State Street Bank and Trust Company, as agent and lender, for a committed line of credit. The State Street Agreement replaced a preexisting credit agreement with the Northern Trust Company. The State Street Agreement has a 364 day term through October 26, 2017 and permits the AllianzGI Borrowers to borrow up to $200 million in aggregate, subject to (i) a requirement that each AllianzGI Borrower Fund’s asset coverage with respect to senior securities representing indebtedness be 300% or higher, and (ii) certain other limitations and conditions. Each AllianzGI Borrower Fund will pay interest on any amounts borrowed under the facility at a rate per annum equal to 1.25% plus the higher of the then-current federal funds overnight rate or the one-month LIBOR rate, subject to upward adjustment when any past due payments are outstanding. The AllianzGI Borrowers will also pay a usage fee at an annualized rate of 0.25% on undrawn amounts, allocated pro rata among the AllianzGI Borrower Funds on the basis of net assets. Amounts borrowed may be repaid and reborrowed on a revolving basis during the term of the facility.
| 60 | Semi-Annual Report/ March 31, 2017 |
AllianzGI Institutional Multi-Series Trust
Notes to Financial Statements
March 31, 2017 (unaudited) (continued)
The Portfolios did not utilize either line of credit during the six months ended March 31, 2017.
11. SUBSEQUENT EVENTS
In preparing these financial statements, the Portfolios’ management has evaluated events and transactions for potential recognition or disclosure through the date the financial statements were issued.
Effective as of May 31, 2017, Mark Roemer is no longer a portfolio manager of AllianzGI Global Small-Cap Opportunities Portfolio. Also effective as of May 31, 2017, Kunal Ghosh is appointed as a portfolio manager of AllianzGI Global Small-Cap Opportunities Portfolio.
There were no other subsequent events identified that require recognition or disclosure.
| 61 | Semi-Annual Report/ March 31, 2017 |
AllianzGI Institutional Multi-Series Trust
Privacy Policy
March 31, 2017 (unaudited)
Please read this Policy carefully. It gives you important information about how Allianz Global Investors U.S. and its U.S. affiliates (“AllianzGI US,” “we” or “us”) handle non-public personal information (“Personal Information”) that we may receive about you. It applies to all of our past, present and future clients and shareholders of AllianzGI US and the funds and accounts it manages, advises, sub-advises, administers or distributes, and will continue to apply when you are no longer a client or shareholder. As used throughout this Policy, “AllianzGI US” means Allianz Global Investors U.S. LLC, Allianz Global Investors Distributors LLC, NFJ Investment Group LLC and the family of registered and unregistered funds managed by one or more of these firms. AllianzGI US is part of a global investment management group, and the privacy policies of other Allianz Global Investors entities outside of the United States may have provisions in their policies that differ from this Privacy Policy. Please refer to the website of the specific non-US Allianz Global Investors entity for its policy on privacy.
We Care about Your Privacy
We consider your privacy to be a fundamental aspect of our relationship with you, and we strive to maintain the confidentiality, integrity and security of your Personal Information. To ensure your privacy, we have developed policies that are designed to protect your Personal Information while allowing your needs to be served.
Information We May Collect
In the course of providing you with products and services, we may obtain Personal Information about you, which may come from sources such as account application and other forms, from other written, electronic, or verbal communications, from account transactions, from a brokerage or financial advisory firm, financial advisor or consultant, and/or from information you provide on our website.
You are not required to supply any of the Personal Information that we may request. However, failure to do so may result in us being unable to open and maintain your account, or to provide services to you.
How Your Information Is Shared
We do not disclose your Personal Information to anyone for marketing purposes. We disclose your Personal Information only to those service providers, affiliated and non-affiliated, who need the information for everyday business purposes, such as to respond to your inquiries, to perform services, and/or to service and maintain your account. This applies to all of the categories of Personal Information we collect about you. The affiliated and non-affiliated service providers who receive your Personal Information also may use it to process your transactions, provide you with materials (including preparing and mailing prospectuses and shareholder reports and gathering shareholder proxies), and provide you with account statements and other materials relating to your account. These service providers provide services at our direction, and under their agreements with us, are required to keep your Personal Information confidential and to use it only for providing the contractually required services. Our service providers may not use your Personal Information to market products and services to you except in conformance with applicable laws and regulations. We also may provide your Personal Information to your respective brokerage or financial advisory firm, custodian, and/or to your financial advisor or consultant.
In addition, we reserve the right to disclose or report Personal Information to non-affiliated third parties, in limited circumstances, where we believe in good faith that disclosure is required under law, to cooperate with regulators or law enforcement authorities or pursuant to other legal process, or to protect our rights or property, including to enforce our Privacy Policy or other agreements with you. Personal Information collected by us may also be transferred as part of a corporate sale, restructuring, bankruptcy, or other transfer of assets.
Security of Your Information
We maintain your Personal Information for as long as necessary for legitimate business purposes or otherwise as required by law. In maintaining this information, we have implemented appropriate procedures that are designed to restrict access to your Personal Information only to those who need to know that information in order to provide products and/or services to you. In addition, we have implemented physical, electronic and procedural safeguards to help protect your Personal Information.
| 62 | Semi-Annual Report/ March 31, 2017 |
AllianzGI Institutional Multi-Series Trust
Privacy Policy
March 31, 2017 (unaudited) (continued)
Privacy and the Internet
The Personal Information that you provide through our website, as applicable, is handled in the same way as the Personal Information that you provide by any other means, as described above. This section of the Policy gives you additional information about the way in which Personal Information that is obtained online is handled.
| • | Online Enrollment, Account Access and Transactions: When you visit our website, you can visit pages that are open to the general public, or, where available, log into protected pages to enroll online, access information about your account, or conduct certain transactions. Access to the secure pages of our website is permitted only after you have created a User ID and Password. The User ID and Password must be supplied each time you want to access your account information online. This information serves to verify your identity. When you enter Personal Information into our website (including your Social Security Number or Taxpayer Identification Number and your password) to enroll or access your account online, you will log into secure pages. By using our website, you consent to this Privacy Policy and to the use of your Personal Information in accordance with the practices described in this Policy. If you provide Personal Information to effect transactions on our website, a record of the transactions you have performed while on the site is retained by us. For additional terms and conditions governing your use of our website, please refer to the Investor Mutual Fund Access – Disclaimer which is incorporated herein by reference and is available on our website. |
| • | Cookies and Similar Technologies: Cookies are small text files stored in your computer’s hard drive when you visit certain web pages. Cookies and similar technologies help us to provide customized services and information. We use these technologies on our website to improve our website and services, including to evaluate the effectiveness of our site, and to enhance the site user experience. Because an industry-standard Do-Not-Track protocol is not yet established, our website will continue to operate as described in this Privacy Policy and will not be affected by any Do-Not-Track signals from any browser. |
Changes to Our Privacy Policy
We may modify this Privacy Policy from time-to-time to reflect changes in related practices and procedures, or applicable laws and regulations. If we make changes, we will notify you on our website and the revised Policy will become effective immediately upon posting to our website. We also will provide account owners with a copy of our Privacy Policy annually. We encourage you to visit our website periodically to remain up to date on our Privacy Policy. You acknowledge that by using our website after we have posted changes to this Privacy Policy, you are agreeing to the terms of the Privacy Policy as modified.
Obtaining Additional Information
If you have any questions about this Privacy Policy or our privacy related practices in the United States, you may contact us via our dedicated email at PrivacyUS@allianzgi.com.
| 63 | Semi-Annual Report/ March 31, 2017 |
| Trustees | ||
| Davey S. Scoon | Investment Manager | |
| Chairman of the Board of Trustees | Allianz Global Investors U.S. LLC | |
| Barbara R. Claussen | 1633 Broadway | |
| Deborah A. DeCotis | New York, NY 10019 | |
| F. Ford Drummond | ||
| A. Douglas Eu | Distributor | |
| Bradford K. Gallagher | Allianz Global Investors Distributors LLC | |
| James A. Jacobson | 1633 Broadway | |
| Hans W. Kertess | New York, NY 10019 | |
| James S. MacLeod | ||
| William B. Ogden, IV | Custodian & Accounting Agent | |
| Alan Rappaport | State Street Bank & Trust Co. | |
| 801 Pennsylvania Avenue | ||
| Officers | Kansas City, MO 64105 | |
| Thomas J. Fuccillo | ||
| President & Chief Executive Officer | Transfer Agent | |
| Lawrence G. Altadonna | Boston Financial Data Services, Inc. | |
| Treasurer, Principal Financial & Accounting Officer | 330 West 9th Street, 5th Floor | |
| Angela Borreggine | Kansas City, MO 64105 | |
| Secretary & Chief Legal Officer | ||
| Thomas L. Harter | Independent Registered Public Accounting Firm | |
| Chief Compliance Officer | PricewaterhouseCoopers LLP | |
| Scott Whisten | 300 Madison Avenue | |
| Assistant Treasurer | New York, NY 10017 | |
| Richard J. Cochran | ||
| Assistant Treasurer | Legal Counsel | |
| Orhan Dzemaili | Ropes & Gray LLC | |
| Assistant Treasurer | Prudential Tower | |
| Debra Rubano | 800 Boylston Street | |
| Assistant Secretary | Boston, MA 02199 | |
| Paul Koo(1) | ||
| Assistant Secretary |
This report, including the financial information herein, is transmitted to the shareholders of the Trust for their information. It is not a prospectus, circular or representation intended for use in the purchase of shares of each Portfolio or any securities mentioned in this report.
The financial information included herein is taken from the records of the Portfolios without examination by an independent registered public accounting firm, who did not express an opinion herein.
(1) Paul Koo is Assistant Secretary of the Portfolios with a limited authority to open, maintain and close certain custodical and trading accounts for each Portfolio.
AZ753SA_033117
152982
| ITEM 2. | CODE OF ETHICS |
| (a) | Not required in this filing. |
| ITEM 3. | AUDIT COMMITTEE FINANCIAL EXPERT |
Not required in this filing.
| ITEM 4. | PRINCIPAL ACCOUNTANT FEES AND SERVICES |
Not required in this filing.
| ITEM 5. | AUDIT COMMITTEE OF LISTED REGISTRANT |
Disclosure not required for open-end management investment companies.
| ITEM 6. | SCHEDULE OF INVESTMENTS |
| (a) | Schedule of Investments is included as part of the report to shareholders filed under Item 1 of this form. |
| (b) | Not applicable. |
| ITEM 7. | DISCLOSURE OF PROXY VOTING POLICIES AND PROCEDURES FOR CLOSED-END MANAGEMENT INVESTMENT COMPANIES |
Disclosure not required for open-end management investment companies.
| ITEM 8. | PORTFOLIO MANAGERS OF CLOSED-END MANAGEMENT INVESTMENT COMPANIES |
Disclosure not required for open-end management investment companies.
| ITEM 9. | PURCHASES OF EQUITY SECURITIES BY CLOSED-END MANAGEMENT INVESTMENT COMPANY AND AFFILIATED COMPANIES. |
Disclosure not required for open-end management investment companies.
| ITEM 10. | SUBMISSION OF MATTERS TO A VOTE OF SECURITY HOLDERS |
There were no material changes to the procedures by which shareholders may recommend nominees to the Fund’s Board of Trustees since the Fund’s last provided disclosure in response to this item.
| ITEM 11. | CONTROLS AND PROCEDURES |
| (a) | The registrant’s President & Chief Executive Officer and Treasurer, Principal Financial & Accounting Officer have concluded that the registrant’s disclosure controls and procedures (as defined in Rule 30a-3(c) under the Act (17 CFR 270.30a-3(c))), are effective based on their evaluation of these controls and procedures as of a date within 90 days of the filing date of this document. |
| (b) | There were no significant changes in the registrant’s internal control over financial reporting (as defined in Rule 30a-3(d) under the Act (17 CFR 270.30a-3(d))) that occurred during the second fiscal quarter of the period covered by this report that has materially affected, or is reasonably likely to materially affect, the registrant’s internal control over financial reporting. |
| ITEM 12. | EXHIBITS |
(a) (1) Not required in this filing.
(a) (2) Exhibit 99.302 Cert. — Certification pursuant to Section 302 of the Sarbanes-Oxley Act of 2002
(a) (3) Not applicable
(b) Exhibit 99.906 Cert. — Certification pursuant to Section 906 of the Sarbanes-Oxley Act of 2002
Signatures
Pursuant to the requirements of the Securities Exchange Act of 1934 and the Investment Company Act of 1940, the registrant has duly caused this report to be signed on its behalf by the undersigned, thereunto duly authorized.
| AllianzGI Institutional Multi-Series Trust | ||
| By: | /s/ Thomas J. Fuccillo | |
| Thomas J. Fuccillo | ||
| President & Chief Executive Officer | ||
| Date: June 2, 2017 | ||
| By: | /s/ Lawrence G. Altadonna | |||
| Lawrence G. Altadonna | ||||
| Treasurer, Principal Financial & Accounting Officer | ||||
| Date: June 2, 2017 | ||||
Pursuant to the requirements of the Securities Exchange Act of 1934 and the Investment Company Act of 1940, this report has been signed below by the following persons on behalf of the registrant and in the capacities and on the dates indicated.
| By: | /s/ Thomas J. Fuccillo | |||
| Thomas J. Fuccillo | ||||
| President & Chief Executive Officer | ||||
| Date: June 2, 2017 | ||||
| By: | /s/ Lawrence G. Altadonna | |||
| Lawrence G. Altadonna | ||||
| Treasurer, Principal Financial & Accounting Officer | ||||
| Date: June 2, 2017 | ||||