UNITED STATES
SECURITIES AND EXCHANGE COMMISSION
Washington, D.C. 20549
FORMN-CSR
CERTIFIED SHAREHOLDER REPORT OF
REGISTERED MANAGEMENT INVESTMENT COMPANIES
Investment Company Act file number:811-22975
AllianzGI Institutional Multi-Series Trust
(Exact name of registrant as specified in charter)
1633 Broadway, New York, NY 10019
(Address of principal executive offices) (Zip code)
Scott Whisten
1633 Broadway, New York, NY 10019
(Name and address of agent for service)
Registrant’s telephone number, including area code:212-739-3367
Date of fiscal year end: September 30
Date of reporting period: March 31, 2019
ITEM 1. Report to Shareholders
AllianzGI Institutional Multi-Series Trust
Semi-Annual Report
March 31, 2019
Beginning on January 1, 2021, as permitted by regulations adopted by the U.S. Securities and Exchange Commission, paper copies of shareholder reports will no longer be sent by mail, unless you specifically request paper copies of the reports. Instead, the reports will be made available on the Portfolio’s website (us.allianzgi.com), and you will be notified by mail each time a report is posted and provided with a website link to access the report.
If you already elected to receive shareholder reports electronically, you will not be affected by this change and you need not take any action. You may elect to receive shareholder reports and other communications from a Portfolio electronically anytime by contacting your financial intermediary (such as a broker-dealer or bank) or, if you are a direct investor, by enrolling at us.allianzgi.com/edelivery.
If you prefer to receive paper copies of your shareholder reports after January 1, 2021, direct investors may inform a Portfolio at any time. Paper copies are provided free of charge and your election to receive reports in paper will apply to all funds held with the fund complex.
Table of Contents
| 2-7 | ||||
| 8-9 | ||||
| 10-34 | ||||
| 35 | ||||
| 36 | ||||
| 37-38 | ||||
| 39-40 | ||||
| 41-54 | ||||
| 55 | ||||
| 56-58 | ||||
AllianzGI Advanced Core Bond Portfolio
(unaudited)
For the period of October 1, 2018 through March 31, 2019, as provided by Fabian Lutzenberger, CFA, Lead Portfolio Manager.
Portfolio Insights |
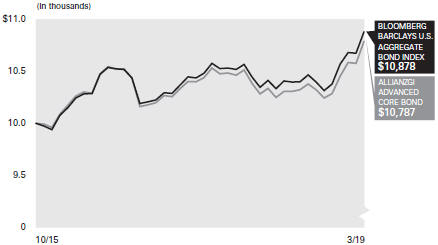
For the six-month period ending March 31, 2019, the AllianzGI Advanced Core Bond Portfolio (the “Portfolio”) returned 4.51% (net of fees), underperforming the Bloomberg Barclays U.S. Aggregate Bond Index (the “benchmark”), which returned 4.63%.
Market Overview
Over the six-month period, the index yield of the benchmark, as provided by Bloomberg Finance L.P., decreased by -52 basis points. Broken down by sub-indices of the benchmark, the strongest decrease in yield was realized in US Treasury, commercial mortgage-backed securities (CMBS), and Covered Bonds (-57 basis points each), followed by US mortgage-backed securities (MBS) (-51 basis points). The total return of the benchmark can be broken down into segment performance as follows: The US Treasury sub-index performed 4.73%, the Government-Related sub-index returned 4.37%, the Corporate sub-index returned 4.96%, and the US MBS sub-index realized a total return of 4.30%. Looking at the various rating segments of the benchmark, we observe that the worst | performance was shown by Aaa-rated bonds (4.52%), while A-rated bonds had the highest total return (5.00%). Analyzing the maturity segments of the benchmark, we observe that the highest total return was realized by the 10+ Year sub-index (7.40%), followed by the 7-10 Year sub-index (5.24%). The worst performance was shown by the 1-3 Year sub-index (2.41%), followed by the 3-5 Year (4.01%) and 5-7 Year (4.64%) sub-indices.
Portfolio Review
According to a performance attribution analysis provided by IDS GmbH*, Sector, Yield, Selection, and Other Factors were positive contributors to the Portfolio’s active return against the benchmark, while Effective Duration, Term Structure, and Quality were negative contributors.
Outlook
At the end of the six-month period, the yield of the Portfolio’s investment universe, as measured by the benchmark yield, was 2.93%, | as provided by Bloomberg Finance L.P. The benchmark segment with the highest yield was Corporate (3.63%), followed by US MBS with 3.08% and CMBS with 3.01%. The segment of the benchmark with the lowest yield was US Treasury, which yielded 2.38%.
We expect economic growth in the US to remain solid for the coming months, supported by stable domestic demand given the strong labor market data, the savings rate and the financial positions of households. Regarding inflation, we expect pressure on US inflation to stay limited, despite the increase in oil price, as there appear to be some signs of wage pressure, as the labor market seems to continue to stay supportive. Concerning US monetary policy, we expect no change in the federal funds target rate over the next three months. Instead, the US Federal Reserve seems to be patient and appears to be willing to tolerate or even strive for inflation of slightly above 2%. Looking at unique market drivers, global trade conflicts appear to continue to be a major source of risk. |
* IDS GmbH is an Analysis and Reporting Service that is a wholly owned subsidiary of Allianz SE offering a full range of managed services encompassing Data Management, Risk Controlling, Performance Analysis and Reporting for investments.
Average Annual Total Return for the period ended March 31, 2019 | |||||||||||||||
| 6 Month* | 1 Year | Since Inception† | |||||||||||||
AllianzGI Advanced Core Bond Portfolio
|
| 4.51%
|
|
| 4.37%
|
|
| 2.25%
|
| ||||||
Bloomberg Barclays U.S. Aggregate Bond Index††
|
| 4.63%
|
|
| 4.48%
|
|
| 2.49%
|
| ||||||
* Cumulative return
† The Portfolio began operations on October 30, 2015. Benchmark return comparisons began on the portfolio inception date.
†† The Bloomberg Barclays U.S. Aggregate Bond Index represents securities that are SEC-registered, taxable, and dollar denominated. The index is composed of securities from the Bloomberg Barclays Capital Government/Credit Bond Index, Mortgage-Backed Securities Index, and Asset-Backed Securities Index. It is generally considered to be representative of the domestic, investment-grade, fixed-rate, taxable bond market. Index returns reflect the reinvestment of income dividends and capital gains, if any, but do not reflect fees, brokerage commissions or other expenses of investing. It is not possible to invest directly in an index.
Performance quoted represents past performance and is no guarantee of future results. Current performance may be lower or higher than performance shown. Investment return and the principal value will fluctuate. Shares may be worth more or less than original cost when redeemed. Returns do not reflect deduction of taxes that a shareholder would pay on portfolio distributions or redemption of portfolio shares. Total return performance assumes that all dividends and capital gain distributions were reinvested on the payable date. The Portfolio’s gross expense ratio is 0.50%. This ratio does not include an expense reduction, contractually agreed to through January 31, 2020. The Portfolio’s expense ratio net of this reduction is 0.35%. Expense ratio information is as of the Portfolio’s current Private Placement Memorandum (“PPM”) dated February 1, 2019, as further revised or supplemented from time to time.
Portfolio Review commentary is based on the Wilshire Axiom Performance Attribution Analysis. Wilshire Axiom uses a position based approach and performance is linked daily. Please note that the different prices and different methodologies used in this attribution report, among others, may cause deviation in return figures to official performance.
| 2 | Semiannual Report / March 31, 2019 |
AllianzGI Advanced Core Bond Portfolio
(unaudited) (continued)
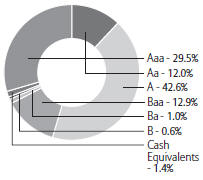
Industry/Sectors (as of March 31, 2019) |
| |||
U.S. Government Agency Securities | 28.0 | % | ||
U.S. Treasury Obligations | 25.7 | % | ||
Banks | 23.8 | % | ||
Sovereign Debt Obligations | 13.7 | % | ||
Auto Manufacturers | 5.8 | % | ||
Oil, Gas & Consumable Fuels | 3.6 | % | ||
Food & Beverage | 2.8 | % | ||
Pharmaceuticals | 2.6 | % | ||
Other | 18.9 | % | ||
Cash & Equivalents — Net | -24.9 | % | ||
Moody’s Ratings* (as of March 31, 2019) | ||
(as a % of total investments)
Cumulative Returns through March 31, 2019 |
* As a percentage of total investments. Bond ratings refer to the underlying holdings of the Portfolio and are categorized from highest to lowest credit quality using ratings provided by Moody’s. Moody’s ratings have been selected for several reasons, including the access to information and materials provided by Moody’s, as well as the Portfolio’s consideration of industry practice. See “Important Information” for more detail on the selection of Moody’s for the Portfolio’s ratings presentation. Bonds not rated by Moody’s and bonds that do not currently have a rating available are designated in the chart above as “NR” and “NA”, respectively.
Shareholder Expense Example | Actual Performance | |
| Institutional Class | ||
Beginning Account Value (10/1/18) | $1,000.00 | |
Ending Account Value (3/31/19) | $1,045.10 | |
Expenses Paid During Period | $ 1.78 | |
| Hypothetical Performance | ||
| (5% return before expenses) | ||
| Institutional Class | ||
Beginning Account Value (10/1/18) | $1,000.00 | |
Ending Account Value (3/31/19) | $1,023.31 | |
Expenses Paid During Period | $ 1.78 | |
Expenses (net of reimbursement, if any) are equal to the annualized expense ratio (0.35%), multiplied by the average account value over the period, multiplied by 182/365.
| 3 | Semiannual Report / March 31, 2019 |
AllianzGI Best Styles Global Managed Volatility Portfolio
(unaudited)
For the period of October 1, 2018 through March 31, 2019, as provided by Christian McCormick, Senior Product Specialist.
Portfolio Insights |
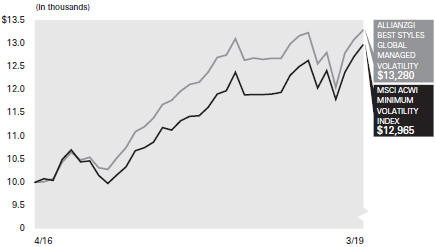
For the six-month period ended March 31, 2019, the AllianzGI Best Styles Global Managed Volatility Portfolio (the “Portfolio”) returned 0.38%, underperforming the MSCI ACWI Minimum Volatility Index (the “benchmark”), which returned 2.66%.
Market Overview
It was a volatile six months for global equities, with a severe setback in the last three months of 2018 followed by a sharp rebound at the start of 2019. A sudden rise in bond yields in early October 2018 provided the catalyst for the sell-off, with concerns over the outlook for global growth, heightened political risks and the ongoing trade tensions between the US and China also weighing on sentiment. While equity markets recovered strongly over the first quarter of 2019, helped by a dovish tone from central banks, many developed markets closed the six-month period lower, although emerging markets performed better, posting moderate gains.
Portfolio Review
The Best Styles strategies implement a well- diversified blend of the five long-term successful investment styles Value, Momentum, | Earnings Change, Growth and Quality. Over the six-month period, the style Value underperformed globally, especially in the US. In addition, the global equity markets experienced an unusual period in which the trend following styles of Momentum and Earnings Change also underperformed. In most environments, Value and trend following have a low correlation to each other. In addition, Quality was only slightly ahead, but low volatility stocks, to which Best Styles does not allocate, were the best performers in an overall more defensive market.
The Best Styles strategy has only moderate leeway for sector and regional allocation with a maximum deviation of 3% versus the benchmark for active weightings. The overall contribution from active country/sector allocation was relatively benign as would be expected with our tight active collars, but there was a -30 basis points detraction from the country allocation
Best Styles holds a broad number of stocks to implement a well-diversified mix of investment styles and assigns a maximum active weighting of 1% to individual stocks. Therefore, we expect stock selection to be the biggest driver of | relative returns and this was the case over the past six months. Stock selection in the healthcare sector and in the United States were the biggest detractors at -100 basis points and -148 basis points, respectively.
Outlook
The Best Styles strategy is a diversified mix of hundreds of securities that seeks to harvest the long-term risk premiums associated with Value, Momentum, Earnings Change, Growth, and Quality. Around these premiums, we use a quantitative process to minimize risk and create a stable excess return stream independent of market and economic environments. Therefore, we do not provide a market or economic outlook. |
Average Annual Return for the period ended March 31, 2019 | ||||||
6 Month* | 1 Year | Since Inception† | ||||
AllianzGI Best Styles Global Managed Volatility Portfolio | 0.38% | 4.72% | 10.03% | |||
MSCI ACWI Minimum Volatility Index†† | 2.66% | 9.04% | 9.14% |
* Cumulative return
† The Portfolio began operations on April 11, 2016. Benchmark return comparisons began on the portfolio inception date.
†† The MSCI ACWI Minimum Volatility Index aims to reflect the performance characteristics of a minimum variance strategy applied to large and mid-cap equities across developed markets and emerging markets countries. The index is calculated by optimizing the MSCI ACWI Index, its parent index, for the lowest absolute risk (within a given set of constraints). Historically, the index has shown lower beta and volatility characteristics relative to the MSCI ACWI Index. Index returns reflect the reinvestment of income dividends and capital gains, if any, but do not reflect fees, brokerage commissions or other expenses of investing. It is not possible to invest directly in an index.
Performance quoted represents past performance and is no guarantee of future results. Current performance may be lower or higher than performance shown. Investment return and the principal value will fluctuate. Shares may be worth more or less than original cost when redeemed. Returns do not reflect deduction of taxes that a shareholder would pay on portfolio distributions or redemption of portfolio shares. Total return performance assumes that all dividends and capital gain distributions were reinvested on the payable date. The Portfolio’s gross expense ratio is 0.84%. This ratio does not include an expense reduction, contractually agreed to through January 31, 2020. The Portfolio’s expense ratio net of this reduction is 0.45%. Expense ratio information is as of the Portfolio’s current PPM dated February 1, 2019, as further revised or supplemented from time to time.
| 4 | Semiannual Report / March 31, 2019 |
AllianzGI Best Styles Global Managed Volatility Portfolio
(unaudited) (continued)
Country Allocation (as of March 31, 2019) |
| |||
United States | 57.5 | % | ||
Japan | 12.4 | % | ||
Taiwan | 4.7 | % | ||
China | 2.5 | % | ||
Hong Kong | 1.8 | % | ||
Switzerland | 1.6 | % | ||
Thailand | 1.6 | % | ||
Singapore | 1.4 | % | ||
Other | 15.0 | % | ||
Cash & Equivalents — Net | 1.5 | % | ||
Cumulative Returns through March 31, 2019 |
Shareholder Expense Example | Actual Performance | |
| Institutional Class | ||
Beginning Account Value (10/1/18) | $1,000.00 | |
Ending Account Value (3/31/19) | $1,003.80 | |
Expenses Paid During Period | $ 2.25 | |
| Hypothetical Performance | ||
| (5% return before expenses) | ||
| Institutional Class | ||
Beginning Account Value (10/1/18) | $1,000.00 | |
Ending Account Value (3/31/19) | $1,022.81 | |
Expenses Paid During Period | $ 2.28 | |
Expenses (net of reimbursement, if any) are equal to the annualized expense ratio (0.45%), multiplied by the average account value over the period, multiplied by 182/365
| 5 | Semiannual Report / March 31, 2019 |
AllianzGI Global Small-Cap Opportunities Portfolio
(unaudited)
For the period of October 1, 2018 through March 31, 2019, as provided by Kunal Ghosh, Portfolio Manager.
Portfolio Insights |
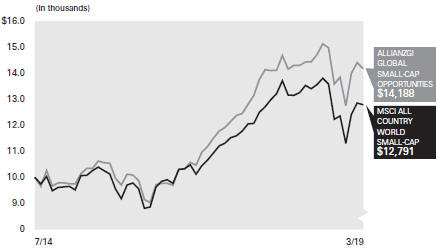
For the six-month period ended March 31, 2019, the AllianzGI Global Small-Cap Opportunities Portfolio (the “Portfolio”) returned -5.27%, outperforming the MSCI All Country World Small-Cap Index (the “benchmark”), which returned -5.85%.
Market Overview
During the reporting period, the macroeconomic climate was particularly divergent and volatility spiked due to rapidly changing investor sentiment. Initially, we saw a sudden rise in bond yields at the start of October 2018 which was a catalyst for the broad-based sell-off. After positive results in November 2018, equities again declined in December 2018 amid weak economic data in Europe and Japan, which prompted fears over the impact of higher tariffs and the outlook for global growth. Global small-cap equities broadly advanced in January and February of 2019 as investor sentiment rapidly improved following headwinds at the end of 2018, and performance subsided modestly in March 2019. Earnings growth estimates pointed to expansion in each of the three upcoming calendar year periods and the asset class was buoyed by expectations that central banks would slow the pace of rate hikes. In addition, the market remained hopeful for an eventual trade resolution between the United States and China, which had been an overhang for the asset class for the past year.
Benchmark sector performance was primarily lower, with three out of 11 sectors posting positive results. Utilities led results to the upside, posting an 8.0% return, followed by more modest gains in real estate and information technology sectors. Meanwhile, the energy sector declined 25.0% during the | reporting period, followed by high-single-digit losses in industrials, financials and materials sectors.
Country results were mostly lower, with 31 out of 47 countries declining. Emerging market small-cap equities generally outperformed their developed markets small-cap counterparts during the reporting period due to a more attractive valuation level. Brazil led results to the upside with a 31.7% gain due to optimism over the reform agenda of newly-elected President Jair Bolsanaro. The Philippines, India and New Zealand each posted low double-digit returns during the reporting period due to the favorable economic backdrop. Meanwhile, Peru was down 20% as a result of idiosyncratic impacts and Pakistan was lower by 17.1% due to macroeconomic headwinds, followed by more modest losses in Norway and France.
Portfolio Review
The Portfolio seeks to benefit from the vast inefficiencies in global small-cap equities. Results modestly outpaced the benchmark during the reporting period due to positive stock selection on both a country and sector basis.
Energy was the top performer thanks to bottom-up stock selection, followed by positive stockpicking in real estate and industrials sectors. Meanwhile, more conservative stock selection in consumer discretionary and materials sectors offset results, as did an underweight allocation to the utilities sector. From a country perspective, bottom-up stockpicking in Japan aided results as did the combination of stock selection and allocation decisions in Singapore and China. Conversely, stock selection in the United States was the primary detractor from relative results, | followed by short-term stockpicking in India and Spain.
Outlook
We maintain the view that the current economic expansion should continue at a moderate pace and investor sentiment has been decidedly positive to start the year. Key manufacturing and service surveys flash expansionary numbers; employment metrics remain positive; and leading indicators signal benign conditions. We anticipate that economic growth should decelerate in 2019, as temporary boosts from factors that include tax reform in the United States, are likely to have an impact on their non-US counterparts. Market expectations of near double-digit earnings growth for next three calendar years, is a decidedly higher growth projection than small-cap’s large-cap counterparts, further encapsulating the opportunities in the asset class. In addition, investors may benefit from the abundance of idiosyncratic opportunities in global small-cap equities as evident by the historical outperformance of actively managed strategies relative to the benchmark.
We continue to construct the Portfolio on a bottom-up basis with conviction at the stock level. In addition, we apply a dual risk-budget, targeting a moderate tracking error and lower forecast risk than the benchmark, which may help protect capital during inevitable down market periods and provide our clients with a greater level of return consistency. We believe investment results will be supported by earnings growth and our behavioral finance- focused investment process and focus on higher quality securities with attractive company fundamentals will be a driver of returns for the coming quarters. |
Average Annual Total Return for the period ended March 31, 2019 | ||||||
6 Month* | 1 Year | Since Inception† | ||||
AllianzGI Global Small-Cap Opportunities Portfolio | -5.27% | -0.82% | 7.75% | |||
MSCI All Country World Small-Cap Index†† | -5.85% | -2.72% | 5.39% |
* Cumulative return
† The Portfolio began operations on July 23, 2014. Benchmark return comparisons began on the portfolio inception date.
†† The MSCI All Country World Small-Cap Index captures small-cap representation across developed markets and emerging markets countries. The Index covers about 14% of the free float-adjusted market capitalization in each country. Index returns reflect the reinvestment of income dividends and capital gains, if any, but do not reflect fees, brokerage commissions or other expenses of investing. It is not possible to invest directly in an index.
Performance quoted represents past performance and is no guarantee of future results. Current performance may be lower or higher than performance shown. Investment return and the principal value will fluctuate. Shares may be worth more or less than original cost when redeemed. Returns do not reflect deduction of taxes that a shareholder would pay on portfolio distributions or redemption of portfolio shares. Total return performance assumes that all dividends and capital gain distributions were reinvested on the payable date. The Portfolio’s gross expense ratio is 3.70%. This ratio does not include an expense reduction, contractually agreed to through January 31, 2020. The Portfolio’s expense ratio net of this reduction is 1.20%. Expense ratio information is as of the Portfolio’s current PPM dated February 1, 2019, as further revised or supplemented from time to time.
| 6 | Semiannual Report / March 31, 2019 |
AllianzGI Global Small-Cap Opportunities Portfolio
(unaudited) (continued)
Country Allocation (as of March 31, 2019) |
| |||
United States | 54.6 | % | ||
Japan | 11.3 | % | ||
United Kingdom | 4.2 | % | ||
China | 4.1 | % | ||
Australia | 3.2 | % | ||
Canada | 2.5 | % | ||
Singapore | 2.3 | % | ||
Hong Kong | 2.1 | % | ||
Other | 15.4 | % | ||
Cash & Equivalents — Net | 0.3 | % | ||
Cumulative Returns through March 31, 2019 |
Shareholder Expense Example | Actual Performance | |
| Institutional Class | ||
Beginning Account Value (10/1/18) | $1,000.00 | |
Ending Account Value (3/31/19) | $ 947.30 | |
Expenses Paid During Period | $ 5.83 | |
| Hypothetical Performance | ||
| (5% return before expenses) | ||
| Institutional Class | ||
Beginning Account Value (10/1/18) | $1,000.00 | |
Ending Account Value (3/31/19) | $1,018.95 | |
Expenses Paid During Period | $ 6.04 | |
Expenses (net of reimbursement, if any) are equal to the annualized expense ratio (1.20%), multiplied by the average account value over the period, multiplied by 182/365.
| 7 | Semiannual Report / March 31, 2019 |
AllianzGI Institutional Multi-Series Trust
Important Information(unaudited)
As of March 31, 2019, AllianzGI Institutional Multi-Series Trust (the “Trust”) consisted of three investment series, AllianzGI Advanced Core Bond Portfolio, AllianzGI Best Styles Global Managed Volatility Portfolio, and AllianzGI Global Small-Cap Opportunities Portfolio, (each a “Portfolio” and collectively the “Portfolios”). The Portfolios each currently offer one share class.
The Cumulative Returns charts for each Portfolio assume the initial investment was made on the first day of each Portfolio’s initial fiscal year. Results assume that all dividends and capital gain distributions, if any, were reinvested. They do not take into account the effect of taxes. The benchmark cumulative return began on the last day of the month of each Portfolio’s inception date.
The following disclosure provides important information regarding each Portfolio’s Shareholder Expense Example, which appears on each Portfolio Summary page in this Annual report. “Cash & Equivalents-Net” in the Allocation Summaries may be comprised of cash, repurchase agreements, U.S. Treasury Bills, and other assets net of other liabilities including net unrealized appreciation (depreciation) on futures contracts, and forward foreign currency contracts, as applicable. Please refer to this information when reviewing the Shareholder Expense Example for each Portfolio.
Shareholder Expense Example
Shareholders incur two types of costs: (1) transaction costs; and (2) ongoing costs, including investment management fees and other Portfolio expenses. The Shareholder Expense Example is intended to help shareholders understand ongoing costs (in dollars) of investing in a Portfolio and to compare these costs with the ongoing costs of investing in other mutual funds. The Shareholder Expense Example is based on $1,000.00 invested at the beginning of the period, as indicated, and held for the entire period October 1, 2018 through March 31, 2019.
Actual Expenses
The information in the table under the heading “Actual Performance” provides information about actual account values and actual expenses. You may use the information in this column, together with the amount you invested, to estimate the expenses that you paid over the period. Simply divide your account value by $1,000.00 (for example, an $8,600.00 account value divided by $1,000.00 = 8.6), then multiply the result by the number in the row titled “Expenses Paid During Period” to estimate the expenses you paid on your account during this period.
Hypothetical Example for Comparison Purposes
The information in the tables for “Hypothetical Performance (5% return before expenses)” provides information about hypothetical account values and hypothetical expenses based on a Portfolio’s actual expense ratio and an assumed rate of return of 5% per year before expenses, which is not each Portfolio’s actual return. The hypothetical account values and expenses may not be used to estimate the actual ending account balance or expenses you paid for the period. You may use this information to compare the ongoing costs of investing in a Portfolio and other funds. To do so, compare this 5% hypothetical example with the 5% hypothetical examples that appear in the shareholder reports of other funds.
Please note that the expenses shown in the table are meant to highlight your ongoing costs only and do not reflect any transactional costs. Therefore, the information for “Hypothetical Performance (5% return before expenses)” is useful in comparing ongoing costs only, and will not help you determine the relative total costs of owning different funds. In addition, if these transactional costs were included, your costs may have been higher.
Proxy Voting
The Portfolios’ Investment Manager, Allianz Global Investors U.S. LLC (“AllianzGI U.S.” or the “Investment Manager”), has adopted written proxy voting policies and procedures (“Proxy Policy”) as required by Rule 206(4)-6 under the Investment Advisers Act of 1940. The Proxy Policy has been adopted by the Trust as the policies and procedures that the Investment Manager will use when voting proxies on behalf of each Portfolio. Copies of the written Proxy Policy and the factors that the Investment Manager may consider in determining how to vote proxies for each Portfolio, and information about how each Portfolio voted proxies relating to portfolio securities held during the most recent twelve-month period ended June 30, are available without charge, upon request, by calling 1-800-498-5413, on the Allianz Global Investors website at us.allianzgi.com and on the Securities and Exchange Commission’s (the “SEC”) website athttp://www.sec.gov.
| 8 | Semiannual Report / March 31, 2019 |
AllianzGI Institutional Multi-Series Trust
Important Information(unaudited) (continued)
Form N-Q
The Trust files complete schedules of each Portfolio’s holdings with the SEC on Form N-Q for the first and third quarters of each fiscal year, which are available on the SEC’s website at http://www.sec.gov. A copy of the Trust’s Form N-Q is available without charge, upon request, by calling 1-800-498-5413. A description of the Trust’s policies and procedures with respect to the disclosure of each Portfolio’s holdings, together with additional information about portfolio holdings disclosure, is available in the Trust’s Statement of Additional Information. In addition, the Investment Manager will post each Portfolio’s holding information on the Portfolio’s website at us.allianzgi.com. Each Portfolio’s website will contain a complete schedule of portfolio holdings as of the relevant month end. The information will be posted approximately thirty (30) calendar days after the relevant month’s end, and such information will remain accessible on the website until the Trust files its Form N-CSR or Form N-Q with the SEC for the period that includes the date as of which the website information is current. Beginning April 30, 2019, and for subsequent periods, this information will be posted on the website approximately thirty (30) calendar days after the relevant month’s end, and such information will remain accessible on the website until the Trust files its Form N-CSR or Form N-PORT for the last month of the Portfolios’ first or third fiscal quarters with the SEC for the period that includes the date as of which the website information is current. The Trust’s policies with respect to the disclosure of portfolio holdings are subject to change without notice.
Credit Ratings
Bond ratings apply to the underlying holdings of a Portfolio and not the Portfolio itself and are divided into categories ranging from highest to lowest credit quality, determined for purposes of presentations in this report by using ratings provided by Moody’s Investors Service, Inc. (“Moody’s”).
Unless otherwise noted, presentations of credit ratings information in this report use ratings provided by Moody’s because of, among other reasons, the access to background information and other materials provided by Moody’s, as well as the Portfolios’ considerations of industry practice.
Bonds not rated by Moody’s or bonds that do not have a rating available are designated as “NR” and “NA”, respectively. Credit quality ratings assigned by a rating agency are subjective opinions, not statements of fact, and are subject to change periodically, even as frequently as daily. Ratings assigned by Moody’s or another rating agency are not absolute standards of credit quality and do not evaluate market risk. Rating agencies may fail to make timely changes in credit ratings, and an issuer’s current financial condition may be better or worse than a rating indicates. In formulating investment decisions for the applicable Portfolios the Investment Manager develops its own analysis of the credit quality and risks associated with individual debt instruments, rather than relying exclusively on rating agencies or third-party research.
All the information on the Portfolio Summary pages, including Portfolio Insights, Average Annual Total Return Tables, Cumulative Return Charts, Shareholder Expense Examples and Allocation/Credit Rating Summaries is unaudited.
Allianz Global Investors Distributors LLC, 1633 Broadway, New York, NY, 10019, us.allianzgi.com, 1-800-498-5413.
| 9 | Semiannual Report / March 31, 2019 |
March 31, 2019 (unaudited)
AllianzGI Advanced Core Bond Portfolio
Principal Amount (000s) | Value | |||||||||||
CORPORATE BONDS & NOTES - 57.5% | ||||||||||||
Aerospace & Defense - 1.3% | ||||||||||||
General Dynamics Corp., | ||||||||||||
3.375%, 5/15/23 | $ | 100 | $ | 102,864 | ||||||||
Northrop Grumman Corp., | ||||||||||||
2.08%, 10/15/20 | 750 | 743,337 | ||||||||||
United Technologies Corp., | ||||||||||||
1.90%, 5/4/20 | 350 | 347,414 | ||||||||||
3.35%, 8/16/21 | 200 | 202,887 | ||||||||||
4.15%, 5/15/45 | 50 | 49,361 | ||||||||||
|
1,445,863
|
| ||||||||||
Agriculture - 1.7% | ||||||||||||
Altria Group, Inc., | ||||||||||||
5.375%, 1/31/44 | 200 | 201,572 | ||||||||||
Cargill, Inc. (a)(b), | ||||||||||||
3.05%, 4/19/21 | 500 | 502,973 | ||||||||||
3.25%, 3/1/23 | 100 | 101,753 | ||||||||||
Philip Morris International, Inc., | ||||||||||||
2.00%, 2/21/20 | 800 | 794,911 | ||||||||||
2.375%, 8/17/22 | 200 | 197,742 | ||||||||||
|
1,798,951
|
| ||||||||||
Auto Manufacturers - 5.8% | ||||||||||||
American Honda Finance Corp., | ||||||||||||
1.95%, 7/20/20 | 500 | 495,240 | ||||||||||
2.00%, 2/14/20 | 800 | 795,895 | ||||||||||
2.60%, 11/16/22 | 100 | 99,823 | ||||||||||
BMW U.S. Capital LLC (a)(b), | ||||||||||||
3.45%, 4/12/23 | 350 | 357,009 | ||||||||||
Daimler Finance North America LLC (a)(b), | ||||||||||||
2.00%, 7/6/21 | 500 | 489,537 | ||||||||||
2.30%, 2/12/21 | 750 | 741,388 | ||||||||||
Ford Motor Credit Co. LLC, | ||||||||||||
2.681%, 1/9/20 | 350 | 348,527 | ||||||||||
General Motors Co., | ||||||||||||
5.15%, 4/1/38 | 200 | 183,863 | ||||||||||
General Motors Financial Co., Inc., | ||||||||||||
2.65%, 4/13/20 | 350 | 348,337 | ||||||||||
3.95%, 4/13/24 | 150 | 148,947 | ||||||||||
4.35%, 4/9/25 | 200 | 199,889 | ||||||||||
Harley-Davidson Financial Services, Inc., Ser. SR (a)(b), | ||||||||||||
3.55%, 5/21/21 | 350 | 350,595 | ||||||||||
Kia Motors Corp. (a)(b), | ||||||||||||
3.50%, 10/25/27 | 250 | 240,625 | ||||||||||
PACCAR Financial Corp., | ||||||||||||
1.65%, 8/11/21 | 500 | 487,542 | ||||||||||
2.30%, 8/10/22 | 250 | 247,036 | ||||||||||
Toyota Motor Credit Corp., | ||||||||||||
1.95%, 4/17/20 | 800 | 794,978 | ||||||||||
|
6,329,231
|
| ||||||||||
Banks - 23.8% | ||||||||||||
Banco Bilbao Vizcaya Argentaria S.A., | ||||||||||||
3.00%, 10/20/20 | 1,000 | 1,002,334 | ||||||||||
Bank of America Corp., | ||||||||||||
4.00%, 4/1/24 | 200 | 208,495 | ||||||||||
5.625%, 7/1/20 | 600 | 621,708 | ||||||||||
Bank of Montreal, | ||||||||||||
2.10%, 6/15/20 | 850 | 845,384 | ||||||||||
2.35%, 9/11/22 | 200 | 198,038 | ||||||||||
Bank of New York Mellon Corp., | ||||||||||||
2.60%, 2/7/22 | 800 | 800,200 | ||||||||||
Bank of Nova Scotia, | ||||||||||||
1.85%, 4/14/20 | 350 | 347,615 | ||||||||||
1.875%, 4/26/21 | 798 | 786,412 | ||||||||||
2.15%, 7/14/20 | 850 | 845,718 | ||||||||||
2.80%, 7/21/21 | 300 | 300,622 | ||||||||||
Barclays PLC, | ||||||||||||
2.75%, 11/8/19 | 850 | 848,575 | ||||||||||
4.375%, 1/12/26 | 350 | 353,018 | ||||||||||
| See accompanying Notes to Financial Statements | 10 | Semiannual Report / March 31, 2019 |
Schedule of Investments
March 31, 2019 (unaudited)
AllianzGI Advanced Core Bond Portfolio
Principal Amount (000s) | Value | |||||||||||
4.95%, 1/10/47 | 300 | 301,866 | ||||||||||
BNG Bank NV (a)(b), | ||||||||||||
1.625%, 4/19/21 | 800 | 787,188 | ||||||||||
2.375%, 3/16/26 | 500 | 495,232 | ||||||||||
3.125%, 11/8/21 | 600 | 611,181 | ||||||||||
BNZ International Funding Ltd. (a)(b), | ||||||||||||
3.375%, 3/1/23 | 300 | 303,062 | ||||||||||
Citigroup, Inc., | ||||||||||||
4.50%, 1/14/22 | 300 | 313,058 | ||||||||||
4.65%, 7/30/45 | 100 | 106,669 | ||||||||||
8.125%, 7/15/39 | 300 | 451,706 | ||||||||||
Commonwealth Bank of Australia (a)(b), | ||||||||||||
2.85%, 5/18/26 | 500 | 487,400 | ||||||||||
Deutsche Bank AG, | ||||||||||||
2.85%, 5/10/19 | 850 | 849,874 | ||||||||||
3.375%, 5/12/21 | 400 | 394,412 | ||||||||||
Dexia Credit Local S.A. (a)(b), | ||||||||||||
3.25%, 9/26/23 | 250 | 257,090 | ||||||||||
Fifth Third Bancorp, | ||||||||||||
2.60%, 6/15/22 | 200 | 198,965 | ||||||||||
Goldman Sachs Group, Inc., Ser. D, | ||||||||||||
6.00%, 6/15/20 | 400 | 415,102 | ||||||||||
ING Bank NV (a)(b), | ||||||||||||
2.625%, 12/5/22 | 750 | 749,345 | ||||||||||
ING Groep NV, | ||||||||||||
4.10%, 10/2/23 | 250 | 257,278 | ||||||||||
JPMorgan Chase & Co., | ||||||||||||
3.625%, 5/13/24 | 200 | 205,686 | ||||||||||
4.40%, 7/22/20 | 800 | 819,425 | ||||||||||
Landwirtschaftliche Rentenbank, | ||||||||||||
2.50%, 11/15/27, Ser. 37 | 400 | 399,112 | ||||||||||
3.125%, 11/14/23 | 600 | 619,755 | ||||||||||
Lloyds Banking Group PLC, | ||||||||||||
4.05%, 8/16/23 | 200 | 204,183 | ||||||||||
Macquarie Bank Ltd. (a)(b), | ||||||||||||
3.90%, 1/15/26 | 500 | 512,279 | ||||||||||
Morgan Stanley, | ||||||||||||
2.50%, 4/21/21 | 500 | 497,387 | ||||||||||
2.80%, 6/16/20 | 850 | 851,159 | ||||||||||
4.375%, 1/22/47 | 100 | 103,402 | ||||||||||
National Australia Bank Ltd., | ||||||||||||
2.625%, 1/14/21 | 200 | 199,406 | ||||||||||
Oesterreichische Kontrollbank AG, | ||||||||||||
1.75%, 1/24/20 | 800 | 795,740 | ||||||||||
Royal Bank of Canada, | ||||||||||||
1.875%, 2/5/20 | 196 | 194,771 | ||||||||||
2.125%, 3/2/20 | 450 | 447,936 | ||||||||||
2.30%, 3/22/21 | 700 | 696,090 | ||||||||||
3.35%, 10/22/21 (a)(b) | 350 | 356,640 | ||||||||||
Royal Bank of Scotland Group PLC, | ||||||||||||
3.875%, 9/12/23 | 300 | 301,764 | ||||||||||
Santander UK PLC, | ||||||||||||
4.00%, 3/13/24 | 400 | 417,057 | ||||||||||
State Street Corp., | ||||||||||||
2.55%, 8/18/20 | 850 | 848,869 | ||||||||||
Toronto-Dominion Bank, | ||||||||||||
1.80%, 7/13/21 | 400 | 392,544 | ||||||||||
2.25%, 3/15/21 (a)(b) | 750 | 744,587 | ||||||||||
Wells Fargo & Co., | ||||||||||||
2.50%, 3/4/21 | 600 | 597,097 | ||||||||||
Ser. M, 3.45%, 2/13/23 | 100 | 101,028 | ||||||||||
Wells Fargo Bank N.A., | ||||||||||||
3.625%, 10/22/21 | 250 | 254,892 | ||||||||||
Westpac Banking Corp., | ||||||||||||
2.00%, 3/3/20 | 350 | 348,010 | ||||||||||
2.85%, 5/13/26 | 800 | 777,630 | ||||||||||
|
25,823,996
|
| ||||||||||
Biotechnology - 0.1% | ||||||||||||
Amgen, Inc., | ||||||||||||
2.25%, 8/19/23 |
| 100
|
|
| 97,603
|
| ||||||
| See accompanying Notes to Financial Statements | 11 | Semiannual Report / March 31, 2019 |
Schedule of Investments
March 31, 2019 (unaudited)
AllianzGI Advanced Core Bond Portfolio
Principal Amount (000s) | Value | |||||||||||
Building Materials - 0.3% | ||||||||||||
CRH America Finance, Inc. (a)(b), | ||||||||||||
3.95%, 4/4/28 |
| 350
|
|
| 344,802
|
| ||||||
Chemicals - 0.8% | ||||||||||||
Dow Chemical Co., | ||||||||||||
7.375%, 11/1/29 | 300 | 380,494 | ||||||||||
Nutrien Ltd., | ||||||||||||
4.00%, 12/15/26 | 300 | 303,841 | ||||||||||
Syngenta Finance NV (a)(b), | ||||||||||||
3.933%, 4/23/21 | 200 | 201,292 | ||||||||||
|
885,627
|
| ||||||||||
Commercial Services - 0.2% | ||||||||||||
Ecolab, Inc., | ||||||||||||
2.375%, 8/10/22 | 250 |
| 246,964
|
| ||||||||
Consumer Products - 0.9% | ||||||||||||
Colgate-Palmolive Co., | ||||||||||||
3.70%, 8/1/47 | 100 | 103,031 | ||||||||||
Procter & Gamble Co., | ||||||||||||
1.90%, 10/23/20 | 300 | 298,167 | ||||||||||
3.50%, 10/25/47 | 100 | 100,637 | ||||||||||
Unilever Capital Corp., | ||||||||||||
1.80%, 5/5/20 | 450 | 446,308 | ||||||||||
|
948,143
|
| ||||||||||
Electric Utilities - 1.8% | ||||||||||||
Consolidated Edison Co. of New York, Inc., | ||||||||||||
Ser. 12-A, 4.20%, 3/15/42 | 200 | 205,104 | ||||||||||
4.50%, 5/15/58 | 150 | 156,674 | ||||||||||
Electricite de France S.A. (a)(b), | ||||||||||||
4.875%, 1/22/44 | 100 | 101,750 | ||||||||||
Enel Finance International NV, | ||||||||||||
6.80%, 9/15/37 | 150 | 180,552 | ||||||||||
Florida Power & Light Co., | ||||||||||||
3.70%, 12/1/47 | 200 | 200,765 | ||||||||||
3.95%, 3/1/48 | 100 | 104,570 | ||||||||||
Georgia Power Co., Ser. C, | ||||||||||||
2.00%, 9/8/20 | 500 | 495,400 | ||||||||||
PPL Electric Utilities Corp., | ||||||||||||
4.15%, 6/15/48 | 150 | 158,220 | ||||||||||
State Grid Overseas Investment 2016 Ltd. (a)(b), | ||||||||||||
3.75%, 5/2/23 | 350 | 359,427 | ||||||||||
|
1,962,462
|
| ||||||||||
Electronics - 0.3% | ||||||||||||
Tyco Electronics Group S.A., | ||||||||||||
3.45%, 8/1/24 |
| 300
|
|
| 304,019
|
| ||||||
Food & Beverage - 2.8% | ||||||||||||
Anheuser-Busch Cos. LLC (a)(b), | ||||||||||||
4.90%, 2/1/46 | 150 | 151,366 | ||||||||||
Diageo Capital PLC, | ||||||||||||
3.00%, 5/18/20 | 350 | 351,273 | ||||||||||
3.875%, 4/29/43 | 150 | 153,108 | ||||||||||
General Mills, Inc., | ||||||||||||
2.60%, 10/12/22 | 150 | 148,399 | ||||||||||
Kellogg Co., | ||||||||||||
3.25%, 5/14/21 | 350 | 353,080 | ||||||||||
3.40%, 11/15/27 | 250 | 240,967 | ||||||||||
Keurig Dr. Pepper, Inc., | ||||||||||||
4.42%, 12/15/46 | 200 | 183,259 | ||||||||||
Kraft Heinz Foods Co., | ||||||||||||
4.00%, 6/15/23 | 150 | 154,522 | ||||||||||
5.375%, 2/10/20 | 400 | 408,471 | ||||||||||
Kroger Co., | ||||||||||||
3.70%, 8/1/27 | 100 | 98,382 | ||||||||||
4.65%, 1/15/48 | 200 | 187,383 | ||||||||||
Nestle Holdings, Inc. (a)(b), | ||||||||||||
3.50%, 9/24/25 | 250 | 259,635 | ||||||||||
| See accompanying Notes to Financial Statements | 12 | Semiannual Report / March 31, 2019 |
Schedule of Investments
March 31, 2019 (unaudited)
AllianzGI Advanced Core Bond Portfolio
Principal Amount (000s) | Value | |||||||||||
PepsiCo, Inc., | ||||||||||||
2.15%, 10/14/20 | 300 | 299,042 | ||||||||||
|
2,988,887
|
| ||||||||||
Healthcare-Products - 0.0% | ||||||||||||
Thermo Fisher Scientific, Inc., | ||||||||||||
4.10%, 8/15/47 |
| 50
|
|
| 49,777
|
| ||||||
Insurance - 0.9% | ||||||||||||
Allstate Corp., | ||||||||||||
3.28%, 12/15/26 | 200 | 202,356 | ||||||||||
MetLife, Inc., | ||||||||||||
5.70%, 6/15/35 | 550 | 661,576 | ||||||||||
Prudential Financial, Inc., | ||||||||||||
4.35%, 2/25/50 | 100 | 103,819 | ||||||||||
|
967,751
|
| ||||||||||
Internet - 0.3% | ||||||||||||
Alphabet, Inc., | ||||||||||||
3.375%, 2/25/24 |
| 300
|
|
| 312,138
|
| ||||||
Iron/Steel - 0.1% | ||||||||||||
Nucor Corp., | ||||||||||||
4.40%, 5/1/48 |
| 150
|
|
| 154,526
|
| ||||||
IT Services - 0.3% | ||||||||||||
International Business Machines Corp., | ||||||||||||
1.90%, 1/27/20 |
| 350
|
|
| 347,896
|
| ||||||
Machinery-Construction & Mining - 0.2% | ||||||||||||
Caterpillar Financial Services Corp., | ||||||||||||
3.15%, 9/7/21 |
| 250
|
|
| 252,974
|
| ||||||
Machinery-Diversified - 1.0% | ||||||||||||
CNH Industrial Capital LLC, | ||||||||||||
4.875%, 4/1/21 |
| 150
|
|
| 154,290
|
| ||||||
John Deere Capital Corp., | ||||||||||||
1.95%, 6/22/20 | 650 | 644,686 | ||||||||||
2.65%, 6/24/24 | 250 | 248,074 | ||||||||||
|
1,047,050
|
| ||||||||||
Media - 1.3% | ||||||||||||
CBS Corp., | ||||||||||||
3.70%, 6/1/28 | 300 | 293,135 | ||||||||||
Comcast Corp., | ||||||||||||
6.45%, 3/15/37 | 200 | 254,495 | ||||||||||
Discovery Communications LLC, | ||||||||||||
3.80%, 3/13/24 | 500 | 508,987 | ||||||||||
6.35%, 6/1/40 | 50 | 55,060 | ||||||||||
Time Warner Cable LLC, | ||||||||||||
6.75%, 6/15/39 | 300 | 335,376 | ||||||||||
|
1,447,053
|
| ||||||||||
Mining - 0.4% | ||||||||||||
Glencore Funding LLC (a)(b), | ||||||||||||
3.00%, 10/27/22 |
| 450
|
|
| 444,670
|
| ||||||
Miscellaneous Manufacturing - 0.9% | ||||||||||||
3M Co., | ||||||||||||
3.25%, 2/14/24 | 200 | 206,044 | ||||||||||
General Electric Co., | ||||||||||||
5.50%, 1/8/20 | 400 | 407,797 | ||||||||||
Siemens Financieringsmaatschappij NV (a)(b), | ||||||||||||
4.40%, 5/27/45 | 300 | 325,302 | ||||||||||
|
939,143
|
| ||||||||||
Oil, Gas & Consumable Fuels - 3.6% | ||||||||||||
BP Capital Markets PLC, | ||||||||||||
2.315%, 2/13/20 | 600 | 597,499 | ||||||||||
3.723%, 11/28/28 | 100 | 103,385 | ||||||||||
| See accompanying Notes to Financial Statements | 13 | Semiannual Report / March 31, 2019 |
Schedule of Investments
March 31, 2019 (unaudited)
AllianzGI Advanced Core Bond Portfolio
Principal Amount (000s) | Value | |||||||||||
CNOOC Nexen Finance 2014 ULC, | ||||||||||||
4.25%, 4/30/24 | 300 | 313,860 | ||||||||||
Equinor ASA, | ||||||||||||
2.65%, 1/15/24 | 400 | 399,016 | ||||||||||
2.90%, 11/8/20 | 400 | 402,487 | ||||||||||
KazMunayGas National Co. JSC (a)(b), | ||||||||||||
4.75%, 4/24/25 | 200 | 207,038 | ||||||||||
Occidental Petroleum Corp., | ||||||||||||
3.00%, 2/15/27 | 300 | 299,395 | ||||||||||
Phillips 66, | ||||||||||||
4.875%, 11/15/44 | 200 | 220,106 | ||||||||||
Shell International Finance BV, | ||||||||||||
2.125%, 5/11/20 | 850 | 845,453 | ||||||||||
3.75%, 9/12/46 | 50 | 50,364 | ||||||||||
6.375%, 12/15/38 | 150 | 204,247 | ||||||||||
Total Capital International S.A., | ||||||||||||
3.455%, 2/19/29 | 200 | 204,888 | ||||||||||
| 3,847,738 |
| ||||||||||
Paper & Forest Products - 0.1% | ||||||||||||
International Paper Co., | ||||||||||||
4.35%, 8/15/48 |
| 150
|
|
| 140,598
|
| ||||||
Pharmaceuticals - 2.6% | ||||||||||||
Bayer U.S. Finance II LLC (a)(b), | ||||||||||||
3.50%, 6/25/21 | 800 | 806,788 | ||||||||||
CVS Health Corp., | ||||||||||||
4.10%, 3/25/25 | 250 | 256,707 | ||||||||||
Johnson & Johnson, | ||||||||||||
1.95%, 11/10/20 | 300 | 297,838 | ||||||||||
4.375%, 12/5/33 | 250 | 281,299 | ||||||||||
Merck & Co., Inc., | ||||||||||||
3.40%, 3/7/29 | 100 | 102,706 | ||||||||||
Novartis Capital Corp., | ||||||||||||
1.80%, 2/14/20 | 600 | 596,003 | ||||||||||
Pfizer, Inc., | ||||||||||||
3.60%, 9/15/28 | 250 | 260,702 | ||||||||||
4.00%, 3/15/49 | 200 | 207,114 | ||||||||||
| 2,809,157 |
| ||||||||||
Pipelines - 0.6% | ||||||||||||
Energy Transfer Partners L.P., Ser. 30Y, | ||||||||||||
6.00%, 6/15/48 | 150 | 162,661 | ||||||||||
Enterprise Products Operating LLC, | ||||||||||||
4.85%, 3/15/44 | 100 | 106,468 | ||||||||||
Kinder Morgan, Inc., | ||||||||||||
3.15%, 1/15/23 | 350 | 351,281 | ||||||||||
| 620,410 |
| ||||||||||
Retail - 1.1% | ||||||||||||
Macy’s Retail Holdings, Inc., | ||||||||||||
4.50%, 12/15/34 | 200 | 173,886 | ||||||||||
Walgreens Boots Alliance, Inc., | ||||||||||||
4.50%, 11/18/34 | 250 | 248,286 | ||||||||||
Walmart, Inc., | ||||||||||||
3.125%, 6/23/21 | 800 | 811,950 | ||||||||||
| 1,234,122 |
| ||||||||||
Software - 0.7% | ||||||||||||
Oracle Corp., | ||||||||||||
2.625%, 2/15/23 |
| 750
|
|
| 749,207
|
| ||||||
Technology Hardware, Storage & Peripherals - 0.7% | ||||||||||||
Apple, Inc., | ||||||||||||
2.25%, 2/23/21 | 500 | 498,014 | ||||||||||
4.65%, 2/23/46 | 200 | 226,607 | ||||||||||
| 724,621 |
| ||||||||||
Telecommunications - 1.8% | ||||||||||||
AT&T, Inc., | ||||||||||||
4.80%, 6/15/44 | 300 | 293,900 | ||||||||||
| See accompanying Notes to Financial Statements | 14 | Semiannual Report / March 31, 2019 |
Schedule of Investments
March 31, 2019 (unaudited)
AllianzGI Advanced Core Bond Portfolio
Principal Amount (000s) | Value | |||||||||||
Cisco Systems, Inc., | ||||||||||||
2.45%, 6/15/20 | 700 | 699,211 | ||||||||||
5.50%, 1/15/40 | 250 | 319,285 | ||||||||||
Deutsche Telekom International Finance BV (a)(b), | ||||||||||||
4.75%, 6/21/38 | 150 | 154,162 | ||||||||||
Verizon Communications, Inc., | ||||||||||||
5.25%, 3/16/37 | 300 | 338,907 | ||||||||||
5.50%, 3/16/47 | 100 | 116,604 | ||||||||||
| 1,922,069 |
| ||||||||||
Transportation - 1.1% | ||||||||||||
CSX Corp., | ||||||||||||
2.60%, 11/1/26 | 150 | 142,610 | ||||||||||
FedEx Corp., | ||||||||||||
3.40%, 2/15/28 | 150 | 148,620 | ||||||||||
4.10%, 4/15/43 | 150 | 136,979 | ||||||||||
United Parcel Service, Inc., | ||||||||||||
2.05%, 4/1/21 | 750 | 745,228 | ||||||||||
| 1,173,437 |
| ||||||||||
Total Corporate Bonds & Notes (cost-$62,232,723) |
| 62,360,885 |
| |||||||||
U.S. GOVERNMENT AGENCY SECURITIES - 28.0% | ||||||||||||
Fannie Mae, | ||||||||||||
2.50%, 4/15/34 MBS, TBA, 15 Year (c) | 1,140 | 1,133,417 | ||||||||||
3.00%, 4/15/34 MBS, TBA, 15 Year (c) | 860 | 867,907 | ||||||||||
3.00%, 4/10/49 MBS, TBA, 30 Year (c) | 2,390 | 2,380,290 | ||||||||||
3.50%, 4/10/49 MBS, TBA, 30 Year (c) | 3,690 | 3,741,458 | ||||||||||
4.00%, 4/10/49 MBS, TBA, 30 Year (c) | 3,300 | 3,394,875 | ||||||||||
4.50%, 4/10/49 MBS, TBA, 30 Year (c) | 1,280 | 1,333,869 | ||||||||||
5.00%, 4/10/49 MBS, TBA, 30 Year (c) | 310 | 327,819 | ||||||||||
6.625%, 11/15/30 | 100 | 136,931 | ||||||||||
Freddie Mac, | ||||||||||||
2.50%, 4/15/34 MBS, TBA, 15 Year (c) | 870 | 865,582 | ||||||||||
3.00%, 4/15/34 MBS, TBA, 15 Year (c) | 440 | 444,310 | ||||||||||
3.00%, 4/10/49 MBS, TBA, 30 Year (c) | 1,630 | 1,623,610 | ||||||||||
3.50%, 4/10/49 MBS, TBA, 30 Year (c) | 2,690 | 2,729,089 | ||||||||||
4.00%, 8/1/44 | 111 | 114,785 | ||||||||||
4.00%, 4/10/49 MBS, TBA, 30 Year (c) | 2,080 | 2,141,547 | ||||||||||
4.50%, 4/10/49 MBS, TBA, 30 Year (c) | 570 | 594,982 | ||||||||||
6.25%, 7/15/32 | 100 | 138,306 | ||||||||||
Ginnie Mae, MBS, TBA, 30 Year (c), | ||||||||||||
3.00%, 4/17/49 | 2,790 | 2,803,623 | ||||||||||
3.50%, 4/17/49 | 4,010 | 4,098,658 | ||||||||||
4.00%, 4/17/49 | 1,380 | 1,425,443 | ||||||||||
Total U.S. Government Agency Securities (cost-$29,884,785) |
| 30,296,501 |
| |||||||||
U.S. TREASURY OBLIGATIONS - 25.7% | ||||||||||||
U.S. Treasury Bonds, | ||||||||||||
2.25%, 8/15/46 | 1,000 | 894,219 | ||||||||||
2.50%, 2/15/45 | 920 | 870,119 | ||||||||||
2.75%, 8/15/47 | 1,200 | 1,186,500 | ||||||||||
3.125%, 2/15/42 | 855 | 910,709 | ||||||||||
3.125%, 2/15/43 | 800 | 849,500 | ||||||||||
3.375%, 11/15/48 | 1,000 | 1,116,094 | ||||||||||
3.50%, 2/15/39 | 50 | 56,781 | ||||||||||
4.75%, 2/15/37 | 200 | 262,891 | ||||||||||
4.75%, 2/15/41 | 400 | 536,125 | ||||||||||
5.50%, 8/15/28 | 700 | 881,727 | ||||||||||
6.00%, 2/15/26 | 1,100 | 1,356,008 | ||||||||||
6.25%, 5/15/30 | 500 | 685,508 | ||||||||||
U.S. Treasury Notes, | ||||||||||||
1.50%, 8/15/26 | 200 | 188,766 | ||||||||||
1.625%, 5/15/26 | 350 | 334,113 | ||||||||||
1.75%, 10/31/20 | 5,580 | 5,528,995 | ||||||||||
1.75%, 1/31/23 | 1,860 | 1,827,740 | ||||||||||
1.875%, 10/31/22 | 500 | 494,023 | ||||||||||
2.00%, 11/15/26 | 300 | 292,945 | ||||||||||
2.125%, 6/30/22 | 300 | 299,133 | ||||||||||
| See accompanying Notes to Financial Statements | 15 | Semiannual Report / March 31, 2019 |
Schedule of Investments
March 31, 2019 (unaudited)
AllianzGI Advanced Core Bond Portfolio
Principal Amount (000s) | Value | |||||||||||
2.125%, 3/31/24 | 100 | 99,492 | ||||||||||
2.125%, 9/30/24 | 2,300 | 2,283,648 | ||||||||||
2.125%, 5/15/25 | 2,400 | 2,376,563 | ||||||||||
2.25%, 11/15/27 | 900 | �� | 891,422 | |||||||||
2.50%, 1/15/22 | 1,500 | 1,510,664 | ||||||||||
2.625%, 12/31/23 | 1,500 | 1,526,484 | ||||||||||
2.875%, 5/15/28 | 550 | 571,914 | ||||||||||
Total U.S. Treasury Obligations (cost-$27,484,201) |
| 27,832,083 |
| |||||||||
SOVEREIGN DEBT OBLIGATIONS - 13.7% | ||||||||||||
Argentina - 0.5% | ||||||||||||
Argentine Republic Government International Bond, | ||||||||||||
4.625%, 1/11/23 | 300 | 247,064 | ||||||||||
6.25%, 4/22/19 | 250 | 250,277 | ||||||||||
| 497,341 |
| ||||||||||
Brazil - 0.3% | ||||||||||||
Brazilian Government International Bond, | ||||||||||||
4.25%, 1/7/25 |
| 300
|
|
| 305,824
|
| ||||||
Canada - 1.7% | ||||||||||||
Export Development Canada, | ||||||||||||
2.50%, 1/24/23 | 700 | 704,528 | ||||||||||
Province of Alberta Canada, | ||||||||||||
1.90%, 12/6/19 | 350 | 348,386 | ||||||||||
3.30%, 3/15/28 | 300 | 311,866 | ||||||||||
Province of Quebec Canada, | ||||||||||||
2.875%, 10/16/24 | 500 | 508,383 | ||||||||||
| 1,873,163 |
| ||||||||||
Chile - 0.6% | ||||||||||||
Chile Government International Bond, | ||||||||||||
3.25%, 9/14/21 | 400 | 407,157 | ||||||||||
3.86%, 6/21/47 | 200 | 203,990 | ||||||||||
| 611,147 |
| ||||||||||
Colombia - 0.3% | ||||||||||||
Colombia Government International Bond, | ||||||||||||
5.00%, 6/15/45 |
| 300
|
|
| 315,666
|
| ||||||
Croatia - 0.5% | ||||||||||||
Croatia Government International Bond, | ||||||||||||
6.75%, 11/5/19 |
| 500
|
|
| 510,920
|
| ||||||
Germany - 0.2% | ||||||||||||
FMS Wertmanagement AoeR, | ||||||||||||
1.75%, 1/24/20 |
| 200
|
|
| 198,931
|
| ||||||
Indonesia - 0.3% | ||||||||||||
Indonesia Government International Bond, | ||||||||||||
3.75%, 4/25/22 |
| 350
|
|
| 355,245
|
| ||||||
Japan - 0.5% | ||||||||||||
Japan Bank for International Cooperation, | ||||||||||||
2.125%, 7/21/20 |
| 500
|
|
| 497,783
|
| ||||||
Korea (Republic of) - 0.6% | ||||||||||||
Export-Import Bank of Korea, | ||||||||||||
2.50%, 11/1/20 | 400 | 398,938 | ||||||||||
3.625%, 11/27/23 | 300 | 309,201 | ||||||||||
| 708,139 |
| ||||||||||
Latvia - 0.6% | ||||||||||||
Latvia Government International Bond, | ||||||||||||
2.75%, 1/12/20 |
| 700
|
|
| 700,032
|
| ||||||
Lithuania - 0.5% | ||||||||||||
Lithuania Government International Bond (a)(b), | ||||||||||||
7.375%, 2/11/20 |
| 500
|
|
| 519,413
|
| ||||||
| See accompanying Notes to Financial Statements | 16 | Semiannual Report / March 31, 2019 |
Schedule of Investments
March 31, 2019 (unaudited)
AllianzGI Advanced Core Bond Portfolio
Principal Amount (000s) | Value | |||||||||||
Mexico - 0.2% | ||||||||||||
Mexico Government International Bond, | ||||||||||||
4.60%, 2/10/48 |
| 250
|
|
| 241,227
|
| ||||||
Morocco - 0.2% | ||||||||||||
Morocco Government International Bond, | ||||||||||||
4.25%, 12/11/22 |
| 200
|
|
| 204,612
|
| ||||||
Norway - 0.5% | ||||||||||||
Kommunalbanken AS (a)(b), | ||||||||||||
3.125%, 10/18/21 |
| 500
|
|
| 509,383
|
| ||||||
Panama - 0.1% | ||||||||||||
Panama Government International Bond, | ||||||||||||
7.125%, 1/29/26 |
| 100
|
|
| 122,302
|
| ||||||
Peru - 0.1% | ||||||||||||
Peruvian Government International Bond, | ||||||||||||
4.125%, 8/25/27 |
| 100
|
|
| 109,315
|
| ||||||
Philippines - 0.3% | ||||||||||||
Philippine Government International Bond, | ||||||||||||
6.50%, 1/20/20 |
| 300
|
|
| 309,300
|
| ||||||
Sri Lanka - 0.3% | ||||||||||||
Sri Lanka Government International Bond (a)(b), | ||||||||||||
5.75%, 4/18/23 |
| 350
|
|
| 345,762
|
| ||||||
Supranational - 3.0% | ||||||||||||
Asian Development Bank, | ||||||||||||
1.625%, 3/16/21 | 700 | 690,315 | ||||||||||
3.125%, 9/26/28 | 300 | 315,132 | ||||||||||
Corp. Andina de Fomento, | ||||||||||||
2.20%, 7/18/20 | 850 | 842,894 | ||||||||||
European Investment Bank, | ||||||||||||
4.875%, 2/15/36 | 250 | 316,613 | ||||||||||
Inter-American Development Bank, | ||||||||||||
3.125%, 9/18/28 | 300 | 315,264 | ||||||||||
Nordic Investment Bank, | ||||||||||||
2.25%, 2/1/21 | 800 | 798,312 | ||||||||||
| 3,278,530 |
| ||||||||||
Sweden - 2.4% | ||||||||||||
Kommuninvest I Sverige AB (a)(b), | ||||||||||||
2.75%, 10/22/20 | 800 | 803,649 | ||||||||||
Svensk Exportkredit AB, | ||||||||||||
1.75%, 5/18/20 | 350 | 347,406 | ||||||||||
2.875%, 5/22/21 | 800 | 807,353 | ||||||||||
3.125%, 11/8/21 | 600 | 611,170 | ||||||||||
| 2,569,578 |
| ||||||||||
Uruguay - 0.0% | ||||||||||||
Uruguay Government International Bond, | ||||||||||||
4.975%, 4/20/55 | 50 | 52,500 | ||||||||||
Total Sovereign Debt Obligations (cost-$14,761,035) |
| 14,836,113 |
| |||||||||
Repurchase Agreements - 1.8% | ||||||||||||
State Street Bank and Trust Co., | 1,899 |
| 1,899,000
|
| ||||||||
Total Investments(cost-$136,261,744)-126.7% | 137,224,582 | |||||||||||
Liabilities in excess of other assets (d)-(26.7)% |
|
(28,876,792 |
) | |||||||||
Net Assets-100.0% | $ | 108,347,790 | ||||||||||
| See accompanying Notes to Financial Statements | 17 | Semiannual Report / March 31, 2019 |
Schedule of Investments
March 31, 2019 (unaudited)
AllianzGI Advanced Core Bond Portfolio
Notes to Schedule of Investments:
| (a) | Private Placement—Restricted as to resale and may not have a readily available market. Securities with an aggregate value of $13,622,323, representing 12.6% of net assets. |
| (b) | 144A—Exempt from registration under Rule 144A of the Securities Act of 1933. These securities may be resold in transactions exempt from registration, typically only to qualified institutional buyers. Securities with an aggregate value of $13,622,323, representing 12.6% of net assets. |
| (c) | When-issued or delayed-delivery. To be settled/delivered after March 31, 2019. |
| (d) | Includes net unrealized appreciation (depreciation) of other financial instruments as follows: |
Futures contracts outstanding at March 31, 2019: |
| Type | Contracts | Expiration Date | Notional Amount (000s) | Market (000s) | Unrealized Depreciation | |||||||||||||||
Short position contracts: | ||||||||||||||||||||
2-Year U.S. Treasury Note | (109) | 6/28/19 | $ (21,800) | $ | (23,227 | ) | $ (73,268) | |||||||||||||
| (e) | At March 31, 2019, the Portfolio pledged $359,545 in cash as collateral for futures contracts and held $410,000 in cash as collateral for TBA securities. |
Glossary:
MBS - Mortgage-Backed Securities
TBA - To Be Announced
| See accompanying Notes to Financial Statements | 18 | Semiannual Report / March 31, 2019 |
Schedule of Investments
March 31, 2019 (unaudited)
AllianzGI Best Styles Global Managed Volatility Portfolio
| Shares | Value | |||||||||||||
COMMON STOCK - 97.6% | ||||||||||||||
Australia - 0.8% | ||||||||||||||
Brickworks Ltd. | 7,935 | $ | 97,738 | |||||||||||
Regis Resources Ltd. | 29,208 | 109,906 | ||||||||||||
Saracen Mineral Holdings Ltd. (e) | 47,419 | 97,663 | ||||||||||||
St. Barbara Ltd. | 28,085 | 67,204 | ||||||||||||
| 372,511 |
| ||||||||||||
Austria - 0.1% | ||||||||||||||
Flughafen Wien AG | 961 | 41,611 | ||||||||||||
Telekom Austria AG | 3,219 | 23,416 | ||||||||||||
| 65,027 |
| ||||||||||||
Belgium - 0.3% | ||||||||||||||
Ageas | 1,836 | 88,562 | ||||||||||||
Elia System Operator S.A. | 999 | 70,051 | ||||||||||||
| 158,613 |
| ||||||||||||
Brazil - 0.0% | ||||||||||||||
Suzano Papel e Celulose S.A. | 1,661 |
| 19,744
|
| ||||||||||
Canada - 1.0% | ||||||||||||||
Cascades, Inc. | 673 | 4,200 | ||||||||||||
Cogeco Communications, Inc. | 1,783 | 113,863 | ||||||||||||
Dream Global Real Estate Investment Trust REIT | 5,020 | 53,230 | ||||||||||||
Fairfax Financial Holdings Ltd. | 296 | 137,108 | ||||||||||||
George Weston Ltd. | 1,126 | 80,965 | ||||||||||||
InterRent Real Estate Investment Trust REIT | 4,129 | 44,925 | ||||||||||||
Killam Apartment Real Estate Investment Trust REIT | 2,174 | 31,560 | ||||||||||||
Valener, Inc. | 682 | 13,346 | ||||||||||||
| 479,197 |
| ||||||||||||
Chile - 0.2% | ||||||||||||||
Empresas CMPC S.A. |
| 20,000
|
|
| 70,536
|
| ||||||||
China - 2.5% | ||||||||||||||
BOC Aviation Ltd. (a) | 15,500 | 126,513 | ||||||||||||
China Construction Bank Corp., Class H | 186,748 | 160,299 | ||||||||||||
China Dongxiang Group Co., Ltd. | 68,883 | 10,014 | ||||||||||||
China Everbright Greentech Ltd. (a) | 66,000 | 52,469 | ||||||||||||
China Mobile Ltd. | 9,000 | 91,839 | ||||||||||||
China SCE Group Holdings Ltd. | 198,000 | 103,359 | ||||||||||||
China Water Affairs Group Ltd. | 30,000 | 31,367 | ||||||||||||
Golden Eagle Retail Group Ltd. | 20,000 | 23,695 | ||||||||||||
Guangdong Investment Ltd. | 28,000 | 54,063 | ||||||||||||
Hopewell Highway Infrastructure Ltd. | 41,000 | 22,099 | ||||||||||||
Jiangsu Expressway Co., Ltd., Class H | 16,811 | 23,787 | ||||||||||||
Postal Savings Bank of China Co., Ltd., Class H (a) | 143,000 | 81,878 | ||||||||||||
Shenzhen Expressway Co., Ltd., Class H | 86,300 | 101,228 | ||||||||||||
Tencent Holdings Ltd. | 3,600 | 165,556 | ||||||||||||
XTEP International Holdings Ltd. | 23,349 | 16,703 | ||||||||||||
Yadea Group Holdings Ltd. (a) | 58,000 | 20,557 | ||||||||||||
Yuexiu Real Estate Investment Trust REIT | 59,000 | 41,946 | ||||||||||||
Yuexiu Transport Infrastructure Ltd. | 80,000 | 65,151 | ||||||||||||
Yuzhou Properties Co., Ltd. | 63,204 | 38,235 | ||||||||||||
| 1,230,758 |
| ||||||||||||
Czech Republic - 0.4% | ||||||||||||||
CEZ AS | 4,782 | 112,377 | ||||||||||||
Moneta Money Bank AS (a) | 14,893 | 51,416 | ||||||||||||
O2 Czech Republic AS | 4,201 | 45,549 | ||||||||||||
| 209,342 |
| ||||||||||||
Denmark - 0.2% | ||||||||||||||
Scandinavian Tobacco Group A/S, Class A (a) | 884 | 11,024 | ||||||||||||
Solar A/S, Class B | 333 | 14,210 | ||||||||||||
Spar Nord Bank A/S | 733 | 6,426 | ||||||||||||
Topdanmark A/S | 787 | 39,319 | ||||||||||||
| 70,979 |
| ||||||||||||
| See accompanying Notes to Financial Statements | 19 | Semiannual Report / March 31, 2019 |
Schedule of Investments
March 31, 2019 (unaudited)
AllianzGI Best Styles Global Managed Volatility Portfolio
| Shares | Value | |||||||||||||
Finland - 0.7% | ||||||||||||||
DNA Oyj | 2,567 | 53,213 | ||||||||||||
Elisa Oyj | 2,397 | 108,145 | ||||||||||||
Neste Oyj | 1,688 | 179,942 | ||||||||||||
| 341,300 |
| ||||||||||||
France - 1.2% | ||||||||||||||
Cegereal S.A. REIT | 1,987 | 91,386 | ||||||||||||
Eiffage S.A. | 1,216 | 116,892 | ||||||||||||
Klepierre S.A. REIT | 3,964 | 138,696 | ||||||||||||
Nexity S.A. | 633 | 30,896 | ||||||||||||
Orpea | 50 | 6,004 | ||||||||||||
SEB S.A. | 36 | 6,061 | ||||||||||||
Vinci S.A. | 1,913 | 186,138 | ||||||||||||
| 576,073 |
| ||||||||||||
Germany - 0.9% | ||||||||||||||
BASF SE | 1,243 | 91,667 | ||||||||||||
Siemens Healthineers AG (a) | 1,205 | 50,309 | ||||||||||||
TAG Immobilien AG | 4,536 | 112,030 | ||||||||||||
Talanx AG (e) | 2,265 | 87,417 | ||||||||||||
TLG Immobilien AG | 1,775 | 53,441 | ||||||||||||
WCM Beteiligungs & Grundbesitz AG (e) | 5,562 | 29,137 | ||||||||||||
| 424,001 |
| ||||||||||||
Hong Kong - 1.8% | ||||||||||||||
CK Hutchison Holdings Ltd. | 8,203 | 86,257 | ||||||||||||
CLP Holdings Ltd. | 42,219 | 489,681 | ||||||||||||
Fairwood Holdings Ltd. | 11,000 | 38,758 | ||||||||||||
Hang Seng Bank Ltd. | 2,700 | 66,671 | ||||||||||||
Hui Xian Real Estate Investment Trust REIT | 50,000 | 24,483 | ||||||||||||
NWS Holdings Ltd. | 19,000 | 41,598 | ||||||||||||
Swire Pacific Ltd., Class A | 10,344 | 133,240 | ||||||||||||
Yue Yuen Industrial Holdings Ltd. | 2,802 | 9,647 | ||||||||||||
| 890,335 |
| ||||||||||||
Hungary - 0.4% | ||||||||||||||
Magyar Telekom Telecommunications PLC | 38,780 | 62,630 | ||||||||||||
MOL Hungarian Oil & Gas PLC | 5,827 | 66,822 | ||||||||||||
OTP Bank Nyrt | 994 | 43,821 | ||||||||||||
| 173,273 |
| ||||||||||||
Indonesia - 0.1% | ||||||||||||||
Telekomunikasi Indonesia Persero Tbk PT | 200,000 |
| 55,282
|
| ||||||||||
Ireland - 0.0% | ||||||||||||||
Irish Residential Properties REIT PLC | 3,629 |
| 6,473
|
| ||||||||||
Israel - 0.8% | ||||||||||||||
Bank Leumi Le-Israel BM | 20,479 | 134,169 | ||||||||||||
Israel Discount Bank Ltd., Class A | 31,996 | 110,880 | ||||||||||||
Mizrahi Tefahot Bank Ltd. | 5,794 | 119,417 | ||||||||||||
Shufersal Ltd. | 2,678 | 17,316 | ||||||||||||
| 381,782 |
| ||||||||||||
Italy - 1.2% | ||||||||||||||
Enav SpA (a) | 6,976 | 38,047 | ||||||||||||
Enel SpA | 18,071 | 115,795 | ||||||||||||
Eni SpA | 3,676 | 64,949 | ||||||||||||
Hera SpA | 27,951 | 101,154 | ||||||||||||
Snam SpA | 50,083 | 257,634 | ||||||||||||
| 577,579 |
| ||||||||||||
Japan - 12.4% | ||||||||||||||
Aeon Co., Ltd. | 6,600 | 138,239 | ||||||||||||
ANA Holdings, Inc. | 5,354 | 196,426 | ||||||||||||
Aoyama Trading Co., Ltd. | 189 | 4,300 | ||||||||||||
Asahi Group Holdings Ltd. | 3,800 | 169,626 | ||||||||||||
Astellas Pharma, Inc. | 16,908 | 254,056 | ||||||||||||
| See accompanying Notes to Financial Statements | 20 | Semiannual Report / March 31, 2019 |
Schedule of Investments
March 31, 2019 (unaudited)
AllianzGI Best Styles Global Managed Volatility Portfolio
| Shares | Value | |||||||||||||
Cawachi Ltd. | 900 | 14,407 | ||||||||||||
Canon, Inc. | 3,190 | 92,622 | ||||||||||||
DCM Holdings Co., Ltd. | 9,875 | 92,106 | ||||||||||||
Doutor Nichires Holdings Co., Ltd. | 3,649 | 69,373 | ||||||||||||
DTS Corp. | 2,001 | 74,096 | ||||||||||||
DyDo Group Holdings, Inc. | 974 | 43,955 | ||||||||||||
Fuji Oil Holdings, Inc. | 1,884 | 64,589 | ||||||||||||
Fuji Soft, Inc. | 2,028 | 80,434 | ||||||||||||
FUJIFILM Holdings Corp. | 4,379 | 199,455 | ||||||||||||
Fukuyama Transporting Co., Ltd. | 554 | 21,363 | ||||||||||||
Geo Holdings Corp. | 864 | 12,014 | ||||||||||||
Ichigo Office REIT Investment REIT | 14 | 13,415 | ||||||||||||
ITOCHU Corp. | 8,100 | 146,803 | ||||||||||||
Japan Airlines Co., Ltd. | 5,680 | 200,161 | ||||||||||||
Japan Wool Textile Co., Ltd. | 5,300 | 45,200 | ||||||||||||
Kagome Co., Ltd. | 1,000 | 28,150 | ||||||||||||
Kajima Corp. | 9,100 | 134,614 | ||||||||||||
Kandenko Co., Ltd. | 4,500 | 38,516 | ||||||||||||
Kato Sangyo Co., Ltd. | 600 | 19,818 | ||||||||||||
KDDI Corp. | 5,900 | 127,070 | ||||||||||||
Kyowa Exeo Corp. | 3,700 | 102,357 | ||||||||||||
Kyudenko Corp. | 2,100 | 65,981 | ||||||||||||
LaSalle Logiport REIT | 68 | 67,233 | ||||||||||||
McDonald’s Holdings Co. Japan Ltd. | 3,400 | 157,296 | ||||||||||||
Mirait Holdings Corp. | 6,200 | 90,690 | ||||||||||||
Mitsubishi Corp. | 4,600 | 128,070 | ||||||||||||
Mitsubishi Research Institute, Inc. | 700 | 21,193 | ||||||||||||
Morinaga Milk Industry Co., Ltd. | 2,800 | 95,194 | ||||||||||||
NET One Systems Co., Ltd. | 4,600 | 116,325 | ||||||||||||
Nichias Corp. | 2,802 | 55,641 | ||||||||||||
Nihon Unisys Ltd. | 4,179 | 110,948 | ||||||||||||
Nippon Telegraph & Telephone Corp. | 9,744 | 415,397 | ||||||||||||
Nishimatsu Construction Co., Ltd. | 4,000 | 88,868 | ||||||||||||
NTT DOCOMO, Inc. | 23,457 | 519,892 | ||||||||||||
Obayashi Corp. | 8,373 | 84,389 | ||||||||||||
Okumura Corp. | 2,100 | 66,784 | ||||||||||||
Raito Kogyo Co., Ltd. | 4,537 | 61,297 | ||||||||||||
Rengo Co., Ltd. | 3,800 | 35,696 | ||||||||||||
S Foods, Inc. | 728 | 26,708 | ||||||||||||
Sankyo Co., Ltd. | 3,100 | 118,352 | ||||||||||||
Sekisui House Ltd. | 8,100 | 134,229 | ||||||||||||
Senko Group Holdings Co., Ltd. | 5,604 | 46,601 | ||||||||||||
Shibaura Electronics Co., Ltd. | 200 | 6,836 | ||||||||||||
Shimachu Co., Ltd. | 2,100 | 54,767 | ||||||||||||
Showa Shell Sekiyu KK (c)(d) | 5,800 | 79,496 | ||||||||||||
Sumitomo Corp. | 9,400 | 130,324 | ||||||||||||
Sumitomo Dainippon Pharma Co., Ltd. | 532 | 13,204 | ||||||||||||
Sumitomo Densetsu Co., Ltd. | 1,200 | 20,389 | ||||||||||||
Sushiro Global Holdings Ltd. | 1,900 | 130,950 | ||||||||||||
T-Gaia Corp. | 1,700 | 28,231 | ||||||||||||
Takasago Thermal Engineering Co., Ltd. | 4,503 | 72,650 | ||||||||||||
Takeda Pharmaceutical Co., Ltd. | 5,657 | 231,667 | ||||||||||||
Tokyo Electron Ltd. | 900 | 130,552 | ||||||||||||
Tokyo Gas Co., Ltd. | 3,700 | 100,158 | ||||||||||||
Tokyu Construction Co., Ltd. | 4,800 | 36,050 | ||||||||||||
Toshiba Plant Systems & Services Corp. | 3,300 | 58,608 | ||||||||||||
Tv Tokyo Holdings Corp. | 934 | 19,664 | ||||||||||||
Yurtec Corp. | 1,868 | 13,693 | ||||||||||||
| 6,017,188 |
| ||||||||||||
Korea (Republic of) - 1.0% | ||||||||||||||
Daekyo Co., Ltd. | 2,318 | 12,650 | ||||||||||||
Easy Bio, Inc. | 1,107 | 6,723 | ||||||||||||
Hansol Paper Co., Ltd. | 1,424 | 18,530 | ||||||||||||
KC Co., Ltd. | 210 | 2,910 | ||||||||||||
KT Corp. | 660 | 15,928 | ||||||||||||
KT&G Corp. | 1,154 | 105,230 | ||||||||||||
Kukdo Chemical Co., Ltd. | 388 | 16,430 | ||||||||||||
Orange Life Insurance Ltd. (a) | 1,691 | 53,678 | ||||||||||||
Samjin Pharmaceutical Co., Ltd. | 628 | 21,152 | ||||||||||||
Samsung Electronics Co., Ltd. | 5,499 | 216,897 | ||||||||||||
Ubiquoss Holdings, Inc. (e) | 1,318 | 18,778 | ||||||||||||
| 488,906 |
| ||||||||||||
| See accompanying Notes to Financial Statements | 21 | Semiannual Report / March 31, 2019 |
Schedule of Investments
March 31, 2019 (unaudited)
AllianzGI Best Styles Global Managed Volatility Portfolio
| Shares | Value | |||||||||||||
Malaysia - 1.3% | ||||||||||||||
Hong Leong Bank Bhd. | 21,000 | 104,594 | ||||||||||||
Hong Leong Financial Group Bhd. | 2,400 | 11,281 | ||||||||||||
Malayan Banking Bhd. | 90,500 | 205,645 | ||||||||||||
MISC Bhd. | 15,800 | 25,935 | ||||||||||||
Petronas Chemicals Group Bhd. | 15,200 | 34,129 | ||||||||||||
Public Bank Bhd. | 17,500 | 99,355 | ||||||||||||
Tenaga Nasional Bhd. | 38,300 | 118,991 | ||||||||||||
VS Industry Bhd. | 38,900 | 10,216 | ||||||||||||
| 610,146 |
| ||||||||||||
Mexico - 0.2% | ||||||||||||||
Banco del Bajio S.A. (a) | 18,100 | 35,948 | ||||||||||||
Qualitas Controladora S.A.B. de C.V. | 19,100 | 46,977 | ||||||||||||
| 82,925 |
| ||||||||||||
Morocco - 0.0% | ||||||||||||||
Douja Promotion Groupe Addoha S.A. |
| 10,225
|
|
| 12,288
|
| ||||||||
Netherlands - 1.0% | ||||||||||||||
ASR Nederland NV | 2,424 | 100,999 | ||||||||||||
Coca-Cola European Partners PLC | 1,317 | 68,142 | ||||||||||||
Koninklijke Ahold Delhaize NV | 6,070 | 161,606 | ||||||||||||
NN Group NV | 2,770 | 115,250 | ||||||||||||
Vastned Retail NV REIT | 1,069 | 41,431 | ||||||||||||
| 487,428 |
| ||||||||||||
New Zealand - 0.3% | ||||||||||||||
Air New Zealand Ltd. | 32,303 | 55,809 | ||||||||||||
Arvida Group Ltd. | 26,315 | 23,310 | ||||||||||||
Summerset Group Holdings Ltd. | 16,234 | 72,984 | ||||||||||||
Tourism Holdings Ltd. | 3,878 | 12,524 | ||||||||||||
| 164,627 |
| ||||||||||||
Norway - 0.2% | ||||||||||||||
B2Holding ASA | 5,084 | 7,135 | ||||||||||||
Elkem ASA (a)(e) | 15,298 | 54,290 | ||||||||||||
Mowi ASA | 2,253 | 50,334 | ||||||||||||
| 111,759 |
| ||||||||||||
Peru - 0.1% | ||||||||||||||
Ferreycorp SAA |
| 40,342
|
|
| 30,035
|
| ||||||||
Poland - 0.2% | ||||||||||||||
Asseco Poland S.A. | 4,650 | 62,899 | ||||||||||||
Ciech S.A. | 1,701 | 23,756 | ||||||||||||
| 86,655 |
| ||||||||||||
Singapore - 1.4% | ||||||||||||||
Accordia Golf Trust UNIT | 37,500 | 16,481 | ||||||||||||
CapitaLand Mall Trust REIT | 90,400 | 158,854 | ||||||||||||
China Aviation Oil Singapore Corp., Ltd. | 6,900 | 6,845 | ||||||||||||
Fortune Real Estate Investment Trust REIT | 66,000 | 86,955 | ||||||||||||
Frasers Logistics & Industrial Trust REIT | 106,900 | 91,559 | ||||||||||||
Oversea-Chinese Banking Corp., Ltd. | 15,300 | 125,086 | ||||||||||||
Sheng Siong Group Ltd. | 33,900 | 26,040 | ||||||||||||
Singapore Airlines Ltd. | 26,000 | 185,656 | ||||||||||||
Sino Grandness Food Industry Group Ltd. (e) | 77,400 | 3,427 | ||||||||||||
| 700,903 |
| ||||||||||||
South Africa - 0.0% | ||||||||||||||
Astral Foods Ltd. |
| 1,214
|
|
| 14,108
|
| ||||||||
Spain - 0.2% | ||||||||||||||
Ebro Foods S.A. | 2,242 | 47,930 | ||||||||||||
Iberdrola S.A. | 5,135 | 45,084 | ||||||||||||
Lar Espana Real Estate Socimi S.A. REIT | 1,947 | 16,255 | ||||||||||||
| 109,269 |
| ||||||||||||
| See accompanying Notes to Financial Statements | 22 | Semiannual Report / March 31, 2019 |
Schedule of Investments
March 31, 2019 (unaudited)
AllianzGI Best Styles Global Managed Volatility Portfolio
| Shares | Value | |||||||||||||
Sweden - 0.3% | ||||||||||||||
Nobina AB (a) | 3,456 | 22,281 | ||||||||||||
Svenska Cellulosa AB SCA, Class B | 13,861 | 120,352 | ||||||||||||
| 142,633 |
| ||||||||||||
Switzerland - 1.6% | ||||||||||||||
Baloise Holding AG | 782 | 129,245 | ||||||||||||
Banque Cantonale Vaudoise | 30 | 24,053 | ||||||||||||
Barry Callebaut AG | 60 | 108,452 | ||||||||||||
BKW AG | 111 | 7,572 | ||||||||||||
Intershop Holding AG | 32 | 16,332 | ||||||||||||
Nestle S.A. | 1,739 | 165,814 | ||||||||||||
Partners Group Holding AG | 236 | 171,681 | ||||||||||||
Schweiter Technologies AG | 11 | 10,616 | ||||||||||||
Swiss Life Holding AG (e) | 301 | 132,621 | ||||||||||||
| 766,386 |
| ||||||||||||
Taiwan - 4.7% | ||||||||||||||
Asia Cement Corp. | 47,000 | 61,232 | ||||||||||||
Cheng Loong Corp. | 37,000 | 24,663 | ||||||||||||
China Airlines Ltd. | 69,000 | 22,095 | ||||||||||||
China Development Financial Holding Corp. | 116,000 | 38,826 | ||||||||||||
China Motor Corp. | 44,000 | 40,718 | ||||||||||||
China Petrochemical Development Corp. (e) | 210,000 | 82,623 | ||||||||||||
CTBC Financial Holding Co., Ltd. | 221,000 | 146,763 | ||||||||||||
E.Sun Financial Holding Co., Ltd. | 150,000 | 115,752 | ||||||||||||
Far Eastern Department Stores Ltd. | 39,000 | 20,769 | ||||||||||||
First Financial Holding Co., Ltd. | 376,891 | 258,125 | ||||||||||||
Formosa Chemicals & Fibre Corp. | 13,000 | 47,365 | ||||||||||||
Formosa Petrochemical Corp. | 71,000 | 266,536 | ||||||||||||
Formosa Plastics Corp. | 31,000 | 110,344 | ||||||||||||
Getac Technology Corp. | 49,000 | 81,889 | ||||||||||||
Great Wall Enterprise Co., Ltd. | 29,960 | 34,341 | ||||||||||||
HannStar Display Corp. | 439,000 | 97,331 | ||||||||||||
International CSRC Investment Holdings Co. | 77,859 | 105,812 | ||||||||||||
King Yuan Electronics Co., Ltd. | 42,000 | 35,867 | ||||||||||||
Lien Hwa Industrial Corp. | 67,100 | 73,326 | ||||||||||||
Mega Financial Holding Co., Ltd. | 92,000 | 83,813 | ||||||||||||
Mercuries Life Insurance Co., Ltd. (e) | 48,594 | 17,845 | ||||||||||||
Nanya Technology Corp. | 27,000 | 53,998 | ||||||||||||
Oriental Union Chemical Corp. | 24,000 | 20,365 | ||||||||||||
Powertech Technology, Inc. | 36,000 | 85,246 | ||||||||||||
Sercomm Corp. | 20,000 | 43,906 | ||||||||||||
Sinbon Electronics Co., Ltd. | 18,139 | 61,011 | ||||||||||||
Taichung Commercial Bank Co., Ltd. | 62,000 | 22,947 | ||||||||||||
Uni-President Enterprises Corp. | 59,000 | 143,369 | ||||||||||||
WT Microelectronics Co., Ltd. | 19,003 | 25,089 | ||||||||||||
Yageo Corp. | 6,985 | 73,601 | ||||||||||||
| 2,295,567 |
| ||||||||||||
Thailand - 1.6% | ||||||||||||||
Bangchak Corp. PCL (c)(d) | 50,300 | 51,098 | ||||||||||||
Bangkok Bank PCL | 15,600 | 106,303 | ||||||||||||
Electricity Generating PCL (c)(d) | 7,500 | 69,068 | ||||||||||||
IRPC PCL (c)(d) | 188,900 | 34,213 | ||||||||||||
PTT PCL (c)(d) | 105,400 | 159,430 | ||||||||||||
Siam Cement PCL (c)(d) | 8,900 | 135,312 | ||||||||||||
Siamgas & Petrochemicals PCL (c)(d) | 151,900 | 44,066 | ||||||||||||
Star Petroleum Refining PCL (c)(d) | 179,100 | 61,561 | ||||||||||||
Tisco Financial Group PCL (c)(d) | 32,600 | 90,788 | ||||||||||||
| 751,839 |
| ||||||||||||
United Kingdom - 1.0% | ||||||||||||||
Berkeley Group Holdings PLC | 2,107 | 101,294 | ||||||||||||
Computacenter PLC | 2,332 | 33,608 | ||||||||||||
Gamma Communications PLC | 5,572 | 70,976 | ||||||||||||
IG Group Holdings PLC | 2,886 | 19,557 | ||||||||||||
Johnson Service Group PLC | 17,486 | 31,657 | ||||||||||||
Persimmon PLC | 3,164 | 89,496 | ||||||||||||
Regional REIT Ltd. REIT (a) | 20,237 | 27,692 | ||||||||||||
Renewables Infrastructure Group Ltd. | 25,130 | 38,577 | ||||||||||||
Royal Dutch Shell PLC, Class A | 3,013 | 94,529 | ||||||||||||
| 507,386 |
| ||||||||||||
| See accompanying Notes to Financial Statements | 23 | Semiannual Report / March 31, 2019 |
Schedule of Investments
March 31, 2019 (unaudited)
AllianzGI Best Styles Global Managed Volatility Portfolio
| Shares | Value | |||||||||||||
United States - 57.5% | ||||||||||||||
AbbVie, Inc. | 1,156 | 93,162 | ||||||||||||
Accenture PLC, Class A | 1,384 | 243,612 | ||||||||||||
Adobe, Inc. (e) | 1,117 | 297,669 | ||||||||||||
Aflac, Inc. | 4,085 | 204,250 | ||||||||||||
AG Mortgage Investment Trust, Inc. REIT | 4,371 | 73,608 | ||||||||||||
AGNC Investment Corp. REIT | 12,322 | 221,796 | ||||||||||||
Align Technology, Inc. (e) | 473 | 134,488 | ||||||||||||
Allstate Corp. | 4,060 | 382,371 | ||||||||||||
Altria Group, Inc. | 3,922 | 225,240 | ||||||||||||
Amdocs Ltd. | 771 | 41,719 | ||||||||||||
Ameren Corp. | 2,768 | 203,586 | ||||||||||||
American Eagle Outfitters, Inc. | 1,908 | 42,300 | ||||||||||||
American Electric Power Co., Inc. | 3,275 | 274,281 | ||||||||||||
American Financial Group, Inc. | 1,151 | 110,738 | ||||||||||||
Amgen, Inc. | 1,094 | 207,838 | ||||||||||||
Annaly Capital Management, Inc. REIT | 19,125 | 191,059 | ||||||||||||
Anthem, Inc. | 740 | 212,365 | ||||||||||||
Anworth Mortgage Asset Corp. REIT | 3,014 | 12,177 | ||||||||||||
Apollo Commercial Real Estate Finance, Inc. REIT | 4,686 | 85,285 | ||||||||||||
Apple, Inc. | 1,529 | 290,434 | ||||||||||||
Archer-Daniels-Midland Co. | 2,720 | 117,314 | ||||||||||||
Ares Commercial Real Estate Corp. REIT | 4,387 | 66,639 | ||||||||||||
ARMOUR Residential REIT, Inc. | 3,421 | 66,812 | ||||||||||||
AT&T, Inc. | 16,432 | 515,308 | ||||||||||||
Atmos Energy Corp. | 1,117 | 114,973 | ||||||||||||
Automatic Data Processing, Inc. | 1,632 | 260,696 | ||||||||||||
AutoZone, Inc. (e) | 319 | 326,694 | ||||||||||||
Avaya Holdings Corp. (e) | 3,065 | 51,584 | ||||||||||||
Berkshire Hathaway, Inc., Class B (e) | 256 | 51,428 | ||||||||||||
Bright Horizons Family Solutions, Inc. (e) | 972 | 123,551 | ||||||||||||
Bristol-Myers Squibb Co. | 3,818 | 182,157 | ||||||||||||
Broadridge Financial Solutions, Inc. | 728 | 75,486 | ||||||||||||
CBTX, Inc. | 1,720 | 55,848 | ||||||||||||
Centene Corp. (e) | 2,190 | 116,289 | ||||||||||||
Chemed Corp. | 355 | 113,625 | ||||||||||||
Cherry Hill Mortgage Investment Corp. REIT | 845 | 14,551 | ||||||||||||
Chimera Investment Corp. REIT | 5,061 | 94,843 | ||||||||||||
Cigna Corp. | 927 | 149,080 | ||||||||||||
Cisco Systems, Inc. | 6,585 | 355,524 | ||||||||||||
CME Group, Inc. | 748 | 123,106 | ||||||||||||
CMS Energy Corp. | 2,406 | 133,629 | ||||||||||||
Coca-Cola Co. | 1,240 | 58,106 | ||||||||||||
Conagra Brands, Inc. | 4,474 | 124,109 | ||||||||||||
Consolidated Edison, Inc. | 7,359 | 624,117 | ||||||||||||
Constellation Brands, Inc., Class A | 1,278 | 224,072 | ||||||||||||
Contura Energy, Inc. (e) | 994 | 57,572 | ||||||||||||
Costco Wholesale Corp. | 1,077 | 260,785 | ||||||||||||
CubeSmart REIT | 3,430 | 109,897 | ||||||||||||
CVS Health Corp. | 1,324 | 71,403 | ||||||||||||
Darden Restaurants, Inc. | 1,336 | 162,284 | ||||||||||||
DaVita, Inc. (e) | 1,107 | 60,099 | ||||||||||||
DTE Energy Co. | 1,095 | 136,590 | ||||||||||||
Duke Energy Corp. | 5,956 | 536,040 | ||||||||||||
DXC Technology Co. | 1,429 | 91,899 | ||||||||||||
Dynex Capital, Inc. REIT | 6,417 | 39,080 | ||||||||||||
Eli Lilly & Co. | 891 | 115,616 | ||||||||||||
Encompass Health Corp. | 1,643 | 95,951 | ||||||||||||
Ennis, Inc. | 2,558 | 53,104 | ||||||||||||
Entergy Corp. | 2,097 | 200,536 | ||||||||||||
Equity LifeStyle Properties, Inc. REIT | 1,149 | 131,331 | ||||||||||||
Exelon Corp. | 2,634 | 132,042 | ||||||||||||
Exxon Mobil Corp. | 395 | 31,916 | ||||||||||||
Facebook, Inc., Class A (e) | 1,531 | 255,202 | ||||||||||||
Fidelity National Information Services, Inc. | 1,248 | 141,149 | ||||||||||||
frontdoor, Inc. (e) | 1,037 | 35,694 | ||||||||||||
FTI Consulting, Inc. (e) | 1,738 | 133,513 | ||||||||||||
Gaming and Leisure Properties, Inc. REIT | 3,228 | 124,504 | ||||||||||||
Granite Point Mortgage Trust, Inc. REIT | 406 | 7,539 | ||||||||||||
Haemonetics Corp. (e) | 1,052 | 92,029 | ||||||||||||
Home Depot, Inc. | 1,577 | 302,611 | ||||||||||||
Humana, Inc. | 837 | 222,642 | ||||||||||||
Huntington Ingalls Industries, Inc. | 156 | 32,323 | ||||||||||||
ICF International, Inc. | 1,161 | 88,329 | ||||||||||||
| See accompanying Notes to Financial Statements | 24 | Semiannual Report / March 31, 2019 |
Schedule of Investments
March 31, 2019 (unaudited)
AllianzGI Best Styles Global Managed Volatility Portfolio
| Shares | Value | |||||||||||||
Ingredion, Inc. | 1,039 | 98,383 | ||||||||||||
Insperity, Inc. | 606 | 74,938 | ||||||||||||
Intel Corp. | 4,702 | 252,497 | ||||||||||||
Intuit, Inc. | 259 | 67,705 | ||||||||||||
Intuitive Surgical, Inc. (e) | 723 | 412,529 | ||||||||||||
Invesco Mortgage Capital, Inc. REIT | 5,280 | 83,424 | ||||||||||||
Johnson & Johnson | 6,720 | 939,389 | ||||||||||||
KAR Auction Services, Inc. | 1,997 | 102,466 | ||||||||||||
Kellogg Co. | 622 | 35,690 | ||||||||||||
Keurig Dr Pepper, Inc. | 2,904 | 81,225 | ||||||||||||
Kimberly-Clark Corp. | 1,741 | 215,710 | ||||||||||||
L3 Technologies, Inc. | 797 | 164,477 | ||||||||||||
Laboratory Corp. of America Holdings (e) | 1,590 | 243,238 | ||||||||||||
Ladder Capital Corp. REIT | 2,432 | 41,393 | ||||||||||||
Lamb Weston Holdings, Inc. | 1,635 | 122,527 | ||||||||||||
Leidos Holdings, Inc. | 1,588 | 101,775 | ||||||||||||
Lockheed Martin Corp. | 1,824 | 547,492 | ||||||||||||
ManTech International Corp., Class A | 1,791 | 96,750 | ||||||||||||
Mastercard, Inc., Class A | 1,670 | 393,201 | ||||||||||||
McDonald’s Corp. | 2,194 | 416,641 | ||||||||||||
McGrath RentCorp | 1,482 | 83,837 | ||||||||||||
MedEquities Realty Trust, Inc. REIT | 6,502 | 72,367 | ||||||||||||
Merck & Co., Inc. | 1,106 | 91,986 | ||||||||||||
MFA Financial, Inc. REIT | 8,361 | 60,784 | ||||||||||||
Microsoft Corp. | 2,137 | 252,038 | ||||||||||||
Motorola Solutions, Inc. | 353 | 49,568 | ||||||||||||
Nasdaq, Inc. | 1,512 | 132,285 | ||||||||||||
National CineMedia, Inc. | 4,631 | 32,649 | ||||||||||||
New Residential Investment Corp. REIT | 7,150 | 120,906 | ||||||||||||
NextEra Energy, Inc. | 2,379 | 459,908 | ||||||||||||
Northfield Bancorp, Inc. | 396 | 5,504 | ||||||||||||
Northrop Grumman Corp. | 1,351 | 364,230 | ||||||||||||
NVR, Inc. (e) | 8 | 22,136 | ||||||||||||
O’Reilly Automotive, Inc. (e) | 423 | 164,251 | ||||||||||||
Occidental Petroleum Corp. | 3,571 | 236,400 | ||||||||||||
Old Republic International Corp. | 4,790 | 100,207 | ||||||||||||
Oritani Financial Corp. | 406 | 6,752 | ||||||||||||
Paychex, Inc. | 1,706 | 136,821 | ||||||||||||
Peoples Bancorp, Inc. | 669 | 20,719 | ||||||||||||
PepsiCo, Inc. | 4,673 | 572,676 | ||||||||||||
Pfizer, Inc. | 12,556 | 533,253 | ||||||||||||
Pinnacle West Capital Corp. | 1,439 | 137,540 | ||||||||||||
Procter & Gamble Co. | 6,716 | 698,800 | ||||||||||||
Progressive Corp. | 4,357 | 314,096 | ||||||||||||
Prospect Capital Corp. | 14,030 | 91,476 | ||||||||||||
QCR Holdings, Inc. | 604 | 20,488 | ||||||||||||
Quest Diagnostics, Inc. | 1,174 | 105,566 | ||||||||||||
Raytheon Co. | 654 | 119,080 | ||||||||||||
RBB Bancorp | 438 | 8,234 | ||||||||||||
Republic Services, Inc. | 6,742 | 541,922 | ||||||||||||
Retail Properties of America, Inc., Class A REIT | 7,958 | 97,008 | ||||||||||||
Ross Stores, Inc. | 2,891 | 269,152 | ||||||||||||
Royal Caribbean Cruises Ltd. | 871 | 99,834 | ||||||||||||
S&P Global, Inc. | 1,068 | 224,867 | ||||||||||||
Sabre Corp. | 2,817 | 60,256 | ||||||||||||
ServiceMaster Global Holdings, Inc. (e) | 2,621 | 122,401 | ||||||||||||
Southern Co. | 238 | 12,300 | ||||||||||||
SP Plus Corp. (e) | 2,076 | 70,833 | ||||||||||||
Stitch Fix, Inc., Class A (e) | 1,868 | 52,734 | ||||||||||||
STORE Capital Corp. REIT | 3,774 | 126,429 | ||||||||||||
Sysco Corp. | 2,347 | 156,686 | ||||||||||||
T-Mobile U.S., Inc. (e) | 2,160 | 149,256 | ||||||||||||
Target Corp. | 1,619 | 129,941 | ||||||||||||
TCG BDC, Inc. | 1,777 | 25,731 | ||||||||||||
TJX Cos., Inc. | 3,944 | 209,860 | ||||||||||||
Total System Services, Inc. | 1,793 | 170,353 | ||||||||||||
TPG RE Finance Trust, Inc. REIT | 1,025 | 20,090 | ||||||||||||
Two Harbors Investment Corp. REIT | 6,846 | 92,626 | ||||||||||||
Tyson Foods, Inc., Class A | 1,295 | 89,912 | ||||||||||||
U.S. Foods Holding Corp. (e) | 547 | 19,096 | ||||||||||||
UGI Corp. | 2,094 | 116,049 | ||||||||||||
United Therapeutics Corp. (e) | 1,003 | 117,722 | ||||||||||||
UnitedHealth Group, Inc. | 2,252 | 556,829 | ||||||||||||
Valero Energy Corp. | 1,771 | 150,234 | ||||||||||||
Verizon Communications, Inc. | 11,939 | 705,953 | ||||||||||||
Visa, Inc., Class A | 1,726 | 269,584 | ||||||||||||
Walmart, Inc. | 2,392 | 233,292 | ||||||||||||
| See accompanying Notes to Financial Statements | 25 | Semiannual Report / March 31, 2019 |
Schedule of Investments
March 31, 2019 (unaudited)
AllianzGI Best Styles Global Managed Volatility Portfolio
| Shares | Value | |||||||||||||
Waste Management, Inc. | 7,436 | 772,675 | ||||||||||||
Waterstone Financial, Inc. | 1,819 | 29,941 | ||||||||||||
WEC Energy Group, Inc. | 6,076 | 480,490 | ||||||||||||
WellCare Health Plans, Inc. (e) | 432 | 116,532 | ||||||||||||
Western Asset Mortgage Capital Corp. REIT | 3,885 | 39,744 | ||||||||||||
Xcel Energy, Inc. | 8,887 | 499,538 | ||||||||||||
Zoetis, Inc. | 2,001 | 201,441 | ||||||||||||
| 27,946,517 |
| ||||||||||||
Total Common Stock (cost-$41,968,918) |
| 47,429,370 |
| |||||||||||
EXCHANGE-TRADED FUNDS - 0.7% | ||||||||||||||
iShares Edge MSCI Min Vol Global (cost-$336,600) |
| 4,000
|
|
| 357,920
|
| ||||||||
MUTUAL FUNDS (f)- 0.2% | ||||||||||||||
3i Infrastructure PLC | 6,625 | 23,768 | ||||||||||||
BB Biotech AG | 1,251 | 87,293 | ||||||||||||
Total Mutual Funds (cost-$106,071) |
| 111,061 |
| |||||||||||
| Principal Amount (000s) | ||||||||||||||
Repurchase Agreements - 1.3% | ||||||||||||||
State Street Bank and Trust Co., | $ | 638 |
| 638,000
|
| |||||||||
Total Investments(cost-$43,049,589) (b)-99.8% |
| 48,536,351
|
| |||||||||||
Other assets less liabilities-0.2%
|
|
78,911
|
| |||||||||||
Net Assets-100.0% | $ | 48,615,262 | ||||||||||||
| See accompanying Notes to Financial Statements | 26 | Semiannual Report / March 31, 2019 |
Schedule of Investments
March 31, 2019 (unaudited)
AllianzGI Best Styles Global Managed Volatility Portfolio
Notes to Schedule of Investments:
| (a) | 144A—Exempt from registration under Rule 144A of the Securities Act of 1933. These securities may be resold in transactions exempt from registration, typically only to qualified institutional buyers. Securities with an aggregate value of $626,102, representing 1.3% of net assets. |
| (b) | Securities with an aggregate value of $17,495,714, representing 36.0% of net assets, were valued utilizing modeling tools provided by a third-party vendor. See Note 1(a) and Note 1(b) in the Notes to Financial Statements. |
| (c) | Fair-Valued—Securities with an aggregate value of $725,032, representing 1.5% of net assets. See Note 1(a) and Note 1(b) in the Notes to Financial Statements. |
| (d) | Level 3 security. See Note 1(a) and Note 1(b) in the Notes to Financial Statements. |
| (e) | Non-income producing. |
| (f) | Mutual Fund. |
Glossary:
MSCI - Morgan Stanley Capital International
REIT - Real Estate Investment Trust
UNIT - More than one class of securities traded together
| See accompanying Notes to Financial Statements | 27 | Semiannual Report / March 31, 2019 |
Schedule of Investments
March 31, 2019 (unaudited)
AllianzGI Best Styles Global Managed Volatility Portfolio
The industry classification of portfolio holdings and other assets less liabilities shown as a percentage of net assets were as follows:
Electric Utilities | 6.6% | |||
Pharmaceuticals | 5.3% | |||
IT Services | 5.0% | |||
Banks | 4.8% | |||
Healthcare Providers & Services | 4.5% | |||
Diversified Telecommunication Services | 4.3% | |||
Insurance | 4.2% | |||
Oil, Gas & Consumable Fuels | 4.1% | |||
Multi-Utilities | 3.5% | |||
Commercial Services & Supplies | 3.4% | |||
Equity Real Estate Investment Trusts (REITs) | 3.3% | |||
Specialty Retail | 3.1% | |||
Food Products | 3.1% | |||
Mortgage Real Estate Investment Trusts (REITs) | 2.7% | |||
Aerospace & Defense | 2.5% | |||
Beverages | 2.4% | |||
Construction & Engineering | 2.4% | |||
Food & Staples Retailing | 2.3% | |||
Hotels, Restaurants & Leisure | 2.2% | |||
Household Products | 1.9% | |||
Wireless Telecommunication Services | 1.8% | |||
Technology Hardware, Storage & Peripherals | 1.8% | |||
Software | 1.7% | |||
Capital Markets | 1.6% | |||
Healthcare Equipment & Supplies | 1.4% | |||
Airlines | 1.4% | |||
Chemicals | 1.2% | |||
Trading Companies & Distributors | 1.2% | |||
Semiconductors & Semiconductor Equipment | 1.2% | |||
Real Estate Management & Development | 1.1% | |||
Communications Equipment | 0.9% | |||
Interactive Media & Services | 0.9% | |||
Biotechnology | 0.9% | |||
Exchange-Traded Funds | 0.7% | |||
Household Durables | 0.7% | |||
Tobacco | 0.7% | |||
Professional Services | 0.6% | |||
Diversified Consumer Services | 0.6% | |||
Construction Materials | 0.6% | |||
Transportation Infrastructure | 0.6% | |||
Metals & Mining | 0.6% | |||
Electronic Equipment, Instruments & Components | 0.6% | |||
Paper & Forest Products | 0.5% | |||
Gas Utilities | 0.4% | |||
Multi-Line Retail | 0.4% | |||
Media | 0.3% | |||
Independent Power Producers & Energy Traders | 0.3% | |||
Building Products | 0.3% | |||
Industrial Conglomerates | 0.3% | |||
Leisure Equipment & Products | 0.2% | |||
Mutual Funds | 0.2% | |||
Road & Rail | 0.2% | |||
Water Utilities | 0.2% | |||
Textiles, Apparel & Luxury Goods | 0.2% | |||
Diversified Financial Services | 0.1% | |||
Containers & Packaging | 0.1% | |||
Automobiles | 0.1% | |||
Internet & Direct Marketing Retail | 0.1% | |||
Thrifts & Mortgage Finance | 0.1% | |||
Marine | 0.1% | |||
Consumer Finance | 0.0% | |||
Repurchase Agreements | 1.3% | |||
Other assets less liabilities | 0.2% | |||
| 100.0% |
| See accompanying Notes to Financial Statements | 28 | Semiannual Report / March 31, 2019 |
Schedule of Investments
March 31, 2019 (unaudited)
AllianzGI Global Small-Cap Opportunities Portfolio
| Shares | Value | |||||||||||||||
COMMON STOCK - 99.3% | ||||||||||||||||
Australia - 3.2% | ||||||||||||||||
BWP Trust REIT | 16,910 | $ | 44,938 | |||||||||||||
Charter Hall Retail REIT | 6,494 | 21,461 | ||||||||||||||
Cromwell Property Group REIT | 22,050 | 17,146 | ||||||||||||||
Qantas Airways Ltd. | 20,280 | 81,605 | ||||||||||||||
| 165,150 |
| ||||||||||||||
Austria - 0.4% | ||||||||||||||||
Verbund AG |
| 484
|
|
| 23,245
|
| ||||||||||
Brazil - 0.4% | ||||||||||||||||
Cia Paranaense de Energia, Class P ADR |
| 2,000
|
|
| 18,560
|
| ||||||||||
Canada - 2.5% | ||||||||||||||||
Canfor Pulp Products, Inc. | 1,215 | 13,538 | ||||||||||||||
Gibson Energy, Inc. | 1,172 | 20,145 | ||||||||||||||
Granite Real Estate Investment Trust REIT | 1,272 | 60,775 | ||||||||||||||
International Petroleum Corp. (e) | 4,428 | 20,895 | ||||||||||||||
TFI International, Inc. | 470 | 13,882 | ||||||||||||||
| 129,235 |
| ||||||||||||||
China - 4.1% | ||||||||||||||||
China Railway Group Ltd., Class H | 33,000 | 30,130 | ||||||||||||||
Huaxin Cement Co., Ltd., Class B | 11,785 | 23,881 | ||||||||||||||
Jiangsu Expressway Co., Ltd., Class H | 18,000 | 25,470 | ||||||||||||||
Maanshan Iron & Steel Co., Ltd., Class H | 108,000 | 52,937 | ||||||||||||||
Sinopec Shanghai Petrochemical Co., Ltd., Class H | 38,000 | 18,118 | ||||||||||||||
Weichai Power Co., Ltd., Class H | 41,000 | 65,805 | ||||||||||||||
| 216,341 |
| ||||||||||||||
Denmark - 1.6% | ||||||||||||||||
Topdanmark A/S |
| 1,646
|
|
| 82,235
|
| ||||||||||
Finland - 0.2% | ||||||||||||||||
Ramirent Oyj |
| 1,554
|
|
| 9,571
|
| ||||||||||
France - 0.3% | ||||||||||||||||
Eutelsat Communications S.A. |
| 977
|
|
| 17,109
|
| ||||||||||
Germany - 0.2% | ||||||||||||||||
ProSiebenSat.1 Media SE |
| 611
|
|
| 8,699
|
| ||||||||||
Greece - 0.7% | ||||||||||||||||
Motor Oil Hellas Corinth Refineries S.A. |
| 1,631
|
|
| 37,872
|
| ||||||||||
Hong Kong - 2.1% | ||||||||||||||||
Hui Xian Real Estate Investment Trust REIT | 33,876 | 16,587 | ||||||||||||||
Hysan Development Co., Ltd. | 10,000 | 53,602 | ||||||||||||||
Yue Yuen Industrial Holdings Ltd. | 11,500 | 39,592 | ||||||||||||||
| 109,781 |
| ||||||||||||||
India - 1.8% | ||||||||||||||||
Larsen & Toubro Infotech Ltd. (a) | 404 | 9,946 | ||||||||||||||
Mphasis Ltd. | 2,440 | 35,244 | ||||||||||||||
WNS Holdings Ltd. ADR (e) | 900 | 47,943 | ||||||||||||||
| 93,133 |
| ||||||||||||||
Indonesia - 0.6% | ||||||||||||||||
Indo Tambangraya Megah Tbk PT |
| 18,600
|
|
| 31,315
|
| ||||||||||
Italy - 0.8% | ||||||||||||||||
Saras SpA | 4,958 | 9,188 | ||||||||||||||
Unipol Gruppo SpA | 6,986 | 34,849 | ||||||||||||||
| 44,037 |
| ||||||||||||||
Japan - 11.3% | ||||||||||||||||
Advance Residence Investment Corp. REIT | 18 | 50,145 | ||||||||||||||
AEON REIT Investment Corp. REIT | 27 | 31,822 | ||||||||||||||
Daiwa Office Investment Corp. REIT | 4 | 28,455 | ||||||||||||||
Fuji Oil Co., Ltd. | 4,500 | 10,224 | ||||||||||||||
Fuji Soft, Inc. | 600 | 23,797 | ||||||||||||||
| See accompanying Notes to Financial Statements | 29 | Semiannual Report / March 31, 2019 |
Schedule of Investments
March 31, 2019 (unaudited)
AllianzGI Global Small-Cap Opportunities Portfolio
| Shares | Value | |||||||||||||||
GungHo Online Entertainment, Inc. | 11,900 | 43,439 | ||||||||||||||
Invincible Investment Corp. REIT | 61 | 29,850 | ||||||||||||||
Japan Airlines Co., Ltd. | 800 | 28,192 | ||||||||||||||
Japan Rental Housing Investments, Inc. REIT | 25 | 19,906 | ||||||||||||||
Juki Corp. | 900 | 8,984 | ||||||||||||||
Nippon Accommodations Fund, Inc. REIT | 6 | 30,442 | ||||||||||||||
Nippon Carbon Co., Ltd. | 200 | 8,917 | ||||||||||||||
Nippon REIT Investment Corp. REIT | 10 | 38,543 | ||||||||||||||
Noritake Co., Ltd. | 400 | 19,214 | ||||||||||||||
Okamura Corp. | 1,800 | 18,902 | ||||||||||||||
Sankyu, Inc. | 2,000 | 97,753 | ||||||||||||||
SKY Perfect JSAT Holdings, Inc. | 4,300 | 17,902 | ||||||||||||||
Skylark Holdings Co., Ltd. | 1,000 | 16,574 | ||||||||||||||
Sumitomo Forestry Co., Ltd. | 2,900 | 40,367 | ||||||||||||||
T-Gaia Corp. | 1,700 | 28,231 | ||||||||||||||
| 591,659 |
| ||||||||||||||
Korea (Republic of) - 1.0% | ||||||||||||||||
DGB Financial Group, Inc. | 2,491 | 17,944 | ||||||||||||||
Macquarie Korea Infrastructure Fund | 2,122 | 19,910 | ||||||||||||||
WiSoL Co., Ltd. | 1,137 | 15,903 | ||||||||||||||
| 53,757 |
| ||||||||||||||
Netherlands - 1.1% | ||||||||||||||||
ASR Nederland NV |
| 1,393
|
|
| 58,041
|
| ||||||||||
Norway - 0.3% | ||||||||||||||||
Atea ASA (e) |
| 1,250
|
|
| 18,146
|
| ||||||||||
Russian Federation - 1.9% | ||||||||||||||||
Alrosa PJSC (c)(d) |
| 70,500
|
|
| 99,234
|
| ||||||||||
Singapore - 2.3% | ||||||||||||||||
Mapletree Commercial Trust REIT | 27,500 | 38,366 | ||||||||||||||
Mapletree Industrial Trust REIT | 23,000 | 35,665 | ||||||||||||||
Mapletree North Asia Commercial Trust REIT | 45,600 | 44,443 | ||||||||||||||
| 118,474 |
| ||||||||||||||
South Africa - 1.2% | ||||||||||||||||
Exxaro Resources Ltd. | 1,149 | 13,067 | ||||||||||||||
Telkom S.A. SOC Ltd. | 9,404 | 47,761 | ||||||||||||||
| 60,828 |
| ||||||||||||||
Spain - 0.6% | ||||||||||||||||
Ence Energia y Celulosa S.A. | 3,635 | 20,255 | ||||||||||||||
Mediaset Espana Comunicacion S.A. | 1,619 | 12,098 | ||||||||||||||
| 32,353 |
| ||||||||||||||
Taiwan - 0.5% | ||||||||||||||||
Huaku Development Co., Ltd. |
| 10,000
|
|
| 24,036
|
| ||||||||||
Thailand - 1.1% | ||||||||||||||||
Thanachart Capital PCL (c)(d) |
| 32,700
|
|
| 56,183
|
| ||||||||||
United Arab Emirates - 0.3% | ||||||||||||||||
Air Arabia PJSC |
| 68,239
|
| �� | 17,463
|
| ||||||||||
United Kingdom - 4.2% | ||||||||||||||||
Computacenter PLC | 1,471 | 21,200 | ||||||||||||||
Go-Ahead Group PLC | 1,510 | 38,567 | ||||||||||||||
Greggs PLC | 521 | 12,483 | ||||||||||||||
Hays PLC | 10,143 | 19,846 | ||||||||||||||
Intu Properties PLC REIT | 7,333 | 10,184 | ||||||||||||||
Nomad Foods Ltd. (e) | 1,410 | 28,835 | ||||||||||||||
OneSavings Bank PLC | 4,148 | 20,738 | ||||||||||||||
QinetiQ Group PLC | 7,210 | 28,313 | ||||||||||||||
SSP Group PLC | 4,026 | 36,330 | ||||||||||||||
| 216,496 |
| ||||||||||||||
| See accompanying Notes to Financial Statements | 30 | Semiannual Report / March 31, 2019 |
Schedule of Investments
March 31, 2019 (unaudited)
AllianzGI Global Small-Cap Opportunities Portfolio
| Shares | Value | |||||||||||||||
United States - 54.6% | ||||||||||||||||
Alliance Resource Partners L.P. | 2,700 | 54,972 | ||||||||||||||
Allied Motion Technologies, Inc. | 430 | 14,783 | ||||||||||||||
America’s Car-Mart, Inc. (e) | 500 | 45,670 | ||||||||||||||
American Eagle Outfitters, Inc. | 1,065 | 23,611 | ||||||||||||||
American Public Education, Inc. (e) | 495 | 14,909 | ||||||||||||||
Atkore International Group, Inc. (e) | 2,185 | 47,043 | ||||||||||||||
Barrett Business Services, Inc. | 400 | 30,932 | ||||||||||||||
Benchmark Electronics, Inc. | 2,800 | 73,500 | ||||||||||||||
Bio-Techne Corp. | 665 | 132,036 | ||||||||||||||
Charles River Laboratories International, Inc. (e) | 870 | 126,367 | ||||||||||||||
Citi Trends, Inc. | 745 | 14,386 | ||||||||||||||
Clearway Energy, Inc., Class A | 2,535 | 36,859 | ||||||||||||||
Cubic Corp. | 260 | 14,622 | ||||||||||||||
Dana, Inc. | 1,200 | 21,288 | ||||||||||||||
Deckers Outdoor Corp. (e) | 165 | 24,253 | ||||||||||||||
Emergent Biosolutions, Inc. (e) | 1,930 | 97,504 | ||||||||||||||
Exantas Capital Corp. REIT | 2,495 | 26,522 | ||||||||||||||
Exelixis, Inc. (e) | 440 | 10,472 | ||||||||||||||
Extended Stay America, Inc. UNIT | 2,900 | 52,055 | ||||||||||||||
Financial Institutions, Inc. | 710 | 19,298 | ||||||||||||||
Franklin Street Properties Corp. REIT | 1,475 | 10,605 | ||||||||||||||
Gray Television, Inc. (e) | 620 | 13,243 | ||||||||||||||
Greenhill & Co., Inc. | 390 | 8,389 | ||||||||||||||
Halozyme Therapeutics, Inc. (e) | 620 | 9,982 | ||||||||||||||
Helen of Troy Ltd. (e) | 85 | 9,857 | ||||||||||||||
Hess Midstream Partners L.P. | 585 | 12,402 | ||||||||||||||
Hill-Rom Holdings, Inc. | 310 | 32,817 | ||||||||||||||
Horizon Pharma PLC (e) | 755 | 19,955 | ||||||||||||||
Integer Holdings Corp. (e) | 1,165 | 87,864 | ||||||||||||||
IQVIA Holdings, Inc. (e) | 740 | 106,449 | ||||||||||||||
Kelly Services, Inc., Class A | 1,005 | 22,170 | ||||||||||||||
Keysight Technologies, Inc. (e) | 950 | 82,840 | ||||||||||||||
Korn/Ferry International | 2,700 | 120,906 | ||||||||||||||
La-Z-Boy, Inc. | 565 | 18,639 | ||||||||||||||
Lennar Corp., Class B | 420 | 16,430 | ||||||||||||||
Liberty TripAdvisor Holdings, Inc., Class A (e) | 800 | 11,352 | ||||||||||||||
Lululemon Athletica, Inc. (e) | 335 | 54,896 | ||||||||||||||
M/I Homes, Inc. (e) | 735 | 19,566 | ||||||||||||||
Malibu Boats, Inc., Class A (e) | 1,200 | 47,496 | ||||||||||||||
ManTech International Corp., Class A | 1,855 | 100,207 | ||||||||||||||
Marcus Corp. | 420 | 16,821 | ||||||||||||||
MasterCraft Boat Holdings, Inc. (e) | 1,950 | 44,012 | ||||||||||||||
Mercer International, Inc. | 1,430 | 19,319 | ||||||||||||||
Methode Electronics, Inc. | 1,300 | 37,414 | ||||||||||||||
MGIC Investment Corp. (e) | 3,805 | 50,188 | ||||||||||||||
Moog, Inc., Class A | 970 | 84,342 | ||||||||||||||
MSA Safety, Inc. | 1,230 | 127,182 | ||||||||||||||
Navient Corp. | 955 | 11,049 | ||||||||||||||
NCI Building Systems, Inc. (e) | 1,345 | 8,285 | ||||||||||||||
Oasis Midstream Partners L.P. | 705 | 14,326 | ||||||||||||||
Office Depot, Inc. | 12,085 | 43,869 | ||||||||||||||
Patterson Cos., Inc. | 460 | 10,051 | ||||||||||||||
PC Connection, Inc. | 315 | 11,551 | ||||||||||||||
PDL BioPharma, Inc. (e) | 3,180 | 11,830 | ||||||||||||||
Plains GP Holdings L.P., Class A (e) | 2,180 | 54,326 | ||||||||||||||
PRA Health Sciences, Inc. (e) | 820 | 90,438 | ||||||||||||||
Premier, Inc., Class A (e) | 1,560 | 53,804 | ||||||||||||||
Progress Software Corp. | 815 | 36,162 | ||||||||||||||
Rush Enterprises, Inc., Class A | 885 | 37,002 | ||||||||||||||
SJW Group | 350 | 21,609 | ||||||||||||||
Spirit Airlines, Inc. (e) | 600 | 31,716 | ||||||||||||||
Surmodics, Inc. (e) | 640 | 27,827 | ||||||||||||||
Tailored Brands, Inc. | 1,455 | 11,407 | ||||||||||||||
Tower International, Inc. | 545 | 11,461 | ||||||||||||||
Triple-S Management Corp., Class B (e) | 1,020 | 23,276 | ||||||||||||||
Unisys Corp. (e) | 1,200 | 14,004 | ||||||||||||||
Vectrus, Inc. (e) | 430 | 11,434 | ||||||||||||||
Verint Systems, Inc. (e) | 2,255 | 134,984 | ||||||||||||||
Vishay Intertechnology, Inc. | 5,315 | 98,168 | ||||||||||||||
Zix Corp. (e) | 1,645 | 11,318 | ||||||||||||||
| 2,846,322 |
| ||||||||||||||
Total Common Stock (cost-$4,713,913) |
| 5,179,275 |
| |||||||||||||
| See accompanying Notes to Financial Statements | 31 | Semiannual Report / March 31, 2019 |
Schedule of Investments
March 31, 2019 (unaudited)
AllianzGI Global Small-Cap Opportunities Portfolio
| Shares | Value | |||||||||||||||
PREFERRED STOCK - 0.4% | ||||||||||||||||
Brazil - 0.4% | ||||||||||||||||
Cia Paranaense de Energia (cost-$22,392) |
| 2,500
|
|
| 23,242
|
| ||||||||||
Total Investments(cost-$4,736,305) (b)-99.7% |
| 5,202,517
|
| |||||||||||||
Other assets less liabilities-0.3% |
| 14,859 |
| |||||||||||||
Net Assets-100.0% | $ | 5,217,376 | ||||||||||||||
| See accompanying Notes to Financial Statements | 32 | Semiannual Report / March 31, 2019 |
Schedule of Investments
March 31, 2019 (unaudited)
AllianzGI Global Small-Cap Opportunities Portfolio
Notes to Schedule of Investments:
| (a) | 144A—Exempt from registration under Rule 144A of the Securities Act of 1933. These securities may be resold in transactions exempt from registration, typically only to qualified institutional buyers. Security with a value of $9,946, representing 0.2% of net assets. |
| (b) | Securities with an aggregate value of $1,860,046, representing 35.7% of net assets, were valued utilizing modeling tools provided by a third-party vendor. See Note 1(a) and Note 1(b) in the Notes to Financial Statements. |
| (c) | Fair-Valued—Securities with an aggregate value of $155,417, representing 3.0% of net assets. See Note 1(a) and Note 1(b) in the Notes to Financial Statements. |
| (d) | Level 3 security. See Note 1(a) and Note 1(b) in the Notes to Financial Statements. |
| (e) | Non-income producing. |
Glossary:
ADR - American Depositary Receipt
REIT - Real Estate Investment Trust
UNIT - More than one class of securities traded together
| See accompanying Notes to Financial Statements | 33 | Semiannual Report / March 31, 2019 |
Schedule of Investments
March 31, 2019 (unaudited)
AllianzGI Global Small-Cap Opportunities Portfolio
The industry classification of portfolio holdings and other assets less liabilities shown as a percentage of net assets were as follows:
Equity Real Estate Investment Trusts (REITs) | 10.1 | % | ||
Life Sciences Tools & Services | 8.7 | % | ||
Electronic Equipment, Instruments & Components | 6.1 | % | ||
Oil, Gas & Consumable Fuels | 5.3 | % | ||
IT Services | 4.7 | % | ||
Software | 4.0 | % | ||
Professional Services | 3.7 | % | ||
Insurance | 3.4 | % | ||
Specialty Retail | 3.2 | % | ||
Airlines | 3.0 | % | ||
Metals & Mining | 2.9 | % | ||
Road & Rail | 2.9 | % | ||
Healthcare Equipment & Supplies | 2.8 | % | ||
Commercial Services & Supplies | 2.8 | % | ||
Aerospace & Defense | 2.7 | % | ||
Biotechnology | 2.5 | % | ||
Textiles, Apparel & Luxury Goods | 2.3 | % | ||
Hotels, Restaurants & Leisure | 2.2 | % | ||
Household Durables | 2.0 | % | ||
Machinery | 1.8 | % | ||
Banks | 1.8 | % | ||
Leisure Equipment & Products | 1.8 | % | ||
Healthcare Providers & Services | 1.7 | % | ||
Real Estate Management & Development | 1.5 | % | ||
Thrifts & Mortgage Finance | 1.4 | % | ||
Electrical Equipment | 1.4 | % | ||
Media | 1.3 | % | ||
Electric Utilities | 1.2 | % | ||
Entertainment | 1.2 | % | ||
Paper & Forest Products | 1.0 | % | ||
Diversified Telecommunication Services | 0.9 | % | ||
Trading Companies & Distributors | 0.9 | % | ||
Independent Power Producers & Energy Traders | 0.7 | % | ||
Auto Components | 0.6 | % | ||
Construction & Engineering | 0.6 | % | ||
Food Products | 0.6 | % | ||
Capital Markets | 0.5 | % | ||
Mortgage Real Estate Investment Trusts (REITs) | 0.5 | % | ||
Transportation Infrastructure | 0.5 | % | ||
Construction Materials | 0.5 | % | ||
Water Utilities | 0.4 | % | ||
Pharmaceuticals | 0.4 | % | ||
Chemicals | 0.3 | % | ||
Diversified Consumer Services | 0.3 | % | ||
Interactive Media & Services | 0.2 | % | ||
Consumer Finance | 0.2 | % | ||
Building Products | 0.2 | % | ||
Other assets less liabilities | 0.3 | % | ||
|
100.0
|
%
|
| See accompanying Notes to Financial Statements | 34 | Semiannual Report / March 31, 2019 |
Statements of Assets and Liabilities
March 31, 2019 (unaudited)
AllianzGI Advanced Core Bond | AllianzGI Best Styles Global Managed Volatility | AllianzGI Global Small-Cap Opportunities | ||||||||||
Assets: | ||||||||||||
Investments, at value | $137,224,582 | $48,536,351 | $5,202,517 | |||||||||
Cash | 346 | 362 | 85,185 | |||||||||
Foreign currency, at value | – | 80,591 | 29,064 | |||||||||
Dividends and interest receivable (net of foreign withholding taxes) | 842,575 | 165,556 | 9,845 | |||||||||
Deposits with brokers for derivatives collateral | 359,545 | – | – | |||||||||
Receivable for variation margin on futures contracts | 23,844 | – | – | |||||||||
Investments in Affiliated Funds - Trustees Deferred Compensation Plan (see Note 4) | 19,521 | 8,313 | 780 | |||||||||
Receivable for investments sold | – | – | 137,595 | |||||||||
Tax reclaims receivable | – | 28,736 | 1,420 | |||||||||
Receivable from Investment Manager | – | 4,409 | 6,997 | |||||||||
Prepaid expenses and other assets | 3,704 | 1,753 | 1,251 | |||||||||
Total Assets | 138,474,117 | 48,826,071 | 5,474,654 | |||||||||
Liabilities: | ||||||||||||
Payable for TBA investments purchased | 29,500,959 | – | – | |||||||||
Payable to broker | 410,000 | – | – | |||||||||
Trustees Deferred Compensation Plan payable (see Note 4) | 19,521 | 8,313 | 780 | |||||||||
Investment management fees payable | 10,760 | – | – | |||||||||
Payable for investments purchased | – | – | 173,847 | |||||||||
Accrued expenses and other liabilities | 185,087 | 202,496 | 82,651 | |||||||||
Total Liabilities | 30,126,327 | 210,809 | 257,278 | |||||||||
Net Assets | $108,347,790 | $48,615,262 | $5,217,376 | |||||||||
Net Assets Consist of: | ||||||||||||
Paid-in-capital | $113,306,540 | $42,848,643 | $4,771,459 | |||||||||
Total distributable earnings | (4,958,750 | ) | 5,766,619 | 445,917 | ||||||||
Net Assets | $108,347,790 | $48,615,262 | $5,217,376 | |||||||||
Cost of Investments | $136,261,744 | $43,049,589 | $4,736,305 | |||||||||
Cost of Foreign Currency | $– | $80,481 | $29,209 | |||||||||
Shares Issued and Outstanding | 7,372,371 | 3,142,896 | 321,005 | |||||||||
Net Asset Value Per Share* | $14.70 | $15.47 | $16.25 | |||||||||
| * | Net asset value and redemption price per share may not recalculate exactly due to rounding. |
| See accompanying Notes to Financial Statements | 35 | Semiannual Report / March 31, 2019 |
Six Months ended March 31, 2019 (unaudited)
AllianzGI Advanced Core Bond | AllianzGI Best Styles Global Managed Volatility | AllianzGI Global Small-Cap Opportunities | ||||||||||
Investment Income: | ||||||||||||
Dividends, net of foreign withholding taxes* | $– | $616,631 | $52,690 | |||||||||
Interest | 1,560,237 | 1,667 | 102 | |||||||||
Non-cash income | – | – | 4,040 | |||||||||
Miscellaneous | – | 4 | – | |||||||||
Total Investment Income | 1,560,237 | 618,302 | 56,832 | |||||||||
Expenses: | ||||||||||||
Investment management | 169,173 | 95,968 | 22,663 | |||||||||
Custodian and accounting agent | 62,837 | 109,616 | 26,965 | |||||||||
Audit and tax services | 20,688 | 19,056 | 19,189 | |||||||||
Legal | 39,851 | 13,457 | 21,598 | |||||||||
Shareholder communications | 7,411 | 6,917 | 3,962 | |||||||||
Trustees | 8,939 | 3,559 | 313 | |||||||||
Insurance | 4,930 | 3,505 | 2,503 | |||||||||
Transfer agent | 3,967 | 2,973 | 2,416 | |||||||||
Line of credit commitment | 1,540 | 652 | 65 | |||||||||
Miscellaneous | 3,745 | 1,992 | 1,685 | |||||||||
Total Expenses | 323,081 | 257,695 | 101,359 | |||||||||
Less: Fee Waiver/Reimbursement from Investment Manager | (122,474 | ) | (149,051 | ) | (71,076 | ) | ||||||
Net Expenses | 200,607 | 108,644 | 30,283 | |||||||||
Net Investment Income | 1,359,630 | 509,658 | 26,549 | |||||||||
Realized and Change in Unrealized Gain (Loss): |
| |||||||||||
Net realized gain (loss) on: | ||||||||||||
Investments | (709,373 | ) | 698,565 | 42,222 | ||||||||
Futures contracts | (98,789 | ) | – | – | ||||||||
Foreign currency transactions | – | (2,452 | ) | (1,345 | ) | |||||||
Net change in unrealized appreciation/depreciation of: | ||||||||||||
Investments | 4,361,550 | (1,367,226 | ) | (358,529 | ) | |||||||
Futures contracts | (164,898 | ) | – | – | ||||||||
Foreign currency transactions | – | (798 | ) | 801 | ||||||||
Net realized and change in unrealized gain (loss) | 3,388,490 | (671,911 | ) | (316,851 | ) | |||||||
Net Increase (Decrease) in Net Assets Resulting from Investment Operations | $4,748,120 | $(162,253 | ) | $(290,302 | ) | |||||||
*Foreign withholding taxes | $– | $23,080 | $4,039 | |||||||||
| See accompanying Notes to Financial Statements | 36 | Semiannual Report / March 31, 2019 |
Statements of Changes in Net Assets
| AllianzGI Advanced Core Bond | AllianzGI Best Styles Global Managed Volatility | |||||||||||||||
Six Months ended March 31, 2019 | Year ended September 30, 2018 | Six Months ended March 31, 2019 (unaudited) | Year ended September 30, 2018 | |||||||||||||
Increase (Decrease) in Net Assets from: | ||||||||||||||||
Investment Operations: | ||||||||||||||||
Net investment income | $1,359,630 | $3,268,756 | $509,658 | $1,480,525 | ||||||||||||
Net realized gain (loss) | (808,162 | ) | (1,960,378 | ) | 696,113 | 5,294,405 | ||||||||||
Net change in unrealized appreciation/depreciation | 4,196,652 | (3,766,078 | ) | (1,368,024 | ) | (1,619,923 | ) | |||||||||
Net increase (decrease) in net assets resulting from investment operations | 4,748,120 | (2,457,700 | ) | (162,253 | ) | 5,155,007 | ||||||||||
Distributions to Shareholders: | ||||||||||||||||
Total distributions paid | (1,672,345 | ) | (3,640,184 | ) | (7,046,627 | ) | (4,309,656 | ) | ||||||||
Fund Share Transactions: | ||||||||||||||||
Net proceeds from the sale of shares | 2,481,154 | 28,851,924 | 531,957 | 3,721,485 | ||||||||||||
Issued in reinvestment of distributions | 1,672,345 | 3,640,184 | 7,046,627 | 4,309,656 | ||||||||||||
Cost of shares redeemed | (23,389,108 | ) | (46,841,138 | ) | (3,576,367 | ) | (16,171,024 | ) | ||||||||
Net increase (decrease) from Fund share transactions | (19,235,609 | ) | (14,349,030 | ) | 4,002,217 | (8,139,883 | ) | |||||||||
Total increase (decrease) in net assets | (16,159,834 | ) | (20,446,914 | ) | (3,206,663 | ) | (7,294,532 | ) | ||||||||
Net Assets: | ||||||||||||||||
Beginning of period | 124,507,624 | 144,954,538 | 51,821,925 | 59,116,457 | ||||||||||||
End of period | $108,347,790 | $124,507,624 | $48,615,262 | $51,821,925 | ||||||||||||
Shares Activity: | ||||||||||||||||
Issued | 174,309 | 1,962,293 | 31,126 | 210,288 | ||||||||||||
Issued in reinvestment of distributions | 116,444 | 252,182 | 506,587 | 248,109 | ||||||||||||
Redeemed | (1,637,782 | ) | (3,253,673 | ) | (256,003 | ) | (909,101 | ) | ||||||||
Net increase (decrease) | (1,347,029 | ) | (1,039,198 | ) | 281,710 | (450,704 | ) | |||||||||
| – | May reflect actual amounts rounding to less than $1. |
| See accompanying Notes to Financial Statements | 37 | Semiannual Report / March 31, 2019 |
Statements of Changes in Net Assets
| AllianzGI Global Small-Cap Opportunities | ||||||
| Six Months ended March 31, 2019 (unaudited) | Year ended September 30, 2018 | |||||
| |
|
| ||||
| $26,549 | $61,204 | |||||
| 40,877 | 351,072 | |||||
| | (357,728) |
| 40,320 | |||
| |
(290,302) |
| 452,596 | |||
| |
|
| ||||
| (441,283) | (716,041) | |||||
| | – |
| – | |||
| | 441,283 |
| 716,041 | |||
| – | – | |||||
| |
441,283 |
| 716,041 | |||
| | (290,302) |
| 452,596 | |||
| 5,507,678 | 5,055,082 | |||||
| $5,217,376 | $5,507,678 | |||||
| – | – | |||||
| | 30,433 |
| 40,159 | |||
| – | – | |||||
| 30,433 | 40,159 | |||||
| See accompanying Notes to Financial Statements | 38 | Semiannual Report / March 31, 2019 |
For a share of common stock outstanding throughout each period:^
| AllianzGI Advanced Core Bond | AllianzGI Best Styles Global Managed Volatility | |||||||||||||||
| Six months ended March 31, 2019 (unaudited) | Year ended September 30, 2018 | Year ended September 30, 2017 | Period from October 30, 2015* through September 30, 2016 | Six months ended March 31, 2019 (unaudited) | September 30, 2018 | September 30, 2017 | Period from April 11, 2016* through September 30, 2016 | |||||||||
Net asset value, beginning of period | $14.28 | $14.85 | $15.71 | $15.00 | $18.11 | $17.85 | $15.81 | $15.00 | ||||||||
Investment Operations: | ||||||||||||||||
Net investment income(a) | 0.17 | 0.31 | 0.25 | 0.21 | 0.17 | 0.42 | 0.40 | 0.22 | ||||||||
Net realized and change in unrealized gain (loss) | 0.47 | (0.53) | (0.34) | 0.57 | (0.37) | 1.09 | 1.99 | 0.59 | ||||||||
Total from investment operations | 0.64 | (0.22) | (0.09) | 0.78 | (0.20) | 1.51 | 2.39 | 0.81 | ||||||||
Dividends and Distributions to Shareholders from: | ||||||||||||||||
Net investment income | (0.22) | (0.35) | (0.60) | (0.07) | (0.50) | (0.60) | (0.31) | — | ||||||||
Net realized gains | — | — | (0.17) | — | (1.94) | (0.65) | (0.04) | — | ||||||||
Total dividends and distributions to shareholders | (0.22) | (0.35) | (0.77) | (0.07) | (2.44) | (1.25) | (0.35) | — | ||||||||
Net asset value, end of period | $14.70 | $14.28 | $14.85 | $15.71 | $15.47 | $18.11 | $17.85 | $15.81 | ||||||||
Total Return(b) | 4.51% | (1.48)% | (0.43)% | 5.23% | 0.38% | 8.77% | 15.41% | 5.40% | ||||||||
RATIOS/SUPPLEMENTAL DATA: | ||||||||||||||||
Net assets, end of period (000s) | $108,348 | $124,508 | $144,955 | $173,411 | $48,615 | $51,822 | $59,116 | $77,339 | ||||||||
Ratio of expenses to average net assets with fee reimbursement | 0.35%(c) | 0.35% | 0.35% | 0.41%(c)(d) | 0.45%(c)(e) | 0.45%(e) | 0.45%(e) | 0.45%(c)(d) | ||||||||
Ratio of expenses to average net assets without fee reimbursement | 0.57%(c) | 0.50% | 0.44% | 0.62%(c)(d) | 1.07%(c)(e) | 0.84%(e) | 0.83%(e) | 0.99%(c)(d) | ||||||||
Ratio of net investment income to average net assets | 2.41%(c) | 2.13% | 1.67% | 1.52%(c)(d) | 2.12%(c)(e) | 2.37%(e) | 2.42%(e) | 2.96%(c)(d) | ||||||||
Portfolio turnover rate | 150% | 314% | 319% | 260% | 19% | 59% | 31%(f) | 1% | ||||||||
| ^ | A — may reflect actual amounts rounding to less than $0.01 or 0.01%. |
| * | Commencement of operations. |
| (a) | Calculated on average shares outstanding during the period. |
| (b) | Total return is calculated assuming a purchase of a share on the first day of the period and a sale of a share on the last day of each period reported. Dividends and distributions, if any, are assumed, for purposes of this calculation, to be reinvested. Total return does not reflect sales charges and includes the effect of expense reimbursements. Total return may reflect adjustments to conform to U.S. GAAP. Total return for a period of less than one year is not annualized. |
| (c) | Annualized, unless otherwise noted. |
| (d) | Certain expenses incurred were not annualized. |
| (e) | Does not include expenses of the investment in which the Portfolio invests. |
| (f) | Portfolio turnover rate excludes securities received or delivered from in-kind fund share transactions. |
| See accompanying Notes to Financial Statements | 39 | Semiannual Report / March 31, 2019 |
Financial Highlights
For a share of common stock outstanding throughout each period:^
| AllianzGI Global Small-Cap Opportunities | ||||||||||||
| Six Months ended March 31, 2019 (unaudited) | Year ended 2018 | Year ended 2017 | Year ended 2016 | Period from 12/1/2014 through 9/30/2015# | Period 7/23/2014* through 11/30/2014 | |||||||
Net asset value, beginning of period | $18.95 | $20.19 | $15.72 | $14.53 | $14.70 | $15.00 | ||||||
Investment Operations: | ||||||||||||
Net investment income(a) | 0.09 | 0.22 | 0.19 | 0.15 | 0.12 | 0.05 | ||||||
Net realized and change in unrealized gain (loss) | (1.27) | 1.40 | 4.49 | 1.13 | (0.25) | (0.35) | ||||||
Total from investment operations | (1.18) | 1.62 | 4.68 | 1.28 | (0.13) | (0.30) | ||||||
Dividends and Distributions to Shareholders from: | ||||||||||||
Net investment income | (0.31) | (0.43) | (0.21) | (0.09) | (0.04) | — | ||||||
Net realized gains | (1.21) | (2.43) | — | — | — | — | ||||||
Total dividends and distributions to shareholders | (1.52) | (2.86) | (0.21) | (0.09) | (0.04) | — | ||||||
Net asset value, end of period | $16.25 | $18.95 | $20.19 | $15.72 | $14.53 | $14.70 | ||||||
Total Return(b) | (5.27)% | 8.91% | 30.06% | 8.85% | (0.86)% | (2.00)% | ||||||
RATIOS/SUPPLEMENTAL DATA: | ||||||||||||
Net assets, end of period (000s) | $5,217 | $5,508 | $5,055 | $5,287 | $4,856 | $4,899 | ||||||
Ratio of expenses to average net assets with fee reimbursement | 1.20%(c) | 1.20% | 1.20% | 1.20% | 1.22%(c)(d) | 1.20%(c)(d) | ||||||
Ratio of expenses to average net assets without fee reimbursement | 4.03%(c) | 3.70% | 4.24% | 5.48% | 7.06%(c)(d) | 4.88%(c)(d) | ||||||
Ratio of net investment income to average net assets | 1.05%(c) | 1.16% | 1.10% | 1.04% | 0.91%(c)(d) | 0.88%(c)(d) | ||||||
Portfolio turnover rate | 26% | 98% | 143% | 177% | 152% | 56% | ||||||
| ^ | A — may reflect actual amounts rounding to less than $0.01 or 0.01%. |
| * | Commencement of operations. |
| # | Fiscal year end changed from November 30th to September 30th. |
| (a) | Calculated on average shares outstanding during the period. |
| (b) | Total return is calculated assuming a purchase of a share on the first day of the period and a sale of a share on the last day of each period reported. Dividends and distributions, if any, are assumed, for purposes of this calculation, to be reinvested. Total return does not reflect sales charges and includes the effect of expense reimbursements. Total return may reflect adjustments to conform to U.S. GAAP. Total return for a period of less than one year is not annualized. |
| (c) | Annualized, unless otherwise noted. |
| (d) | Certain expenses incurred were not annualized. |
| See accompanying Notes to Financial Statements | 40 | Semiannual Report / March 31, 2019 |
AllianzGI Institutional Multi-Series Trust
March 31, 2019 (unaudited)
1. ORGANIZATION AND SIGNIFICANT ACCOUNTING POLICIES
AllianzGI Institutional Multi-Series Trust (the “Trust”) was organized on June 3, 2014 and is registered under the Investment Company Act of 1940, as amended (the “1940-Act”), as an open-end registered investment company. The Trust follows the investment company accounting and reporting guidance of the Financial Accounting Standards Board (“FASB”) Accounting Standard Codification Topic 946 Financial Services-Investment Companies. As of March 31, 2019, the Trust consisted of three separate investment series, (each a “Portfolio” and together the “Portfolios”). AllianzGI US serves as the Portfolios’ investment manager. AllianzGI U.S. is an indirect, wholly-owned subsidiary of Allianz Asset Management of America L.P. (“AAM”). AAM is an indirect, wholly-owned subsidiary of Allianz SE, a publicly traded European insurance and financial services company. Shares of the Portfolios have not been registered for public sale and are currently offered and sold on a private placement basis in accordance with Rule 506(c) of Regulation D under the Securities Act of 1933, as amended. Currently, the Trust has authorized one class of shares.
The investment objective of AllianzGI Advanced Core Bond is to seek long-term risk adjusted total net return. The investment objective of AllianzGI Best Styles Global Managed Volatility and AllianzGI Global Small-Cap Opportunities is to seek long-term capital appreciation. There can be no assurance that the Portfolios will meet their stated objective.
The preparation of the Portfolios’ financial statements in accordance with accounting principles generally accepted in the United States of America (“U.S. GAAP”) requires the Portfolios’ management to make estimates and assumptions that affect the reported amounts and disclosures in each Portfolio’s financial statements. Actual results could differ from those estimates.
In the normal course of business, the Portfolios enter into contracts that contain a variety of representations that provide general indemnifications. The Portfolios’ maximum exposures under these arrangements are unknown as this would involve future claims that may be made against the Portfolios that have not yet occurred. However, based on experience, the risk of loss is expected to be remote.
Like many other companies, the Portfolios’ organizational documents provide that its officers (“Officers”) and the Board of Trustees of the Portfolios (the “Board”) are indemnified against certain liabilities arising out of the performance of their duties to the Portfolios. In addition, both in some of its principal service contracts and in the normal course of its business, the Portfolios enter into contracts that provide indemnifications to other parties for certain types of losses or liabilities. The Portfolios maximum exposure under these arrangements is unknown as this could involve future claims against the Portfolios.
The following is a summary of significant accounting policies consistently followed by the Portfolios:
(a) Valuation of Investments. Portfolio securities and other financial instruments for which market quotations are readily available are stated at market value. Market values for various types of the securities and other instruments are determined on the basis of closing prices or last sales prices on an exchange or other market, or based on quotes or other market information obtained from quotation reporting systems, established market makers or pricing services. Investments in mutual funds are valued at the net asset value per share (“NAV”) as reported on each business day. The Portfolios’ investments are valued daily using prices supplied by an independent pricing service or broker/dealer quotations, or by using the last sale or settlement price on the exchange that is the primary market for such securities, or the mean between the last bid and ask quotations. The market value for NASDAQ Global Market and NASDAQ Capital Market securities may also be calculated using the NASDAQ Official Closing Price instead of the last reported sales price. Independent pricing services use information provided by market makers or estimates of market values obtained from yield data relating to investments or securities with similar characteristics. Exchange traded futures are valued at the price determined by the relevant exchange. Securities purchased on a when-issued or delayed-delivery basis are marked to market daily until settlement at the forward settlement date.
The Board has adopted procedures for valuing portfolio securities and other financial derivative instruments in circumstances where market quotations are not readily available (including in cases where available market quotations are deemed to be unreliable), and has delegated primary responsibility for applying the valuation methods to the Investment Manager. The
| 41 | Semiannual Report / March 31, 2019 |
AllianzGI Institutional Multi-Series Trust
Notes to Financial Statements (unaudited) (continued)
Trust’s Valuation Committee was established by the Board to oversee the implementation of the Portfolios’ valuation methods and to make fair value determinations on behalf of the Board, as instructed. The Investment Manager monitors the continued appropriateness of methods applied and identifies circumstances and events that may require fair valuation. The Investment Manager determines if adjustments should be made in light of market changes, events affecting the issuer, or other factors. If the Investment Manager determines that a valuation method may no longer be appropriate, another valuation method previously approved by the Trust’s Valuation Committee may be selected or the Trust’s Valuation Committee will be convened to consider the matter and take any appropriate action in accordance with procedures adopted by the Board. The Board shall review the appropriateness of the valuation methods and these methods may be amended or supplemented from time to time by the Trust’s Valuation Committee.
Short-term debt investments having a remaining maturity of 60 days or less will be valued at amortized cost unless the Board or its Valuation Committee determines that particular circumstances dictate otherwise.
Investments initially valued in currencies other than the U.S. dollar are converted to the U.S. dollar using exchange rates obtained from pricing services. As a result, the NAV of each Portfolio may be affected by changes in the value of currencies in relation to the U.S. dollar. The value of securities traded in markets outside the United States or denominated in currencies other than the U.S. dollar may be affected significantly on a day that the New York Stock Exchange (“NYSE”) is closed.
The prices used by the Portfolios to value investments may differ from the value that would be realized if the investments were sold, and these differences could be material to the Portfolios’ financial statements. Each Portfolio’s NAV is normally determined as of the close of regular trading (normally, 4:00 p.m., Eastern Time) on the NYSE on each day the NYSE is open for business. In unusual circumstances, the Board or the Valuation Committee may in good faith determine the NAV as of 4:00 p.m., Eastern Time, notwithstanding an earlier, unscheduled close or halt of trading on the NYSE.
The prices of certain portfolio securities or financial instruments may be determined at a time prior to the close of regular trading on the NYSE. In considering whether fair value pricing is required and in determining fair values, the Portfolios may, among other things, consider significant events (which may be considered to include changes in the value of U.S. securities or securities indices) that occur after the close of the relevant market and before the time the NAV of a Portfolio is calculated. With respect to certain foreign securities, the Portfolios may fair-value securities using modeling tools provided by third-party vendors, where appropriate. The Portfolios have retained a statistical research service to assist in determining the fair value of foreign securities. This service utilizes statistics and programs based on historical performance of markets and other economic data to assist in making fair value estimates. Fair value estimates used by the Portfolios for foreign securities may differ from the value realized from the sale of those securities and the difference could be material to the financial statements. Fair value pricing may require subjective determinations about the value of a security or other assets, and fair values used to determine the NAV of a Portfolio may differ from quoted or published prices, or from prices that are used by others, for the same investments. In addition, the use of fair value pricing may not always result in adjustments to the prices of securities or other assets held by a Portfolio.
(b) Fair Value Measurements.Fair value is defined as the price that would be received to sell an asset or paid to transfer a liability (i.e., the “exit price”) in an orderly transaction between market participants. The three levels of the fair value hierarchy are described below:
| · | Level 1 – quoted prices in active markets for identical investments that the Portfolios have the ability to access |
| · | Level 2 – valuations based on other significant observable inputs, which may include, but are not limited to, quoted prices for similar assets or liabilities, interest rates, yield curves, volatilities, prepayment speeds, loss severities, credit risks and default rates or other market corroborated inputs |
| · | Level 3 – valuations based on significant unobservable inputs (including the Investment Manager’s or Trust’s Valuation Committee’s own assumptions and securities whose price was determined by using a single broker’s quote) |
The valuation techniques used by the Portfolios to measure fair value during the six months ended March 31, 2019 were intended to maximize the use of observable inputs and to minimize the use of unobservable inputs.
An investment asset’s or liability’s level within the fair value hierarchy is based on the lowest level input, individually or in aggregate, that is significant to the fair value measurement. The objective of fair value measurement remains the same even when there is a significant decrease in the volume and level of activity for an asset or liability and regardless of the valuation techniques used.
| 42 | Semiannual Report / March 31, 2019 |
AllianzGI Institutional Multi-Series Trust
Notes to Financial Statements (unaudited) (continued)
The inputs or methodology used for valuing securities are not necessarily an indication of the risk associated with investing in those securities. The following are certain inputs and techniques that the Portfolios generally use to evaluate how to classify each major category of assets and liabilities within Level 2 and Level 3, in accordance with U.S. GAAP.
An asset or liability for which market values cannot be measured using the methodologies described above is valued by methods deemed reasonable in good faith by the Valuation Committee, following the procedures established by the Board, to represent fair value. Under these procedures, the Portfolios generally use a market-based approach which may use related or comparable assets or liabilities, recent transactions, market multiples, book values and other relevant information. Fair value determinations involve the consideration of a number of subjective factors, an analysis of applicable facts and circumstances and the exercise of judgment. As a result, it is possible that the fair value for a security determined in good faith in accordance with the Portfolios’ valuation procedures may differ from valuations for the same security determined by other funds using their own valuation procedures. Although the Portfolios’ valuation procedures are designed to value a security at the price the Portfolios may reasonably expect to receive upon the security’s sale in an orderly transaction, there can be no assurance that any fair value determination thereunder would, in fact, approximate the amount that the Portfolios would actually realize upon the sale of the security or the price at which the security would trade if a reliable market price were readily available.
Equity Securities (Common and Preferred Stock and Warrants)— Equity securities traded in inactive markets and certain foreign equity securities are valued using inputs which include broker-dealer quotes, recently executed transactions adjusted for changes in the benchmark index, or evaluated price quotes received from independent pricing services that take into account the integrity of the market sector and issuer, the individual characteristics of the security, and information received from broker-dealers and other market sources pertaining to the issuer or security. To the extent that these inputs are observable, the values of equity securities are categorized as Level 2. To the extent that these inputs are unobservable, the values are categorized as Level 3.
U.S. Treasury Obligations — U.S. Treasury obligations are valued by independent pricing services based on pricing models that evaluate the mean between the most recently quoted bid and ask price. The models also take into consideration data received from active market makers and broker-dealers, yield curves, and the spread over comparable U.S. Treasury issues. The spreads change daily in response to market conditions and are generally obtained from the new issue market and broker-dealer sources. To the extent that these inputs are observable, the values of U.S. Treasury obligations are categorized as Level 2. To the extent that these inputs are unobservable, the values are categorized as Level 3.
Government Sponsored Enterprise and Mortgage-Backed Securities — Government sponsored enterprise and mortgage-backed securities are valued by independent pricing services using pricing models based on inputs that include issuer type, coupon, cash flows, mortgage prepayment projection tables and Adjustable Rate Mortgage evaluations that incorporate index data, periodic life caps and the next coupon reset date. To the extent that these inputs are observable, the values of government sponsored enterprise and mortgage-backed securities are categorized as Level 2. To the extent that these inputs are unobservable, the values are categorized as Level 3.
Sovereign Debt Obligations — Sovereign debt obligations are valued by independent pricing services based on discounted cash flow models that incorporate option adjusted spreads along with benchmark curves and credit spreads. In addition, international bond markets are monitored regularly for information pertaining to the issuer and/or the specific issue. To the extent that these inputs are observable, the values of sovereign debt obligations are categorized as Level 2. To the extent that these inputs are unobservable, the values are categorized as Level 3.
Corporate Bonds & Notes — Corporate bonds & notes are generally comprised of two main categories: investment grade bonds and high yield bonds. Investment grade bonds are valued by independent pricing services using various inputs and techniques, which include broker-dealer quotations, live trading levels, recently executed transactions in securities of the issuer or comparable issuers, and option adjusted spread models that include base curve and spread curve inputs. Adjustments to individual bonds can be applied to recognize trading differences compared to other bonds issued by the same issuer. High yield bonds are valued by independent pricing services based primarily on broker-dealer quotations from relevant market
| 43 | Semiannual Report / March 31, 2019 |
AllianzGI Institutional Multi-Series Trust
Notes to Financial Statements (unaudited) (continued)
makers and recently executed transactions in securities of the issuer or comparable issuers. The broker-dealer quotations received are supported by credit analysis of the issuer that takes into consideration credit quality assessments, daily trading activity, and the activity of the underlying equities, listed bonds and sector-specific trends. To the extent that these inputs are observable, the values of corporate bonds & notes are categorized as Level 2. To the extent that these inputs are unobservable, the values are categorized as Level 3.
A summary of the inputs used at March 31, 2019 in valuing each Portfolio’s assets and liabilities is listed below (refer to the Schedules of Investments and Notes to Schedules of Investments for more detailed information on Investments in Securities and Other Financial Instruments):
| AllianzGI Advanced Core Bond: |
| |||||||||||||||
Level 1 - Quoted Prices | Level 2 - Other Significant Observable Inputs | Level 3 - Significant Unobservable Inputs | Value at 3/31/19 | |||||||||||||
Investments in Securities - Assets | ||||||||||||||||
Corporate Bonds & Notes | — | $ | 62,360,885 | — | $ | 62,360,885 | ||||||||||
U.S. Government Agency Securities | — | 30,296,501 | — | 30,296,501 | ||||||||||||
U.S. Treasury Obligations | — | 27,832,083 | — | 27,832,083 | ||||||||||||
Sovereign Debt Obligations | — | 14,836,113 | — | 14,836,113 | ||||||||||||
Repurchase Agreements | — | 1,899,000 | — | 1,899,000 | ||||||||||||
| — | 137,224,582 | — | 137,224,582 | |||||||||||||
Other Financial Instruments* – Liabilities | ||||||||||||||||
Interest Rate Contracts | $ | (73,268 | ) | — | — | (73,268 | ) | |||||||||
Totals | $ | (73,268 | ) | $ | 137,224,582 | — | $ | 137,151,314 | ||||||||
| AllianzGI Best Styles Global Managed Volatility: |
| |||||||||||||||
Level 1 - Quoted Prices | Level 2 - Other Significant Observable Inputs | Level 3 - Significant Unobservable Inputs | Value at 3/31/19 | |||||||||||||
Investments in Securities - Assets |
| |||||||||||||||
Common Stock: |
| |||||||||||||||
Australia | — | $ | 372,512 | — | $ | 372,512 | ||||||||||
Austria | $ | 41,611 | 23,416 | — | 65,027 | |||||||||||
Belgium | — | 158,613 | — | 158,613 | ||||||||||||
China | 23,695 | 1,207,063 | �� | 1,230,758 | ||||||||||||
Czech Republic | 45,549 | 163,793 | — | 209,342 | ||||||||||||
Denmark | 25,234 | 45,745 | — | 70,979 | ||||||||||||
Finland | 108,145 | 233,155 | — | 341,300 | ||||||||||||
France | 91,386 | 484,687 | — | 576,073 | ||||||||||||
Germany | 82,578 | 341,423 | — | 424,001 | ||||||||||||
Hong Kong | — | 890,335 | — | 890,335 | ||||||||||||
Hungary | — | 173,273 | — | 173,273 | ||||||||||||
Indonesia | — | 55,282 | — | 55,282 | ||||||||||||
Israel | — | 381,782 | — | 381,782 | ||||||||||||
Italy | — | 577,579 | — | 577,579 | ||||||||||||
Japan | 13,415 | 5,924,277 | $ | 79,496 | 6,017,188 | |||||||||||
Korea (Republic of) | — | 488,906 | — | 488,906 | ||||||||||||
Malaysia | — | 610,146 | — | 610,146 | ||||||||||||
Netherlands | 109,573 | 377,855 | — | 487,428 | ||||||||||||
New Zealand | — | 164,627 | — | 164,627 | ||||||||||||
Norway | — | 111,759 | — | 111,759 | ||||||||||||
Poland | — | 86,655 | — | 86,655 | ||||||||||||
Singapore | 3,427 | 697,476 | — | 700,903 | ||||||||||||
Spain | — | 109,269 | — | 109,269 | ||||||||||||
Sweden | — | 142,633 | — | 142,633 | ||||||||||||
Switzerland | 10,616 | 755,770 | — | 766,386 | ||||||||||||
Taiwan | — | 2,295,567 | — | 2,295,567 | ||||||||||||
Thailand | — | 106,303 | 645,536 | 751,839 | ||||||||||||
United Kingdom | 102,633 | 404,753 | — | 507,386 | ||||||||||||
All Other | 28,661,822 | — | — | 28,661,822 | ||||||||||||
Exchange-Traded Funds | 357,920 | — | — | 357,920 | ||||||||||||
Mutual Funds | — | 111,061 | — | 111,061 | ||||||||||||
Repurchase Agreements | — | 638,000 | — | 638,000 | ||||||||||||
Totals | $ | 29,677,604 | $ | 18,133,715 | $ | 725,032 | $ | 48,536,351 | ||||||||
| 44 | Semiannual Report / March 31, 2019 |
AllianzGI Institutional Multi-Series Trust
Notes to Financial Statements(unaudited) (continued)
| AllianzGI Global Small-Cap Opportunities: |
| |||||||||||||||
Level 1 - Quoted Prices | Level 2 - Other Significant Observable Inputs | Level 3 - Significant Unobservable Inputs | Value at 3/31/19 | |||||||||||||
Investments in Securities - Assets |
| |||||||||||||||
Common Stock: |
| |||||||||||||||
Australia | — | $ | 165,150 | — | $ | 165,150 | ||||||||||
Austria | — | 23,245 | — | 23,245 | ||||||||||||
Canada | $ | 108,340 | 20,895 | — | 129,235 | |||||||||||
China | — | 216,341 | — | 216,341 | ||||||||||||
Denmark | — | 82,235 | — | 82,235 | ||||||||||||
Finland | — | 9,571 | — | 9,571 | ||||||||||||
France | — | 17,109 | — | 17,109 | ||||||||||||
Germany | — | 8,699 | — | 8,699 | ||||||||||||
Hong Kong | — | 109,781 | — | 109,781 | ||||||||||||
India | 47,943 | 45,190 | — | 93,133 | ||||||||||||
Indonesia | — | 31,315 | — | 31,315 | ||||||||||||
Italy | — | 44,037 | — | 44,037 | ||||||||||||
Japan | — | 591,659 | — | 591,659 | ||||||||||||
Korea (Republic of) | 19,909 | 33,847 | — | 53,756 | ||||||||||||
Netherlands | — | 58,041 | — | 58,041 | ||||||||||||
Norway | — | 18,146 | — | 18,146 | ||||||||||||
Russian Federation | — | — | $ | 99,234 | 99,234 | |||||||||||
Singapore | — | 118,474 | — | 118,474 | ||||||||||||
South Africa | — | 60,828 | — | 60,828 | ||||||||||||
Spain | — | 32,353 | — | 32,353 | ||||||||||||
Taiwan | — | 24,036 | — | 24,036 | ||||||||||||
Thailand | — | — | 56,183 | 56,183 | ||||||||||||
United Kingdom | 67,402 | 149,094 | — | 216,496 | ||||||||||||
All Other | 2,920,218 | — | — | 2,920,218 | ||||||||||||
Preferred Stock | 23,242 | — | — | 23,242 | ||||||||||||
Totals | $ | 3,187,054 | $ | 1,860,046 | $ | 155,417 | $ | 5,202,517 | ||||||||
A roll forward of fair value measurements using significant unobservable inputs (Level 3) for the six months ended March 31, 2019, was as follows:
AllianzGI Best Styles Global Managed Volatility:
Beginning Balance 9/30/18 | Purchases | Sales | Accrued Discount (Premiums) | Net Realized Gain (Loss) | Net Change in Unrealized Appreciation/ Depreciation | Transfers into Level 3 | Transfers out of Level 3 | Ending Balance 3/31/19 |
| |||||||||||||||||||||||||||||||
Investments in Securities - Assets |
| |||||||||||||||||||||||||||||||||||||||
Common Stock: |
| |||||||||||||||||||||||||||||||||||||||
Japan | $ | — | $ | — | $ | — | $ | — | $ | — | $ | — | $ | 79,496 | † | $ | — | $ | 79,496 | |||||||||||||||||||||
Thailand | 758,135 | 56,504 | (218,263 | ) | — | (15,376 | ) | 2,975 | 61,561 | †† | — | 645,536 | ||||||||||||||||||||||||||||
Totals | $ | 758,135 | $ | 56,504 | $ | (218,263 | ) | $ | — | $ | (15,376 | ) | $ | 2,975 | $ | 141,057 | $ | — | $ | 725,032 | ||||||||||||||||||||
AllianzGI Global Small-Cap Opportunities:
|
| |||||||||||||||||||||||||||||||||||||||
Beginning Balance 9/30/18 | Purchases | Sales | Accrued Discount (Premiums) | Net Realized Gain (Loss) | Net Change in Unrealized Appreciation/ Depreciation | Transfers into Level 3 | Transfers out of Level 3 | Ending Balance 3/31/19 | ||||||||||||||||||||||||||||||||
Investments in Securities - Assets |
| |||||||||||||||||||||||||||||||||||||||
Common Stock: |
| |||||||||||||||||||||||||||||||||||||||
Russian Federation | $ | 111,656 | $ | 3,100 | $ | — | $ | — | $ | — | $ | (15,522 | ) | $ | — | $ | — | $ | 99,234 | |||||||||||||||||||||
Thailand | 54,348 | — | — | — | — | 1,835 | — | — | 56,183 | |||||||||||||||||||||||||||||||
Totals | $ | 166,004 | $ | 3,100 | $ | — | $ | — | $ | — | $ | (13,687 | ) | $ | — | $ | — | $ | 155,417 | |||||||||||||||||||||
| 45 | Semiannual Report / March 31, 2019 |
AllianzGI Institutional Multi-Series Trust
Notes to Financial Statements(unaudited) (continued)
The table above may include Level 3 investments that are valued by brokers and independent pricing services. The inputs for these investments are not readily available or cannot be reasonably estimated and are generally those inputs described in Note 1(b).
The table above does not include Level 3 investments that are valued by brokers or independent pricing services.
*Other financial instruments are derivatives, such as futures contracts, which are valued at the unrealized appreciation (depreciation) of the instrument.
† Transferred out of Level 2 and into Level 3 due to an exchange traded closing price being unavailable or unreliable at March 31, 2019.
†† Transferred out of Level 1 and into Level 3 because an exchange traded price was not available in the foreign market at March 31, 2019.
The net change in unrealized appreciation/depreciation of Level 3 investments which the following Portfolios held at March 31, 2019 was:
AllianzGI Best Styles Global Managed Volatility | $ (70,484) | |||
AllianzGI Global Small-Cap Opportunities | (13,687) |
Net realized gain (loss) and net change in unrealized appreciation/depreciation are reflected on the Statements of Operations.
(c) Investment Transactions and Investment Income. Investment transactions are accounted for on the trade date. Securities purchased and sold on a when-issued or delayed-delivery basis may be settled beyond a standard settlement period for the security after the trade date. Realized gains and losses on investments are determined on an identified cost basis. Interest income adjusted for the accretion of discounts and amortization of premiums is recorded on an accrual basis. Discounts or premiums on debt securities purchased are accreted or amortized, respectively, to interest income. Dividend income is recorded on the ex-dividend date, except for certain dividends from foreign securities where the ex-dividend date may have passed, and then are recorded as soon after the ex-dividend date as the Portfolios, using reasonable diligence, become aware of such dividends. Dividend and interest income on the Statements of Operations are shown net of any foreign taxes withheld on income from foreign securities. Payments received from real estate investment trust securities may be comprised of dividends, realized gains and return of capital. The payment may initially be recorded as dividend income and may subsequently be reclassified as realized gains and/or return of capital upon receipt of information from the issuer. Payments considered return of capital reduce the cost basis of the respective security. Distributions, if any, in excess of the cost basis of a security are recognized as capital gains.
(d) Federal Income Taxes. The Portfolios intend to distribute all of their taxable income and to comply with the other requirements of Subchapter M of the U.S. Internal Revenue Code of 1986, as amended, applicable to regulated investment companies. Accordingly, no provision for U.S. federal income taxes is required. The Portfolios may be subject to excise tax based on distributions to shareholders.
Accounting for uncertainty in income taxes establishes for all entities, including pass-through entities such as the Portfolios, a minimum threshold for financial statement recognition of the benefit of positions taken in filing tax returns (including whether an entity is taxable in a particular jurisdiction), and requires certain expanded tax disclosures. In accordance with provisions set forth under U.S. GAAP, the Investment Manager has reviewed the Portfolios’ tax positions for all open tax years. As of March 31, 2019, the Portfolios have recorded no liability for net unrecognized tax benefits relating to uncertain income tax positions they have taken. The Portfolios’ federal income tax returns since inception remain subject to examination by the Internal Revenue Service.
(e) Dividends and Distributions to Shareholders. The Portfolios (except AllianzGI Advanced Core Bond) declare dividends and distributions from net investment income and net realized capital gains, if any, annually. AllianzGI Advanced Core Bond declares dividends from net investment income quarterly and distributions from net realized capital gains, if any, annually. The Portfolios record dividends and distributions to their respective shareholders on the ex-dividend date. The amount of dividends from net investment income and distributions from net realized capital gains is determined in accordance with federal income tax regulations, which may differ from U.S. GAAP. These “book-tax” differences are considered either temporary or permanent in nature. To the extent these differences are permanent in nature, such amounts are reclassified within the capital accounts based on their federal income tax treatment. Temporary differences do not require
| 46 | Semiannual Report / March 31, 2019 |
AllianzGI Institutional Multi-Series Trust
Notes to Financial Statements(unaudited) (continued)
reclassification. To the extent dividends and/or distributions exceed current and accumulated earnings and profits for federal income tax purposes, they are reported as dividends and/or distributions to shareholders from return of capital.
(f) Foreign Currency Translation. The Portfolios’ accounting records are maintained in U.S. dollars as follows: (1) the foreign currency market values of investments and other assets and liabilities denominated in foreign currencies are translated at the prevailing exchange rate at the end of the period; and (2) purchases and sales, income and expenses are translated at the prevailing exchange rate on the respective dates of such transactions. The resulting net foreign currency gain (loss) is included in the Portfolios’ Statements of Operations.
The Portfolios do not generally isolate that portion of the results of operations arising as a result of changes in foreign currency exchange rates from the fluctuations arising from changes in the market prices of securities. Accordingly, such foreign currency gain (loss) is included in net realized and unrealized gain (loss) on investments. However, the Portfolios do isolate the effect of fluctuations in foreign currency exchange rates when determining the gain (loss) upon the sale or maturity of foreign currency denominated debt obligations pursuant to U.S. federal income tax regulations; such amount is categorized as foreign currency gain (loss) for both financial reporting and income tax reporting purposes.
(g) Repurchase Agreements. The Portfolios are parties to Master Repurchase Agreements (“Master Repo Agreements”) with select counterparties. The Master Repo Agreements include provisions for initiation of repurchase transactions, income payments, events of default, and maintenance of collateral.
The Portfolios enter into transactions, under the Master Repo Agreements, with their custodian bank or securities brokerage firms whereby they purchase securities under agreements (i.e., repurchase agreements) to resell such securities at an agreed upon price and date. The Portfolios, through their custodian, take possession of securities collateralizing the repurchase agreement. Such agreements are carried at the contract amount in the financial statements, which is considered to represent fair value. The collateral that is pledged (i.e. the securities received by the Portfolios), which consists primarily of U.S. government obligations and asset-backed securities, is held by the custodian bank for the benefit of the Portfolios until maturity of the repurchase agreement. Provisions of the repurchase agreements and the procedures adopted by the Portfolios require that the market value of the collateral, including accrued interest thereon, be sufficient in the event of default by the counterparty. If the counterparty defaults under the Master Repo Agreements and the value of the collateral declines or if the counterparty initiates an insolvency proceeding, realization of the collateral by the Portfolios may be delayed or limited. The gross values are included in the Portfolios’ Schedules of Investments. As of March 31, 2019, the value of the related collateral exceeded the value of the repurchase agreements for each Portfolio.
(h) Rights. The Portfolios may receive rights. A right is a privilege granted to existing shareholders of a corporation to subscribe for shares of a new issue of common stock before it is issued. Rights normally have a short life, usually two to four weeks, are freely transferable and entitle the holder to buy the new common stock at a lower price than the public offering price. Rights may entail greater risks than certain other types of investments. Generally, rights do not carry the right to receive dividends or exercise voting rights with respect to the underlying securities, and they do not represent any rights in the assets of the issuer. In addition, their value does not necessarily change with the value of the underlying securities, and they cease to have value if they are not exercised on or before their expiration date. If the market price of the underlying stock does not exceed the exercise price during the life of the right, the right will expire worthless. Rights may increase the potential profit or loss to be realized from the investment as compared with investing the same amount in the underlying securities.
(i) U.S. Government Agencies or Government-Sponsored Enterprises.Securities issued by U.S. Government agencies or government-sponsored enterprises may not be guaranteed by the U.S. Treasury. The Government National Mortgage Association (“GNMA” or “Ginnie Mae”), a wholly-owned U.S. Government corporation, is authorized to guarantee, with the full faith and credit of the U.S. Government, the timely payment of principal and interest on securities issued by institutions approved by GNMA and backed by pools of mortgages insured by the Federal Housing Administration or guaranteed by the Department of Veterans Affairs. Government-related guarantors not backed by the full faith and credit of the U.S. Government include the Federal National Mortgage Association (“FNMA” or “Fannie Mae”) and the Federal Home Loan Mortgage Corporation (“FHLMC” or “Freddie Mac”). Pass-through securities issued by FNMA are guaranteed as to timely payment of principal and interest by FNMA, but are not backed by the full faith and credit of the U.S. Government. FHLMC guarantees the timely payment of interest and ultimate collection of principal, but its participation certificates are not backed by the full faith and credit of the U.S. Government.
| 47 | Semiannual Report / March 31, 2019 |
AllianzGI Institutional Multi-Series Trust
Notes to Financial Statements(unaudited) (continued)
(j) When-Issued/Delayed-Delivery Transactions. When-issued or delayed-delivery transactions involve a commitment to purchase or sell securities for a predetermined price or yield, with payment and delivery taking place beyond the customary settlement period. When delayed-delivery purchases are outstanding, the Portfolios will set aside and maintain until the settlement date in a designated account, liquid assets in an amount sufficient to meet the purchase price. Upon entering into these when-issued or delayed-delivery transactions, the Portfolios and the counterparties are required to pledge to the other party an amount of cash or securities collateral when either party has a net exposure that exceeds the minimum transfer amount of the other party. When purchasing a security on a delayed-delivery basis, the Portfolios assume the rights and risks of ownership of the security, including the risk of price and yield fluctuations; consequently, such fluctuations are taken into account when determining the NAV. The Portfolios may dispose of or renegotiate a delayed-delivery transaction after it is entered into, and may sell when-issued securities before they are delivered, which may result in a realized gain or loss. When a security is sold on a delayed-delivery basis, the Portfolios do not participate in future gains and losses with respect to the security.
(k) Securities Traded on a To-Be-Announced Basis. The Portfolios may from time to time purchase securities on a to-be-announced (“TBA”) basis. In a TBA transaction, the Portfolio commits to purchasing or selling securities for which all specific information is not yet known at the time of the trade, particularly the face amount and maturity date of the underlying security transactions. Securities purchased on a TBA basis are not settled until they are delivered to the Portfolio, normally 15 to 45 days later. Beginning on the date the Portfolio enters into a TBA transaction, cash, U.S. government securities or other liquid securities are segregated in an amount equal in value to the purchase price of the TBA security. These transactions are subject to market fluctuations, and their current value is determined in the same manner as for other securities.
(l) New Accounting Pronouncements. In March 2017, the FASB issued Accounting Standards Update No. (“ASU”) 2017-08, “Receivables - Nonrefundable Fees and Other Costs (Subtopic 310-20): Premium Amortization on Purchased Callable Debt Securities.” ASU 2017-08 shortens the amortization period for certain callable debt securities, held at a premium, to be amortized to the earliest call date rather than the contractual maturity date. The Portfolios have adopted and applied ASU 2017-08 on a modified retrospective basis through a cumulative-effect adjustment as of October 1, 2018. The adoption of ASU 2017-08 had no impact on beginning net assets, the current period results from operations, or any prior period information presented in the financial statements.
In August 2018, the FASB issued ASU 2018-13, “Fair Value Measurement (Topic 820): Disclosure Framework - Changes to the disclosure requirements for fair value measurement”. ASU 2018-13 removes the disclosure requirements for the amounts of and reasons for transfers between Level 1 and Level 2 of the fair value hierarchy, the policy for timing of transfers between levels and the valuation processes for Level 3 fair value measurements. The ASU is effective for annual periods beginning after December 15, 2019, and interim periods within those annual periods. Management has reviewed ASU 2018-13 and resolved to adopt immediately certain aspects of the ASU related to the removal and modification of certain fair measurement disclosures.
On October 17, 2018, the Securities and Exchange Commission (“SEC”) adopted changes to Regulation S-X to simplify the reporting of information by registered investment companies in financial statements. The amendments require presentation of the total, rather than the components, of distributable earnings on the Statement of Assets and Liabilities and also require presentation of the total, rather than the components, of distributions to shareholders, except for tax return of capital distributions, if any, on the Statements of Changes in Net Assets. The amendments also removed the requirement for parenthetical disclosure of undistributed net investment income on the Statements of Changes in Net Assets. These Regulation S-X amendments are reflected in the Portfolios’ financial statements for the period ended March 31, 2019.
2. PRINCIPAL RISKS
In the normal course of business, the Portfolios trade financial instruments and enter into financial transactions where risk of potential loss exists due to, among other things, changes in the market (market risk) or failure of the other party to a transaction to perform (counterparty risk).
| 48 | Semiannual Report / March 31, 2019 |
AllianzGI Institutional Multi-Series Trust
Notes to Financial Statements(unaudited) (continued)
The Portfolios are also exposed to other risks such as, but not limited to, interest rate, foreign currency, credit and leverage risks.
Interest rate risk is the risk that fixed income securities’ valuations will change because of changes in interest rates. During periods of rising nominal interest rates, the values of fixed income instruments are generally expected to decline. Conversely, during periods of declining nominal interest rates, the values of fixed income instruments are generally expected to rise. To the extent that a Portfolio effectively has short positions with respect to fixed income instruments, the values of such short positions would generally be expected to rise when nominal interest rates rise and to decline when nominal interest rates decline. A nominal interest rate can be described as the sum of a real interest rate and an expected inflation rate. Fixed income securities with longer durations tend to be more sensitive to changes in interest rates, usually making them more volatile than securities with shorter durations. Duration is used primarily as a measure of the sensitivity of a fixed income security’s market price to interest rate (i.e., yield) movements. Interest rate changes can be sudden and unpredictable, and the Portfolios may lose money as a result of movements in interest rates. High-yield or junk bonds are subject to greater levels of credit and liquidity risk, may be speculative and may decline in value due to an increase in interest rates or an issuer’s deterioration and/or default. The Portfolios may not be able to hedge against changes in interest rates or may choose not to do so for cost or other reasons. In addition, any hedges may not work as intended. The values of equity and other non-fixed income securities may also decline due to fluctuations in interest rates.
Variable and floating rate securities generally are less sensitive to interest rate changes but may decline in value if their interest rates do not rise as much, or as quickly, as interest rates in general. Conversely, floating rate securities will not generally increase in value if interest rates decline. Inverse floating rate securities may decrease in value if interest rates increase. Inverse floating rate securities may also exhibit greater price volatility than a fixed rate obligation with similar credit quality. When the Portfolios hold variable or floating rate securities, a decrease (or, in the case of inverse floating rate securities, an increase) in market interest rates will adversely affect the income received from such securities and the NAV of the Portfolios’ shares.
The Portfolios are exposed to credit risk, which is the risk of losing money if the issuer or guarantor of a fixed income security is unable or unwilling, or is perceived (whether by market participants, rating agencies, pricing services or otherwise) as unable or unwilling, to make timely principal and/or interest payments, or to otherwise honor its obligations. Securities are subject to varying degrees of credit risk, which are often reflected in credit ratings.
To the extent the Portfolios directly invest in foreign currencies or in securities that trade in, and receive revenues in, foreign currencies, or in derivatives that provide exposure to foreign currencies, they will be subject to the risk that those currencies will decline in value relative to the U.S. dollar, or, in the case of hedging positions, that the U.S. dollar will decline in value relative to the currency being hedged. Currency rates in foreign countries may fluctuate significantly over short periods of time for a number of reasons, including economic growth, inflation, changes in interest rates, intervention (or the failure to intervene) by U.S. or foreign governments, central banks or supranational entities such as the International Monetary Fund, or the imposition of currency controls or other political developments in the United States or abroad. As a result, the Portfolios’ investments in foreign currency-denominated securities may reduce the returns of the Portfolios.
The Portfolios are subject to elements of risk not typically associated with investments in the U.S., due to concentrated investments in foreign issuers located in a specific country or region. Such concentrations will subject the Portfolios to additional risks resulting from future political or economic conditions in such country or region and the possible imposition of adverse governmental laws or currency exchange restrictions affecting such country or region, which could cause the securities and their markets to be less liquid and prices more volatile than those of comparable U.S. companies.
The market values of securities may decline due to general market conditions (market risk) which are not specifically related to a particular company, such as real or perceived adverse economic conditions, changes in the general outlook for corporate earnings, changes in interest or currency rates, adverse changes to credit markets or adverse investor sentiment. They may also decline due to factors that affect a particular industry or industries, such as labor shortages or increased production costs and competitive conditions within an industry. Equity securities and equity-related investments generally have greater market price volatility than fixed income securities, although under certain market conditions fixed income securities may have comparable or greater price volatility. Credit ratings downgrades may also negatively affect securities held by the Portfolios. Even when markets perform well, there is no assurance that the investments held by the Portfolios will increase in value along with the broader market. In addition, market risk includes the risk that geopolitical events will disrupt the economy on a national or global level.
| 49 | Semiannual Report / March 31, 2019 |
AllianzGI Institutional Multi-Series Trust
Notes to Financial Statements(unaudited) (continued)
The Portfolios are exposed to counterparty risk, or the risk that an institution or other entity with which the Portfolios have unsettled or open transactions will default. The potential loss to the Portfolios could exceed the value of the financial assets recorded in the Portfolios’ financial statements. Financial assets, which potentially expose the Portfolios to counterparty risk, consist principally of cash due from counterparties and investments. The Investment Manager seeks to minimize the Portfolios’ counterparty risk by performing reviews of each counterparty and by minimizing concentration of counterparty risk by undertaking transactions with multiple customers and counterparties on recognized and reputable exchanges. Delivery of securities sold is only made once the Portfolios’ have received payment. Payment is made on a purchase once the securities have been delivered by the counterparty. The trade will fail if either party fails to meet its obligation.
The Portfolios are exposed to risks associated with leverage. Leverage may cause the value of the Portfolios’ shares to be more volatile than if the Portfolios did not use leverage. This is because leverage tends to exaggerate the effect of any increase or decrease in the value of the Portfolios’ portfolio securities. The Portfolios may engage in transactions or purchase instruments that give rise to forms of leverage. In addition, to the extent the Portfolios employ dividend and interest costs on such leverage may not be recovered by any appreciation of the securities purchased with the leverage proceeds and could exceed the Portfolios’ investment returns, resulting in greater losses.
The Portfolios are party to International Swaps and Derivatives Association, Inc. Master Agreements (“ISDA Master Agreements”) with select counterparties that govern transactions, over-the-counter derivatives and foreign exchange contracts entered into by the Portfolios and those counterparties. The ISDA Master Agreements contain provisions for general obligations, representations, agreements, collateral and events of default or termination. Events of termination include conditions that may entitle counterparties to elect to terminate early and cause settlement of all outstanding transactions under the applicable ISDA Master Agreement. Any election to terminate early could be material to the financial statements of the Portfolios.
The considerations and factors surrounding the settlement of certain purchases and sales made on a delayed-delivery basis are governed by Master Securities Forward Transaction Agreements (“Master Forward Agreements”) between the Portfolios and select counterparties. The Master Forward Agreements maintain provisions for, among other things, initiation and confirmation, payment and transfer, events of default, termination, and maintenance of collateral.
3. FINANCIAL DERIVATIVE INSTRUMENTS
Disclosure about derivatives and hedging activities requires qualitative disclosure regarding objectives and strategies for using derivatives, quantitative disclosure about fair value amounts of gains and losses on derivatives, and disclosure about credit-risk-related contingent features in derivative agreements. The disclosure requirements distinguish between derivatives which are accounted for as “hedges”, and those that do not qualify for such accounting. Although the Portfolios at times use derivatives for hedging purposes, the Portfolios reflect derivatives at fair value and recognize changes in fair value through the Portfolios’ Statements of Operations, and such derivatives do not qualify for hedge accounting treatment.
Futures Contracts. The Portfolios use futures contracts to manage their exposure to the securities markets or the movements in interest rates and currency values. A futures contract is an agreement between two parties to buy and sell a financial instrument at a set price on a future date. Upon entering into such a contract, the Portfolios are required to pledge to the broker an amount of cash or securities equal to the minimum “initial margin” requirements of the exchange. Pursuant to the contracts, the Portfolios agree to receive from or pay to the broker an amount of cash or securities equal to the daily fluctuation in the value of the contracts. Such receipts or payments are known as “variation margin” and are recorded by the Portfolios as unrealized appreciation or depreciation. When the contracts are closed, the Portfolios record a realized gain or loss equal to the difference between the value of the contracts at the time they were opened and the value at the time they were closed. Any unrealized appreciation or depreciation recorded is simultaneously reversed. The use of futures transactions involves various risks, including the risk of an imperfect correlation in the movements in the price of futures contracts, interest rates and underlying hedging assets, and possible inability or unwillingness of counterparties to meet the terms of their contracts.
The following is a summary of the Portfolios’ derivatives categorized by risk exposure.
| 50 | Semiannual Report / March 31, 2019 |
AllianzGI Institutional Multi-Series Trust
Notes to Financial Statements(unaudited) (continued)
The effect of derivatives on the Statements of Assets and Liabilities at March 31, 2019:
AllianzGI Advanced Core Bond:
| Location | Interest Rate Contracts | |
Liability derivatives: | ||
Unrealized depreciation on futures contracts* | $ (73,268) |
* Included in net unrealized depreciation of $73,268 on futures contracts as reported in the Portfolio’s Notes to Schedule of Investments. Only variation margin is reported within the Statements of Assets and Liabilities.
The effect of derivatives on the Statements of Operations for the six months ended March 31, 2019:
AllianzGI Advanced Core Bond:
| Location | Interest Rate Contracts | |||
Net realized loss on: | ||||
Futures contracts | $ (98,789) | |||
Net change in unrealized appreciation/depreciation of:
| ||||
Futures contracts | $ (164,898) | |||
The average volume (based on open positions at each fiscal month-end) of derivative activity during the six months ended March 31, 2019:
| Futures Contracts (1) | ||||
| Long | Short | |||
AllianzGI Advanced Core Bond | — | 123 | ||
(1) Number of contracts
4. INVESTMENT MANAGER/DISTRIBUTOR FEES/DEFERRED COMPENSATION
Investment Management Fee. Each Portfolio has an Investment Management Agreement (for the purpose of this section, the “Agreement”) with the Investment Manager. Subject to the supervision of the Trust’s Board, the Investment Manager was responsible for managing, either directly or through others selected by it, each Portfolio’s investment activities, business affairs and administrative matters. Pursuant to the Agreement, the Investment Manager received an annual fee, payable monthly, at an annual rate of each Portfolio’s average daily net assets (the “Investment Management Fee”).
The Investment Management Fee was charged at an annual rate as indicated in the following table:
| Management Fee | ||||
AllianzGI Advanced Core Bond | 0.30% | |||
AllianzGI Best Styles Global Managed Volatility | 0.40 | |||
AllianzGI Global Small-Cap Opportunities | 0.90 | |||
Distribution Fees. Allianz Global Investors Distributors LLC (the “Distributor”), an affiliate of AAM and the Investment Manager, serves as the distributor of the Portfolios’ shares pursuant to a Distribution Contract. The Distributor, for each of the Portfolios, currently receives no compensation in connection with the services it provides under the Distribution Contract.
| 51 | Semiannual Report / March 31, 2019 |
AllianzGI Institutional Multi-Series Trust
Notes to Financial Statements(unaudited) (continued)
Deferred Compensation. The Trustees do not currently receive any pension or retirement benefits from the Trust. In calendar year 2018 and certain prior periods, the Trust maintained a deferred compensation plan pursuant to which each Independent Trustee had the opportunity to elect not to receive all or a portion of his or her fees from the Trust on a current basis, but instead to receive in a subsequent period chosen by the Trustee an amount equal to the value of such compensation if such compensation had been invested in one or more series of Allianz Funds or Allianz Funds Multi-Strategy Trust selected by the Trustees from and after the normal payment dates for such compensation. The deferred compensation program was closed to new deferrals effective January 1, 2019, and all Trustee fees earned with respect to service in calendar year 2019 and beyond have been or will be paid in cash, on a current basis, unless the Board of Trustees of the Allianz-Sponsored Funds reopens the program to new deferrals. Allianz Funds and Allianz Funds Multi-Strategy Trust still have obligations with respect to Trustee fees deferred in 2018 and in prior periods, and will continue to have such obligations until all deferred Trustee fees are paid out pursuant to the terms of the deferred compensation plan.
5. EXPENSE LIMITATION/MANAGEMENT FEE WAIVER AND RECOUPMENT
The Trust and the Investment Manager have entered into Expense Limitation and Management Fee Waiver Agreements as indicated below:
| Expense Limitation | ||||
AllianzGI Advanced Core Bond(1) | 0.35% | |||
AllianzGI Best Styles Global Managed Volatility(2) | 0.45 | |||
AllianzGI Global Small-Cap Opportunities(3) | 1.20 | |||
1. The Investment Manager has contractually agreed to irrevocably waive its management fee and/or reimburse the Portfolio through January 31, 2020, to the extent that Total Annual Portfolio Operating Expenses, including payment of organizational expenses but excluding interest, tax and extraordinary expenses, and certain credits and other expenses, exceed 0.35%. Under the Expense Limitation Agreement, the Investment Manager may recoup waived or reimbursed amounts for three years, provided total expenses, including such recoupment, do not exceed the annual expense limit in effect at the time of such waiver/reimbursement or recoupment. The Expense Limitation Agreement is terminable by the Trust (based on approval by the Board) upon 90 days’ prior written notice to the Investment Manager or at any time by mutual agreement of the parties.
2. The Investment Manager has contractually agreed to irrevocably waive its management fee and/or reimburse the Portfolio through January 31, 2020, to the extent that Total Annual Portfolio Operating Expenses, including payment of organizational expenses but excluding interest, tax and extraordinary expenses, and certain credits and other expenses, exceed 0.45%. Under the Expense Limitation Agreement, the Investment Manager may recoup waived or reimbursed amounts for three years, provided total expenses, including such recoupment, do not exceed the annual expense limit in effect at the time of such waiver/reimbursement or recoupment. The Expense Limitation Agreement is terminable by the Trust (based on approval by the Board) upon 90 days’ prior written notice to the Investment Manager or at any time by mutual agreement of the parties.
3. The Investment Manager has contractually agreed to irrevocably waive its management fee or reimburse the Portfolio through January 31, 2020, to the extent that Total Annual Portfolio Operating Expenses, including payment of organizational expenses but excluding interest, tax and extraordinary expenses, and certain credits and other expenses, exceed 1.20%. Under the Expense Limitation Agreement, the Investment Manager may recoup waived or reimbursed amounts for three years, provided total expenses, including such recoupment, do not exceed the annual expense limit in effect at the time of such waiver/reimbursement or recoupment. The Expense Limitation Agreement is terminable by the Trust (based on approval by the Board) upon 90 days’ prior written notice to the Investment Manager or at any time by mutual agreement of the parties.
During the six months ended March 31, 2019, the Investment Manager did not recoup any expenses from the Portfolios. The following represents the amounts that still can be recouped by the Investment Manager:
| Unrecouped Expenses Waived/Reimbursed through | ||||||||
| Fiscal Period or Year ended | ||||||||
| 09/30/2016 | 09/30/2017 | 09/30/2018 | Total | |||||
AllianzGI Advanced Core Bond | $275,685 | $141,917 | $220,446 | $638,048 | ||||
AllianzGI Best Styles Global Managed Volatility | 205,431 | 258,092 | 241,955 | 705,478 | ||||
AllianzGI Global Small-Cap Opportunities | 209,673 | 144,937 | 132,581 | 487,191 | ||||
| 52 | Semiannual Report / March 31, 2019 |
AllianzGI Institutional Multi-Series Trust
Notes to Financial Statements(unaudited) (continued)
6. INVESTMENTS IN SECURITIES
For the six months ended March 31, 2019, purchases and sales of investments, other than short-term securities and U.S. government obligations were:
| Purchases | Sales | |||||||||||||||||||
AllianzGI Advanced Core Bond | $5,216,868 | $19,827,136 | ||||||||||||||||||
AllianzGI Best Styles Global Managed Volatility | 9,373,170 | 11,133,985 | ||||||||||||||||||
AllianzGI Global Small-Cap Opportunities | 1,349,364 | 1,331,568 | ||||||||||||||||||
Purchases and sales in U.S. government obligations were: | ||||||||||||||||||||
| Purchases | Sales | |||||||||||||||||||
AllianzGI Advanced Core Bond | $212,048,816 | $223,319,942 | ||||||||||||||||||
7. INCOME TAX INFORMATION
At March 31, 2019, the aggregate cost basis and the net unrealized appreciation (depreciation) of investments in securities and other financial instruments for federal income tax purposes were:
| Net Unrealized | ||||||||||||||||
| Federal Tax Cost | Unrealized | Unrealized | Appreciation | |||||||||||||
| Basis(1) | Appreciation | Depreciation | (Depreciation) | |||||||||||||
AllianzGI Advanced Core Bond | $136,856,979 | $1,391,943 | $1,197,608 | $194,335 | ||||||||||||
AllianzGI Best Styles Global Managed Volatility | 43,100,981 | 7,384,683 | 1,949,313 | 5,435,370 | ||||||||||||
AllianzGI Global Small-Cap Opportunities | 4,760,844 | 665,110 | 223,437 | 441,673 | ||||||||||||
(1) Differences, if any, between book and tax cost basis were attributable to wash sale loss deferrals and the differing treatment of bond premium amortization.
8. SIGNIFICANT ACCOUNT HOLDERS
From time to time, a Portfolio may have a concentration of shareholders, which may include the Investment Manager or affiliates of the Investment Manager, holding a significant percentage of shares outstanding. Investment activities of these shareholders could have a material impact to a Portfolio.
At March 31, 2019, the significant account-holders, owners of 5% or greater of each respective Portfolio’s outstanding shares, were as follows:
Unaffiliated
| Affiliated*
| |||||||||||||||||||||||||||
| Number of | Approximate | Number of | Approximate | AFI | ||||||||||||||||||||||||
| Account | Ownership | Account | Ownership | |||||||||||||||||||||||||
| Holders | Holders | |||||||||||||||||||||||||||
AllianzGI Advanced Core Bond | — | — | 4 | 96% | — | |||||||||||||||||||||||
AllianzGI Best Styles Global Managed Volatility | — | — | 2 | 100% | — | |||||||||||||||||||||||
AllianzGI Global Small-Cap Opportunities | — | — | — | — | 100% | |||||||||||||||||||||||
* This represents the aggregate percentage of affiliated entities that own 5% or more of the Portfolio’s outstanding shares. These affiliated entities include portfolios of the Trust and Allianz Multi-Series Collective Investment Trust.
| 53 | Semiannual Report / March 31, 2019 |
AllianzGI Institutional Multi-Series Trust
Notes to Financial Statements(unaudited) (continued)
9. BORROWINGS
The Trust has entered into a credit agreement (the “State Street Agreement”), among the Trust, Allianz Funds Multi-Strategy Trust, Allianz Funds and Premier Multi-Series VIT, as borrowers (collectively, the “AllianzGI Borrowers” and each series thereof, an “AllianzGI Borrower Fund”), and State Street Bank and Trust Company, as agent and lender, for a committed line of credit. The State Street Agreement permits the AllianzGI Borrowers to borrow up to $200 million in aggregate, subject to (i) a requirement that each AllianzGI Borrower Fund’s asset coverage with respect to senior securities representing indebtedness be 300% or higher, and (ii) certain other limitations and conditions. Each AllianzGI Borrower Fund must pay interest on any amounts borrowed under the facility at a rate per annum equal to 1.25% plus the higher of the then-current federal funds overnight rate or the one month LIBOR rate, subject to upward adjustment when any past due payments are outstanding. The State Street Agreement was extended by an additional 364-day period by an amendment effective October 25, 2018, with an expiration date of October 24, 2019 (the “Amendment”). The Amendment changed a 0.25% usage fee on undrawn amounts, which had previously applied, to an annualized rate of 0.20%, to be allocated pro rata among the AllianzGI Borrower Funds on the basis of net assets. Amounts borrowed may be repaid and reborrowed on a revolving basis during the term of the facility.
The Portfolios did not utilize the line of credit during the six months ended March 31, 2019.
Pursuant to an exemptive order issued by the SEC (the “Order”), the Portfolios are authorized to enter into a master interfund lending agreement (the “Interfund Program”) with each other and certain funds advised by the Investment Manager (each a “Participating Fund”). The Interfund Program allows each Participating Fund, whose policies permit it to do so, to lend money directly to and borrow money directly from other Portfolios for temporary purposes through the Interfund Program.
During the six months ended March 31, 2019, the Portfolios did not participate as a borrower or lender in the Interfund Program.
10. SUBSEQUENT EVENTS
In preparing these financial statements, the Portfolios’ management has evaluated events and transactions for potential recognition or disclosure through the date the financial statements were issued.
On May 15, 2019, AllianzGI International Growth Portfolio commenced operations as a new series of the Trust.
There were no other subsequent events identified that require recognition or disclosure.
| 54 | Semiannual Report / March 31, 2019 |
AllianzGI Institutional Multi-Series Trust
Changes to the Board of Trustees (unaudited)
Effective January 1, 2019, Alan Rappaport was appointed Chairman of the Board of Trustees of the Trust.
Effective January 1, 2019, Sarah E. Cogan became a Trustee of the Trust.
Effective March 21, 2019, A. Douglas Eu resigned as a Trustee of the Trust and Thomas J. Fuccillo became a Trustee of the Trust. Mr. Fuccillo is an “interested person” of the Trust, as defined in Section 2(a)(19) of the 1940 Act; due to his position with the Investment Manager and its affiliates.
| 55 | Semiannual Report / March 31, 2019 |
AllianzGI Institutional Multi-Series Trust
Please read this Policy carefully. It gives you important information about how Allianz Global Investors U.S. and its U.S. affiliates (“AllianzGI US,” “we” or “us”) handle non-public personal information (“Personal Information”) that we may receive about you. It applies to all of the past, present and future clients and shareholders of AllianzGI US and the funds and accounts it manages, advises, administers or distributes, and will continue to apply when you are no longer a client or shareholder. As used throughout this Policy, “AllianzGI US” means Allianz Global Investors U.S. LLC, Allianz Global Investors Distributors LLC, and the family of registered and unregistered funds managed by one or more of these firms. AllianzGI US is part of a global investment management group, and the privacy policies of other Allianz Global Investors entities outside of the United States may have provisions in their policies that differ from this Privacy Policy. Please refer to the website of the specific non-US Allianz Global Investors entity for its policy on privacy.
We Care about Your Privacy
We consider your privacy to be a fundamental aspect of our relationship with you, and we strive to maintain the confidentiality, integrity and security of your Personal Information. To ensure your privacy, we have developed policies that are designed to protect your Personal Information while allowing your needs to be served.
Information We May Collect
In the course of providing you with products and services, we may obtain Personal Information about you, which may come from sources such as account application and other forms, from other written, electronic, or verbal communications, from account transactions, from a brokerage or financial advisory firm, financial advisor or consultant, and/or from information you provide on our website.
You are not required to supply any of the Personal Information that we may request. However, failure to do so may result in us being unable to open and maintain your account, or to provide services to you.
How Your Information Is Shared
We do not disclose your Personal Information to anyone for marketing purposes. We disclose your Personal Information only to those service providers, affiliated and non-affiliated, who need the information for everyday business purposes, such as to respond to your inquiries, to perform services, and/or to service and maintain your account. This applies to all of the categories of Personal Information we collect about you. The affiliated and non-affiliated service providers who receive your Personal Information also may use it to process your transactions, provide you with materials (including preparing and mailing prospectuses and shareholder reports and gathering shareholder proxies), and provide you with account statements and other materials relating to your account. These service providers provide services at our direction, and under their agreements with us, are required to keep your Personal Information confidential and to use it only for providing the contractually required services. Our service providers may not use your Personal Information to market products and services to you except in conformance with applicable laws and regulations. We also may provide your Personal Information to your respective brokerage or financial advisory firm, custodian, and/or to your financial advisor or consultant.
In addition, we reserve the right to disclose or report Personal Information to non-affiliated third parties, in limited circumstances, where we believe in good faith that disclosure is required under law, to cooperate with regulators or law enforcement authorities or pursuant to other legal process, or to protect our rights or property, including to enforce our Privacy Policy or other agreements with you. Personal Information collected by us may also be transferred as part of a corporate sale, restructuring, bankruptcy, or other transfer of assets.
Security of Your Information
We maintain your Personal Information for as long as necessary for legitimate business purposes or otherwise as required by law. In maintaining this information, we have implemented appropriate procedures that are designed to restrict access to your Personal Information only to those who need to know that information in order to provide products and/or services to you. In addition, we have implemented physical, electronic and procedural safeguards to help protect your Personal Information.
| 56 | Semiannual Report / March 31, 2019 |
AllianzGI Institutional Multi-Series Trust
Privacy Policy(unaudited) (continued)
Privacy and the Internet
The Personal Information that you provide through our website, as applicable, is handled in the same way as the Personal Information that you provide by any other means, as described above. This section of the Policy gives you additional information about the way in which Personal Information that is obtained online is handled.
•Online Enrollment, Account Access and Transactions: When you visit our website, you can visit pages that are open to the general public, or, where available, log into protected pages to enroll online, access information about your account, or conduct certain transactions. Access to these secure pages is permitted only after you have created a User ID and Password. The User ID and Password must be supplied each time you want to access your account information online. This information serves to verify your identity. When you enter Personal Information to enroll or access your account online, you will log into secure pages. By using our website, you consent to this Privacy Policy and to the use of your Personal Information in accordance with the practices described in this Policy. If you provide Personal Information to effect transactions, a record of the transactions you have performed while on the site is retained by us. For additional terms and conditions governing your use of our website, please refer to the Investor Mutual Fund Access – Disclaimer which is incorporated herein by reference and is available on our website.
• Cookies and Similar Technologies:Cookies are small text files stored in your computer’s hard drive when you visit certain web pages. Clear GIFs (also known as Web Beacons) are typically transparent very small graphic images (usually 1 pixel x 1 pixel) that are placed on a website that may be included on our services provided via our website and typically work in conjunction with cookies to identify our users and user behavior. We may use cookies and automatically collected information to: (i) personalize our website and the services provided via our website, such as remembering your information so that you will not have to re-enter it during your use of, or the next time you use, our website and the services provided via our website; (ii) provide customized advertisements, content, and information; (iii) monitor and analyze the effectiveness of our website and the services provided via our website and third-party marketing activities; (iv) monitor aggregate site usage metrics such as total number of visitors and pages viewed; and (v) track your entries, submissions, and status in any promotions or other activities offered through our website and the services provided via our website. Tracking technology also helps us manage and improve the usability of our website, (i) detecting whether there has been any contact between your computer and us in the past and (ii) to identify the most popular sections of our website. Because an industry-standard Do-Not-Track protocol is not yet established, our website will continue to operate as described in this Privacy Policy and will not be affected by any Do-Not-Track signals from any browser.
• Use of Social Media Plugins: Our website uses the following Social Media Plugins (“Plugins”):
• Facebook Share Button operated by Facebook Inc., 1601 S. California Ave, Palo Alto, CA 94304, USA
• Tweet Button operated by Twitter Inc., 795 Folsom St., Suite 600, San Francisco, CA 94107, USA
• LinkedIn Share Button operated by LinkedIn Corporation, 2029 Stierlin Court, Mountain View, CA 94043, USA
All Plugins are marked with the brand of the respective operators Facebook, Twitter and LinkedIn (“Operators”). When you visit our website that contains a social plugin, your browser establishes a direct connection to the servers of the Operator. The Operator directly transfers the plugin content to your browser which embeds the latter into our website, enabling the Operator to receive information about you having accessed the respective page of our website. Thus, AllianzGI US has no influence on the data gathered by the plugin and we inform you according to our state of knowledge: The embedded plugins provide the Operator with the information that you have accessed the corresponding page of our website. If you do not wish to have such data transferred to the Operators, you need to log out of your respective account before visiting our website. Please see the Operators’ data privacy statements in order to get further information about purpose and scope of the data collection and the processing and use:
• Facebook: https://de-de.facebook.com/about/privacy
• Twitter: https://twitter.com/privacy
• Linked In: https://www.linkedin.com/legal/privacy-policy
| 57 | Semiannual Report / March 31, 2019 |
AllianzGI Institutional Multi-Series Trust
Privacy Policy(unaudited) (continued)
Changes to Our Privacy Policy
We may modify this Privacy Policy from time-to-time to reflect changes in related practices and procedures, or applicable laws and regulations. If we make changes, we will notify you on our website and the revised Policy will become effective immediately upon posting to our website. We also will provide account owners with a copy of our Privacy Policy, annually if required. We encourage you to visit our website periodically to remain up to date on our Privacy Policy. You acknowledge that by using our website after we have posted changes to this Privacy Policy, you are agreeing to the terms of the Privacy Policy as modified.
Obtaining Additional Information
If you have any questions about this Privacy Policy or our privacy related practices in the United States, you may contact us via our dedicated email at PrivacyUS@allianzgi.com.
| 58 | Semiannual Report / March 31, 2019 |
Trustees
Alan Rappaport
Chairman of the Board of Trustees
Sarah E. Cogan
Deborah A. Decotis
F. Ford Drummond
Thomas J. Fuccillo
Bradford K. Gallagher
Erick R. Holt
James A. Jacobson
Hans W. Kertess
James S. MacLeod
William B. Ogden, IV
Davey S. Scoon
Officers
Thomas J. Fuccillo
President and Chief Executive Officer
Scott Whisten
Treasurer, Principal Financial and Accounting Officer
Angela Borreggine
Chief Legal Officer and Secretary
Thomas L. Harter
Chief Compliance Officer, CFA
Richard J. Cochran
Assistant Treasurer
Orhan Dzemaili
Assistant Treasurer
Debra Rubano
Assistant Secretary
Craig A. Ruckman
Assistant Secretary
Investment Manager
Allianz Global Investors U.S. LLC
1633 Broadway
New York, NY 10019
Distributor
Allianz Global Investors Distributors LLC
1633 Broadway
New York, NY 10019
Custodian & Accounting Agent
State Street Bank and Trust Co.
801 Pennsylvania Avenue
Kansas City, MO 64105
Transfer Agent
State Street Bank and Trust Company, which has delegated
its obligations
as transfer agent to:
DST Asset Management Solutions, Inc.
P.O. Box 219723
Kansas City, MO 64121-9723
Independent Registered Public Accounting Firm
PricewaterhouseCoopers LLP
300 Madison Avenue
New York, NY 10017
Legal Counsel
Ropes & Gray LLC
Prudential Tower
800 Boylston Street
Boston, MA 02199
This report, including the financial information herein, is transmitted to the shareholders of the Trust for their information. It is not a prospectus, circular or representation intended for use in the purchase of shares of each Portfolio or any securities mentioned in this report.
The financial information included herein is taken from the records of the Portfolios without examination by an independent registered public accounting firm, who did not express an opinion herein.
| ITEM 2. | CODE OF ETHICS |
(a) Not required in this filing.
| ITEM 3. | AUDIT COMMITTEE FINANCIAL EXPERT |
Not required in this filing.
| ITEM 4. | PRINCIPAL ACCOUNTANT FEES AND SERVICES |
Not required in this filing.
| ITEM 5. | AUDIT COMMITTEE OF LISTED REGISTRANT |
Disclosure not required foropen-end management investment companies.
| ITEM 6. | INVESTMENTS |
| (a) | Schedule of Investments is included as part of the report to shareholders filed under Item 1 of this form. |
| (b) | Not applicable. |
| ITEM 7. | DISCLOSURE OF PROXY VOTING POLICIES AND PROCEDURES FORCLOSED-END MANAGEMENT INVESTMENT COMPANIES |
Disclosure not required foropen-end management investment companies.
| ITEM 8. | PORTFOLIO MANAGERS OFCLOSED-END MANAGEMENT INVESTMENT COMPANIES |
Disclosure not required foropen-end management investment companies.
| ITEM 9. | PURCHASES OF EQUITY SECURITIES BYCLOSED-END MANAGEMENT INVESTMENT COMPANY AND AFFILIATED PURCHASERS. |
Disclosure not required foropen-end management investment companies.
| ITEM 10. | SUBMISSION OF MATTERS TO A VOTE OF SECURITY HOLDERS |
There were no material changes to the procedures by which shareholders may recommend nominees to the Trust’s Board of Trustees since the Trust’s last provided disclosure in response to this item.
| ITEM 11. | CONTROLS AND PROCEDURES |
| (a) | The registrant’s President & Chief Executive Officer and Treasurer, Principal Financial & Accounting Officer have concluded that the registrant’s disclosure controls and procedures (as defined in Rule 30a-3(c) under the Investment Company Act of 1940 (the “1940 Act”) (17 CFR 270.30a-3(c)) as amended), are effective based on their evaluation of these controls and procedures as of a date within 90 days of the filing date of this document. |
| (b) | There were no significant changes in the registrant’s internal control over financial reporting (as defined in Rule 30a-3(d) under the 1940 Act (17 CFR 270.30a-3(d))) that occurred during the most recent semi-annual period covered by this report that has materially affected, or is reasonably likely to materially affect, the registrant’s internal control over financial reporting. |
| ITEM 12. | DISCLOSURE OF SECURITIES LENDING ACTIVITIES FORCLOSED-END MANAGEMENT INVESTMENT COMPANIES |
Disclosure not required foropen-end management investment companies
| ITEM 13. | EXHIBITS |
(a) (1) Not required in this filing.
(a) (2) Exhibit 99_ Cert. — Certification pursuant to Section 302 of the Sarbanes-Oxley Act of 2002
(a) (3) Not applicable.
(a) (4) Not applicable.
(b) Exhibit 99.906 Cert. — Certification pursuant to Section 906 of the Sarbanes-Oxley Act of 2002
Signatures
Pursuant to the requirements of the Securities Exchange Act of 1934 and the Investment Company Act of 1940, the registrant has duly caused this report to be signed on its behalf by the undersigned, thereunto duly authorized.
| AllianzGI Institutional Multi-Series Trust | ||
| By: | /s/ Thomas J. Fuccillo | |
| Thomas J. Fuccillo | ||
| President & Chief Executive Officer | ||
| Date: | June 5, 2019 | |
| By: | /s/ Scott Whisten | |
| Scott Whisten | ||
| Treasurer, Principal Financial & Accounting Officer | ||
| Date: | June 5, 2019 | |
Pursuant to the requirements of the Securities Exchange Act of 1934 and the Investment Company Act of 1940, this report has been signed below by the following persons on behalf of the registrant and in the capacities and on the dates indicated.
| By: | /s/ Thomas J. Fuccillo | |
| Thomas J. Fuccillo | ||
| President & Chief Executive Officer | ||
| Date: | June 5, 2019 | |
| By: | /s/ Scott Whisten | |
| Scott Whisten | ||
| Treasurer, Principal Financial & Accounting Officer | ||
| Date: | June 5, 2019 | |