Table of Contents
UNITED STATES
SECURITIES AND EXCHANGE COMMISSION
Washington, D.C. 20549
FORM N-CSR
CERTIFIED SHAREHOLDER REPORT OF REGISTERED
MANAGEMENT INVESTMENT COMPANIES
Investment Company Act file number 811-22975
AllianzGI Institutional Multi-Series Trust
(Exact name of registrant as specified in charter)
| 1633 Broadway, New York, New York | 10019 | |
| (Address of principal executive offices) | (Zip code) |
Lawrence G. Altadonna
1633 Broadway,
New York, New York 10019
(Name and address of agent for service)
Registrant’s telephone number, including area code: 212-739-3371
Date of fiscal year end: September 30, 2016
Date of reporting period: March 31, 2016
Table of Contents
Item 1. Report to Shareholders
AllianzGI Institutional Multi-Series Trust
Semi-Annual Report
March 31, 2016
Table of Contents
| 2 - 7 | ||||
| 8 | ||||
| 9 -27 | ||||
| 28-29 | ||||
| 30-31 | ||||
| 32 | ||||
| 33-35 | ||||
| 36-47 | ||||
| Changes to the Board of Trustees & Fund Officers | 48 | |||
| Matters Relating to the Trustees’ Consideration of the Investment Management and Sub-Advisory Agreement | 49-52 | |||
| 53-54 | ||||
Table of Contents
AllianzGI Advanced Core Bond Portfolio
(unaudited)
From inception on October 30, 2015 through March 31, 2016, as provided by Dr. Matthias Grein, CFA, Portfolio Manager.
Fund Insights
Performance Overview
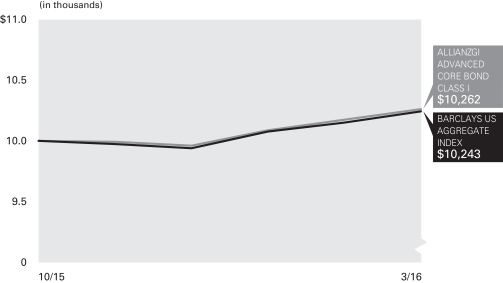
For the period from inception on October 30, 2015 through March 31, 2016, the AllianzGI Advanced Core Bond Portfolio (the “Portfolio”) returned 2.62%, outperforming the Barclays US Aggregate Bond Index (the “benchmark index”), which returned 2.43%.
Martket Overview
The Portfolio was not immune to the increased financial market volatility in the beginning of the year when fears of a recession, which have not materialized, impacted market pricing. The financial market weakness, together with domestic and international economic uncertainty, led the US Federal Reserve (“Fed”) to issue a more accommodative policy statement following its March meeting. This was followed by positive market reaction and tightening spreads, which benefited the Portfolio.
Portfolio Review
The Portfolio is currently duration neutral versus its benchmark index. After the first Fed rate increase in December of 2015, we expect further steps by the Fed to be at a very measured pace. We therefore changed our position from a slightly short position to a neutral position. Support for low rates (and flat curves) stems from low energy
prices, which lead to low inflation expectations. For the time being we expect no noticeable increase in inflation, although in the course of the year the impact of the weak currency, positive base effects and the tightening labor market could, in our opinion, become effective and increase risks.
Within the Portfolio, there is a short position on the short end of the Treasury curve and an overweight in subsovereigns, supranationals and agencies (“SSAs”). The overweight in SSAs partially reflects our safe-spread strategy where we substitute individual bonds with bonds by issuers of a similar risk profile that nevertheless offer a yield pickup (for instance, Canadian provinces).
Robust economic growth and high liquidity continue to provide a good base for spread products, therefore the Portfolio is overweight corporates and covered bonds.
While the majority of the Portfolio is invested in US securities, there is international exposure to several countries, including emerging markets. All securities are US dollar (“USD”) denominated. The average rating of the Portfolio is AA (the same as the benchmark index), with exposure to high yield corporates and countries.
The Portfolio actively participates in the issuances of new securities to capture primary market premiums.
The Portfolio utilizes derivatives to invest in the mortgage market through forwards on mortgage-backed securities (so-called TBAs). The Portfolio also uses Treasury futures.
During the reporting period, the Portfolio saw significant inflows, increasing the initial assets under management from approximately USD $78.4 million to the current level of approximately USD $155.2 million.
Outlook
We still expect continuing improvement in economic dynamics in the US, supported by domestic demand, given positive labor market conditions and low oil prices which supports consumption. We believe risks stem mainly from slow investment activity, especially as investments in energy-related parts of the industry further decline, as well as from global uncertainties. We therefore expect more tentative action by the Fed. Properly prepared, we believe that, the market impact on the Portfolio to be limited, however, risks, with potential consequences for the Portfolio, remain.
Cumulative Return for the period ended March 31, 2016
| Since Inception† | ||||
| AllianzGI Advanced Core Bond Portfolio | 2.62% | |||
| Barclays US Aggregate Bond Index †† | 2.43% | |||
† The Portfolio began operations on 10/30/15. Benchmark return comparisons began on the portfolio inception date. Lipper performance comparisons began on 10/30/15.
†† The Barclays US Aggregate Bond Index is composed of securities from the Barclays Government/Credit Bond Index, Mortgage-Backed Securities Index, and Asset-Backed Securities Index. It is generally considered to be representative of the domestic, investment grade fixed rate, taxable bond market (as of March 31, 2016). Index returns reflect the reinvestment of income dividends and capital gains, if any, but do not reflect fees, brokerage commissions or other expenses of investing. It is not possible to invest directly in an index.
Performance quoted represents past performance and is no guarantee of future results. Current performance may be lower or higher than performance shown. Investment return and the principal value will fluctuate. Shares may be worth more or less than original cost when redeemed. Returns do not reflect deduction of taxes that a shareholder would pay on portfolio distributions or redemption of portfolio shares. Total return performance assumes that all dividends and capital gain distributions were reinvested on the payable date. The Portfolio’s gross expense ratio is 0.67%. This ratio does not include an expense reduction, contractually agreed to through January 31, 2017. The Portfolio’s expense ratio net of this reduction is 0.45%. Expense ratio information is as of the Portfolio’s current Private Placement Memorandum (“PPM”) dated February 1, 2016.
| 2 | Semi-Annual Report / March 31, 2016 |
Table of Contents
AllianzGI Advanced Core Bond Portfolio
(unaudited) (continued)
Industry/Sectors (as of March 31, 2016)
| U.S. Treasury Notes | 43.6% | |||
| Sovereign Debt Obligations | 13.7% | |||
| Fannie Mae | 12.3% | |||
| Banks | 10.3% | |||
| Freddie Mac | 7.8% | |||
| U.S. Treasury Bonds | 7.7% | |||
| Ginnie Mae | 7.5% | |||
| Telecommunications | 2.5% | |||
| Other | 20.0% | |||
| Cash & Equivalents — Net | -25.4% |
Cumulative Returns Through March 31, 2016
| Shareholder Expense Example | Actual Performance | |||
Beginning Account Value* | $ | 1,000.00 | ||
Ending Account Value (3/31/16) | $ | 1,026.20 | ||
Expenses Paid During Period | $ | 1.91 | ||
| Hypothetical Performance | ||||
| (5% return before expenses) | ||||
Beginning Account Value (10/1/15) | $ | 1,000.00 | ||
Ending Account Value (3/31/16) | $ | 1,022.75 | ||
Expenses Paid During Period | $ | 2.28 | ||
* The Fund commenced operations on October 30, 2015. The Actual expense example is based on the period since inception; the Hypothetical expense example is based on the period beginning October 1, 2015. If the Hypothetical expense example had been based on the period since inception, the Ending Account Value and Expenses Paid During Period would have been: $1,019.02 and $1.90, respectively.
Expenses (net of reimbursement, if any) are equal to the annualized expense ratio (0.45%), multiplied by the average account value over the period, multiplied by 153/366 for the Actual expense example and 183/366 for the Hypothetical expense example.
| 3 | Semi-Annual Report / March 31, 2016 |
Table of Contents
AllianzGI Discovery U.S. Portfolio
(unaudited)
From inception on December 21, 2015 through March 31, 2016, as provided by Raymond Cunha, CFA, Lead Portfolio Manager.
Fund Insights
Performance Overview
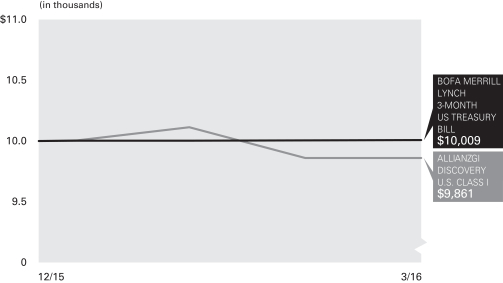
For the period from inception on December 21, 2015 through March 31, 2016, the AllianzGI Discovery U.S. Portfolio (the “Portfolio”) returned -1.40%, underperforming the BofA Merrill Lynch 3-Month US Treasury Bill Index (the “benchmark index”), which returned 0.09%.
Market Overview
In the first quarter of 2016, the US equity market was a tale of two performance halves. From December 21, 2015 through February 11, 2016, the S&P 500 Index declined 8.5% and subsequently rebounded 11.6% to finish the quarter up 1.4%. The decline in the first half of the quarter reflected a myriad of concerns, including heightened monetary risk from an anticipated Fed tightening, crude prices declining below $30 per barrel, and fears over a significant global growth slowdown emanating from China and other parts of the world. These fears were dispelled in the second half of the quarter as oil bottomed, both on the prospect of the Organization of the Petroleum Exporting Countries (“OPEC”) oil production freeze and supply cuts, and the abrupt course reversal on
the pace of Fed rate hikes for the remainder of 2016. Fed Chair Janet Yellen indicated that recent market and economic conditions made it necessary to push back rate hikes. Given the prospect of lower interest rates for a more extended period of time, investors’ risk appetite grew and the market regained its losses from the early part of the year.
Portfolio Review
The Portfolio’s negative 1.4% return was primarily due to a 2.4 % (gross of fees) drop that the Portfolio incurred in the month of February 2016. In that month, the S&P 500 Index rallied sharply, and what we believe are either structurally impaired or cyclically challenged companies that the Portfolio was short, particularly in consumer discretionary and industrials, snapped back. Given the Fed’s dovish stance and signs that China’s economy was possibly bottoming, these sectors’ laggards revived as the market transitioned to a more bullish global economic outlook. For the months of January and March 2016, the Portfolio was up 1.1% and 0.1%, respectively (gross of fees).
The Portfolio’s individual Global Industry Classification Standards (“GICS”) sector net exposure is generally limited to the range of +/-5%. Positive net sector contributions were generated from largest to smallest, in healthcare, technology, materials, consumer staples and energy, respectively. Net sector detractors (in same order) included industrials, financials and consumer discretionary. In healthcare the Portfolio benefited from its short exposure in biopharma, which was pressured by the greater scrutiny on drug pricing. The negative contribution from industrials was primarily a result of the “mean reversion” trade as companies with weak cyclical fundamentals revived with the hope of a bottoming Chinese economy.
During the reporting period, the top long contributor was Continental Resources Inc. and the largest long detractor was Citigroup Inc. Continental Resources, Inc. rose with the surge in oil prices. The largest individual company short contributor was LinkedIn Corp., which fell on a negative earnings surprise. The largest short detractor was a tie between IBM and Cummins Inc. IBM rebounded concurrent with some analyst upgrades.
Cumulative Return for the period ended March 31, 2016
| Since Inception† | ||||
| AllianzGI Discovery U.S. Portfolio | -1.40% | |||
| BofA Merrill Lynch 3-Month US Treasury Bill Index †† | 0.09% | |||
† The Portfolio began operations on 12/21/15. Benchmark return comparisons began on the portfolio inception date. Lipper performance comparisons began on 12/31/15.
†† The BofA Merrill Lynch 3-Month US Treasury Bill Index tracks the performance of the 3-month US Treasury markets. Index returns reflect the reinvestment of income dividends and capital gains, if any, but do not reflect fees, brokerage commissions or other expenses of investing. It is not possible to invest directly in an index.
Performance quoted represents past performance and is no guarantee of future results. Current performance may be lower or higher than performance shown. Investment return and the principal value will fluctuate. Shares may be worth more or less than original cost when redeemed. Returns do not reflect deduction of taxes that a shareholder would pay on portfolio distributions or redemption of portfolio shares. Total return performance assumes that all dividends and capital gain distributions were reinvested on the payable date. The Portfolio’s gross expense ratio is 6.21%. This ratio does not include an expense reduction, contractually agreed to through January 31, 2017, where the manager agrees to irrevocably waive its management fee and/or reimburse the Portfolio to the extent that gross expense ratio, excluding interest, tax, dividend expenses on short sales, and extraordinary expenses, and certain credits and other expenses , exceed 1.50%. The Portfolio’s expense ratio net of this reduction is 3.23%, which includes dividend expenses on short sales which are estimated to be 1.73%. Expense ratio information is as of the Portfolio’s current PPM dated February 1, 2016.
| 4 | Semi-Annual Report / March 31, 2016 |
Table of Contents
AllianzGI Discovery U.S. Portfolio
(unaudited) (continued)
Industry/Sectors (as of March 31, 2016*)
| Software | 9.0% | |||
| Oil, Gas & Consumable Fuels | 7.2% | |||
| Biotechnology | 5.8% | |||
| Banks | 5.6% | |||
| Specialty Retail | 5.4% | |||
| Media | 5.1% | |||
| Food Products | 4.1% | |||
| Other | 53.5% | |||
| Securities Sold Short | -100.8% | |||
| Cash & Equivalents — Net | 105.1% |
* Table below details the industry/sectors allocation for securities sold short
Industry/Sectors — Securities Sold Short
| Machinery | -7.6% | |||
| Semiconductors & Semiconductor Equipment | -7.0% | |||
| Specialty Retail | -6.6% | |||
| Capital Markets | -6.3% | |||
| Oil, Gas & Consumable Fuels | -4.7% | |||
| IT Services | -4.3% | |||
| Health Care Providers & Services | -4.1% | |||
| Diversified Financial Services | -4.0% | |||
| Real Estate Investment Trust | -3.7% | |||
| Other | -52.5% |
Cumulative Returns Through March 31, 2016
| Shareholder Expense Example | Actual Performance | |||
Beginning Account Value* | $ | 1,000.00 | ||
Ending Account Value (3/31/16) | $ | 986.00 | ||
Expenses Paid During Period | $ | 8.41 | ||
| Hypothetical Performance | ||||
| (5% return before expenses) | ||||
Beginning Account Value (10/1/15) | $ | 1,000.00 | ||
Ending Account Value (3/31/16) | $ | 1,009.65 | ||
Expenses Paid During Period | $ | 15.42 | ||
* The Fund commenced operations on December 21, 2015. The Actual expense example is based on the period since inception; the Hypothetical expense example is based on the period beginning October 1, 2015. If the Hypothetical expense example had been based on the period since inception, the Ending Account Value and Expenses Paid During Period would have been: $1,005.33 and $8.49, respectively.
Expenses (net of reimbursement, if any) are equal to the annualized expense ratio (3.07%), multiplied by the average account value over the period, multiplied by 101/366 for the Actual expense example and 183/366 for the Hypothetical expense example.
| 5 | Semi-Annual Report / March 31, 2016 |
Table of Contents
AllianzGI Global Small-Cap Opportunities Portfolio
(unaudited)
For the period of October 1, 2015 through March 31, 2016, as provided by Mark P. Roemer, Portfolio Manager.
Fund Insights
Performance Overview
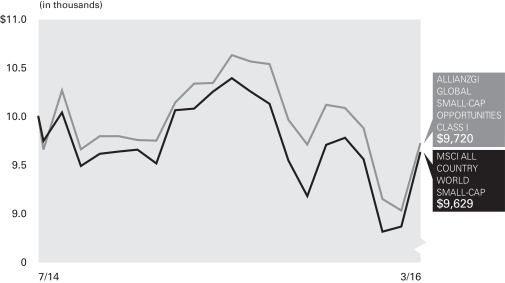
For the six-month period ended March 31, 2016, the AllianzGI Global Small-Cap Opportunities Portfolio (the “Portfolio”) returned 0.05%, underperforming the MSCI All Country World Small-Cap Index (the “benchmark index”), which returned 4.87%.
Market Overview
During the six-month period, the macroeconomic environment for global small-cap equities was particularly divergent. The benchmark index rallied nearly 6% in October 2015 as investor sentiment rapidly improved following declines in three of the four prior months. The exuberance carried through modestly in November 2015 with a less than 1% increase, and moderated in December 2015 amid slowing global growth and impact from the Fed rate hikes, resulting in a greater than 2% decline. The new year was met with extreme pessimism, with the asset class declining 12% through the first three weeks of January 2016. Global small-cap equities witnessed a sharp turnaround in performance, rallying the last week of January amid higher energy prices, a weaker dollar and dovish central bank expectations. The asset class oscillated in February 2016 only to see a significant rebound in March 2016 resulting in a greater than 8% increase. During the reporting period, pro-
cyclical, deep-value stocks were among the best performers due to the rapid shift in sentiment and preference for higher-beta exposure which had been a laggard in previous periods.
During the reporting period, smaller weights within the benchmark index were among the top performers, including a greater than 52% advance in Colombia, followed by New Zealand and Russia, which were higher by 32% and 31%, respectively. Meanwhile, perennial debt issues and slowing economic conditions led to a nearly 9% decline in Greece. Sector results were led by double-digit advances in utilities, materials and consumer staples given the market preference for deep value segments of the market. Meanwhile, energy stocks were surprisingly lower by over 5% overall, despite a rebound in oil and gas prices, followed by a nearly 2% decline in the health care sector.
Portfolio Review
The Portfolio seeks to benefit from the vast inefficiencies in global small-cap equities. During the reporting period, the Portfolio trailed the benchmark index due to more conservative stock selection at the country and sector level.
Specifically, the telecommunication services, information technology and health care sectors each contributed positively to performance as the result of stock selection. Meanwhile,
stockpicking in value-oriented segments of the market, including energy, industrials and materials, did not keep pace with the benchmark index during the reporting period. From a country standpoint, a relative underweight and positive stock selection in the United Kingdom added to results, as did stockpicking in South Korea and Israel. Conversely, the United States was the primary detractor due to more conservative stock selection, followed by Japan.
The largest individual active contributor to performance was Advanced Energy Industries, Inc. The maker of power conversion and control systems for the semiconductor industry advanced due in part to improved revenue growth and better than expected earnings guidance from management. Shares of China Lodging Group Ltd., an operator of hotels in China, contributed to performance thanks to an increase in consumer-related demand and integration with a hotel operator based in France. The largest individual active detractor to performance was Seadrill Partners LLC. Shares declined due to the overall weakness in energy prices alongside slowing demand for offshore drilling rigs. JetBlue Airways Corporation was lower due in part to concerns of declining topline revenue growth and potential impact from further slowing industry demand.
Average Annual Return for the period ended March 31, 2016
| 6 Month* | 1 Year | Since Inception† | ||||||||
| AllianzGI Global Small-Cap Opportunities Portfolio | 0.05% | -6.00% | -1.66% | |||||||
| MSCI All Country World Small-Cap Index †† | 4.87% | -4.50% | -2.21% | |||||||
* Cumulative return
† The Portfolio began operations on 7/23/14. Benchmark return comparisons began on the portfolio inception date. Lipper performance comparisons began on 7/31/14.
†† The MSCI All Country World Small-Cap Index captures small-cap representation across developed markets and emerging markets countries. The Index covers about 14% of the free float-adjusted market capitalization in each country (as of March 31, 2016). Index returns reflect the reinvestment of income dividends and capital gains, if any, but do not reflect fees, brokerage commissions or other expenses of investing. It is not possible to invest directly in an index.
Performance quoted represents past performance and is no guarantee of future results. Current performance may be lower or higher than performance shown. Investment return and the principal value will fluctuate. Shares may be worth more or less than original cost when redeemed. Returns do not reflect deduction of taxes that a shareholder would pay on portfolio distributions or redemption of portfolio shares. Total return performance assumes that all dividends and capital gain distributions were reinvested on the payable date. The Portfolio’s gross expense ratio is 7.46%. This ratio does not include an expense reduction, contractually agreed to through January 31, 2017. The Portfolio’s expense ratio net of this reduction is 1.20%. Expense ratio information is as of the Portfolio’s current PPM dated February 1, 2016.
| 6 | Semi-Annual Report / March 31, 2016 |
Table of Contents
AllianzGI Global Small-Cap Opportunities Portfolio
(unaudited) (continued)
Country Allocation (as of March 31, 2016)
| United States | 49.0% | |||
| Japan | 7.4% | |||
| China | 4.3% | |||
| Switzerland | 4.3% | |||
| Australia | 3.4% | |||
| Germany | 3.4% | |||
| Korea (Republic of) | 3.3% | |||
| Netherlands | 2.6% | |||
| Other | 19.9% | |||
| Cash & Equivalents — Net | 2.4% |
Cumulative Returns Through March 31, 2016
| Shareholder Expense Example | Actual Performance | |||
Beginning Account Value (10/1/15) | $ | 1,000.00 | ||
Ending Account Value (3/31/16) | $ | 1,000.50 | ||
Expenses Paid During Period | $ | 6.00 | ||
| Hypothetical Performance | ||||
| (5% return before expenses) | ||||
Beginning Account Value (10/1/15) | $ | 1,000.00 | ||
Ending Account Value (3/31/16) | $ | 1,019.00 | ||
Expenses Paid During Period | $ | 6.06 | ||
Expenses (net of reimbursement, if any) are equal to the annualized expense ratio (1.20%), multiplied by the average account value over the period, multiplied by 183/366.
| 7 | Semi-Annual Report / March 31, 2016 |
Table of Contents
Important Information (unaudited)
AllianzGI Institutional Multi-Series Trust
Effective September 30, 2015, the Trust’s fiscal year end changed from November 30th to September 30th.
As of March 31, 2016, AllianzGI Institutional Multi-Series Trust (the “Trust”) consisted of four investment series, AllianzGI Advanced Core Bond Portfolio, AllianzGI Discovery U.S. Portfolio, AllianzGI Global Small-Cap Opportunities Portfolio and AllianzGI Best Styles Global Managed Volatility Portfolio (each a “Portfolio” and collectively the “Portfolios”). As of March 31, 2016, the Portfolios offered one share class except, for AllianzGI Best Styles Global Managed Volatility which had not yet commenced operations.
The Cumulative Returns chart for each Portfolio assumes the initial investment was made on the first day of each Portfolio’s initial fiscal year. Results assume that all dividends and capital gain distributions, if any, were reinvested. They do not take into account the effect of taxes. The benchmark cumulative return began on the last day of the month of each Portfolio’s inception date.
The following disclosure provides important information regarding each Portfolio’s Shareholder Expense Example, which appears on each Portfolio Summary page in this Semi-Annual report. Please refer to this information when reviewing the Shareholder Expense Example for each Portfolio.
Shareholder Expense Example
Shareholders incur two types of costs: (1) transaction costs; and (2) ongoing costs, including investment management fees and other Portfolio expenses. The Shareholder Expense Example is intended to help shareholders understand ongoing costs (in dollars) of investing in a Portfolio and to compare these costs with the ongoing costs of investing in other mutual funds. The Shareholder Expense Example is based on $1,000.00 invested at the beginning and held for the entire period of since inception dates or October 1, 2015 through March 31, 2016.
Actual Expenses
The information in the tables for “Actual Performance” provides information about actual account values and actual expenses. You may use the information in this column, together with the amount you invested, to estimate the expenses that you paid over the period. Simply divide your account value by $1,000.00 (for example, an $8,600.00 account value divided by $1,000.00 = 8.6), then multiply the result by the number in the row entitled “Expenses Paid During Period” to estimate the expenses you paid on your account during this period.
Hypothetical Example for Comparison Purposes
The information in the tables for “Hypothetical Performance (5% return before expenses)” provides information about hypothetical account values and hypothetical expenses based on a Portfolio’s actual expense ratio and an assumed rate of return of 5% per year before expenses, which is not a Portfolio’s actual return. The hypothetical account values and expenses may not be used to estimate the actual ending account balance or expenses you paid for the period. You may use this information to compare the ongoing costs of investing in a Portfolio and other funds. To do so, compare this 5% hypothetical example with the 5% hypothetical examples that appear in the shareholder reports of other funds.
Please note that the expenses shown in the table are meant to highlight your ongoing costs only and do not reflect any transactional costs. Therefore, the information for “Hypothetical Performance (5% return before expenses)” is useful in comparing ongoing costs only, and will not help you determine the relative total costs of owning different funds. In addition, if these transactional costs were included, your costs would have been higher.
Proxy Voting
The Trust’s Investment Manager and Sub-Adviser have adopted written proxy voting policies and procedures (“Proxy Policy”) as required by Rule 206(4)-6 under the Investment Advisers Act of 1940. The Proxy Policy has been adopted by the Trust as the policies and procedures that the Sub-Adviser will use when voting proxies on behalf of each Portfolio. Copies of the written Proxy Policy and the factors that the Sub-Adviser may consider in determining how to vote proxies for each Portfolio, and information about how each Portfolio voted proxies relating to portfolio securities held during the most recent twelve-month period ended June 30, are available without charge, upon request, by calling 1-800-498-5413, and on the Securities and Exchange Commission’s (“SEC”) website at http://www.sec.gov.
Form N-Q
The Trust files its complete schedule of portfolio holdings with the SEC on Form N-Q for the first and third quarters of each fiscal year, which are available on the SEC’s website at http://www.sec.gov. A copy of the Trust’s Form N-Q is available without charge, upon request, by calling 1-800-498-5413. In addition, the Trust’s Form N-Q may be reviewed and copied at the SEC’s Public Reference Room in Washington, DC. Information on the operation of the Public Reference Room may be obtained by calling 1-800-SEC-0330.
| 8 | Semi-Annual Report / March 31, 2016 |
Table of Contents
March 31, 2016 (unaudited)
AllianzGI Advanced Core Bond Portfolio
Principal Amount (000s) | Value | |||||||||
| ||||||||||
U.S. TREASURY OBLIGATIONS - 51.3% | ||||||||||
U.S. Treasury Bonds, | ||||||||||
2.50%, 2/15/45 | $ | 1,200 | $ | 1,170,610 | ||||||
3.125%, 2/15/42 | 1,250 | 1,391,089 | ||||||||
3.125%, 2/15/43 | 700 | 775,838 | ||||||||
3.50%, 2/15/39 | 2,100 | 2,501,174 | ||||||||
4.75%, 2/15/41 | 1,400 | 1,989,996 | ||||||||
5.50%, 8/15/28 | 900 | 1,252,634 | ||||||||
6.00%, 2/15/26 | 1,200 | 1,660,969 | ||||||||
6.25%, 8/15/23 | 800 | 1,062,625 | ||||||||
U.S. Treasury Notes, | ||||||||||
0.75%, 12/31/17 | 900 | 900,422 | ||||||||
0.75%, 3/31/18 | 2,100 | 2,100,410 | ||||||||
1.25%, 10/31/18 (d) | 20,750 | 20,982,628 | ||||||||
1.375%, 3/31/20 | 1,300 | 1,314,702 | ||||||||
1.50%, 12/31/18 | 3,500 | 3,564,256 | ||||||||
1.50%, 10/31/19 | 800 | 814,094 | ||||||||
1.625%, 4/30/19 | 800 | 817,687 | ||||||||
1.75%, 10/31/20 | 2,700 | 2,767,921 | ||||||||
1.75%, 3/31/22 | 1,300 | 1,323,791 | ||||||||
1.75%, 1/31/23 | 1,900 | 1,926,942 | ||||||||
1.875%, 10/31/22 | 1,800 | 1,842,188 | ||||||||
2.125%, 1/31/21 | 2,100 | 2,190,932 | ||||||||
2.125%, 6/30/22 | 1,000 | 1,039,336 | ||||||||
2.125%, 5/15/25 | 1,000 | 1,031,543 | ||||||||
2.25%, 7/31/18 | 2,500 | 2,584,473 | ||||||||
2.50%, 5/15/24 | 1,000 | 1,063,945 | ||||||||
4.25%, 11/15/17 | 19,900 | 21,029,484 | ||||||||
|
| |||||||||
Total U.S. Treasury Obligations (cost-$78,333,299) | 79,099,689 | |||||||||
|
| |||||||||
CORPORATE BONDS & NOTES - 32.8% | ||||||||||
Advertising - 0.2% | ||||||||||
WPP Finance 2010, | ||||||||||
4.75%, 11/21/21 | 300 | 331,620 | ||||||||
|
| |||||||||
Aerospace & Defense - 0.4% | ||||||||||
United Technologies Corp., | ||||||||||
6.125%, 2/1/19 | 600 | 675,161 | ||||||||
|
| |||||||||
Agriculture - 0.2% | ||||||||||
Altria Group, Inc., | ||||||||||
5.375%, 1/31/44 | 300 | 368,088 | ||||||||
|
| |||||||||
Auto Components - 0.2% | ||||||||||
Delphi Corp., | ||||||||||
5.00%, 2/15/23 | 300 | 316,500 | ||||||||
|
| |||||||||
Auto Manufacturers - 1.7% | ||||||||||
Banque PSA Finance S.A., | ||||||||||
4.375%, 4/4/16 | 250 | 250,000 | ||||||||
Daimler Finance North America LLC, | ||||||||||
2.00%, 8/3/18 | 400 | 403,583 | ||||||||
Ford Motor Credit Co. LLC, | ||||||||||
1.724%, 12/6/17 | 300 | 297,935 | ||||||||
2.375%, 3/12/19 | 800 | 805,498 | ||||||||
General Motors Financial Co., Inc., | ||||||||||
4.375%, 9/25/21 | 300 | 310,583 | ||||||||
RCI Banque S.A., | ||||||||||
4.60%, 4/12/16 | 250 | 250,216 | ||||||||
Toyota Motor Credit Corp., | ||||||||||
1.70%, 2/19/19 | 300 | 302,984 | ||||||||
|
| |||||||||
| 2,620,799 | ||||||||||
|
| |||||||||
Banks - 10.3% | ||||||||||
Bank Nederlandse Gemeenten N.V. (a)(b), | ||||||||||
2.375%, 3/16/26 | 500 | 505,389 | ||||||||
Bank of America Corp., Ser. L, | ||||||||||
2.65%, 4/1/19 | 500 | 509,239 | ||||||||
Bank of Montreal, | ||||||||||
1.40%, 9/11/17 | 100 | 100,313 | ||||||||
2.375%, 1/25/19 | 600 | 611,849 | ||||||||
| 9 | Semi-Annual Report / March 31, 2016 |
Table of Contents
Schedule of Investments
March 31, 2016 (unaudited)
AllianzGI Advanced Core Bond Portfolio
Principal Amount (000s) | Value | |||||||||
| ||||||||||
Bank of Nova Scotia, | ||||||||||
2.80%, 7/21/21 | 300 | 307,966 | ||||||||
Barclays PLC, | ||||||||||
4.375%, 1/12/26 | 550 | 540,771 | ||||||||
Citigroup, Inc., | ||||||||||
4.50%, 1/14/22 | 500 | 548,358 | ||||||||
8.125%, 7/15/39 | 500 | 742,164 | ||||||||
Commonwealth Bank of Australia, | ||||||||||
2.25%, 3/16/17 | 350 | 355,045 | ||||||||
Deutsche Bank AG, | ||||||||||
3.70%, 5/30/24 | 450 | 445,167 | ||||||||
Dexia Credit Local S.A. (a)(b), | ||||||||||
1.875%, 3/28/19 | 400 | 402,178 | ||||||||
Goldman Sachs Group, Inc., | ||||||||||
2.375%, 1/22/18, Ser. GLOB | 500 | 506,709 | ||||||||
2.55%, 10/23/19 | 500 | 508,436 | ||||||||
Inter-American Development Bank, | ||||||||||
3.20%, 8/7/42 | 400 | 414,222 | ||||||||
JPMorgan Chase & Co., | ||||||||||
3.625%, 5/13/24 | 450 | 469,899 | ||||||||
5.40%, 1/6/42 | 250 | 299,310 | ||||||||
KFW, | ||||||||||
zero coupon, 6/29/37 | 100 | 53,245 | ||||||||
1.125%, 8/6/18 | 650 | 651,248 | ||||||||
2.75%, 10/1/20 | 400 | 422,988 | ||||||||
Landwirtschaftliche Rentenbank, | ||||||||||
0.875%, 9/12/17 | 1,300 | 1,299,122 | ||||||||
Lloyds Bank PLC, | ||||||||||
2.00%, 8/17/18 | 400 | 401,369 | ||||||||
Macquarie Bank Ltd. (a)(b), | ||||||||||
2.35%, 1/15/19 | 300 | 301,662 | ||||||||
3.90%, 1/15/26 | 500 | 504,653 | ||||||||
Morgan Stanley, | ||||||||||
2.375%, 7/23/19 | 550 | 556,339 | ||||||||
2.50%, 1/24/19 | 600 | 611,002 | ||||||||
4.75%, 3/22/17 | 400 | 413,244 | ||||||||
National Australia Bank Ltd., | ||||||||||
2.625%, 1/14/21 | 800 | 815,178 | ||||||||
Svenska Handelsbanken AB, | ||||||||||
2.50%, 1/25/19 | 600 | 614,777 | ||||||||
Swedbank AB, | ||||||||||
1.75%, 3/12/18 | 400 | 399,952 | ||||||||
UBS AG, | ||||||||||
2.375%, 8/14/19 | 550 | 558,975 | ||||||||
Wells Fargo & Co., | ||||||||||
3.90%, 5/1/45 | 300 | 300,910 | ||||||||
Westpac Banking Corp., | ||||||||||
2.00%, 3/3/20 | 350 | 348,851 | ||||||||
2.10%, 2/25/21 (a)(b) | 400 | 402,154 | ||||||||
|
| |||||||||
| 15,922,684 | ||||||||||
|
| |||||||||
Beverages - 0.2% | ||||||||||
PepsiCo, Inc., | ||||||||||
2.15%, 10/14/20 | 300 | 307,884 | ||||||||
|
| |||||||||
Building Materials - 0.2% | ||||||||||
Hanson Ltd., | ||||||||||
6.125%, 8/15/16 | 250 | 254,800 | ||||||||
|
| |||||||||
Chemicals - 0.3% | ||||||||||
Dow Chemical Co., | ||||||||||
7.375%, 11/1/29 | 300 | 385,683 | ||||||||
|
| |||||||||
Diversified Financial Services - 0.8% | ||||||||||
BlackRock, Inc., | ||||||||||
3.375%, 6/1/22 | 300 | 320,286 | ||||||||
General Electric Capital Corp., | ||||||||||
3.10%, 1/9/23 | 600 | 636,119 | ||||||||
General Motors Financial Co., Inc., | ||||||||||
3.70%, 11/24/20 | 300 | 306,179 | ||||||||
|
| |||||||||
| 1,262,584 | ||||||||||
|
| |||||||||
Diversified Telecommunication Services - 0.4% | ||||||||||
AT&T, Inc., | ||||||||||
| 10 | Semi-Annual Report / March 31, 2016 |
Table of Contents
Schedule of Investments
March 31, 2016 (unaudited)
AllianzGI Advanced Core Bond Portfolio
Principal Amount (000s) | Value | |||||||||
| ||||||||||
4.125%, 2/17/26 | 300 | 317,595 | ||||||||
5.65%, 2/15/47 | 300 | 332,467 | ||||||||
|
| |||||||||
| 650,062 | ||||||||||
|
| |||||||||
Electric Utilities - 1.8% | ||||||||||
Consolidated Edison Co. of New York, Inc., | ||||||||||
4.20%, 3/15/42, Ser. 12-A | 300 | 312,165 | ||||||||
4.45%, 3/15/44 | 300 | 327,764 | ||||||||
Electricite de France S.A. (a)(b), | ||||||||||
2.15%, 1/22/19 | 600 | 607,314 | ||||||||
4.875%, 1/22/44 | 500 | 501,936 | ||||||||
Enel Finance International NV, | ||||||||||
5.125%, 10/7/19 (a)(b) | 400 | 440,940 | ||||||||
6.80%, 9/15/37 | 150 | 192,994 | ||||||||
Pacific Gas & Electric Co., | ||||||||||
8.25%, 10/15/18 | 300 | 348,104 | ||||||||
|
| |||||||||
| 2,731,217 | ||||||||||
|
| |||||||||
Food & Beverage - 2.1% | ||||||||||
Anheuser-Busch InBev Fin Co., | ||||||||||
1.90%, 2/1/19 | 300 | 304,465 | ||||||||
2.65%, 2/1/21 | 500 | 514,361 | ||||||||
3.65%, 2/1/26 | 300 | 315,878 | ||||||||
4.90%, 2/1/46 | 300 | 336,018 | ||||||||
Diageo Capital PLC, | ||||||||||
3.875%, 4/29/43 | 400 | 407,373 | ||||||||
HJ Heinz Co. (a)(b), | ||||||||||
2.80%, 7/2/20 | 300 | 307,681 | ||||||||
5.20%, 7/15/45 | 300 | 337,077 | ||||||||
Mondelez International, Inc., | ||||||||||
2.25%, 2/1/19 | 450 | 459,826 | ||||||||
PepsiCo, Inc., | ||||||||||
2.75%, 3/1/23 | 200 | 208,591 | ||||||||
|
| |||||||||
| 3,191,270 | ||||||||||
|
| |||||||||
Food Products - 0.2% | ||||||||||
Unilever Capital Corp., | ||||||||||
3.10%, 7/30/25 | 300 | 321,946 | ||||||||
|
| |||||||||
Hand/Machine Tools - 0.2% | ||||||||||
Stanley Black & Decker, Inc., (converts to FRN on 12/15/18), | ||||||||||
5.75%, 12/15/53 | 300 | 316,500 | ||||||||
|
| |||||||||
Hotels, Restaurants & Leisure - 0.2% | ||||||||||
McDonald’s Corp., | ||||||||||
4.875%, 12/9/45 | 300 | 329,159 | ||||||||
|
| |||||||||
Insurance - 0.4% | ||||||||||
MetLife, Inc., | ||||||||||
5.70%, 6/15/35 | 550 | 642,963 | ||||||||
|
| |||||||||
Internet - 0.4% | ||||||||||
Google, Inc., | ||||||||||
3.375%, 2/25/24 | 500 | 547,883 | ||||||||
|
| |||||||||
IT Services - 0.4% | ||||||||||
IBM Corp., | ||||||||||
1.80%, 5/17/19 | 300 | 303,354 | ||||||||
4.70%, 2/19/46 | 300 | 331,057 | ||||||||
|
| |||||||||
| 634,411 | ||||||||||
|
| |||||||||
Machinery-Diversified - 1.1% | ||||||||||
CNH Industrial Capital LLC, | ||||||||||
3.875%, 7/16/18 | 200 | 199,500 | ||||||||
4.875%, 4/1/21 | 500 | 499,375 | ||||||||
John Deere Capital Corp., | ||||||||||
2.75%, 3/15/22 | 400 | 412,502 | ||||||||
2.80%, 3/6/23 | 500 | 508,737 | ||||||||
|
| |||||||||
| 1,620,114 | ||||||||||
|
| |||||||||
| 11 | Semi-Annual Report / March 31, 2016 |
Table of Contents
Schedule of Investments
March 31, 2016 (unaudited)
AllianzGI Advanced Core Bond Portfolio
Principal Amount (000s) | Value | |||||||||
| ||||||||||
Media - 1.6% | ||||||||||
CBS Corp., | ||||||||||
2.30%, 8/15/19 | 400 | 404,537 | ||||||||
Comcast Corp., | ||||||||||
6.45%, 3/15/37 | 300 | 398,551 | ||||||||
Discovery Communications LLC, | ||||||||||
5.05%, 6/1/20 | 400 | 428,945 | ||||||||
6.35%, 6/1/40 | 300 | 305,567 | ||||||||
RELX Capital, Inc., | ||||||||||
8.625%, 1/15/19 | 300 | 348,841 | ||||||||
Time Warner Cable, Inc., | ||||||||||
4.00%, 9/1/21 | 300 | 314,434 | ||||||||
Time Warner, Inc., | ||||||||||
4.875%, 3/15/20 | 300 | 329,333 | ||||||||
|
| |||||||||
| 2,530,208 | ||||||||||
|
| |||||||||
Mining - 0.4% | ||||||||||
Barrick Gold Corp., | ||||||||||
4.10%, 5/1/23 | 95 | 92,692 | ||||||||
BHP Billiton Finance USA Ltd., | ||||||||||
6.50%, 4/1/19 | 400 | 450,288 | ||||||||
|
| |||||||||
| 542,980 | ||||||||||
|
| |||||||||
Miscellaneous Manufacturing - 0.2% | ||||||||||
Siemens Financieringsmaatschappij NV (a)(b), | ||||||||||
4.40%, 5/27/45 | 300 | 330,050 | ||||||||
|
| |||||||||
Oil, Gas & Consumable Fuels - 0.8% | ||||||||||
Gazprom OAO Via Gaz Capital S.A. (a)(b), | ||||||||||
6.212%, 11/22/16 | 300 | 307,334 | ||||||||
Shell International Finance BV, | ||||||||||
6.375%, 12/15/38 | 150 | 184,047 | ||||||||
Sinopec Group Overseas Development 2012 Ltd., | ||||||||||
2.75%, 5/17/17 | 400 | 405,200 | ||||||||
Statoil ASA, | ||||||||||
2.90%, 11/8/20 | 400 | 410,839 | ||||||||
|
| |||||||||
| 1,307,420 | ||||||||||
|
| |||||||||
Pharmaceuticals - 0.9% | ||||||||||
AstraZeneca PLC, | ||||||||||
1.95%, 9/18/19 | 400 | 404,041 | ||||||||
Johnson & Johnson, | ||||||||||
4.375%, 12/5/33 | 250 | 285,388 | ||||||||
Merck & Co., Inc., | ||||||||||
2.75%, 2/10/25 | 300 | 307,604 | ||||||||
Sanofi, | ||||||||||
4.00%, 3/29/21 | 300 | 330,604 | ||||||||
|
| |||||||||
| 1,327,637 | ||||||||||
|
| |||||||||
Pipelines - 0.4% | ||||||||||
Enterprise Products Operating LLC, | ||||||||||
4.85%, 3/15/44 | 300 | 282,548 | ||||||||
TransCanada PipeLines Ltd., | ||||||||||
7.125%, 1/15/19 | 350 | 388,814 | ||||||||
|
| |||||||||
| 671,362 | ||||||||||
|
| |||||||||
Retail - 0.8% | ||||||||||
CVS Health Corp., | ||||||||||
4.00%, 12/5/23 | 300 | 330,872 | ||||||||
Macy’s Retail Holdings, Inc., | ||||||||||
4.50%, 12/15/34 | 300 | 244,367 | ||||||||
Walgreens Boots Alliance, Inc., | ||||||||||
2.70%, 11/18/19 | 300 | 306,571 | ||||||||
4.50%, 11/18/34 | 300 | 292,310 | ||||||||
|
| |||||||||
| 1,174,120 | ||||||||||
|
| |||||||||
Software - 0.2% | ||||||||||
Oracle Corp., | ||||||||||
3.875%, 7/15/20 | 300 | 327,632 | ||||||||
|
| |||||||||
| 12 | Semi-Annual Report / March 31, 2016 |
Table of Contents
Schedule of Investments
March 31, 2016 (unaudited)
AllianzGI Advanced Core Bond Portfolio
Principal Amount (000s) | Value | |||||||||
| ||||||||||
Supranational Bank - 1.7% | ||||||||||
African Development Bank, | ||||||||||
1.375%, 12/17/18 | 1,000 | 1,010,230 | ||||||||
Asian Development Bank, | ||||||||||
1.375%, 1/15/19 | 200 | 201,848 | ||||||||
1.625%, 3/16/21 | 700 | 705,366 | ||||||||
Council of Europe Development Bank, | ||||||||||
1.625%, 3/16/21 | 700 | 703,438 | ||||||||
|
| |||||||||
| 2,620,882 | ||||||||||
|
| |||||||||
Technology Hardware, Storage & Peripherals - 1.0% | ||||||||||
Apple, Inc., | ||||||||||
2.25%, 2/23/21 | 500 | 509,908 | ||||||||
2.85%, 2/23/23 | 450 | 465,901 | ||||||||
4.65%, 2/23/46 | 500 | 547,347 | ||||||||
|
| |||||||||
| 1,523,156 | ||||||||||
|
| |||||||||
Telecommunications - 2.5% | ||||||||||
AT&T, Inc., | ||||||||||
3.40%, 5/15/25 | 500 | 502,198 | ||||||||
3.90%, 3/11/24 | 300 | 317,258 | ||||||||
4.80%, 6/15/44 | 300 | 294,754 | ||||||||
5.60%, 5/15/18 | 400 | 433,020 | ||||||||
British Telecommunications PLC, | ||||||||||
5.95%, 1/15/18 | 300 | 323,676 | ||||||||
Cisco Systems, Inc., | ||||||||||
2.45%, 6/15/20 | 400 | 415,810 | ||||||||
5.50%, 1/15/40 | 250 | 312,161 | ||||||||
Verizon Communications, Inc., | ||||||||||
3.50%, 11/1/21 | 250 | 266,048 | ||||||||
4.15%, 3/15/24 | 500 | 544,736 | ||||||||
6.55%, 9/15/43 | 300 | 396,042 | ||||||||
|
| |||||||||
| 3,805,703 | ||||||||||
|
| |||||||||
Transportation - 0.6% | ||||||||||
Burlington Northern Santa Fe LLC, | ||||||||||
4.40%, 3/15/42 | 300 | 317,509 | ||||||||
CSX Corp., | ||||||||||
3.40%, 8/1/24 | 350 | 362,885 | ||||||||
FedEx Corp., | ||||||||||
4.10%, 4/15/43 | 300 | 285,974 | ||||||||
|
| |||||||||
| 966,368 | ||||||||||
|
| |||||||||
Total Corporate Bonds & Notes (cost-$49,628,246) | 50,558,846 | |||||||||
|
| |||||||||
U.S. GOVERNMENT AGENCY SECURITIES - 27.6% | ||||||||||
Fannie Mae, MBS (c), | ||||||||||
2.50%, 4/18/31 TBA, 15 Year | 1,200 | 1,232,062 | ||||||||
3.00%, 4/18/31 TBA, 15 Year | 1,460 | 1,525,329 | ||||||||
3.00%, 4/13/46 TBA, 30 Year | 2,760 | 2,832,396 | ||||||||
3.50%, 4/18/31 TBA, 15 Year | 1,520 | 1,605,381 | ||||||||
3.50%, 4/13/46 TBA, 30 Year | 4,680 | 4,908,424 | ||||||||
4.00%, 4/13/46 TBA, 30 Year | 3,290 | 3,516,460 | ||||||||
4.50%, 4/13/46 TBA, 30 Year | 1,440 | 1,567,047 | ||||||||
5.00%, 4/13/46 TBA, 30 Year | 730 | 807,842 | ||||||||
5.50%, 4/13/46 TBA, 30 Year | 940 | 1,054,471 | ||||||||
Freddie Mac, MBS, | ||||||||||
2.50%, 4/18/31 TBA, 15 Year (c) | 870 | 893,559 | ||||||||
3.00%, 4/18/31 TBA, 15 Year (c) | 930 | 972,359 | ||||||||
3.00%, 4/13/46 TBA, 30 Year (c) | 1,570 | 1,608,177 | ||||||||
3.50%, 4/18/31 TBA, 15 Year (c) | 960 | 1,013,400 | ||||||||
3.50%, 4/13/46 TBA, 30 Year (c) | 2,990 | 3,131,266 | ||||||||
4.00%, 8/1/44 | 222 | 237,252 | ||||||||
4.00%, 4/13/46 TBA, 30 Year (c) | 1,860 | 1,985,732 | ||||||||
4.50%, 4/13/46 TBA, 30 Year (c) | 860 | 934,343 | ||||||||
5.00%, 4/13/46 TBA, 30 Year (c) | 500 | 549,688 | ||||||||
5.50%, 4/13/46 TBA, 30 Year (c) | 570 | 634,639 | ||||||||
Ginnie Mae, MBS, TBA, 30 Year (c), | ||||||||||
3.00%, 4/20/46 | 2,330 | 2,415,009 | ||||||||
3.50%, 4/20/46 | 4,050 | 4,281,926 | ||||||||
4.00%, 4/20/46 | 2,060 | 2,202,832 | ||||||||
| 13 | Semi-Annual Report / March 31, 2016 |
Table of Contents
Schedule of Investments
March 31, 2016 (unaudited)
AllianzGI Advanced Core Bond Portfolio
Principal Amount (000s) | Value | |||||||||
| ||||||||||
4.50%, 4/20/46 | 2,480 | 2,662,610 | ||||||||
|
| |||||||||
Total U.S. Government Agency Securities (cost-$42,466,868) | 42,572,204 | |||||||||
|
| |||||||||
SOVEREIGN DEBT OBLIGATIONS - 13.7% | ||||||||||
Brazil - 0.3% | ||||||||||
Brazilian Government International Bond, | ||||||||||
4.25%, 1/7/25 | 300 | 275,175 | ||||||||
5.00%, 1/27/45 | 200 | 161,000 | ||||||||
|
| |||||||||
| 436,175 | ||||||||||
|
| |||||||||
Canada - 0.6% | ||||||||||
Export Development Canada, | ||||||||||
1.25%, 12/10/18 | 350 | 351,322 | ||||||||
Province of New Brunswick Canada, | ||||||||||
2.75%, 6/15/18 | 500 | 516,400 | ||||||||
|
| |||||||||
| 867,722 | ||||||||||
|
| |||||||||
Chile - 0.5% | ||||||||||
Chile Government International Bond, | ||||||||||
3.25%, 9/14/21 | 400 | 424,400 | ||||||||
3.625%, 10/30/42 | 300 | 284,250 | ||||||||
|
| |||||||||
| 708,650 | ||||||||||
|
| |||||||||
Colombia - 0.3% | ||||||||||
Colombia Government International Bond, | ||||||||||
4.00%, 2/26/24 | 400 | 403,000 | ||||||||
|
| |||||||||
Croatia - 0.5% | ||||||||||
Croatia Government International Bond, | ||||||||||
6.25%, 4/27/17 | 200 | 208,085 | ||||||||
6.75%, 11/5/19 | 500 | 549,597 | ||||||||
|
| |||||||||
| 757,682 | ||||||||||
|
| |||||||||
Germany - 0.9% | ||||||||||
FMS Wertmanagement AoeR, | ||||||||||
1.00%, 11/21/17 | 1,400 | 1,399,374 | ||||||||
|
| |||||||||
Hungary - 0.3% | ||||||||||
Hungary Government International Bond, | ||||||||||
4.00%, 3/25/19 | 500 | 519,688 | ||||||||
|
| |||||||||
Iceland - 0.4% | ||||||||||
Iceland Government International Bond, | ||||||||||
5.875%, 5/11/22 | 600 | 694,594 | ||||||||
|
| |||||||||
Indonesia - 0.8% | ||||||||||
Indonesia Government International Bond, | ||||||||||
3.75%, 4/25/22 | 550 | 556,499 | ||||||||
11.625%, 3/4/19 | 600 | 753,959 | ||||||||
|
| |||||||||
| 1,310,458 | ||||||||||
|
| |||||||||
Latvia - 0.6% | ||||||||||
Republic of Latvia, | ||||||||||
2.75%, 1/12/20 | 700 | 714,542 | ||||||||
5.25%, 2/22/17 | 200 | 206,910 | ||||||||
|
| |||||||||
| 921,452 | ||||||||||
|
| |||||||||
Lithuania - 0.9% | ||||||||||
Lithuania Government International Bond (a)(b), | ||||||||||
7.375%, 2/11/20 | 500 | 592,843 | ||||||||
Republic Of Lithuania, | ||||||||||
5.125%, 9/14/17 | 700 | 739,964 | ||||||||
|
| |||||||||
| 1,332,807 | ||||||||||
|
| |||||||||
Mexico - 1.0% | ||||||||||
Mexico Government International Bond, | ||||||||||
4.00%, 10/2/23 | 400 | 420,000 | ||||||||
4.75%, 3/8/44 | 300 | 300,000 | ||||||||
| 14 | Semi-Annual Report / March 31, 2016 |
Table of Contents
Schedule of Investments
March 31, 2016 (unaudited)
AllianzGI Advanced Core Bond Portfolio
Principal Amount (000s) | Value | |||||||||
| ||||||||||
5.95%, 3/19/19 | 600 | 669,750 | ||||||||
United Mexican States, | ||||||||||
4.125%, 1/21/26 | 200 | 210,200 | ||||||||
|
| |||||||||
| 1,599,950 | ||||||||||
|
| |||||||||
Morocco - 0.4% | ||||||||||
Morocco Government International Bond, | ||||||||||
4.25%, 12/11/22 | 550 | 563,269 | ||||||||
|
| |||||||||
Panama - 0.4% | ||||||||||
Panama Government International Bond, | ||||||||||
7.125%, 1/29/26 | 550 | 708,125 | ||||||||
|
| |||||||||
Peru - 0.9% | ||||||||||
Peruvian Government International Bond, | ||||||||||
7.125%, 3/30/19 | 500 | 575,500 | ||||||||
7.35%, 7/21/25 | 400 | 527,000 | ||||||||
Republic of Peru, | ||||||||||
4.125%, 8/25/27 | 300 | 315,750 | ||||||||
|
| |||||||||
| 1,418,250 | ||||||||||
|
| |||||||||
Philippines - 0.2% | ||||||||||
Philippine Government International Bond, | ||||||||||
6.50%, 1/20/20 | 300 | 354,108 | ||||||||
|
| |||||||||
Poland - 0.7% | ||||||||||
Poland Government International Bond, | ||||||||||
5.00%, 3/23/22 | 300 | 335,579 | ||||||||
6.375%, 7/15/19 | 600 | 682,802 | ||||||||
|
| |||||||||
| 1,018,381 | ||||||||||
|
| |||||||||
Supranational - 3.4% | ||||||||||
Asian Development Bank, | ||||||||||
1.375%, 3/23/20 | 500 | 501,154 | ||||||||
Council Of Europe Development Bank, | ||||||||||
1.00%, 3/7/18 | 1,000 | 1,001,068 | ||||||||
European Bank for Reconstruction & Development, | ||||||||||
0.75%, 9/1/17 | 1,000 | 998,484 | ||||||||
European Investment Bank, | ||||||||||
1.00%, 3/15/18 | 1,200 | 1,200,709 | ||||||||
International Bank for Reconstruction & Development, | ||||||||||
1.875%, 10/7/19 | 500 | 513,822 | ||||||||
Nordic Investment Bank, | ||||||||||
0.75%, 1/17/18 | 1,000 | 997,681 | ||||||||
|
| |||||||||
| 5,212,918 | ||||||||||
|
| |||||||||
Turkey - 0.6% | ||||||||||
Turkey Government International Bond, | ||||||||||
4.875%, 10/9/26 | 300 | 304,448 | ||||||||
6.75%, 4/3/18 | 600 | 647,298 | ||||||||
|
| |||||||||
| 951,746 | ||||||||||
|
| |||||||||
Total Sovereign Debt Obligations (cost-$20,987,832) | 21,178,349 | |||||||||
|
| |||||||||
Repurchase Agreements - 1.2% | ||||||||||
State Street Bank & Trust Co., | 1,795 | 1,795,000 | ||||||||
|
| |||||||||
Total Investments (cost-$193,211,245)-126.6% | 195,204,088 | |||||||||
|
| |||||||||
Liabilities in excess of other assets (e)-(26.6)% | (41,066,742) | |||||||||
|
| |||||||||
Net Assets-100.0% | $ | 154,137,346 | ||||||||
|
| |||||||||
| 15 | Semi-Annual Report / March 31, 2016 |
Table of Contents
Schedule of Investments
March 31, 2016 (unaudited)
AllianzGI Advanced Core Bond Portfolio
Notes to Schedule of Investments:
| (a) | Private Placement—Restricted as to resale and may not have a readily available market. Securities with an aggregate value of $5,541,211, representing 3.6% of net assets. |
| (b) | 144A—Exempt from registration under Rule 144A of the Securities Act of 1933. These securities may be resold in transactions exempt from registration, typically only to qualified institutional buyers. Unless otherwise indicated, these securities are not considered to be illiquid. |
| (c) | When-issued or delayed-delivery. To be settled/delivered after March 31, 2016. |
| (d) | All or partial amount segregated for the benefit of the counterparty as collateral for when-issued or delayed delivery securities. |
| (e) | Includes net unrealized appreciation (depreciation) of other financial instruments. See Note 6(a) in the Notes to Financial Statements. |
Glossary:
FRN - Floating Rate Note
MBS - Mortgage-Backed Securities
TBA - To Be Announced
| 16 | Semi-Annual Report / March 31, 2016 |
Table of Contents
Schedule of Investments
March 31, 2016 (unaudited)
AllianzGI Discovery U.S. Portfolio
| Shares | Value | |||||||||
| ||||||||||
COMMON STOCK - 95.7% | ||||||||||
Aerospace & Defense - 2.1% | ||||||||||
Boeing Co. (a) | 1,643 | $ | 208,562 | |||||||
|
| |||||||||
Air Freight & Logistics - 2.0% | ||||||||||
United Parcel Service, Inc., Class B (a) | 1,850 | 195,120 | ||||||||
|
| |||||||||
Airlines - 0.3% | ||||||||||
United Continental Holdings, Inc. (a)(b) | 560 | 33,522 | ||||||||
|
| |||||||||
Banks - 5.6% | ||||||||||
Citigroup, Inc. (a) | 5,958 | 248,747 | ||||||||
JPMorgan Chase & Co. (a) | 5,055 | 299,357 | ||||||||
|
| |||||||||
| 548,104 | ||||||||||
|
| |||||||||
Beverages - 2.5% | ||||||||||
PepsiCo, Inc. (a) | 2,390 | 244,927 | ||||||||
|
| |||||||||
Biotechnology - 5.8% | ||||||||||
Amgen, Inc. (a) | 1,615 | 242,137 | ||||||||
BioMarin Pharmaceutical, Inc. (a)(b) | 1,915 | 157,949 | ||||||||
Celgene Corp. (a)(b) | 1,735 | 173,656 | ||||||||
|
| |||||||||
| 573,742 | ||||||||||
|
| |||||||||
Capital Markets - 2.2% | ||||||||||
BlackRock, Inc. (a) | 625 | 212,856 | ||||||||
|
| |||||||||
Chemicals - 2.7% | ||||||||||
Ashland, Inc. (a) | 1,495 | 164,390 | ||||||||
Dow Chemical Co. (a) | 2,020 | 102,737 | ||||||||
|
| |||||||||
| 267,127 | ||||||||||
|
| |||||||||
Communications Equipment - 1.8% | ||||||||||
Cisco Systems, Inc. (a) | 6,233 | 177,454 | ||||||||
|
| |||||||||
Consumer Finance - 1.1% | ||||||||||
Synchrony Financial (a)(b) | 3,933 | 112,720 | ||||||||
|
| |||||||||
Diversified Financial Services - 4.0% | ||||||||||
CME Group, Inc. (a) | 1,505 | 144,555 | ||||||||
Intercontinental Exchange, Inc. (a) | 1,040 | 244,546 | ||||||||
|
| |||||||||
| 389,101 | ||||||||||
|
| |||||||||
Energy Equipment & Services - 1.4% | ||||||||||
Schlumberger Ltd. (a) | 1,865 | 137,544 | ||||||||
|
| |||||||||
Food & Staples Retailing - 2.7% | ||||||||||
CVS Health Corp. (a) | 2,570 | 266,586 | ||||||||
|
| |||||||||
Food Products - 4.1% | ||||||||||
Hain Celestial Group, Inc. (a)(b) | 5,056 | 206,841 | ||||||||
Mondelez International, Inc., Class A (a) | 5,025 | 201,603 | ||||||||
|
| |||||||||
| 408,444 | ||||||||||
|
| |||||||||
Health Care Equipment & Supplies - 3.3% | ||||||||||
Intuitive Surgical, Inc. (a)(b) | 305 | 183,320 | ||||||||
St. Jude Medical, Inc. (a) | 2,520 | 138,600 | ||||||||
|
| |||||||||
| 321,920 | ||||||||||
|
| |||||||||
Health Care Providers & Services - 2.6% | ||||||||||
UnitedHealth Group, Inc. (a) | 1,990 | 256,511 | ||||||||
|
| |||||||||
Hotels, Restaurants & Leisure - 2.9% | ||||||||||
McDonald’s Corp. (a) | 2,235 | 280,895 | ||||||||
|
| |||||||||
Industrial Conglomerates - 4.0% | ||||||||||
General Electric Co. (a) | 12,465 | 396,262 | ||||||||
|
| |||||||||
Internet Software & Services - 3.9% | ||||||||||
Akamai Technologies, Inc. (a)(b) | 2,700 | 150,039 | ||||||||
| 17 | Semi-Annual Report / March 31, 2016 |
Table of Contents
Schedule of Investments
March 31, 2016 (unaudited)
AllianzGI Discovery U.S. Portfolio
| Shares | Value | |||||||||
| ||||||||||
Alphabet, Inc., Class A (a)(b) | 306 | 233,447 | ||||||||
|
| |||||||||
| 383,486 | ||||||||||
|
| |||||||||
IT Services - 1.4% | ||||||||||
Cognizant Technology Solutions Corp., Class A (a)(b) | 2,250 | 141,075 | ||||||||
|
| |||||||||
Media - 5.1% | ||||||||||
CBS Corp., Class B (a) | 4,450 | 245,150 | ||||||||
Comcast Corp., Class A (a) | 4,210 | 257,147 | ||||||||
|
| |||||||||
| 502,297 | ||||||||||
|
| |||||||||
Multi-line Retail - 2.0% | ||||||||||
Dollar General Corp. (a) | 2,351 | 201,246 | ||||||||
|
| |||||||||
Oil, Gas & Consumable Fuels - 7.2% | ||||||||||
Chevron Corp. (a) | 2,230 | 212,742 | ||||||||
Concho Resources, Inc. (a)(b) | 1,710 | 172,778 | ||||||||
Continental Resources, Inc. (a)(b) | 5,943 | 180,430 | ||||||||
Pioneer Natural Resources Co. (a) | 996 | 140,177 | ||||||||
|
| |||||||||
| 706,127 | ||||||||||
|
| |||||||||
Pharmaceuticals - 2.7% | ||||||||||
Merck & Co., Inc. (a) | 5,030 | 266,137 | ||||||||
|
| |||||||||
Road & Rail - 1.6% | ||||||||||
Union Pacific Corp. (a) | 2,015 | 160,293 | ||||||||
|
| |||||||||
Semiconductors & Semiconductor Equipment - 4.1% | ||||||||||
Intel Corp. (a) | 5,815 | 188,115 | ||||||||
Lam Research Corp. (a) | 2,640 | 218,064 | ||||||||
|
| |||||||||
| 406,179 | ||||||||||
|
| |||||||||
Software - 9.0% | ||||||||||
Check Point Software Technologies Ltd. (a)(b) | 1,940 | 169,692 | ||||||||
Microsoft Corp. (a) | 5,070 | 280,016 | ||||||||
Mobileye NV (b) | 5,420 | 202,112 | ||||||||
Oracle Corp. (a) | 5,685 | 232,573 | ||||||||
|
| |||||||||
| 884,393 | ||||||||||
|
| |||||||||
Specialty Retail - 5.4% | ||||||||||
Home Depot, Inc. (a) | 2,290 | 305,555 | ||||||||
TJX Cos., Inc. (a) | 2,905 | 227,607 | ||||||||
|
| |||||||||
| 533,162 | ||||||||||
|
| |||||||||
Technology Hardware, Storage & Peripherals - 1.5% | ||||||||||
Apple, Inc. (a) | 1,390 | 151,496 | ||||||||
|
| |||||||||
Trading Companies & Distributors - 0.7% | ||||||||||
United Rentals, Inc. (a)(b) | 1,025 | 63,745 | ||||||||
|
| |||||||||
Total Common Stock (cost-$9,111,227) | 9,431,033 | |||||||||
|
| |||||||||
Principal Amount (000s) | ||||||||||
|
| |||||||||
Repurchase Agreements - 73.8% | ||||||||||
State Street Bank & Trust Co., | $ | 7,277 | 7,277,000 | |||||||
|
| |||||||||
Total Investments, before securities sold short (cost-$16,388,227)-169.5% | 16,708,033 | |||||||||
|
| |||||||||
| Shares | ||||||||||
|
| |||||||||
SECURITIES SOLD SHORT - (100.8)% | ||||||||||
Common Stock - (95.4)% | ||||||||||
Aerospace & Defense - (1.1)% | ||||||||||
Textron, Inc. | 3,060 | (111,568) | ||||||||
|
| |||||||||
| 18 | Semi-Annual Report / March 31, 2016 |
Table of Contents
Schedule of Investments
March 31, 2016 (unaudited)
AllianzGI Discovery U.S. Portfolio
| Shares | Value | |||||||
| ||||||||
Air Freight & Logistics - (1.1)% | ||||||||
Expeditors International of Washington, Inc. | 2,210 | (107,870) | ||||||
|
| |||||||
Airlines - (0.8)% | ||||||||
American Airlines Group, Inc. | 1,913 | (78,452) | ||||||
|
| |||||||
Auto Components - (0.9)% | ||||||||
BorgWarner, Inc. | 2,350 | (90,240) | ||||||
|
| |||||||
Automobiles - (2.8)% | ||||||||
General Motors Co. | 4,610 | (144,892) | ||||||
Harley-Davidson, Inc. | 2,469 | (126,734) | ||||||
|
| |||||||
| (271,626) | ||||||||
|
| |||||||
Banks - (1.5)% | ||||||||
Comerica, Inc. | 2,610 | (98,841) | ||||||
Zions BanCorp. | 2,045 | (49,509) | ||||||
|
| |||||||
| (148,350) | ||||||||
|
| |||||||
Beverages - (1.8)% | ||||||||
Coca-Cola Co. | 3,790 | (175,818) | ||||||
|
| |||||||
Biotechnology - (1.0)% | ||||||||
Incyte Corp. (b) | 1,340 | (97,110) | ||||||
|
| |||||||
Capital Markets - (6.3)% | ||||||||
Ameriprise Financial, Inc. | 1,080 | (101,531) | ||||||
Franklin Resources, Inc. | 2,485 | (97,039) | ||||||
Goldman Sachs Group, Inc. | 800 | (125,584) | ||||||
Legg Mason, Inc. | 1,525 | (52,887) | ||||||
Morgan Stanley | 6,105 | (152,686) | ||||||
T Rowe Price Group, Inc. | 1,265 | (92,927) | ||||||
|
| |||||||
| (622,654) | ||||||||
|
| |||||||
Chemicals - (2.9)% | ||||||||
CF Industries Holdings, Inc. | 2,760 | (86,499) | ||||||
Monsanto Co. | 1,695 | (148,719) | ||||||
Mosaic Co. | 1,800 | (48,600) | ||||||
|
| |||||||
| (283,818) | ||||||||
|
| |||||||
Communications Equipment - (2.2)% | ||||||||
F5 Networks, Inc. (b) | 1,065 | (112,730) | ||||||
Juniper Networks, Inc. | 4,205 | (107,270) | ||||||
|
| |||||||
| (220,000) | ||||||||
|
| |||||||
Consumer Finance - (1.5)% | ||||||||
American Express Co. | 2,490 | (152,886) | ||||||
|
| |||||||
Distributors - (0.8)% | ||||||||
Genuine Parts Co. | 750 | (74,520) | ||||||
|
| |||||||
Diversified Financial Services - (4.0)% | ||||||||
Berkshire Hathaway, Inc., Class B (b) | 1,380 | (195,794) | ||||||
Leucadia National Corp. | 6,400 | (103,488) | ||||||
Moody’s Corp. | 1,015 | (98,009) | ||||||
|
| |||||||
| (397,291) | ||||||||
|
| |||||||
Electrical Equipment - (2.3)% | ||||||||
Eaton Corp. PLC | 1,720 | (107,603) | ||||||
Rockwell Automation, Inc. | 1,066 | (121,258) | ||||||
|
| |||||||
| (228,861) | ||||||||
|
| |||||||
Energy Equipment & Services - (1.9)% | ||||||||
Core Laboratories NV | 480 | (53,957) | ||||||
Diamond Offshore Drilling, Inc. | 2,195 | (47,697) | ||||||
Helmerich & Payne, Inc. | 1,495 | (87,787) | ||||||
|
| |||||||
| (189,441) | ||||||||
|
| |||||||
Food & Staples Retailing - (1.0)% | ||||||||
Whole Foods Market, Inc. | 3,115 | (96,908) | ||||||
|
| |||||||
| 19 | Semi-Annual Report / March 31, 2016 |
Table of Contents
Schedule of Investments
March 31, 2016 (unaudited)
AllianzGI Discovery U.S. Portfolio
| Shares | Value | |||||||
| ||||||||
Food Products - (2.6)% | ||||||||
Archer-Daniels-Midland Co. | 2,735 | (99,308) | ||||||
Blue Buffalo Pet Products, Inc. (b) | 1,995 | (51,191) | ||||||
Hershey Co. | 1,155 | (106,364) | ||||||
|
| |||||||
| (256,863) | ||||||||
|
| |||||||
Health Care Providers & Services - (4.1)% | ||||||||
Brookdale Senior Living, Inc. (b) | 3,155 | (50,101) | ||||||
DaVita HealthCare Partners, Inc. (b) | 1,390 | (101,998) | ||||||
LifePoint Hospitals, Inc. (b) | 785 | (54,361) | ||||||
McKesson Corp. | 970 | (152,533) | ||||||
Team Health Holdings, Inc. (b) | 1,160 | (48,500) | ||||||
|
| |||||||
| (407,493) | ||||||||
|
| |||||||
Health Care Technology - (1.0)% | ||||||||
Cerner Corp. (b) | 1,920 | (101,683) | ||||||
|
| |||||||
Hotels, Restaurants & Leisure - (2.5)% | ||||||||
Chipotle Mexican Grill, Inc. (b) | 190 | (89,484) | ||||||
Dunkin’ Brands Group, Inc. | 1,195 | (56,368) | ||||||
Restaurant Brands International, Inc. | 2,577 | (100,065) | ||||||
|
| |||||||
| (245,917) | ||||||||
|
| |||||||
Household Durables - (1.2)% | ||||||||
Garmin Ltd. | 3,041 | (121,518) | ||||||
|
| |||||||
Household Products - (2.1)% | ||||||||
Colgate-Palmolive Co. | 1,495 | (105,622) | ||||||
Procter & Gamble Co. | 1,185 | (97,537) | ||||||
|
| |||||||
| (203,159) | ||||||||
|
| |||||||
Internet & Catalog Retail - (2.1)% | ||||||||
Amazon.com, Inc. (b) | 345 | (204,806) | ||||||
|
| |||||||
Internet Software & Services - (1.8)% | ||||||||
Alibaba Group Holding Ltd. ADR (b) | 2,200 | (173,866) | ||||||
|
| |||||||
IT Services - (4.3)% | ||||||||
Alliance Data Systems Corp. (b) | 470 | (103,400) | ||||||
International Business Machines Corp. | 1,460 | (221,117) | ||||||
Teradata Corp. (b) | 1,875 | (49,200) | ||||||
WEX, Inc. (b) | 620 | (51,683) | ||||||
|
| |||||||
| (425,400) | ||||||||
|
| |||||||
Machinery - (7.6)% | ||||||||
Caterpillar, Inc. | 2,005 | (153,463) | ||||||
CNH Industrial NV | 16,080 | (108,701) | ||||||
Cummins, Inc. | 1,010 | (111,039) | ||||||
Donaldson Co., Inc. | 1,495 | (47,706) | ||||||
Dover Corp. | 1,610 | (103,571) | ||||||
PACCAR, Inc. | 2,125 | (116,216) | ||||||
WABCO Holdings, Inc. (b) | 1,045 | (111,731) | ||||||
|
| |||||||
| (752,427) | ||||||||
|
| |||||||
Media - (2.7)% | ||||||||
Discovery Communications, Inc., Class A (b) | 3,723 | (106,589) | ||||||
Twenty-First Century Fox, Inc., Class A | 5,669 | (158,052) | ||||||
|
| |||||||
| (264,641) | ||||||||
|
| |||||||
Oil, Gas & Consumable Fuels - (4.7)% | ||||||||
California Resources Corp. | 1 | (1) | ||||||
Exxon Mobil Corp. | 2,415 | (201,870) | ||||||
Noble Energy, Inc. | 3,305 | (103,810) | ||||||
Occidental Petroleum Corp. | 2,325 | (159,099) | ||||||
|
| |||||||
| (464,780) | ||||||||
|
| |||||||
Pharmaceuticals - (3.0)% | ||||||||
Allergan PLC (b) | 720 | (192,982) | ||||||
Eli Lilly & Co. | 1,395 | (100,454) | ||||||
|
| |||||||
| (293,436) | ||||||||
|
| |||||||
| 20 | Semi-Annual Report / March 31, 2016 |
Table of Contents
Schedule of Investments
March 31, 2016 (unaudited)
AllianzGI Discovery U.S. Portfolio
| Shares | Value | |||||||
| ||||||||
Real Estate Investment Trust - (3.7)% | ||||||||
AvalonBay Communities, Inc. | 805 | (153,111) | ||||||
Boston Properties, Inc. | 854 | (108,527) | ||||||
Weyerhaeuser Co. | 3,435 | (106,416) | ||||||
|
| |||||||
| (368,054) | ||||||||
|
| |||||||
Semiconductors & Semiconductor Equipment - (7.0)% | ||||||||
Analog Devices, Inc. | 2,039 | (120,688) | ||||||
Linear Technology Corp. | 1,735 | (77,312) | ||||||
NXP Semiconductors NV (b) | 1,270 | (102,959) | ||||||
Qorvo, Inc. (b) | 1,510 | (76,119) | ||||||
QUALCOMM, Inc. | 2,778 | (142,067) | ||||||
Texas Instruments, Inc. | 2,895 | (166,231) | ||||||
|
| |||||||
| (685,376) | ||||||||
|
| |||||||
Software - (2.7)% | ||||||||
ANSYS, Inc. (b) | 840 | (75,146) | ||||||
Fortinet, Inc. (b) | 2,665 | (81,629) | ||||||
Salesforce.com, Inc. (b) | 1,435 | (105,946) | ||||||
|
| |||||||
| (262,721) | ||||||||
|
| |||||||
Specialty Retail - (6.6)% | ||||||||
Advance Auto Parts, Inc. | 450 | (72,153) | ||||||
Bed Bath & Beyond, Inc. (b) | 2,165 | (107,471) | ||||||
Gap, Inc. | 3,745 | (110,103) | ||||||
L Brands, Inc. | 1,145 | (100,542) | ||||||
Tiffany & Co. | 1,390 | (101,998) | ||||||
Tractor Supply Co. | 1,219 | (110,271) | ||||||
Urban Outfitters, Inc. (b) | 1,470 | (48,642) | ||||||
|
| |||||||
| (651,180) | ||||||||
|
| |||||||
Technology Hardware, Storage & Peripherals - (0.8)% | ||||||||
HP, Inc. | 6,110 | (75,275) | ||||||
|
| |||||||
Trading Companies & Distributors - (1.0)% | ||||||||
Fastenal Co. | 2,040 | (99,960) | ||||||
|
| |||||||
Total Common Stock (proceeds received-$8,957,140) | (9,405,968) | |||||||
|
| |||||||
Exchange-Traded Funds - (5.4)% | ||||||||
Health Care Select Sector SPDR Fund | 1,475 | (99,975) | ||||||
iShares Nasdaq Biotechnology Index Fund | 937 | (244,379) | ||||||
Technology Select Sector SPDR Fund | 4,210 | (186,756) | ||||||
|
| |||||||
Total Exchange-Traded Funds (proceeds received-$557,517) | (531,110) | |||||||
|
| |||||||
Total Securities Sold Short (proceeds received-$9,514,657) | (9,937,078) | |||||||
|
| |||||||
Total Investments, net of securities sold short (cost-$6,873,570)-68.7% | 6,770,955 | |||||||
|
| |||||||
Other assets less other liabilities-31.3% | 3,087,151 | |||||||
|
| |||||||
Net Assets-100.0% | $ | 9,858,106 | ||||||
|
| |||||||
| 21 | Semi-Annual Report / March 31, 2016 |
Table of Contents
Schedule of Investments
March 31, 2016 (unaudited)
AllianzGI Discovery U.S. Portfolio
Notes to Schedule of Investments:
| (a) | All or partial amount segregated for the benefit of the counterparty as collateral for securities sold short. |
| (b) | Non-income producing. |
Glossary:
ADR - American Depositary Receipt
| 22 | Semi-Annual Report / March 31, 2016 |
Table of Contents
Schedule of Investments
March 31, 2016 (unaudited)
AllianzGI Global Small-Cap Opportunities Portfolio
| Shares | Value | |||||||
| ||||||||
COMMON STOCK - 97.6% | ||||||||
Australia - 3.4% | ||||||||
Blackmores Ltd. | 192 | $ | 26,065 | |||||
Genworth Mortgage Insurance Australia Ltd. | 17,440 | 33,208 | ||||||
Qantas Airways Ltd. (d) | 34,018 | 106,182 | ||||||
|
| |||||||
| 165,455 | ||||||||
|
| |||||||
Austria - 0.2% | ||||||||
Kapsch TrafficCom AG | 340 | 11,508 | ||||||
|
| |||||||
Belgium - 2.0% | ||||||||
AGFA-Gevaert NV (d) | 17,001 | 75,632 | ||||||
Gimv NV | 350 | 19,310 | ||||||
|
| |||||||
| 94,942 | ||||||||
|
| |||||||
Brazil - 0.4% | ||||||||
JBS S.A. | 6,400 | 19,490 | ||||||
|
| |||||||
Canada - 1.4% | ||||||||
Cascades, Inc. | 4,972 | 32,808 | ||||||
Milestone Apartments Real Estate Investment Trust REIT | 2,743 | 35,060 | ||||||
|
| |||||||
| 67,868 | ||||||||
|
| |||||||
China - 4.9% | ||||||||
China Lodging Group Ltd. ADR (d) | 1,990 | 76,038 | ||||||
China SCE Property Holdings Ltd. | 125,000 | 26,910 | ||||||
Chongqing Rural Commercial Bank Co., Ltd., Class H | 36,000 | 19,058 | ||||||
Powerlong Real Estate Holdings Ltd. | 67,000 | 14,026 | ||||||
Sohu.com, Inc. (d) | 1,185 | 58,705 | ||||||
Yuzhou Properties Co., Ltd. | 159,000 | 41,860 | ||||||
|
| |||||||
| 236,597 | ||||||||
|
| |||||||
Denmark - 0.6% | ||||||||
SimCorp A/S (c) | 587 | 27,058 | ||||||
|
| |||||||
France - 2.1% | ||||||||
Altran Technologies S.A. | 3,214 | 44,496 | ||||||
Cegid Group S.A. | 488 | 27,509 | ||||||
Ipsen S.A. | 546 | 31,309 | ||||||
|
| |||||||
| 103,314 | ||||||||
|
| |||||||
Germany - 3.4% | ||||||||
Aareal Bank AG | 2,452 | 79,275 | ||||||
Deutsche Lufthansa AG (d) | 5,226 | 84,345 | ||||||
|
| |||||||
| 163,620 | ||||||||
|
| |||||||
Hong Kong - 1.7% | ||||||||
Champion REIT | 125,000 | 63,667 | ||||||
Shun Tak Holdings Ltd. | 64,000 | 21,276 | ||||||
|
| |||||||
| 84,943 | ||||||||
|
| |||||||
India - 0.4% | ||||||||
WNS Holdings Ltd. ADR (d) | 570 | 17,465 | ||||||
|
| |||||||
Israel - 0.7% | ||||||||
Orbotech Ltd. (d) | 1,505 | 35,789 | ||||||
|
| |||||||
Italy - 0.3% | ||||||||
ASTM SpA | 1,385 | 15,986 | ||||||
|
| |||||||
Japan - 7.4% | ||||||||
Aisan Industry Co., Ltd. | 1,900 | 14,934 | ||||||
Gunze Ltd. | 6,000 | 16,971 | ||||||
Nichiha Corp. | 1,500 | 22,681 | ||||||
Nippon Suisan Kaisha Ltd. | 5,000 | 24,266 | ||||||
Nippon Synthetic Chemical Industry Co., Ltd. | 4,000 | 25,356 | ||||||
Okamura Corp. | 2,400 | 22,889 | ||||||
Pacific Industrial Co., Ltd. | 7,900 | 79,642 | ||||||
Ryobi Ltd. | 8,000 | 31,513 | ||||||
Topre Corp. | 1,500 | 27,936 | ||||||
Towa Pharmaceutical Co., Ltd. | 300 | 12,290 | ||||||
| 23 | Semi-Annual Report / March 31, 2016 |
Table of Contents
Schedule of Investments
March 31, 2016 (unaudited)
AllianzGI Global Small-Cap Opportunities Portfolio
| Shares | Value | |||||||
| ||||||||
Yorozu Corp. | 3,800 | 79,702 | ||||||
|
| |||||||
| 358,180 | ||||||||
|
| |||||||
Korea (Republic of) - 3.3% | ||||||||
Daishin Securities Co., Ltd. | 7,631 | 80,052 | ||||||
KB Insurance Co., Ltd. | 768 | 22,888 | ||||||
SK Materials Co., Ltd. | 351 | 34,210 | ||||||
Tongyang Life Insurance Co., Ltd. | 2,157 | 22,310 | ||||||
|
| |||||||
| 159,460 | ||||||||
|
| |||||||
Mexico - 0.4% | ||||||||
Controladora Vuela Cia de Aviacion S.A.B. de C.V., Class A (d) | 9,100 | 19,225 | ||||||
|
| |||||||
Netherlands - 1.7% | ||||||||
Accell Group | 983 | 20,907 | ||||||
Koninklijke BAM Groep NV (d) | 13,144 | 62,063 | ||||||
|
| |||||||
| 82,970 | ||||||||
|
| |||||||
New Zealand - 0.9% | ||||||||
Kiwi Property Group Ltd. | 41,965 | 41,940 | ||||||
|
| |||||||
Norway - 0.9% | ||||||||
BW LPG Ltd. (a) | 7,484 | 45,396 | ||||||
|
| |||||||
Russian Federation - 0.9% | ||||||||
X5 Retail Group NV GDR (d) | 2,124 | 45,029 | ||||||
|
| |||||||
South Africa - 0.6% | ||||||||
Astral Foods Ltd. | 2,336 | 17,536 | ||||||
Vukile Property Fund Ltd. REIT | 9,234 | 10,623 | ||||||
|
| |||||||
| 28,159 | ||||||||
|
| |||||||
Switzerland - 4.3% | ||||||||
BKW AG | 1,061 | 44,579 | ||||||
Swiss Life Holding AG (d) | 360 | 95,532 | ||||||
Transocean Ltd. | 4,750 | 43,415 | ||||||
Valiant Holding AG | 225 | 23,972 | ||||||
|
| |||||||
| 207,498 | ||||||||
|
| |||||||
Taiwan - 2.3% | ||||||||
Farglory Land Development Co., Ltd. | 36,000 | 41,415 | ||||||
Gintech Energy Corp. (d) | 11,000 | 8,733 | ||||||
Grand Pacific Petrochemical | 51,000 | 27,393 | ||||||
Huaku Development Co., Ltd. | 14,000 | 25,883 | ||||||
LCY Chemical Corp. (d) | 8,000 | 8,273 | ||||||
|
| |||||||
| 111,697 | ||||||||
|
| |||||||
Thailand - 1.4% | ||||||||
SVI PCL (d) | 170,100 | 25,603 | ||||||
Thai Vegetable Oil PCL | 44,400 | 29,519 | ||||||
Tipco Asphalt PCL | 21,300 | 15,120 | ||||||
|
| |||||||
| 70,242 | ||||||||
|
| |||||||
Turkey - 1.2% | ||||||||
Is Gayrimenkul Yatirim Ortakligi AS REIT | 90,561 | 58,505 | ||||||
|
| |||||||
United Kingdom - 1.6% | ||||||||
JD Sports Fashion PLC | 1,323 | 21,414 | ||||||
UNITE Group PLC | 2,000 | 18,248 | ||||||
Workspace Group PLC REIT | 3,518 | 39,517 | ||||||
|
| |||||||
| 79,179 | ||||||||
|
| |||||||
United States - 49.2% | ||||||||
Acuity Brands, Inc. | 65 | 14,179 | ||||||
Advanced Energy Industries, Inc. (d) | 3,440 | 119,678 | ||||||
Alliance Holdings GP L.P. | 1,115 | 16,301 | ||||||
Allscripts Healthcare Solutions, Inc. (d) | 1,270 | 16,777 | ||||||
American Eagle Outfitters, Inc. | 1,700 | 28,339 | ||||||
American Equity Investment Life Holding Co. | 1,595 | 26,796 | ||||||
Armour Residential REIT, Inc. REIT | 625 | 13,456 | ||||||
Arrow Electronics, Inc. (d) | 1,135 | 73,105 | ||||||
Banc of California, Inc. | 5,270 | 92,225 | ||||||
| 24 | Semi-Annual Report / March 31, 2016 |
Table of Contents
Schedule of Investments
March 31, 2016 (unaudited)
AllianzGI Global Small-Cap Opportunities Portfolio
| Shares | Value | |||||||
| ||||||||
Beneficial Bancorp, Inc. (d) | 3,095 | 42,371 | ||||||
Berkshire Hills Bancorp, Inc. | 1,090 | 29,310 | ||||||
Black Hills Corp. | 235 | 14,131 | ||||||
Brookline Bancorp, Inc. | 7,600 | 83,676 | ||||||
Bruker Corp. | 3,625 | 101,500 | ||||||
CBIZ, Inc. (d) | 3,435 | 34,659 | ||||||
Dynavax Technologies Corp. (d) | 630 | 12,121 | ||||||
Dynex Capital, Inc. REIT | 3,440 | 22,876 | ||||||
Emergent Biosolutions, Inc. (d) | 2,350 | 85,422 | ||||||
Express, Inc. (d) | 3,595 | 76,969 | ||||||
HD Supply Holdings, Inc. (d) | 790 | 26,125 | ||||||
ICU Medical, Inc. (d) | 440 | 45,804 | ||||||
JetBlue Airways Corp. (d) | 4,270 | 90,182 | ||||||
John Bean Technologies Corp. | 795 | 44,846 | ||||||
Knoll, Inc. | 1,350 | 29,228 | ||||||
Koppers Holdings, Inc. (d) | 1,250 | 28,088 | ||||||
Magellan Health, Inc. (d) | 430 | 29,210 | ||||||
Matrix Service Co. (d) | 470 | 8,319 | ||||||
Navigant Consulting, Inc. (d) | 5,130 | 81,105 | ||||||
NeuStar, Inc., Class A (d) | 3,255 | 80,073 | ||||||
Nuance Communications, Inc. (d) | 4,290 | 80,180 | ||||||
Owens Corning | 2,170 | 102,598 | ||||||
Plantronics, Inc. | 1,825 | 71,522 | ||||||
Post Holdings, Inc. (d) | 1,440 | 99,029 | ||||||
Premier, Inc., Class A (d) | 805 | 26,855 | ||||||
Prestige Brands Holdings, Inc. (d) | 1,025 | 54,725 | ||||||
QLogic Corp. (d) | 3,755 | 50,467 | ||||||
Sanmina Corp. (d) | 4,130 | 96,559 | ||||||
Seadrill Partners LLC | 13,125 | 45,675 | ||||||
SpartanNash Co. | 1,450 | 43,949 | ||||||
Spirit AeroSystems Holdings, Inc., Class A (d) | 1,050 | 47,628 | ||||||
Telephone & Data Systems, Inc. | 3,130 | 94,182 | ||||||
United Therapeutics Corp. (d) | 165 | 18,386 | ||||||
USANA Health Sciences, Inc. (d) | 335 | 40,676 | ||||||
Vail Resorts, Inc. | 160 | 21,392 | ||||||
Vantiv, Inc., Class A (d) | 2,005 | 108,029 | ||||||
Vocera Communications, Inc. (d) | 1,920 | 24,480 | ||||||
|
| |||||||
| 2,393,203 | ||||||||
|
| |||||||
Total Investments (cost-$4,554,373) (b)-97.6% | 4,744,718 | |||||||
|
| |||||||
Other assets less liabilities-2.4% | 116,716 | |||||||
|
| |||||||
Net Assets-100.0% | $ | 4,861,434 | ||||||
|
| |||||||
See accompanying Notes to Financial Statements | 25 | Semi-Annual Report / March 31, 2016 |
Table of Contents
Schedule of Investments
March 31, 2016 (unaudited)
AllianzGI Global Small-Cap Opportunities Portfolio
Notes to Schedule of Investments:
| (a) | 144A—Exempt from registration under Rule 144A of the Securities Act of 1933. These securities may be resold in transactions exempt from registration, typically only to qualified institutional buyers. Unless otherwise indicated, these securities are not considered to be illiquid. |
| (b) | Securities with an aggregate value of $1,869,494, representing 38.5% of net assets, were valued utilizing modeling tools provided by a third-party vendor. See Note 1(a) and Note 1(b) in the Notes to Financial Statements. |
| (c) | Affiliated security. |
| (d) | Non-income producing. |
Glossary:
ADR - American Depositary Receipt
GDR - Global Depositary Receipt
REIT - Real Estate Investment Trust
See accompanying Notes to Financial Statements | 26 | Semi-Annual Report / March 31, 2016 |
Table of Contents
Schedule of Investments
March 31, 2016 (unaudited)
AllianzGI Global Small-Cap Opportunities Portfolio
The industry classification of portfolio holdings and other assets less liabilities shown as a percentage of net assets were as follows:
Airlines | 6.2% | |||||||
Electronic Equipment, Instruments & Components | 6.0% | |||||||
Real Estate Investment Trust | 5.9% | |||||||
IT Services | 5.1% | |||||||
Banks | 5.1% | |||||||
Auto Components | 4.2% | |||||||
Food Products | 3.9% | |||||||
Real Estate Management & Development | 3.5% | |||||||
Insurance | 3.4% | |||||||
Thrifts & Mortgage Finance | 3.2% | |||||||
Software | 2.8% | |||||||
Semiconductors & Semiconductor Equipment | 2.6% | |||||||
Specialty Retail | 2.6% | |||||||
Building Products | 2.6% | |||||||
Chemicals | 2.5% | |||||||
Health Care Technology | 2.4% | |||||||
Biotechnology | 2.4% | |||||||
Professional Services | 2.4% | |||||||
Life Sciences Tools & Services | 2.1% | |||||||
Capital Markets | 2.0% | |||||||
Pharmaceuticals | 2.0% | |||||||
Hotels, Restaurants & Leisure | 2.0% | |||||||
Energy Equipment & Services | 2.0% | |||||||
Wireless Telecommunication Services | 1.9% | |||||||
Food & Staples Retailing | 1.8% | |||||||
Machinery | 1.6% | |||||||
Communications Equipment | 1.5% | |||||||
Personal Products | 1.4% | |||||||
Construction & Engineering | 1.3% | |||||||
Oil, Gas & Consumable Fuels | 1.3% | |||||||
Internet Software & Services | 1.2% | |||||||
Health Care Providers & Services | 1.2% | |||||||
Commercial Services & Supplies | 1.1% | |||||||
Aerospace & Defense | 1.0% | |||||||
Health Care Equipment & Supplies | 0.9% | |||||||
Electric Utilities | 0.9% | |||||||
Containers & Packaging | 0.7% | |||||||
Trading Companies & Distributors | 0.5% | |||||||
Industrial Conglomerates | 0.4% | |||||||
Leisure Equipment & Products | 0.4% | |||||||
Textiles, Apparel & Luxury Goods | 0.4% | |||||||
Transportation Infrastructure | 0.3% | |||||||
Construction Materials | 0.3% | |||||||
Electrical Equipment | 0.3% | |||||||
Multi-Utilities | 0.3% | |||||||
Other assets less liabilities | 2.4% | |||||||
|
| |||||||
| 100.0% | ||||||||
|
| |||||||
See accompanying Notes to Financial Statements | 27 | Semi-Annual Report / March 31, 2016 |
Table of Contents
Statements of Assets and Liabilities
March 31, 2016 (unaudited)
| AllianzGI Advanced Core Bond | AllianzGI Discovery U.S. | AllianzGI Global Small-Cap Opportunities | ||||||||||||||||||||||
Assets: | ||||||||||||||||||||||||
Investments, at value | $193,409,088 | $9,431,033 | $4,717,660 | |||||||||||||||||||||
|
|
|
|
|
|
| ||||||||||||||||||
Investments in Affiliates, at value | – | – | 27,058 | |||||||||||||||||||||
|
|
|
|
|
|
| ||||||||||||||||||
Repurchase agreements, at value | 1,795,000 | 7,277,000 | – | |||||||||||||||||||||
|
|
|
|
|
|
| ||||||||||||||||||
Cash | 103,810 | 305 | 95,083 | |||||||||||||||||||||
|
|
|
|
|
|
| ||||||||||||||||||
Foreign currency, at value | – | – | 10,598 | |||||||||||||||||||||
|
|
|
|
|
|
| ||||||||||||||||||
Dividends and interest receivable (net of foreign withholding taxes) | 1,116,544 | 10,727 | 10,594 | |||||||||||||||||||||
|
|
|
|
|
|
| ||||||||||||||||||
Deposits with brokers for derivatives collateral | 99,494 | – | – | |||||||||||||||||||||
|
|
|
|
|
|
| ||||||||||||||||||
Receivable for Fund shares sold | 78,313 | – | – | |||||||||||||||||||||
|
|
|
|
|
|
| ||||||||||||||||||
Deferred offering costs | 14,662 | 18,083 | – | |||||||||||||||||||||
|
|
|
|
|
|
| ||||||||||||||||||
Investments in Affiliated Funds - Trustee Deferred Compensation Plan (see Note 4) | 1,211 | 58 | 133 | |||||||||||||||||||||
|
|
|
|
|
|
| ||||||||||||||||||
Receivable for investments sold | – | 834,736 | 56,377 | |||||||||||||||||||||
|
|
|
|
|
|
| ||||||||||||||||||
Receivable from Investment Manager | – | 12,675 | 32,041 | |||||||||||||||||||||
|
|
|
|
|
|
| ||||||||||||||||||
Deposits with brokers for securities sold short collateral | – | 2,557,984 | – | |||||||||||||||||||||
|
|
|
|
|
|
| ||||||||||||||||||
Prepaid expenses and other assets | – | – | 1,384 | |||||||||||||||||||||
|
|
|
|
|
|
| ||||||||||||||||||
Total Assets | 196,618,122 | 20,142,601 | 4,950,928 | |||||||||||||||||||||
|
|
|
|
|
|
| ||||||||||||||||||
Liabilities: | ||||||||||||||||||||||||
Payable for investments purchased | 42,335,080 | 270,284 | 48,055 | |||||||||||||||||||||
|
|
|
|
|
|
| ||||||||||||||||||
Payable for securities sold short expenses | – | 9,205 | – | |||||||||||||||||||||
|
|
|
|
|
|
| ||||||||||||||||||
Payable for variation margin on futures contracts | 12,230 | – | – | |||||||||||||||||||||
|
|
|
|
|
|
| ||||||||||||||||||
Investment management fees payable | 37,402 | – | – | |||||||||||||||||||||
|
|
|
|
|
|
| ||||||||||||||||||
Due to Investment Manager | 14,662 | 18,083 | – | |||||||||||||||||||||
|
|
|
|
|
|
| ||||||||||||||||||
Trustees Deferred Compensation Plan payable (see Note 4) | 1,211 | 58 | 133 | |||||||||||||||||||||
|
|
|
|
|
|
| ||||||||||||||||||
Securities sold short, at value | – | 9,937,078 | – | |||||||||||||||||||||
|
|
|
|
|
|
| ||||||||||||||||||
Dividends payable on securities sold short | – | 8,453 | – | |||||||||||||||||||||
|
|
|
|
|
|
| ||||||||||||||||||
Accrued expenses and other liabilities | 80,191 | 41,334 | 41,306 | |||||||||||||||||||||
|
|
|
|
|
|
| ||||||||||||||||||
Total Liabilities | 42,480,776 | 10,284,495 | 89,494 | |||||||||||||||||||||
|
|
|
|
|
|
| ||||||||||||||||||
Net Assets | $154,137,346 | $9,858,106 | $4,861,434 | |||||||||||||||||||||
|
|
|
|
|
|
| ||||||||||||||||||
Net Assets Consist of: | ||||||||||||||||||||||||
Paid-in-capital | $151,675,545 | $10,000,000 | $5,044,153 | |||||||||||||||||||||
|
|
|
|
|
|
| ||||||||||||||||||
Undistributed (dividends in excess of) net investment income | 212,609 | (33,975 | ) | 11,255 | ||||||||||||||||||||
|
|
|
|
|
|
| ||||||||||||||||||
Accumulated net realized gain (loss) | 268,579 | (5,304 | ) | (384,794 | ) | |||||||||||||||||||
|
|
|
|
|
|
| ||||||||||||||||||
Net unrealized appreciation (depreciation) | 1,980,613 | (102,615 | ) | 190,820 | ||||||||||||||||||||
|
|
|
|
|
|
| ||||||||||||||||||
Net Assets | $154,137,346 | $9,858,106 | $4,861,434 | |||||||||||||||||||||
|
|
|
|
|
|
| ||||||||||||||||||
Cost of Investments | $191,416,245 | $9,111,227 | $4,533,898 | |||||||||||||||||||||
|
|
|
|
|
|
| ||||||||||||||||||
Cost of Investments in Affiliates | $– | $– | $20,475 | |||||||||||||||||||||
|
|
|
|
|
|
| ||||||||||||||||||
Cost of Repurchase Agreements | $1,795,000 | $7,277,000 | $– | |||||||||||||||||||||
|
|
|
|
|
|
| ||||||||||||||||||
Cost of Foreign Currency | $– | $– | $10,252 | |||||||||||||||||||||
|
|
|
|
|
|
| ||||||||||||||||||
Proceeds Received on Securities Sold Short | $– | $9,514,657 | $– | |||||||||||||||||||||
|
|
|
|
|
|
| ||||||||||||||||||
Shares Issued and outstanding | 10,059,819 | 666,667 | 336,356 | |||||||||||||||||||||
|
|
|
|
|
|
| ||||||||||||||||||
Net Asset Value and Redemption Price Per Share* | $15.3 | 2 | $14.7 | 9 | $14.4 | 5 | ||||||||||||||||||
|
|
|
|
|
|
| ||||||||||||||||||
See accompanying Notes to Financial Statements | 28 | Semi-Annual Report / March 31, 2016 |
Table of Contents
* Net asset value and redemption price per share may not recalculate exactly due to rounding.
See accompanying Notes to Financial Statements | 29 | Semi-Annual Report / March 31, 2016 |
Table of Contents
Six Months or period ended March 31, 2016 (unaudited)
| AllianzGI Advanced Core Bond(1) | AllianzGI Discovery U.S.(2) | AllianzGI Global Small-Cap Opportunities | ||||||||||||||||
Investment Income: | ||||||||||||||||||
Interest | $754,410 | $217 | $– | |||||||||||||||
Dividends, net of foreign withholding taxes* | – | 50,216 | 40,023 | |||||||||||||||
Total Investment Income | 754,410 | 50,433 | 40,023 | |||||||||||||||
Expenses: | ||||||||||||||||||
Investment management | 115,965 | 27,475 | 21,610 | |||||||||||||||
Organizational | 60,000 | 40,000 | – | |||||||||||||||
Custodian and accounting agent | 44,347 | 26,989 | 44,941 | |||||||||||||||
Audit and tax services | 22,605 | 9,883 | 16,012 | |||||||||||||||
Legal | 17,490 | 11,038 | 41,354 | |||||||||||||||
Shareholder communications | 11,125 | 1,518 | 6,354 | |||||||||||||||
Offering | 10,338 | 6,917 | – | |||||||||||||||
Transfer agent | 6,121 | 1,821 | 1,927 | |||||||||||||||
Trustees | 5,364 | 397 | 311 | |||||||||||||||
Excise tax | – | – | 31 | |||||||||||||||
Dividends on securities sold short | – | 43,195 | – | |||||||||||||||
Securities sold short | – | 28,981 | – | |||||||||||||||
Insurance | – | – | 2,783 | |||||||||||||||
Line of credit commitment | – | – | 9 | |||||||||||||||
Miscellaneous | 2,139 | 552 | 1,772 | |||||||||||||||
Total Expenses | 295,494 | 198,766 | 137,104 | |||||||||||||||
Less: Fee Waiver/Reimbursement from Investment Manager | (121,471) | (114,358) | (108,250) | |||||||||||||||
Net Expenses | 174,023 | 84,408 | 28,854 | |||||||||||||||
Net Investment Income (Loss) | 580,387 | (33,975) | 11,169 | |||||||||||||||
Realized and Change in Unrealized Gain (Loss): |
| |||||||||||||||||
Net realized gain (loss) on: | ||||||||||||||||||
Investments | 389,085 | (59,480) | (134,051) | |||||||||||||||
Investments in Affiliates | – | – | (243) | |||||||||||||||
Securities sold short | – | 54,176 | – | |||||||||||||||
Futures contracts | (120,506) | – | – | |||||||||||||||
Foreign currency transactions | – | – | (14,561) | |||||||||||||||
Net change in unrealized appreciation/depreciation of: | ||||||||||||||||||
Investments | 1,992,843 | 319,806 | 134,892 | |||||||||||||||
Investments in Affiliates | – | – | 3,375 | |||||||||||||||
Securities sold short | – | (422,421) | – | |||||||||||||||
Futures contracts | (12,230) | – | – | |||||||||||||||
Foreign currency transactions | – | – | 4,452 | |||||||||||||||
Net realized and change in unrealized gain (loss) | 2,249,192 | (107,919) | (6,136) | |||||||||||||||
Net Increase (Decrease) in Net Assets Resulting from Investment Operations | $2,829,579 | $(141,894) | $5,033 | |||||||||||||||
*Foreign withholding taxes | $– | $– | $2,134 | |||||||||||||||
See accompanying Notes to Financial Statements | 30 | Semi-Annual Report / March 31, 2016 |
Table of Contents
(1) The Portfolio commenced operations on October 30, 2015.
(2) The Portfolio commenced operations on December 21, 2015.
See accompanying Notes to Financial Statements | 31 | Semi-Annual Report / March 31, 2016 |
Table of Contents
Statements of Changes in Net Assets
AllianzGI Advanced Core Bond | AllianzGI Discovery U.S. | AllianzGI Global Small-Cap Opportunities | ||||||||||||||||||
Period from 10/30/2015(1) through 3/31/2016 (unaudited) | Period from 12/21/2015(1) through 3/31/2016 (unaudited) | Six Months ended 3/31/2016 (unaudited) | Period from 12/1/2014 through 9/30/2015(2) | Period from 7/23/2014(1) through 11/30/2014 | ||||||||||||||||
Increase (Decrease) in Net Assets from: | ||||||||||||||||||||
Investment Operations: | ||||||||||||||||||||
Net investment income (loss) | $580,387 | $(33,975) | $11,169 | $38,702 | $15,248 | |||||||||||||||
Net realized gain (loss) | 268,579 | (5,304) | (148,855) | (141,304) | (104,346) | |||||||||||||||
Net change in unrealized appreciation/depreciation | 1,980,613 | (102,615) | 142,719 | 59,618 | (11,517) | |||||||||||||||
Net increase (decrease) in net assets resulting from investment operations | 2,829,579 | (141,894) | 5,033 | (42,984) | (100,615) | |||||||||||||||
Dividends to Shareholders from: | ||||||||||||||||||||
Net investment income | (367,778) | – | (29,791) | (14,423) | – | |||||||||||||||
Fund Share Transactions: | ||||||||||||||||||||
Net proceeds from the sale of shares | 151,392,239 | – | – | – | – | |||||||||||||||
Issued in reinvestment of dividends | 367,778 | – | 29,791 | 14,423 | – | |||||||||||||||
Cost of shares redeemed | (134,472) | – | – | – | – | |||||||||||||||
Total increase (decrease) in net assets | 154,087,346 | (141,894) | 5,033 | (42,984) | (100,615) | |||||||||||||||
Net Assets: | ||||||||||||||||||||
Beginning of period | 50,000 | 10,000,000 | 4,856,401 | 4,899,385 | 5,000,000 | |||||||||||||||
End of period* | 154,137,346 | 9,858,106 | 4,861,434 | 4,856,401 | 4,899,385 | |||||||||||||||
*Including undistributed (dividends in excess of) net investment income of: | $212,609 | $(33,975) | $11,255 | $29,877 | $13,155 | |||||||||||||||
Shares Issued and Reinvested: | ||||||||||||||||||||
Issued | 10,040,637 | – | – | – | – | |||||||||||||||
Issued in Reinvestment of Dividends | 24,700 | – | 2,035 | 988 | – | |||||||||||||||
Shares redeemed | (8,851) | – | – | – | – | |||||||||||||||
Net Increase | 10,056,486 | – | – | – | – | |||||||||||||||
| (1) | Commencement of operations. |
| (2) | Fiscal year end changed from November 30th to September 30th. |
See accompanying Notes to Financial Statements | 32 | Semi-Annual Report / March 31, 2016 |
Table of Contents
AllianzGI Advanced Core Bond Portfolio
Financial Highlights
For a share of common stock outstanding throughout each period:
| ||
| Period from 10/30/2015* through 3/31/2016 (unaudited) | ||
| Net asset value, beginning of period | $15.00 | |
| ||
Investment Operations: | ||
| ||
Net investment income(a) | $0.15 | |
| ||
Net realized and change in unrealized loss | $0.24 | |
| ||
Total from investment operations | $0.39 | |
| ||
Dividends to Shareholders from net investment income | $(0.07) | |
| ||
Net asset value, end of period | $15.32 | |
| ||
| Total Return(b) | 2.62% | |
| ||
RATIOS/SUPPLEMENTAL DATA: | ||
Net assets, end of period (000s) | $154,137 | |
| ||
Ratio of expenses to average net assets with fee reimbursement(c)(d) | 0.45% | |
| ||
Ratio of expenses to average net assets without fee reimbursement(c)(d) | 0.66% | |
| ||
Ratio of net investment income to average net assets(c)(d) | 2.49% | |
| ||
Portfolio Turnover Rate | 109% | |
| ||
* Commencement of operations.
(a) Calculated on average shares outstanding during the period.
(b) Total return is calculated assuming a purchase of a share on the first day of the period and a sale of a share on the last day of each period reported. Dividends and distributions, if any, are assumed, for purposes of this calculation, to be reinvested. Total return does not reflect sales charges and includes the effect of fee waivers and reimbursements. Total return may reflect adjustments to conform to U.S. GAAP. Total return for a period of less than one year is not annualized.
(c) Annualized, unless otherwise noted.
(d) Certain expenses incurred were not annualized.
See accompanying Notes to Financial Statements | 33 | Semi-Annual Report / March 31, 2016 |
Table of Contents
AllianzGI Discovery U.S. Portfolio
Financial Highlights
For a share of common stock outstanding throughout each period:
| ||
| Period from 12/21/2015* through 3/31/2016 (unaudited) | ||
| Net asset value, beginning of period | $15.00 | |
| ||
Investment Operations: | ||
| ||
Net investment income(a) | $(0.05) | |
| ||
Net realized and change in unrealized loss | $(0.16) | |
| ||
Total from investment operations | $(0.21) | |
| ||
Net asset value, end of period | $14.79 | |
| ||
Total Return(b) | (1.40)% | |
| ||
RATIOS/SUPPLEMENTAL DATA: | ||
Net assets, end of period (000s) | $9,858 | |
| ||
Ratio of expenses to average net assets with fee reimbursement(c)(d) | 3.07% | |
| ||
Ratio of expenses to average net assets without fee reimbursement(c)(d) | 4.94% | |
| ||
Ratio of net investment loss to average net assets(c)(d) | (1.24)% | |
| ||
Portfolio Turnover Rate | 118% | |
| ||
* Commencement of operations.
(a) Calculated on average shares outstanding during the period.
(b) Total return is calculated assuming a purchase of a share on the first day of the period and a sale of a share on the last day of each period reported. Dividends and distributions, if any, are assumed, for purposes of this calculation, to be reinvested. Total return does not reflect sales charges and includes the effect of fee waivers and reimbursements. Total return may reflect adjustments to conform to U.S. GAAP. Total return for a period of less than one year is not annualized.
(c) Annualized, unless otherwise noted.
(d) Certain expenses incurred were not annualized.
See accompanying Notes to Financial Statements | 34 | Semi-Annual Report / March 31, 2016 |
Table of Contents
AllianzGI Global Small-Cap Opportunities Portfolio
Financial Highlights
For a share of common stock outstanding throughout each period:
| ||||||
Six Months ended 3/31/2016 (unaudited) | Period from 12/1/2014 through 9/30/2015(1) | Period from 7/23/2014(2) through 11/30/2014 | ||||
| ||||||
Net asset value, beginning of period | $14.53 | $14.70 | $15.00 | |||
| ||||||
Investment Operations: | ||||||
Net investment income(a) | 0.03 | 0.12 | 0.05 | |||
| ||||||
Net realized and change in unrealized loss | (0.02) | (0.25) | (0.35) | |||
| ||||||
Total from investment operations | 0.01 | (0.13) | (0.30) | |||
| ||||||
Dividends to Shareholders from net investment income | (0.09) | (0.04) | — | |||
| ||||||
Net asset value, end of period | $14.45 | $14.53 | $14.70 | |||
| ||||||
Total Return(b) | 0.05% | (0.86)% | (2.00)% | |||
| ||||||
RATIOS/SUPPLEMENTAL DATA: | ||||||
Net assets, end of period (000s) | $4,891 | $4,856 | $4,899 | |||
| ||||||
Ratio of expenses to average net assets with fee reimbursement(c)(d) | 1.20% | 1.22% | 1.20% | |||
| ||||||
Ratio of expenses to average net assets without fee reimbursement(c)(d) | 5.71% | 7.06% | 4.88% | |||
| ||||||
Ratio of net investment income to average net assets(c)(d) | 0.47% | 0.91% | 0.88% | |||
| ||||||
Portfolio Turnover Rate | 75% | 152% | 56% | |||
| ||||||
(1) Fiscal year end changed from November 30th to September 30th.
(2) Commencement of operations.
(a) Calculated on average shares outstanding.
(b) Total return is calculated assuming a purchase of a share on the first day of the period and a sale of a share on the last day of each period reported. Dividends and distributions, if any, are assumed, for purposes of this calculation, to be reinvested. Total return does not reflect sales charges and includes the effect of fee waivers and reimbursements. Total return may reflect adjustments to conform to U.S. GAAP. Total return for a period of less than one year is not annualized.
(c) Annualized, unless otherwise noted.
(d) Certain expenses incurred were not annualized.
See accompanying Notes to Financial Statements | 35 | Semi-Annual Report / March 31, 2016 |
Table of Contents
March 31, 2016 (unaudited)
1. ORGANIZATION AND SIGNIFICANT ACCOUNTING POLICIES
AllianzGI Institutional Multi-Series Trust (the “Trust”) was organized on June 3, 2014, as an open-end registered investment company organized as a Massachusetts business trust. The Trust follows the investment company accounting and reporting guidance of the Financial Accounting Standards Board (“FASB”) Accounting Standard Codification Topic 946 Financial Services-Investment Companies. As of March 31, 2016, the Trust consisted of four separate investment series, (each a “Portfolio” and collectively the “Portfolios”), one of which, AllianzGI Best Styles Global Managed Volatility Portfolio, had not yet commenced operations during the period of this report. Allianz Global Investors Fund Management LLC (“AGIFM” or the “Investment Manager”) serves as the Portfolios’ investment manager and Allianz Global Investors U.S. LLC (“AllianzGI U.S.” or the “Sub-Adviser”) serves as the Portfolios’ sub-adviser. AGIFM and AllianzGI U.S. are indirect, wholly-owned subsidiaries of Allianz Asset Management of America L.P. (“AAM”). AAM is an indirect, wholly-owned subsidiary of Allianz SE, a publicly traded European insurance and financial services company. Shares of the Portfolios have not been registered for public sale and are currently offered and sold on a private placement basis in accordance with Rule 506(c) of Regulation D under the Securities Act of 1933, as amended. Currently, the Trust has authorized one class of shares.
The following Portfolios sold and issued shares of beneficial interest to Allianz Fund Investments, Inc. (“AFI”), an indirect wholly-owned subsidiary of Allianz SE, during the periods ended March 31, 2016, September 30, 2015 and November 30, 2014:
AllianzGI Advanced Core Bond Portfolio
| ||||
| Date | Shares | Amount | ||
| 10/30/15 | 3,333 | $ 50,000 | ||
AllianzGI Discovery U.S. Portfolio
| ||||
| Date | Shares | Amount | ||
| 12/21/15 | 666,667 | $ 10,000,000 | ||
AllianzGI Global Small-Cap Opportunities Portfolio
| ||||
| Date | Shares | Amount | ||
| 7/23/14 | 333,333 | $ 5,000,000 | ||
The investment objective of AllianzGI Advanced Core Bond is to seek long-term risk adjusted total net return. The investment objective of AllianzGI Discovery U.S. and AllianzGI Global Small-Cap Opportunities is to seek long-term capital appreciation. There can be no assurance that the Portfolios will meet their stated objective.
The preparation of the Portfolios’ financial statements in accordance with accounting principles generally accepted in the United States of America (“U.S. GAAP”) requires the Portfolios’ management to make estimates and assumptions that affect the reported amounts and disclosures in each Portfolio’s financial statements. Actual results could differ from those estimates.
In the normal course of business, the Portfolios enter into contracts that contain a variety of representations that provide general indemnifications. The Portfolios’ maximum exposure under these arrangements is unknown as this would involve future claims that may be made against the Portfolios that have not yet occurred.
The following is a summary of significant accounting policies consistently followed by the Portfolios:
(a) Valuation of Investments. Portfolio securities and other financial instruments for which market quotations are readily available are stated at market value. Market value is generally determined on the basis of official closing prices, last reported sales prices, or if no sales or closing prices are reported, on the basis of quotes obtained from a quotation reporting system, established market makers, or independent pricing services. The Portfolios’ investments are valued daily using prices supplied by an independent pricing service or broker/dealer quotations, or by using the last sale or settlement price on the exchange that is the primary market for such securities, or the mean between the last bid and ask quotations. The market value for NASDAQ Global Market and NASDAQ Capital Market securities may also be calculated using the NASDAQ Official Closing Price instead of the last reported sales price. Independent pricing services use information provided by
| 36 | Semi-Annual Report / March 31, 2016 |
Table of Contents
Notes to Financial Statements
March 31, 2016 (unaudited) (continued)
market makers or estimates of market values obtained from yield data relating to investments or securities with similar characteristics. Securities purchased on a when-issued or delayed-delivery basis are marked to market daily until settlement at the forward settlement date.
The Board of Trustees (the “Board”) has adopted procedures for valuing portfolio securities and other financial instruments in circumstances where market quotations are not readily available (including in cases where available market quotations are deemed to be unreliable), and has delegated primary responsibility for applying the valuation methods to the Investment Manager and the Sub-Adviser. The Trust’s Valuation Committee was established by the Board to oversee the implementation of the Portfolios’ valuation methods and to make fair value determinations on behalf of the Board, as instructed by the Board. The Sub-Adviser monitors the continued appropriateness of methods applied and identifies to the Investment Manager circumstances and events that may require fair valuation. The Investment Manager, in turn, determines if adjustments should be made in light of market changes, events affecting the issuer, or other factors. If the Investment Manager (in consultation with the Sub-Adviser) determines that a valuation method may no longer be appropriate, another valuation method may be selected or the Valuation Committee will be convened to consider the matter and take any appropriate action in accordance with procedures set forth by the Board. The Board shall review and ratify the appropriateness of the valuation methods and these methods may be amended or supplemented from time to time by the Valuation Committee.
Short-term debt instruments maturing in 60 days or less are valued at amortized cost, if their original term to maturity was 60 days or less, or by amortizing premiums or discounts based on their value on the 61st day prior to maturity, if the original term to maturity exceeded 60 days.
Investments initially valued in currencies other than the U.S. dollar are converted to the U.S. dollar using exchange rates obtained from pricing services. As a result, the net asset value (“NAV”) of each Portfolio may be affected by changes in the value of currencies in relation to the U.S. dollar. The value of securities traded in markets outside the United States or denominated in currencies other than the U.S. dollar may be affected significantly on a day that the New York Stock Exchange (“NYSE”) is closed.
The prices used by the Portfolios to value investments may differ from the value that would be realized if the investments were sold, and these differences could be material to the Portfolios’ financial statements. The NAV of each Portfolio is normally determined as of the close of regular trading (normally, 4:00 p.m. Eastern Time) on the NYSE on each day the NYSE is open for business.
The prices of certain portfolio securities or financial instruments may be determined at a time prior to the close of regular trading on the NYSE. When fair-valuing the securities, the Portfolios may, among other things, consider significant events (which may be considered to include changes in the value of U.S. securities or securities indices) that occur after the close of the relevant market and before the time the NAV of a Portfolio is calculated. With respect to certain foreign securities, the Portfolios may fair-value securities using modeling tools provided by third-party vendors. The Portfolios have retained a statistical research service to assist in determining the fair value of foreign securities. This service utilizes statistics and programs based on historical performance of markets and other economic data to assist in making fair value estimates. Fair value estimates used by the Portfolios for foreign securities may differ from the value realized from the sale of those securities and the difference could be material to the financial statements. Fair value pricing may require subjective determinations about the value of a security or other assets, and fair values used to determine the NAV of a Portfolio may differ from quoted or published prices, or from prices that are used by others, for the same investments. In addition, the use of fair value pricing may not always result in adjustments to the prices of securities or other assets held by a Portfolio.
(b) Fair Value Measurements. Fair value is defined as the price that would be received to sell an asset or paid to transfer a liability (i.e., the “exit price”) in an orderly transaction between market participants. The three levels of the fair value hierarchy are described below:
| · | Level 1 – quoted prices in active markets for identical investments that the Portfolios have the ability to access |
| · | Level 2 – valuations based on other significant observable inputs, which may include, but are not limited to, quoted prices for similar assets or liabilities, interest rates, yield curves, volatilities, prepayment speeds, loss severities, credit risks and default rates or other market corroborated inputs |
| · | Level 3 – valuations based on significant unobservable inputs (including the Sub-Adviser’s or Valuation Committee’s own assumptions and securities whose price was determined by using a single broker’s quote) |
| 37 | Semi-Annual Report / March 31, 2016 |
Table of Contents
Notes to Financial Statements
March 31, 2016 (unaudited) (continued)
The valuation techniques used by the Portfolios to measure fair value during the period ended March 31, 2016 were intended to maximize the use of observable inputs and to minimize the use of unobservable inputs.
The Portfolios’ policy is to recognize transfers between levels at the end of the reporting period. An investment asset’s or liability’s level within the fair value hierarchy is based on the lowest level input, individually or in aggregate, that is significant to the fair value measurement. The objective of fair value measurement remains the same even when there is a significant decrease in the volume and level of activity for an asset or liability and regardless of the valuation techniques used. Investments categorized as Level 1 or 2 as of period end may have been transferred between Levels 1 and 2 since the prior period due to changes in the valuation method utilized in valuing the investments.
The inputs or methodology used for valuing securities are not necessarily an indication of the risk associated with investing in those securities. The following are certain inputs and techniques that the Portfolios generally use to evaluate how to classify each major category of assets and liabilities within Level 2 and Level 3, in accordance with U.S. GAAP.
Equity Securities (Common and Preferred Stock) — Equity securities traded in inactive markets and certain foreign equity securities are valued using inputs which include broker-dealer quotes, recently executed transactions adjusted for changes in the benchmark index, or evaluated price quotes received from independent pricing services that take into account the integrity of the market sector and issuer, the individual characteristics of the security, and information received from broker-dealers and other market sources pertaining to the issuer or security. To the extent that these inputs are observable, the values of equity securities are categorized as Level 2. To the extent that these inputs are unobservable, the values are categorized as Level 3.
U.S. Treasury Obligations — U.S. Treasury obligations are valued by independent pricing services based on pricing models that evaluate the mean between the most recently quoted bid and ask price. The models also take into consideration data received from active market makers and broker-dealers, yield curves, and the spread over comparable U.S. Treasury issues. The spreads change daily in response to market conditions and are generally obtained from the new issue market and broker-dealer sources. To the extent that these inputs are observable, the values of U.S. Treasury obligations are categorized as Level 2. To the extent that these inputs are unobservable, the values are categorized as Level 3.
Government Sponsored Enterprise and Mortgage-Backed Securities — Government sponsored enterprise and mortgage-backed securities are valued by independent pricing services using pricing models based on inputs that include issuer type, coupon, cash flows, mortgage prepayment projection tables and Adjustable Rate Mortgage evaluations that incorporate index data, periodic life caps and the next coupon reset date. To the extent that these inputs are observable, the values of government sponsored enterprise and mortgage-backed securities are categorized as Level 2. To the extent that these inputs are unobservable, the values are categorized as Level 3.
Sovereign Debt Obligations — Sovereign debt obligations are valued by independent pricing services based on discounted cash flow models that incorporate option adjusted spreads along with benchmark curves and credit spreads. In addition, international bond markets are monitored regularly for information pertaining to the issuer and/or the specific issue. To the extent that these inputs are observable, the values of sovereign debt obligations are categorized as Level 2. To the extent that these inputs are unobservable, the values are categorized as Level 3.
Corporate Bonds & Notes — Corporate bonds & notes are generally comprised of two main categories: investment grade bonds and high yield bonds. Investment grade bonds are valued by independent pricing services using various inputs and techniques, which include broker-dealer quotations, live trading levels, recently executed transactions in securities of the issuer or comparable issuers, and option adjusted spread models that include base curve and spread curve inputs. Adjustments to individual bonds can be applied to recognize trading differences compared to other bonds issued by the same issuer. High yield bonds are valued by independent pricing services based primarily on broker-dealer quotations from relevant market makers and recently executed transactions in securities of the issuer or comparable issuers. The broker-dealer quotations received are supported by credit analysis of the issuer that takes into consideration credit quality assessments, daily trading activity, and the activity of the underlying equities, listed bonds and sector-specific trends. To the extent that these inputs are observable, the values of corporate bonds & notes are categorized as Level 2. To the extent that these inputs are unobservable, the values are categorized as Level 3.
| 38 | Semi-Annual Report / March 31, 2016 |
Table of Contents
Notes to Financial Statements
March 31, 2016 (unaudited) (continued)
A summary of the inputs used at March 31, 2016 in valuing each Portfolio’s assets and liabilities is listed below (refer to the Schedules of Investments for more detailed information on Investments in Securities):
| AllianzGI Advanced Core Bond Portfolio: | ||||||||||||||||
Level 1 - Quoted Prices | Level 2 - Other Significant Observable Inputs | Level 3 - Significant Unobservable Inputs | Value at 3/31/16 | |||||||||||||
Investments in Securities - Assets | ||||||||||||||||
U.S. Treasury Obligations | $ | — | $ | 79,099,689 | $ | — | $ | 79,099,689 | ||||||||
Corporate Bonds & Notes | — | 50,558,846 | — | 50,558,846 | ||||||||||||
U.S. Government Agency Securities | — | 42,572,204 | — | 42,572,204 | ||||||||||||
Sovereign Debt Obligations | — | 21,178,349 | — | 21,178,349 | ||||||||||||
Repurchase Agreements | — | 1,795,000 | — | 1,795,000 | ||||||||||||
| — | 195,204,088 | — | 195,204,088 | |||||||||||||
Other Financial Instruments* – Liabilities | ||||||||||||||||
Interest Rate Contracts | (12,230 | ) | — | — | (12,230) | |||||||||||
Totals | $ | (12,230 | ) | $ | 195,204,088 | $ | — | $ | 195,191,858 | |||||||
AllianzGI Discovery U.S Portfolio.: | ||||||||||||||||
Level 1 - Quoted Prices | Level 2 - Other Significant Observable Inputs | Level 3 - Significant Unobservable Inputs | Value at 3/31/16 | |||||||||||||
Investments in Securities - Assets | ||||||||||||||||
Common Stock | $ | 9,431,033 | $ | — | $ | — | $ | 9,431,033 | ||||||||
Repurchase Agreements | — | 7,277,000 | — | 7,277,000 | ||||||||||||
| 9,431,033 | 7,277,000 | — | 16,708,033 | |||||||||||||
Investments in Securities - Liabilities | ||||||||||||||||
Securities Sold Short, at value | (9,937,078 | ) | — | — | (9,937,078) | |||||||||||
Totals | $ | (506,045 | ) | $ | 7,277,000 | $ | — | $ | 6,770,955 | |||||||
AllianzGI Global Small-Cap Opportunities Portfolio: | ||||||||||||||||
Level 1 - Quoted Prices | Level 2 - Other Significant Observable Inputs | Level 3 - Significant Unobservable Inputs | Value at 3/31/16 | |||||||||||||
Investments in Securities - Assets | ||||||||||||||||
Common Stock: | ||||||||||||||||
Australia | $ | — | $ | 165,455 | $ | — | $ | 165,455 | ||||||||
Austria | — | 11,508 | — | 11,508 | ||||||||||||
Belgium | — | 94,942 | — | 94,942 | ||||||||||||
China | 161,653 | 74,944 | — | 236,597 | ||||||||||||
Denmark | — | 27,058 | — | 27,058 | ||||||||||||
France | 27,509 | 75,805 | — | 103,314 | ||||||||||||
Germany | — | 163,620 | — | 163,620 | ||||||||||||
Hong Kong | — | 84,943 | — | 84,943 | ||||||||||||
Italy | — | 15,986 | — | 15,986 | ||||||||||||
Japan | — | 358,180 | — | 358,180 | ||||||||||||
Korea (Republic of) | — | 159,460 | — | 159,460 | ||||||||||||
Netherlands | — | 82,970 | — | 82,970 | ||||||||||||
New Zealand | — | 41,940 | — | 41,940 | ||||||||||||
Norway | — | 45,396 | — | 45,396 | ||||||||||||
South Africa | — | 28,159 | — | 28,159 | ||||||||||||
Switzerland | 87,994 | 119,504 | — | 207,498 | ||||||||||||
Taiwan | — | 111,697 | — | 111,697 | ||||||||||||
Thailand | — | 70,242 | — | 70,242 | ||||||||||||
Turkey | — | 58,505 | — | 58,505 | ||||||||||||
United Kingdom | — | 79,179 | — | 79,179 | ||||||||||||
All Other | 2,598,069 | — | — | 2,598,069 | ||||||||||||
Totals | $ | 2,875,225 | $ | 1,869,493 | $ | — | $ | 4,744,718 | ||||||||
| 39 | Semi-Annual Report / March 31, 2016 |
Table of Contents
Notes to Financial Statements
March 31, 2016 (unaudited) (continued)
At March 31, 2016, AllianzGI Global Small-Cap Opportunities Portfolio had transfers of $42,321 from Level 1 to Level 2. This transfer was the result of securities trading outside the U.S. whose values were not adjusted by the application of a modeling tool at September 30, 2015, which was applied on March 31, 2016.
(c) Investment Transactions and Investment Income. Investment transactions are accounted for on the trade date. Securities purchased and sold on a when-issued or delayed-delivery basis may be settled a month or more after the trade date. Realized gains and losses on investments are determined on an identified cost basis. Interest income adjusted for the accretion of discounts and amortization of premiums is recorded on an accrual basis. Discounts or premiums on debt securities purchased are accreted or amortized, respectively, to interest income. Dividend income is recorded on the ex-dividend date, except for certain dividends from foreign securities where the ex-dividend date may have passed, and then are recorded as soon after the ex-dividend date as the Portfolios, using reasonable diligence, become aware of such dividends. Dividend and interest income on the Statements of Operations are shown net of any foreign taxes withheld on income from foreign securities. Payments received from real estate investment trust securities may be comprised of dividends, realized gains and return of capital. The payment may initially be recorded as dividend income and may subsequently be reclassified as realized gains and/or return of capital upon receipt of information from the issuer. Payments considered return of capital reduce the cost basis of the respective security.
(d) Federal Income Taxes. The Portfolios intend to distribute all of their taxable income and to comply with the other requirements of Subchapter M of the U.S. Internal Revenue Code of 1986, as amended, applicable to regulated investment companies. Accordingly, no provision for U.S. federal income taxes is required. The Portfolios may be subject to excise tax based on distributions to shareholders.
Accounting for uncertainty in income taxes establishes for all entities, including pass-through entities such as the Portfolios, a minimum threshold for financial statement recognition of the benefit of positions taken in filing tax returns (including whether an entity is taxable in a particular jurisdiction), and requires certain expanded tax disclosures. In accordance with provisions set forth under U.S. GAAP, the Investment Manager has reviewed the Portfolios’ tax positions for all open tax years. As of March 31, 2016, the Portfolios have recorded no liability for net unrecognized tax benefits relating to uncertain income tax positions they have taken. The Portfolios’ federal income tax returns since inception remain subject to examination by the Internal Revenue Service.
(e) Dividends and Distributions to Shareholders. The Portfolios declare dividends and distributions from net investment income and net realized capital gains, if any, annually. The Portfolios record dividends and distributions to their respective shareholders on the ex-dividend date. The amount of dividends from net investment income and distributions from net realized capital gains is determined in accordance with federal income tax regulations, which may differ from U.S. GAAP. These “book-tax” differences are considered either temporary or permanent in nature. To the extent these differences are permanent in nature, such amounts are reclassified within the capital accounts based on their federal income tax treatment; temporary differences do not require reclassification. To the extent dividends and/or distributions exceed current and accumulated earnings and profits for federal income tax purposes, they are reported as dividends and/or distributions to shareholders from return of capital.
(f) Foreign Currency Translation. The Portfolios’ accounting records are maintained in U.S. dollars as follows: (1) the foreign currency market values of investments and other assets and liabilities denominated in foreign currencies are translated at the prevailing exchange rate at the end of the period; and (2) purchases and sales, income and expenses are translated at the prevailing exchange rate on the respective dates of such transactions. The resulting net foreign currency gain (loss) is included in the Portfolios’ Statements of Operations.
The Portfolios do not generally isolate that portion of the results of operations arising as a result of changes in foreign currency exchange rates from the fluctuations arising from changes in the market prices of securities. Accordingly, such foreign currency gain (loss) is included in net realized and unrealized gain (loss) on investments. However, the Portfolios do isolate the effect of fluctuations in foreign currency exchange rates when determining the gain (loss) upon the sale or maturity of foreign currency denominated debt obligations pursuant to U.S. federal income tax regulations; such amount is categorized as foreign currency gain (loss) for both financial reporting and income tax reporting purposes.
| 40 | Semi-Annual Report / March 31, 2016 |
Table of Contents
Notes to Financial Statements
March 31, 2016 (unaudited) (continued)
(g) Repurchase Agreements. The Portfolios are parties to Master Repurchase Agreements (“Master Repo Agreements”) with select counterparties. The Master Repo Agreements maintain provisions for initiation, income payments, events of default, and maintenance of collateral.
The Portfolios enter into transactions, under the Master Repo Agreements, with their custodian bank or securities brokerage firms whereby they purchase securities under agreements to resell such securities at an agreed upon price and date (“repurchase agreements”). The Portfolios, through their custodian, take possession of securities collateralizing the repurchase agreement. Such agreements are carried at the contract amount in the financial statements, which is considered to represent fair value. Collateral pledged (the securities received), which consists primarily of U.S. government obligations and asset-backed securities, is held by the custodian bank for the benefit of the Portfolios until maturity of the repurchase agreement. Provisions of the repurchase agreements and the procedures adopted by the Portfolios require that the market value of the collateral, including accrued interest thereon, be sufficient in the event of default by the counterparty. If the counterparty defaults under the Master Repo Agreements and the value of the collateral declines or if the counterparty enters an insolvency proceeding, realization of the collateral by the Portfolios may be delayed or limited. The gross values are included in the Portfolios’ Schedules of Investments. The value of the related collateral exceeded the value of the repurchase agreements at March 31, 2016.
(h) Securities Sold Short. Certain Portfolios engage in short sales for investment and risk management purposes. Short sales are transactions in which a Portfolio sells a security or other instrument (such as an option, forward, future or other derivative contract) it does not own. When a Portfolio engages in a short sale, it must borrow the security sold short and deliver it to the counterparty. The Portfolios will ordinarily have to pay a fee or premium to borrow a security and be obligated to repay the lender of the security any dividend or interest that accrues on the security during the period of the loan. Until a short position is closed out, the net proceeds of the short sale will be retained by the lending broker to the extent necessary to meet margin requirements, together with any additional assets the broker requires as collateral. A Portfolio is also required to designate, on its books or the books of its custodian, liquid assets (less any additional collateral held by the broker) to cover the short sale obligation, marked to market daily. Short sales expose the Portfolios to the risk that they will be required to cover the short position at a time when the security or other asset has appreciated in value, thus resulting in losses to the applicable Portfolio. A short sale is “against the box” if a Portfolio holds in its portfolio or has the right to acquire the security sold short at no additional cost. The Portfolios will be subject to additional risks to the extent that they engage in short sales that are not “against the box.” A Portfolio’s loss on a short sale could theoretically be unlimited in cases where the Portfolio is unable, for whatever reason, to close out its short position.
(i) U.S. Government Agencies or Government-Sponsored Enterprises. Securities issued by U.S. Government agencies or government-sponsored enterprises may not be guaranteed by the U.S. Treasury. The Government National Mortgage Association (“GNMA” or “Ginnie Mae”), a wholly-owned U.S. Government corporation, is authorized to guarantee, with the full faith and credit of the U.S. Government, the timely payment of principal and interest on securities issued by institutions approved by GNMA and backed by pools of mortgages insured by the Federal Housing Administration or guaranteed by the Department of Veterans Affairs. Government-related guarantors not backed by the full faith and credit of the U.S. Government include the Federal National Mortgage Association (“FNMA” or “Fannie Mae”) and the Federal Home Loan Mortgage Corporation (“FHLMC” or “Freddie Mac”). Pass-through securities issued by FNMA are guaranteed as to timely payment of principal and interest by FNMA, but are not backed by the full faith and credit of the U.S. Government. FHLMC guarantees the timely payment of interest and ultimate collection of principal, but its participation certificates are not backed by the full faith and credit of the U.S. Government.
(j) When-Issued/Delayed-Delivery Transactions. When-issued or delayed-delivery transactions involve a commitment to purchase or sell securities for a predetermined price or yield, with payment and delivery taking place beyond the customary settlement period. When delayed-delivery purchases are outstanding, the Portfolios will set aside and maintain until the settlement date in a designated account, liquid assets in an amount sufficient to meet the purchase price. When purchasing a security on a delayed-delivery basis, the Portfolios assume the rights and risks of ownership of the security, including the risk of price and yield fluctuations; consequently, such fluctuations are taken into account when determining the NAV. The Portfolios may dispose of or renegotiate a delayed-delivery transaction after it is entered into, and may sell when-issued securities before they are delivered, which may result in a realized gain or loss. When a security is sold on a delayed-delivery basis, the Portfolios do not participate in future gains and losses with respect to the security.
(k) Organizational and Offering Costs. Organizational costs are expensed at the inception of the Portfolios. Offering costs are amortized over a twelve-month period from the inception of the Portfolios.
| 41 | Semi-Annual Report / March 31, 2016 |
Table of Contents
Notes to Financial Statements
March 31, 2016 (unaudited) (continued)
2. PRINCIPAL RISKS
In the normal course of business, the Portfolios trade financial instruments and enter into financial transactions where risk of potential loss exists due to, among other things, changes in the market (market risk) or failure of the other party to a transaction to perform (counterparty risk). The Portfolios are also exposed to other risks such as, but not limited to, interest rate, foreign currency, credit and leverage risks.
Interest rate risk is the risk that fixed income securities’ valuations will change because of changes in interest rates. During periods of rising nominal interest rates, the values of fixed income instruments are generally expected to decline. Conversely, during periods of declining nominal interest rates, the values of fixed income instruments are generally expected to rise. A nominal interest rate can be described as the sum of a real interest rate and an expected inflation rate. Fixed income securities with longer durations tend to be more sensitive to changes in interest rates, usually making them more volatile than securities with shorter durations. Duration is used primarily as a measure of the sensitivity of a fixed income security’s market price to interest rate (i.e. yield) movements. Interest rate changes can be sudden and unpredictable, and the Portfolios may lose money as a result of movements in interest rates. The Portfolios may not be able to hedge against changes in interest rates or may choose not to do so for cost or other reasons. In addition, any hedges may not work as intended.
Variable and floating rate securities generally are less sensitive to interest rate changes but may decline in value if their interest rates do not rise as much, or as quickly, as interest rates in general. Conversely, floating rate securities will not generally increase in value if interest rates decline. Inverse floating rate securities may decrease in value if interest rates increase. Inverse floating rate securities may also exhibit greater price volatility than a fixed rate obligation with similar credit quality. When the Portfolios hold variable or floating rate securities, a decrease (or, in the case of inverse floating rate securities, an increase) in market interest rates will adversely affect the income received from such securities and the NAV of the Portfolios’ shares.
The Portfolios are exposed to credit risk, which is the risk of losing money if the issuer or guarantor of a fixed income security is unable or unwilling, or is perceived (whether by market participants, rating agencies, pricing services or otherwise) as unable or unwilling, to make timely principal and/or interest payments, or to otherwise honor its obligations. Securities are subject to varying degrees of credit risk, which are often reflected in credit ratings.
To the extent the Portfolios directly invest in foreign currencies or in securities that trade in, and receive revenues in, foreign currencies, or in derivatives that provide exposure to foreign currencies, they will be subject to the risk that those currencies will decline in value relative to the U.S. dollar, or, in the case of hedging positions, that the U.S. dollar will decline in value relative to the currency being hedged. Currency rates in foreign countries may fluctuate significantly over short periods of time for a number of reasons, including economic growth, inflation, changes in interest rates, intervention (or the failure to intervene) by U.S. or foreign governments, central banks or supranational entities such as the International Monetary Fund, or the imposition of currency controls or other political developments in the United States or abroad. As a result, the Portfolios’ investments in foreign currency-denominated securities may reduce the returns of the Portfolios. The local emerging markets currencies in which the Portfolios may be invested may experience substantially greater volatility against the U.S. dollar than the major convertible currencies in developed countries.
The Portfolios are subject to elements of risk not typically associated with investments in the U.S., due to concentrated investments in foreign issuers located in a specific country or region. Such concentrations will subject the Portfolios to additional risks resulting from future political or economic conditions in such country or region and the possible imposition of adverse governmental laws or currency exchange restrictions affecting such country or region, which could cause the securities and their markets to be less liquid and prices more volatile than those of comparable U.S. companies.
The market values of securities may decline due to general market conditions (market risk) which are not specifically related to a particular company, such as real or perceived adverse economic conditions, changes in the general outlook for corporate earnings, changes in interest or currency rates, adverse changes to credit markets or adverse investor sentiment. They may
| 42 | Semi-Annual Report / March 31, 2016 |
Table of Contents
Notes to Financial Statements
March 31, 2016 (unaudited) (continued)
also decline due to factors that affect a particular industry or industries, such as labor shortages or increased production costs and competitive conditions within an industry. Equity securities and equity-related investments generally have greater market price volatility than fixed income securities, although under certain market conditions fixed income securities may have comparable or greater price volatility. Credit ratings downgrades may also negatively affect securities held by the Portfolios. Even when markets perform well, there is no assurance that the investments held by the Portfolios will increase in value along with the broader market. In addition, market risk includes the risk that geopolitical events will disrupt the economy on a national or global level.
The Portfolios are exposed to counterparty risk, or the risk that an institution or other entity with which the Portfolios have unsettled or open transactions will default. The potential loss to the Portfolios could exceed the value of the financial assets recorded in the Portfolios’ financial statements. Financial assets, which potentially expose the Portfolios to counterparty risk, consist principally of cash due from counterparties and investments. The Sub-Adviser seeks to minimize the Portfolios’ counterparty risk by performing reviews of each counterparty and by minimizing concentration of counterparty risk by undertaking transactions with multiple customers and counterparties on recognized and reputable exchanges. Delivery of securities sold is only made once the Portfolios’ have received payment. Payment is made on a purchase once the securities have been delivered by the counterparty. The trade will fail if either party fails to meet its obligation.
The considerations and factors surrounding the settlement of certain purchases and sales made on a delayed-delivery basis are governed by Master Securities Forward Transaction Agreements (“Master Forward Agreements”) between the Portfolios and select counterparties. The Master Forward Agreements maintain provisions for, among other things, initiation and confirmation, payment and transfer, events of default, termination, and maintenance of collateral.
The Portfolios are party to International Swaps and Derivatives Association, Inc. Master Agreements (“ISDA Master Agreements”) with select counterparties that govern transactions, over-the-counter derivatives and foreign exchange contracts entered into by the Portfolios and those counterparties. The ISDA Master Agreements contain provisions for general obligations, representations, agreements, collateral and events of default or termination. Events of termination include conditions that may entitle counterparties to elect to terminate early and cause settlement of all outstanding transactions under the applicable ISDA Master Agreement. Any election to terminate early could be material to the financial statements of the Portfolios.
3. FINANCIAL DERIVATIVE INSTRUMENTS
Disclosure about derivatives and hedging activities requires qualitative disclosure regarding objectives and strategies for using derivatives, quantitative disclosure about fair value amounts of gains and losses on derivatives, and disclosure about credit-risk-related contingent features in derivative agreements. The disclosure requirements distinguish between derivatives which are accounted for as “hedges”, and those that do not qualify for such accounting. Although the Portfolios at times use derivatives for hedging purposes, the Portfolios reflect derivatives at fair value and recognize changes in fair value through the Portfolios’ Statements of Operations, and such derivatives do not qualify for hedge accounting treatment.
Futures Contracts. The Portfolios use futures contracts to manage their exposure to the securities markets or the movements in interest rates and currency values. A futures contract is an agreement between two parties to buy and sell a financial instrument at a set price on a future date. Upon entering into such a contract, the Portfolios are required to pledge to the broker an amount of cash or securities equal to the minimum “initial margin” requirements of the exchange. Pursuant to the contracts, the Portfolios agree to receive from or pay to the broker an amount of cash or securities equal to the daily fluctuation in the value of the contracts. Such receipts or payments are known as “variation margin” and are recorded by the Portfolios as unrealized appreciation or depreciation. When the contracts are closed, the Portfolios record a realized gain or loss equal to the difference between the value of the contracts at the time they were opened and the value at the time they were closed. Any unrealized appreciation or depreciation recorded is simultaneously reversed. The use of futures transactions involves various risks, including the risk of an imperfect correlation in the movements in the price of futures contracts, interest rates and underlying hedging assets, and possible inability or unwillingness of counterparties to meet the terms of their contracts.
Forward Foreign Currency Contracts. A forward foreign currency contract is an agreement between two parties to buy and sell a currency at a set exchange rate on a future date. The Portfolios enter into these contracts for purposes of increasing exposure to a foreign currency or shifting exposure to foreign currency fluctuations from one country to another. The market
| 43 | Semi-Annual Report / March 31, 2016 |
Table of Contents
Notes to Financial Statements
March 31, 2016 (unaudited) (continued)
value of a forward foreign currency contract fluctuates with changes in foreign currency exchange rates. All commitments are marked to market daily at the applicable exchange rates and any resulting unrealized appreciation or depreciation is recorded. Realized gains or losses are recorded at the time the forward contract matures or by delivery of the currency. Risks may arise upon entering into these contracts from the potential inability of counterparties to meet the terms of their contracts and from unanticipated movements in the value of a foreign currency relative to the U.S. dollar. In addition, these contracts may involve market risk in excess of the unrealized appreciation (depreciation) reflected in the Portfolios’ Statements of Assets and Liabilities.
The following is a summary of the Portfolios’ derivatives categorized by risk exposure.
The effect of derivatives on the Statements of Assets and Liabilities at March 31, 2016:
| AllianzGI Advanced Core Bond Portfolio: | ||
| Location |
Interest Rate | |
| ||
| Liability derivatives: | ||
| Payable for variation margin on futures contracts* | $(12,230) | |
* Included in net unrealized depreciation of $12,230 on futures contracts as reported in Note 6(a).
The effect of derivatives on the Statements of Operations for the six months ended March 31, 2016:
| AllianzGI Advanced Core Bond Portfolio: | ||
| Location |
Interest Rate | |
| ||
| Net realized gain (loss) on: | ||
| Futures contracts | $(120,506) | |
| Net change in unrealized appreciation/depreciation of: | ||
| Futures contracts | (12,230) | |
| AllianzGI Global Small-Cap Opportunities Portfolio: | ||
| Location |
Foreign Exchange | |
| ||
| Net realized gain (loss) on: | ||
| Foreign currency transaction (forward currency contracts) | $846 | |
The average volume (measured at each fiscal quarter-end) of derivative activity during the period ended March 31, 2016:
| Futures Contracts(1) | ||||
| Long | Short | |||
| ||||
AllianzGI Advanced Core Bond | — | 163 | ||
(1) Number of contracts
4. INVESTMENT MANAGER/DISTRIBUTOR FEES/DEFERRED COMPENSATION
Investment Management Fee. Each Portfolio has an Investment Management Agreement (for the purpose of this section, collectively the “Agreements”) with the Investment Manager. Subject to the supervision of the Trust’s Board, the Investment Manager is responsible for managing, either directly or through others selected by it, each Portfolio’s investment activities, business affairs and administrative matters. Pursuant to the Agreements, the Investment Manager receives an annual fee, payable monthly, at an annual rate of each Portfolio’s average daily net assets (the “Investment Management Fee”).
| 44 | Semi-Annual Report / March 31, 2016 |
Table of Contents
Notes to Financial Statements
March 31, 2016 (unaudited) (continued)
“Due to Investment Manager” on the Statements of Assets and Liabilities represents the remaining payable for the Portfolios’ offering costs that were paid by the Investment Manager.
The Investment Manager has retained the Sub-Adviser to manage the Portfolios’ investments. Subject to the supervision of the Investment Manager, the Sub-Adviser is responsible for making all of the Portfolios’ investment decisions. The Investment Manager, not the Portfolios, pays a portion of the fees it receives as Investment Manager to the Sub-Adviser in return for its services.
The Investment Management fee is charged at an annual rate as indicated in the following table:
Management Fee | ||
AllianzGI Advanced Core Bond Portfolio | 0.30% | |
AllianzGI Discovery U.S. Portfolio | 1.00 | |
AllianzGI Global Small-Cap Opportunities Portfolio | 0.90 |
Distribution Fees. Allianz Global Investors Distributors LLC (the “Distributor”), an indirect, wholly owned subsidiary of AAM, the Investment Manager and the Sub-Adviser serves as the distributor of the Portfolios’ shares pursuant to a Distribution Contract. The Distributor, for each of the Portfolios, currently receives no compensation in connection with the services it provides under the Distribution Contract.
Deferred Compensation. Trustees do not currently receive any pension or retirement benefits from the Trust. The Trust has adopted a deferred compensation plan for the Trustees that went into place on January 1, 2015 and permits the Trustees to defer their receipt of compensation from the Trust, at their election, in accordance with the terms of the plan. Under the plan, each Trustee may elect not to receive all or a portion of his or her fees from the Trust on a current basis but to receive in a subsequent period chosen by the Trustee an amount equal to the value of such compensation if such compensation had been invested in one or more series of the Trust or Allianz Funds selected by the Trustees from and after the normal payment dates for such compensation. The deferred compensation program is structured such that the Trust remains in substantially the same financial position whether Trustee fees are paid when earned or deferred.
5. EXPENSE LIMITATION AND RECOUPMENT
The Trust and the Investment Manager have entered into Expense Limitation and Management Fee Waiver Agreements as indicated below:
Expense Limitation | ||
AllianzGI Advanced Core Bond Portfolio | 0.45% | |
AllianzGI Discovery U.S. Portfolio | 1.50 | |
AllianzGI Global Small-Cap Opportunities Portfolio | 1.20 |
During the periods ended March 31, 2016, the Investment Manager did not recoup any expenses from the Portfolios. The following represents the amounts that still can be recouped by the Investment Manager:
| Unrecouped Expenses Waived/Reimbursed through Fiscal Year ended | ||||||||||||
|
| |||||||||||
| 11/30/2014 | 9/30/2015 | Totals | ||||||||||
|
| |||||||||||
AllianzGI Global Small-Cap Opportunities | $ | 132,292 | $ | 260,824 | $ | 393,116 | ||||||
| 45 | Semi-Annual Report / March 31, 2016 |
Table of Contents
Notes to Financial Statements
March 31, 2016 (unaudited) (continued)
6. INVESTMENTS IN SECURITIES
For the period or six months ended March 31, 2016, purchases and sales of investments, other than short-term securities were:
| Purchases | Sales | |||
| ||||
AllianzGI Advanced Core Bond Portfolio | $ 78,033,850 | $ 8,377,536 | ||
AllianzGI Discovery U.S. Portfolio* | 21,457,296 | 21,855,422 | ||
AllianzGI Global Small-Cap Opportunities Portfolio | 3,582,424 | 3,558,096 | ||
* Securities sold short of $11,129,025; covers on securities sold short of $20,697,859.
(a) Futures contracts outstanding at March 31, 2016:
AllianzGI Advanced Core Bond Portfolio:
Type
| Contracts
| Market Value (000s)
| Expiration Date
| Unrealized Depreciation
| ||||||||||||||||
| ||||||||||||||||||||
Short: 2-Year U.S. Treasury Note | (205 | ) | $ | (44,844) | 6/30/16 | $ | (12,230) | |||||||||||||
|
| |||||||||||||||||||
At March 31, 2016, AllianzGI Advanced Core Bond pledged $99,494 in cash as collateral for derivatives.
7. INCOME TAX INFORMATION
At March 31, 2016, the aggregate cost basis and the net unrealized appreciation (depreciation) of investments (before securities sold short) for federal income tax purposes were:
Federal Tax Cost Basis(1) | Unrealized Appreciation | Unrealized Depreciation | Net Unrealized Appreciation | |||||
| ||||||||
| AllianzGI Advanced Core Bond Portfolio | $193,579,770 | $1,901,198 | $276,880 | $1,624,318 | ||||
AllianzGI Discovery U.S. Portfolio | 16,389,894 | 510,265 | 192,126 | 318,139 | ||||
AllianzGI Global Small-Cap Opportunities Portfolio | 4,557,174 | 416,192 | 228,649 | 187,543 | ||||
(1) Differences, if any, between book and tax cost basis were attributable to wash sale loss deferrals.
8. SIGNIFICANT ACCOUNT HOLDERS
From time to time, a Portfolio may have a concentration of shareholders, which may include the Investment Manager or affiliates of the Investment Manager, holding a significant percentage of shares outstanding. Investment activities of these shareholders could have a material impact to a Portfolio.
At March 31, 2016, the significant account-holders, owners of 5% or greater of each respective Portfolio’s outstanding shares, were as follows:
| Affiliated Approximate Ownership | ||||||
| ||||||
| Number of Account Holders | AFI | AllianzGI Global Allocation | ||||
| ||||||
AllianzGI Advanced Core Bond | 1 | - | 85% | |||
AllianzGI Discovery U.S. | 1 | 100% | - | |||
AllianzGI Global Small-Cap Opportunities | 1 | 100% | - | |||
9. AFFILIATED TRANSACTIONS
An affiliate includes any company in which a Sub-Adviser owns 5% or more of a company’s outstanding voting securities at any point during the fiscal year.
| 46 | Semi-Annual Report / March 31, 2016 |
Table of Contents
Notes to Financial Statements
March 31, 2016 (unaudited) (continued)
The table below represents transactions in and earnings from these affiliated issuers during the six months ended March 31, 2016:
| AllianzGI Global Small-Cap Opportunities Portfolio: | ||||||||||||||||||||||||||||
Market Value
| Purchases
| Proceeds
| Unrealized
| Market Value
| Dividend
| Net Realized
| ||||||||||||||||||||||
| ||||||||||||||||||||||||||||
Aareal Bank AG† | $ | 84,080 | $ | 3,096 | $ | — | $ | (5,902) | $ | 79,275 | $ | — | $ | — | ||||||||||||||
Cembra Money Bank AG† | 14,784 | — | (15,186) | — | — | — | (243) | |||||||||||||||||||||
SimCorp A/S | 29,565 | — | — | 6,583 | 27,058 | — | — | |||||||||||||||||||||
|
| |||||||||||||||||||||||||||
Totals | $ | 128,429 | $ | 3,096 | $ | (15,186) | $ | 681 | $ | 106,333 | $ | — | $ | (243) | ||||||||||||||
|
| |||||||||||||||||||||||||||
† Not affiliated at March 31, 2016.
The percentages and market values below represent portfolio holdings that were considered affiliated at March 31, 2016:
AllianzGI Global Small-Cap Opportunities Portfolio:
| Issuer Name | Sub-Adviser’s % Holding | Market Value | Market Value as a % of Portfolio’s Net Assets | |||||
| ||||||||
SimCorp A/S | 12.56% | $ | 27,058 | 0.56% | ||||
10. BORROWINGS
On July 31, 2015, the Trust entered into a new credit agreement (the “Northern Trust Agreement”), among the Trust on behalf of AllianzGI Global Small-Cap Opportunities, Allianz Funds Multi-Strategy Trust, Allianz Funds and Premier Multi-Series VIT, as borrowers (collectively, the “AllianzGI Borrowers” and each series thereof, an “AllianzGI Borrower Fund”), and Northern Trust Company, as lender, for a committed line of credit. The Northern Trust Agreement has a 364 day term and permits the AllianzGI Borrowers to borrow up to $200 million in aggregate, subject to (i) a requirement that each AllianzGI Borrower Fund’s asset coverage with respect to senior securities representing indebtedness be 300% or higher, and (ii) certain other limitations and conditions. Each AllianzGI Borrower Fund will pay interest on any amounts borrowed under the facility at the greater of (i) the federal funds overnight rate plus 1.00% or (ii) 1.50%, subject to upward adjustment when any past-due payments are outstanding. The AllianzGI Borrowers will also pay a usage fee at an annualized rate of 0.15% on undrawn amounts, allocated pro rata among the AllianzGI Borrower Funds on the basis of net assets. Amounts borrowed may be repaid and reborrowed on a revolving basis during the term of the facility.
AllianzGI Global Small-Cap Opportunities did not utilize the line of credit during the period ended March 31, 2016.
11. SUBSEQUENT EVENTS
In preparing these financial statements, the Portfolios’ management has evaluated events and transactions for potential recognition or disclosure through the date the financial statements were issued.
On April 11, 2016, AllianzGI Best Styles Global Managed Volatility Portfolio commenced operations as a series of the Trust.
There were no other subsequent events identified that require recognition or disclosure.
| 47 | Semi-Annual Report / March 31, 2016 |
Table of Contents
Changes to the Board of Trustees & Fund Officers
(Unaudited)
Effective October 8, 2015, Barbara R. Claussen became a Trustee of the Trust. Ms. Claussen is an “interested person” of the Trust, as defined in Section 2(a) (19) of the 1940 Act, due to her positions with the Investment Manager and its affiliates.
Effective April 15, 2016, Julian Sluyters resigned as a Trustee of the Trust.
Effective April 25, 2016, A. Douglas Eu became a Trustee of the Trust. Mr. Eu is an “interested person” of the Trust, as defined in Section 2(a) (19) of the 1940 Act, due to his positions with the Investment Manager and its affiliates.
Effective April 25, 2016, Thomas J. Fuccillo, formerly the Vice President, Chief Legal Officer and Secretary to the Trust was appointed President and Chief Executive Officer to the Trust.
Effective April 25, 2016, Angela Borreggine, formerly an Assistant Secretary to the Trust was appointed Chief Legal Officer and Secretary to the Trust.
| 48 | Semi-Annual Report / March 31, 2016 |
Table of Contents
Matters Relating to the Trustees’ Consideration of the Investment Management and Sub-Advisory Agreement
(Unaudited)
The Investment Company Act of 1940, as amended (the “1940 Act”), requires that both the full Board of Trustees (the “Trustees”) and a majority of the Trustees who are not interested persons of the Trust (the “Independent Trustees”), voting separately, annually approve the continuation of (i) the Trust’s Investment Management Agreement on behalf of the AllianzGI Global Small-Cap Opportunities Portfolio (the “Global Small-Cap Opportunities Portfolio”) with Allianz Global Investors Fund Management LLC (the “Investment Manager”), and (ii) the Sub-Advisory Agreement between the Investment Manager and Allianz Global Investors U.S. LLC (the “Sub-Adviser”).
The 1940 Act also requires that the Trustees and the Independent Trustees initially approve any new investment management or sub-advisory agreement for a Portfolio (as defined below). New agreements approved for Portfolios covered by this report relate to the organization of the AllianzGI Advanced Core Bond Portfolio (the “Advanced Core Bond Portfolio”), AllianzGI Best Styles Global Managed Volatility Portfolio (the “Best Styles Portfolio”) and AllianzGI Discovery U.S. Portfolio (the “Discovery U.S. Portfolio” and together with the Advanced Core Bond Portfolio and Best Styles Portfolio, the “New Portfolios” and together with Global Small-Cap Opportunities Portfolio, the “Portfolios”). At an in-person meeting held on October 7, 2015, the Board and the Independent Trustees unanimously approved, for an initial two-year term, (i) the Investment Management Agreement and (ii) the Sub-Advisory Agreement on behalf of the Advanced Core Bond Portfolio and the Discovery U.S. Portfolio, each a new series of the Trust. Each Investment Management Agreement and each Sub-Advisory Agreement with respect to the Portfolios are collectively referred to herein as the “Agreements.” The Advanced Core Bond Portfolio and the Discovery U.S. Portfolio commenced operations on October 30, 2015 and December 21, 2015, respectively. At an in-person meeting held on March 22, 2016, the Board and the Independent Trustees unanimously approved, for an initial two-year term, (i) the Investment Management Agreement and (ii) the Sub-Advisory Agreement on behalf of the Best Styles Portfolio, a new series of the Trust. The Best Styles Portfolio commenced operations on April 11, 2016.
With respect to the Global Small-Cap Opportunities Portfolio, the Independent Trustees had a pre-meeting on March 10, 2016 with independent counsel to discuss the materials provided by the Investment Manager in response to the Independent Trustees’ written request for information regarding the annual renewals. Representatives from the Investment Manager attended portions of that meeting to review, among other matters, the comparative fee and expense information and comparative performance information prepared and provided by Broadridge Inc. (“Broadridge”) using its respective Lipper Inc. (“Lipper”) peer universe for performance comparison and Broadridge peer universe for expense comparisons.
At an in-person meeting held on March 22, 2015, the Board and the Independent Trustees unanimously approved the continuation of the Agreements for an additional one-year period from April 1, 2016 through March 31, 2017 with respect to the Global Small-Cap Opportunities Portfolio.
The material factors and conclusions that formed the basis of these approvals for the Portfolios are discussed below.
The Independent Trustees were assisted in their evaluation of the Agreements and the factors that they deemed to be material, including those factors described below, by independent legal counsel, from whom they received separate legal advice and with whom they met separately from the Investment Manager during their contract review meetings.
In connection with their deliberations regarding the approval of the Agreements, the Trustees, including the Independent Trustees, considered such information and factors as they believed, in light of the legal advice furnished to them and their own business judgment, to be relevant. As described below, the Trustees considered the nature, quality and extent of the various investment management, administrative and other services to be performed by the Investment Manager and the Sub-Adviser under the Agreements.
In connection with their deliberations, the Trustees received and relied upon materials provided by the Investment Manager including, among other items: (i) information provided by Broadridge, an independent third party, for the Global Small-Cap Opportunities Portfolio on the investment performance of a group of funds with investment classifications and/or objectives comparable to those of the Global Small-Cap Opportunities Portfolio identified by Lipper (the “Lipper performance universe”), the performance of applicable benchmark indices and the total return investment performance (based on net assets) of the Global Small-Cap Opportunities Portfolio for various time periods; (ii) information compiled from Morningstar Direct (“Morningstar”), an independent third party, for each New Portfolio on the investment performance for various time periods, including annualized return performance information for certain time periods, of a group of funds with investment
| 49 | Semi-Annual Report / March 31, 2016 |
Table of Contents
Matters Relating to the Trustees’ Consideration of the Investment Management and Sub-Advisory Agreement
(Unaudited)
classifications and/or objectives comparable to those proposed for the New Portfolios; (iii) information on each New Portfolio’s management fees and other anticipated expenses and on the Global Small-Cap Opportunities Portfolio’s’ management fees and other expenses and information compiled from Morningstar or provided by Broadridge, as applicable, on the management fees and other expenses of comparable funds identified by Morningstar or Broadridge, as applicable; (iv) to the extent applicable, information regarding the investment performance, fees and expenses for other funds and accounts managed by the Investment Manager and the Sub-Adviser, or their affiliates, including institutional and separate accounts, with similar investment objective(s) and policies to those of the Global Small-Cap Opportunities Portfolio, if any; (v) with respect to the New Portfolios, to the extent applicable, information regarding the investment performance, fees and expenses of other funds and accounts, including institutional and separate accounts, managed by the Investment Manager and the Sub-Adviser or their affiliates with similar investment objective(s) and policies to those of the New Portfolios, if any; (vi) an estimate of the profitability to the Investment Manager from its relationship with the New Portfolios during its first year and the estimated profitability to the Investment Manager from its relationship with the Global Small-Cap Opportunities Portfolio for the twelve months ended December 31, 2015; (vii) descriptions of various functions performed or to be performed by the Investment Manager and the Sub-Adviser for the Portfolios, such as portfolio management, compliance monitoring and portfolio trading practices; and (viii) information regarding the overall organization and business functions of the Investment Manager and the Sub-Adviser, including, without limitation, information regarding senior management, portfolio managers and other personnel providing or proposed to provide investment management, administrative and other services to the Portfolios.
The Trustees’ conclusions as to the approval of the Agreements were based on a comprehensive consideration of all information provided to the Trustees and were not the result of any single factor. Some of the factors that figured particularly in the Trustees’ deliberations are described below, although individual Trustees may have evaluated the information presented differently from one another, attributing different weights to various factors. The Trustees recognized that the fee arrangements for the Global Small-Cap Opportunities Portfolio are the result of years of review and discussion between the Independent Trustees and the Investment Manager, that certain aspects of such arrangements may receive greater scrutiny in some years than in others, and that the Trustees’ conclusions may be based, in part, on their consideration of these same arrangements during the course of the year and in prior years. The Trustees evaluated information available to them on a Portfolio-by-Portfolio basis, and their determinations were made separately in respect of each Portfolio. However, they also took into account the common interests of all series of the Trust in their review. The Trustees also took into account that the Investment Manager had proposed the continuation of certain advisory fee waivers and expense caps for the Global Small-Cap Opportunities Portfolio and had proposed to observe certain management fee waivers and/or expense limitations for each New Portfolio. The Trustees also considered the risk profile of each Portfolio.
Performance Information
Specific performance results for the Global Small-Cap Opportunities Portfolio reviewed by the Trustees are discussed below. The comparative performance information was prepared and provided by Broadridge and was not independently verified by the Trustees. Due to the passage of time, these performance results may differ from the performance results for more recent periods, including those shown elsewhere in this report. With respect to the Global Small-Cap Opportunities Portfolio, the Trustees reviewed, among other information, comparative information showing performance against its respective Lipper performance universe for the one-year and since inception periods ended September 30, 2015. For the Global Small-Cap Opportunities Portfolio, performance was above the median for the one-year and since inception periods against its respective Lipper peer universe.
In addition, the Trustees considered matters bearing on the Global Small-Cap Opportunities Portfolio and the advisory arrangements at their meetings throughout the year, including a review of performance data at each regular meeting.
As part of their review, the Trustees examined the ability of the Investment Manager and the Sub-Adviser to provide high-quality investment management and other services to the Portfolios. Among other information, the Trustees considered the investment philosophy and research and decision making processes of the Investment Manager and Sub-Adviser; the experience of key advisory personnel of the Sub-Adviser or its affiliates, as applicable, who are or would be responsible for portfolio management of the Portfolios; the ability of the Investment Manager and the Sub-Adviser to attract and retain capable personnel; the background and capabilities of the senior management and staff of the Investment Manager and the Sub-Adviser; employee compensation; and the operational infrastructure, including technology and systems, of the Investment Manager and the Sub-Adviser. In addition, the Trustees reviewed the extent and quality of the Investment
| 50 | Semi-Annual Report / March 31, 2016 |
Table of Contents
Matters Relating to the Trustees’ Consideration of the Investment Management and Sub-Advisory Agreement
(Unaudited)
Manager’s and the Sub-Adviser’s services or expected services with respect to regulatory compliance and compliance with the investment policies of the Portfolios; the compliance programs and risk controls of the Investment Manager and Sub-Adviser; the specific contractual obligations of the Investment Manager and Sub-Adviser pursuant to each Agreement; the nature, extent and quality of certain administrative services the Investment Manager is responsible for providing to the Global Small-Cap Opportunities Portfolio and would be responsible for providing to the New Portfolios; and conditions that might affect the ability of the Investment Manager or the Sub-Adviser to provide high quality services to the Portfolios in the future under the Agreements, including each organization’s respective financial condition and operational stability. Based on the foregoing, the Trustees concluded that the Investment Manager’s and the Sub-Adviser’s investment processes, research capabilities and philosophy were well-suited to each Portfolio given its respective investment objectives and policies, and that the Investment Manager and the Sub-Adviser would be able to meet and/or continue to meet any reasonably foreseeable obligations under each Agreement and that the Investment Manager and the Sub-Adviser would otherwise be able to provide or continue to provide services to the Portfolios of sufficient extent and quality.
Fee and Expense Information
In assessing the reasonableness of the Global Small-Cap Opportunities Portfolio’s fees and expenses under the Agreements, the Trustees considered, among other information, its management fee and total expense ratio as a percentage of average daily net assets and the advisory and net expense ratios of peer groups of funds based on information provided by Broadridge. The Trustees also noted the management fee waiver and/or expense limitation agreement observed by the Investment Manager for the Global Small-Cap Opportunities Portfolio that cap fees or expenses of its shares. With respect to each Portfolio, the Trustees also considered, among other items: (i) the level of the Portfolios’ Sub-Advisory fees; (ii) the allocation of the Management Fee between the Investment Manager and the Sub-Adviser, and the services provided by the Investment Manager, on the one hand, and the Sub-Adviser, on the other hand; and (iii) that the Investment Manager (and not the Portfolio) pays the Sub-Advisory fees.
In assessing the reasonableness of each New Portfolio’s proposed fees under the Agreements, the Trustees considered, among other information, each New Portfolio’s proposed management fee and its expected net expense ratio as a percentage of anticipated average daily net assets, taking into account the management fee waiver and/or expense limitation arrangements that the Investment Manager would observe, and the advisory fees and net expense ratios of peer groups of funds based on information provided by Morningstar.
The Trustees considered how the net expense ratio of each New Portfolio was expected to compare to its Morningstar peers, and considered comparisons of each New Portfolio’s proposed management fee with the advisory fees of the peer funds.
The Trustees took into account that a comparison of the New Portfolios’ proposed management fee to the advisory fee of peer funds is complicated because each of the New Portfolio’s proposed management fee includes a component for administrative services while peer funds may have separate advisory and administration agreements with separate fees. The Trustees therefore placed significant emphasis on the estimated net expense ratio of each of the New Portfolios compared to the net expense ratios of the Morningstar peer funds, recognizing that the fees for investment advisory, administrative services and fund operating expenses would be subsumed within the net expense ratio of all funds.
In comparing the Global Small-Cap Opportunities Portfolio to its respective Broadrige peers, with respect to expenses, the Trustees noted that the Global Small-Cap Opportunities Portfolio was not charged a separate administration fee, recognizing that its management fee includes a component for administrative services, while many peer funds in the Broadridge categories have separate advisory and administration agreements with separate fees.
With respect to the Global Small-Cap Opportunities Portfolio, the Trustees also considered, as applicable, the management fees charged by the Investment Manager and the Sub-Adviser to other funds and accounts with similar investment strategies to the New Portfolios, if any.
The Trustees noted that the proposed management fees and estimated net expense ratios for the Advanced Core Bond Portfolio were lower than the median for shares of the Portfolio’s peer funds, measured as of August 31, 2015. The Trustees noted that the proposed management fees and estimated net expense ratios of the Best Styles Portfolio were lower than the median for shares of the Portfolio’s peer funds, measured as of January 31, 2016. The Trustees noted that the proposed management fee for the Discovery U.S. Portfolio was lower than the median for shares of the Portfolio’s peer funds and the Portfolio’s net expense ratio was higher than the median for shares of the Portfolio’s peer funds, measured as of August 31, 2015.
| 51 | Semi-Annual Report / March 31, 2016 |
Table of Contents
Matters Relating to the Trustees’ Consideration of the Investment Management and Sub-Advisory Agreement
(Unaudited)
With respect to the New Portfolios, the Trustees also considered the management fees charged by the Investment Manager and the Sub-Adviser to other funds and accounts with similar investment strategies to the New Portfolios, if any.
The Independent Trustees noted that management fees for shares of the Global Small-Cap Opportunities Portfolio were below median, and total expense ratios (taking fee waivers and/or expense limitations into account) were above median (in the third quintile) for shares of the Global Small-Cap Opportunities Portfolio’s peer funds.
The Trustees considered the estimated profitability to the Investment Manager from its relationship with the Global Small-Cap Opportunities Portfolio and the estimated profitability to the Investment Manager from its relationship with each New Portfolio and determined that such profitability did not appear to be excessive. The Trustees noted that, with respect to the New Portfolios, the Investment Manager’s profitability was expected to be negative for each New Portfolio’s first year of operations. The Trustees considered the extent to which the Investment Manager and Sub-Adviser may realize economies of scale or other efficiencies in managing and supporting the Portfolios. The Trustees took into account that, as open-end investment companies, the Portfolios intend to raise additional assets, so as the assets of the Portfolios grow over time, certain economies of scale and other efficiencies may be realized through spreading certain fixed costs over a larger asset base or across a variety of products and services, while also taking into account the fee waiver and/or expense limitation arrangements observed by or proposed to be observed by the Investment Manager for each Portfolio. Additionally, the Trustees considered so-called “fall-out benefits” to the Investment Manager, the Sub-Adviser and their affiliates, such as reputational value derived from serving as Investment Manager and Sub-Adviser to the Portfolio.
After reviewing these and other factors described herein, the Trustees concluded, within the context of their overall conclusions regarding the Agreements and based on the information provided and related representations made by management of the Investment Manager and Sub-Adviser, with respect to the Global Small-Cap Opportunities Portfolio, that the fees payable under each Agreement represent reasonable compensation in light of the nature, extent and quality of services provided by the Investment Manager or Sub-Adviser, as the case may be, and should be continued. With respect to the New Portfolios, the Trustees also concluded the proposed fees payable under each Agreement represent reasonable compensation in light of the nature, extent and quality of services to be provided by the Investment Manager or the Sub-Adviser, as the case may be, and should be approved for an initial two-year period. Based on their evaluation of factors that they deemed to be material, including those factors described above, the Trustees, including the Independent Trustees, unanimously concluded that the continuation of the Agreements with respect to the Global Small-Cap Opportunities Portfolio and initial approval of the Agreements with respect to the New Portfolios were in the interests of each applicable Portfolio and its shareholders, and should be approved.
| 52 | Semi-Annual Report / March 31, 2016 |
Table of Contents
(Unaudited)
Please read this Policy carefully. It gives you important information about how Allianz Global Investors U.S. and its U.S. affiliates (“AllianzGI US,” “we” or “us”) handle non-public personal information (“Personal Information”) that we may receive about you. It applies to all of our past, present and future clients and shareholders of AllianzGI US and the funds and accounts it manages, advises, sub-advises, administers or distributes, and will continue to apply when you are no longer a client or shareholder. As used throughout this Policy, “AllianzGI US” means Allianz Global Investors U.S. LLC, Allianz Global Investors Fund Management LLC, Allianz Global Investors Distributors LLC, NFJ Investment Group LLC and the family of registered and unregistered funds managed by one or more of these firms. AllianzGI US is part of a global investment management group, and the privacy policies of other Allianz Global Investors entities outside of the United States may have provisions in their policies that differ from this Privacy Policy. Please refer to the website of the specific non-US Allianz Global Investors entity for its policy on privacy.
We Care about Your Privacy
We consider your privacy to be a fundamental aspect of our relationship with you, and we strive to maintain the confidentiality, integrity and security of your Personal Information. To ensure your privacy, we have developed policies that are designed to protect your Personal Information while allowing your needs to be served.
Information We May Collect
In the course of providing you with products and services, we may obtain Personal Information about you, which may come from sources such as account application and other forms, from other written, electronic, or verbal communications, from account transactions, from a brokerage or financial advisory firm, financial adviser or consultant, and/or from information you provide on our website.
You are not required to supply any of the Personal Information that we may request. However, failure to do so may result in us being unable to open and maintain your account, or to provide services to you.
How Your Information Is Shared
We do not disclose your Personal Information to anyone for marketing purposes. We disclose your Personal Information only to those service providers, affiliated and non-affiliated, who need the information for everyday business purposes, such as to respond to your inquiries, to perform services, and/or to service and maintain your account. This applies to all of the categories of Personal Information we collect about you. The affiliated and non-affiliated service providers who receive your Personal Information also may use it to process your transactions, provide you with materials (including preparing and mailing prospectuses and shareholder reports and gathering shareholder proxies), and provide you with account statements and other materials relating to your account. These service providers provide services at our direction, and under their agreements with us, are required to keep your Personal Information confidential and to use it only for providing the contractually required services. Our service providers may not use your Personal Information to market products and services to you except in conformance with applicable laws and regulations. We also may provide your Personal Information to your respective brokerage or financial advisory firm, custodian, and/or to your financial adviser or consultant.
In addition, we reserve the right to disclose or report Personal Information to non-affiliated third parties, in limited circumstances, where we believe in good faith that disclosure is required under law, to cooperate with regulators or law enforcement authorities or pursuant to other legal process, or to protect our rights or property, including to enforce our Privacy Policy or other agreements with you. Personal Information collected by us may also be transferred as part of a corporate sale, restructuring, bankruptcy, or other transfer of assets.
Security of Your Information
We maintain your Personal Information for as long as necessary for legitimate business purposes or otherwise as required by law. In maintaining this information, we have implemented appropriate procedures that are designed to restrict access to your Personal Information only to those who need to know that information in order to provide products and/or services to you. In addition, we have implemented physical, electronic and procedural safeguards to help protect your Personal Information.
| 53 | Semi-Annual Report / March 31, 2016 |
Table of Contents
Privacy Policy
(Unaudited)(Continued)
Privacy and the Internet
The Personal Information that you provide through our website, as applicable, is handled in the same way as the Personal Information that you provide by any other means, as described above. This section of the Policy gives you additional information about the way in which Personal Information that is obtained online is handled.
| · | Online Enrollment, Account Access and Transactions: When you visit our website, you can visit pages that are open to the general public, or, where available, log into protected pages to enroll online, access information about your account, or conduct certain transactions. Access to the secure pages of our website is permitted only after you have created a User ID and Password. The User ID and Password must be supplied each time you want to access your account information online. This information serves to verify your identity. When you enter Personal Information into our website (including your Social Security Number or Taxpayer Identification Number and your password) to enroll or access your account online, you will log into secure pages. By using our website, you consent to this Privacy Policy and to the use of your Personal Information in accordance with the practices described in this Policy. If you provide Personal Information to effect transactions on our website, a record of the transactions you have performed while on the site is retained by us. For additional terms and conditions governing your use of our website, please refer to the Investor Mutual Fund Access – Disclaimer which is incorporated herein by reference and is available on our website. |
| · | Cookies and Similar Technologies: Cookies are small text files stored in your computer’s hard drive when you visit certain web pages. Cookies and similar technologies help us to provide customized services and information. We use these technologies on our website to improve our website and services, including to evaluate the effectiveness of our site, and to enhance the site user experience. Because an industry-standard Do-Not-Track protocol is not yet established, our website will continue to operate as described in this Privacy Policy and will not be affected by any Do-Not-Track signals from any browser. |
Changes to Our Privacy Policy
We may modify this Privacy Policy from time-to-time to reflect changes in related practices and procedures, or applicable laws and regulations. If we make changes, we will notify you on our website and the revised Policy will become effective immediately upon posting to our website. We also will provide account owners with a copy of our Privacy Policy annually. We encourage you to visit our website periodically to remain up to date on our Privacy Policy. You acknowledge that by using our website after we have posted changes to this Privacy Policy, you are agreeing to the terms of the Privacy Policy as modified.
Obtaining Additional Information
If you have any questions about this Privacy Policy or our privacy related practices in the United States, you may contact us via our dedicated email at PrivacyUS@allianzgi.com.
| 54 | Semi-Annual Report / March 31, 2016 |
Table of Contents
Trustees
Davey S. Scoon
Chairman of the Board of Trustees
Barbara R. Claussen
Deborah A. DeCotis
F. Ford Drummond
A. Douglas Eu
Bradford K. Gallagher
James A. Jacobson
Hans W. Kertess
James S. MacLeod
William B. Ogden, IV
Alan Rappaport
Officers
Thomas J. Fuccillo
President & Chief Executive Officer
Lawrence G. Altadonna
Treasurer, Principal Financial & Accounting Officer
Angela Borreggine
Secretary & Chief Legal Officer
Thomas L. Harter
Chief Compliance Officer
Scott Whisten
Assistant Treasurer
Richard J. Cochran
Assistant Treasurer
Orhan Dzemaili
Assistant Treasurer
Debra Rubano
Assistant Secretary
Paul Koo
Assistant Secretary
Investment Manager
Allianz Global Investors Fund Management LLC
1633 Broadway
New York, NY 10019
Sub-Adviser
Allianz Global Investors U.S. LLC
1633 Broadway
New York, NY 10019
Distributor
Allianz Global Investors Distributors LLC
1633 Broadway
New York, NY 10019
Custodian & Accounting Agent
State Street Bank & Trust Co.
801 Pennsylvania Avenue
Kansas City, MO 64105
Transfer Agent
Boston Financial Data Services, Inc.
330 West 9th Street, 5th Floor
Kansas City, MO 64105
Independent Registered Public Accounting Firm
PricewaterhouseCoopers LLP
300 Madison Avenue
New York, NY 10017
Legal Counsel
Ropes & Gray LLC
Prudential Tower
800 Boylston Street
Boston, MA 02199
This report, including the financial information herein, is transmitted to the shareholders of the Trust for their information. It is not a prospectus, circular or representation intended for use in the purchase of shares of each Portfolio or any securities mentioned in this report.
The Financial information included herein is taken from the records of the Portfolios without examination by an independent registered public accounting firm, who did not express an opinion herein.
AGI-2016-04-08-15001
Table of Contents
ITEM 2. CODE OF ETHICS
(a) Not required in this filing.
ITEM 3. AUDIT COMMITTEE FINANCIAL EXPERT
Not required in this filing.
ITEM 4. PRINCIPAL ACCOUNTANT FEES AND SERVICES
Not required in this filing.
ITEM 5. AUDIT COMMITTEE OF LISTED REGISTRANT
Disclosure not required for open-end management investment companies.
ITEM 6. SCHEDULE OF INVESTMENTS
(a) Schedule of Investments is included as part of the report to shareholders filed under Item 1 of this form.
(b) Not applicable.
| ITEM 7. | DISCLOSURE OF PROXY VOTING POLICIES AND PROCEDURES FOR CLOSED-END MANAGEMENT | |
| INVESTMENT COMPANIES |
Disclosure not required for open-end management investment companies.
| ITEM 8. | PORTFOLIO MANAGERS OF CLOSED-END MANAGEMENT INVESTMENT COMPANIES |
Disclosure not required for open-end management investment companies.
| ITEM 9. | PURCHASES OF EQUITY SECURITIES BY CLOSED-END MANAGEMENT INVESTMENT COMPANY AND | |
| AFFILIATED COMPANIES. |
Disclosure not required for open-end management investment companies.
ITEM 10. SUBMISSION OF MATTERS TO A VOTE OF SECURITY HOLDERS
There were no material changes to the procedures by which shareholders may recommend nominees to the Fund’s Board of Trustees since the Fund’s last provided disclosure in response to this item.
ITEM 11. CONTROLS AND PROCEDURES
| (a) | The registrant’s President and Treasurer, Principal Financial & Accounting Officer have concluded that the registrant’s disclosure controls and procedures (as defined in Rule 30a-3(c) under the Act (17 CFR 270.30a-3(c))), are effective based on their evaluation of these controls and procedures as of a date within 90 days of the filing date of this document. |
| (b) | There were no significant changes in the registrant’s internal control over financial reporting (as defined in Rule 30a-3(d) under the Act (17 CFR 270.30a-3(d))) that occurred during the second fiscal quarter of the period covered by this report that has materially affected, or is reasonably likely to materially affect, the registrant’s internal control over financial reporting. |
ITEM 12. EXHIBITS
(a) (1) Not required in this filing.
(a) (2) Exhibit 99.302 Cert. — Certification pursuant to Section 302 of the Sarbanes-Oxley Act of 2002
(a) (3) Not applicable
(b) Exhibit 99.906 Cert. — Certification pursuant to Section 906 of the Sarbanes-Oxley Act of 2002
Table of Contents
Signatures
Pursuant to the requirements of the Securities Exchange Act of 1934 and the Investment Company Act of 1940, the registrant has duly caused this report to be signed on its behalf by the undersigned, thereunto duly authorized.
| (Registrant) AllianzGI Institutional Multi-Series Trust | ||||
| By: | /s/ Thomas J. Fuccillo | |||
| Thomas J. Fuccillo, | ||||
| President & Chief Executive Officer | ||||
| Date: | June 1, 2016 | |||
| By: | /s/ Lawrence G. Altadonna | |||||
| Lawrence G. Altadonna | ||||||
Treasurer, Principal Financial & Accounting Officer | ||||||
| Date: | June 1, 2016 | |||||
Pursuant to the requirements of the Securities Exchange Act of 1934 and the Investment Company Act of 1940, this report has been signed below by the following persons on behalf of the registrant and in the capacities and on the dates indicated.
| By: | /s/ Thomas J. Fuccillo | |||||
| Thomas J. Fuccillo, | ||||||
| President & Chief Executive Officer | ||||||
| Date: | June 1, 2016 | |||||
| By: | /s/ Lawrence G. Altadonna | |||||
| Lawrence G. Altadonna, | ||||||
Treasurer, Principal Financial & Accounting Officer | ||||||
| Date: | June 1, 2016 | |||||