UNITED STATES
SECURITIES AND EXCHANGE COMMISSION
Washington, D.C. 20549
FORM N-CSR
CERTIFIED SHAREHOLDER REPORT OF
REGISTERED MANAGEMENT INVESTMENT COMPANIES
Investment Company Act file number: 811-22985
SMEAD FUNDS TRUST
(Exact name of registrant as specified in charter)
2777 East Camelback Road, Suite 375
Phoenix, AZ 85016
(Address of principal executive offices) (Zip code)
Cole W. Smead
Smead Capital Management, Inc.
2777 East Camelback Road, Suite 375
Phoenix, AZ 85016
Copy to:
Pamela M. Krill, Esq
Godfrey & Kahn, S.C.
833 East Michigan Street, Suite 1800
Milwaukee, WI 53202
(Name and address of agent for service)
Registrant’s telephone number, including area code: (877) 701-2883
Date of fiscal year end: November 30
Date of reporting period: May 31, 2022
Item 1. Report to Shareholders.
(a)
Semi-Annual Report

May 31, 2022
Investment Adviser
Smead Capital Management, Inc.
2777 East Camelback Road
Suite 375
Phoenix, AZ 85016
Phone: 877-807-4122
www.smeadfunds.com
Table of Contents
May 2022 Semi-Annual Letter: Smead Value Fund
As we come to the end of the first six months of the fiscal year in the Smead Value Fund (the Fund; SMVLX), it all comes down to what people are doing versus what they are saying. We were saying one year ago that trouble was brewing in the financial euphoria episode centered on technology and futuristic investments. The hammer came down on those investors in the last six months.
The Fund gained 2.02% in the last six months versus a loss of 8.85% in the tech-heavy S&P 500 Index and a gain of 1.51% in the Russell 1000 Value Index. We always like to beat the indexes, but our guess is that before this difficult market era is over, we will end up highlighting lower losses. Over long periods of time, lower losses lead to outperformance, as much as gain years.
Our best performers in the last 12 months were Occidental Petroleum (OXY), Continental Resources (CLR), Conoco (COP). The stock market was slow to catch up to the economic reality of scarce resources like oil and gas. Once Russia invaded Ukraine and national security issues entered the equation (as if they weren’t important until then), we woke up with $115 per barrel of oil and massive free cash flow.
On the downside, low consumer sentiment and prospects of a deep recession drove fearful selling. Target (TGT), Macerich (MAC) and Simon Property Group (SPG) bled in the underperformance section. As interest rates rose in the last six months, recession fears began to dominate post-pandemic economic confidence.
We have been willing to sit through the correction in stocks like Target (TGT) and eBay (EBAY) because we see bright futures as they meet the demand coming from Millennial necessity spending. People sell stock in anticipation of a recession because they think the economy will contract by 3%. Would you divorce your spouse if they loved you 3% less next year?
1
Do as I Do and Not as I Say
As you can see in this chart, consumers and investors are very bearish in the aftermath of the stock market decline in the first half of 2022. However, their asset allocation is not matching up with their sentiment:
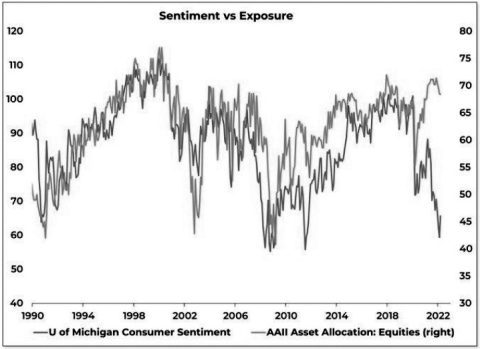
What does history tell us about what might come next? The great investor, Peter Lynch, of Fidelity Magellan fame, taught about the three stages of a bull market. At the bottom of a bear market, people avoided him like the plague, even though he made people a mountain of money. When the asset allocation of investors matches their bearishness, we will be hunting for bargains among companies that meet an economic need and fit our other seven criteria for common stock selection. Fear stock market failure!
Warmest regards,
| | |
 | |  |
William Smead Lead Portfolio Manager | | Cole Smead, CFA Co-Portfolio Manager |
The information contained herein represents the opinion of Smead Capital Management, Inc. and is not intended to be a forecast of future events, a guarantee of future results, nor investment advice.
Consider the investment objectives, risks, charges and expenses of the Fund carefully before investing. The statutory and summary prospectuses contain this
2
and other information about the Fund and are available at www.smeadcap.com or by calling 877-807-4122. Read carefully before investing.
Performance data quoted represents past performance; past performance does not guarantee future results. The investment return and principal value of an investment will fluctuate so that an investor’s shares, when redeemed, may be worth more or less than their original cost. Current performance of the Fund may be lower or higher than the performance quoted. Performance data current to the most recent month end may be obtained by calling 877-807-4122.
Must be preceded or accompanied by a prospectus.
Mutual fund investing involves risk. Principal loss is possible.
The S&P 500 Index is a broad-based unmanaged index of 500 stocks, which is widely recognized as representative of the equity market in general. The Russell 1000® Value Index measures the performance of those Russell 1000® Index companies with lower price-to-book ratios and lower forecasted growth values. Frank Russell Company is the source and owner of the trademarks, service marks and copyrights related to the Russell Indexes. Russell ® is a trademark of Russell Investment Group. One cannot invest directly in an index.
The Smead Value Fund is distributed by UMB Distribution Services, LLC. UMB Distribution services, and Smead Capital Management, Inc. are not affiliated.
3
May 2022 Semi-Annual Letter: Smead International Value Fund
As we close on the first half of the fiscal year of the Smead International Value Fund (the Fund; SVXLX) in 2022, we are thankful for the money our investors have made.
The Fund gained 8.44% during the first half of the fiscal year versus a loss of 11.98% for the MSCI EAFE Net Return Index and a loss of 12.03% for the MSCI ACWI ex-US Net Return Index.1 While we are pleased by the start, we know that stock market failure will continue to cause problems and frustration to investors, including us.
Our largest contributors so far this year were the Occidental Petroleum Warrants (OXY/WS US), Cenovus Energy (CVE CN) and MEG Energy (MEG CN). Our energy holdings were the strongest contributor by sector as the world awoke to the troubles that the Ukraine invasion has caused. We believe that higher prices are here to stay.
The largest detractors in the Fund’s portfolio were Interfor (IFP CN), Porsche Automobile (PAH3 GY) and Volkswagen (VOW 3 GY). Economic fears in the economy of the world drove our cyclical businesses in consumer discretionary and materials lower. While we believe these fears are overblown, we have to stare at lower stock quotes in the interim. We view the supply of cars and lumber to be scarce. We believe the pricing is going to be stronger in the time ahead, but short-term news is driving stock prices.
Oil Price Persistence Like the 1970s
This year, so far, has been destructive to investor capital overall and we don’t expect the environment to get suddenly easy. However, we do believe that shareholders in the Fund have a distinct advantage over other investors in international markets. We think about it like a card game. The best hand in the game is referred to as “the nuts.” Our large exposure to the energy business in the Fund’s portfolio via companies like Occidental Petroleum (OXY), Cenovus Energy (CVE) and MEG Energy (MEG) are what we consider to be a strong hand. If our analysis of long-term energy needs plays out, we would expect many other international investors to want to get heavily involved in energy production.
These energy businesses are not currently reflecting spot oil prices near $115 per barrel. Most analysts that are bullish are still forecasting $80 per barrel prices a couple of years from now and running their analysis on $70 or $75 prices. In other words, everyone is afraid to say how good it is. Our experience is that investors in commodities markets are always afraid to say how good it is because tomorrow could be a nightmare. The risk aversion by Wall Street and other investors has caused owning energy to be an underestimated hand at the investing poker table. We believe it’s the best hand (the nuts) and would like to think that our shareholders will get paid appropriately for taking that risk.
This persistence isn’t just the circumstances of today but can be drawn from history as well. When the 1973 oil embargo hit the global economy, prices never went back to where they were prior. Today looks analogous with one big exception: no gas lines from rationing. Price is going to do the rationing this time because America produces its own oil compared to the dark days of the 1970s. This isn’t Arab nations limiting our supply. This is global oil companies not willing to increase supply unless they get paid for their capital at risk. It’s rational. This is why the world is a bit lost and doesn’t understand the logic.
Back to being patient with our hand. Jim Reid at Deutsche Bank has done some great work looking at returns of the 1970s in various asset classes. We’ll provide a brief synopsis. Stocks and bonds broadly lost money in real terms. Single-family real estate
4
beat inflation. Commodities did well also. Oil crushed everything from a real return standpoint. Warren Buffett worked very hard during that decade to defend his capital.
We will attempt to practice ignorance avoidance, regardless of the volatility we sit through. We hope to have a world-class hand for the shareholders of the Fund today. If and when we get paid handsomely for taking this risk, we believe we will be in a good position to buy bargains created by the extremely difficult market environment. Until then, we will patiently wait for the pot to get bigger and the plot to get thicker.
Fear stock market failure,
| | |
| | |
Cole Smead, CFA Lead Portfolio Manager | | William Smead Co-Portfolio Manager |
| 1 | The Fund is a newly registered mutual fund and does not have a full calendar year of performance as a mutual fund. The Fund succeeded to substantially all of the assets and liabilities of the Smead International Value Fund LP, a Delaware Limited Partnership (the “Predecessor Fund”), in exchange solely for Class I1 shares of the Fund on January 11, 2022 (the “Reorganization”). Smead Private Fund Advisers, LLC, an affiliate of the Adviser, was the General Partner for the Predecessor Fund since its inception on January 12, 2015. Prior performance represents the historical performance of the Predecessor Fund, which offered partnership interests. Following the Reorganization, the Predecessor Fund was liquidated and dissolved. Please see the Fund’s Prospectus for more details. |
The information contained herein represents the opinion of Smead Capital Management, Inc. and is not intended to be a forecast of future events, a guarantee of future results, nor investment advice.
Consider the investment objectives, risks, charges and expenses of the Fund carefully before investing. The statutory and summary prospectuses contain this and other information about the Fund and are available at www.smeadcap.com or by calling 877-807-4122. Read carefully before investing.
Performance data quoted represents past performance; past performance does not guarantee future results. The investment return and principal value of an investment will fluctuate so that an investor’s shares, when redeemed, may be worth more or less than their original cost. Current performance of the Fund may be lower or higher than the performance quoted. Performance data current to the most recent month end may be obtained by calling 877-807-4122.
Must be preceded or accompanied by a prospectus.
Mutual fund investing involves risk. Principal loss is possible.
Foreign Securities Risk. Investments in securities of foreign companies involve additional risks, including less liquidity, currency rate fluctuations, political and economic instability, differences in financial reporting standards and securities market regulation, and the imposition of foreign withholding taxes.
5
MSCI EAFE Index (Net) (Europe, Australasia, Far East) is a broad-based, unmanaged equity market index designed to measure the equity market performance of 21 developed markets, excluding the US and Canada. An index cannot be invested indirectly. This benchmark calculates reinvested dividends net of withholding taxes using Luxembourg tax rates. MSCI ACWI ex-U.S. Index (Net) is a free float-adjusted market capitalization index that is designed to large and mid-cap representation across 22 of 23 Developed Markets (DM) countries (excluding the US) and 24 Emerging Markets (EM) countries. This benchmark calculates reinvested dividends net of withholding taxes using Luxembourg tax rates. One cannot invest directly in an index.
The Smead International Value Fund is distributed by UMB Distribution Services, LLC. UMB Distribution Services, and Smead Capital Management, Inc. are not affiliated.
6
SMEAD FUNDS
Expense Examples
(Unaudited)
As a shareholder of the Funds, you incur two types of costs: (1) transaction costs, including sales charges (loads) on purchase payments and (2) ongoing costs, including management fees, distribution (12b-1) fees, shareholder servicing fees and other Fund expenses. These Examples are intended to help you understand your ongoing costs (in dollars) of investing in the Funds, and to compare these costs with the ongoing costs of investing in other mutual funds. The Examples are based on an investment of $1,000 invested at the beginning of the period and held for the entire period as indicated below.
Actual Expenses
The second and fourth columns of the following tables provide information about actual account values and actual expenses of each Class of the Funds. If you purchase Class A shares of the Funds you will pay a maximum initial sales charge of 5.75% when you invest. Class A shares and Class C shares of Smead Value Fund and the Smead International Value Fund are subject to a contingent deferred sales charge of 1.00% for purchases of $1,000,000 or more that are redeemed within eighteen months of purchase for Class A shares and redeemed within twelve months of purchase for Class C shares. In addition, you will be assessed fees for outgoing wire transfers, returned checks and stop payment orders at prevailing rates charged by UMB Fund Services, Inc., the Funds’ transfer agent. To the extent the Funds invest in shares of exchange-traded funds (“ETFs”) or other investment companies as part of their investment strategies, you will indirectly bear your proportionate share of any fees and expenses charged by the underlying funds in which the Funds invest in addition to the expenses of the Funds. Actual expenses of the underlying funds are expected to vary among the various underlying funds. These expenses are not included in the Examples. The Examples include, but are not limited to, advisory fees, fund administration and accounting, custody and transfer agent fees. You may use the information in the second and fourth columns, together with the amount you invested, to estimate the expenses that you paid over the period. Simply divide your account value by $1,000 (for example, an $8,600 account value divided by $1,000 = 8.6), then multiply the result by the applicable number under the column entitled “Actual Expenses Paid During Period” to estimate the expenses you paid on your account during this period.
Hypothetical Example for Comparison Purposes
The third and fifth columns of the following tables provide information about hypothetical account values and hypothetical expenses based on the Funds’ actual expense ratios and an assumed rate of return of 5% per year before expenses, which are not the Funds’ actual returns. The hypothetical account values and expenses may not be used to estimate the actual ending account balance or expenses you paid for the period. You may use this information to compare the ongoing costs of investing in the Funds and other funds. To do so, compare this 5% hypothetical example with the 5% hypothetical examples that appear in the shareholder reports of other funds. Please note that the expenses shown in the table are meant to highlight your ongoing costs only and do not reflect any transactional costs, such as sales charges (loads), redemption fees or exchange fees. Therefore, the third and fifth columns of the table are useful in comparing ongoing costs only, and will not help you determine the relative total costs of owning different funds. In addition, if these transactional costs were included, your costs would have been higher.
7
SMEAD FUNDS
Expense Examples (Continued)
(Unaudited)
Smead Value Fund
| | | | | | | | | | | | | | | | | | | | | | | | | | | | | | |
Class | | Beginning
Acount
Value
12/1/21 | | Actual
Ending
Account
Value
5/31/22 | | Hypothetical
Ending
Account
Value | | Actual
Expenses
Paid
During
Period(1) | | Hypothetical
Expenses
Paid During
Period(1) | | Net
Expense
Ratio
During
Period(2) |
Investor Class | | | $ | 1,000.00 | | | | $ | 1,020.20 | | | | $ | 1,018.80 | | | | | $6.20 | | | | $ | 6.19 | | | | | 1.23 | % |
Class A | | | | 1,000.00 | | | | | 1,020.10 | | | | | 1,018.75 | | | | | 6.25 | | | | | 6.24 | | | | | 1.24 | |
Class C | | | | 1,000.00 | | | | | 1,017.50 | | | | | 1,015.86 | | | | | 9.15 | | | | | 9.15 | | | | | 1.82 | |
Class I1 | | | | 1,000.00 | | | | | 1,021.60 | | | | | 1,020.14 | | | | | 4.84 | | | | | 4.84 | | | | | 0.96 | |
Class R1 | | | | 1,000.00 | | | | | 1,019.40 | | | | | 1,017.15 | | | | | 7.85 | | | | | 7.85 | | | | | 1.56 | |
Class R2 | | | | 1,000.00 | | | | | 1,020.10 | | | | | 1,017.95 | | | | | 7.05 | | | | | 7.04 | | | | | 1.40 | |
Class Y | | | | 1,000.00 | | | | | 1,022.10 | | | | | 1,020.79 | | | | | 4.18 | | | | | 4.18 | | | | | 0.83 | |
| (1) | Investor Class, Class A, Class C, Class I1, Class R1, Class R2 and Class Y expenses are calculated using each Class’ annualized net expense ratio (as disclosed), multiplied by the average account value over the period, and multiplied by 182/365 (to reflect the most recent one-half year period). |
Smead International Value Fund
| | | | | | | | | | | | | | | | | | | | | | | | | | | | | | |
Class | | Beginning
Acount
Value
1/12/22 | | Actual
Ending
Account
Value
5/31/22 | | Hypothetical
Ending
Account
Value | | Actual
Expenses
Paid
During
Period(1) | | Hypothetical
Expenses
Paid During
Period(1) | | Net
Expense
Ratio
During
Period(2) |
Investor Class | | | $ | 1,000.00 | | | | $ | 1,106.80 | | | | $ | 1,020.49 | | | | | $4.67 | | | | $ | 4.48 | | | | | 0.89 | % |
Class A | | | | 1,000.00 | | | | | 1,106.10 | | | | | 1,019.80 | | | | | 5.41 | | | | | 5.19 | | | | | 1.03 | |
Class C | | | | 1,000.00 | | | | | 1,103.50 | | | | | 1,017.30 | | | | | 8.02 | | | | | 7.70 | | | | | 1.53 | |
Class I1 | | | | 1,000.00 | | | | | 1,107.10 | | | | | 1,020.69 | | | | | 4.47 | | | | | 4.28 | | | | | 0.85 | |
Class Y | | | | 1,000.00 | | | | | 1,107.80 | | | | | 1,021.24 | | | | | 3.89 | | | | | 3.73 | | | | | 0.74 | |
| (1) | Investor Class, Class A, Class C, Class I1 and Class Y expenses are calculated using each Class’ annualized net expense ratio (as disclosed), multiplied by the average account value over the period, and multiplied by 182/365 (to reflect the most recent one-half year period). |
8
SMEAD FUNDS
Investment Highlights
(Unaudited)
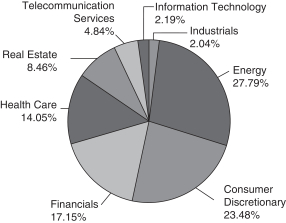
The Smead Value Fund seeks long-term capital appreciation. To achieve its investment objective, the Fund maintains approximately 25-30 companies in its portfolio and will invest in the common stocks of large capitalization U.S. companies.
Sector Breakdown
(% of equity Investments as of May 31, 2022)
Top Ten Holdings (% of Net Assets as of May 31, 2022)*
| | | | | |
Continental Resources, Inc. | | | | 10.40% | |
Occidental Petroleum Corp. | | | | 8.36% | |
American Express Co. | | | | 5.72% | |
Amgen, Inc. | | | | 5.53% | |
Merck & Co., Inc. | | | | 5.18% | |
NVR, Inc. | | | | 4.41% | |
ConocoPhillips | | | | 4.40% | |
Simon Property Group, Inc. | | | | 4.39% | |
Lennar Corp. | | | | 4.22% | |
Target Corp. | | | | 3.90% | |
| * | Does not Include Short-Term Investments |
Fund holdings are subject to change at any time and should not be considered recommendations to buy or sell any security. Current and future portfolio holdings are subject to risk.
Continued
9
SMEAD FUNDS
Investment Highlights (Continued)
(Unaudited)
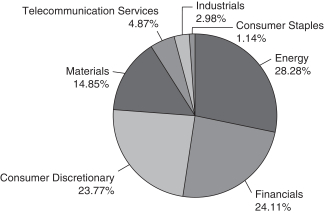
The Smead International Value Fund seeks long-term capital appreciation. To achieve its investment objective, the Fund maintains approximately 25-30 companies in its portfolio and will invest in the common stocks of large capitalization non-U.S. companies.
Sector Breakdown
(% of equity Investments as of May 31, 2022)
Top Ten Holdings (% of Net Assets as of May 31, 2022)*
| | | | | |
Occidental Petroleum Corp. – Warrant | | | | 11.48% | |
Cenovus Energy, Inc. – Warrant | | | | 9.45% | |
MEG Energy Corp. | | | | 9.05% | |
West Fraser Timber Co. Ltd. | | | | 6.32% | |
Interfor Corp. | | | | 5.87% | |
Occidental Petroleum Corp. | | | | 4.69% | |
BAWAG Group AG | | | | 4.15% | |
Porsche Automobil Holding SE | | | | 3.96% | |
Volkswagen AG | | | | 3.95% | |
Assicurazioni Generali SpA | | | | 3.37% | |
| * | Does not Include Short-Term Investments |
Fund holdings are subject to change at any time and should not be considered recommendations to buy or sell any security. Current and future portfolio holdings are subject to risk.
Continued
10
SMEAD FUNDS
Investment Highlights (Continued)
(Unaudited)
Average Annual Total Returns for the period ended May 31, 2022
| | | | | | | | | | | | | | | | | | | | | | | | | |
| | | Inception
Date | | 1 Year | | 5 Years | | 10 Years | | Since
Inception |
Smead Value Fund –
Investor Class | | | | 1/2/2008 | | | | | 10.66% | | | | | 14.93% | | | | | 15.45% | | | | | 10.11% | |
| | | | | |
Smead Value Fund – Class A | | | | 1/27/2014 | | | | | 10.66% | | | | | 14.96% | | | | | N/A | | | | | 12.29% | |
| | | | | |
Smead Value Fund – Class C | | | | 4/16/2020 | | | | | 10.04% | | | | | N/A | | | | | N/A | | | | | 36.34% | |
| | | | | |
Smead Value Fund – Class I1 | | | | 12/18/2009 | | | | | 10.96% | | | | | 15.24% | | | | | 15.75% | | | | | 14.75% | |
| | | | | |
Smead Value Fund – Class R1 | | | | 11/25/2014 | | | | | 10.50% | | | | | 14.65% | | | | | N/A | | | | | 11.38% | |
| | | | | |
Smead Value Fund – Class R2 | | | | 11/25/2014 | | | | | 10.53% | | | | | 15.44% | | | | | N/A | | | | | 11.93% | |
| | | | | |
Smead Value Fund – Class Y | | | | 11/25/2014 | | | | | 11.05% | | | | | 15.39% | | | | | N/A | | | | | 12.12% | |
| | | | | |
S&P 500® Index (Total Return) | | | | | | | | | (0.30)% | | | | | 13.38% | | | | | 14.40% | | | | | 9.66% | |
| | | | | |
Russell 1000® Value Index
(Total Return) | | | | | | | | | 0.93% | | | | | 9.50% | | | | | 12.06% | | | | | 7.49% | |
Average Annual Total Returns for the period ended May 31, 2022
| | | | | | | | | | | | | | | | |
| | | Inception
Date | | 1 Year | | 5 Years | | 10 Years | | Since
Inception |
| | | | | |
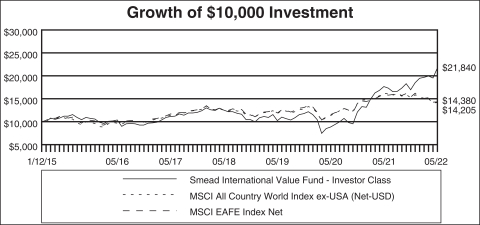
Smead International Value Fund – Investor Class | | | | 1/12/2015 | | | 23.17% | | 14.40% | | N/A | | | | 11.16% | |
| | | | | |
Smead International Value Fund – Class A | | | | 1/12/2015 | | | 23.00% | | 14.25% | | N/A | | | | 11.00% | |
| | | | | |
Smead International Value Fund –Class C | | | | 1/12/2015 | | | 22.26% | | 13.58% | | N/A | | | | 10.34% | |
| | | | | |
Smead International Value Fund –Class I1 | | | | 1/12/2015 | | | 23.29% | | 14.55% | | N/A | | | | 11.30% | |
| | | | | |
Smead International Value Fund –Class Y | | | | 1/12/2015 | | | 23.45% | | 14.71% | | N/A | | | | 11.43% | |
| | | | | |
MSCI All Country World Index ex-USA (Net-USD) | | | | | | | (12.41)% | | 4.42% | | 6.39% | | | | 4.87% | |
| | | | | |
MSCI EAFE Index Net | | | | | | | (10.38)% | | 4.17% | | 7.15% | | | | 5.04% | |
As on January 12, 2022 (date of the Reorganization), the Smead International Value Fund succeeded to substantially all the assets and liabilities of the Smead International Value Fund, L.P. (Predecessor Fund). Smead Private Fund Advisers, LLC, an affiliate of Smead Capital Management, Inc., the investment adviser to the Fund (the “Adviser”), served as the General Partner for the Predecessor Fund since its inception on January 12, 2015.
Performance data quoted represents past performance and does not guarantee future results. The investment return and principal value of an investment will fluctuate so that an investor’s shares, when redeemed, may be worth more or less
Continued
11
SMEAD FUNDS
Investment Highlights (Continued)
(Unaudited)
than their original cost. Current performance of the Funds may be lower or higher than the performance quoted. Performance data current to the most recent month end may be obtained by calling 877-807-4122.
Investment performance for the Smead International Value Fund reflects fee waivers in effect. In the absence of such waivers, total returns would be reduced.
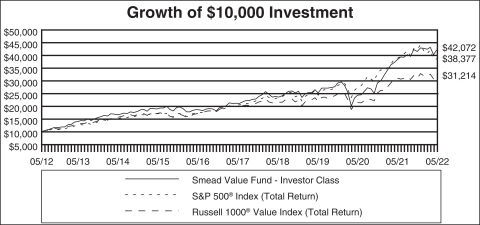
The returns shown assume reinvestment of Fund distributions and do not reflect the deduction of taxes that a shareholder would pay on Fund distributions or the redemption of Fund shares. The following graphs illustrate performance of hypothetical investments made in the Funds and broad-based securities indices on the Funds’ inception dates. The graphs do not reflect any future performance.
The S&P 500® Index is a broad based unmanaged index of 500 stocks, which is widely recognized as representative of the equity market in general.
Standard & Poor’s®, S&P®, S&P 500® and Standard & Poor’s 500® are trade names or trademarks of Standard & Poor’s Financial Services, LLC.
The Russell 1000® Value Index measures the performance of those Russell 1000® companies with lower price-to-book ratios and lower forecasted growth values.
Frank Russell Company is the source and owner of the trademarks, service marks and copyrights related to the Russell Indexes. Russell® is a trademark of Russell Investment Group.
The MSCI EAFE Index is designed to represent the performance of large and mid-cap securities across 21 developed markets, including countries in Europe, Australasia and the Far East, excluding the U.S. and Canada. It covers approximately 85% of the free float-adjusted market capitalization in each country.
The MSCI World ex - USA All Cap Index captures large, mid, small and micro cap representation across 22 of 23 Developed Markets (DM) countries* (excluding the United States). With 8,723 constituents, the index covers approximately 99% of the free float adjusted market capitalization in each country.
One cannot invest directly in an index.
Continued
12
SMEAD FUNDS
Investment Highlights (Continued)
(Unaudited)
Continued
13
SMEAD VALUE FUND
|
| Schedule of Investments |
|
| May 31, 2022 (Unaudited) |
| | | | | | | | | | |
| | | Shares | | Value |
COMMON STOCKS 93.70% | | | | | | | | | | |
| | |
Banks 7.15% | | | | | | | | | | |
Bank of America Corp. | | | | 3,975,607 | | | | $ | 147,892,581 | |
JPMorgan Chase & Co. | | | | 1,066,266 | | | | | 140,992,353 | |
| | | | | | | | | | |
| | | | | | | | | 288,884,934 | |
| | | | | | | | | | |
| | |
Consumer Durables & Apparel 12.44% | | | | | | | | | | |
DR Horton, Inc. | | | | 2,051,028 | | | | | 154,134,754 | |
Lennar Corp. – Class A | | | | 2,124,401 | | | | | 170,483,180 | |
NVR, Inc. (a) | | | | 40,084 | | | | | 178,398,652 | |
| | | | | | | | | | |
| | | | | | | | | 503,016,586 | |
| | | | | | | | | | |
| | |
Diversified Financials 8.92% | | | | | | | | | | |
American Express Co. | | | | 1,368,540 | | | | | 231,036,923 | |
Berkshire Hathaway, Inc. – Class B (a) | | | | 143,985 | | | | | 45,496,380 | |
Credit Acceptance Corp. (a) | | | | 141,213 | | | | | 84,065,511 | |
| | | | | | | | | | |
| | | | | | | | | 360,598,814 | |
| | | | | | | | | | |
| | |
Energy 8.36% | | | | | | | | | | |
Occidental Petroleum Corp. | | | | 4,875,905 | | | | | 337,948,976 | |
| | | | | | | | | | |
|
Materials 17.68% | |
Chevron Corp. | | | | 665,555 | | | | | 116,245,836 | |
ConocoPhillips | | | | 1,584,126 | | | | | 177,992,397 | |
Continental Resources, Inc. | | | | 6,175,812 | | | | | 420,387,523 | |
| | | | | | | | | | |
| | | | | | | | | 714,625,756 | |
| | | | | | | | | | |
|
Media & Entertainment 4.54% | |
Comcast Corp. – Class A | | | | 1,003,959 | | | | | 44,455,304 | |
Warner Bros Discovery, Inc. (a) | | | | 7,526,026 | | | | | 138,855,180 | |
| | | | | | | | | | |
| | | | | | | | | 183,310,484 | |
| | | | | | | | | | |
|
Pharmaceuticals, Biotechnology & Life Sciences 13.17% | |
Amgen, Inc. | | | | 871,428 | | | | | 223,730,425 | |
Merck & Co., Inc. | | | | 2,273,813 | | | | | 209,259,010 | |
Organon & Co. | | | | 1,097,596 | | | | | 41,664,744 | |
Pfizer, Inc. | | | | 1,086,178 | | | | | 57,610,881 | |
| | | | | | | | | | |
| | | | | | | | | 532,265,060 | |
| | | | | | | | | | |
|
Real Estate 7.93% | |
Macerich Co. (The) – REIT | | | | 12,182,311 | | | | | 143,142,154 | |
Simon Property Group, Inc. – REIT | | | | 1,546,299 | | | | | 177,283,181 | |
| | | | | | | | | | |
| | | | | | | | | 320,425,335 | |
| | | | | | | | | | |
The accompanying notes are an integral part of these financial statements.
14
SMEAD VALUE FUND
|
| Schedule of Investments (Continued) |
|
| May 31, 2022 (Unaudited) |
| | | | | | | | | | |
| | | Shares | | Value |
|
Retailing 9.55% | |
eBay, Inc. | | | | 2,516,063 | | | | $ | 122,456,786 | |
Home Depot, Inc. | | | | 350,182 | | | | | 106,017,601 | |
Target Corp. | | | | 974,432 | | | | | 157,741,052 | |
| | | | | | | | | | |
| | | | | | | | | 386,215,439 | |
| | | | | | | | | | |
|
Semiconductors & Semiconductor Equipment 2.05% | |
Qualcomm, Inc. | | | | 578,344 | | | | | 82,830,428 | |
| | | | | | | | | | |
|
Transportation 1.91% | |
AMERCO | | | | 157,843 | | | | | 77,339,913 | |
| | | | | | | | | | |
TOTAL COMMON STOCKS (Cost $3,060,811,908) | | | | | | | | | 3,787,461,725 | |
| | | | | | | | | | |
| | |
SHORT-TERM INVESTMENTS 5.68% | | | | | | | | | | |
| | |
Money Market Fund 5.68% | | | | | | | | | | |
State Street Institutional U.S. Government Money Market – Premier Class 0.06% (b) | | | | 229,734,693 | | | | | 229,734,693 | |
| | | | | | | | | | |
TOTAL SHORT-TERM INVESTMENTS (Cost $229,734,693) | | | | | | | | | 229,734,693 | |
| | | | | | | | | | |
TOTAL INVESTMENTS (Cost $3,290,546,601) 99.38% | | | | | | | | | 4,017,196,418 | |
Other Assets in Excess of Liabilities 0.62% | | | | | | | | | 24,912,953 | |
| | | | | | | | | | |
TOTAL NET ASSETS 100.00% | | | | | | | | $ | 4,042,109,371 | |
| | | | | | | | | | |
| (a) | Non-income producing security. |
| (b) | The rate shown is the 1-month performance for the month ended May 31, 2022. |
REIT – Real Estate Investment Trust
The Global Industry Classification Standard (GICS®) was developed by and/or is the exclusive property of MSCI, Inc. and Standard & Poor Financial Services LLC (“S&P”). GICS® is a service mark of MSCI and S&P and has been licensed for use by Smead Capital Management, Inc.
The accompanying notes are an integral part of these financial statements.
15
SMEAD INTERNATIONAL VALUE FUND
|
| Schedule of Investments |
|
| May 31, 2022 (Unaudited) |
| | | | | | | | | | |
| | | Shares | | Value |
COMMON STOCKS 82.03% | | | | | | | | | | |
| | |
Austria 4.15% | | | | | | | | | | |
Financials 4.15% | | | | | | | | | | |
BAWAG Group AG (a) | | | | 56,962 | | | | $ | 2,906,332 | |
| | | | | | | | | | |
| | |
Canada 31.63% | | | | | | | | | | |
Consumer Staples 0.94% | | | | | | | | | | |
Alimentation Couche-Tard, Inc. | | | | 14,473 | | | | | 657,598 | |
| | | | | | | | | | |
| | |
Energy 18.51% | | | | | | | | | | |
Cenovus Energy, Inc. | | | | 285,688 | | | | | 6,622,424 | |
MEG Energy Corp. (b) | | | | 363,512 | | | | | 6,342,815 | |
| | | | | | | | | | |
| | | | | | | | | 12,965,239 | |
| | | | | | | | | | |
| | |
Materials 12.18% | | | | | | | | | | |
Interfor Corp. (b) | | | | 154,313 | | | | | 4,108,995 | |
West Fraser Timber Co. Ltd. | | | | 47,958 | | | | | 4,424,792 | |
| | | | | | | | | | |
| | | | | | | | | 8,533,787 | |
| | | | | | | | | | |
| | | | | | | | | 22,156,624 | |
| | | | | | | | | | |
| | |
Denmark 2.31% | | | | | | | | | | |
Consumer Discretionary 2.31% | | | | | | | | | | |
Pandora AS | | | | 19,960 | | | | | 1,616,279 | |
| | | | | | | | | | |
| | |
France 1.86% | | | | | | | | | | |
Financials 1.86% | | | | | | | | | | |
BNP Paribas SA | | | | 22,787 | | | | | 1,303,329 | |
| | | | | | | | | | |
| | |
Germany 9.38% | | | | | | | | | | |
Consumer Discretionary 9.38% | | | | | | | | | | |
Bayerische Motoren Werke AG | | | | 11,821 | | | | | 1,023,643 | |
Porsche Automobil Holding SE – (Preference Shares) | | | | 33,949 | | | | | 2,776,418 | |
Volkswagen AG – (Preference Shares) | | | | 16,666 | | | | | 2,769,134 | |
| | | | | | | | | | |
| | | | | | | | | 6,569,195 | |
| | | | | | | | | | |
| | |
Italy 7.74% | | | | | | | | | | |
Financials 7.74% | | | | | | | | | | |
Assicurazioni Generali SpA | | | | 129,492 | | | | | 2,358,293 | |
Banco BPM SpA | | | | 292,983 | | | | | 1,022,833 | |
Intesa Sanpaolo SpA | | | | 541,883 | | | | | 1,183,478 | |
Mediobanca Banca di Credito Finanziario SpA | | | | 83,598 | | | | | 858,685 | |
| | | | | | | | | | |
| | | | | | | | | 5,423,289 | |
| | | | | | | | | | |
| | |
Netherlands 2.01% | | | | | | | | | | |
Financials 0.82% | | | | | | | | | | |
EXOR NV | | | | 7,751 | | | | | 572,635 | |
| | | | | | | | | | |
The accompanying notes are an integral part of these financial statements.
16
SMEAD INTERNATIONAL VALUE FUND
|
| Schedule of Investments (Continued) |
|
| May 31, 2022 (Unaudited) |
| | | | | | | | | | |
| | | Shares | | Value |
| | |
Telecommunication Services 1.19% | | | | | | | | | | |
Universal Music Group NV | | | | 37,257 | | | | $ | 836,701 | |
| | | | | | | | | | |
| | | | | | | | | 1,409,336 | |
| | | | | | | | | | |
| | |
Spain 1.97% | | | | | | | | | | |
Financials 1.97% | | | | | | | | | | |
Bankinter SA | | | | 217,042 | | | | | 1,380,469 | |
| | | | | | | | | | |
| | |
Switzerland 2.44% | | | | | | | | | | |
Industrials 2.44% | | | | | | | | | | |
IWG PLC (b) | | | | 540,213 | | | | | 1,711,976 | |
| | | | | | | | | | |
| | |
United Kingdom 13.85% | | | | | | | | | | |
Consumer Discretionary 7.81% | | | | | | | | | | |
Bellway PLC | | | | 30,644 | | | | | 903,019 | |
Berkeley Group Holdings PLC | | | | 21,217 | | | | | 1,123,781 | |
Next PLC | | | | 13,550 | | | | | 1,109,961 | |
Persimmon PLC | | | | 39,839 | | | | | 1,093,862 | |
WH Smith PLC (b) | | | | 61,798 | | | | | 1,242,943 | |
| | | | | | | | | | |
| | | | | | | | | 5,473,566 | |
| | | | | | | | | | |
| | |
Financials 3.24% | | | | | | | | | | |
Barclays PLC | | | | 585,613 | | | | | 1,248,165 | |
Lloyds Banking Group PLC | | | | 1,789,963 | | | | | 1,018,966 | |
| | | | | | | | | | |
| | | | | | | | | 2,267,131 | |
| | | | | | | | | | |
| | |
Telecommunication Services 2.80% | | | | | | | | | | |
Liberty Global PLC – Class C (b) | | | | 77,239 | | | | | 1,962,643 | |
| | | | | | | | | | |
| | | | | | | | | 9,703,340 | |
| | | | | | | | | | |
| | |
United States 4.69% | | | | | | | | | | |
Energy 4.69% | | | | | | | | | | |
Occidental Petroleum Corp. | | | | 47,387 | | | | | 3,284,393 | |
| | | | | | | | | | |
TOTAL COMMON STOCKS (Cost $55,439,348) | | | | | | | | | 57,464,562 | |
| | | | | | | | | | |
| | |
WARRANTS 12.70% | | | | | | | | | | |
| | |
Canada 1.22% | | | | | | | | | | |
Energy 1.22% | | | | | | | | | | |
Cenovus Energy, Inc. Expiration date 1/1/2026 (b) | | | | 47,223 | | | | | 851,982 | |
| | | | | | | | | | |
| | |
United States 11.48% | | | | | | | | | | |
Energy 11.48% | | | | | | | | | | |
Occidental Petroleum Corp. Expiration date 8/3/2027 (b) | | | | 169,860 | | | | | 8,042,871 | |
| | | | | | | | | | |
TOTAL WARRANTS (Cost $2,557,906) | | | | | | | | | 8,894,853 | |
| | | | | | | | | | |
The accompanying notes are an integral part of these financial statements.
17
SMEAD INTERNATIONAL VALUE FUND
|
| Schedule of Investments (Continued) |
|
| May 31, 2022 (Unaudited) |
| | | | | | | | | | |
| | | Shares | | Value |
| | |
SHORT-TERM INVESTMENTS 5.21% | | | | | | | | | | |
| | |
Money Market Fund 5.21% | | | | | | | | | | |
State Street Institutional U.S. Government Money Market – Premier Class 0.06% (c) | | | | 3,651,275 | | | | $ | 3,651,275 | |
| | | | | | | | | | |
TOTAL SHORT-TERM INVESTMENTS (Cost $3,651,275) | | | | | | | | | 3,651,275 | |
| | | | | | | | | | |
TOTAL INVESTMENTS (Cost $61,648,529) 99.94% | | | | | | | | | 70,010,690 | |
Other Assets in Excess of Liabilities 0.06% | | | | | | | | | 44,414 | |
| | | | | | | | | | |
TOTAL NET ASSETS 100.00% | | | | | | | | $ | 70,055,104 | |
| | | | | | | | | | |
| (a) | Security exempt from registration under Rule 144A of the Securities Act of 1933. This security may be resold in transactions exempt from registration, normally to qualified institutional buyers. At May 31, 2022, the value of this security totaled $2,906,332 or 4.15% of net assets. |
| (b) | Non-income producing security. |
| (c) | The rate shown is the 1-month performance for the month ended May 31, 2022. |
The Global Industry Classification Standard (GICS®) was developed by and/or is the exclusive property of MSCI, Inc. and Standard & Poor Financial Services LLC (“S&P”). GICS® is a service mark of MSCI and S&P and has been licensed for use by Smead Capital Management, Inc.
The accompanying notes are an integral part of these financial statements.
18
SMEAD VALUE FUND
|
| Statement of Assets and Liabilities |
|
| May 31, 2022 (Unaudited) |
| | | | | |
Assets | | | | | |
Investments, at value (cost $3,290,546,601) | | | $ | 4,017,196,418 | |
Receivable for Fund shares sold | | | | 6,846,677 | |
Dividends and interest receivable | | | | 7,423,294 | |
Receivable for investments sold | | | | 17,080,674 | |
| | | | | |
Total Assets | | | | 4,048,547,063 | |
| | | | | |
| |
Liabilities | | | | | |
Payable for Fund shares redeemed | | | | 1,703,626 | |
Payable to Adviser | | | | 2,455,170 | |
Payable to Administrator | | | | 220,868 | |
Payable for distribution fees | | | | 121,531 | |
Payable for shareholder servicing fees | | | | 1,659,934 | |
Accrued expenses and other liabilities | | | | 276,563 | |
| | | | | |
Total Liabilities | | | | 6,437,692 | |
| | | | | |
Net Assets | | | $ | 4,042,109,371 | |
| | | | | |
| |
Net Assets Consist Of: | | | | | |
Paid-in capital | | | $ | 3,178,222,292 | |
Total distributable earnings (loss) | | | | 863,887,079 | |
| | | | | |
Net Assets | | | $ | 4,042,109,371 | |
| | | | | |
| |
Investor Class Shares | | | | | |
Net assets | | | | 106,729,240 | |
Shares of beneficial interest outstanding (unlimited number of shares authorized, $0.001 par value) | | | | 1,562,536 | |
Net asset value, offering price and redemption price per share | | | $ | 68.31 | |
| | | | | |
| |
Class A Shares | | | | | |
Net assets | | | | 408,034,111 | |
Shares of beneficial interest outstanding (unlimited number of shares authorized, $0.001 par value) | | | | 6,027,715 | |
Net asset value, offering price and redemption price per share(1) | | | $ | 67.69 | |
| | | | | |
Maximum offering price per share (67.69/0.9425)(2) | | | $ | 71.82 | |
| | | | | |
Class C Shares | | | | | |
Net assets | | | | 31,601,117 | |
Shares of beneficial interest outstanding (unlimited number of shares authorized, $0.001 par value) | | | | 477,184 | |
Net asset value, offering price and redemption price per share(1) | | | $ | 66.22 | |
| | | | | |
The accompanying notes are an integral part of these financial statements.
19
SMEAD VALUE FUND
|
| Statement of Assets and Liabilities (Continued) |
|
| May 31, 2022 (Unaudited) |
| | | | | |
Class I1 Shares | | | | | |
Net assets | | | | 3,126,740,764 | |
Shares of beneficial interest outstanding (unlimited number of shares authorized, $0.001 par value) | | | | 45,762,659 | |
Net asset value, offering price and redemption price per share | | | $ | 68.33 | |
| | | | | |
| |
Class R1 Shares | | | | | |
Net assets | | | | 174,299 | |
Shares of beneficial interest outstanding (unlimited number of shares authorized, $0.001 par value) | | | | 2,595 | |
Net asset value, offering price and redemption price per share | | | $ | 67.17 | |
| | | | | |
| |
Class R2 Shares | | | | | |
Net assets | | | | 60,902 | |
Shares of beneficial interest outstanding (unlimited number of shares authorized, $0.001 par value) | | | | 878 | |
Net asset value, offering price and redemption price per share | | | $ | 69.36 | (3) |
| | | | | |
| |
Class Y Shares | | | | | |
Net assets | | | | 368,768,938 | |
Shares of beneficial interest outstanding (unlimited number of shares authorized, $0.001 par value) | | | | 5,387,700 | |
Net asset value, offering price and redemption price per share | | | $ | 68.45 | |
| | | | | |
| (1) | A contingent deferred sales charge (“CDSC”) of 1.00% may be charged on shares redeemed within eighteen months of purchase for Class A shares and twelve months of purchase for Class C shares. Redemption price per share is equal to net asset value less any redemption or CDSC fees. |
| (2) | Reflects a maximum sales charge of 5.75%. |
| (3) | Calculated NAV may not equal actual NAV shown due to rounding of the net assets and shares. |
The accompanying notes are an integral part of these financial statements.
20
SMEAD INTERNATIONAL VALUE FUND
|
| Statement of Assets and Liabilities |
|
| May 31, 2022 (Unaudited) |
| | | | | |
Assets | | | | | |
Investments, at value (cost $61,648,529) | | | $ | 70,010,690 | |
Receivable for Fund shares sold | | | | 57,376 | |
Dividends and interest receivable | | | | 27,097 | |
Due from Adviser | | | | 4,470 | |
Other assets | | | | 140,676 | |
| | | | | |
Total Assets | | | | 70,240,309 | |
| | | | | |
| |
Liabilities | | | | | |
Payable for Fund shares redeemed | | | | 110,749 | |
Payable to Adviser | | | | 40,672 | |
Payable to Administrator | | | | 4,241 | |
Payable for distribution fees | | | | 562 | |
Payable for shareholder servicing fees | | | | 12,373 | |
Accrued expenses and other liabilities | | | | 16,608 | |
| | | | | |
Total Liabilities | | | | 185,205 | |
| | | | | |
Net Assets | | | $ | 70,055,104 | |
| | | | | |
| |
Net Assets Consist Of: | | | | | |
Paid-in capital | | | $ | 60,958,508 | |
Total distributable earnings (loss) | | | | 9,096,596 | |
| | | | | |
Net Assets | | | $ | 70,055,104 | |
| | | | | |
| |
Investor Class Shares | | | | | |
Net assets | | | | 5,534 | |
Shares of beneficial interest outstanding (unlimited number of shares authorized, $0.001 par value) | | | | 101 | |
Net asset value, offering price and redemption price per share | | | $ | 54.79 | (1) |
| | | | | |
| |
Class A Shares | | | | | |
Net assets | | | | 3,033,037 | |
Shares of beneficial interest outstanding (unlimited number of shares authorized, $0.001 par value) | | | | 56,162 | |
Net asset value, offering price and redemption price per share(2) | | | $ | 54.01 | |
| | | | | |
Maximum offering price per share (54.01/0.9425)(3) | | | $ | 57.31 | |
| | | | | |
| |
Class C Shares | | | | | |
Net assets | | | | 75,982 | |
Shares of beneficial interest outstanding (unlimited number of shares authorized, $0.001 par value) | | | | 1,470 | |
Net asset value, offering price and redemption price per share(2) | | | $ | 51.69 | |
| | | | | |
The accompanying notes are an integral part of these financial statements.
21
SMEAD INTERNATIONAL VALUE FUND
|
| Statement of Assets and Liabilities (Continued) |
|
| May 31, 2022 (Unaudited) |
| | | | | |
Class I1 Shares | | | | | |
Net assets | | | | 39,580,529 | |
Shares of beneficial interest outstanding (unlimited number of shares authorized, $0.001 par value) | | | | 718,160 | |
Net asset value, offering price and redemption price per share | | | $ | 55.11 | |
| | | | | |
| |
Class Y Shares | | | | | |
Net assets | | | | 27,360,022 | |
Shares of beneficial interest outstanding (unlimited number of shares authorized, $0.001 par value) | | | | 492,178 | |
Net asset value, offering price and redemption price per share | | | $ | 55.59 | |
| | | | | |
| (1) | Calculated NAV may not equal actual NAV shown due to rounding of the net assets and shares. |
| (2) | A contingent deferred sales charge (“CDSC”) of 1.00% may be charged on shares redeemed within eighteen months of purchase for Class A shares and twelve months of purchase for Class C shares. Redemption price per share is equal to net asset value less any redemption or CDSC fees. |
| (3) | Reflects a maximum sales charge of 5.75%. |
The accompanying notes are an integral part of these financial statements.
22
SMEAD VALUE FUND
|
| Statement of Operations |
|
| May 31, 2022 (Unaudited) |
| | | | | |
Investment Income | | | | | |
Dividend income | | | $ | 35,305,002 | |
Interest income | | | | 211,220 | |
| | | | | |
Total Investment Income | | | | 35,516,222 | |
| | | | | |
| |
Expenses | | | | | |
Management fees | | | | 13,655,991 | |
Distribution fees – Investor Class | | | | 137,464 | |
Distribution fees – Class A | | | | 425,254 | |
Distribution fees – Class C | | | | 91,670 | |
Distribution fees – Class R1 | | | | 436 | |
Distribution fees – Class R2 | | | | 272 | |
Shareholder servicing fees – Investor Class | | | | 93,475 | |
Shareholder servicing fees – Class A | | | | 289,178 | |
Shareholder servicing fees – Class C | | | | 30,557 | |
Shareholder servicing fees – Class I1 | | | | 2,154,060 | |
Shareholder servicing fees – Class R1 | | | | 218 | |
Shareholder servicing fees – Class R2 | | | | 54 | |
Administration fees | | | | 310,520 | |
Transfer agent fees and expenses | | | | 205,040 | |
Fund accounting fees | | | | 244,410 | |
Federal and state registration fees | | | | 176,088 | |
Custody fees | | | | 68,558 | |
Reports to shareholders | | | | 38,035 | |
Legal fees | | | | 50,479 | |
Audit and tax fees | | | | 10,727 | |
Trustees’ fees | | | | 64,822 | |
Recoupment of previously reimbursed expenses | | | | 17,704 | |
Other expenses | | | | 20,069 | |
| | | | | |
Total Expenses | | | | 18,085,081 | |
| | | | | |
| |
Net Investment Income | | | | 17,431,141 | |
| | | | | |
| |
Realized and Unrealized Gain on Investments | | | | | |
Net realized gain from investments | | | | 144,329,958 | |
Change in net unrealized depreciation on investments | | | | (104,899,785 | ) |
| | | | | |
Net Realized and Unrealized Gain on Investments | | | | 39,430,173 | |
| | | | | |
Net Increase in Net Assets from Operations | | | $ | 56,861,314 | |
| | | | | |
The accompanying notes are an integral part of these financial statements.
23
SMEAD INTERNATIONAL VALUE FUND
|
| Statement of Operations |
|
| May 31, 2022 (Unaudited) |
| | | | | |
Investment Income | | | | | |
Dividend income | | | $ | 834,749 | |
Interest income | | | | 2,976 | |
| | | | | |
Total Investment Income | | | | 837,725 | |
| | | | | |
| |
Expenses | | | | | |
Management fees | | | | 158,874 | |
Distribution fees – Investor Class | | | | 5 | |
Distribution fees – Class A | | | | 1,938 | |
Distribution fees – Class C | | | | 47 | |
Shareholder servicing fees – Class A | | | | 1,299 | |
Shareholder servicing fees – Class C | | | | 16 | |
Shareholder servicing fees – Class I1 | | | | 18,831 | |
Administration fees | | | | 4,241 | |
Fund accounting fees | | | | 3,711 | |
Federal and state registration fees | | | | 650 | |
Custody fees | | | | 2,839 | |
Reports to shareholders | | | | 1,290 | |
Legal fees | | | | 19,899 | |
Audit and tax fees | | | | 9,179 | |
Trustees’ fees | | | | 563 | |
Other expenses | | | | 1,399 | |
| | | | | |
Total Expenses | | | | 224,781 | |
| | | | | |
| |
Net Investment Income | | | | 612,944 | |
| | | | | |
| |
Realized and Unrealized Gain on Investments | | | | | |
Net realized gain from investments | | | | 118,722 | |
Foreign currency transactions | | | | 1,197 | |
Change in net unrealized appreciation on investments | | | | 8,362,161 | |
Change in net unrealized appreciation on foreign currency | | | | 1,571 | |
| | | | | |
Net Realized and Unrealized Gain on Investments | | | | 8,483,651 | |
| | | | | |
Net Increase in Net Assets from Operations | | | $ | 9,096,595 | |
| | | | | |
The accompanying notes are an integral part of these financial statements.
24
SMEAD VALUE FUND
|
| Statements of Changes in Net Assets |
| | | | | | | | | | |
| | | Six Months Ended
May 31, 2022
(Unaudited) | | Year Ended
November 30, 2021 |
From Operations | | | | | | |
Net investment income | | | $ | 17,431,141 | | | | $ | 10,512,671 | |
Net realized gain from investments | | | | 144,329,958 | | | | | 119,504,783 | |
Change in net unrealized appreciation (depreciation) on investments | | | | (104,899,785 | ) | | | | 472,600,790 | |
| | | | | | | | | | |
Net increase in net assets from operations | | | | 56,861,314 | | | | | 602,618,244 | |
| | | | | | | | | | |
| | |
From Distributions | | | | | | | | | | |
Investor Class | | | | (4,255,078 | ) | | | | (1,127,357 | ) |
Class A | | | | (11,256,332 | ) | | | | (1,572,940 | ) |
Class C | | | | (682,470 | ) | | | | (4,407 | ) |
Class I1 | | | | (102,566,190 | ) | | | | (16,339,105 | ) |
Class R1 | | | | (6,379 | ) | | | | (3,380 | ) |
Class R2 | | | | (3,885 | ) | | | | (931 | ) |
Class Y | | | | (10,684,125 | ) | | | | (1,677,290 | ) |
| | | | | | | | | | |
Net Increase in net assets resulting from
distributions paid | | | | (129,454,459 | ) | | | | (20,725,410 | ) |
| | | | | | | | | | |
| | |
From Capital Share Transactions | | | | | | | | | | |
Proceeds from shares sold | | | | 1,469,522,993 | | | | | 1,661,638,625 | |
Issued in reinvestment of dividends
and distributions | | | | 88,737,359 | | | | | 11,207,979 | |
Payments for shares redeemed | | | | (504,845,717 | ) | | | | (419,159,099 | ) |
| | | | | | | | | | |
Net increase in net assets from
capital share transactions | | | | 1,053,414,635 | | | | | 1,253,687,505 | |
| | | | | | | | | | |
Total Increase in Net Assets | | | | 980,821,490 | | | | | 1,835,580,339 | |
| | | | | | | | | | |
| | |
Net Assets | | | | | | | | | | |
Beginning of year | | | | 3,061,287,881 | | | | | 1,225,707,542 | |
| | | | | | | | | | |
End of year | | | $ | 4,042,109,371 | | | | $ | 3,061,287,881 | |
| | | | | | | | | | |
The accompanying notes are an integral part of these financial statements.
25
SMEAD INTERNATIONAL VALUE FUND
|
| Statements of Changes in Net Assets |
| | | | | |
| | | Six Months Ended
May 31, 2022
(Unaudited) |
From Operations | |
Net investment income | | | $ | 612,944 | |
Net realized gain from investments and foreign currency | | | | 119,919 | |
Change in net unrealized appreciation on investments and foreign currency | | | | 8,363,732 | |
| | | | | |
Net increase in net assets from operations | | | | 9,096,595 | |
| | | | | |
| |
From Capital Share Transactions | | | | | |
Proceeds from shares sold | | | | 62,621,591 | |
Payments for shares redeemed | | | | (1,663,082 | ) |
| | | | | |
Net increase in net assets from capital share transactions | | | | 60,958,509 | |
| | | | | |
Total Increase in Net Assets | | | | 70,055,104 | |
| |
Net Assets | | | | | |
Beginning of period | | | | — | |
| | | | | |
End of period | | | $ | 70,055,104 | |
| | | | | |
The accompanying notes are an integral part of these financial statements.
26
(This Page Intentionally Left Blank.)
27
SMEAD VALUE FUND
| | | | |
| Financial Highlights |
|
| May 31, 2022 |
| | | | | | | | | | | | | | | | | | | | | | | | | | | | | | | | | | | |
| | | | |
Income from investment operations | | Less distributions paid |
| | | Net Asset
Value,
Beginning
of Period | | Net
investment
income(1) | | Net realized
and
unrealized
gain/(loss) on
investments | | Total from
investment
operations | | Distributions
from net
investment
income | | Distributions
from net
realized gain
on
investments | | Total
distributions
paid |
Investor Class | | | | | | | | | | | | | | | | | | | | | | | | | | | | | | | | | | | |
Six Months Ended
May 31, 2022 (Unaudited) | | | $ | 69.63 | | | | $ | 0.24 | | | | $ | 1.14 | | | | $ | 1.38 | | | | $ | (0.15 | ) | | | $ | (2.55 | ) | | | $ | (2.70 | ) |
November 30, 2021 | | | | 49.68 | | | | | 0.17 | | | | | 20.49 | | | | | 20.66 | | | | | (0.35 | ) | | | | (0.36 | ) | | | | (0.71 | ) |
November 30, 2020 | | | | 51.55 | | | | | 0.52 | | | | | (0.47 | ) | | | | 0.05 | | | | | (0.35 | ) | | | | (1.57 | ) | | | | (1.92 | ) |
November 30, 2019 | | | | 49.13 | | | | | 0.33 | | | | | 5.19 | | | | | 5.52 | | | | | — | | | | | (3.10 | ) | | | | (3.10 | ) |
November 30, 2018 | | | | 47.29 | | | | | 0.19 | | | | | 3.75 | | | | | 3.94 | | | | | (0.10 | ) | | | | (2.00 | ) | | | | (2.10 | ) |
November 30, 2017 | | | | 39.79 | | | | | 0.15 | | | | | 8.57 | | | | | 8.72 | | | | | (0.19 | ) | | | | (1.03 | ) | | | | (1.22 | ) |
| | | | | | | |
Class A | | | | | | | | | | | | | | | | | | | | | | | | | | | | | | | | | | | |
Six Months Ended
May 31, 2022 (Unaudited) | | | | 69.08 | | | | | 0.24 | | | | | 1.13 | | | | | 1.37 | | | | | (0.21 | ) | | | | (2.55 | ) | | | | (2.76 | ) |
November 30, 2021 | | | | 49.32 | | | | | 0.17 | | | | | 20.32 | | | | | 20.49 | | | | | (0.37 | ) | | | | (0.36 | ) | | | | (0.73 | ) |
November 30, 2020 | | | | 51.20 | | | | | 0.50 | | | | | (0.45 | ) | | | | 0.05 | | | | | (0.36 | ) | | | | (1.57 | ) | | | | (1.93 | ) |
November 30, 2019 | | | | 48.82 | | | | | 0.33 | | | | | 5.15 | | | | | 5.48 | | | | | — | | | | | (3.10 | ) | | | | (3.10 | ) |
November 30, 2018 | | | | 47.03 | | | | | 0.22 | | | | | 3.72 | | | | | 3.94 | | | | | (0.15 | ) | | | | (2.00 | ) | | | | (2.15 | ) |
November 30, 2017 | | | | 39.62 | | | | | 0.20 | | | | | 8.50 | | | | | 8.70 | | | | | (0.26 | ) | | | | (1.03 | ) | | | | (1.29 | ) |
| | | | | | | |
Class C | | | | | | | | | | | | | | | | | | | | | | | | | | | | | | | | | | | |
Six Months Ended
May 31, 2022 (Unaudited) | | | | 67.70 | | | | | 0.05 | | | | | 1.11 | | | | | 1.16 | | | | | (0.09 | ) | | | | (2.55 | ) | | | | (2.64 | ) |
November 30, 2021 | | | | 48.70 | | | | | (0.18 | ) | | | | 20.00 | | | | | 19.82 | | | | | (0.46 | ) | | | | (0.36 | ) | | | | (0.82 | ) |
November 30, 2020(7) | | | | 36.22 | | | | | 0.08 | | | | | 12.40 | (8) | | | | 12.48 | | | | | — | | | | | — | | | | | — | |
| | | | | | | |
Class I1 | | | | | | | | | | | | | | | | | | | | | | | | | | | | | | | | | | | |
Six Months Ended
May 31, 2022 (Unaudited) | | | | 69.74 | | | | | 0.34 | | | | | 1.14 | | | | | 1.48 | | | | | (0.34 | ) | | | | (2.55 | ) | | | | (2.89 | ) |
November 30, 2021 | | | | 49.78 | | | | | 0.34 | | | | | 20.47 | | | | | 20.81 | | | | | (0.49 | ) | | | | (0.36 | ) | | | | (0.85 | ) |
November 30, 2020 | | | | 51.65 | | | | | 0.62 | | | | | (0.43 | ) | | | | 0.19 | | | | | (0.49 | ) | | | | (1.57 | ) | | | | (2.06 | ) |
November 30, 2019 | | | | 49.10 | | | | | 0.47 | | | | | 5.19 | | | | | 5.66 | | | | | (0.01 | ) | | | | (3.10 | ) | | | | (3.11 | ) |
November 30, 2018 | | | | 47.33 | | | | | 0.33 | | | | | 3.72 | | | | | 4.05 | | | | | (0.28 | ) | | | | (2.00 | ) | | | | (2.28 | ) |
November 30, 2017 | | | | 39.87 | | | | | 0.28 | | | | | 8.56 | | | | | 8.84 | | | | | (0.35 | ) | | | | (1.03 | ) | | | | (1.38 | ) |
| | | | | | | |
Class R1 | | | | | | | | | | | | | | | | | | | | | | | | | | | | | | | | | | | |
Six Months Ended
May 31, 2022 (Unaudited) | | | | 68.42 | | | | | 0.13 | | | | | 1.17 | | | | | 1.30 | | | | | — | | | | | (2.55 | ) | | | | (2.55 | ) |
November 30, 2021 | | | | 48.81 | | | | | (0.03 | ) | | | | 20.21 | | | | | 20.18 | | | | | (0.21 | ) | | | | (0.36 | ) | | | | (0.57 | ) |
November 30, 2020 | | | | 50.46 | | | | | 0.38 | | | | | (0.46 | ) | | | | (0.08 | ) | | | | — | | | | | (1.57 | ) | | | | (1.57 | ) |
November 30, 2019 | | | | 48.30 | | | | | 0.19 | | | | | 5.07 | | | | | 5.26 | | | | | — | | | | | (3.10 | ) | | | | (3.10 | ) |
November 30, 2018 | | | | 46.57 | | | | | 0.06 | | | | | 3.69 | | | | | 3.75 | | | | | (0.02 | ) | | | | (2.00 | ) | | | | (2.02 | ) |
November 30, 2017 | | | | 39.33 | | | | | 0.06 | | | | | 8.45 | | | | | 8.51 | | | | | (0.24 | ) | | | | (1.03 | ) | | | | (1.27 | ) |
The accompanying notes are an integral part of these financial statements.
28
| | | | | | | | | | | | | | | | | | | | | | | | | | | | | | | | | | | | | | |
| | | | | | | Ratio of expenses to
average net assets | | Ratio of net investment income
(loss) to average net assets | | |
Net Asset
Value,
End of
Period | | Total
Return(2)(3) | | Net
assets
at end of
period
(000’s) | | Before
waivers and
recoupment
of expenses(4) | | After
waivers and
recoupment
of expenses(4) | | Before
waivers and
recoupment
of expenses(4) | | After
waivers and
recoupments
of expenses(4) | | Portfolio
turnover
rate(3) |
| | | | | | | | | | | | | | | | | | | | | | | | | | | | | | | | | | | | | | | |
| |
|
$68.31 |
| | | | 2.02 | % | | | $ | 106,729 | | | | | 1.23 | % | | | | 1.23 | % | | | | 0.70 | % | | | | 0.70 | % | | | | 8.83 | % |
| | | 69.63 | | | | | 42.10 | % | | | | 109,938 | | | | | 1.19 | % | | | | 1.19 | % | | | | 0.27 | % | | | | 0.27 | % | | | | 17.40 | % |
| | | 49.68 | | | | | 0.09 | % | | | | 79,894 | | | | | 1.22 | % | | | | 1.22 | % | | | | 1.16 | % | | | | 1.16 | % | | | | 40.26 | % |
| | | 51.55 | | | | | 12.38 | % | | | | 117,805 | | | | | 1.24 | % | | | | 1.24 | % | | | | 0.71 | % | | | | 0.71 | % | | | | 20.75 | % |
| | | 49.13 | | | | | 8.65 | % | | | | 136,278 | | | | | 1.24 | % | | | | 1.26 | % | | | | 0.43 | % | | | | 0.41 | % | | | | 10.98 | % |
| | | 47.29 | | | | | 22.51 | % | | | | 155,602 | | | | | 1.25 | % | | | | 1.23 | %(5) | | | | 0.34 | % | | | | 0.36 | %(6) | | | | 20.04 | % |
| | | | | | | |
| | | | | | | | | | | | | | | | | | | | | | | | | | | | | | | | | | | | | | | |
| |
|
67.69 |
| | | | 2.01 | % | | | | 408,034 | | | | | 1.24 | % | | | | 1.24 | % | | | | 0.72 | % | | | | 0.72 | % | | | | 8.83 | % |
| | | 69.08 | | | | | 42.11 | % | | | | 274,607 | | | | | 1.20 | % | | | | 1.20 | % | | | | 0.27 | % | | | | 0.27 | % | | | | 17.40 | % |
| | | 49.32 | | | | | 0.08 | % | | | | 105,555 | | | | | 1.23 | % | | | | 1.23 | % | | | | 1.14 | % | | | | 1.14 | % | | | | 40.26 | % |
| | | 51.20 | | | | | 12.35 | % | | | | 119,181 | | | | | 1.24 | % | | | | 1.24 | % | | | | 0.72 | % | | | | 0.72 | % | | | | 20.75 | % |
| | | 48.82 | | | | | 8.80 | % | | | | 122,653 | | | | | 1.19 | % | | | | 1.19 | % | | | | 0.47 | % | | | | 0.47 | % | | | | 10.98 | % |
| | | 47.03 | | | | | 22.51 | % | | | | 163,989 | | | | | 1.18 | % | | | | 1.16 | %(5) | | | | 0.45 | % | | | | 0.46 | %(6) | | | | 20.04 | % |
| | | | | | | |
| | | | | | | | | | | | | | | | | | | | | | | | | | | | | | | | | | | | | | | |
| |
|
66.22 |
| | | | 1.75 | % | | | | 31,601 | | | | | 1.82 | % | | | | 1.82 | % | | | | 0.15 | % | | | | 0.15 | % | | | | 8.83 | % |
| | | 67.70 | | | | | 41.29 | % | | | | 16,544 | | | | | 1.76 | % | | | | 1.76 | % | | | | (0.27 | )% | | | | (0.27 | )% | | | | 17.40 | % |
| | | 48.70 | | | | | 34.46 | % | | | | 199 | | | | | 1.85 | % | | | | 1.84 | % | | | | 0.27 | % | | | | 0.28 | % | | | | 40.26 | % |
| | | | | | | |
| | | | | | | | | | | | | | | | | | | | | | | | | | | | | | | | | | | | | | | |
| |
|
68.33 |
| | | | 2.16 | % | | | | 3,126,741 | | | | | 0.96 | % | | | | 0.96 | % | | | | 0.99 | % | | | | 0.99 | % | | | | 8.83 | % |
| | | 69.74 | | | | | 42.43 | % | | | | 2,417,546 | | | | | 0.93 | % | | | | 0.93 | % | | | | 0.54 | % | | | | 0.54 | % | | | | 17.40 | % |
| | | 49.78 | | | | | 0.36 | % | | | | 947,872 | | | | | 0.97 | % | | | | 0.97 | % | | | | 1.40 | % | | | | 1.40 | % | | | | 40.26 | % |
| | | 51.65 | | | | | 12.67 | % | | | | 1,066,128 | | | | | 0.97 | % | | | | 0.97 | % | | | | 1.00 | % | | | | 1.00 | % | | | | 20.75 | % |
| | | 49.10 | | | | | 8.93 | % | | | | 963,978 | | | | | 0.97 | % | | | | 0.98 | % | | | | 0.72 | % | | | | 0.70 | % | | | | 10.98 | % |
| | | 47.33 | | | | | 22.86 | % | | | | 897,547 | | | | | 0.98 | % | | | | 0.96 | %(5) | | | | 0.65 | % | | | | 0.67 | %(6) | | | | 20.04 | % |
| | | | | | | |
| | | | | | | | | | | | | | | | | | | | | | | | | | | | | | | | | | | | | | | |
| |
|
67.17 |
| | | | 1.94 | % | | | | 174 | | | | | 1.56 | % | | | | 1.56 | % | | | | 0.37 | % | | | | 0.37 | % | | | | 8.83 | % |
| | | 68.42 | | | | | 41.75 | % | | | | 171 | | | | | 1.49 | % | | | | 1.49 | % | | | | (0.05 | )% | | | | (0.05 | )% | | | | 17.40 | % |
| | | 48.81 | | | | | (0.18 | )% | | | | 291 | | | | | 1.52 | % | | | | 1.52 | % | | | | 0.85 | % | | | | 0.85 | % | | | | 40.26 | % |
| | | 50.46 | | | | | 12.01 | % | | | | 872 | | | | | 1.55 | % | | | | 1.55 | % | | | | 0.43 | % | | | | 0.43 | % | | | | 20.75 | % |
| | | 48.30 | | | | | 8.47 | % | | | | 792 | | | | | 1.50 | % | | | | 1.50 | % | | | | 0.12 | % | | | | 0.12 | % | | | | 10.98 | % |
| | | 46.57 | | | | | 22.14 | % | | | | 1,779 | | | | | 1.49 | % | | | | 1.48 | %(5) | | | | 0.13 | % | | | | 0.15 | %(6) | | | | 20.04 | % |
29
SMEAD VALUE FUND
| | | | |
| Financial Highlights (Continued) |
|
| May 31, 2022 |
| | | | | | | | | | | | | | | | | | | | | | | | | | | | | | | | | | | |
| | | | |
Income from investment operations | | Less distributions paid |
| | | Net Asset
Value,
Beginning
of Period | | Net
investment
income(1) | | Net realized
and
unrealized
gain/(loss) on
investments | | Total from
investment
operations | | Distributions
from net
investment
income | | Distributions
from net
realized gain
on
investments | | Total
distributions
paid |
| | | | | | | |
Class R2 | | | | | | | | | | | | | | | | | | | | | | | | | | | | | | | | | | | |
Six Months Ended
May 31, 2022 (Unaudited) | | | $ | 70.62 | | | | $ | 0.18 | | | | $ | 1.23 | | | | $ | 1.41 | | | | $ | (0.12 | ) | | | $ | (2.55 | ) | | | $ | (2.67 | ) |
November 30, 2021 | | | | 50.43 | | | | | 0.08 | | | | | 20.75 | | | | | 20.83 | | | | | (0.28 | ) | | | | (0.36 | ) | | | | (0.64 | ) |
November 30, 2020 | | | | 52.43 | | | | | 0.41 | | | | | (0.45 | ) | | | | (0.04 | ) | | | | (0.39 | ) | | | | (1.57 | ) | | | | (1.96 | ) |
November 30, 2019 | | | | 50.01 | | | | | 0.32 | | | | | 5.20 | | | | | 5.52 | | | | | — | | | | | (3.10 | ) | | | | (3.10 | ) |
November 30, 2018 | | | | 46.73 | | | | | (0.16 | ) | | | | 5.49 | | | | | 5.33 | | | | | (0.05 | ) | | | | (2.00 | ) | | | | (2.05 | ) |
November 30, 2017 | | | | 39.40 | | | | | 0.08 | | | | | 8.47 | | | | | 8.55 | | | | | (0.19 | ) | | | | (1.03 | ) | | | | (1.22 | ) |
| | | | | | | |
Class Y | | | | | | | | | | | | | | | | | | | | | | | | | | | | | | | | | | | |
Six Months Ended
May 31, 2022 (Unaudited) | | | | 69.86 | | | | | 0.38 | | | | | 1.15 | | | | | 1.53 | | | | | (0.39 | ) | | | | (2.55 | ) | | | | (2.94 | ) |
November 30, 2021 | | | | 49.86 | | | | | 0.40 | | | | | 20.51 | | | | | 20.91 | | | | | (0.55 | ) | | | | (0.36 | ) | | | | (0.91 | ) |
November 30, 2020 | | | | 51.73 | | | | | 0.61 | | | | | (0.35 | ) | | | | 0.26 | | | | | (0.56 | ) | | | | (1.57 | ) | | | | (2.13 | ) |
November 30, 2019 | | | | 49.19 | | | | | 0.53 | | | | | 5.19 | | | | | 5.72 | | | | | (0.08 | ) | | | | (3.10 | ) | | | | (3.18 | ) |
November 30, 2018 | | | | 47.40 | | | | | 0.40 | | | | | 3.73 | | | | | 4.13 | | | | | (0.34 | ) | | | | (2.00 | ) | | | | (2.34 | ) |
November 30, 2017 | | | | 39.92 | | | | | 0.35 | | | | | 8.57 | | | | | 8.92 | | | | | (0.41 | ) | | | | (1.03 | ) | | | | (1.44 | ) |
| (1) | Based on average shares outstanding. |
| (2) | Total return in the above table represents the rate that the investor would have earned or lost on an investment in the Fund, assuming reinvestment of dividends. |
| (3) | Not annualized for periods of less than one year. |
| (4) | Annualized for periods of less than one year. |
| (5) | Includes a non-recurring reimbursement from service provider. Excluding this non-recurring reimbursement, the Ratio of expenses to average net assets after waivers and recoupment of expenses would have been 1.25%, 1.18%, 0.98%, 1.49%, 1.43% and 0.83%, respectively. |
| (6) | Includes a non-recurring reimbursement from service provider. Excluding this non-recurring reimbursement, the Ratio of net investment income to average net assets after waivers and recoupment of expenses would have been 0.34%, 0.45%, 0.65%, 0.13%, 0.18% and 0.80%, respectively. |
| (7) | Class C shares commenced operations on April 16, 2020. |
| (8) | The amount shown for a share outstanding throughout the year does not correspond with the change in aggregate gains and losses in the portfolio of securities during the year because of the timing of sales and purchases of fund shares in relation to fluctuating values during the year. |
The accompanying notes are an integral part of these financial statements.
30
| | | | | | | | | | | | | | | | | | | | | | | | | | | | | | | | | | | | | | |
| | | | | | | Ratio of expenses to
average net assets | | Ratio of net investment income
(loss) to average net assets | | |
Net Asset
Value,
End of
Period | | Total
Return(2)(3) | | Net assets
at end of
period
(000’s) | | Before
waivers and
recoupment
of expenses(4) | | After
waivers and
recoupment
of expenses(4) | | Before
waivers and
recoupment
of expenses(4) | | After
waivers and
recoupments
of expenses(4) | | Portfolio
turnover
rate(3) |
| | | | | | | | | | | | | | | | | | | | | | | | | | | | | | | | | | | | | | | |
| |
|
$69.36 |
| | | | 2.01 | % | | | | $61 | | | | | 1.40 | % | | | | 1.40 | % | | | | 0.52 | % | | | | 0.52 | % | | | | 8.83 | % |
| | | 70.62 | | | | | 41.78 | % | | | | 95 | | | | | 1.40 | % | | | | 1.40 | % | | | | 0.11 | % | | | | 0.11 | % | | | | 17.40 | % |
| | | 50.43 | | | | | (0.10 | )% | | | | 73 | | | | | 1.43 | % | | | | 1.43 | % | | | | 0.91 | % | | | | 0.91 | % | | | | 40.26 | % |
| | | 52.43 | | | | | 12.12 | % | | | | 74 | | | | | 1.44 | % | | | | 1.44 | % | | | | 0.66 | % | | | | 0.66 | % | | | | 20.75 | % |
| | | 50.01 | | | | | 11.88 | % | | | | 10 | | | | | 1.44 | % | | | | 1.49 | % | | | | (0.28 | )% | | | | (0.33 | )% | | | | 10.98 | % |
| | | 46.73 | | | | | 22.28 | % | | | | 1,263 | | | | | 1.43 | % | | | | 1.41 | %(5) | | | | 0.18 | % | | | | 0.20 | %(6) | | | | 20.04 | % |
| | | | | | | |
| | | | | | | | | | | | | | | | | | | | | | | | | | | | | | | | | | | | | | | |
| |
|
68.45 |
| | | | 2.21 | % | | | | 368,769 | | | | | 0.82 | % | | | | 0.83 | % | | | | 1.11 | % | | | | 1.10 | % | | | | 8.83 | % |
| | | 69.86 | | | | | 42.62 | % | | | | 242,387 | | | | | 0.84 | % | | | | 0.84 | % | | | | 0.63 | % | | | | 0.62 | % | | | | 17.40 | % |
| | | 49.86 | | | | | 0.48 | % | | | | 91,824 | | | | | 0.88 | % | | | | 0.84 | % | | | | 1.32 | % | | | | 1.36 | % | | | | 40.26 | % |
| | | 51.73 | | | | | 12.81 | % | | | | 15,443 | | | | | 0.86 | % | | | | 0.84 | % | | | | 1.12 | % | | | | 1.14 | % | | | | 20.75 | % |
| | | 49.19 | | | | | 9.11 | % | | | | 13,787 | | | | | 0.86 | % | | | | 0.84 | % | | | | 0.84 | % | | | | 0.86 | % | | | | 10.98 | % |
| | | 47.40 | | | | | 23.04 | % | | | | 12,934 | | | | | 0.83 | % | | | | 0.81 | %(5) | | | | 0.80 | % | | | | 0.82 | %(6) | | | | 20.04 | % |
31
SMEAD INTERNATIONAL VALUE FUND
| | | | |
| Financial Highlights |
|
| May 31, 2022 |
| | | | | | | | | | | | | | | | | | | | | | | | | | | | | | | | | | | |
| | | | | Income from investment operations | | | | | | |
| | | Net Asset
Value,
Beginning
of Period(1) | | Net
investment
income(2) | | Net realized
and
unrealized
gain/(loss) on
investments | | Total from
investment
operations | | Net Asset
Value,
End of
Period | | Total
Return(3)(4) | |
Net assets
at end of
period
(000’s) |
Investor Class | | | | | | | | | | |
Six Months Ended
May 31, 2022 (Unaudited) | | | $ | 49.33 | | | | $ | 0.47 | | | | $ | 4.99 | | | | $ | 5.46 | | | | $ | 54.79 | | | | | 10.68 | % | | | $ | 6 | |
| | | | | | | |
Class A | | | | | | | | | | | | | | | | | | | | | | | | | | | | | | | | | | | |
Six Months Ended
May 31, 2022 (Unaudited) | | | | 48.83 | | | | | 0.53 | | | | | 4.65 | | | | | 5.18 | | | | | 54.01 | | | | | 10.61 | % | | | | 3,033 | |
| | | | | | | |
Class C | | | | | | | | | | | | | | | | | | | | | | | | | | | | | | | | | | | |
Six Months Ended
May 31, 2022 (Unaudited) | | | | 46.84 | | | | | 0.81 | | | | | 4.04 | | | | | 4.85 | | | | | 51.69 | | | | | 10.35 | % | | | | 76 | |
| | | | | | | |
Class I1 | | | | | | | | | | | | | | | | | | | | | | | | | | | | | | | | | | | |
Six Months Ended
May 31, 2022 (Unaudited) | | | | 49.78 | | | | | 0.53 | | | | | 4.80 | | | | | 5.33 | | | | | 55.11 | | | | | 10.71 | % | | | | 39,580 | |
| | | | | | | |
Class Y | | | | | | | | | | | | | | | | | | | | | | | | | | | | | | | | | | | |
Six Months Ended May 31, 2022 (Unaudited) | | | | 50.18 | | | | | 0.60 | | | | | 4.81 | | | | | 5.41 | | | | | 55.59 | | | | | 10.78 | % | | | | 27,360 | |
| (1) | Period from January 12, 2022, date operations commenced, through May 31, 2022. |
| (2) | Based on average shares outstanding. |
| (3) | Total return in the above table represents the rate that the investor would have earned or lost on an investment in the Fund, assuming reinvestment of dividends. |
| (4) | Not annualized for periods of less than one year. |
| (5) | Annualized for periods of less than one year. |
The accompanying notes are an integral part of these financial statements.
32
| | | | | | | | | | | | | | | | | | | | | | | |
Ratio of expenses to
average net assets | | Ratio of net investment income
(loss) to average net assets | | |
Before
waivers and
recoupment
of expenses(5) | | After
waivers and
recoupment
of expenses(5) | | Before
waivers and
recoupment
of expenses(5) | | After
waivers and
recoupments
of expenses(5) | | Portfolio
turnover
rate(4) |
| | | | | | | | | | | | | | | | | | | | | | | | |
| |
|
1.16% |
| | | | 1.16 | % | | | | 2.44 | % | | | | 2.44 | % | | | | 3.87 | % |
| | | | |
| | | | | | | | | | | | | | | | | | | | | | | | |
| |
|
1.35% |
| | | | 1.35 | % | | | | 2.83 | % | | | | 2.83 | % | | | | 3.87 | % |
| | | | |
| | | | | | | | | | | | | | | | | | | | | | | | |
| |
|
1.99% |
| | | | 1.99 | % | | | | 4.49 | % | | | | 4.49 | % | | | | 3.87 | % |
| | | | |
| | | | | | | | | | | | | | | | | | | | | | | | |
| |
|
1.10% |
| | | | 1.10 | % | | | | 2.76 | % | | | | 2.76 | % | | | | 3.87 | % |
| | | | |
| | | | | | | | | | | | | | | | | | | | | | | | |
| |
|
0.96% |
| | | | 0.96 | % | | | | 3.11 | % | | | | 3.11 | % | | | | 3.87 | % |
33
SMEAD FUNDS
Notes to Financial Statements
May 31, 2022 (Unaudited)
The Smead Value Fund and the Smead International Value Fund (each, a “Fund” and together, the "Funds") are non-diversified series of Smead Funds Trust, a Delaware statutory trust (the “Trust”) organized on July 17, 2014. The Trust is registered under the Investment Company Act of 1940, as amended (the “1940 Act”), as an open-end management investment company. Each Fund is an investment company and accordingly follows the investment company accounting and reporting guidance of the Financial Accounting Standards Board (FASB) Accounting Standard Codification Topic 946 Financial Services-Investment Companies. Each Fund’s investment objective is long-term capital appreciation. The Trust may issue an unlimited number of interests (or shares) of beneficial interest, each with a par value of $0.001. The Smead Value Fund currently offers seven classes of shares: Investor Class, Class A, Class C, Class I1, Class R1, Class R2 and Class Y shares. Class I2, Class R3 and Class R4 shares are not yet in operation and thus not currently offered by the Smead Value Fund. The Smead International Value Fund currently offers six classes of shares: Investor Class, Class A, Class C, Class I1, Class I2 and Class Y shares. The Class I2 shares are not currently available for purchase. Each class of shares of the Funds has identical rights and privileges except with respect to the distribution and shareholder servicing fees, and voting rights on matters affecting a single class of shares. The classes differ principally in their respective distribution and shareholder servicing expenses. Costs incurred by the Funds in connection with the organization, registration and the initial public offering of shares were paid by Smead Capital Management, Inc., the Funds’ investment adviser (the “Adviser”).
The Smead International Value Fund succeeded to substantially all of the assets and liabilities of the Smead International Value Fund LP, a Delaware Limited Partnership, in exchange solely for Class I1 shares of the Fund on January 11, 2022 (the “Reorganization”).
| (2) | Significant Accounting Policies |
The following is a summary of significant accounting policies consistently followed by the Funds in the preparation of the financial statements. These policies are in conformity with generally accepted accounting principles in the United States of America (“GAAP”).
Each security owned by the Funds that is listed on a securities exchange is valued at its last sale price on that exchange on the date as of which assets are valued. When the security is listed on more than one exchange, the Funds will use the price of the exchange that the Funds generally consider to be the principal exchange on which the security is traded.
Fund securities listed on The NASDAQ Stock Market, Inc. (“NASDAQ”) will be valued at the NASDAQ Official Closing Price (“NOCP”), which may not necessarily represent the last sale price. If the NOCP is not available, such securities shall be valued at the last sale price on the day of valuation. If there has been no sale on such exchange or on NASDAQ on such day, the security is valued at the mean between the most recent
34
SMEAD FUNDS
Notes to Financial Statements (Continued)
May 31, 2022 (Unaudited)
bid and asked prices on such day. Over-the-counter securities that are not traded on NASDAQ shall be valued at the most recent trade price.
Debt securities, other than short-term instruments, are valued at the mean between the closing bid and asked prices provided by a pricing service (“Pricing Service”). If the closing bid and asked prices are not readily available, the Pricing Service may provide a price determined by matrix pricing or other analytical pricing models. Short-term debt securities, such as commercial paper, bankers’ acceptances and U.S. Treasury bills having a maturity of less than 60 days, are valued at amortized cost, which approximates fair value. If a short-term debt security has a maturity of greater than 60 days, it is valued at market price.
Redeemable securities issued by open-end, registered investment companies, including money market funds, are valued at the net asset value (“NAV”) of such companies for purchase and/or redemption orders placed on that day.
When market quotations are not readily available, any security or other asset is valued at its fair value as determined under fair value pricing procedures approved by the Trust’s Board of Trustees (the “Board of Trustees”). These fair value pricing procedures will also be used to price a security when corporate events, events in the securities market and/or world events cause the Adviser to believe that a security’s last sale price may not reflect its actual fair market value. The intended effect of using fair value pricing procedures is to ensure that the Funds are accurately priced.
The Funds’ fair value procedures include fair valuation accounting standards that establish an authoritative definition of fair value and set out a hierarchy for measuring fair value. These standards require additional disclosures about the various inputs used to develop the measurements of fair value. These inputs are summarized in the three broad levels listed below:
| | Level 1—unadjusted | quoted prices in active markets for identical securities. |
| | Level 2—other | significant observable inputs (including unadjusted quoted prices for similar securities, interest rates, prepayment speeds, credit risk, etc.). |
| | Level 3—significant | unobservable inputs (including a Fund’s own assumptions in determining the fair value of investments). |
The inputs or methodology used for valuing securities are not necessarily an indication of the risk associated with investing in those securities. The following table summarizes the valuation inputs of each Fund’s investments by each fair value hierarchy level as of May 31, 2022:
| | | | | | | | | | | | | | | | | | | | |
| | | Level 1 | | Level 2 | | Level 3 | | Total |
| | | Smead Value Fund |
Equity | |
Common Stocks(1) | | | $ | 3,787,461,725 | | | | $ | — | | | | $ | — | | | | $ | 3,787,461,725 | |
| | | | | | | | | | | | | | | | | | | | |
Total Equity | | | | 3,787,461,725 | | | | | — | | | | | — | | | | | 3,787,461,725 | |
Short-Term Investment | | | | — | | | | | 229,734,693 | | | | | — | | | | | 229,734,693 | |
| | | | | | | | | | | | | | | | | | | | |
Total Investments in Securities | | | $ | 3,787,461,725 | | | | $ | 229,734,693 | | | | $ | — | | | | $ | 4,017,196,418 | |
| | | | | | | | | | | | | | | | | | | | |
35
SMEAD FUNDS
Notes to Financial Statements (Continued)
May 31, 2022 (Unaudited)
| | | | | | | | | | | | | | | | | | | | |
| | | Level 1 | | Level 2 | | Level 3 | | Total |
| | | Smead International Value Fund |
Equity | |
Common Stocks(1) | | | $ | 57,464,562 | | | | $ | — | | | | $ | — | | | | $ | 57,464,562 | |
Warrants | | | | 8,894,853 | | | | | — | | | | | | | | | | 8,894,853 | |
| | | | | | | | | | | | | | | | | | | | |
Total Equity | | | | 66,359,415 | | | | | — | | | | | — | | | | | 66,359,415 | |
Short-Term Investment | | | | — | | | | | 3,651,275 | | | | | — | | | | | 3,651,275 | |
| | | | | | | | | | | | | | | | | | | | |
Total Investments in Securities | | | $ | 66,359,415 | | | | $ | 3,651,275 | | | | $ | — | | | | $ | 70,010,690 | |
| | | | | | | | | | | | | | | | | | | | |
| | (1) | See the Schedule of Investments for industry classification. |
No Level 3 securities were held in the Funds at May 31, 2022. For the six month period ended May 31, 2022, there were no transfers between levels for the Funds. It is the Funds’ policy to record transfers between levels as of the end of the reporting period. The Funds did not hold financial derivative instruments during the reporting period.
The NAV per share of each Fund is calculated by dividing the sum of the value of the securities held by the Fund, plus cash or other assets, minus all liabilities (including estimated accrued expenses) by the total number of shares outstanding for the Fund rounded to the nearest cent. The Funds’ shares will not be priced on the days on which the New York Stock Exchange is closed for trading.
The preparation of financial statements in conformity with GAAP requires management to make estimates and assumptions that affect the reported amounts of assets and liabilities and disclosure of contingent assets and liabilities at the date of the financial statements and the reported amounts of revenues and expenses during the reporting period. Actual results could differ from those estimates.
| | (d) | Allocation of Income, Expenses and Gains/Losses |
Income, expenses (other than those deemed attributable to a specific share class, such as distribution and shareholder servicing fees), and gains and losses of the Funds are allocated daily to each class of shares based upon the ratio of net assets represented by each class as a percentage of the net assets of the Funds. Expenses deemed directly attributable to a class of shares are recorded by the specific class. Most Fund expenses are allocated by class based on relative net assets. Rule 12b-1 fees for Smead Value Fund are expensed at 0.25% of average daily net assets of the Investor Class and Class A shares, 0.75% of average daily net assets of the Class C shares, and 0.50% of the average daily net assets of the Class R1 and Class R2 shares. Rule 12b-1 fees for Smead International Value Fund are expensed at 0.25% of average daily net assets of the Investor Class, 0.25% of average daily net assets of the Class A shares and 0.75% of average daily net assets of the Class C shares. A
36
SMEAD FUNDS
Notes to Financial Statements (Continued)
May 31, 2022 (Unaudited)
separate shareholder servicing fees is authorized up to 0.25% of the average daily net assets attributable to Class A shares, Class C shares, Investor Class shares, Class I1 shares, Class I2 shares, Class R1 shares and Class R2 shares of Smead Value Fund, Class A shares, Class C shares, Investor Class shares, Class I1 shares, Class I2 shares and Class Y shares of Smead International Value Fund, respectively. However, as of May 31, 2022, those fees were expensed at the following rates: 0.17% for the Investor Class shares and Class A, 0.25% for Class C shares, 0.15% for Class I1 shares, 0.25% for Class R1 shares, and 0.10% for Class R2 shares of Smead Value Fund. Additionally, as of May 31, 2022, those fees were expensed at the following rates: 0.00% for the Investor Class shares, 0.17% for the Class A shares, 0.25% for Class C, 0.15% for Class I1 shares and 0.10% for class I2 shares of Smead International Value Fund.
The Funds comply with the requirements of Subchapter M of the Internal Revenue Code of 1986, as amended, necessary to qualify as regulated investment companies and make the requisite distributions of income and capital gains to their shareholders sufficient to relieve them from all or substantially all federal income taxes. Therefore, no federal income tax provision has been provided.
As of and during the fiscal year ended November 30, 2021, the Smead Value Fund did not have a liability for any unrecognized tax benefits. The Smead Value Fund recognizes interest and penalties, if any, related to unrecognized tax benefits as income tax expense in the statement of operations. During the fiscal year ended November 30, 2021, the Smead Value Fund did not incur any interest or penalties.
As of November 30, 2021, the components of accumulated earnings on a tax basis were as follows for the Smead Value Fund:
| | | | | |
Cost basis of investments for federal income tax purposes | | | $ | 2,281,110,760 | |
| | | | | |
Gross tax unrealized appreciation | | | | 837,989,583 | |
Gross tax unrealized depreciation | | | | (28,441,420 | ) |
| | | | | |
Net tax unrealized appreciation | | | $ | 809,548,163 | |
| | | | | |
Undistributed ordinary income | | | $ | 12,031,449 | |
Undistributed long-term capital gain | | | | 114,900,612 | |
| | | | | |
Total distributable earnings | | | $ | 126,932,061 | |
| | | | | |
Other accumulated losses | | | | — | |
| | | | | |
Total accumulated gains | | | $ | 936,480,224 | |
| | | | | |
The tax basis of investments for tax and financial reporting purposes differs principally due to the deferral of losses on wash sales.
November 30, 2022 will be the first fiscal year end of the Smead International Value Fund, hence the accumulated earnings on tax basis will be shown in the next annual report dated November 30, 2022.
37
SMEAD FUNDS
Notes to Financial Statements (Continued)
May 31, 2022 (Unaudited)
| | (f) | Distributions to Shareholders |
The Funds will distribute any net investment income and any net realized long or short-term capital gains at least annually. Distributions from net realized gains for book purposes may include short-term capital gains. All short-term capital gains are included in ordinary income for tax purposes. Distributions to shareholders are recorded on the ex-dividend date. The Funds may also pay a special distribution at the end of the calendar year to comply with federal tax requirements. Income and capital gains distributions may differ from GAAP, primarily due to timing differences in the recognition of income, gains and losses by the Funds. GAAP requires that certain components of net assets relating to permanent differences be reclassified between the components of net assets. These reclassifications have no effect on net assets or net asset value per share. For the fiscal year ended November 30, 2021, reclassifications were made for equalization utilized for the Smead Value Fund.
| | | | | | | | | | |
Fund name | | | Total Distributable
Earnings (Loss) | | | Paid-in
Capital | |
| | Smead Value Fund | | | $ | (10,597,503 | ) | | $ | 10,597,503 | |
The tax character of distributions paid during the fiscal years ended November 30, 2021 and November 30, 2020 was as follows:
| | | | | | | | | | |
Smead Value Fund | | November 30,
2021 | | November 30,
2020 |
Ordinary Income | | | $ | 11,796,035 | | | | $ | 11,720,001 | |
Long-Term Capital Gain | | | $ | 8,929,375 | | | | $ | 40,538,172 | |
On December 17, 2021, the Smead Value Fund declared and paid distributions from ordinary income and long-term capital gains to shareholders of record on December 16, 2021.
| | | | | | | | | | | | | | | |
| | | Distributions Paid from | | Total
Distributions
Paid |
Class | | Ordinary
Income | | Realized
Gain/Loss |
Investor Class | | | $ | 240,533 | | | | $ | 4,014,545 | | | | $ | 4,255,078 | |
Class A | | | | 843,908 | | | | | 10,411,882 | | | | | 11,255,790 | |
Class C | | | | 22,896 | | | | | 659,574 | | | | | 682,470 | |
Class I1 | | | | 12,038,104 | | | | | 90,528,086 | | | | | 102,566,190 | |
Class R1 | | | | — | | | | | 6,379 | | | | | 6,379 | |
Class R2 | | | | 175 | | | | | 3,710 | | | | | 3,885 | |
Class Y | | | | 1,407,670 | | | | | 9,276,455 | | | | | 10,684,125 | |
Investment transactions are recorded on the trade date. The Funds determine the gain or loss from investment transactions based on specific identification using the first in, first out method. Dividend income, less foreign withholding tax, is recognized on the ex-dividend date and interest income is recognized on an accrual basis.
38
SMEAD FUNDS
Notes to Financial Statements (Continued)
May 31, 2022 (Unaudited)
The Funds have an Investment Advisory Agreement (the “Agreement”) with the Adviser to furnish investment advisory services to the Funds. Under the terms of the Agreement, each Fund compensates the Adviser for its management services at the annual rate of 0.75% of the Fund’s average daily net assets.
The Adviser has contractually agreed to waive its management fee and/or reimburse each Fund’s other expenses (the “Expense Limitation Caps”) at least through March 31, 2023 to the extent necessary to ensure that the Fund’s operating expenses do not exceed 1.26%, 1.26%, 1.84%, 0.99%, 1.59%, 1.44% and 0.84% of the Fund’s average daily net assets for the Investor Class, Class A, Class C, Class I1, Class R1, Class R2 and Class Y shares for the Smead Value Fund and 1.25%, 1.42%, 2.00%, 1.15%, 1.10% and 1.00% of the Fund’s average daily net assets for the Investor Class, Class A, Class C, Class I1, Class I2 and Class Y shares for the Smead International Value Fund, respectively. Any such waiver or reimbursement is subject to later adjustment to allow the Adviser to recoup amounts waived or reimbursed to the extent actual fees and expenses for a fiscal period (taking into account the reimbursement) does not exceed the Expense Limitation Caps in place at the time of waiver; provided, however, that the Adviser shall only be entitled to recoup such amounts over the following three fiscal years. The following table shows the waived or reimbursed expenses subject to potential recovery expiring on November 30:
| | | | | | | | |
Year incurred | | Expiration Year | | | Smead Value Fund | |
| 2019 | | | 2022 | | | $ | — | |
| 2020 | | | 2023 | | | | — | |
| 2021 | | | 2024 | | | | — | |
For the six months ended May 31, 2022, the Smead Value Fund made repayments to the Adviser for previously waived and reimbursed fees to the amount of $17,704.
| (4) | Distribution Plan and Shareholder Servicing Plan |
The Funds have adopted a plan pursuant to Rule 12b-1 (the “12b-1 Plan”), which authorizes it to pay UMB Distribution Services, LLC, the Funds’ principal distributor (the “Distributor”), a fee for the Smead Value Fund at an annual rate of 0.25% of the Fund’s average daily net assets of Investor Class and Class A shares, 0.75% of the Fund’s average daily net assets of Class C shares, and 0.50% of the Fund’s average daily net assets of Class R1 and Class R2 shares for services to prospective Fund shareholders and distribution of Fund shares of the Smead Value Fund. There is no 12b-1 fee for Class Y shares of the Smead Value Fund. Under the 12b-1 Plan, the Smead International Value Fund pays a fee at the annual rate of 0.25% of the Fund’s average daily net assets of Investor Class and Class A shares and 0.75% of the Fund’s average daily net assets of Class C shares services to prospective Fund shareholders and distribution of Fund shares of the Smead International Value Fund. There are no 12b-1 fees for Class I1, Class I2 and Class Y shares of the Smead International Value Fund. During the six months ended May 31, 2022, were accrued
39
SMEAD FUNDS
Notes to Financial Statements (Continued)
May 31, 2022 (Unaudited)
expenses of $655,096 and $1,990 pursuant to the 12b-1 Plan for Smead Value Fund and Smead International Value Fund, respectively. As of May 31, 2022, the Smead Value Fund and Smead International Value Fund owed the Distributor fees of $121,531 and $562, respectively.
The Funds have also adopted a separate shareholder servicing plan (the “Shareholder Servicing Plan”). The Shareholder Servicing Plan also authorizes payment of a shareholder servicing fee to financial intermediaries and other service providers up to 0.25% of the average daily net assets attributable to the Class A shares, Class C shares, Investor Class shares, Class I1 shares, Class I2 shares, Class R1 shares and Class R2 shares, respectively (this fee is referred to as the “Shareholder Servicing Fee”). However, as of May 31, 2022, these Shareholder Servicing Fees were expensed at the following rates: 0.17% for the Investor Class, 0.17% for the Class A shares, 0.25% for the Class C shares, 0.15% for the Class I1 shares, 0.25% for the Class R1 shares, and 0.10% for the Class R2 shares of the Smead Value Fund. The Shareholder Servicing Fees were expensed at the following rates: 0.00% for the Investor Class, 0.17% for the Class A shares, 0.25% for the Class C shares, 0.15% for the Class I1 shares and 0.10% for the Class I2 shares of the Smead International Value Fund. There is no Shareholder Servicing Fee for the Class Y shares of the Funds. For those share classes that currently charge less than the maximum Shareholder Servicing Fee permitted under the Shareholder Servicing Plan, the Funds may increase such fee, but not beyond the maximum of 0.25%, only after providing affected shareholders with 30 days’ prior written notice. The following table details the Shareholder Servicing Plan fees paid for the six months ended May 31, 2022.
| | | | | |
Smead Value Fund | | | | | |
Investor Class | | | $ | 93,475 | |
Class A | | | | 289,178 | |
Class C | | | | 30,557 | |
Class I1 | | | | 2,154,060 | |
Class R1 | | | | 218 | |
Class R2 | | | | 54 | |
| |
Smead International Value Fund | | | | | |
Class A | | | $ | 1,299 | |
Class C | | | | 16 | |
Class I1 | | | | 18,831 | |
| (5) | Accounting, Custody, Administration and Transfer Agent Fees |
State Street Bank and Trust Company (“State Street”) serves as the Funds’ accounting agent, custodian of the Funds’ investments and administrator of the Funds. For its services, the Funds pay State Street a fee that is calculated daily and paid monthly at an annual rate based on the aggregate average daily net assets of the Funds, along with transactional and out-of-pocket fees.
UMB Fund Services, Inc. (“UMB”) is the Funds’ transfer and dividend disbursing agent. UMB receives a fee that is calculated daily and paid monthly at an annual rate
40
SMEAD FUNDS
Notes to Financial Statements (Continued)
May 31, 2022 (Unaudited)
based on the average daily net assets of the Funds, and is reimbursed for certain out-of-pocket expenses.
| (6) | Capital Share Transactions |
Transactions in shares of the Funds were as follows:
| | | | | | | | | | | | | | | | | | | | |
| Smead Value Fund | | | | | | | | |
| | | For The Six Months Ended
May 31, 2022 | | For The Year Ended
November 30, 2021 |
| | | Shares | | Amount | | Shares | | Amount |
Proceeds from shares sold | | | | | | | | | | | | | | | | | | | | |
Investor Class | | | | 72,500 | | | | $ | 5,023,107 | | | | | 286,945 | | | | $ | 17,699,957 | |
Class A | | | | 2,724,778 | | | | | 185,226,593 | | | | | 2,324,320 | | | | | 148,472,498 | |
Class C | | | | 240,260 | | | | | 16,119,415 | | | | | 245,193 | | | | | 15,554,280 | |
Class I1 | | | | 16,044,154 | | | | | 1,105,955,658 | | | | | 20,924,678 | | | | | 1,357,662,229 | |
Class R1 | | | | 96 | | | | | 6,379 | | | | | 221 | | | | | 12,384 | |
Class R2 | | | | 343 | | | | | 23,637 | | | | | 968 | | | | | 61,431 | |
Class Y | | | | 2,234,599 | | | | | 157,168,204 | | | | | 1,931,764 | | | | | 122,175,846 | |
| | | | |
Issued in reinvestment of dividends and distributions | | | | | | | | | | | | | | | | | | | | |
Investor Class | | | | 58,748 | | | | | 3,986,070 | | | | | 20,200 | | | | | 1,022,342 | |
Class A | | | | 129,616 | | | | | 8,715,869 | | | | | 22,238 | | | | | 1,116,851 | |
Class C | | | | 6,377 | | | | | 420,516 | | | | | 89 | | | | | 4,407 | |
Class I1 | | | | 1,045,630 | | | | | 70,872,795 | | | | | 172,003 | | | | | 8,698,174 | |
Class R2 | | | | 3 | | | | | 204 | | | | | — | | | | | — | |
Class Y | | | | 69,867 | | | | | 4,741,905 | | | | | 7,236 | | | | | 366,205 | |
| | | | |
Payments for shares redeemed | | | | | | | | | | | | | | | | | | | | |
Investor Class | | | | (147,613 | ) | | | | (10,115,959 | ) | | | | (336,316 | ) | | | | (20,481,907 | ) |
Class A | | | | (801,790 | ) | | | | (54,703,510 | ) | | | | (511,476 | ) | | | | (32,498,488 | ) |
Class C | | | | (13,840 | ) | | | | (910,968 | ) | | | | (4,985 | ) | | | | (322,111 | ) |
Class I1 | | | | (5,994,609 | ) | | | | (412,379,412 | ) | | | | (5,472,298 | ) | | | | (345,892,058 | ) |
Class R1 | | | | — | | | | | — | | | | | (3,674 | ) | | | | (235,195 | ) |
Class R2 | | | | (817 | ) | | | | (55,877 | ) | | | | (1,069 | ) | | | | (54,416 | ) |
Class Y | | | | (386,148 | ) | | | | (26,679,991 | ) | | | | (311,206 | ) | | | | (19,674,924 | ) |
| | | | | | | | | | | | | | | | | | | | |
Total increase in net assets from capital share transactions | | | | 15,282,154 | | | | $ | 1,053,414,635 | | | | | 19,294,831 | | | | $ | 1,253,687,505 | |
| | | | | | | | | | | | | | | | | | | | |
41
SMEAD FUNDS
Notes to Financial Statements (Continued)
May 31, 2022 (Unaudited)
| | | | | | | | | | |
| Smead International Value Fund | | | | |
| | | For The Six Months
Ended May 31, 2022 |
| | | Shares | | Amount |
Proceeds from shares sold | | | | | | | | | | |
Investor Class | | | | 101 | | | | $ | 3,033 | |
Class A | | | | 61,305 | | | | | 3,027,547 | |
Class C | | | | 1,470 | | | | | 68,017 | |
Class I1 | | | | 734,965 | | | | | 33,963,792 | |
Class Y | | | | 503,010 | | | | | 25,559,201 | |
| | |
Payments for shares redeemed | | | | | | | | | | |
Class A | | | | (5,143 | ) | | | | (256,270 | ) |
Class I1 | | | | (16,805 | ) | | | | (850,193 | ) |
Class Y | | | | (10,832 | ) | | | | (556,619 | ) |
| | | | | | | | | | |
Total increase in net assets from capital share transactions | | | | 1,268,071 | | | | $ | 60,958,508 | |
| | | | | | | | | | |
The Smead International Value Fund reorganized on January 11, 2022, hence has no comparatives.
| (7) | Investment Transactions |
The aggregate purchases and sales of securities, excluding short-term investments, for the Smead Value Fund for the six months ended May 31, 2022 were $1,055,211,720 and $307,484,525, respectively. The aggregate purchases and sales of securities, excluding short-term investments, for the Smead International Value Fund for the period ended May 31, 2022 were $55,249,605 and $2,112,080, respectively. There were no purchases or sales of U.S. government securities for the Funds.
The beneficial ownership, either directly or indirectly, of more than 25% of the voting securities of a fund creates a presumption of control of the fund, under Section 2(a)(9) of the 1940 Act. At May 31, 2022, National Financial Services LLC, for the benefit of its customers, held 54.35% of outstanding shares of the Investor Class in the Smead Value Fund. At May 31, 2022, Wells Fargo Clearing Services LLC and Merrill Lynch Pierce Fenner & Smith, for the benefit of its customers, held 54.25% and 32.02% of outstanding shares of Class C in the Smead Value Fund. At May 31, 2022, Merrill Lynch Pierce Fenner & Smith, for the benefit of its customers, held 26.36%, 100% and 83.68% of outstanding shares of Class I1, Class R1 and Class R2, respectively, in the Smead Value Fund.
At May 31, 2022, Skamokawa Living Trust, for the benefit of its customers, held 100% of outstanding shares of the Investor Class in the Smead International Value Fund. At May 31, 2022, TD Ameritrade Inc., for the benefit of its customers, held 64.06% of outstanding shares of Class A in the Smead International Value Fund. At May 31, 2022, Charles Schwab & Company, Inc, for the benefit of its customers, held 92.74% and 73.67% of outstanding shares of Class C and Class I1, respectively, in the Smead International Value Fund.
42
SMEAD FUNDS
Notes to Financial Statements (Continued)
May 31, 2022 (Unaudited)
An investment in the Funds represents an indirect investment in the assets owned by the Funds. As with any mutual fund, the value of the assets owned by the Funds may move up or down, and as a result, an investment in the Funds at any point in time may be worth more or less than the original amount invested.
Each Fund’s transactions in listed securities are settled/paid for upon delivery to or from their counterparties; therefore, the risk of counterparty default for listed securities is considered minimal, as delivery of securities sold is only made once the Funds have received payment. Payment is made on a purchase once the securities have been delivered by the counterparty. The trade will fail if either party fails to meet its obligations.
| | Market | and Regulatory Risks |
Events in the financial markets and economy may cause volatility and uncertainty and affect Fund performance. Market events may affect a single issuer, industry, sector, or the market as a whole. In addition, because of interdependencies between markets, events in one market may adversely impact other markets or issuers in which the Funds invest in unforeseen ways. For example, the global outbreak of COVID-19 has disrupted financial markets and the prolonged economic impact is uncertain. The performance of each Fund’s investments depends on future developments, including the duration and spread of the outbreak. Events related to COVID-19 may result in further global economic disruption and market volatility which in turn may impact the value of the Fund’s investments. Traditionally liquid investments may experience periods of diminished liquidity. During a general downturn in the financial markets, multiple asset classes may decline in value and the Funds may lose value, regardless of the individual results of the securities and other instruments in which the Funds invest. Governmental and regulatory actions, including tax law changes, may also impair Fund management and have unexpected or adverse consequences on particular markets, strategies, or investments. Future market or regulatory events may impact the Funds in unforeseen ways, such as causing the Funds to alter their existing strategies or potentially, to liquidate and close.
Stock markets are volatile. Equity investments tend to go up or down in value, sometimes rapidly and unpredictably, in response to many factors, including a company’s historical and prospective earnings, the value of its assets, general economic conditions, interest rates, investor perceptions, and market liquidity. Due to the complexities of markets, events in one market or sector may adversely impact other markets or sectors.
Management has evaluated the possibility of subsequent events through the date of issuance and determined that there are no material events that would require adjustment to or disclosure in the Funds’ financial statements.
43
SMEAD INTERNATIONAL VALUE FUND
Basis for Trustees’ Approval of Investment Advisory Agreement
(Unaudited)
The Board of Trustees (the “Trustees”) of Smead Funds Trust (the “Trust”) met on December 9, 2021 to consider the approval of the Investment Advisory Agreement (the “Agreement”) between the Trust, on behalf of the Smead International Value Fund (the “New Fund”), a proposed series of the Trust, and Smead Capital Management, Inc., the Fund’s proposed investment adviser (the “Adviser”). Prior to this meeting, the Trustees requested and received materials to assist them in considering the approval of the Agreement. The materials provided contained information with respect to the factors enumerated below, including (1) a copy of the Agreement, (2) a memorandum prepared by the Trust’s outside legal counsel discussing in detail the Trustees’ fiduciary obligations and the factors they should assess in considering the approval of the Agreement, (3) detailed comparative performance information relating to the performance of the Smead International Value Fund L.P. (the “Private Fund”), which was managed by Smead Private Fund Advisers, LLC, an affiliate of the Adviser (the “Private Fund Adviser”), and was substantially identical to the New Fund, (4) the proposed management fees and other expenses of the New Fund, (5) the Adviser’s response to the Independent Trustees’ (defined below) request for information, including the Adviser’s Form ADV, select financial statements of the Adviser, biographic information of the Adviser’s key management and compliance personnel, comparative fee information for the New Fund and the Adviser’s other separately-managed accounts, a summary detailing key provisions of the Adviser’s written compliance program, including its code of ethics, and other pertinent information. Based on their evaluation of the information provided by the Adviser, in conjunction with the New Fund’s other service providers, the Trustees, by a unanimous vote (including a separate vote of the Trustees who are not “interested persons,” as that term is defined in the Investment Company Act of 1940, as amended (the “Independent Trustees”)), approved the Agreement for an initial two-year term ending January 12, 2024.
DISCUSSION OF FACTORS CONSIDERED
In considering the approval of the Agreement and reaching their conclusions, the Trustees reviewed and analyzed various factors that they determined were relevant, including the factors enumerated below.
| 1. | NATURE, EXTENT AND QUALITY OF SERVICES |
The Independent Trustees reviewed and considered the nature, extent and quality of the services to be provided by the Adviser and expect that they will be of high quality and in the best interests of the New Fund. They noted that the Adviser’s prior history, experience and reputation relative to the Adviser’s management of the Trust’s existing series were exceptional. The Independent Trustees considered the experience and qualifications of the personnel at the Adviser who would be responsible for providing services to the New Fund. The Independent Trustees also considered the resources, policies, procedures and infrastructure of the Adviser devoted to ensuring compliance with applicable laws and regulations, as well as the Adviser’s commitment to those programs, including the Adviser’s use of third-party compliance and cybersecurity providers to support the Adviser’s own compliance efforts. The Independent Trustees noted that there were currently no known pending regulatory actions by the Securities and Exchange Commission or other regulatory agencies involving the Adviser or the Trust. The Independent Trustees concluded that the Adviser was experienced in
44
SMEAD INTERNATIONAL VALUE FUND
Basis for Trustees’ Approval of Investment Advisory Agreement (Continued)
(Unaudited)
managing an investment product similar to the New Fund (namely, the Private Fund), that its key personnel have sufficient expertise necessary to serve as investment adviser to the New Fund and that the nature, overall quality and extent of the management services to be received by the New Fund were expected to be satisfactory and reliable.
Because the New Fund had not yet commenced operations and did not have its own performance history, the Independent Trustees considered the performance history of the Private Fund, a fund advised by the Private Fund Adviser (an affiliate of the Adviser) that had identical investment objectives and techniques as the New Fund. As part of its review, the Independent Trustees reviewed a report prepared by an independent consulting firm, Broadridge. Broadridge used foreign large value for category and peer selection, with an emphasis on both institutional and no-load retail share classes that have no Rule 12b-1 fee and share a high concentration, low turnover, foreign value-oriented strategy. The Broadridge report included comparisons of the performance of the Private Fund to certain funds determined by Broadridge to be comparable based on investment style (the “Morningstar Performance Peer Group”), to funds included in Morningstar’s Foreign Large Value category (the “Morningstar Category”), and to a relevant benchmark index (the “MSCI ACWI Ex USA Val NR USD Index”). The Independent Trustees noted that, based on the Morningstar Performance Peer Group rankings, the Private Fund ranked 1st out of 262 funds, 4th out of 235 funds and 5th out of 200 funds for the 1-year, 3-year and 5-year periods ended October 31, 2021, respectively. For the same periods, the Independent Trustees noted that the Private Fund ranked 1st out of 91 funds, 1st out of 87 funds and 1st out of 75 funds, respectively, in the Morningstar Category, and that the Private Fund outperformed the benchmark for the 1-year, 3-year, 5-year and since inception periods. The Independent Trustees concluded that the performance obtained by the Adviser for the Private Fund was very good under current market conditions. Although past performance is not a guarantee or indication of future results, the Independent Trustees determined that the New Fund and its shareholders were likely to benefit from the Adviser’s management of the New Fund, which would be managed in substantially the same manner as the Private Fund Adviser managed the Private Fund.
| 3. | COST OF SERVICES PROVIDED AND PROFITS REALIZED BY THE ADVISER |
The Independent Trustees considered both the advisory fee rate proposed to be charged by the Adviser to the New Fund, as well as the overall expense ratio for the New Fund, taking into consideration the New Fund’s expense limitation arrangement with the Adviser. The Independent Trustees discussed Broadridge’s analysis which, as of October 31, 2021, showed that the New Fund’s proposed net expenses of 1.15% (for Class I1) exceeded the Morningstar Performance Peer Group and Morningstar Category medians by 15 basis points and 30 basis points, respectively, placing the Fund in the third quartile against the peer group and in the fourth quartile against the category. In addition, the Broadridge report noted that, at October 31, 2021 asset levels, the advisory fee of 0.75% is five basis points lower
45
SMEAD INTERNATIONAL VALUE FUND
Basis for Trustees’ Approval of Investment Advisory Agreement (Continued)
(Unaudited)
than the Morningstar Performance Peer Group median and two basis points higher than the Morningstar Category median, which highlights that non-management fees are a driver in higher net expenses. This advisory fee puts the New Fund in the third quartile within the Morningstar Category. The Independent Trustees noted that while the proposed overall net expenses of the New Fund were above the median of the Morningstar Performance Peer Group and the Morningstar Category, the advisory fee was very close to the median of the Morningstar Performance Peer Group and the Morningstar Category, and given the very good performance of the Private Fund, on balance, the overall fees and expenses were deemed to be reasonable. The Independent Trustees also noted that the current expense limitation structure would remain in effect for the New Fund until at least March 31, 2023. The Independent Trustees were reminded that the Adviser had provided audited financial statements for the Board’s review a few months prior, and that the Adviser’s financial condition and profitability remained strong. The Independent Trustees concluded that the New Fund’s overall expenses and proposed advisory fee rate were fair and reasonable in light of the comparative performance, expense and advisory fee information presented. The Independent Trustees further concluded that they had no concerns regarding the Adviser’s ability to perform its management duties to the New Fund or the continued viability of the Adviser.
| 4. | EXTENT OF ECONOMIES OF SCALE |
The Independent Trustees compared the New Fund’s net expenses relative to its Morningstar Performance Peer Group and its Morningstar Category and discussed the potential for economies of scale. The Independent Trustees noted that, although the Fund did not have advisory fee breakpoints, the Adviser had contractually agreed to limit the expenses of each share class of the Fund so that each share class does not exceed its operating expense limitation. The Independent Trustees discussed the possibility of including breakpoints in the investment advisory fee and considered the Adviser’s thoughts on this subject. Based upon its review and discussion, the Independent Trustees determined that, while fee breakpoints were not currently necessary for the New Fund, they would continue to review whether breakpoints should be incorporated. After further discussion, the Independent Trustees concluded that the current fee structure was reasonable and that any economies of scale were not a significant factor in their thinking at this time as the New Fund had not yet become operational.
| 5. | INDIRECT BENEFITS REALIZED BY THE ADVISER |
The Independent Trustees considered the direct and indirect benefits that may be realized by the Adviser from its association with the New Fund. The Independent Trustees concluded that benefits such as greater name recognition, growth in separate account management services and increased ability to obtain research or brokerage services through the use of soft dollars, were all benefits the Adviser currently enjoyed through its management of the Trust’s existing series. The Independent Trustees concluded that these benefits were not unusual or unreasonable, and in many cases, may benefit the New Fund through growth in assets.
46
SMEAD INTERNATIONAL VALUE FUND
Basis for Trustees’ Approval of Investment Advisory Agreement (Continued)
(Unaudited)
CONCLUSIONS
The Trustees considered all of the foregoing factors. In considering the approval of the Agreement, the Trustees did not identify any one factor as all-important, but rather considered these factors collectively in light of the New Fund’s surrounding circumstances. Based on this review, the Trustees, including a majority of the Independent Trustees, approved the Agreement as being in the best interests of the New Fund and its shareholders.
47
SMEAD FUNDS
Notice of Privacy Policies and Practices
We collect non-public personal information about you from the following sources:
| • | | information we receive about you on applications or other forms; |
| • | | information you give us orally; and |
| • | | information about your transactions with us or others. |
We do not disclose any non-public personal information about our shareholders or former shareholders without the shareholder’s authorization, except as permitted by law or in response to inquiries from governmental authorities. We may share information with affiliated parties and unaffiliated third parties with whom we have contracts for servicing the Funds. We will provide unaffiliated third parties with only the information necessary to carry out their assigned responsibility. All shareholder records will be disposed of in accordance with applicable law. We maintain physical, electronic and procedural safeguards to protect your non-public personal information and require third parties to treat your non-public personal information with the same high degree of confidentiality.
In the event that you hold shares of the Funds through a financial intermediary, including, but not limited to, a broker-dealer, bank or trust company, the privacy policy of your financial intermediary would govern how your non-public personal information would be shared with unaffiliated third parties.
48
SMEAD FUNDS
Additional Information
(Unaudited)
Tax Information
For the year ended November 30, 2021, 100% of dividends paid from net ordinary income qualified for the dividends received deduction available to corporate shareholders of the Smead Value Fund.
Indemnifications
Under the Trust’s organizational documents, its officers and trustees are indemnified against certain liabilities arising out of the performance of their duties to the Funds. In addition, in the normal course of business, the Funds enter into contracts that provide general indemnifications to other parties. The Funds’ maximum exposure under these arrangements is unknown as this would involve future claims that may be made against the Funds that have not yet occurred. However, the Funds have not had prior claims or losses pursuant to these contracts and expects the risk of loss to be remote.
Information about Trustees
The business and affairs of the Trust are managed under the direction of the Board of Trustees. Information pertaining to the Trustees of the Trust is set forth below. The Statement of Additional Information includes additional information about the Trustees and is available, without charge, upon request by calling 877-807-4122. This table is as of May 31, 2022.
| | | | | | | | | | |
Name and Age | | Position(s) Held with the Trust | | Term of
Office and
Length of
Time Served | | Number of
Portfolios
in Trust
Overseen
by Trustee | | Principal
Occupation(s)
During the Past
Five Years | | Other Directorships Held by
Trustee During
the Past Five Years |
Independent Trustees | | | | |
| | | | | |
Gregory A. Demopulos Age: 63 | | Trustee | | Indefinite Term (since September 2014). | | 2 | | Chairman and CEO, Omeros Corp. (biopharmaceutical company) (since 1994). | | Director, Onconome, Inc. (2004 to 2017). |
| | | | | |
Peter M. Musser Age: 65 | | Trustee | | Indefinite Term (since September 2014). | | 2 | | Principal, Angeline Properties, LLC (a private investment firm) (since 2014); and Principal and Senior Equity Portfolio Manager with Rainier Investment Management (from 1994 to 2013). | | Trustee, Lawrence University (since 2012); Trustee, Berry College (since 2010); and Director, Boys and Girls Clubs of King County (2008 to 2016). |
49
SMEAD FUNDS
Additional Information (Continued)
(Unaudited)
| | | | | | | | | | |
Name and Age | | Position(s) Held with the Trust | | Term of
Office and
Length of
Time Served | | Number of
Portfolios
in Trust
Overseen
by Trustee | | Principal
Occupation(s)
During the Past
Five Years | | Other Directorships Held by
Trustee During
the Past Five Years |
| | | | | |
Walter F. Walker Age: 67 | | Trustee | | Indefinite Term (since September 2014). | | 2 | | Principal, Hana Road Capital LLC (hedge fund) (since 2007). | | Advisory Council, Stone Arch Capital (since 2005); and Independent Director, Atlas Financial Holdings, Inc. (since 2017); and Independent Director, Harbor Custom Development, Inc. (real estate development company) (since 2020). |
| | | | | |
Nancy A. Zevenbergen Age: 63 | | Trustee | | Indefinite Term (since September 2014). | | 2 | | Principal and Chief Investment Officer, Zevenbergen Capital Investments LLC (since 1987). | | Director, Seattle Pacific Foundation (since 1993); Director, Anduin Foundation (since 2010); Director, University of Washington Foster School of Business (since 2014); and Director, evenstar3 Inc. (since 2005). |
50
SMEAD FUNDS
Additional Information (Continued)
(Unaudited)
| | | | | | | | | | |
Name and Age | | Position(s) Held with the Trust | | Term of
Office and
Length of
Time Served | | Number of
Portfolios
in Trust
Overseen
by Trustee | | Principal
Occupation(s)
During the Past
Five Years | | Other Directorships Held by
Trustee During
the Past Five Years |
| | |
Interested Trustees and Officers | | | | |
| | | | | |
William W. Smead1 Age: 64 | | Trustee and Chairman | | Indefinite Term (since September 2014). | | 2 | | Chief Investment Officer of the Adviser (since 2007); Chief Executive Officer of the Adviser (2007-2019); and President and Chief Executive Officer of the Trust (from September 2014 to January 2016). | | None. |
| | | | | |
Cole W. Smead1 Age: 38 | | Trustee President and Chief Executive Officer | | Indefinite Term (since September 2014). Elected annually (since January 2016). | | 2 | | President of the Adviser (since 2020); Managing Director of the Adviser (2007-2019). | | Director and Chairman, Smead Funds S.A. (since 2015). |
| | | | | |
Steven J. LeMire Age: 52 | | Chief Compliance Officer Treasurer, Principal Financial and Accounting Officer | | Elected annually (since September 2014). Elected annually (since January 2016). | | N/A | | Chief Compliance Officer of the Adviser (since 2014). | | N/A |
| | | | | |
Heather Peterson Age: 37 | | Secretary | | Elected annually (since August 2020). | | N/A | | Director - Marketing & Brand Development of the Adviser (since 2022). Vice President - Marketing of the Adviser (2016-2021). | | N/A |
| 1 | Mr. William Smead and Mr. Cole Smead are each deemed to be an “interested person” of the Fund under the 1940 Act because of his position with Smead Capital Management, Inc. Mr. William Smead and Mr. Cole Smead are father and son, respectively. |
51
A NOTE ON FORWARD LOOKING STATEMENTS (Unaudited)
Except for historical information contained in this report for the Funds, the matters discussed in this report may constitute forward-looking statements made pursuant to the safe-harbor provisions of the Private Securities Litigation Reform Act of 1995. These include any adviser or portfolio manager predictions, assessments, analyses or outlooks for individual securities, industries, market sectors and/or markets. These statements involve risks and uncertainties. In addition to the general risks described for the Funds in the current Prospectus, other factors bearing on this report include the accuracy of the Adviser’s or portfolio managers’ forecasts and predictions, and the appropriateness of the investment programs designed by the adviser or portfolio managers to implement their strategies efficiently and effectively. Any one or more of these factors, as well as other risks affecting the securities markets and investment instruments generally, could cause the actual results of the Funds to differ materially as compared to benchmarks associated with the Funds.
ADDITIONAL INFORMATION (Unaudited)
The Funds have adopted proxy voting policies and procedures that delegate to the Adviser the authority to vote proxies. A description of the Funds’ proxy voting policies and procedures is available without charge, upon request, by calling the Funds toll free at 877-807-4122. A description of these policies and procedures is also included in the Funds’ Statement of Additional Information, which is available on the SEC’s website at http://www.sec.gov.
The Smead Value Fund’s proxy voting record for the most recent 12-month period ended June 30 is available without charge, upon request, by calling, toll free, 877-807-4122, or by accessing the SEC’s website at http://www.sec.gov. When available, the Smead International Value Fund’s proxy voting record for the most recent 12-month period ended June 30 will also be available without charge, upon request, by calling, toll free, 877-807-4122, or by accessing the SEC’s website at http://www.sec.gov.
The Funds file their complete schedules of portfolio holdings with the SEC for the first and third quarters of each fiscal year as an exhibit to its reports on Form N-PORT. Shareholders may view the Funds’ Form N-PORT report on the SEC’s website at www.sec.gov.
HOUSEHOLDING (Unaudited)
In an effort to decrease costs, the Funds intend to reduce the number of duplicate prospectuses and annual and semi-annual reports you receive by sending only one copy of each to those addresses shared by two or more accounts and to shareholders the Funds reasonably believe are from the same family or household. Once implemented, if you would like to discontinue householding for your accounts, please call toll-free at 877-807-4122 to request individual copies of these documents. Once the Funds receive notice to stop householding, the Funds will begin sending individual copies 30 days after receiving your request. This policy does not apply to account statements.
SMEAD FUNDS
| | |
| |
Investment Adviser | | Smead Capital Management, Inc. 2777 East Camelback Road Suite 375 Phoenix, AZ 85016 |
| |
Legal Counsel | | Godfrey & Kahn, S.C. 833 East Michigan Street Suite 1800 Milwaukee, Wisconsin 53202 |
| |
Independent Registered Public Accounting Firm | | Cohen & Company, Ltd. 1350 Euclid Avenue Suite 800 Cleveland, Ohio 44115 |
| |
Custodian, Fund Accountant and Fund Administrator | | State Street Bank and Trust Company One Lincoln Street Boston, Massachusetts 02111 |
| |
Transfer Agent | | UMB Fund Services, Inc. 235 W Galena Street Milwaukee, WI 53212 |
| |
Distributor | | UMB Distribution Services, LLC 235 W Galena Street Milwaukee, WI 53212 |
This report is intended for shareholders of the Funds and may not be used as sales literature unless preceded or accompanied by a current prospectus.
(b) Not applicable.
Item 2. Code of Ethics.
Not applicable to this semi-annual report.
Item 3. Audit Committee Financial Expert.
Not applicable to this semi-annual report.
Item 4. Principal Accountant Fees and Services.
Not applicable to this semi-annual report.
Item 5. Audit Committee of Listed Registrants.
Not applicable.
Item 6. Investments.
| (a) | Included as part of the Report to Shareholders under Item 1 of this Form N-CSR. |
Item 7. Disclosure of Proxy Voting Policies and Procedures for Closed-End Management Investment Companies.
Not applicable.
Item 8. Portfolio Managers of Closed-End Management Investment Companies.
Not applicable.
Item 9. Purchases of Equity Securities by Closed-End Management Investment Company and Affiliated Purchasers.
Not applicable.
Item 10. Submission of Matters to a Vote of Security Holders.
During the period ended May 31, 2022, there were no material changes to the procedures by which shareholders may recommend nominees to the Registrant’s Board of Trustees.
Item 11. Controls and Procedures.
| (a) | The Registrant’s principal executive and principal financial officers, or persons performing similar functions, have concluded that the Registrant’s disclosure controls and procedures (as defined in Rule 30a-3(c) under the Investment Company Act of 1940 (the “Act”)) are effective, as of a date within 90 days of the filing date of this Form N-CSR, based on the evaluation of these controls and procedures required by the Act and under the Securities Exchange Act of 1934. |
| (b) | There were no changes in the Registrant’s internal control over financial reporting (as defined in Rule 30a-3(d) under the Act) that occurred during the period covered by this report that have materially affected, or are reasonably likely to materially affect, the Registrant’s internal control over financial reporting. |
Item 12. Disclosure of Securities Lending Activities for Closed-End Management Investment Companies.
Not applicable.
Item 13. Exhibits.
SIGNATURES
Pursuant to the requirements of the Securities Exchange Act of 1934 and the Investment Company Act of 1940, the Registrant has duly caused this report to be signed on its behalf by the undersigned, thereunto duly authorized.
| | |
| Smead Funds Trust |
|
| By: /s/ Cole W. Smead |
| Cole W. Smead |
| President |
| (Principal Executive Officer) |
|
| Date: August 5, 2022 |
Pursuant to the requirements of the Securities Exchange Act of 1934 and the Investment Company Act of 1940, this report has been signed below by the following persons on behalf of the Registrant and in the capacities and on the dates indicated.
| | |
| By: /s/ Cole W. Smead |
| Cole W. Smead |
| President |
| (Principal Executive Officer) |
|
| Date: August 5, 2022 |
|
| By: /s/ Steven J. LeMire |
| Steven J. LeMire |
| Treasurer |
| (Principal Financial Officer) |
|
| Date: August 5, 2022 |