UNITED STATES
SECURITIES AND EXCHANGE COMMISSION
Washington, D.C. 20549
FORM N-CSR
CERTIFIED SHAREHOLDER REPORT OF
REGISTERED MANAGEMENT INVESTMENT COMPANIES
Investment Company Act file number: 811-22985
SMEAD FUNDS TRUST
(Exact name of registrant as specified in charter)
2777 East Camelback Road, Suite 375
Phoenix, AZ 85016
(Address of principal executive offices) (Zip code)
Cole W. Smead
Smead Capital Management, Inc.
2777 East Camelback Road, Suite 375
Phoenix, AZ 85016
Copy to:
Pamela M. Krill, Esq
Godfrey & Kahn, S.C.
833 East Michigan Street, Suite 1800
Milwaukee, WI 53202
(Name and address of agent for service)
Registrant’s telephone number, including area code: (877) 701-2883
Date of fiscal year end: November 30
Date of reporting period: May 31, 2023
Item 1. Report to Shareholders.
(a) Report pursuant to Rule 30e-1
Semi-Annual Report

May 31, 2023
Investment Adviser
Smead Capital Management, Inc.
2777 East Camelback Road
Suite 375
Phoenix, AZ 85016
Phone: 877-807-4122
www.smeadfunds.com
Table of Contents
May 2023 Semi-Annual Letter: Smead Value Fund
Victims of Our Own Success
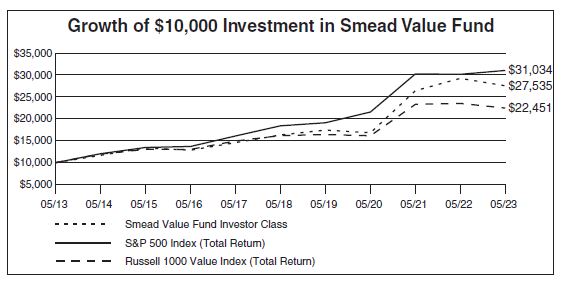
In the first half of the 2023 fiscal year, we suffered from the success of the two prior fiscal years. The Smead Value Fund (SMVLX) declined 9.10% versus a gain in the S&P 500 Index of 3.33% and a decline in the Russell 1000 Value Index of 5.40%. We had beaten both of those indices handily in fiscal 2021 and 2022, with a cumulative gain of 50.20%. This is compared to gains of 16.10% in the S&P 500 Index and a gain of 25.15% in the Russell 1000 Value Index. We have never expected straight-line results.
When you look at the history of the Fund, we have had several cases where the results were poor following strong prior performance. We beat the indices five years in a row from 2011-2015 and then suffered in 2016. We got hit hard in fiscal 2020 in the pandemic shutdown after a solid three-year performance in 2017-2019.
Our best-performing common stocks in the first half of fiscal 2023 were DR Horton (DHI), Lennar (LEN) and NVR (NVR). The home builders shocked everyone but us, as their resilience and profitability showed right through the biggest Federal Reserve tightening of credit in the last 40 years. Our biggest detractors were Ovintiv (OVV), Occidental Petroleum (OXY) and Amgen (AMGN). Ovintiv was purchased with some of the proceeds of our trade out of Continental Resources (CLR) at the end of the prior fiscal year and was purchased before the correction in oil and gas had run its course. Occidental Petroleum (OXY) was the best performer in the S&P 500 Index in fiscal 2022. It deserved a rest and so did Amgen (AMGN), which had a strong fiscal 2022.
What is Next for the Smead Value Fund?
We believe that we are in a stock market dominated by two countervailing forces. First, we’ve entered a period of stubborn inflation. This is defined in our economics textbooks as too many people (Millennials), with too much money ($9 trillion in Federal Government monetized borrowing), chasing too few goods! Review 1971-1981, if you want to see when too many baby boomers, with too much Vietnam War/Johnson’s Great Society borrowed money, were chasing too few goods.
Second, we are unwinding a financial euphoria mania for tech/growth/crypto/memes/IPOs-SPACs and just about anything under the sun that free money caused to be popular at the same time. If you don’t view the current upsurge in tech stocks as a bear market rally, go study the 2000-2003 breaking of the DotCom Bubble in the NASDAQ Composite Index. There were three earth-shattering rallies in that composite over three years, while the index lost 81% from peak to trough.
On the positive side, our portfolio is very cheap relative to both indices and is overweighted in the sectors which offer favorable returns in a stubborn inflationary environment. The chart below shows how the current performance of commodities (like oil and gas) has been since the bottom in April of 2020 as compared to the last two major positive commodity super-cycles:
1
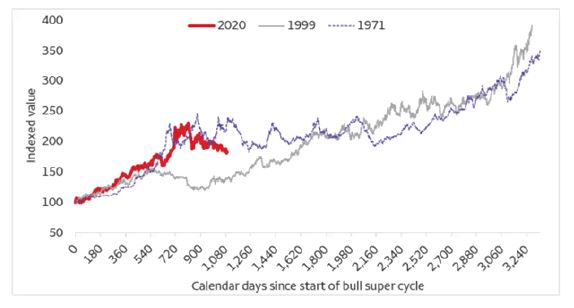
Source: Wells Fargo Investment Institute, “The commodity bull super-cycle: Why super-cycles matter, what we are seeing next, and what it means for investors” published March 30, 2023.
The current correction in our oil and gas investments is tracking right with the prior commodity super cycles. Since we are very over-weighted in oil and gas, we expect this bodes well for the next 5-10 years as the cycle plays out. Hopefully, we will get another chance to be victims of our own success. On the other hand, we have very little exposure to today’s popular tech stocks if their bear market reemerges. As always, fear stock market failure.
Warmest regards,
| | |

| | 
|
| |
| William Smead | | Cole Smead, CFA |
| Lead Portfolio Manager | | Co-Portfolio Manager |
The information contained herein represents the opinion of Smead Capital Management, Inc. and is not intended to be a forecast of future events, a guarantee of future results, nor investment advice.
Consider the investment objectives, risks, charges and expenses of the Fund carefully before investing. The statutory and summary prospectuses contain this and other information about the Fund and are available at www.smeadcap.com or by calling 877-807-4122. Read carefully before investing.
2
Performance data quoted represents past performance; past performance does not guarantee future results. The investment return and principal value of an investment will fluctuate so that an investor’s shares, when redeemed, may be worth more or less than their original cost. Current performance of the Fund may be lower or higher than the performance quoted. Performance data current to the most recent month end may be obtained by calling 877-807-4122.
Must be preceded or accompanied by a prospectus.
Mutual fund investing involves risk. Principal loss is possible.
The S&P 500® Index is a broad-based unmanaged index of 500 stocks, which is widely recognized as representative of the equity market in general. The Russell 1000® Value Index measures the performance of those Russell 1000® Index companies with lower price-to-book ratios and lower forecasted growth values. Frank Russell Company is the source and owner of the trademarks, service marks and copyrights related to the Russell Indexes. Russell® is a trademark of Russell Investment Group. One cannot invest directly in an index.
The Smead Value Fund is distributed by UMB Distribution Services, LLC. UMB Distribution services, and Smead Capital Management, Inc. are not affiliated.
3
May 2023 Semi-Annual Letter: Smead International Value Fund
As we close on the first half of the fiscal year of the Smead International Value Fund (SVXLX) in 2023, we feel blessed to be side-by-side with our investors and in the position we are in with the portfolio.
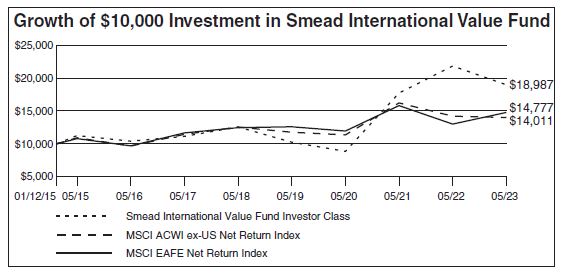
The Fund lost 0.08% during the first half of the fiscal year versus a gain of 6.81% for the MSCI EAFE Net Return Index and a gain of 4.77% for the MSCI ACWI ex-US Net Return Index. While we are pleased by the start, we know that in the short run the market is a voting machine but in the long run it’s a weighing machine.
Our largest contributors so far this year are our holdings in Unicredit SPA (UCG IM), BMW (BMW GR) and Porsche AG (P911 GR). Our sole consumer staples holding, Alimen Couche-Tard, was the strongest contributor by sector and performed well in a difficult market.
The largest detractors in the portfolio were Whitehaven Coal (WHC AU), Cenovus Energy (CVE CN) and Universal Music Group (UMG NA). Economic fears in the global economy drove our cyclical businesses in energy and materials. While these fears are overblown, we must stare at lower stock quotes in the interim. We believe the pricing is going to be stronger in the time ahead, but short-term news is driving stock prices.
The Boredom of Good Poker
Today’s market has not been very rewarding to shareholders. There has been very little change in the value of our holdings since the beginning of 2022. Fortunately, we have a much longer-term perspective. We invest based on the view that delayed gratification will build a cumulative advantage over time for our wealth. The frustrating part is that may not happen year to year. This is very similar to the boredom of playing good poker.
During the depths of the pandemic, I was itching to live free again. This caused me to head out on a couple of road trips. Twice, I put a couple of my kids in the car and headed to the city of busted dreams, Las Vegas. We went there to take advantage of cheap hotels and restaurants with no wait. The kids would tell you it was the lazy river at the MGM. I also selfishly wanted to sit down next to total strangers and find a cash no limit Texas hold’em poker game.
Poker is such an interesting game to think about because the outcome is unknown. Like stocks, each player at the table has different incentives on any given hand, due to the difference in chip stacks. Much like brokerage in stock investing, the house takes a vig on each hand as well.
I’m a Smead, which means you play conservative-aggressive poker. You only play good cards (pairs or face cards). This can produce success over time, especially when you have someone playing bad cards next to you. However, there is no guarantee it will pay off each hour or each day. During one of those trips, I played poker for four hours. In the end, I had made no money but had lost none either. I had only entertained myself, which I still counted as a win. This is not why you take risks though. You take risks to make money.
You will occasionally sit down at a table where a person is playing terrible cards (think 2-7 off-suit), but they get lucky and take down some huge pots. This makes no sense based on the odds. The lucky player seems successful at the time and can have success playing lucky cards for a while, but usually, the luck runs out. You hope you’re still solvent at that point.
4
We find ourselves in analogous stock market circumstances. We argued a year ago that we have the best hand at the table and that patience should reward us. We’ve had hands like this in past years, and we don’t know when we’ll get rewarded, just like we didn’t know back then. There has been a large bounce in speculative investments and aggressive risk-taking by market participants. This isn’t because the environment has changed, but it doesn’t feel exactly like it did one year ago to stock market investors. This happens in poker and our style of investing.
Below is a chart from GMO showing the 2000-2003 bear market outperformance of value versus growth by month. They highlighted the months where growth outperformed value.
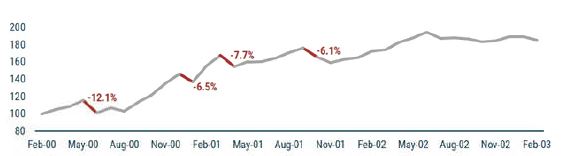
Growth stocks rallied on and off before the stock market eventually crushed the chip stacks to next to nothing. Value created large chips stacks as it outperformed by over 80%. These rallies seemed so real to stock market participants, just like the aggressive player feels when playing terrible cards in Vegas. In 2023, value has only outperformed in the month of April globally. At the poker table, no one stops and asks what the poker gods or the felt table are telling us. Everyone knows that odds are odds in poker. Stock investors always state the foolish phrase: What is the market telling us? There is much more wishful thinking in stocks.
We continue to play our conservative-aggressive discipline in the Fund using our eight criteria while being ever patient. In stock investing, we can’t claim entertainment as a win. There is only one goal, making money. Closely following that is Buffett’s old rule: don’t lose money. His second rule: refer back to rule #1.
Our approach to the hand that we have has caused us to be aggressive by continuing to invest in the energy business. This includes coal businesses like Whitehaven Coal (WHC AU) and Thungela Resources (TGA LN). The conservative part of these companies is that they sit with cash as a percentage of market cap ranging from 40% to 80%. The aggressive part is that investors are unwilling to own them due to ESG reasons and the idea they are dead businesses. Demand hasn’t gone down, but that is the fear.
We know that very few investors will go down these routes to make money. This is nothing new. Keynes told us that investors would rather fail conventionally than succeed unconventionally. It is definitely unconventional to tell large pools of wealth that we are excited about old-world businesses.
The main thing we want our investors to understand is that our approach remains the same. The reward timeline remains the question, but we believe the end goal remains in sight. We have to enjoy the process of playing good cards and not be willing to place a bet on any hand, like the other players, just to get in a game. We have to be comfortable and patient with the boredom of playing good poker.
5
Fear stock market failure,
| | |
| |
|
| |
| Cole Smead, CFA | | William Smead |
| Lead Portfolio Manager | | Co-Portfolio Manager |
The information contained herein represents the opinion of Smead Capital Management, Inc. and is not intended to be a forecast of future events, a guarantee of future results, nor investment advice.
Consider the investment objectives, risks, charges and expenses of the Fund carefully before investing. The statutory and summary prospectuses contain this and other information about the Fund and are available at www.smeadcap.com or by calling 877-807-4122. Read carefully before investing.
Performance data quoted represents past performance; past performance does not guarantee future results. The investment return and principal value of an investment will fluctuate so that an investor’s shares, when redeemed, may be worth more or less than their original cost. Current performance of the Fund may be lower or higher than the performance quoted. Performance data current to the most recent month end may be obtained by calling 877-807-4122.
Must be preceded or accompanied by a prospectus.
Mutual fund investing involves risk. Principal loss is possible.
Foreign Securities Risk. Investments in securities of foreign companies involve additional risks, including less liquidity, currency rate fluctuations, political and economic instability, differences in financial reporting standards and securities market regulation, and the imposition of foreign withholding taxes.
MSCI EAFE Index (Net) (Europe, Australasia, Far East) is a broad-based, unmanaged equity market index designed to measure the equity market performance of 21 developed markets, excluding the US and Canada. An index cannot be invested indirectly. This benchmark calculates reinvested dividends net of withholding taxes using Luxembourg tax rates. MSCI ACWI ex-US Index (Net) is a free float-adjusted market capitalization index that is designed to large and mid-cap representation across 22 of 23 Developed Markets (DM) countries (excluding the US) and 24 Emerging Markets (EM) countries. This benchmark calculates reinvested dividends net of withholding taxes using Luxembourg tax rates. One cannot invest directly in an index.
The Smead International Value Fund is distributed by UMB Distribution Services, LLC. UMB Distribution Services, and Smead Capital Management, Inc. are not affiliated.
6
SMEAD FUNDS
Expense Examples
(Unaudited)
As a shareholder of the Funds, you incur two types of costs: (1) transaction costs, including sales charges (loads) on purchase payments and (2) ongoing costs, including management fees, distribution (12b-1) fees, shareholder servicing fees and other Fund expenses. These Examples are intended to help you understand your ongoing costs (in dollars) of investing in the Funds, and to compare these costs with the ongoing costs of investing in other mutual funds. The Examples are based on an investment of $1,000 invested at the beginning of the period and held for the entire period as indicated below.
Actual Expenses
The second and fourth columns of the following tables provide information about actual account values and actual expenses of each Class of the Funds. If you purchase Class A shares of the Funds you will pay a maximum initial sales charge of 5.75% when you invest. Class A shares and Class C shares of Smead Value Fund and the Smead International Value Fund are subject to a contingent deferred sales charge of 1.00% for purchases of $1,000,000 or more that are redeemed within eighteen months of purchase for Class A shares and redeemed within twelve months of purchase for Class C shares. In addition, you will be assessed fees for outgoing wire transfers, returned checks and stop payment orders at prevailing rates charged by UMB Fund Services, Inc., the Funds’ transfer agent. To the extent the Funds invest in shares of exchange-traded funds (“ETFs”) or other investment companies as part of their investment strategies, you will indirectly bear your proportionate share of any fees and expenses charged by the underlying funds in which the Funds invest in addition to the expenses of the Funds. Actual expenses of the underlying funds are expected to vary among the various underlying funds. These expenses are not included in the Examples. The Examples include, but are not limited to, advisory fees, fund administration and accounting, custody and transfer agent fees. You may use the information in the second and fourth columns, together with the amount you invested, to estimate the expenses that you paid over the period. Simply divide your account value by $1,000 (for example, an $8,600 account value divided by $1,000 = 8.6), then multiply the result by the applicable number under the column entitled “Actual Expenses Paid During Period” to estimate the expenses you paid on your account during this period.
Hypothetical Example for Comparison Purposes
The third and fifth columns of the following tables provide information about hypothetical account values and hypothetical expenses based on the Funds’ actual expense ratios and an assumed rate of return of 5% per year before expenses, which are not the Funds’ actual returns. The hypothetical account values and expenses may not be used to estimate the actual ending account balance or expenses you paid for the period. You may use this information to compare the ongoing costs of investing in the Funds and other funds.To do so, compare this 5% hypothetical example with the 5% hypothetical examples that appear in the shareholder reports of other funds. Please note that the expenses shown in the table are meant to highlight your ongoing costs only and do not reflect any transactional costs, such as sales charges (loads), redemption fees or exchange fees. Therefore, the third and fifth columns of the table are useful in comparing ongoing costs only, and will not help you determine the relative total costs of owning different funds. In addition, if these transactional costs were included, your costs would have been higher.
7
SMEAD FUNDS
Expense Examples (Continued)
(Unaudited)
Smead Value Fund
| | | | | | | | | | | | | | | | | | | | | | | | | | | | | | |
Class | | Beginning
Account
Value
12/1/22 | | Actual
Ending
Account
Value
5/31/23 | | Hypothetical
Ending
Account
Value | | Actual
Expenses
Paid
During
Period | | Hypothetical
Expenses
Paid During
Period | | Net
Expense
Ratio
During
Period |
Investor Class | | $1,000.00 | | $909.00 | | $1,018.90 | | $5.76 | | $6.09 | | 1.21% |
Class A | | 1,000.00 | | 909.00 | | 1,018.90 | | 5.76 | | 6.09 | | 1.21 |
Class C | | 1,000.00 | | 906.40 | | 1,016.01 | | 8.51 | | 9.00 | | 1.79 |
Class I1 | | 1,000.00 | | 910.20 | | 1,020.24 | | 4.48 | | 4.73 | | 0.94 |
Class R1 | | 1,000.00 | | 907.60 | | 1,017.25 | | 7.32 | | 7.75 | | 1.54 |
Class R2 | | 1,000.00 | | 908.30 | | 1,018.00 | | 6.61 | | 6.99 | | 1.39 |
Class Y | | 1,000.00 | | 911.00 | | 1,020.99 | | 3.76 | | 3.98 | | 0.79 |
Smead International Value Fund
| | | | | | | | | | | | | | | | | | | | | | | | | | | | | | |
Class | | Beginning
Account
Value
12/1/2022 | | Actual
Ending
Account
Value
5/31/23 | | Hypothetical
Ending
Account
Value | | Actual
Expenses
Paid
During
Period | | Hypothetical
Expenses
Paid During
Period | | Net
Expense
Ratio
During
Period |
Investor Class | | $1,000.00 | | $951.10 | | $1,018.70 | | $6.08 | | $6.29 | | 1.25% |
Class A | | 1,000.00 | | 950.00 | | 1,017.85 | | 6.90 | | 7.14 | | 1.42 |
Class C | | 1,000.00 | | 947.40 | | 1,014.96 | | 9.71 | | 10.05 | | 2.00 |
Class I1 | | 1,000.00 | | 951.40 | | 1,019.20 | | 5.59 | | 5.79 | | 1.15 |
Class Y | | 1,000.00 | | 952.30 | | 1,019.95 | | 4.87 | | 5.04 | | 1.00 |
8
SMEAD FUNDS
Investment Highlights
(Unaudited)
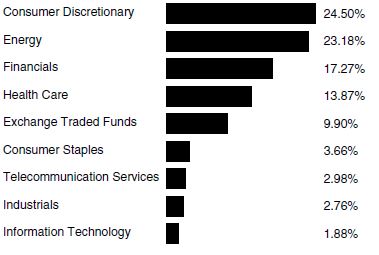
The Smead Value Fund seeks long-term capital appreciation. To achieve its investment objective, the Fund maintains approximately 25-30 companies in its portfolio and will invest in the common stocks of large capitalization U.S. companies.
Sector Breakdown
(% of equity Investments as of May 31, 2023)
Top Ten Holdings (% of Net Assets as of May 31, 2023)*
| | | | | |
Occidental Petroleum Corp. | | | | 8.07% | |
| |
Merck & Co., Inc. | | | | 6.81% | |
| |
Lennar Corp. – Class A | | | | 6.61% | |
| |
DR Horton, Inc. | | | | 6.34% | |
| |
American Express Co. | | | | 5.90% | |
| |
Simon Property Group, Inc. – REIT | | | | 5.21% | |
| |
Amgen, Inc. | | | | 5.19% | |
| |
ConocoPhillips | | | | 4.90% | |
| |
NVR, Inc. | | | | 4.60% | |
| |
Macerich Co. (The) – REIT | | | | 4.15% | |
* Does not Include Short-Term Investments
Fund holdings are subject to change at any time and should not be considered recommendations to buy or sell any security. Current and future portfolio holdings are subject to risk.
Continued
9
SMEAD FUNDS
Investment Highlights (Continued)
(Unaudited)
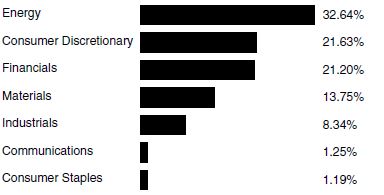
The Smead International Value Fund seeks long-term capital appreciation. To achieve its investment objective, the Fund maintains approximately 25-30 companies in its portfolio and will invest in the common stocks of large capitalization non-U.S. companies.
Sector Breakdown
(% of equity Investments as of May 31, 2023)
Top Ten Holdings (% of Net Assets as of May 31, 2023)*
| | | | | |
MEG Energy Corp. | | | | 8.78% | |
| |
Occidental Petroleum Corp. – Warrants | | | | 7.46% | |
| |
Occidental Petroleum Corp. | | | | 7.04% | |
| |
UniCredit SpA | | | | 6.75% | |
| |
Cenovus Energy, Inc. | | | | 6.52% | |
| |
Frontline PLC | | | | 4.78% | |
| |
West Fraser Timber Co. Ltd. | | | | 4.62% | |
| |
BAWAG Group AG | | | | 4.57% | |
| |
Interfor Corp. | | | | 4.45% | |
| |
Porsche Automobil Holding SE | | | | 4.23% | |
* Does not Include Short-Term Investments
Fund holdings are subject to change at any time and should not be considered recommendations to buy or sell any security. Current and future portfolio holdings are subject to risk.
Continued
10
SMEAD FUNDS
Investment Highlights (Continued)
(Unaudited)
Average Annual Total Returns for the period ended May 31, 2023
| | | | | | | | | | | | | | | | |
| | | Inception
Date | | 1 Year | | 5 Years | | 10 Years | | Since
Inception |
Smead Value Fund – Investor Class | | | | 1/2/2008 | | | (5.81)% | | 11.03% | | 10.66% | | | | 9.01% | |
| | | | | |
Smead Value Fund – Class A | | | | 1/27/2014 | | | (5.82)% | | 11.02% | | N/A | | | | 10.20% | |
| | | | | |
Smead Value Fund – Class C | | | | 4/16/2020 | | | (6.34)% | | N/A | | N/A | | | | 20.91% | |
| | | | | |
Smead Value Fund – Class I1 | | | | 12/18/2009 | | | (5.57)% | | 11.31% | | 10.95% | | | | 13.10% | |
| | | | | |
Smead Value Fund – Class R1 | | | | 11/25/2014 | | | (6.11)% | | 10.72% | | N/A | | | | 9.16% | |
| | | | | |
Smead Value Fund – Class R2 | | | | 11/25/2014 | | | (6.00)% | | 11.58% | | N/A | | | | 9.66% | |
| | | | | |
Smead Value Fund – Class Y | | | | 11/25/2014 | | | (5.47)% | | 11.44% | | N/A | | | | 9.90% | |
| | | | | |
S&P 500® Index (Total Return) | | | | | | | 2.92% | | 11.01% | | 11.99% | | | | 9.31% | |
| | | | | |
Russell 1000® Value Index (Total Return) | | | | | | | (4.55)% | | 6.78% | | 8.42% | | | | 6.76% | |
Average Annual Total Returns for the period ended May 31, 2023
| | | | | | | | | | | | | | | | |
| | | Inception
Date(1) | | 1 Year | | 5 Years(2) | | 10 Years | | Since
Inception(1)(2) |
| | | | | |
Smead International Value Fund – Investor Class | | | | 1/12/2015 | | | (13.06)% | | 8.60% | | N/A | | 7.95% |
| | | | | |
Smead International Value Fund – Class A | | | | 1/12/2015 | | | (13.25)% | | 8.42% | | N/A | | 7.78% |
| | | | | |
Smead International Value Fund – Class C | | | | 1/12/2015 | | | (13.65)% | | 7.80% | | N/A | | 7.16% |
| | | | | |
Smead International Value Fund – Class I1 | | | | 1/12/2015 | | | (12.97)% | | 8.72% | | N/A | | 8.08% |
| | | | | |
Smead International Value Fund – Class Y | | | | 1/12/2015 | | | (12.78)% | | 8.88% | | N/A | | 8.22% |
| | | | | |
MSCI All Country World Index ex-USA (Net-USD) | | | | | | | (1.41)% | | 2.22% | | N/A | | 4.11% |
| | | | | |
MSCI EAFE Index Net | | | | | | | 3.06% | | 3.21% | | N/A | | 4.77% |
| (1) | On January 11, 2022, the Fund succeeded to substantially all of the assets and liabilities of the Smead International Value Fund LP, a Delaware Limited Partnership (the “Predecessor Fund”), in exchange solely for Class I1 shares of the Fund (the “Reorganization”). Smead Private Fund Advisers, LLC, an affiliate of Smead Capital Management, Inc., the investment adviser to the Fund (the “Adviser”), served as the General Partner for the Predecessor Fund since its inception on January 12, 2015. |
| (2) | Includes the historical performance of the Predecessor Fund prior to the date of Reorganization. |
Performance data quoted represents past performance and does not guarantee future results. The investment return and principal value of an investment will fluctuate so
Continued
11
SMEAD FUNDS
Investment Highlights (Continued)
(Unaudited)
that an investor’s shares, when redeemed, may be worth more or less than their original cost. Current performance of the Funds may be lower or higher than the performance quoted. Performance data current to the most recent month end may be obtained by calling 877-807-4122.
Investment performance for the Smead International Value Fund reflects fee waivers in effect. In the absence of such waivers, total returns would be reduced.
The returns shown assume reinvestment of Fund distributions and do not reflect the deduction of taxes that a shareholder would pay on Fund distributions or the redemption of Fund shares. The following graphs illustrate performance of hypothetical investments made in the Funds and broad-based securities indices on the Funds’ inception dates. The graphs do not reflect any future performance.
Continued
12
SMEAD FUNDS
Investment Highlights (Continued)
(Unaudited)
The S&P 500® Index is a broad based unmanaged index of 500 stocks, which is widely recognized as representative of the equity market in general.
Standard & Poor’s®, S&P®, S&P 500® and Standard & Poor’s 500® are trade names or trademarks of Standard & Poor’s Financial Services, LLC.
The Russell 1000® Value Index measures the performance of those Russell 1000® companies with lower price-to-book ratios and lower forecasted growth values.
Frank Russell Company is the source and owner of the trademarks, service marks and copyrights related to the Russell Indexes. Russell® is a trademark of Russell Investment Group.
The MSCI ACWI ex-US Net Return Index captures large, mid, small and micro cap representation across 22 of 23 Developed Markets (DM) countries (excluding the United States). With 8,723 constituents, the index covers approximately 99% of the free float adjusted market capitalization in each country.
The MSCI EAFE Net Return Index is designed to represent the performance of large and mid-cap securities across 21 developed markets, including countries in Europe, Australasia and the Far East, excluding the U.S. and Canada. It covers approximately 85% of the free float-adjusted market capitalization in each country.
One cannot invest directly in an index.
Continued
13
SMEAD VALUE FUND
|
|
Schedule of Investments |
|
| May 31, 2023 (Unaudited) |
| | | | | | | | | | |
| | | Shares | | Value |
COMMON STOCKS 94.57% | | | | | | | | | | |
| | |
Banks 7.47% | | | | | | | | | | |
Bank of America Corp. | | | | 5,463,890 | | | | $ | 151,841,503 | |
JPMorgan Chase & Co. | | | | 1,264,373 | | | | | 171,588,060 | |
| | | | | | | | | | |
| | | | | | | | | 323,429,563 | |
| | | | | | | | | | |
| | |
Consumer Durables & Apparel 17.55% | | | | | | | | | | |
DR Horton, Inc. | | | | 2,571,628 | | | | | 274,752,736 | |
Lennar Corp. – Class A | | | | 2,671,004 | | | | | 286,117,949 | |
NVR, Inc. (a) | | | | 35,884 | | | | | 199,307,630 | |
| | | | | | | | | | |
| | | | | | | | | 760,178,315 | |
| | | | | | | | | | |
| | |
Diversified Financials 8.86% | | | | | | | | | | |
American Express Co. | | | | 1,612,736 | | | | | 255,715,420 | |
Berkshire Hathaway, Inc. – Class B (a) | | | | 169,133 | | | | | 54,305,224 | |
Credit Acceptance Corp. (a) | | | | 165,859 | | | | | 73,920,039 | |
| | | | | | | | | | |
| | | | | | | | | 383,940,683 | |
| | | | | | | | | | |
| | |
Energy 21.92% | | | | | | | | | | |
APA Corp. | | | | 3,937,840 | | | | | 125,144,555 | |
ConocoPhillips | | | | 2,139,340 | | | | | 212,436,462 | |
Devon Energy Corp. | | | | 2,261,114 | | | | | 104,237,355 | |
Occidental Petroleum Corp. | | | | 6,066,040 | | | | | 349,767,867 | |
Ovintiv, Inc. | | | | 4,777,374 | | | | | 157,987,758 | |
| | | | | | | | | | |
| | | | | | | | | 949,573,997 | |
| | | | | | | | | | |
| | |
Media & Entertainment 2.82% | | | | | | | | | | |
Warner Bros Discovery, Inc. (a) | | | | 10,821,155 | | | | | 122,062,628 | |
| | | | | | | | | | |
| | |
Pharmaceuticals, Biotechnology & Life Sciences 13.12% | | | | | | | | | | |
Amgen, Inc. | | | | 1,018,494 | | | | | 224,730,701 | |
Merck & Co., Inc. | | | | 2,670,110 | | | | | 294,806,845 | |
Pfizer, Inc. | | | | 1,279,181 | | | | | 48,634,462 | |
| | | | | | | | | | |
| | | | | | | | | 568,172,008 | |
| | | | | | | | | | |
| | |
Real Estate 9.36% | | | | | | | | | | |
Macerich Co. (The) – REIT | | | | 18,635,020 | | | | | 179,641,594 | |
Simon Property Group, Inc. – REIT | | | | 2,146,540 | | | | | 225,708,681 | |
| | | | | | | | | | |
| | | | | | | | | 405,350,275 | |
| | | | | | | | | | |
The accompanying notes are an integral part of these financial statements.
14
SMEAD VALUE FUND
|
|
Schedule of Investments (Continued) |
|
| May 31, 2023 (Unaudited) |
| | | | | | | | | | |
| | | Shares | | Value |
| | |
Retailing 9.08% | | | | | | | | | | |
eBay, Inc. | | | | 2,971,908 | | | | $ | 126,424,966 | |
Home Depot, Inc. | | | | 411,903 | | | | | 116,753,905 | |
Target Corp. | | | | 1,145,148 | | | | | 149,934,228 | |
| | | | | | | | | | |
| | | | | | | | | 393,113,099 | |
| | | | | | | | | | |
| | |
Semiconductors & Semiconductor Equipment 1.78% | | | | | | | | | | |
Qualcomm, Inc. | | | | 679,378 | | | | | 77,048,259 | |
| | | | | | | | | | |
| | |
Transportation 2.61% | | | | | | | | | | |
U-Haul Holding Co. | | | | 490,753 | | | | | 25,897,036 | |
U-Haul Holding Co. (Non Voting) | | | | 1,883,009 | | | | | 87,164,486 | |
| | | | | | | | | | |
| | | | | | | | | 113,061,522 | |
| | | | | | | | | | |
TOTAL COMMON STOCKS (Cost $3,897,692,076) | | | | | | | | | 4,095,930,349 | |
| | | | | | | | | | |
| | |
SHORT-TERM INVESTMENTS 5.42% | | | | | | | | | | |
| | |
Money Market Fund 5.42% | | | | | | | | | | |
Northern Institutional Treasury Portfolio — Premier Class, 4.93% (b) | | | | 234,544,499 | | | | | 234,544,499 | |
| | | | | | | | | | |
TOTAL SHORT-TERM INVESTMENTS (Cost $234,544,499) | | | | | | | | | 234,544,499 | |
| | | | | | | | | | |
TOTAL INVESTMENTS (Cost $4,132,236,575) 99.99% | | | | | | | | | 4,330,474,848 | |
Other Assets in Excess of Liabilities 0.01% | | | | | | | | | 520,998 | |
| | | | | | | | | | |
TOTAL NET ASSETS 100% | | | | | | | | $ | 4,330,995,846 | |
| | | | | | | | | | |
| (a) | Non-income producing security. |
| (b) | The rate shown is the 1-month performance for the month ended May 31, 2023. |
REIT — Real Estate Investment Trust
The Global Industry Classification Standard (GICS®) was developed by and/or is the exclusive property of MSCI, Inc. and Standard & Poor Financial Services LLC (“S&P”). GICS® is a service mark of MSCI and S&P and has been licensed for use by Smead Capital Management, Inc. for the purpose of Industry Classification in the Schedule of Investments.
The accompanying notes are an integral part of these financial statements.
15
SMEAD INTERNATIONAL VALUE FUND
|
|
Schedule of Investments |
|
| May 31, 2023 (Unaudited) |
| | | | | | | | | | |
| | | Shares | | Value |
COMMON STOCKS 79.92% | | | | | | | | | | |
| | |
Australia 2.43% | | | | | | | | | | |
Materials 2.43% | | | | | | | | | | |
Whitehaven Coal Ltd. | | | | 554,765 | | | | $ | 2,032,966 | |
| | | | | | | | | | |
| | |
Austria 4.57% | | | | | | | | | | |
Financials 4.57% | | | | | | | | | | |
BAWAG Group AG (a),(b) | | | | 87,642 | | | | | 3,825,784 | |
| | | | | | | | | | |
| | |
Canada 30.08% | | | | | | | | | | |
Consumer Discretionary 2.61% | | | | | | | | | | |
Canada Goose Holdings, Inc. (b) | | | | 137,583 | | | | | 2,190,180 | |
| | | | | | | | | | |
| | |
Consumer Staples 1.16% | | | | | | | | | | |
Alimentation Couche-Tard, Inc. | | | | 20,011 | | | | | 968,930 | |
| | | | | | | | | | |
| | |
Energy 17.24% | | | | | | | | | | |
Cenovus Energy, Inc. | | | | 341,918 | | | | | 5,463,132 | |
MEG Energy Corp. (b) | | | | 486,523 | | | | | 7,350,708 | |
Whitecap Resources, Inc. | | | | 237,451 | | | | | 1,624,987 | |
| | | | | | | | | | |
| | | | | | | | | 14,438,827 | |
| | | | | | | | | | |
| | |
Materials 9.07% | | | | | | | | | | |
Interfor Corp. (b) | | | | 254,978 | | | | | 3,728,408 | |
West Fraser Timber Co. Ltd. | | | | 57,248 | | | | | 3,863,344 | |
| | | | | | | | | | |
| | | | | | | | | 7,591,752 | |
| | | | | | | | | | |
| | | | | | | | | 25,189,689 | |
| | | | | | | | | | |
| | |
Denmark 2.63% | | | | | | | | | | |
Consumer Discretionary 2.63% | | | | | | | | | | |
Pandora AS | | | | 27,603 | | | | | 2,205,135 | |
| | | | | | | | | | |
| | |
Germany 2.13% | | | | | | | | | | |
Consumer Discretionary 2.13% | | | | | | | | | | |
Bayerische Motoren Werke AG | | | | 16,345 | | | | | 1,780,672 | |
| | | | | | | | | | |
| | |
Italy 10.82% | | | | | | | | | | |
Financials 10.82% | | | | | | | | | | |
Assicurazioni Generali SpA | | | | 179,057 | | | | | 3,404,125 | |
| | | | | | | | | | |
UniCredit SpA | | | | 293,751 | | | | | 5,653,095 | |
| | | | | | | | | | |
| | | | | | | | | 9,057,220 | |
| | | | | | | | | | |
The accompanying notes are an integral part of these financial statements.
16
SMEAD INTERNATIONAL VALUE FUND
|
|
Schedule of Investments (Continued) |
|
| May 31, 2023 (Unaudited) |
| | | | | | | | | | |
| | | Shares | | Value |
| | |
Netherlands 1.22% | | | | | | | | | | |
Communications 1.22% | | | | | | | | | | |
Universal Music Group NV | | | | 51,515 | | | | $ | 1,020,220 | |
| | | | | | | | | | |
| | |
Norway 4.78% | | | | | | | | | | |
Industrials 4.78% | | | | | | | | | | |
Frontline PLC | | | | 281,052 | | | | | 4,006,372 | |
| | | | | | | | | | |
| | |
South Africa 1.88% | | | | | | | | | | |
Materials 1.88% | | | | | | | | | | |
Thungela Resources Ltd. | | | | 225,107 | | | | | 1,576,310 | |
| | | | | | | | | | |
| | |
Spain 3.16% | | | | | | | | | | |
Financials 3.16% | | | | | | | | | | |
Bankinter SA | | | | 458,646 | | | | | 2,645,967 | |
| | | | | | | | | | |
| | |
Switzerland 3.33% | | | | | | | | | | |
Industrials 3.33% | | | | | | | | | | |
IWG PLC (b) | | | | 1,527,833 | | | | | 2,786,723 | |
| | | | | | | | | | |
| | |
United Kingdom 5.85% | | | | | | | | | | |
Consumer Discretionary 3.78% | | | | | | | | | | |
Next PLC | | | | 18,736 | | | | | 1,484,770 | |
WH Smith PLC | | | | 85,453 | | | | | 1,677,798 | |
| | | | | | | | | | |
| | | | | | | | | 3,162,568 | |
| | | | | | | | | | |
| | |
Financials 2.07% | | | | | | | | | | |
NatWest Group PLC | | | | 533,911 | | | | | 1,732,968 | |
| | | | | | | | | | |
| | | | | | | | | 4,895,536 | |
| | | | | | | | | | |
| | |
United States 7.04% | | | | | | | | | | |
Energy 7.04% | | | | | | | | | | |
Occidental Petroleum Corp. | | | | 102,187 | | | | | 5,892,102 | |
| | | | | | | | | | |
TOTAL COMMON STOCKS (Cost $66,587,585) | | | | | | | | | 66,914,696 | |
| | | | | | | | | | |
| | |
PREFERRED STOCKS 9.88% | | | | | | | | | | |
| | |
Germany 9.88% | | | | | | | | | | |
Consumer Discretionary 9.88% | | | | | | | | | | |
Dr Ing hc F Porsche AG, 0.87% (a),(c) | | | | 11,431 | | | | | 1,419,162 | |
Porsche Automobil Holding SE, 4.92% (c) | | | | 63,928 | | | | | 3,543,318 | |
Volkswagen AG, 7.50% (c) | | | | 26,530 | | | | | 3,309,249 | |
| | | | | | | | | | |
TOTAL PREFERRED STOCKS (Cost $10,702,746) | | | | | | | | | 8,271,729 | |
| | | | | | | | | | |
The accompanying notes are an integral part of these financial statements.
17
SMEAD INTERNATIONAL VALUE FUND
|
|
Schedule of Investments (Continued) |
|
| May 31, 2023 (Unaudited) |
| | | | | | | | | | |
| | | Shares | | Value |
WARRANTS 7.46% | | | | | | | | | | |
| | |
United States 7.46% | | | | | | | | | | |
Energy 7.46% | | | | | | | | | | |
Occidental Petroleum Corp., Exp. 7/6/2027, Strike $22.00 (b) | | | | 175,049 | | | | | 6,245,748 | |
| | | | | | | | | | |
TOTAL WARRANTS (Cost $3,108,275) | | | | | | | | | 6,245,748 | |
| | | | | | | | | | |
| | |
SHORT-TERM INVESTMENTS 3.31% | | | | | | | | | | |
| | |
Money Market Fund 3.31% | | | | | | | | | | |
Northern Institutional Treasury Portfolio — Premier Class, 4.93% (d) | | | | 2,770,230 | | | | | 2,770,230 | |
| | | | | | | | | | |
TOTAL SHORT-TERM INVESTMENTS (Cost $2,770,230) | | | | | | | | | 2,770,230 | |
| | | | | | | | | | |
TOTAL INVESTMENTS (Cost $83,168,836) 100.57% | | | | | | | | | 84,202,403 | |
Other Assets in Excess of Liabilities (0.57)% | | | | | | | | | (477,255 | ) |
| | | | | | | | | | |
TOTAL NET ASSETS 100.00% | | | | | | | | $ | 83,725,148 | |
| | | | | | | | | | |
| (a) | Security exempt from registration under Rule 144A of the Securities Act of 1933. This security may be resold in transactions exempt from registration, normally to qualified institutional buyers. At May 31, 2023, the value of this security totaled $5,244,946 or 6.27% of net assets. |
| (b) | Non-income producing security. |
| (c) | Current yield is disclosed. Dividends are calculated based on a percentage of the issuer’s net income. |
| (d) | The rate shown is the 1-month performance for the month ended May 31, 2023. |
The Global Industry Classification Standard (GICS®) was developed by and/or is the exclusive property of MSCI, Inc. and Standard & Poor Financial Services LLC (“S&P”). GICS® is a service mark of MSCI and S&P and has been licensed for use by Smead Capital Management, Inc. for the purpose of Industry Classification in the Schedule of Investments.
The accompanying notes are an integral part of these financial statements.
18
SMEAD VALUE FUND
|
|
| Statement of Assets and Liabilities |
|
| May 31, 2023 (Unaudited) |
| | | | | |
Assets | | | | | |
Investments, at value (cost $4,132,236,575) | | | $ | 4,330,474,848 | |
Receivable for Fund shares sold | | | | 3,710,937 | |
Dividends and interest receivable | | | | 12,273,215 | |
Other assets | | | | 356,466 | |
| | | | | |
Total Assets | | | | 4,346,815,466 | |
| | | | | |
| |
Liabilities | | | | | |
Payable for Fund shares redeemed | | | | 10,067,047 | |
Payable to Adviser | | | | 2,880,991 | |
Payable to Administrator | | | | 902 | |
Payable for distribution fees | | | | 132,541 | |
Payable for shareholder servicing fees | | | | 2,333,582 | |
Accrued expenses and other liabilities | | | | 404,557 | |
| | | | | |
Total Liabilities | | | | 15,819,620 | |
| | | | | |
Net assets | | | $ | 4,330,995,846 | |
| | | | | |
| |
Net Assets Consist Of: | | | | | |
Paid in capital | | | $ | 4,071,719,045 | |
Total distributable earnings | | | | 259,276,801 | |
| | | | | |
Net assets | | | $ | 4,330,995,846 | |
| | | | | |
| |
Investor Class Shares | | | | | |
Net assets | | | $ | 92,539,503 | |
Shares of beneficial interest outstanding (unlimited number of shares authorized, $0.001 par value) | | | | 1,463,846 | |
Net asset value, offering price and redemption price per share | | | $ | 63.22 | |
| | | | | |
| |
Class A Shares | | | | | |
Net assets | | | $ | 379,915,774 | |
Shares of beneficial interest outstanding (unlimited number of shares authorized, $0.001 par value) | | | | 6,067,726 | |
Net asset value, offering price and redemption price per share(1) | | | $ | 62.61 | |
| | | | | |
Maximum offering price per share ($62.61/0.9425) (2) | | | $ | 66.43 | |
| | | | | |
| |
Class C Shares | | | | | |
Net assets | | | $ | 42,791,208 | |
Shares of beneficial interest outstanding (unlimited number of shares authorized, $0.001 par value) | | | | 700,265 | |
Net asset value, offering price and redemption price per share(1) | | | $ | 61.11 | |
| | | | | |
The accompanying notes are an integral part of these financial statements.
19
SMEAD VALUE FUND
|
|
| Statement of Assets and Liabilities (Continued) |
|
| May 31, 2023 (Unaudited) |
| | | | | |
Class I1 Shares | | | | | |
Net assets | | | $ | 3,472,872,164 | |
Shares of beneficial interest outstanding (unlimited number of shares authorized, $0.001 par value) | | | | 54,933,577 | |
Net asset value, offering price and redemption price per share | | | $ | 63.22 | |
| | | | | |
| |
Class R1 Shares | | | | | |
Net assets | | | $ | 218,994 | |
Shares of beneficial interest outstanding (unlimited number of shares authorized, $0.001 par value) | | | | 3,530 | |
Net asset value, offering price and redemption price per share | | | $ | 62.04 | |
| | | | | |
| |
Class R2 Shares | | | | | |
Net assets | | | $ | 72,805 | |
Shares of beneficial interest outstanding (unlimited number of shares authorized, $0.001 par value) | | | | 1,133 | |
Net asset value, offering price and redemption price per share | | | $ | 64.27 | (3) |
| | | | | |
| |
Class Y Shares | | | | | |
Net assets | | | $ | 342,585,398 | |
Shares of beneficial interest outstanding (unlimited number of shares authorized, $0.001 par value) | | | | 5,408,168 | |
Net asset value, offering price and redemption price per share | | | $ | 63.35 | |
| | | | | |
| (1) | A 1.00% deferred sales charge (CDSC) applies to Class A purchases of $1,000,000 or more that are redeemed within 18 months of purchase. A CDSC of 1.00% also applies on redemptions of Class C shares within 12 months of purchase. |
| (2) | Reflects a maximum sales charge of 5.75%. |
| (3) | Calculated NAV may not equal actual NAV shown due to rounding of the net assets and shares. |
The accompanying notes are an integral part of these financial statements.
20
SMEAD INTERNATIONAL VALUE FUND
|
|
| Statement of Assets and Liabilities |
|
| May 31, 2023 (Unaudited) |
| | | | | |
Assets | | | | | |
Investments, at value (cost $83,168,836) | | | $ | 84,202,403 | |
Receivable for Fund shares sold | | | | 7,965 | |
Dividends and interest receivable | | | | 33,022 | |
Foreign currencies, at value (cost $52) | | | | 50 | |
Receivable for foreign tax reclaimable | | | | 228,502 | |
Other assets | | | | 63,244 | |
| | | | | |
Total Assets | | | | 84,535,186 | |
| | | | | |
| |
Liabilities | | | | | |
Payable for Fund shares redeemed | | | | 29,555 | |
Payable to Adviser | | | | 55,717 | |
Payable to Administrator | | | | 7,832 | |
Payable for investments purchased | | | | 651,222 | |
Payable for distribution fees | | | | 1,112 | |
Payable for shareholder servicing fees | | | | 19,948 | |
Accrued expenses and other liabilities | | | | 44,652 | |
| | | | | |
Total Liabilities | | | | 810,038 | |
| | | | | |
Net assets | | | $ | 83,725,148 | |
| | | | | |
| |
Net Assets Consist Of: | | | | | |
Paid in capital | | | $ | 85,938,255 | |
Total distributable earnings (accumulated loss) | | | | (2,213,107 | ) |
| | | | | |
Net assets | | | $ | 83,725,148 | |
| | | | | |
| |
Investor Class Shares | | | | | |
Net assets | | | $ | 31,802 | |
Shares of beneficial interest outstanding (unlimited number of shares authorized, $0.001 par value) | | | | 680 | |
Net asset value, offering price and redemption price per share | | | $ | 46.78 | (1) |
| | | | | |
| |
Class A Shares | | | | | |
Net assets | | | $ | 4,243,122 | |
Shares of beneficial interest outstanding (unlimited number of shares authorized, $0.001 par value) | | | | 91,697 | |
Net asset value, offering price and redemption price per share(2) | | | $ | 46.27 | |
| | | | | |
Maximum offering price per share ($46.27/0.9425) (3) | | | $ | 49.09 | |
| | | | | |
| |
Class C Shares | | | | | |
Net assets | | | $ | 218,731 | |
Shares of beneficial interest outstanding (unlimited number of shares authorized, $0.001 par value) | | | | 4,969 | |
Net asset value, offering price and redemption price per share(2) | | | $ | 44.02 | |
| | | | | |
The accompanying notes are an integral part of these financial statements.
21
SMEAD INTERNATIONAL VALUE FUND
|
|
| Statement of Assets and Liabilities (Continued) |
|
| May 31, 2023 (Unaudited) |
| | | | | |
Class I1 Shares | | | | | |
Net assets | | | $ | 43,476,131 | |
Shares of beneficial interest outstanding (unlimited number of shares authorized, $0.001 par value) | | | | 920,001 | |
Net asset value, offering price and redemption price per share | | | $ | 47.26 | |
| | | | | |
| |
Class Y Shares | | | | | |
Net assets | | | $ | 35,755,362 | |
Shares of beneficial interest outstanding (unlimited number of shares authorized, $0.001 par value) | | | | 749,035 | |
Net asset value, offering price and redemption price per share | | | $ | 47.74 | |
| | | | | |
| (1) | Calculated NAV may not equal actual NAV shown due to rounding of the net assets and shares. |
| (2) | A 1.00% deferred sales charge (CDSC) applies to Class A purchases of $1,000,000 or more that are redeemed within 18 months of purchase. A CDSC of 1.00% also applies on redemptions of Class C shares within 12 months of purchase. |
| (3) | Reflects a maximum sales charge of 5.75%. |
The accompanying notes are an integral part of these financial statements.
22
SMEAD VALUE FUND
|
|
| Statement of Operations |
|
| May 31, 2023 (Unaudited) |
| | | | | |
Investment Income | | | | | |
Dividend income | | | $ | 58,251,858 | |
| | | | | |
Total Investment Income | | | | 58,251,858 | |
| | | | | |
| |
Expenses | | | | | |
Management fees | | | | 17,251,434 | |
Distribution fees – Investor Class | | | | 126,610 | |
Distribution fees – Class A | | | | 505,728 | |
Distribution fees – Class C | | | | 162,732 | |
Distribution fees – Class R1 | | | | 579 | |
Distribution fees – Class R2 | | | | 188 | |
Shareholder servicing fees – Investor Class | | | | 86,094 | |
Shareholder servicing fees – Class A | | | | 343,893 | |
Shareholder servicing fees – Class C | | | | 54,244 | |
Shareholder servicing fees – Class I1 | | | | 2,758,456 | |
Shareholder servicing fees – Class R1 | | | | 290 | |
Shareholder servicing fees – Class R2 | | | | 37 | |
Administration fees | | | | 11,051 | |
Transfer agent fees and expenses | | | | 234,046 | |
Fund accounting fees | | | | 264,446 | |
Federal and state registration fees | | | | 47,195 | |
Custody fees | | | | 31,869 | |
Reports to shareholders | | | | 116,860 | |
Legal fees | | | | 88,451 | |
Audit and tax fees | | | | 11,044 | |
Trustees’ fees | | | | 101,783 | |
Other expenses | | | | 96,181 | |
| | | | | |
Total Expenses | | | | 22,293,211 | |
| | | | | |
| |
Net Investment Income | | | | 35,958,647 | |
| | | | | |
| |
Realized and Unrealized Gain on Investments | | | | | |
Net realized loss on investments | | | | (13,095,763 | ) |
Net realized gain from in-kind redemptions | | | | 68,639,006 | |
Change in net unrealized depreciation on investments | | | | (515,313,839 | ) |
| | | | | |
Net Realized and Unrealized Loss on Investments | | | | (459,770,596 | ) |
| | | | | |
Net Decrease in Net Assets from Operations | | | $ | (423,811,949 | ) |
| | | | | |
The accompanying notes are an integral part of these financial statements.
23
SMEAD INTERNATIONAL VALUE FUND
|
|
| Statement of Operations |
|
| May 31, 2023 (Unaudited) |
| | | | | |
Investment Income | | | | | |
Dividend income (net of taxes withheld of $255,216) | | | $ | 2,333,079 | |
Interest income | | | | 182 | |
| | | | | |
Total Investment Income | | | | 2,333,261 | |
| | | | | |
| |
Expenses | | | | | |
Management fees | | | | 312,664 | |
Distribution fees – Investor Class | | | | 37 | |
Distribution fees – Class A | | | | 4,867 | |
Distribution fees – Class C | | | | 1,240 | |
Shareholder servicing fees – Class A | | | | 3,310 | |
Shareholder servicing fees – Class C | | | | 413 | |
Shareholder servicing fees – Class I1 | | | | 32,198 | |
Administration fees | | | | 121,901 | |
Transfer agent fees and expenses | | | | 30,309 | |
Fund accounting fees | | | | 52,959 | |
Federal and state registration fees | | | | 16,389 | |
Custody fees | | | | 88,960 | |
Reports to shareholders | | | | 5,073 | |
Legal fees | | | | 7,212 | |
Audit and tax fees | | | | 11,090 | |
Trustees’ fees | | | | 1,448 | |
Other expenses | | | | 7,916 | |
| | | | | |
Total Expenses | | | | 697,986 | |
| | | | | |
Expense waiver by Adviser | | | | (218,948 | ) |
Expense waiver by service provider | | | | (20,065 | ) |
| | | | | |
Net Expenses | | | | 458,973 | |
| | | | | |
| |
Net Investment Income | | | | 1,874,288 | |
| | | | | |
| |
Realized and Unrealized Gain on Investments | | | | | |
Net realized loss on investments | | | | (895,151 | ) |
Net realized gain on foreign currency transactions | | | | 17,540 | |
Change in net unrealized depreciation on investments | | | | (5,753,154 | ) |
Change in net unrealized depreciation on foreign currency | | | | (83 | ) |
| | | | | |
Net Realized and Unrealized Loss on Investments | | | | (6,630,848 | ) |
| | | | | |
Net Decrease in Net Assets from Operations | | | $ | (4,756,560 | ) |
| | | | | |
The accompanying notes are an integral part of these financial statements.
24
SMEAD VALUE FUND
|
|
| Statements of Changes in Net Assets |
|
| |
| | | | | | | | | | |
| | | Six Months Ended
May 31, 2023
(Unaudited) | | For The Year Ended
November 30, 2022 |
From Operations | | | | | | | | | | |
Net investment income | | | $ | 35,958,647 | | | | $ | 37,333,443 | |
Net realized gain from investments | | | | 55,543,243 | | | | | 307,522,667 | |
Change in net unrealized depreciation on investments | | | | (515,313,839 | ) | | | | (117,997,490 | ) |
| | | | | | | | | | |
Net increase (decrease) in net assets from operations | | | | (423,811,949 | ) | | | | 226,858,620 | |
| | | | | | | | | | |
| | |
From Distributions | | | | | | | | | | |
Investor Class | | | | (1,771,485 | ) | | | | (4,255,078 | ) |
Class A | | | | (7,460,942 | ) | | | | (11,256,332 | ) |
Class C | | | | (590,592 | ) | | | | (682,470 | ) |
Class I1 | | | | (72,422,216 | ) | | | | (102,566,190 | ) |
Class R1 | | | | (3,744 | ) | | | | (6,379 | ) |
Class R2 | | | | (1,000 | ) | | | | (3,885 | ) |
Class Y | | | | (7,794,488 | ) | | | | (10,684,125 | ) |
| | | | | | | | | | |
Decrease in net assets resulting from distributions paid | | | | (90,044,467 | ) | | | | (129,454,459 | ) |
| | | | | | | | | | |
| | |
From Capital Share Transactions | | | | | | | | | | |
Proceeds from shares sold | | | | 1,102,220,058 | | | | | 2,694,052,838 | |
Issued in reinvestment of dividends and distributions | | | | 67,139,759 | | | | | 88,737,360 | |
Payments for shares redeemed | | | | (824,016,482 | ) | | | | (1,441,973,313 | ) |
| | | | | | | | | | |
Net increase in net assets from capital share transactions | | | | 345,343,335 | | | | | 1,340,816,885 | |
| | | | | | | | | | |
Total Increase (Decrease) in Net Assets | | | | (168,513,081 | ) | | | | 1,438,221,046 | |
| | | | | | | | | | |
| | |
Net Assets | | | | | | | | | | |
Beginning of year | | | | 4,499,508,927 | | | | | 3,061,287,881 | |
| | | | | | | | | | |
End of year | | | $ | 4,330,995,846 | | | | $ | 4,499,508,927 | |
| | | | | | | | | | |
The accompanying notes are an integral part of these financial statements.
25
SMEAD INTERNATIONAL VALUE FUND
|
|
| Statements of Changes in Net Assets |
|
| |
| | | | | | | | | | |
| | | Six Months Ended
May 31, 2023
(Unaudited) | | For The Period Ended
November 30, 20221 |
From Operations | | | | | | | | | | |
Net investment income | | | $ | 1,874,288 | | | | $ | 565,985 | |
Net realized loss from investments | | | | (895,151 | ) | | | | (3,750,135 | ) |
Net realized gain from foreign currency transactions | | | | 17,540 | | | | | 9,092 | |
Change in net unrealized appreciation (depreciation) on investments | | | | (5,753,154 | ) | | | | 3,638,737 | |
Change in net unrealized depreciation on foreign currency transactions | | | | (83 | ) | | | | (825 | ) |
| | | | | | | | | | |
Net increase (decrease) in net assets from operations | | | | (4,756,560 | ) | | | | 462,854 | |
| | | | | | | | | | |
| | |
From Distributions | | | | | | | | | | |
Investor Class | | | | (255 | ) | | | | - | |
Class A | | | | (31,070 | ) | | | | - | |
Class C | | | | (2,993 | ) | | | | - | |
Class I1 | | | | (547,621 | ) | | | | - | |
Class Y | | | | (485,446 | ) | | | | - | |
| | | | | | | | | | |
Decrease in net assets resulting from distributions paid | | | | (1,067,385 | ) | | | | - | |
| | | | | | | | | | |
| | |
From Capital Share Transactions | | | | | | | | | | |
Proceeds from shares sold | | | | 19,298,050 | | | | | 79,963,231 | |
Issued in reinvestment of dividends and distributions | | | | 1,039,547 | | | | | - | |
Payments for shares redeemed | | | | (6,322,954 | ) | | | | (4,891,635 | ) |
| | | | | | | | | | |
Net increase in net assets from capital share transactions | | | | 14,014,643 | | | | | 75,071,596 | |
| | | | | | | | | | |
Total Increase in Net Assets | | | | 8,190,698 | | | | | 75,534,450 | |
| | | | | | | | | | |
| | |
Net Assets | | | | | | | | | | |
Beginning of year | | | | 75,534,450 | | | | | - | |
| | | | | | | | | | |
End of year | | | $ | 83,725,148 | | | | $ | 75,534,450 | |
| | | | | | | | | | |
| 1 | Period from January 12, 2022, date operations commenced, through November 30, 2022. |
The accompanying notes are an integral part of these financial statements.
26
(This Page Intentionally Left Blank.)
SMEAD VALUE FUND
|
|
Financial Highlights |
|
| May 31, 2023 |
| | | | | | | | | | | | | | | | | | | | | | | | | | | | | | | | | | | |
| | | | |
Income from investment operations | | Less distributions paid |
| | | Net Asset
Value,
Beginning
of Period | | Net
investment
income(1) | | Net realized
and
unrealized
gain/(loss) on
investments | | Total from
investment
operations | | Distributions
from net
investment
income | | Distributions
from net
realized gain
on
investments | | Total
distributions
paid |
| | | | | | | |
Investor Class | | | | | | | | | | | | | | | | | | | | | | | | | | | | | | | | | | | |
Six Months Ended May 31, 2023 (Unaudited) | | | $ | 70.77 | | | | $ | 0.44 | | | | $ | (6.81 | ) | | | $ | (6.37 | ) | | | $ | (0.47 | ) | | | $ | (0.71 | ) | | | $ | (1.18 | ) |
November 30, 2022 | | | | 69.63 | | | | | 0.49 | | | | | 3.35 | | | | | 3.84 | | | | | (0.15 | ) | | | | (2.55 | ) | | | | (2.70 | ) |
November 30, 2021 | | | | 49.68 | | | | | 0.17 | | | | | 20.49 | | | | | 20.66 | | | | | (0.35 | ) | | | | (0.36 | ) | | | | (0.71 | ) |
November 30, 2020 | | | | 51.55 | | | | | 0.52 | | | | | (0.47 | ) | | | | 0.05 | | | | | (0.35 | ) | | | | (1.57 | ) | | | | (1.92 | ) |
November 30, 2019 | | | | 49.13 | | | | | 0.33 | | | | | 5.19 | | | | | 5.52 | | | | | — | | | | | (3.10 | ) | | | | (3.10 | ) |
November 30, 2018 | | | | 47.29 | | | | | 0.19 | | | | | 3.75 | | | | | 3.94 | | | | | (0.10 | ) | | | | (2.00 | ) | | | | (2.10 | ) |
| | | | | | | |
Class A | | | | | | | | | | | | | | | | | | | | | | | | | | | | | | | | | | | |
Six Months Ended May 31, 2023 (Unaudited) | | | | 70.13 | | | | | 0.44 | | | | | (6.76 | ) | | | | (6.32 | ) | | | | (0.49 | ) | | | | (0.71 | ) | | | | (1.20 | ) |
November 30, 2022 | | | | 69.08 | | | | | 0.50 | | | | | 3.31 | | | | | 3.81 | | | | | (0.21 | ) | | | | (2.55 | ) | | | | (2.76 | ) |
November 30, 2021 | | | | 49.32 | | | | | 0.17 | | | | | 20.32 | | | | | 20.49 | | | | | (0.37 | ) | | | | (0.36 | ) | | | | (0.73 | ) |
November 30, 2020 | | | | 51.20 | | | | | 0.50 | | | | | (0.45 | ) | | | | 0.05 | | | | | (0.36 | ) | | | | (1.57 | ) | | | | (1.93 | ) |
November 30, 2019 | | | | 48.82 | | | | | 0.33 | | | | | 5.15 | | | | | 5.48 | | | | | — | | | | | (3.10 | ) | | | | (3.10 | ) |
November 30, 2018 | | | | 47.03 | | | | | 0.22 | | | | | 3.72 | | | | | 3.94 | | | | | (0.15 | ) | | | | (2.00 | ) | | | | (2.15 | ) |
| | | | | | | |
Class C | | | | | | | | | | | | | | | | | | | | | | | | | | | | | | | | | | | |
Six Months Ended May 31, 2023 (Unaudited) | | | | 68.42 | | | | | 0.24 | | | | | (6.59 | ) | | | | (6.35 | ) | | | | (0.25 | ) | | | | (0.71 | ) | | | | (0.96 | ) |
November 30, 2022 | | | | 67.70 | | | | | 0.15 | | | | | 3.21 | | | | | 3.36 | | | | | (0.09 | ) | | | | (2.55 | ) | | | | (2.64 | ) |
November 30, 2021 | | | | 48.70 | | | | | (0.18 | ) | | | | 20.00 | | | | | 19.82 | | | | | (0.46 | ) | | | | (0.36 | ) | | | | (0.82 | ) |
November 30, 2020(5) | | | | 36.22 | | | | | 0.08 | | | | | 12.40 | (6) | | | | 12.48 | | | | | — | | | | | — | | | | | — | |
| | | | | | | |
Class I1 | | | | | | | | | | | | | | | | | | | | | | | | | | | | | | | | | | | |
Six Months Ended May 31, 2023 (Unaudited) | | | | 70.88 | | | | | 0.53 | | | | | (6.82 | ) | | | | (6.29 | ) | | | | (0.66 | ) | | | | (0.71 | ) | | | | (1.37 | ) |
November 30, 2022 | | | | 69.74 | | | | | 0.68 | | | | | 3.35 | | | | | 4.03 | | | | | (0.34 | ) | | | | (2.55 | ) | | | | (2.89 | ) |
November 30, 2021 | | | | 49.78 | | | | | 0.34 | | | | | 20.47 | | | | | 20.81 | | | | | (0.49 | ) | | | | (0.36 | ) | | | | (0.85 | ) |
November 30, 2020 | | | | 51.65 | | | | | 0.62 | | | | | (0.43 | ) | | | | 0.19 | | | | | (0.49 | ) | | | | (1.57 | ) | | | | (2.06 | ) |
November 30, 2019 | | | | 49.10 | | | | | 0.47 | | | | | 5.19 | | | | | 5.66 | | | | | (0.01 | ) | | | | (3.10 | ) | | | | (3.11 | ) |
November 30, 2018 | | | | 47.33 | | | | | 0.33 | | | | | 3.72 | | | | | 4.05 | | | | | (0.28 | ) | | | | (2.00 | ) | | | | (2.28 | ) |
| | | | | | | |
Class R1 | | | | | | | | | | | | | | | | | | | | | | | | | | | | | | | | | | | |
Six Months Ended May 31, 2023 (Unaudited) | | | | 69.48 | | | | | 0.33 | | | | | (6.69 | ) | | | | (6.36 | ) | | | | (0.37 | ) | | | | (0.71 | ) | | | | (1.08 | ) |
November 30, 2022 | | | | 68.42 | | | | | 0.30 | | | | | 3.31 | | | | | 3.61 | | | | | — | | | | | (2.55 | ) | | | | (2.55 | ) |
November 30, 2021 | | | | 48.81 | | | | | (0.03 | ) | | | | 20.21 | | | | | 20.18 | | | | | (0.21 | ) | | | | (0.36 | ) | | | | (0.57 | ) |
November 30, 2020 | | | | 50.46 | | | | | 0.38 | | | | | (0.46 | ) | | | | (0.08 | ) | | | | — | | | | | (1.57 | ) | | | | (1.57 | ) |
November 30, 2019 | | | | 48.30 | | | | | 0.19 | | | | | 5.07 | | | | | 5.26 | | | | | — | | | | | (3.10 | ) | | | | (3.10 | ) |
November 30, 2018 | | | | 46.57 | | | | | 0.06 | | | | | 3.69 | | | | | 3.75 | | | | | (0.02 | ) | | | | (2.00 | ) | | | | (2.02 | ) |
The accompanying notes are an integral part of these financial statements.
28
| | | | | | | | | | | | | | | | | | | | | | | | | | | | | | | | | | | | | | |
| | | | | | | Ratio of expenses to
average net assets | | Ratio of net investment income
(loss) to average net assets | | |
Net Asset
Value,
End of
Period | | Total
Return(2) | | Net
assets
at end of
period
(000’s) | | Before
waivers and
recoupment
of expenses | | After
waivers and
recoupment
of expenses | | Before
waivers and
recoupment
of expenses | | After
waivers and
recoupments
of expenses | | Portfolio
turnover
rate |
| | | | | | | |
| | | | | | | | | | | | | | | | | | | | | | | | | | | | | | | | | | | | | | | |
| | | $63.22 | | | | | (9.10 | )%(3) | | | $ | 92,540 | | | | | 1.21 | %(4) | | | | 1.21 | %(4) | | | | 1.32 | %(4) | | | | 1.32 | %(4) | | | | 5.87 | %(3) |
| | | 70.77 | | | | | 5.70 | % | | | | 107,324 | | | | | 1.19 | % | | | | 1.19 | % | | | | 0.73 | % | | | | 0.73 | % | | | | 11.15 | % |
| | | 69.63 | | | | | 42.10 | % | | | | 109,938 | | | | | 1.19 | % | | | | 1.19 | % | | | | 0.27 | % | | | | 0.27 | % | | | | 17.40 | % |
| | | 49.68 | | | | | 0.09 | % | | | | 79,894 | | | | | 1.22 | % | | | | 1.22 | % | | | | 1.16 | % | | | | 1.16 | % | | | | 40.26 | % |
| | | 51.55 | | | | | 12.38 | % | | | | 117,805 | | | | | 1.24 | % | | | | 1.24 | % | | | | 0.71 | % | | | | 0.71 | % | | | | 20.75 | % |
| | | 49.13 | | | | | 8.65 | % | | | | 136,278 | | | | | 1.24 | % | | | | 1.26 | % | | | | 0.43 | % | | | | 0.41 | % | | | | 10.98 | % |
| | | | | | | |
| | | | | | | | | | | | | | | | | | | | | | | | | | | | | | | | | | | | | | | |
| | | 62.61 | | | | | (9.10 | )%(3) | | | | 379,916 | | | | | 1.21 | %(4) | | | | 1.21 | %(4) | | | | 1.31 | %(4) | | | | 1.31 | %(4) | | | | 5.87 | %(3) |
| | | 70.13 | | | | | 5.69 | % | | | | 427,616 | | | | | 1.19 | % | | | | 1.19 | % | | | | 0.76 | % | | | | 0.76 | % | | | | 11.15 | % |
| | | 69.08 | | | | | 42.11 | % | | | | 274,607 | | | | | 1.20 | % | | | | 1.20 | % | | | | 0.27 | % | | | | 0.27 | % | | | | 17.40 | % |
| | | 49.32 | | | | | 0.08 | % | | | | 105,555 | | | | | 1.23 | % | | | | 1.23 | % | | | | 1.14 | % | | | | 1.14 | % | | | | 40.26 | % |
| | | 51.20 | | | | | 12.35 | % | | | | 119,181 | | | | | 1.24 | % | | | | 1.24 | % | | | | 0.72 | % | | | | 0.72 | % | | | | 20.75 | % |
| | | 48.82 | | | | | 8.80 | % | | | | 122,653 | | | | | 1.19 | % | | | | 1.19 | % | | | | 0.47 | % | | | | 0.47 | % | | | | 10.98 | % |
| | | | | | | |
| | | | | | | | | | | | | | | | | | | | | | | | | | | | | | | | | | | | | | | |
| | | 61.11 | | | | | (9.36 | )%(3) | | | | 42,791 | | | | | 1.79 | %(4) | | | | 1.79 | %(4) | | | | 0.74 | %(4) | | | | 0.74 | %(4) | | | | 5.87 | %(3) |
| | | 68.42 | | | | | 5.13 | % | | | | 41,043 | | | | | 1.75 | % | | | | 1.75 | % | | | | 0.23 | % | | | | 0.23 | % | | | | 11.15 | % |
| | | 67.70 | | | | | 41.29 | % | | | | 16,544 | | | | | 1.76 | % | | | | 1.76 | % | | | | (0.27 | )% | | | | (0.27 | )% | | | | 17.40 | % |
| | | 48.70 | | | | | 34.46 | %(3) | | | | 199 | | | | | 1.85 | %(4) | | | | 1.84 | %(4) | | | | 0.27 | %(4) | | | | 0.28 | %(4) | | | | 40.26 | %(3) |
| | | | | | | |
| | | | | | | | | | | | | | | | | | | | | | | | | | | | | | | | | | | | | | | |
| | | 63.22 | | | | | (8.98 | )%(3) | | | | 3,472,872 | | | | | 0.94 | %(4) | | | | 0.94 | %(4) | | | | 1.59 | %(4) | | | | 1.59 | %(4) | | | | 5.87 | %(3) |
| | | 70.88 | | | | | 5.99 | % | | | | 3,531,198 | | | | | 0.93 | % | | | | 0.93 | % | | | | 1.01 | % | | | | 1.01 | % | | | | 11.15 | % |
| | | 69.74 | | | | | 42.43 | % | | | | 2,417,546 | | | | | 0.93 | % | | | | 0.93 | % | | | | 0.54 | % | | | | 0.54 | % | | | | 17.40 | % |
| | | 49.78 | | | | | 0.36 | % | | | | 947,872 | | | | | 0.97 | % | | | | 0.97 | % | | | | 1.40 | % | | | | 1.40 | % | | | | 40.26 | % |
| | | 51.65 | | | | | 12.67 | % | | | | 1,066,128 | | | | | 0.97 | % | | | | 0.97 | % | | | | 1.00 | % | | | | 1.00 | % | | | | 20.75 | % |
| | | 49.10 | | | | | 8.93 | % | | | | 963,978 | | | | | 0.97 | % | | | | 0.98 | % | | | | 0.72 | % | | | | 0.70 | % | | | | 10.98 | % |
| | | | | | | |
| | | | | | | | | | | | | | | | | | | | | | | | | | | | | | | | | | | | | | | |
| | | 62.04 | | | | | (9.24 | )%(3) | | | | 219 | | | | | 1.54 | %(4) | | | | 1.54 | %(4) | | | | 0.99 | %(4) | | | | 0.99 | %(4) | | | | 5.87 | %(3) |
| | | 69.48 | | | | | 5.45 | % | | | | 241 | | | | | 1.49 | % | | | | 1.49 | % | | | | 0.46 | % | | | | 0.46 | % | | | | 11.15 | % |
| | | 68.42 | | | | | 41.75 | % | | | | 171 | | | | | 1.49 | % | | | | 1.49 | % | | | | (0.05 | )% | | | | (0.05 | )% | | | | 17.40 | % |
| | | 48.81 | | | | | (0.18 | )% | | | | 291 | | | | | 1.52 | % | | | | 1.52 | % | | | | 0.85 | % | | | | 0.85 | % | | | | 40.26 | % |
| | | 50.46 | | | | | 12.01 | % | | | | 872 | | | | | 1.55 | % | | | | 1.55 | % | | | | 0.43 | % | | | | 0.43 | % | | | | 20.75 | % |
| | | 48.30 | | | | | 8.47 | % | | | | 792 | | | | | 1.50 | % | | | | 1.50 | % | | | | 0.12 | % | | | | 0.12 | % | | | | 10.98 | % |
29
SMEAD VALUE FUND
|
|
Financial Highlights (Continued) |
|
| May 31, 2023 |
| | | | | | | | | | | | | | | | | | | | | | | | | | | | | | | | | | | |
| | | | | Income from investment operations | | Less distributions paid |
| | | Net Asset
Value,
Beginning
of Period | | Net
investment
income(1) | | Net realized
and
unrealized
gain/(loss) on
investments | | Total from
investment
operations | | Distributions
from net
investments
income | | Distributions
from net
realized gain
on
investments | | Total
distributions
paid |
| | | | | | | |
Class R2 | | | | | | | | | | | | | | | | | | | | | | | | | | | | | | | | | | | |
Six Months Ended May 31, 2023 (Unaudited) | | | $ | 71.80 | | | | $ | 0.39 | | | | $ | (6.95 | ) | | | $ | (6.56 | ) | | | $ | (0.26 | ) | | | $ | (0.71 | ) | | | $ | (0.97 | ) |
November 30, 2022 | | | | 70.62 | | | | | 0.33 | | | | | 3.49 | | | | | 3.85 | | | | | (0.12 | ) | | | | (2.55 | ) | | | | (2.67 | ) |
November 30, 2021 | | | | 50.43 | | | | | 0.08 | | | | | 20.75 | | | | | 20.83 | | | | | (0.28 | ) | | | | (0.36 | ) | | | | (0.64 | ) |
November 30, 2020 | | | | 52.43 | | | | | 0.41 | | | | | (0.45 | ) | | | | (0.04 | ) | | | | (0.39 | ) | | | | (1.57 | ) | | | | (1.96 | ) |
November 30, 2019 | | | | 50.01 | | | | | 0.32 | | | | | 5.20 | | | | | 5.52 | | | | | — | | | | | (3.10 | ) | | | | (3.10 | ) |
November 30, 2018 | | | | 46.73 | | | | | (0.16 | ) | | | | 5.49 | | | | | 5.33 | | | | | (0.05 | ) | | | | (2.00 | ) | | | | (2.05 | ) |
| | | | | | | |
Class Y | | | | | | | | | | | | | | | | | | | | | | | | | | | | | | | | | | | |
Six Months Ended May 31, 2023 (Unaudited) | | | | 71.01 | | | | | 0.58 | | | | | (6.82 | ) | | | | (6.24 | ) | | | | (0.71 | ) | | | | (0.71 | ) | | | | (1.42 | ) |
November 30, 2022 | | | | 69.86 | | | | | 0.74 | | | | | 3.36 | | | | | 4.09 | | | | | (0.39 | ) | | | | (2.55 | ) | | | | (2.94 | ) |
November 30, 2021 | | | | 49.86 | | | | | 0.40 | | | | | 20.51 | | | | | 20.91 | | | | | (0.55 | ) | | | | (0.36 | ) | | | | (0.91 | ) |
November 30, 2020 | | | | 51.73 | | | | | 0.61 | | | | | (0.35 | ) | | | | 0.26 | | | | | (0.56 | ) | | | | (1.57 | ) | | | | (2.13 | ) |
November 30, 2019 | | | | 49.19 | | | | | 0.53 | | | | | 5.19 | | | | | 5.72 | | | | | (0.08 | ) | | | | (3.10 | ) | | | | (3.18 | ) |
November 30, 2018 | | | | 47.40 | | | | | 0.40 | | | | | 3.73 | | | | | 4.13 | | | | | (0.34 | ) | | | | (2.00 | ) | | | | (2.34 | ) |
| (1) | Based on average shares outstanding. |
| (2) | Total return in the above table represents the rate that the investor would have earned or lost on an investment in the Fund, assuming reinvestment of dividends. |
| (3) | Not annualized for periods of less than one year. |
| (4) | Annualized for periods of less than one year. |
| (5) | Class C shares commenced operations on April 16, 2020. |
| (6) | The amount shown for a share outstanding throughout the year does not correspond with the change in aggregate gains and losses in the portfolio of securities during the year because of the timing of sales and purchases of fund shares in relation to fluctuating values during the year. |
The accompanying notes are an integral part of these financial statements.
30
| | | | | | | | | | | | | | | | | | | | | | | | | | | | | | | | | | | | | | |
| | | | | | | Ratio of expenses to
average net assets | | Ratio of net investment income
(loss) to average net assets | | |
Net Asset
Value,
End of
Period | | Total
Return(2) | | Net assets
at end of
period
(000’s) | | Before
waivers and
recoupment
of expenses | | After
waivers and
recoupment
of expenses | | Before
waivers and
recoupment
of expenses | | After
waivers and
recoupments
of expenses | | Portfolio
turnover
rate |
| | | | | | | |
| | | | | | | | | | | | | | | | | | | | | | | | | | | | | | | | | | | | | | | |
| | | $64.27 | | | | | (9.17 | )%(3) | | | $ | 73 | | | | | 1.39 | %(4) | | | | 1.39 | %(4) | | | | 1.14 | %(4) | | | | 1.14 | %(4) | | | | 5.87 | %(3) |
| | | 71.80 | | | | | 5.57 | % | | | | 74 | | | | | 1.38 | % | | | | 1.38 | % | | | | 0.49 | % | | | | 0.49 | % | | | | 11.15 | % |
| | | 70.62 | | | | | 41.78 | % | | | | 95 | | | | | 1.40 | % | | | | 1.40 | % | | | | 0.11 | % | | | | 0.11 | % | | | | 17.40 | % |
| | | 50.43 | | | | | (0.10 | )% | | | | 73 | | | | | 1.43 | % | | | | 1.43 | % | | | | 0.91 | % | | | | 0.91 | % | | | | 40.26 | % |
| | | 52.43 | | | | | 12.12 | % | | | | 74 | | | | | 1.44 | % | | | | 1.44 | % | | | | 0.66 | % | | | | 0.66 | % | | | | 20.75 | % |
| | | 50.01 | | | | | 11.88 | % | | | | 10 | | | | | 1.44 | % | | | | 1.49 | % | | | | (0.28 | )% | | | | (0.33 | )% | | | | 10.98 | % |
| | | | | | | |
| | | | | | | | | | | | | | | | | | | | | | | | | | | | | | | | | | | | | | | |
| | | 63.35 | | | | | (8.90 | )%(3) | | | | 342,585 | | | | | 0.79 | %(4) | | | | 0.79 | %(4) | | | | 1.72 | %(4) | | | | 1.72 | %(4) | | | | 5.87 | %(3) |
| | | 71.01 | | | | | 6.06 | % | | | | 392,012 | | | | | 0.84 | % | | | | 0.84 | % | | | | 1.12 | % | | | | 1.11 | % | | | | 11.15 | % |
| | | 69.86 | | | | | 42.62 | % | | | | 242,387 | | | | | 0.84 | % | | | | 0.84 | % | | | | 0.63 | % | | | | 0.62 | % | | | | 17.40 | % |
| | | 49.86 | | | | | 0.48 | % | | | | 91,824 | | | | | 0.88 | % | | | | 0.84 | % | | | | 1.32 | % | | | | 1.36 | % | | | | 40.26 | % |
| | | 51.73 | | | | | 12.81 | % | | | | 15,443 | | | | | 0.86 | % | | | | 0.84 | % | | | | 1.12 | % | | | | 1.14 | % | | | | 20.75 | % |
| | | 49.19 | | | | | 9.11 | % | | | | 13,787 | | | | | 0.86 | % | | | | 0.84 | % | | | | 0.84 | % | | | | 0.86 | % | | | | 10.98 | % |
31
SMEAD INTERNATIONAL VALUE FUND
|
|
Financial Highlights |
|
| May 31, 2023 |
| | | | | | | | | | | | | | | | | | | | | | | | | | | | | | | | | | | |
| | | | | Income from investment operations | | Less distributions paid | | |
| | | Net Asset
Value,
Beginning
of Period | | Net
investment
income(1) | | Net realized
and
unrealized
gain (loss) on
investments | | Total from
investment
operations | | Distributions
from net
investments
income | | Net Asset
Value,
End of
Period | | Total
Return(2)(3) |
| | |
Investor Class | | | | | | | | | | |
Six Months Ended May 31, 2023 (Unaudited) | | | $ | 49.91 | | | | $ | 1.03 | | | | $ | (3.49 | ) | | | $ | (2.46 | ) | | | $ | (0.67 | ) | | | $ | 46.78 | | | | | (4.89 | )% |
November 30, 2022(5) | | | | 49.33 | | | | | 0.08 | | | | | 0.50 | | | | | 0.58 | | | | | — | | | | | 49.91 | | | | | 1.18 | % |
| | | | | | | |
Class A | | | | | | | | | | | | | | | | | | | | | | | | | | | | | | | | | | | |
Six Months Ended May 31, 2023 (Unaudited) | | | | 49.32 | | | | | 1.05 | | | | | (3.52 | ) | | | | (2.47 | ) | | | | (0.58 | ) | | | | 46.27 | | | | | (5.00 | )% |
November 30, 2022(5) | | | | 48.83 | | | | | 0.33 | | | | | 0.16 | | | | | 0.49 | | | | | — | | | | | 49.32 | | | | | 1.00 | % |
| | | | | | | |
Class C | | | | | | | | | | | | | | | | | | | | | | | | | | | | | | | | | | | |
Six Months Ended May 31, 2023 (Unaudited) | | | | 47.10 | | | | | 0.50 | | | | | (2.97 | ) | | | | (2.47 | ) | | | | (0.61 | ) | | | | 44.02 | | | | | (5.26 | )% |
November 30, 2022(5) | | | | 46.84 | | | | | (0.14 | )(6) | | | | 0.40 | | | | | 0.26 | | | | | — | | | | | 47.10 | | | | | 0.58 | % |
| | | | | | | |
Class I1 | | | | | | | | | | | | | | | | | | | | | | | | | | | | | | | | | | | |
Six Months Ended May 31, 2023 (Unaudited) | | | | 50.41 | | | | | 1.12 | | | | | (3.57 | ) | | | | (2.45 | ) | | | | (0.70 | ) | | | | 47.26 | | | | | (4.86 | )% |
November 30, 2022(5) | | | | 49.78 | | | | | 0.43 | | | | | 0.20 | | | | | 0.63 | | | | | — | | | | | 50.41 | | | | | 1.27 | % |
| | | | | | | |
Class Y | | | | | | | | | | | | | | | | | | | | | | | | | | | | | | | | | | | |
Six Months Ended May 31, 2023 (Unaudited) | | | | 50.91 | | | | | 1.16 | | | | | (3.60 | ) | | | | (2.44 | ) | | | | (0.73 | ) | | | | 47.74 | | | | | (4.77 | )% |
November 30, 2022(5) | | | | 50.18 | | | | | 0.49 | | | | | 0.24 | | | | | 0.73 | | | | | — | | | | | 50.91 | | | | | 1.45 | % |
| (1) | Based on average shares outstanding. |
| (2) | Total return in the above table represents the rate that the investor would have earned or lost on an investment in the Fund, assuming reinvestment of dividends. |
| (3) | Not annualized for periods of less than one year. |
| (4) | Annualized for periods of less than one year. |
| (5) | Period from January 12, 2022, date operations commenced, through November 30, 2022. |
| (6) | The amount shown for a share outstanding throughout the year does not correspond with the change in aggregate gains and losses in the portfolio of securities during the year because of the timing of sales and purchases of fund shares in relation to fluctuating values during the year. |
The accompanying notes are an integral part of these financial statements.
32
| | | | | | | | | | | | | | | | | | | | | | | | | | | | |
| | | Ratio of expenses to average net assets | | Ratio of net investment income
(loss) to average net assets | | |
Net
assets
at end of
period
(000’s) | | Before
waivers and
recoupment
of expenses | | After
waivers and
recoupment
of expenses | | Before
waivers and
recoupment
of expenses | | After
waivers and
recoupment
of expenses | | Portfolio
turnover
rate(3) |
| | | | | |
| | | | | | | | | | | | | | | | | | | | | | | | | | | | | |
| | $ | 32 | | | | | 1.83 | %(4) | | | | 1.25 | %(4) | | | | 3.57 | %(4) | | | | 4.15 | %(4) | | | | 5.54 | % |
| | | 19 | | | | | 1.42 | %(4) | | | | 1.42 | %(4) | | | | 0.19 | %(4) | | | | 0.19 | %(4) | | | | 20.30 | % |
| | | | | |
| | | | | | | | | | | | | | | | | | | | | | | | | | | | | |
| | | 4,243 | | | | | 2.00 | %(4) | | | | 1.42 | %(4) | | | | 3.71 | %(4) | | | | 4.29 | %(4) | | | | 5.54 | % |
| | | 2,630 | | | | | 1.51 | %(4) | | | | 1.51 | %(4) | | | | 0.78 | %(4) | | | | 0.78 | %(4) | | | | 20.30 | % |
| | | | | |
| | | | | | | | | | | | | | | | | | | | | | | | | | | | | |
| | | 219 | | | | | 2.60 | %(4) | | | | 2.00 | %(4) | | | | 1.54 | %(4) | | | | 2.14 | %(4) | | | | 5.54 | % |
| | | 106 | | | | | 2.02 | %(4) | | | | 2.02 | %(4) | | | | (0.34 | )%(4) | | | | (0.34 | )%(4) | | | | 20.30 | % |
| | | | | |
| | | | | | | | | | | | | | | | | | | | | | | | | | | | | |
| | | 43,476 | | | | | 1.72 | %(4) | | | | 1.15 | %(4) | | | | 3.90 | %(4) | | | | 4.47 | %(4) | | | | 5.54 | % |
| | | 39,428 | | | | | 1.23 | %(4) | | | | 1.23 | %(4) | | | | 0.99 | %(4) | | | | 0.99 | %(4) | | | | 20.30 | % |
| | | | | |
| | | | | | | | | | | | | | | | | | | | | | | | | | | | | |
| | | 35,755 | | | | | 1.57 | %(4) | | | | 1.00 | %(4) | | | | 3.99 | %(4) | | | | 4.56 | %(4) | | | | 5.54 | % |
| | | 33,351 | | | | | 1.15 | %(4) | | | | 1.00 | %(4) | | | | 0.97 | %(4) | | | | 1.12 | %(4) | | | | 20.30 | % |
33
SMEAD FUNDS
Notes to Financial Statements
May 31, 2023 (Unaudited)
The Smead Value Fund and the Smead International Value Fund (each, a “Fund” and together, the “Funds”) are non-diversified series of Smead Funds Trust, a Delaware statutory trust (the “Trust”) organized on July 17, 2014. The Trust is registered under the Investment Company Act of 1940, as amended (the “1940 Act”), as an open-end management investment company. Each Fund is an investment company and accordingly follows the investment company accounting and reporting guidance of the Financial Accounting Standards Board (FASB) Accounting Standard Codification Topic 946 Financial Services-Investment Companies. Each Fund’s investment objective is long-term capital appreciation. The Trust may issue an unlimited number of interests (or shares) of beneficial interest, each with a par value of $0.001. The Smead Value Fund currently offers ten classes of shares: Investor Class, Class A, Class C, Class I1, Class I2, Class R1, Class R2, Class R3, Class R4 and ClassY shares; provided however Class I2, Class R3 and Class R4 shares are not currently available for purchase. The Smead International Value Fund currently offers six classes of shares: Investor Class, Class A, Class C, Class I1, Class I2 and Class Y shares; provided however the Class I2 shares are not currently available for purchase. Each class of shares of the Funds has identical rights and privileges except with respect to the distribution and shareholder servicing fees, and voting rights on matters affecting a single class of shares. The classes differ principally in their respective distribution and shareholder servicing expenses. Costs incurred by the Funds in connection with the organization, registration and the initial public offering of shares were paid by Smead Capital Management, Inc., the Funds’ investment adviser (the “Adviser”).
The Smead International Value Fund succeeded to substantially all of the assets and liabilities of the Smead International Value Fund LP, a Delaware Limited Partnership, in exchange solely for Class I1 shares of the Fund on January 11, 2022 (the “Reorganization”).
In January 2022, the partners of the Smead International Value Fund, L.P. (the “International Partnership”) approved the conversion of the International Partnership into the Smead International Value Fund effective January 12, 2022. The Smead International Value Fund is a successor to the International Partnership and has substantially the same investment objectives and strategies as did the International Partnership. The conversion was accomplished through a tax-free exchange of 163,932 shares of Smead International Value Fund, for the value of $8,170,405. The investment portfolio of International Partnership with a fair value of $8,056,631, identified cost of $4,908,647 and unrealized appreciation of $3,147,984 at January 11, 2022, was the principal asset acquired by Smead International Value Fund. For financial reporting purposes, assets received and shares issued by Smead International Value Fund were recorded at fair value. However, the cost basis of the investments received from International Partnership was carried forward to align ongoing reporting of Smead International Value Fund’s realized and unrealized gains and losses with amounts distributable to shareholders for tax purposes.
34
SMEAD FUNDS
Notes to Financial Statements (Continued)
May 31, 2023 (Unaudited)
| (2) | Significant Accounting Policies |
The following is a summary of significant accounting policies consistently followed by the Funds in the preparation of the financial statements. These policies are in conformity with accounting principles generally accepted in the United States of America (“GAAP”).
The Funds value their investments at fair value. Each security owned by the Funds that is listed on a securities exchange is valued at its last sale price on that exchange on the date as of which assets are valued. When the security is listed on more than one exchange, the Funds will use the price of the exchange that the Funds generally consider to be the principal exchange on which the security is traded.
Fund securities listed on The NASDAQ Stock Market, Inc. (“NASDAQ”) will be valued at the NASDAQ Official Closing Price (“NOCP”), which may not necessarily represent the last sale price. If the NOCP is not available, such securities shall be valued at the last sale price on the day of valuation. If there has been no sale on such exchange or on NASDAQ on such day, the security is valued at the mean between the most recent bid and asked prices on such day. Over-the-counter securities that are not traded on NASDAQ shall be valued at the most recent trade price.
Debt securities, other than short-term instruments, are valued at the mean between the closing bid and asked prices provided by a pricing service (“Pricing Service”). If the closing bid and asked prices are not readily available, the Pricing Service may provide a price determined by matrix pricing or other analytical pricing models. Short-term debt securities, such as commercial paper, bankers’ acceptances and U.S. Treasury bills having a maturity of less than 60 days, are valued at amortized cost, which approximates fair value. If a short-term debt security has a maturity of greater than 60 days, it is valued at market price.
Redeemable securities issued by open-end, registered investment companies, including money market funds, are valued at the net asset value (“NAV”) of such companies for purchase and/or redemption orders placed on that day.
In the absence of prices from a Pricing Service or in the event that market quotations are not readily available, fair value will be determined under the Funds’ valuation policies and procedures adopted pursuant to Rule 2a-5 of the 1940 act. These fair value pricing procedures will also be used to price a security when corporate events, events in the securities market or world events cause the Adviser to believe that a security’s last sale price may not reflect its actual fair market value. The intended effect of using fair value pricing procedures is to ensure that a Fund’s shares are accurately priced. Pursuant to these procedures, the Board of Trustees has appointed the Adviser as the Funds’ valuation designee (the “Valuation Designee”) to perform all fair valuations of the Funds’ portfolio investments, subject to the Board of Trustees’ oversight. As the Valuation Designee, the Adviser has established a valuation committee (the “Valuation Committee”) to fulfill its responsibilities as Valuation Designee. When fair value pricing is employed, the prices of securities used by a Fund to calculate its NAV may differ from quoted or published prices for the same securities. Due to the subjective and variable nature of fair value pricing, it is possible that the fair value determined for a particular
35
SMEAD FUNDS
Notes to Financial Statements (Continued)
May 31, 2023 (Unaudited)
security may be materially different (higher or lower) from the price of the security quoted or published by others or the value when trading resumes or is realized upon sale. Therefore, if a shareholder purchases or redeems Fund shares when the Fund holds securities priced at a fair value, the number of shares purchased or redeemed may be higher or lower than would be the case if the Fund were using market value pricing.
The Funds’ fair value procedures include fair valuation accounting standards that establish an authoritative definition of fair value and set out a hierarchy for measuring fair value. These standards require additional disclosures about the various inputs used to develop the measurements of fair value. These inputs are summarized in the three broad levels listed below:
Level 1—unadjusted quoted prices in active markets for identical securities.
Level 2—other significant observable inputs (including unadjusted quoted prices for similar securities, interest rates, prepayment speeds, credit risk, etc.).
Level 3—significant unobservable inputs (including a Fund’s own assumptions in determining the fair value of investments).
The inputs or methodology used for valuing securities are not necessarily an indication of the risk associated with investing in those securities. The following table summarizes the valuation inputs of each Fund’s investments by each fair value hierarchy level as of May 31, 2023:
| | | | | | | | | | | | | | | | | | | | |
| | | Level 1 | | Level 2 | | Level 3 | | Total |
| | | Smead Value Fund |
Equity(1) | | | | | | | | | | | | | | | | | | | | |
Common Stocks | | | $ | 4,095,930,349 | | | | $ | — | | | | $ | — | | | | $ | 4,095,930,349 | |
| | | | | | | | | | | | | | | | | | | | |
Total Equity | | | | 4,095,930,349 | | | | | — | | | | | — | | | | | 4,095,930,349 | |
Short-Term Investment | | | | — | | | | | 234,544,499 | | | | | — | | | | | 234,544,499 | |
| | | | | | | | | | | | | | | | | | | | |
Total Investments on Securities | | | $ | 4,095,930,349 | | | | $ | 234,544,499 | | | | $ | — | | | | $ | 4,330,474,848 | |
| | | | | | | | | | | | | | | | | | | | |
36
SMEAD FUNDS
Notes to Financial Statements (Continued)
May 31, 2023 (Unaudited)
| | | | | | | | | | | | | | | | | | | | |
| | | Level 1 | | Level 2 | | Level 3 | | Total |
| | | Smead International Value Fund |
Equity(1) | |
Common Stocks | | | $ | 31,081,791 | | | | $ | 35,832,905 | | | | $ | — | | | | $ | 66,914,696 | |
Preferred Stocks | | | | — | | | | | 8,271,729 | | | | | — | | | | | 8,271,729 | |
Warrants | | | | 6,245,748 | | | | | — | | | | | — | | | | | 6,245,748 | |
| | | | | | | | | | | | | | | | | | | | |
Total Equity | | | | 37,327,539 | | | | | 44,104,634 | | | | | — | | | | | 81,432,173 | |
Short-Term Investment | | | | — | | | | | 2,770,230 | | | | | — | | | | | 2,770,230 | |
| | | | | | | | | | | | | | | | | | | | |
Total Investments on Securities | | | $ | 37,327,539 | | | | $ | 46,874,864 | | | | $ | — | | | | $ | 84,202,403 | |
| | | | | | | | | | | | | | | | | | | | |
| | (1) | See the Schedule of Investments for industry classification. |
No Level 3 securities were held in the Funds at May 31, 2023. For the six month period ended May 31, 2023, there were no transfers between levels for the Funds. The Funds did not hold financial derivative instruments during the reporting period.
In accordance with procedures adopted by the Trust’s Board of Trustees, fair value pricing may be used if events materially affecting the value of foreign equity securities occur between the time the exchange on which they are traded closes and the time the Smead International Value Fund’s NAVs are calculated. The Fund uses a systematic valuation model, provided daily by an independent third party, to fair value their international equity securities. These valuations are considered as Level 2 in the fair value hierarchy.
The NAV per share of each Fund is calculated by dividing the sum of the value of the securities held by the Fund, plus cash and other assets, minus all liabilities (including estimated accrued expenses), by the total number of shares outstanding for the Fund rounded to the nearest cent. The Funds’ shares will not be priced on the days on which the New York Stock Exchange is closed for trading.
The preparation of financial statements in conformity with GAAP requires management to make estimates and assumptions that affect the reported amounts of assets and liabilities and disclosure of contingent assets and liabilities at the date of the financial statements and the reported amounts of increases and decreases in net assets from operations during the reporting period. Actual results could differ from those estimates.
| | (d) | Allocation of Income, Expenses and Gains/Losses |
Income, expenses (other than those deemed attributable to a specific share class, such as distribution and shareholder servicing fees), and gains and losses of the Funds are allocated daily to each class of shares based upon the ratio of net assets represented by each class as a percentage of the net assets of the Funds. Expenses deemed directly
37
SMEAD FUNDS
Notes to Financial Statements (Continued)
May 31, 2023 (Unaudited)
attributable to a class of shares are recorded by the specific class. Most Fund expenses are allocated by class based on relative net assets. Rule 12b-1 fees for Smead Value Fund are expensed at 0.25% of average daily net assets of the Investor Class and Class A shares, 0.75% of average daily net assets of the Class C shares, and 0.50% of the average daily net assets of the Class R1 and Class R2 shares. Rule 12b-1 fees for Smead International Value Fund are expensed at 0.25% of average daily net assets of the Investor Class and Class A shares, and 0.75% of average daily net assets of the Class C shares. A separate shareholder servicing fees is authorized up to 0.25% of the average daily net assets attributable to Class A shares, Class C shares, Investor Class shares, Class I1 shares, Class I2 shares, Class R1 shares and Class R2 shares of Smead Value Fund, Class A shares, Class C shares, Investor Class shares, Class I1 shares, Class I2 shares and Class Y shares of Smead International Value Fund, respectively. However, as of May 31, 2022, those fees were expensed at the following rates: 0.17% for the Investor Class shares and Class A, 0.25% for Class C shares, 0.15% for Class I1 shares, 0.25% for Class R1 shares, and 0.10% for Class R2 shares of Smead Value Fund. Additionally, as of May 31, 2022, those fees were expensed at the following rates: 0.00% for the Investor Class shares, 0.17% for the Class A shares, 0.25% for Class C, 0.15% for Class I1 shares and 0.10% for class I2 shares of Smead International Value Fund.
The Funds comply with the requirements of Subchapter M of the Internal Revenue Code of 1986, as amended, necessary to qualify as regulated investment companies and make the requisite distributions of income and capital gains to their shareholders sufficient to relieve them from all or substantially all federal income taxes. Therefore, no federal income tax provision has been provided.
As of and during the fiscal year ended November 30, 2022, the Funds did not have a liability for any unrecognized tax benefits. The Funds recognize interest and penalties, if any, related to unrecognized tax benefits as income tax expense in the statement of operations. During the fiscal year ended November 30, 2022, the Funds did not incur any interest or penalties.
38
SMEAD FUNDS
Notes to Financial Statements (Continued)
May 31, 2023 (Unaudited)
As of November 30, 2022, the components of accumulated earnings on a tax basis were as follows:
| | | | | | | | | | |
| | | Smead Value
Fund | | Smead
International
Value Fund |
Cost basis of investments for federal income tax purposes | | | $ | 3,381,237,299 | | | | $ | 66,284,255 | |
| | | | | | | | | | |
Gross tax unrealized appreciation | | | | 760,276,968 | | | | | 13,952,087 | |
Gross tax unrealized depreciation | | | | (69,540,053 | ) | | | | (7,337,098 | ) |
| | | | | | | | | | |
Net tax unrealized appreciation | | | $ | 690,736,915 | | | | $ | 6,614,989 | |
| | | | | | | | | | |
Undistributed ordinary income | | | $ | 34,811,565 | | | | $ | 575,077 | |
Undistributed long-term capital gain | | | | 47,584,737 | | | | | — | |
| | | | | | | | | | |
Total distributable earnings | | | $ | 82,396,302 | | | | $ | 575,077 | |
| | | | | | | | | | |
Other accumulated losses | | | | — | | | | | (3,579,228 | )(1) |
| | | | | | | | | | |
Total accumulated gains | | | $ | 773,133,217 | | | | $ | 3,610,838 | |
| | | | | | | | | | |
| | (1) | Other accumulated losses disclosed above pertains to Capital Loss Carryforwards, and are deemed Short Term in nature. |
The tax basis of investments for tax and financial reporting purposes differs principally due to the deferral of losses on wash sales.
| | (f) | Distributions to Shareholders |
The Funds will distribute any net investment income and any net realized long or short-term capital gains at least annually. Distributions from net realized gains for book purposes may include short-term capital gains. All short-term capital gains are included in ordinary income for tax purposes. Distributions to shareholders are recorded on the ex-dividend date. The Funds may also pay a special distribution at the end of the calendar year to comply with federal tax requirements. Income and capital gains distributions may differ from GAAP, primarily due to timing differences in the recognition of income, gains and losses by the Funds. GAAP requires that certain components of net assets relating to permanent differences be reclassified between the components of net assets. These reclassifications have no effect on net assets or net asset value per share. For the fiscal year ended November 30, 2022, reclassifications were made for equalization utilized and redemption in kinds.
39
SMEAD FUNDS
Notes to Financial Statements (Continued)
May 31, 2023 (Unaudited)
| | | | |
Fund Name | | Total Distributable
Earnings (Loss) | | Paid-in
Capital |
| Smead Value Fund | | $(260,750,995) | | $260,750,995 |
| Smead International Value Fund | | $— | | $— |
The tax character of distributions paid during the fiscal years ended November 30, 2022 and November 30, 2021 was as follows:
| | | | | | | | | | |
Smead Value Fund | | November 30,
2022 | | November 30,
2021 |
Ordinary Income | | | $ | 14,553,327 | | | | $ | 11,796,035 | |
Long-Term Capital Gain | | | $ | 114,901,132 | | | | $ | 8,929,375 | |
| |
Smead International Value Fund | | November 30,
2022 |
Ordinary Income | | | | | $— | |
Long-Term Capital Gain | | | | | $— | |
Smead Value Fund
| | | | | | | | | | | | | | | |
| | | Distributions Paid from | | |
Class | | Ordinary
Income | | Realized
Gain/Loss | | Total
Distributions
Paid |
Investor Class | | | $ | 240,533 | | | | $ | 4,014,545 | | | | $ | 4,255,078 | |
Class A | | | | 843,949 | | | | | 10,412,383 | | | | | 11,256,332 | |
Class C | | | | 22,896 | | | | | 659,574 | | | | | 682,470 | |
Class I1 | | | | 12,038,104 | | | | | 90,528,086 | | | | | 102,566,190 | |
Class R1 | | | | — | | | | | 6,379 | | | | | 6,379 | |
Class R2 | | | | 175 | | | | | 3,710 | | | | | 3,885 | |
Class Y | | | | 1,407,670 | | | | | 9,276,455 | | | | | 10,684,125 | |
On December 16, 2022, the Smead Value Fund declared and paid distributions from ordinary income and long-term capital gains to shareholders of record on December 14, 2022.
Investment transactions are recorded on the trade date. The Funds determine the gain or loss from investment transactions based on specific identification using the first in, first out method. Dividend income, less foreign withholding tax, is recognized on the ex-dividend date and interest income is recognized on an accrual basis. Withholding taxes on foreign dividends have been provided for in accordance with the Funds’ understanding of the applicable country’s tax rules and rates.
40
SMEAD FUNDS
Notes to Financial Statements (Continued)
May 31, 2023 (Unaudited)
| | (h) | Foreign currency translation |
The books and records of the Funds are maintained in U.S.dollars. Investment securities and other assets and liabilities denominated in a foreign currency are translated into U.S. dollars on the date of valuation. The Funds do not isolate that portion of realized or unrealized gains and losses resulting from changes in the foreign exchange rate from fluctuations arising from changes in the market prices of the securities. These gains and losses are included in net realized and unrealized gains (losses) on investments on the Statements of Operations.
Net realized and unrealized gains (losses) on foreign currency transactions represent net foreign exchange gains or losses from disposition of foreign currencies, currency gains or losses realized between trade and settlement dates on securities transactions and the difference between the amount of the investment income and foreign withholding taxes recorded on the Funds’ books and the U.S. dollar equivalent amounts actually received or paid.
The Funds have an Investment Advisory Agreement (the “Agreement”) with the Adviser to furnish investment advisory services to the Funds. Under the terms of the Agreement, each Fund compensates the Adviser for its management services at the annual rate of 0.75% of the Fund’s average daily net assets.
The Adviser has contractually agreed to waive its management fee and/or reimburse each Fund’s other expenses (the “Expense Limitation Caps”) at least through March 31, 2024 to the extent necessary to ensure that the Fund’s operating expenses do not exceed 1.26%, 1.26%, 1.84%, 0.99%, 1.59%, 1.44% and 0.84% of the Fund’s average daily net assets for the Investor Class, Class A, Class C, Class I1, Class R1,Class R2 and ClassY shares for the Smead Value Fund and 1.25%, 1.42%, 2.00%, 1.15%, 1.10% and 1.00% of the Fund’s average daily net assets for the Investor Class, Class A, Class C, Class I1, Class I2 and Class Y shares for the Smead International Value Fund, respectively. Any such waiver or reimbursement is subject to later adjustment to allow the Adviser to recoup amounts waived or reimbursed to the extent actual fees and expenses for a fiscal period (taking into account the reimbursement) does not exceed the Expense Limitation Caps in place at the time of waiver; provided, however, that the Adviser shall only be entitled to recoup such amounts over the following three fiscal years. For the six months ended May 31, 2023, the Adviser waived expenses of $218,948. The expenses waived by the service provider are not eligible for recoupment. The following table shows the waived or reimbursed expenses subject to potential recovery expiring on November 30:
| | | | | | | | |
Year incurred | | Expiration Year | | Smead Value
Fund | | Smead
International
Value Fund | |
| 2021 | | 2023 | | $— | | $ | — | |
| 2022 | | 2024 | | — | | | 33,480 | |
| 2023 | | 2025 | | — | | | 218,948 | |
41
SMEAD FUNDS
Notes to Financial Statements (Continued)
May 31, 2023 (Unaudited)
For the six months ended May 31, 2023, the Adviser recouped $0 in previously waived fees and expenses from the Funds.
| (4) | Distribution Plan and Shareholder Servicing Plan |
The Funds have adopted a plan pursuant to Rule 12b-1 (the “12b-1 Plan”), which authorizes it to pay UMB Distribution Services, LLC, the Funds’ principal distributor (the “Distributor”), a fee for the Smead Value Fund at an annual rate of 0.25% of the Fund’s average daily net assets of Investor Class and Class A shares, 0.75% of the Fund’s average daily net assets of Class C shares, and 0.50% of the Fund’s average daily net assets of Class R1 and Class R2 shares for services to prospective Fund shareholders and distribution of Fund shares of the Smead Value Fund. There is no 12b-1 fee for Class I1 and ClassY shares of the Smead Value Fund. Under the 12b-1 Plan, the Smead International Value Fund pays a fee at the annual rate of 0.25% of the Fund’s average daily net assets of Investor Class and Class A shares and 0.75% of the Fund’s average daily net assets of Class C shares services to prospective Fund shareholders and distribution of Fund shares of the Smead International Value Fund. There are no 12b-1 fees for Class I1, Class I2 and Class Y shares of the Smead International Value Fund. The following table details the 12b-1 Plan fees paid for the six months ended May 31, 2023.
| | | | | |
Smead Value Fund | | | | | |
Investor Class | | | $ | 126,610 | |
Class A | | | | 505,728 | |
Class C | | | | 162,732 | |
Class I1 | | | | — | |
Class R1 | | | | 579 | |
Class R2 | | | | 188 | |
Class Y | | | | — | |
| |
Smead International Value Fund | | | | | |
Investor Class | | | $ | 37 | |
Class A | | | | 4,867 | |
Class C. | | | | 1,240 | |
Class I1 | | | | — | |
Class Y | | | | — | |
As of May 31, 2023, the Smead Value Fund and Smead International Value Fund owed the Distributor fees pursuant to the 12b-1 Plans, in the amounts of $132,541 and $1,112, respectively.
The Funds have also adopted a separate shareholder servicing plan (the “Shareholder Servicing Plan”).The Shareholder Servicing Plan also authorizes payment of a shareholder servicing fee to financial intermediaries and other service providers up to 0.25% of the average daily net assets attributable to the Class A shares, Class C shares, Investor Class shares, Class I1 shares, Class I2 shares, Class R1 shares and Class R2 shares, respectively (this fee is referred to as the “Shareholder Servicing Fee”). However, as of May 31, 2023, these Shareholder Servicing Fees were expensed at the
42
SMEAD FUNDS
Notes to Financial Statements (Continued)
May 31, 2023 (Unaudited)
following rates: 0.17% for the Investor Class, 0.17% for the Class A shares, 0.25% for the Class C shares, 0.15% for the Class I1shares, 0.25% for the Class R1 shares, and 0.10% for the Class R2 shares of the Smead Value Fund. There is no Shareholder Servicing Fee for Class Y of the Smead Value Fund. The Shareholder Servicing Fees were expensed at the following rates: 0.17% for the Class A shares, 0.25% for the Class C shares, 0.15% for the Class I1 shares and 0.10% for the Class I2 shares of the Smead International Value Fund. There is no Shareholder Servicing Fee for the Investor Class and Class Y of the Smead International Value Fund. For those share classes that currently charge less than the maximum Shareholder Servicing Fee permitted under the Shareholder Servicing Plan, the Funds may increase such fee, but not beyond the maximum of 0.25%, only after providing affected shareholders with 30 days’ prior written notice. The following table details the Shareholder Servicing Plan fees paid for the six months ended May 31, 2023.
| | | | | |
| Smead Value Fund | | |
Investor Class | | | $ | 86,094 | |
Class A | | | | 343,893 | |
Class C | | | | 54,244 | |
Class I1 | | | | 2,758,456 | |
Class R1 | | | | 290 | |
Class R2 | | | | 37 | |
Class Y | | | | — | |
| |
| Smead International Value Fund | | |
Investor Class | | | $ | — | |
Class A | | | | 3,310 | |
Class C | | | | 413 | |
Class I1 | | | | 32,198 | |
Class Y | | | | — | |
| (5) | Accounting, Custody, Administration and Transfer Agent Fees |
The Northern Trust Company (the “Administrator”) acts as administrator for the Funds. The Administrator prepares various federal and state regulatory filings; prepares reports and materials to be supplied to the Trustees; monitors the activities of the Funds’ custodian, and accountant; coordinates the preparation and payment of Fund expenses; and reviews the Funds’ expense accruals. For these services, each Fund pays the administrator monthly a fee accrued daily and based on the Fund’s average daily net assets. The Funds may also reimburse the Administrator for out-of-pocket expenses incurred by the Administrator in the performance of its duties. The amounts paid directly to the Administrator by the Funds for administrative services are included in the Administration fees in the Statements of Operations.
UMB Fund Services, Inc. (“UMB”) is the Funds’ transfer and dividend disbursing agent. UMB receives a fee that is calculated daily and paid monthly at an annual rate based on the average daily net assets of the Funds, and is reimbursed for certain out-of-pocket expenses.
43
SMEAD FUNDS
Notes to Financial Statements (Continued)
May 31, 2023 (Unaudited)
| (6) | Capital Share Transactions |
Transactions in shares of the Funds were as follows:
| | | | | | | | | | | | | | | | | | | | |
| Smead Value Fund | | | | | | | | |
| | | For The Six Months Ended
May 31, 2023 | | For The Year Ended
November 30, 2022 |
| | | Shares | | Amount | | Shares | | Amount |
| | | | |
Proceeds from shares sold | | | | | | | | | | | | | | | | | | | | |
Investor Class | | | | 38,791 | | | | $ | 2,609,545 | | | | | 99,745 | | | | $ | 6,794,192 | |
Class A | | | | 1,290,560 | | | | | 85,671,604 | | | | | 3,992,778 | | | | | 267,269,120 | |
Class C | | | | 153,929 | | | | | 10,046,312 | | | | | 411,277 | | | | | 26,868,991 | |
Class I1 | | | | 11,626,739 | | | | | 786,996,087 | | | | | 25,895,502 | | | | | 1,749,633,388 | |
Class R1 | | | | 57 | | | | | 3,745 | | | | | 1,066 | | | | | 71,379 | |
Class R2 | | | | 97 | | | | | 6,548 | | | | | 498 | | | | | 33,958 | |
Class Y | | | | 3,299,395 | | | | | 216,886,217 | | | | | 9,249,855 | | | | | 643,381,810 | |
| | | | |
Issued in reinvestment of dividends and distributions | | | | | | | | | | | | | | | | | | | | |
Investor Class | | | | 24,597 | | | | | 1,640,895 | | | | | 58,748 | | | | | 3,986,070 | |
Class A | | | | 90,677 | | | | | 5,990,929 | | | | | 129,616 | | | | | 8,715,869 | |
Class C | | | | 6,248 | | | | | 403,907 | | | | | 6,377 | | | | | 420,517 | |
Class I1 | | | | 813,408 | | | | | 54,197,383 | | | | | 1,045,630 | | | | | 70,872,795 | |
Class R1 | | | | — | | | | | — | | | | | — | | | | | — | |
Class R2 | | | | 3 | | | | | 166 | | | | | 3 | | | | | 204 | |
Class Y | | | | 73,549 | | | | | 4,906,479 | | | | | 69,867 | | | | | 4,741,905 | |
| | | | |
Payments for shares redeemed | | | | | | | | | | | | | | | | | | | | |
Investor Class | | | | (116,111 | ) | | | | (7,752,601 | ) | | | | (220,825 | ) | | | | (14,844,231 | ) |
Class A | | | | (1,410,826 | ) | | | | (94,428,771 | ) | | | | (2,000,190 | ) | | | | (130,436,680 | ) |
Class C | | | | (59,794 | ) | | | | (3,862,533 | ) | | | | (62,159 | ) | | | | (3,861,718 | ) |
Class I1 | | | | (7,329,411 | ) | | | | (488,712,272 | ) | | | | (11,785,775 | ) | | | | (782,476,775 | ) |
Class R1 | | | | — | | | | | — | | | | | (92 | ) | | | | (6,272 | ) |
Class R2 | | | | — | | | | | (18 | ) | | | | (817 | ) | | | | (55,890 | ) |
Class Y | | | | (3,484,938 | ) | | | | (229,260,287 | ) | | | | (7,268,942 | ) | | | | (510,291,747 | ) |
| | | | | | | | | | | | | | | | | | | | |
Total increase in net assets from capital share transations | | | | 5,016,970 | | | | $ | 345,343,335 | | | | | 19,622,162 | | | | $ | 1,340,816,885 | |
| | | | | | | | | | | | | | | | | | | | |
44
SMEAD FUNDS
Notes to Financial Statements (Continued)
May 31, 2023 (Unaudited)
| | | | | | | | | | | | | | | | | | | | |
| Smead International Value Fund | | | | | | | | |
| | | For The Six Months Ended
May 31, 2023 | | For The Period Ended
November 30, 20221 |
| | | Shares | | Amount | | Shares | | Amount |
| | | | |
Proceeds from shares sold | | | | | | | | | | | | | | | | | | | | |
Investor Class | | | | 297 | | | | $ | 14,100 | | | | | 378 | | | | $ | 16,233 | |
Class A | | | | 44,401 | | | | | 2,222,875 | | | | | 66,640 | | | | | 3,288,896 | |
Class C | | | | 12,651 | | | | | 625,000 | | | | | 2,244 | | | | | 108,017 | |
Class I1 | | | | 198,202 | | | | | 10,180,329 | | | | | 842,878 | | | | | 39,105,686 | 2 |
Class Y | | | | 122,500 | | | | | 6,255,746 | | | | | 683,082 | | | | | 34,296,415 | |
| | | | |
Issued in reinvestment of dividends and distributions | | | | | | | | | | | | | | | | | | | | |
Investor Class | | | | 5 | | | | | 255 | | | | | — | | | | | — | |
Class A | | | | 677 | | | | | 31,070 | | | | | — | | | | | — | |
Class C | | | | 68 | | | | | 2,992 | | | | | — | | | | | — | |
Class I1 | | | | 11,567 | | | | | 541,661 | | | | | — | | | | | — | |
Class Y | | | | 9,805 | | | | | 463,569 | | | | | — | | | | | — | |
| | | | |
Payments for shares redeemed | | | | | | | | | | | | | | | | | | | | |
Class A | | | | (6,717 | ) | | | | (330,577 | ) | | | | (13,304 | ) | | | | (641,752 | ) |
Class C | | | | (9,994 | ) | | | | (468,244 | ) | | | | — | | | | | — | |
Class I1 | | | | (71,956 | ) | | | | (3,653,259 | ) | | | | (60,690 | ) | | | | (2,893,374 | ) |
Class Y | | | | (38,327 | ) | | | | (1,870,874 | ) | | | | (28,025 | ) | | | | (1,356,509 | ) |
| | | | | | | | | | | | | | | | | | | | |
Total increase in net assets from capital share transations | | | | 273,179 | | | | $ | 14,014,643 | | | | | 1,493,203 | | | | $ | 71,923,612 | |
| | | | | | | | | | | | | | | | | | | | |
1 Period from January 12, 2022, date operations commenced, through November 30, 2022.
2 Contributions presented in this note exclude the unrealized gain from the in-kind contribution on January 11, 2022.
| (7) | Investment Transactions |
The aggregate purchases and sales of securities, excluding short-term investments, for the Smead Value Fund for the six months ended May 31, 2023 were $736,679,620 and $252,952,890, respectively. The aggregate purchases and sales of securities, excluding short-term investments, for the Smead International Value Fund for the six months ended May 31, 2023 were $19,668,929 and $4,487,499, respectively. There were no purchases or sales of U.S. government securities for the Funds.
The beneficial ownership, either directly or indirectly, of more than 25% of the voting securities of a fund creates a presumption of control of the fund, under Section 2(a)(9) of the 1940 Act. As of May 31, 2023, the record holder information for Smead Value Fund and Smead International Fund were as follows:
45
SMEAD FUNDS
Notes to Financial Statements (Continued)
May 31, 2023 (Unaudited)
| | | | | |
| | | Percentage |
Smead Value Fund | | | | | |
National Financial Services LLC, | | | | | |
Investor Class | | | | 52.10 | % |
Class I1 | | | | 32.66 | % |
Class Y | | | | 29.93 | % |
Wells Fargo Clearing Services LLC, | | | | | |
Class C | | | | 47.36 | % |
Merrill Lynch Pierce Fenner & Smith, | | | | | |
Class C | | | | 27.35 | % |
Class R1 | | | | 100.00 | % |
Class R2 | | | | 81.13 | % |
Pershing LLC, | | | | | |
Class Y | | | | 37.42 | % |
American Enterprise Inv, | | | | | |
Class A | | | | 49.34 | % |
| | | | | |
| | | Percentage |
| |
Smead International Value Fund | | | | | |
The Timothy A Gaar Living Trust | | | | | |
Investor Class | | | | 70.40 | % |
TD Ameritrade Inc., | | | | | |
Class A | | | | 36.60 | % |
Charles Schwab & Company, Inc, | | | | | |
Class A | | | | 44.90 | % |
Class C | | | | 97.82 | % |
Class I1 | | | | 67.90 | % |
National Financial Services LLC, | | | | | |
Class A | | | | 98.55 | % |
General Investment Risks
An investment in the Funds represents an indirect investment in the assets owned by the Funds. As with any mutual fund, the value of the assets owned by the Funds may move up or down, and as a result, an investment in the Funds at any point in time may be worth more or less than the original amount invested.
Each Fund’s transactions in listed securities are settled/paid for upon delivery to or from their counterparties; therefore, the risk of counterparty default for listed securities is considered minimal, as delivery of securities sold is only made once the Funds have received payment. Payment is made on a purchase once the securities have been delivered by the counterparty. The trade will fail if either party fails to meet its obligations.
46
SMEAD FUNDS
Notes to Financial Statements (Continued)
May 31, 2023 (Unaudited)
Market and Regulatory Risks
Events in the financial markets and economy may cause volatility and uncertainty and affect the Funds’ performance. Market events may affect a single issuer, industry, sector, or the market as a whole. In addition, because of interdependencies between markets, events in one market may adversely impact other markets or issuers in which the Funds invest in unforeseen ways. For example, the global outbreak of COVID-19 has disrupted financial markets and the prolonged economic impact is uncertain. Traditionally liquid investments may experience periods of diminished liquidity. During a general downturn in the financial markets, multiple asset classes may decline in value and the Funds may lose value, regardless of the individual results of the securities and other instruments in which the Funds invest. Governmental and regulatory actions, including tax law changes, may also impair Fund management and have unexpected or adverse consequences on particular markets, strategies, or investments. Future market or regulatory events may impact the Funds in unforeseen ways, such as causing the Funds to alter their existing strategies or potentially, to liquidate and close.
Management Risk
The Adviser’s investment strategies for the Funds may not result in an increase in the value of your investment or in overall performance equal to other investments.
Non-Diversification Risk
Each Fund may invest a large percentage of its assets in securities issued by or representing a small number of issuers. As a result, the Fund’s performance may depend on the performance of a small number of issuers.
Equity Investments Risks
Stock markets are volatile. Equity investments tend to go up or down in value, sometimes rapidly and unpredictably, in response to many factors, including a company’s historical and prospective earnings, the value of its assets, general economic conditions, interest rates, investor perceptions, and market liquidity. Due to the complexities of markets, events in one market or sector may adversely impact other markets or sectors.
Management has evaluated the possibility of subsequent events through the date of issuance and determined that there are no material events that would require adjustment to or disclosure in the Funds’ financial statements.
47
SMEAD FUNDS
Notice of Privacy Policies and Practices
We collect non-public personal information about you from the following sources:
| • | | information we receive about you on applications or other forms; |
| • | | information you give us orally; and |
| • | | information about your transactions with us or others. |
We do not disclose any non-public personal information about our shareholders or former shareholders without the shareholder’s authorization, except as permitted by law or in response to inquiries from governmental authorities. We may share information with affiliated parties and unaffiliated third parties with whom we have contracts for servicing the Funds. We will provide unaffiliated third parties with only the information necessary to carry out their assigned responsibility. All shareholder records will be disposed of in accordance with applicable law. We maintain physical, electronic and procedural safeguards to protect your non-public personal information and require third parties to treat your non-public personal information with the same high degree of confidentiality. In the event that you hold shares of the Funds through a financial intermediary, including, but not limited to, a broker-dealer, bank or trust company, the privacy policy of your financial intermediary would govern how your non-public personal information would be shared with unaffiliated third parties.
48
SMEAD FUNDS
Additional Information
(Unaudited)
Tax Information
For the year ended November 30, 2022, 100% of dividends paid from net ordinary income qualified for the dividends received deduction available to corporate shareholders of the Smead Value Fund. There were no dividends paid from net ordinary income for Smead International Value Fund.
Indemnifications
Under the Trust’s organizational documents, its officers and trustees are indemnified against certain liabilities arising out of the performance of their duties to the Funds. In addition, in the normal course of business, the Funds enter into contracts that provide general indemnifications to other parties. The Funds’ maximum exposure under these arrangements is unknown as this would involve future claims that may be made against the Funds that have not yet occurred. However, the Funds have not had prior claims or losses pursuant to these contracts and expects the risk of loss to be remote.
Information about Trustees
The business and affairs of the Trust are managed under the direction of the Board of Trustees. Information pertaining to the Trustees of the Trust is set forth below. The Statement of Additional Information includes additional information about the Trustees and is available, without charge, upon request by calling 877-807-4122. This table is as of May 31, 2023.
| | | | | | | | | | |
Name and
Birth Year | | Position(s)
Held with
the Trust | | Term of Office and
Length of
Time Served | | Number of
Portfolios
in Trust
Overseen
by Trustee | | Principal Occupation(s) During the Past Five Years | | Other Directorships Held by Trustee During
the Past Five Years |
| | |
Independent Trustees | | | | |
| | | | | |
Gregory A. Demopulos
Year: 1959 | | Trustee | | Indefinite Term (since September 2014). | | 2 | | Chairman and CEO, Omeros Corp. (biopharmaceutical company) (since 1994). | | Chairman, Omeros Corp. (since 1994). |
49
SMEAD FUNDS
Additional Information (Continued)
(Unaudited)
| | | | | | | | | | |
Name and
Birth Year | | Position(s)
Held with
the Trust | | Term of Office and
Length of
Time Served | | Number of
Portfolios
in Trust
Overseen
by Trustee | | Principal Occupation(s) During the Past Five Years | | Other Directorships Held by Trustee During
the Past Five Years |
| | | | | |
Peter M. Musser
Year: 1956 | | Trustee | | Indefinite Term (since September 2014). | | 2 | | Principal, Angeline Properties, LLC (a private investment firm)(since 2014); and Principal and Senior Equity Portfolio Manager with Rainier Investment Management (from 1994 to 2013). | | Trustee, Lawrence University (since 2012); Trustee, Berry College (since 2010); and Director, Boys and Girls Clubs of King County (2008 to 2016). |
| | | | | |
Walter F. Walker
Year: 1954 | | Trustee | | Indefinite Term (since September 2014). | | 2 | | Principal, Hana Road Capital LLC (hedge fund) (since 2007). | | Advisory Council, Stone Arch Capital (since 2005); and Independent Director, Harbor Custom Development, Inc. (real estate development company) (since 2020). |
50
SMEAD FUNDS
Additional Information (Continued)
(Unaudited)
| | | | | | | | | | | | |
Name and
Birth Year | | Position(s)
Held with
the Trust | | Term of Office and
Length of
Time Served | | Number of
Portfolios
in Trust
Overseen
by Trustee | | | Principal Occupation(s) During the Past Five Years | | Other Directorships Held by Trustee During
the Past Five Years |
| | | | | |
Nancy A. Zevenbergen
Year: 1959 | | Trustee | | Indefinite Term (since September 2014). | | | 2 | | | Principal and Chief Investment Officer, Zevenbergen Capital Investments LLC (since 1987). | | Director, Seattle Pacific Foundation (since 1993); Director, Anduin Foundation (since 2010); Director, University of Washington Foster School of Business (2014-2022); and Director, evenstar3 Inc. (since 2005). |
| | | |
Interested Trustees and Officers | | | | | | | | |
| | | | | |
William W. Smead1
Year: 1958 | | Trustee and Chairman | | Indefinite Term (since September 2014). | | | 2 | | | Chairman and Chief Investment Officer of the Adviser (since 2007); previously, Chief Executive Officer of the Adviser (2007-2019). | | None. |
| | | | | |
Cole W. Smead1
Year: 1983 | | Trustee | | Indefinite Term (since September 2014). | | | 2 | | | Chief Executive Officer of the Adviser (since 2022) and President of the Adviser (since 2020); previously, Managing Director of the Adviser (2007-2019). | | Director and Chairman, Smead Funds S.A. (since 2015). |
| | | | | |
| | President and Chief Executive Officer | | Elected annually (since January 2016). | | | | | | | | |
51
SMEAD FUNDS
Additional Information (Continued)
(Unaudited)
| | | | | | | | | | |
Name and
Birth Year | | Position(s)
Held with
the Trust | | Term of Office and
Length of
Time Served | | Number of
Portfolios
in Trust
Overseen
by Trustee | | Principal Occupation(s) During the Past Five Years | | Other Directorships Held by Trustee During
the Past Five Years |
| | | | | |
Steven J. LeMire
Year: 1969 | | Chief Compliance Officer | | Elected annually (since September 2014). | | N/A | | Chief Compliance Officer of the Adviser (since 2014). | | N/A |
| | | | | |
| | Treasurer, Principal Financial and Accounting Officer | | Elected annually (since January 2016). | | | | | | |
| | | | | |
Heather Peterson
Year: 1985 | | Secretary | | Elected annually (since August 2020). | | N/A | | Director - Marketing & Brand Development of the Adviser (since February 2022); and Vice President - Marketing of the Adviser (January 2016 - February 2022). | | N/A |
| 1 | Mr. William Smead and Mr. Cole Smead are each deemed to be an “interested person” of the Funds under the 1940 Act because of their position with Smead Capital Management, Inc. Mr. William Smead and Mr. Cole Smead are father and son, respectively. |
52
A NOTE ON FORWARD LOOKING STATEMENTS (Unaudited)
Except for historical information contained in this report for the Funds, the matters discussed in this report may constitute forward-looking statements made pursuant to the safe-harbor provisions of the Private Securities Litigation Reform Act of 1995. These include any adviser or portfolio manager predictions, assessments, analyses or outlooks for individual securities, industries, market sectors and/or markets. These statements involve risks and uncertainties. In addition to the general risks described for the Funds in the current Prospectus, other factors bearing on this report include the accuracy of the Adviser’s or portfolio managers’ forecasts and predictions, and the appropriateness of the investment programs designed by the adviser or portfolio managers to implement their strategies efficiently and effectively. Any one or more of these factors, as well as other risks affecting the securities markets and investment instruments generally, could cause the actual results of the Funds to differ materially as compared to benchmarks associated with the Funds.
ADDITIONAL INFORMATION (Unaudited)
The Funds have adopted proxy voting policies and procedures that delegate to the Adviser the authority to vote proxies. A description of the Funds’ proxy voting policies and procedures is available without charge, upon request, by calling the Funds toll free at 877-807-4122. A description of these policies and procedures is also included in the Funds’ Statement of Additional Information, which is available on the SEC’s website at http://www.sec.gov.
The Funds’ proxy voting records for the most recent 12-month period ended June 30 are available without charge, upon request, by calling, toll free, 877-807-4122, or by accessing the SEC’s website at http://www.sec.gov.
The Funds file their complete schedules of portfolio holdings with the SEC for the first and third quarters of each fiscal year as an exhibit to their reports on Form N-PORT. Shareholders may view the Funds’ Form N-PORT reports on the SEC’s website at www.sec.gov.
HOUSEHOLDING (Unaudited)
In an effort to decrease costs, the Funds intend to reduce the number of duplicate prospect uses and annual and semi-annual reports you receive by sending only one copy of each to those addresses shared by two or more accounts and to shareholders the Funds reasonably believe are from the same family or household. Once implemented, if you would like to discontinue householding for your accounts, please call toll-free at 877-807-4122 to request individual copies of these documents. Once the Funds receive notice to stop householding, the Funds will begin sending individual copies 30 days after receiving your request. This policy does not apply to account statements.
53
SMEAD FUNDS
Results of a Joint Special Meeting of Shareholders of SMEAD Funds Trust
(Unaudited)
At a Joint Special Meeting of Shareholders of the Funds held on May 23, 2023, the Funds’ shareholders approved an amendment to the Funds’ fundamental investment policy regarding industry concentration (“Proposal 1”) by the following votes:
| | | | | | | | |
Fund Name | | For (Shares Voted / % of Voted) | | Against (Shares Voted / % of Voted) | | Abstain (Shares Voted / % of Voted) | | Broker Non-Vote
(Shares Voted / % of Voted) |
| | | | |
Smead International Value Fund | | 816,240 / 95.86% | | 6,036 / 0.71% | | 29,188 / 3.43% | | None |
| | | | |
Smead Value Fund | | 33,571,948 / 96.76% | | 509,858 / 1.47% | | 614,355 / 1.77% | | None |
At the same Joint Special Meeting of Shareholders of the Funds held on May 23, 2023, the persons named as proxies on behalf of those Fund shareholders who provided voting instructions for the meeting voted to adjourn the meeting as it relates to Proposal 2 to allow time to solicit additional voting instructions from shareholders.
54
SMEAD FUNDS
| | |
| |
Investment Adviser | | Smead Capital Management, Inc. 2777 East Camelback Road Suite 375 Phoenix, AZ 85016 |
| |
Legal Counsel | | Godfrey & Kahn, S.C. 833 East Michigan Street Suite 1800 Milwaukee, Wisconsin 53202 |
| |
Independent Registered Public Accounting Firm | | Cohen & Company, Ltd. 1350 Euclid Avenue Suite 800 Cleveland, Ohio 44115 |
| |
Custodian, Fund Accountant and Fund Administrator | | The Northern Trust Company 50 South La Salle Street Chicago, IL 60603 |
| |
Transfer Agent | | UMB Fund Services, Inc. 235 W Galena Street Milwaukee, WI 53212 |
| |
Distributor | | UMB Distribution Services, LLC 235 W Galena Street Milwaukee, WI 53212 |
This report is intended for shareholders of the Funds and may not be used as sales literature unless preceded or accompanied by a current prospectus.
Item 2. Code of Ethics.
Not applicable to this semi-annual report.
Item 3. Audit Committee Financial Expert.
Not applicable to this semi-annual report.
Item 4. Principal Accountant Fees and Services.
Not applicable to this semi-annual report.
Item 5. Audit Committee of Listed Registrants.
Not applicable.
Item 6. Investments.
| (a) | Included as part of the Report to Shareholders under Item 1 of this Form N-CSR. |
Item 7. Disclosure of Proxy Voting Policies and Procedures for Closed-End Management Investment Companies.
Not applicable.
Item 8. Portfolio Managers of Closed-End Management Investment Companies.
Not applicable.
Item 9. Purchases of Equity Securities by Closed-End Management Investment Company and Affiliated Purchasers.
Not applicable.
Item 10. Submission of Matters to a Vote of Security Holders.
During the period ended May 31, 2023, there were no material changes to the procedures by which shareholders may recommend nominees to the Registrant’s Board of Trustees.
Item 11. Controls and Procedures.
| (a) | The Registrant’s principal executive and principal financial officers, or persons performing similar functions, have concluded that the Registrant’s disclosure controls and procedures (as defined in Rule 30a-3(c) under the Investment Company Act of 1940 (the “Act”)) are effective, as of a date within 90 days of the filing date of this Form N-CSR, based on the evaluation of these controls and procedures required by the Act and under the Securities Exchange Act of 1934. |
| (b) | There were no changes in the Registrant’s internal control over financial reporting (as defined in Rule 30a-3(d) under the Act) that occurred during the period covered by this report that have materially affected, or are reasonably likely to materially affect, the Registrant’s internal control over financial reporting. |
Item 12. Disclosure of Securities Lending Activities for Closed-End Management Investment Companies.
Not applicable.
Item 13. Exhibits.
SIGNATURES
Pursuant to the requirements of the Securities Exchange Act of 1934 and the Investment Company Act of 1940, the Registrant has duly caused this report to be signed on its behalf by the undersigned, thereunto duly authorized.
| | |
| Smead Funds Trust |
| |
| By: | | /s/ Cole W. Smead |
| Cole W. Smead |
| President |
| (Principal Executive Officer) |
| |
| Date: | | August 4, 2023 |
Pursuant to the requirements of the Securities Exchange Act of 1934 and the Investment Company Act of 1940, this report has been signed below by the following persons on behalf of the Registrant and in the capacities and on the dates indicated.
| | |
| By: | | /s/ Cole W. Smead |
| Cole W. Smead |
| President |
| (Principal Executive Officer) |
| |
| Date: | | August 4, 2023 |
| |
| By: | | /s/ Steven J. LeMire |
| Steven J. LeMire |
| Treasurer |
| (Principal Financial Officer) |
| |
| Date: | | August 4, 2023 |