UNITED STATES
SECURITIES AND EXCHANGE COMMISSION
Washington, D.C. 20549
Form N-CSR
CERTIFIED SHAREHOLDER REPORT OF REGISTERED
MANAGEMENT INVESTMENT COMPANIES
Investment Company Act File Number: 811-22983
Eaton Vance NextShares Trust II
(Exact Name of Registrant as Specified in Charter)
Two International Place, Boston, Massachusetts 02110
(Address of Principal Executive Offices)
Maureen A. Gemma
Two International Place, Boston, Massachusetts 02110
(Name and Address of Agent for Services)
(617) 482-8260
(Registrant’s Telephone Number)
September 30
Date of Fiscal Year End
March 31, 2018
Date of Reporting Period
Item 1. Reports to Stockholders

Eaton Vance
Oaktree Diversified Credit NextShares (OKDCC)
Listing Exchange: The NASDAQ Stock Market LLC
Semiannual Report
March 31, 2018

NextSharesTM is a trademark of NextShares Solutions LLC. Used with permission.

Commodity Futures Trading Commission Registration. Effective December 31, 2012, the Commodity Futures Trading Commission (“CFTC”) adopted certain regulatory changes that subject registered investment companies and advisers to regulation by the CFTC if a fund invests more than a prescribed level of its assets in certain CFTC-regulated instruments (including futures, certain options and swap agreements) or markets itself as providing investment exposure to such instruments. The Fund has claimed an exclusion from the definition of the term “commodity pool operator” under the Commodity Exchange Act. Accordingly, neither the Fund nor the adviser with respect to the operation of the Fund is subject to CFTC regulation. Because of its management of other strategies, the Fund’s adviser is registered with the CFTC as a commodity pool operator and a commodity trading advisor.
Fund shares are not insured by the FDIC and are not deposits or other obligations of, or guaranteed by, any depository institution. Shares are subject to investment risks, including possible loss of principal invested.
This report must be preceded or accompanied by a current summary prospectus or prospectus. Before investing in NextShares, investors should consider carefully the investment objectives, risks, charges and expenses. This and other important information is contained in the prospectus and summary prospectus, which can be obtained from a financial advisor. Prospective investors should read the prospectus carefully before investing. For further information, please call 1-800-262-1122.
Semiannual Report March 31, 2018
Eaton Vance
Oaktree Diversified Credit NextShares
Table of Contents
| | | | |
Performance | | | 2 | |
| |
Fund Profile | | | 2 | |
| |
Endnotes and Additional Disclosures | | | 3 | |
| |
Fund Expenses | | | 4 | |
| |
Financial Statements | | | 5 | |
| |
Board of Trustees’ Contract Approval | | | 23 | |
| |
Officers and Trustees | | | 26 | |
| |
Important Notices | | | 27 | |
Eaton Vance
Oaktree Diversified Credit NextShares
March 31, 2018
Performance1,2
Portfolio Manager Bruce A. Karsh, of Oaktree Capital Management, L.P.
| | | | | | | | | | | | | | | | | | | | | | | | |
| % Cumulative Total Returns | | Fund Inception Date | | | Performance Inception Date | | | Six Months | | | One Year | | | Five Years | | | Since
Fund Inception | |
Fund at NAV | | | 11/15/2017 | | | | 11/15/2017 | | | | — | | | | — | | | | — | | | | 0.95 | % |
Fund at Market Price | | | 11/15/2017 | | | | 11/15/2017 | | | | — | | | | — | | | | — | | | | 0.95 | |
ICE BofAML U.S. High Yield Index | | | — | | | | — | | | | –0.51 | % | | | 3.69 | % | | | 5.01 | % | | | 0.50 | % |
| | | | | | |
| | | | | | | | | | | | | | | | | | | | | | | | |
| % Total Annual Operating Expense Ratios3 | | | | | | | | | | | | | | | | |
Gross | | | | | | | | | | | | | | | | | | | | | | | 1.11 | % |
Net | | | | | | | | | | | | | | | | | | | | | | | 0.90 | |
| | | | | | |
| | | | | | | | | | | | | | | | | | | | | | | | |
| % Distribution Rates/Yields4 | | | | | | | | | | | | | | | | | | |
Distribution Rate at NAV | | | | | | | | | | | | | | | | | | | | | | | 3.09 | % |
SEC 30-day Yield – Subsidized | | | | | | | | | | | | | | | | | | | | | | | 3.37 | |
SEC 30-day Yield – Unsubsidized | | | | | | | | | | | | | | | | | | | | | | | 2.40 | |
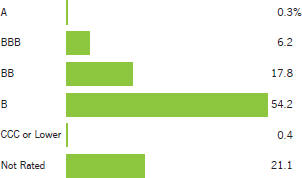
Fund Profile
Credit Quality (% of total investments)5,6
See Endnotes and Additional Disclosures in this report.
Past performance is no guarantee of future results. Investment return and principal value will fluctuate so that shares, when sold, may be worth more or less than their original cost. Performance is for the stated time period only; due to market volatility, the Fund’s current performance may be lower or higher than indicated. The Fund’s performance at market price will differ from its results at net asset value (NAV). The market price used to calculate the Market Price return is the midpoint between the highest bid and the lowest offer on the exchange on which the shares of the Fund are listed for trading, as of the time that the Fund’s NAV is calculated. If you trade your shares at another time during the day, your return may differ. Returns are historical and are calculated by determining the percentage change in NAV or market price (as applicable) with all distributions reinvested at NAV or closing market price (as applicable) on the payment date of the distribution, and are net of management fees and other expenses. Returns are before taxes unless otherwise noted. Performance less than or equal to one year is cumulative. For performance as of the most recent month-end, including historical trading premiums/discounts relative to NAV, please refer to eatonvance.com.
Eaton Vance
Oaktree Diversified Credit NextShares
March 31, 2018
Endnotes and Additional Disclosures
| 1 | ICE BofAML U.S. High Yield Index is an unmanaged index of below-investment grade U.S. corporate bonds. ICE Data Indices, LLC indices not for redistribution or other uses; provided “as is”, without warranties, and with no liability. Eaton Vance has prepared this report, ICE Data Indices, LLC does not endorse it, or guarantee, review, or endorse Eaton Vance’s products. Unless otherwise stated, index returns do not reflect the effect of any applicable sales charges, commissions, expenses, taxes or leverage, as applicable. It is not possible to invest directly in an index. Performance since inception for an index, if presented, is the performance since the Fund’s inception. |
| 2 | Shares of NextShares funds are normally bought and sold in the secondary market through a broker, and may not be individually purchased or redeemed from the fund. In the secondary market, buyers and sellers transact with each other, rather than with the fund. Market trading prices of NextShares are linked to the fund’s next-computed net asset value (NAV) and will vary from NAV by a market-determined premium or discount, which may be zero. Buyers and sellers of NextShares will not know the value of their purchases and sales until after the fund’s NAV is determined at the end of the trading day. Market trading prices may vary significantly from anticipated levels. NextShares do not offer investors the opportunity to buy and sell intraday based on current (versus end-of-day) determinations of fund value. NextShares trade execution prices will fluctuate based on changes in NAV. Although limit orders may be used to control trading costs, they cannot be used to control or limit trade execution prices. As a new type of fund, NextShares have a limited operating history and may initially be available through a limited number of brokers. There can be no guarantee that an active trading market for NextShares will develop or be maintained, or that their listing will continue unchanged. Buying and selling NextShares may require payment of brokerage commissions and expose transacting shareholders to other trading costs. Frequent trading may detract from realized investment returns. The return on a shareholder’s NextShares investment will be reduced if the shareholder sells shares at a greater discount or narrower premium to NAV than he or she acquired the shares. NextShares funds issue and redeem shares only in specified creation unit quantities in transactions by or through authorized participants. In such transactions, a fund issues and redeems shares in exchange for the basket of securities, other instruments and/or cash that the fund specifies each business day. A fund’s basket is not intended to be representative of the fund’s current portfolio positions and may vary significantly from current positions. |
| 3 | Source: Fund prospectus. Net expense ratio reflects a contractual expense reimbursement that continues through 12/31/18. Without the reimbursement, performance would have been lower. The expense ratio for the current reporting period can be found in the Financial Highlights section of this report. |
| 4 | The Distribution Rate is based on the Fund’s last regular distribution per share in the period (annualized) divided by the Fund’s NAV at the end of the period. The Fund’s distributions may be comprised of amounts characterized for federal income tax purposes as tax-exempt income, qualified and non-qualified ordinary dividends, capital gains and nondividend distributions, also known as return of capital. The Fund will determine the federal income tax character of distributions paid to a shareholder after the end of the calendar year. This is reported on the IRS form 1099-DIV and provided to the shareholder shortly after each year-end. The Fund’s distributions are determined by the investment adviser based on its current assessment of the Fund’s long-term return potential. As portfolio and market conditions change, the rate of distributions paid by the Fund could change. SEC Yield is a standardized measure based on the estimated yield to maturity of a fund’s investments over a 30-day period and is based on the maximum offer price at the date specified. The SEC Yield is not based on the distributions made by the Fund, which may differ. Subsidized yield reflects the effect of fee waivers and expense reimbursements. |
| 5 | Ratings are based on Moody’s, S&P or Fitch, as applicable. If securities are rated differently by the ratings agencies, the lowest rating is applied. Ratings, which are subject to change, apply to the creditworthiness of the issuers of the underlying securities and not to the Fund or its shares. Credit ratings measure the quality of a bond based on the issuer’s creditworthiness, with ratings ranging from AAA, being the highest, to D, being the lowest based on S&P’s measures. Ratings of BBB or higher by S&P or Fitch (Baa or higher by Moody’s) are considered to be investment-grade quality. Credit ratings are based largely on the ratings agency’s analysis at the time of rating. The rating assigned to any particular security is not necessarily a reflection of the issuer’s current financial condition and does not necessarily reflect its assessment of the volatility of a security’s market value or of the liquidity of an investment in the security. Holdings designated as “Not Rated” (if any) are not rated by the national ratings agencies stated above. |
| 6 | Excludes cash and cash equivalents. |
| | Fund profile subject to change due to active management. |
Important Notice to Shareholders
| | On December 13, 2017, the Trustees of the Fund approved a 2-for-1 stock split, effective March 9, 2018. The stock split had no impact on the net assets of the Fund or the overall value of a shareholder’s investment in the Fund. |
Eaton Vance
Oaktree Diversified Credit NextShares
March 31, 2018
Fund Expenses
Example: As a Fund shareholder, you incur two types of costs: (1) transaction costs, including brokerage commissions on purchases and sales of Fund shares; and (2) ongoing costs, including management fees and other Fund expenses. This Example is intended to help you understand your ongoing costs (in dollars) of Fund investing and to compare these costs with the ongoing costs of investing in other funds. The actual expense Example is based on an investment of $1,000 invested at the beginning of the period and held for the entire period (November 15, 2017 – March 31, 2018). The hypothetical expense Example is based on an investment of $1,000 invested for the one-half year period (October 1, 2017 – March 31, 2018).
Actual Expenses: The first section of the table below provides information about actual account values and actual expenses. You may use the information in this section, together with the amount you invested, to estimate the expenses that you paid over the period. Simply divide your account value by $1,000 (for example, an $8,600 account value divided by $1,000 = 8.6), then multiply the result by the number in the first section under the heading entitled “Expenses Paid During Period” to estimate the expenses you paid on your account during this period.
Hypothetical Example for Comparison Purposes: The second section of the table below provides information about hypothetical account values and hypothetical expenses based on the actual Fund expense ratio and an assumed rate of return of 5% per year (before expenses), which is not the actual Fund return. The hypothetical account values and expenses may not be used to estimate the actual ending account balance or expenses you paid for the period. You may use this information to compare the ongoing costs of investing in your Fund and other funds. To do so, compare this 5% hypothetical example with the 5% hypothetical examples that appear in the shareholder reports of the other funds.
Please note that the expenses shown in the table are meant to highlight your ongoing costs only and do not reflect any transactional costs, such as brokerage commissions on purchases and sales of Fund shares. Therefore, the second section of the table is useful in comparing ongoing costs only, and will not help you determine the relative total costs of owning different funds. In addition, if these transactional costs were included, your costs would be higher.
| | | | | | | | | | | | | | | | |
| | | Beginning
Account Value
(11/15/17) | | | Ending
Account Value
(3/31/18) | | | Expenses Paid
During Period
(11/15/17 – 3/31/18) | | | Annualized
Expense
Ratio | |
| | | |
Actual* | | | | | | | | | | | | | |
| | $ | 1,000.00 | | | $ | 1,009.50 | | | $ | 3.39 | *** | | | 0.90 | % |
| * | The Fund had not commenced operations on October 1, 2017. Actual expenses are equal to the Fund’s annualized expense ratio, multiplied by the average account value over the period, multiplied by 137/365 (to reflect the period from commencement of operations on November 15, 2017 to March 31, 2018). The Example assumes that the $1,000 was invested at the net asset value per share determined at the opening of business on November 15, 2017. |
| | | | | | | | | | | | | | | | |
| | | Beginning
Account Value
(10/1/17) | | | Ending
Account Value
(3/31/18) | | | Expenses Paid
During Period
(10/1/17 – 3/31/18) | | | Annualized
Expense
Ratio | |
| | | | |
Hypothetical** | | | | | | | | | | | | | | | | |
(5% return per year before expenses) | | | | | | | | | | | | | | | | |
| | $ | 1,000.00 | | | $ | 1,020.40 | | | $ | 4.53 | *** | | | 0.90 | % |
| ** | Hypothetical expenses are equal to the Fund’s annualized expense ratio, multiplied by the average account value over the period, multiplied by 182/365 (to reflect the one-half year period). The Example assumes that the $1,000 was invested at the net asset value per share determined at the opening of business on November 15, 2017. |
| *** | Absent an allocation of certain expenses to an affiliate, expenses would be higher. |
Eaton Vance
Oaktree Diversified Credit NextShares
March 31, 2018
Portfolio of Investments (Unaudited)
| | | | | | | | | | | | |
| Senior Floating-Rate Loans — 36.5%(1) | |
| Borrower/Tranche Description | | | | | Principal Amount* (000’s omitted) | | | Value | |
| | | | | | | | | | | | |
| | | |
| Business Equipment and Services — 6.0% | | | | | | | | | |
| Fugue Finance B.V. | | | | | | | | | |
Term Loan, 3.25%, (3 mo. EURIBOR + 3.25%), Maturing September 1, 2024 | | | EUR | | | | 400 | | | $ | 491,565 | |
| Kiloutou NewCo | | | | | | | | | |
Term Loan, Maturing January 31, 2025(2) | | | EUR | | | | 230 | | | | 283,622 | |
| Mitchell International, Inc. | | | | | | | | | |
Term Loan, 1.63%, Maturing November 29, 2024(3) | | | | | | | 75 | | | | 74,860 | |
Term Loan, 5.13%, (1 mo. USD LIBOR + 3.25%), Maturing November 29, 2024 | | | | | | | 925 | | | | 928,265 | |
| Nets Holding A/S | | | | | | | | | |
Term Loan, 3.25%, (3 mo. EURIBOR + 3.25%), Maturing February 6, 2025 | | | EUR | | | | 176 | | | | 216,890 | |
| Packers Holdings, LLC | | | | | | | | | |
Term Loan, 4.94%, (3 mo. USD LIBOR + 3.25%), Maturing December 4, 2024 | | | | | | | 998 | | | | 1,000,410 | |
| | | | | | | | | | | $ | 2,995,612 | |
|
| Cable and Satellite Television — 3.0% | |
| Charter Communications Operating, LLC | | | | | | | | | |
Term Loan, 3.88%, (1 mo. USD LIBOR + 2.00%), Maturing
April 30, 2025 | | | | | | | 748 | | | $ | 751,679 | |
| CSC Holdings, LLC | | | | | | | | | |
Term Loan, 4.28%, (1 mo. USD LIBOR + 2.50%), Maturing January 25, 2026 | | | | | | | 750 | | | | 751,054 | |
| | | | | | | | | | | $ | 1,502,733 | |
|
| Chemicals and Plastics — 4.4% | |
| CTC AcquiCo GmbH | | | | | | | | | |
Term Loan, 5.24%, (3 mo. USD LIBOR + 3.25%), Maturing November 29, 2024 | | | | | | | 1,200 | | | $ | 1,197,000 | |
| Proampac PG Borrower, LLC | | | | | | | | | |
Term Loan, 5.30%, (1 mo. USD LIBOR + 3.50%), Maturing November 18, 2023 | | | | | | | 995 | | | | 1,005,327 | |
| | | | | | | | | | | $ | 2,202,327 | |
|
| Ecological Services and Equipment — 4.0% | |
| EG Finco Limited | | | | | | | | | |
Term Loan, Maturing January 19, 2025(2) | | | | | | | 500 | | | $ | 500,209 | |
| ExGen Renewables IV, LLC | | | | | | | | | |
Term Loan, 4.99%, (3 mo. USD LIBOR + 3.00%), Maturing November 28, 2024 | | | | | | | 1,496 | | | | 1,516,823 | |
| | | | | | | | | | | $ | 2,017,032 | |
| | | | | | | | | | | | |
| Borrower/Tranche Description | | | | | Principal Amount* (000’s omitted) | | | Value | |
| | | | | | | | | | | | |
|
| Electronics / Electrical — 2.5% | |
| Infor (US), Inc. | | | | | | | | | |
Term Loan, 3.25%, (3 mo. EURIBOR + 2.25%, Floor 1.00%), Maturing February 1, 2022 | | | EUR | | | | 200 | | | $ | 246,119 | |
| SolarWinds Holdings, Inc. | | | | | | | | | |
Term Loan, Maturing February 21,
2024(2) | | | | | | | 500 | | | | 502,843 | |
| SS&C Technologies, Inc. | | | | | | | | | |
Term Loan, Maturing February 28,
2025(2) | | | | | | | 500 | | | | 503,164 | |
| | | | | | | | | | | $ | 1,252,126 | |
|
| Financial Intermediaries — 1.5% | |
| CCP Lux Holding S.a.r.l. | | | | | | | | | |
Term Loan, Maturing January 31,
2025(2) | | | EUR | | | | 200 | | | $ | 246,449 | |
| Fintrax | | | | | | | | | |
Term Loan, 4.00%, (3 mo. EURIBOR + 4.00%), Maturing December 14, 2024 | | | EUR | | | | 200 | | | | 248,335 | |
| Peer Holding B.V. | | | | | | | | | |
Term Loan, Maturing February 13,
2025(2) | | | EUR | | | | 200 | | | | 245,304 | |
| | | | | | | | | | | $ | 740,088 | |
|
| Food Products — 0.5% | |
| Refresco Group B.V. | | | | | | | | | |
Term Loan, Maturing December 14, 2024(2) | | | EUR | | | | 200 | | | $ | 245,987 | |
| | | | | | | | | | | $ | 245,987 | |
|
| Health Care — 5.4% | |
| CHG Healthcare Services, Inc. | | | | | | | | | |
Term Loan, 4.77%, (3 mo. USD LIBOR + 3.00%), Maturing June 7, 2023 | | | | | | | 995 | | | $ | 1,004,743 | |
| Independent Vetcare Holdings Limited | | | | | | | | | |
Term Loan, 5.21%, (3 mo. GBP LIBOR + 4.50%), Maturing January 31, 2024 | | | GBP | | | | 260 | | | | 365,692 | |
| Innoviva, Inc. | | | | | | | | | |
Term Loan, 6.37%, (3 mo. USD LIBOR + 4.50%), Maturing August 11, 2022 | | | | | | | 371 | | | | 374,963 | |
| Pearl Intermediate Parent, LLC | | | | | | | | | |
Term Loan, 1.00%, Maturing February 14, 2025(3) | | | | | | | 227 | | | | 225,497 | |
Term Loan, 4.53%, (1 mo. USD LIBOR + 2.75%), Maturing February 14, 2025 | | | | | | | 773 | | | | 766,691 | |
| | | | | | | | | | | $ | 2,737,586 | |
|
| Industrial Equipment — 1.3% | |
| Pro Mach Group, Inc. | | | | | | | | | |
Term Loan, 5.03%, (3 mo. USD LIBOR + 3.00%), Maturing March 7, 2025 | | | | | | | 500 | | | $ | 501,384 | |
| | | | |
| | 5 | | See Notes to Financial Statements. |
Eaton Vance
Oaktree Diversified Credit NextShares
March 31, 2018
Portfolio of Investments (Unaudited) — continued
| | | | | | | | | | | | |
| Borrower/Tranche Description | | | | | Principal Amount* (000’s omitted) | | | Value | |
| | | | | | | | | | | | |
|
| Industrial Equipment (continued) | |
| TI Luxembourg S.A. | | | | | | | | | |
Term Loan, Maturing January 9, 2025(2) | | | EUR | | | | 140 | | | $ | 172,505 | |
| | | | | | | | | | | $ | 673,889 | |
|
| Insurance — 2.0% | |
| Mayfield Agency Borrower, Inc. | | | | | | | | | |
Term Loan, 6.38%, (1 mo. USD LIBOR + 4.50%), Maturing January 30, 2025 | | | | | | | 1,000 | | | $ | 1,008,125 | |
| | | | | | | | | | | $ | 1,008,125 | |
|
| Leisure Goods / Activities / Movies — 2.0% | |
| MND Holdings III Corp. | | | | | | | | | |
Term Loan, 6.05%, (3 mo. USD LIBOR + 3.75%), Maturing June 19, 2024 | | | | | | | 995 | | | $ | 1,008,047 | |
| | | | | | | | | | | $ | 1,008,047 | |
|
| Lodging and Casinos — 0.5% | |
| A&O Hotels and Hostels Holding AG | | | | | | | | | |
Term Loan, 3.75%, (3 mo. EURIBOR + 3.75%), Maturing December 20, 2024 | | | EUR | | | | 200 | | | $ | 248,551 | |
| | | | | | | | | | | $ | 248,551 | |
|
| Nonferrous Metals / Minerals — 1.0% | |
| American Rock Salt Company, LLC | | | | | | | | | |
Term Loan, Maturing March 21, 2025(2) | | | | | | | 500 | | | $ | 502,969 | |
| | | | | | | | | | | $ | 502,969 | |
|
| Radio and Television — 2.0% | |
| Sinclair Television Group, Inc. | | | | | | | | | |
Term Loan, Maturing
December 12, 2024(2) | | | | | | | 1,000 | | | $ | 1,006,370 | |
| | | | | | | | | | | $ | 1,006,370 | |
|
| Retailers (Except Food and Drug) — 0.4% | |
| EG Group Limited | | | | | | | | | |
Term Loan, Maturing
January 18, 2025(2) | | | GBP | | | | 150 | | | $ | 209,950 | |
| | | | | | | | | | | $ | 209,950 | |
| |
Total Senior Floating-Rate Loans
(identified cost $18,160,814) | | | $ | 18,351,392 | |
| | | | | | | | | | | | |
| Corporate Bonds & Notes — 22.7% | |
| Security | | | | | Principal Amount* (000’s omitted) | | | Value | |
| | | | | | | | | | | | |
| | | |
| Chemicals — 0.4% | | | | | | | | | |
| Monitchem HoldCo 3 S.A. | | | | | | | | | |
5.25%, 6/15/21(5) | | | EUR | | | | 150 | | | $ | 186,753 | |
| | | | | | | | | | | $ | 186,753 | |
|
| Commercial Services — 0.6% | |
| Ritchie Bros Auctioneers, Inc. | | | | | | | | | |
5.375%, 1/15/25(6) | | | | | | | 125 | | | $ | 125,313 | |
| Service Corp. International | | | | | | | | | |
5.375%, 5/15/24 | | | | | | | 190 | | | | 198,132 | |
| | | | | | | | | | | $ | 323,445 | |
|
| Computers — 0.5% | |
| NCR Corp. | | | | | | | | | |
6.375%, 12/15/23 | | | | | | | 215 | | | $ | 223,600 | |
| | | | | | | | | | | $ | 223,600 | |
|
| Distribution & Wholesale — 0.6% | |
| H&E Equipment Services, Inc. | | | | | | | | | |
5.625%, 9/1/25 | | | | | | | 295 | | | $ | 298,319 | |
| | | | | | | | | | | $ | 298,319 | |
|
| Diversified Financial Services — 0.9% | |
| Intrum Justitia AB | | | | | | | | | |
3.125%, 7/15/24(5) | | | EUR | | | | 100 | | | $ | 119,335 | |
| Mercury BondCo PLC | | | | | | | | | |
7.125%, (7.125% cash or 7.875% PIK), 5/30/21(5)(7) | | | EUR | | | | 100 | | | | 127,286 | |
| Vantiv, LLC/Vanity Issuer Corp. | | | | | | | | | |
3.875%, 11/15/25(6) | | | GBP | | | | 150 | | | | 208,230 | |
| | | | | | | | | | | $ | 454,851 | |
|
| Entertainment — 1.3% | |
| CPUK Finance, Ltd. | | | | | | | | | |
4.25%, 2/28/47(5) | | | GBP | | | | 100 | | | $ | 141,634 | |
| Scientific Games International, Inc. | | | | | | | | | |
5.00%, 10/15/25(6) | | | | | | | 125 | | | | 121,875 | |
| Six Flags Entertainment Corp. | | | | | | | | | |
4.875%, 7/31/24(6) | | | | | | | 280 | | | | 273,350 | |
| WMG Acquisition Corp. | | | | | | | | | |
4.125%, 11/1/24(5) | | | EUR | | | | 100 | | | | 129,243 | |
| | | | | | | | | | | $ | 666,102 | |
| | | | |
| | 6 | | See Notes to Financial Statements. |
Eaton Vance
Oaktree Diversified Credit NextShares
March 31, 2018
Portfolio of Investments (Unaudited) — continued
| | | | | | | | | | | | |
| Security | | | | | Principal Amount* (000’s omitted) | | | Value | |
| | | | | | | | | | | | |
|
| Food Services — 0.5% | |
| Aramark Services, Inc. | | | | | | | | | |
5.125%, 1/15/24 | | | | | | | 245 | | | $ | 250,513 | |
| | | | | | | | | | | $ | 250,513 | |
|
| Forest Products & Paper — 0.4% | |
| Mercer International, Inc. | | | | | | | | | |
5.50%, 1/15/26(6) | | | | | | | 200 | | | $ | 199,000 | |
| | | | | | | | | | | $ | 199,000 | |
|
| Health Care – Services — 0.6% | |
| CHS/Community Health Systems, Inc. | | | | | | | | | |
6.25%, 3/31/23 | | | | | | | 330 | | | $ | 305,663 | |
| | | | | | | | | | | $ | 305,663 | |
|
| Home Builders — 0.5% | |
| Century Communities, Inc. | | | | | | | | | |
5.875%, 7/15/25 | | | | | | | 250 | | | $ | 238,750 | |
| | | | | | | | | | | $ | 238,750 | |
|
| Machinery – Diversified — 0.7% | |
| RBS Global, Inc./Rexnord, LLC | | | | | | | | | |
4.875%, 12/15/25(6) | | | | | | | 150 | | | $ | 145,875 | |
| Tennant Co. | | | | | | | | | |
5.625%, 5/1/25 | | | | | | | 220 | | | | 225,500 | |
| | | | | | | | | | | $ | 371,375 | |
|
| Media — 1.9% | |
| SFR Group S.A. | | | | | | | | | |
5.625%, 5/15/24(5) | | | EUR | | | | 100 | | | $ | 125,130 | |
| Sirius XM Radio, Inc. | | | | | | | | | |
5.375%, 4/15/25(6) | | | | | | | 200 | | | | 199,000 | |
| Univision Communications, Inc. | | | | | | | | | |
5.125%, 5/15/23(6) | | | | | | | 380 | | | | 362,938 | |
| Virgin Media Receivables Financing Notes I DAC | | | | | | | | | |
5.50%, 9/15/24(5) | | | GBP | | | | 100 | | | | 138,117 | |
| Ziggo Bond Finance B.V. | | | | | | | | | |
4.625%, 1/15/25(5) | | | EUR | | | | 100 | | | | 124,117 | |
| | | | | | | | | | | $ | 949,302 | |
|
| Metal Fabricate & Hardware — 1.0% | |
| Grinding Media, Inc./Moly-Cop AltaSteel, Ltd. | | | | | | | | | |
7.375%, 12/15/23(6) | | | | | | | 330 | | | $ | 347,325 | |
| | | | | | | | | | | | |
| Security | | | | | Principal Amount* (000’s omitted) | | | Value | |
| | | | | | | | | | | | |
|
| Metal Fabricate & Hardware (continued) | |
| TriMas Corp. | | | | | | | | | |
4.875%, 10/15/25(6) | | | | | | | 180 | | | $ | 174,487 | |
| | | | | | | | | | | $ | 521,812 | |
|
| Oil & Gas — 1.2% | |
| Extraction Oil & Gas, Inc. | | | | | | | | | |
5.625%, 2/1/26(6) | | | | | | | 135 | | | $ | 127,744 | |
Hess Infrastructure Partners L.P./Hess Infrastructure
Partners Finance Corp. | | | | | | | | | |
5.625%, 2/15/26(6) | | | | | | | 250 | | | | 246,875 | |
| Oasis Petroleum, Inc. | | | | | | | | | |
6.875%, 1/15/23 | | | | | | | 245 | | | | 248,981 | |
| | | | | | | | | | | $ | 623,600 | |
|
| Packaging & Containers — 1.7% | |
| ARD Finance S.A. | | | | | | | | | |
6.625%, (6.625% cash or 7.375% PIK), 9/15/23(7) | | | EUR | | | | 100 | | | $ | 130,120 | |
| BWAY Holding Co. | | | | | | | | | |
5.50%, 4/15/24(6) | | | | | | | 270 | | | | 272,362 | |
| Multi-Color Corp. | | | | | | | | | |
4.875%, 11/1/25(6) | | | | | | | 210 | | | | 196,875 | |
Reynolds Group Issuer, Inc./Reynolds Group Issuer,
LLC | | | | | | | | | |
5.125%, 7/15/23(6) | | | | | | | 225 | | | | 227,464 | |
| | | | | | | | | | | $ | 826,821 | |
|
| Pharmaceuticals — 1.6% | |
| Grifols S.A. | | | | | | | | | |
3.20%, 5/1/25(5) | | | EUR | | | | 150 | | | $ | 186,439 | |
| Nidda Healthcare Holding GmbH | | | | | | | | | |
3.50%, 9/30/24(5) | | | EUR | | | | 100 | | | | 123,094 | |
| Valeant Pharmaceuticals International, Inc. | | | | | | | | | |
6.50%, 3/15/22(6) | | | | | | | 95 | | | | 98,444 | |
5.875%, 5/15/23(6) | | | | | | | 335 | | | | 298,568 | |
5.50%, 11/1/25(6) | | | | | | | 75 | | | | 73,294 | |
| | | | | | | | | | | $ | 779,839 | |
|
| Real Estate — 0.9% | |
| Hunt Cos., Inc. | | | | | | | | | |
6.25%, 2/15/26(6) | | | | | | | 223 | | | $ | 215,835 | |
| Kennedy-Wilson, Inc. | | | | | | | | | |
5.875%, 4/1/24(6) | | | | | | | 250 | | | | 249,063 | |
| | | | | | | | | | | $ | 464,898 | |
| | | | |
| | 7 | | See Notes to Financial Statements. |
Eaton Vance
Oaktree Diversified Credit NextShares
March 31, 2018
Portfolio of Investments (Unaudited) — continued
| | | | | | | | | | | | |
| Security | | | | | Principal Amount* (000’s omitted) | | | Value | |
| | | | | | | | | | | | |
|
| Real Estate Investment Trusts (REITs) — 1.1% | |
| ESH Hospitality, Inc. | | | | | | | | | |
5.25%, 5/1/25(6) | | | | | | | 255 | | | $ | 248,701 | |
| Iron Mountain, Inc. | | | | | | | | | |
5.25%, 3/15/28(6) | | | | | | | 105 | | | | 99,356 | |
| SBA Communications Corp. | | | | | | | | | |
4.875%, 9/1/24 | | | | | | | 230 | | | | 226,263 | |
| | | | | | | | | | | $ | 574,320 | |
|
| Retail — 1.1% | |
| FirstCash, Inc. | | | | | | | | | |
5.375%, 6/1/24(6) | | | | | | | 170 | | | $ | 173,561 | |
Suburban Propane Partners L.P./Suburban Energy
Finance Corp. | | | | | | | | | |
5.75%, 3/1/25 | | | | | | | 380 | | | | 366,700 | |
| | | | | | | | | | | $ | 540,261 | |
|
| Software — 1.4% | |
| First Data Corp. | | | | | | | | | |
5.75%, 1/15/24(6) | | | | | | | 245 | | | $ | 247,450 | |
| MSCI, Inc. | | | | | | | | | |
5.75%, 8/15/25(6) | | | | | | | 215 | | | | 225,686 | |
| TeamSystem SpA | | | | | | | | | |
4.00%, (3 mo. EURIBOR + 4.00%), 4/15/23(4)(6)(8) | | | EUR | | | | 200 | | | | 246,705 | |
| | | | | | | | | | | $ | 719,841 | |
|
| Telecommunications — 3.4% | |
| CommScope, Inc. | | | | | | | | | |
5.50%, 6/15/24(6) | | | | | | | 270 | | | $ | 276,750 | |
| Frontier Communications Corp. | | | | | | | | | |
8.50%, 4/1/26(6) | | | | | | | 125 | | | | 121,562 | |
| Intelsat Jackson Holdings S.A. | | | | | | | | | |
8.00%, 2/15/24(6) | | | | | | | 360 | | | | 379,350 | |
| Level 3 Financing, Inc. | | | | | | | | | |
5.625%, 2/1/23 | | | | | | | 200 | | | | 200,690 | |
| Plantronics, Inc. | | | | | | | | | |
5.50%, 5/31/23(6) | | | | | | | 250 | | | | 248,450 | |
| Sprint Communications, Inc. | | | | | | | | | |
6.00%, 11/15/22 | | | | | | | 505 | | | | 496,794 | |
| | | | | | | | | | | $ | 1,723,596 | |
| | | | | | | | | | | | |
| Security | | | | | Principal Amount* (000’s omitted) | | | Value | |
| | | | | | | | | | | | |
|
| Transportation — 0.4% | |
| Watco Cos., LLC/Watco Finance Corp. | | | | | | | | | |
6.375%, 4/1/23(6) | | | | | | | 195 | | | $ | 200,606 | |
| | | | | | | | | | | $ | 200,606 | |
| |
Total Corporate Bonds & Notes
(identified cost $11,568,111) | | | $ | 11,443,267 | |
| | | | | | | | | | | | |
|
| Convertible Bonds — 15.0% | |
| Security | | | | | Principal Amount* (000’s omitted) | | | Value | |
| | | |
| Aerospace & Defense — 0.3% | | | | | | | | | |
| Airbus SE | | | | | | | | | |
0.00%, 7/1/22(5) | | | EUR | | | | 100 | | | $ | 146,977 | |
| | | | | | | | | | | $ | 146,977 | |
|
| Agriculture — 0.1% | |
| Vector Group, Ltd. | | | | | | | | | |
5.50%, (3 mo. Cash Dividends on Common Stock + 1.75%, Floor 5.50%), 4/15/20 | | | | | | | 40 | | | $ | 44,086 | |
| | | | | | | | | | | $ | 44,086 | |
|
| Airlines — 0.4% | |
| ANA Holdings, Inc. | | | | | | | | | |
0.00%, 9/19/24(5) | | | JPY | | | | 20,000 | | | $ | 195,245 | |
| | | | | | | | | | | $ | 195,245 | |
|
| Biotechnology — 0.3% | |
| Illumina, Inc. | | | | | | | | | |
0.00%, 6/15/19 | | | | | | | 73 | | | $ | 81,127 | |
| Innoviva, Inc. | | | | | | | | | |
2.125%, 1/15/23 | | | | | | | 48 | | | | 51,620 | |
| | | | | | | | | | | $ | 132,747 | |
|
| Chemicals — 0.8% | |
| Kansai Paint Co., Ltd. | | | | | | | | | |
0.00%, 6/17/22(5) | | | JPY | | | | 20,000 | | | $ | 196,889 | |
| Mitsubishi Chemical Holdings Corp. | | | | | | | | | |
0.00%, 3/29/24(5) | | | JPY | | | | 20,000 | | | | 202,998 | |
| | | | | | | | | | | $ | 399,887 | |
| | | | |
| | 8 | | See Notes to Financial Statements. |
Eaton Vance
Oaktree Diversified Credit NextShares
March 31, 2018
Portfolio of Investments (Unaudited) — continued
| | | | | | | | | | | | |
| Security | | | | | Principal Amount* (000’s omitted) | | | Value | |
| | | | | | | | | | | | |
|
| Coal — 0.5% | |
| RAG-Stiftung | | | | | | | | | |
0.00%, 3/16/23(5) | | | EUR | | | | 200 | | | $ | 256,007 | |
| | | | | | | | | | | $ | 256,007 | |
|
| Commercial Services — 0.4% | |
| Cardtronics, Inc. | | | | | | | | | |
1.00%, 12/1/20 | | | | | | | 75 | | | $ | 70,038 | |
| Huron Consulting Group, Inc. | | | | | | | | | |
1.25%, 10/1/19 | | | | | | | 125 | | | | 118,121 | |
| | | | | | | | | | | $ | 188,159 | |
|
| Computers — 0.3% | |
| Indra Sistemas S.A. | | | | | | | | | |
1.25%, 10/7/23(5) | | | EUR | | | | 100 | | | $ | 132,396 | |
| | | | | | | | | | | $ | 132,396 | |
|
| Diversified Financial Services — 0.9% | |
| Encore Capital Group, Inc. | | | | | | | | | |
2.875%, 3/15/21 | | | | | | | 100 | | | $ | 100,300 | |
| JPMorgan Chase Financial Co., LLC | | | | | | | | | |
0.25%, 5/1/23 | | | | | | | 95 | | | | 94,041 | |
| PRA Group, Inc. | | | | | | | | | |
3.00%, 8/1/20 | | | | | | | 150 | | | | 144,937 | |
3.50%, 6/1/23(6) | | | | | | | 95 | | | | 102,210 | |
| | | | | | | | | | | $ | 441,488 | |
|
| Electric — 0.3% | |
| China Yangtze Power International BVI 2, Ltd. | | | | | | | | | |
0.00%, 11/9/21(5) | | | EUR | | | | 100 | | | $ | 136,888 | |
| | | | | | | | | | | $ | 136,888 | |
|
| Energy – Alternate Sources — 0.2% | |
| Green Plains, Inc. | | | | | | | | | |
4.125%, 9/1/22 | | | | | | | 130 | | | $ | 123,993 | |
| | | | | | | | | | | $ | 123,993 | |
|
| Engineering & Construction — 0.5% | |
| China Railway Construction Corp, Ltd. | | | | | | | | | |
0.00%, 1/29/21(5) | | | | | | | 250 | | | $ | 258,000 | |
| | | | | | | | | | | $ | 258,000 | |
| | | | | | | | | | | | |
| Security | | | | | Principal Amount* (000’s omitted) | | | Value | |
| | | | | | | | | | | | |
|
| Entertainment — 0.1% | |
| Live Nation Entertainment, Inc. | | | | | | | | | |
2.50%, 3/15/23(6) | | | | | | | 45 | | | $ | 45,526 | |
| | | | | | | | | | | $ | 45,526 | |
|
| Health Care – Products — 0.5% | |
| Nevro Corp. | | | | | | | | | |
1.75%, 6/1/21 | | | | | | | 40 | | | $ | 46,199 | |
| QIAGEN N.V. | | | | | | | | | |
0.50%, 9/13/23(5) | | | | | | | 200 | | | | 202,368 | |
| | | | | | | | | | | $ | 248,567 | |
|
| Health Care – Services — 0.3% | |
| Brookdale Senior Living, Inc. | | | | | | | | | |
2.75%, 6/15/18 | | | | | | | 125 | | | $ | 125,156 | |
| | | | | | | | | | | $ | 125,156 | |
|
| Holding Company – Diversified — 0.3% | |
| RWT Holdings, Inc. | | | | | | | | | |
5.625%, 11/15/19 | | | | | | | 150 | | | $ | 151,500 | |
| | | | | | | | | | | $ | 151,500 | |
|
| Home Furnishings — 0.8% | |
| Harvest International Co. | | | | | | | | | |
0.00%, 11/21/22(5) | | | HKD | | | | 2,000 | | | $ | 274,905 | |
| Sony Corp. | | | | | | | | | |
0.00%, 9/30/22 | | | JPY | | | | 10,000 | | | | 117,241 | |
| | | | | | | | | | | $ | 392,146 | |
|
| Internet — 1.3% | |
| Ctrip.com International, Ltd. | | | | | | | | | |
1.00%, 7/1/20 | | | | | | | 209 | | | $ | 225,532 | |
| FireEye, Inc. | | | | | | | | | |
1.00%, 6/1/35 | | | | | | | 75 | | | | 71,507 | |
| Pandora Media, Inc. | | | | | | | | | |
1.75%, 12/1/20 | | | | | | | 150 | | | | 137,345 | |
| Q2 Holdings, Inc. | | | | | | | | | |
0.75%, 2/15/23(6) | | | | | | | 93 | | | | 95,538 | |
| Twitter, Inc. | | | | | | | | | |
0.25%, 9/15/19 | | | | | | | 150 | | | | 144,613 | |
| | | | | | | | | | | $ | 674,535 | |
| | | | |
| | 9 | | See Notes to Financial Statements. |
Eaton Vance
Oaktree Diversified Credit NextShares
March 31, 2018
Portfolio of Investments (Unaudited) — continued
| | | | | | | | | | | | |
| Security | | | | | Principal Amount* (000’s omitted) | | | Value | |
| | | | | | | | | | | | |
|
| Investment Companies — 0.5% | |
| Archer Obligations S.A. | | | | | | | | | |
0.00%, 3/31/23(5) | | | EUR | | | | 200 | | | $ | 274,944 | |
| | | | | | | | | | | $ | 274,944 | |
|
| Iron & Steel — 0.4% | |
| Abigrove, Ltd. | | | | | | | | | |
0.00%, 2/16/22(5) | | | | | | | 200 | | | $ | 206,050 | |
| | | | | | | | | | | $ | 206,050 | |
|
| Media — 0.1% | |
| Liberty Media Corp. | | | | | | | | | |
2.25%, 9/30/46 | | | | | | | 45 | | | $ | 47,055 | |
| | | | | | | | | | | $ | 47,055 | |
| | | |
| Mining — 0.3% | | | | | | | | | |
| SSR Mining, Inc. | | | | | | | | | |
2.875%, 2/1/33 | | | | | | | 150 | | | $ | 149,156 | |
| | | | | | | | | | | $ | 149,156 | |
| | | |
| Oil & Gas — 0.4% | | | | | | | | | |
| PDC Energy, Inc. | | | | | | | | | |
1.125%, 9/15/21 | | | | | | | 84 | | | $ | 81,980 | |
| Whiting Petroleum Corp. | | | | | | | | | |
1.25%, 4/1/20 | | | | | | | 150 | | | | 141,935 | |
| | | | | | | | | | | $ | 223,915 | |
| | | |
| Oil & Gas Services — 0.5% | | | | | | | | | |
| Helix Energy Solutions Group, Inc. | | | | | | | | | |
4.25%, 5/1/22 | | | | | | | 125 | | | $ | 118,647 | |
| SEACOR Holdings, Inc. | | | | | | | | | |
3.00%, 11/15/28 | | | | | | | 150 | | | | 145,693 | |
| | | | | | | | | | | $ | 264,340 | |
| | | |
| Pharmaceuticals — 0.5% | | | | | | | | | |
| Herbalife, Ltd. | | | | | | | | | |
2.625%, 3/15/24(6) | | | | | | | 70 | | | $ | 70,420 | |
| Horizon Pharma Investment, Ltd. | | | | | | | | | |
2.50%, 3/15/22 | | | | | | | 75 | | | | 69,061 | |
| Supernus Pharmaceuticals, Inc. | | | | | | | | | |
0.625%, 4/1/23(6) | | | | | | | 40 | | | | 42,654 | |
| Teva Pharmaceutical Finance Co., LLC | | | | | | | | | |
0.25%, 2/1/26 | | | | | | | 75 | | | | 66,108 | |
| | | | | | | | | | | $ | 248,243 | |
| | | | | | | | | | | | |
| Security | | | | | Principal Amount* (000’s omitted) | | | Value | |
| | | | | | | | | | | | |
| | | |
| Real Estate — 1.4% | | | | | | | | | |
| ADLER Real Estate AG | | | | | | | | | |
2.50%, 7/19/21(5) | | | EUR | | | | 974 | | | $ | 193,731 | |
| Consus Real Estate AG | | | | | | | | | |
4.00%, 11/29/22(5) | | | EUR | | | | 300 | | | | 332,221 | |
| Nexity S.A. | | | | | | | | | |
0.125%, 1/1/23(5) | | | EUR | | | | 235 | | | | 200,385 | |
| | | | | | | | | | | $ | 726,337 | |
| | | |
| Real Estate Investment Trusts (REITs) — 1.1% | | | | | | | | | |
| Extra Space Storage L.P. | | | | | | | | | |
3.125%, 10/1/35(6) | | | | | | | 85 | | | $ | 94,810 | |
| IH Merger Sub, LLC | | | | | | | | | |
3.50%, 1/15/22 | | | | | | | 45 | | | | 50,387 | |
| PennyMac Corp. | | | | | | | | | |
5.375%, 5/1/20 | | | | | | | 125 | | | | 125,469 | |
| Resource Capital Corp. | | | | | | | | | |
6.00%, 12/1/18 | | | | | | | 50 | | | | 50,844 | |
| Spirit Realty Capital, Inc. | | | | | | | | | |
2.875%, 5/15/19 | | | | | | | 100 | | | | 99,682 | |
| VEREIT, Inc. | | | | | | | | | |
3.00%, 8/1/18 | | | | | | | 125 | | | | 125,156 | |
| | | | | | | | | | | $ | 546,348 | |
| | | |
| Semiconductors — 0.3% | | | | | | | | | |
| Rambus, Inc. | | | | | | | | | |
1.375%, 2/1/23(6) | | | | | | | 65 | | | $ | 64,262 | |
| Synaptics, Inc. | | | | | | | | | |
0.50%, 6/15/22(6) | | | | | | | 85 | | | | 80,378 | |
| | | | | | | | | | | $ | 144,640 | |
| | | |
| Software — 0.6% | | | | | | | | | |
| Akamai Technologies, Inc. | | | | | | | | | |
0.00%, 2/15/19 | | | | | | | 95 | | | $ | 97,610 | |
| CSG Systems International, Inc. | | | | | | | | | |
4.25%, 3/15/36 | | | | | | | 90 | | | | 99,363 | |
| Envestnet, Inc. | | | | | | | | | |
1.75%, 12/15/19 | | | | | | | 70 | | | | 77,053 | |
| Workday, Inc. | | | | | | | | | |
0.25%, 10/1/22(6) | | | | | | | 45 | | | | 49,054 | |
| | | | | | | | | | | $ | 323,080 | |
| | | | |
| | 10 | | See Notes to Financial Statements. |
Eaton Vance
Oaktree Diversified Credit NextShares
March 31, 2018
Portfolio of Investments (Unaudited) — continued
| | | | | | | | | | | | |
| Security | | | | | Principal Amount* (000’s omitted) | | | Value | |
| | | | | | | | | | | | |
| | | |
| Telecommunications — 0.1% | | | | | | | | | |
| Viavi Solutions, Inc. | | | | | | | | | |
0.625%, 8/15/33 | | | | | | | 65 | | | $ | 66,731 | |
| | | | | | | | | | | $ | 66,731 | |
| | | |
| Transportation — 0.5% | | | | | | | | | |
| Golar LNG, Ltd. | | | | | | | | | |
2.75%, 2/15/22 | | | | | | | 188 | | | $ | 192,563 | |
| Ship Finance International, Ltd. | | | | | | | | | |
5.75%, 10/15/21 | | | | | | | 50 | | | | 50,680 | |
| | | | | | | | | | | $ | 243,243 | |
| | | |
Total Convertible Bonds
(identified cost $7,555,341) | | | | | | | | | | $ | 7,557,385 | |
|
| Asset-Backed Securities — 12.0% | |
| Security | | | | | Principal Amount
(000’s omitted) | | | Value | |
| CIFC Funding Ltd. | | | | | | | | | |
Series 2013-2A, Class B3LR, 9.614%, (3 mo. USD LIBOR + 7.88%),
10/18/30(6)(8) | | | | | | $ | 750 | | | $ | 718,128 | |
| Dryden Senior Loan Fund | | | | | | | | | |
Series 2016-43A, Class E, 8.995%, (3 mo. USD LIBOR + 7.25%),
7/20/29(6)(8) | | | | | | | 700 | | | | 708,078 | |
| MidOcean Credit CLO | | | | | | | | | |
Series 2017-7A, Class F, 9.822%, (3 mo. USD LIBOR + 8.10%), 7/15/29(6)(8) | | | | | | | 750 | | | | 753,234 | |
| Nassau, Ltd. | | | | | | | | | |
Series 2017-IIA, Class D, 4.306%, (3 mo. USD LIBOR + 2.68%), 1/15/30(6)(8) | | | | | | | 550 | | | | 539,711 | |
| Octagon Investment Partners XIV, Ltd. | | | | | | | | | |
Series 2012-1A, Class ER, 10.072%, (3 mo. USD LIBOR + 8.35%),
7/15/29(6)(8) | | | | | | | 750 | | | | 740,116 | |
| OZLM, Ltd. | | | | | | | | | |
Series 2017-17A, Class D, 7.735%, (3 mo. USD LIBOR + 5.99%),
7/20/30(6)(8) | | | | | | | 250 | | | | 253,169 | |
| Pretium Mortgage Credit Partners I, LLC | | | | | | | | | |
Series 2018-NPL1, Class A2,
5.00%, 1/27/33(6) | | | | | | | 600 | | | | 597,475 | |
| Regatta X Funding, Ltd. | | | | | | | | | |
Series 2017-3A, Class D, 4.435%, (3 mo. USD LIBOR + 2.75%), 1/17/31(6)(8) | | | | | | | 250 | | | | 251,706 | |
| TICP CLO I, Ltd. | | | | | | | | | |
Series 2015-1A, Class DR, 4.25%, (3 mo. USD LIBOR + 2.50%), 7/20/27(6)(8) | | | | | | | 500 | | | | 501,121 | |
| | | | | | | | | | | | |
| Security | | | | | Principal Amount
(000’s omitted) | | | Value | |
| | | | | | | | | | | | |
| Tralee CLO IV, Ltd. | | | | | | | | | |
Series 2017-4A, Class E, 8.039%,
(3 mo. USD LIBOR + 6.10%),
1/20/30(6)(8) | | | | | | $ | 1,000 | | | $ | 987,768 | |
| |
Total Asset-Backed Securities
(identified cost $6,050,262) | | | $ | 6,050,506 | |
|
| Commercial Mortgage-Backed Securities — 10.7% | |
| Security | | | | | Principal Amount
(000’s omitted) | | | Value | |
| Barclays Commercial Mortgage Securities Trust | | | | | | | | | |
Series 2017-GLKS, Class F, 5.477%, (1 mo. USD LIBOR + 3.70%), 11/15/34(6)(8) | | | | | | $ | 500 | | | $ | 501,483 | |
| CFCRE Commercial Mortgage Trust | | | | | | | | | |
Series 2018-TAN, Class E,
6.446%, 2/15/33(6) | | | | | | | 1,000 | | | | 978,373 | |
| CGGS Commercial Mortgage Trust | | | | | | | | | |
Series 2018-WSS, Class E, 4.90%,
(1 mo. USD LIBOR + 3.15%)
, 2/15/37(6)(8) | | | | | | | 300 | | | | 301,788 | |
| Citigroup Commercial Mortgage Trust | | | | | | | | | |
Series 2018-TBR, Class F, 5.427%,
(1 mo. USD LIBOR + 3.65%),
12/15/36(6)(8) | | | | | | | 400 | | | | 402,643 | |
| Cosmopolitan Hotel Trust | | | | | | | | | |
Series 2017-CSMO, Class F, 5.518%, (1 mo. USD LIBOR + 3.74%), 11/15/36(6)(8) | | | | | | | 1,000 | | | | 1,002,119 | |
| Hilton USA Trust: | | | | | | | | | |
Series 2016-HHV, Class F, 4.194%, 11/5/38(6)(9) | | | | | | | 500 | | | | 437,127 | |
Series 2016-SFP, Class F,
6.155%, 11/5/35(6) | | | | | | | 500 | | | | 502,039 | |
| InTown Hotel Portfolio Trust | | | | | | | | | |
Series 2018-STAY, Class E, 4.877%, (1 mo. USD LIBOR + 3.10%), 1/15/33(6)(8) | | | | | | | 500 | | | | 499,877 | |
JP Morgan Chase Commercial Mortgage
Securities Trust | | | | | | | | | |
Series 2018-BCON, Class F, 3.756%, 1/5/31(6)(9) | | | | | | | 250 | | | | 238,747 | |
| UBS Commercial Mortgage Trust | | | | | | | | | |
Series 2018-NYCH, Class F, 5.598%, (1 mo. USD LIBOR + 3.82%), 2/15/32(6)(8) | | | | | | | 500 | | | | 498,568 | |
| |
Total Commercial Mortgage-Backed Securities
(identified cost $5,353,180) | | | $ | 5,362,764 | |
| | | | |
| | 11 | | See Notes to Financial Statements. |
Eaton Vance
Oaktree Diversified Credit NextShares
March 31, 2018
Portfolio of Investments (Unaudited) — continued
| | | | | | | | | | | | |
| Short-Term Investments — 12.5% | |
| Description | | | | | Units | | | Value | |
| | | | | | | | | | | | |
Eaton Vance Cash Reserves Fund, LLC, 1.89%(10) | | | | | | | 6,274,578 | | | $ | 6,273,323 | |
| |
Total Short-Term Investments
(identified cost $6,274,359) | | | $ | 6,273,323 | |
| |
Total Investments — 109.4%
(identified cost $54,962,067) | | | $ | 55,038,637 | |
| |
Less Unfunded Loan Commitments — (0.7)% | | | $ | (343,413 | ) |
| |
Net Investments — 108.7%
(identified cost $54,618,654) | | | $ | 54,695,224 | |
| |
Other Assets, Less Liabilities — (8.7)% | | | $ | (4,371,331 | ) |
| |
Net Assets — 100.0% | | | $ | 50,323,893 | |
The percentage shown for each investment category in the Portfolio of Investments is based on net assets.
| | * | In U.S. dollars unless otherwise indicated. |
| | (1) | Senior floating-rate loans (Senior Loans) often require prepayments from excess cash flows or permit the borrowers to repay at their election. The degree to which borrowers repay, whether as a contractual requirement or at their election, cannot be predicted with accuracy. As a result, the actual remaining maturity may be substantially less than the stated maturities shown. However, Senior Loans will typically have an expected average life of approximately two to four years. Senior Loans typically have rates of interest which are redetermined periodically by reference to a base lending |
| | rate, plus a spread. These base lending rates are primarily the London Interbank Offered Rate (“LIBOR”) and secondarily, the prime rate offered by one or more major United States banks (the “Prime Rate”). Base lending rates may be subject to a floor, or minimum rate. |
| | (2) | This Senior Loan will settle after March 31, 2018, at which time the interest rate will be determined. |
| | (3) | Unfunded or partially unfunded loan commitments. The stated interest rate reflects the weighted average of the reference rate and spread for the funded portion and the commitment fees on the portion of the loan that is unfunded. See Note 1G for description. |
| | (4) | When-issued security. |
| | (5) | Security exempt from registration under Regulation S of the Securities Act of 1933, which exempts from registration securities offered and sold outside the United States. Security may not be offered or sold in the United States except pursuant to an exemption from, or in a transaction not subject to, the registration requirements of the Securities Act of 1933. At March 31, 2018, the aggregate value of these securities is $4,611,152 or 9.2% of the Fund’s net assets. |
| | (6) | Security exempt from registration pursuant to Rule 144A under the Securities Act of 1933, as amended. These securities may be sold in certain transactions in reliance on an exemption from registration (normally to qualified institutional buyers). At March 31, 2018, the aggregate value of these securities is $18,690,216 or 37.1% of the Fund’s net assets. |
| | (7) | Represents a payment-in-kind security which may pay interest in additional principal at the issuer’s discretion. |
| | (8) | Variable rate security. The stated interest rate represents the rate in effect at March 31, 2018. |
| (9) | Weighted average fixed-rate coupon that changes/updates monthly. Rate shown is the rate at March 31, 2018. |
| (10) | Affiliated investment company, available to Eaton Vance portfolios and funds, which invests in high quality, U.S. dollar denominated money market instruments. The rate shown is the annualized seven-day yield as of March 31, 2018. |
| | | | | | | | | | | | | | | | | | | | | | | | |
| Forward Foreign Currency Exchange Contracts | |
| | | | | |
| Currency Purchased | | | Currency Sold | | | Counterparty | | Settlement
Date | | | Unrealized
Appreciation | | | Unrealized
(Depreciation) | |
| EUR | | | 106,376 | | | USD | | | 131,442 | | | State Street Bank and Trust Company | | | 4/18/18 | | | $ | — | | | $ | (423 | ) |
| EUR | | | 44,000 | | | USD | | | 54,880 | | | State Street Bank and Trust Company | | | 4/18/18 | | | | — | | | | (686 | ) |
| EUR | | | 36,000 | | | USD | | | 45,191 | | | State Street Bank and Trust Company | | | 4/18/18 | | | | — | | | | (851 | ) |
| EUR | | | 214,177 | | | USD | | | 265,688 | | | State Street Bank and Trust Company | | | 4/18/18 | | | | — | | | | (1,894 | ) |
| EUR | | | 761,173 | | | USD | | | 942,952 | | | State Street Bank and Trust Company | | | 4/18/18 | | | | — | | | | (5,440 | ) |
| GBP | | | 154,612 | | | USD | | | 216,918 | | | State Street Bank and Trust Company | | | 4/18/18 | | | | 130 | | | | — | |
| HKD | | | 43,000 | | | USD | | | 5,507 | | | State Street Bank and Trust Company | | | 4/18/18 | | | | — | | | | (25 | ) |
| JPY | | | 3,100,000 | | | USD | | | 28,552 | | | State Street Bank and Trust Company | | | 4/18/18 | | | | 607 | | | | — | |
| JPY | | | 7,500,000 | | | USD | | | 70,217 | | | State Street Bank and Trust Company | | | 4/18/18 | | | | 330 | | | | — | |
| JPY | | | 4,200,000 | | | USD | | | 39,714 | | | State Street Bank and Trust Company | | | 4/18/18 | | | | — | | | | (208 | ) |
| JPY | | | 30,100,000 | | | USD | | | 285,007 | | | State Street Bank and Trust Company | | | 4/18/18 | | | | — | | | | (1,880 | ) |
| JPY | | | 41,600,000 | | | USD | | | 396,232 | | | State Street Bank and Trust Company | | | 4/18/18 | | | | — | | | | (4,933 | ) |
| USD | | | 252,895 | | | EUR | | | 201,701 | | | State Street Bank and Trust Company | | | 4/18/18 | | | | 4,467 | | | | — | |
| USD | | | 252,724 | | | EUR | | | 201,881 | | | State Street Bank and Trust Company | | | 4/18/18 | | | | 4,073 | | | | — | |
| USD | | | 218,108 | | | EUR | | | 175,000 | | | State Street Bank and Trust Company | | | 4/18/18 | | | | 2,566 | | | | — | |
| | | | |
| | 12 | | See Notes to Financial Statements. |
Eaton Vance
Oaktree Diversified Credit NextShares
March 31, 2018
Portfolio of Investments (Unaudited) — continued
| | | | | | | | | | | | | | | | | | | | | | | | |
| Forward Foreign Currency Exchange Contracts (continued) | |
| | | | | |
Currency
Purchased | | | Currency Sold | | | Counterparty | | Settlement
Date | | | Unrealized
Appreciation | | | Unrealized
(Depreciation) | |
| USD | | | 223,881 | | | EUR | | | 180,000 | | | State Street Bank and Trust Company | | | 4/18/18 | | | $ | 2,182 | | | $ | — | |
| USD | | | 250,041 | | | EUR | | | 201,564 | | | State Street Bank and Trust Company | | | 4/18/18 | | | | 1,782 | | | | — | |
| USD | | | 140,550 | | | EUR | | | 113,000 | | | State Street Bank and Trust Company | | | 4/18/18 | | | | 1,371 | | | | — | |
| USD | | | 198,908 | | | EUR | | | 160,564 | | | State Street Bank and Trust Company | | | 4/18/18 | | | | 1,148 | | | | — | |
| USD | | | 251,576 | | | EUR | | | 203,550 | | | State Street Bank and Trust Company | | | 4/18/18 | | | | 870 | | | | — | |
| USD | | | 1,189,738 | | | EUR | | | 966,300 | | | State Street Bank and Trust Company | | | 4/18/18 | | | | — | | | | (422 | ) |
| USD | | | 738,639 | | | EUR | | | 601,269 | | | State Street Bank and Trust Company | | | 4/18/18 | | | | — | | | | (1,924 | ) |
| USD | | | 2,714,092 | | | EUR | | | 2,209,334 | | | State Street Bank and Trust Company | | | 4/18/18 | | | | — | | | | (7,072 | ) |
| USD | | | 216,339 | | | GBP | | | 153,961 | | | State Street Bank and Trust Company | | | 4/18/18 | | | | 204 | | | | — | |
| USD | | | 361,955 | | | GBP | | | 260,000 | | | State Street Bank and Trust Company | | | 4/18/18 | | | | — | | | | (3,041 | ) |
| USD | | | 491,720 | | | GBP | | | 356,627 | | | State Street Bank and Trust Company | | | 4/18/18 | | | | — | | | | (8,924 | ) |
| USD | | | 275,828 | | | HKD | | | 2,153,000 | | | State Street Bank and Trust Company | | | 4/18/18 | | | | 1,353 | | | | — | |
| USD | | | 58,056 | | | JPY | | | 6,300,000 | | | State Street Bank and Trust Company | | | 4/18/18 | | | | — | | | | (1,203 | ) |
| USD | | | 399,794 | | | JPY | | | 43,600,000 | | | State Street Bank and Trust Company | | | 4/18/18 | | | | — | | | | (10,317 | ) |
| USD | | | 1,021,946 | | | JPY | | | 112,600,000 | | | State Street Bank and Trust Company | | | 4/18/18 | | | | — | | | | (37,195 | ) |
| | | | | | | |
| | | | | | | | | | | | | | | | | | | $ | 21,083 | | | $ | (86,438 | ) |
Abbreviations:
| | | | |
| EURIBOR | | – | | Euro Interbank Offered Rate |
| LIBOR | | – | | London Interbank Offered Rate |
| PIK | | – | | Payment In Kind |
Currency Abbreviations:
| | | | |
| EUR | | – | | Euro |
| GBP | | – | | British Pound Sterling |
| HKD | | – | | Hong Kong Dollar |
| JPY | | – | | Japanese Yen |
| USD | | – | | United States Dollar |
| | | | |
| | 13 | | See Notes to Financial Statements. |
Eaton Vance
Oaktree Diversified Credit NextShares
March 31, 2018
Statement of Assets and Liabilities (Unaudited)
| | | | |
| Assets | | March 31, 2018 | |
Unaffiliated investments, at value (identified cost, $48,344,295) | | $ | 48,421,901 | |
Affiliated investment, at value (identified cost, $6,274,359) | | | 6,273,323 | |
Cash | | | 73,864 | |
Foreign currency, at value (identified cost, $376,929) | | | 376,656 | |
Interest receivable | | | 382,180 | |
Dividends receivable from affiliated investment | | | 7,560 | |
Receivable for investments sold | | | 2,045,627 | |
Receivable for open forward foreign currency exchange contracts | | | 21,083 | |
Receivable from affiliate | | | 40,584 | |
Total assets | | $ | 57,642,778 | |
|
| Liabilities | |
Payable for investments purchased | | $ | 6,888,159 | |
Payable for when-issued securities | | | 246,090 | |
Payable for open forward foreign currency exchange contracts | | | 86,438 | |
Payable to affiliates: | | | | |
Investment adviser fee | | | 34,307 | |
Operations agreement fee | | | 2,144 | |
Accrued expenses | | | 61,747 | |
Total liabilities | | $ | 7,318,885 | |
Net Assets | | $ | 50,323,893 | |
|
| Sources of Net Assets | |
Paid-in capital | | $ | 50,482,878 | |
Accumulated undistributed net investment income | | | 72,980 | |
Accumulated net realized loss | | | (240,309 | ) |
Net unrealized appreciation | | | 8,344 | |
Total | | $ | 50,323,893 | |
| |
| Net Asset Value Per Share(1) | | | | |
($50,323,893 ÷ 5,025,000 shares issued and outstanding) | | $ | 10.01 | |
| (1) | Reflects a 2-for-1 stock split effective March 9, 2018 (see Note 8). |
| | | | |
| | 14 | | See Notes to Financial Statements. |
Eaton Vance
Oaktree Diversified Credit NextShares
March 31, 2018
Statement of Operations (Unaudited)
| | | | |
| Investment Income | | Period Ended
March 31, 2018(1) | |
Interest (net of foreign taxes, $221) | | $ | 611,506 | |
Dividends from affiliated investment | | | 58,493 | |
Total investment income | | $ | 669,999 | |
| |
| Expenses | | | | |
Investment adviser fee | | $ | 149,431 | |
Operations agreement fee | | | 9,339 | |
Trustees’ fees and expenses | | | 1,310 | |
Custodian fee | | | 29,832 | |
Transfer and dividend disbursing agent fees | | | 5,048 | |
Legal and accounting services | | | 60,386 | |
Printing and postage | | | 3,276 | |
Registration fees | | | 2,448 | |
Listing fee | | | 11,150 | |
Intraday pricing fee | | | 1,476 | |
Miscellaneous | | | 2,122 | |
Total expenses | | $ | 275,818 | |
Deduct — | | | | |
Allocation of expenses to affiliate | | $ | 105,704 | |
Total expense reductions | | $ | 105,704 | |
| |
Net expenses | | $ | 170,114 | |
| |
Net investment income | | $ | 499,885 | |
| |
| Realized and Unrealized Gain (Loss) | | | | |
Net realized gain (loss) — | | | | |
Investment transactions | | $ | (6,725 | ) |
Investment transactions — affiliated investment | | | (431 | ) |
Foreign currency transactions | | | (70,684 | ) |
Forward foreign currency exchange contracts | | | (162,469 | ) |
Net realized loss | | $ | (240,309 | ) |
Change in unrealized appreciation (depreciation) — | | | | |
Investments | | $ | 77,606 | |
Investments — affiliated investment | | | (1,036 | ) |
Foreign currency | | | (2,871 | ) |
Forward foreign currency exchange contracts | | | (65,355 | ) |
Net change in unrealized appreciation (depreciation) | | $ | 8,344 | |
| |
Net realized and unrealized loss | | $ | (231,965 | ) |
| |
Net increase in net assets from operations | | $ | 267,920 | |
| (1) | For the period from the start of business, November 15, 2017, to March 31, 2018. |
| | | | |
| | 15 | | See Notes to Financial Statements. |
Eaton Vance
Oaktree Diversified Credit NextShares
March 31, 2018
Statement of Changes in Net Assets
| | | | |
| Increase (Decrease) in Net Assets | | Period Ended March 31, 2018(1) (Unaudited) | |
From operations — | | | | |
Net investment income | | $ | 499,885 | |
Net realized loss | | | (240,309 | ) |
Net change in unrealized appreciation (depreciation) | | | 8,344 | |
Net increase in net assets from operations | | $ | 267,920 | |
Distributions to shareholders — | | | | |
From net investment income | | $ | (426,905 | ) |
Total distributions to shareholders | | $ | (426,905 | ) |
Transactions in Fund shares — | | | | |
Proceeds from sale of shares | | $ | 50,505,372 | |
Cost of shares redeemed | | | (250,897 | ) |
Transaction fees | | | 228,403 | |
Net increase in net assets from Fund share transactions | | $ | 50,482,878 | |
| |
Net increase in net assets | | $ | 50,323,893 | |
| |
| Net Assets | | | | |
At beginning of period | | $ | — | |
At end of period | | $ | 50,323,893 | |
| |
Accumulated undistributed net investment income
included in net assets | | | | |
At end of period | | $ | 72,980 | |
| |
| Changes in shares outstanding(2) | | | | |
Shares outstanding, beginning of period | | | — | |
Shares sold | | | 5,050,000 | |
Shares redeemed | | | (25,000 | ) |
Shares outstanding, end of period | | | 5,025,000 | |
| (1) | For the period from the start of business, November 15, 2017, to March 31, 2018. |
| (2) | Reflects a 2-for-1 stock split effective March 9, 2018 (see Note 8). |
| | | | |
| | 16 | | See Notes to Financial Statements. |
Eaton Vance
Oaktree Diversified Credit NextShares
March 31, 2018
Financial Highlights
| | | | |
| | | Period Ended March 31, 2018(1)(2) (Unaudited) | |
Net asset value — Beginning of period | | $ | 10.000 | |
| |
| Income (Loss) From Operations | | | | |
Net investment income(3) | | $ | 0.100 | |
Net realized and unrealized loss | | | (0.051 | ) |
| |
Total income from operations | | $ | 0.049 | |
| |
| Less Distributions | | | | |
From net investment income | | $ | (0.085 | ) |
| |
Total distributions | | $ | (0.085 | ) |
| |
Transaction fees | | $ | 0.046 | |
| |
Net asset value — End of period | | $ | 10.010 | |
| |
Total Return on Net Asset Value(4) | | | 0.95 | %(5)(6) |
| |
| Ratios/Supplemental Data | | | | |
Net assets, end of period (000’s omitted) | | $ | 50,324 | |
Ratios (as a percentage of average daily net assets): | | | | |
Expenses | | | 0.90 | %(6)(7) |
Net investment income | | | 2.66 | %(7) |
Portfolio Turnover | | | 81 | %(5) |
| (1) | For the period from the start of business, November 15, 2017, to March 31, 2018. |
| (2) | Per share data reflects a 2-for-1 stock split effective March 9, 2018 (see Note 8). |
| (3) | Computed using average shares outstanding. |
| (4) | Returns are historical and are calculated by determining the percentage change in net asset value with all distributions reinvested and do not reflect the effect of a market-determined premium or discount. Investment returns assume that all distributions have been reinvested at net asset value. |
| (6) | The investment adviser reimbursed certain operating expenses (equal to 0.56% of average daily net assets for the period ended March 31, 2018). Absent this reimbursement, total return would be lower. |
| | | | |
| | 17 | | See Notes to Financial Statements. |
Eaton Vance
Oaktree Diversified Credit NextShares
March 31, 2018
Notes to Financial Statements (Unaudited)
1 Significant Accounting Policies
Eaton Vance Oaktree Diversified Credit NextShares (the Fund) is a diversified series of Eaton Vance NextShares Trust II (the Trust), a Massachusetts business trust registered under the Investment Company Act of 1940, as amended (the 1940 Act). The Fund is an exchange-traded managed fund operating pursuant to an order issued by the SEC granting an exemption from certain provisions of the 1940 Act. Individual shares of the Fund may be purchased and sold only on a national securities exchange or alternative trading system through a broker-dealer that offers NextShares, and may not be directly purchased or redeemed from the Fund. Market trading prices for the Fund are directly linked to the Fund’s next-computed net asset value per share (NAV) and will vary from NAV by a market-determined premium or discount, which may be zero. The Fund’s investment objective is total return. The Fund commenced operations on November 15, 2017.
The following is a summary of significant accounting policies of the Fund. The policies are in conformity with accounting principles generally accepted in the United States of America (U.S. GAAP). The Fund is an investment company and follows accounting and reporting guidance in the Financial Accounting Standards Board (FASB) Accounting Standards Codification Topic 946.
A Investment Valuation — The following methodologies are used to determine the market value or fair value of investments.
Senior Floating-Rate Loans. Interests in senior floating-rate loans (Senior Loans) for which reliable market quotations are readily available are valued generally at the average mean of bid and ask quotations obtained from a third party pricing service. Other Senior Loans are valued at fair value by the investment adviser under procedures approved by the Trustees. In fair valuing a Senior Loan, the investment adviser utilizes one or more of the valuation techniques described in (i) through (iii) below to assess the likelihood that the borrower will make a full repayment of the loan underlying such Senior Loan relative to yields on other Senior Loans issued by companies of comparable credit quality. If the investment adviser believes that there is a reasonable likelihood of full repayment, the investment adviser will determine fair value using a matrix pricing approach that considers the yield on the Senior Loan. If the investment adviser believes there is not a reasonable likelihood of full repayment, the investment adviser will determine fair value using analyses that include, but are not limited to: (i) a comparison of the value of the borrower’s outstanding equity and debt to that of comparable public companies; (ii) a discounted cash flow analysis; or (iii) when the investment adviser believes it is likely that a borrower will be liquidated or sold, an analysis of the terms of such liquidation or sale. In certain cases, the investment adviser will use a combination of analytical methods to determine fair value, such as when only a portion of a borrower’s assets are likely to be sold. In conducting its assessment and analyses for purposes of determining fair value of a Senior Loan, the investment adviser will use its discretion and judgment in considering and appraising relevant factors. Fair value determinations are made by the portfolio managers of the Fund based on information available to such managers. The portfolio managers of other funds managed by the investment adviser that invest in Senior Loans may not possess the same information about a Senior Loan borrower as the portfolio managers of the Fund. At times, the fair value of a Senior Loan determined by the portfolio managers of other funds managed by the investment adviser that invest in Senior Loans may vary from the fair value of the same Senior Loan determined by the portfolio managers of the Fund. The fair value of each Senior Loan is periodically reviewed and approved by the investment adviser’s Valuation Committee and by the Trustees based upon procedures approved by the Trustees. Junior Loans (i.e., subordinated loans and second lien loans) are valued in the same manner as Senior Loans.
Debt Obligations. Debt obligations are generally valued on the basis of valuations provided by third party pricing services, as derived from such services’ pricing models. Inputs to the models may include, but are not limited to, reported trades, executable bid and asked prices, broker/dealer quotations, prices or yields of securities with similar characteristics, interest rates, anticipated prepayments, benchmark curves or information pertaining to the issuer, as well as industry and economic events. The pricing services may use a matrix approach, which considers information regarding securities with similar characteristics to determine the valuation for a security. Short-term obligations purchased with a remaining maturity of sixty days or less for which a valuation from a third party pricing service is not readily available may be valued at amortized cost, which approximates fair value.
Derivatives. Forward foreign currency exchange contracts are generally valued at the mean of the average bid and average asked prices that are reported by currency dealers to a third party pricing service at the valuation time. Such third party pricing service valuations are supplied for specific settlement periods and the Fund’s forward foreign currency exchange contracts are valued at an interpolated rate between the closest preceding and subsequent settlement period reported by the third party pricing service.
Foreign Securities and Currencies. Foreign securities and currencies are valued in U.S. dollars, based on foreign currency exchange rate quotations supplied by a third party pricing service. The pricing service uses a proprietary model to determine the exchange rate. Inputs to the model include reported trades and implied bid/ask spreads.
Affiliated Fund. The Fund may invest in Eaton Vance Cash Reserves Fund, LLC (Cash Reserves Fund), an affiliated investment company managed by Eaton Vance Management (EVM). While Cash Reserves Fund is not a registered money market mutual fund, it conducts all of its investment activities in accordance with the requirements of Rule 2a-7 under the 1940 Act. Investments in Cash Reserves Fund are valued at the closing net asset value per unit on the valuation day. Cash Reserves Fund generally values its investment securities based on available market quotations provided by a third party pricing service.
Fair Valuation. Investments for which valuations or market quotations are not readily available or are deemed unreliable are valued at fair value using methods determined in good faith by or at the direction of the Trustees of the Fund in a manner that fairly reflects the security’s value, or the amount that the Fund might reasonably expect to receive for the security upon its current sale in the ordinary course. Each such determination is based on a consideration of relevant factors, which are likely to vary from one pricing context to another. These factors may include, but are not limited to, the type of security, the existence of any contractual restrictions on the security’s disposition, the price and extent of public trading in similar securities of the issuer or of comparable companies or entities, quotations or relevant information obtained from broker/dealers or other market participants, information obtained
Eaton Vance
Oaktree Diversified Credit NextShares
March 31, 2018
Notes to Financial Statements (Unaudited) — continued
from the issuer, analysts, and/or the appropriate stock exchange (for exchange-traded securities), an analysis of the company’s or entity’s financial condition, and an evaluation of the forces that influence the issuer and the market(s) in which the security is purchased and sold.
B Investment Transactions — Investment transactions for financial statement purposes are accounted for on a trade date basis. Realized gains and losses on investments sold are determined on the basis of identified cost.
C Income — Interest income is recorded on the basis of interest accrued, adjusted for amortization of premium or accretion of discount. Fees associated with loan amendments are recognized immediately. Dividend income is recorded on the ex-dividend date for dividends received in cash and/or securities. Withholding taxes on foreign interest have been provided for in accordance with the Fund’s understanding of the applicable countries’ tax rules and rates.
D Federal Taxes — The Fund’s policy is to comply with the provisions of the Internal Revenue Code applicable to regulated investment companies and to distribute to shareholders each year substantially all of its net investment income, and all or substantially all of its net realized capital gains. Accordingly, no provision for federal income or excise tax is necessary.
As of March 31, 2018, the Fund had no uncertain tax positions that would require financial statement recognition, de-recognition, or disclosure. The Fund files a U.S. federal income tax return annually after its fiscal year-end, which is subject to examination by the Internal Revenue Service for a period of three years from the date of filing.
E Expenses — The majority of expenses of the Trust are directly identifiable to an individual fund. Expenses which are not readily identifiable to a specific fund are allocated taking into consideration, among other things, the nature and type of expense and the relative size of the funds.
F Foreign Currency Translation — Investment valuations, other assets, and liabilities initially expressed in foreign currencies are translated each business day into U.S. dollars based upon current exchange rates. Purchases and sales of foreign investment securities and income and expenses denominated in foreign currencies are translated into U.S. dollars based upon currency exchange rates in effect on the respective dates of such transactions. Recognized gains or losses on investment transactions attributable to changes in foreign currency exchange rates are recorded for financial statement purposes as net realized gains and losses on investments. That portion of unrealized gains and losses on investments that results from fluctuations in foreign currency exchange rates is not separately disclosed.
G Unfunded Loan Commitments — The Fund may enter into certain loan agreements all or a portion of which may be unfunded. The Fund is obligated to fund these commitments at the borrower’s discretion. These commitments are disclosed in the accompanying Portfolio of Investments. At March 31, 2018, the Fund had sufficient cash and/or securities to cover these commitments.
H Use of Estimates — The preparation of the financial statements in conformity with U.S. GAAP requires management to make estimates and assumptions that affect the reported amounts of assets and liabilities at the date of the financial statements and the reported amounts of income and expense during the reporting period. Actual results could differ from those estimates.
I Indemnifications — Under the Trust’s organizational documents, its officers and Trustees may be indemnified against certain liabilities and expenses arising out of the performance of their duties to the Fund. Under Massachusetts law, if certain conditions prevail, shareholders of a Massachusetts business trust (such as the Trust) could be deemed to have personal liability for the obligations of the Trust. However, the Trust’s Declaration of Trust contains an express disclaimer of liability on the part of Fund shareholders and the By-laws provide that the Trust shall assume the defense on behalf of any Fund shareholders. Moreover, the By-laws also provide for indemnification out of Fund property of any shareholder held personally liable solely by reason of being or having been a shareholder for all loss or expense arising from such liability. Additionally, in the normal course of business, the Fund enters into agreements with service providers that may contain indemnification clauses. The Fund’s maximum exposure under these arrangements is unknown as this would involve future claims that may be made against the Fund that have not yet occurred.
J Forward Foreign Currency Exchange Contracts — The Fund may enter into forward foreign currency exchange contracts for the purchase or sale of a specific foreign currency at a fixed price on a future date. The forward foreign currency exchange contracts are adjusted by the daily exchange rate of the underlying currency and any gains or losses are recorded as unrealized until such time as the contracts have been closed. Risks may arise upon entering these contracts from the potential inability of counterparties to meet the terms of their contracts and from movements in the value of a foreign currency relative to the U.S. dollar.
K When-Issued Securities and Delayed Delivery Transactions — The Fund may purchase or sell securities on a delayed delivery or when-issued basis. Payment and delivery may take place after the customary settlement period for that security. At the time the transaction is negotiated, the price of the security that will be delivered is fixed. The Fund maintains cash and/or security positions for these commitments such that sufficient liquid assets will be available to make payments upon settlement. Securities purchased on a delayed delivery or when-issued basis are marked-to-market daily and begin earning interest on settlement date. Losses may arise due to changes in the market value of the underlying securities or if the counterparty does not perform under the contract.
L Interim Financial Statements — The interim financial statements relating to March 31, 2018 and for the period then ended have not been audited by an independent registered public accounting firm, but in the opinion of the Fund’s management, reflect all adjustments, consisting only of normal recurring adjustments, necessary for the fair presentation of the financial statements.
Eaton Vance
Oaktree Diversified Credit NextShares
March 31, 2018
Notes to Financial Statements (Unaudited) — continued
2 Distributions to Shareholders and Income Tax Information
It is the present policy of the Fund to make monthly distributions of all or substantially all of its net investment income and to distribute annually all or substantially all of its net realized capital gains. Distributions are paid in cash and cannot be automatically reinvested in additional shares of the Fund. Distributions to shareholders are recorded on the ex-dividend date. Distributions to shareholders are determined in accordance with income tax regulations, which may differ from U.S. GAAP. As required by U.S. GAAP, only distributions in excess of tax basis earnings and profits are reported in the financial statements as a return of capital. Permanent differences between book and tax accounting relating to distributions are reclassified to paid-in capital. For tax purposes, distributions from short-term capital gains are considered to be from ordinary income.
The cost and unrealized appreciation (depreciation) of investments, including open derivative contracts, of the Fund at March 31, 2018, as determined on a federal income tax basis, were as follows:
| | | | |
| |
Aggregate cost | | $ | 54,637,302 | |
| |
Gross unrealized appreciation | | $ | 424,054 | |
Gross unrealized depreciation | | | (431,487 | ) |
| |
Net unrealized depreciation | | $ | (7,433 | ) |
3 Investment Adviser Fee and Other Transactions with Affiliates
The investment adviser fee is earned by EVM as compensation for investment advisory services rendered to the Fund. The fee is computed at an annual rate of 0.80% of the Fund’s average daily net assets up to $500 million and is payable monthly. On net asset of $500 million and over, the annual fee is reduced. For the period ended March 31, 2018, the investment adviser fee amounted to $149,431 or 0.80% (annualized) of the Fund’s average daily net assets. EVM also serves as the administrator of the Fund, but receives no compensation. Pursuant to an investment sub-advisory agreement, EVM has delegated the investment management of the Fund to Oaktree Capital Management, L.P. (Oaktree), a registered investment adviser. EVM pays Oaktree a portion of its investment adviser fee for sub-advisory services provided to the Fund.
The Trust, on behalf of the Fund, has entered into an operations agreement with EVM pursuant to which EVM provides the Fund with services required for it to operate as a NextShares exchange-traded managed fund in accordance with the exemptive order obtained by EVM and the Trust. Pursuant to the agreement, the Fund pays EVM a monthly fee at an annual rate of 0.05% of the Fund’s average daily net assets provided the average net assets of NextShares funds sponsored by EVM (“Covered Assets”) are less than $10 billion. The annual rate is reduced if Covered Assets are $10 billion and above. For the period ended March 31, 2018, the operations agreement fee amounted to $9,339 or 0.05% (annualized) of the Fund’s average daily net assets.
EVM has agreed to reimburse the Fund’s expenses to the extent that total annual operating expenses (relating to ordinary operating expenses only) exceed 0.90% of the Fund’s average daily net assets through December 31, 2018. Thereafter, the reimbursement may be changed or terminated at any time. Pursuant to this agreement, EVM was allocated $105,704 of the Fund’s operating expenses for the period ended March 31, 2018.
Trustees and officers of the Fund who are members of EVM’s organization receive remuneration for their services to the Fund out of the investment adviser fee. Trustees of the Fund who are not affiliated with EVM may elect to defer receipt of all or a percentage of their annual fees in accordance with the terms of the Trustees Deferred Compensation Plan. For the period ended March 31, 2018, no significant amounts have been deferred. Certain officers and Trustees of the Fund are officers of EVM.
4 Purchases and Sales of Investments
Purchases and sales of investments, other than short-term obligations, and including maturities, paydowns and principal repayments on Senior Loans, aggregated $86,507,136 and $38,240,723, respectively, for the period ended March 31, 2018.
5 Financial Instruments
The Fund may trade in financial instruments with off-balance sheet risk in the normal course of its investing activities. These financial instruments may include forward foreign currency exchange contracts and may involve, to a varying degree, elements of risk in excess of the amounts recognized for financial statement purposes. The notional or contractual amounts of these instruments represent the investment the Fund has in particular classes of financial instruments and do not necessarily represent the amounts potentially subject to risk. The measurement of the risks associated with these instruments is meaningful only when all related and offsetting transactions are considered. A summary of obligations under these financial instruments at March 31, 2018 is included in the Portfolio of Investments. At March 31, 2018, the Fund had sufficient cash and/or securities to cover commitments under these contracts.
Eaton Vance
Oaktree Diversified Credit NextShares
March 31, 2018
Notes to Financial Statements (Unaudited) — continued
The Fund is subject to foreign exchange risk in the normal course of pursuing its investment objective. Because the Fund holds foreign currency denominated investments, the value of these investments and related receivables and payables may change due to future changes in foreign currency exchange rates. To hedge against this risk, the Fund enters into forward foreign currency exchange contracts.
The fair value of open derivative instruments (not considered to be hedging instruments for accounting disclosure purposes) and whose primary underlying risk exposure is foreign exchange risk at March 31, 2018 was as follows:
| | | | | | | | |
| | | Fair Value | |
| Derivative | | Asset Derivative(1) | | | Liability Derivative(2) | |
| | |
Forward foreign currency exchange contracts | | $ | 21,083 | | | $ | (86,438 | ) |
| (1) | Statement of Assets and Liabilities location: Receivable for open forward foreign currency exchange contracts; Net unrealized appreciation. |
| (2) | Statement of Assets and Liabilities location: Payable for open forward foreign currency exchange contracts; Net unrealized appreciation. |
The effect of derivative instruments (not considered to be hedging instruments for accounting disclosure purposes) on the Statement of Operations and whose primary underlying risk exposure is foreign exchange risk for the period ended March 31, 2018 was as follows:
| | | | | | | | |
| Derivative | | Realized Gain (Loss)
on Derivatives Recognized
in Income(1) | | | Change in Unrealized
Appreciation (Depreciation) on
Derivatives Recognized in Income(2) | |
| | |
Forward foreign currency exchange contracts | | $ | (162,469 | ) | | $ | (65,355 | ) |
| (1) | Statement of Operations location: Net realized gain (loss) – Forward foreign currency exchange contracts. |
| (2) | Statement of Operations location: Change in unrealized appreciation (depreciation) – Forward foreign currency exchange contracts. |
The average notional amount of forward foreign currency exchange contracts (based on the absolute value of notional amounts of currency purchased and currency sold) outstanding during the period ended March 31, 2018, which is indicative of the volume of this derivative type, was approximately $7,965,000.
6 Capital Share Transactions
The Trust may issue an unlimited number of shares of capital stock (no par value per share) in one or more series (such as the Fund). The Fund issues and redeems shares only in blocks of 25,000 shares or multiples thereof (“Creation Units”). The Fund issues and redeems Creation Units in return for the securities, other instruments and/or cash (the “Basket”) that the Fund specifies each business day. Creation Units may be purchased or redeemed only by or through Authorized Participants, which are broker-dealers or institutional investors that have entered into agreements with the Fund’s distributor for this purpose. The Fund imposes a transaction fee on Creation Units issued and redeemed to offset the estimated cost to the Fund of processing the transaction, which is paid by the Authorized Participants directly to a third-party administrator. In addition, Authorized Participants pay the Fund a variable charge for converting the Basket to or from the desired portfolio composition. Such variable charges are reflected as Transaction fees on the Statement of Changes in Net Assets.
At March 31, 2018, Eaton Vance Corporation and Oaktree owned in the aggregate 99.5% of the outstanding shares of the Fund.
7 Fair Value Measurements
Under generally accepted accounting principles for fair value measurements, a three-tier hierarchy to prioritize the assumptions, referred to as inputs, is used in valuation techniques to measure fair value. The three-tier hierarchy of inputs is summarized in the three broad levels listed below.
| • | | Level 1 – quoted prices in active markets for identical investments |
| • | | Level 2 – other significant observable inputs (including quoted prices for similar investments, interest rates, prepayment speeds, credit risk, etc.) |
| • | | Level 3 – significant unobservable inputs (including a fund’s own assumptions in determining the fair value of investments) |
In cases where the inputs used to measure fair value fall in different levels of the fair value hierarchy, the level disclosed is determined based on the lowest level input that is significant to the fair value measurement in its entirety. The inputs or methodology used for valuing securities are not necessarily an indication of the risk associated with investing in those securities.
Eaton Vance
Oaktree Diversified Credit NextShares
March 31, 2018
Notes to Financial Statements (Unaudited) — continued
At March 31, 2018, the hierarchy of inputs used in valuing the Fund’s investments and open derivative instruments, which are carried at value, were as follows:
| | | | | | | | | | | | | | | | |
| Asset Description | | Level 1 | | | Level 2 | | | Level 3 | | | Total | |
| | | | |
Senior Floating-Rate Loans (Less Unfunded Loan Commitments) | | $ | — | | | $ | 18,007,979 | | | $ | — | | | $ | 18,007,979 | |
Corporate Bonds & Notes | | | — | | | | 11,443,267 | | | | — | | | | 11,443,267 | |
Convertible Bonds | | | — | | | | 7,557,385 | | | | — | | | | 7,557,385 | |
Asset-Backed Securities | | | — | | | | 6,050,506 | | | | — | | | | 6,050,506 | |
Commercial Mortgage-Backed Securities | | | — | | | | 5,362,764 | | | | — | | | | 5,362,764 | |
Short-Term Investments | | | — | | | | 6,273,323 | | | | — | | | | 6,273,323 | |
| | | | |
Total Investments | | $ | — | | | $ | 54,695,224 | | | $ | — | | | $ | 54,695,224 | |
| | | | |
Forward Foreign Currency Exchange Contracts | | $ | — | | | $ | 21,083 | | | $ | — | | | $ | 21,083 | |
| | | | |
Total | | $ | — | | | $ | 54,716,307 | | | $ | — | | | $ | 54,716,307 | |
| | | | |
Liability Description | | | | | | | | | | | | | | | | |
| | | | |
Forward Foreign Currency Exchange Contracts | | $ | — | | | $ | (86,438 | ) | | $ | — | | | $ | (86,438 | ) |
| | | | |
Total | | $ | — | | | $ | (86,438 | ) | | $ | — | | | $ | (86,438 | ) |
8 Stock Split
The Trustees of the Fund approved a 2-for-1 stock split, effective March 9, 2018. The stock split had no impact on the net assets of the Fund or the overall value of a shareholder’s investment in the Fund.
Eaton Vance
Oaktree Diversified Credit NextShares
March 31, 2018
Board of Trustees’ Contract Approval
Overview of the Contract Review Process
The Investment Company Act of 1940, as amended (the “1940 Act”), provides, in substance, that for a fund to enter into an investment advisory agreement with an investment adviser, the fund’s board of trustees, including a majority of the trustees who are not “interested persons” of the fund (“Independent Trustees”), must approve the agreement and its terms at an in-person meeting called for the purpose of considering such approval.
At a meeting of the Board of Trustees (each a “Board”) of the registered investment companies advised by either Eaton Vance Management or its affiliate, Boston Management and Research, (the “Eaton Vance Funds”) held on August 8 and 9, 2017 (the “Meeting”), the Board, including a majority of the Independent Trustees, voted to approve the investment advisory and administrative agreement of Eaton Vance Oaktree Diversified Credit NextShares (the “Fund”) with Eaton Vance Management (the “Adviser”) and the sub-advisory agreement with Oaktree Capital Management, L.P. (the “Sub-adviser”).
In voting to approve the sub-advisory agreement with the Sub-adviser, the Board relied upon the affirmative recommendation of the Contract Review Committee of the Board, which is a committee comprised exclusively of Independent Trustees, as well as the affirmative recommendation of the Adviser. Acting through a working group established by the Contract Review Committee specifically for the purpose of evaluating the sub-advisory agreement, the Contract Review Committee requested information from the Adviser and the Sub-adviser relevant to the Committee’s consideration of the sub-advisory agreement. Leading up to the Meeting, the Contract Review Committee and/or its working group held meetings (together with the Meeting, the “Meetings”) to review and evaluate information provided by the Adviser and the Sub-adviser relating to the sub-advisory agreement, including information regarding the due diligence conducted by the Adviser on the Sub-adviser. In addition, the Contract Review Committee, the working group and/or the Board met with representatives from each of the Adviser and the Sub-adviser to discuss the terms of the agreements and the plans of the Adviser and the Sub-adviser for managing the assets of the Fund upon its launch.
Prior to voting its approval of the investment advisory and administrative agreement and the sub-advisory agreement, the Board received information from the Adviser and the Sub-adviser that the Board considered reasonably necessary to evaluate the terms of each agreement. The Board considered information furnished by the Adviser and the Sub-adviser for the Meetings relating specifically to the Fund, as well as information furnished for prior meetings of the Board and its committees. The Board also considered information provided in connection with the annual contract review process for other Eaton Vance Funds.
The information that the Board considered included, among other things, the following:
Information about Fees and Expenses
| • | | The advisory and related fees payable by the Fund and the anticipated expense ratio of the Fund; |
| • | | Information comparing the advisory and related fees to be payable by the Fund with fees paid by comparable funds, as identified by an independent data provider (“comparable funds”); |
| • | | Information concerning the sub-advisory fees to be payable by the Adviser to the Sub-adviser; |
| • | | Information comparing the expected total expense ratio and its components to comparable funds; |
| • | | Pro forma profitability analyses for the Adviser with respect to the Fund; |
Information about Portfolio Management and Trading
| • | | Descriptions of the investment management services provided by the Adviser and the Sub-adviser, including the investment strategies and processes each employs; |
| • | | The procedures and processes used to determine the fair value of fund assets and actions taken to monitor and test the effectiveness of such procedures and processes; |
| • | | Information about policies and practices with respect to trading, including processes for monitoring best execution of portfolio transactions; |
| • | | Information about the allocation of brokerage transactions and the benefits received by the Sub-adviser as a result of brokerage allocation, including information with respect to “soft dollars”; |
Information about the Adviser and the Sub-adviser
| • | | Information regarding the financial condition, ownership structure and resources of the Adviser and the Sub-adviser; |
| • | | Descriptions of the qualifications, education and experience of the individual investment professionals whose responsibilities will include portfolio management and investment research for the Fund, and information relating to their compensation and responsibilities with respect to managing other mutual funds and investment accounts; |
| • | | The Codes of Ethics of the Adviser and its affiliates and the Sub-adviser, together with information relating to compliance with and the administration of such codes; |
| • | | Policies and procedures relating to proxy voting and the handling of corporate actions and class actions; |
| • | | Information concerning the resources devoted to compliance efforts undertaken by the Adviser and its affiliates and the Sub-adviser (including descriptions of various compliance programs) and their records of compliance; |
| • | | Information concerning the business continuity and disaster recovery plans of the Adviser and its affiliates and the Sub-adviser; |
Eaton Vance
Oaktree Diversified Credit NextShares
March 31, 2018
Board of Trustees’ Contract Approval — continued
Other Relevant Information
| • | | Information concerning the nature, cost and character of the administrative and other non-investment advisory services provided by the Adviser and its affiliates; |
| • | | Information concerning management of the relationship with the custodian, subcustodians and fund accountants by the Adviser and its affiliates; and |
| • | | The terms of the investment advisory and administrative agreement and the sub-advisory agreement. |
Results of the Process
Based on its consideration of the foregoing, and such other information as it deemed relevant, including the factors and conclusions described below, the Board concluded that the terms of the Fund’s investment advisory and administrative agreement with the Adviser and the sub-advisory agreement with the Sub-adviser, including their fee structures, are in the interests of shareholders. With respect to the sub-advisory agreement, in making this conclusion, the Board accepted the recommendation of the Contract Review Committee based on the material factors considered and conclusions reached by the Contract Review Committee. Accordingly, the Board, including a majority of the Independent Trustees, voted to approve the investment advisory and administrative agreement and sub-advisory agreement for the Fund. The conclusions reached with respect to each agreement were based on a comprehensive evaluation of all the information provided and not any single factor. Moreover, each member of the Board may have placed varying emphasis on particular factors in reaching conclusions with respect to each agreement.
Nature, Extent and Quality of Services
In considering whether to approve the investment advisory and administrative agreement and the sub-advisory agreement of the Fund, the Board evaluated the nature, extent and quality of services to be provided to the Fund by the Adviser and the Sub-adviser.
The Board considered the Adviser’s and the Sub-adviser’s management capabilities and investment process with respect to the types of investments to be held by the Fund, including the education, experience and number of its investment professionals and other personnel who will provide portfolio management, investment research, and similar services to the Fund. With respect to the Adviser, the Board considered the Adviser’s responsibilities overseeing the Sub-adviser and coordinating activities in implementing the Fund’s investment strategies. With respect to the Sub-adviser, the Board took into account the resources available to the Sub-adviser in fulfilling its duties under the sub-advisory agreement and the experience of the Sub-adviser’s investment professionals in analyzing factors relevant to investing in credit-related investments, including investment grade and below investment grade (high yield) corporate debt, senior loans, structured credit investments, emerging market debt, real estate debt and convertible securities. The Board also took into account the resources dedicated to portfolio management and other services, as well as the compensation methods of the Adviser and other factors, such as the reputation and resources of the Adviser to recruit and retain highly qualified research, advisory and supervisory investment professionals. In addition, the Board considered the time and attention expected to be devoted to the Eaton Vance Funds, including the Fund, by senior management, as well as the infrastructure, operational capabilities and support staff in place to assist in the portfolio management and operations of the Fund, including the provision of administrative services. The Board also considered the business-related and other risks to which the Adviser or its affiliates may be subject in managing the Fund.
The Board considered the special attributes of the Fund relative to a traditional mutual fund and the benefits that are expected to be realized from an investment in the Fund, rather than a traditional mutual fund. The Board also considered the resources devoted by the Adviser and its affiliates in developing and maintaining an infrastructure necessary to support the on-going operations of the Fund and other Eaton Vance NextShares funds.
The Board considered the compliance programs of the Adviser, the Sub-adviser and relevant affiliates thereof. Among other matters, the Board considered compliance and reporting matters relating to personal trading by investment professionals, selective disclosure of portfolio holdings, late trading, frequent trading, portfolio valuation, business continuity and the allocation of investment opportunities. The Board also considered the responses of the Adviser and its affiliates to requests in recent years from regulatory authorities such as the Securities and Exchange Commission and the Financial Industry Regulatory Authority.
The Board considered shareholder and other administrative services to be provided or managed by the Adviser and its affiliates, including transfer agency and accounting services. The Board evaluated the benefits to shareholders of investing in a fund that is a part of a large fund complex offering exposure to a variety of asset classes and investment disciplines.
After consideration of the foregoing factors, among others, the Board concluded that the nature, extent and quality of services to be provided by the Adviser and the Sub-adviser, taken as a whole, will be appropriate and consistent with the terms of the investment advisory and administrative agreement and the sub-advisory agreement.
Fund Performance
The Board considered information regarding the performance of the Sub-adviser in managing strategies similar to that to be employed by the Fund, as well as the Sub-adviser’s track record managing a global credit portfolio that allocates assets among different asset classes. The Board noted that, because the Fund had not yet commenced operations when the agreement was approved, the Fund had no performance record.
Eaton Vance
Oaktree Diversified Credit NextShares
March 31, 2018
Board of Trustees’ Contract Approval — continued
Management Fees and Expenses
The Board considered contractual fee rates to be payable by the Fund for advisory and administrative services (referred to collectively as “management fees”). As part of its review, the Board considered the Fund’s management fees and estimated total expense ratio for a one-year period, as compared to those of comparable funds, before and after giving effect to any undertaking to waive fees or reimburse expenses. The Board also received and considered information about the services offered and the fee rates charged by the Sub-adviser to other types of clients with investment strategies that are substantially similar to the Fund.
After considering the foregoing information, and in light of the nature, extent and quality of the services to be provided by the Adviser and the Sub-adviser, the Board concluded that the management fees proposed to be charged for advisory and related services are reasonable.
Profitability and Other “Fall-Out” Benefits
The Board considered the level of profits projected to be realized by the Adviser and relevant affiliates thereof in providing investment advisory and administrative services to the Fund. The Board considered the level of profits expected to be realized without regard to marketing support or other payments expected to be made by the Adviser and its affiliates to third parties in respect of distribution services. The Board also considered other direct or indirect fall-out benefits expected to be received by the Adviser and its affiliates in connection with their relationships with the Fund, including the benefits of research services that may be available to the Adviser as a result of securities transactions effected for the Fund and other investment advisory clients.
The Board concluded that, in light of the foregoing factors and the nature, extent and quality of the services to be rendered to the Fund, the profits expected to be realized by the Adviser and its affiliates with respect to the Fund are deemed not to be excessive. The Board also concluded that, in light of its role as a sub-adviser not affiliated with the Adviser, the Sub-adviser’s expected profitability in managing the Fund was not a material factor.
Economies of Scale
In reviewing management fees and profitability, the Board also considered the extent to which the Adviser and its affiliates, on the one hand, and the Fund, on the other hand, can expect to realize benefits from economies of scale as the assets of the Fund increase. The Board acknowledged the difficulty in accurately measuring the benefits resulting from economies of scale, if any, with respect to the management of any specific fund or group of funds. Based upon the foregoing, the Board concluded that, assuming reasonably foreseeable asset levels of the Fund, the structure of the advisory fee under the investment advisory and administrative agreement, which includes breakpoints at several asset levels, can be expected to allow the Fund to share in any benefits from economies of scale in the future.
Eaton Vance
Oaktree Diversified Credit NextShares
March 31, 2018
Officers and Trustees
Officers of Eaton Vance Oaktree Diversified Credit NextShares
Payson F. Swaffield
President
Maureen A. Gemma
Vice President, Secretary and
Chief Legal Officer
James F. Kirchner
Treasurer
Richard F. Froio
Chief Compliance Officer
Trustees of Eaton Vance Oaktree Diversified Credit NextShares
William H. Park
Chairperson
Thomas E. Faust Jr.*
Mark R. Fetting
Cynthia E. Frost
George J. Gorman
Valerie A. Mosley
Helen Frame Peters
Susan J. Sutherland
Harriett Tee Taggart
Scott E. Wennerholm
Eaton Vance Funds
IMPORTANT NOTICES
Privacy. The Eaton Vance organization is committed to ensuring your financial privacy. Each of the financial institutions identified below has in effect the following policy (“Privacy Policy”) with respect to nonpublic personal information about its customers:
| • | | Only such information received from you, through application forms or otherwise, and information about your Eaton Vance fund transactions will be collected. This may include information such as name, address, social security number, tax status, account balances and transactions. |
| • | | None of such information about you (or former customers) will be disclosed to anyone, except as permitted by law (which includes disclosure to employees necessary to service your account). In the normal course of servicing a customer’s account, Eaton Vance may share information with unaffiliated third parties that perform various required services such as transfer agents, custodians and broker-dealers. |
| • | | Policies and procedures (including physical, electronic and procedural safeguards) are in place that are designed to protect the confidentiality of such information. |
| • | | We reserve the right to change our Privacy Policy at any time upon proper notification to you. Customers may want to review our Privacy Policy periodically for changes by accessing the link on our homepage: www.eatonvance.com. |
Our pledge of privacy applies to the following entities within the Eaton Vance organization: the Eaton Vance Family of Funds, Eaton Vance Management, Eaton Vance Investment Counsel, Eaton Vance Distributors, Inc., Eaton Vance Trust Company, Eaton Vance Management (International) Limited, Eaton Vance Advisers International Ltd., Eaton Vance Management’s Real Estate Investment Group and Boston Management and Research. In addition, our Privacy Policy applies only to those Eaton Vance customers who are individuals and who have a direct relationship with us. If a customer’s account (i.e., fund shares) is held in the name of a third-party financial advisor/broker-dealer, it is likely that only such advisor’s privacy policies apply to the customer. This notice supersedes all previously issued privacy disclosures. For more information about Eaton Vance’s Privacy Policy, please call 1-800-262-1122.
Delivery of Shareholder Documents. The Securities and Exchange Commission (SEC) permits funds to deliver only one copy of shareholder documents, including prospectuses, proxy statements and shareholder reports, to fund investors with multiple accounts at the same residential or post office box address. This practice is often called “householding” and it helps eliminate duplicate mailings to shareholders. Your financial advisor may household the mailing of your documents indefinitely unless you instruct your financial advisor otherwise. If you would prefer that your Eaton Vance documents not be householded, please contact your financial advisor. Your instructions that householding not apply to delivery of your Eaton Vance documents will typically be effective within 30 days of receipt by your financial advisor.
Portfolio Holdings. Each Eaton Vance Fund and its underlying Portfolio(s) (if applicable) will file a schedule of portfolio holdings on Form N-Q with the SEC for the first and third quarters of each fiscal year. The Form N-Q will be available on the Eaton Vance website at www.eatonvance.com, by calling Eaton Vance at 1-800-262-1122 or in the EDGAR database on the SEC’s website at www.sec.gov. Form N-Q may also be reviewed and copied at the SEC’s public reference room in Washington, D.C. (call 1-800-732-0330 for information on the operation of the public reference room).
Proxy Voting. From time to time, funds are required to vote proxies related to the securities held by the funds. The Eaton Vance Funds or their underlying Portfolios (if applicable) vote proxies according to a set of policies and procedures approved by the Funds’ and Portfolios’ Boards. You may obtain a description of these policies and procedures and information on how the Funds or Portfolios voted proxies relating to portfolio securities during the most recent 12-month period ended June 30, without charge, upon request, by calling 1-800-262-1122 and by accessing the SEC’s website at www.sec.gov.
This Page Intentionally Left Blank
Investment Adviser and Administrator
Eaton Vance Management
Two International Place
Boston, MA 02110
Sub-Advisor
Oaktree Capital Management, L.P.
333 South Grand Ave.
Los Angeles, CA 90071
Distributor*
Foreside Fund Services, LLC
Three Canal Plaza, Suite 100
Portland, ME 04101
Custodian
State Street Bank and Trust Company
State Street Financial Center, One Lincoln Street
Boston, MA 02111
Transfer and Dividend Disbursing Agent
State Street Bank and Trust Company
State Street Financial Center, One Lincoln Street
Boston, MA 02111
Fund Offices
Two International Place
Boston, MA 02110
| * | FINRA BrokerCheck. Investors may check the background of their Investment Professional by contacting the Financial Industry Regulatory Authority (FINRA). FINRA BrokerCheck is a free tool to help investors check the professional background of current and former FINRA-registered securities firms and brokers. FINRA BrokerCheck is available by calling 1-800-289-9999 and at www.FINRA.org. The FINRA BrokerCheck brochure describing this program is available to investors at www.FINRA.org. |
28876 3.31.18
Item 2. Code of Ethics
Not required in this filing.
Item 3. Audit Committee Financial Expert
Not required in this filing.
Item 4. Principal Accountant Fees and Services
Rule 2-01(c)(1)(ii)(A) of Regulation S-X (the “Loan Rule”) prohibits an accounting firm, such as the Trust’s principal accountant, Deloitte & Touche LLP (“D&T”), from having certain financial relationships with their audit clients and affiliated entities. Specifically, the Loan Rule provides, in relevant part, that an accounting firm generally would not be independent if it or a “covered person” of the accounting firm (within the meaning of applicable SEC rules relating to auditor independence) receives a loan from a lender that is a “record or beneficial owner of more than ten percent of the audit client’s equity securities.” Based on information provided
to the Audit Committee of the Board of Trustees (the “Audit Committee”) of the Eaton Vance family of funds by D&T, certain relationships between D&T and its affiliates (“Deloitte Entities”) and one or more lenders who are record owners of shares of one or more funds within the Eaton Vance family of funds (the “Funds”) implicate the Loan Rule, calling into question D&T’s independence with respect to the Funds. The Funds are providing this disclosure to explain the facts and circumstances as well as D&T’s conclusions concerning D&T’s objectivity and impartiality with respect to the audits of the Funds notwithstanding the existence of one or more breaches of the Loan Rule.
On June 20, 2016, the U.S. Securities and Exchange Commission (the “SEC”) issued no-action relief to another mutual fund complex (see Fidelity Management & Research Company et al., No-Action Letter (June 20, 2016) (the “No-Action Letter”)) related to an auditor independence issue arising under the Loan Rule. In the No-Action Letter, the SEC indicated that it would not recommend enforcement action against the fund group if the auditor is not in compliance with the Loan Rule provided that: (1) the auditor has complied with PCAOB Rule 3526(b)(1) and 3526(b)(2); (2) the auditor’s non-compliance under the Loan Rule is with respect to certain lending relationships; and (3) notwithstanding such non-compliance, the auditor has concluded that it is objective and impartial with respect to the issues encompassed within its engagement as auditor of the funds. Although the relief contained in the No-Action Letter was scheduled to expire eighteen months from issuance, it was extended via a subsequent no-action letter issued on September 22, 2017 (see Fidelity Management & Research Company et al., No-Action Letter (Sept. 22, 2017)).
Based on information provided by D&T to the Audit Committee, the requirements of the No-Action Letter appear to be met with respect to D&T’s lending relationships described above. Among other things, D&T has advised the Audit Committee of its conclusion that the consequences of the breach of the Loan Rule have been satisfactorily addressed, that D&T’s objectivity and impartiality in the planning and conduct of the audits of the Fund’s financial statements has not been compromised and that, notwithstanding the breach, D&T is in a position to continue as the auditor for the Funds and D&T does not believe any actions need to be taken with respect to previously issued reports by D&T. D&T has advised the Audit Committee that these conclusions were based in part on its consideration of the No-Action Letter and other relevant information communicated to the Audit Committee.
Item 5. Audit Committee of Listed Registrants
Not applicable.
Item 6. Schedule of Investments
Please see schedule of investments contained in the Report to Stockholders included under Item 1 of this Form N-CSR.
Item 7. Disclosure of Proxy Voting Policies and Procedures for Closed-End Management Investment Companies
Not applicable.
Item 8. Portfolio Managers of Closed-End Management Investment Companies
Not applicable.
Item 9. Purchases of Equity Securities by Closed-End Management Investment Company and Affiliated Purchasers
Not applicable.
Item 10. Submission of Matters to a Vote of Security Holders
No material changes.
Item 11. Controls and Procedures
(a) It is the conclusion of the registrant’s principal executive officer and principal financial officer that the effectiveness of the registrant’s current disclosure controls and procedures (such disclosure controls and procedures having been evaluated within 90 days of the date of this filing) provide reasonable assurance that the information required to be disclosed by the registrant has been recorded, processed, summarized and reported within the time period specified in the Commission’s rules and forms and that the information required to be disclosed by the registrant has been accumulated and communicated to the registrant’s principal executive officer and principal financial officer in order to allow timely decisions regarding required disclosure.
(b) There have been no changes in the registrant’s internal controls over financial reporting during the second fiscal quarter of the period covered by this report that has materially affected, or is reasonably likely to materially affect, the registrant’s internal control over financial reporting.
Item 12. Disclosure of Securities Lending Activities for Closed-End Management Investment Companies
Not applicable.
Item 13. Exhibits
| | |
| (a)(1) | | Registrant’s Code of Ethics – Not applicable (please see Item 2). |
| |
| (a)(2)(i) | | Treasurer’s Section 302 certification. |
| |
| (a)(2)(ii) | | President’s Section 302 certification. |
| |
| (b) | | Combined Section 906 certification. |
Signatures
Pursuant to the requirements of the Securities Exchange Act of 1934 and the Investment Company Act of 1940, the registrant has duly caused this report to be signed on its behalf by the undersigned, thereunto duly authorized.
Eaton Vance NextShares Trust II
| | |
| By: | | /s/ Payson F. Swaffield |
| | Payson F. Swaffield |
| | President |
Date: May 24, 2018
Pursuant to the requirements of the Securities Exchange Act of 1934 and the Investment Company Act of 1940, this report has been signed below by the following persons on behalf of the registrant and in the capacities and on the dates indicated.
| | |
| By: | | /s/ James F. Kirchner |
| | James F. Kirchner |
| | Treasurer |
Date: May 24, 2018
| | |
| By: | | /s/ Payson F. Swaffield |
| | Payson F. Swaffield |
| | President |
Date: May 24, 2018