UNITED STATES
SECURITIES AND EXCHANGE COMMISSION
Washington, D.C. 20549
Form N-CSR
CERTIFIED SHAREHOLDER REPORT OF REGISTERED
MANAGEMENT INVESTMENT COMPANIES
Investment Company Act File Number: 811-22983
Eaton Vance NextShares Trust II
(Exact Name of Registrant as Specified in Charter)
Two International Place, Boston, Massachusetts 02110
(Address of Principal Executive Offices)
Maureen A. Gemma
Two International Place, Boston, Massachusetts 02110
(Name and Address of Agent for Services)
(617) 482-8260
(Registrant’s Telephone Number)
January 31
Date of Fiscal Year End
July 31, 2018
Date of Reporting Period
Item 1. Reports to Stockholders

Eaton Vance
TABS 5-to-15 Year Laddered Municipal Bond NextShares (EVLMC)
Listing Exchange: The NASDAQ Stock Market LLC
Semiannual Report
July 31, 2018
NextShares® is a registered trademark of NextShares Solutions LLC. All rights reserved.
Commodity Futures Trading Commission Registration. Effective December 31, 2012, the Commodity Futures Trading Commission (“CFTC”) adopted certain regulatory changes that subject registered investment companies and advisers to regulation by the CFTC if a fund invests more than a prescribed level of its assets in certain CFTC-regulated instruments (including futures, certain options and swap agreements) or markets itself as providing investment exposure to such instruments. The Fund has claimed an exclusion from the definition of the term “commodity pool operator” under the Commodity Exchange Act. Accordingly, neither the Fund nor the adviser with respect to the operation of the Fund is subject to CFTC regulation. Because of its management of other strategies, the Fund’s adviser is registered with the CFTC as a commodity pool operator and a commodity trading advisor.
Fund shares are not insured by the FDIC and are not deposits or other obligations of, or guaranteed by, any depository institution. Shares are subject to investment risks, including possible loss of principal invested.
This report must be preceded or accompanied by a current summary prospectus or prospectus. Before investing in NextShares, investors should consider carefully the investment objectives, risks, charges and expenses. This and other important information is contained in the prospectus and summary prospectus, which can be obtained from a financial advisor. Prospective investors should read the prospectus carefully before investing. For further information, please call 1-800-262-1122.
Semiannual Report July 31, 2018
Eaton Vance
TABS 5-to-15 Year Laddered Municipal Bond NextShares
Table of Contents
| | | | |
Performance | | | 2 | |
| |
Fund Profile | | | 2 | |
| |
Endnotes and Additional Disclosures | | | 3 | |
| |
Fund Expenses | | | 4 | |
| |
Financial Statements | | | 5 | |
| |
Board of Trustees’ Contract Approval | | | 31 | |
| |
Officers and Trustees | | | 34 | |
| |
Important Notices | | | 35 | |
Eaton Vance
TABS 5-to-15 Year Laddered Municipal Bond NextShares
July 31, 2018
Performance1,2,3
Portfolio Managers James H. Evans, CFA, Brian C. Barney, CFA and Christopher J. Harshman, CFA
| | | | | | | | | | | | | | | | | | | | | | | | | | | | |
| % Average Annual Total Returns | | Fund
Inception Date | | | Performance
Inception Date | | | Six Months | | | One Year | | | Five Years | | | Since
Portfolio
Investor
Inception | | | Since
Fund
Inception | |
Fund at NAV | | | 03/30/2016 | | | | 02/01/2010 | | | | 0.88 | % | | | 0.33 | % | | | 5.61 | % | | | 6.18 | % | | | 1.68 | % |
Fund at Market Price | | | 03/30/2016 | | | | 03/30/2016 | | | | 0.88 | | | | 0.33 | | | | — | | | | — | | | | 1.68 | |
Bloomberg Barclays 10 Year Municipal Bond Index | | | — | | | | — | | | | 1.20 | % | | | 0.31 | % | | | 3.72 | % | | | 4.25 | % | | | 1.52 | % |
Bloomberg Barclays 15 Year Municipal Bond Index | | | — | | | | — | | | | 1.45 | | | | 1.57 | | | | 4.79 | | | | 4.84 | | | | 2.09 | |
| | | | | | | |
| | | | | | | | | | | | | | | | | | | | | | | | | | | | |
| % Total Annual Operating Expense Ratios4 | | | | | | | | | | | | | | | | | | | |
Gross | | | | | | | | | | | | | | | | | | | | | | | | | | | 1.09 | % |
Net | | | | | | | | | | | | | | | | | | | | | | | | | | | 0.35 | |
| | | | | | | |
| | | | | | | | | | | | | | | | | | | | | | | | | | | | |
| % Distribution Rates/Yields5 | | | | | | | | | | | | | | | | | | | | | |
Distribution Rate at NAV | | | | | | | | | | | | | | | | | | | | | | | | | | | 2.11 | % |
SEC 30-day Yield – Subsidized | | | | | | | | | | | | | | | | | | | | | | | | | | | 2.09 | |
SEC 30-day Yield – Unsubsidized | | | | | | | | | | | | | | | | | | | | | | | | | | | 0.58 | |
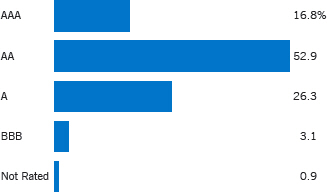
Fund Profile6
Credit Quality (% of total investments)7
See Endnotes and Additional Disclosures in this report.
Past performance is no guarantee of future results. Investment return and principal value will fluctuate so that shares, when sold, may be worth more or less than their original cost. Performance is for the stated time period only; due to market volatility, the Fund’s current performance may be lower or higher than indicated. The Fund’s performance at market price will differ from its results at net asset value (NAV). The market price used to calculate the Market Price return is the midpoint between the highest bid and the lowest offer on the exchange on which the shares of the Fund are listed for trading, as of the time that the Fund’s NAV is calculated. If you trade your shares at another time during the day, your return may differ. Returns are historical and are calculated by determining the percentage change in NAV or market price (as applicable) with all distributions reinvested at NAV or closing market price (as applicable) on the payment date of the distribution, and are net of management fees and other expenses. Returns are before taxes unless otherwise noted. Performance less than or equal to one year is cumulative. For performance as of the most recent month-end, including historical trading premiums/discounts relative to NAV, please refer to eatonvance.com.
Eaton Vance
TABS 5-to-15 Year Laddered Municipal Bond NextShares
July 31, 2018
Endnotes and Additional Disclosures
| 1 | Shares of NextShares funds are normally bought and sold in the secondary market through a broker, and may not be individually purchased or redeemed from the fund. In the secondary market, buyers and sellers transact with each other, rather than with the fund. Market trading prices of NextShares are linked to the fund’s next-computed net asset value (NAV) and will vary from NAV by a market-determined premium or discount, which may be zero. Buyers and sellers of NextShares will not know the value of their purchases and sales until after the fund’s NAV is determined at the end of the trading day. Market trading prices may vary significantly from anticipated levels. NextShares do not offer investors the opportunity to buy and sell intraday based on current (versus end-of-day) determinations of fund value. NextShares trade execution prices will fluctuate based on changes in NAV. Although limit orders may be used to control trading costs, they cannot be used to control or limit trade execution prices. As a new type of fund, NextShares have a limited operating history and may initially be available through a limited number of brokers. There can be no guarantee that an active trading market for NextShares will develop or be maintained, or that their listing will continue unchanged. Buying and selling NextShares may require payment of brokerage commissions and expose transacting shareholders to other trading costs. Frequent trading may detract from realized investment returns. The return on a shareholder’s NextShares investment will be reduced if the shareholder sells shares at a greater discount or narrower premium to NAV than he or she acquired the shares. NextShares funds issue and redeem shares only in specified creation unit quantities in transactions by or through authorized participants. In such transactions, a fund issues and redeems shares in exchange for the basket of securities, other instruments and/or cash that the fund specifies each business day. A fund’s basket is not intended to be representative of the fund’s current portfolio positions and may vary significantly from current positions. |
| 2 | Bloomberg Barclays 10 Year Municipal Bond Index is an unmanaged index of municipal bonds traded in the U.S. with maturities ranging from 8-12 years. Bloomberg Barclays 15 Year Municipal Bond Index is an unmanaged index of municipal bonds traded in the U.S. with maturities ranging from
12-17 years. Unless otherwise stated, index returns do not reflect the effect of any applicable sales charges, commissions, expenses, taxes or leverage, as applicable. It is not possible to invest directly in an index. |
| 3 | The Fund pursues its investment objective by investing in a separate investment fund (the Portfolio). The returns at NAV for periods before the date the Fund commenced operations are for a mutual fund that invests in the Portfolio (the Portfolio Investor). The performance during such period does not represent the performance of the Fund. The prior investment performance of the Portfolio Investor (rather than the Portfolio itself) is shown because it reflects the expenses typically borne by a retail fund investing in the Portfolio. The Portfolio Investor returns are not adjusted to reflect differences between the total net operating expenses of the Fund and the Portfolio Investor during the periods shown. If such an adjustment were made, the performance presented would be higher, because the Fund’s total net operating expenses are lower than those of the Portfolio Investor. Performance is for a share class of the Portfolio Investor offered at net asset value. Performance presented in the Financial Highlights included in the financial statements is not linked. |
| | Prior to April 15, 2015, the Portfolio Investor had a different name and investment objective and employed a different investment strategy from the Portfolio Investor’s current investment strategy. Performance prior to April 15, 2015 reflects the Portfolio Investor’s performance under its former investment objective and policies. |
| 4 | Source: Fund prospectus. Net expense ratio reflects a contractual expense reimbursement that continues through 5/31/19. Without the reimbursement, performance would have been lower. The expense ratios for the current reporting period can be found in the Financial Highlights section of this report. |
| 5 | The Distribution Rate is based on the Fund’s last regular distribution per share in the period (annualized) divided by the Fund’s NAV or market price at the end of the period. The Fund’s distributions may be comprised of amounts characterized for federal income tax purposes as tax-exempt income, qualified and non-qualified ordinary dividends, capital gains and nondividend distributions, also known as return of capital. The Fund will determine the federal income tax character of distributions paid to a shareholder after the end of the calendar year. This is reported on the IRS form 1099-DIV and provided to the shareholder shortly after each year-end. The Fund’s distributions are determined by the investment adviser based on its current assessment of the Fund’s long-term return potential. As portfolio and market conditions change, the rate of distributions paid by the Fund could change. The SEC Yield is a standardized measure based on the estimated yield to maturity of a fund’s investments over a 30-day period and is based on the maximum offer price at the date specified. The SEC Yield is not based on the distributions made by the Fund, which may differ. Subsidized yield reflects the effect of fee waivers and expense reimbursements. |
| 6 | Fund primarily invests in an affiliated investment company (Portfolio) with the same objective(s) and policies as the Fund and may also invest directly. Unless otherwise noted, references to investments are to the aggregate holdings of the Fund and the Portfolio. |
| 7 | Ratings are based on Moody’s Investors Service, Inc. (“Moody’s”), S&P Global Ratings (“S&P”) or Fitch Ratings (“Fitch”), as applicable. If securities are rated differently by the ratings agencies, the highest rating is applied. Ratings, which are subject to change, apply to the creditworthiness of the issuers of the underlying securities and not to the Fund or its shares. Credit ratings measure the quality of a bond based on the issuer’s creditworthiness, with ratings ranging from AAA, being the highest, to D, being the lowest based on S&P’s measures. Ratings of BBB or higher by S&P or Fitch (Baa or higher by Moody’s) are considered to be investment-grade quality. Credit ratings are based largely on the ratings agency’s analysis at the time of rating. The rating assigned to any particular security is not necessarily a reflection of the issuer’s current financial condition and does not necessarily reflect its assessment of the volatility of a security’s market value or of the liquidity of an investment in the security. Holdings designated as “Not Rated” (if any) are not rated by the national ratings agencies stated above. |
| | Fund profile subject to change due to active management. |
Eaton Vance
TABS 5-to-15 Year Laddered Municipal Bond NextShares
July 31, 2018
Fund Expenses
Example: As a Fund shareholder, you incur two types of costs: (1) transaction costs, including brokerage commissions on purchases and sales of Fund shares; and (2) ongoing costs, including management fees and other Fund expenses. This Example is intended to help you understand your ongoing costs (in dollars) of Fund investing and to compare these costs with the ongoing costs of investing in other funds. The Example is based on an investment of $1,000 invested at the beginning of the period and held for the entire period (February 1, 2018 – July 31, 2018).
Actual Expenses: The first section of the table below provides information about actual account values and actual expenses. You may use the information in this section, together with the amount you invested, to estimate the expenses that you paid over the period. Simply divide your account value by $1,000 (for example, an $8,600 account value divided by $1,000 = 8.6), then multiply the result by the number in the first section under the heading entitled “Expenses Paid During Period” to estimate the expenses you paid on your account during this period.
Hypothetical Example for Comparison Purposes: The second section of the table below provides information about hypothetical account values and hypothetical expenses based on the actual Fund expense ratio and an assumed rate of return of 5% per year (before expenses), which is not the actual Fund return. The hypothetical account values and expenses may not be used to estimate the actual ending account balance or expenses you paid for the period. You may use this information to compare the ongoing costs of investing in your Fund and other funds. To do so, compare this 5% hypothetical example with the 5% hypothetical examples that appear in the shareholder reports of the other funds.
Please note that the expenses shown in the table are meant to highlight your ongoing costs only and do not reflect any transactional costs, such as brokerage commissions on purchases and sales of Fund shares. Therefore, the second section of the table is useful in comparing ongoing costs only, and will not help you determine the relative total costs of owning different funds. In addition, if these transactional costs were included, your costs would be higher.
| | | | | | | | | | | | | | | | |
| | | Beginning
Account Value
(2/1/18) | | | Ending
Account Value
(7/31/18) | | | Expenses Paid
During Period*
(2/1/18 – 7/31/18) | | | Annualized
Expense
Ratio | |
| | | | |
Actual | | | | | | | | | | | | | | | | |
| | $ | 1,000.00 | | | $ | 1,008.80 | | | $ | 1.74 | ** | | | 0.35 | % |
| | | | | |
Hypothetical | | | | | | | | | | | | | | | | |
(5% return per year before expenses) | | | | | | | | | | | | | | | | |
| | $ | 1,000.00 | | | $ | 1,023.10 | | | $ | 1.76 | ** | | | 0.35 | % |
| * | Expenses are equal to the Fund’s annualized expense ratio, multiplied by the average account value over the period, multiplied by 181/365 (to reflect the one-half year period). The Example assumes that the $1,000 was invested at the net asset value per share determined at the close of business on January 31, 2018. The Example reflects the expenses of both the Fund and the Portfolio. |
| ** | Absent an allocation of certain expenses to an affiliate, expenses would be higher. |
Eaton Vance
TABS 5-to-15 Year Laddered Municipal Bond NextShares
July 31, 2018
Statement of Assets and Liabilities (Unaudited)
| | | | |
| Assets | | July 31, 2018 | |
Investment in 5-to-15 Year Laddered Municipal Bond Portfolio, at value (identified cost, $6,932,783) | | $ | 7,046,692 | |
Receivable from affiliate | | | 8,557 | |
Total assets | | $ | 7,055,249 | |
|
| Liabilities | |
Payable to affiliate: | | | | |
Operations agreement fee | | $ | 296 | |
Accrued expenses | | | 80,817 | |
Total liabilities | | $ | 81,113 | |
Net Assets | | $ | 6,974,136 | |
|
| Sources of Net Assets | |
Paid-in capital | | $ | 7,101,000 | |
Accumulated undistributed net investment income | | | 12,862 | |
Accumulated net realized loss from Portfolio | | | (253,635 | ) |
Net unrealized appreciation from Portfolio | | | 113,909 | |
Total | | $ | 6,974,136 | |
| |
| Net Asset Value Per Share | | | | |
($6,974,136 ÷ 700,000 shares issued and outstanding) | | $ | 9.96 | |
| | | | |
| | 5 | | See Notes to Financial Statements. |
Eaton Vance
TABS 5-to-15 Year Laddered Municipal Bond NextShares
July 31, 2018
Statement of Operations (Unaudited)
| | | | |
| Investment Income | | Six Months Ended July 31, 2018 | |
Interest allocated from Portfolio | | $ | 86,835 | |
Expenses allocated from Portfolio | | | (12,167 | ) |
Total investment income from Portfolio | | $ | 74,668 | |
| |
| Expenses | | | | |
Operations agreement fee | | $ | 1,723 | |
Trustees’ fees and expenses | | | 250 | |
Custodian fee | | | 9,850 | |
Transfer and dividend disbursing agent fees | | | 6,808 | |
Legal and accounting services | | | 11,635 | |
Printing and postage | | | 4,934 | |
Listing fee | | | 3,550 | |
Intraday pricing fee | | | 6,000 | |
Miscellaneous | | | 5,492 | |
Total expenses | | $ | 50,242 | |
Deduct — | | | | |
Allocation of expenses to affiliate | | $ | 50,182 | |
Total expense reductions | | $ | 50,182 | |
| |
Net expenses | | $ | 60 | |
| |
Net investment income | | $ | 74,608 | |
|
| Realized and Unrealized Gain (Loss) from Portfolio | |
Net realized gain (loss) — | | | | |
Investment transactions | | $ | (41,476 | ) |
Net realized loss | | $ | (41,476 | ) |
Change in unrealized appreciation (depreciation) — | | | | |
Investments | | $ | 29,724 | |
Net change in unrealized appreciation (depreciation) | | $ | 29,724 | |
| |
Net realized and unrealized loss | | $ | (11,752 | ) |
| |
Net increase in net assets from operations | | $ | 62,856 | |
| | | | |
| | 6 | | See Notes to Financial Statements. |
Eaton Vance
TABS 5-to-15 Year Laddered Municipal Bond NextShares
July 31, 2018
Statements of Changes in Net Assets
| | | | | | | | |
| Increase (Decrease) in Net Assets | | Six Months Ended July 31, 2018
(Unaudited) | | | Year Ended
January 31, 2018 | |
From operations — | | | | | | | | |
Net investment income | | $ | 74,608 | | | $ | 320,674 | |
Net realized loss | | | (41,476 | ) | | | (31,533 | ) |
Net change in unrealized appreciation (depreciation) | | | 29,724 | | | | 619,608 | |
Net increase in net assets from operations | | $ | 62,856 | | | $ | 908,749 | |
Distributions to shareholders — | | | | | | | | |
From net investment income | | $ | (74,900 | ) | | $ | (313,820 | ) |
Total distributions to shareholders | | $ | (74,900 | ) | | $ | (313,820 | ) |
Transactions in Fund shares — | | | | | | | | |
Proceeds from sale of shares | | $ | — | | | $ | 1,472,279 | |
Cost of shares redeemed | | | — | | | | (17,145,569 | ) |
Transaction fees | | | — | | | | 35,374 | |
Net decrease in net assets from Fund share transactions | | $ | — | | | $ | (15,637,916 | ) |
Other capital — | | | | | | | | |
Portfolio transaction fee contributed to Portfolio | | $ | (156 | ) | | $ | (11,024 | ) |
Portfolio transaction fee allocated from Portfolio | | | 1,385 | | | | 11,325 | |
Net increase in net assets from other capital | | $ | 1,229 | | | $ | 301 | |
| | |
Net decrease in net assets | | $ | (10,815 | ) | | $ | (15,042,686 | ) |
|
| Net Assets | |
At beginning of period | | $ | 6,984,951 | | | $ | 22,027,637 | |
At end of period | | $ | 6,974,136 | | | $ | 6,984,951 | |
|
Accumulated undistributed net investment income
included in net assets | |
At end of period | | $ | 12,862 | | | $ | 13,154 | |
| | |
| Changes in shares outstanding(1) | | | | | | | | |
Shares outstanding, beginning of period | | | 700,000 | | | | 2,250,000 | |
Shares sold | | | — | | | | 150,000 | |
Shares redeemed | | | — | | | | (1,700,000 | ) |
Shares outstanding, end of period | | | 700,000 | | | | 700,000 | |
| (1) | Shares have been restated to reflect a 2-for-1 stock split effective March 9, 2018 (see Note 6). |
| | | | |
| | 7 | | See Notes to Financial Statements. |
Eaton Vance
TABS 5-to-15 Year Laddered Municipal Bond NextShares
July 31, 2018
Financial Highlights
| | | | | | | | | | | | |
| | | Six Months Ended
July 31, 2018
(Unaudited) | | | Year Ended
January 31, 2018(1) | | | Period Ended January 31, 2017(1)(2) | |
Net asset value — Beginning of period | | $ | 9.980 | | | $ | 9.790 | | | $ | 10.000 | |
| | | |
| Income (Loss) From Operations | | | | | | | | | | | | |
Net investment income(3) | | $ | 0.107 | | | $ | 0.229 | | | $ | 0.149 | |
Net realized and unrealized gain (loss) | | | (0.022 | ) | | | 0.175 | | | | (0.238 | ) |
| | | |
Total income (loss) from operations | | $ | 0.085 | | | $ | 0.404 | | | $ | (0.089 | ) |
| | | |
| Less Distributions | | | | | | | | | | | | |
From net investment income | | $ | (0.107 | ) | | $ | (0.214 | ) | | $ | (0.110 | ) |
| | | |
Total distributions | | $ | (0.107 | ) | | $ | (0.214 | ) | | $ | (0.110 | ) |
| | | |
Portfolio transaction fee, net(3) | | $ | 0.002 | | | $ | 0.000 | (4) | | $ | (0.011 | ) |
| | | |
Net asset value — End of period | | $ | 9.960 | | | $ | 9.980 | | | $ | 9.790 | |
| | | |
Total Return on Net Asset Value(5)(6) | | | 0.88 | %(7) | | | 4.13 | % | | | (1.03 | )%(7) |
| | | |
| Ratios/Supplemental Data | | | | | | | | | | | | |
Net Assets, end of period (000’s omitted) | | $ | 6,974 | | | $ | 6,985 | | | $ | 22,028 | |
Ratios (as a percentage of average daily net assets):(8) | | | | | | | | | | | | |
Expenses(6) | | | 0.35 | %(9) | | | 0.35 | % | | | 0.35 | %(9) |
Net investment income | | | 2.17 | %(9) | | | 2.28 | % | | | 1.77 | %(9) |
Portfolio Turnover of the Portfolio | | | 40 | %(7) | | | 35 | % | | | 30 | %(7)(10) |
| (1) | Per share data have been restated to reflect a 2-for-1 stock split effective March 9, 2018 (see Note 6). |
| (2) | For the period from the start of business, March 30, 2016, to January 31, 2017. |
| (3) | Computed using average shares outstanding. |
| (4) | Amount is less than $0.0005. |
| (5) | Returns are historical and are calculated by determining the percentage change in net asset value with all distributions reinvested and do not reflect the effect of a market-determined premium or discount. Investment returns assume that all distributions have been reinvested at net asset value. |
| (6) | The investment adviser and administrator of the Fund and the investment adviser of the Portfolio reimbursed certain operating expenses (equal to 1.47%, 0.74% and 1.10% of average daily net assets for the six months ended July 31, 2018, the year ended January 31, 2018 and the period ended January 31, 2017, respectively). Absent this reimbursement, total return would be lower. |
| (8) | Includes the Fund’s share of the Portfolio’s allocated expenses. |
| (10) | For the period from the Portfolio’s start of business, March 28, 2016, to January 31, 2017. |
| | | | |
| | 8 | | See Notes to Financial Statements. |
Eaton Vance
TABS 5-to-15 Year Laddered Municipal Bond NextShares
July 31, 2018
Notes to Financial Statements (Unaudited)
1 Significant Accounting Policies
Eaton Vance TABS 5-to-15 Year Laddered Municipal Bond NextShares (the Fund) is a diversified series of Eaton Vance NextShares Trust II (the Trust), a Massachusetts business trust registered under the Investment Company Act of 1940, as amended (the 1940 Act). The Fund is an exchange-traded managed fund operating pursuant to an order issued by the SEC granting an exemption from certain provisions of the 1940 Act. Individual shares of the Fund may be purchased and sold only on a national securities exchange or alternative trading system through a broker-dealer that offers NextShares, and may not be directly purchased or redeemed from the Fund. Market trading prices for the Fund are directly linked to the Fund’s next-computed net asset value per share (NAV) and will vary from NAV by a market-determined premium or discount, which may be zero. The Fund invests all of its investable assets in interests in 5-to-15 Year Laddered Municipal Bond Portfolio (the Portfolio), a Massachusetts business trust, having the same investment objective and policies as the Fund. The value of the Fund’s investment in the Portfolio reflects the Fund’s proportionate interest in the net assets of the Portfolio (1.1% at July 31, 2018). The performance of the Fund is directly affected by the performance of the Portfolio. The financial statements of the Portfolio, including the portfolio of investments, are included elsewhere in this report and should be read in conjunction with the Fund’s financial statements.
The following is a summary of significant accounting policies of the Fund. The policies are in conformity with accounting principles generally accepted in the United States of America (U.S. GAAP). The Fund is an investment company and follows accounting and reporting guidance in the Financial Accounting Standards Board (FASB) Accounting Standards Codification Topic 946.
A Investment Valuation — Valuation of securities by the Portfolio is discussed in Note 1A of the Portfolio’s Notes to Financial Statements, which are included elsewhere in this report.
B Income — The Fund’s net investment income or loss consists of the Fund’s pro-rata share of the net investment income or loss of the Portfolio, less all actual and accrued expenses of the Fund.
C Federal Taxes — The Fund’s policy is to comply with the provisions of the Internal Revenue Code applicable to regulated investment companies and to distribute to shareholders each year substantially all of its taxable, if any, and tax-exempt net investment income, and all or substantially all of its net realized capital gains. Accordingly, no provision for federal income or excise tax is necessary. The Fund intends to satisfy conditions which will enable it to designate distributions from the interest income generated by the Portfolio’s investments in municipal obligations, which are exempt from regular federal income tax when received by the Portfolio, as exempt-interest dividends. The portion of such interest, if any, earned on private activity bonds issued after August 7, 1986, may be considered a tax preference item to shareholders.
As of July 31, 2018, the Fund had no uncertain tax positions that would require financial statement recognition, de-recognition, or disclosure. The Fund files a U.S. federal income tax return annually after its fiscal year-end, which is subject to examination by the Internal Revenue Service for a period of three years from the date of filing.
D Expenses — The majority of expenses of the Trust are directly identifiable to an individual fund. Expenses which are not readily identifiable to a specific fund are allocated taking into consideration, among other things, the nature and type of expense and the relative size of the funds.
E Use of Estimates — The preparation of the financial statements in conformity with U.S. GAAP requires management to make estimates and assumptions that affect the reported amounts of assets and liabilities at the date of the financial statements and the reported amounts of income and expense during the reporting period. Actual results could differ from those estimates.
F Indemnifications — Under the Trust’s organizational documents, its officers and Trustees may be indemnified against certain liabilities and expenses arising out of the performance of their duties to the Fund. Under Massachusetts law, if certain conditions prevail, shareholders of a Massachusetts business trust (such as the Trust) could be deemed to have personal liability for the obligations of the Trust. However, the Trust’s Declaration of Trust contains an express disclaimer of liability on the part of Fund shareholders and the By-laws provide that the Trust shall assume the defense on behalf of any Fund shareholders. Moreover, the By-laws also provide for indemnification out of Fund property of any shareholder held personally liable solely by reason of being or having been a shareholder for all loss or expense arising from such liability. Additionally, in the normal course of business, the Fund enters into agreements with service providers that may contain indemnification clauses. The Fund’s maximum exposure under these arrangements is unknown as this would involve future claims that may be made against the Fund that have not yet occurred.
G Other — Investment transactions are accounted for on a trade date basis.
H Interim Financial Statements — The interim financial statements relating to July 31, 2018 and for the six months then ended have not been audited by an independent registered public accounting firm, but in the opinion of the Fund’s management, reflect all adjustments, consisting only of normal recurring adjustments, necessary for the fair presentation of the financial statements.
2 Distributions to Shareholders and Income Tax Information
It is the present policy of the Fund to make monthly distributions of all or substantially all of its net investment income and to distribute annually all or substantially all of its net realized capital gains. Distributions are paid in cash and cannot be automatically reinvested in additional shares of the Fund. Distributions to shareholders are recorded on the ex-dividend date. Distributions to shareholders are determined in accordance with income tax regulations,
Eaton Vance
TABS 5-to-15 Year Laddered Municipal Bond NextShares
July 31, 2018
Notes to Financial Statements (Unaudited) — continued
which may differ from U.S. GAAP. As required by U.S. GAAP, only distributions in excess of tax basis earnings and profits are reported in the financial statements as a return of capital. Permanent differences between book and tax accounting relating to distributions are reclassified to paid-in capital. For tax purposes, distributions from short-term capital gains are considered to be from ordinary income.
At January 31, 2018, the Fund, for federal income tax purposes, had deferred capital losses of $297,991 which would reduce its taxable income arising from future net realized gains on investment transactions, if any, to the extent permitted by the Internal Revenue Code, and thus would reduce the amount of distributions to shareholders, which would otherwise be necessary to relieve the Fund of any liability for federal income or excise tax. The deferred capital losses are treated as arising on the first day of the Fund’s next taxable year and retain the same short-term or long-term character as when originally deferred. Of the deferred capital losses at January 31, 2018, $244,032 are short-term and $53,959 are long-term.
3 Investment Adviser Fee and Other Transactions with Affiliates
The investment adviser fee is earned by Eaton Vance Management (EVM) as compensation for investment advisory services rendered to the Fund. The fee is computed at an annual rate of 0.32% of the Fund’s average daily net assets that are not invested in other investment companies for which EVM or its affiliates serve as investment adviser and receive an advisory fee (“Direct Assets”) up to $1 billion and is payable monthly. On Direct Assets of $1 billion and over, the annual fee is reduced. For the six months ended July 31, 2018, the Fund incurred no investment adviser fee on Direct Assets. To the extent the Fund’s assets are invested in the Portfolio, the Fund is allocated its share of the Portfolio’s investment adviser fee. The Portfolio has engaged Boston Management and Research (BMR), a subsidiary of EVM, to render investment advisory services. See Note 2 of the Portfolio’s Notes to Financial Statements which are included elsewhere in this report. EVM also serves as the administrator of the Fund, but receives no compensation.
The Trust, on behalf of the Fund, has entered into an operations agreement with EVM pursuant to which EVM provides the Fund with services required for it to operate as a NextShares exchange-traded managed fund in accordance with the exemptive order obtained by EVM and the Trust. Pursuant to the agreement, the Fund pays EVM a monthly fee at an annual rate of 0.05% of the Fund’s average daily net assets provided the average net assets of NextShares funds sponsored by EVM (“Covered Assets”) are less than $10 billion. The annual rate is reduced if Covered Assets are $10 billion and above. For the six months ended July 31, 2018, the operations agreement fee amounted to $1,723 or 0.05% (annualized) of the Fund’s average daily net assets.
EVM has agreed to reimburse the Fund’s expenses to the extent that total annual operating expenses (relating to ordinary operating expenses only) exceed 0.35% of the Fund’s average daily net assets through May 31, 2019. Thereafter, the reimbursement may be changed or terminated at any time. Pursuant to this agreement, EVM was allocated $50,182 of the Fund’s operating expenses for the six months ended July 31, 2018.
Trustees and officers of the Fund who are members of EVM’s or BMR’s organizations receive remuneration for their services to the Fund out of the investment adviser fee. Certain officers and Trustees of the Fund and the Portfolio are officers of the above organizations.
4 Investment Transactions
For the six months ended July 31, 2018, increases and decreases in the Fund’s investment in the Portfolio aggregated $47,175 and $127,166, respectively. In addition, a Portfolio transaction fee is imposed by the Portfolio on the combined daily inflows or outflows of the Fund and the Portfolio’s other investors as more fully described at Note 1H of the Portfolio’s Notes to Financial Statements included herein. Such fee is allocated to the Fund based on its pro-rata interest in the Portfolio. The amount of the Portfolio transaction fee imposed on the Fund, if any, and the allocation of such fee are presented as Other capital on the Statements of Changes in Net Assets.
5 Capital Share Transactions
The Trust may issue an unlimited number of shares of capital stock (no par value per share) in one or more series (such as the Fund). The Fund issues and redeems shares only in blocks of 25,000 shares or multiples thereof (“Creation Units”). The Fund issues and redeems Creation Units in return for the securities, other instruments and/or cash (the “Basket”) that the Fund specifies each business day. Creation Units may be purchased or redeemed only by or through Authorized Participants, which are broker-dealers or institutional investors that have entered into agreements with the Fund’s distributor for this purpose. The Fund imposes a transaction fee on Creation Units issued and redeemed to offset the estimated cost to the Fund of processing the transaction, which is paid by the Authorized Participants directly to a third-party administrator. In addition, Authorized Participants pay the Fund a variable charge for converting the Basket to or from the desired portfolio composition. Such variable charges are reflected as Transaction fees on the Statements of Changes in Net Assets.
At July 31, 2018, EVM owned approximately 95.6% of the outstanding shares of the Fund.
6 Stock Split
The Trustees of the Fund approved a 2-for-1 stock split, effective March 9, 2018. The stock split had no impact on the net assets of the Fund or the overall value of a shareholder’s investment in the Fund.
5-to-15 Year Laddered Municipal Bond Portfolio
July 31, 2018
Portfolio of Investments (Unaudited)
| | | | | | | | |
| Tax-Exempt Investments — 97.5% | |
| Security | | Principal
Amount
(000’s omitted) | | | Value | |
|
| Bond Bank — 0.0%(1) | |
New York Environmental Facilities Corp., Revolving Fund Revenue, 5.00%, 6/15/29 | | $ | 50 | | | $ | 51,461 | |
| | | | $ | 51,461 | |
|
| Education — 6.4% | |
Alabama Public School and College Authority, 5.00%, 5/1/23 | | $ | 500 | | | $ | 567,595 | |
Alabama Public School and College Authority, 5.00%, 5/1/24 | | | 500 | | | | 577,810 | |
Brownsburg 1999 School Building Corp., IN, 5.00%, 2/5/24 | | | 235 | | | | 268,565 | |
Brownsburg 1999 School Building Corp., IN, 5.00%, 2/5/25 | | | 200 | | | | 231,552 | |
Brownsburg 1999 School Building Corp., IN, 5.00%, 2/5/26 | | | 565 | | | | 658,626 | |
Colorado Educational and Cultural Facilities Authority, (University of Denver),
4.00%, 3/1/30 | | | 150 | | | | 160,685 | |
Connecticut Health and Educational Facilities Authority, (Fairfield University),
5.00%, 7/1/23 | | | 700 | | | | 788,718 | |
Connecticut Health and Educational Facilities Authority, (Fairfield University),
5.00%, 7/1/24 | | | 1,000 | | | | 1,139,570 | |
Connecticut Health and Educational Facilities Authority, (Fairfield University),
5.00%, 7/1/25 | | | 875 | | | | 1,007,090 | |
Connecticut Health and Educational Facilities Authority, (Fairfield University),
5.00%, 7/1/26 | | | 1,000 | | | | 1,155,940 | |
Florida Higher Educational Facilities Financing Authority, (Nova Southeastern University), 5.00%, 4/1/28 | | | 400 | | | | 454,100 | |
Florida Higher Educational Facilities Financing Authority, (Nova Southeastern University), 5.00%, 4/1/29 | | | 1,000 | | | | 1,130,870 | |
Florida Higher Educational Facilities Financing Authority, (Nova Southeastern University), 5.00%, 4/1/30 | | | 750 | | | | 845,422 | |
Florida Higher Educational Facilities Financing Authority, (Nova Southeastern University), 5.00%, 4/1/31 | | | 250 | | | | 280,903 | |
Kokomo-Center Schools Building Corp., IN, 5.00%, 1/15/23 | | | 430 | | | | 481,187 | |
Kokomo-Center Schools Building Corp., IN, 5.00%, 7/15/23 | | | 235 | | | | 265,597 | |
Kokomo-Center Schools Building Corp., IN, 5.00%, 1/15/24 | | | 450 | | | | 510,691 | |
Kokomo-Center Schools Building Corp., IN, 5.00%, 7/15/24 | | | 385 | | | | 440,675 | |
Kokomo-Center Schools Building Corp., IN, 5.00%, 7/15/25 | | | 540 | | | | 625,288 | |
Kokomo-Center Schools Building Corp., IN, 5.00%, 1/15/26 | | | 555 | | | | 641,863 | |
Kokomo-Center Schools Building Corp., IN, 5.00%, 7/15/26 | | | 500 | | | | 581,805 | |
Louisiana Public Facilities Authority, (Tulane University), 5.00%, 12/15/27 | | | 1,105 | | | | 1,276,308 | |
Metropolitan State University of Denver, CO, (Aerospace and Engineering Sciences Building), 4.00%, 12/1/28 | | | 715 | | | | 772,958 | |
Metropolitan State University of Denver, CO, (Aerospace and Engineering Sciences Building), 4.00%, 12/1/29 | | | 400 | | | | 429,404 | |
Metropolitan State University of Denver, CO, (Aerospace and Engineering Sciences Building), 4.00%, 12/1/30 | | | 225 | | | | 239,699 | |
Metropolitan State University of Denver, CO, (Aerospace and Engineering Sciences Building), 4.00%, 12/1/31 | | | 300 | | | | 317,775 | |
| | | | | | | | |
| Security | | Principal
Amount
(000’s omitted) | | | Value | |
|
| Education (continued) | |
Metropolitan State University of Denver, CO, (Aerospace and Engineering Sciences Building), 5.00%, 12/1/27 | | $ | 625 | | | $ | 736,375 | |
Nevada System of Higher Education,
5.00%, 7/1/24 | | | 1,000 | | | | 1,133,210 | |
New Hope Cultural Education Facilities Finance Corp., TX, (Texas A&M University - Cain Hall Redevelopment), 5.00%, 4/1/24 | | | 220 | | | | 250,367 | |
New Jersey Educational Facilities Authority, (Princeton University), 5.00%, 7/1/33 | | | 300 | | | | 356,424 | |
New York Dormitory Authority, School Districts Revenue, 4.00%, 10/1/23 | | | 2,000 | | | | 2,177,840 | |
North Carolina Capital Facilities Finance Agency, (Davidson College), 5.00%, 3/1/29 | | | 200 | | | | 219,612 | |
Oregon Facilities Authority, (Linfield College), 5.00%, 10/1/23 | | | 100 | | | | 112,917 | |
Oregon Facilities Authority, (Linfield College), 5.00%, 10/1/26 | | | 150 | | | | 169,617 | |
Oregon Facilities Authority, (Linfield College), 5.00%, 10/1/27 | | | 425 | | | | 475,924 | |
Red River Education Financing Corp., TX, (Texas Christian University), 5.00%, 3/15/23 | | | 120 | | | | 134,960 | |
Red River Education Financing Corp., TX, (Texas Christian University), 5.00%, 3/15/24 | | | 100 | | | | 114,381 | |
Red River Education Financing Corp., TX, (Texas Christian University), 5.00%, 3/15/31 | | | 375 | | | | 429,030 | |
Rhode Island Health and Educational Building Corp., (Rhode Island School of Design), (LOC: TD Bank, N.A.), 0.98%, 8/15/36(2) | | | 5,000 | | | | 5,000,000 | |
S.M. Educational Building Corp., MS,
5.00%, 9/1/25 | | | 250 | | | | 291,205 | |
Saginaw Valley State University, MI,
5.00%, 7/1/26 | | | 750 | | | | 870,997 | |
Saginaw Valley State University, MI,
5.00%, 7/1/27 | | | 750 | | | | 863,505 | |
Saginaw Valley State University, MI,
5.00%, 7/1/28 | | | 1,000 | | | | 1,146,000 | |
Tarrant County Cultural Education Facilities Finance Corp., TX, (Hendrick Medical Center), 5.00%, 9/1/23 | | | 250 | | | | 280,783 | |
University of California, 5.00%, 5/15/32 | | | 3,000 | | | | 3,382,410 | |
University of North Carolina at Chapel Hill, 1.802%, (67% of 1 mo. USD LIBOR + 0.40%), 11/9/22 (Put Date), 12/1/41(3) | | | 4,250 | | | | 4,281,620 | |
University of North Carolina at Greensboro, 5.00%, 4/1/33 | | | 1,085 | | | | 1,228,003 | |
University of Washington, 5.00%, 4/1/25 | | | 2,500 | | | | 2,928,225 | |
Western Michigan University, 5.00%, 11/15/24 | | | 500 | | | | 578,895 | |
| | | | $ | 43,012,996 | |
|
| Electric Utilities — 4.5% | |
Brownsville, TX, Utilities System Revenue, 5.00%, 9/1/29 | | $ | 1,000 | | | $ | 1,142,460 | |
Energy Northwest, WA, Wind Project Revenue, 5.00%, 7/1/25 | | | 500 | | | | 574,455 | |
Energy Northwest, WA, Wind Project Revenue, 5.00%, 7/1/26 | | | 1,000 | | | | 1,145,510 | |
Fayetteville Public Works Commission, NC, 5.00%, 3/1/25 | | | 1,000 | | | | 1,168,650 | |
Garland, TX, Electric Utility System Revenue, 5.00%, 3/1/32 | | | 250 | | | | 282,225 | |
Los Angeles Department of Water and Power, CA, Power System Revenue, (SPA: TD Bank, N.A.), 0.53%, 7/1/34(2) | | | 5,900 | | | | 5,900,000 | |
| | | | |
| | 11 | | See Notes to Financial Statements. |
5-to-15 Year Laddered Municipal Bond Portfolio
July 31, 2018
Portfolio of Investments (Unaudited) — continued
| | | | | | | | |
| Security | | Principal
Amount
(000’s omitted) | | | Value | |
|
| Electric Utilities (continued) | |
Lower Colorado River Authority, TX, (LCRA Transmission Services Corp.),
5.00%, 5/15/24 | | $ | 100 | | | $ | 114,721 | |
Marquette Board of Light and Power, MI, 5.00%, 7/1/24 | | | 475 | | | | 539,339 | |
Marquette Board of Light and Power, MI, 5.00%, 7/1/25 | | | 345 | | | | 394,966 | |
Marquette Board of Light and Power, MI, 5.00%, 7/1/27 | | | 735 | | | | 842,310 | |
North Carolina Municipal Power Agency No. 1, (Catawba), 5.00%, 1/1/29 | | | 500 | | | | 578,355 | |
North Carolina Municipal Power Agency No. 1, (Catawba), 5.00%, 1/1/30 | | | 1,000 | | | | 1,152,870 | |
Orlando Utilities Commission, FL, Utility System Revenue, (SPA: TD Bank, N.A.), 0.97%, 10/1/33(2) | | | 5,000 | | | | 5,000,000 | |
Public Power Generation Agency, NE, (Whelan Energy Center Unit 2), 5.00%, 1/1/23 | | | 1,325 | | | | 1,478,448 | |
Public Power Generation Agency, NE, (Whelan Energy Center Unit 2), 5.00%, 1/1/25 | | | 500 | | | | 573,320 | |
Redding Joint Powers Financing Authority, CA, Electric System Revenue, 4.00%, 6/1/23 | | | 125 | | | | 136,998 | |
Redding Joint Powers Financing Authority, CA, Electric System Revenue, 5.00%, 6/1/24 | | | 300 | | | | 348,573 | |
Redding Joint Powers Financing Authority, CA, Electric System Revenue, 5.00%, 6/1/26 | | | 250 | | | | 294,917 | |
Springfield Electric System Revenue, IL, 5.00%, 3/1/22 | | | 500 | | | | 547,760 | |
Springfield Electric System Revenue, IL, 5.00%, 3/1/27 | | | 250 | | | | 281,400 | |
Springfield Electric System Revenue, IL, 5.00%, 3/1/28 | | | 250 | | | | 280,285 | |
Springfield Electric System Revenue, IL, 5.00%, 3/1/29 | | | 250 | | | | 279,178 | |
Tallahassee, FL, Energy System Revenue, 5.00%, 10/1/27 | | | 300 | | | | 345,549 | |
Tallahassee, FL, Energy System Revenue, 5.00%, 10/1/28 | | | 400 | | | | 459,492 | |
Tallahassee, FL, Energy System Revenue, 5.00%, 10/1/29 | | | 1,120 | | | | 1,283,128 | |
Tallahassee, FL, Energy System Revenue, 5.00%, 10/1/30 | | | 1,500 | | | | 1,711,095 | |
Tallahassee, FL, Energy System Revenue, 5.00%, 10/1/31 | | | 1,000 | | | | 1,138,280 | |
Tallahassee, FL, Energy System Revenue, 5.00%, 10/1/33 | | | 1,500 | | | | 1,692,825 | |
Walnut Energy Center Authority, CA,
5.00%, 1/1/33 | | | 250 | | | | 284,302 | |
| | | | $ | 29,971,411 | |
|
| Escrowed / Prerefunded — 0.1% | |
Wisconsin Health and Educational Facilities Authority, (Ministry Health Care), Prerefunded to 8/15/22, 5.00%, 8/15/32 | | $ | 500 | | | $ | 556,030 | |
| | | | $ | 556,030 | |
|
| General Obligations — 31.7% | |
Addison, TX, 5.00%, 2/15/26 | | $ | 270 | | | $ | 301,722 | |
Agua Fria Union High School District No. 216, AZ, 4.00%, 7/1/29 | | | 175 | | | | 189,037 | |
Anchorage, AK, 5.00%, 9/1/23 | | | 750 | | | | 857,002 | |
Anchorage, AK, 5.00%, 9/1/24 | | | 250 | | | | 289,785 | |
Anchorage, AK, 5.00%, 9/1/25 | | | 750 | | | | 878,932 | |
| | | | | | | | |
| Security | | Principal
Amount
(000’s omitted) | | | Value | |
|
| General Obligations (continued) | |
Anchorage, AK, 5.00%, 9/1/27 | | $ | 780 | | | $ | 908,560 | |
Arkansas, 5.00%, 10/1/23 | | | 3,045 | | | | 3,489,387 | |
Arkansas, 5.00%, 4/1/24 | | | 5,000 | | | | 5,711,200 | |
Arlington County, VA, 4.00%, 8/1/27 | | | 2,090 | | | | 2,261,965 | |
Avon, OH, 4.00%, 12/1/31 | | | 340 | | | | 362,443 | |
Bayfield School District No. 10 JT-R, CO,
5.00%, 12/1/32 | | | 1,250 | | | | 1,432,025 | |
Belding Area Schools, MI, 5.00%, 5/1/28 | | | 250 | | | | 289,755 | |
Belding Area Schools, MI, 5.00%, 5/1/30 | | | 250 | | | | 287,118 | |
Boston, MA, 4.00%, 4/1/30 | | | 1,500 | | | | 1,636,380 | |
Brookline, MA, 4.00%, 3/1/30 | | | 185 | | | | 199,017 | |
Bryan County School District, GA, 4.00%, 8/1/32 | | | 515 | | | | 550,241 | |
Bryant School District No. 25, AR, 3.00%, 2/1/26 | | | 300 | | | | 304,299 | |
Burlington, VT, 5.00%, 11/1/23 | | | 350 | | | | 394,972 | |
Burlington, VT, 5.00%, 11/1/24 | | | 180 | | | | 205,312 | |
Burlington, VT, 5.00%, 11/1/25 | | | 400 | | | | 461,024 | |
Burlington, VT, 5.00%, 11/1/26 | | | 150 | | | | 174,146 | |
Burlington, VT, 5.00%, 11/1/27 | | | 225 | | | | 259,963 | |
Burlington, VT, 5.00%, 11/1/28 | | | 370 | | | | 426,029 | |
California, 4.00%, 9/1/26 | | | 750 | | | | 848,242 | |
California, 4.00%, 9/1/27 | | | 240 | | | | 263,791 | |
California, 4.00%, 9/1/28 | | | 150 | | | | 163,955 | |
California, 4.00%, 9/1/31 | | | 400 | | | | 432,084 | |
California, 5.00%, 8/1/24 | | | 1,500 | | | | 1,755,900 | |
California, 5.00%, 8/1/26 | | | 2,010 | | | | 2,384,604 | |
California, 5.00%, 8/1/32 | | | 1,590 | | | | 1,863,941 | |
California, 5.25%, 9/1/23 | | | 500 | | | | 554,320 | |
California, (LOC: Sumitomo Mitsui Banking Co.), 0.65%, 5/1/40(2) | | | 5,000 | | | | 5,000,000 | |
Cambridge, MA, 5.00%, 2/15/26 | | | 1,350 | | | | 1,608,079 | |
Central Dauphin School District, PA,
5.00%, 2/1/29 | | | 500 | | | | 579,880 | |
Collin County, TX, 5.00%, 2/15/25 | | | 1,605 | | | | 1,867,626 | |
Colonial School District, PA, 5.00%, 2/15/29 | | | 100 | | | | 116,038 | |
Colonial School District, PA, 5.00%, 2/15/31 | | | 100 | | | | 115,410 | |
Colonial School District, PA, 5.00%, 2/15/32 | | | 100 | | | | 115,271 | |
Colonial School District, PA, 5.00%, 2/15/33 | | | 200 | | | | 229,988 | |
Cook County School District No. 25, (Arlington Heights), IL, 5.00%, 12/15/29 | | | 1,000 | | | | 1,143,050 | |
Cook County School District No. 25, (Arlington Heights), IL, 5.00%, 12/15/30 | | | 2,000 | | | | 2,276,600 | |
Cook County School District No. 25, (Arlington Heights), IL, 5.00%, 12/15/31 | | | 1,000 | | | | 1,135,930 | |
Cook County School District No. 25, (Arlington Heights), IL, 5.00%, 12/15/32 | | | 630 | | | | 712,662 | |
Cuyahoga Community College District, OH, 4.00%, 2/1/27 | | | 1,000 | | | | 1,077,140 | |
Cuyahoga Community College District, OH, 4.00%, 2/1/28 | | | 750 | | | | 802,102 | |
| | | | |
| | 12 | | See Notes to Financial Statements. |
5-to-15 Year Laddered Municipal Bond Portfolio
July 31, 2018
Portfolio of Investments (Unaudited) — continued
| | | | | | | | |
| Security | | Principal
Amount
(000’s omitted) | | | Value | |
|
| General Obligations (continued) | |
Dallas, TX, 5.00%, 2/15/23 | | $ | 5,000 | | | $ | 5,624,200 | |
Dallas, TX, 5.00%, 2/15/31 | | | 3,715 | | | | 4,104,183 | |
Deer Park Independent School District, TX, (PSF Guaranteed), 5.00%, 8/15/31 | | | 400 | | | | 463,864 | |
Deer Park Independent School District, TX, (PSF Guaranteed), 5.00%, 8/15/33 | | | 500 | | | | 575,555 | |
Deer Valley Unified School District No. 97, AZ, 5.00%, 7/1/23 | | | 250 | | | | 284,303 | |
Delaware, 5.00%, 2/1/29 | | | 1,000 | | | | 1,212,070 | |
Delaware, 5.00%, 2/1/32 | | | 1,150 | | | | 1,376,665 | |
Delaware County, OH, 4.00%, 12/1/27 | | | 150 | | | | 163,407 | |
Delaware County, OH, 4.00%, 12/1/28 | | | 255 | | | | 274,444 | |
Dowagiac Union School District, MI,
4.00%, 5/1/23 | | | 350 | | | | 379,393 | |
Dowagiac Union School District, MI,
4.00%, 5/1/24 | | | 250 | | | | 272,330 | |
Dowagiac Union School District, MI,
4.00%, 5/1/25 | | | 630 | | | | 689,548 | |
Dowagiac Union School District, MI,
4.00%, 5/1/26 | | | 350 | | | | 382,372 | |
Eagle-Vail Metropolitan District, CO,
4.00%, 12/1/29 | | | 75 | | | | 81,956 | |
Eagle-Vail Metropolitan District, CO,
4.00%, 12/1/30 | | | 175 | | | | 190,482 | |
Edgewood City School District, OH,
5.25%, 12/1/33 | | | 500 | | | | 564,615 | |
Edinburg, TX, 5.00%, 3/1/23 | | | 1,235 | | | | 1,385,448 | |
Edinburg, TX, 5.00%, 3/1/24 | | | 315 | | | | 358,590 | |
Edinburg, TX, 5.00%, 3/1/25 | | | 310 | | | | 356,144 | |
Fayette County School District, GA,
5.25%, 9/1/24 | | | 1,425 | | | | 1,673,734 | |
Flower Mound, TX, 4.00%, 3/1/27 | | | 1,000 | | | | 1,082,900 | |
Flower Mound, TX, 4.00%, 3/1/32 | | | 390 | | | | 414,629 | |
Flower Mound, TX, 5.00%, 3/1/27 | | | 510 | | | | 596,771 | |
Frisco Independent School District, TX, (PSF Guaranteed), 4.00%, 8/15/30 | | | 400 | | | | 429,228 | |
Georgia, 5.00%, 7/1/23 | | | 2,400 | | | | 2,737,752 | |
Georgia, 5.00%, 2/1/32 | | | 1,000 | | | | 1,178,580 | |
Glen Rock Board of Education, NJ,
5.00%, 9/1/30 | | | 250 | | | | 289,360 | |
Glen Rock Board of Education, NJ,
5.00%, 9/1/31 | | | 345 | | | | 398,037 | |
Granville Exempted Village School District, OH, 5.00%, 12/1/26 | | | 500 | | | | 583,600 | |
Harlandale Independent School District, TX, 5.00%, 8/1/29 | | | 845 | | | | 976,676 | |
Hawaii, 4.00%, 10/1/32 | | | 2,400 | | | | 2,570,760 | |
Homewood, AL, 5.00%, 9/1/28 | | | 2,000 | | | | 2,338,240 | |
Homewood, AL, 5.00%, 9/1/29 | | | 2,000 | | | | 2,328,760 | |
Houston, TX, 5.00%, 3/1/23 | | | 3,000 | | | | 3,379,410 | |
Hudson City School District, OH, 4.00%, 12/1/30 | | | 500 | | | | 533,210 | |
Hudson City School District, OH, 4.00%, 12/1/31 | | | 400 | | | | 425,132 | |
Hudson City School District, OH, 4.00%, 12/1/32 | | | 350 | | | | 370,493 | |
Jourdanton Independent School District, TX, (PSF Guaranteed), 4.00%, 2/15/23 | | | 340 | | | | 367,962 | |
Jourdanton Independent School District, TX, (PSF Guaranteed), 4.00%, 2/15/24 | | | 340 | | | | 371,919 | |
Jourdanton Independent School District, TX, (PSF Guaranteed), 4.00%, 2/15/25 | | | 555 | | | | 609,828 | |
| | | | | | | | |
| Security | | Principal
Amount
(000’s omitted) | | | Value | |
|
| General Obligations (continued) | |
Jourdanton Independent School District, TX, (PSF Guaranteed), 4.00%, 2/15/26 | | $ | 500 | | | $ | 551,945 | |
Kane, Cook and DuPage Counties School District No. 46, IL, 5.00%, 1/1/29 | | | 1,000 | | | | 1,122,060 | |
Kane, McHenry, Cook and DeKalb Counties Community Unit School District No. 300, IL, 5.00%, 1/1/28 | | | 2,370 | | | | 2,740,289 | |
King County, WA, 5.00%, 1/1/26 | | | 1,495 | | | | 1,659,435 | |
Lakeland, FL, 5.00%, 10/1/25 | | | 635 | | | | 733,977 | |
Lakeland, FL, 5.00%, 10/1/28 | | | 1,500 | | | | 1,716,945 | |
Lakeland, FL, 5.00%, 10/1/30 | | | 1,000 | | | | 1,138,070 | |
Lakewood, OH, 4.00%, 12/1/30 | | | 250 | | | | 267,728 | |
Laredo Community College District, TX,
5.00%, 8/1/23 | | | 165 | | | | 186,166 | |
Laredo Community College District, TX,
5.00%, 8/1/24 | | | 140 | | | | 159,967 | |
Laredo Community College District, TX,
5.00%, 8/1/25 | | | 110 | | | | 126,790 | |
Laredo Community College District, TX,
5.00%, 8/1/26 | | | 320 | | | | 372,621 | |
Leander Independent School District, TX, (PSF Guaranteed), 0.00%, 8/15/29 | | | 2,380 | | | | 1,619,971 | |
Leander Independent School District, TX, (PSF Guaranteed), 0.00%, 8/15/31 | | | 850 | | | | 521,773 | |
Lewisville Independent School District, TX, (PSF Guaranteed), 4.00%, 8/15/27 | | | 1,600 | | | | 1,750,720 | |
Little Rock School District, AR, 3.00%, 2/1/23 | | | 400 | | | | 406,856 | |
Massachusetts, 4.00%, 4/1/33 | | | 5,000 | | | | 5,156,750 | |
McLean County Public Building Commission, IL, 5.00%, 12/1/28 | | | 200 | | | | 228,598 | |
Miami-Dade County School District, FL,
5.00%, 3/15/28 | | | 300 | | | | 343,125 | |
Miami-Dade County, FL, 5.00%, 7/1/29 | | | 1,000 | | | | 1,154,380 | |
Miamisburg City School District, OH,
4.00%, 12/1/31 | | | 300 | | | | 318,789 | |
Milpitas Unified School District, CA, (Election of 2012), 4.00%, 8/1/32 | | | 560 | | | | 590,212 | |
Minneapolis Special School District No. 1, MN, 3.00%, 2/1/23 | | | 250 | | | | 258,738 | |
Monroe, NC, Limited Obligation Bonds,
3.00%, 3/1/23 | | | 500 | | | | 517,110 | |
Mountain View-Los Altos Union High School District, CA, 0.00%, 8/1/27 | | | 175 | | | | 138,707 | |
Navasota Independent School District, TX, (PSF Guaranteed), 5.00%, 2/15/28 | | | 195 | | | | 223,468 | |
Navasota Independent School District, TX, (PSF Guaranteed), 5.00%, 2/15/29 | | | 340 | | | | 388,756 | |
Navasota Independent School District, TX, (PSF Guaranteed), 5.00%, 2/15/30 | | | 725 | | | | 827,094 | |
Navasota Independent School District, TX, (PSF Guaranteed), 5.00%, 2/15/31 | | | 885 | | | | 1,007,342 | |
Navasota Independent School District, TX, (PSF Guaranteed), 5.00%, 2/15/32 | | | 720 | | | | 816,300 | |
Navasota Independent School District, TX, (PSF Guaranteed), 5.00%, 2/15/33 | | | 445 | | | | 503,099 | |
New York, 5.00%, 2/15/24 | | | 3,000 | | | | 3,474,540 | |
| | | | |
| | 13 | | See Notes to Financial Statements. |
5-to-15 Year Laddered Municipal Bond Portfolio
July 31, 2018
Portfolio of Investments (Unaudited) — continued
| | | | | | | | |
| Security | | Principal
Amount
(000’s omitted) | | | Value | |
|
| General Obligations (continued) | |
New York, NY, 5.00%, 8/1/25 | | $ | 2,000 | | | $ | 2,344,360 | |
North Royalton City School District, OH,
4.00%, 12/1/32 | | | 600 | | | | 632,238 | |
Oakland Schools Intermediate School District, MI, 5.00%, 5/1/25 | | | 920 | | | | 1,071,892 | |
Olentangy Local School District, OH,
4.00%, 12/1/27 | | | 415 | | | | 452,226 | |
Oregon, 2.15%, 12/1/23 | | | 735 | | | | 736,838 | |
Oregon, 2.20%, 6/1/24 | | | 1,565 | | | | 1,568,396 | |
Oregon, 2.25%, 12/1/24 | | | 1,000 | | | | 1,001,750 | |
Oregon, 2.35%, 6/1/25 | | | 365 | | | | 366,832 | |
Oregon, 2.40%, 12/1/25 | | | 1,050 | | | | 1,055,617 | |
Oregon, 2.50%, 6/1/26 | | | 1,070 | | | | 1,078,346 | |
Oregon, 2.55%, 12/1/26 | | | 430 | | | | 434,188 | |
Oregon, 2.55%, 6/1/28 | | | 425 | | | | 410,576 | |
Oregon, 5.00%, 12/1/27 | | | 325 | | | | 385,483 | |
Oregon, (SPA: U.S. Bank, N.A.),
1.02%, 12/1/36(2) | | | 5,000 | | | | 5,000,000 | |
Owen J. Roberts School District, PA,
4.00%, 5/15/29 | | | 750 | | | | 784,200 | |
Pasadena, TX, 4.00%, 2/15/28 | | | 500 | | | | 537,775 | |
Pasadena, TX, 4.00%, 2/15/29 | | | 250 | | | | 267,188 | |
Pasadena, TX, 4.00%, 2/15/30 | | | 500 | | | | 531,305 | |
Pasadena, TX, 4.00%, 2/15/31 | | | 750 | | | | 793,748 | |
Pendleton School District No. 16R, Umatilla County, OR, 0.00%, 6/15/27 | | | 1,060 | | | | 817,525 | |
Penn Hills, PA, 5.00%, 12/1/27 | | | 1,000 | | | | 1,160,810 | |
Pennsylvania, 4.00%, 6/1/30 | | | 5,000 | | | | 5,197,900 | |
Pennsylvania, 4.00%, 6/15/31 | | | 235 | | | | 244,724 | |
Pennsylvania, 5.00%, 7/1/24 | | | 490 | | | | 558,389 | |
Peoria, IL, 5.00%, 1/1/27 | | | 500 | | | | 556,875 | |
Pflugerville, TX, 5.00%, 8/1/30 | | | 185 | | | | 216,211 | |
Pflugerville, TX, 5.00%, 8/1/31 | | | 245 | | | | 285,067 | |
Pflugerville, TX, 5.00%, 8/1/32 | | | 100 | | | | 115,839 | |
Pittsburg Unified School District, CA,
5.00%, 8/1/28 | | | 920 | | | | 1,103,466 | |
Pittsburg Unified School District, CA,
5.00%, 8/1/29 | | | 1,150 | | | | 1,371,168 | |
Pittsburg Unified School District, CA,
5.00%, 8/1/30 | | | 1,160 | | | | 1,372,872 | |
Pittsburg Unified School District, CA, (Election of 2014), 5.00%, 8/1/30 | | | 420 | | | | 497,074 | |
Pittsburg Unified School District, CA, (Election of 2014), 5.00%, 8/1/31 | | | 370 | | | | 435,634 | |
Pittsburg Unified School District, CA, (Election of 2014), 5.00%, 8/1/32 | | | 670 | | | | 784,195 | |
Prosper Independent School District, TX, (PSF Guaranteed), 5.00%, 2/15/24 | | | 1,020 | | | | 1,169,807 | |
Ravenswood City School District, CA, (Election of 2016), 5.00%, 8/1/23 | | | 445 | | | | 508,871 | |
Ravenswood City School District, CA, (Election of 2016), 5.00%, 8/1/24 | | | 465 | | | | 540,330 | |
| | | | | | | | |
| Security | | Principal
Amount
(000’s omitted) | | | Value | |
|
| General Obligations (continued) | |
Ravenswood City School District, CA, (Election of 2016), 5.00%, 8/1/25 | | $ | 485 | | | $ | 570,903 | |
Ravenswood City School District, CA, (Election of 2016), 5.00%, 8/1/26 | | | 505 | | | | 601,642 | |
Ravenswood City School District, CA, (Election of 2016), 5.00%, 8/1/27 | | | 530 | | | | 627,610 | |
Ravenswood City School District, CA, (Election of 2016), 5.00%, 8/1/28 | | | 555 | | | | 655,011 | |
Ravenswood City School District, CA, (Election of 2016), 5.00%, 8/1/29 | | | 575 | | | | 676,332 | |
Romeo Community Schools, MI, 5.00%, 5/1/25 | | | 1,000 | | | | 1,156,310 | |
Romeo Community Schools, MI, 5.00%, 5/1/26 | | | 1,270 | | | | 1,475,803 | |
Romeo Community Schools, MI, 5.00%, 5/1/29 | | | 1,000 | | | | 1,152,220 | |
Romeo Community Schools, MI, 5.00%, 5/1/30 | | | 700 | | | | 803,929 | |
Romulus, MI, 4.00%, 11/1/31 | | | 250 | | | | 266,335 | |
Romulus, MI, 4.00%, 11/1/32 | | | 300 | | | | 318,195 | |
Romulus, MI, 4.00%, 11/1/33 | | | 250 | | | | 263,830 | |
SCAGO Educational Facilities Corp. for Cherokee School District, SC, 5.00%, 12/1/23 | | | 500 | | | | 570,040 | |
SCAGO Educational Facilities Corp. for Pickens School District, SC, 5.00%, 12/1/26 | | | 1,750 | | | | 2,004,170 | |
School District 27J, Adams and Weld Counties and City and County of Broomfield, CO, 4.00%, 12/1/30 | | | 750 | | | | 805,132 | |
School District 27J, Adams and Weld Counties and City and County of Broomfield, CO, 4.00%, 12/1/31 | | | 250 | | | | 267,695 | |
Seguin Independent School District, TX, (PSF Guaranteed), 4.00%, 8/15/29 | | | 400 | | | | 432,848 | |
Seguin Independent School District, TX, (PSF Guaranteed), 4.00%, 8/15/30 | | | 300 | | | | 322,446 | |
Seguin Independent School District, TX, (PSF Guaranteed), 4.00%, 8/15/31 | | | 200 | | | | 214,042 | |
Seward County Unified School District No. 480, KS, 5.00%, 9/1/29 | | | 2,000 | | | | 2,294,620 | |
South Texas College District, 5.00%, 8/15/30 | | | 1,295 | | | | 1,457,743 | |
Southfield Public Schools, MI, 5.00%, 5/1/25 | | | 1,100 | | | | 1,271,941 | |
Southfield Public Schools, MI, 5.00%, 5/1/27 | | | 1,000 | | | | 1,171,290 | |
Spring Independent School District, TX, (PSF Guaranteed), 5.00%, 8/15/24 | | | 500 | | | | 577,810 | |
Spring Independent School District, TX, (PSF Guaranteed), 5.00%, 8/15/26 | | | 735 | | | | 870,372 | |
St. Vrain Valley School District RE-1J, CO,
5.00%, 12/15/28 | | | 1,700 | | | | 2,009,264 | |
St. Vrain Valley School District RE-1J, CO,
5.00%, 12/15/29 | | | 1,000 | | | | 1,172,870 | |
Stamford, CT, 4.00%, 8/1/27 | | | 750 | | | | 827,887 | |
Sugar Land, TX, 5.00%, 2/15/26 | | | 555 | | | | 650,593 | |
Sun Valley, ID, 5.00%, 9/15/23 | | | 685 | | | | 782,003 | |
Sun Valley, ID, 5.00%, 9/15/24 | | | 720 | | | | 835,265 | |
Sun Valley, ID, 5.00%, 9/15/25 | | | 755 | | | | 888,688 | |
| | | | |
| | 14 | | See Notes to Financial Statements. |
5-to-15 Year Laddered Municipal Bond Portfolio
July 31, 2018
Portfolio of Investments (Unaudited) — continued
| | | | | | | | |
| Security | | Principal
Amount
(000’s omitted) | | | Value | |
|
| General Obligations (continued) | |
Sun Valley, ID, 5.00%, 9/15/26 | | $ | 695 | | | $ | 827,008 | |
Torrance Unified School District, CA, (Election of 2014), 5.00%, 8/1/30 | | | 515 | | | | 604,538 | |
Torrance Unified School District, CA, (Election of 2014), 5.00%, 8/1/31 | | | 450 | | | | 525,762 | |
Trussville, AL, 5.00%, 10/1/31 | | | 250 | | | | 279,708 | |
Tuloso-Midway Independent School District, TX, (PSF Guaranteed), 4.00%, 8/15/27 | | | 510 | | | | 559,766 | |
Tuloso-Midway Independent School District, TX, (PSF Guaranteed), 4.00%, 8/15/28 | | | 530 | | | | 579,566 | |
Tuloso-Midway Independent School District, TX, (PSF Guaranteed), 4.00%, 8/15/29 | | | 545 | | | | 593,036 | |
Tuloso-Midway Independent School District, TX, (PSF Guaranteed), 4.00%, 8/15/30 | | | 570 | | | | 616,808 | |
Tuloso-Midway Independent School District, TX, (PSF Guaranteed), 5.00%, 8/15/22 | | | 395 | | | | 440,887 | |
Tuloso-Midway Independent School District, TX, (PSF Guaranteed), 5.00%, 8/15/23 | | | 415 | | | | 471,801 | |
Tuloso-Midway Independent School District, TX, (PSF Guaranteed), 5.00%, 8/15/24 | | | 435 | | | | 502,429 | |
Tuloso-Midway Independent School District, TX, (PSF Guaranteed), 5.00%, 8/15/25 | | | 360 | | | | 420,516 | |
Tuloso-Midway Independent School District, TX, (PSF Guaranteed), 5.00%, 8/15/26 | | | 485 | | | | 563,124 | |
Ventura County, CA, 2.50%, 7/1/19 | | | 5,000 | | | | 5,046,250 | |
Virginia Resources Authority, (Pooled Financing Program), 5.00%, 11/1/25 | | | 600 | | | | 710,190 | |
Washington, 5.00%, 8/1/28 | | | 1,485 | | | | 1,743,182 | |
Washington, 5.00%, 8/1/29 | | | 1,500 | | | | 1,753,710 | |
Waupun School District, WI, 4.00%, 4/1/24 | | | 105 | | | | 114,485 | |
Weatherford Independent School District, TX, (PSF Guaranteed), 0.00%, 2/15/23 | | | 150 | | | | 135,705 | |
Weatherford Independent School District, TX, (PSF Guaranteed), 0.00%, 2/15/24 | | | 150 | | | | 131,802 | |
Weatherford Independent School District, TX, (PSF Guaranteed), 0.00%, 2/15/25 | | | 475 | | | | 403,019 | |
Webster Groves School District, MO,
4.00%, 3/1/28 | | | 1,050 | | | | 1,149,771 | |
West Chester Township, OH, 4.00%, 12/1/27 | | | 400 | | | | 436,588 | |
Will and Kendall Counties Community Consolidated School District No. 202, IL, 4.00%, 1/1/27 | | | 2,825 | | | | 3,051,085 | |
Will County Community Unit School District No. 365-U, IL, 4.00%, 1/1/30 | | | 750 | | | | 788,295 | |
Williamson County, TX, 5.00%, 2/15/28 | | | 300 | | | | 343,725 | |
Wisconsin, 5.00%, 11/1/26 | | | 2,000 | | | | 2,391,860 | |
York County, PA, 5.00%, 6/1/27 | | | 1,225 | | | | 1,407,108 | |
| | | | $ | 211,312,076 | |
| | | | | | | | |
| Security | | Principal
Amount
(000’s omitted) | | | Value | |
|
| Hospital — 12.7% | |
Berks County Industrial Development Authority, PA, (Tower Health), 4.00%, 11/1/33 | | $ | 500 | | | $ | 512,030 | |
Buffalo and Erie County Industrial Land Development Corp., NY, (Catholic Health System, Inc.), 5.00%, 7/1/25 | | | 250 | | | | 287,398 | |
California Health Facilities Financing Authority, (Adventist Health System/West),
4.00%, 3/1/27 | | | 100 | | | | 105,741 | |
California Health Facilities Financing Authority, (El Camino Hospital), 5.00%, 2/1/29 | | | 750 | | | | 877,717 | |
Charlotte-Mecklenburg Hospital Authority, NC, 5.125%, 1/15/37 | | | 40 | | | | 43,087 | |
Clarke County Hospital Authority, GA, (Piedmont Healthcare, Inc.), 4.00%, 7/1/33 | | | 415 | | | | 429,807 | |
Clarke County Hospital Authority, GA, (Piedmont Healthcare, Inc.), 5.00%, 7/1/30 | | | 2,000 | | | | 2,288,960 | |
Colorado Health Facilities Authority, (NCMC, Inc.), 5.00%, 5/15/25 | | | 500 | | | | 574,530 | |
Colorado Health Facilities Authority, (Parkview Medical Center), 5.00%, 9/1/23 | | | 270 | | | | 303,934 | |
Colorado Health Facilities Authority, (Parkview Medical Center), 5.00%, 9/1/25 | | | 260 | | | | 299,567 | |
Connecticut Health and Educational Facilities Authority, (Yale New Haven Health),
5.00%, 7/1/28 | | | 5,000 | | | | 5,647,900 | |
Greeneville Health and Educational Facilities Board, TN, (Ballad Health), 5.00%, 7/1/32 | | | 3,965 | | | | 4,330,375 | |
Greeneville Health and Educational Facilities Board, TN, (Ballad Health), 5.00%, 7/1/33 | | | 4,000 | | | | 4,359,080 | |
Idaho Health Facilities Authority, (Trinity Health Credit Group), 5.00%, 12/1/30 | | | 750 | | | | 822,375 | |
Illinois Finance Authority, (Mercy Health Corp.), 5.00%, 12/1/29 | | | 590 | | | | 657,826 | |
Illinois Finance Authority, (Riverside Health System), 5.00%, 11/15/24 | | | 1,070 | | | | 1,214,675 | |
Illinois Finance Authority, (Riverside Health System), 5.00%, 11/15/25 | | | 400 | | | | 458,472 | |
Illinois Finance Authority, (Riverside Health System), 5.00%, 11/15/26 | | | 500 | | | | 576,430 | |
Illinois Finance Authority, (Riverside Health System), 5.00%, 11/15/27 | | | 500 | | | | 574,840 | |
Illinois Finance Authority, (Rush University Medical Center), 5.00%, 11/15/31 | | | 1,000 | | | | 1,118,670 | |
Illinois Finance Authority, (Rush University Medical Center), 5.00%, 11/15/32 | | | 1,000 | | | | 1,114,780 | |
Indiana Finance Authority, (Community Foundation of Northwest Indiana Obligated Group), 5.00%, 9/1/24 | | | 500 | | | | 570,400 | |
Indiana Finance Authority, (Parkview Health), 5.00%, 11/1/26 | | | 300 | | | | 353,856 | |
Knox County Health, Educational and Housing Facility Board, TN, (University Health System, Inc.), 5.00%, 9/1/24 | | | 175 | | | | 196,488 | |
Knox County Health, Educational and Housing Facility Board, TN, (University Health System, Inc.), 5.00%, 9/1/30 | | | 1,000 | | | | 1,120,440 | |
| | | | |
| | 15 | | See Notes to Financial Statements. |
5-to-15 Year Laddered Municipal Bond Portfolio
July 31, 2018
Portfolio of Investments (Unaudited) — continued
| | | | | | | | |
| Security | | Principal
Amount
(000’s omitted) | | | Value | |
|
| Hospital (continued) | |
Lehigh County General Purpose Authority, PA, (Lehigh Valley Health Network),
4.00%, 7/1/23 | | $ | 225 | | | $ | 241,805 | |
Louisiana Public Facilities Authority, (Ochsner Clinic Foundation), 5.00%, 5/15/23 | | | 150 | | | | 167,961 | |
Louisiana Public Facilities Authority, (Ochsner Clinic Foundation), 5.00%, 5/15/25 | | | 250 | | | | 286,930 | |
Louisiana Public Facilities Authority, (Ochsner Clinic Foundation), 5.00%, 5/15/26 | | | 250 | | | | 285,260 | |
Louisiana Public Facilities Authority, (Ochsner Clinic Foundation), 5.00%, 5/15/27 | | | 250 | | | | 283,603 | |
Louisville/Jefferson County Metro Government, KY, (Norton Healthcare, Inc.),
5.00%, 10/1/30 | | | 2,000 | | | | 2,276,780 | |
Louisville/Jefferson County Metro Government, KY, (Norton Healthcare, Inc.),
5.00%, 10/1/31 | | | 1,500 | | | | 1,701,795 | |
Louisville/Jefferson County Metro Government, KY, (Norton Healthcare, Inc.),
5.00%, 10/1/32 | | | 2,000 | | | | 2,259,840 | |
Maryland Health and Higher Educational Facilities Authority, (MedStar Health, Inc.), 5.00%, 8/15/31 | | | 1,000 | | | | 1,116,640 | |
Massachusetts Development Finance Agency, (Berkshire Retirement Community, Inc.), 5.00%, 7/1/25 | | | 595 | | | | 678,758 | |
Massachusetts Development Finance Agency, (South Shore Hospital), 5.00%, 7/1/24 | | | 550 | | | | 623,524 | |
Massachusetts Development Finance Agency, (South Shore Hospital), 5.00%, 7/1/26 | | | 500 | | | | 578,740 | |
Massachusetts Development Finance Agency, (South Shore Hospital), 5.00%, 7/1/27 | | | 500 | | | | 569,970 | |
Massachusetts Development Finance Agency, (South Shore Hospital), 5.00%, 7/1/28 | | | 500 | | | | 566,580 | |
Massachusetts Development Finance Agency, (South Shore Hospital), 5.00%, 7/1/29 | | | 210 | | | | 236,863 | |
Massachusetts Development Finance Agency, (South Shore Hospital), 5.00%, 7/1/30 | | | 330 | | | | 370,250 | |
Michigan Finance Authority, (Sparrow Obligated Group), 5.00%, 11/15/24 | | | 500 | | | | 574,475 | |
Michigan Finance Authority, (Trinity Health Credit Group), 5.00%, 12/1/35 | | | 500 | | | | 545,550 | |
Missouri Health and Educational Facilities Authority, (CoxHealth), 5.00%, 11/15/31 | | | 490 | | | | 548,922 | |
Missouri Health and Educational Facilities Authority, (Saint Luke’s Health System), 5.00%, 11/15/31 | | | 1,000 | | | | 1,131,980 | |
Monongalia County Building Commission, WV, (Monongalia Health System Obligated Group), 5.00%, 7/1/23 | | | 500 | | | | 554,035 | |
Monongalia County Building Commission, WV, (Monongalia Health System Obligated Group), 5.00%, 7/1/24 | | | 500 | | | | 560,425 | |
New Hampshire Health and Education Facilities Authority, (Dartmouth-Hitchcock Obligated Group), 5.00%, 8/1/23 | | | 200 | | | | 225,758 | |
New Hampshire Health and Education Facilities Authority, (Dartmouth-Hitchcock Obligated Group), 5.00%, 8/1/24 | | | 300 | | | | 342,426 | |
| | | | | | | | |
| Security | | Principal
Amount
(000’s omitted) | | | Value | |
|
| Hospital (continued) | |
New Hampshire Health and Education Facilities Authority, (Dartmouth-Hitchcock Obligated Group), 5.00%, 8/1/25 | | $ | 400 | | | $ | 460,780 | |
New Hampshire Health and Education Facilities Authority, (Dartmouth-Hitchcock Obligated Group), 5.00%, 8/1/26 | | | 500 | | | | 579,490 | |
New Hampshire Health and Education Facilities Authority, (Dartmouth-Hitchcock Obligated Group), 5.00%, 8/1/28 | | | 500 | | | | 583,910 | |
New Hampshire Health and Education Facilities Authority, (Dartmouth-Hitchcock Obligated Group), 5.00%, 8/1/29 | | | 500 | | | | 580,315 | |
New Hampshire Health and Education Facilities Authority, (Dartmouth-Hitchcock Obligated Group), 5.00%, 8/1/30 | | | 500 | | | | 577,195 | |
New Hampshire Health and Education Facilities Authority, (Dartmouth-Hitchcock Obligated Group), 5.00%, 8/1/31 | | | 380 | | | | 436,308 | |
New Hanover County, NC, (New Hanover Regional Medical Center), 5.00%, 10/1/26 | | | 500 | | | | 586,135 | |
New Hanover County, NC, (New Hanover Regional Medical Center), 5.00%, 10/1/29 | | | 1,000 | | | | 1,161,780 | |
New Jersey Health Care Facilities Financing Authority, (Princeton HealthCare System), 5.00%, 7/1/22 | | | 800 | | | | 889,904 | |
New Jersey Health Care Facilities Financing Authority, (Princeton HealthCare System), 5.00%, 7/1/25 | | | 1,000 | | | | 1,167,480 | |
New Jersey Health Care Facilities Financing Authority, (Princeton HealthCare System), 5.00%, 7/1/27 | | | 700 | | | | 823,284 | |
New Jersey Health Care Facilities Financing Authority, (Princeton HealthCare System), 5.00%, 7/1/28 | | | 700 | | | | 819,455 | |
New Jersey Health Care Facilities Financing Authority, (Princeton HealthCare System), 5.00%, 7/1/30 | | | 520 | | | | 604,297 | |
New Jersey Health Care Facilities Financing Authority, (Princeton HealthCare System), 5.00%, 7/1/31 | | | 700 | | | | 810,775 | |
New Mexico Hospital Equipment Loan Council, (Presbyterian Healthcare Services),
5.00%, 8/1/24 | | | 100 | | | | 114,502 | |
Norman Regional Hospital Authority, OK,
5.00%, 9/1/25 | | | 1,000 | | | | 1,138,330 | |
Norman Regional Hospital Authority, OK,
5.00%, 9/1/29 | | | 1,000 | | | | 1,130,290 | |
North Carolina Medical Care Commission, (North Carolina Baptist Hospital), 5.00%, 6/1/34 | | | 2,220 | | | | 2,333,731 | |
North Carolina Medical Care Commission, (Wake Forest Baptist Obligated Group),
5.00%, 12/1/33 | | | 3,030 | | | | 3,340,272 | |
Northampton County General Purpose Authority, PA, (St. Luke’s University Health Network), 5.00%, 8/15/27 | | | 115 | | | | 131,314 | |
Ohio, (University Hospitals Health System, Inc.), 5.00%, 1/15/27 | | | 535 | | | | 602,549 | |
Ohio, (University Hospitals Health System, Inc.), 5.00%, 1/15/28 | | | 1,000 | | | | 1,122,020 | |
Ohio, (University Hospitals Health System, Inc.), 5.00%, 1/15/29 | | | 1,000 | | | | 1,117,090 | |
Ohio, (University Hospitals Health System, Inc.), 5.00%, 1/15/30 | | | 1,000 | | | | 1,113,590 | |
Ohio, (University Hospitals Health System, Inc.), 5.00%, 1/15/31 | | | 1,000 | | | | 1,110,100 | |
| | | | |
| | 16 | | See Notes to Financial Statements. |
5-to-15 Year Laddered Municipal Bond Portfolio
July 31, 2018
Portfolio of Investments (Unaudited) — continued
| | | | | | | | |
| Security | | Principal
Amount
(000’s omitted) | | | Value | |
|
| Hospital (continued) | |
Richmond County Hospital Authority, GA, (University Health Services, Inc.),
5.00%, 1/1/24 | | $ | 630 | | | $ | 714,395 | |
Richmond County Hospital Authority, GA, (University Health Services, Inc.),
5.00%, 1/1/27 | | | 600 | | | | 695,874 | |
Richmond County Hospital Authority, GA, (University Health Services, Inc.),
5.00%, 1/1/28 | | | 1,000 | | | | 1,153,640 | |
Royal Oak Hospital Finance Authority, MI, (William Beaumont Hospital), 5.00%, 9/1/29 | | | 250 | | | | 279,460 | |
Southcentral Pennsylvania General Authority, (Hanover Hospital, Inc.), 4.00%, 12/1/30 | | | 150 | | | | 155,102 | |
Southcentral Pennsylvania General Authority, (Hanover Hospital, Inc.), 5.00%, 12/1/22 | | | 225 | | | | 249,995 | |
Southcentral Pennsylvania General Authority, (Hanover Hospital, Inc.), 5.00%, 12/1/24 | | | 300 | | | | 343,272 | |
St. Paul Housing and Redevelopment Authority, MN, (Fairview Health Services), 5.00%, 11/15/25 | | | 500 | | | | 584,225 | |
St. Paul Housing and Redevelopment Authority, MN, (HealthPartners Obligated Group), 5.00%, 7/1/30 | | | 625 | | | | 710,869 | |
Stafford County Economic Development Authority, VA, (Mary Washington Healthcare Obligated Group),
5.00%, 6/15/23 | | | 300 | | | | 333,447 | |
Stafford County Economic Development Authority, VA, (Mary Washington Healthcare Obligated Group),
5.00%, 6/15/24 | | | 500 | | | | 562,600 | |
University of Kansas Hospital Authority, (KU Health System), 5.00%, 9/1/27 | | | 1,655 | | | | 1,896,498 | |
University of Kansas Hospital Authority, (KU Health System), 5.00%, 9/1/30 | | | 1,625 | | | | 1,846,439 | |
Vermont Educational and Health Buildings Financing Agency, (University of Vermont Medical Center), 5.00%, 12/1/23 | | | 55 | | | | 62,467 | |
Vermont Educational and Health Buildings Financing Agency, (University of Vermont Medical Center), 5.00%, 12/1/24 | | | 350 | | | | 402,696 | |
Vermont Educational and Health Buildings Financing Agency, (University of Vermont Medical Center), 5.00%, 12/1/25 | | | 335 | | | | 389,793 | |
Vermont Educational and Health Buildings Financing Agency, (University of Vermont Medical Center), 5.00%, 12/1/26 | | | 400 | | | | 462,696 | |
Vermont Educational and Health Buildings Financing Agency, (University of Vermont Medical Center), 5.00%, 12/1/27 | | | 305 | | | | 350,719 | |
Vermont Educational and Health Buildings Financing Agency, (University of Vermont Medical Center), 5.00%, 12/1/28 | | | 500 | | | | 572,685 | |
Vermont Educational and Health Buildings Financing Agency, (University of Vermont Medical Center), 5.00%, 12/1/30 | | | 400 | | | | 454,848 | |
Vermont Educational and Health Buildings Financing Agency, (University of Vermont Medical Center), 5.00%, 12/1/31 | | | 400 | | | | 453,652 | |
Washington Health Care Facilities Authority, (Overlake Hospital Medical Center),
5.00%, 7/1/27 | | | 1,575 | | | | 1,819,739 | |
Wisconsin Health and Educational Facilities Authority, (Agnesian HealthCare, Inc.), 5.00%, 7/1/26 | | | 400 | | | | 461,148 | |
Wisconsin Health and Educational Facilities Authority, (Ascension Health Senior Credit Group), 5.00%, 11/15/33 | | | 650 | | | | 674,953 | |
| | | | $ | 84,534,356 | |
| | | | | | | | |
| Security | | Principal
Amount
(000’s omitted) | | | Value | |
|
| Housing — 2.7% | |
Connecticut Housing Finance Authority,
3.60%, 11/15/30 | | $ | 145 | | | $ | 145,947 | |
Georgia Housing & Finance Authority,
3.65%, 12/1/32 | | | 1,000 | | | | 1,021,860 | |
New York City Housing Development Corp., NY, 1.95%, 11/1/23 | | | 785 | | | | 762,368 | |
New York City Housing Development Corp., NY, 2.30%, 5/1/25 | | | 1,110 | | | | 1,099,000 | |
New York City Housing Development Corp., NY, 2.35%, 11/1/25 | | | 665 | | | | 656,674 | |
New York City Housing Development Corp., NY, 2.50%, 11/1/26 | | | 945 | | | | 933,159 | |
New York City Housing Development Corp., NY, 2.65%, 11/1/27 | | | 970 | | | | 957,419 | |
New York City Housing Development Corp., NY, 2.80%, 5/1/29 | | | 795 | | | | 776,166 | |
New York City Housing Development Corp., NY, 2.85%, 11/1/29 | | | 425 | | | | 415,756 | |
New York City Housing Development Corp., NY, 3.10%, 11/1/32 | | | 1,000 | | | | 981,850 | |
New York Housing Finance Agency, (FHLMC), (FNMA), (GNMA), 1.90%, 5/1/23 | | | 165 | | | | 163,220 | |
New York Housing Finance Agency, (FHLMC), (FNMA), (GNMA), 2.05%, 5/1/24 | | | 175 | | | | 173,121 | |
New York Housing Finance Agency, (FHLMC), (FNMA), (GNMA), 2.10%, 11/1/24 | | | 125 | | | | 123,479 | |
New York Housing Finance Agency, (FHLMC), (FNMA), (GNMA), 2.20%, 5/1/25 | | | 290 | | | | 287,117 | |
New York Housing Finance Agency, (FHLMC), (FNMA), (GNMA), 2.25%, 11/1/25 | | | 225 | | | | 222,615 | |
New York Housing Finance Agency, (FHLMC), (FNMA), (GNMA), 2.35%, 5/1/26 | | | 200 | | | | 198,174 | |
New York Housing Finance Agency, (FHLMC), (FNMA), (GNMA), 2.40%, 11/1/26 | | | 225 | | | | 222,997 | |
New York Housing Finance Agency, (FHLMC), (FNMA), (GNMA), 2.50%, 11/1/27 | | | 140 | | | | 138,739 | |
New York Housing Finance Agency, (FHLMC), (FNMA), (GNMA), 2.60%, 5/1/28 | | | 110 | | | | 108,688 | |
New York Mortgage Agency, 1.75%, 4/1/24 | | | 250 | | | | 243,515 | |
New York Mortgage Agency, 1.95%, 10/1/25 | | | 450 | | | | 433,566 | |
Seattle Housing Authority, WA, 2.625%, 12/1/23 | | | 110 | | | | 112,784 | |
Seattle Housing Authority, WA, 2.75%, 12/1/24 | | | 480 | | | | 492,936 | |
Seattle Housing Authority, WA, 2.875%, 12/1/25 | | | 900 | | | | 926,118 | |
Seattle Housing Authority, WA, 3.00%, 12/1/26 | | | 920 | | | | 945,990 | |
Seattle Housing Authority, WA, 3.125%, 12/1/27 | | | 935 | | | | 959,001 | |
Tennessee Housing Development Agency, 2.05%, 1/1/22 | | | 245 | | | | 245,240 | |
Tennessee Housing Development Agency, 2.80%, 7/1/26 | | | 250 | | | | 251,235 | |
Virginia Housing Development Authority,
1.70%, 5/1/22 | | | 845 | | | | 836,187 | |
Virginia Housing Development Authority,
1.85%, 5/1/23 | | | 820 | | | | 811,144 | |
Virginia Housing Development Authority,
1.95%, 11/1/23 | | | 295 | | | | 292,227 | |
Virginia Housing Development Authority,
2.25%, 5/1/25 | | | 170 | | | | 169,364 | |
Virginia Housing Development Authority,
2.40%, 5/1/26 | | | 420 | | | | 419,110 | |
Virginia Housing Development Authority,
2.55%, 5/1/27 | | | 730 | | | | 722,627 | |
Washington Housing Finance Commission, 2.05%, 6/1/24 | | | 310 | | | | 306,460 | |
Washington Housing Finance Commission, 2.25%, 6/1/25 | | | 355 | | | | 352,323 | |
| | | | |
| | 17 | | See Notes to Financial Statements. |
5-to-15 Year Laddered Municipal Bond Portfolio
July 31, 2018
Portfolio of Investments (Unaudited) — continued
| | | | | | | | |
| Security | | Principal
Amount
(000’s omitted) | | | Value | |
|
| Housing (continued) | |
Washington Housing Finance Commission, 2.30%, 12/1/25 | | $ | 130 | | | $ | 128,956 | |
Washington Housing Finance Commission, 2.40%, 6/1/26 | | | 105 | | | | 103,961 | |
| | | | $ | 18,141,093 | |
|
| Insured – Electric Utilities — 0.1% | |
Sienna Plantation Municipal Utility District No. 3, TX, (AGM), 5.00%, 3/1/30 | | $ | 500 | | | $ | 553,090 | |
| | | | $ | 553,090 | |
|
| Insured – General Obligations — 2.1% | |
Albertville, AL, (BAM), 4.00%, 6/1/28 | | $ | 1,230 | | | $ | 1,296,961 | |
Albertville, AL, (BAM), Series A, 4.00%, 6/1/30 | | | 1,605 | | | | 1,685,780 | |
Albertville, AL, (BAM), Series C, 4.00%, 6/1/30 | | | 610 | | | | 639,567 | |
Crawford County Unified School District No. 250, KS, (BAM), 5.00%, 9/1/26 | | | 250 | | | | 291,487 | |
Lakewood Township, NJ, (AGM),
4.00%, 11/1/25 | | | 1,175 | | | | 1,291,948 | |
Lakewood Township, NJ, (AGM),
4.00%, 11/1/26 | | | 1,250 | | | | 1,377,162 | |
New Britain, CT, (AGM), 5.00%, 3/1/32 | | | 1,000 | | | | 1,137,320 | |
New Britain, CT, (BAM), 5.00%, 3/1/23 | | | 165 | | | | 184,412 | |
New Britain, CT, (BAM), 5.00%, 3/1/24 | | | 200 | | | | 226,670 | |
New Britain, CT, (BAM), 5.00%, 3/1/25 | | | 135 | | | | 154,918 | |
New Britain, CT, (BAM), Escrowed to Maturity, 5.00%, 3/1/23 | | | 385 | | | | 435,489 | |
New Britain, CT, (BAM), Escrowed to Maturity, 5.00%, 3/1/24 | | | 350 | | | | 403,578 | |
New Britain, CT, (BAM), Escrowed to Maturity, 5.00%, 3/1/25 | | | 5 | | | | 5,827 | |
New Britain, CT, (BAM), Escrowed to Maturity, 5.00%, 3/1/25 | | | 260 | | | | 303,849 | |
Northern Palm Beach County Improvement District, FL, (AGM), 5.00%, 8/1/23 | | | 250 | | | | 280,313 | |
Ogle and Winnebago Counties Community Unit School District No. 223, IL, (BAM),
4.00%, 12/1/25 | | | 470 | | | | 498,571 | |
Ogle and Winnebago Counties Community Unit School District No. 223, IL, (BAM),
5.00%, 12/1/21 | | | 190 | | | | 206,733 | |
Ogle and Winnebago Counties Community Unit School District No. 223, IL, (BAM),
5.00%, 12/1/22 | | | 320 | | | | 353,600 | |
Ogle and Winnebago Counties Community Unit School District No. 223, IL, (BAM),
5.00%, 12/1/23 | | | 400 | | | | 447,908 | |
Ogle and Winnebago Counties Community Unit School District No. 223, IL, (BAM),
5.00%, 12/1/24 | | | 325 | | | | 366,405 | |
Pocono Mountain School District, PA, (AGM), 4.00%, 9/1/25 | | | 1,720 | | | | 1,874,783 | |
Pocono Mountain School District, PA, (AGM), 4.00%, 9/1/27 | | | 690 | | | | 746,380 | |
| | | | $ | 14,209,661 | |
|
| Insured – Lease Revenue / Certificates of Participation — 1.5% | |
Biloxi Public School District, MS, (BAM), 5.00%, 4/1/23 | | $ | 1,000 | | | $ | 1,122,970 | |
Biloxi Public School District, MS, (BAM), 5.00%, 4/1/25 | | | 1,500 | | | | 1,733,805 | |
Biloxi Public School District, MS, (BAM), 5.00%, 4/1/26 | | | 100 | | | | 116,727 | |
| | | | | | | | |
| Security | | Principal
Amount
(000’s omitted) | | | Value | |
|
| Insured – Lease Revenue / Certificates of Participation (continued) | |
Biloxi Public School District, MS, (BAM),
5.00%, 4/1/28 | | $ | 500 | | | $ | 573,895 | |
Biloxi Public School District, MS, (BAM),
5.00%, 4/1/29 | | | 1,235 | | | | 1,406,566 | |
Clermont County Port Authority, OH, (West Clermont Local School District), (BAM), 5.00%, 12/1/26 | | | 250 | | | | 286,568 | |
Clermont County Port Authority, OH, (West Clermont Local School District), (BAM), 5.00%, 12/1/29 | | | 100 | | | | 114,129 | |
Highlands County School Board, FL, (BAM), 5.00%, 3/1/23 | | | 500 | | | | 557,675 | |
Highlands County School Board, FL, (BAM), 5.00%, 3/1/26 | | | 400 | | | | 459,016 | |
Highlands County School Board, FL, (BAM), 5.00%, 3/1/27 | | | 200 | | | | 228,726 | |
Pasco County School Board, FL, (BAM),
5.00%, 8/1/23 | | | 255 | | | | 287,456 | |
Pasco County School Board, FL, (BAM),
5.00%, 8/1/24 | | | 410 | | | | 467,248 | |
Pasco County School Board, FL, (BAM),
5.00%, 8/1/25 | | | 305 | | | | 351,766 | |
Pasco County School Board, FL, (BAM),
5.00%, 8/1/26 | | | 355 | | | | 413,653 | |
Pasco County School Board, FL, (BAM),
5.00%, 8/1/27 | | | 605 | | | | 699,307 | |
Pasco County School Board, FL, (BAM),
5.00%, 8/1/28 | | | 410 | | | | 471,693 | |
Pasco County School Board, FL, (BAM),
5.00%, 8/1/29 | | | 510 | | | | 584,389 | |
| | | | $ | 9,875,589 | |
|
| Insured – Special Tax Revenue — 0.1% | |
Successor Agency to Yuba City Redevelopment Agency, CA, (AGM), 5.00%, 9/1/24 | | $ | 115 | | | $ | 133,658 | |
Successor Agency to Yuba City Redevelopment Agency, CA, (AGM), 5.00%, 9/1/25 | | | 420 | | | | 495,201 | |
| | | | $ | 628,859 | |
|
| Insured – Transportation — 0.3% | |
New Brunswick Parking Authority, NJ, (BAM), 5.00%, 9/1/23 | | $ | 440 | | | $ | 497,776 | |
New Brunswick Parking Authority, NJ, (BAM), 5.00%, 9/1/24 | | | 350 | | | | 401,622 | |
New Brunswick Parking Authority, NJ, (BAM), 5.00%, 9/1/25 | | | 500 | | | | 579,590 | |
New Brunswick Parking Authority, NJ, (BAM), 5.00%, 9/1/26 | | | 320 | | | | 369,146 | |
New Brunswick Parking Authority, NJ, (BAM), 5.00%, 9/1/27 | | | 375 | | | | 431,546 | |
| | | | $ | 2,279,680 | |
|
| Insured – Water and Sewer — 0.1% | |
Gulf Coast Waste Disposal Authority, TX, (AGM), 5.00%, 10/1/24 | | $ | 150 | | | $ | 171,385 | |
Gulf Coast Waste Disposal Authority, TX, (AGM), 5.00%, 10/1/30 | | | 250 | | | | 286,340 | |
| | | | $ | 457,725 | |
|
| Lease Revenue / Certificates of Participation — 8.6% | |
Adams County, CO, Certificates of Participation, 4.00%, 12/1/28 | | $ | 1,000 | | | $ | 1,077,620 | |
Broward County School Board, FL, 5.00%, 7/1/25 | | | 500 | | | | 582,010 | |
| | | | |
| | 18 | | See Notes to Financial Statements. |
5-to-15 Year Laddered Municipal Bond Portfolio
July 31, 2018
Portfolio of Investments (Unaudited) — continued
| | | | | | | | |
| Security | | Principal
Amount
(000’s omitted) | | | Value | |
|
| Lease Revenue / Certificates of Participation (continued) | |
Broward County School Board, FL,
5.00%, 7/1/27 | | $ | 500 | | | $ | 584,155 | |
Broward County School Board, FL,
5.00%, 7/1/29 | | | 500 | | | | 577,200 | |
Broward County School Board, FL,
5.00%, 7/1/30 | | | 400 | | | | 458,704 | |
Broward County School Board, FL,
5.00%, 7/1/31 | | | 600 | | | | 685,782 | |
Broward County School Board, FL, Series A, 5.00%, 7/1/23 | | | 500 | | | | 566,105 | |
Broward County School Board, FL, Series A, 5.00%, 7/1/24 | | | 1,250 | | | | 1,437,087 | |
Broward County School Board, FL, Series C, 5.00%, 7/1/23 | | | 2,500 | | | | 2,830,525 | |
Broward County School Board, FL, Series C, 5.00%, 7/1/24 | | | 2,000 | | | | 2,299,340 | |
California Public Works Board, 5.00%, 11/1/27 | | | 1,000 | | | | 1,197,590 | |
California Public Works Board, 5.00%, 11/1/28 | | | 1,000 | | | | 1,192,630 | |
California Public Works Board, 5.00%, 11/1/29 | | | 1,000 | | | | 1,187,690 | |
Canadian County Educational Facilities Authority, OK, (Mustang Public Schools), 5.00%, 9/1/26 | | | 500 | | | | 585,750 | |
Cleveland County Educational Facilities Authority, OK, (Noble Public Schools), 5.00%, 9/1/25 | | | 300 | | | | 345,444 | |
Colorado Department of Transportation,
5.00%, 6/15/30 | | | 350 | | | | 402,434 | |
Colorado Department of Transportation,
5.00%, 6/15/31 | | | 310 | | | | 355,266 | |
Commonwealth Financing Authority, PA, Tobacco Master Settlement Payment Revenue, 5.00%, 6/1/29 | | | 3,000 | | | | 3,433,200 | |
Commonwealth Financing Authority, PA, Tobacco Master Settlement Payment Revenue, 5.00%, 6/1/30 | | | 3,000 | | | | 3,419,640 | |
Costa Mesa Financing Authority, CA,
5.00%, 10/1/30 | | | 165 | | | | 196,210 | |
Costa Mesa Financing Authority, CA,
5.00%, 10/1/31 | | | 185 | | | | 218,674 | |
Costa Mesa Financing Authority, CA,
5.00%, 10/1/32 | | | 155 | | | | 182,251 | |
Costa Mesa Financing Authority, CA,
5.00%, 10/1/33 | | | 150 | | | | 175,580 | |
Cuyahoga County, OH, (Convention Hotel), 5.00%, 12/1/26 | | | 250 | | | | 280,245 | |
Eagle County, CO, Certificates of Participation, 5.00%, 12/1/26 | | | 200 | | | | 232,566 | |
Fountain Valley Public Financing Authority, CA, 4.00%, 11/1/23 | | | 135 | | | | 149,733 | |
Fountain Valley Public Financing Authority, CA, 4.00%, 11/1/24 | | | 550 | | | | 616,347 | |
Fountain Valley Public Financing Authority, CA, 4.00%, 11/1/25 | | | 570 | | | | 644,898 | |
Fountain Valley Public Financing Authority, CA, 4.00%, 11/1/26 | | | 595 | | | | 659,700 | |
Fountain Valley Public Financing Authority, CA, 4.00%, 11/1/27 | | | 620 | | | | 680,989 | |
Fountain Valley Public Financing Authority, CA, 4.00%, 11/1/28 | | | 645 | | | | 703,244 | |
Fountain Valley Public Financing Authority, CA, 4.00%, 11/1/29 | | | 675 | | | | 730,553 | |
Fountain Valley Public Financing Authority, CA, 4.00%, 11/1/30 | | | 700 | | | | 753,564 | |
Georgia Municipal Association, Inc., Certificates of Participation, (Atlanta Public Safety), 5.00%, 12/1/28 | | | 410 | | | | 480,659 | |
Kentucky Property and Buildings Commission, 5.00%, 4/1/27 | | | 1,710 | | | | 1,955,128 | |
Kentucky Property and Buildings Commission, 5.00%, 11/1/27 | | | 2,350 | | | | 2,687,342 | |
Lee County School Board, FL, Certificates of Participation, 5.00%, 8/1/32 | | | 1,495 | | | | 1,701,639 | |
Medina City School District, OH, 5.00%, 12/1/23 | | | 350 | | | | 396,204 | |
Medina City School District, OH, 5.00%, 12/1/24 | | | 400 | | | | 458,452 | |
Oklahoma County Finance Authority, OK, (Deer Creek Public Schools), 5.00%, 12/1/25 | | | 1,405 | | | | 1,623,182 | |
| | | | | | | | |
| Security | | Principal
Amount
(000’s omitted) | | | Value | |
|
| Lease Revenue / Certificates of Participation (continued) | |
Oklahoma County Finance Authority, OK, (Deer Creek Public Schools), 5.00%, 12/1/26 | | $ | 2,000 | | | $ | 2,291,940 | |
Oklahoma County Finance Authority, OK, (Midwest City-Del City Public Schools), 5.00%, 10/1/24 | | | 850 | | | | 969,621 | |
Oklahoma County Finance Authority, OK, (Midwest City-Del City Public Schools), 5.00%, 10/1/25 | | | 1,000 | | | | 1,154,500 | |
Oklahoma County Finance Authority, OK, (Midwest City-Del City Public Schools), 5.00%, 10/1/26 | | | 1,000 | | | | 1,156,370 | |
Oklahoma County Finance Authority, OK, (Western Heights Public Schools),
5.00%, 9/1/23 | | | 1,250 | | | | 1,405,825 | |
Orange County School Board, FL, 5.00%, 8/1/32 | | | 1,935 | | | | 2,205,126 | |
Pennington County, SD, Certificates of Participation, 5.00%, 6/1/27 | | | 1,300 | | | | 1,497,574 | |
Plymouth Intermediate District No. 287, MN, Certificates of Participation, 5.00%, 2/1/30 | | | 885 | | | | 1,021,201 | |
Public Finance Authority, WI, (KU Campus Development Corp.), 5.00%, 3/1/29 | | | 500 | | | | 569,890 | |
Riverside County Public Financing Authority, CA, 5.00%, 11/1/27 | | | 850 | | | | 990,029 | |
Riverside County Public Financing Authority, CA, 5.00%, 11/1/28 | | | 950 | | | | 1,101,724 | |
San Francisco City and County, CA, (City Office Buildings), 4.00%, 9/1/29 | | | 1,075 | | | | 1,152,002 | |
South Dakota Building Authority, 5.00%, 6/1/26 | | | 500 | | | | 588,770 | |
South Dakota Building Authority, 5.00%, 6/1/27 | | | 635 | | | | 723,938 | |
South Dakota Building Authority, 5.00%, 6/1/28 | | | 210 | | | | 241,775 | |
South Dakota Building Authority, Series 2015B, 5.00%, 6/1/30 | | | 200 | | | | 228,914 | |
St. Charles County Public Water Supply District No. 2, MO, 3.00%, 12/1/24 | | | 650 | | | | 667,290 | |
Tulsa County Industrial Authority, OK, (Broken Arrow Public Schools), 5.00%, 9/1/23 | | | 500 | | | | 569,005 | |
| | | | $ | 57,280,826 | |
|
| Other Revenue — 4.1% | |
California Infrastructure and Economic Development Bank, (The J. Paul Getty Trust), 1.664%, (70% of 1 mo. USD LIBOR + 0.20%), 4/1/21 (Put Date), 10/1/47(3) | | $ | 2,500 | | | $ | 2,504,125 | |
District of Columbia, (National Public Radio, Inc.), 5.00%, 4/1/28 | | | 1,000 | | | | 1,146,300 | |
District of Columbia, (National Public Radio, Inc.), 5.00%, 4/1/29 | | | 1,000 | | | | 1,141,130 | |
Fulton County Development Authority, GA, (Robert W. Woodruff Arts Center, Inc.), 5.00%, 3/15/24 | | | 600 | | | | 676,488 | |
Hyland Hills Park & Recreation District, CO, 5.00%, 12/15/24 | | | 150 | | | | 172,236 | |
Hyland Hills Park & Recreation District, CO, 5.00%, 12/15/25 | | | 155 | | | | 180,248 | |
Hyland Hills Park & Recreation District, CO, 5.00%, 12/15/26 | | | 150 | | | | 176,054 | |
| | | | |
| | 19 | | See Notes to Financial Statements. |
5-to-15 Year Laddered Municipal Bond Portfolio
July 31, 2018
Portfolio of Investments (Unaudited) — continued
| | | | | | | | |
| Security | | Principal
Amount
(000’s omitted) | | | Value | |
|
| Other Revenue (continued) | |
Louisiana Local Government Environmental Facilities and Community Development Authority, (Jefferson Parish), 5.00%, 4/1/27 | | $ | 500 | | | $ | 575,010 | |
Louisiana Local Government Environmental Facilities and Community Development Authority, (Jefferson Parish), 5.00%, 4/1/29 | | | 500 | | | | 568,725 | |
Mississippi Development Bank, Special Obligation Bond, (Jackson Public School District), 5.00%, 4/1/25 | | | 1,270 | | | | 1,455,344 | |
Patriots Energy Group Financing Agency, SC, Gas Supply Revenue, 4.00% to 2/1/24 (Put Date), 10/1/48(4) | | | 8,500 | | | | 9,033,970 | |
Rhode Island Health and Educational Building Corp., (Barrington), 5.00%, 5/15/28 | | | 1,060 | | | | 1,264,145 | |
Spartanburg County School District No. 7, SC, Special Obligation Bonds, 5.00%, 12/1/24 | | | 500 | | | | 575,915 | |
Virginia Resources Authority, 5.00%, 11/1/28 | | | 3,135 | | | | 3,570,984 | |
Wisconsin, Environmental Improvement Fund Revenue, 5.00%, 6/1/31 | | | 2,500 | | | | 2,896,925 | |
Wisconsin, Environmental Improvement Fund Revenue, 5.00%, 6/1/32 | | | 1,000 | | | | 1,156,730 | |
| | | | $ | 27,094,329 | |
|
| Senior Living / Life Care — 3.5% | |
Bexar County Health Facilities Development Corp., TX, (Army Retirement Residence Foundation), 5.00%, 7/15/33 | | $ | 1,500 | | | $ | 1,640,610 | |
Buffalo and Erie County Industrial Land Development Corp., NY, (Orchard Park CCRC, Inc.), 5.00%, 11/15/28 | | | 50 | | | | 55,703 | |
Buffalo and Erie County Industrial Land Development Corp., NY, (Orchard Park CCRC, Inc.), 5.00%, 11/15/30 | | | 100 | | | | 110,516 | |
California Statewide Communities Development Authority, (American Baptist Homes of the West), 5.00%, 10/1/22 | | | 250 | | | | 275,395 | |
California Statewide Communities Development Authority, (American Baptist Homes of the West), 5.00%, 10/1/25 | | | 100 | | | | 113,909 | |
Cumberland County Municipal Authority, PA, (Diakon Lutheran Social Ministries),
2.50%, 1/1/26 | | | 640 | | | | 619,693 | |
Cumberland County Municipal Authority, PA, (Diakon Lutheran Social Ministries),
5.00%, 1/1/25 | | | 1,175 | | | | 1,322,098 | |
Cumberland County Municipal Authority, PA, (Diakon Lutheran Social Ministries),
5.00%, 1/1/27 | | | 1,035 | | | | 1,167,987 | |
Cumberland County Municipal Authority, PA, (Diakon Lutheran Social Ministries),
5.00%, 1/1/30 | | | 645 | | | | 717,472 | |
Cumberland County Municipal Authority, PA, (Diakon Lutheran Social Ministries),
5.00%, 1/1/31 | | | 500 | | | | 553,060 | |
East Hempfield Township Industrial Development Authority, PA, (Willow Valley Communities), 5.00%, 12/1/21 | | | 250 | | | | 272,607 | |
East Hempfield Township Industrial Development Authority, PA, (Willow Valley Communities), 5.00%, 12/1/31 | | | 250 | | | | 277,290 | |
Fulton County Residential Care Facilities for the Elderly Authority, GA, (Lenbrook Square Foundation, Inc.), 4.00%, 7/1/24 | | | 630 | | | | 664,946 | |
| | | | | | | | |
| Security | | Principal
Amount
(000’s omitted) | | | Value | |
|
| Senior Living / Life Care (continued) | |
Fulton County Residential Care Facilities for the Elderly Authority, GA, (Lenbrook Square Foundation, Inc.), 4.00%, 7/1/26 | | $ | 500 | | | $ | 529,195 | |
Glendale Industrial Development Authority, AZ, (Royal Oaks Life Care Community),
4.00%, 5/15/24 | | | 675 | | | | 727,697 | |
Glendale Industrial Development Authority, AZ, (Royal Oaks Life Care Community),
4.00%, 5/15/25 | | | 500 | | | | 540,365 | |
Illinois Finance Authority, (Presbyterian Homes Obligated Group), 5.00%, 5/1/21 | | | 325 | | | | 347,682 | |
Illinois Finance Authority, (Presbyterian Homes Obligated Group), 5.00%, 5/1/22 | | | 225 | | | | 244,825 | |
Illinois Finance Authority, (Presbyterian Homes Obligated Group), 5.00%, 5/1/23 | | | 225 | | | | 247,797 | |
Illinois Finance Authority, (Presbyterian Homes Obligated Group), 5.00%, 5/1/24 | | | 480 | | | | 533,794 | |
Illinois Finance Authority, (Presbyterian Homes Obligated Group), 5.00%, 11/1/27 | | | 250 | | | | 280,072 | |
Illinois Finance Authority, (Presbyterian Homes Obligated Group), 5.00%, 11/1/28 | | | 250 | | | | 278,545 | |
Missouri Health and Educational Facilities Authority, (Lutheran Senior Services), 3.00%, 2/1/27 | | | 1,000 | | | | 985,960 | |
Missouri Health and Educational Facilities Authority, (Lutheran Senior Services), 5.00%, 2/1/23 | | | 600 | | | | 659,142 | |
Missouri Health and Educational Facilities Authority, (Lutheran Senior Services), 5.00%, 2/1/24 | | | 440 | | | | 488,057 | |
Missouri Health and Educational Facilities Authority, (Lutheran Senior Services), 5.00%, 2/1/26 | | | 385 | | | | 433,602 | |
Missouri Health and Educational Facilities Authority, (Lutheran Senior Services), 5.00%, 2/1/28 | | | 250 | | | | 278,025 | |
Missouri Health and Educational Facilities Authority, (Lutheran Senior Services), 5.00%, 2/1/29 | | | 600 | | | | 663,060 | |
Missouri Health and Educational Facilities Authority, (Lutheran Senior Services), 5.00%, 2/1/30 | | | 200 | | | | 220,326 | |
Missouri Health and Educational Facilities Authority, (Lutheran Senior Services), 5.00%, 2/1/31 | | | 250 | | | | 274,715 | |
New Hope Cultural Education Facilities Finance Corp., TX, (Westminster), 5.00%, 11/1/22 | | | 175 | | | | 191,926 | |
New Hope Cultural Education Facilities Finance Corp., TX, (Westminster), 5.00%, 11/1/28 | | | 590 | | | | 654,021 | |
North Carolina Medical Care Commission, (United Methodist Retirement Homes), 5.00%, 10/1/23 | | | 150 | | | | 168,443 | |
North Carolina Medical Care Commission, (United Methodist Retirement Homes), 5.00%, 10/1/24 | | | 150 | | | | 170,742 | |
North Carolina Medical Care Commission, (United Methodist Retirement Homes), 5.00%, 10/1/25 | | | 100 | | | | 113,678 | |
North Carolina Medical Care Commission, (United Methodist Retirement Homes), 5.00%, 10/1/26 | | | 100 | | | | 112,948 | |
North Carolina Medical Care Commission, (United Methodist Retirement Homes), 5.00%, 10/1/27 | | | 50 | | | | 56,267 | |
| | | | |
| | 20 | | See Notes to Financial Statements. |
5-to-15 Year Laddered Municipal Bond Portfolio
July 31, 2018
Portfolio of Investments (Unaudited) — continued
| | | | | | | | |
| Security | | Principal
Amount
(000’s omitted) | | | Value | |
|
| Senior Living / Life Care (continued) | |
North Carolina Medical Care Commission, (United Methodist Retirement Homes), 5.00%, 10/1/29 | | $ | 125 | | | $ | 139,703 | |
North Carolina Medical Care Commission, (United Methodist Retirement Homes), 5.00%, 10/1/32 | | | 225 | | | | 249,970 | |
North Carolina Medical Care Commission, (United Methodist Retirement Homes), Series 2016A, 5.00%, 10/1/30 | | | 200 | | | | 224,150 | |
North Carolina Medical Care Commission, (United Methodist Retirement Homes), Series 2016A, 5.00%, 10/1/31 | | | 675 | | | | 753,948 | |
North Carolina Medical Care Commission, (United Methodist Retirement Homes), Series 2017A, 5.00%, 10/1/30 | | | 250 | | | | 278,765 | |
North Carolina Medical Care Commission, (United Methodist Retirement Homes), Series 2017A, 5.00%, 10/1/31 | | | 175 | | | | 194,779 | |
Sarasota County Health Facilities Authority, FL, (Village on the Isle), 5.00%, 1/1/22 | | | 375 | | | | 401,801 | |
Sarasota County Health Facilities Authority, FL, (Village on the Isle), 5.00%, 1/1/23 | | | 865 | | | | 938,611 | |
Sarasota County Health Facilities Authority, FL, (Village on the Isle), 5.00%, 1/1/25 | | | 750 | | | | 825,870 | |
Warren County, OH, (Otterbein Homes Obligated Group), 5.00%, 7/1/23 | | | 200 | | | | 223,178 | |
Warren County, OH, (Otterbein Homes Obligated Group), 5.00%, 7/1/27 | | | 250 | | | | 283,852 | |
Warren County, OH, (Otterbein Homes Obligated Group), 5.00%, 7/1/29 | | | 440 | | | | 493,341 | |
Warren County, OH, (Otterbein Homes Obligated Group), 5.00%, 7/1/30 | | | 475 | | | | 530,827 | |
Warren County, OH, (Otterbein Homes Obligated Group), 5.00%, 7/1/31 | | | 470 | | | | 523,162 | |
| | | | $ | 23,054,127 | |
|
| Special Tax Revenue — 4.3% | |
Atlanta Development Authority, GA, (New Downtown Atlanta Stadium), 5.00%, 7/1/26 | | $ | 100 | | | $ | 115,438 | |
Atlanta, GA, (Atlantic Station), Tax Allocation Increments, 5.00%, 12/1/23 | | | 1,000 | | | | 1,125,070 | |
Atlanta, GA, (Atlantic Station), Tax Allocation Increments, 5.00%, 12/1/24 | | | 880 | | | | 1,002,514 | |
Atlanta, GA, Tax Allocation Increments,
5.00%, 1/1/23 | | | 260 | | | | 289,299 | |
Atlanta, GA, Tax Allocation Increments,
5.00%, 1/1/24 | | | 115 | | | | 129,657 | |
Atlanta, GA, Tax Allocation Increments,
5.00%, 1/1/25 | | | 150 | | | | 170,948 | |
Atlanta, GA, Tax Allocation Increments,
5.00%, 1/1/27 | | | 300 | | | | 342,180 | |
Atlanta, GA, Tax Allocation Increments,
5.00%, 1/1/28 | | | 300 | | | | 340,893 | |
Atlanta, GA, Tax Allocation Increments,
5.00%, 1/1/29 | | | 100 | | | | 113,133 | |
Cape Coral, FL, Special Obligation Bonds, 5.00%, 10/1/23 | | | 500 | | | | 569,805 | |
Cuyahoga County, OH, Excise Tax Revenue, 5.00%, 12/1/23 | | | 500 | | | | 566,540 | |
Escambia County School Board, FL, Sales Tax Revenue, 5.00%, 9/1/26 | | | 450 | | | | 527,175 | |
| | | | | | | | |
| Security | | Principal
Amount
(000’s omitted) | | | Value | |
|
| Special Tax Revenue (continued) | |
Escambia County School Board, FL, Sales Tax Revenue, 5.00%, 9/1/27 | | $ | 650 | | | $ | 756,333 | |
Lafayette, LA, Sales Tax Revenue,
5.00%, 3/1/31 | | | 300 | | | | 343,134 | |
Los Angeles County Metropolitan Transportation Authority, CA, Sales Tax Revenue,
5.00%, 6/1/31 | | | 1,000 | | | | 1,181,440 | |
Los Angeles County Metropolitan Transportation Authority, CA, Sales Tax Revenue,
5.00%, 6/1/32 | | | 500 | | | | 588,770 | |
Miami-Dade County, FL, Special Obligation Bonds, 5.00%, 4/1/25 | | | 250 | | | | 291,980 | |
Miami-Dade County, FL, Special Obligation Bonds, 5.00%, 4/1/26 | | | 1,025 | | | | 1,211,304 | |
Miami-Dade County, FL, Special Obligation Bonds, 5.00%, 4/1/29 | | | 900 | | | | 1,054,638 | |
Miami-Dade County, FL, Special Obligation Bonds, 5.00%, 4/1/30 | | | 950 | | | | 1,106,750 | |
Miami-Dade County, FL, Special Obligation Bonds, 5.00%, 4/1/31 | | | 895 | | | | 1,035,273 | |
Miami-Dade County, FL, Special Obligation Bonds, 5.00%, 4/1/32 | | | 735 | | | | 844,713 | |
Miami-Dade County, FL, Special Obligation Bonds, 5.00%, 10/1/32 | | | 1,200 | | | | 1,316,400 | |
Mississippi Development Bank, Special Obligation Bonds, (Hinds County School District), 4.00%, 3/1/23 | | | 250 | | | | 267,698 | |
Mississippi Development Bank, Special Obligation Bonds, (Hinds County School District), 4.00%, 3/1/25 | | | 470 | | | | 507,783 | |
Mississippi Development Bank, Special Obligation Bonds, (Hinds County School District), 4.00%, 3/1/27 | | | 500 | | | | 541,505 | |
Mississippi Development Bank, Special Obligation Bonds, (Hinds County School District), 4.00%, 3/1/28 | | | 350 | | | | 378,647 | |
Mississippi Development Bank, Special Obligation Bonds, (Hinds County School District), 4.00%, 3/1/29 | | | 720 | | | | 772,726 | |
New York Dormitory Authority, Sales Tax Revenue, 5.00%, 3/15/32 | | | 1,800 | | | | 2,076,552 | |
New York, NY, Transitional Finance Authority, Future Tax Revenue, 5.00%, 8/1/33 | | | 1,340 | | | | 1,521,503 | |
Oregon Department of Transportation, Highway User Tax Revenue, 5.00%, 11/15/31 | | | 1,400 | | | | 1,605,002 | |
Scottsdale Municipal Property Corp., AZ, Excise Tax Revenue, 5.00%, 7/1/32 | | | 2,400 | | | | 2,834,664 | |
St. Lucie County, FL, Special Tax Revenue, 5.00%, 10/1/30 | | | 1,000 | | | | 1,171,410 | |
Successor Agency to San Mateo Redevelopment Agency, CA, 5.00%, 8/1/26 | | | 100 | | | | 114,575 | |
Successor Agency to San Mateo Redevelopment Agency, CA, 5.00%, 8/1/29 | | | 140 | | | | 159,354 | |
Tri-County Metropolitan Transportation District, OR, Payroll Tax Revenue, 5.00%, 9/1/32 | | | 1,000 | | | | 1,165,160 | |
Tustin Community Facilities District No. 06-1, CA, (Tustin Legacy/Columbus Villages), 5.00%, 9/1/28 | | | 250 | | | | 284,583 | |
| | | | $ | 28,424,549 | |
| | | | |
| | 21 | | See Notes to Financial Statements. |
5-to-15 Year Laddered Municipal Bond Portfolio
July 31, 2018
Portfolio of Investments (Unaudited) — continued
| | | | | | | | |
| Security | | Principal
Amount
(000’s omitted) | | | Value | |
|
| Transportation — 10.3% | |
Alameda Corridor Transportation Authority, CA, 4.00%, 10/1/23 | | $ | 250 | | | $ | 269,565 | |
Alameda Corridor Transportation Authority, CA, 5.00%, 10/1/24 | | | 250 | | | | 285,335 | |
Bay Area Toll Authority, CA, (San Francisco Bay Area), 2.10% to 4/1/22 (Put Date), 4/1/45 | | | 2,000 | | | | 2,012,820 | |
Bay Area Toll Authority, CA, (San Francisco Bay Area), 2.95% to 4/1/26 (Put Date), 4/1/47 | | | 1,800 | | | | 1,868,382 | |
Chicago, IL, (O’Hare International Airport), 5.00%, 1/1/25 | | | 100 | | | | 115,691 | |
Chicago, IL, (O’Hare International Airport), 5.00%, 1/1/26 | | | 1,000 | | | | 1,165,260 | |
Chicago, IL, (O’Hare International Airport), 5.00%, 1/1/28 | | | 150 | | | | 168,873 | |
Chicago, IL, (O’Hare International Airport), 5.00%, 1/1/29 | | | 150 | | | | 168,498 | |
Chicago, IL, (O’Hare International Airport), 5.00%, 1/1/30 | | | 500 | | | | 560,415 | |
Chicago, IL, (O’Hare International Airport), 5.00%, 1/1/31 | | | 1,000 | | | | 1,118,350 | |
Chicago, IL, (O’Hare International Airport), 5.00%, 1/1/33 | | | 500 | | | | 556,395 | |
Chicago, IL, (O’Hare International Airport), 5.25%, 1/1/28 | | | 2,905 | | | | 3,435,162 | |
Chicago, IL, (O’Hare International Airport), 5.25%, 1/1/29 | | | 3,060 | | | | 3,593,389 | |
Chicago, IL, (O’Hare International Airport), 5.25%, 1/1/30 | | | 1,000 | | | | 1,167,000 | |
Chicago, IL, (O’Hare International Airport), 5.25%, 1/1/31 | | | 1,000 | | | | 1,162,960 | |
Chicago, IL, (O’Hare International Airport), 5.25%, 1/1/32 | | | 2,565 | | | | 2,976,785 | |
Chicago, IL, (O’Hare International Airport), Series 2015B, 5.00%, 1/1/24 | | | 200 | | | | 228,760 | |
Chicago, IL, (O’Hare International Airport), Series 2016B, 5.00%, 1/1/24 | | | 500 | | | | 571,900 | |
Chicago, IL, (O’Hare International Airport), Series 2016B, 5.00%, 1/1/25 | | | 1,000 | | | | 1,156,910 | |
Clark County, NV, Highway Revenue,
5.00%, 7/1/33 | | | 3,000 | | | | 3,362,550 | |
Commonwealth Transportation Board, VA, 5.00%, 9/15/30 | | | 1,240 | | | | 1,451,581 | |
Dallas and Fort Worth, TX, (Dallas/Fort Worth International Airport), 5.00%, 11/1/30 | | | 2,545 | | | | 2,714,777 | |
Denver City and County, CO, Airport System Revenue, 5.00%, 11/15/23 | | | 1,000 | | | | 1,144,350 | |
Denver City and County, CO, Airport System Revenue, 5.00%, 11/15/24 | | | 650 | | | | 756,697 | |
Denver City and County, CO, Airport System Revenue, 5.00%, 11/15/25 | | | 625 | | | | 736,212 | |
Denver City and County, CO, Airport System Revenue, 5.00%, 11/15/31 | | | 1,650 | | | | 1,914,066 | |
Denver City and County, CO, Airport System Revenue, 5.00%, 11/15/32 | | | 2,200 | | | | 2,541,550 | |
E-470 Public Highway Authority, CO,
5.375%, 9/1/26 | | | 3,465 | | | | 3,704,293 | |
Fort Bend County, TX, Toll Road Revenue, 5.00%, 3/1/23 | | | 150 | | | | 167,648 | |
Fort Bend County, TX, Toll Road Revenue, 5.00%, 3/1/24 | | | 195 | | | | 220,894 | |
Fort Bend County, TX, Toll Road Revenue, 5.00%, 3/1/28 | | | 500 | | | | 566,965 | |
Fort Bend County, TX, Toll Road Revenue, 5.00%, 3/1/29 | | | 1,000 | | | | 1,129,430 | |
Fort Bend County, TX, Toll Road Revenue, 5.00%, 3/1/30 | | | 750 | | | | 844,200 | |
Idaho Housing and Finance Association, Federal Highway Trust Fund, 5.00%, 7/15/25 | | | 650 | | | | 753,558 | |
| | | | | | | | |
| Security | | Principal
Amount
(000’s omitted) | | | Value | |
|
| Transportation (continued) | |
Illinois Toll Highway Authority, 5.00%, 1/1/29 | | $ | 175 | | | $ | 201,115 | |
Illinois Toll Highway Authority, 5.00%, 12/1/32 | | | 350 | | | | 395,469 | |
Kentucky Asset/Liability Commission, 2015 Federal Highway Trust Fund, 5.00%, 9/1/24 | | | 250 | | | | 285,805 | |
Kentucky Turnpike Authority, 5.00%, 7/1/33 | | | 500 | | | | 555,495 | |
Maryland Department of Transportation,
4.00%, 2/1/29 | | | 5,000 | | | | 5,312,750 | |
Metropolitan Transportation Authority, NY, 5.00%, 11/15/23 | | | 500 | | | | 571,100 | |
Metropolitan Transportation Authority, NY, 5.00%, 11/15/24 | | | 500 | | | | 578,260 | |
Metropolitan Transportation Authority, NY, 5.00%, 11/15/25 | | | 500 | | | | 583,500 | |
Metropolitan Transportation Authority, NY, 5.00%, 11/15/26 | | | 1,000 | | | | 1,176,200 | |
Metropolitan Transportation Authority, NY, 5.00%, 11/15/41 | | | 415 | | | | 455,135 | |
Miami-Dade County, FL, Seaport Revenue, 5.00%, 10/1/23 | | | 130 | | | | 145,114 | |
New Jersey Turnpike Authority, 5.00%, 1/1/33 | | | 500 | | | | 580,140 | |
New Orleans Aviation Board, LA, 5.00%, 1/1/28 | | | 150 | | | | 175,071 | |
New Orleans Aviation Board, LA, 5.00%, 1/1/31 | | | 190 | | | | 218,677 | |
North Carolina, (Federal-Aid Highway Projects), 5.00%, 3/1/23 | | | 750 | | | | 845,197 | |
North Carolina, (Federal-Aid Highway Projects), 5.00%, 3/1/29 | | | 550 | | | | 627,214 | |
North Carolina, (Federal-Aid Highway Projects), 5.00%, 3/1/30 | | | 400 | | | | 454,860 | |
Oklahoma Capitol Improvement Authority, 5.00%, 7/1/29 | | | 1,000 | | | | 1,154,400 | |
Port of Seattle, WA, 5.00%, 3/1/24 | | | 250 | | | | 285,298 | |
Port of Seattle, WA, 5.00%, 3/1/25 | | | 150 | | | | 172,215 | |
Port of Seattle, WA, 5.00%, 3/1/27 | | | 250 | | | | 285,350 | |
Port of Seattle, WA, 5.00%, 3/1/29 | | | 250 | | | | 283,840 | |
Salt Lake City, UT, (Salt Lake City International Airport), 5.00%, 7/1/27 | | | 300 | | | | 358,266 | |
Salt Lake City, UT, (Salt Lake City International Airport), 5.00%, 7/1/28 | | | 1,370 | | | | 1,622,888 | |
Texas Transportation Commission, 4.00% to 10/1/21 (Put Date), 4/1/26 | | | 1,860 | | | | 1,972,865 | |
Texas Transportation Commission,
5.00%, 4/1/33 | | | 50 | | | | 56,816 | |
Wisconsin, Transportation Revenue,
5.00%, 7/1/31 | | | 3,450 | | | | 3,933,552 | |
Wisconsin, Transportation Revenue,
5.00%, 7/1/32 | | | 700 | | | | 796,460 | |
| | | | $ | 68,674,273 | |
|
| Water and Sewer — 4.4% | |
Boston Water and Sewer Commission, MA, 5.00%, 11/1/31 | | $ | 450 | | | $ | 510,197 | |
Buffalo Municipal Water Finance Authority, NY, 5.00%, 7/1/25 | | | 300 | | | | 347,964 | |
Buffalo Municipal Water Finance Authority, NY, 5.00%, 7/1/29 | | | 115 | | | | 131,189 | |
Buffalo Municipal Water Finance Authority, NY, 5.00%, 7/1/30 | | | 100 | | | | 113,538 | |
Jacksonville, NC, Enterprise Systems Revenue, 5.00%, 5/1/27 | | | 700 | | | | 827,652 | |
Kentucky Infrastructure Authority, Wastewater and Drinking Water Revolving Fund Revenue, 5.00%, 2/1/28 | | | 500 | | | | 584,975 | |
Lancaster, OH, Wastewater System Revenue, 4.00%, 12/1/26 | | | 205 | | | | 225,186 | |
Lancaster, OH, Wastewater System Revenue, 4.00%, 12/1/27 | | | 250 | | | | 271,823 | |
Lancaster, OH, Wastewater System Revenue, 4.00%, 12/1/28 | | | 670 | | | | 720,625 | |
| | | | |
| | 22 | | See Notes to Financial Statements. |
5-to-15 Year Laddered Municipal Bond Portfolio
July 31, 2018
Portfolio of Investments (Unaudited) — continued
| | | | | | | | |
| Security | | Principal
Amount
(000’s omitted) | | | Value | |
|
| Water and Sewer (continued) | |
Los Angeles Department of Water and Power, CA, Water System Revenue, (SPA: Royal Bank of Canada), 0.53%, 7/1/35(2) | | $ | 5,000 | | | $ | 5,000,000 | |
Marin Public Financing Authority, CA, (Sausalito-Marin City Sanitary District), 4.00%, 4/1/31 | | | 130 | | | | 143,503 | |
Marin Public Financing Authority, CA, (Sausalito-Marin City Sanitary District), 4.00%, 4/1/32 | | | 875 | | | | 954,555 | |
Marysville, OH, Water System Revenue, 4.00%, 12/1/25 | | | 250 | | | | 275,145 | |
Marysville, OH, Water System Revenue, 4.00%, 12/1/27 | | | 180 | | | | 195,962 | |
Mesa, AZ, Utility Systems Revenue,
5.00%, 7/1/27 | | | 600 | | | | 705,672 | |
Mesa, AZ, Utility Systems Revenue,
5.00%, 7/1/29 | | | 500 | | | | 582,990 | |
Mesa, AZ, Utility Systems Revenue,
5.00%, 7/1/30 | | | 600 | | | | 697,266 | |
New York City Municipal Water Finance Authority, NY, (Water and Sewer System), (SPA: Barclays Bank PLC), 1.50%, 6/15/50(5) | | | 5,000 | | | | 5,000,000 | |
New York City Municipal Water Finance Authority, NY, (Water and Sewer System), (SPA: Royal Bank of Canada), 0.94%, 6/15/23(2) | | | 5,000 | | | | 5,000,000 | |
Rapid City, SD, Water Revenue,
4.00%, 11/1/29 | | | 600 | | | | 649,776 | |
Rapid City, SD, Water Revenue,
4.00%, 11/1/30 | | | 670 | | | | 723,298 | |
Rapid City, SD, Water Revenue,
5.00%, 11/1/26 | | | 1,000 | | | | 1,164,740 | |
Rapid City, SD, Water Revenue,
5.00%, 11/1/27 | | | 515 | | | | 597,987 | |
Santa Fe, NM, Water Utility System Revenue, 4.00%, 6/1/30 | | | 365 | | | | 393,996 | |
Santa Fe, NM, Water Utility System Revenue, 4.00%, 6/1/31 | | | 450 | | | | 482,481 | |
St. Joseph Industrial Development Authority, MO, (Sewerage System Improvements), 5.00%, 4/1/26 | | | 500 | | | | 574,290 | |
Tallahassee, FL, Consolidated Utility Systems Revenue, 5.00%, 10/1/33 | | | 1,000 | | | | 1,138,890 | |
Wyoming, MI, Water Supply System Revenue, 4.00%, 6/1/29 | | | 135 | | | | 143,000 | |
Wyoming, MI, Water Supply System Revenue, 4.00%, 6/1/30 | | | 105 | | | | 110,699 | |
Wyoming, MI, Water Supply System Revenue, 5.00%, 6/1/25 | | | 210 | | | | 241,492 | |
Wyoming, MI, Water Supply System Revenue, 5.00%, 6/1/27 | | | 505 | | | | 580,700 | |
Wyoming, MI, Water Supply System Revenue, 5.00%, 6/1/28 | | | 550 | | | | 629,128 | |
| | | | $ | 29,718,719 | |
| | |
Total Tax-Exempt Investments — 97.5%
(identified cost $648,718,641) | | | | | | $ | 649,830,850 | |
| |
Other Assets, Less Liabilities — 2.5% | | | $ | 16,867,541 | |
| |
Net Assets — 100.0% | | | $ | 666,698,391 | |
The percentage shown for each investment category in the Portfolio of Investments is based on net assets.
At July 31, 2018, the concentration of the Portfolio’s investments in the various states, determined as a percentage of net assets, is as follows:
| | | | |
| California | | | 10.5% | |
| Others, representing less than 10% individually | | | 87.0% | |
The Portfolio invests primarily in debt securities issued by municipalities. The ability of the issuers of the debt securities to meet their obligations may be affected by economic developments in a specific industry or municipality. In order to reduce the risk associated with such economic developments, at July 31, 2018, 4.3% of total investments are backed by bond insurance of various financial institutions and financial guaranty assurance agencies. The aggregate percentage insured by an individual financial institution or financial guaranty assurance agency ranged from 1.3% to 3.0% of total investments.
| (1) | Amount is less than 0.05%. |
| (2) | Variable rate demand obligation that may be tendered at par on any day for payment the lesser of 5 business days or 7 calendar days. The stated interest rate, which generally resets weekly, is determined by the remarketing agent and represents the rate in effect at July 31, 2018. |
| (3) | Floating rate security. The stated interest rate represents the rate in effect at July 31, 2018. |
| (4) | When-issued security. |
| (5) | Variable rate demand obligation that may be tendered at par on any day for payment the same or next business day. The stated interest rate, which generally resets daily, is determined by the remarketing agent and represents the rate in effect at July 31, 2018. |
Abbreviations:
| | | | |
| AGM | | – | | Assured Guaranty Municipal Corp. |
| BAM | | – | | Build America Mutual Assurance Co. |
| FHLMC | | – | | Federal Home Loan Mortgage Corp. |
| FNMA | | – | | Federal National Mortgage Association |
| GNMA | | – | | Government National Mortgage Association |
| LIBOR | | – | | London Interbank Offered Rate |
| LOC | | – | | Letter of Credit |
| PSF | | – | | Permanent School Fund |
| SPA | | – | | Standby Bond Purchase Agreement |
Currency Abbreviations:
| | | | |
| USD | | – | | United States Dollar |
| | | | |
| | 23 | | See Notes to Financial Statements. |
5-to-15 Year Laddered Municipal Bond Portfolio
July 31, 2018
Statement of Assets and Liabilities (Unaudited)
| | | | |
| Assets | | July 31, 2018 | |
Unaffiliated investments, at value (identified cost, $648,718,641) | | $ | 649,830,850 | |
Cash | | | 18,853,118 | |
Interest receivable | | | 6,681,611 | |
Receivable for investments sold | | | 611,518 | |
Receivable from affiliate | | | 12,576 | |
Total assets | | $ | 675,989,673 | |
|
| Liabilities | |
Payable for when-issued securities | | $ | 9,025,470 | |
Payable to affiliates: | | | | |
Investment adviser fee | | | 181,333 | |
Accrued expenses | | | 84,479 | |
Total liabilities | | $ | 9,291,282 | |
Net Assets applicable to investors’ interest in Portfolio | | $ | 666,698,391 | |
|
| Sources of Net Assets | |
Investors’ capital | | $ | 665,586,182 | |
Net unrealized appreciation | | | 1,112,209 | |
Total | | $ | 666,698,391 | |
| | | | |
| | 24 | | See Notes to Financial Statements. |
5-to-15 Year Laddered Municipal Bond Portfolio
July 31, 2018
Statement of Operations (Unaudited)
| | | | |
| Investment Income | | Six Months Ended July 31, 2018 | |
Interest | | $ | 8,291,488 | |
Total investment income | | $ | 8,291,488 | |
|
| Expenses | |
Investment adviser fee | | $ | 1,062,156 | |
Trustees’ fees and expenses | | | 14,623 | |
Custodian fee | | | 90,339 | |
Legal and accounting services | | | 28,117 | |
Miscellaneous | | | 9,197 | |
Total expenses | | $ | 1,204,432 | |
Deduct — | |
Allocation of expenses to affiliate | | $ | 42,699 | |
Total expense reductions | | $ | 42,699 | |
| |
Net expenses | | $ | 1,161,733 | |
| |
Net investment income | | $ | 7,129,755 | |
|
| Realized and Unrealized Gain (Loss) | |
Net realized gain (loss) — | |
Investment transactions | | $ | (3,989,731 | ) |
Net realized loss | | $ | (3,989,731 | ) |
Change in unrealized appreciation (depreciation) — | |
Investments | | $ | 2,828,793 | |
Net change in unrealized appreciation (depreciation) | | $ | 2,828,793 | |
| |
Net realized and unrealized loss | | $ | (1,160,938 | ) |
| |
Net increase in net assets from operations | | $ | 5,968,817 | |
| | | | |
| | 25 | | See Notes to Financial Statements. |
5-to-15 Year Laddered Municipal Bond Portfolio
July 31, 2018
Statements of Changes in Net Assets
| | | | | | | | |
| Increase (Decrease) in Net Assets | | Six Months Ended July 31, 2018 (Unaudited) | | | Year Ended January 31, 2018 | |
From operations — | |
Net investment income | | $ | 7,129,755 | | | $ | 11,752,466 | |
Net realized loss | | | (3,989,731 | ) | | | (1,636,424 | ) |
Net change in unrealized appreciation (depreciation) | | | 2,828,793 | | | | 7,838,450 | |
Net increase in net assets from operations | | $ | 5,968,817 | | | $ | 17,954,492 | |
Capital transactions — | |
Contributions | | $ | 36,218,808 | | | $ | 211,735,515 | |
Withdrawals | | | (51,921,254 | ) | | | (55,926,844 | ) |
Portfolio transaction fee | | | 132,196 | | | | 432,365 | |
Net increase (decrease) in net assets from capital transactions | | $ | (15,570,250 | ) | | $ | 156,241,036 | |
| | |
Net increase (decrease) in net assets | | $ | (9,601,433 | ) | | $ | 174,195,528 | |
| | |
| Net Assets | | | | | | | | |
At beginning of period | | $ | 676,299,824 | | | $ | 502,104,296 | |
At end of period | | $ | 666,698,391 | | | $ | 676,299,824 | |
| | | | |
| | 26 | | See Notes to Financial Statements. |
5-to-15 Year Laddered Municipal Bond Portfolio
July 31, 2018
Financial Highlights
| | | | | | | | | | | | |
| Ratios/Supplemental Data | | Six Months Ended
July 31, 2018
(Unaudited) | | | Year Ended
January 31, 2018 | | | Period Ended
January 31, 2017(1) | |
Ratios (as a percentage of average daily net assets): | | | | | | | | | | | | |
Expenses(2) | | | 0.35 | %(3) | | | 0.35 | % | | | 0.35 | %(3) |
Net investment income | | | 2.15 | %(3) | | | 2.01 | % | | | 1.71 | %(3) |
Portfolio Turnover | | | 40 | %(4) | | | 35 | % | | | 30 | %(4) |
| | | |
Total Return(2) | | | 0.91 | %(4) | | | 3.83 | % | | | (0.80 | )%(4) |
| | | |
Net assets, end of period (000’s omitted) | | $ | 666,698 | | | $ | 676,300 | | | $ | 502,104 | |
| (1) | For the period from the start of business, March 28, 2016, to January 31, 2017. |
| (2) | The investment adviser reimbursed certain operating expenses (equal to 0.01%, 0.01% and 0.02% of average daily net assets for the six months ended July 31, 2018, the year ended January 31, 2018 and the period ended January 31, 2017, respectively). Absent this reimbursement, total return would be lower. |
| | | | |
| | 27 | | See Notes to Financial Statements. |
5-to-15 Year Laddered Municipal Bond Portfolio
July 31, 2018
Notes to Financial Statements (Unaudited)
1 Significant Accounting Policies
5-to-15 Year Laddered Municipal Bond Portfolio (the Portfolio) is a Massachusetts business trust registered under the Investment Company Act of 1940, as amended (the 1940 Act), as a diversified, open-end management investment company. The Portfolio’s investment objective is to seek current income exempt from regular federal income tax. The Declaration of Trust permits the Trustees to issue interests in the Portfolio. At July 31, 2018, Eaton Vance TABS 5-to-15 Year Laddered Municipal Bond Fund and Eaton Vance TABS 5-to-15 Year Laddered Municipal Bond NextShares held an interest of 98.9% and 1.1%, respectively, in the Portfolio.
The following is a summary of significant accounting policies of the Portfolio. The policies are in conformity with accounting principles generally accepted in the United States of America (U.S. GAAP). The Portfolio is an investment company and follows accounting and reporting guidance in the Financial Accounting Standards Board (FASB) Accounting Standards Codification Topic 946.
A Investment Valuation — The following methodologies are used to determine the market value or fair value of investments.
Debt Obligations. Debt obligations are generally valued on the basis of valuations provided by third party pricing services, as derived from such services’ pricing models. Inputs to the models may include, but are not limited to, reported trades, executable bid and asked prices, broker/dealer quotations, prices or yields of securities with similar characteristics, interest rates, anticipated prepayments, benchmark curves or information pertaining to the issuer, as well as industry and economic events. The pricing services may use a matrix approach, which considers information regarding securities with similar characteristics to determine the valuation for a security. Short-term obligations purchased with a remaining maturity of sixty days or less for which a valuation from a third party pricing service is not readily available may be valued at amortized cost, which approximates fair value.
Fair Valuation. Investments for which valuations or market quotations are not readily available or are deemed unreliable are valued at fair value using methods determined in good faith by or at the direction of the Trustees of the Portfolio in a manner that fairly reflects the security’s value, or the amount that the Portfolio might reasonably expect to receive for the security upon its current sale in the ordinary course. Each such determination is based on a consideration of relevant factors, which are likely to vary from one pricing context to another. These factors may include, but are not limited to, the type of security, the existence of any contractual restrictions on the security’s disposition, the price and extent of public trading in similar securities of the issuer or of comparable entities, quotations or relevant information obtained from broker/dealers or other market participants, information obtained from the issuer, analysts, and/or the appropriate stock exchange (for exchange-traded securities), an analysis of the entity’s financial condition, and an evaluation of the forces that influence the issuer and the market(s) in which the security is purchased and sold.
B Investment Transactions — Investment transactions for financial statement purposes are accounted for on a trade date basis. Realized gains and losses on investments sold are determined on the basis of identified cost.
C Income — Interest income is recorded on the basis of interest accrued, adjusted for amortization of premium or accretion of discount.
D Federal Taxes — The Portfolio has elected to be treated as a partnership for federal tax purposes. No provision is made by the Portfolio for federal or state taxes on any taxable income of the Portfolio because each investor in the Portfolio is ultimately responsible for the payment of any taxes on its share of taxable income. Since at least one of the Portfolio’s investors is a regulated investment company that invests all or substantially all of its assets in the Portfolio, the Portfolio normally must satisfy the applicable source of income and diversification requirements (under the Internal Revenue Code) in order for its investors to satisfy them. The Portfolio will allocate, at least annually among its investors, each investor’s distributive share of the Portfolio’s net investment income, net realized capital gains and losses and any other items of income, gain, loss, deduction or credit.
As of July 31, 2018, the Portfolio had no uncertain tax positions that would require financial statement recognition, de-recognition, or disclosure. The Portfolio files a U.S. federal income tax return annually after its fiscal year-end, which is subject to examination by the Internal Revenue Service for a period of three years from the date of filing.
E Use of Estimates — The preparation of the financial statements in conformity with U.S. GAAP requires management to make estimates and assumptions that affect the reported amounts of assets and liabilities at the date of the financial statements and the reported amounts of income and expense during the reporting period. Actual results could differ from those estimates.
F Indemnifications — Under the Portfolio’s organizational documents, its officers and Trustees may be indemnified against certain liabilities and expenses arising out of the performance of their duties to the Portfolio. Under Massachusetts law, if certain conditions prevail, interestholders in the Portfolio could be deemed to have personal liability for the obligations of the Portfolio. However, the Portfolio’s Declaration of Trust contains an express disclaimer of liability on the part of Portfolio interestholders and the By-laws provide that the Portfolio shall assume the defense on behalf of any Portfolio interestholder. Moreover, the By-laws also provide for indemnification out of Portfolio property of any interestholder held personally liable solely by reason of being or having been an interestholder for all loss or expense arising from such liability. Additionally, in the normal course of business, the Portfolio enters into agreements with service providers that may contain indemnification clauses. The Portfolio’s maximum exposure under these arrangements is unknown as this would involve future claims that may be made against the Portfolio that have not yet occurred.
G When-Issued Securities and Delayed Delivery Transactions — The Portfolio may purchase or sell securities on a delayed delivery or when-issued basis. Payment and delivery may take place after the customary settlement period for that security. At the time the transaction is negotiated, the price of the security that will be delivered is fixed. The Portfolio maintains cash and/or security positions for these commitments such that sufficient liquid assets will
5-to-15 Year Laddered Municipal Bond Portfolio
July 31, 2018
Notes to Financial Statements (Unaudited) — continued
be available to make payments upon settlement. Securities purchased on a delayed delivery or when-issued basis are marked-to-market daily and begin earning interest on settlement date. Losses may arise due to changes in the market value of the underlying securities or if the counterparty does not perform under the contract.
H Capital Transactions — To seek to protect the Portfolio (and, indirectly, other investors in the Portfolio) against the costs of accommodating investor inflows and outflows, the Portfolio imposes a fee (“Portfolio transaction fee”) on inflows and outflows by Portfolio investors. The Portfolio transaction fee is sized to cover the estimated cost to the Portfolio of, in connection with issuing interests, converting the cash and/or other instruments it receives to the desired composition and, in connection with redeeming its interests, converting Portfolio holdings to cash and/or other instruments to be distributed. Such fee, which may vary over time, is limited to amounts that have been authorized by the Board of Trustees and determined by Eaton Vance Management (EVM) to be appropriate. The maximum Portfolio transaction fee is 2% of the amount of net contributions or withdrawals. The Portfolio transaction fee is recorded as a component of capital transactions on the Statements of Changes in Net Assets.
I Interim Financial Statements — The interim financial statements relating to July 31, 2018 and for the six months then ended have not been audited by an independent registered public accounting firm, but in the opinion of the Portfolio’s management, reflect all adjustments, consisting only of normal recurring adjustments, necessary for the fair presentation of the financial statements.
2 Investment Adviser Fee and Other Transactions with Affiliates
The investment adviser fee is earned by Boston Management and Research (BMR), a subsidiary of EVM, as compensation for investment advisory services rendered to the Portfolio. The fee is computed at an annual rate of 0.32% of the Portfolio’s average daily net assets up to $1 billion and at reduced rates on average daily net assets of $1 billion or more, and is payable monthly. For the six months ended July 31, 2018, the Portfolio’s investment adviser fee amounted to $1,062,156 or 0.32% (annualized) of the Portfolio’s average daily net assets. Pursuant to a voluntary expense reimbursement, BMR was allocated $42,699 of the Portfolio’s operating expenses for the six months ended July 31, 2018.
Trustees and officers of the Portfolio who are members of EVM’s or BMR’s organizations receive remuneration for their services to the Portfolio out of the investment adviser fee. Trustees of the Portfolio who are not affiliated with the investment adviser may elect to defer receipt of all or a percentage of their annual fees in accordance with the terms of the Trustees Deferred Compensation Plan. For the six months ended July 31, 2018, no significant amounts have been deferred. Certain officers and Trustees of the Portfolio are officers of the above organizations.
3 Purchases and Sales of Investments
Purchases and sales of investments, other than short-term obligations, aggregated $276,709,877 and $255,186,992, respectively, for the six months ended July 31, 2018.
4 Federal Income Tax Basis of Investments
The cost and unrealized appreciation (depreciation) of investments of the Portfolio at July 31, 2018, as determined on a federal income tax basis, were as follows:
| | | | |
| |
Aggregate cost | | $ | 648,715,459 | |
| |
Gross unrealized appreciation | | $ | 5,433,047 | |
Gross unrealized depreciation | | | (4,317,656 | ) |
| |
Net unrealized appreciation | | $ | 1,115,391 | |
5 Line of Credit
The Portfolio participates with other portfolios and funds managed by EVM and its affiliates in a $625 million unsecured line of credit agreement with a group of banks, which is in effect through October 30, 2018. Borrowings are made by the Portfolio solely to facilitate the handling of unusual and/or unanticipated short-term cash requirements. Interest is charged to the Portfolio based on its borrowings at an amount above either the Eurodollar rate or Federal Funds rate. In addition, a fee computed at an annual rate of 0.15% on the daily unused portion of the line of credit is allocated among the participating portfolios and funds at the end of each quarter. Because the line of credit is not available exclusively to the Portfolio, it may be unable to borrow some or all of its requested amounts at any particular time. The Portfolio did not have any significant borrowings or allocated fees during the six months ended July 31, 2018.
5-to-15 Year Laddered Municipal Bond Portfolio
July 31, 2018
Notes to Financial Statements (Unaudited) — continued
6 Fair Value Measurements
Under generally accepted accounting principles for fair value measurements, a three-tier hierarchy to prioritize the assumptions, referred to as inputs, is used in valuation techniques to measure fair value. The three-tier hierarchy of inputs is summarized in the three broad levels listed below.
| • | | Level 1 – quoted prices in active markets for identical investments |
| • | | Level 2 – other significant observable inputs (including quoted prices for similar investments, interest rates, prepayment speeds, credit risk, etc.) |
| • | | Level 3 – significant unobservable inputs (including a fund’s own assumptions in determining the fair value of investments) |
In cases where the inputs used to measure fair value fall in different levels of the fair value hierarchy, the level disclosed is determined based on the lowest level input that is significant to the fair value measurement in its entirety. The inputs or methodology used for valuing securities are not necessarily an indication of the risk associated with investing in those securities.
At July 31, 2018, the hierarchy of inputs used in valuing the Portfolio’s investments, which are carried at value, were as follows:
| | | | | | | | | | | | | | | | |
| Asset Description | | Level 1 | | | Level 2 | | | Level 3 | | | Total | |
| | | | |
Tax-Exempt Investments | | $ | — | | | $ | 649,830,850 | | | $ | — | | | $ | 649,830,850 | |
| | | | |
Total Investments | | $ | — | | | $ | 649,830,850 | | | $ | — | | | $ | 649,830,850 | |
At July 31, 2018, there were no investments transferred between Level 1 and Level 2 during the six months then ended.
Eaton Vance
TABS 5-to-15 Year Laddered Municipal Bond NextShares
July 31, 2018
Board of Trustees’ Contract Approval
Overview of the Contract Review Process
The Investment Company Act of 1940, as amended (the “1940 Act”), provides, in substance, that each investment advisory agreement between a fund and its investment adviser will continue in effect from year to year only if its continuation is approved at least annually by the fund’s board of trustees, including by a vote of a majority of the trustees who are not “interested persons” of the fund (“Independent Trustees”), cast in person at a meeting called for the purpose of considering such approval.
At a meeting of the Boards of Trustees (each a “Board”) of the registered investment companies advised by either Eaton Vance Management or its affiliate, Boston Management and Research, (the “Eaton Vance Funds”) held on April 24, 2018, the Board, including a majority of the Independent Trustees, voted to approve continuation of existing investment advisory and sub-advisory agreements for the Eaton Vance Funds for an additional one-year period. In voting its approval, the Board relied upon the affirmative recommendation of its Contract Review Committee, which is a committee comprised exclusively of Independent Trustees. Prior to making its recommendation, the Contract Review Committee reviewed information furnished by each adviser to the Eaton Vance Funds (including information specifically requested by the Board) for a series of meetings of the Contract Review Committee held between February and April 2018. The Contract Review Committee also considered information received at prior meetings of the Board and its committees, as relevant to its annual evaluation of the investment advisory and sub-advisory agreements.
The information that the Board considered included, among other things, the following (for funds that invest through one or more underlying portfolio(s), references to “each fund” in this section may include information that was considered at the portfolio-level):
Information about Fees, Performance and Expenses
| • | | A report from an independent data provider comparing the advisory and related fees paid by each fund with fees paid by comparable funds as identified by the independent data provider (“comparable funds”); |
| • | | A report from an independent data provider comparing each fund’s total expense ratio and its components to comparable funds; |
| • | | A report from an independent data provider comparing the investment performance of each fund (including, where relevant, yield data, Sharpe ratios and information ratios) to the investment performance of comparable funds over various time periods; |
| • | | Data regarding investment performance in comparison to benchmark indices, as well as customized groups of peer funds and blended indices identified by the adviser in consultation with the Board; |
| • | | For each fund, comparative information concerning the fees charged and the services provided by each adviser in managing other accounts (including mutual funds, other collective investment funds and institutional accounts) using investment strategies and techniques similar to those used in managing such fund; |
| • | | Profitability analyses for each adviser with respect to each fund; |
Information about Portfolio Management and Trading
| • | | Descriptions of the investment management services provided to each fund, including the fund’s investment strategies and policies; |
| • | | The procedures and processes used to determine the fair value of fund assets and actions taken to monitor and test the effectiveness of such procedures and processes; |
| • | | Information about each adviser’s policies and practices with respect to trading, including each adviser’s processes for monitoring best execution of portfolio transactions; |
| • | | Information about the allocation of brokerage transactions and the benefits received by each adviser as a result of brokerage allocation, including information concerning the acquisition of research through client commission arrangements and policies with respect to “soft dollars”; |
| • | | Data relating to portfolio turnover rates of each fund; |
Information about each Adviser
| • | | Reports detailing the financial results and condition of each adviser; |
| • | | Descriptions of the qualifications, education and experience of the individual investment professionals whose responsibilities include portfolio management and investment research for the funds, and information relating to their responsibilities with respect to managing other mutual funds and investment accounts; |
| • | | The Code of Ethics of each adviser and its affiliates, together with information relating to compliance with and the administration of such codes; |
| • | | Policies and procedures relating to proxy voting and the handling of corporate actions and class actions; |
| • | | Information concerning the resources devoted to compliance efforts undertaken by each adviser and its affiliates (including descriptions of various compliance programs) and their record of compliance; |
| • | | Information concerning the business continuity and disaster recovery plans of each adviser and its affiliates; |
| • | | A description of Eaton Vance Management’s procedures for overseeing third party advisers and sub-advisers, including with respect to regulatory and compliance issues, investment management and other matters; |
Eaton Vance
TABS 5-to-15 Year Laddered Municipal Bond NextShares
July 31, 2018
Board of Trustees’ Contract Approval — continued
Other Relevant Information
| • | | Information concerning the nature, cost and character of the administrative and other non-investment advisory services provided by Eaton Vance Management and its affiliates; |
| • | | Information concerning management of the relationship with the custodian, subcustodians and fund accountants by each adviser or the funds’ administrator; and |
| • | | The terms of each investment advisory agreement. |
Over the course of the twelve-month period ended April 30, 2018, with respect to one or more funds, the Board met seven times and the Contract Review Committee, the Audit Committee, the Governance Committee, the Portfolio Management Committee and the Compliance Reports and Regulatory Matters Committee, each of which is a Committee comprised solely of Independent Trustees, met seven, thirteen, six, eight and nine times, respectively. At such meetings, the Trustees participated in investment and performance reviews with the portfolio managers and other investment professionals of each investment adviser relating to each fund, and considered various investment and trading strategies used in pursuing each fund’s investment objective, such as the use of derivative instruments, as well as risk management techniques. The Board and its Committees also evaluated issues pertaining to industry and regulatory developments, compliance procedures, fund governance and other issues with respect to the funds, and received and participated in reports and presentations provided by Eaton Vance Management and other fund advisers with respect to such matters. In addition to the formal meetings of the Board and its Committees, the Independent Trustees hold regular teleconferences in between meetings to discuss, among other topics, matters relating to the continuation of investment advisory and sub-advisory agreements.
For funds that invest through one or more underlying portfolios, the Board considered similar information about the portfolio(s) when considering the approval of investment advisory agreements. In addition, in cases where the fund’s investment adviser has engaged a sub-adviser, the Board considered similar information about the sub-adviser when considering the approval of any sub-advisory agreement.
The Contract Review Committee was assisted throughout the contract review process by Goodwin Procter LLP, independent legal counsel for the Independent Trustees. The members of the Contract Review Committee relied upon the advice of such counsel and their own business judgment in determining the material factors to be considered in evaluating each investment advisory and sub-advisory agreement and the weight to be given to each such factor. The conclusions reached with respect to each investment advisory and sub-advisory agreement were based on a comprehensive evaluation of all the information provided and not any single factor. Moreover, each member of the Contract Review Committee may have placed varying emphasis on particular factors in reaching conclusions with respect to each investment advisory and sub-advisory agreement. In evaluating each investment advisory and sub-advisory agreement, including the specific fee structures and other terms of the agreements, the Contract Review Committee was informed by multiple years of analysis and discussion among the Independent Trustees and the Eaton Vance Funds’ advisers and sub-advisers.
Results of the Process
Based on its consideration of the foregoing, and such other information as it deemed relevant, including the factors and conclusions described below, the Contract Review Committee concluded that the continuation of the investment advisory and administrative agreement of Eaton Vance TABS 5-to-15 Year Laddered Municipal Bond NextShares (the “Fund”) with Eaton Vance Management (“EVM”), as well as the investment advisory agreement of 5-to-15 Year Laddered Municipal Bond Portfolio (the “Portfolio”), the portfolio in which the Fund invests, with Boston Management and Research (“BMR”) (EVM, with respect to the Fund, and BMR, with respect to the Portfolio, are each referred to herein as the “Adviser”), including their fee structures, is in the interests of shareholders and, therefore, the Contract Review Committee recommended to the Board approval of each agreement. The Board accepted the recommendation of the Contract Review Committee based on the material factors considered and conclusions reached by the Contract Review Committee with respect to the agreements. Accordingly, the Board, including a majority of the Independent Trustees, voted to approve continuation of the investment advisory and administrative agreement for the Fund and the investment advisory agreement for the Portfolio (together, the “investment advisory agreements”).
Nature, Extent and Quality of Services
In considering whether to approve the investment advisory agreements of the Fund and the Portfolio, the Board evaluated the nature, extent and quality of services provided to the Fund and the Portfolio by the applicable Adviser.
The Board considered each Adviser’s management capabilities and investment process with respect to the types of investments held by the Fund and the Portfolio, including the education, experience and number of its investment professionals and other personnel who provide portfolio management, investment research, and similar services to the Fund and the Portfolio. In particular, the Board considered the abilities and experience of each Adviser’s investment professionals in the Advisers’ tax-advantaged bond strategies and municipal research groups involved in managing the Fund and the Portfolio and other funds and accounts that invest primarily in municipal bonds and employ tax-advantaged bond and laddered strategies. The Board also took into account the resources dedicated to portfolio management and other services, as well as the compensation methods of each Adviser and other factors, such as the reputation and resources of the Adviser to recruit and retain highly qualified research, advisory and supervisory investment professionals. In addition, the Board considered the time and attention devoted to the Eaton Vance Funds, including the Fund and the Portfolio, by senior management, as well as the infrastructure, operational capabilities and support staff in place to assist in the portfolio management and operations of the Fund and the Portfolio, including the provision of administrative services. The Board also considered the business-related and other risks to which each Adviser or its affiliates may be subject in managing the Fund and the Portfolio.
Eaton Vance
TABS 5-to-15 Year Laddered Municipal Bond NextShares
July 31, 2018
Board of Trustees’ Contract Approval — continued
The Board considered the special attributes of the Fund relative to a traditional mutual fund and the benefits that are expected to be realized from an investment in the Fund, rather than a traditional mutual fund. The Board also considered the resources devoted by the applicable Adviser and its affiliates in developing and maintaining an infrastructure necessary to support the on-going operations of the Fund.
The Board noted that under the terms of the investment advisory agreement of the Fund, EVM may invest assets of the Fund directly in securities, for which it would receive a fee, or in the Portfolio, for which it receives no separate fee but for which BMR receives an advisory fee from the Portfolio.
The Board considered the compliance programs of each Adviser and relevant affiliates thereof. Among other matters, the Board considered compliance and reporting matters relating to personal trading by investment professionals, selective disclosure of portfolio holdings, late trading, frequent trading, portfolio valuation, business continuity and the allocation of investment opportunities. The Board also considered the responses of each Adviser and its affiliates to requests in recent years from regulatory authorities such as the Securities and Exchange Commission and the Financial Industry Regulatory Authority.
The Board considered shareholder and other administrative services provided or managed by Eaton Vance Management and its affiliates, including transfer agency and accounting services. The Board evaluated the benefits to shareholders of investing in a fund that is a part of a large fund complex offering exposure to a variety of asset classes and investment disciplines.
After consideration of the foregoing factors, among others, the Board concluded that the nature, extent and quality of services provided by each Adviser, taken as a whole, are appropriate and consistent with the terms of the applicable investment advisory agreement.
Fund Performance
The Board compared the Fund’s investment performance to that of comparable funds and appropriate benchmark indices, as well as a customized peer group of similarly managed funds. In light of the Fund’s relatively brief operating history, the Board concluded that additional time is required to evaluate Fund performance.
Management Fees and Expenses
The Board considered contractual fee rates payable by the Fund and by the Portfolio for advisory and administrative services (referred to collectively as “management fees”). As part of its review, the Board considered the Fund’s management fees and total expense ratio for the one year period ended September 30, 2017, as compared to those of comparable funds, before and after giving effect to any undertaking to waive fees or reimburse expenses. The Board also considered certain factors identified by management in response to inquiries from the Contract Review Committee regarding the Fund’s expense ratio relative to comparable funds.
After considering the foregoing information, and in light of the nature, extent and quality of the services provided by each Adviser, the Board concluded that the management fees charged for advisory and related services are reasonable.
Profitability and Other “Fall-Out” Benefits
The Board considered the level of profits realized by each Adviser and relevant affiliates thereof in providing investment advisory and administrative services to the Fund, to the Portfolio and to all Eaton Vance Funds as a group. The Board considered the level of profits realized without regard to marketing support or other payments by each Adviser and its affiliates to third parties in respect of distribution services. The Board also considered other direct or indirect fall-out benefits received by each Adviser and its affiliates in connection with their relationships with the Fund and the Portfolio, including the benefits of research services that may be available to each Adviser as a result of securities transactions effected for the Fund and the Portfolio and other investment advisory clients.
The Board concluded that, in light of the foregoing factors and the nature, extent and quality of the services rendered, the profits realized by each Adviser and its affiliates are deemed not to be excessive.
Economies of Scale
In reviewing management fees and profitability, the Board also considered the extent to which the applicable Adviser and its affiliates, on the one hand, and the Fund and the Portfolio, on the other hand, can expect to realize benefits from economies of scale as the assets of the Fund and the Portfolio increase. The Board acknowledged the difficulty in accurately measuring the benefits resulting from economies of scale, if any, with respect to the management of any specific fund or group of funds. The Board reviewed data summarizing the increases and decreases in the assets of the Fund and of all Eaton Vance Funds as a group over various time periods, and evaluated the extent to which the total expense ratio of the Fund and the profitability of each Adviser and its affiliates may have been affected by such increases or decreases. Based upon the foregoing, the Board concluded that the Fund currently shares in any benefits from economies of scale. The Board also concluded that, assuming reasonably foreseeable increases in the assets of the Fund and the Portfolio, the structure of the advisory fees, which include breakpoints at several asset levels, will allow the Fund and the Portfolio to continue to benefit from any economies of scale in the future.
Eaton Vance
TABS 5-to-15 Year Laddered Municipal Bond NextShares
July 31, 2018
Officers and Trustees
Officers of Eaton Vance TABS 5-to-15 Year Laddered Municipal Bond NextShares
Payson F. Swaffield
President
Maureen A. Gemma
Vice President, Secretary and
Chief Legal Officer
James F. Kirchner
Treasurer
Richard F. Froio
Chief Compliance Officer
Officers of 5-to-15 Year Laddered Municipal Bond Portfolio
Payson F. Swaffield
President
Maureen A. Gemma
Vice President, Secretary and
Chief Legal Officer
James F. Kirchner
Treasurer
Richard F. Froio
Chief Compliance Officer
Trustees of Eaton Vance TABS 5-to-15 Year Laddered Municipal Bond NextShares and 5-to-15 Year Laddered Municipal Bond Portfolio
William H. Park
Chairperson
Thomas E. Faust Jr.*
Mark R. Fetting
Cynthia E. Frost
George J. Gorman
Valerie A. Mosley
Helen Frame Peters
Susan J. Sutherland
Harriett Tee Taggart
Scott E. Wennerholm
Eaton Vance Funds
IMPORTANT NOTICES
Privacy. The Eaton Vance organization is committed to ensuring your financial privacy. Each of the financial institutions identified below has in effect the following policy (“Privacy Policy”) with respect to nonpublic personal information about its customers:
| • | | Only such information received from you, through application forms or otherwise, and information about your Eaton Vance fund transactions will be collected. This may include information such as name, address, social security number, tax status, account balances and transactions. |
| • | | None of such information about you (or former customers) will be disclosed to anyone, except as permitted by law (which includes disclosure to employees necessary to service your account). In the normal course of servicing a customer’s account, Eaton Vance may share information with unaffiliated third parties that perform various required services such as transfer agents, custodians and broker-dealers. |
| • | | Policies and procedures (including physical, electronic and procedural safeguards) are in place that are designed to protect the confidentiality of such information. |
| • | | We reserve the right to change our Privacy Policy at any time upon proper notification to you. Customers may want to review our Privacy Policy periodically for changes by accessing the link on our homepage: www.eatonvance.com. |
Our pledge of privacy applies to the following entities within the Eaton Vance organization: the Eaton Vance Family of Funds, Eaton Vance Management, Eaton Vance Investment Counsel, Eaton Vance Distributors, Inc., Eaton Vance Trust Company, Eaton Vance Management (International) Limited, Eaton Vance Advisers International Ltd., Eaton Vance Management’s Real Estate Investment Group and Boston Management and Research. In addition, our Privacy Policy applies only to those Eaton Vance customers who are individuals and who have a direct relationship with us. If a customer’s account (i.e., fund shares) is held in the name of a third-party financial advisor/broker-dealer, it is likely that only such advisor’s privacy policies apply to the customer. This notice supersedes all previously issued privacy disclosures. For more information about Eaton Vance’s Privacy Policy, please call 1-800-262-1122.
Delivery of Shareholder Documents. The Securities and Exchange Commission (SEC) permits delivery of only one copy of fund shareholder documents, including prospectuses, proxy statements and shareholder reports, to fund investors with multiple accounts at the same residential or post office box address. This practice is often called “householding” and it helps eliminate duplicate mailings to shareholders. Your broker may household the mailing of your documents indefinitely unless you instruct your broker otherwise. If you would prefer that your Eaton Vance documents not be householded, please contact your broker. Your instructions that householding not apply to delivery of your Eaton Vance documents will typically be effective within 30 days of receipt by your broker.
Portfolio Holdings. Each Eaton Vance Fund and its underlying Portfolio(s) (if applicable) will file a schedule of portfolio holdings on Form N-Q with the SEC for the first and third quarters of each fiscal year. The Form N-Q will be available on the Eaton Vance website at www.eatonvance.com, by calling Eaton Vance at 1-800-262-1122 or in the EDGAR database on the SEC’s website at www.sec.gov. Form N-Q may also be reviewed and copied at the SEC’s public reference room in Washington, D.C. (call 1-800-732-0330 for information on the operation of the public reference room).
Proxy Voting. From time to time, funds are required to vote proxies related to the securities held by the funds. The Eaton Vance Funds or their underlying Portfolios (if applicable) vote proxies according to a set of policies and procedures approved by the Funds’ and Portfolios’ Boards. You may obtain a description of these policies and procedures and information on how the Funds or Portfolios voted proxies relating to portfolio securities during the most recent 12-month period ended June 30, without charge, upon request, by calling 1-800-262-1122 and by accessing the SEC’s website at www.sec.gov.
This Page Intentionally Left Blank
Investment Adviser of 5-to-15 Year Laddered Municipal Bond Portfolio
Boston Management and Research
Two International Place
Boston, MA 02110
Investment Adviser and Administrator of Eaton Vance TABS 5-to-15 Year Laddered Municipal Bond NextShares
Eaton Vance Management
Two International Place
Boston, MA 02110
Distributor*
Foreside Fund Services, LLC
Three Canal Plaza, Suite 100
Portland, ME 04101
Custodian
State Street Bank and Trust Company
State Street Financial Center, One Lincoln Street
Boston, MA 02111
Transfer and Dividend Disbursing Agent
State Street Bank and Trust Company
State Street Financial Center, One Lincoln Street
Boston, MA 02111
Fund Offices
Two International Place
Boston, MA 02110
| * | FINRA BrokerCheck. Investors may check the background of their Investment Professional by contacting the Financial Industry Regulatory Authority (FINRA). FINRA BrokerCheck is a free tool to help investors check the professional background of current and former FINRA-registered securities firms and brokers. FINRA BrokerCheck is available by calling 1-800-289-9999 and at www.FINRA.org. The FINRA BrokerCheck brochure describing this program is available to investors at www.FINRA.org. |


22627 7.31.18
Item 2. Code of Ethics
Not required in this filing.
Item 3. Audit Committee Financial Expert
Not required in this filing.
Item 4. Principal Accountant Fees and Services
Not required in this filing.
Item 5. Audit Committee of Listed Registrants
Not applicable.
Item 6. Schedule of Investments
Please see schedule of investments contained in the Report to Stockholders included under Item 1 of this Form N-CSR.
Item 7. Disclosure of Proxy Voting Policies and Procedures for Closed-End Management Investment Companies
Not applicable.
Item 8. Portfolio Managers of Closed-End Management Investment Companies
Not applicable.
Item 9. Purchases of Equity Securities by Closed-End Management Investment Company and Affiliated Purchasers
Not applicable.
Item 10. Submission of Matters to a Vote of Security Holders
No material changes.
Item 11. Controls and Procedures
(a) It is the conclusion of the registrant’s principal executive officer and principal financial officer that the effectiveness of the registrant’s current disclosure controls and procedures (such disclosure controls and procedures having been evaluated within 90 days of the date of this filing) provide reasonable assurance that the information required to be disclosed by the registrant has been recorded, processed, summarized and reported within the time period specified in the Commission’s rules and forms and that the information required to be disclosed by the registrant has been accumulated and communicated to the registrant’s principal executive officer and principal financial officer in order to allow timely decisions regarding required disclosure.
(b) There have been no changes in the registrant’s internal controls over financial reporting during the second fiscal quarter of the period covered by this report that has materially affected, or is reasonably likely to materially affect, the registrant’s internal control over financial reporting.
Item 12. Disclosure of Securities Lending Activities for Closed-End Management Investment Companies
Not applicable.
Item 13. Exhibits
| | |
| (a)(1) | | Registrant’s Code of Ethics – Not applicable (please see Item 2). |
| (a)(2)(i) | | Treasurer’s Section 302 certification. |
| (a)(2)(ii) | | President’s Section 302 certification. |
| (b) | | Combined Section 906 certification. |
Signatures
Pursuant to the requirements of the Securities Exchange Act of 1934 and the Investment Company Act of 1940, the registrant has duly caused this report to be signed on its behalf by the undersigned, thereunto duly authorized.
Eaton Vance NextShares Trust II
| | |
| By: | | /s/ Payson F. Swaffield |
| | Payson F. Swaffield |
| | President |
| |
| Date: | | September 24, 2018 |
Pursuant to the requirements of the Securities Exchange Act of 1934 and the Investment Company Act of 1940, this report has been signed below by the following persons on behalf of the registrant and in the capacities and on the dates indicated.
| | |
| By: | | /s/ James F. Kirchner |
| | James F. Kirchner |
| | Treasurer |
| |
| Date: | | September 24, 2018 |
| | |
| By: | | /s/ Payson F. Swaffield |
| | Payson F. Swaffield |
| | President |
| |
| Date: | | September 24, 2018 |