UNITED STATES
SECURITIES AND EXCHANGE COMMISSION
Washington, D.C. 20549
FormN-CSR
CERTIFIED SHAREHOLDER REPORT OF REGISTERED
MANAGEMENT INVESTMENT COMPANIES
Investment Company Act File Number:811-22983
Eaton Vance NextShares Trust II
(Exact Name of Registrant as Specified in Charter)
Two International Place, Boston, Massachusetts 02110
(Address of Principal Executive Offices)
Maureen A. Gemma
Two International Place, Boston, Massachusetts 02110
(Name and Address of Agent for Services)
(617)482-8260
(Registrant’s Telephone Number)
September 30
Date of Fiscal Year End
March 31, 2019
Date of Reporting Period
Item 1. Reports to Stockholders

Eaton Vance
Oaktree Diversified Credit NextShares (OKDCC)
Listing Exchange: The NASDAQ Stock Market LLC
Semiannual Report
March 31, 2019
Important Note. Beginning on January 1, 2021, as permitted by regulations adopted by the Securities and Exchange Commission, paper copies of the Fund’s annual and semi-annual shareholder reports will no longer be sent by mail unless you specifically request paper copies of the reports. Instead, the reports will be made available on the Fund’s website (eatonvance.com/nextsharesdocuments), and you will be notified by mail each time a report is posted and provided with a website address to access the report.
If you already elected to receive shareholder reports electronically, you will not be affected by this change and you need not take any action. You may elect to receive shareholder reports and other communications from the Fund electronically by contacting your financial intermediary (such as a financial advisor, broker-dealer or bank).
You may elect to receive all future Fund shareholder reports in paper free of charge. You can contact your financial intermediary or follow instructions included with this disclosure, if applicable, to elect to continue to receive paper copies of your shareholder reports. Your election to receive reports in paper will apply to all funds held through your financial intermediary.
NextShares® is a registered trademark of NextShares Solutions LLC. All rights reserved.
Commodity Futures Trading Commission Registration. Effective December 31, 2012, the Commodity Futures Trading Commission (“CFTC”) adopted certain regulatory changes that subject registered investment companies and advisers to regulation by the CFTC if a fund invests more than a prescribed level of its assets in certain CFTC-regulated instruments (including futures, certain options and swap agreements) or markets itself as providing investment exposure to such instruments. The Fund has claimed an exclusion from the definition of the term “commodity pool operator” under the Commodity Exchange Act. Accordingly, neither the Fund nor the adviser with respect to the operation of the Fund is subject to CFTC regulation. Because of its management of other strategies, the Fund’s adviser is registered with the CFTC as a commodity pool operator and a commodity trading advisor.
Fund shares are not insured by the FDIC and are not deposits or other obligations of, or guaranteed by, any depository institution. Shares are subject to investment risks, including possible loss of principal invested.
This report must be preceded or accompanied by a current summary prospectus or prospectus. Before investing in NextShares, investors should consider carefully the investment objectives, risks, charges and expenses. This and other important information is contained in the prospectus and summary prospectus, which can be obtained from a financial advisor. Prospective investors should read the prospectus carefully before investing. For further information, please call 1-800-262-1122.
Semiannual ReportMarch 31, 2019
Eaton Vance
Oaktree Diversified Credit NextShares
Table of Contents
| | | | |
Performance | | | 2 | |
| |
Fund Profile | | | 2 | |
| |
Endnotes and Additional Disclosures | | | 3 | |
| |
Fund Expenses | | | 4 | |
| |
Financial Statements | | | 5 | |
| |
Officers and Trustees | | | 27 | |
| |
Important Notices | | | 28 | |
Eaton Vance
Oaktree Diversified Credit NextShares
March 31, 2019
Performance1,2
Portfolio ManagerBruce A. Karsh, of Oaktree Capital Management, L.P.
| | | | | | | | | | | | | | | | | | | | | | | | |
| % Average Annual Total Returns | | Fund
Inception Date | | | Performance
Inception Date | | | Six Months | | | One Year | | | Five Years | | | Since Fund
Inception | |
Fund at NAV | | | 11/15/2017 | | | | 11/15/2017 | | | | 1.27 | % | | | 4.42 | % | | | — | | | | 3.92 | % |
Fund at Market Price | | | 11/15/2017 | | | | 11/15/2017 | | | | 1.27 | | | | 4.42 | | | | — | | | | 3.92 | |
ICE BofAMLNon-Financial Developed Markets High Yield Constrained Index – Hedged USD | | | — | | | | — | | | | 2.38 | % | | | 5.71 | % | | | 4.84 | % | | | 4.57 | % |
Blended Index | | | — | | | | — | | | | 1.40 | | | | 4.34 | | | | 4.24 | | | | 4.13 | |
| | | | | | |
| | | | | | | | | | | | | | | | | | | | | | | | |
| % Total Annual Operating Expense Ratios3 | | | | | | | | | | | | | | | | | | |
Gross | | | | | | | | | | | | | | | | | | | | | | | 1.29 | % |
Net | | | | | | | | | | | | | | | | | | | | | | | 0.90 | |
| | | | | | |
| | | | | | | | | | | | | | | | | | | | | | | | |
| % Distribution Rates/Yields4 | | | | | | | | | | | | | | | | | | |
Distribution Rate at NAV | | | | | | | | | | | | | | | | | | | | | | | 3.24 | % |
SEC30-day Yield – Subsidized | | | | | | | | | | | | | | | | | | | | | | | 4.89 | |
SEC30-day Yield – Unsubsidized | | | | | | | | | | | | | | | | | | | | | | | 4.32 | |
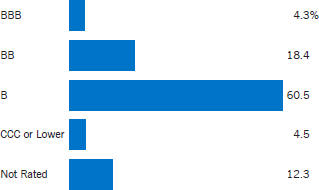
Fund Profile
Credit Quality (% of total investments)5,6
See Endnotes and Additional Disclosures in this report.
Past performance is no guarantee of future results. Investment return and principal value will fluctuate so that shares, when sold, may be worth more or less than their original cost. Performance is for the stated time period only; due to market volatility, the Fund’s current performance may be lower or higher than indicated. The Fund’s performance at market price will differ from its results at net asset value (NAV). The market price used to calculate the Market Price return is the midpoint between the highest bid and the lowest offer on the exchange on which the shares of the Fund are listed for trading, as of the time that the Fund’s NAV is calculated. If you trade your shares at another time during the day, your return may differ. Returns are historical and are calculated by determining the percentage change in NAV or market price (as applicable) with all distributions reinvested at NAV or closing market price (as applicable) on the payment date of the distribution, and are net of management fees and other expenses. Returns are before taxes unless otherwise noted. Performance less than or equal to one year is cumulative. For performance as of the most recentmonth-end, including historical trading premiums/discounts relative to NAV, please refer to eatonvance.com
Eaton Vance
Oaktree Diversified Credit NextShares
March 31, 2019
Endnotes and Additional Disclosures
| 1 | ICE BofAMLNon-Financial Developed Markets High Yield Constrained Index — Hedged USD is an unmanaged index of below investment grade corporate bonds from developed market countries. The index excludes financial companies, limits issuer exposure to 2%, and is hedged to the US Dollar. ICE® BofAML® indices are not for redistribution or other uses; provided “as is”, without warranties, and with no liability. Eaton Vance has prepared this report and ICE Data Indices, LLC does not endorse it, or guarantee, review, or endorse Eaton Vance’s products. BofAML® is a licensed registered trademark of Bank of America Corporation in the United States and other countries. S&P/LSTA Leveraged Loan Index is an unmanaged index of the institutional leverage loan market. S&P Dow Jones Indices are a product of S&P Dow Jones Indices LLC (“S&P DJI”) and have been licensed for use. S&P® and S&P 500® are registered trademarks of S&P DJI; Dow Jones® is a registered trademark of Dow Jones Trademark Holdings LLC (“Dow Jones”); S&P DJI, Dow Jones and their respective affiliates do not sponsor, endorse, sell or promote the Fund, will not have any liability with respect thereto and do not have any liability for any errors, omissions, or interruptions of the S&P Dow Jones Indices. The Blended Index consists of 50% ICE BofAMLNon-Financial Developed Markets High Yield Constrained Index — Hedged USD and 50% S&P/LSTA Leveraged Loan Index. Unless otherwise stated, index returns do not reflect the effect of any applicable sales charges, commissions, expenses, taxes or leverage, as applicable. It is not possible to invest directly in an index. Performance since inception for an index, if presented, is the performance since the Fund’s inception. |
| 2 | Shares of NextShares funds are normally bought and sold in the secondary market through a broker, and may not be individually purchased or redeemed from the fund. In the secondary market, buyers and sellers transact with each other, rather than with the fund. NextShares funds issue and redeem shares only in specified creation unit quantities in transactions by or through Authorized Participants. In such transactions, a fund issues and redeems shares in exchange for the basket of securities, other instruments and/or cash that the fund specifies each business day. By transacting in kind, a NextShares fund can lower its trading costs and enhance fund tax efficiency by avoiding forced sales of securities to meet redemptions. Redemptions may be effected partially or entirely in cash whenin-kind delivery is not practicable or deemed not in the best interests of shareholders. A fund’s basket is not intended to be representative of the fund’s current portfolio positions and may vary significantly from current positions. As exchange-traded securities, NextShares can operate with low transfer agency expenses by utilizing the same highly efficient share processing system as used for exchange-listed stocks and ETFs. |
| | Market trading prices of NextShares are linked to the fund’s next-computed net asset value (NAV) and will vary from NAV by a market-determined premium or discount, which may be zero. Buyers and sellers of NextShares will not know the value of their purchases and sales until after the fund’s NAV is determined at the end of the trading day. Market trading prices may vary significantly from anticipated levels. NextShares do not offer investors the opportunity to buy and sell intraday based on current (versusend-of-day) determinations of fund value. NextShares trade execution prices will fluctuate based on changes in NAV. Although limit orders may be used to control trading costs, they cannot be used to control or limit trade execution prices. As a new type of fund, NextShares have a limited operating history and may initially be available through a limited number of brokers. There can be no guarantee that an active trading market for NextShares will develop or be maintained, or that their listing will continue unchanged. Buying and selling NextShares may require payment of brokerage commissions and expose transacting shareholders to other trading costs. Frequent trading may detract from realized investment returns. The return on a shareholder’s NextShares investment will be reduced if the shareholder sells shares at a greater discount or narrower premium to NAV than he or she acquired the shares. |
| 3 | Source: Fund prospectus. Net expense ratio reflects a contractual expense reimbursement that continues through 1/31/20. Without the reimbursement, performance would have been lower. The expense ratio for the current reporting period can be found in the Financial Highlights section of this report. |
| 4 | The Distribution Rate is based on the Fund’s last regular distribution per share in the period (annualized) divided by the Fund’s NAV at the end of the period. The Fund’s distributions may be comprised of amounts characterized for federal income tax purposes astax-exempt income, qualified andnon-qualified ordinary dividends, capital gains and nondividend distributions, also known as return of capital. The Fund will determine the federal income tax character of distributions paid to a shareholder after the end of the calendar year. This is reported on the IRS form1099-DIV and provided to the shareholder shortly after eachyear-end. The Fund’s distributions are determined by the investment adviser based on its current assessment of the Fund’s long-term return potential. As portfolio and market conditions change, the rate of distributions paid by the Fund could change. The SEC Yield is a standardized measure based on the estimated yield to maturity of a fund’s investments over a30-day period and is based on the maximum offer price at the date specified. The SEC Yield is not based on the distributions made by the Fund, which may differ. Subsidized yield reflects the effect of fee waivers and expense reimbursements. |
| 5 | Ratings are based on Moody’s Investors Service, Inc. (“Moody’s”), S&P Global Ratings (“S&P”) or Fitch Ratings (“Fitch”), as applicable. If securities are rated differently by the ratings agencies, the lowest rating is applied. Ratings, which are subject to change, apply to the creditworthiness of the issuers of the underlying securities and not to the Fund or its shares. Credit ratings measure the quality of a bond based on the issuer’s creditworthiness, with ratings ranging from AAA, being the highest, to D, being the lowest based on S&P’s measures. Ratings of BBB or higher by S&P or Fitch (Baa or higher by Moody’s) are considered to be investment-grade quality. Credit ratings are based largely on the ratings agency’s analysis at the time of rating. The rating assigned to any particular security is not necessarily a reflection of the issuer’s current financial condition and does not necessarily reflect its assessment of the volatility of a security’s market value or of the liquidity of an investment in the security. Holdings designated as “Not Rated” (if any) are not rated by the national ratings agencies stated above. |
| 6 | Excludes cash and cash equivalents. |
| | Fund profile subject to change due to active management. |
Eaton Vance
Oaktree Diversified Credit NextShares
March 31, 2019
Fund Expenses
Example: As a Fund shareholder, you incur two types of costs: (1) transaction costs, including brokerage commissions on purchases and sales of Fund shares; and (2) ongoing costs, including management fees and other Fund expenses. This Example is intended to help you understand your ongoing costs (in dollars) of Fund investing and to compare these costs with the ongoing costs of investing in other funds. The Example is based on an investment of $1,000 invested at the beginning of the period and held for the entire period (October 1, 2018 – March 31, 2019).
Actual Expenses: The first section of the table below provides information about actual account values and actual expenses. You may use the information in this section, together with the amount you invested, to estimate the expenses that you paid over the period. Simply divide your account value by $1,000 (for example, an $8,600 account value divided by $1,000 = 8.6), then multiply the result by the number in the first section under the heading entitled “Expenses Paid During Period” to estimate the expenses you paid on your account during this period.
Hypothetical Example for Comparison Purposes: The second section of the table below provides information about hypothetical account values and hypothetical expenses based on the actual Fund expense ratio and an assumed rate of return of 5% per year (before expenses), which is not the actual Fund return. The hypothetical account values and expenses may not be used to estimate the actual ending account balance or expenses you paid for the period. You may use this information to compare the ongoing costs of investing in your Fund and other funds. To do so, compare this 5% hypothetical example with the 5% hypothetical examples that appear in the shareholder reports of the other funds.
Please note that the expenses shown in the table are meant to highlight your ongoing costs only and do not reflect any transactional costs, such as brokerage commissions on purchases and sales of Fund shares. Therefore, the second section of the table is useful in comparing ongoing costs only, and will not help you determine the relative total costs of owning different funds. In addition, if these transactional costs were included, your costs would be higher.
| | | | | | | | | | | | | | | | | | | | |
| | | Beginning
Account Value
(10/1/18) | | | Ending
Account Value
(3/31/19) | | | Expenses Paid
During Period*
(10/1/18 – 3/31/19) | | | Annualized
Expense
Ratio | | | | |
| | | | |
Actual | | | | | | | | | | | | | | | | | |
| | $ | 1,000.00 | | | $ | 1,012.70 | | | $ | 4.52 | ** | | | 0.90 | % | | | | |
| | | | | |
Hypothetical | | | | | | | | | | | | | | | | | |
(5% return per year before expenses) | | | | | | | | | | | | | | | | | |
| | $ | 1,000.00 | | | $ | 1,020.40 | | | $ | 4.53 | ** | | | 0.90 | % | | | | |
| * | Expenses are equal to the Fund’s annualized expense ratio, multiplied by the average account value over the period, multiplied by 182/365 (to reflect the one-half year period). The Example assumes that the $1,000 was invested at the net asset value per share determined at the close of business on September 30, 2018. |
| ** | Absent an allocation of certain expenses to an affiliate, expenses would be higher. |
Eaton Vance
Oaktree Diversified Credit NextShares
March 31, 2019
Portfolio of Investments (Unaudited)
| | | | | | | | | | | | |
| Senior Floating-Rate Loans — 26.3%(1) | |
| Borrower/Tranche Description | | | | | Principal
Amount*
(000’s omitted) | | | Value | |
|
| Aerospace and Defense — 1.5% | |
| | | |
| TransDigm, Inc. | | | | | | | | | |
| | | |
Term Loan, 5.00%, (1 mo. USD LIBOR + 2.50%), Maturing May 30, 2025 | | | | | | | 743 | | | $ | 724,286 | |
| | | |
| | | | | | | | | | | $ | 724,286 | |
|
| Building and Development — 0.7% | |
| | | |
| Forest City Enterprises L.P. | | | | | | | | | |
| | | |
Term Loan, 6.48%, (1 mo. USD LIBOR + 4.00%), Maturing December 7, 2025 | | | | | | | 369 | | | $ | 371,382 | |
| | | |
| | | | | | | | | | | $ | 371,382 | |
|
| Business Equipment and Services — 5.8% | |
| | | |
| Blitz F18-675 GmbH | | | | | | | | | |
| | | |
Term Loan, 3.75%, (3 mo. EURIBOR + 3.75%), Maturing July 31, 2025 | | | EUR | | | | 450 | | | $ | 506,865 | |
| | | |
| Fugue Finance B.V. | | | | | | | | | |
| | | |
Term Loan, 3.25%, (3 mo. EURIBOR + 3.25%), Maturing September 1, 2024 | | | EUR | | | | 400 | | | | 443,492 | |
| | | |
| Mayfield Agency Borrower, Inc. | | | | | | | | | |
| | | |
Term Loan, 7.00%, (1 mo. USD LIBOR + 4.50%), Maturing February 28, 2025 | | | | | | | 993 | | | | 970,170 | |
| | | |
| PI US MergerCo, Inc. | | | | | | | | | |
| | | |
Term Loan, 6.00%, (1 mo. USD LIBOR + 3.50%), Maturing December 20, 2024 | | | | | | | 495 | | | | 487,033 | |
| | | |
| Trans Union, LLC | | | | | | | | | |
| | | |
Term Loan, 4.50%, (1 mo. USD LIBOR + 2.00%), Maturing June 19, 2025 | | | | | | | 496 | | | | 490,434 | |
| | | |
| | | | | | | | | | | $ | 2,897,994 | |
|
| Cable and Satellite Television — 1.5% | |
| | | |
| CSC Holdings, LLC | | | | | | | | | |
| | | |
Term Loan, 4.98%, (1 mo. USD LIBOR + 2.50%), Maturing January 25, 2026 | | | | | | | 741 | | | $ | 725,697 | |
| | | |
| | | | | | | | | | | $ | 725,697 | |
|
| Chemicals and Plastics — 0.9% | |
| | | |
| U.S. Silica Company | | | | | | | | | |
| | | |
Term Loan, 6.50%, (1 mo. USD LIBOR + 4.00%), Maturing May 1, 2025 | | | | | | | 496 | | | $ | 470,188 | |
| | | |
| | | | | | | | | | | $ | 470,188 | |
| | | | | | | | | | | | |
| Borrower/Tranche Description | | | | | Principal
Amount*
(000’s omitted) | | | Value | |
|
| Containers and Glass Products — 0.5% | |
| | | |
| CCP Lux Holding S.a.r.l. | | | | | | | | | |
| | | |
Term Loan, 3.50%, (3 mo. EURIBOR + 3.50%), Maturing January 10, 2025 | | | EUR | | | | 200 | | | $ | 224,140 | |
| | | |
| | | | | | | | | | | $ | 224,140 | |
|
| Ecological Services and Equipment — 1.9% | |
| | | |
| ExGen Renewables IV, LLC | | | | | | | | | |
| | | |
Term Loan, 5.63%, (3 mo. USD LIBOR + 3.00%), Maturing November 28, 2024 | | | | | | | 488 | | | $ | 458,414 | |
| | | |
| GFL Environmental, Inc. | | | | | | | | | |
| | | |
Term Loan, 5.50%, (1 mo. USD LIBOR + 3.00%), Maturing May 30, 2025 | | | | | | | 497 | | | | 483,191 | |
| | | |
| | | | | | | | | | | $ | 941,605 | |
|
| Electronics / Electrical — 2.5% | |
| | | |
| Financial & Risk US Holdings, Inc. | | | | | | | | | |
| | | |
Term Loan, 4.00%, (6 mo. EURIBOR + 4.00%), Maturing October 1, 2025 | | | EUR | | | | 100 | | | $ | 111,440 | |
| | | |
Term Loan, 6.25%, (1 mo. USD LIBOR + 3.75%), Maturing October 1, 2025 | | | | | | | 532 | | | | 516,659 | |
| | | |
| Marcel LUX IV S.a.r.l. | | | | | | | | | |
| | | |
Term Loan, Maturing September 26, 2025(2) | | | EUR | | | | 130 | | | | 145,387 | |
| | | |
| TriTech Software Systems | | | | | | | | | |
| | | |
Term Loan, 6.25%, (1 mo. USD LIBOR + 3.75%), Maturing August 29, 2025 | | | | | | | 499 | | | | 492,204 | |
| | | |
| | | | | | | | | | | $ | 1,265,690 | |
|
| Financial Intermediaries — 0.4% | |
| | | |
| Peer Holding III B.V. | | | | | | | | | |
| | | |
Term Loan, 3.25%, (3 mo. EURIBOR + 3.25%), Maturing March 8, 2025 | | | EUR | | | | 200 | | | $ | 220,401 | |
| | | |
| | | | | | | | | | | $ | 220,401 | |
|
| Food Products — 0.4% | |
| | | |
| Refresco Group B.V. | | | | | | | | | |
| | | |
Term Loan, 3.25%, (3 mo. EURIBOR + 3.25%), Maturing March 28, 2025 | | | EUR | | | | 200 | | | $ | 220,999 | |
| | | |
| | | | | | | | | | | $ | 220,999 | |
|
| Health Care — 4.7% | |
| | | |
| Auris Luxembourg III S.a.r.l. | | | | | | | | | |
| | | |
Term Loan, Maturing February 27,
2026(2) | | | EUR | | | | 380 | | | $ | 428,830 | |
| | | |
| CTC AcquiCo GmbH | | | | | | | | | |
| | | |
Term Loan, 5.63%, (3 mo. USD LIBOR + 3.00%), Maturing March 7, 2025 | | | | | | | 191 | | | | 188,618 | |
| | | | |
| | 5 | | See Notes to Financial Statements. |
Eaton Vance
Oaktree Diversified Credit NextShares
March 31, 2019
Portfolio of Investments (Unaudited) — continued
| | | | | | | | | | | | |
| Borrower/Tranche Description | | | | | Principal
Amount*
(000’s omitted) | | | Value | |
|
| Health Care (continued) | |
| | | |
| Envision Healthcare Corporation | | | | | | | | | |
| | | |
Term Loan, 6.25%, (1 mo. USD LIBOR + 3.75%), Maturing October 10, 2025 | | | | | | | 499 | | | $ | 467,474 | |
| | | |
| Gentiva Health Services, Inc. | | | | | | | | | |
| | | |
Term Loan, 6.25%, (1 mo. USD LIBOR + 3.75%), Maturing July 2, 2025 | | | | | | | 276 | | | | 275,881 | |
| | | |
| Innoviva, Inc. | | | | | | | | | |
| | | |
Term Loan, 7.14%, (3 mo. USD LIBOR + 4.50%), Maturing August 11, 2022 | | | | | | | 41 | | | | 40,837 | |
| | | |
| Pearl Intermediate Parent, LLC | | | | | | | | | |
| | | |
Term Loan, 4.23%, (1 mo. USD LIBOR + 2.75%), Maturing February 14, 2025(3) | | | | | | | 226 | | | | 214,368 | |
| | | |
Term Loan, 5.24%, (1 mo. USD LIBOR + 2.75%), Maturing February 14, 2025 | | | | | | | 765 | | | | 724,837 | |
| | | |
| | | | | | | | | | | $ | 2,340,845 | |
|
| Industrial Equipment — 0.3% | |
| | | |
| TI Luxembourg S.A. | | | | | | | | | |
| | | |
Term Loan, 3.50%, (3 mo. EURIBOR + 3.50%), Maturing February 14, 2025 | | | EUR | | | | 140 | | | $ | 156,731 | |
| | | |
| | | | | | | | | | | $ | 156,731 | |
|
| Leisure Goods / Activities / Movies — 0.3% | |
| | | |
| Amer Sports Oyj | | | | | | | | | |
| | | |
Term Loan, Maturing February 26, 2026(2) | | | EUR | | | | 150 | | | $ | 166,820 | |
| | | |
| | | | | | | | | | | $ | 166,820 | |
|
| Lodging and Casinos — 0.9% | |
| | | |
| Alpha Group S.a.r.l. | | | | | | | | | |
| | | |
Term Loan, 3.75%, (3 mo. EURIBOR + 3.75%), Maturing January 31, 2025 | | | EUR | | | | 200 | | | $ | 222,854 | |
| | | |
| Stars Group Holdings B.V. (The) | | | | | | | | | |
| | | |
Term Loan, 3.75%, (3 mo. EURIBOR + 3.75%), Maturing July 10, 2025 | | | EUR | | | | 200 | | | | 225,612 | |
| | | |
| | | | | | | | | | | $ | 448,466 | |
|
| Nonferrous Metals / Minerals — 1.0% | |
| | | |
| American Rock Salt Company, LLC | | | | | | | | | |
| | | |
Term Loan, 6.25%, (1 mo. USD LIBOR + 3.75%), Maturing March 21, 2025 | | | | | | | 495 | | | $ | 494,072 | |
| | | |
| | | | | | | | | | | $ | 494,072 | |
| | | | | | | | | | | | |
| Borrower/Tranche Description | | | | | Principal
Amount*
(000’s omitted) | | | Value | |
|
| Oil and Gas — 1.0% | |
| | | |
| HFOTCO, LLC | | | | | | | | | |
| | | |
Term Loan, 5.25%, (1 mo. USD LIBOR + 2.75%), Maturing June 26, 2025 | | | | | | | 496 | | | $ | 491,598 | |
| | | |
| | | | | | | | | | | $ | 491,598 | |
|
| Retailers (Except Food and Drug) — 0.4% | |
| | | |
| EG Group Limited | | | | | | | | | |
| | | |
Term Loan, 5.60%, (3 mo. GBP LIBOR + 4.75%), Maturing February 6, 2025 | | | GBP | | | | 149 | | | $ | 188,578 | |
| | | |
| | | | | | | | | | | $ | 188,578 | |
|
| Telecommunications — 1.1% | |
| | | |
| Securus Technologies Holdings, Inc. | | | | | | | | | |
| | | |
Term Loan, Maturing November 1, 2024(2) | | | | | | | 400 | | | $ | 398,127 | |
| | | |
| TDC A/S | | | | | | | | | |
| | | |
Term Loan, 2.75%, (1 mo. EURIBOR + 2.75%), Maturing June 4, 2025 | | | EUR | | | | 131 | | | | 146,976 | |
| | | |
| | | | | | | | | | | $ | 545,103 | |
|
| Utilities — 0.5% | |
| | | |
| Brookfield WEC Holdings, Inc. | | | | | | | | | |
| | | |
Term Loan - Second Lien, 9.25%, (1 mo. USD LIBOR + 6.75%), Maturing August 3, 2026 | | | | | | | 250 | | | $ | 251,094 | |
| | | |
| | | | | | | | | | | $ | 251,094 | |
| |
Total Senior Floating-Rate Loans
(identified cost $13,561,727) | | | $ | 13,145,689 | |
|
| Corporate Bonds & Notes — 37.6% | |
| Security | | | | | Principal
Amount*
(000’s omitted) | | | Value | |
|
| Aerospace & Defense — 0.4% | |
| | | |
| TransDigm, Inc. | | | | | | | | | |
| | | |
6.25%, 3/15/26(4) | | | | | | | 170 | | | $ | 176,800 | |
| | | |
| | | | | | | | | | | $ | 176,800 | |
|
| Agriculture — 0.4% | |
| | | |
| MHP SE | | | | | | | | | |
| | | |
7.75%, 5/10/24(5) | | | | | | | 200 | | | $ | 202,388 | |
| | | |
| | | | | | | | | | | $ | 202,388 | |
| | | | |
| | 6 | | See Notes to Financial Statements. |
Eaton Vance
Oaktree Diversified Credit NextShares
March 31, 2019
Portfolio of Investments (Unaudited) — continued
| | | | | | | | | | | | |
| Security | | | | | Principal
Amount*
(000’s omitted) | | | Value | |
|
| Apparel — 0.2% | |
| | | |
| Samsonite Finco S.a.r.l. | | | | | | | | | |
| | | |
3.50%, 5/15/26(5) | | | EUR | | | | 110 | | | $ | 123,701 | |
| | | |
| | | | | | | | | | | $ | 123,701 | |
|
| Automotive & Parts — 0.2% | |
| | | |
| IHO Verwaltungs GmbH | | | | | | | | | |
| | | |
2.75%, (2.75% cash or 3.50% PIK), 9/15/21(5)(6) | | | EUR | | | | 105 | | | $ | 119,506 | |
| | | |
| | | | | | | | | | | $ | 119,506 | |
|
| Building Materials — 0.4% | |
| | | |
Summit Materials, LLC/Summit Materials
Finance Corp. | | | | | | | | | |
| | | |
6.125%, 7/15/23 | | | | | | | 206 | | | $ | 211,325 | |
| | | |
| | | | | | | | | | | $ | 211,325 | |
|
| Chemicals — 1.2% | |
| | | |
| Axalta Coating Systems Dutch Holding B B.V. | | | | | | | | | |
| | | |
3.75%, 1/15/25(5) | | | EUR | | | | 105 | | | $ | 122,661 | |
| | | |
| Braskem Finance, Ltd. | | | | | | | | | |
| | | |
7.375% to 2/14/19(5)(7) | | | | | | | 75 | | | | 76,219 | |
| | | |
| Chemours Co. (The) | | | | | | | | | |
| | | |
4.00%, 5/15/26 | | | EUR | | | | 100 | | | | 113,880 | |
| | | |
| Kraton Polymers, LLC/Kraton Polymers Capital Corp. | | | | | | | | | |
| | | |
5.25%, 5/15/26(5) | | | EUR | | | | 105 | | | | 119,920 | |
| | | |
| Monitchem HoldCo 3 S.A. | | | | | | | | | |
| | | |
5.25%, 6/15/21(5) | | | EUR | | | | 150 | | | | 168,823 | |
| | | |
| | | | | | | | | | | $ | 601,503 | |
|
| Coal — 0.5% | |
| | | |
SunCoke Energy Partners, L.P./SunCoke
Energy Partners Finance Corp. | | | | | | | | | |
| | | |
7.50%, 6/15/25(4) | | | | | | | 224 | | | $ | 227,360 | |
| | | |
| | | | | | | | | | | $ | 227,360 | |
|
| Commercial Services — 2.8% | |
| | | |
| Arena Luxembourg Finance S.a.r.l. | | | | | | | | | |
| | | |
2.875%, 11/1/24(5) | | | EUR | | | | 105 | | | $ | 120,893 | |
| | | |
| Blitz F18-674 GmbH | | | | | | | | | |
| | | |
6.00%, 7/30/26(4) | | | EUR | | | | 100 | | | | 116,547 | |
| | | |
| Carriage Services, Inc. | | | | | | | | | |
| | | |
6.625%, 6/1/26(4) | | | | | | | 193 | | | | 198,307 | |
| | | |
| Herc Rentals, Inc. | | | | | | | | | |
| | | |
7.50%, 6/1/22(4) | | | | | | | 166 | | | | 173,470 | |
| | | |
7.75%, 6/1/24(4) | | | | | | | 45 | | | | 47,869 | |
| | | | | | | | | | | | |
| Security | | | | | Principal
Amount*
(000’s omitted) | | | Value | |
|
| Commercial Services (continued) | |
| | | |
| Intertrust Group B.V. | | | | | | | | | |
| | | |
3.375%, 11/15/25(5) | | | EUR | | | | 105 | | | $ | 120,827 | |
| | | |
| Nexi Capital SpA | | | | | | | | | |
| | | |
4.125%, 11/1/23(4) | | | EUR | | | | 105 | | | | 122,684 | |
| | | |
Prime Security Services Borrower, LLC/
Prime Finance, Inc. | | | | | | | | | |
| | | |
9.25%, 5/15/23(4) | | | | | | | 206 | | | | 216,815 | |
| | | |
| TMS International Corp. | | | | | | | | | |
| | | |
7.25%, 8/15/25(4) | | | | | | | 176 | | | | 170,900 | |
| | | |
| Verisure Holding AB | | | | | | | | | |
| | | |
3.50%, 5/15/23(5) | | | EUR | | | | 105 | | | | 122,070 | |
| | | |
| | | | | | | | | | | $ | 1,410,382 | |
|
| Computers — 0.8% | |
| | | |
| NCR Corp. | | | | | | | | | |
| | | |
6.375%, 12/15/23 | | | | | | | 370 | | | $ | 381,352 | |
| | | |
| | | | | | | | | | | $ | 381,352 | |
|
| Distribution & Wholesale — 0.3% | |
| | | |
| LKQ Italia Bondco SpA | | | | | | | | | |
| | | |
3.875%, 4/1/24(5) | | | EUR | | | | 105 | | | $ | 125,970 | |
| | | |
| | | | | | | | | | | $ | 125,970 | |
|
| Diversified Financial Services — 0.8% | |
| | | |
| LHC3 PLC | | | | | | | | | |
| | | |
4.125%, (4.125% cash or 4.875% PIK), 8/15/24(5)(6) | | | EUR | | | | 125 | | | $ | 142,497 | |
| | | |
| Lincoln Financing S.a.r.l. | | | | | | | | | |
| | | |
3.625%, 4/1/24(4)(8) | | | EUR | | | | 100 | | | | 113,367 | |
| | | |
| Vantiv, LLC/Vanity Issuer Corp. | | | | | | | | | |
| | | |
3.875%, 11/15/25(5) | | | GBP | | | | 110 | | | | 149,434 | |
| | | |
| | | | | | | | | | | $ | 405,298 | |
|
| Electric — 1.7% | |
| | | |
| AES Corp. (The) | | | | | | | | | |
| | | |
6.00%, 5/15/26 | | | | | | | 45 | | | $ | 47,924 | |
| | | |
| Clearway Energy Operating, LLC | | | | | | | | | |
| | | |
5.75%, 10/15/25(4) | | | | | | | 200 | | | | 201,500 | |
| | | |
| Genneia S.A. | | | | | | | | | |
| | | |
8.75%, 1/20/22(4) | | | | | | | 91 | | | | 82,810 | |
| | | |
8.75%, 1/20/22(5) | | | | | | | 322 | | | | 293,020 | |
| | | |
| Pampa Energia SA | | | | | | | | | |
| | | |
7.50%, 1/24/27(5) | | | | | | | 240 | | | | 213,048 | |
| | | |
| | | | | | | | | | | $ | 838,302 | |
| | | | |
| | 7 | | See Notes to Financial Statements. |
Eaton Vance
Oaktree Diversified Credit NextShares
March 31, 2019
Portfolio of Investments (Unaudited) — continued
| | | | | | | | | | | | |
| Security | | | | | Principal
Amount*
(000’s omitted) | | | Value | |
|
| Electrical Components & Equipment — 0.3% | |
| | | |
| Energizer Gamma Acquisition B.V. | | | | | | | | | |
| | | |
4.625%, 7/15/26(5) | | | EUR | | | | 140 | | | $ | 161,748 | |
| | | |
| | | | | | | | | | | $ | 161,748 | |
|
| Energy – Alternate Sources — 0.3% | |
| | | |
| Rio Energy S.A./UGEN S.A./UENSA S.A. | | | | | | | | | |
| | | |
6.875%, 2/1/25(5) | | | | | | | 200 | | | $ | 152,240 | |
| | | |
| | | | | | | | | | | $ | 152,240 | |
|
| Entertainment — 0.8% | |
| | | |
Cedar Fair L.P./Canada’s Wonderland Co./
Magnum Management Corp. | | | | | | | | | |
| | | |
5.375%, 6/1/24 | | | | | | | 120 | | | $ | 123,143 | |
| | | |
| CPUK Finance, Ltd. | | | | | | | | | |
| | | |
4.25%, 2/28/47(5) | | | GBP | | | | 110 | | | | 143,185 | |
| | | |
| WMG Acquisition Corp. | | | | | | | | | |
| | | |
5.00%, 8/1/23(4) | | | | | | | 45 | | | | 45,956 | |
| | | |
4.125%, 11/1/24(5) | | | EUR | | | | 90 | | | | 106,100 | |
| | | |
| | | | | | | | | | | $ | 418,384 | |
|
| Environmental Control — 0.5% | |
| | | |
| Covanta Holding Corp. | | | | | | | | | |
| | | |
5.875%, 3/1/24 | | | | | | | 231 | | | $ | 237,352 | |
| | | |
| | | | | | | | | | | $ | 237,352 | |
|
| Foods — 0.5% | |
| | | |
| Ingles Markets, Inc. | | | | | | | | | |
| | | |
5.75%, 6/15/23 | | | | | | | 125 | | | $ | 127,969 | |
| | | |
| Sigma Holdco B.V. | | | | | | | | | |
| | | |
5.75%, 5/15/26(5) | | | EUR | | | | 115 | | | | 121,589 | |
| | | |
| | | | | | | | | | | $ | 249,558 | |
|
| Forest Products & Paper — 0.9% | |
| | | |
| Mercer International, Inc. | | | | | | | | | |
| | | |
7.375%, 1/15/25(4) | | | | | | | 310 | | | $ | 326,275 | |
| | | |
| WEPA Hygieneprodukte GmbH | | | | | | | | | |
| | | |
3.75%, 5/15/24(5) | | | EUR | | | | 110 | | | | 125,243 | |
| | | |
| | | | | | | | | | | $ | 451,518 | |
|
| Health Care – Services — 0.6% | |
| | | |
| CHS/Community Health Systems, Inc. | | | | | | | | | |
| | | |
6.25%, 3/31/23 | | | | | | | 104 | | | $ | 98,020 | |
| | | | | | | | | | | | |
| Security | | | | | Principal
Amount*
(000’s omitted) | | | Value | |
|
| Health Care – Services (continued) | |
| | | |
| MPH Acquisition Holdings, LLC | | | | | | | | | |
| | | |
7.125%, 6/1/24(4) | | | | | | | 227 | | | $ | 227,000 | |
| | | |
| | | | | | | | | | | $ | 325,020 | |
|
| Home Builders — 1.0% | |
| | | |
| Century Communities, Inc. | | | | | | | | | |
| | | |
5.875%, 7/15/25 | | | | | | | 250 | | | $ | 238,750 | |
| | | |
| KB Home | | | | | | | | | |
| | | |
6.875%, 6/15/27 | | | | | | | 250 | | | | 258,125 | |
| | | |
| | | | | | | | | | | $ | 496,875 | |
|
| Household Products — 0.7% | |
| | | |
| Diamond BC B.V. | | | | | | | | | |
| | | |
5.625%, 8/15/25(5) | | | EUR | | | | 120 | | | $ | 126,803 | |
| | | |
| Prestige Brands, Inc. | | | | | | | | | |
| | | |
6.375%, 3/1/24(4) | | | | | | | 203 | | | | 207,567 | |
| | | |
| | | | | | | | | | | $ | 334,370 | |
|
| Insurance — 1.0% | |
| | | |
| Hub International, Ltd. | | | | | | | | | |
| | | |
7.00%, 5/1/26(4) | | | | | | | 177 | | | $ | 175,672 | |
| | | |
| Nationstar Mortgage Holdings, Inc. | | | | | | | | | |
| | | |
8.125%, 7/15/23(4) | | | | | | | 294 | | | | 303,555 | |
| | | |
| | | | | | | | | | | $ | 479,227 | |
|
| Iron & Steel — 1.0% | |
| | | |
| Metinvest B.V. | | | | | | | | | |
| | | |
8.50%, 4/23/26(4) | | | | | | | 500 | | | $ | 492,685 | |
| | | |
| | | | | | | | | | | $ | 492,685 | |
|
| Machinery – Diversified — 0.4% | |
| | | |
| Tennant Co. | | | | | | | | | |
| | | |
5.625%, 5/1/25 | | | | | | | 176 | | | $ | 178,200 | |
| | | |
| | | | | | | | | | | $ | 178,200 | |
|
| Media — 1.7% | |
| | | |
| Altice France S.A. | | | | | | | | | |
| | | |
5.625%, 5/15/24(5) | | | EUR | | | | 100 | | | $ | 115,990 | |
| | | |
| Sirius XM Radio, Inc. | | | | | | | | | |
| | | |
5.375%, 4/15/25(4) | | | | | | | 95 | | | | 97,850 | |
| | | |
| Tele Columbus AG | | | | | | | | | |
| | | |
3.875%, 5/2/25(5) | | | EUR | | | | 110 | | | | 110,911 | |
| | | | |
| | 8 | | See Notes to Financial Statements. |
Eaton Vance
Oaktree Diversified Credit NextShares
March 31, 2019
Portfolio of Investments (Unaudited) — continued
| | | | | | | | | | | | |
| Security | | | | | Principal
Amount*
(000’s omitted) | | | Value | |
|
| Media (continued) | |
| | | |
| Telenet Finance VI Luxembourg SCA | | | | | | | | | |
| | | |
4.875%, 7/15/27(5) | | | EUR | | | | 117 | | | $ | 141,343 | |
| | | |
| UPCB Finance IV, Ltd. | | | | | | | | | |
| | | |
4.00%, 1/15/27(5) | | | EUR | | | | 104 | | | | 121,833 | |
| | | |
| Virgin Media Receivables Financing Notes I DAC | | | | | | | | | |
| | | |
5.50%, 9/15/24(5) | | | GBP | | | | 100 | | | | 131,368 | |
| | | |
| Ziggo Bond Co., B.V. | | | | | | | | | |
| | | |
4.625%, 1/15/25(5) | | | EUR | | | | 100 | | | | 115,563 | |
| | | |
| | | | | | | | | | | $ | 834,858 | |
|
| Metal Fabricate & Hardware — 0.7% | |
| | | |
| Grinding Media, Inc./Moly-Cop AltaSteel, Ltd. | | | | | | | | | |
| | | |
7.375%, 12/15/23(4) | | | | | | | 379 | | | $ | 365,735 | |
| | | |
| | | | | | | | | | | $ | 365,735 | |
|
| Oil & Gas — 3.9% | |
| | | |
Archrock Partners L.P./Archrock
Partners Finance Corp. | | | | | | | | | |
| | | |
6.875%, 4/1/27(4) | | | | | | | 50 | | | $ | 51,110 | |
| | | |
| CITGO Petroleum Corp. | | | | | | | | | |
| | | |
6.25%, 8/15/22(4) | | | | | | | 375 | | | | 374,062 | |
| | | |
| Comstock Escrow Corp. | | | | | | | | | |
| | | |
9.75%, 8/15/26(4) | | | | | | | 160 | | | | 148,000 | |
| | | |
| Northern Oil and Gas, Inc. | | | | | | | | | |
| | | |
9.50%, (8.50% cash and 1.00% PIK), 5/15/23 | | | | | | | 190 | | | | 197,600 | |
| | | |
| Oasis Petroleum, Inc. | | | | | | | | | |
| | | |
6.875%, 1/15/23 | | | | | | | 199 | | | | 199,498 | |
| | | |
| Rio Oil Finance Trust | | | | | | | | | |
| | | |
8.20%, 4/6/28(5) | | | | | | | 250 | | | | 271,190 | |
| | | |
| UGI International, LLC | | | | | | | | | |
| | | |
3.25%, 11/1/25(5) | | | EUR | | | | 105 | | | | 122,466 | |
| | | |
| YPF S.A. | | | | | | | | | |
| | | |
8.75%, 4/4/24(5) | | | | | | | 142 | | | | 143,065 | |
| | | |
6.95%, 7/21/27(5) | | | | | | | 508 | | | | 453,009 | |
| | | |
| | | | | | | | | | | $ | 1,960,000 | |
|
| Packaging & Containers — 1.7% | |
| | | |
| ARD Finance S.A. | | | | | | | | | |
| | | |
6.625%, (6.625% cash or 7.375% PIK), 9/15/23(6) | | | EUR | | | | 100 | | | $ | 113,901 | |
| | | |
| BWAY Holding Co. | | | | | | | | | |
| | | |
5.50%, 4/15/24(4) | | | | | | | 256 | | | | 255,117 | |
| | | |
Reynolds Group Issuer, Inc./Reynolds
Group Issuer, LLC | | | | | | | | | |
| | | |
7.00%, 7/15/24(4) | | | | | | | 329 | | | | 339,528 | |
| | | | | | | | | | | | |
| Security | | | | | Principal
Amount*
(000’s omitted) | | | Value | |
|
| Packaging & Containers (continued) | |
| | | |
| Silgan Holdings, Inc. | | | | | | | | | |
| | | |
3.25%, 3/15/25 | | | EUR | | | | 105 | | | $ | 121,965 | |
| | | |
| | | | | | | | | | | $ | 830,511 | |
|
| Pharmaceuticals — 1.0% | |
| | | |
| Bausch Health Companies, Inc. | | | | | | | | | |
| | | |
5.875%, 5/15/23(4) | | | | | | | 159 | | | $ | 161,186 | |
| | | |
8.50%, 1/31/27(4) | | | | | | | 45 | | | | 47,813 | |
| | | |
| Grifols S.A. | | | | | | | | | |
| | | |
3.20%, 5/1/25(5) | | | EUR | | | | 150 | | | | 171,480 | |
| | | |
| Nidda Healthcare Holding GmbH | | | | | | | | | |
| | | |
3.50%, 9/30/24(5) | | | EUR | | | | 130 | | | | 145,038 | |
| | | |
| | | | | | | | | | | $ | 525,517 | |
|
| Pipelines — 0.8% | |
| | | |
| Transportadora de Gas del Sur S.A. | | | | | | | | | |
| | | |
6.75%, 5/2/25(5) | | | | | | | 450 | | | $ | 425,700 | |
| | | |
| | | | | | | | | | | $ | 425,700 | |
|
| Real Estate — 1.5% | |
| | | |
| Hunt Cos., Inc. | | | | | | | | | |
| | | |
6.25%, 2/15/26(4) | | | | | | | 258 | | | $ | 241,230 | |
| | | |
| Kennedy-Wilson, Inc. | | | | | | | | | |
| | | |
5.875%, 4/1/24 | | | | | | | 525 | | | | 524,344 | |
| | | |
| | | | | | | | | | | $ | 765,574 | |
|
| Real Estate Investment Trusts (REITs) — 0.3% | |
| | | |
| Geo Group, Inc. (The) | | | | | | | | | |
| | | |
5.125%, 4/1/23 | | | | | | | 152 | | | $ | 135,660 | |
| | | |
| | | | | | | | | | | $ | 135,660 | |
|
| Retail — 0.7% | |
| | | |
| FirstCash, Inc. | | | | | | | | | |
| | | |
5.375%, 6/1/24(4) | | | | | | | 95 | | | $ | 97,613 | |
| | | |
Suburban Propane Partners L.P./Suburban Energy
Finance Corp. | | | | | | | | | |
| | | |
5.50%, 6/1/24 | | | | | | | 160 | | | | 156,656 | |
| | | |
5.75%, 3/1/25 | | | | | | | 100 | | | | 97,250 | |
| | | |
| | | | | | | | | | | $ | 351,519 | |
|
| Software — 0.9% | |
| | | |
| First Data Corp. | | | | | | | | | |
| | | |
5.75%, 1/15/24(4) | | | | | | | 95 | | | $ | 98,040 | |
| | | | |
| | 9 | | See Notes to Financial Statements. |
Eaton Vance
Oaktree Diversified Credit NextShares
March 31, 2019
Portfolio of Investments (Unaudited) — continued
| | | | | | | | | | | | |
| Security | | | | | Principal
Amount*
(000’s omitted) | | | Value | |
|
| Software (continued) | |
| | | |
| InterXion Holding N.V. | | | | | | | | | |
| | | |
4.75%, 6/15/25(4) | | | EUR | | | | 105 | | | $ | 125,204 | |
| | | |
| TeamSystem SpA | | | | | | | | | |
| | | |
4.00%, (3 mo. EURIBOR + 4.00%), 4/15/23(4)(9) | | | EUR | | | | 200 | | | | 225,472 | |
| | | |
| | | | | | | | | | | $ | 448,716 | |
|
| Telecommunications — 5.1% | |
| | | |
| CommScope, Inc. | | | | | | | | | |
| | | |
5.50%, 3/1/24(4) | | | | | | | 40 | | | $ | 41,012 | |
| | | |
5.50%, 6/15/24(4) | | | | | | | 231 | | | | 227,038 | |
| | | |
| Frontier Communications Corp. | | | | | | | | | |
| | | |
8.50%, 4/1/26(4) | | | | | | | 135 | | | | 125,719 | |
| | | |
8.00%, 4/1/27(4) | | | | | | | 90 | | | | 93,150 | |
| | | |
| Intelsat Jackson Holdings S.A. | | | | | | | | | |
| | | |
8.00%, 2/15/24(4) | | | | | | | 241 | | | | 251,845 | |
| | | |
8.50%, 10/15/24(4) | | | | | | | 70 | | | | 68,425 | |
| | | |
| Level 3 Financing, Inc. | | | | | | | | | |
| | | |
5.375%, 1/15/24 | | | | | | | 273 | | | | 278,760 | |
| | | |
| Oi S.A. | | | | | | | | | |
| | | |
10.00%, (10.00% cash or 8.00% cash and 4.00% PIK), 7/27/25(6) | | | | | | | 497 | | | | 526,820 | |
| | | |
| Plantronics, Inc. | | | | | | | | | |
| | | |
5.50%, 5/31/23(4) | | | | | | | 381 | | | | 382,905 | |
| | | |
| SES S.A. | | | | | | | | | |
| | | |
4.625% to 1/2/22(5)(7)(10) | | | EUR | | | | 100 | | | | 117,634 | |
| | | |
| Sprint Communications, Inc. | | | | | | | | | |
| | | |
6.00%, 11/15/22 | | | | | | | 99 | | | | 100,020 | |
| | | |
| Sprint Corp. | | | | | | | | | |
| | | |
7.125%, 6/15/24 | | | | | | | 197 | | | | 200,447 | |
| | | |
| Telecom Italia SpA | | | | | | | | | |
| | | |
3.25%, 1/16/23(5) | | | EUR | | | | 105 | | | | 123,387 | |
| | | |
| | | | | | | | | | | $ | 2,537,162 | |
|
| Transportation — 0.9% | |
| | | |
| Moto Finance PLC | | | | | | | | | |
| | | |
4.50%, 10/1/22(5) | | | GBP | | | | 100 | | | $ | 128,128 | |
| | | |
| Watco Cos., LLC/Watco Finance Corp. | | | | | | | | | |
| | | |
6.375%, 4/1/23(4) | | | | | | | 323 | | | | 326,230 | |
| | | |
| | | | | | | | | | | $ | 454,358 | |
| | | | | | | | | | | | |
| Security | | | | | Principal
Amount*
(000’s omitted) | | | Value | |
|
| Trucking & Leasing — 0.7% | |
| | | |
| DAE Funding, LLC | | | | | | | | | |
| | | |
5.25%, 11/15/21(4) | | | | | | | 362 | | | $ | 370,145 | |
| | | |
| | | | | | | | | | | $ | 370,145 | |
| |
Total Corporate Bonds & Notes
(identified cost $18,862,824) | | | $ | 18,806,519 | |
|
| Foreign Government Bonds — 1.3% | |
| Security | | | | | Principal
Amount
(000’s omitted) | | | Value | |
|
| Argentina — 1.3% | |
| | | |
Province of Neuquen, 8.625%, 5/12/28(5) | | | | | | $ | 150 | | | $ | 142,500 | |
| | | |
Provincia de Buenos Aires, 6.50%, 2/15/23(5) | | | | | | | 225 | | | | 183,937 | |
| | | |
Provincia del Chubut Argentina, 7.75%, 7/26/26(5) | | | | | | | 150 | | | | 118,875 | |
| | | |
Republic of Argentina, 5.875%, 1/11/28 | | | | | | | 100 | | | | 77,013 | |
| | | |
Republic of Argentina, 6.625%, 7/6/28 | | | | | | | 150 | | | | 118,464 | |
| |
Total Foreign Government Bonds
(identified cost $668,268) | | | $ | 640,789 | |
|
| Convertible Bonds — 8.7% | |
| Security | | | | | Principal
Amount*
(000’s omitted) | | | Value | |
|
| Banks — 0.1% | |
| | | |
| Hope Bancorp, Inc. | | | | | | | | | |
| | | |
2.00%, 5/15/38(4) | | | | | | | 60 | | | $ | 53,086 | |
| | | |
| | | | | | | | | | | $ | 53,086 | |
|
| Biotechnology — 0.1% | |
| | | |
| Acorda Therapeutics, Inc. | | | | | | | | | |
| | | |
1.75%, 6/15/21 | | | | | | | 55 | | | $ | 48,812 | |
| | | |
| | | | | | | | | | | $ | 48,812 | |
|
| Building Materials — 0.2% | |
| | | |
| Cemex SAB de CV | | | | | | | | | |
| | | |
3.72%, 3/15/20 | | | | | | | 50 | | | $ | 49,883 | |
| | | |
| Patrick Industries, Inc. | | | | | | | | | |
| | | |
1.00%, 2/1/23 | | | | | | | 65 | | | | 58,338 | |
| | | |
| | | | | | | | | | | $ | 108,221 | |
| | | | |
| | 10 | | See Notes to Financial Statements. |
Eaton Vance
Oaktree Diversified Credit NextShares
March 31, 2019
Portfolio of Investments (Unaudited) — continued
| | | | | | | | | | | | |
| Security | | | | | Principal
Amount*
(000’s omitted) | | | Value | |
|
| Commercial Services — 0.5% | |
| | | |
| Cardtronics, Inc. | | | | | | | | | |
| | | |
1.00%, 12/1/20 | | | | | | | 60 | | | $ | 59,587 | |
| | | |
| Euronet Worldwide, Inc. | | | | | | | | | |
| | | |
0.75%, 3/15/49(4) | | | | | | | 11 | | | | 11,876 | |
| | | |
| FTI Consulting, Inc. | | | | | | | | | |
| | | |
2.00%, 8/15/23(4) | | | | | | | 20 | | | | 20,475 | |
| | | |
| Huron Consulting Group, Inc. | | | | | | | | | |
| | | |
1.25%, 10/1/19 | | | | | | | 80 | | | | 78,979 | |
| | | |
| Macquarie Infrastructure Corp. | | | | | | | | | |
| | | |
2.00%, 10/1/23 | | | | | | | 90 | | | | 79,540 | |
| | | |
| | | | | | | | | | | $ | 250,457 | |
|
| Computers — 0.2% | |
| | | |
| Western Digital Corp. | | | | | | | | | |
| | | |
1.50%, 2/1/24(4) | | | | | | | 95 | | | $ | 83,791 | |
| | | |
| | | | | | | | | | | $ | 83,791 | |
|
| Diversified Financial Services — 0.3% | |
| | | |
| Encore Capital Group, Inc. | | | | | | | | | |
| | | |
2.875%, 3/15/21 | | | | | | | 75 | | | $ | 69,286 | |
| | | |
| PRA Group, Inc. | | | | | | | | | |
| | | |
3.00%, 8/1/20 | | | | | | | 90 | | | | 87,096 | |
| | | |
3.50%, 6/1/23 | | | | | | | 15 | | | | 13,473 | |
| | | |
| | | | | | | | | | | $ | 169,855 | |
|
| Electric — 0.4% | |
| | | |
| China Yangtze Power International BVI1, Ltd. | | | | | | | | | |
| | | |
0.00%, 11/9/21(5) | | | | | | | 200 | | | $ | 219,050 | |
| | | |
| | | | | | | | | | | $ | 219,050 | |
|
| Electronics — 0.0%(11) | |
| | | |
| OSI Systems, Inc. | | | | | | | | | |
| | | |
1.25%, 9/1/22 | | | | | | | 15 | | | $ | 15,244 | |
| | | |
| | | | | | | | | | | $ | 15,244 | |
|
| Energy – Alternate Sources — 0.3% | |
| | | |
| Green Plains, Inc. | | | | | | | | | |
| | | |
4.125%, 9/1/22 | | | | | | | 50 | | | $ | 47,969 | |
| | | |
| NextEra Energy Partners, L.P. | | | | | | | | | |
| | | |
1.50%, 9/15/20(4) | | | | | | | 22 | | | | 21,955 | |
| | | |
| Pattern Energy Group, Inc. | | | | | | | | | |
| | | |
4.00%, 7/15/20 | | | | | | | 40 | | | | 40,275 | |
| | | | | | | | | | | | |
| Security | | | | | Principal
Amount*
(000’s omitted) | | | Value | |
|
| Energy – Alternate Sources (continued) | |
| | | |
| Tesla Energy Operations, Inc. | | | | | | | | | |
| | | |
1.625%, 11/1/19 | | | | | | | 45 | | | $ | 43,561 | |
| | | |
| | | | | | | | | | | $ | 153,760 | |
|
| Health Care – Services — 0.2% | |
| | | |
| Korian S.A. | | | | | | | | | |
| | | |
2.50% to 1/1/23(5)(7)(10) | | | EUR | | | | 80 | | | $ | 97,963 | |
| | | |
| | | | | | | | | | | $ | 97,963 | |
|
| Holding Company – Diversified — 0.4% | |
| | | |
| RWT Holdings, Inc. | | | | | | | | | |
| | | |
5.625%, 11/15/19 | | | | | | | 60 | | | $ | 60,527 | |
| | | |
| Seven Group Holdings, Ltd. | | | | | | | | | |
| | | |
2.20%, 3/5/25(5) | | | AUD | | | | 200 | | | | 138,636 | |
| | | |
| | | | | | | | | | | $ | 199,163 | |
|
| Internet — 0.4% | |
| | | |
| Ctrip.com International, Ltd. | | | | | | | | | |
| | | |
1.25%, 9/15/22 | | | | | | | 55 | | | $ | 55,934 | |
| | | |
| Twitter, Inc. | | | | | | | | | |
| | | |
0.25%, 9/15/19 | | | | | | | 45 | | | | 44,365 | |
| | | |
0.25%, 6/15/24(4) | | | | | | | 10 | | | | 9,279 | |
| | | |
| Zillow Group, Inc. | | | | | | | | | |
| | | |
2.00%, 12/1/21 | | | | | | | 10 | | | | 10,252 | |
| | | |
1.50%, 7/1/23 | | | | | | | 60 | | | | 54,947 | |
| | | |
| | | | | | | | | | | $ | 174,777 | |
|
| Investment Companies — 0.1% | |
| | | |
| New Mountain Finance Corp. | | | | | | | | | |
| | | |
5.00%, 6/15/19 | | | | | | | 40 | | | $ | 40,102 | |
| | | |
| | | | | | | | | | | $ | 40,102 | |
|
| Iron & Steel — 0.5% | |
| | | |
| Angang Steel Co., Ltd. | | | | | | | | | |
| | | |
0.00%, 5/25/23(5) | | | HKD | | | | 2,000 | | | $ | 250,306 | |
| | | |
| | | | | | | | | | | $ | 250,306 | |
|
| Media — 0.1% | |
| | | |
| DISH Network Corp. | | | | | | | | | |
| | | |
2.375%, 3/15/24 | | | | | | | 50 | | | $ | 41,431 | |
| | | | |
| | 11 | | See Notes to Financial Statements. |
Eaton Vance
Oaktree Diversified Credit NextShares
March 31, 2019
Portfolio of Investments (Unaudited) — continued
| | | | | | | | | | | | |
| Security | | | | | Principal
Amount*
(000’s omitted) | | | Value | |
|
| Media (continued) | |
| | | |
| Liberty Media Corp. | | | | | | | | | |
| | | |
1.00%, 1/30/23 | | | | | | | 11 | | | $ | 12,347 | |
| | | |
2.25%, 12/1/48(4) | | | | | | | 15 | | | | 16,778 | |
| | | |
| | | | | | | | | | | $ | 70,556 | |
|
| Mining — 0.1% | |
| | | |
| SSR Mining, Inc. | | | | | | | | | |
| | | |
2.875%, 2/1/33 | | | | | | | 30 | | | $ | 30,156 | |
| | | |
| | | | | | | | | | | $ | 30,156 | |
|
| Miscellaneous Manufacturing — 0.5% | |
| | | |
| CRRC Corp., Ltd. | | | | | | | | | |
| | | |
0.00%, 2/5/21(5) | | | | | | | 250 | | | $ | 263,080 | |
| | | |
| | | | | | | | | | | $ | 263,080 | |
|
| Oil & Gas — 0.3% | |
| | | |
| Chesapeake Energy Corp. | | | | | | | | | |
| | | |
5.50%, 9/15/26 | | | | | | | 18 | | | $ | 16,724 | |
| | | |
| Ensco Jersey Finance, Ltd. | | | | | | | | | |
| | | |
3.00%, 1/31/24 | | | | | | | 70 | | | | 54,167 | |
| | | |
| Whiting Petroleum Corp. | | | | | | | | | |
| | | |
1.25%, 4/1/20 | | | | | | | 90 | | | | 87,224 | |
| | | |
| | | | | | | | | | | $ | 158,115 | |
|
| Oil & Gas Services — 0.1% | |
| | | |
| SEACOR Holdings, Inc. | | | | | | | | | |
| | | |
3.00%, 11/15/28 | | | | | | | 65 | | | $ | 63,697 | |
| | | |
| | | | | | | | | | | $ | 63,697 | |
|
| Pharmaceuticals — 0.3% | |
| | | |
| Herbalife Nutrition, Ltd. | | | | | | | | | |
| | | |
2.625%, 3/15/24 | | | | | | | 10 | | | $ | 10,591 | |
| | | |
| Teva Pharmaceutical Finance Co., LLC | | | | | | | | | |
| | | |
0.25%, 2/1/26 | | | | | | | 50 | | | | 46,346 | |
| | | |
| Toho Holdings Co., Ltd. | | | | | | | | | |
| | | |
0.00%, 6/23/23(5) | | | JPY | | | | 10,000 | | | | 93,747 | |
| | | |
| | | | | | | | | | | $ | 150,684 | |
|
| Pipelines — 0.1% | |
| | | |
| Cheniere Energy, Inc. | | | | | | | | | |
| | | |
4.875%, (0.00% cash and 4.875% PIK), 5/28/21(4)(6) | | | | | | | 20 | | | $ | 20,880 | |
| | | |
| | | | | | | | | | | $ | 20,880 | |
| | | | | | | | | | | | |
| Security | | | | | Principal
Amount*
(000’s omitted) | | | Value | |
|
| Real Estate — 0.5% | |
| | | |
| Consus Real Estate AG | | | | | | | | | |
| | | |
4.00%, 11/29/22(5) | | | EUR | | | | 100 | | | $ | 98,446 | |
| | | |
| Forestar Group, Inc. | | | | | | | | | |
| | | |
3.75%, 3/1/20 | | | | | | | 65 | | | | 64,935 | |
| | | |
| Nexity S.A. | | | | | | | | | |
| | | |
0.125%, 1/1/23(5) | | | EUR | | | | 85 | | | | 62,657 | |
| | | |
| | | | | | | | | | | $ | 226,038 | |
|
| Real Estate Investment Trusts (REITs) — 1.8% | |
| | | |
| Arbor Realty Trust, Inc. | | | | | | | | | |
| | | |
5.25%, 7/1/21(4) | | | | | | | 50 | | | $ | 52,078 | |
| | | |
| Blackstone Mortgage Trust, Inc. | | | | | | | | | |
| | | |
4.375%, 5/5/22 | | | | | | | 25 | | | | 25,317 | |
| | | |
| Colony Capital, Inc. | | | | | | | | | |
| | | |
3.875%, 1/15/21 | | | | | | | 326 | | | | 311,758 | |
| | | |
| Cromwell SPV Finance Pty, Ltd. | | | | | | | | | |
| | | |
2.50%, 3/29/25(5) | | | EUR | | | | 100 | | | | 110,913 | |
| | | |
| Empire State Realty OP L.P. | | | | | | | | | |
| | | |
2.625%, 8/15/19(4) | | | | | | | 50 | | | | 49,818 | |
| | | |
| Extra Space Storage L.P. | | | | | | | | | |
| | | |
3.125%, 10/1/35(4) | | | | | | | 20 | | | | 23,024 | |
| | | |
| KKR Real Estate Finance Trust, Inc. | | | | | | | | | |
| | | |
6.125%, 5/15/23(4) | | | | | | | 80 | | | | 82,016 | |
| | | |
| New York Mortgage Trust, Inc. | | | | | | | | | |
| | | |
6.25%, 1/15/22 | | | | | | | 75 | | | | 75,128 | |
| | | |
| PennyMac Corp. | | | | | | | | | |
| | | |
5.375%, 5/1/20 | | | | | | | 85 | | | | 85,393 | |
| | | |
| Two Harbors Investment Corp. | | | | | | | | | |
| | | |
6.25%, 1/15/22 | | | | | | | 65 | | | | 65,806 | |
| | | |
| | | | | | | | | | | $ | 881,251 | |
|
| Retail — 0.5% | |
| | | |
| Carrefour S.A. | | | | | | | | | |
| | | |
0.00%, 3/27/24(5) | | | | | | | 200 | | | $ | 188,700 | |
| | | |
| Vitamin Shoppe, Inc. | | | | | | | | | |
| | | |
2.25%, 12/1/20 | | | | | | | 45 | | | | 40,333 | |
| | | |
| | | | | | | | | | | $ | 229,033 | |
|
| Semiconductors — 0.5% | |
| | | |
| STMicroelectronics N.V. | | | | | | | | | |
| | | |
0.25%, 7/3/24(5) | | | | | | | 200 | | | $ | 207,008 | |
| | | |
| Veeco Instruments, Inc. | | | | | | | | | |
| | | |
2.70%, 1/15/23 | | | | | | | 65 | | | | 55,769 | |
| | | |
| | | | | | | | | | | $ | 262,777 | |
| | | | |
| | 12 | | See Notes to Financial Statements. |
Eaton Vance
Oaktree Diversified Credit NextShares
March 31, 2019
Portfolio of Investments (Unaudited) — continued
| | | | | | | | | | | | |
| Security | | | | | Principal
Amount*
(000’s omitted) | | | Value | |
|
| Software — 0.1% | |
| | | |
| Guidewire Software, Inc. | | | | | | | | | |
| | | |
1.25%, 3/15/25 | | | | | | | 15 | | | $ | 16,365 | |
| | | |
| Nuance Communications, Inc. | | | | | | | | | |
| | | |
1.25%, 4/1/25 | | | | | | | 19 | | | | 18,894 | |
| | | |
| Pluralsight, Inc. | | | | | | | | | |
| | | |
0.375%, 3/1/24(4) | | | | | | | 11 | | | | 11,795 | |
| | | |
| | | | | | | | | | | $ | 47,054 | |
|
| Telecommunications — 0.0%(11) | |
| | | |
| Viavi Solutions, Inc. | | | | | | | | | |
| | | |
1.00%, 3/1/24 | | | | | | | 10 | | | $ | 11,295 | |
| | | |
| | | | | | | | | | | $ | 11,295 | |
|
| Transportation — 0.0%(11) | |
| | | |
| Air Transport Services Group, Inc. | | | | | | | | | |
| | | |
1.125%, 10/15/24 | | | | | | | 15 | | | $ | 15,036 | |
| | | |
| | | | | | | | | | | $ | 15,036 | |
|
| Venture Capital — 0.1% | |
| | | |
| Hercules Capital, Inc. | | | | | | | | | |
| | | |
4.375%, 2/1/22 | | | | | | | 55 | | | $ | 53,854 | |
| | | |
| | | | | | | | | | | $ | 53,854 | |
| | | |
Total Convertible Bonds
(identified cost $4,363,486) | | | | | | | | | | $ | 4,348,093 | |
|
| Asset-Backed Securities — 12.2% | |
| Security | | | | | Principal
Amount
(000’s omitted) | | | Value | |
| | | |
| BlueMountain CLO, Ltd. | | | | | | | | | |
| | | |
Series 2013-2A, Class ER, 9.061%, (3 mo. USD LIBOR + 6.30%),
10/22/30(4)(9) | | | | | | $ | 350 | | | $ | 331,383 | |
| | | |
| BSPRT Issuer, Ltd. | | | | | | | | | |
| | | |
Series 2017-FL1, Class C, 6.74%, (1 mo. USD LIBOR + 4.25%), 6/15/27(4)(9) | | | | | | | 168 | | | | 168,279 | |
| | | |
| CIFC Funding, Ltd. | | | | | | | | | |
| | | |
Series 2018-4X, Class E, 10.28%, (3 mo. USD LIBOR + 7.70%),
10/17/31(5)(9) | | | | | | | 325 | | | | 298,051 | |
| | | |
| InSite Issuer, LLC | | | | | | | | | |
| | | |
Series 2018-1A, Class C, 6.115%, 12/15/48(4) | | | | | | | 305 | | | | 314,464 | |
| | | | | | | | | | |
| Security | | | | Principal
Amount
(000’s omitted) | | | Value | |
| | | |
| MidOcean Credit CLO | | | | | | | | |
| | | |
Series 2014-3A, Class ER, 8.961%, (3 mo. USD LIBOR + 6.20%), 4/21/31(4)(9) | | | | $ | 500 | | | $ | 472,922 | |
| | | |
Series 2017-7A, Class F, 10.887%, (3 mo. USD LIBOR + 8.10%), 7/15/29(4)(9) | | | | | 750 | | | | 704,847 | |
| | | |
| Nassau, Ltd. | | | | | | | | |
| | | |
Series 2017-IIA, Class D, 5.467%, (3 mo. USD LIBOR + 2.68%), 1/15/30(4)(9) | | | | | 550 | | | | 511,925 | |
| | | |
| Octagon Investment Partners XIV, Ltd. | | | | | | | | |
| | | |
Series 2012-1A, Class ER, 11.137%, (3 mo. USD LIBOR + 8.35%), 7/15/29(4)(9) | | | | | 750 | | | | 706,278 | |
| | | |
| OZLM, Ltd. | | | | | | | | |
| | | |
Series 2017-17A, Class D, 8.751%, (3 mo. USD LIBOR + 5.99%), 7/20/30(4)(9) | | | | | 250 | | | | 242,506 | |
| | | |
| Regatta X Funding, Ltd. | | | | | | | | |
| | | |
Series 2017-3A, Class D, 5.523%, (3 mo. USD LIBOR + 2.75%), 1/17/31(4)(9) | | | | | 250 | | | | 238,821 | |
| | | |
| Saranac CLO VII, Ltd. | | | | | | | | |
| | | |
Series 2014-2A, Class ER, 9.364%, (3 mo. USD LIBOR + 6.72%), 11/20/29(4)(9) | | | | | 100 | | | | 97,559 | |
| | | |
| Shackleton CLO, Ltd. | | | | | | | | |
| | | |
Series 2013-3A, Class ER, 8.667%, (3 mo. USD LIBOR + 5.88%), 7/15/30(4)(9) | | | | | 250 | | | | 236,820 | |
| | | |
| THL Credit Wind River | | | | | | | | |
| | | |
Series 2019-1A, Class E, (3 mo. USD LIBOR + 6.72%), 4/20/31(4)(8)(9) | | | | | 350 | | | | 345,453 | |
| | | |
| TICP CLO I, Ltd. | | | | | | | | |
| | | |
Series 2015-1A, Class DR, 5.261%, (3 mo. USD LIBOR + 2.50%), 7/20/27(4)(9) | | | | | 500 | | | | 482,767 | |
| | | |
| Tralee CLO IV, Ltd. | | | | | | | | |
| | | |
Series 2017-4A, Class E, 8.861%, (3 mo. USD LIBOR + 6.10%), 1/20/30(4)(9) | | | | | 1,000 | | | | 945,422 | |
| | | |
Total Asset-Backed Securities
(identified cost $6,315,095) | | | | | | | | $ | 6,097,497 | |
|
| Commercial Mortgage-Backed Securities — 9.8% | |
| Security | | | | Principal
Amount
(000’s omitted) | | | Value | |
| | | |
| BHMS | | | | | | | | |
| | | |
Series 2018-ATLS, Class E, 5.484%, (1 mo. USD LIBOR + 3.00%), 7/15/35(4)(9) | | | | $ | 300 | | | $ | 298,239 | |
| | | |
| BX Trust | | | | | | | | |
| | | |
Series 2017-IMC, Class G, 7.984%, (1 mo. USD LIBOR + 5.50%), 10/15/32(4)(9) | | | | | 125 | | | | 124,757 | |
| | | |
| CFCRE Commercial Mortgage Trust | | | | | | | | |
| | | |
Series 2018-TAN, Class E, 6.446%, 2/15/33(4) | | | | | 660 | | | | 678,865 | |
| | | | |
| | 13 | | See Notes to Financial Statements. |
Eaton Vance
Oaktree Diversified Credit NextShares
March 31, 2019
Portfolio of Investments (Unaudited) — continued
| | | | | | | | | | |
| Security | | | | Principal
Amount
(000’s omitted) | | | Value | |
| | | |
| CGGS Commercial Mortgage Trust | | | | | | | | |
| | | |
Series 2018-WSS, Class E, 5.634%, (1 mo. USD LIBOR + 3.15%), 2/15/37(4)(9) | | | | $ | 300 | | | $ | 300,239 | |
| | | |
| Citigroup Commercial Mortgage Trust | | | | | | | | |
| | | |
Series 2018-TBR, Class F, 6.134%, (1 mo. USD LIBOR + 3.65%), 12/15/36(4)(9) | | | | | 400 | | | | 403,253 | |
| | | |
| Cosmopolitan Hotal Trust Mortgage Trust | | | | | | | | |
| | | |
Series 2017-CSMO, Class F, 6.225%, (1 mo. USD LIBOR + 3.74%),
11/15/36(4)(9) | | | | | 1,000 | | | | 1,006,948 | |
| | | |
| DBCCRE Mortgage Trust | | | | | | | | |
| | | |
Series 2014-ARCP, Class E, 4.935%, 1/10/34(4)(12) | | | | | 200 | | | | 190,676 | |
| | | |
| GS Mortgage Securities Corp. Trust | | | | | | | | |
| | | |
Series 2018-RIVR, Class H, 5.88%, (1 mo. USD LIBOR + 3.40%), 7/15/35(4)(9) | | | | | 300 | | | | 297,325 | |
| | | |
JPMorgan Chase Commercial Mortgage
Securities Trust | | | | | | | | |
| | | |
Series 2018-BCON, Class F, 3.756%, 1/5/31(4) | | | | | 240 | | | | 230,509 | |
| | | |
Series 2018-PTC, Class D, 5.604%, (1 mo. USD LIBOR + 3.12%), 4/15/31(4)(9) | | | | | 400 | | | | 401,852 | |
| | | |
| Rosslyn Portfolio Trust | | | | | | | | |
| | | |
Series 2017-ROSS, Class F, 6.234%, (1 mo. USD LIBOR + 3.75%), 6/15/33(4)(9) | | | | | 354 | | | | 352,661 | |
| | | |
| Toorak Mortgage Corp., Ltd. | | | | | | | | |
| | | |
Series 2018-1, Class A2, 4.949% to 4/25/21, 8/25/21(4)(13) | | | | | 150 | | | | 149,253 | |
| | | |
| UBS Commercial Mortgage Trust | | | | | | | | |
| | | |
Series 2018-NYCH, Class F, 6.305%, (1 mo. USD LIBOR + 3.82%), 2/15/32(4)(9) | | | | | 500 | | | | 502,702 | |
| | | |
Total Commercial Mortgage-Backed Securities
(identified cost $4,884,871) | | | | | | | | $ | 4,937,279 | |
| | | | | | | | | | |
| Short-Term Investments — 3.2% | |
| Description | | | | Units | | | Value | |
| | | |
Eaton Vance Cash Reserves Fund, LLC, 2.59%(14) | | | | | 1,589,684 | | | $ | 1,589,684 | |
| |
Total Short-Term Investments
(identified cost $1,589,684) | | | $ | 1,589,684 | |
| |
Total Investments — 99.1%
(identified cost $50,245,955) | | | $ | 49,565,550 | |
| |
Less Unfunded Loan Commitments — (0.1)% | | | $ | (53,917 | ) |
| |
Net Investments — 99.0%
(identified cost $50,192,038) | | | $ | 49,511,633 | |
| |
Other Assets, Less Liabilities — 1.0% | | | $ | 495,388 | |
| |
Net Assets — 100.0% | | | $ | 50,007,021 | |
The percentage shown for each investment category in the Portfolio of Investments is based on net assets.
| | * | In U.S. dollars unless otherwise indicated. |
| | (1) | Senior floating-rate loans (Senior Loans) often require prepayments from excess cash flows or permit the borrowers to repay at their election. The degree to which borrowers repay, whether as a contractual requirement or at their election, cannot be predicted with accuracy. As a result, the actual remaining maturity may be substantially less than the stated maturities shown. However, Senior Loans will typically have an expected average life of approximately two to four years. Senior Loans typically have rates of interest which are redetermined periodically by reference to a base lending rate, plus a spread. These base lending rates are primarily the London Interbank Offered Rate (“LIBOR”) and secondarily, the prime rate offered by one or more major United States banks (the “Prime Rate”). Base lending rates may be subject to a floor, or minimum rate. |
| | (2) | This Senior Loan will settle after March 31, 2019, at which time the interest rate will be determined. |
| | (3) | Unfunded or partially unfunded loan commitments. The stated interest rate reflects the weighted average of the reference rate and spread for the funded portion, if any, and the commitment fees on the portion of the loan that is unfunded. See Note 1G for description. |
| | (4) | Security exempt from registration pursuant to Rule 144A under the Securities Act of 1933, as amended. These securities may be sold in certain transactions in reliance on an exemption from registration (normally to qualified institutional buyers). At March 31, 2019, the aggregate value of these securities is $19,335,144 or 38.7% of the Fund’s net assets. |
| | (5) | Security exempt from registration under Regulation S of the Securities Act of 1933, which exempts from registration securities offered and sold outside the United States. Security may not be offered or sold in the United States except pursuant to an exemption from, or in a transaction not subject to, the registration requirements of the Securities Act of 1933. At March 31, 2019, the aggregate value of these securities is $8,469,859 or 16.9% of the Fund’s net assets. |
| | (6) | Represents a payment-in-kind security which may pay interest in additional principal at the issuer’s discretion. |
| | | | |
| | 14 | | See Notes to Financial Statements. |
Eaton Vance
Oaktree Diversified Credit NextShares
March 31, 2019
Portfolio of Investments (Unaudited) — continued
| | (7) | Perpetual security with no stated maturity date but may be subject to calls by the issuer. |
| | (8) | When-issued security. For a variable rate security, interest rate will be determined after March 31, 2019. |
| | (9) | Variable rate security. The stated interest rate represents the rate in effect at March 31, 2019. |
| (10) | Security converts to floating rate after the indicated fixed-rate coupon period. |
| (11) | Amount is less than 0.05%. |
| (12) | Weighted average fixed-rate coupon that changes/updates monthly. Rate shown is the rate at March 31, 2019. |
| (13) | Step coupon bond. Interest rate represents the rate in effect at March 31, 2019. |
| (14) | Affiliated investment company, available to Eaton Vance portfolios and funds, which invests in high quality, U.S. dollar denominated money market instruments. The rate shown is the annualized seven-day yield as of March 31, 2019. |
| | | | | | | | |
| Currency Concentration of Portfolio | |
| Currency | | Percentage
of Net Assets | | | Value | |
| | |
United States Dollar | | | 80.9 | % | | $ | 40,484,626 | |
| | |
Euro | | | 15.7 | | | | 7,857,542 | |
| | |
British Pound Sterling | | | 1.5 | | | | 740,693 | |
| | |
Other currency, less than 1% each | | | 1.0 | | | | 482,689 | |
| | |
Total Investments | | | 99.1 | % | | $ | 49,565,550 | |
| | | | | | | | |
| Country Concentration of Portfolio | |
| Country | | Percentage
of Net Assets | | | Value | |
| | |
United States | | | 57.7 | % | | $ | 28,837,731 | |
| | |
Cayman Islands | | | 11.5 | | | | 5,761,693 | |
| | |
Argentina | | | 4.8 | | | | 2,403,681 | |
| | |
Luxembourg | | | 4.0 | | | | 2,018,289 | |
| | |
Netherlands | | | 3.4 | | | | 1,696,916 | |
| | |
Germany | | | 3.3 | | | | 1,634,028 | |
| | |
United Kingdom | | | 2.6 | | | | 1,318,348 | |
| | |
Canada | | | 2.1 | | | | 1,065,234 | |
| | |
Ukraine | | | 1.4 | | | | 695,073 | |
| | |
Italy | | | 1.2 | | | | 597,513 | |
| | |
China | | | 1.1 | | | | 569,320 | |
| | |
Brazil | | | 1.1 | | | | 526,820 | |
| | |
France | | | 0.9 | | | | 465,310 | |
| | |
United Arab Emirates | | | 0.7 | | | | 370,145 | |
| | |
New Zealand | | | 0.7 | | | | 339,528 | |
| | |
Australia | | | 0.5 | | | | 249,549 | |
| | |
British Virgin Islands | | | 0.4 | | | | 219,050 | |
| | |
Spain | | | 0.4 | | | | 171,480 | |
| | |
Finland | | | 0.3 | | | | 166,820 | |
| | |
Denmark | | | 0.3 | | | | 146,976 | |
| | |
Sweden | | | 0.3 | | | | 122,070 | |
| | |
Japan | | | 0.2 | | | | 93,747 | |
| | |
Mexico | | | 0.1 | | | | 49,883 | |
| | |
Israel | | | 0.1 | | | | 46,346 | |
| | |
Total Investments | | | 99.1 | % | | $ | 49,565,550 | |
| | | | | | | | | | | | | | | | | | | | | | | | |
| Forward Foreign Currency Exchange Contracts | |
| | | | | |
| Currency Purchased | | | Currency Sold | | | Counterparty | | Settlement
Date | | | Unrealized
Appreciation | | | Unrealized
(Depreciation) | |
| | | | | | | |
| AUD | | | 5,200 | | | USD | | | 3,694 | | | State Street Bank and Trust Company | | | 4/18/19 | | | $ | — | | | $ | (1 | ) |
| | | | | | | |
| EUR | | | 13,800 | | | USD | | | 15,803 | | | State Street Bank and Trust Company | | | 4/18/19 | | | | — | | | | (302 | ) |
| | | | | | | |
| EUR | | | 42,600 | | | USD | | | 48,590 | | | State Street Bank and Trust Company | | | 4/18/19 | | | | — | | | | (738 | ) |
| | | | | | | |
| EUR | | | 98,200 | | | USD | | | 112,137 | | | State Street Bank and Trust Company | | | 4/18/19 | | | | — | | | | (1,832 | ) |
| | | | | | | |
| JPY | | | 10,900,000 | | | USD | | | 98,873 | | | State Street Bank and Trust Company | | | 4/18/19 | | | | — | | | | (387 | ) |
| | | | | | | |
| JPY | | | 11,414,000 | | | USD | | | 104,133 | | | State Street Bank and Trust Company | | | 4/18/19 | | | | — | | | | (1,003 | ) |
| | | | | | | |
| USD | | | 133,731 | | | AUD | | | 185,477 | | | State Street Bank and Trust Company | | | 4/18/19 | | | | 1,990 | | | | — | |
| | | | | | | |
| USD | | | 7,460 | | | AUD | | | 10,500 | | | State Street Bank and Trust Company | | | 4/18/19 | | | | 2 | | | | — | |
| | | | | | | |
| USD | | | 4,613 | | | AUD | | | 6,500 | | | State Street Bank and Trust Company | | | 4/18/19 | | | | — | | | | (4 | ) |
| | | | | | | |
| USD | | | 3,321,797 | | | EUR | | | 2,883,655 | | | State Street Bank and Trust Company | | | 4/18/19 | | | | 82,668 | | | | — | |
| | | | | | | |
| USD | | | 3,319,579 | | | EUR | | | 2,881,729 | | | State Street Bank and Trust Company | | | 4/18/19 | | | | 82,612 | | | | — | |
| | | | | | | |
| USD | | | 555,063 | | | EUR | | | 482,364 | | | State Street Bank and Trust Company | | | 4/18/19 | | | | 13,236 | | | | — | |
| | | | | | | |
| USD | | | 660,259 | | | EUR | | | 584,053 | | | State Street Bank and Trust Company | | | 4/18/19 | | | | 4,208 | | | | — | |
| | | | | | | |
| USD | | | 185,303 | | | EUR | | | 162,914 | | | State Street Bank and Trust Company | | | 4/18/19 | | | | 2,307 | | | | — | |
| | | | | | | |
| USD | | | 107,811 | | | EUR | | | 94,500 | | | State Street Bank and Trust Company | | | 4/18/19 | | | | 1,662 | | | | — | |
| | | | |
| | 15 | | See Notes to Financial Statements. |
Eaton Vance
Oaktree Diversified Credit NextShares
March 31, 2019
Portfolio of Investments (Unaudited) — continued
| | | | | | | | | | | | | | | | | | | | | | | | |
| Forward Foreign Currency Exchange Contracts (continued) | |
| | | | | |
| Currency Purchased | | | Currency Sold | | | Counterparty | | Settlement
Date | | | Unrealized
Appreciation | | | Unrealized
(Depreciation) | |
| | | | | | | |
| USD | | | 20,457 | | | GBP | | | 15,499 | | | State Street Bank and Trust Company | | | 4/18/19 | | | $ | 253 | | | $ | — | |
| | | | | | | |
| USD | | | 535,831 | | | GBP | | | 415,289 | | | State Street Bank and Trust Company | | | 4/18/19 | | | | — | | | | (5,501 | ) |
| | | | | | | |
| USD | | | 538,954 | | | GBP | | | 417,709 | | | State Street Bank and Trust Company | | | 4/18/19 | | | | — | | | | (5,533 | ) |
| | | | | | | |
| USD | | | 240,948 | | | HKD | | | 1,884,860 | | | State Street Bank and Trust Company | | | 4/18/19 | | | | 715 | | | | — | |
| | | | | | | |
| USD | | | 6,388 | | | HKD | | | 50,000 | | | State Street Bank and Trust Company | | | 4/18/19 | | | | 16 | | | | — | |
| | | | | | | |
| USD | | | 6,505 | | | HKD | | | 51,000 | | | State Street Bank and Trust Company | | | 4/18/19 | | | | 5 | | | | — | |
| | | | | | | |
| USD | | | 303,828 | | | JPY | | | 32,782,000 | | | State Street Bank and Trust Company | | | 4/18/19 | | | | 7,631 | | | | — | |
| | | | | | | |
| | | | | | | | | | | | | | | | | | | $ | 197,305 | | | $ | (15,301 | ) |
Abbreviations:
| | | | |
| | |
| EURIBOR | | – | | Euro Interbank Offered Rate |
| | |
| LIBOR | | – | | London Interbank Offered Rate |
| | |
| PIK | | – | | Payment In Kind |
Currency Abbreviations:
| | | | |
| | |
| AUD | | – | | Australian Dollar |
| | |
| EUR | | – | | Euro |
| | |
| GBP | | – | | British Pound Sterling |
| | |
| HKD | | – | | Hong Kong Dollar |
| | |
| JPY | | – | | Japanese Yen |
| | |
| USD | | – | | United States Dollar |
| | | | |
| | 16 | | See Notes to Financial Statements. |
Eaton Vance
Oaktree Diversified Credit NextShares
March 31, 2019
Statement of Assets and Liabilities (Unaudited)
| | | | |
| Assets | | March 31, 2019 | |
| |
Unaffiliated investments, at value (identified cost, $48,602,354) | | $ | 47,921,949 | |
| |
Affiliated investment, at value (identified cost, $1,589,684) | | | 1,589,684 | |
| |
Cash | | | 245,808 | |
| |
Foreign currency, at value (identified cost, $1,055,047) | | | 1,047,945 | |
| |
Interest receivable | | | 516,913 | |
| |
Dividends receivable from affiliated investment | | | 3,161 | |
| |
Receivable for investments sold | | | 208,233 | |
| |
Receivable for open forward foreign currency exchange contracts | | | 197,305 | |
| |
Receivable from affiliate | | | 23,840 | |
| |
Total assets | | $ | 51,754,838 | |
| |
| Liabilities | | | | |
| |
Payable for investments purchased | | $ | 1,149,813 | |
| |
Payable for when-issued securities | | | 457,260 | |
| |
Payable for open forward foreign currency exchange contracts | | | 15,301 | |
| |
Payable to affiliates: | | | | |
| |
Investment adviser fee | | | 33,921 | |
| |
Operations agreement fee | | | 2,120 | |
| |
Accrued expenses | | | 89,402 | |
| |
Total liabilities | | $ | 1,747,817 | |
| |
Net Assets | | $ | 50,007,021 | |
|
| Sources of Net Assets | |
| |
Paid-in capital | | $ | 50,751,165 | |
| |
Accumulated loss | | | (744,144 | ) |
| |
Total | | $ | 50,007,021 | |
|
| Net Asset Value Per Share | |
| |
($50,007,021 ÷ 5,050,000 shares issued and outstanding) | | $ | 9.90 | |
| | | | |
| | 17 | | See Notes to Financial Statements. |
Eaton Vance
Oaktree Diversified Credit NextShares
March 31, 2019
Statement of Operations (Unaudited)
| | | | |
| Investment Income | | Six Months Ended March 31, 2019 | |
| |
Interest | | $ | 1,474,948 | |
| |
Dividends from affiliated investment | | | 19,445 | |
| |
Total investment income | | $ | 1,494,393 | |
|
| Expenses | |
| |
Investment adviser fee | | $ | 199,250 | |
| |
Operations agreement fee | | | 12,453 | |
| |
Trustees’ fees and expenses | | | 1,616 | |
| |
Custodian fee | | | 42,052 | |
| |
Transfer and dividend disbursing agent fees | | | 4,961 | |
| |
Legal and accounting services | | | 41,853 | |
| |
Printing and postage | | | 6,134 | |
| |
Registration fees | | | 68 | |
| |
Listing fee | | | 3,590 | |
| |
Intraday pricing fee | | | 5,984 | |
| |
Miscellaneous | | | 793 | |
| |
Total expenses | | $ | 318,754 | |
| |
Deduct — | | | | |
| |
Allocation of expenses to affiliate | | $ | 94,559 | |
| |
Total expense reductions | | $ | 94,559 | |
| |
Net expenses | | $ | 224,195 | |
| |
Net investment income | | $ | 1,270,198 | |
|
| Realized and Unrealized Gain (Loss) | |
| |
Net realized gain (loss) — | | | | |
| |
Investment transactions | | $ | (266,029 | ) |
| |
Investment transactions — affiliated investment | | | (52 | ) |
| |
Foreign currency transactions | | | (1,152 | ) |
| |
Forward foreign currency exchange contracts | | | 274,815 | |
| |
Net realized gain | | $ | 7,582 | |
| |
Change in unrealized appreciation (depreciation) — | | | | |
| |
Investments | | $ | (768,047 | ) |
| |
Foreign currency | | | 14,470 | |
| |
Forward foreign currency exchange contracts | | | 103,870 | |
| |
Net change in unrealized appreciation (depreciation) | | $ | (649,707 | ) |
| |
Net realized and unrealized loss | | $ | (642,125 | ) |
| |
Net increase in net assets from operations | | $ | 628,073 | |
| | | | |
| | 18 | | See Notes to Financial Statements. |
Eaton Vance
Oaktree Diversified Credit NextShares
March 31, 2019
Statements of Changes in Net Assets
| | | | | | | | |
| Increase (Decrease) in Net Assets | | Six Months Ended March 31, 2019 (Unaudited) | | | Period Ended September 30, 2018(1) | |
| | |
From operations — | | | | | | | | |
| | |
Net investment income | | $ | 1,270,198 | | | $ | 1,623,089 | |
| | |
Net realized gain | | | 7,582 | | | | 1,653 | |
| | |
Net change in unrealized appreciation (depreciation) | | | (649,707 | ) | | | 169,724 | |
| | |
Net increase in net assets from operations | | $ | 628,073 | | | $ | 1,794,466 | |
| | |
Distributions to shareholders | | $ | (1,679,043 | ) | | $ | (1,488,735 | ) |
| | |
Transactions in Fund shares — | | | | | | | | |
| | |
Proceeds from sale of shares | | $ | 246,850 | | | $ | 51,511,209 | |
| | |
Cost of shares redeemed | | | (988,909 | ) | | | (250,897 | ) |
| | |
Transaction fees | | | 3,089 | | | | 230,918 | |
| | |
Net increase (decrease) in net assets from Fund share transactions | | $ | (738,970 | ) | | $ | 51,491,230 | |
| | |
Net increase (decrease) in net assets | | $ | (1,789,940 | ) | | $ | 51,796,961 | |
|
| Net Assets | |
| | |
At beginning of period | | $ | 51,796,961 | | | $ | — | |
| | |
At end of period | | $ | 50,007,021 | | | $ | 51,796,961 | |
|
| Changes in shares outstanding | |
| | |
Shares outstanding, beginning of period | | | 5,125,000 | | | | — | |
| | |
Shares sold | | | 25,000 | | | | 5,150,000 | (2) |
| | |
Shares redeemed | | | (100,000 | ) | | | (25,000 | )(2) |
| | |
Shares outstanding, end of period | | | 5,050,000 | | | | 5,125,000 | (2) |
| (1) | For the period from the start of business, November 15, 2017, to September 30, 2018. |
| (2) | Shares reflect a 2-for-1 share split effective March 9, 2018. |
| | | | |
| | 19 | | See Notes to Financial Statements. |
Eaton Vance
Oaktree Diversified Credit NextShares
March 31, 2019
Financial Highlights
| | | | | | | | |
| | | Six Months Ended March 31, 2019 (Unaudited) | | | Period Ended September 30, 2018(1)(2) | |
| | |
Net asset value — Beginning of period | | $ | 10.110 | | | $ | 10.000 | |
| | |
| Income (Loss) From Operations | | | | | | | | |
| | |
Net investment income(3) | | $ | 0.250 | | | $ | 0.321 | |
| | |
Net realized and unrealized gain (loss) | | | (0.130 | ) | | | 0.036 | |
| | |
Total income from operations | | $ | 0.120 | | | $ | 0.357 | |
| | |
| Less Distributions | | | | | | | | |
| | |
From net investment income | | $ | (0.331 | ) | | $ | (0.293 | ) |
| | |
Total distributions | | $ | (0.331 | ) | | $ | (0.293 | ) |
| | |
Transaction fees | | $ | 0.001 | | | $ | 0.046 | |
| | |
Net asset value — End of period | | $ | 9.900 | | | $ | 10.110 | |
| | |
Total Return on Net Asset Value(4)(6) | | | 1.27 | %(5) | | | 4.10 | %(5) |
| | |
| Ratios/Supplemental Data | | | | | | | | |
| | |
Net assets, end of period (000’s omitted) | | $ | 50,007 | | | $ | 51,797 | |
| | |
Ratios (as a percentage of average daily net assets): | | | | | | | | |
| | |
Expenses(6) | | | 0.90 | %(7) | | | 0.90 | %(7) |
| | |
Net investment income | | | 5.10 | %(7) | | | 3.65 | %(7) |
| | |
Portfolio Turnover | | | 32 | %(5) | | | 152 | %(5) |
| (1) | For the period from the start of business, November 15, 2017, to September 30, 2018. |
| (2) | Per share data reflect a 2-for-1 share split effective March 9, 2018. |
| (3) | Computed using average shares outstanding. |
| (4) | Returns are historical and are calculated by determining the percentage change in net asset value with all distributions reinvested and do not reflect the effect of a market-determined premium or discount. Investment returns assume that all distributions have been reinvested at net asset value. |
| (6) | The investment adviser reimbursed certain operating expenses (equal to 0.38% and 0.39% of average daily net assets for the six months ended March 31, 2019 and the period ended September 30, 2018). Absent this reimbursement, total return would be lower. |
| | | | |
| | 20 | | See Notes to Financial Statements. |
Eaton Vance
Oaktree Diversified Credit NextShares
March 31, 2019
Notes to Financial Statements (Unaudited)
1 Significant Accounting Policies
Eaton Vance Oaktree Diversified Credit NextShares (the Fund) is a diversified series of Eaton Vance NextShares Trust II (the Trust), a Massachusetts business trust registered under the Investment Company Act of 1940, as amended (the 1940 Act). The Fund is an exchange-traded managed fund operating pursuant to an order issued by the SEC granting an exemption from certain provisions of the 1940 Act. Individual shares of the Fund may be purchased and sold only on a national securities exchange or alternative trading system through a broker-dealer that offers NextShares, and may not be directly purchased or redeemed from the Fund. Market trading prices for the Fund are directly linked to the Fund’s next-computed net asset value per share (NAV) and will vary from NAV by a market-determined premium or discount, which may be zero. The Fund’s investment objective is total return.
The following is a summary of significant accounting policies of the Fund. The policies are in conformity with accounting principles generally accepted in the United States of America (U.S. GAAP). The Fund is an investment company and follows accounting and reporting guidance in the Financial Accounting Standards Board (FASB) Accounting Standards Codification Topic 946.
A Investment Valuation — The following methodologies are used to determine the market value or fair value of investments.
Senior Floating-Rate Loans. Interests in senior floating-rate loans (Senior Loans) for which reliable market quotations are readily available are valued generally at the average mean of bid and ask quotations obtained from a third party pricing service. Other Senior Loans are valued at fair value by the investment adviser under procedures approved by the Trustees. In fair valuing a Senior Loan, the investment adviser utilizes one or more of the valuation techniques described in (i) through (iii) below to assess the likelihood that the borrower will make a full repayment of the loan underlying such Senior Loan relative to yields on other Senior Loans issued by companies of comparable credit quality. If the investment adviser believes that there is a reasonable likelihood of full repayment, the investment adviser will determine fair value using a matrix pricing approach that considers the yield on the Senior Loan. If the investment adviser believes there is not a reasonable likelihood of full repayment, the investment adviser will determine fair value using analyses that include, but are not limited to: (i) a comparison of the value of the borrower’s outstanding equity and debt to that of comparable public companies; (ii) a discounted cash flow analysis; or (iii) when the investment adviser believes it is likely that a borrower will be liquidated or sold, an analysis of the terms of such liquidation or sale. In certain cases, the investment adviser will use a combination of analytical methods to determine fair value, such as when only a portion of a borrower’s assets are likely to be sold. In conducting its assessment and analyses for purposes of determining fair value of a Senior Loan, the investment adviser will use its discretion and judgment in considering and appraising relevant factors. Fair value determinations are made by the portfolio managers of the Fund based on information available to such managers. The portfolio managers of other funds managed by the investment adviser that invest in Senior Loans may not possess the same information about a Senior Loan borrower as the portfolio managers of the Fund. At times, the fair value of a Senior Loan determined by the portfolio managers of other funds managed by the investment adviser that invest in Senior Loans may vary from the fair value of the same Senior Loan determined by the portfolio managers of the Fund. The fair value of each Senior Loan is periodically reviewed and approved by the investment adviser’s Valuation Committee and by the Trustees based upon procedures approved by the Trustees. Junior Loans (i.e., subordinated loans and second lien loans) are valued in the same manner as Senior Loans.
Debt Obligations. Debt obligations are generally valued on the basis of valuations provided by third party pricing services, as derived from such services’ pricing models. Inputs to the models may include, but are not limited to, reported trades, executable bid and ask prices, broker/dealer quotations, prices or yields of securities with similar characteristics, interest rates, anticipated prepayments, benchmark curves or information pertaining to the issuer, as well as industry and economic events. The pricing services may use a matrix approach, which considers information regarding securities with similar characteristics to determine the valuation for a security. Short-term debt obligations purchased with a remaining maturity of sixty days or less for which a valuation from a third party pricing service is not readily available may be valued at amortized cost, which approximates fair value.
Derivatives. Forward foreign currency exchange contracts are generally valued at the mean of the average bid and average ask prices that are reported by currency dealers to a third party pricing service at the valuation time. Such third party pricing service valuations are supplied for specific settlement periods and the Fund’s forward foreign currency exchange contracts are valued at an interpolated rate between the closest preceding and subsequent settlement period reported by the third party pricing service.
Foreign Securities and Currencies. Foreign securities and currencies are valued in U.S. dollars, based on foreign currency exchange rate quotations supplied by a third party pricing service. The pricing service uses a proprietary model to determine the exchange rate. Inputs to the model include reported trades and implied bid/ask spreads.
Affiliated Fund. The Fund may invest in Eaton Vance Cash Reserves Fund, LLC (Cash Reserves Fund), an affiliated investment company managed by Eaton Vance Management (EVM). While Cash Reserves Fund is not a registered money market mutual fund, it conducts all of its investment activities in accordance with the requirements of Rule 2a-7 under the 1940 Act. Investments in Cash Reserves Fund are valued at the closing net asset value per unit on the valuation day. Cash Reserves Fund generally values its investment securities based on available market quotations provided by a third party pricing service.
Fair Valuation. Investments for which valuations or market quotations are not readily available or are deemed unreliable are valued at fair value using methods determined in good faith by or at the direction of the Trustees of the Fund in a manner that fairly reflects the security’s value, or the amount that the Fund might reasonably expect to receive for the security upon its current sale in the ordinary course. Each such determination is based on a consideration of relevant factors, which are likely to vary from one pricing context to another. These factors may include, but are not limited to, the type of security, the existence of any contractual restrictions on the security’s disposition, the price and extent of public trading in similar securities of the issuer or of comparable companies or entities, quotations or relevant information obtained from broker/dealers or other market participants, information obtained
Eaton Vance
Oaktree Diversified Credit NextShares
March 31, 2019
Notes to Financial Statements (Unaudited) — continued
from the issuer, analysts, and/or the appropriate stock exchange (for exchange-traded securities), an analysis of the company’s or entity’s financial condition, and an evaluation of the forces that influence the issuer and the market(s) in which the security is purchased and sold.
B Investment Transactions — Investment transactions for financial statement purposes are accounted for on a trade date basis. Realized gains and losses on investments sold are determined on the basis of identified cost.
C Income — Interest income is recorded on the basis of interest accrued, adjusted for amortization of premium or accretion of discount. Fees associated with loan amendments are recognized immediately. Dividend income is recorded on the ex-dividend date for dividends received in cash and/or securities.
D Federal Taxes — The Fund’s policy is to comply with the provisions of the Internal Revenue Code applicable to regulated investment companies and to distribute to shareholders each year substantially all of its net investment income, and all or substantially all of its net realized capital gains. Accordingly, no provision for federal income or excise tax is necessary.
As of March 31, 2019, the Fund had no uncertain tax positions that would require financial statement recognition, de-recognition, or disclosure. The Fund files a U.S. federal income tax return annually after its fiscal year-end, which is subject to examination by the Internal Revenue Service for a period of three years from the date of filing.
E Expenses — The majority of expenses of the Trust are directly identifiable to an individual fund. Expenses which are not readily identifiable to a specific fund are allocated taking into consideration, among other things, the nature and type of expense and the relative size of the funds.
F Foreign Currency Translation — Investment valuations, other assets, and liabilities initially expressed in foreign currencies are translated each business day into U.S. dollars based upon current exchange rates. Purchases and sales of foreign investment securities and income and expenses denominated in foreign currencies are translated into U.S. dollars based upon currency exchange rates in effect on the respective dates of such transactions. Recognized gains or losses on investment transactions attributable to changes in foreign currency exchange rates are recorded for financial statement purposes as net realized gains and losses on investments. That portion of unrealized gains and losses on investments that results from fluctuations in foreign currency exchange rates is not separately disclosed.
G Unfunded Loan Commitments — The Fund may enter into certain loan agreements all or a portion of which may be unfunded. The Fund is obligated to fund these commitments at the borrower’s discretion. These commitments are disclosed in the accompanying Portfolio of Investments. At March 31, 2019, the Fund had sufficient cash and/or securities to cover these commitments.
H Use of Estimates — The preparation of the financial statements in conformity with U.S. GAAP requires management to make estimates and assumptions that affect the reported amounts of assets and liabilities at the date of the financial statements and the reported amounts of income and expense during the reporting period. Actual results could differ from those estimates.
I Indemnifications — Under the Trust’s organizational documents, its officers and Trustees may be indemnified against certain liabilities and expenses arising out of the performance of their duties to the Fund. Under Massachusetts law, if certain conditions prevail, shareholders of a Massachusetts business trust (such as the Trust) could be deemed to have personal liability for the obligations of the Trust. However, the Trust’s Declaration of Trust contains an express disclaimer of liability on the part of Fund shareholders and the By-laws provide that the Trust shall assume the defense on behalf of any Fund shareholders. Moreover, the By-laws also provide for indemnification out of Fund property of any shareholder held personally liable solely by reason of being or having been a shareholder for all loss or expense arising from such liability. Additionally, in the normal course of business, the Fund enters into agreements with service providers that may contain indemnification clauses. The Fund’s maximum exposure under these arrangements is unknown as this would involve future claims that may be made against the Fund that have not yet occurred.
J Forward Foreign Currency Exchange Contracts — The Fund may enter into forward foreign currency exchange contracts for the purchase or sale of a specific foreign currency at a fixed price on a future date. The forward foreign currency exchange contracts are adjusted by the daily exchange rate of the underlying currency and any gains or losses are recorded as unrealized until such time as the contracts have been closed. Risks may arise upon entering these contracts from the potential inability of counterparties to meet the terms of their contracts and from movements in the value of a foreign currency relative to the U.S. dollar.
K When-Issued Securities and Delayed Delivery Transactions — The Fund may purchase or sell securities on a delayed delivery or when-issued basis. Payment and delivery may take place after the customary settlement period for that security. At the time the transaction is negotiated, the price of the security that will be delivered is fixed. The Fund maintains cash and/or security positions for these commitments such that sufficient liquid assets will be available to make payments upon settlement. Securities purchased on a delayed delivery or when-issued basis are marked-to-market daily and begin earning interest on settlement date. Losses may arise due to changes in the market value of the underlying securities or if the counterparty does not perform under the contract.
L Interim Financial Statements — The interim financial statements relating to March 31, 2019 and for the six months then ended have not been audited by an independent registered public accounting firm, but in the opinion of the Fund’s management, reflect all adjustments, consisting only of normal recurring adjustments, necessary for the fair presentation of the financial statements.
Eaton Vance
Oaktree Diversified Credit NextShares
March 31, 2019
Notes to Financial Statements (Unaudited) — continued
2 Distributions to Shareholders and Income Tax Information
It is the present policy of the Fund to make monthly distributions of all or substantially all of its net investment income and to distribute annually all or substantially all of its net realized capital gains. Distributions are paid in cash and cannot be automatically reinvested in additional shares of the Fund. Distributions to shareholders are recorded on the ex-dividend date. Distributions to shareholders are determined in accordance with income tax regulations, which may differ from U.S. GAAP. As required by U.S. GAAP, only distributions in excess of tax basis earnings and profits are reported in the financial statements as a return of capital. Permanent differences between book and tax accounting relating to distributions are reclassified to paid-in capital. For tax purposes, distributions from short-term capital gains are considered to be from ordinary income.
At September 30, 2018, the Fund, for federal income tax purposes, had deferred capital losses of $308,404 which would reduce its taxable income arising from future net realized gains on investment transactions, if any, to the extent permitted by the Internal Revenue Code, and thus would reduce the amount of distributions to shareholders, which would otherwise be necessary to relieve the Fund of any liability for federal income or excise tax. The deferred capital losses are treated as arising on the first day of the Fund’s next taxable year and retain the same short-term or long-term character as when originally deferred. Of the deferred capital losses at September 30, 2018, $308,404 are short-term.
The cost and unrealized appreciation (depreciation) of investments, including open derivative contracts, of the Fund at March 31, 2019, as determined on a federal income tax basis, were as follows:
| | | | |
| |
Aggregate cost | | $ | 50,137,155 | |
| |
Gross unrealized appreciation | | $ | 564,928 | |
| |
Gross unrealized depreciation | | | (1,008,446 | ) |
| |
Net unrealized depreciation | | $ | (443,518 | ) |
3 Investment Adviser Fee and Other Transactions with Affiliates
The investment adviser fee is earned by EVM as compensation for investment advisory services rendered to the Fund. The fee is computed at an annual rate of 0.80% of the Fund’s average daily net assets up to $500 million and is payable monthly. On net assets of $500 million and over, the annual fee is reduced. For the six months ended March 31, 2019, the investment adviser fee amounted to $199,250 or 0.80% (annualized) of the Fund’s average daily net assets. EVM also serves as the administrator of the Fund, but receives no compensation. Pursuant to an investment sub-advisory agreement, EVM has delegated the investment management of the Fund to Oaktree Capital Management, L.P. (Oaktree), a registered investment adviser. EVM pays Oaktree a portion of its investment adviser fee for sub-advisory services provided to the Fund.
The Trust, on behalf of the Fund, has entered into an operations agreement with EVM pursuant to which EVM provides the Fund with services required for it to operate as a NextShares exchange-traded managed fund in accordance with the exemptive order obtained by EVM and the Trust. Pursuant to the agreement, the Fund pays EVM a monthly fee at an annual rate of 0.05% of the Fund’s average daily net assets provided the average net assets of NextShares funds sponsored by EVM (“Covered Assets”) are less than $10 billion. The annual rate is reduced if Covered Assets are $10 billion and above. For the six months ended March 31, 2019, the operations agreement fee amounted to $12,453 or 0.05% (annualized) of the Fund’s average daily net assets.
EVM has agreed to reimburse the Fund’s expenses to the extent that total annual operating expenses (relating to ordinary operating expenses only) exceed 0.90% of the Fund’s average daily net assets through January 31, 2020. Thereafter, the reimbursement may be changed or terminated at any time. Pursuant to this agreement, EVM was allocated $94,559 of the Fund’s operating expenses for the six months ended March 31, 2019.
Trustees and officers of the Fund who are members of EVM’s organization receive remuneration for their services to the Fund out of the investment adviser fee. Trustees of the Fund who are not affiliated with EVM may elect to defer receipt of all or a percentage of their annual fees in accordance with the terms of the Trustees Deferred Compensation Plan. For the six months ended March 31, 2019, no significant amounts have been deferred. Certain officers and Trustees of the Fund are officers of EVM.
4 Purchases and Sales of Investments
Purchases and sales of investments, other than short-term obligations, and including maturities, paydowns and principal repayments on Senior Loans, aggregated $15,830,633 and $20,474,553, respectively, for the six months ended March 31, 2019.
Eaton Vance
Oaktree Diversified Credit NextShares
March 31, 2019
Notes to Financial Statements (Unaudited) — continued
5 Financial Instruments
The Fund may trade in financial instruments with off-balance sheet risk in the normal course of its investing activities. These financial instruments may include forward foreign currency exchange contracts and may involve, to a varying degree, elements of risk in excess of the amounts recognized for financial statement purposes. The notional or contractual amounts of these instruments represent the investment the Fund has in particular classes of financial instruments and do not necessarily represent the amounts potentially subject to risk. The measurement of the risks associated with these instruments is meaningful only when all related and offsetting transactions are considered. A summary of obligations under these financial instruments at March 31, 2019 is included in the Portfolio of Investments. At March 31, 2019, the Fund had sufficient cash and/or securities to cover commitments under these contracts.
The Fund is subject to foreign exchange risk in the normal course of pursuing its investment objective. Because the Fund holds foreign currency denominated investments, the value of these investments and related receivables and payables may change due to future changes in foreign currency exchange rates. To hedge against this risk, the Fund enters into forward foreign currency exchange contracts.
The Fund enters into forward foreign currency exchange contracts that may contain provisions whereby the counterparty may terminate the contract under certain conditions, including but not limited to a decline in the Fund’s net assets below a certain level over a certain period of time, which would trigger a payment by the Fund for those derivatives in a liability position. At March 31, 2019, the fair value of derivatives with credit-related contingent features in a net liability position was $15,301. At March 31, 2019, there were no assets pledged by the Fund for such liability.
The over-the-counter (OTC) derivatives in which the Fund invests are subject to the risk that the counterparty to the contract fails to perform its obligations under the contract. To mitigate this risk, the Fund has entered into an International Swaps and Derivatives Association, Inc. Master Agreement (“ISDA Master Agreement”) or similar agreement with its derivative counterparty. The ISDA Master Agreement is a bilateral agreement between the Fund and the counterparty that governs certain OTC derivatives and typically contains, among other things, set-off provisions in the event of a default and/or termination event as defined under the ISDA Master Agreement. Under the ISDA Master Agreement, the Fund may, under certain circumstances, offset with the counterparty certain derivative financial instruments’ payables and/or receivables with collateral held and/or posted and create one single net payment. The provisions of the ISDA Master Agreement typically permit a single net payment in the event of default including the bankruptcy or insolvency of the counterparty. However, bankruptcy or insolvency laws of a particular jurisdiction may impose restrictions on or prohibitions against the right of offset in bankruptcy or insolvency. The ISDA Master Agreement allows the counterparty to OTC derivatives to terminate derivative contracts prior to maturity in the event the Fund’s net assets decline by a stated percentage or the Fund fails to meet the terms of its ISDA Master Agreement, which would cause the counterparty to accelerate payment by the Fund of any net liability owed to it.
The collateral requirements for derivatives traded under the ISDA Master Agreement are governed by a Credit Support Annex to the ISDA Master Agreement. Collateral requirements are determined at the close of business each day and are typically based on changes in market values for each transaction under the ISDA Master Agreement and netted into one amount for such agreement. Generally, the amount of collateral due from or to the counterparty is subject to a minimum transfer threshold amount before a transfer is required. Collateral pledged for the benefit of the Fund and/or counterparty is held in segregated accounts by the Fund’s custodian and cannot be sold, re-pledged, assigned or otherwise used while pledged. The portion of such collateral representing cash, if any, is reflected as deposits for derivatives collateral and, in the case of cash pledged by the counterparty for the benefit of the Fund, a corresponding liability on the Statement of Assets and Liabilities. Securities pledged by the Fund as collateral, if any, are identified as such in the Portfolio of Investments.
The fair value of open derivative instruments (not considered to be hedging instruments for accounting disclosure purposes) and whose primary underlying risk exposure is foreign exchange risk at March 31, 2019 was as follows:
| | | | | | | | |
| | | Fair Value | |
| Derivative | | Asset Derivative(1) | | | Liability Derivative(2) | |
| | |
Forward foreign currency exchange contracts | | $ | 197,305 | | | $ | (15,301 | ) |
| (1) | Statement of Assets and Liabilities location: Receivable for open forward foreign currency exchange contracts; Accumulated loss. |
| (2) | Statement of Assets and Liabilities location: Payable for open forward foreign currency exchange contracts; Accumulated loss. |
Eaton Vance
Oaktree Diversified Credit NextShares
March 31, 2019
Notes to Financial Statements (Unaudited) — continued
The Fund’s derivative assets and liabilities at fair value by type, which are reported gross in the Statement of Assets and Liabilities, are presented in the table above. The following tables present the Fund’s derivative assets and liabilities by counterparty, net of amounts available for offset under a master netting agreement and net of the related collateral received by the Fund for such assets and pledged by the Fund for such liabilities as of March 31, 2019.
| | | | | | | | | | | | | | | | | | | | |
| Counterparty | | Derivative Assets
Subject to
Master Netting
Agreement | | | Derivatives
Available
for Offset | | | Non-cash
Collateral
Received(a) | | | Cash
Collateral
Received(a) | | | Net Amount
of Derivative
Assets(b) | |
| | | | | |
State Street Bank and Trust Company | | $ | 197,305 | | | $ | (15,301 | ) | | $ | — | | | $ | — | | | $ | 182,004 | |
| | | | | |
| Counterparty | | Derivative Liabilities
Subject to Master Netting
Agreement | | | Derivatives
Available
for Offset | | | Non-cash
Collateral
Pledged(a) | | | Cash
Collateral
Pledged(a) | | | Net Amount
of Derivative
Liabilities(c) | |
| | | | | |
State Street Bank and Trust Company | | $ | (15,301 | ) | | $ | 15,301 | | | $ | — | | | $ | — | | | $ | — | |
| (a) | In some instances, the total collateral received and/or pledged may be more than the amount shown due to overcollateralization. |
| (b) | Net amount represents the net amount due from the counterparty in the event of default. |
| (c) | Net amount represents the net amount payable to the counterparty in the event of default. |
The effect of derivative instruments (not considered to be hedging instruments for accounting disclosure purposes) on the Statement of Operations and whose primary underlying risk exposure is foreign exchange risk for the six months ended March 31, 2019 was as follows:
| | | | | | | | |
| Derivative | | Realized Gain (Loss)
on Derivatives Recognized
in Income(1) | | | Change in Unrealized Appreciation (Depreciation) on Derivatives Recognized in Income(2) | |
| | |
Forward foreign currency exchange contracts | | $ | 274,815 | | | $ | 103,870 | |
| (1) | Statement of Operations location: Net realized gain (loss) – Forward foreign currency exchange contracts. |
| (2) | Statement of Operations location: Change in unrealized appreciation (depreciation) – Forward foreign currency exchange contracts. |
The average notional amount of forward foreign currency exchange contracts (based on the absolute value of notional amounts of currency purchased and currency sold) outstanding during the six months ended March 31, 2019, which is indicative of the volume of this derivative type, was approximately $10,049,000.
6 Capital Share Transactions
The Trust may issue an unlimited number of shares of capital stock (no par value per share) in one or more series (such as the Fund). The Fund issues and redeems shares only in blocks of 25,000 shares or multiples thereof (“Creation Units”). The Fund issues and redeems Creation Units in return for the securities, other instruments and/or cash (the “Basket”) that the Fund specifies each business day. Creation Units may be purchased or redeemed only by or through Authorized Participants, which are broker-dealers or institutional investors that have entered into agreements with the Fund’s distributor for this purpose. The Fund imposes a transaction fee on Creation Units issued and redeemed to offset the estimated cost to the Fund of processing the transaction, which is paid by the Authorized Participants directly to a third-party administrator. In addition, Authorized Participants pay the Fund a variable charge for converting the Basket to or from the desired portfolio composition. Such variable charges are reflected as Transaction fees on the Statements of Changes in Net Assets.
At March 31, 2019, Eaton Vance Corporation and Oaktree owned in the aggregate 99.0% of the outstanding shares of the Fund.
Eaton Vance
Oaktree Diversified Credit NextShares
March 31, 2019
Notes to Financial Statements (Unaudited) — continued
7 Fair Value Measurements
Under generally accepted accounting principles for fair value measurements, a three-tier hierarchy to prioritize the assumptions, referred to as inputs, is used in valuation techniques to measure fair value. The three-tier hierarchy of inputs is summarized in the three broad levels listed below.
| • | | Level 1 – quoted prices in active markets for identical investments |
| • | | Level 2 – other significant observable inputs (including quoted prices for similar investments, interest rates, prepayment speeds, credit risk, etc.) |
| • | | Level 3 – significant unobservable inputs (including a fund’s own assumptions in determining the fair value of investments) |
In cases where the inputs used to measure fair value fall in different levels of the fair value hierarchy, the level disclosed is determined based on the lowest level input that is significant to the fair value measurement in its entirety. The inputs or methodology used for valuing securities are not necessarily an indication of the risk associated with investing in those securities.
At March 31, 2019, the hierarchy of inputs used in valuing the Fund’s investments and open derivative instruments, which are carried at value, were as follows:
| | | | | | | | | | | | | | | | |
| Asset Description | | Level 1 | | | Level 2 | | | Level 3 | | | Total | |
| | | | |
Senior Floating-Rate Loans (Less Unfunded Loan Commitments) | | $ | — | | | $ | 13,091,772 | | | $ | — | | | $ | 13,091,772 | |
| | | | |
Corporate Bonds & Notes | | | — | | | | 18,806,519 | | | | — | | | | 18,806,519 | |
| | | | |
Foreign Government Bonds | | | — | | | | 640,789 | | | | — | | | | 640,789 | |
| | | | |
Convertible Bonds | | | — | | | | 4,348,093 | | | | — | | | | 4,348,093 | |
| | | | |
Asset-Backed Securities | | | — | | | | 6,097,497 | | | | — | | | | 6,097,497 | |
| | | | |
Commercial Mortgage-Backed Securities | | | — | | | | 4,937,279 | | | | — | | | | 4,937,279 | |
| | | | |
Short-Term Investments | | | — | | | | 1,589,684 | | | | — | | | | 1,589,684 | |
| | | | |
Total Investments | | $ | — | | | $ | 49,511,633 | | | $ | — | | | $ | 49,511,633 | |
| | | | |
Forward Foreign Currency Exchange Contracts | | $ | — | | | $ | 197,305 | | | $ | — | | | $ | 197,305 | |
| | | | |
Total | | $ | — | | | $ | 49,708,938 | | | $ | — | | | $ | 49,708,938 | |
| | | | |
Liability Description | | | | | | | | | | | | | | | | |
| | | | |
Forward Foreign Currency Exchange Contracts | | $ | — | | | $ | (15,301 | ) | | $ | — | | | $ | (15,301 | ) |
| | | | |
Total | | $ | — | | | $ | (15,301 | ) | | $ | — | | | $ | (15,301 | ) |
Eaton Vance
Oaktree Diversified Credit NextShares
March 31, 2019
Officers and Trustees
Officers of Eaton Vance Oaktree Diversified Credit NextShares
Payson F. Swaffield
President
Maureen A. Gemma
Vice President, Secretary and Chief Legal Officer
James F. Kirchner
Treasurer
Richard F. Froio
Chief Compliance Officer
Trustees of Eaton Vance Oaktree Diversified Credit NextShares
William H. Park
Chairperson
Thomas E. Faust Jr.*
Mark R. Fetting
Cynthia E. Frost
George J. Gorman
Valerie A. Mosley
Helen Frame Peters
Keith Quinton(1)
Marcus L. Smith(1)
Susan J. Sutherland
Scott E. Wennerholm
| (1) | Messrs. Quinton and Smith began serving as Trustees effective October 1, 2018. |
Eaton Vance Funds
IMPORTANT NOTICES
Privacy. The Eaton Vance organization is committed to ensuring your financial privacy. Each of the financial institutions identified below has in effect the following policy (“Privacy Policy”) with respect to nonpublic personal information about its customers:
| • | | Only such information received from you, through application forms or otherwise, and information about your Eaton Vance fund transactions will be collected. This may include information such as name, address, social security number, tax status, account balances and transactions. |
| • | | None of such information about you (or former customers) will be disclosed to anyone, except as permitted by law (which includes disclosure to employees necessary to service your account). In the normal course of servicing a customer’s account, Eaton Vance may share information with unaffiliated third parties that perform various required services such as transfer agents, custodians and broker-dealers. |
| • | | Policies and procedures (including physical, electronic and procedural safeguards) are in place that are designed to protect the confidentiality of such information. |
| • | | We reserve the right to change our Privacy Policy at any time upon proper notification to you. Customers may want to review our Privacy Policy periodically for changes by accessing the link on our homepage: www.eatonvance.com. |
Our pledge of privacy applies to the following entities within the Eaton Vance organization: the Eaton Vance Family of Funds, Eaton Vance Management, Eaton Vance Investment Counsel, Eaton Vance Distributors, Inc., Eaton Vance Trust Company, Eaton Vance Management (International) Limited, Eaton Vance Advisers International Ltd., Eaton Vance Management’s Real Estate Investment Group and Boston Management and Research. In addition, our Privacy Policy applies only to those Eaton Vance customers who are individuals and who have a direct relationship with us. If a customer’s account (i.e., fund shares) is held in the name of a third-party financial advisor/broker-dealer, it is likely that only such advisor’s privacy policies apply to the customer. This notice supersedes all previously issued privacy disclosures. For more information about Eaton Vance’s Privacy Policy, please call 1-800-262-1122.
Delivery of Shareholder Documents. The Securities and Exchange Commission (SEC) permits delivery of only one copy of fund shareholder documents, including prospectuses, proxy statements and shareholder reports, to fund investors with multiple accounts at the same residential or post office box address. This practice is often called “householding” and it helps eliminate duplicate mailings to shareholders.Your broker may household the mailing of your documents indefinitely unless you instruct your broker otherwise.If you would prefer that your Eaton Vance documents not be householded, please contact your broker. Your instructions that householding not apply to delivery of your Eaton Vance documents will typically be effective within 30 days of receipt by your broker.
Portfolio Holdings. Each Eaton Vance Fund and its underlying Portfolio(s) (if applicable) files a schedule of portfolio holdings on Part F toForm N-PORT with the SEC for the first and third quarters of each fiscal year. The Form N-PORT will be available on the Eaton Vance website at www.eatonvance.com, by calling Eaton Vance at 1-800-262-1122 or in the EDGAR database on the SEC’s website at www.sec.gov.
Proxy Voting. From time to time, funds are required to vote proxies related to the securities held by the funds. The Eaton Vance Funds or their underlying Portfolios (if applicable) vote proxies according to a set of policies and procedures approved by the Funds’ and Portfolios’ Boards. You may obtain a description of these policies and procedures and information on how the Funds or Portfolios voted proxies relating to portfolio securities during the most recent 12-month period ended June 30, without charge, upon request, by calling 1-800-262-1122 and by accessing the SEC’s website at www.sec.gov.
Investment Adviser and Administrator
Eaton Vance Management
Two International Place
Boston, MA 02110
Sub-Advisor
Oaktree Capital Management, L.P.
333 South Grand Ave.
Los Angeles, CA 90071
Distributor*
Foreside Fund Services, LLC
Three Canal Plaza, Suite 100
Portland, ME 04101
Custodian
State Street Bank and Trust Company
State Street Financial Center, One Lincoln Street
Boston, MA 02111
Transfer and Dividend Disbursing Agent
State Street Bank and Trust Company
State Street Financial Center, One Lincoln Street
Boston, MA 02111
Fund Offices
Two International Place
Boston, MA 02110
| * | FINRA BrokerCheck. Investors may check the background of their Investment Professional by contacting the Financial Industry Regulatory Authority (FINRA). FINRA BrokerCheck is a free tool to help investors check the professional background of current and former FINRA-registered securities firms and brokers. FINRA BrokerCheck is available by calling 1-800-289-9999 and at www.FINRA.org. The FINRA BrokerCheck brochure describing this program is available to investors at www.FINRA.org. |


28876 3.31.19
Item 2. Code of Ethics
Not required in this filing.
Item 3. Audit Committee Financial Expert
Not required in this filing.
Item 4. Principal Accountant Fees and Services
Not required in this filing.
Item 5. Audit Committee of Listed Registrants
Not applicable.
Item 6. Schedule of Investments
Please see schedule of investments contained in the Report to Stockholders included under Item 1 of this FormN-CSR.
Item 7. Disclosure of Proxy Voting Policies and Procedures forClosed-End Management Investment Companies
Not applicable.
Item 8. Portfolio Managers ofClosed-End Management Investment Companies
Not applicable.
Item 9. Purchases of Equity Securities byClosed-End Management Investment Company and Affiliated Purchasers
Not applicable.
Item 10. Submission of Matters to a Vote of Security Holders
No material changes.
Item 11. Controls and Procedures
(a) It is the conclusion of the registrant’s principal executive officer and principal financial officer that the effectiveness of the registrant’s current disclosure controls and procedures (such disclosure controls and procedures having been evaluated within 90 days of the date of this filing) provide reasonable assurance that the information required to be disclosed by the registrant has been recorded, processed, summarized and reported within the time period specified in the Commission’s rules and forms and that the information required to be disclosed by the registrant has been accumulated and communicated to the registrant’s principal executive officer and principal financial officer in order to allow timely decisions regarding required disclosure.
(b) There have been no changes in the registrant’s internal controls over financial reporting during the second fiscal quarter of the period covered by this report that has materially affected, or is reasonably likely to materially affect, the registrant’s internal control over financial reporting.
Item 12. Disclosure of Securities Lending Activities forClosed-End Management Investment Companies
Not applicable.
Item 13. Exhibits
| | |
| (a)(1) | | Registrant’s Code of Ethics – Not applicable (please see Item 2). |
| |
| (a)(2)(i) | | Treasurer’s Section 302 certification. |
| |
| (a)(2)(ii) | | President’s Section 302 certification. |
| |
| (b) | | Combined Section 906 certification. |
Signatures
Pursuant to the requirements of the Securities Exchange Act of 1934 and the Investment Company Act of 1940, the registrant has duly caused this report to be signed on its behalf by the undersigned, thereunto duly authorized.
Eaton Vance NextShares Trust II
| | |
| By: | | /s/ Payson F. Swaffield |
| | Payson F. Swaffield |
| | President |
| |
| Date: | | May 24, 2019 |
Pursuant to the requirements of the Securities Exchange Act of 1934 and the Investment Company Act of 1940, this report has been signed below by the following persons on behalf of the registrant and in the capacities and on the dates indicated.
| | |
| By: | | /s/ James F. Kirchner |
| | James F. Kirchner |
| | Treasurer |
| |
| Date: | | May 24, 2019 |
| | |
| By: | | /s/ Payson F. Swaffield |
| | Payson F. Swaffield |
| | President |
| |
| Date: | | May 24, 2019 |