As filed with the U.S. Securities and Exchange Commission on [07/08/19]
UNITED STATES
SECURITIES AND EXCHANGE COMMISSION
Washington, D.C. 20549
FORM N-CSR
CERTIFIED SHAREHOLDER REPORT OF REGISTERED
MANAGEMENT INVESTMENT COMPANIES
Investment Company Act file number811-23024
Pacer Funds Trust
(Exact name of registrant as specified in charter)
500 Chesterfield Parkway
Malvern, PA 19355
(Address of principal executive offices) (Zip code)
Joe M. Thomson, President
500 Chesterfield Parkway
Malvern, PA 19355
(Name and address of agent for service)
610-644-8100
Registrant's telephone number, including area code
Date of fiscal year end:April 30
Date of reporting period:May 1, 2018 through April 30, 2019
Item 1. Reports to Stockholders.
Pacer Funds
TABLE OF CONTENTS
| | Page |
Letters to Shareholders | 1 |
Portfolio Allocation | 12 |
Performance Summary | 17 |
Expense Example | 32 |
Schedules of Investments | 34 |
Statements of Assets and Liabilities | 78 |
Statements of Operations | 81 |
Statements of Changes in Net Assets | 84 |
Financial Highlights | 92 |
Notes to Financial Statements | 107 |
Report of Independent Registered Public Accounting Firm | 122 |
Additional Information | 123 |
Pacer Funds
Dear Shareholder,
Pacer ETFs continued to show fast paced growth this past fiscal year. Several milestones were hit, including surpassing both three billion and four billion in assets under management (AUM) in just one year. The company has witnessed 100% growth in AUM since March of 2018. Our unique model, which centers around the distribution of our ETFs through the financial advisor community, continues to be our focus.
During this fiscal year, we expanded our fund offerings to fifteen by adding four products to our Pacer Custom ETF Series, and one to our Pacer Leaders ETF Series. They include Pacer Benchmark Data & Infrastructure Real Estate SCTR ETF (SRVR), Pacer Benchmark Industrial Real Estate SCTR ETF (INDS), Pacer Benchmark Retail Real Estate SCTR ETF (RTL), Pacer CFRA-Stovall Equal Weight Seasonal Rotation ETF (SZNE), and Pacer US Export Leaders ETF (PEXL). Four of our new ETFs were made possible by partnerships we have developed to help bring their ideas to market in an ETF.
Our goal is to remain consistent in developing and testing innovative ideas to bring new funds to market as the ETF landscape continues to evolve. Expanding a line of ETFs that aid investors in accomplishing multiple goals is something we believe in. We thank you for entrusting your assets with us as we look forward to growing with you.
Best,

Joe M. Thomson
Chairman, Pacer Funds Trust
1
Pacer Funds
Market Environment Overview
The overall picture for equity markets is showing conflicting data signals for both bullish and bearish outlooks. The U.S. economy has continued strong growth throughout fiscal year 2018, oftentimes surpassing 3% implied annual growth. During the second calendar quarter of 2018, for example, U.S. gross domestic product (GDP) increased at a rate of 4.2%, which is uncharacteristically high for a mature economy. Additionally, the unemployment rate and labor force participation rates have respectively realized record lows and highs, suggesting a robust labor market. Earnings and revenue growth across all sectors have seen notable increases. This is partially a result of the previous year’s tax reforms taking full effect, but also due to organic growth.
Despite this, several forward-looking indicators including net savings rates remaining relatively flat and the decline of new and existing home sales introduces new doubt into investors’ minds. This is replicated in overall market sentiment as seen from September through December 2018. This timeframe saw the return of volatility, which was notably low the preceding year.
In late March, the yield curve inverted for the first time since the Great Recession of 2007-2009. This signifies a disconnect between the Federal Reserve’s monetary policy and the market’s outlook on interest rates and, therefore, the economy overall. The inversion of the yield curve is generally considered a consistent indicator that a recession will occur about 12-18 months after the inversion. This, however, is not foolproof and remains to be seen.
In addition to conflicting domestic economic data, the news surrounding Brexit and on trade wars with China are causing concerns for the economy broadly and for the equity markets specifically. Sino-American tensions ripple across other markets, most notably the emerging markets that trade heavily with China, and European markets that buy large amounts of materials and goods from China. This “trade war” is best characterized as the two largest economies deciding which is more powerful: the seller or the buyer.
Europe additionally seems to be suffering a multi-front economic war, with Brexit on one side, and rising Euroscepticism, populism, and nationalism on the other. As the predominant economy in the Eurozone, Germany has repeatedly tried to keep other member nations of the European Union in line with a globalist worldview. Internal stresses in member countries, most notably Italy and France, have led to populist movements gaining wide support from voter bases with a clear message of distaste for being a part of the E.U.
The presence of these opposing forces both domestically and internationally suggests that the markets are uncertain of what the future holds. The systemic risks facing the economies and equity markets of the world may escalate to the point of global recession or may begin a gradual but sustained de-risking. Much of the deciding factor resting on U.S.-China trade tensions.
The Pacer Trendpilot™ Series
The Pacer Trendpilot series is based on a trend following strategy that alternates exposure between a Benchmark Index and 3-Month US T-Bills using three indicators. It is designed to participate in the market when it is trending up, maintain some exposure during short term market declines and exit the market when it is trending down. The period referenced in this section for all Trendpilot Funds is for the fiscal year end of April 30, 2019.
Pacer Trendpilot® US Large Cap ETF
The Pacer Trendpilot® US Large Cap ETF (the “Fund”) is an exchange traded fund that seeks to track the total return performance, before fees and expenses, of the Pacer Trendpilot® US Large Cap Index (the “Index”).
The Index uses an objective, rules-based methodology to implement a systematic trend-following strategy that directs exposure (i) 100% to the S&P 500 Index, (ii) 50% to the S&P 500 Index and 50% to 3-Month US Treasury bills, or (iii) 100% to 3-Month US Treasury bills, depending on the relative performance of the S&P 500 Total Return Index and its 200-business day historical simple moving average.
The S&P 500 Total Return Index is a total return version of the S&P 500 Index and reflects the reinvestment of dividends paid by the securities in the S&P 500 Index. The S&P 500 Index consists of approximately 500 leading U.S.-listed companies representing approximately 80% of the U.S. equity market capitalization.
The Fund
The Fund had a total return of 8.65%. The Index had a total return of 9.34%. The S&P 500 Index had a total return of 13.49%.
2
Pacer Funds
The Fund had two exposure changes during the fiscal year. Summary details of these changes are presented in the following table.
PTLC EXPOSURE CHANGES |
Date | Resulting Exposure | U.S. Treasury 3-Month Yield (%) |
October 30, 2018 | 100% T-Bills | 2.3227 |
February 20, 2019 | 100% Equities | 2.4354 |
| | |
Fiscal Year Maximum Drawdowns (%) | |
Fund | -9.92 | |
Benchmark | -19.36 | |
Pacer Trendpilot® US Mid Cap ETF
The Pacer Trendpilot® US Mid Cap ETF (the “Fund”) is an exchange traded fund that seeks to track the total return performance, before fees and expenses, of the Pacer Trendpilot US Mid Cap Trendpilot Index (the “Index”).
The Index uses an objective, rules-based methodology to implement a systematic trend-following strategy that directs exposure (i) 100% to the S&P MidCap 400 Index, (ii) 50% to the S&P MidCap 400 Index and 50% to 3-Month US Treasury bills, or (iii) 100% to 3-Month US Treasury bills, depending on the relative performance of the S&P MidCap 400 Total Return Index and its 200-business day historical simple moving average.
The S&P MidCap 400 Total Return Index is a total return version of the S&P MidCap 400 Index and reflects the reinvestment of dividends paid by the securities in the S&P MidCap 400 Index. The S&P Midcap 400 measures the performance of mid-capitalization stocks in the United States.
The Fund
The Fund had a total return of 1.66%. The Index had a total return of 2.11%. The S&P MidCap 400 Index had a total return of 6.99%.
The Fund had five exposure changes during the fiscal year. Summary details of these changes are presented in the following table.
PTMC EXPOSURE CHANGES |
Date | Resulting Exposure | U.S. Treasury 3-Month Yield (%) |
October 17, 2018 | 50% T-Bills / 50% Equities | 2.3046 |
October 23, 2018 | 100% T-Bills | 2.3227 |
February 25, 2019 | 100% Equities | 2.4397 |
March 13, 2019 | 100% T-Bills | 2.4379 |
April 4, 2019 | 100% Equities | 2.4225 |
| | | |
Fiscal Year Maximum Drawdowns (%) | |
Fund | -13.04 | |
Benchmark | -23.12 | |
Pacer Trendpilot® 100 ETF
The Pacer Trendpilot® 100 ETF (the “Fund”) seeks to track the total return performance, before fees and expenses, of the Pacer NASDAQ-100 Trendpilot™ Index (the “Index”).
The Index uses an objective, rules-based methodology to implement a systematic trend-following strategy that directs exposure (i) 100% to the Nasdaq-100 Index, (ii) 50% to the Nasdaq-100 Index and 50% to 3-Month US Treasury bills, or (iii) 100% to 3-Month US Treasury bills, depending on the relative performance of the Nasdaq-100 Total Return Index and its 200-business day historical simple moving average.
The Nasdaq-100 Total Return Index is a total return version of the Nasdaq-100 Index and reflects the reinvestment of dividends paid by the securities in the Nasdaq-100 Index. The Nasdaq-100 Index includes approximately 100 of the largest non-financial securities listed on The Nasdaq Stock Market based on market capitalization. The Nasdaq-100 Index comprises securities of companies across major industry groups, including computer, biotechnology, healthcare, telecommunications and transportation. However, it does not contain securities of
3
Pacer Funds
financial companies, including investment companies. The Nasdaq-100 Index was developed by Nasdaq OMX. There is no minimum market capitalization requirement for inclusion in the Nasdaq-100 Index. Inclusion is determined based on the top 100 largest issuers based on market capitalization meeting all other eligibility requirements.
The Fund
The Fund had a total return of 16.04%. The Index had a total return of 16.55%. The NASDAQ-100® Index had a total return of 19.10%.
The Fund had three exposure changes during the fiscal year. Summary details of these changes are presented in the following table.
PTNQ EXPOSURE CHANGES |
Date | Resulting Exposure | U.S. Treasury 3-Month Yield (%) |
October 31, 2018 | 50% T-Bills / 50% Equities | 2.3251 |
November 16, 2018 | 100% T-Bills | 2.3424 |
February 22, 2019 | 100% Equities | 2.4424 |
| | | |
Fiscal Year Maximum Drawdowns (%) | |
Fund | -12.31 | |
Benchmark | -22.72 | |
Pacer Trendpilot® European Index ETF
The Pacer Trendpilot® European Index ETF (the “Fund”) seeks to track the total return performance, before fees and expenses, of the Pacer Trendpilot European Index (the “Index”).
The Index uses an objective, rules-based methodology to implement a systematic trend-following strategy that directs exposure (i) 100% to the FTSE Eurozone Index, (ii) 50% to the FTSE Eurozone Index and 50% to 3-Month US Treasury bills, or (iii) 100% to 3-Month US Treasury bills, depending on the relative performance of the FTSE Eurozone Total Return Index and its 200-business day historical simple moving average.
The FTSE Eurozone Index is a rules-based, float-adjusted, market capitalization weighted index comprised of large- and mid-capitalization stocks providing coverage of the developed markets in the euro zone, including primarily France, Germany, Spain, the Netherlands and Italy. The FTSE Eurozone Index is a subset of the FTSE Global Equity Index Series, which covers 98% of the world’s investable market capitalization. The FTSE Eurozone Total Return Index is a total return version of the FTSE Eurozone Index and reflects the reinvestment of dividend paid by the securities in the FTSE Eurozone Index.
The Fund
The Fund had a total return of -8.07%. The Index had a total return of -6.60%. The FTSE Eurozone Index (USD) had a total return of -6.12%.
The Fund had six exposure changes during the fiscal year. Summary details of these changes are presented in the following table.
PTEU EXPOSURE CHANGES |
Date | Resulting Exposure | U.S. Treasury 3-Month Yield (%) |
July 2, 2018 | 50% T-Bills / 50% Equities | 1.9249 |
July 12, 2018 | 100% Equities | 1.9612 |
September 10, 2018 | 100% T-Bills | 2.1245 |
September 27, 2018 | 100% Equities | 2.184 |
October 9, 2018 | 100% T-Bills | 2.2345 |
March 8, 2019 | 100% Equities | 2.4398 |
| | | |
Fiscal Year Maximum Drawdowns (%) | |
Fund | -13.12 | |
Benchmark | -15.69 | |
4
Pacer Funds
The Pacer Cash Cows Index® ETF Series
The Pacer Cash Cows ETFs aim to provide capital appreciation over time by screening broad based indexes to identify quality companies with high free cash flow yield. The period referenced in this section for all Cash Cows Funds is for the fiscal year end of April 30, 2019.
Pacer Global Cash Cows Dividend ETF
The Pacer Global Cash Cows Dividend ETF (the “Fund”) seeks to track the total return performance, before fees and expenses, of the Pacer Global Cash Cows Dividend Index (the “Index”).
The Index uses an objective, rules-based methodology to provide exposure to global companies with high dividend yield backed by a high free cash flow yield. The initial index universe is derived from the component companies of the FTSE Developed Large Cap Index. The initial universe of companies is screened based on their average projected free cash flows and earnings over each of the next two fiscal years. Companies with negative average projected free cash flows or earnings are removed from the Index universe. Additionally, financial companies, other than real estate investment trusts, are excluded from the Index universe. The remaining companies are ranked by their free cash flow yield for the trailing twelve-month period. The 300 companies with the highest free cash flow yield are then ranked by their dividend yield. The equity securities of the 100 companies with the highest dividend yield are included in the Index.
The FTSE Developed Large-Cap Index is a market-capitalization weighted index representing the performance of large-cap stocks in developed markets. The FTSE Developed Large-Cap Total Return Index is a total return version of the FTSE Developed Large-Cap Index and reflects the reinvestment of dividends paid by the securities in the FTSE Developed Large-Cap Index.
The Fund
The Fund had a total return of 5.56%. The Index had a total return of 6.25%. The FTSE Developed Large-Cap Index had a total return of 7.04%.
During the fiscal year, the top three sectors for contribution to performance were Energy at -2.06%, Information Technology at 22.05%, and Consumer Staples at 15.48%. The three sectors with the lowest contribution to performance were Telecommunication Services at -7.12%, Consumer Discretionary at -3.21%, and Financials at 8.95%. Sector performance numbers reflect their total return during the period.
Pacer US Cash Cows 100 ETF
The Pacer US Cash Cows 100 ETF (the “Fund”) seeks to track the total return performance, before fees and expenses, of the Pacer US Cash Cows 100 Index (the “Index”).
The Index uses an objective, rules-based methodology to provide exposure to large and mid-capitalization U.S. companies with high free cash flow yields. The initial index universe is derived from the component companies of the Russell 1000 Index. The initial universe of companies is screened based on their average projected free cash flows and earnings over each of the next two fiscal years. Companies with no forward year estimates available for free cash flows or earnings will remain in the Index universe. Companies with negative average projected free cash flows or earnings are removed from the Index universe. Additionally, financial companies, other than real estate investment trusts, are excluded from the Index universe. The remaining companies are ranked by their free cash flow yield for the trailing twelve-month period. The equity securities of the 100 companies with the highest free cash flow yield are included in the Index.
The Russell 1000 Index is a market-capitalization weighted index representing the top 1,000 large-cap stocks in the Russell 3000 Index. The Russell 1000 Total Return Index is a total return version of the Russell 1000 Index that reflects the reinvestment of dividends paid by the securities in the Russell 1000 Index.
The Fund
The Fund had a total return of 4.28%. The Index had a total return of 4.84%. The Russell 1000 Index had a total return of 13.33%.
During the fiscal year, the top three sectors for contribution to performance were Information Technology at 9.82%, Consumer Discretionary at 6.70%, and Materials at -8.58%. The three sectors with the lowest contribution to performance were Energy at -24.77%, Consumer Staples at -9.56%, and Financials at -0.85%. Sector performance numbers reflect their total return during the period.
Pacer US Small Cap Cash Cows 100 ETF
The Pacer US Small Cap Cash Cows 100 ETF (the “Fund”) seeks to track the total performance, before fees and expenses, of the Pacer US Small Cap Cash Cows Index (the “Index”).
5
Pacer Funds
The Index uses an objective, rules-based methodology to provide exposure to small-capitalization U.S. companies with high free cash flow yields. The initial index universe is derived from the component companies of the S&P Small Cap 600 Index. The initial universe of companies is screened based on their average projected free cash flows and earnings over each of the next two fiscal years. Companies with no forward year estimates available for free cash flows or earnings will remain in the Index universe. Companies with negative average projected free cash flows or earnings are removed from the Index universe. Additionally, financial companies, other than real estate investment trusts, are excluded from the Index universe. The remaining companies are ranked by their free cash flow yield for the trailing twelve-month period. The equity securities of the 100 companies with the highest free cash flow yield are included in the Index.
The S&P SmallCap 600 Index measures the performance of 600 small sized companies in the US equity market, with market capitalization ranging from $450 million to $2.1 billion USD. The Index does not overlap holdings with the S&P 500 or S&P MidCap 400.
The Fund
The Fund had a total return of 0.20%. The Index had a total return of 0.32%. The S&P 600 Index had a total return of 4.42%.
During the fiscal year, the top three sectors for contribution to performance were Information Technology at 18.77%, Industrials at 6.83%, and Energy at 10.08%. The three sectors with the lowest contribution to performance were Consumer Discretionary at -9.09%, Health Care at -22.29%, and Consumer Staples at -36.59%. Sector performance numbers reflect their total return during the period.
Pacer Developed Markets International Cash Cows 100 ETF
The Pacer Developed Markets International Cash Cows 100 ETF (the “Fund”) seeks to track the total performance, before fees and expenses, of the Pacer Developed Markets International Cash Cows 100 Index (the “Index”).
The Index uses an objective, rules-based methodology to provide exposure to large and mid-capitalization non-U.S. companies in developed markets with high free cash flow yields. The initial index universe is derived from the component companies of the FTSE Developed ex US Index. The initial universe of companies is screened based on their average projected free cash flows and earnings over each of the next two fiscal years. Companies with no forward year estimates available for free cash flows or earnings will remain in the Index universe. Companies with negative average projected free cash flows or earnings are removed from the Index universe. Additionally, financial companies, other than real estate investment trusts and companies with a market capitalization of less than $3 billion are excluded from the Index universe. The remaining companies are ranked by their average daily trading value (“ADTV”) for the prior three months. The 500 companies with the highest ADTV are then ranked by their free cash flow yield for the trailing twelve-month period. The equity securities of the 100 companies with the highest free cash flow yield are included in the Index.
The FTSE Developed ex-US Index is comprised of Large (85%) and Mid (15%) cap stocks providing coverage of Developed markets (24 countries) excluding the US. The index is derived from the FTSE Global Equity Index Series, which covers 98% of the world’s investable market capitalization.
The Fund
The Fund had a total return of -3.92%. The Index had a total return of -3.49%. The FTSE Developed ex US Index had a total return of -3.72%.
During the fiscal year, the top three sectors for contribution to performance were Consumer Staples at 6.22%, Information Technology at -7.95%, and Energy at -0.02%. The three sectors with the lowest contribution to performance were Materials at -8.73%, Consumer Discretionary at -8.54%, and Telecommunication Services at -8.48%. Sector performance numbers reflect their total return during the period.
The Pacer Custom ETF Series
The Pacer Custom ETFs are strategy-driven, rules-based and are each designed to offer a specific investment focus. The period referenced in this section for all custom funds is for the fiscal year end of April 30, 2019.
Pacer WealthShield ETF
The Pacer WealthShield ETF (the “Fund”) seeks to track the total performance, before fees and expenses, of the Pacer WealthShield Index (the “Index”).
The Index uses an objective, rules-based methodology to implement a trend-following strategy that directs some or all of the Index’s exposure to (i) U.S. equity securities or (ii) U.S. Treasury securities depending on the strength of the high yield corporate (“junk”) bond market relative to U.S. Treasury bonds and the momentum of certain U.S. equity sectors or industries and of long-term U.S. Treasury bonds.
6
Pacer Funds
The Fund
The Fund had a total return of 1.43%. The Index had a total return of 2.57%. The S&P 500 Index had a total return of 13.49%.
Throughout the fiscal year, the Fund spent about half of the year with “risk on” and half with “risk off.” The Fund was “risk on” for the months of May, August, September, October, March, and April. The Fund was “risk off” for June, July, and November through February.
Pacer Military Times Best Employers ETF
The Pacer Military Times Best Employers ETF (the “Fund”) seeks to track the total performance, before fees and expenses, of the Military Times Best for VetsSM Index (the “Index”).
The Index is owned and developed by VETS Indexes, LLC (the “Index Provider”) and based on The Military Times Best for VetsSM: Employers list (the “Best for Vets List”) published annually by Sightline Media Group. The Best for Vets List is published each year based on detailed surveys (the “Best for Vets Survey”) completed by companies doing business in the United States that address the recruiting of U.S. armed forces veterans and service members, company culture, policies and reservist accommodations. Responses to each such category of questions are weighted to create a composite score and companies with composite scores in the top 60% of all participating companies are included on The Best for Vets List. Companies on the Best for Vets List are expected to come from a variety of sectors and industries, such as banking, information technology, energy and telecommunications, among others. Although all the companies in the Index have their stock listed on a U.S. exchange, such companies may have significant (or a majority of their) business operations outside of the United States.
The Index is composed of the U.S.-listed stocks of companies that have been included in the Best for Vets List for the last three consecutive years, have a minimum market capitalization of $200 million and meet the Index’s liquidity threshold. Index components are equally weighted at the time of each annual reconstitution of the Index, which is effective at the close of business on the third Friday of each September. As of January 11, 2018, the Index was made up of 37 companies and included significant allocations to companies in the financial, industrial and information technology sectors. Companies previously included in the Index for two consecutive years that are no longer on the Best for Vets List may continue to be included in the Index if the reason that they are no longer on the Best for Vets List is because they did not complete the most recent Best for Vets Survey.
The Fund
The Fund had a total return of 15.46%. The Index had a total return of 16.01%. The S&P 500 Index had a total return of 13.49%.
During the fiscal year, the top three sectors for contribution to performance were Information Technology at 22.42%, Industrials at 13.46%, and Consumer Discretionary at 17.42%. The three sectors with the lowest contribution to performance were Energy at -0.66%, Health Care at 10.35%, and Consumer Staples at 16.13%. Sector performance numbers reflect their total return during the period.
Pacer Benchmark Retail Real Estate SCTR ETF
The Pacer Benchmark Retail Real Estate SCTRSM ETF (the “Fund”) is an exchange traded fund that seeks to track the total return performance, before fees and expenses, of the Benchmark Retail Real Estate SCTRSM Index (the “Index”).
The Index is generally composed of the U.S.-listed equity securities of companies that derive at least 85% of their earnings or revenues from real estate operations in the retail real estate sector (“Eligible Companies”). At the time of each reconstitution of the Index, Eligible Companies with a market capitalization of more than $200 million and average daily traded volume of at least 10,000 shares are included in the Index (the “Index Constituents”). A significant portion of the Index is expected to be composed of real estate investment trusts (“REITs”). The real estate companies included in the Index may utilize leverage, and some may be highly leveraged. Additionally, such companies may include significant business operations outside of the United States.
The Index is reconstituted and rebalanced quarterly as of the close of business on the third Friday of each March, June, September, and December based on data as of the end of the previous month (each, a “Reference Date”). Index Constituents are weighted based on their free-float market capitalization (i.e., market capitalization based on the number of shares available to the public), subject to the following constraints as of the time of each reconstitution of the Index. Each Index Constituent’s weight is capped at 15% and the sum of Index Constituents with weights greater than 4.5% cannot exceed 45% of the total Index weight. If the foregoing limits would be exceeded at the time of a reconstitution of the Index, the excess weight is proportionally redistributed to all Index Constituents with weights below such limits.
The Fund
The Fund’s inception date was May 15, 2018. The Fund had a since inception total return of 18.30%. The Index had a total return of 18.56%. The FTSE NAREIT All Equity REITS Index had a total return of 19.31%.
7
Pacer Funds
The Fund’s top three contributors to its return were Realty Income Corporation, Simon Property Group, Inc., and National Retail Properties, Inc. These stocks realized total returns of 44.72%, 16.31%, and 44.09%, respectively.
The Fund’s bottom three contributors to its return were Macerich Company, Taubman Centers, Inc., and Urban Edge Properties These stocks realized total returns of -26.24%, -7.59%, and -5.74%, respectively.
Pacer Benchmark Industrial Real Estate SCTR ETF
The Pacer Benchmark Industrial Real Estate SCTRSM ETF (the “Fund”) is an exchange traded fund that seeks to track the total return performance, before fees and expenses, of the Benchmark Industrial Real Estate SCTRSM Index (the “Index”).
The Index is generally composed of the U.S.-listed equity securities of companies that derive at least 85% of their earnings or revenues from real estate operations in the industrial real estate sector (“Industrial Companies”), including companies that derive at least 85% of their earnings or revenues from self-storage real estate operations (“Self-Storage Companies”). At the time of each reconstitution of the Index, Industrial Companies with a market capitalization of more than $200 million and average daily traded volume of at least 10,000 shares are included in the Index (the “Index Constituents”). A significant portion of the Index is expected to be composed of real estate investment trusts (“REITs”). The real estate companies included in the Index may utilize leverage, and some may be highly leveraged. Additionally, such companies may include significant business operations outside of the United States.
The Index is reconstituted and rebalanced quarterly as of the close of business on the third Friday of each March, June, September, and December based on data as of the end of the previous month (each, a “Reference Date”). Index Constituents are weighted based on their free-float market capitalization (i.e., market capitalization based on the number of shares available to the public), subject to the following constraints as of the time of each reconstitution of the Index. The sum of all Industrial Companies that are not Self-Storage Companies cannot exceed 80% of the total Index weight, and the remaining weight will be composed of Self-Storage Companies. Additionally, each Index Constituent’s weight is capped at 15% and the sum of Index Constituents with weights greater than 4.5% cannot exceed 45% of the total Index weight. If the foregoing limits would be exceeded at the time of a reconstitution of the Index, the excess weight is proportionally redistributed to all Index Constituents with weights below such limits.
The Fund
The Fund’s inception date was May 14, 2018. The Fund had a since inception total return of 21.62%. The Index had a total return of 22.13%. The FTSE NAREIT All Equity REITS Index had a total return of 17.40%.
The Fund’s top three contributors to its return were Innovative Industrial Properties Inc, Prologis, Inc., and Liberty Property Trust These stocks realized total returns of 156.32%, 21.68%, and 23.09%, respectively.
The Fund’s bottom three contributors to its return were CubeSmart, Monmouth Real Estate Investment Corporation Class A, and National Storage Affiliates Trust These stocks realized total returns of -1.44%, -8.07%, and -0.52%, respectively.
Pacer Benchmark Data & Infrastructure Real Estate SCTR ETF
The Pacer Benchmark Data & Infrastructure Real Estate SCTRSM ETF (the “Fund”) is an exchange traded fund that seeks to track the total return performance, before fees and expenses, of the Benchmark Data & Infrastructure Real Estate SCTRSM Index (the “Index”).
The Index is generally composed of the U.S.-listed equity securities of companies that derive at least 85% of their earnings or revenues from real estate operations in the data and infrastructure real estate sectors (“Eligible Companies”). At the time of each reconstitution of the Index, Eligible Companies with a market capitalization of more than $200 million and average daily traded volume of at least 10,000 shares are included in the Index (the “Index Constituents”). A significant portion of the Index is expected to be composed of real estate investment trusts (“REITs”). The real estate companies included in the Index may utilize leverage, and some may be highly leveraged. Additionally, such companies may include significant business operations outside of the United States.
The Index is reconstituted and rebalanced quarterly as of the close of business on the third Friday of each March, June, September, and December based on data as of the end of the previous month (each, a “Reference Date”). Index Constituents are weighted based on their free-float market capitalization (i.e., market capitalization based on the number of shares available to the public), subject to the following constraints as of the time of each reconstitution of the Index. Each Index Constituent’s weight is capped at 15% and the sum of Index Constituents with weights greater than 4.5% cannot exceed 45% of the total Index weight. If the foregoing limits would be exceeded at the time of a reconstitution of the Index, the excess weight is proportionally redistributed to all Index Constituents with weights below such limits.
8
Pacer Funds
The Fund
The Fund’s inception date was May 15, 2018. The Fund had a since inception total return of 17.89%. The Index had a total return of 19.33%. The FTSE NAREIT All Equity REITS Index had a total return of 19.31%.
The Fund’s top three contributors to its return were American Tower Corporation, Crown Castle International Corp, and Zayo Group Holdings, Inc. These stocks realized total returns of 46.25%, 29.57%, and 52.93%, respectively.
The Fund’s bottom three contributors to its return were Weyerhaeuser Company, PotlatchDeltic Corporation, and Uniti Group Inc These stocks realized total returns of -40.84%, -37.5%, and-32.52%, respectively.
The Pacer Leaders ETF Series
The Pacer Leaders ETFs are strategy-driven, rules-based and are each designed to offer exposure to leaders in specific themes. The period referenced in this section for all custom funds is for the fiscal year end of April 30, 2019.
Pacer US Export Leaders ETF
The Pacer US Export Leaders ETF (the “Fund”) is an exchange traded fund that seeks to track the total return performance, before fees and expenses, of the Pacer US Export Leaders Index (the “Index”).
The Index uses an objective, rules-based methodology to measure the performance of an equal weight portfolio of approximately 100 large- and mid-capitalization U.S. companies with a high percentage of foreign sales and high free cash flow growth. Free cash flow is a company’s cash flow from operations minus its capital expenditures. Construction of the Index begins with an initial universe of the 200 companies across the S&P 900® Index (which is comprised of the S&P 500® Index (“S&P 500”) and S&P MidCap 400® Index (“S&P MidCap 400”)) that have the highest annual foreign sales as a percentage of total sales. The 200 companies are then narrowed to the 100 companies with the highest change in free cash flow growth over the past five years, and those 100 companies are equally weighted to create the Index. The Index is reconstituted and rebalanced to equal-weight quarterly. From time to time, the Index may include more or less than 100 companies as a result of events such as acquisitions, spin-offs and other corporate actions. The S&P 500 consists of approximately 500 leading U.S.-listed companies representing approximately 80% of the U.S. equity market capitalization. The S&P MidCap 400 measures the performance of mid-capitalization stocks in the United States.
The Fund
The Fund’s inception date was July 23, 2018. The Fund had a since inception total return of 4.33%. The Index had a total return of 4.89%. The S&P 900 Index had a total return of 6.10%.
During the fiscal year, the top three sectors for contribution to performance were Information Technology at 19.82%, Industrials at 21.93%, and Health Care at 10.95%. The three sectors with the lowest contribution to performance were Energy at -17.12%, Consumer Discretionary at -3.73%, and Real Estate at -9.36%. Sector performance numbers reflect their total return during the period.
Pacer CFRA-Stovall Equal Weight Seasonal Rotation ETF
The Pacer CFRA-Stovall Equal Weight Seasonal Rotation ETF (the “Fund”) is an exchange traded fund (“ETF”) that seeks to track the total return performance, before fees and expenses, of the Pacer CFRA-Stovall Equal Weight Seasonal Rotation Index (the “Index”).
The Index uses an objective, rules-based methodology to track the performance of a semi-annual rotation of certain sectors within the S&P 500 Equal Weight Index (“EWI”). The S&P 500 EWI is an equal-weighted version of the S&P 500®, which measures the performance of the large-cap segment of the U.S. equity market. The S&P 500 EWI includes stocks covering all 11 Global Industry Classification Standard (“GICS®”) sectors, six of which are eligible for inclusion in the Index.
On the last business day of each April, the Index is equally weighted in the S&P 500 EWI Consumer Staples and Healthcare sectors. The Index holdings then float until the last business day of the following October, when the Index is reconstituted and rebalanced to an equal weighting in the S&P 500 EWI Consumer Discretionary, Industrials, Information Technology, and Materials sectors. The Index holdings then float until the last business day of the following April (the next calendar year), when the Index is reconstituted and rebalanced back to an equal weighting in the S&P 500 EWI Consumer Staples and Healthcare sectors.
9
Pacer Funds
The Fund
The Fund’s inception date was July 23, 2018. The Fund had a since inception total return of 13.67%. The Index had a total return of 14.08%. The S&P 500 Index had a total return of 6.57%.
During the fiscal year, the top three sectors for contribution to performance were Information Technology at 16.95%, Consumer Staples at 7.26%, and Health Care at 6.43%. The three sectors with the lowest contribution to performance were Materials at 6.83%, Consumer Discretionary at 8.55%, and Industrials at 11.43%. Sector performance numbers reflect their total return during the period.
The performance data quoted is historical. Past performance is no guarantee of future results. You cannot invest directly in an index.
Before investing you should carefully consider the Fund’s investment objectives, risks, charges and expenses. This and other information is in the prospectus. A copy may be obtained by visiting www.paceretfs.com or calling 1-877-337-0500. Please read the prospectus carefully before investing.
An investment in the Funds is subject to investment risk, including the possible loss of principal. Pacer ETF shares may be bought and sold on an exchange through a brokerage account. Brokerage commissions and ETF expenses will reduce investment returns. There can be no assurance that an active trading market for ETF shares will be developed or maintained. The risks associated with these funds are detailed in the prospectus and could include factors such as concentration risk, currency exchange rate risk, data and infrastructure real estate sector risk, emerging markets risk, equity market risk, European investments risk, fixed income risk, foreign sales risk, foreign securities risk, geographic concentration risk, government obligations risk, high portfolio turnover risk, index criteria risk, industrial real estate sector risk, international operations risk, large and mid-capitalization investing risk, monthly exposure risk, new fund risk, non-diversification risk, other investment companies risk, passive investment risk, REIT investment risk, retail real estate sector risk, sector risk, sector rotation risk, smaller-capitalization companies risk, style risk, tax risk, tracking risk, trend lag risk, and/or special risks of exchange traded funds.
The Pacer Trendpilot® US Large Cap Index, Pacer Trendpilot® US Mid Cap Index, Pacer US Small Cap Cash Cows Index, Pacer US Export Leaders Index, and Pacer WealthShield Index (the “Indices”) are the property of Index Design Group, LLC which has contracted with S&P Opco, LLC (a subsidiary of S&P Dow Jones Indices LLC) to calculate and maintain the Indices. The Indices are not sponsored by S&P Dow Jones Indices or its affiliates or its third party licensors (collectively, “S&P Dow Jones Indices”). S&P Dow Jones Indices will not be liable for any errors or omissions in calculating the Indices. “Calculated by S&P Dow Jones Indices” and the related stylized mark(s) are service marks of S&P Dow Jones Indices and have been licensed for use by Index Design Group, LLC. S&P® is a registered trademark of Standard & Poor’s Financial Services LLC (“SPFS”) and Dow Jones® is a registered trademark of Dow Jones Trademark Holdings LLC (“Dow Jones”).
The Pacer NASDAQ-100 Trendpilot® Index is co-owned by Index Design Group, LLC. and Nasdaq, Inc. (which with its affiliates is referred to as the “Corporations”). The NASDAQ-100 is a registered trademark of the Corporations and is licensed for use by Index Design Group, LLC. The Product(s) are not issued, endorsed, sold, or promoted by the Corporations. The Corporations make no warranties and bear no liability with respect to the product(s).
Source: FTSE International Limited (“FTSE”)© FTSE 2017. “FTSE®” is a trade mark of the London Stock Exchange Group companies and is used by FTSE International Limited under license. All rights in the FTSE indices and / or FTSE ratings vest in FTSE and/or its licensors. Neither FTSE nor its licensors accept any liability for any errors or omissions in the FTSE indices and / or FTSE ratings or underlying data and no party may rely on any FTSE indices, ratings and / or data underlying data contained in this communication. No further distribution of FTSE Data is permitted without FTSE’s express written consent. FTSE does not promote, sponsor or endorse the content of this communication.
The Russell 1000 Index (the “Index”) is a trademark of Frank Russell Company (“Russell”) and has been licensed for use by Index Design Group, LLC (“IDG”). The Pacer US Cash Cows 100 Index is not in any way sponsored, endorsed, sold or promoted by Russell or the London Stock Exchange Group companies (“LSEG”) (together the “Licensor Parties”) and none of the Licensor Parties make any claim, prediction, warranty or representation whatsoever, expressly or impliedly, either as to (i) the results to be obtained from the use of the Index (upon which the Pacer US Cash Cows 100 Index is based), (ii) the figure at which the Index is said to stand at any particular time on any particular day or otherwise, or (iii) the suitability of the Index for the purpose to which it is being put in connection with the Pacer US Cash Cows 100 Index. None of the Licensor Parties have provided or will provide any financial or investment advice or recommendation in relation to the Index to IDG or to its clients. The Index is calculated by Russell or its agent. None of the Licensor Parties shall be (a) liable (whether in negligence or otherwise) to any person for any error in the Index or (b) under any obligation to advise any person of any error therein.
10
Pacer Funds
“VETS INDEXES(SM)” and “MILITARY TIMES BEST FOR VETS INDEX(SM)” are service marks of VETS Indexes LLC and have been licensed for use by Pacer Advisors, LLC. The Product is not sponsored, endorsed, sold or promoted by VETS Indexes LLC and VETS Indexes LLC makes no representation regarding the advisability of investing in the Product or such similar language as may be approved in advance by VETS.
Benchmark Data & Infrastructure Real Estate SCTR Index, Benchmark Industrial Real Estate SCTR Index and Benchmark Retail Real Estate SCTR Index are trademarks of Benchmark Investments, LLC and have been licensed for use by Pacer Advisors, Inc. The Pacer Benchmark Data & Infrastructure Real Estate SCTR ETF, Pacer Benchmark Industrial Real Estate SCTR ETF and Pacer Benchmark Retail Real Estate SCTR ETF are not sponsored, endorsed, sold or promoted by Benchmarks Investments, LLC and Benchmark Investments, LLC makes no representation or warranty regarding the advisability of investing in this Pacer Benchmark Data & Infrastructure Real Estate SCTR ETF, Pacer Benchmark Industrial Real Estate SCTR ETF and Pacer Benchmark Retail Real Estate SCTR ETF.
CFRA makes no representation or warranty, express or implied, to the owners of the Product or any member of the public regarding the advisability of investing in securities generally, or in the Product particularly, or the ability of CFRA’s Index to track general market performance. CFRA is not responsible for and has not participated in the determination of the prices and amount of the Product or the timing of the issuance or sale of the Product or in the determination or calculation of the equation by which the product may be converted into cash or other redemption mechanics. CFRA has no obligation or liability in connection with the administration, marketing or trading of the Product. CFRA is not an investment advisor. Inclusion of a security within a CFRA Index is not a recommendation by CFRA to buy, sell, or hold any security, nor is it investment advice. CFRA does not guarantee the adequacy, accuracy, timeliness and/or the completeness of the CFRA Index or any data related thereto or any communication with respect thereto, including oral, written, or electronic communications. CFRA shall not be subject to any damages or liability for any errors, omissions, or delays therein. CFRA makes no express or implied warranties, and expressly disclaims all warranties, of merchantability or fitness for a particular purpose or use or as to results to be obtained by users, owners of the product, or any other person or entity from the use of the CFRA Index or with respect to any data related thereto.
Investment products offered are: Not FDIC Insured ● No Bank Guarantee ● May Lose Value
Trendpilot®, Cash Cows Index® and Strategy Driven ETFs™ are trademarks of Index Design Group, LLC.
Distributor: Pacer Financial, Inc, member FINRA, SIPC, an affiliate of Pacer Advisors, Inc.
11
Pacer Funds
Portfolio Allocation (Unaudited)
As of April 30, 2019
Pacer Trendpilot® US Large Cap ETF
Sector(a) | | Percentage of
Net Assets | |
Consumer, Non-Cyclical | | | 21.4 | % |
Financial | | | 17.8 | % |
Technology | | | 16.9 | % |
Communications | | | 15.3 | % |
Industrial | | | 9.3 | % |
Consumer, Cyclical | | | 8.4 | % |
Energy | | | 5.2 | % |
Utilities | | | 3.2 | % |
Basic Materials | | | 2.1 | % |
Short-Term Investments | | | 0.3 | % |
Investments Purchased with Proceeds from Securities Lending | | | 19.0 | % |
Liabilities in excess of other assets | | | -18.9 | % |
Total | | | 100.0 | % |
(a) | The Fund may classify a company in a different category than the The Pacer Trendpilot® US Large Cap Index. |
Pacer Trendpilot® US Mid Cap ETF
Sector(a) | | Percentage of
Net Assets | |
Financial | | | 24.5 | % |
Industrial | | | 19.2 | % |
Consumer, Non-Cyclical | | | 14.6 | % |
Consumer, Cyclical | | | 12.6 | % |
Technology | | | 9.6 | % |
Basic Materials | | | 4.6 | % |
Utilities | | | 4.2 | % |
Energy | | | 4.0 | % |
Communications | | | 3.4 | % |
Investment Companies | | | 3.2 | % |
Short-Term Investments | | | 0.1 | % |
Investments Purchased with Proceeds from Securities Lending | | | 29.0 | % |
Liabilities in excess of other assets | | | -29.0 | % |
Total | | | 100.0 | % |
(a) | The Fund may classify a company in a different category than the The Pacer Trendpilot® US Mid Cap Index. |
Pacer Trendpilot® 100 ETF
Sector(a) | | Percentage of
Net Assets | |
Technology | | | 39.9 | % |
Communications | | | 37.4 | % |
Consumer, Non-Cyclical | | | 14.4 | % |
Consumer, Cyclical | | | 7.0 | % |
Industrial | | | 0.9 | % |
Utilities | | | 0.3 | % |
Short-Term Investments | | | 0.1 | % |
Investments Purchased with Proceeds from Securities Lending | | | 13.7 | % |
Liabilities in excess of other assets | | | -13.7 | % |
Total | | | 100.0 | % |
(a) | The Fund may classify a company in a different category than the Pacer nasdaq-100 Trendpilot® Index. |
12
Pacer Funds
PORTFOLIO ALLOCATION (Unaudited) (Continued)
As of April 30, 2019
Pacer Trendpilot® European Index ETF
Country(a) | | Percentage of
Net Assets | |
France | | | 31.3 | % |
Germany | | | 27.4 | % |
Netherlands | | | 10.5 | % |
Spain | | | 9.5 | % |
Italy | | | 7.2 | % |
Finland | | | 3.8 | % |
Belgium | | | 3.2 | % |
United Kingdom | | | 3.0 | % |
Ireland | | | 0.8 | % |
Austria | | | 0.8 | % |
Luxembourg | | | 0.6 | % |
Portugal | | | 0.5 | % |
Greece | | | 0.4 | % |
Switzerland | | | 0.3 | % |
Short-Term Investments | | | 0.4 | % |
Investments Purchased with Proceeds from Securities Lending | | | 3.1 | % |
Liabilities in excess of other assets | | | -2.8 | % |
Total | | | 100.0 | % |
(a) | The Fund generally classifies a company based on its country of incorporation, but may designate a different country in certain circumstances. |
Pacer Global Cash Cows Dividend ETF
Sector(a) | | Percentage of
Net Assets | |
Consumer, Non-Cyclical | | | 20.6 | % |
Energy | | | 16.5 | % |
Communications | | | 15.4 | % |
Consumer, Cyclical | | | 12.9 | % |
Basic Materials | | | 12.7 | % |
Technology | | | 9.0 | % |
Industrial | | | 6.0 | % |
Utilities | | | 3.8 | % |
Financial | | | 1.9 | % |
Diversified | | | 0.2 | % |
Short-Term Investments | | | 0.5 | % |
Investments Purchased with Proceeds from Securities Lending | | | 23.6 | % |
Liabilities in excess of other assets | | | -23.1 | % |
Total | | | 100.0 | % |
(a) | The Fund may classify a company in a different category than the Pacer Global Cash Cows Dividend 100 Index. |
13
Pacer Funds
PORTFOLIO ALLOCATION (Unaudited) (Continued)
As of April 30, 2019
Pacer US Cash Cows 100 ETF
Sector(a) | | Percentage of
Net Assets | |
Technology | | | 30.6 | % |
Consumer, Non-Cyclical | | | 19.6 | % |
Consumer, Cyclical | | | 19.0 | % |
Communications | | | 11.6 | % |
Basic Materials | | | 6.9 | % |
Energy | | | 6.8 | % |
Industrial | | | 3.6 | % |
Financial | | | 1.7 | % |
Short-Term Investments | | | 0.2 | % |
Investments Purchased with Proceeds from Securities Lending | | | 8.9 | % |
Liabilities in excess of other assets | | | -8.9 | % |
Total | | | 100.0 | % |
(a) | The Fund may classify a company in a different category than the Pacer US Cash Cows 100 Index. |
Pacer US Small Cap Cash Cows 100 ETF
Sector(a) | | Percentage of
Net Assets | |
Consumer, Cyclical | | | 28.9 | % |
Industrial | | | 20.6 | % |
Consumer, Non-Cyclical | | | 20.1 | % |
Technology | | | 10.8 | % |
Energy | | | 6.9 | % |
Basic Materials | | | 5.3 | % |
Communications | | | 5.1 | % |
Financial | | | 2.1 | % |
Short-Term Investments | | | 0.2 | % |
Investments Purchased with Proceeds from Securities Lending | | | 27.0 | % |
Liabilities in excess of other assets | | | -27.0 | % |
Total | | | 100.0 | % |
(a) | The Fund may classify a company in a different category than the Pacer US Small Cap Cash Cows 100 Index. |
Pacer Developed Markets International Cash Cows 100 ETF
Sector(a) | | Percentage of
Net Assets | |
Consumer, Cyclical | | | 27.9 | % |
Basic Materials | | | 19.2 | % |
Consumer, Non-Cyclical | | | 14.4 | % |
Communications | | | 11.9 | % |
Industrial | | | 9.1 | % |
Technology | | | 8.4 | % |
Energy | | | 6.2 | % |
Utilities | | | 1.8 | % |
Short-Term Investments | | | 0.5 | % |
Investments Purchased with Proceeds from Securities Lending | | | 9.2 | % |
Liabilities in excess of other assets | | | -8.6 | % |
Total | | | 100.0 | % |
(a) | The Fund may classify a company in a different category than the Pacer Developed Markets International Cash Cows 100 Index. |
14
Pacer Funds
PORTFOLIO ALLOCATION (Unaudited) (Continued)
As of April 30, 2019
Pacer WealthShield ETF
Sector(a) | | Percentage of
Net Assets | |
Financial | | | 22.4 | % |
Technology | | | 20.4 | % |
Utilities | | | 19.3 | % |
Consumer, Non-Cyclical | | | 18.8 | % |
Communications | | | 15.3 | % |
Consumer, Cyclical | | | 3.3 | % |
Industrial | | | 0.3 | % |
Short-Term Investments | | | 0.2 | % |
Investments Purchased with Proceeds from Securities Lending | | | 4.9 | % |
Other assets in excess of liabilities | | | -4.9 | % |
Total | | | 100.0 | % |
(a) | The Fund may classify a company in a different category than the Pacer WealthShield Index. |
Pacer Military Times Best Employers ETF
Sector(a) | | Percentage of
Net Assets | |
Financial | | | 23.1 | % |
Technology | | | 16.9 | % |
Industrial | | | 16.2 | % |
Consumer, Non-Cyclical | | | 13.1 | % |
Communications | | | 11.6 | % |
Consumer, Cyclical | | | 9.3 | % |
Utilities | | | 9.3 | % |
Short-Term Investments | | | 0.4 | % |
Other assets in excess of liabilities | | | 0.1 | % |
Total | | | 100.0 | % |
(a) | The Fund may classify a company in a different category than the Military Times Best for VETS Total Return Index. |
Pacer Benchmark Retail Real Estate ETF
Sector(a) | | Percentage of
Net Assets | |
Financial | | | 99.7 | % |
Short-Term Investments | | | 0.2 | % |
Other assets in excess of liabilities | | | 0.1 | % |
Total | | | 100.0 | % |
(a) | The Fund may classify a company in a different category than the Pacer Benchmark Retail Real Estate Index. |
Pacer Benchmark Industrial Real Estate ETF
Sector(a) | | Percentage of
Net Assets | |
Financial | | | 99.7 | % |
Short-Term Investments | | | 0.3 | % |
Investments Purchased with Proceeds from Securities Lending | | | 5.8 | % |
Liabilities in excess of other assets | | | -5.8 | % |
Total | | | 100.0 | % |
(a) | The Fund may classify a company in a different category than the Pacer Benchmark Industrial Real Estate Index. |
15
Pacer Funds
PORTFOLIO ALLOCATION (Unaudited) (Continued)
As of April 30, 2019
Pacer Benchmark Data & Infrastructure Real Estate ETF
Sector(a) | | Percentage of
Net Assets | |
Financial | | | 83.3 | % |
Communications | | | 11.9 | % |
Technology | | | 4.6 | % |
Short-Term Investments | | | 0.2 | % |
Investments Purchased with Proceeds from Securities Lending | | | 4.4 | % |
Other assets in excess of liabilities | | | -4.4 | % |
Total | | | 100.0 | % |
(a) | The Fund may classify a company in a different category than the Pacer Benchmark Data & Infrastructure Real Estate Index. |
Pacer US Export Leaders ETF
Sector(a) | | Percentage of
Net Assets | |
Technology | | | 32.9 | % |
Industrial | | | 24.7 | % |
Consumer, Non-Cyclical | | | 16.3 | % |
Consumer, Cyclical | | | 8.7 | % |
Basic Materials | | | 7.6 | % |
Communications | | | 6.0 | % |
Energy | | | 2.8 | % |
Exchange Traded Funds | | | 0.9 | % |
Short-Term Investments | | | 0.1 | % |
Liabilities in excess of other assets | | | *0.0 | % |
Total | | | 100.0 | % |
(a) | The Fund may classify a company in a different category than the Pacer US Export Leaders Index. |
Pacer CFRA-Stovall Equal Weight Seasonal Rotation ETF
Sector(a) | | Percentage of
Net Assets | |
Consumer, Non-Cyclical | | | 91.5 | % |
Consumer, Cyclical | | | 4.3 | % |
Industrial | | | 3.2 | % |
Technology | | | 1.0 | % |
Short-Term Investments | | | 0.1 | % |
Liabilities in excess of other assets | | | -0.1 | % |
Total | | | 100.0 | % |
(a) | The Fund may classify a company in a different category than the Pacer CFRA-Stovall Equal Weight Seasonal Rotation Index. |
16
Pacer Trendpilot® US Large Cap ETF
Performance Summary
(Unaudited)
Growth of $10,000
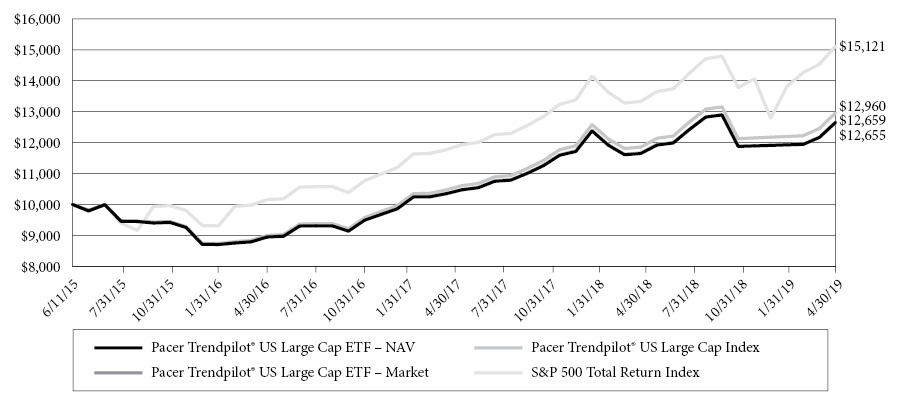
This chart illustrates the performance of a hypothetical $10,000 investment made on June 11, 2015, and is not intended to imply any future performance. The returns shown do not reflect the deduction of taxes that a shareholder would pay on fund distributions or the redemption of fund shares. The chart assumes reinvestment of capital gains and dividends.
The Pacer Trendpilot® US Large Cap Index uses an objective, rules-based methodology to implement a systematic trend-following strategy that directs exposure (i) 100% to the S&P 500 Index, (ii) 50% to the S&P 500 Total Return Index and 50% to 3-Month US Treasury bills, or (iii) 100% to 3-Month US Treasury bills, depending on the relative performance of the S&P 500 Total Return Index and its 200-business day historical simple moving average. The S&P 500 Total Return Index is a total return version of the S&P 500 Index and reflects the reinvestment of dividends paid by the securities in the S&P 500 Index.
The S&P 500 Total Return Index is a total return version of the S&P 500 Index and reflects the reinvestment of dividends paid by the securities in the S&P 500 Index. The S&P 500 Index consists of approximately 500 leading U.S.-listed companies representing approximately 8% of the U.S. equity market capitalization.
Annualized Returns(1)
(For the year ended April 30, 2019)
| | One Year | Since Inception(2) |
Pacer Trendpilot® US Large Cap ETF - NAV | 8.65% | 6.24% |
Pacer Trendpilot® US Large Cap ETF - Market | 8.48% | 6.25% |
Pacer Trendpilot® US Large Cap Index(3)(4) | 9.34% | 6.90% |
S&P 500 Total Return IndexTM (4) | 13.49% | 11.22% |
(1) | The performance data quoted is historical. Past performance is no guarantee of future results. Current performance may be higher or lower than the performance data quoted. The principal value and investment return of an investment will fluctuate so that investor’s shares, when redeemed, may be worth more or less than the original cost. The returns shown do not reflect the deduction of taxes that a shareholder would pay on Fund distributions or on redemptions of Fund shares. The total annual operating expenses as stated in the fee table to the Fund’s prospectus dated August 31, 2018, is 0.60%. For performance information current to the most recent month-end, please call 1-877-337-0500. |
(2) | Inception date is June 11, 2015. |
(3) | Effective November 1, 2017, the Fund’s investment objective was to track the price and total return performance, before fees and expenses, of the Pacer Trendpilot® US Large Cap Index. Prior to November 1, 2017, the Fund’s investment objective was to track the price and total return performance, before fees and expenses, of the Pacer Wilshire US Large-Cap TrendpilotTM Index. Performance shown for periods beginning November 1, 2017 is that of the Pacer Trendpilot® US Large Cap Index, and performance shown for periods prior to November 1, 2017 is that of the Pacer Wilshire US Large-Cap TrendpilotTM Index. |
(4) | Indexes are unmanaged statistical composites and their returns do not include fees an investor would pay to purchase the securities they represent. Such costs would lower performance. It is not possible to invest directly in an index. |
17
Pacer Trendpilot® US Mid Cap ETF
PERFORMANCE SUMMARY
(Unaudited)
Growth of $10,000
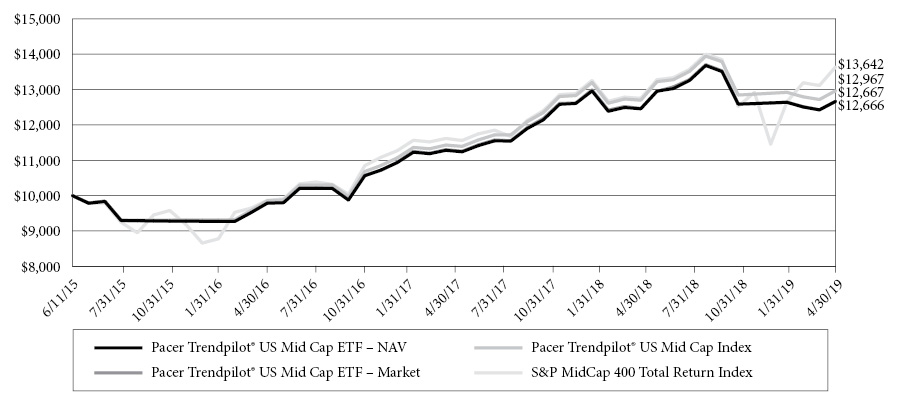
This chart illustrates the performance of a hypothetical $10,000 investment made on June 11, 2015, and is not intended to imply any future performance. The returns shown do not reflect the deduction of taxes that a shareholder would pay on fund distributions or the redemption of fund shares. The chart assumes reinvestment of capital gains and dividends.
The Pacer Trendpilot® US Mid Cap Index uses an objective, rules-based methodology to implement a systematic trend-following strategy that directs exposure (i) 100% to the S&P MidCap 400 Index, (ii) 50% to the S&P MidCap 400 Index and 50% to 3-Month US Treasury bills, or (iii) 100% to 3-Month US Treasury bills, depending on the relative performance of the S&P MidCap 400 Total Return Index and its 200-business day historical simple moving average.
The S&P MidCap 400 Total Return Index is a total return version of the S&P MidCap 400 Index and reflects the reinvestment of dividends paid by the securities in the S&P MidCap 400 Index. The S&P Midcap 400 measures the performance of mid-capitalization stocks in the United States.
Annualized Returns(1)
(For the year ended April 30, 2019)
| | One Year | Since Inception(2) |
Pacer Trendpilot® US Mid Cap ETF - NAV | 1.66% | 6.27% |
Pacer Trendpilot® US Mid Cap ETF - Market | 1.65% | 6.27% |
Pacer Trendpilot® US Mid Cap Index(3)(4) | 2.11% | 6.91% |
S&P MidCap 400 Total Return Index(4) | 6.99% | 8.32% |
(1) | The performance data quoted is historical. Past performance is no guarantee of future results. Current performance may be higher or lower than the performance data quoted. The principal value and investment return of an investment will fluctuate so that investor’s shares, when redeemed, may be worth more or less than the original cost. The returns shown do not reflect the deduction of taxes that a shareholder would pay on Fund distributions or on redemptions of Fund shares. The total annual operating expenses as stated in the fee table to the Fund’s prospectus dated August 31, 2018, is 0.62%. For performance information current to the most recent month-end, please call 1-877-337-0500. |
(2) | Inception date is June 11, 2015. |
(3) | Effective November 1, 2017, the Fund’s investment objective was to track the price and total return performance, before fees and expenses, of thePacer Trendpilot® US Mid Cap Index. Prior to November 1, 2017, the Fund’s investment objective was to track the price and total return performance, before fees and expenses, of the Pacer Wilshire US Mind-Cap TrendpilotTM Index. Performance shown for periods beginning November 1, 2017 is that of the Pacer Trendpilot® US Mid Cap Index, and performance shown for periods prior to November 1, 2017 is that of the Pacer Wilshire US Mid-Cap TrendpilotTM Index. |
(4) | Indexes are unmanaged statistical composites and their returns do not include fees an investor would pay to purchase the securities they represent. Such costs would lower performance. It is not possible to invest directly in an index. |
18
Pacer Trendpilot® 100 ETF
PERFORMANCE SUMMARY
(Unaudited)
Growth of $10,000
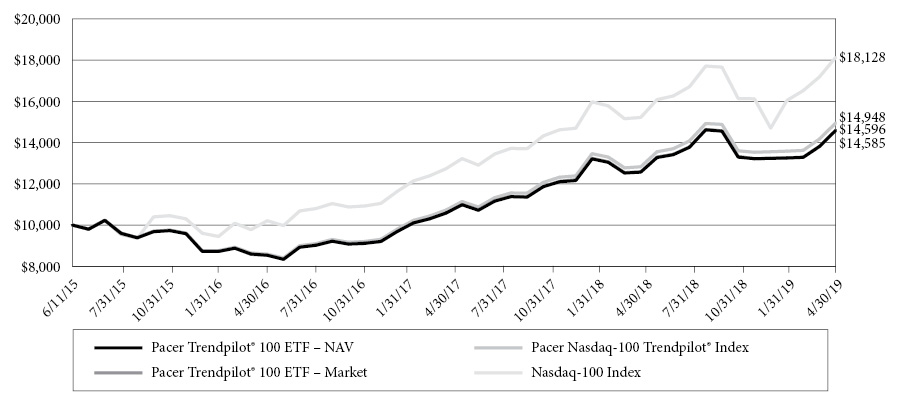
This chart illustrates the performance of a hypothetical $10,000 investment made on June 11, 2015, and is not intended to imply any future performance. The returns shown do not reflect the deduction of taxes that a shareholder would pay on fund distributions or the redemption of fund shares. The chart assumes reinvestment of capital gains and dividends.
Pacer Nasdaq-100 Trendpilot® Index uses an objective, rules-based methodology to implement a systematic trend-following strategy that directs exposure (i) 100% to the Nasdaq-100 Index, (ii) 50% to the Nasdaq-100 Index and 50% to 3-Month US Treasury bills, or (iii) 100% to 3-Month US Treasury bills, depending on the relative performance of the Nasdaq-100 Total Return Index and its 200-business day historical simple moving average. The Nasdaq-100 Total Return Index is a total return version of the Nasdaq-100 Index and reflects the reinvestment of dividends paid by the securities in the Nasdaq-100 Index.
The Nasdaq-100 Index includes approximately 100 of the largest non-financial securities listed on The Nasdaq Stock Market based on market capitalization. The Nasdaq-100 Index comprises securities of companies across major industry groups, including computer, biotechnology, healthcare, telecommunications and transportation. However, it does not contain securities of financial companies, including investment companies. The Nasdaq 100 Index was developed by Nasdaq OMX. There is no minimum market capitalization requirement for inclusion in the Nasdaq-100 Index. Inclusion is determined based on the top 100 largest issuers based on market capitalization meeting all other eligibility requirements.
Annualized Returns(1)
(For the year ended April 30, 2019)
| | One Year | Since Inception(2) |
Pacer Trendpilot® 100 ETF - NAV | 16.04% | 10.20% |
Pacer Trendpilot® 100 ETF - Market | 16.01% | 10.22% |
Pacer Nasdaq-100 Trendpilot® Index(3) | 16.55% | 10.89% |
Nasdaq-100 Index(3) | 19.10% | 16.53% |
(1) | The performance data quoted is historical. Past performance is no guarantee of future results. Current performance may be higher or lower than the performance data quoted. The principal value and investment return of an investment will fluctuate so that investor’s shares, when redeemed, may be worth more or less than the original cost. The returns shown do not reflect the deduction of taxes that a shareholder would pay on Fund distributions or on redemptions of Fund shares. The total annual operating expenses as stated in the fee table to the Fund’s prospectus dated August 31, 2018, is 0.65%. For performance information current to the most recent month-end, please call 1-877-337-0500. |
(2) | Inception date is June 11, 2015. |
(3) | Indexes are unmanaged statistical composites and their returns do not include fees an investor would pay to purchase the securities they represent. Such costs would lower performance. It is not possible to invest directly in an index. |
19
Pacer Trendpilot® European Index ETF
PERFORMANCE SUMMARY
(Unaudited)
Growth of $10,000
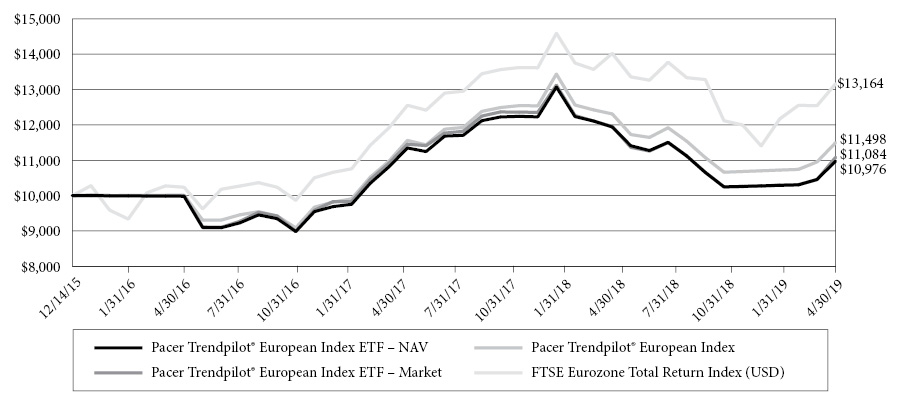
This chart illustrates the performance of a hypothetical $10,000 investment made on December 14, 2015, and is not intended to imply any future performance. The returns shown do not reflect the deduction of taxes that a shareholder would pay on fund distributions or the redemption of fund shares. The chart assumes reinvestment of capital gains and dividends.
The Pacer Trendpilot® European Index uses an objective, rules-based methodology to implement a systematic trend-following strategy that directs exposure (i) 100% to the FTSE Eurozone Index, (ii) 50% to the FTSE Eurozone Index and 50% to 3-Month US Treasury bills, or (iii) 100% to 3-Month US Treasury bills, depending on the relative performance of the FTSE Eurozone Total Return Index and its 200-business day historical simple moving average.
The FTSE Eurozone Index is a rules-based, float-adjusted, market capitalization-weighted index comprised of large- and mid-capitalization stocks providing coverage of the developed markets in the euro zone, including primarily France, Germany, Spain, the Netherlands, and Italy. The FTSE Eurozone Index is a subset of the FTSE Global Equity Index Series, which covers 98% of the world’s investable market capitalization. The FTSE Eurozone Total Return Index is a total return version of the FTSE Eurozone Index and reflects the reinvestment of dividend paid by the securities in the FTSE Eurozone Index.
Annualized Returns(1)
(For the year ended April 30, 2019)
| | One Year | Since Inception(2) |
Pacer Trendpilot® European Index ETF - NAV | -8.07% | 2.79% |
Pacer Trendpilot® European Index ETF - Market | -7.26% | 3.09% |
Pacer Trendpilot® European Index(3) | -6.60% | 4.22% |
FTSE Eurozone Index (USD)(3) | -6.12% | 8.48% |
(1) | The performance data quoted is historical. Past performance is no guarantee of future results. Current performance may be higher or lower than the performance data quoted. The principal value and investment return of an investment will fluctuate so that investor’s shares, when redeemed, may be worth more or less than the original cost. The returns shown do not reflect the deduction of taxes that a shareholder would pay on Fund distributions or on redemptions of Fund shares. The total annual operating expenses as stated in the fee table to the Fund’s prospectus dated August 31, 2018, is 0.66%. For performance information current to the most recent month-end, please call 1-877-337-0500. |
(2) | Inception date is December 14, 2015. |
(3) | Indexes are unmanaged statistical composites and their returns do not include fees an investor would pay to purchase the securities they represent. Such costs would lower performance. It is not possible to invest directly in an index. |
20
Pacer Global Cash Cows Dividend ETF
PERFORMANCE SUMMARY
(Unaudited)
Growth of $10,000
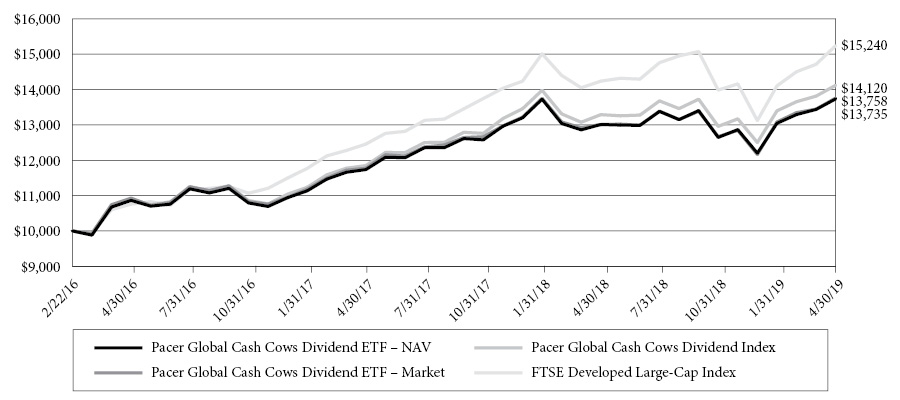
This chart illustrates the performance of a hypothetical $10,000 investment made on February 22, 2016, and is not intended to imply any future performance. The returns shown do not reflect the deduction of taxes that a shareholder would pay on fund distributions or the redemption of fund shares. The chart assumes reinvestment of capital gains and dividends.
The Pacer Global Cash Cows Dividend Index uses an objective, rules-based methodology to provide exposure to global companies with high dividend yield backed by a high free cash flow yield. The initial index universe is derived from the component companies of the FTSE Developed Large Cap Index. The initial universe of companies is screened based on their average projected free cash flows and earnings over each of the next two fiscal years. Companies with negative average projected free cash flows or earnings are removed from the Index universe. Additionally, financial companies, other than real estate investment trusts, are excluded from the Index universe. The remaining companies are ranked by their free cash flow yield for the trailing twelve month period. The 300 companies with the highest free cash flow yield are then ranked by their dividend yield. The equity securities of the 100 companies with the highest dividend yield are included in the Index.
The FTSE Developed Large-Cap Index is a market-capitalization weighted index representing the performance of large-cap stocks in developed markets. The FTSE Developed Large-Cap Total Return Index is a total return version of the FTSE Developed Large-Cap Index and reflects the reinvestment of dividends paid by the securities in the FTSE Developed Large-Cap Index.
Annualized Returns(1)
(For the year ended April 30, 2019)
| | One Year | Since Inception(2) |
Pacer Global Cash Cows Dividend ETF - NAV | 5.56% | 10.47% |
Pacer Global Cash Cows Dividend ETF - Market | 5.73% | 10.53% |
Pacer Global Cash Cows Dividend Index(3) | 6.25% | 11.44% |
FTSE Developed Large-Cap Index(3) | 7.04% | 14.14% |
(1) | The performance data quoted is historical. Past performance is no guarantee of future results. Current performance may be higher or lower than the performance data quoted. The principal value and investment return of an investment will fluctuate so that investor’s shares, when redeemed, may be worth more or less than the original cost. The returns shown do not reflect the deduction of taxes that a shareholder would pay on Fund distributions or on redemptions of Fund shares. The total annual operating expenses as stated in the fee table to the Fund’s prospectus dated August 31, 2018, is 0.60%. For performance information current to the most recent month-end, please call 1-877-337-0500. |
(2) | Inception date is February 22, 2016. |
(3) | Indexes are unmanaged statistical composites and their returns do not include fees an investor would pay to purchase the securities they represent. Such costs would lower performance. It is not possible to invest directly in an index |
21
Pacer US Cash Cows 100 ETF
PERFORMANCE SUMMARY
(Unaudited)
Growth of $10,000
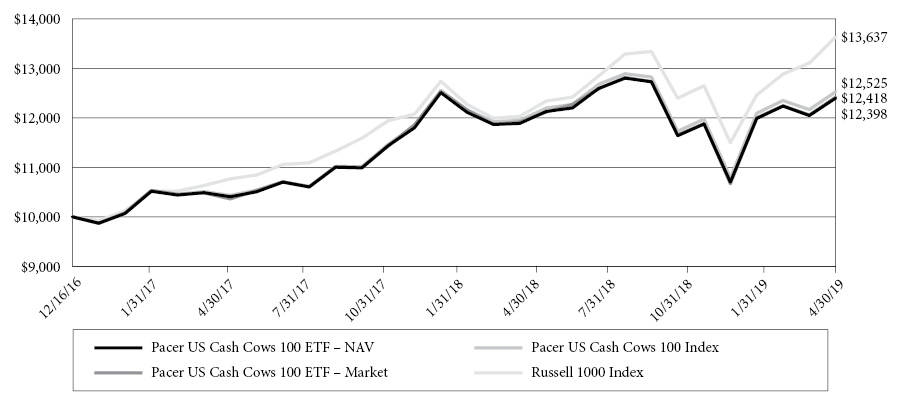
This chart illustrates the performance of a hypothetical $10,000 investment made on December 16, 2016, and is not intended to imply any future performance. The returns shown do not reflect the deduction of taxes that a shareholder would pay on fund distributions or the redemption of fund shares. The chart assumes reinvestment of capital gains and dividends.
The Pacer US Cash Cows 100 Index uses an objective, rules-based methodology to provide exposure to large and mid-capitalization U.S. companies with high free cash flow yields. The initial index universe is derived from the component companies of the Russell 1000 Index. The initial universe of companies is screened based on their average projected free cash flows and earnings over each of the next two fiscal years. Companies with no forward year estimates available for free cash flows or earnings will remain in the Index universe. Companies with negative average projected free cash flows or earnings are removed from the Index universe. Additionally, financial companies, other than real estate investment trusts, are excluded from the Index universe. The remaining companies are ranked by their free cash flow yield for the trailing twelve month period. The equity securities of the 100 companies with the highest free cash flow yield are included in the Index.
The Russell 1000 Index is a market-capitalization weighted index representing the top 1,000 large-cap stocks in the Russell 3000 Index. The Russell 1000 Total Return Index is a total return version of the Russell 1000 Index that reflects the reinvestment of dividends paid by the securities in the Russell 1000 Index.
Annualized Returns(1)
(For the year ended April 30, 2019)
| | One Year | Since Inception(2) |
Pacer US Cash Cows 100 ETF - NAV | 4.28% | 9.49% |
Pacer US Cash Cows 100 ETF - Market | 4.19% | 9.57% |
Pacer US Cash Cows 100 Index(3) | 4.84% | 9.97% |
Russell 1000 Index(3) | 13.33% | 13.98% |
(1) | The performance data quoted is historical. Past performance is no guarantee of future results. Current performance may be higher or lower than the performance data quoted. The principal value and investment return of an investment will fluctuate so that investor’s shares, when redeemed, may be worth more or less than the original cost. The returns shown do not reflect the deduction of taxes that a shareholder would pay on Fund distributions or on redemptions of Fund shares. The total annual operating expenses as stated in the fee table to the Fund’s prospectus dated August 31, 2018, is 0.49%. For performance information current to the most recent month-end, please call 1-877-337-0500. |
(2) | Inception date is December 16, 2016. |
(3) | Indexes are unmanaged statistical composites and their returns do not include fees an investor would pay to purchase the securities they represent. Such costs would lower performance. It is not possible to invest directly in an index. |
22
Pacer US Small Cap Cash Cows 100 ETF
PERFORMANCE SUMMARY
(Unaudited)
Growth of $10,000
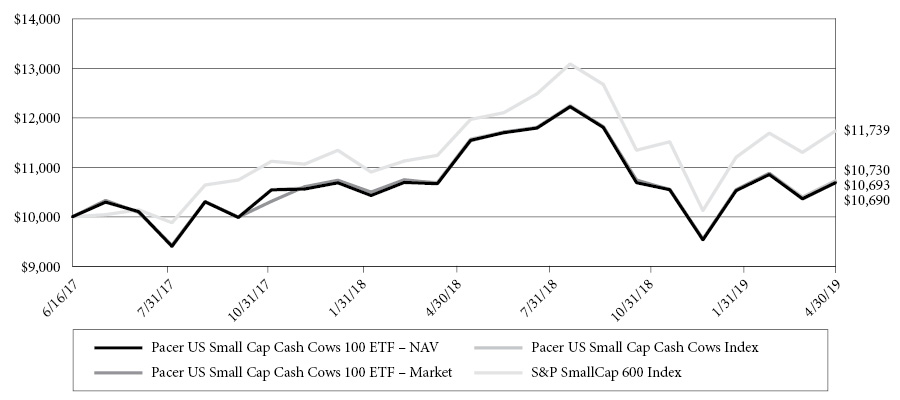
This chart illustrates the performance of a hypothetical $10,000 investment made on June 16, 2017, and is not intended to imply any future performance. The returns shown do not reflect the deduction of taxes that a shareholder would pay on fund distributions or the redemption of fund shares. The chart assumes reinvestment of capital gains and dividends.
The Pacer US Small Cap Cash Cows Index uses an objective, rules-based methodology to provide exposure to small-capitalization U.S. companies with high free cash flow yields. The initial index universe is derived from the component companies of the S&P Small Cap 600 Index. The initial universe of companies is screened based on their average projected free cash flows and earnings over each of the next two fiscal years. Companies with no forward year estimates available for free cash flows or earnings will remain in the Index universe. Companies with negative average projected free cash flows or earnings are removed from the Index universe. Additionally, financial companies, other than real estate investment trusts, are excluded from the Index universe. The remaining companies are ranked by their free cash flow yield for the trailing twelve month period. The equity securities of the 100 companies with the highest free cash flow yield are included in the Index.
The S&P SmallCap 600 Index measures the performance of 600 small sized companies in the US equity market, with market capitalization ranging from $450 million to $2.1 billion USD. The Index does not overlap holdings with the S&P 500 or S&P MidCap 400.
Annualized Returns(1)
(For the year ended April 30, 2019)
| | One Year | Since Inception(2) |
Pacer US Small Cap Cash Cows 100 ETF - NAV | 0.20% | 3.63% |
Pacer US Small Cap Cash Cows 100 ETF - Market | 0.14% | 3.65% |
Pacer US Small Cap Cash Cows Index(3) | 0.32% | 3.84% |
S&P SmallCap 600 Index(3) | 4.42% | 8.96% |
(1) | The performance data quoted is historical. Past performance is no guarantee of future results. Current performance may be higher or lower than the performance data quoted. The principal value and investment return of an investment will fluctuate so that investor’s shares, when redeemed, may be worth more or less than the original cost. The returns shown do not reflect the deduction of taxes that a shareholder would pay on Fund distributions or on redemptions of Fund shares. The total annual operating expenses as stated in the fee table to the Fund’s prospectus dated August 31, 2018, is 0.59%. For performance information current to the most recent month-end, please call 1-877-337-0500. |
(2) | Inception date is June 16, 2017. |
(3) | Indexes are unmanaged statistical composites and their returns do not include fees an investor would pay to purchase the securities they represent. Such costs would lower performance. It is not possible to invest directly in an index. |
23
Pacer Developed Markets International Cash Cows 100 ETF
PERFORMANCE SUMMARY
(Unaudited)
Growth of $10,000
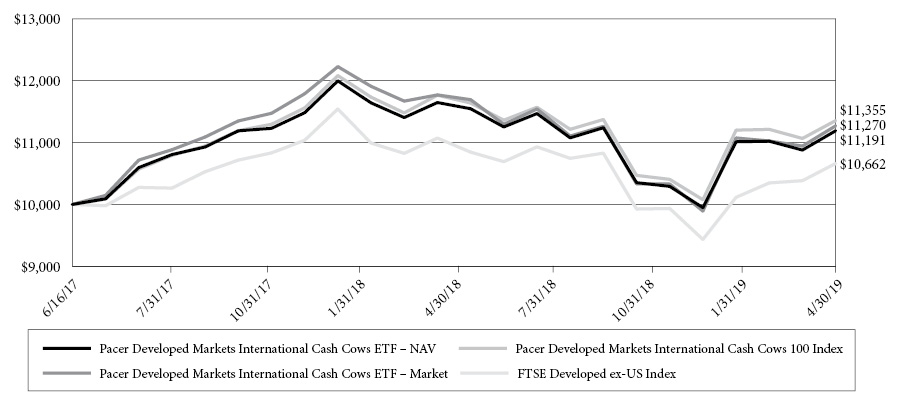
This chart illustrates the performance of a hypothetical $10,000 investment made on June 16, 2017, and is not intended to imply any future performance. The returns shown do not reflect the deduction of taxes that a shareholder would pay on fund distributions or the redemption of fund shares. The chart assumes reinvestment of capital gains and dividends.
The Pacer Developed Markets International Cash Cows 100 Index uses an objective, rules-based methodology to provide exposure to large and mid-capitalization non-U.S. companies in developed markets with high free cash flow yields. The initial index universe is derived from the component companies of the FTSE Developed ex US Index. The initial universe of companies is screened based on their average projected free cash flows and earnings over each of the next two fiscal years. Companies with no forward year estimates available for free cash flows or earnings will remain in the Index universe. Companies with negative average projected free cash flows or earnings are removed from the Index universe. Additionally, financial companies, other than real estate investment trusts, and companies with a market capitalization of less than $3 billion are excluded from the Index universe. The remaining companies are ranked by their average daily trading value (“ADTV”) for the prior three months. The 500 companies with the highest ADTV are then ranked by their free cash flow yield for the trailing twelve month period. The equity securities of the 100 companies with the highest free cash flow yield are included in the Index.
The FTSE Developed ex-US Index is comprised of Large (85%) and Mid (15%) cap stocks providing coverage of Developed markets (24 countries) excluding the US. The index is derived from the FTSE Global Equity Index Series, which covers 98% of the world’s investable market capitalization.
Annualized Returns(1)
(For the year ended April 30, 2019)
| | One Year | Since Inception(2) |
Pacer Developed Markets International Cash Cows 100 ETF - NAV | -3.92% | 6.20% |
Pacer Developed Markets International Cash Cows 100 ETF - Market | -4.26% | 6.60% |
Pacer Developed Markets International Cash Cows 100 Index(3) | -3.49% | 7.03% |
FTSE Developed ex-US Index(3) | -3.72% | 3.49% |
(1) | The performance data quoted is historical. Past performance is no guarantee of future results. Current performance may be higher or lower than the performance data quoted. The principal value and investment return of an investment will fluctuate so that investor’s shares, when redeemed, may be worth more or less than the original cost. The returns shown do not reflect the deduction of taxes that a shareholder would pay on Fund distributions or on redemptions of Fund shares. The total annual operating expenses as stated in the fee table to the Fund’s prospectus dated August 31, 2018, is 0.65%. For performance information current to the most recent month-end, please call 1-877-337-0500. |
(2) | Inception date is June 16, 2017. |
(3) | Indexes are unmanaged statistical composites and their returns do not include fees an investor would pay to purchase the securities they represent. Such costs would lower performance. It is not possible to invest directly in an index. |
24
Pacer WealthShield ETF
PERFORMANCE SUMMARY
(Unaudited)
Growth of $10,000
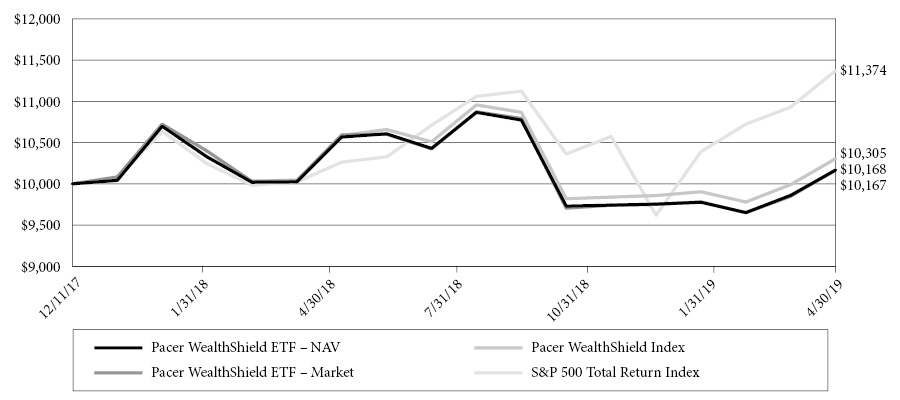
This chart illustrates the performance of a hypothetical $10,000 investment made on December 11, 2017, and is not intended to imply any future performance. The returns shown do not reflect the deduction of taxes that a shareholder would pay on fund distributions or the redemption of fund shares. The chart assumes reinvestment of capital gains and dividends.
The Pacer WealthShield Index uses an objective, rules-based methodology to implement a trend-following strategy that directs some or all of the Index’s exposure to (i) U.S. equity securities or (ii) U.S. Treasury securities depending on the strength of the high-yield corporate (“junk”) bond market relative to U.S. Treasury bonds and the momentum of certain U.S. equity sectors or industries and of long-term U.S. Treasury bonds, as described below.
The S&P 500 Total Return Index is a total return version of the S&P 500 Index and reflects the reinvestment of dividends paid by the securities in the S&P 500 Index. The S&P 500 Index consists of approximately 500 leading U.S.-listed companies representing approximately 8% of the U.S. equity market capitalization.
Annualized Returns(1)
(For the year ended April 30, 2019)
| | One Year | Since Inception(2) |
Pacer WealthShield ETF - NAV | 1.43% | 1.20% |
Pacer WealthShield ETF - Market | 1.36% | 1.22% |
Pacer WealthShield Index(3) | 2.57% | 2.19% |
S&P 500 Total Return IndexTM(3) | 13.49% | 9.75% |
(1) | The performance data quoted is historical. Past performance is no guarantee of future results. Current performance may be higher or lower than the performance data quoted. The principal value and investment return of an investment will fluctuate so that investor’s shares, when redeemed, may be worth more or less than the original cost. The returns shown do not reflect the deduction of taxes that a shareholder would pay on Fund distributions or on redemptions of Fund shares. The total annual operating expenses as stated in the fee table to the Fund’s prospectus dated August 31, 2018, is 0.60%. For performance information current to the most recent month-end, please call 1-877-337-0500. |
(2) | Inception date is December 11, 2017. |
(3) | Indexes are unmanaged statistical composites and their returns do not include fees an investor would pay to purchase the securities they represent. Such costs would lower performance. It is not possible to invest directly in an index. |
25
Pacer Military Times Best Employers ETF
PERFORMANCE SUMMARY
(Unaudited)
Growth of $10,000
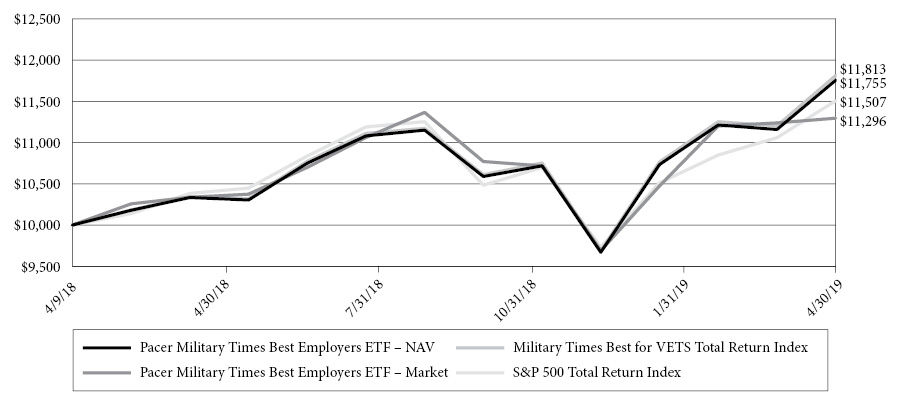
This chart illustrates the performance of a hypothetical $10,000 investment made on April 9, 2018, and is not intended to imply any future performance. The returns shown do not reflect the deduction of taxes that a shareholder would pay on fund distributions or the redemption of fund shares. The chart assumes reinvestment of capital gains and dividends.
The Pacer Military Times Best Employers Index is composed of the U.S.-listed stocks of companies that have been included in the Best for Vets List for the last three consecutive years, have a minimum market capitalization of $200 million, and meet the Index’s liquidity threshold. Index components are equally weighted at the time of each annual reconstitution of the Index, which is effective at the close of business on the third Friday of each September. As of January 11, 2018, the Index was made up of 37 companies and included significant allocations to companies in the financial, industrial, and information technology sectors. Companies previously included in the Index for two consecutive years that are no longer on the Best for Vets List may continue to be included in the Index if the reason that they are no longer on the Best for Vets List is because they did not complete the most recent Best for Vets Survey.
The S&P 500 Total Return Index is a total return version of the S&P 500 Index and reflects the reinvestment of dividends paid by the securities in the S&P 500 Index. The S&P 500 Index consists of approximately 500 leading U.S.-listed companies representing approximately 8% of the U.S. equity market capitalization.
Annualized Returns(1)
(For the year ended April 30, 2019)
| | One Year | Since Inception(2) |
Pacer Military Times Best Employers ETF - NAV | 15.46% | 16.50% |
Pacer Military Times Best Employers ETF - Market | 10.12% | 12.21% |
Military Times Best for VETSSM Total Return Index(3) | 16.01% | 17.06% |
S&P 500 Total Return IndexTM(3) | 13.49% | 14.20% |
(1) | The performance data quoted is historical. Past performance is no guarantee of future results. Current performance may be higher or lower than the performance data quoted. The principal value and investment return of an investment will fluctuate so that investor’s shares, when redeemed, may be worth more or less than the original cost. The returns shown do not reflect the deduction of taxes that a shareholder would pay on Fund distributions or on redemptions of Fund shares. The total annual operating expenses as stated in the fee table to the Fund’s prospectus dated August 31, 2018, is 0.60%. For performance information current to the most recent month-end, please call 1-877-337-0500. |
(2) | Inception date is April 9, 2018. |
(3) | Indexes are unmanaged statistical composites and their returns do not include fees an investor would pay to purchase the securities they represent. Such costs would lower performance. It is not possible to invest directly in an index. |
26
Pacer Benchmark Retail Real Estate SCTRSM ETF
PERFORMANCE SUMMARY
(Unaudited)
Growth of $10,000
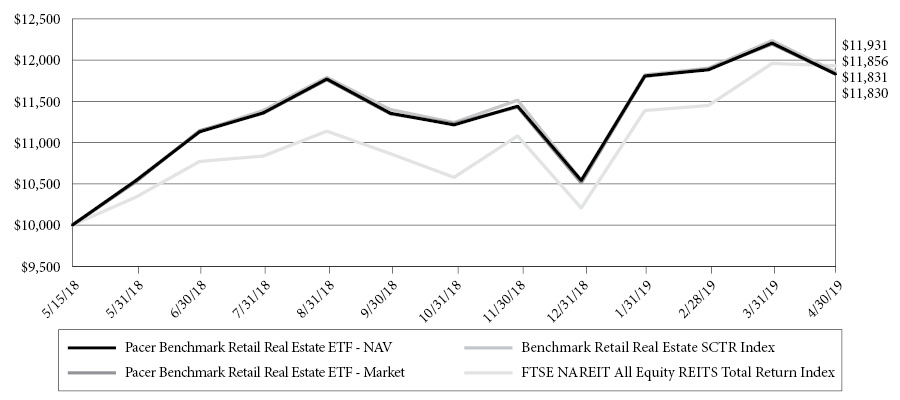
This chart illustrates the performance of a hypothetical $10,000 investment made on May 15, 2018, and is not intended to imply any future performance. The returns shown do not reflect the deduction of taxes that a shareholder would pay on fund distributions or the redemption of fund shares. The chart assumes reinvestment of capital gains and dividends.
The Pacer Benchmark Retail Real Estate Index is generally composed of the U.S.-listed equity securities of companies that derive at least 85% of their earnings or revenues from real estate operations in the retail real estate sector (“Eligible Companies”). At the time of each reconstitution of the Index, Eligible Companies with a market capitalization of more than $200 million and average daily traded volume of at least 10,000 shares are included in the Index (the “Index Constituents”). A significant portion of the Index is expected to be composed of real estate investment trusts (“REITs”).
The FTSE Nareit All Equity REITs Index is a free-float adjusted, market capitalization-weighted index of U.S. equity REITs. Constituents of the index include all tax-qualified REITs with more than 50 percent of total assets in qualifying real estate assets other than mortgages secured by real property.
Cumulative Returns(1)
(For the year ended April 30, 2019)
| | Since Inception(2) |
Pacer Benchmark Retail Real Estate ETF - NAV | 18.30% |
Pacer Benchmark Retail Real Estate ETF - Market | 18.31% |
Benchmark Retail Real Estate SCTR Index(3) | 18.56% |
FTSE NAREIT All Equity REITS Total Return Index(3) | 19.31% |
(1) | The performance data quoted is historical. Past performance is no guarantee of future results. Current performance may be higher or lower than the performance data quoted. The principal value and investment return of an investment will fluctuate so that investor’s shares, when redeemed, may be worth more or less than the original cost. The returns shown do not reflect the deduction of taxes that a shareholder would pay on Fund distributions or on redemptions of Fund shares. The total annual operating expenses as stated in the fee table to the Fund’s prospectus dated April 20, 2018, is 0.60%. For performance information current to the most recent month-end, please call 1-877-337-0500. |
(2) | Inception date is May 15, 2018. |
(3) | Indexes are unmanaged statistical composites and their returns do not include fees an investor would pay to purchase the securities they represent. Such costs would lower performance. It is not possible to invest directly in an index. |
27
Pacer Benchmark Industrial Real Estate SCTRSM ETF
PERFORMANCE SUMMARY
(Unaudited)
Growth of $10,000

This chart illustrates the performance of a hypothetical $10,000 investment made on May 14, 2018, and is not intended to imply any future performance. The returns shown do not reflect the deduction of taxes that a shareholder would pay on fund distributions or the redemption of fund shares. The chart assumes reinvestment of capital gains and dividends.
The Pacer Benchmark Industrial Real Estate Index is generally composed of the U.S.-listed equity securities of companies that derive at least 85% of their earnings or revenues from real estate operations in the industrial real estate sector (“Industrial Companies”), including companies that derivate at least 85% of their earnings or revenues from self-storage real estate operations (“Self-Storage Companies”). At the time of each reconstitution of the Index, Industrial Companies with a market capitalization of more than $200 million and average daily traded volume of at least 10,000 shares are included in the Index (the “Index Constituents”). A significant portion of the Index is expected to be composed of real estate investment trusts (“REITs”).
The FTSE Nareit All Equity REITs Index is a free-float adjusted, market capitalization-weighted index of U.S. equity REITs. Constituents of the index include all tax-qualified REITs with more than 50 percent of total assets in qualifying real estate assets other than mortgages secured by real property.
Cumulative Returns(1)
(For the year ended April 30, 2019)
| | Since Inception(2) |
Pacer Benchmark Industrial Real Estate ETF - NAV | 21.62% |
Pacer Benchmark Industrial Real Estate ETF - Market | 21.80% |
Benchmark Industrial Real Estate SCTR Index(3) | 22.13% |
FTSE NAREIT All Equity REITS Total Return Index(3) | 17.40% |
(1) | The performance data quoted is historical. Past performance is no guarantee of future results. Current performance may be higher or lower than the performance data quoted. The principal value and investment return of an investment will fluctuate so that investor’s shares, when redeemed, may be worth more or less than the original cost. The returns shown do not reflect the deduction of taxes that a shareholder would pay on Fund distributions or on redemptions of Fund shares. The total annual operating expenses as stated in the fee table to the Fund’s prospectus dated April 20, 2018, is 0.60%. For performance information current to the most recent month-end, please call 1-877-337-0500. |
(2) | Inception date is May 14, 2018. |
(3) | Indexes are unmanaged statistical composites and their returns do not include fees an investor would pay to purchase the securities they represent. Such costs would lower performance. It is not possible to invest directly in an index. |
28
Pacer Benchmark Data & Infrastructure Real Estate SCTRSM ETF
PERFORMANCE SUMMARY
(Unaudited)
Growth of $10,000
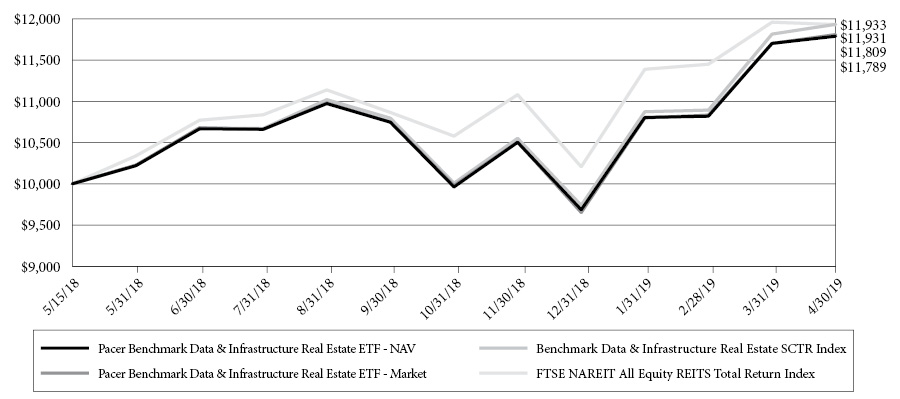
This chart illustrates the performance of a hypothetical $10,000 investment made on May 15, 2018, and is not intended to imply any future performance. The returns shown do not reflect the deduction of taxes that a shareholder would pay on fund distributions or the redemption of fund shares. The chart assumes reinvestment of capital gains and dividends.
The Pacer Benchmark Data & Infrastructure Real Estate Index is generally composed of the U.S.-listed equity securities of companies that derive at least 85% of their earnings or revenues from real estate operations in the data and infrastructure real estate sectors (“Eligible Companies”). At the time of each reconstitution of the Index, Eligible Companies with a market capitalization of more than $200 million and average daily traded volume of at least 10,000 shares are included in the Index (the “Index Constituents”). A significant portion of the Index is expected to be composed of real estate investment trusts (“REITs”).
The FTSE Nareit All Equity REITs Index is a free-float adjusted, market capitalization-weighted index of U.S. equity REITs. Constituents of the index include all tax-qualified REITs with more than 50 percent of total assets in qualifying real estate assets other than mortgages secured by real property.
Cumulative Returns(1)
(For the year ended April 30, 2019)
| | Since Inception(2) |
Pacer Benchmark Data & Infrastructure Real Estate ETF - NAV | 17.89% |
Pacer Benchmark Data & Infrastructure Real Estate ETF - Market | 18.09% |
Benchmark Data & Infrastructure Real Estate SCTR Index(3) | 19.33% |
FTSE NAREIT All Equity REITS Total Return Index(3) | 19.31% |
(1) | The performance data quoted is historical. Past performance is no guarantee of future results. Current performance may be higher or lower than the performance data quoted. The principal value and investment return of an investment will fluctuate so that investor’s shares, when redeemed, may be worth more or less than the original cost. The returns shown do not reflect the deduction of taxes that a shareholder would pay on Fund distributions or on redemptions of Fund shares. The total annual operating expenses as stated in the fee table to the Fund’s prospectus dated April 20, 2018, is 0.60%. For performance information current to the most recent month-end, please call 1-877-337-0500. |
(2) | Inception date is May 15, 2018. |
(3) | Indexes are unmanaged statistical composites and their returns do not include fees an investor would pay to purchase the securities they represent. Such costs would lower performance. It is not possible to invest directly in an index. |
29
Pacer US Export Leaders ETF
PERFORMANCE SUMMARY
(Unaudited)
Growth of $10,000
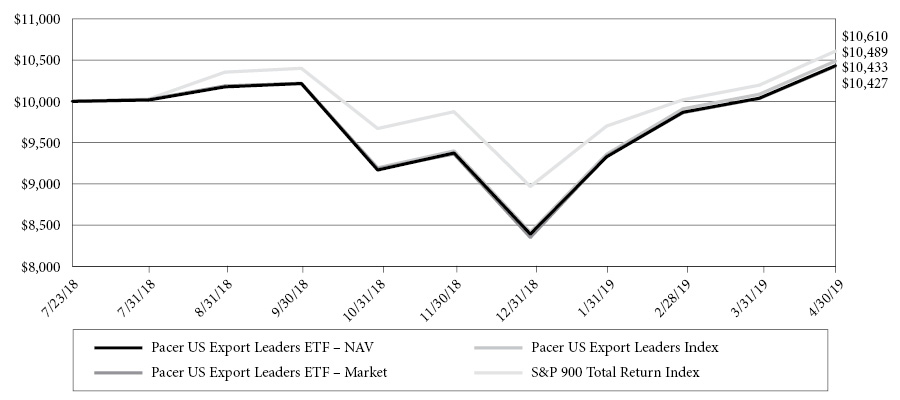
This chart illustrates the performance of a hypothetical $10,000 investment made on July 23, 2018, and is not intended to imply any future performance. The returns shown do not reflect the deduction of taxes that a shareholder would pay on fund distributions or the redemption of fund shares. The chart assumes reinvestment of capital gains and dividends.
The Pacer US Export Leaders Index uses an objective, rules-based methodology to measure the performance of an equal weight portfolio of approximately 100 large- and mid-capitalization U.S. companies with a high percentage of foreign sales and high free cash flow growth. Free cash flow is a company’s cash flow from operations minus its capital expenditures. Construction of the Index begins with an initial universe of the 200 companies across the S&P 900® Index (which is comprised of the S&P 500® Index (“S&P 500”) and S&P MidCap 400® Index (“S&P MidCap 400”)) that have the highest annual foreign sales as a percentage of total sales. The 200 companies are then narrowed to the 100 companies with the highest change in free cash flow growth over the past five years, and those 100 companies are equally weighted to create the Index. The Index is reconstituted and rebalanced to equal-weight quarterly.
The S&P 900® combines the S&P 500® and the S&P MidCap 400® to form an investable benchmark for the mid- to large-cap segment of the U.S. equity market.
Cumulative Returns(1)
(For the year ended April 30, 2019)
| | Since Inception(2) |
Pacer US Export Leaders ETF - NAV | 4.33% |
Pacer US Export Leaders ETF - Market | 4.27% |
Pacer US Export Leaders Index(3) | 4.89% |
S&P 900 Total Return IndexTM(3) | 6.10% |
(1) | The performance data quoted is historical. Past performance is no guarantee of future results. Current performance may be higher or lower than the performance data quoted. The principal value and investment return of an investment will fluctuate so that investor’s shares, when redeemed, may be worth more or less than the original cost. The returns shown do not reflect the deduction of taxes that a shareholder would pay on Fund distributions or on redemptions of Fund shares. The total annual operating expenses as stated in the fee table to the Fund’s prospectus dated August 31, 2018, is 0.60%. For performance information current to the most recent month-end, please call 1-877-337-0500. |
(2) | Inception date is July 23, 2018. |
(3) | Indexes are unmanaged statistical composites and their returns do not include fees an investor would pay to purchase the securities they represent. Such costs would lower performance. It is not possible to invest directly in an index. |
30
Pacer CFRA-Stovall Equal Weight Seasonal Rotation ETF
PERFORMANCE SUMMARY
(Unaudited)
Growth of $10,000
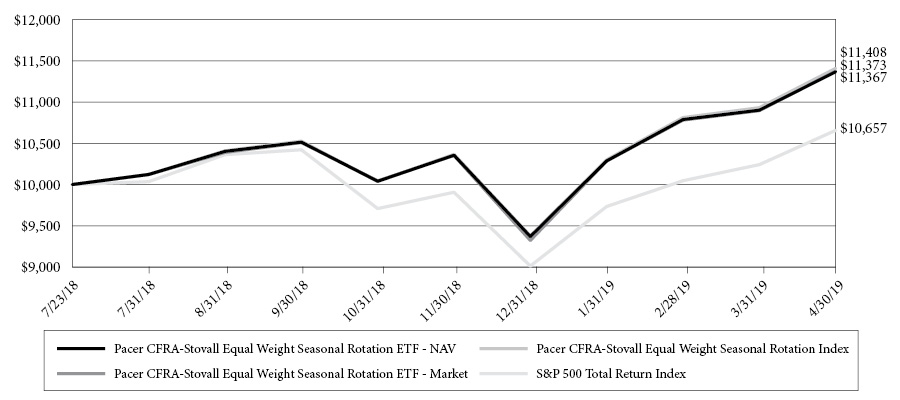
This chart illustrates the performance of a hypothetical $10,000 investment made on July 23, 2018, and is not intended to imply any future performance. The returns shown do not reflect the deduction of taxes that a shareholder would pay on fund distributions or the redemption of fund shares. The chart assumes reinvestment of capital gains and dividends.
The Pacer CFRA-Stovall Equal Weight Seasonal Rotation Index uses an objective, rules-based methodology to track the performance of a semi-annual rotation of certain sectors within the S&P 500 Equal Weight Index (“EWI”). The S&P 500 EWI is an equal-weighted version of the S&P 500®, which measures the performance of the large-cap segment of the U.S. equity market.
The S&P 500 Total Return Index is a total return version of the S&P 500 Index and reflects the reinvestment of dividends paid by the securities in the S&P 500 Index. The S&P 500 Index consists of approximately 500 leading U.S.-listed companies representing approximately 8% of the U.S. equity market capitalization.
Cumulative Returns(1)
(For the year ended April 30, 2019)
| | Since Inception(2) |
Pacer CFRA-Stovall Equal Weight Seasonal Rotation ETF - NAV | 13.67% |
Pacer CFRA-Stovall Equal Weight Seasonal Rotation ETF - Market | 13.73% |
Pacer CFRA-Stovall Equal Weight Seasonal Rotation Index(3) | 14.08% |
S&P 500 Total Return IndexTM(3) | 6.57% |
(1) | The performance data quoted is historical. Past performance is no guarantee of future results. Current performance may be higher or lower than the performance data quoted. The principal value and investment return of an investment will fluctuate so that investor’s shares, when redeemed, may be worth more or less than the original cost. The returns shown do not reflect the deduction of taxes that a shareholder would pay on Fund distributions or on redemptions of Fund shares. The total annual operating expenses as stated in the fee table to the Fund’s prospectus dated July 16, 2018, is 0.60%. For performance information current to the most recent month-end, please call 1-877-337-0500. |
(2) | Inception date is July 23, 2018. |
(3) | Indexes are unmanaged statistical composites and their returns do not include fees an investor would pay to purchase the securities they represent. Such costs would lower performance. It is not possible to invest directly in an index. |
31
Pacer Funds
Expense Example
For the Year Ended April 30, 2019 (Unaudited)
As a shareholder of a Fund, you pay ongoing expenses, such as advisory fees, and other fund expenses. The following examples are intended to help you understand the ongoing cost (in dollars) of investing in a Fund and to compare these costs with the ongoing costs of investing in other funds. Please note, the expenses shown in the tables are meant to highlight ongoing costs only and do not reflect any transactional costs. You may pay brokerage commissions on your purchase and sale of Fund shares, which are not reflected in the following examples. Each example is based on an investment of $1,000 invested at the beginning of the period and held for the entire period as indicated below.
Actual Expenses
The columns under the heading entitled “Actual” help you estimate the actual expenses you paid over the period. The “Actual Ending Account Value” shown is derived from a Fund’s actual return and the “Actual Expenses Paid During Period” show the dollar amount that would have been paid by an investor who started with $1,000 in a Fund. To estimate the expenses you paid on your account during this period, simply divide your account value by $1,000 (for example, an $8,600 account value divided by $1,000=8.6), then multiply the result by the number in the column under the heading untitled “Actual Expenses Paid During Period”.
Hypothetical Example for Comparison Purposes
The columns under the heading entitled “Hypothetical” provide information about hypothetical account value and hypothetical expenses based on a Fund’s actual expense ratio and an assumed rate of return of 5% per year before expenses, which is not the Fund’s return. The hypothetical account values and expenses may not be used to estimate the actual ending account balance or expenses you paid for the period. You may use this information to compare the ongoing costs of investing in a Fund and other funds. To do so, compare this 5% hypothetical example with the 5% hypothetical examples that appear in the shareholder reports of other funds.
Please note that the expenses shown in the table are meant to highlight your ongoing costs only and do not reflect any transactional costs which may be applicable to your account. Therefore, the last column of the table (Hypothetical Expenses Paid During Period) is useful in comparing ongoing costs only and will not help you determine the relative total costs of owning different funds. In addition, if these transactional costs were included, your costs would have been higher.
| | Fund’s Annual
Expense Ratio | Beginning Account
Value 11/01/18 | Ending Account
Value 04/30/19 | Expenses Paid
During Period(a) |
Pacer Trendpilot® US Large Cap ETF | | | | |
Actual | 0.60% | $1,000.00 | $ 1,065.70 | $ 3.07 |
Hypothetical(b) | 0.60% | $1,000.00 | $ 1,021.82 | $ 3.01 |
Pacer Trendpilot® US Mid Cap ETF | | | | |
Actual | 0.60% | $1,000.00 | $ 1,006.40 | $ 2.98 |
Hypothetical(b) | 0.60% | $1,000.00 | $ 1,021.82 | $ 3.01 |
Pacer TrendpilotTM 100 ETF | | | | |
Actual | 0.65% | $1,000.00 | $ 1,097.10 | $ 3.38 |
Hypothetical(b) | 0.65% | $1,000.00 | $ 1,021.57 | $ 3.26 |
Pacer Trendpilot® EuropeanIndex ETF | | | | |
Actual | 0.65% | $1,000.00 | $ 1,071.20 | $ 3.34 |
Hypothetical(b) | 0.65% | $1,000.00 | $ 1,021.57 | $ 3.26 |
Pacer Global Cash Cows Dividend ETF | | | | |
Actual | 0.60% | $1,000.00 | $ 1,086.10 | $ 3.10 |
Hypothetical(b) | 0.60% | $1,000.00 | $ 1,021.82 | $ 3.01 |
Pacer U.S. Cash Cows 100 ETF | | | | |
Actual | 0.49% | $1,000.00 | $ 1,065.10 | $ 2.51 |
Hypothetical(b) | 0.49% | $1,000.00 | $ 1,022.36 | $ 2.46 |
Pacer U.S. Small Cap Cash Cows 100 ETF | | | | |
Actual | 0.59% | $1,000.00 | $ 1,001.10 | $ 2.93 |
Hypothetical(b) | 0.59% | $1,000.00 | $ 1,021.87 | $ 2.96 |
Pacer Developed Markets International
Cash Cows 100 ETF | | | | |
Actual | 0.65% | $1,000.00 | $ 1,080.80 | $ 3.35 |
Hypothetical(b) | 0.65% | $1,000.00 | $ 1,021.57 | $ 3.26 |
32
Pacer Funds
EXPENSE EXAMPLE
For the Periods Ended April 30, 2019 (Unaudited)(Continued)
| | Fund’s Annual
Expense Ratio | Beginning Account
Value 11/01/18 | Ending Account
Value 04/30/19 | Expenses Paid
During Period(a) |
Pacer WealthShield ETF | | | | |
Actual | 0.60% | $1,000.00 | $ 1,044.90 | $ 3.04 |
Hypothetical(b) | 0.60% | $1,000.00 | $ 1,021.82 | $ 3.01 |
Pacer Military Times Best Employers ETF | | | | |
Actual | 0.60% | $1,000.00 | $ 1,110.00 | $ 3.14 |
Hypothetical(b) | 0.60% | $1,000.00 | $ 1,021.82 | $ 3.01 |
Pacer Benchmark Retail Real Estate ETF | | | | |
Actual | 0.60% | $1,000.00 | $ 1,055.00 | $ 3.06 |
Hypothetical(b) | 0.60% | $1,000.00 | $ 1,021.77 | $ 3.01 |
Pacer Benchmark Industrial Real Estate ETF | | | | |
Actual | 0.60% | $1,000.00 | $ 1,203.60 | $ 3.28 |
Hypothetical(b) | 0.60% | $1,000.00 | $ 1,021.77 | $ 3.01 |
Pacer Benchmark Data & Infrastructure Real Estate ETF | | | | |
Actual | 0.60% | $1,000.00 | $ 1,183.40 | $ 3.25 |
Hypothetical(b) | 0.60% | $1,000.00 | $ 1,021.77 | $ 3.01 |
Pacer US Export Leaders ETF | | | | |
Actual | 0.60% | $1,000.00 | $ 1,138.10 | $ 3.18 |
Hypothetical(b) | 0.60% | $1,000.00 | $ 1,021.77 | $ 3.01 |
Pacer CFRA-Stovall Equal Weight Seasonal Rotation ETF | | | | |
Actual | 0.60% | $1,000.00 | $ 1,132.20 | $ 3.17 |
Hypothetical(b) | 0.60% | $1,000.00 | $ 1,021.77 | $ 3.01 |
(a) | The dollar amounts shown as expenses paid during the period are equal to the annualized six-month expense ratio multiplied by the average account value during the period, multiplied by the number of days (181) in the most recent six-month period and divided by the number of days in the most recent twelve-month period (365). |
(b) | Assumes 5% return before expenses. |
33
Pacer Trendpilot® US Large Cap ETF
Schedule of Investments
April 30, 2019
| | | Shares | | | Value | |
COMMON STOCKS — 96.7% | | | | |
| | | | | | | | | |
Advertising — 0.1% | | | | |
Interpublic Group of Cos., Inc. (a) | | | 33,582 | | | $ | 772,386 | |
Omnicom Group, Inc. (a) | | | 19,582 | | | | 1,567,147 | |
| | | | | | | | 2,339,533 | |
Aerospace/Defense — 2.5% | | | | | | | | |
Arconic, Inc. | | | 37,607 | | | | 807,798 | |
Boeing Co. | | | 46,149 | | | | 17,430,016 | |
General Dynamics Corp. | | | 24,246 | | | | 4,333,245 | |
Harris Corp. (a) | | | 10,210 | | | | 1,720,385 | |
L3 Technologies, Inc. | | | 6,893 | | | | 1,506,672 | |
Lockheed Martin Corp. | | | 21,529 | | | | 7,176,262 | |
Northrop Grumman Corp. | | | 15,202 | | | | 4,407,212 | |
Raytheon Co. | | | 24,911 | | | | 4,423,944 | |
TransDigm Group, Inc. (b) | | | 4,234 | | | | 2,042,990 | |
United Technologies Corp. | | | 70,773 | | | | 10,092,937 | |
| | | | | | | | 53,941,461 | |
Agriculture — 1.1% | | | | | | | | |
Altria Group, Inc. (a) | | | 163,909 | | | | 8,905,176 | |
Archer-Daniels-Midland Co. | | | 48,983 | | | | 2,184,642 | |
Philip Morris International, Inc. | | | 135,687 | | | | 11,745,067 | |
| | | | | | | | 22,834,885 | |
Airlines — 0.4% | | | | | | | | |
Alaska Air Group, Inc. (a) | | | 10,834 | | | | 670,625 | |
American Airlines Group, Inc. (a) | | | 35,695 | | | | 1,220,055 | |
Delta Air Lines, Inc. (a) | | | 54,329 | | | | 3,166,837 | |
Southwest Airlines Co. (a) | | | 44,096 | | | | 2,391,326 | |
United Continental Holdings, Inc. (b) | | | 19,938 | | | | 1,771,691 | |
| | | | | | | | 9,220,534 | |
Apparel — 0.8% | | | | | | | | |
Capri Holdings Ltd. (b) | | | 13,049 | | | | 575,200 | |
Hanesbrands, Inc. (a) | | | 31,412 | | | | 567,615 | |
NIKE, Inc. - Class B | | | 111,052 | | | | 9,753,697 | |
PVH Corp. | | | 6,672 | | | | 860,621 | |
Ralph Lauren Corp. - Class A | | | 4,685 | | | | 616,452 | |
Tapestry, Inc. (a) | | | 25,301 | | | | 816,463 | |
Under Armour, Inc. - Class A (a)(b) | | | 16,450 | | | | 379,831 | |
Under Armour, Inc. - Class C (a)(b) | | | 16,804 | | | | 348,179 | |
VF Corp. (a) | | | 28,365 | | | | 2,677,940 | |
| | | | | | | | 16,595,998 | |
Auto Manufacturers — 0.5% | | | | | | | | |
Ford Motor Co. | | | 340,931 | | | | 3,562,729 | |
General Motors Co. | | | 114,492 | | | | 4,459,463 | |
PACCAR, Inc. (a) | | | 30,568 | | | | 2,190,809 | |
| | | | | | | | 10,213,001 | |
Auto Parts&Equipment — 0.1% | | | | | | | | |
Aptiv PLC | | | 22,929 | | | | 1,965,015 | |
BorgWarner, Inc. | | | 18,196 | | | | 760,047 | |
| | | | | | | | 2,725,062 | |
| | | Shares | | | Value | |
Banks — 6.5% | | | | | | | | |
Bank of America Corp. | | | 787,566 | | | $ | 24,083,768 | |
Bank of New York Mellon Corp. | | | 77,054 | | | | 3,826,502 | |
BB&T Corp. (a) | | | 67,227 | | | | 3,442,022 | |
Citigroup, Inc. | | | 206,167 | | | | 14,576,007 | |
Citizens Financial Group, Inc. | | | 40,839 | | | | 1,478,372 | |
Comerica, Inc. | | | 14,108 | | | | 1,108,748 | |
Fifth Third BanCorp. (a) | | | 57,094 | | | | 1,645,449 | |
First Republic Bank (a) | | | 14,264 | | | | 1,506,564 | |
Goldman Sachs Group, Inc. | | | 29,957 | | | | 6,168,745 | |
Huntington Bancshares, Inc. (a) | | | 92,499 | | | | 1,287,586 | |
JPMorgan Chase & Co. | | | 286,839 | | | | 33,287,666 | |
KeyCorp. | | | 90,189 | | | | 1,582,817 | |
M&T Bank Corp. | | | 12,311 | | | | 2,093,732 | |
Morgan Stanley (a) | | | 114,096 | | | | 5,505,132 | |
Northern Trust Corp. (a) | | | 19,379 | | | | 1,909,800 | |
PNC Financial Services Group, Inc. | | | 40,152 | | | | 5,498,013 | |
Regions Financial Corp. (a) | | | 90,140 | | | | 1,399,874 | |
State Street Corp. | | | 33,100 | | | | 2,239,546 | |
SunTrust Banks, Inc. | | | 39,244 | | | | 2,569,697 | |
SVB Financial Group (b) | | | 4,587 | | | | 1,154,640 | |
US BanCorp. | | | 132,477 | | | | 7,063,674 | |
Wells Fargo & Co. | | | 358,961 | | | | 17,377,302 | |
Zions BanCorp. (a) | | | 16,792 | | | | 828,349 | |
| | | | | | | | 141,634,005 | |
Beverages — 1.8% | | | | | | | | |
Brown-Forman Corp. - Class B (a) | | | 14,452 | | | | 770,147 | |
Coca-Cola Co. | | | 337,360 | | | | 16,550,882 | |
Constellation Brands, Inc. - Class A (a) | | | 14,440 | | | | 3,056,515 | |
Molson Coors Brewing Co. - Class B (a) | | | 16,427 | | | | 1,054,449 | |
Monster Beverage Corp. (a)(b) | | | 34,734 | | | | 2,070,146 | |
PepsiCo, Inc. | | | 123,102 | | | | 15,763,211 | |
| | | | | | | | 39,265,350 | |
Biotechnology — 1.9% | | | | | | | | |
Alexion Pharmaceuticals, Inc. (b) | | | 19,507 | | | | 2,655,488 | |
Amgen, Inc. | | | 54,587 | | | | 9,788,541 | |
Biogen, Inc. (b) | | | 17,487 | | | | 4,008,720 | |
Celgene Corp. (b) | | | 61,042 | | | | 5,778,236 | |
Gilead Sciences, Inc. | | | 112,790 | | | | 7,335,861 | |
Illumina, Inc. (b) | | | 12,808 | | | | 3,996,096 | |
Incyte Corp. (b) | | | 15,427 | | | | 1,184,794 | |
Regeneron Pharmaceuticals, Inc. (b) | | | 6,813 | | | | 2,337,813 | |
Vertex Pharmaceuticals, Inc. (b) | | | 22,337 | | | | 3,774,506 | |
| | | | | | | | 40,860,055 | |
Building Materials — 0.3% | | | | | | | | |
Fortune Brands Home & Security, Inc. | | | 12,389 | | | | 653,891 | |
Johnson Controls International PLC (a) | | | 80,596 | | | | 3,022,350 | |
The accompanying notes are an integral part of the financial statements.
34
Pacer Trendpilot® US Large Cap ETF
SCHEDULE OF INVESTMENTS
April 30, 2019 (Continued)
| | | Shares | | | Value | |
COMMON STOCKS — 96.7% (Continued) |
| |
Building Materials — 0.3% (Continued) |
Martin Marietta Materials, Inc. | | | 5,496 | | | $ | 1,219,562 | |
Masco Corp. | | | 26,597 | | | | 1,038,879 | |
Vulcan Materials Co. (a) | | | 11,488 | | | | 1,448,752 | |
| | | | | | | | 7,383,434 | |
Chemicals — 1.8% | | | | | | | | |
Air Products & Chemicals, Inc. (a) | | | 19,240 | | | | 3,959,400 | |
Albemarle Corp. (a) | | | 9,354 | | | | 702,111 | |
Celanese Corp. - Class A | | | 11,616 | | | | 1,253,250 | |
CF Industries Holdings, Inc. (a) | | | 20,082 | | | | 899,272 | |
DOW, Inc. (b) | | | 65,861 | | | | 3,736,295 | |
DowDuPont, Inc. | | | 197,684 | | | | 7,600,950 | |
Eastman Chemical Co. | | | 12,287 | | | | 969,199 | |
FMC Corp. | | | 11,683 | | | | 923,658 | |
International Flavors & Fragrances, Inc. (a) | | | 8,784 | | | | 1,210,347 | |
Linde PLC | | | 48,065 | | | | 8,664,197 | |
LyondellBasell Industries NV - Class A | | | 27,357 | | | | 2,413,708 | |
Mosaic Co. | | | 30,956 | | | | 808,261 | |
PPG Industries, Inc. (a) | | | 20,964 | | | | 2,463,270 | |
Sherwin-Williams Co. (a) | | | 7,170 | | | | 3,261,131 | |
| | | | | | | | 38,865,049 | |
Commercial Services — 2.2% | | | | | | | | |
Automatic Data Processing, Inc. (a) | | | 38,179 | | | | 6,276,246 | |
Cintas Corp. (a) | | | 7,483 | | | | 1,624,859 | |
Ecolab, Inc. (a) | | | 22,236 | | | | 4,093,203 | |
Equifax, Inc. (a) | | | 10,508 | | | | 1,323,483 | |
FleetCor Technologies, Inc. (b) | | | 7,639 | | | | 1,993,397 | |
Gartner, Inc. (a)(b) | | | 8,007 | | | | 1,272,873 | |
Global Payments, Inc. | | | 13,848 | | | | 2,022,777 | |
H&R Block, Inc. (a) | | | 17,991 | | | | 489,535 | |
IHS Markit Ltd. (b) | | | 31,340 | | | | 1,794,528 | |
Moody’s Corp. | | | 14,482 | | | | 2,847,451 | |
Nielsen Holdings PLC (a) | | | 30,982 | | | | 790,970 | |
PayPal Holdings, Inc. (b) | | | 102,840 | | | | 11,597,267 | |
Quanta Services, Inc. | | | 12,735 | | | | 517,041 | |
Robert Half International, Inc. (a) | | | 10,495 | | | | 651,635 | |
Rollins, Inc. (a) | | | 12,830 | | | | 496,136 | |
S&P Global, Inc. | | | 21,787 | | | | 4,807,519 | |
Total System Services, Inc. | | | 14,568 | | | | 1,489,432 | |
United Rentals, Inc. (b) | | | 7,073 | | | | 996,727 | |
Verisk Analytics, Inc. | | | 14,327 | | | | 2,022,113 | |
| | | | | | | | 47,107,192 | |
Computers — 5.3% | | | | | | | | |
Accenture PLC - Class A | | | 55,613 | | | | 10,158,827 | |
Apple, Inc. | | | 392,727 | | | | 78,808,527 | |
Cognizant Technology Solutions Corp. - Class A | | | 50,560 | | | | 3,688,858 | |
DXC Technology Co. | | | 24,375 | | | | 1,602,413 | |
| | | Shares | | | Value | |
Computers — 5.3% (Continued) |
Fortinet, Inc. (a)(b) | | | 12,644 | | | $ | 1,181,202 | |
Hewlett Packard Enterprise Co. | | | 123,999 | | | | 1,960,424 | |
HP, Inc. | | | 137,856 | | | | 2,750,227 | |
International Business Machines Corp. | | | 77,998 | | | | 10,940,779 | |
NetApp, Inc. (a) | | | 21,983 | | | | 1,601,462 | |
Seagate Technology PLC (a) | | | 22,703 | | | | 1,097,009 | |
Western Digital Corp. (a) | | | 25,273 | | | | 1,291,956 | |
| | | | | | | | 115,081,684 | |
Cosmetics/Personal Care — 1.5% | | | | | | | | |
Colgate-Palmolive Co. | | | 75,636 | | | | 5,505,544 | |
Coty, Inc. - Class A (a) | | | 39,346 | | | | 425,724 | |
Estee Lauder Cos., Inc. - Class A | | | 19,268 | | | | 3,310,435 | |
Procter & Gamble Co. | | | 219,298 | | | | 23,350,851 | |
| | | | | | | | 32,592,554 | |
Distribution/Wholesale — 0.2% | | | | | | | | |
Copart, Inc. (a)(b) | | | 17,941 | | | | 1,207,788 | |
Fastenal Co. (a) | | | 25,096 | | | | 1,770,523 | |
LKQ Corp. (b) | | | 27,829 | | | | 837,653 | |
WW Grainger, Inc. (a) | | | 4,016 | | | | 1,132,512 | |
| | | | | | | | 4,948,476 | |
Diversified Financial Services — 4.3% | | | | | | | | |
Affiliated Managers Group, Inc. | | | 4,544 | | | | 504,020 | |
Alliance Data Systems Corp. | | | 4,108 | | | | 657,691 | |
American Express Co. | | | 61,055 | | | | 7,157,478 | |
Ameriprise Financial, Inc. | | | 12,156 | | | | 1,784,136 | |
BlackRock, Inc. (a) | | | 10,573 | | | | 5,130,443 | |
Capital One Financial Corp. | | | 41,268 | | | | 3,830,908 | |
Cboe Global Markets, Inc. | | | 9,802 | | | | 995,981 | |
Charles Schwab Corp. | | | 104,802 | | | | 4,797,836 | |
CME Group, Inc. (a) | | | 31,191 | | | | 5,580,070 | |
Discover Financial Services | | | 29,279 | | | | 2,385,946 | |
E*TRADE Financial Corp. | | | 22,159 | | | | 1,122,575 | |
Franklin Resources, Inc. (a) | | | 25,884 | | | | 895,328 | |
Intercontinental Exchange, Inc. (a) | | | 49,652 | | | | 4,039,190 | |
Invesco Ltd. (a) | | | 35,801 | | | | 786,548 | |
Jefferies Financial Group, Inc. (a) | | | 23,116 | | | | 475,496 | |
MasterCard, Inc. - Class A | | | 79,129 | | | | 20,117,757 | |
Nasdaq, Inc. | | | 9,994 | | | | 921,447 | |
Raymond James Financial, Inc. | | | 11,257 | | | | 1,030,803 | |
Synchrony Financial | | | 57,715 | | | | 2,000,979 | |
T Rowe Price Group, Inc. | | | 21,021 | | | | 2,259,757 | |
Visa, Inc. - Class A (a) | | | 153,050 | | | | 25,166,011 | |
Western Union Co. (a) | | | 38,558 | | | | 749,568 | |
| | | | | | | | 92,389,968 | |
Electric — 3.0% | | | | | | | | |
AES Corp. (a) | | | 57,795 | | | | 989,450 | |
Alliant Energy Corp. | | | 20,668 | | | | 976,150 | |
Ameren Corp. | | | 21,293 | | | | 1,549,492 | |
The accompanying notes are an integral part of the financial statements.
35
Pacer Trendpilot® US Large Cap ETF
SCHEDULE OF INVESTMENTS
April 30, 2019 (Continued)
| | | Shares | | | Value | |
COMMON STOCKS — 96.7% (Continued) |
| |
Electric — 3.0% (Continued) |
American Electric Power Co., Inc. | | | 43,005 | | | $ | 3,679,078 | |
CenterPoint Energy, Inc. | | | 43,731 | | | | 1,355,661 | |
CMS Energy Corp. | | | 24,696 | | | | 1,371,863 | |
Consolidated Edison, Inc. | | | 27,204 | | | | 2,343,897 | |
Dominion Energy, Inc. | | | 70,109 | | | | 5,459,388 | |
DTE Energy Co. | | | 15,823 | | | | 1,989,109 | |
Duke Energy Corp. | | | 63,729 | | | | 5,806,986 | |
Edison International | | | 28,397 | | | | 1,810,877 | |
Entergy Corp. (a) | | | 15,844 | | | | 1,535,284 | |
Evergy, Inc. (a) | | | 22,928 | | | | 1,325,697 | |
Eversource Energy (a) | | | 27,730 | | | | 1,987,132 | |
Exelon Corp. | | | 84,413 | | | | 4,300,842 | |
FirstEnergy Corp. (a) | | | 42,464 | | | | 1,784,762 | |
NextEra Energy, Inc. | | | 41,669 | | | | 8,102,120 | |
NRG Energy, Inc. | | | 25,231 | | | | 1,038,760 | |
Pinnacle West Capital Corp. | | | 9,793 | | | | 932,979 | |
PPL Corp. (a) | | | 62,810 | | | | 1,960,300 | |
Public Service Enterprise Group, Inc. (a) | | | 44,049 | | | | 2,627,523 | |
Sempra Energy (a) | | | 23,893 | | | | 3,057,109 | |
Southern Co. | | | 89,735 | | | | 4,775,697 | |
WEC Energy Group, Inc. (a) | | | 27,507 | | | | 2,157,374 | |
Xcel Energy, Inc. (a) | | | 44,892 | | | | 2,536,398 | |
| | | | | | | | 65,453,928 | |
Electrical Components & Equipment — 0.3% | | | | |
AMETEK, Inc. | | | 20,181 | | | | 1,779,359 | |
Emerson Electric Co. | | | 54,609 | | | | 3,876,693 | |
| | | | | | | | 5,656,052 | |
Electronics — 1.3% | | | | | | | | |
Agilent Technologies, Inc. | | | 27,871 | | | | 2,187,874 | |
Allegion PLC (a) | | | 8,318 | | | | 825,395 | |
Amphenol Corp. - Class A (a) | | | 26,365 | | | | 2,624,899 | |
FLIR Systems, Inc. | | | 12,081 | | | | 639,568 | |
Fortive Corp. (a) | | | 25,607 | | | | 2,210,908 | |
Garmin Ltd. | | | 10,528 | | | | 902,671 | |
Honeywell International, Inc. | | | 63,900 | | | | 11,094,957 | |
Keysight Technologies, Inc. (b) | | | 16,436 | | | | 1,430,425 | |
Mettler-Toledo International, Inc. (a)(b) | | | 2,276 | | | | 1,696,212 | |
PerkinElmer, Inc. | | | 9,730 | | | | 932,523 | |
TE Connectivity Ltd. | | | 29,887 | | | | 2,858,692 | |
Waters Corp. (a)(b) | | | 6,593 | | | | 1,407,869 | |
| | | | | | | | 28,811,993 | |
Engineering&Construction — 0.1% | | | | | | | | |
Fluor Corp. (a) | | | 12,334 | | | | 490,030 | |
Jacobs Engineering Group, Inc. | | | 10,352 | | | | 806,835 | |
| | | | | | | | 1,296,865 | |
Environmental Control — 0.3% | | | | | | | | |
Pentair PLC (a) | | | 13,960 | | | | 544,300 | |
| | | Shares | | | Value | |
Environmental Control — 0.3% (Continued) | | | | |
Republic Services, Inc. | | | 18,883 | | | $ | 1,563,890 | |
Waste Management, Inc. | | | 34,172 | | | | 3,668,023 | |
| | | | | | | | 5,776,213 | |
Food — 1.2% | | | | | | | | |
Campbell Soup Co. | | | 16,827 | | | | 651,037 | |
ConAgra Foods, Inc. (a) | | | 42,364 | | | | 1,303,964 | |
General Mills, Inc. | | | 52,048 | | | | 2,678,910 | |
Hershey Co. (a) | | | 12,302 | | | | 1,535,905 | |
Hormel Foods Corp. (a) | | | 23,817 | | | | 951,251 | |
JM Smucker Co. (a) | | | 9,918 | | | | 1,216,244 | |
Kellogg Co. (a) | | | 22,170 | | | | 1,336,851 | |
Kroger Co. (a) | | | 69,636 | | | | 1,795,216 | |
Lamb Weston Holdings, Inc. | | | 12,767 | | | | 894,328 | |
McCormick & Co., Inc. (a) | | | 10,719 | | | | 1,650,404 | |
Mondelez International, Inc. - Class A | | | 126,868 | | | | 6,451,238 | |
SYSCO Corp. | | | 41,618 | | | | 2,928,659 | |
The Kraft Heinz Co. (a) | | | 54,250 | | | | 1,803,270 | |
Tyson Foods, Inc. - Class A | | | 25,698 | | | | 1,927,607 | |
| | | | | | | | 27,124,884 | |
Forest Products&Paper — 0.1% | | | | | | | | |
International Paper Co. | | | 35,330 | | | | 1,653,797 | |
| | | | | | | | | |
Gas — 0.1% | | | | | | | | |
Atmos Energy Corp. | | | 10,150 | | | | 1,038,751 | |
NiSource, Inc. (a) | | | 31,683 | | | | 880,154 | |
| | | | | | | | 1,918,905 | |
Hand/Machine Tools — 0.1% | | | | | | | | |
Snap-On, Inc. (a) | | | 4,769 | | | | 802,527 | |
Stanley Black & Decker, Inc. | | | 13,111 | | | | 1,922,073 | |
| | | | | | | | 2,724,600 | |
Healthcare-Products — 3.7% | | | | | | | | |
Abbott Laboratories | | | 153,199 | | | | 12,188,512 | |
ABIOMED, Inc. (b) | | | 3,973 | | | | 1,102,150 | |
Align Technology, Inc. (b) | | | 6,329 | | | | 2,054,900 | |
Baxter International, Inc. | | | 41,823 | | | | 3,191,095 | |
Becton Dickinson and Co. | | | 23,489 | | | | 5,654,742 | |
Boston Scientific Corp. (a)(b) | | | 120,702 | | | | 4,480,458 | |
Danaher Corp. | | | 55,085 | | | | 7,295,457 | |
Dentsply Sirona, Inc. (a) | | | 19,466 | | | | 995,297 | |
Edwards Lifesciences Corp. (b) | | | 18,254 | | | | 3,213,982 | |
Henry Schein, Inc. (a)(b) | | | 13,214 | | | | 846,489 | |
Hologic, Inc. (a)(b) | | | 23,574 | | | | 1,093,362 | |
IDEXX Laboratories, Inc. (b) | | | 7,457 | | | | 1,730,024 | |
Intuitive Surgical, Inc. (b) | | | 9,952 | | | | 5,081,790 | |
Medtronic PLC | | | 117,171 | | | | 10,405,956 | |
ResMed, Inc. (a) | | | 12,471 | | | | 1,303,344 | |
Stryker Corp. (a) | | | 27,056 | | | | 5,111,149 | |
Teleflex, Inc. | | | 4,044 | | | | 1,157,312 | |
The Cooper Cos., Inc. | | | 4,280 | | | | 1,240,858 | |
The accompanying notes are an integral part of the financial statements.
36
Pacer Trendpilot® US Large Cap ETF
SCHEDULE OF INVESTMENTS
April 30, 2019 (Continued)
| | | Shares | | | Value | |
COMMON STOCKS — 96.7% (Continued) |
| |
Healthcare-Products — 3.7% (Continued) | | | | |
Thermo Fisher Scientific, Inc. | | | 35,146 | | | $ | 9,751,258 | |
Varian Medical Systems, Inc. (b) | | | 8,024 | | | | 1,092,628 | |
Zimmer Biomet Holdings, Inc. | | | 17,875 | | | | 2,201,485 | |
| | | | | | | | 81,192,248 | |
Healthcare-Services — 1.9% | | | | | | | | |
Anthem, Inc. | | | 22,568 | | | | 5,936,061 | |
Centene Corp. (b) | | | 35,834 | | | | 1,847,601 | |
DaVita, Inc. (b) | | | 11,047 | | | | 610,236 | |
HCA Healthcare, Inc. | | | 23,503 | | | | 2,990,287 | |
Humana, Inc. | | | 11,872 | | | | 3,032,228 | |
IQVIA Holdings, Inc. (b) | | | 13,325 | | | | 1,850,842 | |
Laboratory Corp. of American Holdings (b) | | | 8,755 | | | | 1,400,100 | |
Quest Diagnostics, Inc. (a) | | | 11,789 | | | | 1,136,224 | |
UnitedHealth Group, Inc. | | | 83,919 | | | | 19,559,001 | |
Universal Health Services, Inc. - Class B | | | 7,384 | | | | 936,808 | |
WellCare Health Plans, Inc. (b) | | | 4,343 | | | | 1,122,014 | |
| | | | | | | | 40,421,402 | |
Home Builders — 0.2% | | | | | | | | |
DR Horton, Inc. | | | 29,840 | | | | 1,322,210 | |
Lennar Corp. - Class A (a) | | | 25,506 | | | | 1,327,077 | |
PulteGroup, Inc. | | | 22,549 | | | | 709,392 | |
| | | | | | | | 3,358,679 | |
Home Furnishings — 0.1% | | | | | | | | |
Leggett & Platt, Inc. (a) | | | 11,366 | | | | 447,366 | |
Whirlpool Corp. (a) | | | 5,578 | | | | 774,338 | |
| | | | | | | | 1,221,704 | |
Household Products/Wares — 0.4% | | | | | | | | |
Avery Dennison Corp. | | | 7,492 | | | | 828,990 | |
Church & Dwight Co., Inc. (a) | | | 21,438 | | | | 1,606,778 | |
Clorox Co. (a) | | | 11,159 | | | | 1,782,427 | |
Kimberly-Clark Corp. (a) | | | 30,131 | | | | 3,868,218 | |
| | | | | | | | 8,086,413 | |
Housewares — 0.0% | | | | | | | | |
Newell Brands, Inc. (a) | | | 37,208 | | | | 535,051 | |
| | | | | | | | | |
Insurance — 4.1% | | | | | | | | |
Aflac, Inc. | | | 66,407 | | | | 3,345,585 | |
Allstate Corp. | | | 29,992 | | | | 2,971,008 | |
American International Group, Inc. | | | 77,166 | | | | 3,670,787 | |
Aon PLC | | | 21,035 | | | | 3,789,245 | |
Arthur J Gallagher & Co. | | | 15,952 | | | | 1,333,906 | |
Assurant, Inc. | | | 4,503 | | | | 427,785 | |
Berkshire Hathaway, Inc. - Class B (b) | | | 170,508 | | | | 36,950,789 | |
Brighthouse Financial, Inc. (a)(b) | | | 10,281 | | | | 429,643 | |
Chubb Ltd. (a) | | | 40,106 | | | | 5,823,391 | |
Cincinnati Financial Corp. | | | 13,133 | | | | 1,263,132 | |
| | | Shares | | | Value | |
Insurance — 4.1% (Continued) |
Everest Re Group Ltd. | | | 3,533 | | | $ | 832,021 | |
Hartford Financial Services Group, Inc. | | | 31,263 | | | | 1,635,368 | |
Lincoln National Corp. | | | 18,595 | | | | 1,240,658 | |
Loews Corp. (a) | | | 24,104 | | | | 1,236,294 | |
Marsh & McLennan Cos., Inc. (a) | | | 43,919 | | | | 4,141,122 | |
MetLife, Inc. | | | 85,938 | | | | 3,964,320 | |
Principal Financial Group, Inc. (a) | | | 22,911 | | | | 1,309,593 | |
Progressive Corp. | | | 50,864 | | | | 3,975,022 | |
Prudential Financial, Inc. (a) | | | 35,926 | | | | 3,797,737 | |
Torchmark Corp. (a) | | | 8,884 | | | | 778,771 | |
Travelers Cos., Inc. | | | 23,035 | | | | 3,311,281 | |
Unum Group | | | 18,979 | | | | 700,705 | |
Willis Towers Watson PLC | | | 11,330 | | | | 2,088,572 | |
| | | | | | | | 89,016,735 | |
Internet — 9.5% | | | | | | | | |
Alphabet, Inc. - Class A (b) | | | 26,279 | | | | 31,507,470 | |
Alphabet, Inc. - Class C (b) | | | 26,942 | | | | 32,020,028 | |
Amazon.com, Inc. (b) | | | 36,206 | | | | 69,751,583 | |
Booking Holdings, Inc. (b) | | | 3,963 | | | | 7,351,325 | |
eBay, Inc. | | | 75,367 | | | | 2,920,471 | |
Expedia Group, Inc. (a) | | | 10,271 | | | | 1,333,587 | |
F5 Networks, Inc. (a)(b) | | | 5,340 | | | | 837,846 | |
Facebook, Inc. - Class A (b) | | | 208,735 | | | | 40,369,349 | |
Netflix, Inc. (b) | | | 38,056 | | | | 14,101,270 | |
Symantec Corp. | | | 55,721 | | | | 1,349,006 | |
TripAdvisor, Inc. (a)(b) | | | 8,867 | | | | 471,991 | |
Twitter, Inc. (b) | | | 63,155 | | | | 2,520,516 | |
VeriSign, Inc. (b) | | | 9,367 | | | | 1,849,514 | |
| | | | | | | | 206,383,956 | |
Iron/Steel — 0.1% | | | | | | | | |
Nucor Corp. | | | 27,307 | | | | 1,558,410 | |
| | | | | | | | | |
Leisure Time — 0.2% | | | | | | | | |
Carnival Corp. (a) | | | 34,984 | | | | 1,919,222 | |
Harley-Davidson, Inc. (a) | | | 14,193 | | | | 528,405 | |
Norwegian Cruise Line Holdings Ltd. (b) | | | 19,273 | | | | 1,086,805 | |
Royal Caribbean Cruises Ltd. | | | 15,034 | | | | 1,818,212 | |
| | | | | | | | 5,352,644 | |
Lodging — 0.4% | | | | | | | | |
Hilton Worldwide Holdings, Inc. (a) | | | 25,807 | | | | 2,244,951 | |
Marriott International, Inc. - Class A (a) | | | 24,681 | | | | 3,366,982 | |
MGM Resorts International (a) | | | 43,784 | | | | 1,165,968 | |
Wynn Resorts Ltd. | | | 8,528 | | | | 1,231,869 | |
| | | | | | | | 8,009,770 | |
Machinery-Constr&Mining — 0.3% | | | | | | | | |
Caterpillar, Inc. | | | 50,481 | | | | 7,038,061 | |
| | | | | | | | | |
The accompanying notes are an integral part of the financial statements.
37
Pacer Trendpilot® US Large Cap ETF
SCHEDULE OF INVESTMENTS
April 30, 2019 (Continued)
| | | Shares | | | Value | |
COMMON STOCKS — 96.7% (Continued) |
| |
Machinery-Diversified — 0.7% | | | | | | | | |
Cummins, Inc. | | | 12,861 | | | $ | 2,138,656 | |
Deere & Co. (a) | | | 28,088 | | | | 4,652,215 | |
Dover Corp. | | | 12,758 | | | | 1,250,794 | |
Flowserve Corp. (a) | | | 11,399 | | | | 558,893 | |
Rockwell Automation, Inc. | | | 10,436 | | | | 1,885,890 | |
Roper Technologies, Inc. (a) | | | 8,944 | | | | 3,217,157 | |
Wabtec Corp. (a) | | | 11,619 | | | | 860,619 | |
Xylem, Inc. (a) | | | 15,657 | | | | 1,305,794 | |
| | | | | | | | 15,870,018 | |
Media — 2.5% | | | | | | | | |
CBS Corp. - Class B (a) | | | 29,494 | | | | 1,512,157 | |
Charter Communications, Inc. - Class A (a)(b) | | | 15,400 | | | | 5,716,326 | |
Comcast Corp. - Class A | | | 396,053 | | | | 17,240,187 | |
Discovery, Inc. (a)(b) | | | 31,376 | | | | 902,374 | |
Discovery, Inc. - Class A (b) | | | 13,738 | | | | 424,504 | |
DISH Network Corp. - Class A (a)(b) | | | 19,966 | | | | 701,206 | |
Fox Corp. - Class A (b) | | | 30,453 | | | | 1,187,362 | |
Fox Corp. - Class B (b) | | | 13,988 | | | | 538,551 | |
News Corp. (a) | | | 10,869 | | | | 135,754 | |
News Corp. - Class A (a) | | | 33,646 | | | | 417,883 | |
Viacom, Inc. - Class B (a) | | | 30,867 | | | | 892,365 | |
Walt Disney Co. | | | 174,792 | | | | 23,941,319 | |
| | | | | | | | 53,609,988 | |
Mining — 0.1% | | | | | | | | |
Freeport-McMoran, Inc. (a) | | | 126,387 | | | | 1,555,824 | |
Newmont Goldcorp Corp. (a) | | | 46,487 | | | | 1,443,886 | |
| | | | | | | | 2,999,710 | |
Miscellaneous Manufactur — 1.4% | | | | | | | | |
3M Co. (a) | | | 50,803 | | | | 9,627,677 | |
AO Smith Corp. (a) | | | 12,575 | | | | 661,068 | |
Eaton Corp. PLC | | | 37,775 | | | | 3,128,525 | |
General Electric Co. (a) | | | 759,061 | | | | 7,719,650 | |
Illinois Tool Works, Inc. (a) | | | 26,659 | | | | 4,148,940 | |
Ingersoll-Rand PLC | | | 21,395 | | | | 2,623,241 | |
Parker-Hannifin Corp. (a) | | | 11,510 | | | | 2,084,231 | |
Textron, Inc. | | | 21,194 | | | | 1,123,282 | |
| | | | | | | | 31,116,614 | |
Office/Business Equip — 0.0% | | | | | | | | |
Xerox Corp. | | | 18,044 | | | | 601,948 | |
| | | | | | | | | |
Oil&Gas — 4.3% | | | | | | | | |
Anadarko Petroleum Corp. | | | 43,962 | | | | 3,202,632 | |
Apache Corp. (a) | | | 33,021 | | | | 1,086,721 | |
Cabot Oil & Gas Corp. | | | 37,609 | | | | 973,697 | |
Chevron Corp. | | | 166,685 | | | | 20,012,201 | |
Cimarex Energy Co. | | | 8,360 | | | | 573,998 | |
Concho Resources, Inc. (a) | | | 17,395 | | | | 2,007,035 | |
| | | Shares | | | Value | |
Oil&Gas — 4.3% (Continued) |
ConocoPhillips | | | 100,328 | | | $ | 6,332,703 | |
Devon Energy Corp. | | | 40,700 | | | | 1,308,098 | |
Diamondback Energy, Inc. | | | 13,551 | | | | 1,441,691 | |
EOG Resources, Inc. (a) | | | 50,625 | | | | 4,862,531 | |
Exxon Mobil Corp. (a) | | | 371,469 | | | | 29,821,531 | |
Helmerich & Payne, Inc. (a) | | | 9,566 | | | | 559,802 | |
HESS Corp. (a) | | | 21,714 | | | | 1,392,302 | |
HollyFrontier Corp. | | | 13,938 | | | | 665,261 | |
Marathon Oil Corp. | | | 72,448 | | | | 1,234,514 | |
Marathon Petroleum Corp. | | | 60,254 | | | | 3,667,661 | |
Noble Energy, Inc. (a) | | | 41,930 | | | | 1,134,626 | |
Occidental Petroleum Corp. (a) | | | 65,939 | | | | 3,882,488 | |
Phillips 66 | | | 36,968 | | | | 3,484,973 | |
Pioneer Natural Resources Co. | | | 14,886 | | | | 2,477,924 | |
Valero Energy Corp. | | | 36,973 | | | | 3,351,972 | |
| | | | | | | | 93,474,361 | |
Oil&Gas Services — 0.5% | | | | | | | | |
Baker Hughes a GE Co. (a) | | | 44,845 | | | | 1,077,177 | |
Halliburton Co. | | | 76,401 | | | | 2,164,440 | |
National Oilwell Varco, Inc. (a) | | | 33,508 | | | | 875,899 | |
Schlumberger Ltd. | | | 120,777 | | | | 5,154,762 | |
TechnipFMC PLC (a) | | | 37,060 | | | | 911,306 | |
| | | | | | | | 10,183,584 | |
Packaging&Containers — 0.2% | | | | | | | | |
Ball Corp. (a) | | | 29,600 | | | | 1,774,224 | |
Packaging Corp. of America (a) | | | 8,277 | | | | 820,748 | |
Sealed Air Corp. | | | 13,752 | | | | 641,118 | |
WestRock Co. | | | 22,187 | | | | 851,537 | |
| | | | | | | | 4,087,627 | |
Pharmaceuticals — 5.7% | | | | | | | | |
AbbVie, Inc. | | | 129,360 | | | | 10,269,890 | |
Allergan PLC | | | 27,662 | | | | 4,066,314 | |
AmerisourceBergen Corp. | | | 13,745 | | | | 1,027,576 | |
Bristol-Myers Squibb Co. (a) | | | 142,424 | | | | 6,612,746 | |
Cardinal Health, Inc. (a) | | | 25,990 | | | | 1,265,973 | |
Cigna Corp. | | | 33,193 | | | | 5,272,376 | |
CVS Health Corp. | | | 112,919 | | | | 6,140,535 | |
Eli Lilly & Co. (a) | | | 80,776 | | | | 9,454,023 | |
Johnson & Johnson | | | 233,843 | | | | 33,018,632 | |
McKesson Corp. | | | 17,030 | | | | 2,030,828 | |
Merck & Co., Inc. | | | 226,723 | | | | 17,845,367 | |
Mylan NV (b) | | | 45,012 | | | | 1,214,874 | |
Nektar Therapeutics (a)(b) | | | 15,162 | | | | 485,487 | |
Perrigo Co PLC (a) | | | 10,960 | | | | 525,203 | |
Pfizer, Inc. | | | 486,772 | | | | 19,767,811 | |
Zoetis, Inc. | | | 41,978 | | | | 4,275,040 | |
| | | | | | �� | | 123,272,675 | |
Pipelines — 0.4% | | | | | | | | |
Kinder Morgan, Inc. (a) | | | 165,850 | | | | 3,295,439 | |
ONEOK, Inc. (a) | | | 35,883 | | | | 2,437,532 | |
The accompanying notes are an integral part of the financial statements.
38
Pacer Trendpilot® US Large Cap ETF
SCHEDULE OF INVESTMENTS
April 30, 2019 (Continued)
| | | Shares | | | Value | |
COMMON STOCKS — 96.7% (Continued) |
| | | | | | | | | |
Pipelines — 0.4% (Continued) | | | | | | | | |
Williams Cos., Inc. | | | 105,650 | | | $ | 2,993,065 | |
| | | | | | | | 8,726,036 | |
Real Estate — 0.1% | | | | | | | | |
CBRE Group, Inc. - Class A (b) | | | 27,660 | | | | 1,440,256 | |
| | | | | | | | | |
Retail — 5.4% | | | | | | | | |
Advance Auto Parts, Inc. | | | 6,258 | | | | 1,040,831 | |
AutoZone, Inc. (b) | | | 2,289 | | | | 2,353,802 | |
Best Buy Co., Inc. | | | 20,411 | | | | 1,518,782 | |
CarMax, Inc. (a)(b) | | | 15,277 | | | | 1,189,467 | |
Chipotle Mexican Grill, Inc. (b) | | | 2,232 | | | | 1,535,705 | |
Costco Wholesale Corp. | | | 38,214 | | | | 9,382,683 | |
Darden Restaurants, Inc. (a) | | | 10,894 | | | | 1,281,134 | |
Dollar General Corp. | | | 22,885 | | | | 2,885,570 | |
Dollar Tree, Inc. (b) | | | 20,821 | | | | 2,316,961 | |
Foot Locker, Inc. (a) | | | 10,004 | | | | 572,329 | |
Gap, Inc. (a) | | | 18,595 | | | | 484,958 | |
Genuine Parts Co. | | | 12,790 | | | | 1,311,487 | |
Home Depot, Inc. | | | 98,583 | | | | 20,081,357 | |
Kohl’s Corp. (a) | | | 14,365 | | | | 1,021,351 | |
L Brands, Inc. (a) | | | 19,900 | | | | 510,236 | |
Lowe’s Cos., Inc. | | | 70,129 | | | | 7,934,395 | |
Macy’s, Inc. (a) | | | 26,824 | | | | 631,437 | |
McDonald’s Corp. | | | 67,329 | | | | 13,302,191 | |
Nordstrom, Inc. (a) | | | 9,920 | | | | 406,918 | |
O’Reilly Automotive, Inc. (b) | | | 6,999 | | | | 2,649,611 | |
Ross Stores, Inc. (a) | | | 32,559 | | | | 3,179,712 | |
Starbucks Corp. (a) | | | 108,301 | | | | 8,412,822 | |
Target Corp. (a) | | | 45,476 | | | | 3,520,752 | |
Tiffany & Co. (a) | | | 9,525 | | | | 1,026,985 | |
TJX Cos., Inc. | | | 107,949 | | | | 5,924,241 | |
Tractor Supply Co. | | | 10,742 | | | | 1,111,797 | |
Ulta Salon Cosmetics & Fragrance, Inc. (b) | | | 4,898 | | | | 1,709,304 | |
Walgreens Boots Alliance, Inc. (a) | | | 70,201 | | | | 3,760,668 | |
Walmart, Inc. (a) | | | 124,202 | | | | 12,772,934 | |
Yum! Brands, Inc. | | | 27,186 | | | | 2,837,947 | |
| | | | | | | | 116,668,367 | |
Savings&Loans — 0.0% | | | | | | | | |
People’s United Financial, Inc. (a) | | | 32,864 | | | | 568,219 | |
| | | | | | | | | |
Semiconductors — 4.0% | | | | | | | | |
Advanced Micro Devices, Inc. (a)(b) | | | 76,737 | | | | 2,120,243 | |
Analog Devices, Inc. | | | 32,319 | | | | 3,756,761 | |
Applied Materials, Inc. | | | 83,241 | | | | 3,668,431 | |
Broadcom, Inc. | | | 34,761 | | | | 11,067,902 | |
Intel Corp. | | | 394,253 | | | | 20,122,673 | |
IPG Photonics Corp. (a)(b) | | | 3,079 | | | | 537,994 | |
| | | Shares | | | Value | |
Semiconductors — 4.0% (Continued) |
KLA-Tencor Corp. | | | 14,463 | | | $ | 1,843,743 | |
Lam Research Corp. | | | 13,541 | | | | 2,808,810 | |
Maxim Integrated Products, Inc. (a) | | | 24,147 | | | | 1,448,820 | |
Microchip Technology, Inc. (a) | | | 20,711 | | | | 2,068,822 | |
Micron Technology, Inc. (b) | | | 97,756 | | | | 4,111,617 | |
NVIDIA Corp. | | | 53,279 | | | | 9,643,499 | |
Qorvo, Inc. (b) | | | 10,954 | | | | 828,232 | |
QUALCOMM, Inc. (a) | | | 105,771 | | | | 9,110,056 | |
Skyworks Solutions, Inc. | | | 15,494 | | | | 1,366,261 | |
Texas Instruments, Inc. (a) | | | 82,259 | | | | 9,692,578 | |
Xilinx, Inc. | | | 22,149 | | | | 2,660,981 | |
| | | | | | | | 86,857,423 | |
Shipbuilding — 0.0% | | | | | | | | |
Huntington Ingalls Industries, Inc. | | | 3,817 | | | | 849,588 | |
| | | | | | | | | |
Software — 7.6% | | | | | | | | |
Activision Blizzard, Inc. | | | 66,539 | | | | 3,207,845 | |
Adobe Systems, Inc. (b) | | | 42,553 | | | | 12,308,455 | |
Akamai Technologies, Inc. (a)(b) | | | 14,196 | | | | 1,136,532 | |
ANSYS, Inc. (b) | | | 7,257 | | | | 1,420,921 | |
Autodesk, Inc. (a)(b) | | | 19,201 | | | | 3,421,810 | |
Broadridge Financial Solutions, Inc. (a) | | | 10,142 | | | | 1,198,075 | |
Cadence Design System, Inc. (b) | | | 24,527 | | | | 1,701,683 | |
Cerner Corp. (a)(b) | | | 28,672 | | | | 1,905,254 | |
Citrix Systems, Inc. (a) | | | 11,187 | | | | 1,129,440 | |
Electronic Arts, Inc. (b) | | | 26,425 | | | | 2,501,126 | |
Fidelity National Information Services, Inc. | | | 28,523 | | | | 3,306,671 | |
Fiserv, Inc. (a)(b) | | | 34,760 | | | | 3,032,462 | |
Intuit, Inc. | | | 22,635 | | | | 5,682,743 | |
Jack Henry & Associates, Inc. (a) | | | 6,789 | | | | 1,011,968 | |
Microsoft Corp. | | | 672,704 | | | | 87,855,142 | |
MSCI, Inc. | | | 7,591 | | | | 1,710,860 | |
Oracle Corp. | | | 222,291 | | | | 12,299,361 | |
Paychex, Inc. (a) | | | 27,932 | | | | 2,354,947 | |
Red Hat, Inc. (b) | | | 15,436 | | | | 2,817,533 | |
Salesforce.com, Inc. (a)(b) | | | 66,765 | | | | 11,039,593 | |
Synopsys, Inc. (b) | | | 12,977 | | | | 1,571,255 | |
Take-Two Interactive Software, Inc. (a)(b) | | | 9,927 | | | | 961,232 | |
| | | | | | | | 163,574,908 | |
Telecommunications — 3.2% | | | | | | | | |
Arista Networks, Inc. (b) | | | 4,497 | | | | 1,404,368 | |
AT&T, Inc. (a) | | | 638,645 | | | | 19,772,449 | |
CenturyLink, Inc. (a) | | | 83,013 | | | | 948,009 | |
Cisco Systems, Inc. | | | 385,918 | | | | 21,592,112 | |
Corning, Inc. | | | 69,735 | | | | 2,221,060 | |
Juniper Networks, Inc. (a) | | | 30,126 | | | | 836,599 | |
Motorola Solutions, Inc. | | | 14,245 | | | | 2,064,243 | |
The accompanying notes are an integral part of the financial statements.
39
Pacer Trendpilot® US Large Cap ETF
SCHEDULE OF INVESTMENTS
April 30, 2019 (Continued)
| | | Shares | | | Value | |
COMMON STOCKS — 96.7% (Continued) |
| | | | | |
Telecommunications — 3.2% (Continued) | | | | |
Verizon Communications, Inc. | | | 362,306 | | | $ | 20,720,280 | |
| | | | | | | | 69,559,120 | |
Textiles — 0.0% | | | | | | | | |
Mohawk Industries, Inc. (a)(b) | | | 5,523 | | | | 752,509 | |
| | | | | | | | | |
Toys/Games/Hobbies — 0.1% | | | | | | | | |
Hasbro, Inc. (a) | | | 10,115 | | | | 1,030,314 | |
Mattel, Inc. (a)(b) | | | 30,045 | | | | 366,248 | |
| | | | | | | | 1,396,562 | |
Transportation — 1.7% | | | | | | | | |
CH Robinson Worldwide, Inc. (a) | | | 11,976 | | | | 970,056 | |
CSX Corp. (a) | | | 67,925 | | | | 5,408,868 | |
Expeditors International of Washington, Inc. (a) | | | 15,125 | | | | 1,201,228 | |
FedEx Corp. (a) | | | 21,154 | | | | 4,007,837 | |
JB Hunt Trasport Services, Inc. | | | 7,540 | | | | 712,379 | |
Kansas City Southern | | | 8,815 | | | | 1,085,479 | |
Norfolk Southern Corp. | | | 23,795 | | | | 4,854,656 | |
Union Pacific Corp. (a) | | | 63,387 | | | | 11,222,034 | |
United Parcel Service, Inc. - Class B (a) | | | 60,660 | | | | 6,443,305 | |
| | | | | | | | 35,905,842 | |
Water — 0.1% | | | | | | | | |
American Water Works Co., Inc. (a) | | | 15,723 | | | | 1,701,071 | |
| | | | | | | | | |
TOTAL COMMON STOCKS (Cost $1,982,907,479) | | | | | | | 2,093,806,977 | |
| | | | | | | | | |
| | | Shares | | | Value | |
REAL ESTATE INVESTMENT TRUSTS — 2.9% | | | | |
| | | | | | | | | |
Alexandria Real Estate Equities, Inc. | | | 9,453 | | | $ | 1,346,013 | |
American Tower Corp. (a) | | | 38,385 | | | | 7,496,591 | |
Apartment Investment & Management Co. (a) | | | 13,470 | | | | 664,872 | |
AvalonBay Communities, Inc. | | | 12,151 | | | | 2,441,500 | |
Boston Properties, Inc. | | | 13,566 | | | | 1,866,953 | |
Crown Castle International Corp. | | | 36,266 | | | | 4,561,537 | |
Digital Realty Trust, Inc. (a) | | | 18,048 | | | | 2,124,430 | |
Duke Realty Corp. | | | 31,232 | | | | 971,940 | |
Equinix, Inc. | | | 7,291 | | | | 3,315,218 | |
Equity Residential | | | 32,190 | | | | 2,459,960 | |
Essex Property Trust, Inc. | | | 5,747 | | | | 1,623,528 | |
Extra Space Storage, Inc. | | | 11,074 | | | | 1,148,263 | |
Federal Realty Investment Trust (a) | | | 6,532 | | | | 874,308 | |
HCP, Inc. (a) | | | 41,635 | | | | 1,239,890 | |
Host Hotels & Resorts, Inc. (a) | | | 64,768 | | | | 1,246,136 | |
Iron Mountain, Inc. (a) | | | 25,034 | | | | 813,104 | |
Kimco Realty Corp. (a) | | | 36,755 | | | | 639,169 | |
Macerich Co. (a) | | | 9,323 | | | | 374,225 | |
Mid-America Apartment Communities, Inc. | | | 9,924 | | | | 1,085,785 | |
Prologis, Inc. | | | 54,941 | | | | 4,212,326 | |
Public Storage (a) | | | 13,028 | | | | 2,881,533 | |
Realty Income Corp. (a) | | | 25,779 | | | | 1,804,788 | |
Regency Centers Corp. | | | 14,687 | | | | 986,526 | |
SBA Communications Corp. (a) | | | 9,886 | | | | 2,014,075 | |
Simon Property Group, Inc. (a) | | | 26,961 | | | | 4,683,126 | |
SL Green Realty Corp. | | | 7,385 | | | | 652,391 | |
UDR, Inc. | | | 24,034 | | | | 1,080,328 | |
Ventas, Inc. | | | 31,093 | | | | 1,900,093 | |
Vornado Realty Trust | | | 15,167 | | | | 1,048,646 | |
Welltower, Inc. (a) | | | 32,809 | | | | 2,445,255 | |
Weyerhaeuser Co. (a) | | | 65,302 | | | | 1,750,094 | |
TOTAL REAL ESTATE INVESTMENT TRUSTS (Cost $59,804,878) | | | | | | | 61,752,603 | |
| | | | | | | | | |
The accompanying notes are an integral part of the financial statements.
40
Pacer Trendpilot® US Large Cap ETF
SCHEDULE OF INVESTMENTS
April 30, 2019 (Continued)
| | | Shares | | | Value | |
SHORT-TERM INVESTMENTS — 0.3% | | | | |
| | | | | | | | | |
Money Market Funds — 0.3% | | | | | | | | |
U.S. Bank Money Market Deposit Account 2.35% (c) | | | 7,600,973 | | | $ | 7,600,973 | |
TOTAL SHORT-TERM INVESTMENTS (Cost $7,600,973) | | | | | | | 7,600,973 | |
| | | | | | | | | |
INVESTMENTS PURCHASED WITH PROCEEDS FROM SECURITIES LENDING — 19.0% | | | | | | | | |
Mount Vernon Liquid Assets Portfolio, LLC 2.61% (c) | | | 410,548,790 | | | | 410,548,790 | |
TOTAL INVESTMENTS PURCHASED WITH PROCEEDS FROM SECURITIES LENDING (Cost $410,548,790) | | | | | | | 410,548,790 | |
Total Investments (Cost $2,460,862,120) — 118.9% | | | | | | | 2,573,709,343 | |
Liabilities in Excess of Other Assets — (18.9)% | | | | | | | (409,719,723 | ) |
TOTAL NET ASSETS — 100.0% | | | | | | $ | 2,163,989,620 | |
Percentages are stated as a percent of net assets.
| | (a) | All or portion of this security is on loan as of April 30, 2019. The total value of securities on loan is $402,974,069 or 18.6% of net assets. |
| | (b) | Non-income producing security. |
| | (c) | The rate shown is as of April 30, 2019. |
For Fund compliance purposes, the Fund’s industry classifications refer to any one or more of the industry sub-classifications used by one or more widely recognized market indexes or ratings group indexes, and/or they may be defined by Fund management. This definition does not apply for all purposes of this report, which may combine sub-classifications for reporting ease. Categories are shown as a percentage of net assets.
The accompanying notes are an integral part of the financial statements.
41
Pacer Trendpilot® US Mid Cap ETF
SCHEDULE OF INVESTMENTS
April 30, 2019
| | | Shares | | | Value | |
COMMON STOCKS — 87.8% | | | | |
| | | | | | | | | |
Aerospace/Defense — 0.7% | | | | |
MSA SAFETY, Inc. (a) | | | 15,405 | | | $ | 1,693,163 | |
Teledyne Technologies, Inc. (b) | | | 15,909 | | | | 3,953,546 | |
| | | | | | | | 5,646,709 | |
Airlines — 0.3% | | | | | | | | |
JetBlue Airways Corp. (b) | | | 134,695 | | | | 2,498,592 | |
| | | | | | | | | |
Apparel — 0.8% | | | | | | | | |
Carter’s, Inc. (a) | | | 20,009 | | | | 2,119,153 | |
Deckers Outdoor Corp. (b) | | | 12,801 | | | | 2,025,246 | |
Skechers U.S.A, Inc. - Class A (a)(b) | | | 58,646 | | | | 1,856,732 | |
| | | | | | | | 6,001,131 | |
Auto Parts & Equipment — 0.4% | | | | | | | | |
Dana, Inc. | | | 63,001 | | | | 1,228,519 | |
Goodyear Tire & Rubber Co. | | | 102,033 | | | | 1,960,054 | |
| | | | | | | | 3,188,573 | |
Banks — 7.2% | | | | | | | | |
Associated Banc-Corp. | | | 72,219 | | | | 1,638,649 | |
BancorpSouth Bank | | | 39,859 | | | | 1,214,902 | |
Bank of Hawaii Corp. (a) | | | 18,112 | | | | 1,492,067 | |
Bank OZK (a) | | | 53,122 | | | | 1,734,433 | |
Cathay General Bancorp | | | 33,604 | | | | 1,236,291 | |
Chemical Financial Corp. (a) | | | 31,412 | | | | 1,379,929 | |
Commerce Bancshares, Inc. (a) | | | 43,372 | | | | 2,620,970 | |
Cullen Frost Bankers, Inc. (a) | | | 27,679 | | | | 2,814,677 | |
East West Bancorp, Inc. (a) | | | 63,696 | | | | 3,279,070 | |
First Financial Bankshares, Inc. (a) | | | 29,796 | | | | 1,833,050 | |
First Horizon National Corp. | | | 139,843 | | | | 2,110,231 | |
FNB Corp. (a) | | | 142,587 | | | | 1,729,580 | |
Fulton Financial Corp. (a) | | | 74,656 | | | | 1,287,816 | |
Hancock Whitney Corp. | | | 37,649 | | | | 1,646,767 | |
Home BancShares, Inc. | | | 68,196 | | | | 1,308,681 | |
International Bancshares Corp. | | | 23,936 | | | | 992,626 | |
PacWest Bancorp (a) | | | 53,086 | | | | 2,099,551 | |
Pinnacle Financial Partners, Inc. | | | 32,025 | | | | 1,859,692 | |
Prosperity Bancshares, Inc. (a) | | | 29,156 | | | | 2,147,048 | |
Signature Bank | | | 24,209 | | | | 3,197,283 | |
Synovus Financial Corp. | | | 69,934 | | | | 2,577,767 | |
TCF Financial Corp. | | | 72,055 | | | | 1,594,577 | |
Texas Capital Bancshares, Inc. (b) | | | 22,079 | | | | 1,429,174 | |
Trustmark Corp. (a) | | | 28,641 | | | | 1,029,931 | |
UMB Financial Corp. (a) | | | 19,396 | | | | 1,355,005 | |
Umpqua Holdings Corp. | | | 96,835 | | | | 1,681,056 | |
United Bankshares, Inc. (a) | | | 44,867 | | | | 1,760,581 | |
Valley National Bancorp (a) | | | 145,882 | | | | 1,528,843 | |
Webster Financial Corp. (a) | | | 40,551 | | | | 2,154,475 | |
Wintrust Financial Corp. | | | 24,827 | | | | 1,891,817 | |
| | | | | | | | 54,626,539 | |
| | | Shares | | | Value | |
Beverages — 0.2% | | | | | | | | |
The Boston Beer Co., Inc. (b) | | | 3,828 | | | $ | 1,186,718 | |
| | | | | | | | | |
Biotechnology — 1.1% | | | | | | | | |
Bio-Rad Laboratories, Inc. - Class A (b) | | | 8,849 | | | | 2,662,930 | |
Exelixis, Inc. (a)(b) | | | 131,888 | | | | 2,592,918 | |
Ligand Pharmaceuticals, Inc. (b) | | | 8,982 | | | | 1,130,385 | |
United Therapeutics Corp. (a)(b) | | | 19,213 | | | | 1,970,677 | |
| | | | | | | | 8,356,910 | |
Building Materials — 1.5% | | | | | | | | |
Lennox International, Inc. (a) | | | 15,769 | | | | 4,280,495 | |
Eagle Materials, Inc. | | | 20,170 | | | | 1,833,655 | |
MDU Resources Group, Inc. | | | 86,169 | | | | 2,253,319 | |
Louisiana-Pacific Corp. | | | 59,498 | | | | 1,490,425 | |
Trex Co, Inc. (a)(b) | | | 25,872 | | | | 1,792,153 | |
| | | | | | | | 11,650,047 | |
Chemicals — 2.9% | | | | | | | | |
Ashland Global Holdings, Inc. | | | 27,517 | | | | 2,215,944 | |
Cabot Corp. | | | 26,154 | | | | 1,186,868 | |
Ingevity Corp. (b) | | | 18,287 | | | | 2,103,188 | |
Minerals Technologies, Inc. | | | 15,477 | | | | 971,491 | |
NewMarket Corp. (a) | | | 3,835 | | | | 1,609,089 | |
Olin Corp. (a) | | | 72,456 | | | | 1,571,571 | |
PolyOne Corp. | | | 34,150 | | | | 943,906 | |
RPM International, Inc. | | | 57,845 | | | | 3,508,299 | |
Sensient Technologies Corp. | | | 18,588 | | | | 1,303,391 | |
The Chemours Co. (a) | | | 73,401 | | | | 2,643,170 | |
Valvoline, Inc. | | | 82,686 | | | | 1,529,691 | |
Versum Materials, Inc. | | | 47,943 | | | | 2,501,666 | |
| | | | | | | | 22,088,274 | |
Commercial Services — 4.5% | | | | | | | | |
Aaron’s, Inc. | | | 29,531 | | | | 1,644,581 | |
Adtalem Global Education, Inc. (a)(b) | | | 25,394 | | | | 1,252,432 | |
ASGN, Inc. (b) | | | 23,138 | | | | 1,458,620 | |
Avis Budget Group, Inc. (b) | | | 27,970 | | | | 994,334 | |
CoreLogic, Inc. (b) | | | 35,191 | | | | 1,429,107 | |
Graham Holdings Co. - Class B | | | 1,914 | | | | 1,422,925 | |
Green Dot Corp. (b) | | | 20,924 | | | | 1,334,324 | |
HealthEquity, Inc. (a)(b) | | | 23,848 | | | | 1,615,702 | |
Insperity, Inc | | | 16,368 | | | | 1,956,958 | |
LiveRamp Holdings, Inc. (a)(b) | | | 29,985 | | | | 1,749,025 | |
ManpowerGroup, Inc. | | | 26,535 | | | | 2,548,421 | |
MarketAxess Holdings, Inc. (a) | | | 16,563 | | | | 4,609,980 | |
SABRE Corp. (a) | | | 121,024 | | | | 2,512,458 | |
Service Corp. International (a) | | | 79,672 | | | | 3,315,152 | |
Sotheby’s (a)(b) | | | 14,457 | | | | 609,796 | |
The Brink’s Co. (a) | | | 21,813 | | | | 1,743,513 | |
WEX, Inc. (b) | | | 18,937 | | | | 3,982,451 | |
| | | | | | | | 34,179,779 | |
The accompanying notes are an integral part of the financial statements.
42
Pacer Trendpilot® US Mid Cap ETF
SCHEDULE OF INVESTMENTS
April 30, 2019 (Continued)
| | | Shares | | | Value | |
COMMON STOCKS — 87.8% (Continued) |
| | | | | | | | | |
Computers — 2.2% | | | | | | | | |
CACI International, Inc. - Class A (b) | | | 10,924 | | | $ | 2,129,524 | |
Leidos Holdings, Inc. | | | 64,224 | | | | 4,719,179 | |
Lumentum Holdings, Inc. (a)(b) | | | 33,442 | | | | 2,072,401 | |
MAXIMUS, Inc. | | | 28,035 | | | | 2,064,778 | |
NCR Corp. (a)(b) | | | 52,266 | | | | 1,513,101 | |
NetScout Systems, Inc. (b) | | | 30,777 | | | | 904,844 | |
Perspecta, Inc. | | | 61,795 | | | | 1,426,229 | |
Science Applications International Corp. | | | 22,361 | | | | 1,675,957 | |
| | | | | | | | 16,506,013 | |
Cosmetics/Personal Care — 0.1% | | | | | | | | |
Edgewell Personal Care Co. (a)(b) | | | 23,779 | | | | 980,408 | |
| | | | | | | | | |
Distribution/Wholesale — 0.7% | | | | | | | | |
Pool Corp. (a) | | | 17,308 | | | | 3,180,172 | |
Watsco, Inc. (a) | | | 14,125 | | | | 2,238,389 | |
| | | | | | | | 5,418,561 | |
Diversified Financial Services — 2.6% | | | | | | | | |
Eaton Vance Corp. (a) | | | 50,609 | | | | 2,103,816 | |
Evercore, Inc. (a) | | | 18,018 | | | | 1,755,494 | |
Federated Investors, Inc. - Class B | | | 42,073 | | | | 1,292,903 | |
Interactive Brokers Group, Inc. | | | 32,994 | | | | 1,789,594 | |
Janus Henderson Group PLC (a) | | | 72,498 | | | | 1,817,525 | |
Legg Mason, Inc. | | | 37,586 | | | | 1,257,252 | |
LendingTree, Inc. (a)(b) | | | 3,273 | | | | 1,259,516 | |
Navient Corp. (a) | | | 95,623 | | | | 1,291,867 | |
SEI Investments Co. | | | 56,729 | | | | 3,088,894 | |
SLM Corp. | | | 191,947 | | | | 1,950,181 | |
Stifel Financial Corp. | | | 31,585 | | | | 1,884,677 | |
| | | | | | | | 19,491,719 | |
Electric — 1.9% | | | | | | | | |
Allete, Inc. | | | 22,639 | | | | 1,843,947 | |
Black Hills Corp. | | | 23,729 | | | | 1,726,522 | |
Hawaiian Electric Industries, Inc. (a) | | | 47,868 | | | | 1,985,565 | |
IdacorpDACORP, Inc. | | | 22,140 | | | | 2,192,303 | |
NorthWestern Corp. | | | 22,125 | | | | 1,545,431 | |
OGE Energy Corp. (a) | | | 87,766 | | | | 3,716,012 | |
PNM Resources, Inc. | | | 35,002 | | | | 1,625,493 | |
| | | | | | | | 14,635,273 | |
Electrical Components & Equipment — 1.7% | | | | | | | | |
Acuity Brands, Inc. | | | 17,533 | | | | 2,565,604 | |
Belden, Inc. (a) | | | 17,312 | | | | 961,682 | |
Energizer Holdings, Inc. (a) | | | 27,944 | | | | 1,338,238 | |
Hubbell, Inc. | | | 23,996 | | | | 3,061,890 | |
Littelfuse, Inc. (a) | | | 10,856 | | | | 2,182,599 | |
Universal Display Corp. (a) | | | 18,633 | | | | 2,973,827 | |
| | | | | | | | 13,083,840 | |
| | | Shares | | | Value | |
Electronics — 3.7% | | | | | | | | |
Arrow Electronics, Inc. (b) | | | 37,317 | | | $ | 3,153,660 | |
Avnet, Inc. (a) | | | 47,649 | | | | 2,316,218 | |
Coherent, Inc. (a)(b) | | | 10,693 | | | | 1,582,671 | |
Gentex Corp. | | | 113,911 | | | | 2,623,370 | |
Jabil, Inc. | | | 61,871 | | | | 1,869,123 | |
National Instruments Corp. (a) | | | 49,391 | | | | 2,326,316 | |
nVent Electric PLC | | | 70,870 | | | | 1,980,816 | |
Synnex Corp. (a) | | | 18,229 | | | | 1,966,544 | |
Tech Data Corp. (b) | | | 16,396 | | | | 1,747,978 | |
Trimble, Inc. (b) | | | 110,519 | | | | 4,511,386 | |
Vishay Intertechnology, Inc. (a) | | | 58,102 | | | | 1,151,001 | |
Woodward, Inc. | | | 24,554 | | | | 2,673,931 | |
| | | | | | | | 27,903,014 | |
Energy-Alternate Sources — 0.3% | | | | | | | | |
First Solar, Inc. (a)(b) | | | 33,184 | | | | 2,041,812 | |
| | | | | | | | | |
Engineering & Construction — 1.1% | | | | | | | | |
AECOM (a)(b) | | | 68,590 | | | | 2,325,201 | |
EMCOR Group, Inc. | | | 24,608 | | | | 2,070,517 | |
Granite Construction, Inc. | | | 20,518 | | | | 921,053 | |
KBR, Inc. | | | 61,966 | | | | 1,376,885 | |
MasTec, Inc. (b) | | | 27,062 | | | | 1,370,690 | |
| | | | | | | | 8,064,346 | |
Entertainment — 1.7% | | | | | | | | |
Churchill Downs, Inc. | | | 15,581 | | | | 1,571,344 | |
Cinemark Holdings, Inc. (a) | | | 46,806 | | | | 1,968,192 | |
Eldorado Resorts, Inc. (b) | | | 28,582 | | | | 1,411,093 | |
International Speedway Corp. | | | 10,446 | | | | 460,877 | |
Live Nation Entertainment, Inc. (b) | | | 60,769 | | | | 3,970,647 | |
Marriott Vacations Worldwide Corp. (a) | | | 17,283 | | | | 1,825,603 | |
Six Flags Entertainment Corp. (a) | | | 31,405 | | | | 1,667,292 | |
| | | | | | | | 12,875,048 | |
Environmental Control — 0.5% | | | | | | | | |
Clean Harbors, Inc. (b) | | | 22,332 | | | | 1,697,232 | |
Stericycle, Inc. (a)(b) | | | 37,466 | | | | 2,187,640 | |
| | | | | | | | 3,884,872 | |
Food — 1.9% | | | | | | | | |
Flowers Foods, Inc. (a) | | | 80,629 | | | | 1,752,874 | |
Hain Celestial Group, Inc. (a)(b) | | | 39,348 | | | | 858,574 | |
Ingredion, Inc. | | | 29,291 | | | | 2,775,322 | |
Lancaster Colony Corp. | | | 8,579 | | | | 1,275,783 | |
Post Holdings, Inc. (b) | | | 29,217 | | | | 3,295,093 | |
Sprouts Farmers Market, Inc. (b) | | | 54,546 | | | | 1,168,375 | |
Sanderson Farms, Inc. (a) | | | 8,564 | | | | 1,298,559 | |
Tootsie Roll Industries, Inc. (a) | | | 8,606 | | | | 334,189 | |
TreeHouse Foods, Inc. (a)(b) | | | 24,604 | | | | 1,647,976 | |
| | | | | | | | 14,406,745 | |
The accompanying notes are an integral part of the financial statements.
43
Pacer Trendpilot® US Mid Cap ETF
SCHEDULE OF INVESTMENTS
April 30, 2019 (Continued)
| | | Shares | | | Value | |
COMMON STOCKS — 87.8% (Continued) |
| | | | | | | | | |
Forest Products & Paper — 0.2% | | | | | | | | |
Domtar Corp. | | | 27,649 | | | $ | 1,352,036 | |
| | | | | | | | | |
Gas — 1.9% | | | | | | | | |
National Fuel Gas Co. (a) | | | 37,914 | | | | 2,244,888 | |
New Jersey Resources Corp. | | | 39,007 | | | | 1,953,471 | |
ONE Gas, Inc. | | | 23,103 | | | | 2,045,078 | |
Southwest Gas Holdings, Inc. | | | 23,322 | | | | 1,940,157 | |
Spire, Inc. (a) | | | 22,294 | | | | 1,876,932 | |
UGI Corp. (a) | | | 76,393 | | | | 4,164,182 | |
| | | | | | | | 14,224,708 | |
Hand/Machine Tools — 0.9% | | | | | | | | |
Colfax Corp. (a)(b) | | | 41,769 | | | | 1,260,171 | |
Kennametal, Inc. | | | 36,133 | | | | 1,470,613 | |
Lincoln Electric Holdings, Inc. | | | 27,785 | | | | 2,424,797 | |
Regal Beloit Corp. | | | 18,801 | | | | 1,599,589 | |
| | | | | | | | 6,755,170 | |
Healthcare - Products — 3.7% | | | | | | | | |
Bio-Techne Corp. | | | 16,598 | | | | 3,395,785 | |
Globus Medical, Inc. (a)(b) | | | 33,460 | | | | 1,508,711 | |
Haemonetics Corp. (b) | | | 22,418 | | | | 1,956,643 | |
Hill-Rom Holdings, Inc. | | | 29,290 | | | | 2,970,592 | |
ICU Medical, Inc. (b) | | | 7,298 | | | | 1,660,295 | |
Integra LifeSciences Holdings Corp. (b) | | | 31,084 | | | | 1,622,274 | |
LivaNova PLC (b) | | | 21,390 | | | | 1,473,557 | |
Masimo Corp. (b) | | | 21,499 | | | | 2,798,095 | |
NuVasive, Inc. (a) (b) | | | 22,690 | | | | 1,375,014 | |
Patterson Cos., Inc. (a) | | | 36,304 | | | | 792,879 | |
Steris PLC | | | 37,166 | | | | 4,868,003 | |
West Pharmaceutical Services, Inc. (a) | | | 32,598 | | | | 4,035,307 | |
| | | | | | | | 28,457,155 | |
Healthcare - Services — 2.4% | | | | | | | | |
Acadia Healthcare Co., Inc. (a)(b) | | | 38,870 | | | | 1,244,617 | |
Amedisys, Inc. (a)(b) | | | 12,800 | | | | 1,636,096 | |
Catalent, Inc. (a)(b) | | | 63,996 | | | | 2,868,301 | |
Charles River Laboratories International, Inc. (b) | | | 21,192 | | | | 2,976,840 | |
Chemed Corp. | | | 7,014 | | | | 2,292,035 | |
Encompass Health Corp. | | | 43,390 | | | | 2,796,486 | |
Molina Healthcare, Inc. (b) | | | 27,449 | | | | 3,558,214 | |
Tenet Healthcare Corp. (b) | | | 36,541 | | | | 800,248 | |
| | | | | | | | 18,172,837 | |
Home Builders — 1.3% | | | | | | | | |
KB Home | | | 37,181 | | | | 963,360 | |
NVR, Inc. (b) | | | 1,494 | | | | 4,709,805 | |
Thor Industries, Inc. (a) | | | 22,707 | | | | 1,495,710 | |
Toll Brothers, Inc. (a) | | | 58,958 | | | | 2,246,300 | |
| | | Shares | | | Value | |
Home Builders — 1.3% (Continued) | | | | |
TRI Pointe Group, Inc. (b) | | | 62,250 | | | $ | 812,362 | |
| | | | | | | | 10,227,537 | |
Home Furnishings — 0.2% | | | | | | | | |
Tempur Sealy International, Inc. (a)(b) | | | 20,170 | | | | 1,238,438 | |
| | | | | | | | | |
Household Products/Wares — 0.2% | | | | | | | | |
Helen of Troy Ltd. (b) | | | 11,249 | | | | 1,619,856 | |
| | | | | | | | | |
Housewares — 0.6% | | | | | | | | |
Scotts Miracle-Gro Co. - Class A (a) | | | 17,269 | | | | 1,468,210 | |
Toro Co. (a) | | | 46,640 | | | | 3,411,716 | |
| | | | | | | | 4,879,926 | |
Insurance — 4.8% | | | | | | | | |
Alleghany Corp. (b) | | | 6,358 | | | | 4,176,443 | |
American Financial Group, Inc. | | | 31,005 | | | | 3,209,948 | |
Brown & Brown, Inc. (a) | | | 102,014 | | | | 3,238,944 | |
CNO Financial Group, Inc. | | | 70,619 | | | | 1,168,744 | |
First American Financial Corp. | | | 48,982 | | | | 2,794,913 | |
Genworth Financial, Inc. (b) | | | 220,050 | | | | 833,989 | |
Hanover Insurance Group, Inc. | | | 17,828 | | | | 2,150,235 | |
Kemper Corp. | | | 26,746 | | | | 2,403,930 | |
Mercury General Corp. | | | 11,914 | | | | 640,735 | |
Old Republic International Corp. | | | 125,066 | | | | 2,796,476 | |
Primerica, Inc. | | | 18,712 | | | | 2,437,987 | |
Reinsurance Group of America, Inc. | | | 27,602 | | | | 4,181,979 | |
RenaissanceRe Holdings Ltd. | | | 18,550 | | | | 2,881,928 | |
WR Berkley Corp. (a) | | | 63,536 | | | | 3,894,757 | |
| | | | | | | | 36,811,008 | |
Internet — 0.2% | | | | | | | | |
Cars.com, Inc. (a)(b) | | | 27,243 | | | | 566,927 | |
Yelp, Inc. (a)(b) | | | 33,158 | | | | 1,328,309 | |
| | | | | | | | 1,895,236 | |
Iron/Steel — 1.0% | | | | | | | | |
Carpenter Technology Corp. (a) | | | 20,818 | | | | 1,034,030 | |
Commercial Metals Co. | | | 51,691 | | | | 893,738 | |
Reliance Steel & Aluminum Co. | | | 29,477 | | | | 2,710,705 | |
Steel Dynamics, Inc. | | | 100,874 | | | | 3,195,688 | |
| | | | | | | | 7,834,161 | |
Leisure Time — 0.6% | | | | | | | | |
Brunswick Corp. (a) | | | 38,246 | | | | 1,958,578 | |
Polaris Industries, Inc. | | | 25,180 | | | | 2,427,352 | |
| | | | | | | | 4,385,930 | |
Lodging — 0.8% | | | | | | | | |
Boyd Gaming Corp. | | | 35,109 | | | | 1,010,437 | |
Caesars Entertainment Corp. (a)(b) | | | 256,194 | | | | 2,397,976 | |
Wyndham Hotels & Resorts, Inc. | | | 43,012 | | | | 2,396,629 | |
| | | | | | | | 5,805,042 | |
The accompanying notes are an integral part of the financial statements.
44
Pacer Trendpilot® US Mid Cap ETF
SCHEDULE OF INVESTMENTS
April 30, 2019 (Continued)
| | | Shares | | | Value | |
COMMON STOCKS — 87.8% (Continued) |
| | | | | |
Machinery - Construction & Mining — 0.5% | | | | |
Oshkosh Corp. (a) | | | 30,776 | | | $ | 2,541,790 | |
Terex Corp. | | | 27,221 | | | | 907,276 | |
| | | | | | | | 3,449,066 | |
Machinery - Diversified — 2.7% | | | | | | | | |
AGCO Corp. (a) | | | 28,239 | | | | 1,998,756 | |
Cognex Corp. (a) | | | 75,065 | | | | 3,785,528 | |
Curtiss-Wright Corp. | | | 18,801 | | | | 2,142,186 | |
Graco, Inc. (a) | | | 72,633 | | | | 3,722,441 | |
IDEX Corp. | | | 33,309 | | | | 5,218,188 | |
Nordson Corp. (a) | | | 22,671 | | | | 3,308,832 | |
| | | | | | | | 20,175,931 | |
Media — 1.9% | | | | | | | | |
AMC Networks, Inc. - Class A (a)(b) | | | 19,657 | | | | 1,148,166 | |
Cable One, Inc | | | 2,176 | | | | 2,307,713 | |
FactSet Research Systems, Inc. (a) | | | 16,715 | | | | 4,611,167 | |
Meredith Corp. (a) | | | 17,571 | | | | 1,036,689 | |
TEGNA, Inc. | | | 94,834 | | | | 1,509,757 | |
The New York Times Co. (a) | | | 62,401 | | | | 2,068,593 | |
World Wrestling Entertainment, Inc. (a) | | | 19,220 | | | | 1,611,597 | |
| | | | | | | | 14,293,682 | |
Metal Fabricate/Hardware — 0.5% | | | | | | | | |
The Timken Co. | | | 29,967 | | | | 1,436,918 | |
Worthington Industries, Inc. | | | 17,252 | | | | 692,323 | |
Valmont Industries, Inc. | | | 9,646 | | | | 1,300,667 | |
| | | | | | | | 3,429,908 | |
Mining — 0.4% | | | | | | | | |
Royal Gold, Inc. | | | 28,786 | | | | 2,506,109 | |
Compass Minerals International, Inc. (a) | | | 14,883 | | | | 854,135 | |
| | | | | | | | 3,360,244 | |
Miscellaneous Manufacturing — 2.0% | | | | | | | | |
AptarGroup, Inc. (a) | | | 27,652 | | | | 3,076,008 | |
Carlisle Cos., Inc. | | | 25,169 | | | | 3,559,400 | |
Crane Co. | | | 22,323 | | | | 1,898,571 | |
Donaldson Co., Inc. (a) | | | 56,198 | | | | 3,008,841 | |
ITT, Inc. | | | 38,406 | | | | 2,325,483 | |
Trinity Industries, Inc. (a) | | | 58,596 | | | | 1,263,330 | |
| | | | | | | | 15,131,633 | |
Office Furnishings — 0.2% | | | | | | | | |
Herman Miller, Inc. | | | 25,885 | | | | 1,004,856 | |
HNI Corp. | | | 19,114 | | | | 701,675 | |
| | | | | | | | 1,706,531 | |
Office/Business Equipment — 0.7% | | | | | | | | |
Pitney Bowes, Inc. (a) | | | 82,720 | | | | 588,139 | |
| | | Shares | | | Value | |
Office/Business Equipment — 0.7% (Continued) | | | | |
Zebra Technologies Corp. - Class A (b) | | | 23,672 | | | $ | 4,998,106 | |
| | | | | | | | 5,586,245 | |
Oil & Gas — 2.7% | | | | | | | | |
Callon Petroleum Co. (a)(b) | | | 100,133 | | | | 751,999 | |
Chesapeake Energy Corp. (a)(b) | | | 458,901 | | | | 1,335,402 | |
CNX Resources Corp. (b) | | | 87,155 | | | | 780,909 | |
Ensco Rowan PLC (a) | | | 86,485 | | | | 1,208,195 | |
EQT Corp. | | | 111,947 | | | | 2,289,316 | |
Matador Resources Co. (a)(b) | | | 45,515 | | | | 896,190 | |
Murphy Oil Corp. | | | 71,482 | | | | 1,947,170 | |
Murphy USA, Inc. (a)(b) | | | 13,187 | | | | 1,127,093 | |
Oasis Petroleum, Inc. (a)(b) | | | 118,778 | | | | 724,546 | |
PBF Energy, Inc. - Class A | | | 52,665 | | | | 1,768,491 | |
QEP Resources, Inc. (a)(b) | | | 103,867 | | | | 781,080 | |
Range Resources Corp. (a) | | | 91,239 | | | | 824,800 | |
SM Energy Co. | | | 45,376 | | | | 722,840 | |
Southwestern Energy Co. (a)(b) | | | 237,872 | | | | 939,594 | |
Transocean Ltd. (b) | | | 222,508 | | | | 1,748,913 | |
WPX Energy, Inc. (b) | | | 173,682 | | | | 2,412,443 | |
| | | | | | | | 20,258,981 | |
Oil & Gas Services — 0.8% | | | | | | | | |
Apergy Corp. (b) | | | 33,991 | | | | 1,349,103 | |
Core Laboratories NV | | | 19,478 | | | | 1,234,710 | |
McDermott International, Inc. (a)(b) | | | 79,445 | | | | 642,710 | |
NOW, Inc. (b) | | | 47,654 | | | | 696,701 | |
Oceaneering International, Inc. (b) | | | 43,431 | | | | 833,875 | |
Patterson-UTI Energy, Inc. | | | 93,889 | | | | 1,275,952 | |
| | | | | | | | 6,033,051 | |
Packaging & Containers — 1.0% | | | | | | | | |
Bemis Co., Inc. (a) | | | 40,058 | | | | 2,300,131 | |
Greif, Inc. | | | 11,524 | | | | 455,428 | |
Owens-Illinois, Inc. (a) | | | 67,506 | | | | 1,333,919 | |
Silgan Holdings, Inc. (a) | | | 33,969 | | | | 1,017,032 | |
Sonoco Products Co. (a) | | | 43,903 | | | | 2,768,523 | |
| | | | | | | | 7,875,033 | |
Pharmaceuticals — 0.5% | | | | | | | | |
Mallinckrodt PLC (a)(b) | | | 36,690 | | | | 567,227 | |
PRA Health Sciences, Inc. (a)(b) | | | 25,920 | | | | 2,509,575 | |
Prestige Brands Holdings, Inc. (b) | | | 22,760 | | | | 669,599 | |
| | | | | | | | 3,746,401 | |
Pipelines — 0.2% | | | | | | | | |
Equitrans Midstream Corp. (a) | | | 89,382 | | | | 1,861,827 | |
| | | | | | | | | |
Real Estate — 0.4% | | | | | | | | |
Jones Lang LaSalle, Inc. | | | 20,050 | | | | 3,099,129 | |
| | | | | | | | | |
Retail — 4.9% | | | | | | | | |
American Eagle Outfitters, Inc. | | | 73,657 | | | | 1,751,563 | |
AutoNation, Inc. (a)(b) | | | 25,324 | | | | 1,061,835 | |
The accompanying notes are an integral part of the financial statements.
45
Pacer Trendpilot® US Mid Cap ETF
SCHEDULE OF INVESTMENTS
April 30, 2019 (Continued)
| | | Shares | | | Value | |
COMMON STOCKS — 87.8% (Continued) |
| |
Retail — 4.9% (Continued) |
Bed Bath & Beyond, Inc. (a) | | | 60,412 | | | $ | 1,009,485 | |
Brinker International, Inc. (a) | | | 16,475 | | | | 704,636 | |
Casey’s General Stores, Inc. (a) | | | 16,089 | | | | 2,129,379 | |
Cracker Barrel Old Country Store, Inc. (a) | | | 10,560 | | | | 1,781,894 | |
Dick’s Sporting Goods, Inc. (a) | | | 32,415 | | | | 1,199,355 | |
Dillard’s, Inc. - Class A (a) | | | 8,115 | | | | 555,472 | |
Domino’s Pizza, Inc. (a) | | | 18,038 | | | | 4,880,722 | |
Dunkin’ Brands Group, Inc. (a) | | | 36,315 | | | | 2,710,189 | |
Five Below, Inc. (a)(b) | | | 24,505 | | | | 3,587,287 | |
Jack in the Box, Inc. (a) | | | 11,340 | | | | 874,314 | |
Michaels Cos., Inc. (a)(b) | | | 39,497 | | | | 443,946 | |
MSC Industrial Direct Co., Inc. (a) | | | 19,836 | | | | 1,659,281 | |
Nu Skin Enterprises, Inc. - Class A | | | 24,324 | | | | 1,237,362 | |
Papa John’s International, Inc. (a) | | | 9,890 | | | | 505,972 | |
Ollie’s Bargain Outlet Holdings, Inc. (a)(b) | | | 22,658 | | | | 2,167,011 | |
Sally Beauty Holdings, Inc. (a)(b) | | | 52,978 | | | | 937,711 | |
Signet Jewelers Ltd. (a) | | | 22,809 | | | | 528,713 | |
Texas Roadhouse, Inc. (a) | | | 29,292 | | | | 1,582,061 | |
The Cheesecake Factory, Inc. (a) | | | 18,326 | | | | 909,336 | |
The Wendy’s Co. | | | 79,922 | | | | 1,487,348 | |
Urban Outfitters, Inc. (a)(b) | | | 33,109 | | | | 984,331 | |
Williams-Sonoma, Inc. (a) | | | 35,227 | | | | 2,013,928 | |
World Fuel Services Corp. | | | 29,518 | | | | 910,630 | |
| | | | | | | | 37,613,761 | |
Savings & Loans — 0.7% | | | | | | | | |
New York Community Bancorp, Inc. (a) | | | 205,361 | | | | 2,388,348 | |
Sterling Bancorp (a) | | | 93,471 | | | | 2,002,149 | |
Washington Federal, Inc. (a) | | | 35,640 | | | | 1,181,110 | |
| | | | | | | | 5,571,607 | |
Semiconductors — 2.4% | | | | | | | | |
Cirrus Logic, Inc. (b) | | | 25,991 | | | | 1,236,652 | |
CREE, Inc. (a)(b) | | | 45,359 | | | | 2,997,776 | |
Cypress Semiconductor Corp. (a) | | | 159,902 | | | | 2,747,116 | |
MKS Instruments, Inc. | | | 23,813 | | | | 2,167,221 | |
Monolithic Power Systems, Inc. (a) | | | 17,348 | | | | 2,701,257 | |
Silicon Laboratories, Inc. (a)(b) | | | 18,931 | | | | 2,038,112 | |
Synaptics, Inc. (b) | | | 15,120 | | | | 569,570 | |
Teradyne, Inc. (a) | | | 76,299 | | | | 3,738,651 | |
| | | | | | | | 18,196,355 | |
Software — 4.4% | | | | | | | | |
ACI Worldwide, Inc. (b) | | | 51,040 | | | | 1,812,941 | |
Allscripts Healthcare Solutions, Inc. (a)(b) | | | 75,290 | | | | 743,112 | |
Blackbaud, Inc | | | 21,340 | | | | 1,692,048 | |
CDK Global, Inc. (a) | | | 54,800 | | | | 3,305,536 | |
CommVault Systems, Inc. (b) | | | 16,938 | | | | 890,939 | |
| | | Shares | | | Value | |
Software — 4.4% (Continued) |
Fair Isaac Corp. (b) | | | 12,775 | | | $ | 3,573,806 | |
J2 Global, Inc. (a) | | | 20,351 | | | | 1,783,155 | |
Manhattan Associates, Inc. (a)(b) | | | 28,571 | | | | 1,927,114 | |
Medidata Solutions, Inc. (a)(b) | | | 27,370 | | | | 2,472,606 | |
PTC, Inc. (a)(b) | | | 46,914 | | | | 4,244,310 | |
Teradata Corp. (a)(b) | | | 51,548 | | | | 2,343,887 | |
Tyler Technologies, Inc. (b) | | | 16,826 | | | | 3,902,118 | |
Ultimate Software Group, Inc. (b) | | | 13,919 | | | | 4,602,317 | |
| | | | | | | | 33,293,889 | |
Telecommunications — 1.3% | | | | | | | | |
CIENA Corp. (b) | | | 63,200 | | | | 2,424,352 | |
InterDigital, Inc. | | | 14,332 | | | | 937,169 | |
LogMeIn, Inc. | | | 22,337 | | | | 1,840,569 | |
Plantronics, Inc. | | | 14,394 | | | | 741,003 | |
Telephone & Data Systems, Inc. | | | 41,202 | | | | 1,313,520 | |
ViaSat, Inc. (a)(b) | | | 24,985 | | | | 2,269,138 | |
| | | | | | | | 9,525,751 | |
Transportation — 2.3% | | | | | | | | |
Genesee & Wyoming, Inc. (b) | | | 24,733 | | | | 2,192,580 | |
Kirby Corp. (a)(b) | | | 23,679 | | | | 1,935,048 | |
Knight-Swift Transportation Holdings Inc - Class A (a) | | | 54,737 | | | | 1,825,479 | |
Landstar System, Inc. | | | 17,630 | | | | 1,920,965 | |
Old Dominion Freight Line, Inc. | | | 28,527 | | | | 4,258,511 | |
Ryder System, Inc. | | | 23,338 | | | | 1,470,294 | |
Werner Enterprises, Inc. (a) | | | 19,204 | | | | 643,334 | |
XPO Logistics, Inc. (a)(b) | | | 47,980 | | | | 3,266,478 | |
| | | | | | | | 17,512,689 | |
Trucking & Leasing — 0.2% | | | | | | | | |
GATX Corp. (a) | | | 16,086 | | | | 1,240,713 | |
| | | | | | | | | |
Water — 0.4% | | | | | | | | |
Aqua America, Inc. (a) | | | 78,283 | | | | 3,057,734 | |
| | | | | | | | | |
TOTAL COMMON STOCKS (Cost $654,201,811) | | | | | | | 668,394,124 | |
| | | | | | | | | |
EXCHANGE TRADED FUNDS — 3.2% | | | | |
| | | | | | | | | |
SPDR S&P MidCap 400 ETF Trust | | | 68,298 | | | | 24,525,812 | |
TOTAL EXCHANGE TRADED FUNDS (Cost $24,071,365) | | | | | | | 24,525,812 | |
| | | | | | | | | |
The accompanying notes are an integral part of the financial statements.
46
Pacer Trendpilot® US Mid Cap ETF
SCHEDULE OF INVESTMENTS
April 30, 2019 (Continued)
| | | Shares | | | Value | |
REAL ESTATE INVESTMENT TRUSTS — 8.9% | | | | |
| | | | | | | | | |
Alexander & Baldwin, Inc. | | | 29,774 | | | $ | 703,262 | |
American Campus Communities, Inc. (a) | | | 60,213 | | | | 2,842,054 | |
Brixmor Property Group, Inc. | | | 131,226 | | | | 2,346,321 | |
Camden Property Trust | | | 42,462 | | | | 4,273,800 | |
CoreSite Realty Corp. | | | 16,133 | | | | 1,765,112 | |
Corporate Office Properties Trust | | | 48,449 | | | | 1,350,758 | |
Cousins Properties, Inc. (a) | | | 184,729 | | | | 1,767,856 | |
CyrusOne, Inc. (a) | | | 47,576 | | | | 2,649,507 | |
Douglas Emmett, Inc. | | | 71,059 | | | | 2,926,920 | |
EPR Properties | | | 32,917 | | | | 2,595,835 | |
First Industrial Realty Trust, Inc. | | | 55,630 | | | | 1,962,070 | |
Healthcare Realty Trust, Inc. | | | 55,060 | | | | 1,700,253 | |
Highwoods Properties, Inc. | | | 45,503 | | | | 2,028,524 | |
Hospitality Properties Trust (a) | | | 72,263 | | | | 1,878,838 | |
JBG Smith Properties (a) | | | 48,480 | | | | 2,062,824 | |
Kilroy Realty Corp. (a) | | | 44,366 | | | | 3,412,189 | |
Lamar Advertising Co. - Class A (a) | | | 37,423 | | | | 3,093,759 | |
Liberty Property Trust | | | 65,015 | | | | 3,227,345 | |
Life Storage, Inc. (a) | | | 20,495 | | | | 1,952,969 | |
Mack-Cali Realty Corp. | | | 39,693 | | | | 924,053 | |
Medical Properties Trust, Inc. (a) | | | 167,457 | | | | 2,923,799 | |
National Retail Properties, Inc. | | | 71,018 | | | | 3,736,967 | |
Omega Healthcare Investors, Inc. | | | 89,742 | | | | 3,175,969 | |
Pebblebrook Hotel Trust | | | 57,349 | | | | 1,867,283 | |
PotlatchDeltic Corp. (a) | | | 29,826 | | | | 1,153,073 | |
Rayonier, Inc. | | | 56,906 | | | | 1,809,042 | |
Sabra Health Care REIT, Inc. (a) | | | 78,360 | | | | 1,532,722 | |
Senior Housing Properties Trust | | | 104,465 | | | | 838,854 | |
Tanger Factory Outlet Centers, Inc. (a) | | | 41,283 | | | | 745,571 | |
Taubman Centers, Inc. (a) | | | 26,863 | | | | 1,324,346 | |
Uniti Group, Inc. | | | 78,652 | | | | 864,385 | |
Urban Edge Properties | | | 50,241 | | | | 932,975 | |
Weingarten Realty Investors | | | 52,568 | | | | 1,521,318 | |
TOTAL REAL ESTATE INVESTMENT TRUSTS (Cost $68,906,878) | | | | | | | 67,890,553 | |
| | | | | | | | | |
| | | Shares | | | Value | |
SHORT-TERM INVESTMENTS — 0.1% | | | | |
| | | | | | | | | |
Money Market Funds — 0.1% | | | | | | | | |
U.S. Bank Money Market Deposit Account 2.35% (c) | | | 388,643 | | | $ | 388,643 | |
TOTAL SHORT-TERM INVESTMENTS
(Cost $388,643) | | | | | | | 388,643 | |
| | | | | | | | | |
INVESTMENTS PURCHASED WITH PROCEEDS FROM SECURITIES LENDING — 29.0% | | | | | | | | |
Mount Vernon Liquid Assets Portfolio, LLC 2.61% (c) | | | 221,030,289 | | | | 221,030,289 | |
TOTAL INVESTMENTS PURCHASED WITH PROCEEDS FROM SECURITIES LENDING (Cost $221,030,289) | | | | | | | 221,030,289 | |
Total Investments
(Cost $968,598,986) — 129.0% | | | | | | | 982,229,421 | |
Liabilities in Excess of Other Assets — (29.0)% | | | | | | | (220,923,987 | ) |
TOTAL NET ASSETS — 100.0% | | | | | | $ | 761,305,434 | |
Percentages are stated as a percent of net assets.
| | (a) | All or portion of this security is on loan as of April 30, 2019. The Total value of securities on loan is $214,543,582 or 28.2% of net assets. |
| | (b) | Non-income producing security. |
| | (c) | The rate shown is as of April 30, 2019 |
For Fund compliance purposes, the Fund’s industry classifications refer to any one or more of the industry sub-classifications used by one or more widely recognized market indexes or ratings group indexes, and/or they may be defined by Fund management. This definition does not apply for all purposes of this report, which may combine sub-classifications for reporting ease. Categories are shown as a percentage of net assets.
The accompanying notes are an integral part of the financial statements.
47
Pacer Trendpilot® 100 ETF
SCHEDULE OF INVESTMENTS
April 30, 2019
| | | Shares | | | Value | |
COMMON STOCKS — 99.9% | | | | |
| | | | | | | | | |
Airlines — 0.5% | | | | |
American Airlines Group, Inc. (a) | | | 27,072 | | | $ | 925,321 | |
United Continental Holdings, Inc. (b) | | | 16,040 | | | | 1,425,314 | |
| | | | | | | | 2,350,635 | |
Auto Manufacturers — 0.8% | | | | | | | | |
PACCAR, Inc. (a) | | | 20,596 | | | | 1,476,115 | |
Tesla Motors, Inc. (a)(b) | | | 10,227 | | | | 2,441,083 | |
| | | | | | | | 3,917,198 | |
Beverages — 2.5% | | | | | | | | |
Monster Beverage Corp. (a)(b) | | | 32,123 | | | | 1,914,531 | |
PepsiCo, Inc. | | | 83,094 | | | | 10,640,186 | |
| | | | | | | | 12,554,717 | |
Biotechnology — 5.8% | | | | | | | | |
Alexion Pharmaceuticals, Inc. (b) | | | 13,141 | | | | 1,788,884 | |
Amgen, Inc. | | | 36,810 | | | | 6,600,769 | |
Biogen, Inc. (b) | | | 11,644 | | | | 2,669,271 | |
BioMarin Pharmaceutical, Inc. (b) | | | 10,506 | | | | 898,578 | |
Celgene Corp. (b) | | | 41,537 | | | | 3,931,892 | |
Gilead Sciences, Inc. | | | 75,464 | | | | 4,908,179 | |
Illumina, Inc. (b) | | | 8,660 | | | | 2,701,920 | |
Incyte Corp. (b) | | | 12,541 | | | | 963,149 | |
Regeneron Pharmaceuticals, Inc. (b) | | | 6,357 | | | | 2,181,341 | |
Vertex Pharmaceuticals, Inc. (b) | | | 15,059 | | | | 2,544,670 | |
| | | | | | | | 29,188,653 | |
Broadcast Service/Program — 0.3% | | | | | | | | |
Fox Corp. - Class A (b) | | | 20,376 | | | | 794,460 | |
Fox Corp. - Class B (b) | | | 15,397 | | | | 592,772 | |
| | | | | | | | 1,387,232 | |
Commercial Services — 2.9% | | | | | | | | |
Automatic Data Processing, Inc. (a) | | | 25,775 | | | | 4,237,153 | |
Cintas Corp. (a) | | | 6,179 | | | | 1,341,708 | |
PayPal Holdings, Inc. (a)(b) | | | 69,434 | | | | 7,830,072 | |
Verisk Analytics, Inc. | | | 9,708 | | | | 1,370,187 | |
| | | | | | | | 14,779,120 | |
Computers — 11.2% | | | | | | | | |
Apple, Inc. | | | 251,441 | | | | 50,456,666 | |
Check Point Software Technologies Ltd. (b) | | | 9,204 | | | | 1,111,475 | |
Cognizant Technology Solutions Corp. - Class A | | | 34,106 | | | | 2,488,374 | |
NetApp, Inc. (a) | | | 14,806 | | | | 1,078,617 | |
Western Digital Corp. (a) | | | 17,077 | | | | 872,976 | |
| | | | | | | | 56,008,108 | |
Distribution/Wholesale — 0.2% | | | | | | | | |
Fastenal Co. (a) | | | 16,927 | | | | 1,194,200 | |
| | | | | | | | | |
Electric — 0.3% | | | | | | | | |
Xcel Energy, Inc. (a) | | | 30,294 | | | | 1,711,611 | |
| | | Shares | | | Value | |
Food — 1.3% | | | | | | | | |
Mondelez International, Inc. - Class A | | | 85,659 | | | $ | 4,355,760 | |
The Kraft Heinz Co. (a) | | | 71,887 | | | | 2,389,524 | |
| | | | | | | | 6,745,284 | |
Healthcare-Products — 1.3% | | | | | | | | |
Align Technology, Inc. (b) | | | 4,717 | | | | 1,531,516 | |
Henry Schein, Inc. (a)(b) | | | 8,975 | | | | 574,938 | |
IDEXX Laboratories, Inc. (b) | | | 5,073 | | | | 1,176,936 | |
Intuitive Surgical, Inc. (b) | | | 6,764 | | | | 3,453,901 | |
| | | | | | | | 6,737,291 | |
Insurance — 0.3% | | | | | | | | |
Willis Towers Watson PLC | | | 7,640 | | | | 1,408,357 | |
| | | | | | | | | |
Internet — 28.7% | | | | | | | | |
Alphabet, Inc. - Class A (b) | | | 16,407 | | | | 19,671,337 | |
Alphabet, Inc. - Class C (b) | | | 18,752 | | | | 22,286,377 | |
Amazon.com, Inc. (b) | | | 26,190 | | | | 50,455,559 | |
Baidu, Inc. - ADR (b) | | | 16,531 | | | | 2,747,948 | |
Booking Holdings, Inc. (b) | | | 2,675 | | | | 4,962,098 | |
Ctrip.com International Ltd. - ADR (a)(b) | | | 28,695 | | | | 1,264,015 | |
eBay, Inc. | | | 54,117 | | | | 2,097,034 | |
Expedia Group, Inc. (a) | | | 8,032 | | | | 1,042,875 | |
Facebook, Inc. - Class A (b) | | | 128,376 | | | | 24,827,918 | |
JD.com, Inc. - ADR (a)(b) | | | 54,454 | | | | 1,648,323 | |
MercadoLibre, Inc. (a)(b) | | | 2,680 | | | | 1,297,495 | |
Netflix, Inc. (b) | | | 25,837 | | | | 9,573,642 | |
Symantec Corp. | | | 37,674 | | | | 912,087 | |
VeriSign, Inc. (b) | | | 7,110 | | | | 1,403,869 | |
| | | | | | | | 144,190,577 | |
Lodging — 0.7% | | | | | | | | |
Marriott International, Inc. - Class A (a) | | | 20,098 | | | | 2,741,769 | |
Wynn Resorts Ltd. | | | 6,408 | | | | 925,636 | |
| | | | | | | | 3,667,405 | |
Media — 4.8% | | | | | | | | |
Charter Communications,
Inc. - Class A (a)(b) | | | 13,336 | | | | 4,950,190 | |
Comcast Corp. - Class A | | | 267,101 | | | | 11,626,907 | |
Liberty Global PLC - Class A (b) | | | 12,038 | | | | 325,146 | |
Liberty Global PLC - Class C (b) | | | 31,673 | | | | 828,249 | |
Sirius XM Holdings, Inc. (a) | | | 257,075 | | | | 1,493,606 | |
Walt Disney Co. | | | 36,282 | | | | 4,969,500 | |
| | | | | | | | 24,193,598 | |
Pharmaceuticals — 0.2% | | | | | | | | |
Mylan NV (b) | | | 30,413 | | | | 820,847 | |
| | | | | | | | | |
The accompanying notes are an integral part of the financial statements.
48
Pacer Trendpilot® 100 ETF
SCHEDULE OF INVESTMENTS
April 30, 2019 (Continued)
| | | Shares | | | Value | |
COMMON STOCKS — 99.9% (Continued) |
| | | | | | | | | |
Retail — 4.4% | | | | | | | | |
Costco Wholesale Corp. | | | 26,073 | | | $ | 6,401,704 | |
Dollar Tree, Inc. (b) | | | 14,040 | | | | 1,562,371 | |
O’Reilly Automotive, Inc. (b) | | | 4,647 | | | | 1,759,215 | |
Ross Stores, Inc. (a) | | | 22,004 | | | | 2,148,911 | |
Starbucks Corp. (a) | | | 73,570 | | | | 5,714,917 | |
Ulta Salon Cosmetics & Fragrance, Inc. (b) | | | 3,535 | | | | 1,233,644 | |
Walgreens Boots Alliance, Inc. (a) | | | 55,909 | | | | 2,995,045 | |
| | | | | | | | 21,815,807 | |
Retail-Apparel/Shoe — 0.3% | | | | | | | | |
Lululemon Athletica, Inc. (b) | | | 7,227 | | | | 1,274,481 | |
| | | | | | | | | |
Semiconductors — 12.1% | | | | | | | | |
Advanced Micro Devices, Inc. (a)(b) | | | 58,939 | | | | 1,628,485 | |
Analog Devices, Inc. | | | 21,804 | | | | 2,534,497 | |
Applied Materials, Inc. | | | 56,178 | | | | 2,475,764 | |
ASML Holding NV - ADR | | | 4,236 | | | | 884,562 | |
Broadcom, Inc. | | | 23,431 | | | | 7,460,430 | |
Intel Corp. | | | 266,046 | | | | 13,578,988 | |
KLA-Tencor Corp. | | | 9,007 | | | | 1,148,212 | |
Lam Research Corp. | | | 9,124 | | | | 1,892,591 | |
Maxim Integrated Products, Inc. (a) | | | 16,306 | | | | 978,360 | |
Microchip Technology, Inc. (a) | | | 13,937 | | | | 1,392,167 | |
Micron Technology, Inc. (b) | | | 66,783 | | | | 2,808,893 | |
NVIDIA Corp. | | | 35,948 | | | | 6,506,588 | |
NXP Semiconductors NV | | | 19,380 | | | | 2,046,916 | |
QUALCOMM, Inc. (a) | | | 71,449 | | | | 6,153,902 | |
Skyworks Solutions, Inc. | | | 10,443 | | | | 920,864 | |
Texas Instruments, Inc. (a) | | | 55,513 | | | | 6,541,097 | |
Xilinx, Inc. | | | 14,922 | | | | 1,792,729 | |
| | | | | | | | 60,745,045 | |
Software — 16.6% | | | | | | | | |
Activision Blizzard, Inc. | | | 44,982 | | | | 2,168,582 | |
Adobe Systems, Inc. (b) | | | 28,786 | | | | 8,326,351 | |
Autodesk, Inc. (b) | | | 12,875 | | | | 2,294,454 | |
Cadence Design System, Inc. (b) | | | 16,637 | | | | 1,154,275 | |
Cerner Corp. (a)(b) | | | 19,399 | | | | 1,289,064 | |
Citrix Systems, Inc. | | | 7,924 | | | | 800,007 | |
Electronic Arts, Inc. (b) | | | 17,809 | | | | 1,685,622 | |
Fiserv, Inc. (a)(b) | | | 23,162 | | | | 2,020,653 | |
Intuit, Inc. | | | 15,297 | | | | 3,840,465 | |
Microsoft Corp. | | | 408,961 | | | | 53,410,307 | |
NetEase, Inc. - ADR | | | 4,325 | | | | 1,230,592 | |
Paychex, Inc. | | | 21,163 | | | | 1,784,252 | |
Synopsys, Inc. (b) | | | 8,769 | | | | 1,061,750 | |
Take-Two Interactive Software, Inc. (a)(b) | | | 6,708 | | | | 649,536 | |
| | | Shares | | | Value | |
Software — 16.6% (Continued) | | | | | | | | |
Workday, Inc. - Class A (a)(b) | | | 8,931 | | | $ | 1,836,482 | |
| | | | | | | | 83,552,392 | |
Telecommunications — 3.6% | | | | | | | | |
Cisco Systems, Inc. | | | 260,404 | | | | 14,569,604 | |
T-Mobile US, Inc. (b) | | | 50,009 | | | | 3,650,157 | |
| | | | | | | | 18,219,761 | |
Toys/Games/Hobbies — 0.2% | | | | | | | | |
Hasbro, Inc. (a) | | | 7,464 | | | | 760,283 | |
| | | | | | | | | |
Transportation — 0.9% | | | | | | | | |
CSX Corp. (a) | | | 48,247 | | | | 3,841,908 | |
JB Hunt Trasport Services, Inc. | | | 6,431 | | | | 607,601 | |
| | | | | | | | 4,449,509 | |
TOTAL COMMON STOCKS (Cost $459,487,877) | | | | | | | 501,672,111 | |
| | | | | | | | | |
SHORT-TERM INVESTMENTS — 0.1% | | | | |
| | | | | | | | | |
Money Market Funds — 0.1% | | | | | | | | |
U.S. Bank Money Market Deposit Account 2.35% (c) | | | 717,855 | | | | 717,855 | |
TOTAL SHORT-TERM INVESTMENTS
(Cost $717,855) | | | | | | | 717,855 | |
| | | | | | | | | |
INVESTMENTS PURCHASED WITH PROCEEDS FROM SECURITIES LENDING — 13.7% | | | | | | | | |
Mount Vernon Liquid Assets Portfolio, LLC 2.61% (c) | | | 68,785,935 | | | | 68,785,935 | |
TOTAL INVESTMENTS PURCHASED WITH PROCEEDS FROM SECURITIES LENDING (Cost $68,785,935) | | | | | | | 68,785,935 | |
Total Investments
(Cost $528,991,667) — 113.7% | | | | | | | 571,175,901 | |
Liabilities in Excess of Other Assets — (13.7)% | | | | | | | (69,002,764 | ) |
TOTAL NET ASSETS — 100.0% | | | | | | $ | 502,173,137 | |
Percentages are stated as a percent of net assets.
ADR | American Depositary Receipt |
| | (a) | All or portion of this security is on loan as of April 30, 2019. The total value of securities on loan is $67,564,384 or 13.5% of net assets. |
| | (b) | Non-income producing security. |
| | (c) | The rate shown is as of April 30, 2019 |
For Fund compliance purposes, the Fund’s industry classifications refer to any one or more of the industry sub-classifications used by one or more widely recognized market indexes or ratings group indexes, and/or they may be defined by Fund management. This definition does not apply for all purposes of this report, which may combine sub-classifications for reporting ease. Categories are shown as a percentage of net assets.
The accompanying notes are an integral part of the financial statements.
49
Pacer Trendpilot® European Index ETF
SCHEDULE OF INVESTMENTS
April 30, 2019
| | | Shares | | | Value | |
COMMON STOCKS — 96.3% | | | | |
| | | | | | | | | |
Advertising — 0.3% | | | | |
JCDecaux SA | | | 2,895 | | | $ | 94,814 | |
Publicis Groupe SA | | | 8,388 | | | | 497,496 | |
| | | | | | | | 592,310 | |
Aerospace/Defense — 3.2% | | | | | | | | |
Airbus Group SE | | | 21,933 | | | | 2,998,266 | |
Dassault Aviation SA | | | 94 | | | | 142,226 | |
Leonardo SpA | | | 15,455 | | | | 178,458 | |
MTU Aero Engines AG | | | 2,058 | | | | 484,043 | |
Safran SA | | | 11,585 | | | | 1,687,893 | |
Thales SA | | | 3,993 | | | | 476,743 | |
| | | | | | | | 5,967,629 | |
Airlines — 0.2% | | | | | | | | |
Air France-KLM (a) | | | 8,542 | | | | 98,682 | |
Deutsche Lufthansa AG | | | 9,414 | | | | 227,225 | |
| | | | | | | | 325,907 | |
Apparel — 4.9% | | | | | | | | |
adidas AG | | | 7,539 | | | | 1,937,218 | |
Hermes International | | | 1,231 | | | | 865,972 | |
Kering | | | 2,960 | | | | 1,749,613 | |
LVMH Moet Hennessy Louis Vuitton SE | | | 9,912 | | | | 3,880,508 | |
Moncler SpA | | | 6,832 | | | | 280,229 | |
Puma SE | | | 326 | | | | 201,652 | |
| | | | | | | | 8,915,192 | |
Auto Manufacturers — 3.3% | | | | | | | | |
Bayerische Motoren Werke AG | | | 12,823 | | | | 1,091,619 | |
Daimler AG | | | 34,344 | | | | 2,247,279 | |
Ferrari NV | | | 5,007 | | | | 678,117 | |
Fiat Chrysler Automobiles NV | | | 43,974 | | | | 677,381 | |
Peugeot SA | | | 21,708 | | | | 568,764 | |
Renault SA | | | 7,341 | | | | 500,773 | |
Volkswagen AG | | | 1,272 | | | | 227,413 | |
| | | | | | | | 5,991,346 | |
Auto Parts&Equipment — 1.5% | | | | | | | | |
Cie Generale des Etablissements Michelin | | | 7,031 | | | | 908,073 | |
Continental AG | | | 4,315 | | | | 713,181 | |
Faurecia | | | 2,927 | | | | 148,651 | |
Hella GmbH & Co. KGaA | | | 1,777 | | | | 96,585 | |
Nokian Renkaat OYJ (c) | | | 5,362 | | | | 179,339 | |
Pirelli & C SPA (a)(b) | | | 17,237 | | | | 125,820 | |
Plastic Omnium SA | | | 2,205 | | | | 66,750 | |
Rheinmetall AG | | | 1,712 | | | | 196,435 | |
Valeo SA | | | 9,498 | | | | 344,838 | |
| | | | | | | | 2,779,672 | |
| | | Shares | | | Value | |
Banks — 10.9% | | | | | | | | |
ABN AMRO Group NV (b) | | | 16,530 | | | $ | 388,786 | |
AIB Group PLC | | | 31,332 | | | | 145,418 | |
Alpha Bank AE (a) | | | 54,903 | | | | 85,103 | |
Banca Mediolanum SpA | | | 9,716 | | | | 71,324 | |
Banco Bilbao Vizcaya Argentaria SA - ADR | | | 265,601 | | | | 1,617,510 | |
Banco BPM SpA (a) | | | 60,552 | | | | 143,981 | |
Banco de Sabadell SA | | | 224,252 | | | | 260,577 | |
Banco Santander SA - ADR | | | 636,620 | | | | 3,176,734 | |
Bank of Ireland Group PLC | | | 36,648 | | | | 233,885 | |
BANKIA S.A. | | | 48,228 | | | | 133,339 | |
Bankinter SA | | | 27,348 | | | | 218,335 | |
BNP Paribas SA | | | 43,168 | | | | 2,297,406 | |
CaixaBank SA | | | 143,349 | | | | 456,457 | |
Commerzbank AG (a) | | | 41,544 | | | | 373,327 | |
Credit Agricole SA | | | 45,467 | | | | 623,681 | |
Deutsche Bank AG | | | 81,691 | | | | 675,184 | |
Erste Group Bank AG | | | 11,448 | | | | 458,392 | |
Eurobank Ergasias SA (a) | | | 72,202 | | | | 60,332 | |
FinecoBank Banca Fineco SpA | | | 15,686 | | | | 206,459 | |
ING Groep NV - ADR (c) | | | 154,738 | | | | 1,974,457 | |
Intesa Sanpaolo SpA | | | 602,982 | | | | 1,580,530 | |
KBC Groep NV | | | 10,883 | | | | 805,868 | |
Mediobanca Banca di Credito Finanziario SpA | | | 26,064 | | | | 276,256 | |
National Bank of Greece SA (a) | | | 21,790 | | | | 47,755 | |
Natixis SA | | | 33,363 | | | | 196,381 | |
Nordea Bank Abp (a) | | | 126,820 | | | | 1,025,279 | |
Raiffeisen Bank International AG | | | 5,159 | | | | 137,542 | |
Societe Generale SA | | | 28,849 | | | | 913,119 | |
UniCredit SpA | | | 89,133 | | | | 1,232,654 | |
Unione di Banche Italiane SpA | | | 40,596 | | | | 126,581 | |
| | | | | | | | 19,942,652 | |
Beverages — 3.3% | | | | | | | | |
Anheuser-Busch InBev SA/NV - ADR (c) | | | 30,744 | | | | 2,734,371 | |
Davide Campari-Milano SpA | | | 22,622 | | | | 227,976 | |
Heineken Holding NV | | | 4,220 | | | | 428,589 | |
Heineken NV | | | 9,415 | | | | 1,016,285 | |
Pernod Ricard SA | | | 8,439 | | | | 1,470,422 | |
Remy Cointreau SA | | | 990 | | | | 131,914 | |
| | | | | | | | 6,009,557 | |
Building Materials — 1.0% | | | | | | | | |
Buzzi Unicem SpA | | | 2,768 | | | | 61,564 | |
Buzzi Unicem SpA - Savings Shares | | | 1,600 | | | | 24,370 | |
Cie de Saint-Gobain | | | 19,678 | | | | 804,265 | |
HeidelbergCement AG | | | 5,937 | | | | 479,445 | |
Imerys SA | | | 1,454 | | | | 77,431 | |
The accompanying notes are an integral part of the financial statements.
50
Pacer Trendpilot® European Index ETF
SCHEDULE OF INVESTMENTS
April 30, 2019 (Continued)
| | | Shares | | | Value | |
COMMON STOCKS — 96.3% (Continued) |
| | | | | | | | | |
Building Materials — 1.0% (Continued) | | | | |
Kingspan Group PLC (London) | | | 5,836 | | | $ | 306,469 | |
Kingspan Group PLC (Cboe BXE) | | | 129 | | | | 6,783 | |
Titan Cement Co SA | | | 1,622 | | | | 35,221 | |
| | | | | | | | 1,795,548 | |
Chemicals — 5.2% | | | | | | | | |
Air Liquide SA | | | 16,765 | | | | 2,229,178 | |
Arkema SA | | | 2,872 | | | | 294,615 | |
Akzo Nobel NV | | | 8,972 | | | | 761,772 | |
BASF SE - ADR | | | 146,063 | | | | 2,981,146 | |
Brenntag AG | | | 6,175 | | | | 332,859 | |
Covestro AG (b) | | | 5,646 | | | | 308,713 | |
Evonik Industries AG | | | 6,628 | | | | 197,447 | |
FUCHS PETROLUB SE | | | 1,341 | | | | 53,395 | |
K&S AG | | | 7,651 | | | | 155,152 | |
Koninklijke DSM NV | | | 6,995 | | | | 799,077 | |
LANXESS AG | | | 3,659 | | | | 211,353 | |
OCI NV (a) | | | 3,838 | | | | 111,277 | |
Solvay SA - Class A | | | 2,768 | | | | 332,658 | |
Symrise AG | | | 4,836 | | | | 464,844 | |
Umicore SA | | | 8,218 | | | | 317,998 | |
Wacker Chemie AG | | | 599 | | | | 52,430 | |
| | | | | | | | 9,603,914 | |
Commercial Services — 1.4% | | | | | | | | |
Adyen NV (a)(b) | | | 241 | | | | 196,134 | |
ALD SA (b) | | | 3,229 | | | | 47,444 | |
Atlantia SpA | | | 21,232 | | | | 579,154 | |
Bureau Veritas SA | | | 10,991 | | | | 278,356 | |
Edenred | | | 9,479 | | | | 446,637 | |
Elis SA | | | 7,562 | | | | 134,857 | |
Randstad Holding NV | | | 4,386 | | | | 250,494 | |
Wirecard AG | | | 4,563 | | | | 684,261 | |
| | | | | | | | 2,617,337 | |
Computers — 1.1% | | | | | | | | |
Atos SE | | | 3,685 | | | | 379,337 | |
Capgemini SE | | | 6,232 | | | | 755,601 | |
Gemalto NV (a) | | | 3,296 | | | | 188,722 | |
Ingenico Group SA | | | 2,481 | | | | 209,148 | |
Teleperformance | | | 2,283 | | | | 438,635 | |
| | | | | | | | 1,971,443 | |
Cosmetics/Personal Care — 3.7% | | | | | | | | |
Beiersdorf AG | | | 3,982 | | | | 435,189 | |
L’Oreal SA | | | 9,615 | | | | 2,643,214 | |
Unilever NV | | | 60,416 | | | | 3,656,483 | |
| | | | | | | | 6,734,886 | |
Distribution/Wholesale — 0.1% | | | | | | | | |
Rexel SA | | | 12,086 | | | | 162,397 | |
| | | | | | | | | |
| | | Shares | | | Value | |
Diversified Financial Services — 0.6% | | | | | | | | |
Amundi SA (b) | | | 2,264 | | | $ | 162,643 | |
Deutsche Boerse AG | | | 6,527 | | | | 870,432 | |
DWS Group GmbH & Co KGaA (a)(b) | | | 1,379 | | | | 50,670 | |
GRENKE AG | | | 1,050 | | | | 111,468 | |
| | | | | | | | 1,195,213 | |
Electric — 5.2% | | | | | | | | |
A2A SpA | | | 61,657 | | | | 103,041 | |
E.ON SE | | | 86,615 | | | | 929,510 | |
EDP - Energias de Portugal SA | | | 90,493 | | | | 342,959 | |
EDP Renovaveis SA | | | 6,066 | | | | 60,212 | |
Electricite de France SA | | | 19,848 | | | | 285,839 | |
Endesa SA | | | 12,652 | | | | 315,172 | |
Enel SpA | | | 310,497 | | | | 1,963,809 | |
Engie SA | | | 65,446 | | | | 969,307 | |
Fortum OYJ | | | 17,226 | | | | 364,003 | |
Hera SpA | | | 28,677 | | | | 102,089 | |
Iberdrola SA | | | 244,513 | | | | 2,220,851 | |
Innogy SE (b) | | | 5,106 | | | | 237,037 | |
Red Electrica Corp. SA | | | 17,222 | | | | 357,061 | |
RWE AG | | | 21,317 | | | | 544,413 | |
Terna Rete Elettrica Nazionale SpA | | | 56,354 | | | | 337,398 | |
Uniper SE | | | 7,804 | | | | 236,419 | |
Verbund AG (a) | | | 2,638 | | | | 130,838 | |
| | | | | | | | 9,499,958 | |
Electrical Components & Equipment — 1.6% | | | | |
Legrand SA | | | 10,629 | | | | 781,099 | |
OSRAM Licht AG | | | 3,523 | | | | 120,479 | |
Prysmian SpA | | | 10,458 | | | | 201,634 | |
Schneider Electric SE | | | 20,413 | | | | 1,727,680 | |
Signify NV (b) | | | 4,292 | | | | 128,676 | |
| | | | | | | | 2,959,568 | |
Energy-Alternate Sources — 0.1% | | | | | | | | |
Siemens Gamesa Renewable Energy SA | | | 8,942 | | | | 160,370 | |
| | | | | | | | | |
Engineering&Construction — 2.6% | | | | | | | | |
Acciona SA | | | 837 | | | | 96,976 | |
Ackermans & van Haaren NV | | | 886 | | | | 142,503 | |
ACS Actividades de Construccion y Servicios SA | | | 9,842 | | | | 451,819 | |
Aena SME SA (b) | | | 2,546 | | | | 472,174 | |
Aeroports de Paris | | | 1,130 | | | | 230,162 | |
Boskalis Westminster | | | 3,194 | | | | 87,375 | |
Bouygues SA | | | 8,152 | | | | 306,667 | |
Eiffage SA | | | 3,004 | | | | 313,682 | |
Ferrovial SA | | | 19,470 | | | | 479,555 | |
Fomento de Construcciones y Contratas SA (a) | | | 2,860 | | | | 35,029 | |
Fraport AG Frankfurt Airport Services Worldwide | | | 1,420 | | | | 117,603 | |
HOCHTIEF AG | | | 797 | | | | 118,891 | |
The accompanying notes are an integral part of the financial statements.
51
Pacer Trendpilot® European Index ETF
SCHEDULE OF INVESTMENTS
April 30, 2019 (Continued)
| | | Shares | | | Value | |
COMMON STOCKS — 96.3% (Continued) |
| | | | | | | | | |
Engineering&Construction — 2.6% (Continued) | | | | |
Mytilineos Holdings SA | | | 4,224 | | | $ | 45,789 | |
Vinci SA | | | 18,543 | | | | 1,872,228 | |
| | | | | | | | 4,770,453 | |
Entertainment — 0.0% | | | | | | | | |
OPAP SA | | | 8,511 | | | | 91,641 | |
| | | | | | | | | |
Food — 2.7% | | | | | | | | |
Carrefour SA | | | 22,281 | | | | 434,084 | |
Casino Guichard Perrachon SA | | | 2,188 | | | | 89,574 | |
Colruyt SA | | | 2,109 | | | | 152,005 | |
Danone SA - ADR | | | 119,065 | | | | 1,931,234 | |
Glanbia PLC (London) | | | 7,697 | | | | 141,840 | |
Glanbia PLC (Dublin) | | | 171 | | | | 3,144 | |
Jeronimo Martins SGPS SA | | | 9,731 | | | | 158,476 | |
Kerry Group PLC - Class A | | | 5,820 | | | | 651,468 | |
Kesko OYJ - Class B | | | 2,705 | | | | 140,471 | |
Koninklijke Ahold Delhaize NV | | | 43,301 | | | | 1,042,239 | |
METRO AG | | | 6,729 | | | | 113,964 | |
Suedzucker AG | | | 3,102 | | | | 47,665 | |
| | | | | | | | 4,906,164 | |
Food Service — 0.2% | | | | | | | | |
Sodexo SA | | | 3,451 | | | | 395,775 | |
| | | | | | | | | |
Forest Products&Paper — 0.5% | | | | | | | | |
Stora Enso OYJ - Class R | | | 22,362 | | | | 277,525 | |
UPM-Kymmene OYJ | | | 21,286 | | | | 599,488 | |
| | | | | | | | 877,013 | |
Gas — 0.7% | | | | | | | | |
Enagas SA | | | 9,053 | | | | 257,909 | |
Italgas SpA | | | 19,550 | | | | 121,916 | |
Naturgy Energy Group SA | | | 12,344 | | | | 350,557 | |
Rubis SCA | | | 3,396 | | | | 185,878 | |
Snam SpA | | | 90,543 | | | | 460,748 | |
| | | | | | | | 1,377,008 | |
Healthcare-Products — 2.0% | | | | | | | | |
Carl Zeiss Meditec AG | | | 1,463 | | | | 143,662 | |
DiaSorin SpA | | | 908 | | | | 88,704 | |
EssilorLuxottica SA | | | 11,568 | | | | 1,407,757 | |
Koninklijke Philips NV | | | 32,780 | | | | 1,395,828 | |
QIAGEN NV (a) | | | 8,749 | | | | 337,859 | |
Sartorius Stedim Biotech | | | 958 | | | | 130,014 | |
Siemens Healthineers AG (b) | | | 5,212 | | | | 222,257 | |
| | | | | | | | 3,726,081 | |
Healthcare-Services — 1.2% | | | | | | | | |
BioMerieux | | | 1,654 | | | | 131,251 | |
Eurofins Scientific SE | | | 446 | | | | 204,096 | |
Fresenius Medical Care AG & Co KGaA - ADR | | | 16,933 | | | | 714,234 | |
| | | Shares | | | Value | |
Healthcare-Services — 1.2% (Continued) | | | | |
Fresenius SE & Co. KGaA | | | 16,191 | | | $ | 918,527 | |
Orpea | | | 1,789 | | | | 218,112 | |
| | | | | | | | 2,186,220 | |
Home Furnishings — 0.2% | | | | | | | | |
Rational AG | | | 133 | | | | 89,802 | |
SEB SA | | | 1,082 | | | | 198,056 | |
| | | | | | | | 287,858 | |
Household Products/Wares — 0.3% | | | | | | | | |
Henkel AG & Co. KGaA | | | 4,046 | | | | 385,504 | |
Societe BIC SA | | | 1,023 | | | | 88,178 | |
| | | | | | | | 473,682 | |
Insurance — 6.7% | | | | | | | | |
Aegon NV | | | 69,973 | | | | 365,412 | |
Ageas | | | 7,477 | | | | 394,153 | |
Allianz SE | | | 16,849 | | | | 4,059,271 | |
ASR Nederland NV | | | 5,309 | | | | 235,802 | |
Assicurazioni Generali SpA | | | 51,750 | | | | 1,004,144 | |
AXA SA | | | 76,736 | | | | 2,043,671 | |
CNP Assurances | | | 6,340 | | | | 149,615 | |
Hannover Rueck SE | | | 2,396 | | | | 361,182 | |
Mapfre SA | | | 39,462 | | | | 118,398 | |
Muenchener Rueckversicherungs-Gesellschaft AG - Class R | | | 5,952 | | | | 1,488,701 | |
NN Group NV | | | 13,597 | | | | 592,023 | |
Poste Italiane SpA (b) | | | 18,429 | | | | 196,572 | |
Sampo OYJ - Class A | | | 19,575 | | | | 894,902 | |
SCOR SE | | | 6,254 | | | | 255,048 | |
Talanx AG | | | 1,515 | | | | 60,527 | |
UnipolSai Assicurazioni SpA | | | 23,126 | | | | 63,341 | |
Vienna Insurance Group AG Wiener Versicherung Gruppe | | | 1,534 | | | | 42,669 | |
| | | | | | | | 12,325,431 | |
Internet — 0.4% | | | | | | | | |
Delivery Hero SE (a)(b) | | | 4,351 | | | | 200,523 | |
Iliad SA | | | 959 | | | | 97,559 | |
Rocket Internet SE (a)(b) | | | 2,611 | | | | 68,820 | |
Scout24 AG (b) | | | 4,300 | | | | 221,371 | |
United Internet AG | | | 4,616 | | | | 184,986 | |
| | | | | | | | 773,259 | |
Investment Companies — 0.5% | | | | | | | | |
Corp. Financiera Alba SA | | | 811 | | | | 41,752 | |
EXOR NV | | | 4,263 | | | | 283,824 | |
Groupe Bruxelles Lambert SA | | | 2,916 | | | | 278,720 | |
Sofina SA | | | 609 | | | | 125,273 | |
Wendel SA | | | 1,131 | | | | 156,537 | |
| | | | | | | | 886,106 | |
Iron/Steel — 0.5% | | | | | | | | |
Acerinox SA | | | 6,895 | | | | 71,720 | |
ArcelorMittal | | | 24,118 | | | | 522,839 | |
ThyssenKrupp AG | | | 18,578 | | | | 261,194 | |
The accompanying notes are an integral part of the financial statements.
52
Pacer Trendpilot® European Index ETF
SCHEDULE OF INVESTMENTS
April 30, 2019 (Continued)
| | | Shares | | | Value | |
COMMON STOCKS — 96.3% (Continued) | | | | |
| | | | | |
Iron/Steel — 0.5% (Continued) | | | | |
Voestalpine AG | | | 4,524 | | | $ | 145,272 | |
| | | | | | | | 1,001,025 | |
Leisure Time — 0.1% | | | | | | | | |
Amer Sports Corp. (a)(c) | | | 4,130 | | | | 185,289 | |
| | | | | | | | | |
Lodging — 0.2% | | | | | | | | |
Accor SA | | | 8,059 | | | | 339,505 | |
| | | | | | | | | |
Machinery-Diversified — 1.1% | | | | | | | | |
ANDRITZ AG | | | 2,829 | | | | 134,853 | |
CNH Industrial NV | | | 39,652 | | | | 429,973 | |
GEA Group AG | | | 6,634 | | | | 185,423 | |
KION Group AG | | | 2,811 | | | | 192,449 | |
Kone OYJ - Class B | | | 15,548 | | | | 852,055 | |
Metso OYJ | | | 4,269 | | | | 159,014 | |
Zardoya Otis SA | | | 7,085 | | | | 57,215 | |
| | | | | | | | 2,010,982 | |
Media — 1.4% | | | | | | | | |
Axel Springer SE | | | 1,779 | | | | 100,764 | |
Bollore SA | | | 39,072 | | | | 185,636 | |
Lagardere SCA | | | 4,601 | | | | 125,194 | |
Mediaset SpA (a) | | | 12,328 | | | | 40,984 | |
ProSiebenSat.1 Media SE | | | 9,149 | | | | 144,021 | |
RTL Group SA | | | 1,528 | | | | 85,862 | |
Telenet Group Holding NV | | | 1,925 | | | | 102,168 | |
Vivendi SA | | | 38,288 | | | | 1,110,961 | |
Wolters Kluwer NV | | | 10,631 | | | | 741,420 | |
| | | | | | | | 2,637,010 | |
Metal Fabricate/Hardware — 0.1% | | | | | | | | |
Tenaris SA - ADR | | | 9,385 | | | | 260,340 | |
| | | | | | | | | |
Miscellaneous Manufacturing — 2.5% | | | | |
Aalberts Industries NV | | | 3,840 | | | | 150,744 | |
Alstom SA | | | 6,151 | | | | 270,440 | |
Knorr-Bremse AG (a) | | | 1,727 | | | | 187,212 | |
Siemens AG - ADR | | | 60,944 | | | | 3,656,640 | |
Wartsila OYJ Abp | | | 18,164 | | | | 289,702 | |
| | | | | | | | 4,554,738 | |
Oil&Gas — 5.1% | | | | | | | | |
Eni SpA | | | 99,914 | | | | 1,705,390 | |
Galp Energia SGPS SA | | | 20,544 | | | | 344,942 | |
Hellenic Petroleum SA | | | 2,318 | | | | 21,449 | |
Motor Oil Hellas Corinth Refineries SA | | | 2,234 | | | | 56,979 | |
Neste OYJ | | | 16,599 | | | | 548,100 | |
OMV AG | | | 5,660 | | | | 303,130 | |
Repsol SA | | | 48,535 | | | | 823,633 | |
| | | Shares | | | Value | |
Oil&Gas — 5.1% (Continued) | | | | | | | | |
TOTAL SA - ADR | | | 100,910 | | | $ | 5,617,683 | |
| | | | | | | | 9,421,306 | |
Oil&Gas Services — 0.3% | | | | | | | | |
Saipem SpA (a) | | | 22,464 | | | | 113,809 | |
TechnipFMC Plc | | | 18,300 | | | | 453,816 | |
| | | | | | | | 567,625 | |
Packaging&Containers — 0.1% | | | | | | | | |
Huhtamaki OYJ | | | 3,703 | | | | 141,254 | |
| | | | | | | | | |
Pharmaceuticals — 4.5% | | | | | | | | |
Bayer AG - ADR | | | 149,509 | | | | 2,510,256 | |
Galapagos NV (a) | | | 1,674 | | | | 191,605 | |
Grifols SA | | | 13,209 | | | | 366,530 | |
Ipsen SA | | | 1,369 | | | | 159,843 | |
Merck KGaA | | | 5,162 | | | | 549,329 | |
Orion OYJ - Class B | | | 4,067 | | | | 135,159 | |
Recordati SpA | | | 3,812 | | | | 153,877 | |
Sanofi - ADR | | | 86,205 | | | | 3,769,745 | |
UCB SA | | | 4,801 | | | | 380,815 | |
| | | | | | | | 8,217,159 | |
Pipelines — 0.1% | | | | | | | | |
Koninklijke Vopak NV | | | 2,644 | | | | 117,879 | |
| | | | | | | | | |
Private Equity — 0.1% | | | | | | | | |
Eurazeo SE | | | 1,903 | | | | 149,302 | |
| | | | | | | | | |
Real Estate — 1.2% | | | | | | | | |
Aroundtown SA | | | 26,595 | | | | 215,545 | |
Deutsche Wohnen SE | | | 14,175 | | | | 637,063 | |
LEG Immobilien AG | | | 2,524 | | | | 293,709 | |
Vonovia SE | | | 20,707 | | | | 1,032,818 | |
| | | | | | | | 2,179,135 | |
Retail — 1.1% | | | | | | | | |
FF Group (a)(d) | | | 1,259 | | | | 6,778 | |
Fielmann AG | | | 973 | | | | 69,081 | |
GrandVision NV (b) | | | 1,950 | | | | 43,874 | |
HUGO BOSS AG | | | 2,563 | | | | 178,690 | |
Industria de Diseno Textil SA | | | 41,940 | | | | 1,268,671 | |
JUMBO SA | | | 4,174 | | | | 75,841 | |
Salvatore Ferragamo SpA | | | 2,679 | | | | 60,636 | |
Zalando SE (a)(b) | | | 5,467 | | | | 257,168 | |
| | | | | | | | 1,960,739 | |
Semiconductors — 2.4% | | | | | | | | |
ASML Holding NV | | | 14,284 | | | | 2,972,536 | |
Infineon Technologies AG | | | 45,182 | | | | 1,065,470 | |
STMicroelectronics NV | | | 25,324 | | | | 465,107 | |
| | | | | | | | 4,503,113 | |
Software — 4.1% | | | | | | | | |
Amadeus IT Holding SA | | | 16,485 | | | | 1,311,286 | |
Dassault Systemes SE | | | 5,269 | | | | 833,568 | |
The accompanying notes are an integral part of the financial statements.
53
Pacer Trendpilot® European Index ETF
SCHEDULE OF INVESTMENTS
April 30, 2019 (Continued)
| | | Shares | | | Value | |
COMMON STOCKS — 96.3% (Continued) | | | | |
| | | | | |
Software — 4.1% (Continued) | | | | | | | | |
SAP SE - ADR | | | 38,333 | | | $ | 4,939,590 | |
Ubisoft Entertainment SA (a) | | | 3,393 | | | | 323,629 | |
Worldline SA/France (a)(b) | | | 1,586 | | | | 99,883 | |
| | | | | | | | 7,507,956 | |
Telecommunications — 4.5% | | | | | | | | |
1&1 Drillisch AG | | | 1,841 | | | | 68,636 | |
Cellnex Telecom SA (b) | | | 8,363 | | | | 257,199 | |
Deutsche Telekom AG | | | 128,941 | | | | 2,156,874 | |
Elisa OYJ | | | 5,710 | | | | 242,277 | |
Eutelsat Communications SA | | | 7,390 | | | | 133,364 | |
Hellenic Telecommunications Organization SA | | | 9,650 | | | | 133,995 | |
Koninklijke KPN NV | | | 132,075 | | | | 405,300 | |
Nokia OYJ - ADR | | | 221,332 | | | | 1,168,633 | |
Orange SA | | | 76,585 | | | | 1,199,567 | |
Proximus SADP | | | 5,585 | | | | 156,291 | |
SES SA | | | 14,012 | | | | 238,410 | |
Telecom Italia SpA (a) | | | 429,699 | | | | 240,301 | |
Telecom Italia SpA - Savings Shares | | | 240,913 | | | | 125,620 | |
Telefonica Deutschland Holding AG | | | 26,678 | | | | 86,655 | |
Telefonica SA - ADR | | | 180,118 | | | | 1,494,979 | |
Telekom Austria AG | | | 5,463 | | | | 40,931 | |
VEON Ltd. | | | 23,646 | | | | 56,491 | |
| | | | | | | | 8,205,523 | |
Transportation — 0.9% | | | | | | | | |
Deutsche Post AG | | | 38,782 | | | | 1,344,090 | |
Getlink SE | | | 18,050 | | | | 290,515 | |
Hapag-Lloyd AG (b) | | | 1,082 | | | | 33,313 | |
| | | | | | | | 1,667,918 | |
Water — 0.4% | | | | | | | | |
Suez | | | 14,613 | | | | 205,285 | |
Veolia Environnement SA | | | 19,882 | | | | 469,632 | |
| | | | | | | | 674,917 | |
TOTAL COMMON STOCKS (Cost $167,050,220) | | | | | | | 176,604,305 | |
| | | | | | | | | |
| | | Shares | | | Value | |
PREFERRED STOCKS — 1.8% | | | | | | | | |
| | | | | | | | | |
Auto Manufacturers — 1.0% | | | | | | | | |
Bayerische Motoren Werke AG | | | 2,203 | | | $ | 162,585 | |
Porsche Automobil Holding SE | | | 6,118 | | | | 424,345 | |
Volkswagen AG | | | 7,316 | | | | 1,272,205 | |
| | | | | | | | 1,859,135 | |
Chemicals — 0.1% | | | | | | | | |
FUCHS PETROLUB SE | | | 2,777 | | | | 120,788 | |
| | | | | | | | | |
Electric — 0.0% | | | | | | | | |
RWE AG | | | 1,558 | | | | 39,755 | |
| | | | | | | | | |
Electronics — 0.2% | | | | | | | | |
Sartorius AG | | | 1,366 | | | | 250,041 | |
| | | | | | | | | |
Household Products/Wares — 0.4% | | | | | | | | |
Henkel AG & Co. KGaA | | | 6,974 | | | | 705,863 | |
| | | | | | | | | |
Pharmaceuticals — 0.1% | | | | | | | | |
Grifols SA - Class B | | | 10,448 | | | | 201,324 | |
| | | | | | | | | |
TOTAL PREFERRED STOCKS
(Cost $3,036,780) | | | | | | | 3,176,906 | |
| | | | | | | | | |
REAL ESTATE INVESTMENT TRUSTS — 1.2% | | | | |
| | | | | | | | | |
Covivio | | | 1,764 | | | | 190,926 | |
Gecina SA | | | 2,086 | | | | 311,410 | |
ICADE | | | 1,280 | | | | 109,397 | |
Inmobiliaria Colonial Socimi SA | | | 12,113 | | | | 130,358 | |
Klepierre | | | 7,976 | | | | 283,317 | |
Merlin Properties Socimi SA | | | 13,319 | | | | 181,504 | |
Unibail-Rodamco-Westfield | | | 5,378 | | | | 924,402 | |
TOTAL REAL ESTATE INVESTMENT TRUSTS (Cost $2,045,183) | | | | | | | 2,131,314 | |
| | | | | | | | | |
The accompanying notes are an integral part of the financial statements.
54
Pacer Trendpilot® European Index ETF
SCHEDULE OF INVESTMENTS
April 30, 2019 (Continued)
| | | Shares | | | Value | |
SHORT-TERM INVESTMENTS — 0.4% | | | | |
| | | | | | | | | |
Money Market Deposit Accounts — 0.4% | | | | | | | | |
U.S. Bank Money Market Deposit Account 2.35% (e) | | | 768,968 | | | $ | 768,968 | |
TOTAL SHORT-TERM INVESTMENTS
(Cost $768,968) | | | | | | | 768,968 | |
| | | | | | | | | |
INVESTMENTS PURCHASED WITH PROCEEDS FROM SECURITIES LENDING — 3.1% | | | | | | | | |
Mount Vernon Liquid Assets Portfolio, LLC 2.61% (e) | | | 5,743,553 | | | | 5,743,553 | |
TOTAL INVESTMENTS PURCHASED WITH PROCEEDS FROM SECURITIES LENDING (Cost $5,743,553) | | | | | | | 5,743,553 | |
Total Investments
(Cost $178,644,704) — 102.8% | | | | | | | 188,425,046 | |
Liabilities in Excess of Other Assets — (2.8)% | | | | | | | (5,045,687 | ) |
TOTAL NET ASSETS — 100.0% | | | | | | $ | 183,379,359 | |
Percentages are stated as a percent of net assets.
ADR | American Depositary Receipt |
| | (a) | Non-income producing security. |
| | (b) | Security exempt from registration under Rule 144(a) of the Securities Act of 1933. Such securities are treated as liquid securities according to the Fund’s liquidity guidelines. The value of those securities total $3,719,077 or 2.03% of net assets. |
| | (c) | All or portion of this security is on loan as of April 30, 2019. The total value of securities on loan is $5,591,627 or 3.0% of net assets. |
| | (d) | As of April 30, 2019 the fund has fair valued this security. This security is deemed illiquid according to the Fund’s liquidity guidelines value determined using significant unobservable inputs. |
| | (e) | The rate shown is as of April 30, 2019 |
For Fund compliance purposes, the Fund’s industry classifications refer to any one or more of the industry sub-classifications used by one or more widely recognized market indexes or ratings group indexes, and/or they may be defined by Fund management. This definition does not apply for all purposes of this report, which may combine sub-classifications for reporting ease. Categories are shown as a percentage of net assets.
The accompanying notes are an integral part of the financial statements.
55
Pacer Global Cash Cows Dividend ETF
SCHEDULE OF INVESTMENTS
April 30, 2019
| | | Shares | | | Value | |
COMMON STOCKS — 97.6% | | | | |
| | | | | | | | | |
Australia — 7.4% | | | | |
AGL Energy Ltd. | | | 54,688 | | | $ | 857,018 | |
Alumina Ltd. | | | 423,314 | | | | 668,450 | |
Aurizon Holdings Ltd. | | | 166,992 | | | | 560,352 | |
BHP Billiton Ltd. - ADR (a) | | | 85,936 | | | | 4,550,311 | |
Caltex Australia Ltd. | | | 15,750 | | | | 302,112 | |
CIMIC Group Ltd. | | | 15,518 | | | | 553,425 | |
Mirvac Group | | | 241,655 | | | | 482,104 | |
South32 Ltd. | | | 319,248 | | | | 751,680 | |
STOCKLAND | | | 229,193 | | | | 609,118 | |
Telstra Corp. Ltd. | | | 811,645 | | | | 1,933,932 | |
Wesfarmers Ltd. | | | 114,555 | | | | 2,908,008 | |
Woodside Petroleum Ltd. | | | 55,846 | | | | 1,393,256 | |
| | | | | | | | 15,569,766 | |
Canada — 0.8% | | | | | | | | |
Canadian Natural Resources Ltd. (a) | | | 55,446 | | | | 1,662,271 | |
| | | | | | | | | |
Cayman Islands — 3.0% | | | | | | | | |
Chow Tai Fook Jewellery Group Ltd. | | | 1,166,791 | | | | 1,247,881 | |
Sands China Ltd. | | | 587,252 | | | | 3,226,413 | |
WH Group Ltd. (b) | | | 856,405 | | | | 1,015,267 | |
Wynn Macau Ltd. | | | 267,999 | | | | 768,659 | |
| | | | | | | | 6,258,220 | |
Finland — 0.7% | | | | | | | | |
Stora Enso OYJ - Class R | | | 38,649 | | | | 479,655 | |
UPM-Kymmene OYJ | | | 34,425 | | | | 969,528 | |
| | | | | | | | 1,449,183 | |
France — 4.8% | | | | | | | | |
Cie Generale des Etablissements Michelin | | | 9,306 | | | | 1,201,895 | |
Engie SA | | | 189,261 | | | | 2,803,104 | |
Publicis Groupe SA | | | 12,059 | | | | 715,225 | |
Renault SA | | | 22,519 | | | | 1,536,156 | |
Sanofi - ADR | | | 88,518 | | | | 3,870,892 | |
| | | | | | | | 10,127,272 | |
Germany — 7.2% | | | | | | | | |
BASF SE | | | 56,335 | | | | 4,580,323 | |
Bayer AG - ADR | | | 203,546 | | | | 3,417,537 | |
Continental AG | | | 9,075 | | | | 1,499,912 | |
Covestro AG (b) | | | 11,571 | | | | 632,682 | |
Evonik Industries AG | | | 29,985 | | | | 893,247 | |
Siemens AG | | | 34,996 | | | | 4,189,723 | |
| | | | | | | | 15,213,424 | |
Hong Kong — 2.2% | | | | | | | | |
CK Infrastructure Holdings Ltd. | | | 130,710 | | | | 1,061,369 | |
NWS Holdings Ltd. | | | 248,979 | | | | 517,331 | |
Power Assets Holdings Ltd. | | | 449,427 | | | | 3,133,752 | |
| | | | | | | | 4,712,452 | |
| | | Shares | | | Value | |
Israel — 0.1% | | | | | | | | |
Bezeq The Israeli Telecommunication Corp. Ltd. | | | 228,977 | | | $ | 156,557 | |
| | | | | | | | | |
Italy — 3.8% | | | | | | | | |
Atlantia SpA | | | 71,101 | | | | 1,939,452 | |
Eni SpA | | | 242,237 | | | | 4,134,640 | |
PRADA SpA | | | 216,717 | | | | 611,906 | |
Snam SpA | | | 251,243 | | | | 1,278,505 | |
| | | | | | | | 7,964,503 | |
Japan — 10.5% | | | | | | | | |
Bridgestone Corp. | | | 34,400 | | | | 1,360,621 | |
Canon, Inc. - ADR (a) | | | 71,536 | | | | 1,980,116 | |
ITOCHU Corp. | | | 74,587 | | | | 1,339,145 | |
Japan Tobacco, Inc. | | | 118,435 | | | | 2,738,799 | |
KDDI Corp. | | | 111,974 | | | | 2,553,705 | |
Mitsubishi Chemical Holdings Corp. | | | 78,720 | | | | 557,637 | |
Mitsui & Co. Ltd. | | | 105,510 | | | | 1,699,223 | |
NTT DOCOMO, Inc. | | | 169,989 | | | | 3,678,428 | |
Subaru Corp. | | | 56,828 | | | | 1,387,859 | |
Sumitomo Chemical Co. Ltd. | | | 82,760 | | | | 410,104 | |
Sumitomo Corp. | | | 68,724 | | | | 980,626 | |
Takeda Pharmaceutical Co Ltd. - ADR | | | 92,600 | | | | 1,692,728 | |
Tokyo Electron Ltd. | | | 11,154 | | | | 1,766,797 | |
| | | | | | | | 22,145,788 | |
Jersey — 0.7% | | | | | | | | |
WPP PLC - ADR (a) | | | 24,003 | | | | 1,495,387 | |
| | | | | | | | | |
Netherlands Antilles — 1.6% | | | | | | | | |
Schlumberger Ltd. | | | 81,009 | | | | 3,457,464 | |
| | | | | | | | | |
Norway — 1.1% | | | | | | | | |
Norsk Hydro ASA | | | 116,704 | | | | 499,960 | |
Telenor ASA | | | 93,607 | | | | 1,879,203 | |
| | | | | | | | 2,379,163 | |
Republic of Korea — 2.2% | | | | | | | | |
Lotte Chemical Corp. | | | 1,707 | | | | 392,355 | |
Samsung Electronics Co. Ltd. | | | 108,069 | | | | 4,241,719 | |
| | | | | | | | 4,634,074 | |
Singapore — 2.0% | | | | | | | | |
Genting Singapore Ltd. | | | 553,322 | | | | 400,722 | |
Keppel Corp. Ltd. | | | 91,607 | | | | 455,981 | |
Singapore Technologies Engineering Ltd. | | | 175,217 | | | | 510,153 | |
Singapore Telecommunications Ltd. | | | 1,202,379 | | | | 2,802,398 | |
| | | | | | | | 4,169,254 | |
South Korea — 0.3% | | | | | | | | |
KT&G Corp. | | | 6,184 | | | | 539,972 | |
| | | | | | | | | |
Spain — 2.6% | | | | | | | | |
Aena SME SA (b) | | | 7,118 | | | | 1,320,085 | |
The accompanying notes are an integral part of the financial statements.
56
Pacer Global Cash Cows Dividend ETF
SCHEDULE OF INVESTMENTS
April 30, 2019 (Continued)
| | | Shares | | | Value | |
COMMON STOCKS — 97.6% (Continued) |
| |
Spain — 2.6% (Continued) | | | | | | | | |
Repsol SA | | | 103,789 | | | $ | 1,761,286 | |
Telefonica SA - ADR | | | 281,851 | | | | 2,339,363 | |
| | | | | | | | 5,420,734 | |
Sweden — 0.6% | | | | | | | | |
Telia Co. AB | | | 317,448 | | | | 1,351,731 | |
| | | | | | | | | |
Switzerland — 1.1% | | | | | | | | |
ABB Ltd. - ADR (a) | | | 110,248 | | | | 2,277,724 | |
| | | | | | | | | |
United Kingdom — 16.1% | | | | | | | | |
Anglo American PLC | | | 81,295 | | | | 2,100,459 | |
BP PLC - ADR | | | 99,154 | | | | 4,336,025 | |
British American Tobacco PLC - ADR (a) | | | 114,132 | | | | 4,473,974 | |
BT Group PLC - ADR (a) | | | 153,320 | | | | 2,313,599 | |
GlaxoSmithKline PLC - ADR | | | 104,207 | | | | 4,286,034 | |
Imperial Brands PLC | | | 99,496 | | | | 3,160,539 | |
International Consolidated Airlines Group SA | | | 94,660 | | | | 667,053 | |
Rio Tinto PLC - ADR (a) | | | 83,859 | | | | 4,939,295 | |
Royal Dutch Shell PLC - ADR (a) | | | 63,124 | | | | 4,096,116 | |
Vodafone Group PLC - ADR | | | 186,433 | | | | 3,452,739 | |
| | | | | | | | 33,825,833 | |
United States — 28.8% | | | | | | | | |
AbbVie, Inc. | | | 44,244 | | | | 3,512,531 | |
Altria Group, Inc. (a) | | | 71,139 | | | | 3,864,982 | |
AT&T, Inc. (a) | | | 127,846 | | | | 3,958,112 | |
Chevron Corp. | | | 33,382 | | | | 4,007,843 | |
Eaton Corp. PLC | | | 19,402 | | | | 1,606,874 | |
Equinor ASA - ADR (a) | | | 162,511 | | | | 3,606,119 | |
Exxon Mobil Corp. (a) | | | 49,635 | | | | 3,984,698 | |
Ford Motor Co. | | | 347,720 | | | | 3,633,674 | |
General Mills, Inc. | | | 37,790 | | | | 1,945,051 | |
International Business Machines Corp. | | | 32,341 | | | | 4,536,472 | |
International Paper Co. | | | 20,805 | | | | 973,882 | |
Las Vegas Sands Corp. (a) | | | 55,101 | | | | 3,694,522 | |
LyondellBasell Industries NV - Class A | | | 22,252 | | | | 1,963,294 | |
Philip Morris International, Inc. | | | 45,583 | | | | 3,945,665 | |
QUALCOMM, Inc. (a) | | | 65,301 | | | | 5,624,375 | |
Southern Copper Corp. (a) | | | 36,424 | | | | 1,399,410 | |
Target Corp. (a) | | | 24,123 | | | | 1,867,603 | |
Valero Energy Corp. | | | 21,530 | | | | 1,951,910 | |
Verizon Communications, Inc. (a) | | | 66,822 | | | | 3,821,550 | |
Western Digital Corp. (a) | | | 16,494 | | | | 843,173 | |
| | | | | | | | 60,741,740 | |
TOTAL COMMON STOCKS (Cost $201,136,082) | | | | | | | 205,552,512 | |
| | | Shares | | | Value | |
REAL ESTATE INVESTMENT TRUSTS — 1.4% | | | | |
| | | | | |
Australia — 0.5% | | | | | | | | |
Dexus | | | 60,113 | | | $ | 529,708 | |
Vincinity Centres | | | 312,927 | | | | 560,319 | |
| | | | | | | | 1,090,027 | |
United States — 0.9% | | | | | | | | |
Public Storage (a) | | | 8,080 | | | | 1,787,135 | |
TOTAL REAL ESTATE INVESTMENT TRUSTS (Cost $2,765,961) | | | | | | | 2,877,162 | |
| | | | | | | | | |
SHORT-TERM INVESTMENTS — 0.5% | | | | |
| | | | | |
Money Market Deposit Accounts — 0.5% | | | | | | | | |
U.S. Bank Money Market Deposit Account, 2.35% (c) | | | 1,025,631 | | | | 1,025,631 | |
TOTAL SHORT-TERM INVESTMENTS
(Cost $1,025,631) | | | | | | | 1,025,631 | |
| | | | | | | | | |
INVESTMENTS PURCHASED WITH PROCEEDS FROM SECURITIES LENDING — 23.6% | | | | | | | | |
Mount Vernon Liquid Assets Portfolio, LLC 2.61% (c) | | | 49,602,558 | | | | 49,602,558 | |
TOTAL INVESTMENTS PURCHASED WITH PROCEEDS FROM SECURITIES LENDING (Cost $49,602,558) | | | | | | | 49,602,558 | |
Total Investments
(Cost $254,530,232) — 123.1% | | | | | | | 259,057,863 | |
Liabilities in Excess of Other Assets — (23.1)% | | | | | | | (48,553,002 | ) |
TOTAL NET ASSETS — 100.0% | | | | | | $ | 210,504,861 | |
Percentages are stated as a percent of net assets.
ADR | American Depositary Receipt |
| | (a) | All or portion of this security is on loan as of April 30, 2019. The total value of securities on loan is $48,500,145 or 23.0% of net assets. |
| | (b) | Security exempt from registration under Rule 144(b) of the Securities Act of 1933. Such securities are treated as liquid securities according to the Fund’s liquidity guidelines. The value of those securities total $2,968,034 or 1.41% of net assets. |
| | (c) | The rate shown is as of April 30, 2019. |
The accompanying notes are an integral part of the financial statements.
57
Pacer US Cash Cows 100 ETF
SCHEDULE OF INVESTMENTS
April 30, 2019
| | | Shares | | | Value | |
COMMON STOCKS — 99.6% | | | | |
| | | | | | | | | |
Advertising — 1.0% | | | | |
Omnicom Group, Inc. | | | 33,593 | | | $ | 2,688,448 | |
| | | | | | | | | |
Agriculture — 2.0% | | | | | | | | |
Altria Group, Inc. | | | 99,048 | | | | 5,381,278 | |
| | | | | | | | | |
Airlines — 1.8% | | | | | | | | |
Southwest Airlines Co. | | | 90,650 | | | | 4,915,949 | |
| | | | | | | | | |
Apparel — 1.0% | | | | | | | | |
Capri Holdings Ltd. (b) | | | 28,665 | | | | 1,263,553 | |
Tapestry, Inc. | | | 43,331 | | | | 1,398,292 | |
| | | | | | | | 2,661,845 | |
Auto Parts & Equipment — 1.1% | | | | | | | | |
Allison Transmission Holdings, Inc. | | | 25,292 | | | | 1,185,183 | |
Lear Corp. | | | 12,191 | | | | 1,743,313 | |
| | | | | | | | 2,928,496 | |
Beverages — 1.1% | | | | | | | | |
Molson Coors Brewing Co. - Class B (a) | | | 46,170 | | | | 2,963,652 | |
| | | | | | | | | |
Biotechnology — 7.3% | | | | | | | | |
Amgen, Inc. | | | 27,491 | | | | 4,929,686 | |
Biogen, Inc. (b) | | | 15,573 | | | | 3,569,955 | |
Celgene Corp. (b) | | | 60,779 | | | | 5,753,340 | |
Gilead Sciences, Inc. | | | 79,149 | | | | 5,147,851 | |
| | | | | | | | 19,400,832 | |
Chemicals — 5.2% | | | | | | | | |
Celanese Corp. - Class A | | | 20,049 | | | | 2,163,087 | |
CF Industries Holdings, Inc. | | | 43,332 | | | | 1,940,407 | |
Huntsman Corp. | | | 60,602 | | | | 1,347,789 | |
LyondellBasell Industries NV - Class A | | | 61,767 | | | | 5,449,702 | |
Olin Corp. | | | 35,286 | | | | 765,353 | |
The Chemours Co. (a) | | | 30,550 | | | | 1,100,105 | |
Westlake Chemical Corp. | | | 17,139 | | | | 1,195,445 | |
| | | | | | | | 13,961,888 | |
Commercial Services — 1.2% | | | | | | | | |
H&R Block, Inc. | | | 53,334 | | | | 1,451,218 | |
ManpowerGroup, Inc. | | | 8,361 | | | | 802,991 | |
Robert Half International, Inc. | | | 13,124 | | | | 814,869 | |
| | | | | | | | 3,069,078 | |
Computers — 10.8% | | | | | | | | |
Apple, Inc. | | | 30,019 | | | | 6,023,913 | |
Dell Technologies, Inc. (b) | | | 92,723 | | | | 6,250,457 | |
HP, Inc. | | | 268,063 | | | | 5,347,857 | |
International Business Machines Corp. | | | 37,329 | | | | 5,236,139 | |
NetApp, Inc. | | | 31,876 | | | | 2,322,167 | |
| | | Shares | | | Value | |
Computers — 10.8% (Continued) |
Western Digital Corp. (a) | | | 70,109 | | | $ | 3,583,972 | |
| | | | | | | | 28,764,505 | |
Distribution/Wholesale — 0.2% | | | | | | | | |
WESCO International, Inc. (b) | | | 8,044 | | | | 460,439 | |
| | | | | | | | | |
Diversified Financial Services — 1.5% | | | | | | | | |
Alliance Data Systems Corp. | | | 24,849 | | | | 3,978,325 | |
| | | | | | | | | |
Electronics — 0.3% | | | | | | | | |
Gentex Corp. (a) | | | 37,960 | | | | 874,219 | |
| | | | | | | | | |
Forest Products & Paper — 0.2% | | | | | | | | |
Domtar Corp. | | | 11,818 | | | | 577,900 | |
| | | | | | | | | |
Hand/Machine Tools — 0.6% | | | | | | | | |
Regal Beloit Corp. | | | 5,718 | | | | 486,487 | |
Snap-On, Inc. (a) | | | 7,155 | | | | 1,204,043 | |
| | | | | | | | 1,690,530 | |
Home Builders — 3.5% | | | | | | | | |
Lennar Corp. - Class A | | | 69,205 | | | | 3,600,736 | |
NVR, Inc. (a)(b) | | | 470 | | | | 1,481,665 | |
PulteGroup, Inc. | | | 87,824 | | | | 2,762,943 | |
Thor Industries, Inc. | | | 7,688 | | | | 506,408 | |
Toll Brothers, Inc. (a) | | | 27,336 | | | | 1,041,502 | |
| | | | | | | | 9,393,254 | |
Internet — 3.3% | | | | | | | | |
Booking Holdings, Inc. (b) | | | 3,051 | | | | 5,659,575 | |
F5 Networks, Inc. (b) | | | 7,109 | | | | 1,115,402 | |
Symantec Corp. (a) | | | 76,753 | | | | 1,858,190 | |
| | | | | | | | 8,633,167 | |
Iron/Steel — 1.5% | | | | | | | | |
Nucor Corp. | | | 39,471 | | | | 2,252,610 | |
Steel Dynamics, Inc. | | | 52,437 | | | | 1,661,204 | |
| | | | | | | | 3,913,814 | |
Leisure Time — 0.6% | | | | | | | | |
Harley-Davidson, Inc. | | | 44,236 | | | | 1,646,906 | |
| | | | | | | | | |
Lodging — 2.2% | | | | | | | | |
Las Vegas Sands Corp. | | | 86,496 | | | | 5,799,557 | |
| | | | | | | | | |
Machinery-Diversified — 1.5% | | | | | | | | |
Cummins, Inc. | | | 17,434 | | | | 2,899,100 | |
GrafTech International Ltd. | | | 91,185 | | | | 1,044,068 | |
| | | | | | | | 3,943,168 | |
Media — 2.8% | | | | | | | | |
AMC Networks, Inc. - Class A (a)(b) | | | 12,842 | | | | 750,101 | |
Discovery, Inc. - Class A (a)(b) | | | 116,771 | | | | 3,608,224 | |
Viacom, Inc. - Class B | | | 106,127 | | | | 3,068,132 | |
| | | | | | | | 7,426,457 | |
The accompanying notes are an integral part of the financial statements.
58
Pacer US Cash Cows 100 ETF
SCHEDULE OF INVESTMENTS
April 30, 2019 (Continued)
| | | Shares | | | Value | |
COMMON STOCKS — 99.6% (Continued) | | | | |
| | | | | | | | | |
Miscellaneous Manufacturing — 0.2% | | | | |
Crane Co. | | | 6,058 | | | $ | 515,233 | |
| | | | | | | | | |
Office/Business Equipment — 0.7% | | | | | | | | |
Xerox Corp. | | | 56,666 | | | | 1,890,378 | |
| | | | | | | | | |
Oil & Gas — 6.7% | | | | | | | | |
Chevron Corp. | | | 42,576 | | | | 5,111,674 | |
ConocoPhillips | | | 75,368 | | | | 4,757,228 | |
HollyFrontier Corp. | | | 40,347 | | | | 1,925,762 | |
PBF Energy, Inc. - Class A | | | 26,905 | | | | 903,470 | |
Phillips 66 | | | 53,894 | | | | 5,080,588 | |
| | | | | | | | 17,778,722 | |
Oil&Gas Services — 0.1% | | | | | | | | |
RPC, Inc. (a) | | | 23,036 | | | | 237,040 | |
| | | | | | | | | |
Packaging & Containers — 0.8% | | | | | | | | |
WestRock Co. | | | 56,332 | | | | 2,162,022 | |
| | | | | | | | | |
Pharmaceuticals — 8.1% | | | | | | | | |
AbbVie, Inc. | | | 64,856 | | | | 5,148,918 | |
Allergan PLC | | | 37,320 | | | | 5,486,040 | |
AmerisourceBergen Corp. | | | 31,303 | | | | 2,340,212 | |
Cardinal Health, Inc. | | | 54,498 | | | | 2,654,598 | |
Jazz Pharmaceuticals PLC (b) | | | 8,030 | | | | 1,042,053 | |
McKesson Corp. | | | 34,841 | | | | 4,154,789 | |
Premier, Inc. - Class A (b) | | | 18,968 | | | | 630,307 | |
| | | | | | | | 21,456,917 | |
Retail — 8.5% | | | | | | | | |
Best Buy Co., Inc. | | | 30,549 | | | | 2,273,151 | |
Dick’s Sporting Goods, Inc. | | | 24,177 | | | | 894,549 | |
Foot Locker, Inc. | | | 13,808 | | | | 789,956 | |
Kohl’s Corp. | | | 41,208 | | | | 2,929,889 | |
Macy’s, Inc. | | | 75,634 | | | | 1,780,424 | |
Nordstrom, Inc. | | | 29,632 | | | | 1,215,505 | |
Qurate Retail Group, Inc. QVC Group - Class A (b) | | | 104,267 | | | | 1,777,752 | |
Starbucks Corp. (a) | | | 73,744 | | | | 5,728,434 | |
Urban Outfitters, Inc. (b) | | | 15,899 | | | | 472,677 | |
Walgreens Boots Alliance, Inc. | | | 77,956 | | | | 4,176,103 | |
Williams-Sonoma, Inc. (a) | | | 11,022 | | | | 630,128 | |
| | | | | | | | 22,668,568 | |
Semiconductors — 15.7% | | | | | | | | |
Applied Materials, Inc. | | | 113,996 | | | | 5,023,804 | |
Broadcom, Inc. | | | 19,257 | | | | 6,131,429 | |
Cypress Semiconductor Corp. | | | 43,709 | | | | 750,921 | |
KLA-Tencor Corp. | | | 19,011 | | | | 2,423,522 | |
Lam Research Corp. | | | 27,236 | | | | 5,649,563 | |
| | | Shares | | | Value | |
Semiconductors — 15.7% (Continued) |
Micron Technology, Inc. (b) | | | 126,344 | | | $ | 5,314,029 | |
MKS Instruments, Inc. (a) | | | 7,071 | | | | 643,532 | |
NXP Semiconductors NV | | | 55,755 | | | | 5,888,843 | |
ON Semiconductor Corp. (b) | | | 59,175 | | | | 1,364,575 | |
Qorvo, Inc. (b) | | | 15,905 | | | | 1,202,577 | |
Skyworks Solutions, Inc. | | | 19,009 | | | | 1,676,214 | |
Texas Instruments, Inc. | | | 49,201 | | | | 5,797,354 | |
| | | | | | | | 41,866,363 | |
Software — 3.3% | | | | | | | | |
Citrix Systems, Inc. | | | 15,331 | | | | 1,547,818 | |
Nuance Communications, Inc. (a)(b) | | | 39,426 | | | | 663,539 | |
Oracle Corp. | | | 99,491 | | | | 5,504,837 | |
Take-Two Interactive Software, Inc. (b) | | | 10,687 | | | | 1,034,822 | |
| | | | | | | | 8,751,016 | |
Telecommunications — 4.6% | | | | | | | | |
Cisco Systems, Inc. | | | 102,188 | | | | 5,717,419 | |
CenturyLink, Inc. | | | 401,290 | | | | 4,582,732 | |
Juniper Networks, Inc. | | | 44,584 | | | | 1,238,098 | |
LogMeIn, Inc. | | | 7,017 | | | | 578,201 | |
| | | | | | | | 12,116,450 | |
Transportation — 0.2% | | | | | | | | |
Landstar System, Inc. (a) | | | 4,452 | | | | 485,090 | |
| | | | | | | | | |
TOTAL COMMON STOCKS (Cost $255,770,275) | | | 253,463,257 | | | | 265,001,506 | |
| | | | | | | | | |
REAL ESTATE INVESTMENT TRUSTS — 0.2% | | | | |
| | | | | | | | | |
Apple Hospitality REIT, Inc. (a) | | | 33,776 | | | | 555,615 | |
TOTAL REAL ESTATE INVESTMENT TRUSTS (Cost $557,986) | | | | | | | 555,615 | |
| | | | | | | | | |
The accompanying notes are an integral part of the financial statements.
59
Pacer US Cash Cows 100 ETF
SCHEDULE OF INVESTMENTS
April 30, 2019 (Continued)
| | | Shares | | | Value | |
SHORT-TERM INVESTMENTS — 0.2% | | | | |
| | | | | | | | | |
Money Market Funds — 0.2% | | | | | | | | |
U.S. Bank Money Market Deposit Account 2.35% (c) | | | 453,773 | | | $ | 453,773 | |
TOTAL SHORT-TERM INVESTMENTS
(Cost $453,773) | | | | | | | 453,773 | |
| | | | | | | | | |
INVESTMENTS PURCHASED WITH PROCEEDS FROM SECURITIES LENDING — 8.9% | | | | | | | | |
Mount Vernon Liquid Assets Portfolio, LLC 2.61% (c) | | | 23,710,020 | | | | 23,710,020 | |
TOTAL INVESTMENTS PURCHASED WITH PROCEEDS FROM SECURITIES LENDING (Cost $23,710,020) | | | | | | | 23,710,020 | |
Total Investments
(Cost $280,492,054) — 108.9% | | | | | | | 289,720,914 | |
Liabilities in Excess of Other Assets — (8.9)% | | | | | | | (23,702,797 | ) |
TOTAL NET ASSETS — 100.0% | | | | | | $ | 266,018,117 | |
Percentages are stated as a percent of net assets.
| | (a) | All or portion of this security is on loan as of April 30, 2019. The total value of securities on loan is $23,102,179 or 8.7% of net assets. |
| | (b) | Non-income producing security. |
| | (c) | The rate shown is as of April 30, 2019. |
For Fund compliance purposes, the Fund’s industry classifications refer to any one or more of the industry sub-classifications used by one or more widely recognized market indexes or ratings group indexes, and/or they may be defined by Fund management. This definition does not apply for all purposes of this report, which may combine sub-classifications for reporting ease. Categories are shown as a percentage of net assets.
The accompanying notes are an integral part of the financial statements.
60
Pacer US Small Cap Cash Cows 100 ETF
SCHEDULE OF INVESTMENTS
April 30, 2019
| | | Shares | | | Value | |
COMMON STOCKS — 99.8% | | | | |
| | | | | | | | | |
Aerospace/Defense — 3.8% | | | | |
Aerojet Rocketdyne Holdings, Inc. (a)(b) | | | 26,926 | | | $ | 911,714 | |
Kaman Corp. (a) | | | 9,689 | | | | 599,846 | |
National Presto Industries, Inc. (a) | | | 3,677 | | | | 391,601 | |
| | | | | | | | 1,903,161 | |
Auto Manufacturers — 0.7% | | | | | | | | |
Wabash National Corp. | | | 24,374 | | | | 367,560 | |
| | | | | | | | | |
Auto/Truck Parts&Equipment — 2.4% | | | | | | | | |
Garrett Motion, Inc. (b) | | | 64,419 | | | | 1,211,077 | |
| | | | | | | | | |
Biotechnology — 1.9% | | | | | | | | |
Innoviva, Inc. (a)(b) | | | 68,661 | | | | 963,314 | |
| | | | | | | | | |
Building Materials — 3.8% | | | | | | | | |
Apogee Enterprises, Inc. | | | 10,187 | | | | 410,536 | |
Boise Cascade Co. | | | 13,210 | | | | 365,785 | |
Gibraltar Industries, Inc. (b) | | | 9,251 | | | | 366,987 | |
Patrick Industries, Inc. (b) | | | 15,704 | | | | 783,159 | |
| | | | | | | | 1,926,467 | |
Chemicals — 1.4% | | | | | | | | |
Hawkins, Inc. | | | 3,620 | | | | 133,614 | |
Rayonier Advanced Materials, Inc. (a) | | | 38,749 | | | | 575,035 | |
| | | | | | | | 708,649 | |
Coal — 1.9% | | | | | | | | |
Consol Energy, Inc. (b) | | | 29,088 | | | | 986,083 | |
| | | | | | | | | |
Commercial Services — 10.7% | | | | | | | | |
American Public Education, Inc. (b) | | | 4,457 | | | | 142,624 | |
AMN Healthcare Services, Inc. (a)(b) | | | 17,640 | | | | 918,338 | |
Cardtronics PLC - Class A (b) | | | 33,259 | | | | 1,189,342 | |
FTI Consulting, Inc. (b) | | | 11,420 | | | | 970,472 | |
Heidrick & Struggles International, Inc. | | | 10,134 | | | | 362,594 | |
Korn/Ferry International | | | 19,014 | | | | 894,038 | |
LSC Communications, Inc. (a) | | | 58,336 | | | | 407,769 | |
TrueBlue, Inc. (b) | | | 21,476 | | | | 518,860 | |
| | | | | | | | 5,404,037 | |
Computers — 3.1% | | | | | | | | |
Insight Enterprises, Inc. (b) | | | 17,799 | | | | 1,007,067 | |
TTEC Holdings, Inc. | | | 15,606 | | | | 568,995 | |
| | | | | | | | 1,576,062 | |
Distribution/Wholesale — 3.2% | | | | | | | | |
Core-Mark Holding Co, Inc. | | | 21,025 | | | | 764,259 | |
Fossil Group, Inc. (a)(b) | | | 66,749 | | | | 872,409 | |
| | | | | | | | 1,636,668 | |
| | | Shares | | | Value | |
Diversified Financial Services — 2.1% | | | | | | | | |
WageWorks, Inc. (b) | | | 21,788 | | | $ | 1,063,036 | |
| | | | | | | | | |
Electronics — 2.0% | | | | | | | | |
Advanced Energy Industries, Inc. (b) | | | 11,940 | | | | 689,654 | |
Control4 Corp. (b) | | | 7,199 | | | | 125,335 | |
Smart Global Holdings, Inc. (a)(b) | | | 8,862 | | | | 192,660 | |
| | | | | | | | 1,007,649 | |
Energy-Alternate Sources — 4.2% | | | | | | | | |
FutureFuel Corp. | | | 18,959 | | | | 278,508 | |
Renewable Energy Group, Inc. (a)(b) | | | 42,437 | | | | 1,023,581 | |
REX American Resources Corp. (b) | | | 1,276 | | | | 107,835 | |
SolarEdge Technologies, Inc. (a)(b) | | | 16,326 | | | | 723,242 | |
| | | | | | | | 2,133,166 | |
Environmental Control — 2.1% | | | | | | | | |
Tetra Tech, Inc. | | | 16,248 | | | | 1,051,570 | |
| | | | | | | | | |
Food — 1.1% | | | | | | | | |
Cal-Maine Foods, Inc. | | | 13,158 | | | | 540,925 | |
| | | | | | | | | |
Forest Products & Paper — 2.2% | | | | | | | | |
Mercer International, Inc. | | | 47,304 | | | | 669,825 | |
Schweitzer-Mauduit International, Inc. | | | 12,660 | | | | 450,316 | |
| | | | | | | | 1,120,141 | |
Healthcare-Services — 2.2% | | | | | | | | |
Medpace Holdings, Inc. (b) | | | 11,512 | | | | 646,629 | |
Tivity Health, Inc. (a)(b) | | | 21,878 | | | | 473,002 | |
| | | | | | | | 1,119,631 | |
Home Builders — 2.3% | | | | | | | | |
Meritage Homes Corp. (b) | | | 22,387 | | | | 1,145,095 | |
| | | | | | | | | |
Home Furnishings — 0.4% | | | | | | | | |
Ethan Allen Interiors, Inc. | | | 9,037 | | | | 199,718 | |
| | | | | | | | | |
Household Products/Wares — 0.5% | | | | | | | | |
Quanex Building Products Corp. | | | 14,864 | | | | 248,526 | |
| | | | | | | | | |
Internet — 3.6% | | | | | | | | |
New Media Investment Group, Inc. | | | 34,377 | | | | 367,490 | |
Perficient, Inc. (b) | | | 9,766 | | | | 287,511 | |
QuinStreet, Inc. (a)(b) | | | 12,296 | | | | 175,464 | |
Stamps.com, Inc. (b) | | | 11,251 | | | | 965,336 | |
| | | | | | | | 1,795,801 | |
Iron/Steel — 1.7% | | | | | | | | |
AK Steel Holding Corp. (a)(b) | | | 350,657 | | | | 848,590 | |
| | | | | | | | | |
Leisure Time — 0.1% | | | | | | | | |
Nautilus, Inc. (b) | | | 7,696 | | | | 41,174 | |
| | | | | | | | | |
The accompanying notes are an integral part of the financial statements.
61
Pacer US Small Cap Cash Cows 100 ETF
SCHEDULE OF INVESTMENTS
April 30, 2019 (Continued)
| | | Shares | | | Value | |
COMMON STOCKS — 99.8% (Continued) |
| | | | | | | | | |
Machinery-Diversified — 0.5% | | | | | | | | |
Ichor Holdings Ltd. (a)(b) | | | 10,334 | | | $ | 260,210 | |
| | | | | | | | | |
Media — 0.7% | | | | | | | | |
Gannett Co., Inc. (a) | | | 37,451 | | | | 349,418 | |
| | | | | | | | | |
Miscellaneous Manufacturing — 7.2% | | | | | | | | |
EnPro Industries, Inc. | | | 10,288 | | | | 764,604 | |
Fabrinet (a)(b) | | | 11,544 | | | | 698,643 | |
Hillenbrand, Inc. | | | 22,733 | | | | 977,974 | |
Myers Industries, Inc. | | | 13,009 | | | | 232,731 | |
Sturm Ruger & Co, Inc. | | | 9,113 | | | | 510,237 | |
Tredegar Corp. | | | 24,315 | | | | 438,156 | |
| | | | | | | | 3,622,345 | |
Oil & Gas Services — 0.8% | | | | | | | | |
ERA Group, Inc. (b) | | | 18,737 | | | | 180,625 | |
Matrix Service Co. (b) | | | 10,261 | | | | 201,218 | |
| | | | | | | | 381,843 | |
Pharmaceuticals — 4.1% | | | | | | | | |
Anika Therapeutics, Inc. (b) | | | 4,206 | | | | 133,961 | |
Assertio Therapeutics, Inc. (a)(b) | | | 84,930 | | | | 354,158 | |
Corcept Therapeutics, Inc. (a)(b) | | | 40,670 | | | | 503,495 | |
Eagle Pharmaceuticals, Inc (b) | | | 4,671 | | | | 240,136 | |
Lannett Co, Inc. (a)(b) | | | 43,091 | | | | 331,370 | |
Supernus Pharmaceuticals, Inc. (a)(b) | | | 14,430 | | | | 530,014 | |
| | | | | | | | 2,093,134 | |
Retail — 19.8% | | | | | | | | |
Abercrombie & Fitch Co. - Class A (a) | | | 35,693 | | | | 1,066,864 | |
Barnes & Noble Education, Inc. (b) | | | 50,424 | | | | 216,823 | |
BJ’s Restaurants, Inc. | | | 6,435 | | | | 321,171 | |
Caleres, Inc. | | | 17,441 | | | | 457,477 | |
Chico’s FAS, Inc. | | | 113,435 | | | | 397,022 | |
Conn’s, Inc. (b) | | | 22,631 | | | | 585,464 | |
Designer Brands, Inc. (a) | | | 21,311 | | | | 474,170 | |
Express, Inc. (b) | | | 36,239 | | | | 133,359 | |
GameStop Corp. - Class A (a) | | | 69,244 | | | | 598,960 | |
Genesco, Inc. (a)(b) | | | 15,658 | | | | 701,635 | |
Haverty Furniture Cos, Inc. | | | 8,728 | | | | 207,901 | |
Hibbett Sports, Inc. (a)(b) | | | 14,747 | | | | 305,263 | |
MarineMax, Inc. (b) | | | 10,921 | | | | 188,824 | |
Movado Group, Inc. | | | 9,995 | | | | 356,322 | |
Office Depot, Inc. | | | 294,139 | | | | 705,934 | |
PetMed Express, Inc. (a) | | | 6,874 | | | | 150,197 | |
Red Robin Gourmet Burgers, Inc. (a)(b) | | | 11,731 | | | | 375,744 | |
Shoe Carnival, Inc. (a) | | | 7,651 | | | | 272,835 | |
Tailored Brands, Inc. | | | 82,525 | | | | 672,579 | |
The Buckle, Inc. (a) | | | 22,954 | | | | 424,190 | |
| | | Shares | | | Value | |
Retail — 19.8% (Continued) |
The Cato Corp. - Class A | | | 14,919 | | | $ | 226,172 | |
The Children’s Place, Inc. (a) | | | 4,374 | | | | 493,475 | |
Vera Bradley, Inc. (b) | | | 15,667 | | | | 192,391 | |
Vitamin Shoppe, Inc. (a)(b) | | | 38,350 | | | | 240,838 | |
Zumiez, Inc. (b) | | | 8,329 | | | | 221,801 | |
| | | | | | | | 9,987,411 | |
Semiconductors — 4.0% | | | | | | | | |
COHU, Inc. | | | 10,349 | | | | 153,476 | |
Kulicke & Soffa Industries, Inc. | | | 20,763 | | | | 483,155 | |
Nanometrics, Inc. (a)(b) | | | 14,134 | | | | 421,052 | |
Rambus, Inc. (b) | | | 32,773 | | | | 375,578 | |
Xperi Corp. | | | 23,378 | | | | 580,943 | |
| | | | | | | | 2,014,204 | |
Software — 2.1% | | | | | | | | |
Progress Software Corp. | | | 13,371 | | | | 609,851 | |
TIVO Corp. (a) | | | 58,551 | | | | 548,623 | |
| | | | | | | | 1,158,474 | |
Telecommunications — 0.9% | | | | | | | | |
Adtran, Inc. | | | 13,680 | | | | 234,475 | |
CalAmp Corp. (b) | | | 14,731 | | | | 215,220 | |
| | | | | | | | 449,695 | |
Transportation — 2.1% | | | | | | | | |
ArcBest Corp. (a) | | | 25,312 | | | | 773,535 | |
Echo Global Logistics, Inc. (b) | | | 12,787 | | | | 293,334 | |
| | | | | | | | 1,066,869 | |
TOTAL COMMON STOCKS (Cost $48,399,226) | | | | | | | 50,381,703 | |
| | | | | | | | | |
SHORT-TERM INVESTMENTS — 0.2% | | | | |
| | | | | | | | | |
Money Market Deposit Accounts — 0.2% | | | | | | | | |
U.S. Bank Money Market Deposit Account 2.35% (c) | | | 109,951 | | | | 109,951 | |
TOTAL SHORT-TERM INVESTMENTS (Cost $109,951) | | | | | | | 109,951 | |
| | | | | | | | | |
The accompanying notes are an integral part of the financial statements.
62
Pacer US Small Cap Cash Cows 100 ETF
SCHEDULE OF INVESTMENTS
April 30, 2019 (Continued)
| | | Shares | | | Value | |
INVESTMENTS PURCHASED WITH PROCEEDS FROM SECURITIES LENDING — 27.0% | | | | | | | | |
Mount Vernon Liquid Assets Portfolio, LLC 2.61% (c) | | | 13,614,390 | | | $ | 13,614,390 | |
TOTAL INVESTMENTS PURCHASED WITH PROCEEDS FROM SECURITIES LENDING (Cost $13,614,390) | | | | | | | | |
Total Investments
(Cost $62,123,567) — 127.0% | | | | | | | 64,106,044 | |
Liabilities in Excess of Other Assets — (27.0)% | | | | | | | (13,632,287 | ) |
TOTAL NET ASSETS — 100.0% | | | | | | $ | 50,473,757 | |
Percentages are stated as a percent of net assets.
| | (a) | All or portion of this security is on loan as of April 30, 2019. The total value of securities on loan is $13,069,315 or 25.9% of net assets. |
| | (b) | Non-income producing security. |
| | (c) | The rate shown is as of April 30, 2019. |
For Fund compliance purposes, the Fund’s industry classifications refer to any one or more of the industry sub-classifications used by one or more widely recognized market indexes or ratings group indexes, and/or they may be defined by Fund management. This definition does not apply for all purposes of this report, which may combine sub-classifications for reporting ease. Categories are shown as a percentage of net assets.
The accompanying notes are an integral part of the financial statements.
63
Pacer Developed Markets International Cash Cows 100 ETF
SCHEDULE OF INVESTMENTS
April 30, 2019
| | | Shares | | | Value | |
COMMON STOCKS — 98.9% | | | | |
| | | | | | | | | |
Australia — 8.2% | | | | |
AGL Energy Ltd. | | | 18,147 | | | $ | 284,382 | |
Alumina Ltd. | | | 63,745 | | | | 100,659 | |
BHP Billiton Ltd. - ADR - (a) | | | 13,891 | | | | 735,529 | |
BlueScope Steel Ltd. | | | 15,024 | | | | 142,451 | |
Coles Group Ltd. (b) | | | 29,632 | | | | 263,411 | |
Newcrest Mining Ltd. | | | 12,595 | | | | 222,060 | |
Qantas Airways Ltd. | | | 60,915 | | | | 240,905 | |
South32 Ltd. | | | 128,961 | | | | 303,643 | |
Wesfarmers Ltd. | | | 18,416 | | | | 467,495 | |
| | | | | | | | 2,760,535 | |
Britain — 1.8% | | | | | | | | |
Fiat Chrysler Automobiles NV | | | 39,251 | | | | 604,627 | |
| | | | | | | | | |
Canada — 5.9% | | | | | | | | |
Canadian Natural Resources Ltd. - (a) | | | 22,172 | | | | 664,716 | |
Imperial Oil Ltd. | | | 16,932 | | | | 492,383 | |
Magna International, Inc. | | | 9,159 | | | | 509,607 | |
Teck Resources Ltd. (a) | | | 13,229 | | | | 312,866 | |
| | | | | | | | 1,979,572 | |
Cayman Islands — 1.9% | | | | | | | | |
WH Group Ltd. (c) | | | 298,321 | | | | 353,659 | |
Wynn Macau Ltd. | | | 98,505 | | | | 282,526 | |
| | | | | | | | 636,185 | |
Denmark — 1.6% | | | | | | | | |
Carlsberg A/S | | | 3,021 | | | | 390,225 | |
Pandora A/S | | | 3,867 | | | | 162,202 | |
| | | | | | | | 552,427 | |
Finland — 1.5% | | | | | | | | |
Stora Enso OYJ - Class R | | | 15,114 | | | | 187,573 | |
UPM-Kymmene OYJ | | | 11,501 | | | | 323,908 | |
| | | | | | | | 511,481 | |
France — 6.4% | | | | | | | | |
Atos SE | | | 2,215 | | | | 228,014 | |
Casino Guichard Perrachon SA | | | 9,050 | | | | 370,494 | |
Faurecia | | | 3,055 | | | | 155,152 | |
Peugeot SA | | | 30,151 | | | | 789,977 | |
Publicis Groupe SA | | | 7,815 | | | | 463,511 | |
Ubisoft Entertainment SA (b) | | | 1,724 | | | | 164,437 | |
| | | | | | | | 2,171,585 | |
Germany — 4.8% | | | | | | | | |
Continental AG | | | 3,281 | | | | 542,283 | |
Covestro AG (c) | | | 10,161 | | | | 555,585 | |
Deutsche Lufthansa AG | | | 8,260 | | | | 199,371 | |
ProSiebenSat.1 Media SE | | | 20,357 | | | | 320,454 | |
| | | | | | | | 1,617,693 | |
Hong Kong — 1.5% | | | | | | | | |
Galaxy Entertainment Group Ltd. | | | 65,571 | | | | 490,228 | |
| | | | | | | | | |
| | | Shares | | | Value | |
Ireland — 0.3% | | | | | | | | |
Paddy Power Betfair PLC | | | 1,161 | | | $ | 98,225 | |
| | | | | | | | | |
Italy — 1.9% | | | | | | | | |
Eni SpA | | | 38,272 | | | | 653,248 | |
| | | | | | | | | |
Japan — 24.7% | | | | | | | | |
Advantest Corp. | | | 3,345 | | | | 94,289 | |
Astellas Pharma, Inc. | | | 37,460 | | | | 507,448 | |
Bridgestone Corp. | | | 10,862 | | | | 429,624 | |
Dentsu, Inc. | | | 5,098 | | | | 207,545 | |
Disco Corp. | | | 624 | | | | 106,880 | |
Fuji Electric Co Ltd. | | | 2,957 | | | | 104,190 | |
Fujifilm Holdings Corp. | | | 8,041 | | | | 374,205 | |
Japan Airlines Co Ltd. | | | 4,273 | | | | 143,041 | |
Kajima Corp. | | | 16,334 | | | | 241,209 | |
Mazda Motor Corp. | | | 16,315 | | | | 192,669 | |
Mitsubishi Chemical Holdings Corp. | | | 55,438 | | | | 392,712 | |
Mitsubishi Heavy Industries Ltd. | | | 9,866 | | | | 409,271 | |
Nexon Co. Ltd. (b) | | | 17,472 | | | | 250,328 | |
Nikon Corp. | | | 15,679 | | | | 218,165 | |
Nippon Telegraph & Telephone Corp. | | | 15,078 | | | | 624,804 | |
Nitto Denko Corp. | | | 2,492 | | | | 134,001 | |
NTT DOCOMO, Inc. | | | 26,858 | | | | 581,186 | |
Renesas Electronics Corp. (b) | | | 32,694 | | | | 174,043 | |
SMC Corp. | | | 837 | | | | 346,086 | |
Sojitz Corp. | | | 74,968 | | | | 257,756 | |
Sony Corp. - ADR (a) | | | 11,369 | | | | 572,656 | |
Square Enix Holdings Co. Ltd. | | | 1,583 | | | | 54,427 | |
Subaru Corp. . | | | 6,530 | | | | 159,476 | |
SUMCO Corp. | | | 5,629 | | | | 73,776 | |
Sumitomo Chemical Co. Ltd. | | | 57,049 | | | | 282,697 | |
Suzuki Motor Corp. | | | 8,158 | | | | 370,935 | |
Taisei Corp. | | | 9,538 | | | | 417,413 | |
Tokyo Electron Ltd. | | | 2,262 | | | | 358,301 | |
Tosoh Corp. | | | 11,710 | | | | 187,642 | |
Yamada Denki Co Ltd. . | | | 21,911 | | | | 103,659 | |
| | | | | | | | 8,370,434 | |
Jersey — 1.1% | | | | | | | | |
WPP PLC - ADR | | | 5,713 | | | | 355,920 | |
| | | | | | | | | |
Netherlands — 2.3% | | | | | | | | |
Koninklijke Ahold Delhaize NV | | | 24,483 | | | | 589,297 | |
Randstad Holding NV | | | 3,258 | | | | 186,071 | |
| | | | | | | | 775,368 | |
Norway — 2.5% | | | | | | | | |
Aker BP ASA | | | 9,084 | | | | 299,555 | |
Telenor ASA | | | 28,042 | | | | 562,956 | |
| | | | | | | | 862,511 | |
The accompanying notes are an integral part of the financial statements.
64
Pacer Developed Markets International Cash Cows 100 ETF
SCHEDULE OF INVESTMENTS
April 30, 2019 (Continued)
| | | Shares | | | Value | |
COMMON STOCKS — 98.9% (Continued) | | | | |
| | | | | | | | | |
Republic of Korea — 9.2% | | | | | | | | |
GS Engineering & Construction Corp. | | | 2,905 | | | $ | 100,966 | |
Hyundai Engineering & Construction Co. Ltd. | | | 3,065 | | | | 137,750 | |
Hyundai Mobis Co. Ltd. | | | 2,253 | | | | 448,421 | |
Kia Motors Corp. | | | 12,093 | | | | 468,440 | |
POSCO - ADR | | | 10,807 | | | | 596,222 | |
Samsung Electronics Co. Ltd. | | | 16,826 | | | | 660,422 | |
SK Hynix, Inc. | | | 10,314 | | | | 697,518 | |
| | | | | | | | 3,109,739 | |
Singapore — 1.4% | | | | | | | | |
Genting Sing Ltd. | | | 644,799 | | | | 466,971 | |
| | | | | | | | | |
South Korea — 0.5% | | | | | | | | |
KT&G Corp. | | | 2,058 | | | | 179,700 | |
| | | | | | | | | |
Spain — 0.9% | | | | | | | | |
Enagas SA | | | 10,927 | | | | 311,297 | |
| | | | | | | | | |
Sweden — 2.3% | | | | | | | | |
Boliden AB | | | 7,985 | | | | 237,100 | |
Sandvik AB | | | 19,495 | | | | 360,560 | |
SKF AB | | | 9,959 | | | | 184,297 | |
| | | | | | | | 781,957 | |
Switzerland — 0.8% | | | | | | | | |
Adecco Group AG | | | 3,243 | | | | 186,251 | |
Logitech International SA | | | 2,405 | | | | 94,033 | |
| | | | | | | | 280,284 | |
United Kingdom — 15.7% | | | | | | | | |
Anglo American PLC | | | 29,997 | | | | 775,047 | |
Antofagasta PLC | | | 19,474 | | | | 230,579 | |
Barratt Developments PLC | | | 28,795 | | | | 225,968 | |
Berkeley Group Holdings PLC | | | 5,102 | | | | 249,887 | |
Burberry Group PLC | | | 6,298 | | | | 165,648 | |
Imperial Brands PLC (a) | | | 21,430 | | | | 680,735 | |
International Consolidated Airlines Group SA | | | 54,580 | | | | 384,616 | |
ITV PLC | | | 83,724 | | | | 149,189 | |
J Sainsbury PLC | | | 55,293 | | | | 160,427 | |
Marks & Spencer Group PLC | | | 45,960 | | | | 171,346 | |
Pearson PLC | | | 18,177 | | | | 196,781 | |
Persimmon PLC | | | 10,167 | | | | 296,444 | |
Rio Tinto PLC - ADR (a) | | | 13,029 | | | | 767,408 | |
Royal Mail PLC | | | 26,104 | | | | 86,052 | |
Taylor Wimpey PLC | | | 104,913 | | | | 248,168 | |
Tesco PLC | | | 166,073 | | | | 540,966 | |
| | | | | | | | 5,329,261 | |
| | | Shares | | | Value | |
United States — 1.7% | | | | | | | | |
Thomson Reuters Corp. (a) | | | 9,358 | | | $ | 578,699 | |
| | | | | | | | | |
TOTAL COMMON STOCKS (Cost $33,857,618) | | | | | | | 33,477,947 | |
| | | | | | | | | |
SHORT-TERM INVESTMENTS — 0.5% | | | | |
| | | | | | | | | |
Money Market Deposit Accounts — 0.5% | | | | | | | | |
U.S. Bank Money Market Deposit Account 2.35% (d) | | | 159,911 | | | | 159,911 | |
TOTAL SHORT-TERM INVESTMENTS
(Cost $159,911) | | | | | | | 159,911 | |
| | | | | | | | | |
INVESTMENTS PURCHASED WITH PROCEEDS FROM SECURITIES LENDING — 9.2% | | | | | | | | |
Mount Vernon Liquid Assets Portfolio, LLC 2.61% (d) | | | 3,114,587 | | | | 3,114,587 | |
TOTAL INVESTMENTS PURCHASED WITH PROCEEDS FROM SECURITIES LENDING (Cost $3,114,587) | | | | | | | 3,114,587 | |
Total Investments
(Cost $37,132,116) — 108.6% | | | | | | | 36,752,445 | |
Liabilities in Excess of Other Assets — (8.6)% | | | | | | | (2,908,069 | ) |
TOTAL NET ASSETS — 100.0% | | | | | | $ | 33,844,376 | |
Percentages are stated as a percent of net assets.
ADR | American Depositary Receipt |
| | (a) | All or portion of this security is on loan as of April 30, 2019. The total value of securities on loan is $3,036,508 or 9.0% of net assets. |
| | (b) | Non-income producing security. |
| | (c) | Security exempt from registration under Rule 144(a) of the Securities Act of 1933. Such securities are treated as liquid securities according to the Fund’s liquidity guidelines. The value of those securities total $909,224 or 2.69% of net assets. |
| | (d) | The rate shown is as of April 30, 2019. |
The accompanying notes are an integral part of the financial statements.
65
Pacer WealthShield ETF
SCHEDULE OF INVESTMENTS
April 30, 2019
| | | Shares | | | Value | |
COMMON STOCKS — 81.0% | | | | |
| | | | | | | | | |
Agricultural — 2.9% | | | | |
Altria Group, Inc. | | | 23,139 | | | $ | 1,257,142 | |
Archer-Daniels-Midland Co. | | | 6,914 | | | | 308,364 | |
Philip Morris International, Inc. | | | 19,190 | | | | 1,661,086 | |
| | | | | | | | 3,226,592 | |
Beverages — 5.0% | | | | | | | | |
Brown-Forman Corp. - Class B (a) | | | 2,088 | | | | 111,269 | |
Coca-Cola Co. | | | 47,499 | | | | 2,330,301 | |
Constellation Brands, Inc. - Class A | | | 2,086 | | | | 441,544 | |
Molson Coors Brewing Co. - Class B | | | 2,352 | | | | 150,975 | |
Monster Beverage Corp. (b) | | | 4,827 | | | | 287,689 | |
PepsiCo, Inc. | | | 17,340 | | | | 2,220,387 | |
| | | | | | | | 5,542,165 | |
Commercial Services — 2.2% | | | | | | | | |
Automatic Data Processing, Inc. | | | 1,864 | | | | 306,423 | |
FleetCor Technologies, Inc. (b) | | | 367 | | | | 95,769 | |
Gartner, Inc. (b) | | | 384 | | | | 61,044 | |
Global Payments, Inc. (a) | | | 674 | | | | 98,451 | |
PayPal Holdings, Inc. (b) | | | 15,956 | | | | 1,799,358 | |
Total System Services, Inc. | | | 696 | | | | 71,159 | |
| | | | | | | | 2,432,204 | |
Computers — 5.1% | | | | | | | | |
Accenture PLC - Class A | | | 2,728 | | | | 498,324 | |
Apple, Inc. | | | 19,207 | | | | 3,854,269 | |
Cognizant Technology Solutions Corp. - Class A | | | 2,461 | | | | 179,555 | |
DXC Technology Co. | | | 1,148 | | | | 75,469 | |
Fortinet, Inc. (a)(b) | | | 621 | | | | 58,014 | |
Hewlett Packard Enterprise Co. (a) | | | 5,892 | | | | 93,152 | |
HP, Inc. | | | 6,562 | | | | 130,912 | |
International Business Machines Corp. | | | 3,808 | | | | 534,148 | |
NetApp, Inc. | | | 1,057 | | | | 77,002 | |
Seagate Technology PLC | | | 1,097 | | | | 53,007 | |
Western Digital Corp. | | | 1,244 | | | | 63,593 | |
| | | | | | | | 5,617,445 | |
Cosmetics/Personal Care — 4.2% | | | | | | | | |
Colgate-Palmolive Co. | | | 10,637 | | | | 774,267 | |
Coty, Inc. - Class A | | | 5,662 | | | | 61,263 | |
Estee Lauder Cos., Inc. - Class A | | | 2,694 | | | | 462,856 | |
Procter & Gamble Co. | | | 30,945 | | | | 3,295,024 | |
| | | | | | | | 4,593,410 | |
Diversified Financial Services — 3.1% | | | | | | | | |
Alliance Data Systems Corp. | | | 195 | | | | 31,219 | |
Blucora, Inc. (b) | | | 6,460 | | | | 226,100 | |
E*TRADE Financial Corp. | | | 9,536 | | | | 483,094 | |
MasterCard, Inc. - Class A | | | 3,774 | | | | 959,502 | |
TD Ameritrade Holding Corp. | | | 9,176 | | | | 482,474 | |
Visa, Inc. - Class A | | | 7,489 | | | | 1,231,416 | |
| | | Shares | | | Value | |
Diversified Financial Services — 3.1% (Continued) |
Western Union Co. | | | 1,865 | | | $ | 36,256 | |
| | | | | | | | 3,450,061 | |
Electric — 18.2% | | | | | | | | |
AES Corp. | | | 17,675 | | | | 302,596 | |
Alliant Energy Corp. | | | 6,300 | | | | 297,549 | |
Ameren Corp. | | | 6,529 | | | | 475,115 | |
American Electric Power Co., Inc. | | | 13,164 | | | | 1,126,180 | |
CenterPoint Energy, Inc. (a) | | | 13,375 | | | | 414,625 | |
CMS Energy Corp. | | | 7,563 | | | | 420,125 | |
Consolidated Edison, Inc. | | | 8,626 | | | | 743,216 | |
Dominion Energy, Inc. (a) | | | 21,421 | | | | 1,668,053 | |
DTE Energy Co. | | | 4,855 | | | | 610,322 | |
Duke Energy Corp. | | | 19,402 | | | | 1,767,910 | |
Edison International | | | 8,695 | | | | 554,480 | |
Entergy Corp. (a) | | | 5,015 | | | | 485,954 | |
Evergy, Inc. | | | 6,740 | | | | 389,707 | |
Eversource Energy | | | 8,459 | | | | 606,172 | |
Exelon Corp. | | | 25,879 | | | | 1,318,535 | |
FirstEnergy Corp. (a) | | | 13,452 | | | | 565,388 | |
NextEra Energy, Inc. | | | 12,761 | | | | 2,481,249 | |
NRG Energy, Inc. | | | 7,499 | | | | 308,734 | |
Pinnacle West Capital Corp. | | | 2,993 | | | | 285,143 | |
PPL Corp. | | | 19,239 | | | | 600,449 | |
Public Service Enterprise Group, Inc. | | | 13,489 | | | | 804,619 | |
Sempra Energy (a) | | | 7,313 | | | | 935,698 | |
Southern Co. | | | 27,609 | | | | 1,469,351 | |
WEC Energy Group, Inc. (a) | | | 8,418 | | | | 660,224 | |
Xcel Energy, Inc. | | | 13,723 | | | | 775,350 | |
| | | | | | | | 20,066,744 | |
Electronics — 0.3% | | | | | | | | |
Amphenol Corp. - Class A | | | 1,275 | | | | 126,939 | |
FLIR Systems, Inc. | | | 580 | | | | 30,705 | |
Keysight Technologies, Inc. (b) | | | 803 | | | | 69,885 | |
TE Connectivity Ltd. | | | 1,450 | | | | 138,693 | |
| | | | | | | | 366,222 | |
Food — 3.5% | | | | | | | | |
Campbell Soup Co. | | | 2,418 | | | | 93,552 | |
ConAgra Foods, Inc. | | | 6,101 | | | | 187,789 | |
General Mills, Inc. | | | 7,367 | | | | 379,180 | |
Hershey Co. | | | 1,763 | | | | 220,111 | |
Hormel Foods Corp. | | | 3,427 | | | | 136,875 | |
JM Smucker Co. | | | 1,432 | | | | 175,606 | |
Kellogg Co. | | | 3,186 | | | | 192,116 | |
Kroger Co. | | | 10,032 | | | | 258,625 | |
Lamb Weston Holdings, Inc. | | | 1,840 | | | | 128,892 | |
McCormick & Co., Inc. (a) | | | 1,532 | | | | 235,882 | |
Mondelez International, Inc. - Class A | | | 17,827 | | | | 906,503 | |
Sysco Corp. | | | 5,831 | | | | 410,327 | |
The Kraft Heinz Co. | | | 7,817 | | | | 259,837 | |
The accompanying notes are an integral part of the financial statements.
66
Pacer WealthShield ETF
SCHEDULE OF INVESTMENTS
April 30, 2019 (Continued)
| | | Shares | | | Value | |
COMMON STOCKS — 81.0% (Continued) | | | | |
| | | | | | | | | |
Food — 3.5% (Continued) | | | | | | | | |
Tyson Foods, Inc. - Class A | | | 3,711 | | | $ | 278,362 | |
| | | | | | | | 3,863,657 | |
Gas — 0.6% | | | | | | | | |
Atmos Energy Corp. | | | 3,119 | | | | 319,199 | |
NiSource, Inc. | | | 10,057 | | | | 279,383 | |
| | | | | | | | 598,582 | |
Household Products/Wares — 1.0% | | | | | | | | |
Church & Dwight Co., Inc. | | | 3,097 | | | | 232,120 | |
Clorox Co. | | | 1,607 | | | | 256,686 | |
Kimberly-Clark Corp. | | | 4,252 | | | | 545,872 | |
| | | | | | | | 1,034,678 | |
Internet — 12.3% | | | | | | | | |
Alphabet, Inc. - Class A (b) | | | 890 | | | | 1,067,075 | |
Alphabet, Inc. - Class C (b) | | | 914 | | | | 1,086,271 | |
Amazon.com, Inc. (b) | | | 1,245 | | | | 2,398,517 | |
Cogent Communications Holdings, Inc. | | | 4,390 | | | | 242,460 | |
eBay, Inc. | | | 19,131 | | | | 741,326 | |
Endurance International Group Holdings, Inc. (b) | | | 17,867 | | | | 98,805 | |
Etsy, Inc. (b) | | | 5,670 | | | | 382,952 | |
Expedia Group, Inc. | | | 4,045 | | | | 525,203 | |
F5 Networks, Inc. (b) | | | 254 | | | | 39,853 | |
Facebook, Inc. - Class A (b) | | | 9,798 | | | | 1,894,933 | |
GoDaddy, Inc. - Class A (b) | | | 6,395 | | | | 521,193 | |
Groupon, Inc. (b) | | | 53,716 | | | | 189,080 | |
GrubHub, Inc. (b) | | | 4,762 | | | | 318,054 | |
Netflix, Inc. (b) | | | 3,367 | | | | 1,247,608 | |
OKTA, Inc. (b) | | | 4,363 | | | | 453,883 | |
SNAP, Inc. (b) | | | 37,795 | | | | 421,036 | |
Symantec Corp. (a) | | | 2,735 | | | | 66,214 | |
TripAdvisor, Inc. (b) | | | 6,330 | | | | 336,946 | |
Twitter, Inc. (b) | | | 19,809 | | | | 790,577 | |
VeriSign, Inc. (b) | | | 3,633 | | | | 717,336 | |
| | | | | | | | 13,539,322 | |
Office/Business Equipment — 0.0% | | | | | | | | |
Xerox Corp. | | | 855 | | | | 28,523 | |
| | | | | | | | | |
Real Estate — 0.4% | | | | | | | | |
CBRE Group, Inc. - Class A (b) | | | 9,047 | | | | 471,077 | |
| | | | | | | | | |
Retail — 3.4% | | | | | | | | |
Costco Wholesale Corp. | | | 5,438 | | | | 1,335,192 | |
Walgreens Boots Alliance, Inc. | | | 9,899 | | | | 530,290 | |
Walmart, Inc. | | | 17,573 | | | | 1,807,207 | |
| | | | | | | | 3,672,689 | |
| | | Shares | | | Value | |
Semiconductors — 3.9% | | | | | | | | |
Advanced Micro Devices, Inc. (b) | | | 3,770 | | | $ | 104,165 | |
Analog Devices, Inc. | | | 1,576 | | | | 183,194 | |
Applied Materials, Inc. | | | 4,062 | | | | 179,012 | |
Broadcom, Inc. | | | 1,695 | | | | 539,688 | |
Intel Corp. | | | 19,242 | | | | 982,112 | |
IPG Photonics Corp. (b) | | | 152 | | | | 26,559 | |
KLA-Tencor Corp. | | | 707 | | | | 90,128 | |
Lam Research Corp. | | | 653 | | | | 135,452 | |
Maxim Integrated Products, Inc. | | | 1,170 | | | | 70,200 | |
Microchip Technology, Inc. | | | 1,014 | | | | 101,289 | |
Micron Technology, Inc. (b) | | | 4,797 | | | | 201,762 | |
NVIDIA Corp. | | | 2,593 | | | | 469,333 | |
Qorvo, Inc. (b) | | | 525 | | | | 39,695 | |
QUALCOMM, Inc. (a) | | | 5,179 | | | | 446,067 | |
Skyworks Solutions, Inc. | | | 745 | | | | 65,694 | |
Texas Instruments, Inc. | | | 4,016 | | | | 473,205 | |
Xilinx, Inc. | | | 1,083 | | | | 130,112 | |
| | | | | | | | 4,237,667 | |
Software — 11.4% | | | | | | | | |
2U, Inc. (b) | | | 4,181 | | | | 252,950 | |
Adobe Systems, Inc. (b) | | | 2,087 | | | | 603,665 | |
Akamai Technologies, Inc. (b) | | | 7,092 | | | | 567,785 | |
ANSYS, Inc. (b) | | | 358 | | | | 70,096 | |
Autodesk, Inc. (b) | | | 937 | | | | 166,983 | |
BOX, Inc. (b) | | | 12,819 | | | | 264,328 | |
Broadridge Financial Solutions, Inc. (a) | | | 495 | | | | 58,475 | |
Cadence Design System, Inc. (b) | | | 1,200 | | | | 83,256 | |
Citrix Systems, Inc. | | | 5,164 | | | | 521,357 | |
Cornerstone OnDemand, Inc. (b) | | | 4,613 | | | | 252,100 | |
DocuSign, Inc. (b) | | | 3,151 | | | | 178,567 | |
Dropbox, Inc. (b) | | | 9,537 | | | | 232,512 | |
Ebix, Inc. | | | 3,189 | | | | 160,981 | |
Fidelity National Information Services, Inc. | | | 1,382 | | | | 160,215 | |
Fiserv, Inc. (b) | | | 1,676 | | | | 146,214 | |
HubSpot, Inc. (a)(b) | | | 2,143 | | | | 395,362 | |
Intuit, Inc. | | | 1,109 | | | | 278,425 | |
j2 Global, Inc. | | | 3,340 | | | | 292,651 | |
Jack Henry & Associates, Inc. | | | 330 | | | | 49,190 | |
Microsoft Corp. | | | 32,896 | | | | 4,296,218 | |
New Relic, Inc. (b) | | | 3,012 | | | | 316,983 | |
Oracle Corp. | | | 10,903 | | | | 603,263 | |
Paychex, Inc. | | | 1,367 | | | | 115,252 | |
Red Hat, Inc. (b) | | | 756 | | | | 137,993 | |
Salesforce.com, Inc. (b) | | | 10,159 | | | | 1,679,791 | |
Synopsys, Inc. (b) | | | 640 | | | | 77,491 | |
Veeva Systems, Inc. - Class A (b) | | | 4,403 | | | | 615,848 | |
| | | | | | | | 12,577,951 | |
The accompanying notes are an integral part of the financial statements.
67
Pacer WealthShield ETF
SCHEDULE OF INVESTMENTS
April 30, 2019 (Continued)
| | | Shares | | | Value | |
COMMON STOCKS — 81.0% (Continued) |
| |
Telecommunications — 3.0% | | | | | | | | |
8x8, Inc. (b) | | | 10,798 | | | $ | 258,288 | |
Arista Networks, Inc. (b) | | | 2,050 | | | | 640,195 | |
Cisco Systems, Inc. | | | 18,835 | | | | 1,053,818 | |
Corning, Inc. | | | 3,366 | | | | 107,207 | |
Juniper Networks, Inc. | | | 17,055 | | | | 473,617 | |
LogMeIn, Inc. | | | 3,591 | | | | 295,898 | |
Motorola Solutions, Inc. | | | 701 | | | | 101,582 | |
NETGEAR, Inc. (b) | | | 4,647 | | | | 144,196 | |
Vonage Holdings Corp. (b) | | | 22,401 | | | | 217,738 | |
| | | | | | | | 3,292,539 | |
Water — 0.5% | | | | | | | | |
American Water Works Co., Inc. | | | 4,824 | | | | 521,909 | |
| | | | | | | | | |
TOTAL COMMON STOCKS (Cost $84,635,644) | | | | | | | 89,133,437 | |
| | | | | | | | | |
REAL ESTATE INVESTMENT TRUSTS — 18.8% | | | | |
| | | | | | | | | |
Alexandria Real Estate Equities, Inc. | | | 3,283 | | | | 467,466 | |
American Tower Corp. | | | 12,874 | | | | 2,514,292 | |
Apartment Investment & Management Co. | | | 4,540 | | | | 224,094 | |
AvalonBay Communities, Inc. | | | 4,034 | | | | 810,552 | |
Boston Properties, Inc. (a) | | | 4,500 | | | | 619,290 | |
Crown Castle International Corp. | | | 12,103 | | | | 1,522,315 | |
Digital Realty Trust, Inc. | | | 6,052 | | | | 712,381 | |
Duke Realty Corp. (a) | | | 10,462 | | | | 325,577 | |
Equinix, Inc. | | | 2,426 | | | | 1,103,102 | |
Equity Residential | | | 10,774 | | | | 823,349 | |
Essex Property Trust, Inc. | | | 1,913 | | | | 540,422 | |
Extra Space Storage, Inc. | | | 3,707 | | | | 384,379 | |
Federal Realty Investment Trust | | | 2,166 | | | | 289,919 | |
HCP, Inc. | | | 13,914 | | | | 414,359 | |
Host Hotels & Resorts, Inc. | | | 21,565 | | | | 414,911 | |
Iron Mountain, Inc. | | | 8,340 | | | | 270,883 | |
Kimco Realty Corp. | | | 12,272 | | | | 213,410 | |
Macerich Co. | | | 3,187 | | | | 127,926 | |
Mid-America Apartment Communities, Inc. | | | 3,317 | | | | 362,913 | |
Prologis, Inc. | | | 18,358 | | | | 1,407,508 | |
Public Storage | | | 4,370 | | | | 966,557 | |
Realty Income Corp. | | | 8,883 | | | | 621,899 | |
Regency Centers Corp. | | | 4,878 | | | | 327,655 | |
SBA Communications Corp. (b) | | | 3,279 | | | | 668,031 | |
Simon Property Group, Inc. | | | 8,998 | | | | 1,562,953 | |
SL Green Realty Corp. | | | 2,437 | | | | 215,285 | |
UDR, Inc. | | | 8,027 | | | | 360,814 | |
Ventas, Inc. | | | 10,373 | | | | 633,894 | |
Vornado Realty Trust | | | 5,050 | | | | 349,157 | |
| | | Shares | | | Value | |
Welltower, Inc. | | | 11,301 | | | $ | 842,263 | |
Weyerhaeuser Co. | | | 21,741 | | | | 582,659 | |
TOTAL REAL ESTATE INVESTMENT TRUSTS (Cost $19,936,661) | | | | | | | 20,680,215 | |
| | | | | | | | | |
SHORT-TERM INVESTMENTS — 0.2% | | | | |
| | | | | | | | | |
Money Market Funds — 0.2% | | | | | | | | |
U.S. Bank Money Market Deposit Account, 2.35% (c) | | | 242,111 | | | | 242,111 | |
TOTAL SHORT-TERM INVESTMENTS
(Cost $242,111) | | | | | | | 242,111 | |
| | | | | | | | | |
INVESTMENTS PURCHASED WITH PROCEEDS FROM SECURITIES LENDING — 4.9% | | | | | | | | |
Mount Vernon Liquid Assets Portfolio, LLC 2.61% (c) | | | 5,378,550 | | | | 5,378,550 | |
TOTAL INVESTMENTS PURCHASED WITH PROCEEDS FROM SECURITIES LENDING (Cost $5,378,550) | | | | | | | 5,378,550 | |
Total Investments
(Cost $110,192,966) — 104.9% | | | | | | | 115,434,313 | |
Liabilities in Excess of Other Assets — (4.9)% | | | | | | | (5,356,199 | ) |
TOTAL NET ASSETS — 100.0% | | | | | | $ | 110,078,114 | |
Percentages are stated as a percent of net assets.
| | (a) | All or portion of this security is on loan as of April 30, 2019. The total value of securities on loan is $5,344,012 or 4.9% of net assets. |
| | (b) | Non-income producing security. |
| | (c) | The rate shown is as of April 30, 2019 |
For Fund compliance purposes, the Fund’s industry classifications refer to any one or more of the industry sub-classifications used by one or more widely recognized market indexes or ratings group indexes, and/or they may be defined by Fund management. This definition does not apply for all purposes of this report, which may combine sub-classifications for reporting ease. Categories are shown as a percentage of net assets.
The accompanying notes are an integral part of the financial statements.
68
Pacer Military Times Best Employers ETF
SCHEDULE OF INVESTMENTS
April 30, 2019
| | | Shares | | | Value | |
COMMON STOCKS — 99.5% | | | | |
| | | | | | | | | |
Aerospace/Defense — 4.7% | | | | |
Boeing Co. | | | 177 | | | $ | 66,851 | |
Lockheed Martin Corp. | | | 204 | | | | 67,999 | |
| | | | | | | | 134,850 | |
Auto Manufacturers — 2.2% | | | | | | | | |
General Motors Co. | | | 1,618 | | | | 63,021 | |
| | | | | | | | | |
Banks — 9.1% | | | | | | | | |
Bank of America Corp. | | | 2,163 | | | | 66,144 | |
Citigroup, Inc. | | | 948 | | | | 67,024 | |
JPMorgan Chase & Co. | | | 586 | | | | 68,005 | |
US Bancorp | | | 1,153 | | | | 61,478 | |
| | | | | | | | 262,651 | |
Commercial Services — 5.1% | | | | | | | | |
Booz Allen Hamilton Holding Corp. | | | 1,219 | | | | 72,275 | |
United Rentals, Inc. (a) | | | 533 | | | | 75,110 | |
| | | | | | | | 147,385 | |
Computers — 11.8% | | | | | | | | |
Accenture PLC - Class A | | | 379 | | | | 69,232 | |
CACI International, Inc. - Class A (a) | | | 351 | | | | 68,424 | |
DXC Technology Co. | | | 971 | | | | 63,833 | |
Leidos Holdings, Inc. | | | 975 | | | | 71,643 | |
Perspecta, Inc. | | | 2,909 | | | | 67,140 | |
| | | | | | | | 340,272 | |
Diversified Financial Services — 4.4% | | | | | | | | |
Capital One Financial Corp. | | | 729 | | | | 67,673 | |
Charles Schwab Corp. | | | 1,271 | | | | 58,186 | |
| | | | | | | | 125,859 | |
Electric — 9.3% | | | | | | | | |
Dominion Energy, Inc. | | | 824 | | | | 64,165 | |
Exelon Corp. | | | 1,324 | | | | 67,458 | |
Southern Co. | | | 1,298 | | | | 69,079 | |
Xcel Energy, Inc. | | | 1,171 | | | | 66,162 | |
| | | | | | | | 266,864 | |
Environmental Control — 2.4% | | | | | | | | |
Waste Management, Inc. | | | 655 | | | | 70,308 | |
| | | | | | | | | |
Food — 2.0% | | | | | | | | |
Hormel Foods Corp. | | | 1,440 | | | | 57,514 | |
| | | | | | | | | |
Healthcare-Services — 3.9% | | | | | | | | |
DaVita, Inc. (a) | | | 1,048 | | | | 57,892 | |
Humana, Inc. | | | 210 | | | | 53,636 | |
| | | | | | | | 111,528 | |
Insurance — 9.6% | | | | | | | | |
Marsh & McLennan Cos., Inc. | | | 692 | | | | 65,249 | |
Progressive Corp. | | | 924 | | | | 72,211 | |
Prudential Financial, Inc. | | | 655 | | | | 69,240 | |
| | | Shares | | | Value | |
Insurance — 9.6% (Continued) |
Travelers Cos., Inc. | | | 474 | | | $ | 68,137 | |
| | | | | | | | 274,837 | |
Internet — 5.0% | | | | | | | | |
Amazon.com, Inc. (a) | | | 38 | | | | 73,208 | |
CDW Corp. | | | 663 | | | | 70,013 | |
| | | | | | | | 143,221 | |
Lodgings — 2.4% | | | | | | | | |
Hilton Worldwide Holdings, Inc. | | | 813 | | | | 70,723 | |
| | | | | | | | | |
Media — 2.4% | | | | | | | | |
Comcast Corp. - Class A | | | 1,574 | | | | 68,516 | |
| | | | | | | | | |
Miscellaneous Manufacturing — 4.5% | | | | | | | | |
Eaton Corp. PLC | | | 798 | | | | 66,090 | |
General Electric Co. | | | 6,152 | | | | 62,566 | |
| | | | | | | | 128,656 | |
Pharmaceuticals — 2.1% | | | | | | | | |
Merck & Co., Inc. | | | 774 | | | | 60,922 | |
| | | | | | | | | |
Retail — 4.7% | | | | | | | | |
Home Depot, Inc. | | | 341 | | | | 69,462 | |
Walmart, Inc. | | | 629 | | | | 64,686 | |
| | | | | | | | 134,148 | |
Software — 5.1% | | | | | | | | |
First Data Corp. - Class A (a) | | | 2,869 | | | | 74,192 | |
ManTech International Corp. VA - Class A | | | 1,151 | | | | 71,350 | |
| | | | | | | | 145,542 | |
Telecommunications — 4.2% | | | | | | | | |
AT&T, Inc. | | | 1,953 | | | | 60,465 | |
Verizon Communications, Inc. | | | 1,075 | | | | 61,479 | |
| | | | | | | | 121,944 | |
Transportation — 4.6% | | | | | | | | |
Union Pacific Corp. | | | 399 | | | | 70,639 | |
Werner Enterprises, Inc. | | | 1,814 | | | | 60,769 | |
| | | | | | | | 131,408 | |
TOTAL COMMON STOCKS (Cost $2,546,092) | | | | | | | 2,860,169 | |
| | | | | | | | | |
The accompanying notes are an integral part of the financial statements.
69
Pacer Military Times Best Employers ETF
SCHEDULE OF INVESTMENTS
April 30, 2019 (Continued)
| | | Shares | | | Value | |
SHORT-TERM INVESTMENTS — 0.4% | | | | |
| | | | | | | | | |
Money Market Deposit Accounts — 0.4% | | | | | | | | |
U.S. Bank Money Market Deposit Account 2.35% (b) | | | 10,796 | | | $ | 10,796 | |
TOTAL SHORT-TERM INVESTMENTS
(Cost $10,796) | | | | | | | 10,796 | |
Total Investments
(Cost $2,556,888) — 99.9% | | | | | | | 2,870,965 | |
Other Assets in Excess of Liabilities — 0.1% (b) | | | | | | | 1,592 | |
TOTAL NET ASSETS — 100.0% | | | | | | $ | 2,872,557 | |
Percentages are stated as a percent of net assets.
| | (a) | Non-income producing security. |
| | (b) | The rate shown is as of April 30, 2019. |
For Fund compliance purposes, the Fund’s industry classifications refer to any one or more of the industry sub-classifications used by one or more widely recognized market indexes or ratings group indexes, and/or they may be defined by Fund management. This definition does not apply for all purposes of this report, which may combine sub-classifications for reporting ease. Categories are shown as a percentage of net assets.
The accompanying notes are an integral part of the financial statements.
70
Pacer Benchmark Retail Real Estate SCTRSM ETF
SCHEDULE OF INVESTMENTS
April 30, 2019
| | | Shares | | | Value | |
REAL ESTATE INVESTMENT TRUSTS — 99.7% | | | | |
| | | | | | | | | |
Regional Malls — 27.0% | | | | |
Brookfield Property REIT,
Inc. - Class A | | | 1,584 | | | $ | 32,995 | |
CBL & Associates Properties, Inc. | | | 2,470 | | | | 2,495 | |
Macerich Co. | | | 1,288 | | | | 51,700 | |
Pennsylvania Real Estate Investment Trust | | | 829 | | | | 4,991 | |
Simon Property Group, Inc. | | | 1,123 | | | | 195,065 | |
Tanger Factory Outlet Centers, Inc. | | | 1,260 | | | | 22,756 | |
Taubman Centers, Inc. | | | 883 | | | | 43,532 | |
Washington Prime Group, Inc. | | | 2,639 | | | | 11,743 | |
Whitestone REIT | | | 509 | | | | 6,530 | |
| | | | | | | | 371,807 | |
Shopping Centers — 44.3% | | | | | | | | |
Acadia Realty Trust | | | 1,099 | | | | 31,036 | |
Alexander’s, Inc. | | | 55 | | | | 20,880 | |
Brixmor Property Group, Inc. | | | 3,851 | | | | 68,856 | |
Cedar Realty Trust, Inc. | | | 687 | | | | 2,109 | |
Federal Realty Investment Trust | | | 460 | | | | 61,571 | |
Kimco Realty Corp. | | | 3,951 | | | | 68,708 | |
Kite Realty Group Trust | | | 1,228 | | | | 19,390 | |
Regency Centers Corp. | | | 1,996 | | | | 134,071 | |
Retail Opportunity Investments Corp. | | | 1,420 | | | | 24,921 | |
Retail Properties of America, Inc. - Class A | | | 3,124 | | | | 38,394 | |
RPT Realty | | | 386 | | | | 4,682 | |
Saul Centers, Inc. | | | 226 | | | | 12,057 | |
Seritage Growth Properties - Class A | | | 340 | | | | 15,161 | |
Site Centers Corp. | | | 2,457 | | | | 32,531 | |
Urban Edge Properties | | | 817 | | | | 15,172 | |
Urstadt Biddle Properties, Inc. | | | 42 | | | | 722 | |
Urstadt Biddle Properties, Inc. - Class A | | | 336 | | | | 7,368 | |
Weingarten Realty Investors | | | 1,863 | | | | 53,915 | |
| | | | | | | | 611,544 | |
Single Tenant — 28.4% | | | | | | | | |
Agree Realty Corp. | | | 508 | | | | 33,259 | |
Essential Properties Realty TR, Inc. | | | 511 | | | | 10,567 | |
Getty Realty Corp. | | | 420 | | | | 13,621 | |
National Retail Properties, Inc. | | | 1,268 | | | | 66,722 | |
Realty Income Corp. | | | 3,296 | | | | 230,753 | |
Spirit Reality Capital, Inc. | | | 916 | | | | 37,061 | |
| | | | | | | | 391,983 | |
TOTAL REAL ESTATE INVESTMENT TRUSTS (Cost $1,314,954) | | | | | | | 1,375,334 | |
| | | | | | | | | |
| | | Shares | | | Value | |
SHORT-TERM INVESTMENTS — 0.2% | | | | |
| | | | | | | | | |
Money Market Deposit Accounts — 0.2% | | | | | | | | |
U.S. Bank Money Market Deposit Account 2.35% (a) | | | 2,259 | | | $ | 2,259 | |
TOTAL SHORT-TERM INVESTMENTS
(Cost $2,259) | | | | | | | 2,259 | |
Total Investments
(Cost $1,317,213) — 99.9% | | | | | | | 1,377,593 | |
Other Assets in Excess of Liabilities — 0.1% | | | | | | | 968 | |
TOTAL NET ASSETS — 100.0% | | | | | | $ | 1,378,561 | |
Percentages are stated as a percent of net assets.
| | (a) | The rate shown is as of April 30, 2019. |
For Fund compliance purposes, the Fund’s industry classifications refer to any one or more of the industry sub-classifications used by one or more widely recognized market indexes or ratings group indexes, and/or they may be defined by Fund management. This definition does not apply for all purposes of this report, which may combine sub-classifications for reporting ease. Categories are shown as a percentage of net assets.
The accompanying notes are an integral part of the financial statements.
71
Pacer Benchmark Industrial Real Estate SCTRSM ETF
SCHEDULE OF INVESTMENTS
April 30, 2019
| | | Shares | | | Value | |
REAL ESTATE INVESTMENT TRUSTS — 99.7% | | | | |
| | | | | | | | | |
Diversified — 32.9% | | | | |
Duke Realty Corp. | | | 35,247 | | | $ | 1,096,886 | |
Innovative Industrial Properties, Inc. (a) | | | 4,902 | | | | 417,356 | |
Lexington Realty Trust | | | 33,770 | | | | 306,294 | |
One Liberty Properties, Inc. | | | 9,625 | | | | 272,388 | |
PS Business Parks, Inc. | | | 2,118 | | | | 325,367 | |
| | | | | | | | 2,418,291 | |
Storage — 4.0% | | | | | | | | |
Life Storage, Inc. | | | 3,092 | | | | 294,637 | |
| | | | | | | | | |
Warehouse/Industrial — 62.8% | | | | | | | | |
Americold Realty Trust | | | 11,037 | | | | 353,294 | |
EastGroup Properties, Inc. | | | 2,972 | | | | 339,789 | |
First Industrial Realty Trust, Inc. | | | 9,285 | | | | 327,482 | |
Industrial Logistics Properties Trust | | | 11,006 | | | | 218,469 | |
Liberty Property Trust | | | 18,981 | | | | 942,217 | |
Monmouth Real Estate Investment Corp. | | | 21,632 | | | | 297,224 | |
Prologis, Inc. | | | 14,795 | | | | 1,134,333 | |
Rexford Industrial Realty, Inc. | | | 9,127 | | | | 345,822 | |
STAG Industrial, Inc. Class A (a) | | | 11,156 | | | | 321,070 | |
Terreno Realty Corp. | | | 7,624 | | | | 340,411 | |
| | | | | | | | 4,620,111 | |
TOTAL REAL ESTATE INVESTMENT TRUSTS (Cost $7,022,554) | | | | | | | 7,333,039 | |
| | | | | | | | | |
| | | Shares | | | Value | |
SHORT-TERM INVESTMENTS — 0.3% | | | | |
| | | | | | | | | |
Money Market Deposit Accounts — 0.3% | | | | | | | | |
U.S. Bank Money Market Deposit Account 2.35% (b) | | | 19,917 | | | $ | 19,917 | |
TOTAL SHORT-TERM INVESTMENTS
(Cost $19,917) | | | | | | | 19,917 | |
| | | | | | | | | |
INVESTMENTS PURCHASED WITH PROCEEDS FROM SECURITIES LENDING — 5.8% | | | | | | | | |
Mount Vernon Liquid Assets Portfolio, LLC 2.61% (b) | | | 429,600 | | | | 429,600 | |
TOTAL INVESTMENTS PURCHASED WITH PROCEEDS FROM SECURITIES LENDING (Cost $429,600) | | | | | | | | |
Total Investments
(Cost $7,472,071) — 105.8% | | | | | | | 7,782,556 | |
Liabilities in Excess of Other Assets — (5.8)% | | | | | | | (426,850 | ) |
TOTAL NET ASSETS — 100.0% | | | | | | $ | 7,355,706 | |
Percentages are stated as a percent of net assets.
| | (a) | All or portion of this security is on loan as of April 30, 2019. The total value of securities on loan is $412,126 or 5.6% of net assets. |
| | (b) | The rate shown is as of April 30, 2019. |
For Fund compliance purposes, the Fund’s industry classifications refer to any one or more of the industry sub-classifications used by one or more widely recognized market indexes or ratings group indexes, and/or they may be defined by Fund management. This definition does not apply for all purposes of this report, which may combine sub-classifications for reporting ease. Categories are shown as a percentage of net assets.
The accompanying notes are an integral part of the financial statements.
72
Pacer Benchmark Data & Infrastructure Real Estate SCTRSM ETF
SCHEDULE OF INVESTMENTS
April 30, 2019
| | | Shares | | | Value | |
COMMON STOCKS — 17.7% | | | | |
| | | | | | | | | |
Computer Software — 4.7% | | | | |
InterXion Holding NV (a) | | | 15,352 | | | $ | 1,062,205 | |
| | | | | | | | | |
Internet Connective Services — 0.3% | | | | | | | | |
Internap Corp. (a) | | | 18,987 | | | | 74,809 | |
| | | | | | | | | |
Real Estate Operations/Development — 1.2% | | | | | | | | |
Landmark Infrastructure Partners LP | | | 16,081 | | | | 261,638 | |
| | | | | | | | | |
Telecom Services — 6.2% | | | | | | | | |
GDS Holdings Ltd. - ADR (a)(b) | | | 26,214 | | | | 1,025,754 | |
Switch, Inc. - Class A | | | 35,473 | | | | 385,591 | |
| | | | | | | | 1,411,345 | |
Telephone-Integrated — 5.3% | | | | | | | | |
Zayo Group Holdings, Inc. (a) | | | 38,791 | | | | 1,213,770 | |
| | | | | | | | | |
TOTAL COMMON STOCKS (Cost $3,603,329) | | | | | | | 4,023,767 | |
| | | | | | | | | |
REAL ESTATE INVESTMENT TRUSTS — 82.1% | | | | |
| | | | | | | | | |
Diversified — 68.6% | | | | | | | | |
American Tower Corp. | | | 15,370 | | | | 3,001,761 | |
CoreSite Realty Corp. | | | 9,073 | | | | 992,677 | |
Crown Castle International Corp. | | | 23,142 | | | | 2,910,801 | |
Digital Realty Trust, Inc. | | | 8,742 | | | | 1,029,021 | |
Equinix, Inc. | | | 7,455 | | | | 3,389,788 | |
Lamar Advertising Co. - Class A | | | 12,991 | | | | 1,073,966 | |
Outfront Media, Inc. | | | 46,235 | | | | 1,101,780 | |
SBA Communications Corp. (a) | | | 5,466 | | | | 1,113,588 | |
Uniti Group, Inc. | | | 87,314 | | | | 959,581 | |
| | | | | | | | 15,572,963 | |
Storage — 4.1% | | | | | | | | |
Iron Mountain, Inc. | | | 28,382 | | | | 921,847 | |
| | | | | | | | | |
Warehouse/Industrial — 9.4% | | | | | | | | |
CyrusOne, Inc. | | | 18,811 | | | | 1,047,585 | |
QTS Realty Trust, Inc. - Class A | | | 24,094 | | | | 1,092,663 | |
TOTAL REAL ESTATE INVESTMENT TRUSTS (Cost $17,729,986) | | | | | | | 18,635,058 | |
| | | | | | | | | |
| | | Shares | | | Value | |
SHORT-TERM INVESTMENTS — 0.2% | | | | |
| | | | | | | | | |
Money Market Deposit Accounts — 0.2% | | | | | | | | |
U.S. Bank Money Market Deposit Account, 2.35% (c) | | | 36,177 | | | $ | 36,177 | |
TOTAL SHORT-TERM INVESTMENTS (Cost $36,177) | | | | | | | 36,177 | |
| | | | | | | | | |
INVESTMENTS PURCHASED WITH PROCEEDS FROM SECURITIES LENDING — 4.4% | | | | | | | | |
Mount Vernon Liquid Assets Portfolio, LLC 2.61% (c) | | | 996,120 | | | | 996,120 | |
TOTAL INVESTMENTS PURCHASED WITH PROCEEDS FROM SECURITY LENDING (Cost $996,120) | | | | | | | 996,120 | |
Total Investments
(Cost $22,365,612) — 104.4% | | | | | | | 23,691,122 | |
Liabilities in Excess of Other Assets — (4.4)% | | | | | | | (999,735 | ) |
TOTAL NET ASSETS — 100.0% | | | | | | $ | 22,691,387 | |
Percentages are stated as a percent of net assets.
ADR | American Depositary Receipt |
| | (a) | Non-income producing security. |
| | (b) | All or portion of this security is on loan as of April 30, 2019. The total value of securities on loan is $974,454 or 4.3% of net assets. |
| | (c) | The rate shown is as of April 30, 2019. |
For Fund compliance purposes, the Fund’s industry classifications refer to any one or more of the industry sub-classifications used by one or more widely recognized market indexes or ratings group indexes, and/or they may be defined by Fund management. This definition does not apply for all purposes of this report, which may combine sub-classifications for reporting ease. Categories are shown as a percentage of net assets.
The accompanying notes are an integral part of the financial statements.
73
Pacer US Export Leaders ETF
SCHEDULE OF INVESTMENTS
April 30, 2019
| | | Shares | | | Value | |
COMMON STOCKS — 99.9% | | | | |
| | | | | | | | | |
Aerospace/Defense — 0.8% | | | | |
Boeing Co. | | | 28 | | | $ | 10,575 | |
| | | | | | | | | |
Apparel — 2.9% | | | | | | | | |
NIKE, Inc. - Class B | | | 142 | | | | 12,472 | |
PVH Corp. | | | 109 | | | | 14,060 | |
Skechers U.S.A, Inc. - Class A (a) | | | 371 | | | | 11,746 | |
| | | | | | | | 38,278 | |
Auto Parts & Equipment — 2.8% | | | | | | | | |
BorgWarner, Inc. | | | 316 | | | | 13,199 | |
Goodyear Tire & Rubber Co. | | | 683 | | | | 13,120 | |
Visteon Corp. (a) | | | 154 | | | | 10,167 | |
| | | | | | | | 36,486 | |
Biotechnology — 1.7% | | | | | | | | |
Bio-Rad Laboratories, Inc. - Class A (a) | | | 40 | | | | 12,037 | |
Regeneron Pharmaceuticals, Inc. (a) | | | 30 | | | | 10,294 | |
| | | | | | | | 22,331 | |
Building Materials — 1.0% | | | | | | | | |
Johnson Controls International PLC | | | 335 | | | | 12,562 | |
| | | | | | | | | |
Chemicals — 4.9% | | | | | | | | |
Air Products & Chemicals, Inc. | | | 66 | | | | 13,582 | |
Celanese Corp. - Class A | | | 121 | | | | 13,055 | |
FMC Corp. | | | 155 | | | | 12,254 | |
Linde PLC | | | 71 | | | | 12,799 | |
The Chemours Co. | | | 316 | | | | 11,379 | |
| | | | | | | | 63,069 | |
Commercial Services — 2.9% | | | | | | | | |
Adtalem Global Ed, Inc. (a) | | | 254 | | | | 12,527 | |
Sabre Corp. | | | 571 | | | | 11,854 | |
The Brink’s Co. | | | 166 | | | | 13,268 | |
| | | | | | | | 37,649 | |
Computers — 6.4% | | | | | | | | |
Accenture PLC - Class A | | | 74 | | | | 13,518 | |
Apple, Inc. | | | 70 | | | | 14,047 | |
DXC Technology Co. | | | 187 | | | | 12,293 | |
Fortinet, Inc. (a) | | | 149 | | | | 13,920 | |
Lumentum Holdings, Inc. (a) | | | 257 | | | | 15,926 | |
NCR Corp. (a) | | | 449 | | | | 12,999 | |
| | | | | | | | 82,703 | |
Cosmetics/Personal Care — 1.0% | | | | | | | | |
Estee Lauder Cos., Inc. - Class A | | | 77 | | | | 13,229 | |
| | | | | | | | | |
Electrical Components & Equipment — 3.0% | | | | | | | | |
Ametek, Inc. | | | 153 | | | | 13,490 | |
Littelfusse, Inc. | | | 64 | | | | 12,867 | |
| | | Shares | | | Value | |
Electrical Components & Equipment — 3.0% (Continued) |
Universal Display Corp. | | | 82 | | | $ | 13,087 | |
| | | | | | | | 39,444 | |
Electronics — 10.0% | | | | | | | | |
Amphenol Corp. - Class A | | | 130 | | | | 12,943 | |
Avnet, Inc. | | | 285 | | | | 13,854 | |
Coherent, Inc. (a) | | | 90 | | | | 13,321 | |
Garmin Ltd. | | | 146 | | | | 12,518 | |
Gentex Corp. | | | 588 | | | | 13,542 | |
Mettler-Toledo International, Inc. (a) | | | 18 | | | | 13,415 | |
National Instruments Corp. | | | 270 | | | | 12,717 | |
PerkinElmer, Inc. | | | 131 | | | | 12,555 | |
Tech Data Corp. (a) | | | 125 | | | | 13,326 | |
Waters Corp. (a) | | | 50 | | | | 10,677 | |
| | | | | | | | 128,868 | |
Healthcare - Products — 4.7% | | | | | | | | |
Abbott Laboratories | | | 157 | | | | 12,491 | |
LivaNova PLC (a) | | | 130 | | | | 8,956 | |
The Cooper Cos., Inc. | | | 42 | | | | 12,177 | |
Thermo Fisher Scientific, Inc. | | | 48 | | | | 13,318 | |
West Pharmaceutical Services, Inc. | | | 118 | | | | 14,607 | |
| | | | | | | | 61,549 | |
Healthcare - Services — 3.0% | | | | | | | | |
Catalent, Inc. (a) | | | 285 | | | | 12,774 | |
IQVIA Holdings, Inc. (a) | | | 88 | | | | 12,223 | |
Syneos Health, Inc. (a) | | | 290 | | | | 13,610 | |
| | | | | | | | 38,607 | |
Household Products/Wares — 1.0% | | | | | | | | |
Avery Dennison Corp. | | | 111 | | | | 12,282 | |
| | | | | | | | | |
Internet — 3.9% | | | | | | | | |
Alphabet, Inc. - Class A (a) | | | 10 | | | | 11,990 | |
Booking Holdings, Inc. (a) | | | 7 | | | | 12,985 | |
F5 Networks, Inc. (a) | | | 76 | | | | 11,924 | |
Facebook, Inc. - Class A (a) | | | 71 | | | | 13,731 | |
| | | | | | | | 50,630 | |
Leisure Time — 1.9% | | | | | | | | |
Carnival Corp. | | | 219 | | | | 12,014 | |
Norwegian Cruise Line Holdings Ltd. (a) | | | 219 | | | | 12,350 | |
| | | | | | | | 24,364 | |
Machinery - Diversifed — 3.9% | | | | | | | | |
Cognex Corp. | | | 234 | | | | 11,801 | |
Nordson Corp. | | | 91 | | | | 13,281 | |
Graco, Inc. | | | 255 | | | | 13,069 | |
Xylem, Inc. | | | 160 | | | | 13,344 | |
| | | | | | | | 51,495 | |
Metal Fabrication/Hardware — 1.0% | | | | | | | | |
The Timken Co. | | | 282 | | | | 13,522 | |
| | | | | | | | | |
The accompanying notes are an integral part of the financial statements.
74
Pacer US Export Leaders ETF
SCHEDULE OF INVESTMENTS
April 30, 2019 (Continued)
| | | Shares | | | Value | |
COMMON STOCKS — 99.9% (Continued) |
| |
Mining — 2.7% | | | | | | | | |
Freeport-McMoRan, Inc. | | | 995 | | | $ | 12,248 | |
Newmont Goldcorp Corp. | | | 357 | | | | 11,089 | |
Royal Gold, Inc. | | | 135 | | | | 11,753 | |
| | | | | | | | 35,090 | |
Miscellaneous Manufacturing — 2.1% | | | | | | | | |
Ingersoll-Rand PLC | | | 115 | | | | 14,100 | |
ITT, Inc. | | | 212 | | | | 12,837 | |
| | | | | | | | 26,937 | |
Oil & Gas — 2.8% | | | | | | | | |
Apache Corp. | | | 377 | | | | 12,407 | |
Chevron Corp. | | | 99 | | | | 11,886 | |
Exxon Mobil Corp. | | | 152 | | | | 12,202 | |
| | | | | | | | 36,495 | |
Packaging & Containers — 1.9% | | | | | | | | |
Ball Corp. | | | 219 | | | | 13,127 | |
Greif, Inc. | | | 299 | | | | 11,816 | |
| | | | | | | | 24,943 | |
Pharmaceuticals — 2.0% | | | | | | | | |
Mylan NV (a) | | | 452 | | | | 12,199 | |
Zoetis, Inc. | | | 130 | | | | 13,239 | |
| | | | | | | | 25,438 | |
Semiconductors — 20.3% | | | | | | | | |
Advanced Micro Devices, Inc. (a) | | | 547 | | | | 15,114 | |
Analog Devices, Inc. | | | 114 | | | | 13,251 | |
Applied Materials, Inc. | | | 319 | | | | 14,058 | |
Broadcom, Inc. | | | 46 | | | | 14,646 | |
Cypress Semiconductor Corp. | | | 813 | | | | 13,967 | |
Intel Corp. | | | 229 | | | | 11,688 | |
IPG Photonics Corp. (a) | | | 81 | | | | 14,153 | |
KLA-Tencor Corp. | | | 106 | | | | 13,513 | |
Lam Research Corp. | | | 71 | | | | 14,728 | |
Maxim Integrated Products, Inc. | | | 232 | | | | 13,920 | |
Microchip Technology, Inc. | | | 142 | | | | 14,184 | |
Micron Technology, Inc. (a) | | | 311 | | | | 13,081 | |
MKS Instruments, Inc. | | | 153 | | | | 13,925 | |
Monolithic Power Systems, Inc. | | | 90 | | | | 14,014 | |
NVIDIA Corp. | | | 80 | | | | 14,480 | |
Qorvo, Inc. (a) | | | 175 | | | | 13,232 | |
Skyworks Solutions, Inc. | | | 150 | | | | 13,227 | |
Teradyne, Inc. | | | 311 | | | | 15,239 | |
Texas Instruments, Inc. | | | 115 | | | | 13,551 | |
| | | | | | | | 263,971 | |
Software — 6.2% | | | | | | | | |
ACI Worldwide, Inc. (a) | | | 377 | | | | 13,391 | |
Activision Blizzard, Inc. | | | 286 | | | | 13,788 | |
ANSYS, Inc. (a) | | | 68 | | | | 13,314 | |
Cadence Design System, Inc. (a) | | | 203 | | | | 14,084 | |
| | | Shares | | | Value | |
Software — 6.2% (Continued) |
Electronic Arts, Inc. (a) | | | 122 | | | $ | 11,547 | |
Microsoft Corp. | | | 109 | | | | 14,236 | |
| | | | | | | | 80,360 | |
Telecommunications — 2.1% | | | | | | | | |
Arista Networks, Inc. (a) | | | 44 | | | | 13,741 | |
Plantronics, Inc. | | | 252 | | | | 12,973 | |
| | | | | | | | 26,714 | |
Toys/Games/Hobbies — 1.1% | | | | | | | | |
Hasbro, Inc. | | | 138 | | | | 14,057 | |
| | | | | | | | | |
Transportation — 1.0% | | | | | | | | |
Expeditors International of Washington, Inc. | | | 162 | | | | 12,866 | |
| | | | | | | | | |
TOTAL COMMON STOCKS (Cost $1,234,905) | | | | | | | 1,284,514 | |
| | | | | | | | | |
EXCHANGE TRADED FUNDS — 0.9% | | | | |
SPDR S&P 500 ETF Trust | | | 40 | | | | 11,761 | |
TOTAL EXCHANGE TRADED FUNDS
(Cost $11,451) | | | | | | | 11,761 | |
| | | | | | | | | |
SHORT-TERM INVESTMENTS — 0.1% | | | | |
| | | | | | | | | |
Money Market Deposit Accounts — 0.1% | | | | | | | | |
U.S. Bank Money Market Deposit Account, 2.35% (b) | | | 1,579 | | | | 1,579 | |
TOTAL SHORT-TERM INVESTMENTS (Cost $1,579) | | | | | | | 1,579 | |
Total Investments
(Cost $1,247,935) — 100.0% | | | | | | | 1,297,854 | |
Other Assets in Excess of Liabilities — 0.0% (c) | | | | | | | 536 | |
TOTAL NET ASSETS — 100.0% | | | | | | $ | 1,298,390 | |
Percentages are stated as a percent of net assets.
| | (a) | Non-income producing security. |
| | (b) | The rate shown is as of April 30, 2019. |
For Fund compliance purposes, the Fund’s industry classifications refer to any one or more of the industry sub-classifications used by one or more widely recognized market indexes or ratings group indexes, and/or they may be defined by Fund management. This definition does not apply for all purposes of this report, which may combine sub-classifications for reporting ease. Categories are shown as a percentage of net assets.
The accompanying notes are an integral part of the financial statements.
75
Pacer CFRA-Stovall Equal Weight Seasonal Rotation ETF
SCHEDULE OF INVESTMENTS
April 30, 2019
| | | Shares | | | Value | |
COMMON STOCKS — 100.0% | | | | |
| | | | | | | | | |
Agricultural — 4.3% | | | | |
Altria Group, Inc. | | | 1,788 | | | $ | 97,142 | |
Archer-Daniels-Midland Co. | | | 2,362 | | | | 105,345 | |
Philip Morris International, Inc. | | | 1,132 | | | | 97,986 | |
| | | | | | | | 300,473 | |
Beverages — 9.3% | | | | | | | | |
Brown-Forman Corp. - Class B | | | 1,983 | | | | 105,674 | |
Coca-Cola Co. | | | 2,208 | | | | 108,325 | |
Constellation Brands, Inc. - Class A | | | 590 | | | | 124,885 | |
Molson Coors Brewing Co. - Class B | | | 1,665 | | | | 106,876 | |
Monster Beverage Corp. (a) | | | 1,634 | | | | 97,386 | |
PepsiCo, Inc. | | | 859 | | | | 109,995 | |
| | | | | | | | 653,141 | |
Biotechnology — 6.9% | | | | | | | | |
Alexion Pharmaceuticals, Inc. (a) | | | 433 | | | | 58,944 | |
Amgen, Inc. | | | 308 | | | | 55,231 | |
Biogen, Inc. (a) | | | 181 | | | | 41,492 | |
Celgene Corp. (a) | | | 660 | | | | 62,476 | |
Gilead Sciences, Inc. | | | 882 | | | | 57,365 | |
Illumina, Inc. (a) | | | 189 | | | | 58,968 | |
Incyte Corp. (a) | | | 679 | | | | 52,147 | |
Regeneron Pharmaceuticals, Inc. (a) | | | 138 | | | | 47,353 | |
Vertex Pharmaceuticals, Inc. (a) | | | 314 | | | | 53,060 | |
| | | | | | | | 487,036 | |
Cosmetics&Toiletries — 6.0% | | | | | | | | |
Colgate-Palmolive Co. | | | 1,515 | | | | 110,277 | |
Coty, Inc. - Class A | | | 9,001 | | | | 97,391 | |
Estee Lauder Cos., Inc. - Class A | | | 635 | | | | 109,099 | |
Procter & Gamble Co. | | | 1,006 | | | | 107,119 | |
| | | | | | | | 423,886 | |
Electronics — 3.2% | | | | | | | | |
Agilent Technologies, Inc. | | | 715 | | | | 56,128 | |
Mettler-Toledo International, Inc. (a) | | | 82 | | | | 61,111 | |
PerkinElmer, Inc. | | | 607 | | | | 58,175 | |
Waters Corp. (a) | | | 234 | | | | 49,968 | |
| | | | | | | | 225,382 | |
Food — 21.7% | | | | | | | | |
Campbell Soup Co. | | | 2,749 | | | | 106,359 | |
ConAgra Foods, Inc. | | | 4,354 | | | | 134,016 | |
General Mills, Inc. | | | 2,127 | | | | 109,477 | |
Hershey Co. | | | 890 | | | | 111,116 | |
Hormel Foods Corp. | | | 2,303 | | | | 91,982 | |
JM Smucker Co. | | | 958 | | | | 117,480 | |
Kellogg Co. | | | 1,815 | | | | 109,444 | |
Kroger Co. | | | 4,046 | | | | 104,306 | |
Lamb Weston Holdings, Inc. | | | 1,414 | | | | 99,051 | |
McCormick & Co., Inc. | | | 722 | | | | 111,166 | |
Mondelez International, Inc. - Class A | | | 2,126 | | | | 108,107 | |
| | | Shares | | | Value | |
Food — 21.7% (Continued) | | | | | | | | |
Sysco Corp. | | | 1,505 | | | $ | 105,907 | |
The Kraft Heinz Co. | | | 3,084 | | | | 102,512 | |
Tyson Foods, Inc. - Class A | | | 1,561 | | | | 117,091 | |
| | | | | | | | 1,528,014 | |
Healthcare - Products — 17.2% | | | | | | | | |
Abbott Laboratories | | | 727 | | | | 57,840 | |
ABIOMED, Inc. (a) | | | 177 | | | | 49,102 | |
Align Technology, Inc. (a) | | | 241 | | | | 78,248 | |
Baxter International, Inc. | | | 752 | | | | 57,378 | |
Becton Dickinson and Co. | | | 226 | | | | 54,407 | |
Boston Scientific Corp. (a) | | | 1,411 | | | | 52,376 | |
Danaher Corp. | | | 446 | | | | 59,068 | |
Dentsply Sirona, Inc. | | | 1,148 | | | | 58,697 | |
Edwards Lifesciences Corp. (a) | | | 329 | | | | 57,927 | |
Henry Schein, Inc. (a) | | | 952 | | | | 60,985 | |
Hologic, Inc. (a) | | | 1,196 | | | | 55,470 | |
IDEXX Laboratories, Inc. (a) | | | 276 | | | | 64,032 | |
Intuitive Surgical, Inc. (a) | | | 104 | | | | 53,106 | |
Medtronic PLC | | | 616 | | | | 54,707 | |
ResMed, Inc. | | | 552 | | | | 57,690 | |
Stryker Corp. | | | 298 | | | | 56,295 | |
Thermo Fisher Scientific, Inc. | | | 223 | | | | 61,872 | |
Teleflex, Inc. | | | 194 | | | | 55,519 | |
The Cooper Cos., Inc. | | | 193 | | | | 55,955 | |
Varian Medical Systems, Inc. (a) | | | 418 | | | | 56,919 | |
Zimmer Biomet Holdings, Inc. | | | 458 | | | | 56,407 | |
| | | | | | | | 1,214,000 | |
Healthcare - Services — 8.8% | | | | | | | | |
Anthem, Inc. | | | 189 | | | | 49,713 | |
Centene Corp. (a) | | | 986 | | | | 50,838 | |
DaVita, Inc. (a) | | | 1,116 | | | | 61,648 | |
HCA Healthcare, Inc. | | | 447 | | | | 56,872 | |
Humana, Inc. | | | 208 | | | | 53,125 | |
IQVIA Holdings, Inc. (a) | | | 406 | | | | 56,393 | |
Laboratory Corp. of American Holdings (a) | | | 380 | | | | 60,770 | |
Quest Diagnostics, Inc. | | | 661 | | | | 63,707 | |
UnitedHealth Group, Inc. | | | 235 | | | | 54,771 | |
Universal Health Services, Inc. - Class B | | | 431 | | | | 54,681 | |
WellCare Health Plans, Inc. (a) | | | 233 | | | | 60,196 | |
| | | | | | | | 622,714 | |
Household Products/Wares — 4.6% | | | | | | | | |
Clorox Co. | | | 627 | | | | 100,151 | |
Church & Dwight Co., Inc. | | | 1,493 | | | | 111,900 | |
Kimberly-Clark Corp. | | | 854 | | | | 109,636 | |
| | | | | | | | 321,687 | |
The accompanying notes are an integral part of the financial statements.
76
Pacer CFRA-Stovall Equal Weight Seasonal Rotation ETF
SCHEDULE OF INVESTMENTS
April 30, 2019 (Continued)
| | | Shares | | | Value | |
COMMON STOCKS — 100.0% (Continued) | | | | |
| | | | | | | | | |
Pharmaceuticals — 12.7% | | | | | | | | |
AbbVie, Inc. | | | 719 | | | $ | 57,081 | |
Allergan PLC | | | 384 | | | | 56,448 | |
AmerisourceBergen Corp. | | | 730 | | | | 54,575 | |
Bristol-Myers Squibb Co. | | | 1,085 | | | | 50,377 | |
Cardinal Health, Inc. | | | 1,169 | | | | 56,942 | |
Cigna Corp. | | | 342 | | | | 54,324 | |
CVS Health Corp. | | | 1,053 | | | | 57,262 | |
Eli Lilly & Co. | | | 440 | | | | 51,498 | |
Johnson & Johnson | | | 404 | | | | 57,045 | |
McKesson Corp. | | | 498 | | | | 59,386 | |
Merck & Co., Inc. | | | 699 | | | | 55,018 | |
Mylan NV (a) | | | 2,095 | | | | 56,544 | |
Nektar Therapeutics (a) | | | 1,587 | | | | 50,816 | |
Perrigo Co PLC | | | 1,199 | | | | 57,456 | |
Pfizer, Inc. | | | 1,363 | | | | 55,351 | |
Zoetis, Inc. | | | 603 | | | | 61,409 | |
| | | | | | | | 891,532 | |
Retail — 4.3% | | | | | | | | |
Costco Wholesale Corp. | | | 435 | | | | 106,806 | |
Walgreens Boots Alliance, Inc. | | | 1,653 | | | | 88,551 | |
Walmart, Inc. | | | 1,015 | | | | 104,383 | |
| | | | | | | | 299,740 | |
Software — 1.0% | | | | | | | | |
Cerner Corp. (a) | | | 1,005 | | | | 66,782 | |
| | | | | | | | | |
TOTAL COMMON STOCKS (Cost $7,036,370) | | | | | | | 7,034,387 | |
| | | | | | | | | |
| | | Shares | | | Value | |
SHORT-TERM INVESTMENTS — 0.1% | | | | |
| | | | | | | | | |
Money Market Deposits — 0.1% | | | | | | | | |
U.S. Bank Money Market Deposit Account 2.35% (b) | | | 9,670 | | | $ | 9,670 | |
TOTAL SHORT-TERM INVESTMENTS
(Cost $9,670) | | | | | | | 9,670 | |
Total Investments
(Cost $7,046,040) — 100.1% | | | | | | | 7,044,057 | |
Liabilities in Excess of Other Assets — (0.1)% | | | | | | | (4,480 | ) |
TOTAL NET ASSETS — 100.0% | | | | | | $ | 7,039,577 | |
Percentages are stated as a percent of net assets.
| | (a) | Non-income producing security. |
| | (b) | The rate shown is as of April 30, 2019. |
For Fund compliance purposes, the Fund’s industry classifications refer to any one or more of the industry sub-classifications used by one or more widely recognized market indexes or ratings group indexes, and/or they may be defined by Fund management. This definition does not apply for all purposes of this report, which may combine sub-classifications for reporting ease. Categories are shown as a percentage of net assets.
The accompanying notes are an integral part of the financial statements.
77
Pacer Funds
Statements of Assets & Liabilities
April 30, 2019
| | | Pacer
Trendpilot®
US Large
Cap ETF | | | Pacer
Trendpilot®
US Mid
Cap ETF | | | Pacer
Trendpilot®
100 ETF | | | Pacer
Trendpilot®
European
Index ETF | | | Pacer
Global
Cash Cows
Dividend ETF | |
ASSETS | | | | | | | | | | | | | | | | | | | | |
Investments in Securities, at Value*^ | | $ | 2,573,709,343 | | | $ | 982,229,421 | | | $ | 571,175,901 | | | $ | 188,425,046 | | | $ | 259,057,863 | |
Cash | | | — | | | | — | | | | — | | | | — | | | | 305,188 | |
Foreign Currency at Value* | | | — | | | | — | | | | — | | | | — | | | | 76,677 | |
Interest and Dividends Receivable | | | 1,826,269 | | | | 427,686 | | | | 37,151 | | | | 789,837 | | | | 1,052,475 | |
Receivable for Fund Shares Sold | | | 13,744,280 | | | | 10,834,090 | | | | 7,253,580 | | | | — | | | | 3,113,570 | |
Securities Lending Income Receivable | | | 39,898 | | | | 14,304 | | | | 6,263 | | | | 3,262 | | | | 12,093 | |
Total Assets | | | 2,589,319,790 | | | | 993,505,501 | | | | 578,472,895 | | | | 189,218,145 | | | | 263,617,866 | |
| | | | | | | | | | | | | | | | | | | | | |
LIABILITIES | | | | | | | | | | | | | | | | | | | | |
Management Fees Payable | | | 1,024,817 | | | | 364,001 | | | | 254,760 | | | | 95,233 | | | | 100,699 | |
Payable for Fund Shares Redeemed | | | — | | | | — | | | | — | | | | — | | | | — | |
Payable for Investment Securities Purchased | | | 13,756,563 | | | | 10,805,777 | | | | 7,259,063 | | | | — | | | | 3,409,748 | |
Collateral Received for Securities Loaned (See Note 5) | | | 410,548,790 | | | | 221,030,289 | | | | 68,785,935 | | | | 5,743,553 | | | | 49,602,558 | |
Total Liabilities | | | 425,330,170 | | | | 232,200,067 | | | | 76,299,758 | | | | 5,838,786 | | | | 53,113,005 | |
NET ASSETS | | $ | 2,163,989,620 | | | $ | 761,305,434 | | | $ | 502,173,137 | | | $ | 183,379,359 | | | $ | 210,504,861 | |
| | | | | | | | | | | | | | | | | | | | | |
NET ASSETS CONSIST OF: | | | | | | | | | | | | | | | | | | | | |
Paid-in Capital | | $ | 2,082,782,411 | | | $ | 803,276,882 | | | $ | 479,474,184 | | | $ | 207,340,768 | | | $ | 216,031,254 | |
Total Distributable Earnings (Accumulated Deficit) | | | 81,207,209 | | | | (41,971,448 | ) | | | 22,698,953 | | | | (23,961,409 | ) | | | (5,526,393 | ) |
Net Assets | | $ | 2,163,989,620 | | | $ | 761,305,434 | | | $ | 502,173,137 | | | $ | 183,379,359 | | | $ | 210,504,861 | |
* Identified Cost: | | | | | | | | | | | | | | | | | | | | |
Investments in Securities | | $ | 2,460,862,120 | | | $ | 968,598,986 | | | $ | 528,991,667 | | | $ | 178,644,704 | | | $ | 254,530,232 | |
Foreign Currencies | | | — | | | | — | | | | — | | | | — | | | | 77,167 | |
^ Includes Loaned securities with a value of | | | 402,974,069 | | | $ | 214,543,582 | | | $ | 67,564,384 | | | | 5,591,627 | | | | 48,500,145 | |
| | | | | | | | | | | | | | | | | | | | | |
Net Asset Value (unlimited shares authorized): | | | | | | | | | | | | | | | | | | | | |
Net Assets | | $ | 2,163,989,620 | | | $ | 761,305,434 | | | $ | 502,173,137 | | | $ | 183,379,359 | | | $ | 210,504,861 | |
Shares Outstanding (No Par Value) | | | 70,800,000 | | | | 24,600,000 | | | | 13,950,000 | | | | 6,850,000 | | | | 6,750,000 | |
Net Asset Value, Offering and Redemption Price per Share | | $ | 30.56 | | | $ | 30.95 | | | $ | 36.00 | | | $ | 26.77 | | | $ | 31.19 | |
The accompanying notes are an integral part of the financial statements.
78
Pacer Funds
STATEMENTS OF ASSETS & LIABILITIES
April 30, 2019
| | | Pacer
US
Cash Cows
100 ETF | | | Pacer
US Small
Cap Cash
Cows
100 ETF | | | Pacer
Developed
Markets
International
Cash Cows
100 ETF | | | Pacer
WealthShield
ETF | | | Pacer
Military Times
Best Employers
ETF | |
ASSETS | | | | | | | | | | | | | | | | | | | | |
Investments in Securities, at Value*^ | | $ | 289,720,914 | | | $ | 64,106,044 | | | $ | 36,752,445 | | | $ | 115,434,313 | | | $ | 2,870,965 | |
Foreign Currency at Value* | | | — | | | | — | | | | 119 | | | | — | | | | — | |
Interest and Dividends Receivable | | | 110,083 | | | | 3,791 | | | | 223,930 | | | | 51,416 | | | | 2,968 | |
Receivable for Fund Shares Sold | | | 1,483,770 | | | | — | | | | — | | | | 2,494,070 | | | | — | |
Securities Lending Income Receivable | | | 2,408 | | | | 2,217 | | | | 623 | | | | 34 | | | | — | |
Total Assets | | | 291,317,175 | | | | 64,112,052 | | | | 36,977,117 | | | | 117,979,833 | | | | 2,873,933 | |
| | | | | | | | | | | | | | | | | | | | | |
LIABILITIES | | | | | | | | | | | | | | | | | | | | |
Payable for Investment Securities Purchased | | | 1,483,850 | | | | — | | | | — | | | | 2,472,244 | | | | — | |
Management Fees Payable | | | 105,188 | | | | 23,905 | | | | 18,154 | | | | 50,925 | | | | 1,376 | |
Collateral Received for Securities Loaned (See Note 5) | | | 23,710,020 | | | | 13,614,390 | | | | 3,114,587 | | | | 5,378,550 | | | | — | |
Total Liabilities | | | 25,299,058 | | | | 13,638,295 | | | | 3,132,741 | | | | 7,901,719 | | | | 1,376 | |
NET ASSETS | | $ | 266,018,117 | | | $ | 50,473,757 | | | $ | 33,844,376 | | | $ | 110,078,114 | | | $ | 2,872,557 | |
| | | | | | | | | | | | | | | | | | | | | |
NET ASSETS CONSIST OF: | | | | | | | | | | | | | | | | | | | | |
Paid-in Capital | | $ | 274,292,513 | | | $ | 52,986,412 | | | $ | 36,395,489 | | | $ | 119,464,648 | | | $ | 2,573,422 | |
Total Distributable Earnings (Accumulated Deficit) | | | (8,274,396 | ) | | | (2,512,655 | ) | | | (2,551,113 | ) | | | (9,386,534 | ) | | | 299,135 | |
Net Assets | | $ | 266,018,117 | | | $ | 50,473,757 | | | $ | 33,844,376 | | | $ | 110,078,114 | | | $ | 2,872,557 | |
* Identified Cost: | | | | | | | | | | | | | | | | | | | | |
Investments in Securities | | $ | 280,492,054 | | | $ | 62,123,567 | | | $ | 37,132,116 | | | $ | 110,192,966 | | | $ | 2,556,888 | |
Foreign Currencies | | | — | | | | — | | | | 134 | | | | — | | | | — | |
^ Includes loaned securities with a value of | | | 23,102,179 | | | | 13,069,315 | | | | 3,036,508 | | | | 5,344,012 | | | | — | |
| | | | | | | | | | | | | | | | | | | | | |
Net Asset Value (unlimited shares authorized): | | | | | | | | | | | | | | | | | | | | |
Net Assets | | $ | 266,018,117 | | | $ | 50,473,757 | | | $ | 33,844,376 | | | $ | 110,078,114 | | | $ | 2,872,557 | |
Shares Outstanding (No Par Value) | | | 8,950,000 | | | | 1,950,000 | | | | 1,250,000 | | | | 4,400,000 | | | | 100,000 | |
Net Asset Value, Offering and Redemption Price per Share | | $ | 29.72 | | | $ | 25.88 | | | $ | 27.08 | | | $ | 25.02 | | | $ | 28.73 | |
The accompanying notes are an integral part of the financial statements.
79
Pacer Funds
STATEMENTS OF ASSETS & LIABILITIES
April 30, 2019
| | | Pacer
Benchmark
Retail Real
EstateSM ETF | | | Pacer
Benchmark
Industrial Real
EstateSM ETF | | | Pacer
Benchmark
Data &
Infrastructure
Real EstateSM
ETF | | | Pacer
US Export
Leaders ETF | | | Pacer
CFRA-Stovall
Equal Weight
Seasonal
Rotation ETF | |
ASSETS | | | | | | | | | | | | | | | | | | | | |
Investments in Securities, at Value*^ | | $ | 1,377,593 | | | $ | 7,782,556 | | | $ | 23,691,122 | | | $ | 1,297,854 | | | $ | 7,044,057 | |
Interest and Dividends Receivable | | | 1,845 | | | | 4,984 | | | | 6,011 | | | | 1,174 | | | | 6,045 | |
Receivable for Investment Securities Sold | | | — | | | | — | | | | — | | | | — | | | | 12,625,495 | |
Receivable for Fund Shares Sold | | | — | | | | — | | | | — | | | | — | | | | 5,618,720 | |
Securities Lending Income Receivable | | | — | | | | 57 | | | | 12 | | | | — | | | | — | |
Total Assets | | | 1,379,438 | | | | 7,787,597 | | | | 23,697,145 | | | | 1,299,028 | | | | 25,294,317 | |
| | | | | | | | | | | | | | | | | | | | | |
LIABILITIES | | | | | | | | | | | | | | | | | | | | |
Payable for Investment Securities Purchased | | | — | | | | — | | | | — | | | | — | | | | 12,616,015 | |
Payable for Fund Shares Redeemed | | | — | | | | — | | | | — | | | | — | | | | 5,635,280 | |
Management Fees Payable | | | 877 | | | | 2,291 | | | | 9,638 | | | | 638 | | | | 3,445 | |
Collateral Received for Securities Loaned (See Note 5) | | | — | | | | 429,600 | | | | 996,120 | | | | — | | | | — | |
Total Liabilities | | | 877 | | | | 431,891 | | | | 1,005,758 | | | | 638 | | | | 18,254,740 | |
NET ASSETS | | $ | 1,378,561 | | | $ | 7,355,706 | | | $ | 22,691,387 | | | $ | 1,298,390 | | | $ | 7,039,577 | |
| | | | | | | | | | | | | | | | | | | | | |
NET ASSETS CONSIST OF: | | | | | | | | | | | | | | | | | | | | |
Paid-in Capital | | $ | 1,366,548 | | | $ | 7,041,015 | | | $ | 21,562,646 | | | $ | 1,333,362 | | | $ | 7,205,971 | |
Total Distributable Earnings (Accumulated Deficit) | | | 12,013 | | | | 314,691 | | | | 1,128,741 | | | | (34,972 | ) | | | (166,394 | ) |
Net Assets | | $ | 1,378,561 | | | $ | 7,355,706 | | | $ | 22,691,387 | | | $ | 1,298,390 | | | $ | 7,039,577 | |
* Identified Cost: | | | | | | | | | | | | | | | | | | | | |
Investments in Securities | | $ | 1,317,213 | | | $ | 7,472,071 | | | $ | 22,365,612 | | | $ | 1,247,935 | | | $ | 7,046,040 | |
^ Includes loaned securities with a value of | | | — | | | | 412,126 | | | | 974,454 | | | | — | | | | — | |
| | | | | | | | | | | | | | | | | | | | | |
Net Asset Value (unlimited shares authorized): | | | | | | | | | | | | | | | | | | | | |
Net Assets | | $ | 1,378,561 | | | $ | 7,355,706 | | | $ | 22,691,387 | | | $ | 1,298,390 | | | $ | 7,039,577 | |
Shares Outstanding (No Par Value) | | | 50,000 | | | | 250,000 | | | | 800,000 | | | | 50,000 | | | | 250,000 | |
Net Asset Value, Offering and Redemption Price per Share | | $ | 27.57 | | | $ | 29.42 | | | $ | 28.36 | | | $ | 25.97 | | | $ | 28.16 | |
The accompanying notes are an integral part of the financial statements.
80
Pacer Funds
Statements of Operations
For the Year Ended April 30, 2019
| | | Pacer
Trendpilot®
US Large
Cap ETF | | | Pacer
Trendpilot®
US Mid
Cap ETF | | | Pacer
Trendpilot®
100 ETF | | | Pacer
Trendpilot®
European
Index ETF | | | Pacer
Global
Cash Cows
Dividend ETF | |
INVESTMENT INCOME | | | | | | | | | | | | | | | | | | | | |
Income: | | | | | | | | | | | | | | | | | | | | |
Dividends (net of fees and foreign withholding tax of $18, $1,841, $2,121, $674,169, and $411,667 respectively) | | $ | 17,709,193 | | | $ | 5,377,924 | | | $ | 2,217,465 | | | $ | 3,973,565 | | | $ | 8,685,886 | |
Interest | | | 10,865,555 | | | | 6,554,366 | | | | 2,473,152 | | | | 1,770,308 | | | | 9,837 | |
Securities Lending Income | | | 244,525 | | | | 213,450 | | | | 59,914 | | | | 18,839 | | | | 186,325 | |
Total Investment Income | | | 28,819,273 | | | | 12,145,740 | | | | 4,750,531 | | | | 5,762,712 | | | | 8,882,048 | |
| | | | | | | | | | | | | | | | | | | | | |
Expenses: | | | | | | | | | | | | | | | | | | | | |
Management Fees | | | 8,508,347 | | | | 3,842,348 | | | | 2,189,472 | | | | 1,095,782 | | | | 1,159,409 | |
Total Expenses | | | 8,508,347 | | | | 3,842,348 | | | | 2,189,472 | | | | 1,095,782 | | | | 1,159,409 | |
Net Investment Income | | | 20,310,926 | | | | 8,303,392 | | | | 2,561,059 | | | | 4,666,930 | | | | 7,722,639 | |
| | | | | | | | | | | | | | | | | | | | | |
REALIZED & UNREALIZED GAIN (LOSS) ON INVESTMENTS | | | | | | | | | | | | | | | | | | | | |
Net Realized Gain (Loss) on: | | | | | | | | | | | | | | | | | | | | |
Investment Securities | | | (1,980,515 | ) | | | (55,864,860 | ) | | | (10,616,144 | ) | | | (30,495,960 | ) | | | (8,526,326 | ) |
In-Kind Redemptions | | | 103,669,128 | | | | 62,657,317 | | | | 46,532,539 | | | | 260 | | | | 7,482,759 | |
Foreign Currencies | | | — | | | | — | | | | — | | | | (1,010,893 | ) | | | (68,753 | ) |
Total | | | 101,688,613 | | | | 6,792,457 | | | | 35,916,395 | | | | (31,506,593 | ) | | | (1,112,320 | ) |
Net Change in Unrealized Appreciation (Depreciation) of: | | | | | | | | | | | | | | | | | | | | |
Investments Securities | | | 11,669,402 | | | | (12,346,289 | ) | | | 11,973,440 | | | | 12,242,814 | | | | 3,755,496 | |
Foreign Currencies | | | — | | | | — | | | | — | | | | (8,401 | ) | | | (4,212 | ) |
Total | | | 11,669,402 | | | | (12,346,289 | ) | | | 11,973,440 | | | | 12,234,413 | | | | 3,751,284 | |
Net Realized and Unrealized Gain (Loss) on Investments | | | 113,358,015 | | | | (5,553,832 | ) | | | 47,889,835 | | | | (19,272,180 | ) | | | 2,638,964 | |
NET INCREASE (DECREASE) IN NET ASSETS RESULTING FROM OPERATIONS | | $ | 133,668,941 | | | $ | 2,749,560 | | | $ | 50,450,894 | | | $ | (14,605,250 | ) | | $ | 10,361,603 | |
The accompanying notes are an integral part of the financial statements.
81
Pacer Funds
STATEMENTS OF OPERATIONS
For the Year Ended April 30, 2019
| | | Pacer
US
Cash Cows
100 ETF | | | Pacer
US Small
Cap Cash
Cows
100 ETF | | | Pacer
Developed
Markets
International
Cash Cows
100 ETF | | | Pacer
WealthShield
ETF | | | Pacer
Military Times
Best Employers
ETF | |
INVESTMENT INCOME | | | | | | | | | | | | | | | | | | | | |
Income: | | | | | | | | | | | | | | | | | | | | |
Dividends (net of fees and foreign withholding tax of $0, $0, $104,169, $0, and $0 respectively) | | $ | 3,386,540 | | | $ | 473,269 | | | $ | 1,069,479 | | | $ | 685,711 | | | $ | 56,789 | |
Interest | | | 6,697 | | | | 1,413 | | | | 1,238 | | | | 1,286,050 | | | | 107 | |
Securities Lending Income | | | 25,544 | | | | 24,569 | | | | 19,849 | | | | 34 | | | | — | |
Total Investment Income | | | 3,418,781 | | | | 499,251 | | | | 1,090,566 | | | | 1,971,795 | | | | 56,896 | |
| | | | | | | | | | | | | | | | | | | | | |
Expenses: | | | | | | | | | | | | | | | | | | | | |
Management Fees | | | 724,702 | | | | 163,389 | | | | 185,049 | | | | 557,508 | | | | 15,133 | |
Total Expenses | | | 724,702 | | | | 163,389 | | | | 185,049 | | | | 557,508 | | | | 15,133 | |
Net Investment Income | | | 2,694,079 | | | | 335,862 | | | | 905,517 | | | | 1,414,287 | | | | 41,763 | |
| | | | | | | | | | | | | | | | | | | | | |
REALIZED & UNREALIZED GAIN (LOSS) ON INVESTMENTS | | | | | | | | | | | | | | | | | | | | |
Net Realized Gain (Loss) on: | | | | | | | | | | | | | | | | | | | | |
Investment Securities | | | (17,195,776 | ) | | | (4,500,367 | ) | | | (2,374,640 | ) | | | (12,148,585 | ) | | | (18,432 | ) |
In-Kind Redemptions | | | 7,697,783 | | | | 2,095,484 | | | | 734,289 | | | | 5,341,184 | | | | 189,567 | |
Foreign Currencies | | | — | | | | — | | | | (17,958 | ) | | | — | | | | — | |
Total | | | (9,497,993 | ) | | | (2,404,883 | ) | | | (1,658,309 | ) | | | (6,807,401 | ) | | | 171,135 | |
Net Change in Unrealized Appreciation (Depreciation) of: | | | | | | | | | | | | | | | | | | | | |
Investments Securities | | | 8,755,096 | | | | 1,900,238 | | | | (742,876 | ) | | | 5,265,168 | | | | 269,984 | |
Foreign Currencies | | | — | | | | — | | | | 735 | | | | — | | | | — | |
Total | | | 8,755,096 | | | | 1,900,238 | | | | (742,141 | ) | | | 5,265,168 | | | | 269,984 | |
Net Realized and Unrealized Gain (Loss) on Investments | | | (742,897 | ) | | | (504,645 | ) | | | (2,400,450 | ) | | | (1,542,233 | ) | | | 441,119 | |
NET INCREASE (DECREASE) IN NET ASSETS RESULTING FROM OPERATIONS | | $ | 1,951,182 | | | $ | (168,783 | ) | | $ | (1,494,933 | ) | | $ | (127,946 | ) | | $ | 482,882 | |
The accompanying notes are an integral part of the financial statements.
82
Pacer Funds
STATEMENTS OF OPERATIONS
For the Year Ended April 30, 2019
| | | Pacer
Benchmark
Retail Real
EstateSM ETF(a) | | | Pacer
Benchmark
Industrial Real
EstateSM ETF(b) | | | Pacer
Benchmark
Data &
Infrastructure
Real EstateSM
ETF(a) | | | Pacer
US Export
Leaders ETF(c) | | | Pacer
CFRA-Stovall
Equal Weight
Seasonal
Rotation ETF(c) | |
INVESTMENT INCOME | | | | | | | | | | | | | | | | | | | | |
Income: | | | | | | | | | | | | | | | | | | | | |
Dividends (net of fees and foreign withholding tax of $14, $0, $0, $0 and $0 respectively) | | $ | 98,628 | | | $ | 85,131 | | | $ | 123,562 | | | $ | 16,177 | | | $ | 49,502 | |
Interest | | | 249 | | | | 127 | | | | 325 | | | | 56 | | | | 151 | |
Securities Lending Income | | | — | | | | 57 | | | | 12 | | | | — | | | | — | |
Total Investment Income | | | 98,877 | | | | 85,315 | | | | 123,899 | | | | 16,233 | | | | 49,653 | |
| | | | | | | | | | | | | | | | | | | | | |
Expenses: | | | | | | | | | | | | | | | | | | | | |
Management Fees | | | 15,081 | | | | 16,070 | | | | 34,611 | | | | 8,818 | | | | 16,295 | |
Total Expenses | | | 15,081 | | | | 16,070 | | | | 34,611 | | | | 8,818 | | | | 16,295 | |
Net Investment Income | | | 83,796 | | | | 69,245 | | | | 89,288 | | | | 7,415 | | | | 33,358 | |
| | | | | | | | | | | | | | | | | | | | | |
REALIZED & UNREALIZED GAIN (LOSS) ON INVESTMENTS | | | | | | | | | | | | | | | | | | | | |
Net Realized Gain (Loss) on: | | | | | | | | | | | | | | | | | | | | |
Investment Securities | | | (38,769 | ) | | | (4,401 | ) | | | (191,603 | ) | | | (88,511 | ) | | | (175,744 | ) |
In-Kind Redemptions | | | 353,871 | | | | 170,347 | | | | 131,474 | | | | (68,521 | ) | | | 823,380 | |
Total | | | 315,102 | | | | 165,946 | | | | (60,129 | ) | | | (157,032 | ) | | | 647,636 | |
Net Change in Unrealized Appreciation (Depreciation) of: | | | | | | | | | | | | | | | | | | | | |
Investments Securities | | | 60,380 | | | | 310,485 | | | | 1,325,510 | | | | 49,919 | | | | (1,983 | ) |
Total | | | 60,380 | | | | 310,485 | | | | 1,325,510 | | | | 49,919 | | | | (1,983 | ) |
Net Realized and Unrealized Gain (Loss) on Investments | | | 375,482 | | | | 476,431 | | | | 1,265,381 | | | | (107,113 | ) | | | 645,653 | |
NET INCREASE (DECREASE) IN NET ASSETS RESULTING FROM OPERATIONS | | $ | 459,278 | | | $ | 545,676 | | | $ | 1,354,669 | | | $ | (99,698 | ) | | $ | 679,011 | |
(a) | Fund commenced operations on May 15, 2018. The information presented is from May 15, 2018 to April 30, 2019. |
(b) | Fund commenced operations on May 14, 2018. The information presented is from May 14, 2018 to April 30, 2019. |
(c) | Fund commenced operations on July 23, 2018. The information presented is from July 23, 2018 to April 30, 2019. |
The accompanying notes are an integral part of the financial statements.
83
Pacer Funds
Statements of Changes in Net Assets
| | | Pacer Trendpilot®
US Large Cap ETF | | | Pacer Trendpilot®
US Mid Cap ETF | |
| | | For the
Year Ended
April 30,
2019 | | | For the
Year Ended
April 30,
2018 | | | For the
Year Ended
April 30,
2019 | | | For the
Year Ended
April 30,
2018 | |
OPERATIONS | | | | | | | | | | | | | | | | |
Net Investment Income | | $ | 20,310,926 | | | $ | 8,578,628 | | | $ | 8,303,392 | | | $ | 3,464,938 | |
Net Realized Gain on Investments | | | 101,668,613 | | | | 9,083,487 | | | | 6,792,457 | | | | 33,031,547 | |
Change in Unrealized Appreciation (Depreciation) of Investments | | | 11,669,402 | | | | 45,094,752 | | | | (12,346,289 | ) | | | (2,103,852 | ) |
Net Increase in Net Assets Resulting from Operations | | | 133,668,941 | | | | 62,756,867 | | | | 2,749,560 | | | | 34,392,633 | |
| | | | | | | | | | | | | | | | | |
DISTRIBUTIONS TO SHAREHOLDERS | | | | | | | | | | | | | | | | |
Dividends and Distributions | | | (14,704,858 | ) | | | (7,017,355 | )(a) | | | (5,930,872 | ) | | | (2,882,696 | )(a) |
Total Distributions to Shareholders | | | (14,704,858 | ) | | | (7,017,355 | ) | | | (5,930,872 | ) | | | (2,882,696 | ) |
| | | | | | | | | | | | | | | | | |
CAPITAL SHARE TRANSACTIONS | | | | | | | | | | | | | | | | |
Proceeds from Shares Sold | | | 1,416,889,645 | | | | 433,608,925 | | | | 524,354,675 | | | | 278,026,940 | |
Payments for Shares Redeemed | | | (293,839,015 | ) | | | (23,553,530 | ) | | | (257,458,190 | ) | | | (93,376,700 | ) |
Net Increase in Net Assets Derived from Capital Share Transactions(b) | | | 1,123,050,630 | | | | 410,055,395 | | | | 266,896,485 | | | | 184,650,240 | |
Net Increase in Net Assets | | $ | 1,242,014,713 | | | $ | 465,794,907 | | | $ | 263,715,173 | | | $ | 216,160,177 | |
| | | | | | | | | | | | | | | | | |
NET ASSETS | | | | | | | | | | | | | | | | |
Beginning of Period | | $ | 921,974,907 | | | $ | 456,180,000 | | | $ | 497,590,261 | | | $ | 281,430,084 | |
End of Period | | $ | 2,163,989,620 | | | $ | 921,974,907 | (c) | | $ | 761,305,434 | | | $ | 497,590,261 | (c) |
(a) | These amounts are comprised of only net investment income. |
(b) | Summary of capital share transactions is as follows: |
| | Shares | Shares | Shares | Shares |
Subscriptions | 48,500,000 | 15,400,000 | 16,600,000 | 9,250,000 |
Redemptions | (10,150,000) | (850,000) | (8,200,000) | (3,100,000) |
Net Increase | 38,350,000 | 14,550,000 | 8,400,000 | 6,150,000 |
(c) | Includes undistributed accumulated net investment income of $3,159,758 and $1,152,697, respectively. |
The accompanying notes are an integral part of the financial statements.
84
Pacer Funds
STATEMENTS OF CHANGES IN NET ASSETS
| | | Pacer Trendpilot® 100 ETF | | | Pacer Trendpilot®
European Index ETF | |
| | | For the
Year Ended
April 30,
2019 | | | For the
Year Ended
April 30,
2018 | | | For the
Year Ended
April 30,
2019 | | | For the
Year Ended
April 30,
2018 | |
OPERATIONS | | | | | | | | | | | | | | | | |
Net Investment Income | | $ | 2,561,059 | | | $ | 493,443 | | | $ | 4,666,930 | | | $ | 1,341,548 | |
Net Realized Gain (Loss) on Investments | | | 35,916,395 | | | | (156,453 | ) | | | (31,506,593 | ) | | | 4,836,398 | |
Change in Unrealized Appreciation (Depreciation) of Investments | | | 11,973,440 | | | | 17,873,120 | | | | 12,234,413 | | | | (6,253,723 | ) |
Net Increase (Decrease) in Net Assets Resulting from Operations | | | 50,450,894 | | | | 18,210,110 | | | | (14,605,250 | ) | | | (75,777 | ) |
| | | | | | | | | | | | | | | | | |
DISTRIBUTIONS TO SHAREHOLDERS | | | | | | | | | | | | | | | | |
Dividends and Distributions | | | (1,575,175 | ) | | | (466,293 | )(a) | | | (2,870,463 | ) | | | (538,237 | )(a) |
Total Distributions to Shareholders | | | (1,575,175 | ) | | | (466,293 | ) | | | (2,870,463 | ) | | | (538,237 | ) |
| | | | | | | | | | | | | | | | | |
CAPITAL SHARE TRANSACTIONS | | | | | | | | | | | | | | | | |
Proceeds from Shares Sold | | | 384,518,860 | | | | 120,466,075 | | | | 62,381,365 | | | | 174,437,090 | |
Payments for Shares Redeemed | | | (143,127,810 | ) | | | — | | | | (20,229,155 | ) | | | (46,201,745 | ) |
Transaction Fees (See Note 1) | | | — | | | | — | | | | 67 | | | | — | |
Net Increase in Net Assets Derived from Capital Share Transactions(b) | | | 241,391,050 | | | | 120,466,075 | | | | 42,152,277 | | | | 128,235,345 | |
Net Increase in Net Assets | | $ | 290,266,769 | | | $ | 138,209,892 | | | $ | 24,676,564 | | | $ | 127,621,331 | |
| | | | | | | | | | | | | | | | | |
NET ASSETS | | | | | | | | | | | | | | | | |
Beginning of Period | | $ | 211,906,368 | | | $ | 73,696,476 | | | $ | 158,702,795 | | | $ | 31,081,464 | |
End of Period | | $ | 502,173,137 | | | $ | 211,906,368 | (c) | | $ | 183,379,359 | | | $ | 158,702,795 | (c) |
(a) | These amounts are comprised of only net investment income. |
(b) | Summary of capital share transactions is as follows: |
| | Shares | Shares | Shares | Shares |
Subscriptions | 11,500,000 | 4,000,000 | 2,300,000 | 5,750,000 |
Redemptions | (4,350,000) | — | (800,000) | (1,550,000) |
Net Increase | 7,150,000 | 4,000,000 | 1,500,000 | 4,200,000 |
(c) | Includes undistributed accumulated net investment income of $99,202 and $827,950, respectively. |
The accompanying notes are an integral part of the financial statements.
85
Pacer Funds
STATEMENTS OF CHANGES IN NET ASSETS
| | | Pacer Global Cash
Cows Dividend ETF | | | Pacer US Cash Cows 100 ETF | |
| | | For the
Year Ended
April 30,
2019 | | | For the
Year Ended
April 30,
2018 | | | For the
Year Ended
April 30,
2019 | | | For the
Year Ended
April 30,
2018 | |
OPERATIONS | | | | | | | | | | | | | | | | |
Net Investment Income | | $ | 7,722,639 | | | $ | 4,087,911 | | | $ | 2,694,079 | | | $ | 349,496 | |
Net Realized Gain (Loss) on Investments | | | (1,112,320 | ) | | | 6,709,257 | | | | (9,497,993 | ) | | | 1,042,948 | |
Change in Unrealized Appreciation (Depreciation) of Investments | | | 3,751,284 | | | | (1,913,304 | ) | | | 8,755,096 | | | | 328,507 | |
Net Increase in Net Assets Resulting from Operations | | | 10,361,603 | | | | 8,883,864 | | | | 1,951,182 | | | | 1,720,951 | |
| | | | | | | | | | | | | | | | | |
DISTRIBUTIONS TO SHAREHOLDERS | | | | | | | | | | | | | | | | |
Dividends and Distributions | | | (7,760,389 | ) | | | (3,669,616 | )(a) | | | (2,630,630 | ) | | | (319,520 | )(a) |
Total Distributions to Shareholders | | | (7,760,389 | ) | | | (3,669,616 | ) | | | (2,630,630 | ) | | | (319,520 | ) |
| | | | | | | | | | | | | | | | | |
CAPITAL SHARE TRANSACTIONS | | | | | | | | | | | | | | | | |
Proceeds from Shares Sold | | | 86,580,140 | | | | 157,190,990 | | | | 297,399,660 | | | | 29,991,055 | |
Payments for Shares Redeemed | | | (52,389,240 | ) | | | (58,760,010 | ) | | | (59,683,405 | ) | | | (14,169,800 | ) |
Transaction Fees (Note 1) | | | 2,621 | | | | 5,956 | | | | 26 | | | | — | |
Net Increase in Net Assets Derived from Capital Share Transactions(b) | | | 34,193,521 | | | | 98,436,936 | | | | 237,716,281 | | | | 15,821,255 | |
Net Increase in Net Assets | | $ | 36,794,735 | | | $ | 103,651,184 | | | $ | 237,036,833 | | | $ | 17,222,686 | |
| | | | | | | | | | | | | | | | | |
NET ASSETS | | | | | | | | | | | | | | | | |
Beginning of Period | | $ | 173,710,126 | | | $ | 70,058,942 | | | $ | 28,981,284 | | | $ | 11,758,598 | |
End of Period | | $ | 210,504,861 | | | $ | 173,710,126 | (c) | | $ | 266,018,117 | | | $ | 28,981,284 | (c) |
(a) | These amounts are comprised of only net investment income. |
(b) | Summary of capital share transactions is as follows: |
| | Shares | Shares | Shares | Shares |
Subscriptions | 2,850,000 | 5,150,000 | 10,050,000 | 1,050,000 |
Redemptions | (1,750,000) | (1,950,000) | (2,100,000) | (500,000) |
Net Increase | 1,100,000 | 3,200,000 | 7,950,000 | 550,000 |
(c) | Includes undistributed accumulated net investment income of $672,131 and $38,618, respectively. |
The accompanying notes are an integral part of the financial statements.
86
Pacer Funds
STATEMENTS OF CHANGES IN NET ASSETS
| | | Pacer US Small Cap
Cash Cows 100 ETF | | | Pacer Developed Markets
International Cash Cows 100 ETF | |
| | | For the
Year Ended
April 30,
2019 | | | For the
Year Ended
April 30,
2018(a) | | | For the
Year Ended
April 30,
2019 | | | For the
Year Ended
April 30,
2018(a) | |
OPERATIONS | | | | | | | | | | | | | | | | |
Net Investment Income | | $ | 335,862 | | | $ | 36,151 | | | $ | 905,517 | | | $ | 131,487 | |
Net Realized Gain (Loss) on Investments | | | (2,404,883 | ) | | | 175,820 | | | | (1,658,309 | ) | | | 53,481 | |
Change in Unrealized Appreciation (Depreciation) of Investments | | | 1,900,238 | | | | 82,238 | | | | (742,141 | ) | | | 360,524 | |
Net Increase (Decrease) in Net Assets Resulting from Operations | | | (168,783 | ) | | | 294,209 | | | | (1,494,933 | ) | | | 545,492 | |
| | | | | | | | | | | | | | | | | |
DISTRIBUTIONS TO SHAREHOLDERS | | | | | | | | | | | | | | | | |
Dividends and Distributions | | | (329,410 | ) | | | (34,114 | )(b) | | | (731,370 | ) | | | (70,528 | )(b) |
Total Distributions to Shareholders | | | (329,410 | ) | | | (34,114 | ) | | | (731,370 | ) | | | (70,528 | ) |
| | | | | | | | | | | | | | | | | |
CAPITAL SHARE TRANSACTIONS | | | | | | | | | | | | | | | | |
Proceeds from Shares Sold | | | 62,486,265 | | | | 8,898,460 | | | | 26,199,335 | | | | 21,155,825 | |
Payments for Shares Redeemed | | | (16,747,460 | ) | | | (3,925,410 | ) | | | (10,378,335 | ) | | | (1,402,765 | ) |
Transaction Fees (Note 1) | | | — | | | | — | | | | 15,033 | | | | 6,622 | |
Net Increase in Net Assets Derived from Capital Share Transactions(c) | | | 45,738,805 | | | | 4,973,050 | | | | 15,836,033 | | | | 19,759,682 | |
Net Increase in Net Assets | | $ | 45,240,612 | | | $ | 5,233,145 | | | $ | 13,609,730 | | | $ | 20,234,646 | |
| | | | | | | | | | | | | | | | | |
NET ASSETS | | | | | | | | | | | | | | | | |
Beginning of Period | | $ | 5,233,145 | | | $ | — | | | $ | 20,234,646 | | | $ | — | |
End of Period | | $ | 50,473,757 | | | $ | 5,233,145 | (d) | | $ | 33,844,376 | | | $ | 20,234,646 | (d) |
(a) | Fund commenced operations on June 16, 2017. The information presented is from June 16, 2017 to April 30, 2018. |
(b) | These amounts are comprised of only net investment income. |
(c) | Summary of capital share transactions is as follows: |
| | Shares | Shares | Shares | Shares |
Subscriptions | 2,400,000 | 350,000 | 950,000 | 750,000 |
Redemptions | (650,000) | (150,000) | (400,000) | (50,000) |
Net Increase | 1,750,000 | 200,000 | 550,000 | 700,000 |
(d) | Includes undistributed accumulated net investment income of $2,037 and $60,172, respectively. |
The accompanying notes are an integral part of the financial statements.
87
Pacer Funds
STATEMENTS OF CHANGES IN NET ASSETS
| | | Pacer WealthShield ETF | | | Pacer Military Times
Best Employers ETF | |
| | | For the
Year Ended
April 30,
2019 | | | For the
Year Ended
April 30,
2018(a) | | | For the
Year Ended
April 30,
2019 | | | For the
Year Ended
April 30,
2018(b) | |
OPERATIONS | | | | | | | | | | | | | | | | |
Net Investment Income | | $ | 1,414,287 | | | $ | 172,593 | | | $ | 41,763 | | | $ | 342 | |
Net Realized Gain (Loss) on Investments | | | (6,807,401 | ) | | | (1,219,932 | ) | | | 171,135 | | | | — | |
Change in Unrealized Appreciation (Depreciation) of Investments | | | 5,265,168 | | | | (23,821 | ) | | | 269,984 | | | | 44,093 | |
Net Increase (Decrease) in Net Assets Resulting from Operations | | | (127,946 | ) | | | (1,071,160 | ) | | | 482,882 | | | | 44,435 | |
| | | | | | | | | | | | | | | | | |
DISTRIBUTIONS TO SHAREHOLDERS | | | | | | | | | | | | | | | | |
Dividends and Distributions | | | (1,397,954 | ) | | | (112,441 | )(c) | | | (38,615 | ) | | | — | |
Total Distributions to Shareholders | | | (1,397,954 | ) | | | (112,441 | ) | | | (38,615 | ) | | | — | |
| | | | | | | | | | | | | | | | | |
CAPITAL SHARE TRANSACTIONS | | | | | | | | | | | | | | | | |
Proceeds from Shares Sold | | | 134,051,800 | | | | 83,838,565 | | | | 1,289,730 | | | | 2,489,000 | |
Payments for Shares Redeemed | | | (84,986,710 | ) | | | (20,116,040 | ) | | | (1,394,875 | ) | | | — | |
Net Increase (Decrease) in Net Assets Derived from Capital Share Transactions(d) | | | 49,065,090 | | | | 63,722,525 | | | | (105,145 | ) | | | 2,489,000 | |
Net Increase in Net Assets | | $ | 47,539,190 | | | $ | 62,538,924 | | | $ | 339,122 | | | $ | 2,533,435 | |
| | | | | | | | | | | | | | | | | |
NET ASSETS | | | | | | | | | | | | | | | | |
Beginning of Period | | $ | 62,538,924 | | | $ | — | | | $ | 2,533,435 | | | $ | — | |
End of Period | | $ | 110,078,114 | | | $ | 62,538,924 | (e) | | $ | 2,872,557 | | | $ | 2,533,435 | (e) |
(a) | Fund commenced operations on December 11, 2017. The information presented is from December 11, 2017 to April 30, 2018. |
(b) | Fund commenced operations on April 9, 2018. The information presented is from April 9, 2018 to April 30, 2018. |
(c) | This amount is comprised of only net investment income. |
(d) | Summary of capital share transactions is as follows: |
| | Shares | Shares | Shares | Shares |
Subscriptions | 5,250,000 | 3,300,000 | 50,000 | 100,000 |
Redemptions | (3,350,000) | (800,000) | (50,000) | — |
Net Increase | 1,900,000 | 2,500,000 | — | 100,000 |
(e) | Includes undistributed accumulated net investment income of $60,273 and $342, respectively. |
The accompanying notes are an integral part of the financial statements.
88
Pacer Funds
STATEMENTS OF CHANGES IN NET ASSETS
| | | Pacer Benchmark
Retail Real
EstateSM ETF | | | Pacer Benchmark
Industrial Real
EstateSM ETF | |
| | | For the
Period Ended
April 30,
2019(a) | | | For the
Period Ended
April 30,
2019(b) | |
OPERATIONS | | | | | | | | |
Net Investment Income | | $ | 83,796 | | | $ | 69,245 | |
Net Realized Gain on Investments | | | 315,102 | | | | 165,946 | |
Change in Unrealized Appreciation of Investments | | | 60,380 | | | | 310,485 | |
Net Increase in Net Assets Resulting from Operations | | | 459,278 | | | | 545,676 | |
| | | | | | | | | |
DISTRIBUTIONS TO SHAREHOLDERS | | | | | | | | |
Net Investment Income | | | (83,796 | ) | | | (67,295 | ) |
Long-Term Capital Gain | | | (5,909 | ) | | | — | |
Return of Capital | | | (20,617 | ) | | | — | |
Total Distributions to Shareholders | | | (110,322 | ) | | | (67,295 | ) |
| | | | | | | | | |
CAPITAL SHARE TRANSACTIONS | | | | | | | | |
Proceeds from Shares Sold | | | 5,126,240 | | | | 13,242,420 | |
Payments for Shares Redeemed | | | (4,096,635 | ) | | | (6,365,095 | ) |
Net Increase in Net Assets Derived from Capital Share Transactions(c) | | | 1,029,605 | | | | 6,877,325 | |
Net Increase in Net Assets | | $ | 1,378,561 | | | $ | 7,355,706 | |
| | | | | | | | | |
NET ASSETS | | | | | | | | |
Beginning of Period | | $ | — | | | $ | — | |
End of Period | | $ | 1,378,561 | | | $ | 7,355,706 | |
(a) | Fund commenced operations on May 15, 2018. The information presented is from May 15, 2018 to April 30, 2019. |
(b) | Fund commenced operations on May 14, 2018. The information presented is from May 14, 2018 to April 30, 2019. |
(c) | Summary of capital share transactions is as follows: |
| | Shares | Shares |
Subscriptions | 200,000 | 500,000 |
Redemptions | (150,000) | (250,000) |
Net Increase | 50,000 | 250,000 |
The accompanying notes are an integral part of the financial statements.
89
Pacer Funds
STATEMENTS OF CHANGES IN NET ASSETS
| | | Pacer
Benchmark Data
& Infrastructure
Real EstateSM
ETF | | | Pacer US Export
Leaders ETF | |
| | | For the
Period Ended
April 30,
2019(a) | | | For the
Period Ended
April 30,
2019(b) | |
OPERATIONS | | | | | | | | |
Net Investment Income | | $ | 89,288 | | | $ | 7,415 | |
Net Realized Loss on Investments | | | (60,129 | ) | | | (157,032 | ) |
Change in Unrealized Appreciation of Investments | | | 1,325,510 | | | | 49,919 | |
Net Increase (Decrease) in Net Assets Resulting from Operations | | | 1,354,669 | | | | (99,698 | ) |
| | | | | | | | | |
DISTRIBUTIONS TO SHAREHOLDERS | | | | | | | | |
Dividends and Distributions | | | (89,513 | ) | | | (6,972 | ) |
Long-Term Capital Gain | | | (1,372 | ) | | | — | |
Return of Capital | | | (37,487 | ) | | | — | |
Total Distributions to Shareholders | | | (128,372 | ) | | | (6,972 | ) |
| | | | | | | | | |
CAPITAL SHARE TRANSACTIONS | | | | | | | | |
Proceeds from Shares Sold | | | 24,042,230 | | | | 2,498,000 | |
Payments for Shares Redeemed | | | (2,577,140 | ) | | | (1,092,940 | ) |
Net Increase in Net Assets Derived from Capital Share Transactions(c) | | | 21,465,090 | | | | 1,405,060 | |
Net Increase in Net Assets | | $ | 22,691,387 | | | $ | 1,298,390 | |
| | | | | | | | | |
NET ASSETS | | | | | | | | |
Beginning of Period | | $ | — | | | $ | — | |
End of Period | | $ | 22,691,387 | | | $ | 1,298,390 | |
(a) | Fund commenced operations on May 15, 2018. The information presented is from May 15, 2018 to April 30, 2019. |
(b) | Fund commenced operations on July 23, 2018. The information presented is from July 23, 2018 to April 30, 2019. |
(c) | Summary of capital share transactions is as follows: |
| | Shares | Shares |
Subscriptions | 900,000 | 100,000 |
Redemptions | (100,000) | (50,000) |
Net Increase | 800,000 | 50,000 |
The accompanying notes are an integral part of the financial statements.
90
Pacer Funds
STATEMENTS OF CHANGES IN NET ASSETS
| | | Pacer CFRA-
Stovall Equal
Weight Seasonal
Rotation ETF | |
| | | For the
Period Ended
April 30,
2019(a) | |
OPERATIONS | | | | |
Net Investment Income | | $ | 33,358 | |
Net Realized Gain on Investments | | | 647,636 | |
Change in Unrealized Depreciation of Investments | | | (1,983 | ) |
Net Increase in Net Assets Resulting from Operations | | | 679,011 | |
| | | | | |
DISTRIBUTIONS TO SHAREHOLDERS | | | | |
Dividends and Distributions | | | (29,474 | ) |
Total Distributions to Shareholders | | | (29,474 | ) |
| | | | | |
CAPITAL SHARE TRANSACTIONS | | | | |
Proceeds from Shares Sold | | | 13,278,420 | |
Payments for Shares Redeemed | | | (6,888,380 | ) |
Net Increase in Net Assets Derived from Capital Share Transactions(c) | | | 6,390,040 | |
Net Increase in Net Assets | | $ | 7,039,577 | |
| | | | | |
NET ASSETS | | | | |
Beginning of Period | | $ | — | |
End of Period | | $ | 7,039,577 | |
(a) | Fund commenced operations on July 23, 2018. The information presented is from July 23, 2018 to April 30, 2019. |
(b) | These amounts are only comprised of net investment income. |
(c) | Summary of capital share transactions is as follows: |
| | | Shares | |
Subscriptions | | | 500,000 | |
Redemptions | | | (250,000 | ) |
Net Increase | | | 250,000 | |
The accompanying notes are an integral part of the financial statements.
91
Pacer Trendpilot® US Large Cap ETF
Financial Highlights
For a capital share outstanding throughout the year/period
| | For the
Year Ended
April 30,
2019 | For the
Year Ended
April 30,
2018 | For the
Year Ended
April 30,
2017 | For the
Period Ended
April 30,
2016(a) |
Net Asset Value, Beginning of Period | $ 28.41 | $ 25.48 | $ 21.88 | $ 25.00 |
| | | | | |
INCOME (LOSS) FROM INVESTMENT OPERATIONS: | | | | |
Net Investment Income(b) | 0.43 | 0.37 | 0.34 | 0.13 |
Net Realized and Unrealized Gain (Loss) on Investments(f) | 2.01 | 2.84 | 3.52 | (3.15) |
Total from Investment Operations | 2.44 | 3.21 | 3.86 | (3.02) |
| | | | | |
LESS DISTRIBUTIONS: | | | | |
Distributions from Net Investment Income | (0.29) | (0.28) | (0.26) | (0.10) |
Total Distributions | (0.29) | (0.28) | (0.26) | (0.10) |
Net Asset Value, End of Period | $ 30.56 | $ 28.41 | $ 25.48 | $ 21.88 |
Total Return | 8.65% | 12.56% | 17.72% | -12.10%(c) |
| | | | | |
SUPPLEMENTAL DATA: | | | | |
Net Assets at End of Period (000’s) | $ 2,163,990 | $ 921,975 | $ 456,180 | $ 365,448 |
| | | | | |
RATIOS TO AVERAGE NET ASSETS: | | | | |
Expenses to Average Net Assets | 0.60% | 0.60% | 0.60% | 0.60%(d) |
Net Investment Income to Average Net Assets | 1.43% | 1.32% | 1.44% | 0.62%(d) |
Portfolio Turnover Rate(e) | 162% | 12% | 7% | 317%(c) |
(a) | Commencement of operations on June 11, 2015. |
(b) | Calculated based on average shares outstanding during the period. |
(e) | Excluded impact of in-kind transactions. |
(f) | Realized and unrealized gains and losses per share in this caption are balancing amounts necessary to reconcile to the change in net asset value for the period and may not reconcile with the aggregate gains and losses in the statement of operations due to the share transactions for the period. |
The accompanying notes are an integral part of the financial statements.
92
Pacer Trendpilot® US Mid Cap ETF
FINANCIAL HIGHLIGHTS
For a capital share outstanding throughout the year/period
| | | For the
Year Ended
April 30,
2019 | | | For the
Year Ended
April 30,
2018 | | | For the
Year Ended
April 30,
2017 | | | For the
Period Ended
April 30,
2016(a) | |
Net Asset Value, Beginning of Period | | $ | 30.72 | | | $ | 28.00 | | | $ | 23.78 | | | $ | 25.00 | |
| | | | | | | | | | | | | | | | | |
INCOME (LOSS) FROM INVESTMENT OPERATIONS: | | | | | | | | | | | | | | | | |
Net Investment Income (Loss)(b) | | | 0.41 | | | | 0.27 | | | | 0.27 | | | | (0.04 | ) |
Net Realized and Unrealized Gain (Loss) on Investments(f) | | | 0.10 | | | | 2.66 | | | | 4.13 | | | | (1.16 | ) |
Total from Investment Operations | | | 0.51 | | | | 2.93 | | | | 4.40 | | | | (1.20 | ) |
| | | | | | | | | | | | | | | | | |
LESS DISTRIBUTIONS: | | | | | | | | | | | | | | | | |
Distributions from Net Investment Income | | | (0.28 | ) | | | (0.21 | ) | | | (0.18 | ) | | | — | |
Distributions from Return of Capital | | | — | | | | — | | | | — | | | | (0.02 | ) |
Total Distributions | | | (0.28 | ) | | | (0.21 | ) | | | (0.18 | ) | | | (0.02 | ) |
Net Asset Value, End of Period | | $ | 30.95 | | | $ | 30.72 | | | $ | 28.00 | | | $ | 23.78 | |
Total Return | | | 1.66 | % | | | 10.42 | % | | | 18.54 | % | | | -4.82 | %(c) |
| | | | | | | | | | | | | | | | | |
SUPPLEMENTAL DATA: | | | | | | | | | | | | | | | | |
Net Assets at End of Period (000’s) | | $ | 761,305 | | | $ | 497,590 | | | $ | 281,430 | | | $ | 149,808 | |
| | | | | | | | | | | | | | | | | |
RATIOS TO AVERAGE NET ASSETS: | | | | | | | | | | | | | | | | |
Expenses to Average Net Assets | | | 0.60 | % | | | 0.60 | % | | | 0.60 | % | | | 0.60 | %(d) |
Net Investment Income to Average Net Assets | | | 1.30 | % | | | 0.91 | % | | | 1.02 | % | | | -0.17 | %(d) |
Portfolio Turnover Rate(e) | | | 405 | % | | | 66 | % | | | 27 | % | | | 379 | %(c) |
(a) | Commencement of operations on June 11, 2015. |
(b) | Calculated based on average shares outstanding during the period. |
(e) | Excluded impact of in-kind transactions. |
(f) | Realized and unrealized gains and losses per share in this caption are balancing amounts necessary to reconcile to the change in net asset value for the period and may not reconcile with the aggregate gains and losses in the statement of operations due to share transactions for the period. |
The accompanying notes are an integral part of the financial statements.
93
Pacer Trendpilot® 100 ETF
FINANCIAL HIGHLIGHTS
For a capital share outstanding throughout the year/period
| | | For the
Year Ended
April 30,
2019 | | | For the
Year Ended
April 30,
2018 | | | For the
Year Ended
April 30,
2017 | | | For the
Period Ended
April 30,
2016(a) | |
Net Asset Value, Beginning of Period | | $ | 31.16 | | | $ | 26.32 | | | $ | 21.44 | | | $ | 25.00 | |
| | | | | | | | | | | | | | | | | |
INCOME (LOSS) FROM INVESTMENT OPERATIONS: | | | | | | | | | | | | | | | | |
Net Investment Income(b) | | | 0.26 | | | | 0.11 | | | | 0.11 | | | | 0.04 | |
Net Realized and Unrealized Gain (Loss) on Investments(f) | | | 4.73 | | | | 4.83 | | | | 4.84 | | | | (3.55 | ) |
Total from Investment Operations | | | 4.99 | | | | 4.94 | | | | 4.95 | | | | (3.51 | ) |
| | | | | | | | | | | | | | | | | |
LESS DISTRIBUTIONS: | | | | | | | | | | | | | | | | |
Distributions from Net Investment Income | | | (0.15 | ) | | | (0.10 | ) | | | (0.07 | ) | | | (0.05 | ) |
Total Distributions | | | (0.15 | ) | | | (0.10 | ) | | | (0.07 | ) | | | (0.05 | ) |
Net Asset Value, End of Period | | $ | 36.00 | | | $ | 31.16 | | | $ | 26.32 | | | $ | 21.44 | |
Total Return | | | 16.04 | % | | | 18.78 | % | | | 23.11 | % | | | -14.04 | %(c) |
| | | | | | | | | | | | | | | | | |
SUPPLEMENTAL DATA: | | | | | | | | | | | | | | | | |
Net Assets at End of Period (000’s) | | $ | 502,173 | | | $ | 211,906 | | | $ | 73,696 | | | $ | 69,689 | |
| | | | | | | | | | | | | | | | | |
RATIOS TO AVERAGE NET ASSETS: | | | | | | | | | | | | | | | | |
Expenses to Average Net Assets | | | 0.65 | % | | | 0.65 | % | | | 0.65 | % | | | 0.65 | %(d) |
Net Investment Income to Average Net Assets | | | 0.76 | % | | | 0.38 | % | | | 0.46 | % | | | 0.18 | %(d) |
Portfolio Turnover Rate(e) | | | 107 | % | | | 3 | % | | | 125 | % | | | 295 | %(c) |
(a) | Commencement of operations on June 11, 2015. |
(b) | Calculated based on average shares outstanding during the period. |
(e) | Excluded impact of in-kind transactions. |
(f) | Realized and unrealized gains and losses per share in this caption are balancing amounts necessary to reconcile to the change in net asset value for the period and may not reconcile with the aggregate gains and losses in the statement of operations due to the share transactions for the period. |
The accompanying notes are an integral part of the financial statements.
94
Pacer Trendpilot® European Index ETF
FINANCIAL HIGHLIGHTS
For a capital share outstanding throughout the year/period
| | | For the
Year Ended
April 30,
2019 | | | For the
Year Ended
April 30,
2018 | | | For the
Year Ended
April 30,
2017 | | | For the
Period Ended
April 30,
2016(a) | |
Net Asset Value, Beginning of Period | | $ | 29.66 | | | $ | 27.03 | | | $ | 24.97 | | | $ | 25.00 | |
| | | | | | | | | | | | | | | | | |
INCOME (LOSS) FROM INVESTMENT OPERATIONS: | | | | | | | | | | | | | | | | |
Net Investment Gain (Loss)(b) | | | 0.74 | | | | 0.51 | | | | 0.18 | | | | (0.04 | ) |
Net Realized and Unrealized Gain (Loss) on Investments(h) | | | (3.16 | ) | | | 2.31 | | | | 1.88 | (c) | | | 0.01 | |
Total from Investment Operations | | | (2.42 | ) | | | 2.82 | | | | 2.06 | | | | (0.03 | ) |
| | | | | | | | | | | | | | | | | |
LESS DISTRIBUTIONS: | | | | | | | | | | | | | | | | |
Distributions from Net Investment Income | | | (0.47 | ) | | | (0.19 | ) | | | — | | | | — | |
Total Distributions | | | (0.47 | ) | | | (0.19 | ) | | | — | | | | — | |
Net Asset Value, End of Period | | $ | 26.77 | | | $ | 29.66 | | | $ | 27.03 | | | $ | 24.97 | |
Total Return | | | -8.07 | % | | | 10.43 | % | | | 8.25 | %(e) | | | -0.13 | %(d) |
| | | | | | | | | | | | | | | | | |
SUPPLEMENTAL DATA: | | | | | | | | | | | | | | | | |
Net Assets at End of Period (000’s) | | $ | 183,379 | | | $ | 158,703 | | | $ | 31,081 | | | $ | 22,470 | |
| | | | | | | | | | | | | | | | | |
RATIOS TO AVERAGE NET ASSETS: | | | | | | | | | | | | | | | | |
Expenses to Average Net Assets | | | 0.65 | % | | | 0.65 | % | | | 0.65 | % | | | 0.65 | %(f) |
Net Investment Income (Loss) to Average Net Assets | | | 2.77 | % | | | 1.69 | % | | | 0.77 | % | | | -0.39 | %(f) |
Portfolio Turnover Rate(g) | | | 396 | % | | | 228 | % | | | 143 | % | | | 0 | %(d) |
(a) | Commencement of operations on December 14, 2015. |
(b) | Calculated based on average shares outstanding during the period. |
(c) | Includes $0.41 gain derived from contribution from a settlement. See Note 8. |
(e) | Before the contribution from a settlement, the total return for the year would have been 6.60%. See Note 8. |
(g) | Excluded impact of in-kind transactions. |
(h) | Realized and unrealized gains and losses per share in this caption are balancing amounts necessary to reconcile to the change in net asset value for the period and may not reconcile with the aggregate gains and losses in the statement of operations due to the share transactions for the period. |
The accompanying notes are an integral part of the financial statements.
95
Pacer Global Cash Cows Dividend ETF
FINANCIAL HIGHLIGHTS
For a capital share outstanding throughout the year/period
| | | For the
Year Ended
April 30,
2019 | | | For the
Year Ended
April 30,
2018 | | | For the
Year Ended
April 30,
2017 | | | For the
Period Ended
April 30,
2016(a) | |
Net Asset Value, Beginning of Period | | $ | 30.75 | | | $ | 28.60 | | | $ | 27.16 | | | $ | 25.00 | |
| | | | | | | | | | | | | | | | | |
INCOME FROM INVESTMENT OPERATIONS: | | | | | | | | | | | | | | | | |
Net Investment Income(b) | | | 1.21 | | | | 1.07 | | | | 0.88 | | | | 0.23 | |
Net Realized and Unrealized Gain on Investments(f) | | | 0.43 | | | | 2.01 | | | | 1.26 | | | | 1.93 | |
Total from Investment Operations | | | 1.64 | | | | 3.08 | | | | 2.14 | | | | 2.16 | |
| | | | | | | | | | | | | | | | | |
LESS DISTRIBUTIONS: | | | | | | | | | | | | | | | | |
Distributions from Net Investment Income | | | (1.20 | ) | | | (0.93 | ) | | | (0.70 | ) | | | — | |
Total Distributions | | | (1.20 | ) | | | (0.93 | ) | | | (0.70 | ) | | | — | |
Net Asset Value, End of Period | | $ | 31.19 | | | $ | 30.75 | | | $ | 28.60 | | | $ | 27.16 | |
Total Return | | | 5.56 | % | | | 10.86 | % | | | 8.03 | % | | | 8.64 | %(c) |
| | | | | | | | | | | | | | | | | |
SUPPLEMENTAL DATA: | | | | | | | | | | | | | | | | |
Net Assets at End of Period (000’s) | | $ | 210,505 | | | $ | 173,710 | | | $ | 70,059 | | | $ | 5,432 | |
| | | | | | | | | | | | | | | | | |
RATIOS TO AVERAGE NET ASSETS: | | | | | | | | | | | | | | | | |
Expenses to Average Net Assets | | | 0.60 | % | | | 0.60 | % | | | 0.60 | % | | | 0.60 | %(d) |
Net Investment Income to Average Net Assets | | | 4.00 | % | | | 3.50 | % | | | 3.19 | % | | | 4.63 | %(d) |
Portfolio Turnover Rate(e) | | | 74 | % | | | 76 | % | | | 44 | % | | | 0 | %(c) |
(a) | Commencement of operations on February 22, 2016. |
(b) | Calculated based on average shares outstanding during the period. |
(e) | Excluded impact of in-kind transactions. |
(f) | Realized and unrealized gains and losses per share in this caption are balancing amounts necessary to reconcile to the change in net asset value for the period and may not reconcile with the aggregate gains and losses in the statement of operations due to the share transactions for the period. |
The accompanying notes are an integral part of the financial statements.
96
Pacer US Cash Cows 100 ETF
FINANCIAL HIGHLIGHTS
For a capital share outstanding throughout the year/period
| | | For the
Year Ended
April 30,
2019 | | | For the
Year Ended
April 30,
2018 | | | For the
Period Ended
April 30,
2017(a) | |
Net Asset Value, Beginning of Period | | $ | 28.98 | | | $ | 26.13 | | | $ | 25.00 | |
| | | | | | | | | | | | | |
INCOME FROM INVESTMENT OPERATIONS: | | | | | | | | | | | | |
Net Investment Income(b) | | | 0.53 | | | | 0.61 | | | | 0.13 | |
Net Realized and Unrealized Gain on Investments(f) | | | 0.67 | | | | 2.84 | | | | 1.09 | |
Total from Investment Operations | | | 1.20 | | | | 3.45 | | | | 1.22 | |
| | | | | | | | | | | | | |
LESS DISTRIBUTIONS: | | | | | | | | | | | | |
Distributions from Net Investment Income | | | (0.46 | ) | | | (0.60 | ) | | | (0.09 | ) |
Total Distributions | | | (0.46 | ) | | | (0.60 | ) | | | (0.09 | ) |
Net Asset Value, End of Period | | $ | 29.72 | | | $ | 28.98 | | | $ | 26.13 | |
Total Return | | | 4.28 | % | | | 13.35 | % | | | 4.87 | %(c) |
| | | | | | | | | | | | | |
SUPPLEMENTAL DATA: | | | | | | | | | | | | |
Net Assets at End of Period (000’s) | | $ | 266,018 | | | $ | 28,981 | | | $ | 11,759 | |
| | | | | | | | | | | | | |
RATIOS TO AVERAGE NET ASSETS: | | | | | | | | | | | | |
Expenses to Average Net Assets | | | 0.49 | % | | | 0.49 | % | | | 0.49 | %(d) |
Net Investment Income to Average Net Assets | | | 1.82 | % | | | 2.16 | % | | | 1.37 | %(d) |
Portfolio Turnover Rate(e) | | | 122 | % | | | 101 | % | | | 36 | %(c) |
(a) | Commencement of operations on December 16, 2016. |
(b) | Calculated based on average shares outstanding during the period. |
(e) | Excluded impact of in-kind transactions. |
(f) | Realized and unrealized gains and losses per share in this caption are balancing amounts necessary to reconcile to the change in net asset value for the period and may not reconcile with the aggregate gains and losses in the statement of operations due to the share transactions for the period. |
The accompanying notes are an integral part of the financial statements.
97
Pacer US Small Cap Cash Cows 100 ETF
FINANCIAL HIGHLIGHTS
For a capital share outstanding throughout the year/period
| | For the
Year Ended
April 30,
2019 | For the
Period Ended
April 30,
2018(a) |
Net Asset Value, Beginning of Period | $ 26.17 | $ 24.78 |
| | | |
INCOME (LOSS) FROM INVESTMENT OPERATIONS: | | |
Net Investment Income(b) | 0.32 | 0.28 |
Net Realized and Unrealized Gain (Loss) on Investments(f) | (0.29) | 1.38 |
Total from Investment Operations | 0.03 | 1.66 |
| | | |
LESS DISTRIBUTIONS: | | |
Distributions from Net Investment Income | (0.32) | (0.27) |
Total Distributions | (0.32) | (0.27) |
Net Asset Value, End of Period | $ 25.88 | $ 26.17 |
Total Return | 0.20% | 6.69%(c) |
| | | |
SUPPLEMENTAL DATA: | | |
Net Assets at End of Period (000’s) | $ 50,474 | $ 5,233 |
| | | |
RATIOS TO AVERAGE NET ASSETS: | | |
Expenses to Average Net Assets | 0.59% | 0.59%(d) |
Net Investment Income to Average Net Assets | 1.21% | 1.25%(d) |
Portfolio Turnover Rate(e) | 123% | 97%(c) |
(a) | Commencement of operations on June 16, 2017. |
(b) | Calculated based on average shares outstanding during the period. |
(e) | Excluded impact of in-kind transactions. |
(f) | Realized and unrealized gains and losses per share in this caption are balancing amounts necessary to reconcile to the change in net asset value for the period and may not reconcile with the aggregate gains and losses in the statement of operations due to the share transactions for the period. |
The accompanying notes are an integral part of the financial statements.
98
Pacer Developed Markets International Cash Cows 100 ETF
FINANCIAL HIGHLIGHTS
For a capital share outstanding throughout the year/period
| | | For the
Year Ended
April 30,
2019 | | | For the
Period Ended
April 30,
2018(a) | |
Net Asset Value, Beginning of Period | | $ | 28.91 | | | $ | 25.09 | |
| | | | | | | | | |
INCOME FROM INVESTMENT OPERATIONS: | | | | | | | | |
Net Investment Income(b) | | | 0.85 | | | | 0.60 | |
Net Realized and Unrealized Gain (Loss) on Investments(f) | | | (2.01 | ) | | | 3.53 | |
Total from Investment Operations | | | (1.16 | ) | | | 4.13 | |
| | | | | | | | | |
LESS DISTRIBUTIONS: | | | | | | | | |
Distributions from Net Investment Income | | | (0.67 | ) | | | (0.31 | ) |
Total Distributions | | | (0.67 | ) | | | (0.31 | ) |
Net Asset Value, End of Period | | $ | 27.08 | | | $ | 28.91 | |
Total Return | | | -3.92 | % | | | 16.48 | %(c) |
| | | | | | | | | |
SUPPLEMENTAL DATA: | | | | | | | | |
Net Assets at End of Period (000’s) | | $ | 33,844 | | | $ | 20,235 | |
| | | | | | | | | |
RATIOS TO AVERAGE NET ASSETS: | | | | | | | | |
Expenses to Average Net Assets | | | 0.65 | % | | | 0.65 | %(d) |
Net Investment Income to Average Net Assets | | | 3.18 | % | | | 2.42 | %(d) |
Portfolio Turnover Rate(e) | | | 80 | % | | | 25 | %(c) |
(a) | Commencement of operations on June 16, 2017. |
(b) | Calculated based on average shares outstanding during the period. |
(e) | Excluded impact of in-kind transactions. |
(f) | Realized and unrealized gains and losses per share in this caption are balancing amounts necessary to reconcile to the change in net asset value for the period and may not reconcile with the aggregate gains and losses in the statement of operations due to the share transactions for the period. |
The accompanying notes are an integral part of the financial statements.
99
Pacer WealthShield ETF
FINANCIAL HIGHLIGHTS
For a capital share outstanding throughout the year/period
| | | For the
Year Ended
April 30,
2019 | | | For the
Period Ended
April 30,
2018(a) | |
Net Asset Value, Beginning of Period | | $ | 25.02 | | | $ | 25.02 | |
| | | | | | | | | |
INCOME FROM INVESTMENT OPERATIONS: | | | | | | | | |
Net Investment Income(b) | | | 0.38 | | | | 0.10 | |
Net Realized and Unrealized Loss on Investments(f) | | | (0.01 | ) | | | (0.05 | ) |
Total from Investment Operations | | | 0.37 | | | | 0.05 | |
| | | | | | | | | |
LESS DISTRIBUTIONS: | | | | | | | | |
Distributions from Net Investment Income | | | (0.37 | ) | | | (0.05 | ) |
Total Distributions | | | (0.37 | ) | | | (0.05 | ) |
Net Asset Value, End of Period | | $ | 25.02 | | | $ | 25.02 | |
Total Return | | | 1.43 | % | | | 0.23 | %(c) |
| | | | | | | | | |
SUPPLEMENTAL DATA: | | | | | | | | |
Net Assets at End of Period (000’s) | | $ | 110,078 | | | $ | 62,539 | |
| | | | | | | | | |
RATIOS TO AVERAGE NET ASSETS: | | | | | | | | |
Expenses to Average Net Assets | | | 0.60 | % | | | 0.60 | %(d) |
Net Investment Income to Average Net Assets | | | 1.52 | % | | | 1.04 | %(d) |
Portfolio Turnover Rate(e) | | | 542 | % | | | 131 | %(c) |
(a) | Commencement of operations on December 11, 2017. |
(b) | Calculated based on average shares outstanding during the period. |
(e) | Excluded impact of in-kind transactions. |
(f) | Realized and unrealized gains and losses per share in this caption are balancing amounts necessary to reconcile to the change in net asset value for the period and may not reconcile with the aggregate gains and losses in the statement of operations due to the share transactions for the period. |
The accompanying notes are an integral part of the financial statements.
100
Pacer Military Times Best Employers ETF
FINANCIAL HIGHLIGHTS
For a capital share outstanding throughout the year/period
| | | For the
Year Ended
April 30,
2019 | | | For the
Period Ended
April 30,
2018(a) | |
Net Asset Value, Beginning of Period | | $ | 25.33 | | | $ | 24.89 | |
| | | | | | | | | |
INCOME FROM INVESTMENT OPERATIONS: | | | | | | | | |
Net Investment Income(b) | | | 0.44 | | | | — | (c) |
Net Realized and Unrealized Gain on Investments(g) | | | 3.43 | | | | 0.44 | |
Total from Investment Operations | | | 3.87 | | | | 0.44 | |
| | | | | | | | | |
LESS DISTRIBUTIONS: | | | | | | | | |
Distributions from Net Investment Income | | | (0.47 | ) | | | — | |
Total Distributions | | | (0.47 | ) | | | — | |
Net Asset Value, End of Period | | $ | 28.73 | | | $ | 25.33 | |
Total Return | | | 15.46 | % | | | 1.79 | %(d) |
| | | | | | | | | |
SUPPLEMENTAL DATA: | | | | | | | | |
Net Assets at End of Period (000’s) | | $ | 2,873 | | | $ | 2,533 | |
| | | | | | | | | |
RATIOS TO AVERAGE NET ASSETS: | | | | | | | | |
Expenses to Average Net Assets | | | 0.60 | % | | | 0.60 | %(e) |
Net Investment Income to Average Net Assets | | | 1.66 | % | | | 0.25 | %(e) |
Portfolio Turnover Rate(f) | | | 9 | % | | | 0 | %(d) |
(a) | Commencement of operations on April 9, 2018. |
(b) | Calculated based on average shares outstanding during the period. |
(f) | Excluded impact of in-kind transactions. |
(g) | Realized and unrealized gains and losses per share in this caption are balancing amounts necessary to reconcile to the change in net asset value for the period and may not reconcile with the aggregate gains and losses in the statement of operations due to the share transactions for the period. |
The accompanying notes are an integral part of the financial statements.
101
Pacer Benchmark Retail Real Estate SCTRSM ETF
FINANCIAL HIGHLIGHTS
For a capital share outstanding throughout the period
| | | For the
Period Ended
April 30,
2019(a) | |
Net Asset Value, Beginning of Period | | $ | 24.30 | |
| | | | | |
INCOME FROM INVESTMENT OPERATIONS: | | | | |
Net Investment Income(b) | | | 0.87 | |
Net Realized and Unrealized Gain on Investments(f) | | | 3.50 | |
Total from Investment Operations | | | 4.37 | |
| | | | | |
LESS DISTRIBUTIONS: | | | | |
Distributions from: | | | | |
Net Investment Income | | | (0.83 | ) |
Long-Term Capital Gain | | | (0.06 | ) |
Return of Capital | | | (0.21 | ) |
Total Distributions | | | (1.10 | ) |
Net Asset Value, End of Period | | $ | 27.57 | |
Total Return | | | 18.30 | %(c) |
| | | | | |
SUPPLEMENTAL DATA: | | | | |
Net Assets at End of Period (000’s) | | $ | 1,379 | |
| | | | | |
RATIOS TO AVERAGE NET ASSETS: | | | | |
Expenses to Average Net Assets | | | 0.60 | %(d) |
Net Investment Income to Average Net Assets | | | 3.33 | %(d) |
Portfolio Turnover Rate(e) | | | 60 | %(c) |
(a) | Commencement of operations on May 15, 2018. |
(b) | Calculated based on average shares outstanding during the period. |
(e) | Excluded impact of in-kind transactions. |
(f) | Realized and unrealized gains and losses per share in this caption are balancing amounts necessary to reconcile to the change in net asset value for the period and may not reconcile with the aggregate gains and losses in the statement of operations due to the share transactions for the period. |
The accompanying notes are an integral part of the financial statements.
102
Pacer Benchmark Industrial Real Estate SCTRSM ETF
FINANCIAL HIGHLIGHTS
For a capital share outstanding throughout the period
| | | For the
Period Ended
April 30,
2019(a) | |
Net Asset Value, Beginning of Period | | $ | 24.83 | |
| | | | | |
INCOME FROM INVESTMENT OPERATIONS: | | | | |
Net Investment Income(b) | | | 0.65 | |
Net Realized and Unrealized Gain on Investments(g) | | | 4.61 | |
Total from Investment Operations | | | 5.26 | |
| | | | | |
LESS DISTRIBUTIONS: | | | | |
Distributions from Net Investment Income(f) | | | (0.67 | ) |
Total Distributions | | | (0.67 | ) |
Net Asset Value, End of Period | | $ | 29.42 | |
Total Return | | | 21.62 | %(c) |
| | | | | |
SUPPLEMENTAL DATA: | | | | |
Net Assets at End of Period (000’s) | | $ | 7,356 | |
| | | | | |
RATIOS TO AVERAGE NET ASSETS: | | | | |
Expenses to Average Net Assets | | | 0.60 | %(d) |
Net Investment Income to Average Net Assets | | | 2.60 | %(d) |
Portfolio Turnover Rate(e) | | | 36 | %(c) |
(a) | Commencement of operations on May 14, 2018. |
(b) | Calculated based on average shares outstanding during the period. |
(e) | Excluded impact of in-kind transactions. |
(f) | These amounts are comprised of only net investment income. |
(g) | Realized and unrealized gains and losses per share in this caption are balancing amounts necessary to reconcile to the change in net asset value for the period and may not reconcile with the aggregate gains and losses in the statement of operations due to the share transactions for the period. |
The accompanying notes are an integral part of the financial statements.
103
Pacer Benchmark Data & Infrastructure Real Estate SCTRSM ETF
FINANCIAL HIGHLIGHTS
For a capital share outstanding throughout the period
| | | For the
Period Ended
April 30,
2019(a) | |
Net Asset Value, Beginning of Period | | $ | 24.67 | |
| | | | | |
INCOME FROM INVESTMENT OPERATIONS: | | | | |
Net Investment Income(b) | | | 0.39 | |
Net Realized and Unrealized Gain on Investments(f) | | | 3.93 | |
Total from Investment Operations | | | 4.32 | |
| | | | | |
LESS DISTRIBUTIONS: | | | | |
Distributions from: | | | | |
Net Investment Income | | | (0.44 | ) |
Long-Term Capital Gain | | | (0.01 | ) |
Return of Capital | | | (0.18 | ) |
Total Distributions | | | (0.63 | ) |
Net Asset Value, End of Period | | $ | 28.36 | |
Total Return | | | 17.89 | %(c) |
| | | | | |
SUPPLEMENTAL DATA: | | | | |
Net Assets at End of Period (000’s) | | $ | 22,691 | |
| | | | | |
RATIOS TO AVERAGE NET ASSETS: | | | | |
Expenses to Average Net Assets | | | 0.60 | %(d) |
Net Investment Income to Average Net Assets | | | 1.55 | %(d) |
Portfolio Turnover Rate(e) | | | 27 | %(c) |
(a) | Commencement of operations on May 15, 2018. |
(b) | Calculated based on average shares outstanding during the period. |
(e) | Excluded impact of in-kind transactions. |
(f) | Realized and unrealized gains and losses per share in this caption are balancing amounts necessary to reconcile to the change in net asset value for the period and may not reconcile with the aggregate gains and losses in the statement of operations due to the share transactions for the period. |
The accompanying notes are an integral part of the financial statements.
104
Pacer US Export Leaders ETF
FINANCIAL HIGHLIGHTS
For a capital share outstanding throughout the period
| | | For the
Period Ended
April 30,
2019(a) | |
Net Asset Value, Beginning of Period | | $ | 24.98 | |
| | | | | |
INCOME FROM INVESTMENT OPERATIONS: | | | | |
Net Investment Income(b) | | | 0.09 | |
Net Realized and Unrealized Gain on Investments(f) | | | 0.98 | |
Total from Investment Operations | | | 1.07 | |
| | | | | |
LESS DISTRIBUTIONS: | | | | |
Distributions from Net Investment Income | | | (0.08 | ) |
Total Distributions | | | (0.08 | ) |
Net Asset Value, End of Period | | $ | 25.97 | |
Total Return | | | 4.33 | %(c) |
| | | | | |
SUPPLEMENTAL DATA: | | | | |
Net Assets at End of Period (000’s) | | $ | 1,298 | |
| | | | | |
RATIOS TO AVERAGE NET ASSETS: | | | | |
Expenses to Average Net Assets | | | 0.60 | %(d) |
Net Investment Income to Average Net Assets | | | 0.50 | %(d) |
Portfolio Turnover Rate(e) | | | 55 | %(c) |
(a) | Commencement of operations on July 23, 2018. |
(b) | Calculated based on average shares outstanding during the period. |
(e) | Excluded impact of in-kind transactions. |
(f) | Realized and unrealized gains and losses per share in this caption are balancing amounts necessary to reconcile to the changes in net asset value for the period of operations due to share transactions for the period and may not reconcile with aggregate gains and losses in the statement of operations due to the share transactions for the period. |
The accompanying notes are an integral part of the financial statements.
105
Pacer CFRA-Stovall Equal Weight Seasonal Rotation ETF
FINANCIAL HIGHLIGHTS
For a capital share outstanding throughout the period
| | | For the
Period Ended
April 30,
2019(a) | |
Net Asset Value, Beginning of Period | | $ | 25.01 | |
| | | | | |
INCOME FROM INVESTMENT OPERATIONS: | | | | |
Net Investment Income(b) | | | 0.25 | |
Net Realized and Unrealized Gain on Investments(g) | | | 3.11 | |
Total from Investment Operations | | | 3.36 | |
| | | | | |
LESS DISTRIBUTIONS: | | | | |
Distributions from Net Investment Income | | | (0.21 | ) |
Total Distributions | | | (0.21 | ) |
Net Asset Value, End of Period | | $ | 28.16 | |
Total Return | | | 13.67 | %(c)(f) |
| | | | | |
SUPPLEMENTAL DATA: | | | | |
Net Assets at End of Period (000’s) | | $ | 7,040 | |
| | | | | |
RATIOS TO AVERAGE NET ASSETS: | | | | |
Expenses to Average Net Assets | | | 0.60 | %(d) |
Net Investment Income to Average Net Assets | | | 1.23 | %(d) |
Portfolio Turnover Rate(e) | | | 262 | %(c) |
(a) | Commencement of operations on July 23, 2018. |
(b) | Calculated based on average shares outstanding during the period. |
(e) | Excluded impact of in-kind transactions. |
(f) | Total Return was calculated using the traded NAV due to the rebalancing of the portfolio at April 30, 2019. |
(g) | Realized and unrealized gains and losses per share in this caption are balancing amounts necessary to reconcile to the change in net asset value for the period and may not reconcile with the aggregate gains and losses in the statement of operations due to the share transactions for the period. |
The accompanying notes are an integral part of the financial statements.
106
Pacer Funds
Notes to Financial Statements
April 30, 2019
NOTE 1 – ORGANIZATION
Pacer Trendpilot® US Large Cap ETF (“PTLC”), Pacer Trendpilot® US Mid Cap ETF (“PTMC”), Pacer Trendpilot® 100 ETF (“PTNQ”), Pacer Trendpilot® European Index ETF (“PTEU”), Pacer Global Cash Cows Dividend ETF (“GCOW”), Pacer US Cash Cows 100 ETF (“COWZ”), Pacer US Small Cap Cash Cows 100 ETF (“CALF”), Pacer Developed Markets International Cash Cows 100 ETF (“ICOW”), Pacer WealthShield ETF (“PWS”), Pacer Military Times Best Employers ETF (“VETS”), Pacer Benchmark Industrial Real Estate SCTRSM ETF (“INDS”), Pacer Benchmark Retail Real Estate SCTRSM ETF (“RTL”), Pacer Benchmark Data & Infrastructure Real Estate SCTRSM ETF (“SRVR”), Pacer US Export Leaders ETF (“PEXL”), and Pacer CFRA-Stovall Equal Weight Seasonal Rotation Index ETF (“SZNE”) (individually the “Fund” or collectively the “Funds”) are series of Pacer Funds Trust (the “Trust”), a Delaware statutory trust organized on August 12, 2014. The Trust is registered with the Securities and Exchange Commission (the “SEC”) under the Investment Company Act of 1940, as amended (the “1940 Act”), as an open-end management investment company and the offering of the Funds’ shares (“Shares”) is registered under the Securities Act of 1933, as amended (the “Securities Act”). The investment objectives of the Funds are to seek to track the total return performance, before fees and expenses, of the Pacer Trendpilot® US Large Cap Index, the Pacer Trendpilot® US Mid-Cap Index, the Pacer NASDAQ-100 Trendpilot® Index, the Pacer Trendpilot® European Index, the Pacer Global Cash Cows High Dividends 100 Index, the Pacer US Cash Cows 100 Index, the Pacer US Small Cap Cash Cows Index, the Pacer Developed Markets International Cash Cows 100 Index, the Pacer WealthShield Index, the Military Times Best for VETSSM Index, the Benchmark Industrial Real Estate SCTRSM Index, the Benchmark Retail Real Estate SCTRSM Index, the Benchmark Data & Infrastructure Real Estate SCTRSM Index, the PEXL and the Pacer CFRA-Stovall Equal Weight Seasonal Rotation Index. PTLC, PTMC, and PTNQ commenced operations on June 11, 2015. PTEU commenced operations on December 14, 2015. GCOW commenced operations on February 22, 2016. COWZ commenced operations on December 16, 2016. CALF and ICOW commenced operations on June 16, 2017. PWS commenced operations on December 11, 2017. VETS commenced operations on April 9, 2018. INDS commenced operations on May 14, 2018. RTL and SRVR commenced operations on May 15, 2018. PEXL and SZNE commenced operations on July 23, 2018. Each of the Funds are non-diversified series of the Trust.
Shares of the Funds are listed and traded on the Cboe BZX Exchange, Inc. (“Cboe”) with the exceptions of VETS, which is listed and traded on the Nasdaq Stock Market LLC (“Nasdaq”) and RTL, INDS, SRVR, PEXL, and SZNE, which are listed and traded on the NYSE Arca, Inc. (“NYSE”). Market prices for the shares may be different from their net asset value (“NAV”). The Funds issue and redeem shares on a continuous basis at NAV only in large blocks of shares, called “Creation Units,” which generally consist of 50,000 shares. Creation Units are issued and redeemed principally in-kind for securities included in a specified universe. Once created, Shares generally trade in the secondary market at market prices that change throughout the day in amounts less than a Creation Unit. Except when aggregated in Creation Units, Shares are not redeemable securities of a Fund. Shares of a Fund may only be purchased directly from or redeemed directly to a Fund by certain financial institutions (“Authorized Participants”). An Authorized Participant is either (i) a broker-dealer or other participant in the clearing process through the Continuous Net Settlement System of the National Securities Clearing Corporation or (ii) a DTC participant and, in each case, must have executed a Participant Agreement with Pacer Financial, Inc. (the “Distributor”). Most retail investors do not qualify as Authorized Participants nor have the resources to buy and sell whole Creation Units. Therefore, they are unable to purchase or redeem the shares directly from a Fund. Rather, most retail investors may purchase Shares in the secondary market with the assistance of a broker and are subject to customary brokerage commissions or fees.
The Funds each currently offer one class of Shares, which have no front end sales loads, no deferred sales charges, and no redemption fees. A purchase (i.e., creation) transaction fee is imposed for the transfer and other transaction costs associated with the purchase of Creation Units. PTLC charges $500, PTMC charges $500, PTNQ charges $250, PTEU charges $2,000, GCOW charges $1,500, COWZ charges $250, CALF charges $250, ICOW charges $1,500, PWS charges $500, VETS charges $250, INDS charges $250, RTL charges $250, SRVR charges $250, PEXL charges $250, and SZNE charges $500 for the standard fixed creation fee, payable to the Custodian. For the PTLC, PTMC, PTNQ, and the PTEU, the standard fixed creation transaction fee is $200 when the Deposit Securities include only U.S. Treasury bills. The fixed transaction fee may be waived on certain orders if the Fund’s Custodian has determined to waive some or all of the costs associated with the order, or another party, such as the Adviser, has agreed to pay such fee. In addition, a variable fee may be charged on all cash transactions or substitutes for Creation Units of up to a maximum of 2% as a percentage of the value of the Creation Units subject to the transaction. Variable fees received by each Fund are displayed in the Capital Share Transaction section of the Statement of Changes in Net Assets. Each Fund may issue an unlimited number of shares of beneficial interest, with no par value. Shares of each Fund have equal rights and privileges with respect to such Fund.
107
Pacer Funds
NOTES TO FINANCIAL STATEMENTS
April 30, 2019 (Continued)
NOTE 2 – SIGNIFICANT ACCOUNTING POLICIES
The following is a summary of significant accounting policies consistently followed by the Funds in the preparation of the financial statements. The financial statements have been prepared in conformity with accounting principles generally accepted in the United States of America (“GAAP”). The Funds are investment companies that follow the accounting and reporting guidelines of the Financial Accounting Standards Board (“FASB”) Accounting Standards Codification Topic 946 applicable to investment companies.
A. | Investment Valuation. Securities listed on a securities exchange, market or automated quotation system for which quotations are readily available, are valued at the last quoted sale price on the primary exchange or market (foreign or domestic) on which they are traded, except for securities listed on Nasdaq Global Market®, Nasdaq Global Select Market®, and Nasdaq Capital Market Exchange® (collectively “Nasdaq”). If, on a particular day, there is no such reported sale, then the most recent quoted bid price will be used. For securities traded on Nasdaq, the Nasdaq Official Closing Price (“NOCP”) will be used. If a Fund holds foreign shares of a security for which there is no reported volume, and there is an actively trading local version of the security, the last quoted sale price of the local security shall be used. Prices denominated in foreign currencies are converted to U.S. dollar equivalents at the current exchange rate. |
Investments in other open-end investment companies, including money market funds, are valued at the investment company’s net asset value per share, with the exception of exchange-traded open-end investment companies, which are priced as equity securities described above.
Fixed-income securities are normally valued on the basis of quotes obtained from independent pricing services in accordance with the procedures adopted by the Board of Trustees (the “Board”). The independent pricing services may employ methodologies that utilize market transactions (if the security is actively traded), broker-dealer supplied valuations, or matrix pricing. Short-term securities that have maturities of less than 60 days, at the time of purchase, are valued at amortized cost, which, when combined with accrued interest, approximates market value.
Any securities for which there are no readily available market quotations and other assets will be valued at their fair value as determined in good faith by the Fair Value Pricing Committee using the Fair Value Procedures approved by the Board.
As described above, the Funds utilize various methods to measure the fair value of their investments on a recurring basis. GAAP establishes a hierarchy that prioritizes inputs to valuations methods. The three levels of inputs are:
| | Level 1 – | Unadjusted quoted prices in active markets for identical assets or liabilities that the Funds have the ability to access. |
| | Level 2 – | Observable inputs other than quoted prices included in Level 1 that are observable for the asset or liability, either directly or indirectly. These inputs may include quoted prices for the identical instrument on an inactive market, prices for similar instruments, interest rates, prepayment speeds, credit risk, yield curves, default rates and similar data. |
| | Level 3 – | Unobservable inputs for the asset or liability, to the extent relevant observable inputs are not available; representing the Funds’ own assumptions about the assumptions a market participant would use in valuing the asset or liability, and would be based on the best information available. |
The availability of observable inputs can vary from security to security and is affected by a wide variety of factors, including, for example, the type of security, whether the security is new and not yet established in the marketplace, the liquidity of markets, and other characteristics particular to the security. To the extent that valuation is based on models or inputs that are less observable or unobservable in the market, the determination of fair value requires more judgment. Accordingly, the degree of judgment exercised in determining fair value is greatest for instruments categorized in Level 3.
The inputs used to measure fair value may fall into different levels of the fair value hierarchy. In such cases, for disclosure purposes, the level in the fair value hierarchy within which the fair value measurement falls in its entirety, is determined based on the lowest level input that is significant to the fair value measurement in its entirety.
108
Pacer Funds
NOTES TO FINANCIAL STATEMENTS
April 30, 2019 (Continued)
The following is a summary of the inputs used to value the Funds’ investments as of April 30, 2019:
PTLC
Description^ | | Level 1 | | | Level 2 | | | Level 3 | | | Investments
Measured at
Net Asset Value | | | Total | |
Common Stocks | | $ | 2,093,806,977 | | | $ | — | | | $ | — | | | $ | — | | | $ | 2,093,806,977 | |
Real Estate Investment Trusts | | | 61,752,603 | | | | — | | | | — | | | | — | | | | 61,752,603 | |
Short-Term Investments | | | 7,600,973 | | | | — | | | | — | | | | — | | | | 7,600,973 | |
Investments Purchased with Proceeds from Securities Lending | | | — | | | | — | | | | — | | | | 410,548,790 | | | | 410,548,790 | |
Total Investments in Securities | | $ | 2,163,160,553 | | | $ | — | | | $ | — | | | $ | 410,548,790 | | | $ | 2,573,709,343 | |
^ See Schedule of Investments for industry breakouts.
PTMC
Description^ | | Level 1 | | | Level 2 | | | Level 3 | | | Investments
Measured at
Net Asset Value | | | Total | |
Common Stocks | | $ | 668,394,124 | | | $ | — | | | $ | — | | | $ | — | | | $ | 668,394,124 | |
Exchange Traded Funds | | | 24,525,812 | | | | — | | | | — | | | | — | | | | 24,525,812 | |
Real Estate Investment Trusts | | | 67,890,553 | | | | — | | | | — | | | | — | | | | 67,890,553 | |
Short-Term Investments | | | 388,643 | | | | — | | | | — | | | | — | | | | 388,643 | |
Investments Purchased with Proceeds from Securities Lending | | | — | | | | — | | | | — | | | | 221,030,289 | | | | 221,030,289 | |
Total Investments in Securities | | $ | 761,199,132 | | | $ | — | | | $ | — | | | $ | 221,030,289 | | | $ | 982,229,421 | |
^ See Schedule of Investments for industry breakouts.
PTNQ
Description^ | | Level 1 | | | Level 2 | | | Level 3 | | | Investments
Measured at
Net Asset Value | | | Total | |
Common Stocks | | $ | 501,672,111 | | | $ | — | | | $ | — | | | $ | — | | | $ | 501,672,111 | |
Short-Term Investments | | | 717,855 | | | | — | | | | — | | | | — | | | | 717,855 | |
Investments Purchased with Proceeds from Securities Lending | | | — | | | | — | | | | — | | | | 68,785,935 | | | | 68,785,935 | |
Total Investments in Securities | | $ | 502,389,966 | | | $ | — | | | $ | — | | | $ | 68,785,935 | | | $ | 571,175,901 | |
^ See Schedule of Investments for industry breakouts.
PTEU
Description^ | | Level 1 | | | Level 2 | | | Level 3 | | | Investments
Measured at
Net Asset Value | | | Total | |
Common Stocks | | $ | 176,597,527 | | | $ | — | | | $ | 6,778 | | | $ | — | | | $ | 177,604,305 | |
Preferred Stocks | | | 3,176,906 | | | | — | | | | — | | | | — | | | | 3,176,906 | |
Real Estate Investment Trusts | | | 2,131,314 | | | | — | | | | — | | | | — | | | | 2,131,314 | |
Short-Term Investments | | | 768,968 | | | | — | | | | — | | | | — | | | | 768,968 | |
Investments Purchased with Proceeds from Securities Lending | | | — | | | | — | | | | — | | | | 5,743,553 | | | | 5,743,553 | |
Total Investments in Securities | | $ | 182,674,715 | | | $ | — | | | $ | 6,778 | | | $ | 5,743,553 | | | $ | 188,425,046 | |
^ See Schedule of Investments for industry breakouts.
109
Pacer Funds
NOTES TO FINANCIAL STATEMENTS
April 30, 2019 (Continued)
The following is a reconciliation of investments in which significant unobservable inputs (Level3) were used in determining fair value:
PTEU | Balance
as of
4/30/2018 | Net
Realized
Gain
(Loss) | Change in Net
Unrealized
Appreciation
(Depreciation) | Purchases | Sales | Sales 2 | Transfers
Into
Level 3 | Transfers
Out of
Level 3 | Balance as
of 04/30/19 | Net Change
in Unrealized
Appreciation
(Depreciation)
on securities
held at
04/30/2019 |
Common Stocks | $ — | $ — | $ — | $ — | $ — | $ — | $ 6,778 | $ — | $ 6,778 | $ (17,590) |
The following is a summary of quantitative information about Level 3 Fair Value Measurements:
PTEU | | Fair Value as
of 04/30/2019 | | | Valuation
Techniques | | | Unobservable
Input | | | Input Values | | | Range/Weighted Average
Unobservable Input(a) | |
Common Stocks | | $ | 6,778 | | | | Last Trade Price | | | | Stale Data | | | | 4.80 EUR | | | | 4.80 EUR | |
| | (a) | Table presents information for one security, which is valued at $6,778 as of April 30, 2019. |
GCOW
Description^ | | Level 1 | | | Level 2 | | | Level 3 | | | Investments
Measured at
Net Asset Value | | | Total | |
Common Stocks | | $ | 205,552,512 | | | $ | — | | | $ | — | | | $ | — | | | $ | 205,552,512 | |
Real Estate Investment Trusts | | | 2,877,162 | | | | — | | | | — | | | | — | | | | 2,877,162 | |
Short-Term Investments | | | 1,025,631 | | | | — | | | | — | | | | — | | | | 1,025,631 | |
Investments Purchased with Proceeds from Securities Lending | | | — | | | | — | | | | — | | | | 49,602,558 | | | | 49,602,558 | |
Total Investments in Securities | | $ | 209,455,305 | | | $ | — | | | $ | — | | | $ | 49,602,558 | | | $ | 259,057,863 | |
^ See Schedule of Investments for country breakouts.
COWZ
Description^ | | Level 1 | | | Level 2 | | | Level 3 | | | Investments
Measured at
Net Asset Value | | | Total | |
Common Stocks | | $ | 265,001,506 | | | $ | — | | | $ | — | | | $ | — | | | $ | 265,001,506 | |
Real Estate Investment Trusts | | | 555,615 | | | | — | | | | — | | | | — | | | | 555,615 | |
Short-Term Investments | | | 453,773 | | | | — | | | | — | | | | — | | | | 453,773 | |
Investments Purchased with Proceeds from Securities Lending | | | — | | | | — | | | | — | | | | 23,710,020 | | | | 23,710,020 | |
Total Investments in Securities | | $ | 266,010,894 | | | $ | — | | | $ | — | | | $ | 23,710,020 | | | $ | 289,720,914 | |
^ See Schedule of Investments for industry breakouts.
CALF
Description^ | | Level 1 | | | Level 2 | | | Level 3 | | | Investments
Measured at
Net Asset Value | | | Total | |
Common Stocks | | $ | 50,381,703 | | | $ | — | | | $ | — | | | $ | — | | | $ | 50,381,703 | |
Short-Term Investments | | | 109,951 | | | | — | | | | — | | | | — | | | | 109,951 | |
Investments Purchased with Proceeds from Securities Lending | | | — | | | | — | | | | — | | | | 13,614,390 | | | | 13,614,390 | |
Total Investments in Securities | | $ | 50,491,654 | | | $ | — | | | $ | — | | | $ | 13,614,390 | | | $ | 64,106,044 | |
^ See Schedule of Investments for industry breakouts.
110
Pacer Funds
NOTES TO FINANCIAL STATEMENTS
April 30, 2019 (Continued)
ICOW
Description^ | | Level 1 | | | Level 2 | | | Level 3 | | | Investments
Measured at
Net Asset Value | | | Total | |
Common Stocks | | $ | 33,477,947 | | | $ | — | | | $ | — | | | $ | — | | | $ | 33,477,947 | |
Short-Term Investments | | | 159,911 | | | | — | | | | — | | | | — | | | | 159,911 | |
Investments Purchased with Proceeds from Securities Lending | | | — | | | | — | | | | — | | | | 3,114,587 | | | | 3,114,587 | |
Total Investments in Securities | | $ | 33,637,858 | | | $ | — | | | $ | — | | | $ | 3,114,587 | | | $ | 36,752,445 | |
^ See Schedule of Investments for country breakouts.
PWS
Description^ | | Level 1 | | | Level 2 | | | Level 3 | | | Investments
Measured at
Net Asset Value | | | Total | |
Common Stocks | | $ | 89,133,437 | | | $ | — | | | $ | — | | | $ | — | | | $ | 89,133,437 | |
Real Estate Investment Trusts | | | 20,680,215 | | | | — | | | | — | | | | | | | | 20,680,215 | |
Short-Term Investments | | | 242,111 | | | | — | | | | — | | | | — | | | | 242,111 | |
Investments Purchased with Proceeds from Securities Lending | | | — | | | | — | | | | — | | | | 5,378,550 | | | | 5,378,550 | |
Total Investments in Securities | | $ | 110,055,763 | | | $ | — | | | $ | — | | | $ | 5,378,550 | | | $ | 115,434,313 | |
^ See Schedule of Investments for industry breakouts.
VETS
Description^ | | Level 1 | | | Level 2 | | | Level 3 | | | Investments
Measured at
Net Asset Value | | | Total | |
Common Stocks | | $ | 2,860,169 | | | $ | — | | | $ | — | | | $ | — | | | $ | 2,860,169 | |
Short-Term Investments | | | 10,796 | | | | — | | | | — | | | | — | | | | 10,796 | |
Total Investments in Securities | | $ | 2,870,965 | | | $ | — | | | $ | — | | | $ | — | | | $ | 2,870,965 | |
^ See Schedule of Investments for industry breakouts.
RTL
Description^ | | Level 1 | | | Level 2 | | | Level 3 | | | Investments
Measured at
Net Asset Value | | | Total | |
Real Estate Investment Trusts | | $ | 1,375,334 | | | $ | — | | | $ | — | | | $ | — | | | $ | 1,375,334 | |
Short-Term Investments | | | 2,259 | | | | — | | | | — | | | | — | | | | 2,259 | |
Total Investments in Securities | | $ | 1,377,593 | | | $ | — | | | $ | — | | | $ | — | | | $ | 1,377,593 | |
^ See Schedule of Investments for industry breakouts.
111
Pacer Funds
NOTES TO FINANCIAL STATEMENTS
April 30, 2019 (Continued)
INDS
Description^ | | Level 1 | | | Level 2 | | | Level 3 | | | Investments
Measured at
Net Asset Value | | | Total | |
Real Estate Investment Trusts | | $ | 7,333,039 | | | $ | — | | | $ | — | | | $ | — | | | $ | 7,333,039 | |
Short-Term Investments | | | 19,917 | | | | — | | | | — | | | | — | | | | 19,917 | |
Investments Purchased with Proceeds from Securities Lending | | | — | | | | — | | | | — | | | | 429,600 | | | | 429,600 | |
Total Investments in Securities | | $ | 7,352,956 | | | $ | — | | | $ | — | | | $ | 429,600 | | | $ | 7,782,556 | |
^ See Schedule of Investments for industry breakouts.
SRVR
Description^ | | Level 1 | | | Level 2 | | | Level 3 | | | Investments
Measured at
Net Asset Value | | | Total | |
Common Stocks | | $ | 4,023,767 | | | $ | — | | | $ | — | | | $ | — | | | $ | 4,023,767 | |
Real Estate Investment Trusts | | | 18,635,058 | | | | — | | | | — | | | | — | | | | 18,635,058 | |
Short-Term Investments | | | 36,177 | | | | — | | | | — | | | | — | | | | 36,177 | |
Investments Purchased with Proceeds from Securities Lending | | | — | | | | — | | | | — | | | | 996,120 | | | | 996,120 | |
Total Investments in Securities | | $ | 22,695,002 | | | $ | — | | | $ | — | | | $ | 996,120 | | | $ | 23,691,122 | |
^ See Schedule of Investments for industry breakouts.
PEXL
Description^ | | Level 1 | | | Level 2 | | | Level 3 | | | Investments
Measured at
Net Asset Value | | | Total | |
Common Stocks | | $ | 1,284,514 | | | $ | — | | | $ | — | | | $ | — | | | $ | 1,284,514 | |
Exchange Traded Funds | | | 11,761 | | | | — | | | | — | | | | — | | | | 11,761 | |
Short-Term Investments | | | 1,579 | | | | — | | | | — | | | | — | | | | 1,579 | |
Total Investments in Securities | | $ | 1,297,854 | | | $ | — | | | $ | — | | | $ | — | | | $ | 1,297,854 | |
^ See Schedule of Investments for industry breakouts.
SZNE
Description^ | | Level 1 | | | Level 2 | | | Level 3 | | | Investments
Measured at
Net Asset Value | | | Total | |
Common Stocks | | $ | 7,034,387 | | | $ | — | | | $ | — | | | $ | — | | | $ | 7,034,387 | |
Short-Term Investments | | | 9,670 | | | | — | | | | — | | | | — | | | | 9,670 | |
Total Investments in Securities | | $ | 7,044,057 | | | $ | — | | | $ | — | | | $ | — | | | $ | 7,044,057 | |
^ See Schedule of Investments for industry breakouts.
During the year/period ended April 30, 2019, the Funds did not recognize any transfers to or from Level 3, except PTEU.
B. | Foreign Currency. Investment securities and other assets and liabilities denominated in foreign currencies are translated into U.S. dollar amounts at the date of valuation. Purchases and sales of investment securities and income and expense items denominated in foreign currencies are translated into U.S. dollar amounts on the respective dates of such transactions. The Funds do not isolate that portion of the results of operations resulting from changes in foreign exchange rates on investments from fluctuations arising from changes in market prices of securities held. Such fluctuations are included with the net realized and unrealized gain or loss from investments. The Funds report net realized foreign exchange gains or losses that arise from sales of foreign currencies, currency gains or losses realized between the trade and settlement dates on foreign currency transactions, and the differences between the amounts of dividends, interest |
112
Pacer Funds
NOTES TO FINANCIAL STATEMENTS
April 30, 2019 (Continued)
and foreign withholding taxes recorded on the Funds’ books and the U.S. dollar equivalent of the amounts actually received or paid. Net unrealized foreign exchange gains and losses arise from changes in the values of assets and liabilities, other than investments in securities at fiscal period end, resulting from changes in exchange rates.
C. | Federal Income Taxes. The Funds comply with the requirements of Subchapter M of the Internal Revenue Code of 1986, as amended, necessary to qualify as regulated investment companies and distribute substantially all net taxable investment income and net realized gains to shareholders in a manner which results in no tax cost to the Funds. Therefore, no federal income tax provision is required. As of and during the fiscal period/year ended April 30, 2019, the Funds did not have any tax positions that did not meet the “more-likely-than-not” threshold of being sustained by the applicable tax authority. As of and during the fiscal period/year ended April 30, 2019, the Funds did not have liabilities for any unrecognized tax benefits on uncertain tax positions as income tax expense in the Statement of Operations. The Funds are subject to examination by U.S. taxing authorities for the tax periods since each Fund’s commencement of operations. |
D. | Security Transactions and Investment Income. Investment securities transactions are accounted for on the trade date. Gains and losses realized on sales of securities are computed on the basis of highest amortized cost. Dividend income is recorded on the ex-dividend date. Interest income is recorded on an accrual basis. Discounts and premiums on securities purchased are accreted and amortized over the lives of the respective securities. Withholding taxes on foreign dividends have been provided for in accordance with the Funds’ understanding of the applicable tax rules and regulations. |
Distributions received from the Fund’s investments in Real Estate Investment Trusts (“REIT”) may be characterized as ordinary income, net capital gain, or a return of capital. The proper characterization of REIT distributions is generally not known until after the end of each calendar year. As such, the Fund must use estimates in reporting the character of their income and distributions for financial statement purposes. The actual character of distributions to the Fund’s shareholders will be reflected on the Form 1099 received by shareholders after the end of the calendar year. Due to the nature of REIT investments, a portion of the distributions received by the Fund’s shareholders may represent a return of capital.
E. | Distributions to Shareholders. Distributions to shareholders from net investment income for the PTLC, PTMC, PTNQ, and the PTEU, are declared and paid on an annual basis. The GCOW, COWZ, CALF, ICOW, PWS, VETS, PEXL, INDS, RTL, SRVR and SZNE are declared and paid on a quarterly basis. The net realized gains on securities normally are declared and paid on an annual basis for all Funds. Distributions are recorded on the ex-dividend date. |
F. | Use of Estimates. The preparation of financial statements in conformity with GAAP requires management to make estimates and assumptions that affect the reported amounts of assets and liabilities and disclosure of contingent assets and liabilities at the date of the financial statements, and the reported amounts of increases and decreases in net assets from operations during the reporting period. Actual results could differ from those estimates. |
G. | Share Valuation. The NAV per share of each Fund is calculated by dividing the sum of the value of the securities held by the Fund, plus cash and other assets, minus all liabilities (including estimated accrued expenses) by the total number of shares outstanding for the Fund, rounded to the nearest cent. The Funds’ shares will not be priced on the days on which the Cboe, Nasdaq and/or New York’s Stock Exchange (“NYSE”) is closed for trading. The offering and redemption price per share for each Fund is equal to the Fund’s net asset value per share. |
H. | Guarantees and Indemnifications. In the normal course of business, the Funds enter into contracts with service providers that contain general indemnification clauses. Each Fund’s maximum exposure under these arrangements is unknown as this would involve future claims that may be against the Funds that have not yet occurred. |
113
Pacer Funds
NOTES TO FINANCIAL STATEMENTS
April 30, 2019 (Continued)
I. | Reclassification of Capital Accounts. Additionally, U.S. GAAP requires that certain components of net assets relating to permanent differences be reclassified between financial and tax reporting. These reclassifications have no effect on net assets or net asset value per share. For the fiscal period/year ended April 30, 2019, the following table shows the reclassifications made: |
| | | Distributable
Earnings
(Accumulated
Deficit) | | | Paid-In Capital | |
PTLC | | $ | (103,568,729 | ) | | $ | 103,568,729 | |
PTMC | | | (62,257,523 | ) | | | 62,257,523 | |
PTNQ | | | (44,505,649 | ) | | | 44,505,649 | |
PTEU | | | 260 | | | | (260 | ) |
GCOW | | | (7,009,888 | ) | | | 7,009,888 | |
COWZ | | | (7,395,578 | ) | | | 7,395,578 | |
CALF | | | (1,901,644 | ) | | | 1,901,644 | |
ICOW | | | (685,624 | ) | | | 685,624 | |
PWS | | | (5,312,475 | ) | | | 5,312,475 | |
VETS | | | (189,567 | ) | | | 189,567 | |
RTL | | | (336,943 | ) | | | 336,943 | |
INDS | | | (163,690 | ) | | | 163,690 | |
SRVR | | | (97,556 | ) | | | 97,556 | |
PEXL | | | 71,698 | | | | (71,698 | ) |
SZNE | | | (815,931 | ) | | | 815,931 | |
During the fiscal year/period ended April 30, 2019, the Funds’ realized the following net capital gains resulting from in-kind redemptions, in which shareholders exchanged Fund shares for securities held by the Fund rather than for cash. Because such gains are not taxable to the Fund, and are not distributed to shareholders, they have been reclassified from accumulated net realized losses to paid-in-capital.
PTLC | | $ | 103,669,128 | |
PTMC | | $ | 62,657,317 | |
PTNQ | | $ | 46,532,539 | |
PTEU | | $ | — | |
GCOW | | $ | 7,482,759 | |
COWZ | | $ | 7,697,783 | |
CALF | | $ | 2,095,484 | |
ICOW | | $ | 734,289 | |
PWS | | $ | 5,341,184 | |
VETS | | $ | 189,567 | |
RTL | | $ | 353,871 | |
INDS | | $ | 170,347 | |
SRVR | | $ | 131,474 | |
PEXL | | $ | — | |
SZNE | | $ | 823,380 | |
NOTE 3 – COMMITMENTS AND OTHER RELATED PARTY TRANSACTIONS
Pacer Advisors, Inc. (“the Adviser”) serves as the investment adviser to the Funds. Pursuant to an Investment Advisory Agreement (“Investment Advisory Agreement”) between the Trust, on behalf of the Funds, and the Adviser, the Adviser provides investment advice to the Funds and oversees the day-to-day operations of the Funds, subject to the direction and control of the Board and the officers of the Trust. The Adviser administers the Funds’ business affairs, provides office facilities and equipment and certain clerical, bookkeeping and administrative services. The Adviser bears the costs of all advisory and non-advisory services required to operate the Funds, in exchange for a single unitary management fee. For services provided to the Funds, PTLC pays the Adviser 0.60%, PTMC pays the Adviser 0.60%, PTNQ pays the Adviser 0.65%, PTEU pays the Adviser 0.65%, GCOW pays the Adviser 0.60%, COWZ pays the Adviser 0.49%, CALF pays the Adviser 0.59%,
114
Pacer Funds
NOTES TO FINANCIAL STATEMENTS
April 30, 2019 (Continued)
ICOW pays the Adviser 0.65%, PWS pays the Adviser 0.60%, VETS pays the Adviser 0.60%, INDS pays the Adviser 0.60%, RTL pays the Adviser 0.60%, SRVR pays the Adviser 0.60%, PEXL pays the Adviser 0.60%, and SZNE pays the Adviser 0.60% at an annual rate based on each Fund’s average daily net assets.
The Distributor acts as the Funds’ principal underwriter in a continuous public offering of the Funds’ shares. The Distributor is an affiliate of the Adviser. The Funds did not pay any fees or commissions to the Distributor during the fiscal year/period ended April 30, 2019.
Certain officers and a Trustee of the Trust are affiliated with the Adviser and Distributor.
NOTE 4 – SERVICE AND CUSTODY AGREEMENTS
The Funds have entered into Service Agreements with U.S. Bancorp Fund Services, LLC (“Fund Services” or “Administrator”) doing business as U.S. Global Fund Services and a Custody Agreement with U.S. Bank, N.A. (the “Custodian”), an affiliate of Fund Services. Under these agreements, Fund Services and the Custodian provide certain transfer agency, administrative, accounting and custody services. The Custodian acts as securities lending agent (the “Securities Lending Agent”) for the Funds.
NOTE 5 – SECURITIES LENDING
The Funds may lend up to 33 1/3% of the value of the securities in their portfolios to brokers, dealers and financial institutions (but not individuals) under terms of participation in a securities lending program administered by the Securities Lending Agent. The securities lending agreement requires that loans are collateralized at all times in an amount equal to at least 102% of the value of any domestic loaned securities at the time of the loan, plus accrued interest. The use of loans of foreign securities, which are denominated and payable in U.S. dollars, shall be collateralized in an amount equal to 105% of the value of any loaned securities at the time of the loan plus accrued interest. The Funds receive compensation in the form of fees and earn interest on the cash collateral. Due to timing issues of when a security is recalled from loan, the financial statements may differ in presentation. The amount of fees depends on a number of factors including the type of security and length of the loan. The Funds continue to receive interest payments or dividends on the securities loaned during the borrowing period. Gain or loss in the value of securities loaned that may occur during the term of the loan will be for the account of the Funds. The Funds have the right under the terms of the securities lending agreements to recall the securities from the borrower on demand.
As of April 30, 2019, the Funds had loaned securities and received cash collateral for the loans. The cash collateral is invested in the Mount Vernon Liquid Assets Portfolio, LLC of which the investment objective is to seek to maximize income to the extent consistent with the preservation of capital and liquidity and maintain a stable Net Asset Value (“NAV”) of $1.00. Although risk is mitigated by the collateral, the Funds could experience a delay in recovering their securities and possible loss of income or value if the borrower fails to return the borrowed securities. In addition, the Funds bear the risk of loss associated with the investment of cash collateral received.
During the year/period ended April 30, 2019, the Funds (excluding VETS, RTL, PEXL, and SZNE) had loaned securities that were collateralized by cash. The cash collateral received was invested in securities as listed in each Fund’s Schedule of Investments. Income earned from these investments is allocated to each Fund based on each Fund’s portion of total cash collateral received. Securities lending income is disclosed in each Fund’s Statement of Operations.
115
Pacer Funds
NOTES TO FINANCIAL STATEMENTS
April 30, 2019 (Continued)
NOTE 6 – SECURED BORROWINGS
The following represents gross obligations for secured borrowings by remaining time to maturity as of April 30, 2019.
Securities Lending Transactions
Overnight and Continuous | | Investments Purchased
with Proceeds from
Securities Lending
Collateral* | |
PTLC | | $ | 410,548,790 | |
PTMC | | | 221,030,289 | |
PTNQ | | | 68,785,935 | |
PTEU | | | 5,743,553 | |
GCOW | | | 49,602,558 | |
COWZ | | | 23,710,020 | |
CALF | | | 13,614,390 | |
ICOW | | | 3,114,587 | |
PWS | | | 5,378,550 | |
VETS | | | — | |
RTL | | | — | |
INDS | | | 429,600 | |
SRVR | | | 996,120 | |
PEXL | | | — | |
SZNE | | | — | |
* | Proceeds from securities lending (Investments Purchased with Proceeds from Securities Lending Collateral). |
Due to the absence of a master netting agreement related to the Funds’ participation in securities lending, no additional offsetting disclosures have been made on behalf of the Funds for the total borrowings listed above.
NOTE 7 – OFFSETTING ASSETS AND LIABILITIES
The following is a summary of the Assets and Liabilities for each Fund subject to offsets as of April 30, 2019:
Liabilities
| | | | | | | | | | | | | | | Gross Amounts Net Offset in the
Statements of Assets and Liabilities | | | | | |
Description | | Gross Amounts
of Recognized
Liabilities | | | Gross Amounts
Offset in the
Statement of
Assets and
Liabilities | | | Net Amounts
Presented in
the Statements
of Assets and
Liabilities | | | Financial
Instruments | | | Collateral
Pledged
(Received) | | | Net
Amount | |
PTLC | | | | | | | | | | | | | | | | | | | | | | | | |
Securities Lending | | $ | 410,548,790 | | | $ | — | | | $ | 410,548,790 | | | $ | 410,548,790 | | | $ | — | | | $ | — | |
PTMC | | | | | | | | | | | | | | | | | | | | | | | | |
Securities Lending | | | 221,030,289 | | | | — | | | | 221,030,289 | | | | 221,030,289 | | | | — | | | | — | |
PTNQ | | | | | | | | | | | | | | | | | | | | | | | | |
Securities Lending | | | 68,785,935 | | | | — | | | | 68,785,935 | | | | 68,785,935 | | | | — | | | | — | |
PTEU | | | | | | | | | | | | | | | | | | | | | | | | |
Securities Lending | | | 5,743,553 | | | | — | | | | 5,743,553 | | | | 5,743,553 | | | | — | | | | — | |
GCOW | | | | | | | | | | | | | | | | | | | | | | | | |
Securities Lending | | | 49,602,558 | | | | — | | | | 49,602,558 | | | | 49,602,558 | | | | — | | | | — | |
COWZ | | | | | | | | | | | | | | | | | | | | | | | | |
Securities Lending | | | 23,710,020 | | | | — | | | | 23,710,020 | | | | 23,710,020 | | | | — | | | | — | |
116
Pacer Funds
NOTES TO FINANCIAL STATEMENTS
April 30, 2019 (Continued)
| | | | | | | | | | | | | | | Gross Amounts Net Offset in the
Statements of Assets and Liabilities | | | | | |
Description | | Gross Amounts
of Recognized
Liabilities | | | Gross Amounts
Offset in the
Statement of
Assets and
Liabilities | | | Net Amounts
Presented in
the Statements
of Assets and
Liabilities | | | Financial
Instruments | | | Collateral
Pledged
(Received) | | | Net
Amount | |
CALF | | | | | | | | | | | | | | | | | | | | | | | | |
Securities Lending | | $ | 13,614,390 | | | $ | — | | | $ | 13,614,390 | | | $ | 13,614,390 | | | $ | — | | | $ | — | |
ICOW | | | | | | | | | | | | | | | | | | | | | | | | |
Securities Lending | | | 3,114,587 | | | | — | | | | 3,114,587 | | | | 3,114,587 | | | | — | | | | — | |
PWS | | | | | | | | | | | | | | | | | | | | | | | | |
Securities Lending | | | 5,378,550 | | | | — | | | | 5,378,550 | | | | 5,378,550 | | | | — | | | | — | |
VETS | | | | | | | | | | | | | | | | | | | | | | | | |
Securities Lending | | | — | | | | — | | | | — | | | | — | | | | — | | | | — | |
RTL | | | | | | | | | | | | | | | | | | | | | | | | |
Securities Lending | | | — | | | | — | | | | — | | | | — | | | | — | | | | — | |
INDS | | | | | | | | | | | | | | | | | | | | | | | | |
Securities Lending | | | 429,600 | | | | — | | | | 429,600 | | | | 429,600 | | | | — | | | | — | |
SRVR | | | | | | | | | | | | | | | | | | | | | | | | |
Securities Lending | | | 996,120 | | | | — | | | | 996,120 | | | | 996,120 | | | | — | | | | — | |
PEXL | | | | | | | | | | | | | | | | | | | | | | | | |
Securities Lending | | | — | | | | — | | | | — | | | | — | | | | — | | | | — | |
SZNE | | | | | | | | | | | | | | | | | | | | | | | | |
Securities Lending | | | — | | | | — | | | | — | | | | — | | | | — | | | | — | |
NOTE 8 – INVESTMENT TRANSACTIONS
For the period ended April 30, 2019, the aggregate purchases and sales of securities by the Funds, excluding short-term securities and in-kind transactions, were as follows:
| | Purchases | | | Sales | |
PTLC | | $ | 1,774,811,038 | | | $ | 1,584,080,065 | |
PTMC | | | 1,493,561,447 | | | | 1,516,641,083 | |
PTNQ | | | 405,784,656 | | | | 277,720,058 | |
PTEU | | | 432,480,703 | | | | 421,760,475 | |
GCOW | | | 178,891,490 | | | | 142,219,103 | |
COWZ | | | 180,815,445 | | | | 193,450,425 | |
CALF | | | 35,458,637 | | | | 34,916,622 | |
ICOW | | | 25,016,606 | | | | 22,747,852 | |
PWS | | | 473,409,456 | | | | 439,343,243 | |
VETS | | | 496,604 | | | | 233,130 | |
RTL | | | 4,472,975 | | | | 1,536,097 | |
INDS | | | 3,606,149 | | | | 1,125,000 | |
SRVR | | | 4,377,497 | | | | 1,757,303 | |
PEXL | | | 1,060,970 | | | | 1,047,065 | |
SZNE | | | 9,978,525 | | | | 9,943,297 | |
117
Pacer Funds
NOTES TO FINANCIAL STATEMENTS
April 30, 2019 (Continued)
For the period ended April 30, 2019, in-kind transactions associated with creations and redemptions are as follows:
| | | Purchases | | | Sales | |
PTLC | | $ | 966,527,883 | | | $ | 28,849,895 | |
PTMC | | | 337,767,342 | | | | 35,436,090 | |
PTNQ | | | 252,878,895 | | | | 138,659,180 | |
PTEU | | | 31,664,849 | | | | — | |
GCOW | | | 48,115,874 | | | | 52,010,390 | |
COWZ | | | 312,948,585 | | | | 59,291,055 | |
CALF | | | 62,383,252 | | | | 16,784,533 | |
ICOW | | | 23,237,833 | | | | 9,793,368 | |
PWS | | | 83,899,741 | | | | 68,139,849 | |
VETS | | | 1,291,087 | | | | 1,634,795 | |
RTL | | | 2,426,406 | | | | 4,100,853 | |
INDS | | | 10,737,808 | | | | 6,343,393 | |
SRVR | | | 21,394,130 | | | | 2,559,334 | |
PEXL | | | 2,493,995 | | | | 1,092,033 | |
SZNE | | | 13,201,021 | | | | 6,841,449 | |
For the period ended April 30, 2019, there were no long-term purchases or sales of U.S. Government Securities for the Funds, except PWS. Included in the amounts for PWS were $121,196,333 of purchases and $2,503,925 of sales of U.S. Government Securities during the year ended April 30, 2019.
During the fiscal year ended April 30, 2017, PTEU accepted a cash contribution in the amount of $409,837 to reimburse the Fund from prior securities transactions.
NOTE 9 – TAX COST BASIS
The components of tax basis cost of investments and net unrealized appreciation for federal income tax purposes at April 30, 2019 were as follows:
| | | PTLC | | | PTMC | | | PTNQ | | | PTEU | | | GCOW | |
Tax cost of investments | | $ | 2,460,930,861 | | | $ | 984,601,098 | | | $ | 529,013,632 | | | $ | 178,727,789 | | | $ | 256,040,348 | |
Gross tax unrealized appreciation | | | 145,178,359 | | | | 25,126,228 | | | | 48,090,535 | | | | 11,400,270 | | | | 15,956,487 | |
Gross tax unrealized depreciation | | | (32,399,877 | ) | | | (27,497,905 | ) | | | (5,928,266 | ) | | | (1,703,013 | ) | | | (12,939,462 | ) |
Net tax unrealized appreciation (depreciation) | | | 112,778,482 | | | | (2,371,677 | ) | | | 42,162,269 | | | | 9,697,257 | | | | 3,017,025 | |
Undistributed ordinary income | | | 8,747,712 | | | | 3,526,511 | | | | 1,089,238 | | | | 1,733,721 | | | | 831,014 | |
Undistributed long-term gain | | | — | | | | — | | | | — | | | | — | | | | — | |
Total distributable earnings | | | 8,747,712 | | | | 3,526,511 | | | | 1,089,238 | | | | 1,733,721 | | | | 831,014 | |
Other accumulated (loss) | | | (40,318,985 | ) | | | (43,126,282 | ) | | | (20,552,554 | ) | | | (35,392,387 | ) | | | (9,374,432 | ) |
Total accumulated gain (loss) | | $ | 81,207,209 | | | $ | (41,971,448 | ) | | $ | 22,698,953 | | | $ | (23,961,409 | ) | | $ | (5,526,393 | ) |
| | | COWZ | | | CALF | | | ICOW | | | PWS | | | VETS | |
Tax cost of investments | | $ | 286,633,173 | | | $ | 64,027,579 | | | $ | 37,388,174 | | | $ | 110,198,742 | | | $ | 2,556,979 | |
Gross tax unrealized appreciation | | | 19,737,873 | | | | 5,271,348 | | | | 2,186,688 | | | | 5,850,350 | | | | 367,910 | |
Gross tax unrealized depreciation | | | (16,650,132 | ) | | | (5,192,883 | ) | | | (2,822,432 | ) | | | (614,779 | ) | | | (53,924 | ) |
Net tax unrealized appreciation (depreciation) | | | 3,087,741 | | | | 78,465 | | | | (635,744 | ) | | | 5,235,571 | | | | 313,986 | |
Undistributed ordinary income | | | 101,514 | | | | 8,612 | | | | 246,512 | | | | 76,606 | | | | 3,490 | |
Undistributed long-term gain | | | — | | | | — | | | | — | | | | — | | | | — | |
Total distributable earnings | | | 101,514 | | | | 8,612 | | | | 246,512 | | | | 76,606 | | | | 3,490 | |
Other accumulated (loss) | | | (11,463,651 | ) | | | (2,599,732 | ) | | | (2,161,881 | ) | | | (14,698,711 | ) | | | (18,341 | ) |
Total accumulated gain (loss) | | $ | (8,274,396 | ) | | $ | (2,512,655 | ) | | $ | (2,551,113 | ) | | $ | (9,386,534 | ) | | $ | 299,135 | |
118
Pacer Funds
NOTES TO FINANCIAL STATEMENTS
April 30, 2019 (Continued)
| | RTL | | | INDS | | | SRVR | | | PEXL | | | SZNE | |
Tax cost of investments | | $ | 1,317,219 | | | $ | 7,475,921 | | | $ | 22,386,173 | | | $ | 1,247,934 | | | $ | 7,046,040 | |
Gross tax unrealized appreciation | | | 102,278 | | | | 347,977 | | | | 1,705,661 | | | | 123,720 | | | | — | |
Gross tax unrealized depreciation | | | (41,904 | ) | | | (41,342 | ) | | | (400,712 | ) | | | (73,800 | ) | | | (1,983 | ) |
Net tax unrealized appreciation (depreciation) | | | 60,374 | | | | 306,635 | | | | 1,304,949 | | | | 49,920 | | | | (1,983 | ) |
Undistributed ordinary income | | | — | | | | 1,950 | | | | — | | | | 443 | | | | 3,884 | |
Undistributed long-term gain | | | — | | | | 6,106 | | | | — | | | | — | | | | — | |
Total distributable earnings | | | — | | | | 8,056 | | | | — | | | | 443 | | | | 3,884 | |
Other accumulated (loss) | | | (48,361 | ) | | | — | | | | (176,208 | ) | | | (85,335 | ) | | | (168,295 | ) |
Total accumulated gain (loss) | | $ | 12,013 | | | $ | 314,691 | | | $ | 1,128,741 | | | $ | (34,972 | ) | | $ | (166,394 | ) |
The difference between book and tax-basis cost is attributable to the realization for tax purposes of unrealized gains on investments in Real Estate Investment Trusts, partnerships, passive foreign investment companies and wash sales. Under tax law, certain capital and foreign currency losses realized after April 30, and within the taxable year are deemed to arise on the first business day of the Fund’s next taxable year.
At April 30, 2019, the Funds had the following capital loss carryforwards:
| | Short-Term Amount | | | Long-Term Amount | | | Expires | |
PTLC | | $ | 40,318,985 | | | | — | | | | Indefinite | |
PTMC | | | 35,081,100 | | | | 8,045,182 | | | | Indefinite | |
PTNQ | | | 17,192,424 | | | | 3,360,130 | | | | Indefinite | |
PTEU | | | 35,384,806 | | | | — | | | | Indefinite | |
GCOW | | | 6,823,440 | | | | 2,544,829 | | | | Indefinite | |
COWZ | | | 11,135,637 | | | | 328,015 | | | | Indefinite | |
CALF | | | 2,520,558 | | | | 79,174 | | | | Indefinite | |
ICOW | | | 1,973,261 | | | | 186,689 | | | | Indefinite | |
PWS | | | 14,698,711 | | | | — | | | | Indefinite | |
VETS | | | 18,341 | | | | — | | | | Indefinite | |
RTL | | | — | | | | — | | | | Indefinite | |
INDS | | | — | | | | — | | | | Indefinite | |
SRVR | | | — | | | | — | | | | Indefinite | |
PEXL | | | 85,335 | | | | — | | | | Indefinite | |
SZNE | | | 168,295 | | | | — | | | | Indefinite | |
At April 30, 2018, RTL and SRVR deferred on a tax basis, a post-October capital loss of $48,361 and $176,208, respectively. None of the Funds deferred on a tax bases late-year ordinary losses.
119
Pacer Funds
NOTES TO FINANCIAL STATEMENTS
April 30, 2019 (Continued)
NOTE 10 – DISTRIBUTIONS TO SHAREHOLDERS
The tax character of distributions paid by the Funds during the fiscal year/period ended April 30, 2019 was as follows:
| | Ordinary Income | | | Capital Gains | | | Return of Capital | |
PTLC | | $ | 14,704,858 | | | $ | — | | | $ | — | |
PTMC | | | 5,930,872 | | | | — | | | | — | |
PTNQ | | | 1,575,175 | | | | — | | | | — | |
PTEU | | | 2,870,463 | | | | — | | | | — | |
GCOW | | | 7,760,389 | | | | — | | | | — | |
COWZ | | | 2,630,630 | | | | — | | | | — | |
CALF | | | 329,410 | | | | — | | | | — | |
ICOW | | | 731,370 | | | | — | | | | — | |
PWS | | | 1,397,954 | | | | — | | | | — | |
VETS | | | 38,615 | | | | — | | | | — | |
RTL | | | 83,796 | | | | 5,909 | | | | 20,617 | |
INDS | | | 67,295 | | | | — | | | | — | |
SRVR | | | 89,513 | | | | 1,372 | | | | 37,487 | |
PEXL | | | 6,972 | | | | — | | | | — | |
SZNE | | | 29,474 | | | | — | | | | — | |
The tax character of distributions paid by the Funds during the fiscal year/period ended April 30, 2018 was as follows:
| | Ordinary Income | | | Capital Gains | | | Return of Capital | |
PTLC | | $ | 7,017,355 | | | $ | — | | | $ | — | |
PTMC | | | 2,882,696 | | | | — | | | | — | |
PTNQ | | | 466,293 | | | | — | | | | — | |
PTEU | | | 538,237 | | | | — | | | | — | |
GCOW | | | 3,669,616 | | | | — | | | | — | |
COWZ | | | 319,520 | | | | — | | | | — | |
CALF | | | 34,114 | | | | — | | | | — | |
ICOW | | | 70,528 | | | | — | | | | — | |
PWS | | | 112,441 | | | | — | | | | — | |
VETS | | | — | | | | — | | | | — | |
RTL | | | — | | | | — | | | | — | |
INDS | | | — | | | | — | | | | — | |
SRVR | | | — | | | | — | | | | — | |
PEXL | | | — | | | | — | | | | — | |
SZNE | | | — | | | | — | | | | — | |
NOTE 11 – NEW ACCOUNTING PRONOUNCEMENTS
In August 2018, FASB issued ASU 2018-13, Fair Value Measurement (Topic 820): Disclosure Framework—Changes to the Disclosure Requirements for Fair Value Measurement (“ASU 2018-13”). The primary focus of ASU 2018-13 is to improve the effectiveness of the disclosure requirements for fair value measurements. The changes affect all companies that are required to include fair value measurement disclosures. In general, the amendments in ASU 2018-13 are effective for all entities for fiscal years and interim periods within those fiscal years, beginning after December 15, 2019. An entity is permitted to early adopt the removed or modified disclosures upon the issuance of ASU 2018-13 and may delay adoption of the additional disclosures, which are required for public companies only, until their effective date. Management has evaluated the ASU 2018-13 and has decided to adopt the disclosure framework.
120
Pacer Funds
NOTES TO FINANCIAL STATEMENTS
April 30, 2019 (Continued)
NOTE 12 – SUBSEQUENT EVENT
Management of the Funds has evaluated the need for disclosures and/or adjustments resulting from subsequent events through the date these financial statements were issued. The evaluation did not result in any subsequent events that necessitated disclosures and/or adjustments other than below.
On May 3, 2019 the Adviser launched three new funds in the Pacer Funds Trust: Pacer US Cash Cows Growth ETF, Pacer Trendpilot International ETF, and Pacer Emerging Markets Cash Cows 100 ETF.
On May 6, 2019 the Adviser launched two new funds in the Pacer Funds Trust: Pacer Cash Cows Fund of Funds ETF and Pacer Trendpilot Fund of Funds ETF.
On June 25, 2019, the following Funds declared distributions from ordinary income to shareholders of record as of June 26, 2019, payable June 27, 2019, as follows:
| | Ordinary Income | | | Per Share Amount | |
GCOW | | $ | 1,962,415 | | | $ | 0.28236187 | |
COWZ | | $ | 1,188,347 | | | $ | 0.13130910 | |
CALF | | $ | 242,647 | | | $ | 0.13480381 | |
ICOW | | $ | 259,965 | | | $ | 0.19256656 | |
PWS | | $ | 344,297 | | | $ | 0.07484718 | |
VETS | | $ | 14,106 | | | $ | 0.14106470 | |
RTL | | $ | 10,033 | | | $ | 0.10032950 | |
INDS | | $ | 23,731 | | | $ | 0.05932848 | |
SRVR | | $ | 135,240 | | | $ | 0.09015990 | |
PEXL | | $ | 1,801 | | | $ | 0.03601720 | |
SZNE | | $ | 35,704 | | | $ | 0.04200501 | |
121
Pacer Funds
Report of Independent Registered Public Accounting Firm
To the Board of Trustees of Pacer Funds Trust and the Shareholders of
Pacer Trendpilot® US Large Cap ETF, Pacer Trendpilot® US Mid Cap ETF, Pacer Trendpilot® 100 ETF, Pacer Trendpilot® European Index ETF, Pacer Global Cash Cows Dividend ETF, Pacer US Cash Cows 100 ETF, Pacer US Small Cap Cash Cows 100 ETF, Pacer Developed Markets International Cash Cows 100 ETF, Pacer WealthShield ETF, Pacer Military Times Best Employers ETF, Pacer Benchmark Retail Real Estate SCTRSM ETF, Pacer Benchmark Industrial Real Estate SCTRSM ETF, Pacer Benchmark Data & Infrastructure Real Estate SCTRSM ETF, Pacer US Export Leaders ETF and Pacer CFRA-Stovall Equal Weight Seasonal Rotation ETF
Opinion on the Financial Statements
We have audited the accompanying statements of assets and liabilities of the Pacer Trendpilot® US Large Cap ETF, Pacer Trendpilot® US Mid Cap ETF, Pacer Trendpilot® 100 ETF, Pacer Trendpilot® European Index ETF, Pacer Global Cash Cows Dividend ETF, Pacer US Cash Cows 100 ETF, Pacer US Small Cap Cash Cows 100 ETF, Pacer Developed Markets International Cash Cows 100 ETF, Pacer WealthShield ETF, Pacer Military Times Best Employers ETF, Pacer Benchmark Retail Real Estate SCTRSM ETF, Pacer Benchmark Industrial Real Estate SCTRSM ETF, Pacer Benchmark Data & Infrastructure Real Estate SCTRSM ETF, Pacer US Export Leaders ETF and Pacer CFRA-Stovall Equal Weight Seasonal Rotation ETF (the “Funds”), including the schedules of investments, as of April 30, 2019 and the related statements of operations for the year or period then ended, the statements of changes in net assets for each of the years or periods in the two-year period then ended and the related notes (collectively, referred to as the “financial statements”) and the financial highlights for each of the years or periods in the four-year period then ended.
In our opinion, the financial statements and financial highlights present fairly, in all material respects, the financial positions of the Funds, as of April 30, 2019, the results of their operations for the year or period then ended, the changes in their net assets for each of the years or periods in the two-year period then ended, and the financial highlights for each of the years or periods in the four-year period then ended, in conformity with accounting principles generally accepted in the United States of America.
Basis for Opinion
These financial statements and financial highlights are the responsibility of the Funds’ management. Our responsibility is to express an opinion on these financial statements and financial highlights based on our audits. We are a public accounting firm registered with the Public Company Accounting Oversight Board (United States) (“PCAOB”) and are required to be independent with respect to the Funds in accordance with the U.S. federal securities laws and the applicable rules and regulations of the Securities and Exchange Commission and the PCAOB.
We conducted our audits in accordance with the standards of the PCAOB. Those standards require that we plan and perform the audits to obtain reasonable assurance about whether the financial statements and financial highlights are free of material misstatement, whether due to error or fraud. The Funds are not required to have, nor were we engaged to perform, an audit of their internal control over financial reporting. As part of our audits we are required to obtain an understanding of internal control over financial reporting but not for the purpose of expressing an opinion on the effectiveness of the Funds’ internal control over financial reporting. Accordingly, we express no such opinion.
Our audits included performing procedures to assess the risk of material misstatement of the financial statements and financial highlights, whether due to error or fraud, and performing procedures that respond to those risks. Such procedures included examining, on a test basis, evidence regarding the amounts and disclosures in the financial statements and financial highlights. Our procedures included confirmation of securities and cash owned as of April 30, 2019, by correspondence with the custodian. Our audits also included evaluating the accounting principles used and significant estimates made by management, as well as evaluating the overall presentation of the financial statements and financial highlights. We believe that our audits provide a reasonable basis for our opinion.

We have served as the Funds’ auditor since 2015
Abington, Pennsylvania
June 27, 2019
122
Pacer Funds
Additional Information
(Unaudited)
NOTE 1 – FREQUENCY DISTRIBUTION OF PREMIUMS AND DISCOUNTS
Information regarding how often shares of each other Fund traded on the Exchange at a price above (i.e., at a premium) or below (i.e., at a discount) the NAV of the Fund is available on the Funds’ website at www.PacerETFs.com.
NOTE 2 – FEDERAL TAX INFORMATION
Qualified Dividend Income/Dividends Received Deduction
For the fiscal year/period ended April 30, 2019, certain dividends paid by the Funds may be subject to a maximum tax rate of 15%, as provided for by the Jobs and Growth Tax Relief Reconciliation Act of 2003.
The percentage of dividends declared from ordinary income designated as qualified dividend income was as follows:
PTLC | 92.48% |
PTMC | 55.11% |
PTNQ | 86.73% |
PTEU | 99.03% |
GCOW | 99.09% |
COWZ | 99.79% |
CALF | 100.00% |
ICOW | 100.00% |
PWS | 32.00% |
VETS | 99.11% |
RTL | 1.46% |
INDS | 2.02% |
SRVR | 10.44% |
PEXL | 100.00% |
SZNE | 100.00% |
For corporate shareholders, the percent of ordinary income distributions qualifying for the corporate dividends received deduction for the fiscal year/period ended April 30, 2019 was as follows:
PTLC | 90.33% |
PTMC | 53.80% |
PTNQ | 82.55% |
PTEU | 0.00% |
GCOW | 31.44% |
COWZ | 99.74% |
CALF | 100.00% |
ICOW | 0.30% |
PWS | 31.56% |
VETS | 99.11% |
RTL | 0.00% |
INDS | 0.00% |
SRVR | 0.47% |
PEXL | 100.00% |
SZNE | 100.00% |
123
Pacer Funds
ADDITIONAL INFORMATION
(Unaudited) (Continued)
Short Term Capital Gains
The percentage of taxable ordinary income distributions that are designated as short-term capital gain distributions under Internal Revenue Section 871(k)(2)(C) for each fund were as follows:
PTLC | 0.00% |
PTMC | 0.00% |
PTNQ | 0.00% |
PTEU | 0.00% |
GCOW | 0.00% |
COWZ | 0.00% |
CALF | 0.00% |
ICOW | 0.00% |
PWS | 0.00% |
VETS | 0.00% |
RTL | 0.00% |
INDS | 0.00% |
SRVR | 0.00% |
PEXL | 0.00% |
SZNE | 0.00% |
Foreign Tax Credit Pass Through
Pursuant to Section 853 of the Internal Revenue code, the Funds designate the following amounts as foreign taxes paid for the period ended April 30, 2019. Foreign taxes paid for purposes of Section 853 may be less than actual foreign taxes paid for financial statement purposes.
| | | | | | | | | | | Per Share | |
| | Gross Foreign
Source Income | | | Foreign Taxes
Passthrough | | | Gross Foreign
Source Income | | | Foreign Taxes
Passthrough | |
PTLC | | $ | — | | | $ | — | | | $ | — | | | $ | — | |
PTMC | | | — | | | | — | | | | — | | | | — | |
PTNQ | | | — | | | | — | | | | — | | | | — | |
PTEU | | | 4,691,018 | | | | 674,169 | | | | 0.68 | | | | 0.10 | |
GCOW | | | 6,320,653 | | | | 382,540 | | | | 0.94 | | | | 0.06 | |
COWZ | | | — | | | | — | | | | — | | | | — | |
CALF | | | — | | | | — | | | | — | | | | — | |
ICOW | | | 1,175,992 | | | | 100,592 | | | | 0.94 | | | | 0.08 | |
PWS | | | — | | | | — | | | | — | | | | — | |
VETS | | | — | | | | — | | | | — | | | | — | |
RTL | | | — | | | | — | | | | — | | | | — | |
INDS | | | — | | | | — | | | | — | | | | — | |
SRVR | | | — | | | | — | | | | — | | | | — | |
PEXL | | | — | | | | — | | | | — | | | | — | |
SZNE | | | — | | | | — | | | | — | | | | — | |
Foreign taxes paid or withheld should be included in taxable income with an offsetting deduction from gross income or as a credit for taxes paid to foreign governements.
Above figures may differ from those cited elsewhere in this report due to difference in the calculation of income and gains under GAAP purposes and Internal Revenue Service purposes.
Shareholders are strongly advised to consult their own tax advisers with respect to the tax consequences of their investments in the Funds.
124
Pacer Funds
ADDITIONAL INFORMATION
(Unaudited) (Continued)
NOTE 3 – DISCLOSURE OF PORTFOLIO HOLDINGS
The Funds file their complete schedule of portfolio holdings for their first and third fiscal quarters with the Securities and Exchange Commission (“SEC”) on Form N-Q or Part F of Form N-PORT. The Funds’ Form N-Q or Part F of Form N-PORT is available on the website of the SEC at http://www.sec.gov. Each Fund’s portfolio holdings are posted on their website at www.paceretfs.com daily.
NOTE 4 – PROXY VOTING POLICIES AND PROCEDURES
A description of the policies and procedures the Funds use to determine how to vote proxies relating to portfolio securities is provided in the Statement of Additional Information (“SAI”). The SAI is available without charge upon request by calling toll-free at (800) 617-0004, by accessing the SEC’s website at http://www.sec.gov, or by accessing the Funds’ website at www.paceretfs.com. Information on how the Fund voted proxies relating to portfolio securities during the year ended June 30 is available without charge, upon request, by calling (800) 617-0004 or by accessing the website of the SEC.
NOTE 5 – BOARD CONSIDERATIONS IN APPROVING THE INVESTMENT ADVISORY AGREEMENT FOR THE FUNDS
The Board of Trustees (the “Board”) of Pacer Funds Trust (the “Trust”), including the Trustees who are not “interested persons,” as defined by the Investment Company Act of 1940, as amended, of the Trust (the “Independent Trustees”), held an in-person meeting on April 8, 2019 (the “April Meeting”), for the purpose of, among other things, the consideration of, and voting on, the proposed renewal of the investment advisory agreement (the “Investment Advisory Agreement”) between the Trust and Pacer Advisors, Inc. (the “Advisor”) relating to the Pacer WealthShield ETF, Pacer Benchmark Retail Real Estate SCTR ETF, , Pacer Industrial Real Estate SCTR ETF, Pacer Data & Infrastructure Real Estate SCTR ETF, Pacer Military Times Best Employers ETF, Pacer CFRA-Stovall Equal Weight Seasonal Rotation ETF, Pacer US Export Leaders ETF, Pacer Trendpilot US Large Cap ETF, Pacer Trendpilot US Mid Cap ETF, Pacer Trendpilot 100 ETF, Pacer Trendpilot European Index ETF, Pacer Global Cash Cows Dividend ETF, Pacer US Cash Cows 100 ETF, Pacer US Small Cap Cash Cows 100 ETF and Pacer Developed Markets International Cash Cows 100 ETF (each a “Fund” and, together, the “Funds”). The Board, including all of the Trust’s Independent Trustees voting separately, unanimously approved the Investment Advisory Agreement based on its review of qualitative and quantitative information provided by the Advisor and the Trust’s other service providers.
Prior to deciding to renew the Investment Advisory Agreement, the Independent Trustees requested and obtained from the Advisor such information as the Independent Trustees deemed reasonably necessary to evaluate the terms of the Investment Advisory Agreement. The Independent Trustees received assistance and advice from, and met separately with, independent counsel. In addition, the Independent Trustees received a memorandum from independent counsel regarding the responsibilities of the Board with respect to the approval or renewal of the Investment Advisory Agreement. Prior to the April Meeting, the Board obtained and reviewed a variety of information, including certain comparative information regarding the Fund’s expenses (both actual and, where relevant, proposed), relative to the expenses of other comparable funds.
At the April Meeting, the Board, including the Independent Trustees, evaluated a number of factors and various materials in connection with the approval process, including: (1) a copy of the Investment Advisory Agreement; (2) the Advisor’s responses to questionnaires designed to provide the Board with information reasonably necessary to evaluate the terms of the Investment Advisory Agreement; (3) the Advisor’s Form ADV disclosures; (4) information describing the nature, quality and extent of services that the Advisor, where relevant, has provided and is prepared in the future to provide to each Fund, and the advisory fee payable by each Fund to the Advisor for the Advisor’s services; (5) certain comparative information regarding the Funds’ expenses relative to the expenses of other funds; (6) a copy of the Trust’s registration statement; and (7) information regarding the financial condition of the Advisor. Representatives from the Advisor presented additional information and participated in question and answer sessions at the Meeting to help the Board evaluate the Advisor���s services, fees and other aspects of the Investment Advisory Agreement.
In considering the continuation and/or approval, respectively, of the Investment Advisory Agreement, the Board considered various factors that they determined were relevant, including: (i) the nature, extent and quality of the services to be provided by the Advisor, including the performance of the Funds over time; (ii) the fee to be paid to the Advisor by each Fund; and (iii) potential economies of scale, as discussed in further detail below.
● | Nature, Extent and Quality of Services to be Provided by the Advisor. The Board reviewed the scope of services provided by the Advisor under the Investment Advisory Agreement and determined that the Advisor has been providing and is capable of providing in the future all necessary advisory services required by the Funds, as indicated by the firm’s management capabilities, the professional qualifications and experience of its portfolio management personnel and the performance of the Funds against their peers. In this regard, the Board reviewed data compiled by the Advisor comparing the performance of each Fund with the performance of other ETFs having similar investment objectives and policies (each Fund’s “Peer Group”). The Board also considered other services provided to the Funds |
125
Pacer Funds
ADDITIONAL INFORMATION
(Unaudited) (Continued)
by the Advisor, such as selecting broker-dealers for executing portfolio transactions, monitoring adherence to each Fund’s investment restrictions, and monitoring compliance with various policies and procedures and with applicable securities regulations. Based on the factors above, as well as those discussed below, the Board concluded, within the context of its full deliberations, that it was satisfied with the nature, extent and quality of the services provided and to be provided to the Funds by the Advisor.
● | Costs of Services to be Provided to the Funds and Profitability. In considering the advisory fees payable by the Trust to the Advisor and each Fund’s expense ratio, the Board reviewed data compiled by the Advisor from an unaffiliated third party proprietary database comparing the expense ratios of each Fund with the expense ratios of the ETFs in each Fund’s Peer Group. The Board compared each Fund’s expense ratio to the expense ratios of ETFs in the Fund’s Peer Group, focusing on whether each Fund charged fees that were within the range of fees charged by the Peer Group. It also noted that the Advisor had contractually agreed to pay all operating expenses of each Fund, including the cost of transfer agency, custody, fund administration, legal, audit and other services, except interest, taxes, brokerage commissions and other expenses in connection with the execution of portfolio transactions, and extraordinary and non-routine expenses. It was noted that this contractual agreement cannot be changed without shareholder approval. The Board also evaluated the compensation and benefits received (or proposed or likely to be received), by the Advisor from its relationship with the Funds, taking into account assessments of the Advisor’s profitability prepared and shared by the Advisor’s management. Based on the factors above, as well as those discussed below, the Board concluded, within the context of its full deliberations, that each Fund’s advisory fee was reasonable in light of the nature and quality of the services rendered and, where relevant, expected to be rendered by the Advisor. |
● | Economies of Scale. The Board also reviewed and considered the extent to which economies of scale would be realized by the Advisor as the assets of the Funds grew or may grow in the future. |
Based on the Board’s deliberations and its evaluation of the information described above, the Board, including the Independent Trustees, unanimously: (a) concluded that the terms of the Investment Advisory Agreement with respect to each Fund were and are fair and reasonable; (b) concluded that the Advisor’s fees are reasonable in light of the nature and quality of the services rendered and expected to be rendered by the Advisor to each Fund; and (c) agreed to renew the Investment Advisory Agreement as to each Fund for a term of one year. In its deliberations, the Board did not identify any particular factor (or conclusion with respect thereto) or single piece of information that was all-important, controlling or determinative of its decision, but considered all of the factors together, and each Trustee may have attributed different weights to the various factors (and conclusions with respect thereto) and information.
NOTE 6 – TRUSTEES AND OFFICERS
The business of the Funds is managed under the direction of the Board of Trustees. The Board of Trustees formulates the general policies of the Funds and meets periodically to review the Funds’ performance, monitor investment activities and practices, and discuss other matters affecting the Funds. The Trustees are fiduciaries for the Funds’ shareholders and are governed by the laws of the State of Delaware in this regard. The names and addresses of the Trustees and officers of the Trust are listed below along with a description of their principal occupations over at least the last five years. There are currently four Trustees, three of whom are not “interested persons” of the Trust within the meaning of that term under the 1940 Act (“Independent Trustee”). The Trustees, in turn, elect the officers of the Trust to actively supervise its day-to-day operations. The address of each Trustee and officer of the Trust, unless otherwise indicated below, is c/o Pacer Advisors, Inc., 500 Chesterfield Parkway, Malvern, PA 19335. The Funds’ Statement of Additional Information includes additional information about the Trustees and is available upon request by calling toll free (800) 617-0004.
126
Pacer Funds
ADDITIONAL INFORMATION
(Unaudited) (Continued)
Name and Year of Birth | Position(s)
Held with
the Trust | Term of Office
and Length of
Time Served | Principal Occupation(s)
During Past 5 Years | Number of
Portfolios in
Fund
Complex
Overseen
By Trustee | Other
Directorships
held by
Trustee During
Past Five Years |
Interested Trustee | | | | | |
Joe M. Thomson
Born: 1944 | Trustee , Chairman, President and Principal Executive Officer | Indefinite Term; since 2014 | Founder/President at Pacer Advisors, Inc. (since 2005); President and Chief Compliance Officer, Pacer Financial, Inc. (since 2004) | 20 | Director, First Cornerstone Bank (2000-2016) |
Independent Trustees | | | | | |
Deborah G. Wolk
Born: 1950 | Lead Independent Trustee | Indefinite Term; since 2015 | Self-employed providing accounting services and computer modeling (since 1997) | 20 | None |
Jonathan H. Newman, Sr.
Born: 1962 | Trustee | Indefinite Term; since 2015 | CEO and Chairman, Newman Wine & Spirits (since 2007) | 20 | None |
Dennis J. Ryan
Born: 1947 | Trustee | Indefinite Term; since 2017 | Principal/Owner, Brendan Abstract Company, Inc. (title insurance) (since 1999) | 20 | None |
Officers who are not Trustees: | | | | | |
Sean E. O’Hara
Born: 1962 | Treasurer and Principal Financial Officer | Indefinite Term; since 2014 | Director, Index Design Group (since 2015); Director, Pacer Financial, Inc. (since 2007); Director, Pacer Advisors, Inc. (since 2007) | N/A | None |
Bruce Kavanaugh
Born: 1964 | Secretary | Indefinite Term; since 2016 | Vice President, Pacer Advisors, Inc. (since 2004), Vice President, Pacer Financial, Inc. (since 2004) | N/A | None |
Perpetua Seidenberg Gateway Corporate Center, Suite 216
223 Wilmington West Chester Pike Chadds Ford, PA 19317 Born: 1990 | Chief Compliance Officer and AML Officer | Indefinite Term; since 2018 | Compliance Director, Vigilant Compliance, LLC (an investment management services company) (since 2014); Auditor, PricewaterhouseCoopers (since 2012) | N/A | None |
Mr. Thomson is an “Interested Person” by reason of his relationship with the Adviser.
Each Trustee shall serve during the lifetime of the Trust until he or she: (a) dies; (b) resigns; (c) has reached the mandatory retirement age, if any, as set by the Trustees; (d) is declared incompetent by a court of appropriate jurisdiction; or (e) is removed, or, if sooner, until the next meeting of shareholders called for the purpose of electing Trustees and until the election and qualification of his or her successor inaccordance with the Trust’s Declaration of Trust and By-laws. Each officer holds office at the pleasure of the Board and services for a period of one year, or until his or her successor is duly elected and qualified.
The Statement of Additional Information includes additional information, including compensation, about the Funds’ Trustees.
127
(This Page Intentionally Left Blank.)
(This Page Intentionally Left Blank.)
Advisor Pacer Advisors, Inc.
500 Chesterfield Parkway
Malvern, PA 19355 |
Index Provider Index Design Group, LLC
500 Chesterfield Parkway
Malvern, PA 19355 Benchmark Investments, LLC
1115 Broadway, 12th Floor
New York, NY 10010 CFRA
One New York Plaza, 34th Floor
New York, NY 10004 VETS Indexes, LLC
6 East 39th Street, Suite 1003
New York, NY 10016 |
Distributor Pacer Financial, Inc.
500 Chesterfield Parkway
Malvern, PA 19355 |
Custodian U.S. Bank National Association
Custody Operations
1555 North Rivercenter Drive
Milwaukee, WI 53212 |
Transfer Agent U.S. Bancorp Fund Services, LLC
615 East Michigan Street
Milwaukee, WI 53202 |
Independent Registered
Public Accounting Firm Sanville & Company
1514 Old York Rd.
Abington, PA 19001 |
Legal Counsel DLA Piper LLP
1650 Market St., Suite 4900
Philadelphia, PA 19103-7300 |

Item 2. Code of Ethics.
The registrant has adopted a code of ethics that applies to the registrant’s principal executive officer and principal financial officer. The registrant has not made any substantive amendments to its code of ethics during the period covered by this report. The registrant has not granted any waivers from any provisions of the code of ethics during the period covered by this report.
A copy of the registrant’s Code of Ethics is filed herewith.
Item 3. Audit Committee Financial Expert.
The registrant’s board of trustees has determined that there is at least one audit committee financial expert serving on its audit committee. Deborah Wolk is the “audit committee financial expert” and is considered to be “independent” as each term is defined in Item 3 of Form N-CSR.
Item 4. Principal Accountant Fees and Services.
The registrant has engaged its principal accountant to perform audit services, audit-related services, tax services and other services during the past two fiscal years. “Audit services” refer to performing an audit of the registrant's annual financial statements or services that are normally provided by the accountant in connection with statutory and regulatory filings or engagements for those fiscal years. “Audit-related services” refer to the assurance and related services by the principal accountant that are reasonably related to the performance of the audit. “Tax services” refer to professional services rendered by the principal accountant for tax compliance, tax advice, and tax planning. No “Other services” were provided by the principal accountant were. The following table details the aggregate fees billed or expected to be billed for each of the last two fiscal years for audit fees, audit-related fees, tax fees and other fees by the principal accountant.
| | FYE 04/30/2019 | FYE 04/30/2018 |
| Audit Fees | $126,500 | $85,000 |
| Audit-Related Fees | $0 | $0 |
| Tax Fees | $17,400 | $10,000 |
| All Other Fees | $0 | $0 |
The audit committee has adopted pre-approval policies and procedures that require the audit committee to pre-approve all audit and non-audit services of the registrant, including services provided to any entity affiliated with the registrant.
The percentage of fees billed by Sanville & Company applicable to non-audit services pursuant to waiver of pre-approval requirement were as follows:
| | FYE 04/30/2019 | FYE 04/30/2018 |
| Audit-Related Fees | 0% | 0% |
| Tax Fees | 0% | 0% |
| All Other Fees | 0% | 0% |
All of the principal accountant’s hours spent on auditing the registrant’s financial statements were attributed to work performed by full-time permanent employees of the principal accountant.(If more than 50 percent of the accountant’s hours were spent to audit the registrant's financial statements for the most recent fiscal year, state how many hours were attributed to work performed by persons other than the principal accountant's full-time, permanent employees.)
The following table indicates the non-audit fees billed or expected to be billed by the registrant’s accountant for services to the registrant and to the registrant’s investment adviser (and any other controlling entity, etc.—not sub-adviser) for the last two years. The audit committee of the board of trustees/directors has considered whether the provision of non-audit services that were rendered to the registrant's investment adviser is compatible with maintaining the principal accountant's independence and has concluded that the provision of such non-audit services by the accountant has not compromised the accountant’s independence.
| Non-Audit Related Fees | FYE 04/30/2019 | FYE 04/30/2018 |
| Registrant | $0 | $0 |
| Registrant’s Investment Adviser | $0 | $0 |
Item 5. Audit Committee of Listed Registrants.
The registrant is an issuer as defined in Rule 10A-3 under the Securities Exchange Act of 1934, (the “Act”) and has a separately-designated standing audit committee established in accordance with Section 3(a)(58)(A) of the Act. The independent members of the committeeare as follows: Jonathan Newman, Dennis Ryan and Deborah Wolk.
Item 6. Investments.
Schedule of Investments is included as part of the report to shareholders filed under Item 1 of this Form.
Item 7. Disclosure of Proxy Voting Policies and Procedures for Closed-End Management Investment Companies.
Not applicable to open-end investment companies.
Item 8. Portfolio Managers of Closed-End Management Investment Companies.
Not applicable to open-end investment companies.
Item 9. Purchases of Equity Securities by Closed-End Management Investment Company and Affiliated Purchasers.
Not applicable to open-end investment companies.
Item 10. Submission of Matters to a Vote of Security Holders.
There have been no material changes to the procedures by which shareholders may recommend nominees to the registrant’s board of trustees.
Item 11. Controls and Procedures.
| (a) | The Registrant’s President/Principal Executive Officer and Treasurer/Principal Financial Officer have reviewed the Registrant's disclosure controls and procedures (as defined in Rule 30a-3(c) under the Investment Company Act of 1940 (the “Act”)) as of a date within 90 days of the filing of this report, as required by Rule 30a-3(b) under the Act and Rules 13a-15(b) or 15d-15(b) under the Securities Exchange Act of 1934. Based on their review, such officers have concluded that the disclosure controls and procedures are effective in ensuring that information required to be disclosed in this report is appropriately recorded, processed, summarized and reported and made known to them by others within the Registrant and by the Registrant’s service provider. |
| (b) | There were no changes in the Registrant's internal control over financial reporting (as defined in Rule 30a-3(d) under the Act) that occurred during the second fiscal quarter of the period covered by this report that has materially affected, or is reasonably likely to materially affect, the Registrant's internal control over financial reporting. |
Item 12. Exhibits.
| (a) | (1)Any code of ethics or amendment thereto, that is the subject of the disclosure required by Item 2, to the extent that the registrant intends to satisfy Item 2 requirements through filing an exhibit.Filed herewith |
(2)A separate certification for each principal executive officer and principal financial officer pursuant to Section 302 of the Sarbanes-Oxley Act of 2002.Filed herewith.
(3)Any written solicitation to purchase securities under Rule 23c-1 under the Act sent or given during the period covered by the report by or on behalf of the registrant to 10 or more persons.Not applicable to open-end investment companies.
(4)Change in the registrant’s independent public accountant.There was no change in the registrant’s independent public accountant for the period covered by this report.
| (b) | Certifications pursuant to Section 906 of the Sarbanes-Oxley Act of 2002. Furnished herewith. |
SIGNATURES
Pursuant to the requirements of the Securities Exchange Act of 1934 and the Investment Company Act of 1940, the registrant has duly caused this report to be signed on its behalf by the undersigned, thereunto duly authorized.
| (Registrant) | Pacer Funds Trust | |
| | | |
| By (Signature and Title) | /s/ Joe M. Thomson | |
| | Joe M. Thomson, President (Principal Executive Officer) | |
| | | |
| Date | 07/08/19 | |
Pursuant to the requirements of the Securities Exchange Act of 1934 and the Investment Company Act of 1940, this report has been signed below by the following persons on behalf of the registrant and in the capacities and on the dates indicated.
| By (Signature and Title) | /s/ Joe M. Thomson | |
| | Joe M. Thomson, President (Principal Executive Officer) | |
| | | |
| Date | 07/08/19 | |
| | | |
| By (Signature and Title) | /s/ Sean E. O’Hara | |
| | Sean E. O’Hara, Treasurer (Principal Financial Officer) | |
| | | |
| Date | 07/08/19 | |
| * | Print the name and title of each signing officer under his or her signature. |