As filed with the U.S. Securities and Exchange Commission on 07/08/2020
UNITED STATES
SECURITIES AND EXCHANGE COMMISSION
Washington, D.C. 20549
FORM N-CSR
CERTIFIED SHAREHOLDER REPORT OF REGISTERED
MANAGEMENT INVESTMENT COMPANIES
Investment Company Act file number 811-23024
Pacer Funds Trust
(Exact name of registrant as specified in charter)
500 Chesterfield Parkway
Malvern, PA 19355
(Address of principal executive offices) (Zip code)
Joe M. Thomson, President
500 Chesterfield Parkway
Malvern, PA 19355
(Name and address of agent for service)
610-644-8100
Registrant's telephone number, including area code
Date of fiscal year end: April 30
Date of reporting period: May 1, 2019 through April 30, 2020
Item 1. Reports to Stockholders.
Pacer Funds
TABLE OF CONTENTS
| | Page |
Letter to Shareholders | 1 |
Portfolio Allocation | 14 |
Performance Summary | 21 |
Expense Example | 45 |
Schedules of Investments | 47 |
Statements of Assets & Liabilities | 86 |
Statements of Operations | 91 |
Statements of Changes in Net Assets | 96 |
Financial Highlights | 107 |
Notes to Financial Statements | 129 |
Report of Independent Registered Public Accounting Firm | 149 |
Additional Information | 151 |
Pacer Funds
Dear Shareholder,
Looking back on this past fiscal year, I am filled with gratitude and pride. As a company, we have surpassed milestones such as growing our assets under management to over $6 billion and building our team to serve more financial advisors and their clients across the country. Our unique model, which centers around the distribution of our exchange traded funds (ETFs) through the financial advisor community, continues to be our focus.
Our goal, from our inception nearly five years ago, has been to design innovative products to help investors and financial advisors meet their objectives. This year, we expanded our fund offerings by adding six exchange traded funds to our flagship Trendpilot and Cash Cows Series’. These include our first fixed income ETF, the Pacer Trendpilot US Bond ETF (PTBD), as well as the Pacer Trendpilot International ETF (PTIN), Pacer Trendpilot Fund of Funds ETF (TRND), Pacer Emerging Markets Cash Cows 100 ETF (ECOW), Pacer US Cash Cows Growth ETF (BUL) and Pacer Cash Cows Fund of Funds ETF (HERD). In addition, we acquired the Pacer American Energy Independence ETF (USAI) and the Pacer CSOP FTSE China A50 ETF (AFTY). These additions allow us to offer a more comprehensive range of products.
We thank the investors, financial advisors and our partners for entrusting your assets with us as we look forward to growing with you.

Joe M. Thomson
Chairman, Pacer Funds Trust
1
Pacer Funds
Market Environment Overview
2019 was another strong year for equity market performance as the 10-year long bull market continued to make all-time highs. 2020 started off with a sharp January advance before peaking in February as news of the escalating Coronavirus pandemic began to surface. The selloff intensified in early March as reports of the increasing spread of the virus roiled markets and resulted in government-imposed shutdowns. The market bottomed in late March after recording one of the largest and fastest declines in history. The market ultimately found a bottom in late March as the number of reported new cases flatted and market participants began to price in a v-shaped recovery in economic activity. As of April 30, the market has nearly retraced 2/3 of the decline.
2020 has been one of the narrowest markets in history with a small subset of large cap technology stocks driving a large proportion of the advance in major market averages. Technology, Consumer, and Healthcare stocks have led the way, while Energy and Financials have lagged. Growth stocks have continued to outperform value stocks and US stocks have outperformed International stocks.
The outlook for the rest of the year looks likely to be driven by news regarding the containment of the virus and the loosing of restrictions driving a recovery in economic activity. The key risks facing this market are signs of a worsening spread of the virus, slower than expected economic recovery, and narrow market participation.
The Pacer Trendpilot™ Series
The Pacer Trendpilot series is based on a trend following strategy that alternates exposure between a Benchmark Index and 3-Month US T-Bills using three indicators. It is designed to participate in the market when it is trending up, maintain some exposure during short term market declines and exit the market when it is trending down. The period referenced in this section for all Trendpilot Funds is for the fiscal year end of April 30, 2020.
Pacer Trendpilot® US Large Cap ETF
The Pacer Trendpilot® US Large Cap ETF (the “Fund”) is an exchange traded fund that seeks to track the total return performance, before fees and expenses, of the Pacer Trendpilot® US Large Cap Index (the “Index”).
The Index uses an objective, rules-based methodology to implement a systematic trend-following strategy that directs exposure (i) 100% to the S&P 500 Index, (ii) 50% to the S&P 500 Index and 50% to 3-Month US Treasury bills, or (iii) 100% to 3-Month US Treasury bills, depending on the relative performance of the S&P 500 Total Return Index and its 200-business day historical simple moving average.
The S&P 500 Total Return Index is a total return version of the S&P 500 Index and reflects the reinvestment of dividends paid by the securities in the S&P 500 Index. The S&P 500 Index consists of approximately 500 leading U.S.-listed companies representing approximately 80% of the U.S. equity market capitalization.
The Fund
The Fund had a total return of -10.71%. The Index had a total return of -10.25%. The S&P 500 Index had a total return of 0.86%.
The Fund had two exposure changes during the fiscal year. Summary details of these changes are presented in the following table.
PTLC EXPOSURE CHANGES |
Dates | Resulting Exposure | U.S. Treasury 3-Month Yield |
March 12, 2020 | 50% T-Bills / 50% Equities | 0.30% |
March 13, 2020 | 100% T-Bills | 0.24% |
Pacer Trendpilot® US Mid Cap ETF
The Pacer Trendpilot® US Mid Cap ETF (the “Fund”) is an exchange traded fund that seeks to track the total return performance, before fees and expenses, of the Pacer Trendpilot US Mid Cap Trendpilot Index (the “Index”).
The Index uses an objective, rules-based methodology to implement a systematic trend-following strategy that directs exposure (i) 100% to the S&P MidCap 400 Index, (ii) 50% to the S&P MidCap 400 Index and 50% to 3-Month US Treasury bills, or (iii) 100% to 3-Month US Treasury bills, depending on the relative performance of the S&P MidCap 400 Total Return Index and its 200-business day historical simple moving average.
2
Pacer Funds
The S&P MidCap 400 Total Return Index is a total return version of the S&P MidCap 400 Index and reflects the reinvestment of dividends paid by the securities in the S&P MidCap 400 Index. The S&P Midcap 400 measures the performance of mid-capitalization stocks in the United States.
The Fund
The Fund had a total return of -7.11%. The Index had a total return of -6.72%. The S&P MidCap 400 Index had a total return of -14.94%.
The Fund had three exposure changes during the fiscal year. Summary details of these changes are presented in the following table.
PTMC EXPOSURE CHANGES |
Dates | Resulting Exposure | U.S. Treasury 3-Month Yield |
May 31, 2019 | 100% T-Bills | 2.34% |
June 12, 2019 | 100% Equities | 2.21% |
March 4, 2020 | 100% T-Bills | 0.71% |
Pacer Trendpilot® 100 ETF
The Pacer Trendpilot® 100 ETF (the “Fund”) seeks to track the total return performance, before fees and expenses, of the Pacer NASDAQ-100 Trendpilot™ Index (the “Index”).
The Index uses an objective, rules-based methodology to implement a systematic trend-following strategy that directs exposure (i) 100% to the Nasdaq-100 Index, (ii) 50% to the Nasdaq-100 Index and 50% to 3-Month US Treasury bills, or (iii) 100% to 3-Month US Treasury bills, depending on the relative performance of the Nasdaq-100 Total Return Index and its 200-business day historical simple moving average.
The Nasdaq-100 Total Return Index is a total return version of the Nasdaq-100 Index and reflects the reinvestment of dividends paid by the securities in the Nasdaq-100 Index. The Nasdaq-100 Index includes approximately 100 of the largest non-financial securities listed on The Nasdaq Stock Market based on market capitalization. The Nasdaq-100 Index comprises securities of companies across major industry groups, including computer, biotechnology, healthcare, telecommunications and transportation. However, it does not contain securities of financial companies, including investment companies. The Nasdaq-100 Index was developed by Nasdaq OMX. There is no minimum market capitalization requirement for inclusion in the Nasdaq-100 Index. Inclusion is determined based on the top 100 largest issuers based on market capitalization meeting all other eligibility requirements.
The Fund
The Fund had a total return of 5.78%. The Index had a total return of 6.09%. The NASDAQ-100 Index had a total return of 16.90%.
The Fund had two exposure changes during the fiscal year. Summary details of these changes are presented in the following table.
PTNQ EXPOSURE CHANGES |
Dates | Resulting Exposure | U.S. Treasury 3-Month Yield |
March 18, 2020 | 50% T-Bills / 50% Equities | -0.01% |
April 16, 2020 | 100% Equities | 0.11% |
Pacer Trendpilot® European Index ETF
The Pacer Trendpilot® European Index ETF (the “Fund”) seeks to track the total return performance, before fees and expenses, of the Pacer Trendpilot European Index (the “Index”).
The Index uses an objective, rules-based methodology to implement a systematic trend-following strategy that directs exposure (i) 100% to the FTSE Eurozone Index, (ii) 50% to the FTSE Eurozone Index and 50% to 3-Month US Treasury bills, or (iii) 100% to 3-Month US Treasury bills, depending on the relative performance of the FTSE Eurozone Total Return Index and its 200-business day historical simple moving average.
3
Pacer Funds
The FTSE Eurozone Index is a rules-based, float-adjusted, market capitalization weighted index comprised of large- and mid-capitalization stocks providing coverage of the developed markets in the euro zone, including primarily France, Germany, Spain, the Netherlands and Italy. The FTSE Eurozone Index is a subset of the FTSE Global Equity Index Series, which covers 98% of the world’s investable market capitalization. The FTSE Eurozone Total Return Index is a total return version of the FTSE Eurozone Index and reflects the reinvestment of dividend paid by the securities in the FTSE Eurozone Index.
The Fund
The Fund had a total return of -8.18%. The Index had a total return of -7.11%. The FTSE Eurozone Index (USD) had a total return of -16.31%.
The Fund had two exposure changes during the fiscal year. Summary details of these changes are presented in the following table.
PTEU EXPOSURE CHANGES |
Dates | Resulting Exposure | U.S. Treasury 3-Month Yield |
March 5, 2020 | 50% T-Bills / 50% Equities | 0.61% |
March 9, 2020 | 100% T-Billss | 0.34% |
Pacer Trendpilot® International ETF
The Pacer Trendpilot® International ETF is an exchange traded fund (“ETF”) that seeks to track the total return performance, before fees and expenses, of the Pacer Trendpilot International Index (the “Index”).
The Index uses an objective, rules-based methodology to implement a systematic trend-following strategy that directs exposure (i) 100% to the S&P Developed Ex-U.S. LargeCap Index, (ii) 50% to the S&P Developed Ex-U.S. LargeCap Index and 50% to 3-Month US Treasury bills, or (iii) 100% to 3-Month US Treasury bills, depending on the relative performance of the S&P Developed Ex-U.S. LargeCap Index and its 200-business day historical simple moving average (the “200-day moving average”). The calculation of the 200-day moving average for the S&P Developed Ex-U.S. LargeCap Index is based on the total return version of the S&P Developed Ex-U.S. LargeCap Local Currency Index and reflects the reinvestment of dividends paid by the securities in the S&P Developed Ex-U.S. LargeCap Index. The Index is expected to be predominantly invested in the components of the S&P Developed Ex-U.S. LargeCap Index over most short- and long-term periods and is only expected to invest in 3-Month US Treasury bills from time to time in response to adverse market conditions as defined by the “50/50 Indicator” and “T-Bill Indicator” below.
The S&P Developed Ex-U.S. LargeCap Index is a rules-based, float-adjusted, market capitalization-weighted index comprised of large-capitalization stocks providing coverage of the developed markets excluding the United States. The S&P Developed Ex-U.S. LargeCap Index is a subset of the S&P Global BMI, a comprehensive, rules-based index measuring global stock market performance.
The Fund
The Fund’s inception date was May 2, 2019. The Fund had a since inception return of -5.08%. The Index had a total return of -4.11%. The S&P Developed Ex-US Large Cap Index had a total return of -9.35%.
The Fund had two exposure changes during the fiscal year. Summary details of these changes are presented in the following table.
PTIN EXPOSURE CHANGES |
Dates | Resulting Exposure | U.S. Treasury 3-Month Yield |
March 5, 2020 | 50% T-Bills / 50% Equities | 0.61% |
March 10, 2020 | 100% T-Bills | 0.43% |
Pacer Trendpilot® US Bond ETF
The Pacer Trendpilot US Bond ETF (the “Fund”) is an exchange traded fund (“ETF”) that seeks to track the total return performance, before fees and expenses, of the Pacer Trendpilot US Bond Index (the “Index”).
4
Pacer Funds
The Index uses an objective, rules-based methodology to implement a systematic trend-following strategy that directs exposure to one of the following positions: (i) 100% to the S&P U.S. High Yield Corporate Bond Index, (ii) 50% to the S&P U.S. High Yield Corporate Bond Index and 50% to the S&P U.S. Treasury Bond 7-10 Year Index or (iii) 100% to S&P U.S. Treasury Bond 7-10 Year Index, depending on the Risk Ratio.
The S&P U.S. High Yield Corporate Bond Index is designed to track the performance of U.S. dollar-denominated, high-yield corporate bonds issued in the U.S. The S&P U.S. Treasury Bond 7-10 Year Index is designed to measure the performance of U.S. Treasury bonds maturing in 7 to 10 years. The Index uses a “Risk Ratio” to signal a change in the position of the Index. The Risk Ratio is calculated by dividing the value of the S&P U.S. High Yield Corporate Bond Index by the value of the S&P U.S. Treasury Bond 7-10 Year Index.
The Index, and consequently the Fund, may stay in any of its three possible positions for an extended period of time. As described below, the Index will change its position based on the following indicators, and each change will become effective by the close of business on the sixth business day after the indicator for the change is triggered. The Index will be in a new position effective on the seventh business day.
The Fund
The Fund had an inception date of October 22, 2019. The fund had a since inception return of 4.24%. The Index had a return of 4.34%. The S&P US High Yield Corporate Bond Index had a total return of -6.85%. The S&P US Treasury Bond 7-10 Year Index had a total return of 9.87%.
The Fund had two exposure changes during the fiscal year. Summary details of these changes are presented in the following table.
PTBD EXPOSURE CHANGES |
Dates | Resulting Exposure | U.S. Treasuriy 10-Year Yield |
October 23, 2019 | 100% High Yield Bonds | 1.76% |
March 2, 2020 | 100% U.S. Treasury Bonds | 1.16% |
Pacer Trendpilot® Fund of Funds ETF
The Pacer Trendpilot Fund of Funds ETF is an exchange traded fund (“ETF”) that seeks to track the total return performance, before fees and expenses, of the Pacer Trendpilot Fund of Funds Index (the “Index” or the “Fund of Funds Index”).
The Fund of Funds Index uses an objective, rules-based approach to construct a portfolio that, as of each quarterly rebalance, is composed of the ETFs listed in the following table, each advised by the Adviser (collectively, the “Trendpilot ETFs”). Each of the Trendpilot ETFs is an index-based ETF that seeks to track the total return performance, before fees and expenses, of the underlying index listed in the following table (collectively, the “Trendpilot Indexes”). Each Trendpilot Index uses an objective, rules-based methodology to implement a systematic trend-following strategy that directs exposure (i) 100% to the “Equity Component” specified in the table below, (ii) 50% to the applicable Equity Component and 50% to 3-Month US Treasury bills, or (iii) 100% to 3-Month US Treasury bills, depending on the relative performance of the Equity Component and its 200- business day historical simple moving average (the “200-day moving average”). The calculation of the 200-day moving average for each Equity Component is based on the total return version of such Equity Component and reflects the reinvestment of dividends paid by the securities in such Equity Component.
Weight | Trendpilot ETF | Trendpilot Index | Equity Universe |
20% | Pacer Trendpilot® US Large Cap ETF | Pacer Trendpilot US Large Cap Index S | S&P 500® Index |
20% | Pacer Trendpilot® US Mid Cap ETF | Pacer Trendpilot US Mid Cap Index | S&P MidCap 400® Index |
20% | Pacer Trendpilot® 100 ETF | Pacer NASDAQ-100 Trendpilot Index | NASDAQ-100® Index |
40% | Pacer Trendpilot® International ETF | Pacer Trendpilot International Index | S&P Developed Ex-U.S. LargeCap Index |
The Fund
The Fund had an inception date of May 3, 2019. The Fund had a since inception return of -5.37%. The Index had a return of -4.41%. The S&P Global 1200 Index had a total return of -3.63%.
The Pacer Cash Cows Index® ETF Series
The Pacer Cash Cows ETFs aim to provide capital appreciation over time by screening broad based indexes to identify quality companies with high free cash flow yield. The period referenced in this section for all Cash Cows Funds is for the fiscal year end of April 30, 2020.
5
Pacer Funds
Pacer Global Cash Cows Dividend ETF
The Pacer Global Cash Cows Dividend ETF (the “Fund”) seeks to track the total return performance, before fees and expenses, of the Pacer Global Cash Cows Dividend Index (the “Index”).
The Index uses an objective, rules-based methodology to provide exposure to global companies with high dividend yield backed by a high free cash flow yield. The initial index universe is derived from the component companies of the FTSE Developed Large Cap Index. The initial universe of companies is screened based on their average projected free cash flows and earnings over each of the next two fiscal years. Companies with negative average projected free cash flows or earnings are removed from the Index universe. Additionally, financial companies, other than real estate investment trusts, are excluded from the Index universe. The remaining companies are ranked by their free cash flow yield for the trailing twelve-month period. The 300 companies with the highest free cash flow yield are then ranked by their dividend yield. The equity securities of the 100 companies with the highest dividend yield are included in the Index.
The FTSE Developed Large-Cap Index is a market-capitalization weighted index representing the performance of large-cap stocks in developed markets. The FTSE Developed Large-Cap Total Return Index is a total return version of the FTSE Developed Large-Cap Index and reflects the reinvestment of dividends paid by the securities in the FTSE Developed Large-Cap Index.
The Fund
The Fund had a total return of -17.32%. The Index had a total return of -16.46%. The FTSE Developed Large-Cap Index had a total return of -1.78%.
During the fiscal year, the top three sectors for contribution to performance were Healthcare at 21.94%, Industrials at -8.92%, and Utilities at -12.92%. The three sectors with the lowest contribution to performance were Consumer Discretionary at -29.64%, Real Estate at -39.05%, and Energy at -38.09%. Sector performance numbers reflect their total return during the period.
Pacer US Cash Cows 100 ETF
The Pacer US Cash Cows 100 ETF (the “Fund”) seeks to track the total return performance, before fees and expenses, of the Pacer US Cash Cows 100 Index (the “Index”).
The Index uses an objective, rules-based methodology to provide exposure to large and mid-capitalization U.S. companies with high free cash flow yields. The initial index universe is derived from the component companies of the Russell 1000 Index. The initial universe of companies is screened based on their average projected free cash flows and earnings over each of the next two fiscal years. Companies with no forward year estimates available for free cash flows or earnings will remain in the Index universe. Companies with negative average projected free cash flows or earnings are removed from the Index universe. Additionally, financial companies, other than real estate investment trusts, are excluded from the Index universe. The remaining companies are ranked by their free cash flow yield for the trailing twelve-month period. The equity securities of the 100 companies with the highest free cash flow yield are included in the Index.
The Russell 1000 Index is a market-capitalization weighted index representing the top 1,000 large-cap stocks in the Russell 3000 Index. The Russell 1000 Total Return Index is a total return version of the Russell 1000 Index that reflects the reinvestment of dividends paid by the securities in the Russell 1000 Index.
The Fund
The Fund had a total return of -12.63%. The Index had a total return of -12.54%. The Russell 1000 Index had a total return of 0.09%.
During the fiscal year, the top three sectors for contribution to performance were Healthcare at 24.33%, Consumer Staples at 9.95%, and Real Estate at -19.74%. The three sectors with the lowest contribution to performance were Consumer Discretionary at -25.31%, Communication Services at -12.91%, and Industrials at -27.18%. Sector performance numbers reflect their total return during the period.
Pacer US Small Cap Cash Cows 100 ETF
The Pacer US Small Cap Cash Cows 100 ETF (the “Fund”) seeks to track the total performance, before fees and expenses, of the Pacer US Small Cap Cash Cows 100 Index (the “Index”).
The Index uses an objective, rules-based methodology to provide exposure to small-capitalization U.S. companies with high free cash flow yields. The initial index universe is derived from the component companies of the S&P Small Cap 600 Index. The initial universe of companies is screened based on their average projected free cash flows and earnings over each of the next two fiscal years. Companies with no forward year estimates available for free cash flows or earnings will remain in the Index universe. Companies with negative average projected
6
Pacer Funds
free cash flows or earnings are removed from the Index universe. Additionally, financial companies, other than real estate investment trusts, are excluded from the Index universe. The remaining companies are ranked by their free cash flow yield for the trailing twelve-month period. The equity securities of the 100 companies with the highest free cash flow yield are included in the Index.
The S&P SmallCap 600 Index measures the performance of 600 small sized companies in the US equity market, with market capitalization ranging from $450 million to $2.1 billion USD. The Index does not overlap holdings with the S&P 500 or S&P MidCap 400.
The Fund
The Fund had a total return of -18.72%. The Index had a total return of -18.83%. The S&P 600 Index had a total return of -19.60%.
During the fiscal year, the top three sectors for contribution to performance were Healthcare at 12.15%, Real Estate at 67.43%, and Consumer Staples at 5.55%. The three sectors with the lowest contribution to performance were Materials at -39.80%, Energy at –77.63%, and Consumer Discretionary at -30.68%. Sector performance numbers reflect their total return during the period.
Pacer Developed Markets International Cash Cows 100 ETF
The Pacer Developed Markets International Cash Cows 100 ETF (the “Fund”) seeks to track the total performance, before fees and expenses, of the Pacer Developed Markets International Cash Cows 100 Index (the “Index”).
The Index uses an objective, rules-based methodology to provide exposure to large and mid-capitalization non-U.S. companies in developed markets with high free cash flow yields. The initial index universe is derived from the component companies of the FTSE Developed ex US Index. The initial universe of companies is screened based on their average projected free cash flows and earnings over each of the next two fiscal years. Companies with no forward year estimates available for free cash flows or earnings will remain in the Index universe. Companies with negative average projected free cash flows or earnings are removed from the Index universe. Additionally, financial companies, other than real estate investment trusts and companies with a market capitalization of less than $3 billion are excluded from the Index universe. The remaining companies are ranked by their average daily trading value (“ADTV”) for the prior three months. The 500 companies with the highest ADTV are then ranked by their free cash flow yield for the trailing twelve-month period. The equity securities of the 100 companies with the highest free cash flow yield are included in the Index.
The FTSE Developed ex-US Index is comprised of Large (85%) and Mid (15%) cap stocks providing coverage of Developed markets (24 countries) excluding the US. The index is derived from the FTSE Global Equity Index Series, which covers over 99% of the world’s investable market capitalization.
The Fund
The Fund had a total return of -20.04%. The Index had a total return of -18.97%. The FTSE Developed ex US Index had a total return of -11.18%.
During the fiscal year, the top three sectors for contribution to performance were Healthcare at 24.21%, Information Technology at 4.14%, and Real Estate at -34.42%. The three sectors with the lowest contribution to performance were Consumer Discretionary at -24.94%, Materials at -22.70%, and Energy at -40.29%. Sector performance numbers reflect their total return during the period.
Pacer Emerging Markets Cash Cows 100 ETF
The Pacer Emerging Markets Cash Cows 100 ETF is an exchange traded fund (“ETF”) that seeks to track the total return performance, before fees and expenses, of the Pacer Emerging Markets Cash Cows 100 Index (the “Index”).
The Index uses an objective, rules-based methodology to provide exposure to large and mid-capitalization companies in emerging markets with high free cash flow yields. Companies with high free cash flow yields are commonly referred to as “cash cows”. The initial index universe is derived from the component companies of the FTSE Emerging Markets Index. The Fund defines emerging markets countries as those countries included in the FTSE Emerging Markets Index. As of April 2020, the Index had significant exposure to companies in Hong Kong, Taiwan, Russia, and Brazil. The initial universe of companies is screened based on their average projected free cash flows and earnings (if available) over each of the next two fiscal years. Companies with no forward year estimates available for free cash flows or earnings will remain in the Index universe. Companies with negative average projected free cash flows or earnings are removed from the Index universe. Additionally, financial companies, other than real estate investment trusts (“REITs”), companies with a market capitalization of less than $2 billion, and companies whose average daily trading value (“ADTV”) for the prior 90 days does not exceed $5 million are excluded from the Index universe. The remaining companies are ranked by their free cash flow yield for the trailing twelve-month period. The equity securities of the 100 companies with the highest free cash flow yield (the “Top 100 Companies”) are included in the Index, subject to the exceptions
7
Pacer Funds
described below. At the time of each rebalance of the Index, the companies included in the Index are weighted in proportion to their trailing twelve-month free cash flow, and weightings are capped at 2% of the weight of the Index for any individual company. Additionally, the Index is limited to a maximum of twenty companies from any individual country and any sector. As of April 2020, the Index had significant exposure to companies in the materials, energy and information technology sectors. If the Top 100 Companies include more than 20 companies from an individual country or sector (the “Exposure Limit”), the Index will exclude the companies with the lowest free cash flow yield from each country and/or sector needed to meet the Exposure Limit and will include companies outside the Top 100 Companies based on their free cash flow yield until the Index includes 100 companies and satisfies the Exposure Limit. As of April 30, 2020, the companies included in the Index had a market capitalization of $671 million to $50.6 billion. The Index is reconstituted and rebalanced semi-annually as of the close of business on the 3rd Friday of June and December based on data as of the 1st Friday of the applicable rebalance month.
The Fund
The Fund had an inception date of May 2, 2019. The Fund had a since inception return of -16.76%. The Index had a total return of -15.32%. The FTSE Emerging Market Index had a total return of -11.89%.
During the fiscal year, the top three sectors for contribution to performance were Information Technology at 16.85%, Health Care at 1.51%, and Telecommunication Services at 11.33%. The three sectors with the lowest contribution to performance were Consumer Staples at -25.38%, Communication Services at -20.49%, and Energy at -24.25%. Sector performance numbers reflect their total return during the period.
Pacer Cash Cows Growth ETF
The Pacer US Cash Cows Growth ETF is an exchange traded fund (“ETF”) that seeks to track the total return performance, before fees and expenses, of the Pacer US Cash Cows Growth Index (the “Index”).
The Fund employs a “passive management” (or indexing) investment approach designed to track the total return performance, before fees and expenses, of the Index. The Index is based on a proprietary methodology developed and maintained by Index Design Group, an affiliate of Pacer Advisors, Inc., the Fund’s investment adviser (the “Adviser”). The Index uses an objective, rules-based methodology to provide exposure to mid- and large-capitalization U.S. companies with high free cash flow yields. Companies with high free cash flow yields are commonly referred to as “cash cows”. The initial Index universe is derived from the component companies of the S&P 900® Pure Growth Index. The initial universe of companies is screened based on their average projected free cash flows and earnings (if available) over each of the next two fiscal years. Companies for which information on their projected free cash flows or earnings is not available will remain in the Index universe. Companies with negative average projected free cash flows or earnings are removed from the Index universe. Additionally, financial companies, other than real estate investment trusts (“REITs”), are excluded from the Index universe. The remaining companies are ranked by their free cash flow yield for the trailing twelve month period. The equity securities of the 50 companies with the highest free cash flow yield are included in the Index. As of April 2020, the Index had significant exposure to companies in the information technology, consumer discretionary and industrials. At the time of each rebalance of the Index, the companies included in the Index are weighted in proportion to their current market capitalization, and weightings are capped at 5% of the weight of the Index for any individual company. Weight above the 5% limitation is redistributed among the other Index constituents in proportion to their weights. As of April 23, 2020, the Index had a market capitalization range of $1.3 billion to $1.3 trillion. The Index is reconstituted and rebalanced quarterly as of the close of business on the 3nd Friday of March, June, September, and December based on data as of the 2nd Friday of the applicable rebalance month.
The Fund
The Fund had an inception date of May 2, 2019. The Fund had a since inception return of -6.52%. The Index had a total return of -6.49%. The S&P 900 Pure Growth Index had a total return of -5.48%.
During the fiscal year, the top three sectors for contribution to performance were Healthcare at 67.44%, Communication Services at 10.41%, and Real Estate at 21.56%. The three sectors with the lowest contribution to performance were Energy at -41.33%, Materials at -64.72%, and Information Technology at -10.61%. Sector performance numbers reflect their total return during the period.
Pacer Cash Cows Fund of Funds ETF
The Pacer Cash Cows Fund of Funds ETF is an exchange traded fund (“ETF”) that seeks to track the total return performance, before fees and expenses, of the Pacer Cash Cows Fund of Funds Index (the “Index” or the “Fund of Funds Index”).
8
Pacer Funds
The Fund employs a “passive management” (or indexing) investment approach designed to track the total return performance, before fees and expenses, of the Index. The Index is based on a proprietary methodology developed and maintained by Index Design Group, an affiliate of Pacer Advisors, Inc., the Fund’s investment adviser (the “Adviser”). The Fund of Funds Index uses an objective, rules-based approach to construct a portfolio that, as of each quarterly rebalance, is composed of the ETFs listed in the following table, each advised by the Adviser (collectively, the “Cash Cows ETFs”). Each of the Cash Cows ETFs is an index-based ETF that seeks to track the total return performance, before fees and expenses, of the applicable underlying index listed in the following table (collectively, the “Cash Cows Indexes”). Each Cash Cows Index uses an objective, rules-based methodology to provide exposure to companies with high free cash flow yields (commonly referred to as “cash cows”) selected from the applicable “Equity Universe” as indicated in the following table.
Weight | Cash Cows ETF | Cash Cows Index | Equity Universe |
20% | Pacer US Cash Cows 100 ETF | Pacer US Cash Cows 100 Index | Russell 1000 Index |
20% | Pacer Global Cash Cows Dividend ETF | Pacer Global Cash Cows Dividend Index | FTSE Developed Large Cap Index |
20% | Pacer US Small Cap Cash Cows 100 ETF | Pacer US Small Cap Cash Cows Index | S&P Small Cap 600® Index |
20% | Pacer US Cash Cows Growth ETF | Pacer US Cash Cows Growth Index | S&P 900® Pure Growth Index |
20% | Pacer Developed Markets
International Cash Cows 100 ETF | Pacer Developed Markets
International Cash Cows 100 Index | FTSE Developed ex US Index |
The Fund
The Fund had an inception date of May 3, 2019. The Fund had a since inception return of -15.71%. The Index had a total return of -14.98%. The FTSE All-World Developed Index had a total return of -4.15%.
The Pacer Custom ETF Series
The Pacer Custom ETFs are strategy-driven, rules-based and are each designed to offer a specific investment focus. The period referenced in this section for all custom funds is for the fiscal year end of April 30, 2020.
Pacer WealthShield ETF
The Pacer WealthShield ETF (the “Fund”) seeks to track the total performance, before fees and expenses, of the Pacer WealthShield Index (the “Index”).
The Index uses an objective, rules-based methodology to implement a trend-following strategy that directs some or all of the Index’s exposure to (i) U.S. equity securities or (ii) U.S. Treasury securities depending on the strength of the high yield corporate (“junk”) bond market relative to U.S. Treasury bonds and the momentum of certain U.S. equity sectors or industries and of long-term U.S. Treasury bonds.
The Fund
The Fund had a total return of -3.04%. The Index had a total return of -3.59%. The S&P 500 Index had a total return of 0.86%.
Throughout the fiscal year, the Fund spent most of the time with “risk on” and went “risk off”, in June and September 2019, and March to April in 2020.
Pacer Military Times Best Employers ETF
The Pacer Military Times Best Employers ETF (the “Fund”) seeks to track the total performance, before fees and expenses, of the Military Times Best for VetsSM Index (the “Index”).
The Index is owned and developed by VETS Indexes, LLC (the “Index Provider”) and based on The Military Times Best for VetsSM: Employers list (the “Best for Vets List”) published annually by Sightline Media Group. The Best for Vets List is published each year based on detailed surveys (the “Best for Vets Survey”) completed by companies doing business in the United States that address the recruiting of U.S. armed forces veterans and service members, company culture, policies and reservist accommodations. Responses to each such category of questions are weighted to create a composite score and companies with composite scores in the top 60% of all participating companies are included on The Best for Vets List. Companies on the Best for Vets List are expected to come from a variety of sectors and industries, such as banking, information technology, energy and telecommunications, among others. Although all the companies in the Index have their stock listed on a U.S. exchange, such companies may have significant (or a majority of their) business operations outside of the United States.
9
Pacer Funds
The Index is composed of the U.S.-listed stocks of companies that have been included in the Best for Vets List for the last three consecutive years, have a minimum market capitalization of $200 million and meet the Index’s liquidity threshold. Index components are equally weighted at the time of each annual reconstitution of the Index, which is effective at the close of business on the third Friday of each September. As of April 30, 2020, the Index was made up of 48 companies and included significant allocations to companies in the financial, industrial and information technology sectors. Companies previously included in the Index for two consecutive years that are no longer on the Best for Vets List may continue to be included in the Index if the reason that they are no longer on the Best for Vets List is because they did not complete the most recent Best for Vets Survey.
The Fund
The Fund had a total return of -1.59%. The Index had a total return of -1.76%. The S&P 500 Index had a total return of 0.86%.
During the fiscal year, the top three sectors for contribution to performance were Information Technology at 13.16%, Healthcare at 25.61%, and Consumer Staples at 17.73%. The three sectors with the lowest contribution to performance were Utilities at 0.78%, Industrials at -7.24%, and Financials at -20.21%. Sector performance numbers reflect their total return during the period.
Pacer CSOP FTSE China A50 ETF
The Pacer CSOP FTSE China A50 ETF (the “Fund”) is an exchange traded fund (“ETF”) that seeks to provide investment results that, before fees and expenses, track the performance for the FTSE China A50 Net Total Return Index (the “Index.”)
The Fund employs a “passive management” (or indexing) investment approach designed to track the total return performance, before fees and expenses, of the Index. The Index The Index is comprised of A-Shares issued by the 50 largest companies in the China A-Shares market. The Index is a net total return index, which means that the performance of the Index assumes that dividends paid by the Index constituents, net of any withholding taxes, are reinvested in additional shares of such Index constituents. The Index is a free float-adjusted market capitalization-weighted index compiled and published by FTSE International Limited (“FTSE” or the “Index Provider”), which is not affiliated with the Fund, Pacer Advisors, Inc. (the “Adviser”), CSOP Asset Management Limited (the “Sub-Adviser”), or the Fund’s distributor. The Index is a real-time, tradable index comprising the largest 50 China A-Share companies by full market capitalization of the FTSE China AAll Cap Free Index. The Index is a subset of the FTSE China AAll Cap Free Index, FTSE’s most comprehensive benchmark for the Chinese A-Share market. It is denominated and quoted in Chinese Yuan (“CNY”) and comprised of stocks listed on the Shanghai Stock and Shenzhen Stock Exchange main markets, the Shenzhen SME Board and/or the Shenzhen ChiNext Board. The Index Provider determines the composition of the Index and relative weightings of the Index constituents based on the Index’s methodology, and publishes information regarding the market value of the Index.
The Fund
The Fund’s last fiscal year ended September 30, 2019. Since last fiscal year end, the Fund had a total return of 0.14%. The FTSE China A50 Index had a total return of 0.30% during this same timeframe.
Pacer Benchmark Data & Infrastructure Real Estate SCTR ETF
The Pacer Benchmark Data & Infrastructure Real Estate SCTRSM ETF (the “Fund”) is an exchange traded fund that seeks to track the total return performance, before fees and expenses, of the Benchmark Data & Infrastructure Real Estate SCTRSM Index (the “Index”).
The Index is generally composed of the U.S.-listed equity securities of companies that derive at least 85% of their earnings or revenues from real estate operations in the data and infrastructure real estate sectors (“Eligible Companies”). At the time of each reconstitution of the Index, Eligible Companies with a market capitalization of more than $200 million and average daily traded volume of at least 10,000 shares are included in the Index (the “Index Constituents”). A significant portion of the Index is expected to be composed of real estate investment trusts (“REITs”). The real estate companies included in the Index may utilize leverage, and some may be highly leveraged. Additionally, such companies may include significant business operations outside of the United States.
The Index is reconstituted and rebalanced quarterly as of the close of business on the third Friday of each March, June, September, and December based on data as of the end of the previous month (each, a “Reference Date”). Index Constituents 39 are weighted based on their free-float market capitalization (i.e., market capitalization based on the number of shares available to the public), subject to the following constraints as of the time of each reconstitution of the Index. Each Index Constituent’s weight is capped at 15% and the sum of Index Constituents with weights greater than 4.5% cannot exceed 45% of the total Index weight. If the foregoing limits would be exceeded at the time of a reconstitution of the Index, the excess weight is proportionally redistributed to all Index Constituents with weights below such limits.
10
Pacer Funds
The Fund
The Fund had a total return of 19.50%. The Index had a total return of 20.30%. The FTSE NAREIT All Equity REITS Index had a total return of -8.30%.
The Fund’s top three contributors to its return were Equinix, Inc., Crown Castle International Corp, and American Tower Corporation. These stocks realized total returns of 51.21%, 31.13%, and 23.99%, respectively.
The Fund’s bottom three contributors to its return were Uniti Group Inc., Lamar Advertising Company, and OUTFRONT Media Inc. These stocks realized total returns of -31.54%, -26.66%, and -30.32%.
Pacer Benchmark Industrial Real Estate SCTR ETF
The Pacer Benchmark Industrial Real Estate SCTRSM ETF (the “Fund”) is an exchange traded fund that seeks to track the total return performance, before fees and expenses, of the Benchmark Industrial Real Estate SCTRSM Index (the “Index”).
The Index is generally composed of the U.S.-listed equity securities of companies that derive at least 85% of their earnings or revenues from real estate operations in the industrial real estate sector (“Industrial Companies”), including companies that derivate at least 85% of their earnings or revenues from self-storage real estate operations (“Self-Storage Companies”). At the time of each reconstitution of the Index, Industrial Companies with a market capitalization of more than $200 million and average daily traded volume of at least 10,000 shares are included in the Index (the “Index Constituents”). A significant portion of the Index is expected to be composed of real estate investment trusts (“REITs”). The real estate companies included in the Index may utilize leverage, and some may be highly leveraged. Additionally, such companies may include significant business operations outside of the United States.
The Index is reconstituted and rebalanced quarterly as of the close of business on the third Friday of each March, June, September, and December based on data as of the end of the previous month (each, a “Reference Date”). Index Constituents are weighted based on their free-float market capitalization (i.e., market capitalization based on the number of shares available to the public), subject to the following constraints as of the time of each reconstitution of the Index. The sum of all Industrial Companies that are not Self-Storage Companies cannot exceed 80% of the total Index weight, and the remaining weight will be composed of Self-Storage Companies. Additionally, each Index Constituent’s weight is capped at 15% and the sum of Index Constituents with weights greater than 4.5% cannot exceed 45% of the total Index weight. If the foregoing limits would be exceeded at the time of a reconstitution of the Index, the excess weight is proportionally redistributed to all Index Constituents with weights below such limits.
The Fund
Fund had a total return of 4.38%. The Index had a total return of 5.55%. The FTSE NAREIT All Equity REITS Index had a total return of -8.30%.
The Fund’s top three contributors to its return were Prologis, Inc., Liberty Property Trust, and Duke Realty Corporation. These stocks realized total returns of 19.49%, 27.69%, and 14.50%, respectively.
The Fund’s bottom three contributors to its return were One Liberty Properties, Inc., Life Storage, Inc., and PS Business Parks, Inc. These stocks realized total returns of -39.51%, -4.33%, and -13.76%, respectively.
Pacer Benchmark Retail Real Estate SCTR ETF
The Pacer Benchmark Retail Real Estate SCTRSM ETF (the “Fund”) is an exchange traded fund that seeks to track the total return performance, before fees and expenses, of the Benchmark Retail Real Estate SCTRSM Index (the “Index”).
The Index is generally composed of the U.S.-listed equity securities of companies that derive at least 85% of their earnings or revenues from real estate operations in the retail real estate sector (“Eligible Companies”). At the time of each reconstitution of the Index, Eligible Companies with a market capitalization of more than $200 million and average daily traded volume of at least 10,000 shares are included in the Index (the “Index Constituents”). A significant portion of the Index is expected to be composed of real estate investment trusts (“REITs”). The real estate companies included in the Index may utilize leverage, and some may be highly leveraged. Additionally, such companies may include significant business operations outside of the United States.
The Index is reconstituted and rebalanced quarterly as of the close of business on the third Friday of each March, June, September, and December based on data as of the end of the previous month (each, a “Reference Date”). Index Constituents are weighted based on their free-float market capitalization (i.e., market capitalization based on the number of shares available to the public), subject to the following constraints as of the time of each reconstitution of the Index. Each Index Constituent’s weight is capped at 15% and the sum of Index Constituents with weights greater than 4.5% cannot exceed 19 45% of the total Index weight. If the foregoing limits would be exceeded at the time of a reconstitution of the Index, the excess weight is proportionally redistributed to all Index Constituents with weights below such limits.
11
Pacer Funds
The Fund
The Fund had a total return of -37.49%. The Index had a total return of -38.66%. The FTSE NAREIT All Equity REITS Index had a total return of -8.30%.
The Fund’s top three contributors to its return were Agree Realty Corporation, Alexander’s, Inc., and Getty Realty Corp. These stocks realized total returns of 2.93%, -12.69%, and -11.95%, respectively.
The Fund’s bottom three contributors to its return were Simon Property Group, Inc., Realty Income Corporation, and National Retail Properties, Inc. These stocks realized total returns of -59.41%, -18.38%, and -35.22%, respectively.
Pacer CFRA-Stovall Equal Weight Seasonal Rotation ETF
The Pacer CFRA-Stovall Equal Weight Seasonal Rotation ETF (the “Fund”) is an exchange traded fund (“ETF”) that seeks to track the total return performance, before fees and expenses, of the Pacer CFRA-Stovall Equal Weight Seasonal Rotation Index (the “Index”).
The Index uses an objective, rules-based methodology to track the performance of a semi-annual rotation of certain sectors within the S&P 500 Equal Weight Index (“EWI”). The S&P 500 EWI is an equal-weighted version of the S&P 500®, which measures the performance of the large-cap segment of the U.S. equity market. The S&P 500 EWI includes stocks covering all 11 Global Industry Classification Standard (“GICS®”) sectors, six of which are eligible for inclusion in the Index.
On the last business day of each April, the Index is equally weighted in the S&P 500 EWI Consumer Staples and Healthcare sectors. The Index holdings then float until the last business day of the following October, when the Index is reconstituted and rebalanced to an equal weighting in the S&P 500 EWI Consumer Discretionary, Industrials, Information Technology, and Materials sectors. The Index holdings then float until the last business day of the following April (the next calendar year), when the Index is reconstituted and rebalanced back to an equal weighting in the S&P 500 EWI Consumer Staples and Healthcare sectors.
The Fund
The Fund had a total return of -8.80%. The Index had a total return of -7.16%. The S&P 500 Index had a total return of 0.86%.
During the fiscal year, the top three sectors for contribution to performance were Healthcare at 7.87%, Consumer Staples at 5.72%, and Information Technology at -1.72%. The three sectors with the lowest contribution to performance were Materials at -16.11%, Industrials at -17.59% and Consumer Discretionary at -24.95%. Sector performance numbers reflect their total return during the period.
The Pacer Leaders ETF Series
The Pacer Leaders ETFs are strategy-driven, rules-based and are each designed to offer exposure to leaders in specific themes. The period referenced in this section for all custom funds is for the fiscal year end of April 30, 2020.
Pacer US Export Leaders ETF
The Pacer US Export Leaders ETF (the “Fund”) is an exchange traded fund that seeks to track the total return performance, before fees and expenses, of the Pacer US Export Leaders Index (the “Index”).
The Index uses an objective, rules-based methodology to measure the performance of an equal weight portfolio of approximately 100 large- and mid-capitalization U.S. companies with a high percentage of foreign sales and high free cash flow growth. Free cash flow is a company’s cash flow from operations minus its capital expenditures. Construction of the Index begins with an initial universe of the 200 companies across the S&P 900® Index (which is comprised of the S&P 500® Index (“S&P 500”) and S&P MidCap 400® Index (“S&P MidCap 400”)) that have the highest annual foreign sales as a percentage of total sales. The 200 companies are then narrowed to the 100 companies with the highest change in free cash flow growth over the past five years, and those 100 companies are equally weighted to create the Index. The Index is reconstituted and rebalanced to equal-weight quarterly. From time to time, the Index may include more or less than 100 companies as a result of events such as acquisitions, spin-offs and other corporate actions. The S&P 500 consists of approximately 500 leading U.S.-listed companies representing approximately 80% of the U.S. equity market capitalization. The S&P MidCap 400 measures the performance of mid-capitalization stocks in the United States.
The Fund
The Fund had a total return of -2.53%. The Index had a total return of -1.96%. The S&P 900 Index had a total return of -0.19%.
12
Pacer Funds
During the fiscal year, the top three sectors for contribution to performance were Healthcare at 22.77%, Information Technology at 5.54%, and Materials at -1.13%. The three sectors with the lowest contribution to performance were Energy at -53.58%, Industrials at -14.52%, and Consumer Discretionary at -26.75%. Sector performance numbers reflect their total return during the period.
The performance data quoted is historical. Past performance is no guarantee of future results. You cannot invest directly in an index.
Before investing you should carefully consider the Fund’s investment objectives, risks, charges and expenses. This and other information is in the prospectus. A copy may be obtained by visiting www.paceretfs.com or calling 1-877-337-0500. Please read the prospectus carefully before investing.
An investment in the Funds is subject to investment risk, including the possible loss of principal. Pacer ETF shares may be bought and sold on an exchange through a brokerage account. Brokerage commissions and ETF expenses will reduce investment returns. There can be no assurance that an active trading market for ETF shares will be developed or maintained. The risks associated with these funds are detailed in the prospectus and could include factors such as concentration risk, currency exchange rate risk, equity market risk, European investments risk, fixed income risk, foreign securities risk, geographic concentration risk, government obligations risk, high portfolio turnover risk, index criteria risk, large and mid-capitalization investing risk, monthly exposure risk, new fund risk, non-diversification risk, other investment companies risk, passive investment risk, sector risk, smaller-capitalization companies risk, style risk, tracking risk, trend lag risk and/or special risks of exchange traded funds.
The Pacer Trendpilot® US Large Cap Index, Pacer Trendpilot® US Mid Cap Index, Pacer US Small Cap Cash Cows Index and Pacer WealthShield Index (the “Indices”) are the property of Index Design Group, LLC which has contracted with S&P Opco, LLC (a subsidiary of S&P Dow Jones Indices LLC) to calculate and maintain the Indices. The Indices are not sponsored by S&P Dow Jones Indices or its affiliates or its third party licensors (collectively, “S&P Dow Jones Indices”). S&P Dow Jones Indices will not be liable for any errors or omissions in calculating the Indices. “Calculated by S&P Dow Jones Indices” and the related stylized mark(s) are service marks of S&P Dow Jones Indices and have been licensed for use by Index Design Group, LLC. S&P® is a registered trademark of Standard & Poor’s Financial Services LLC (“SPFS”) and Dow Jones® is a registered trademark of Dow Jones Trademark Holdings LLC (“Dow Jones”).
The Pacer NASDAQ-100 Trendpilot® Index is co-owned by Index Design Group, LLC. and Nasdaq, Inc. (which with its affiliates is referred to as the “Corporations”). The NASDAQ-100 is a registered trademark of the Corporations and is licensed for use by Index Design Group, LLC. The Product(s) are not issued, endorsed, sold, or promoted by the Corporations. The Corporations make no warranties and bear no liability with respect to the product(s).
Source: FTSE International Limited (“FTSE”) © FTSE 2017. “FTSE®” is a trade mark of the London Stock Exchange Group companies and is used by FTSE International Limited under license. All rights in the FTSE indices and / or FTSE ratings vest in FTSE and/or its licensors. Neither FTSE nor its licensors accept any liability for any errors or omissions in the FTSE indices and / or FTSE ratings or underlying data and no party may rely on any FTSE indices, ratings and / or data underlying data contained in this communication. No further distribution of FTSE Data is permitted without FTSE’s express written consent. FTSE does not promote, sponsor or endorse the content of this communication.
The Russell 1000 Index (the “Index”) is a trademark of Frank Russell Company (“Russell”) and has been licensed for use by Index Design Group, LLC (“IDG”). The Pacer US Cash Cows 100 Index is not in any way sponsored, endorsed, sold or promoted by Russell or the London Stock Exchange Group companies (“LSEG”) (together the “Licensor Parties”) and none of the Licensor Parties make any claim, prediction, warranty or representation whatsoever, expressly or impliedly, either as to (i) the results to be obtained from the use of the Index (upon which the Pacer US Cash Cows 100 Index is based), (ii) the figure at which the Index is said to stand at any particular time on any particular day or otherwise, or (iii) the suitability of the Index for the purpose to which it is being put in connection with the Pacer US Cash Cows 100 Index. None of the Licensor Parties have provided or will provide any financial or investment advice or recommendation in relation to the Index to IDG or to its clients. The Index is calculated by Russell or its agent. None of the Licensor Parties shall be (a) liable (whether in negligence or otherwise) to any person for any error in the Index or (b) under any obligation to advise any person of any error therein.
“VETS INDEXES(SM)” and “MILITARY TIMES BEST FOR VETS INDEX(SM)” are service marks of VETS Indexes LLC and have been licensed for use by Pacer Advisors, LLC. The Product is not sponsored, endorsed, sold or promoted by VETS Indexes LLC and VETS Indexes LLC makes no representation regarding the advisability of investing in the Product or such similar language as may be approved in advance by VETS.
Investment products offered are: Not FDIC Insured ● No Bank Guarantee ● May Lose Value
Trendpilot®, Cash Cows Index® and Strategy Driven ETFs™ are trademarks of Index Design Group, LLC.
Distributor: Pacer Financial, Inc, member FINRA, SIPC, an affiliate of Pacer Advisors, Inc.
13
Pacer Funds
PORTFOLIO ALLOCATION (Unaudited)
As of April 30, 2020
Pacer Trendpilot ® US Large Cap ETF
Sector(a) | Percentage of
Net Assets |
Short-Term Investments | 100.8% |
Investments Purchased with Proceeds from Securities Lending | 31.1% |
Liabilities in excess of other assets | -31.9% |
Total | 100.0% |
(a) | The Fund may classify a company in a different category than the The Pacer Trendpilot ® US Large Cap Index. |
Pacer Trendpilot ® US Mid Cap ETF
Sector(a) | Percentage of
Net Assets |
Consumer, Non-Cyclical | 0.0%(b) |
Short-Term Investments | 100.1% |
Investments Purchased with Proceeds from Securities Lending | 30.1% |
Liabilities in excess of other assets | -30.2% |
Total | 100.0% |
(a) | The Fund may classify a company in a different category than the The Pacer Trendpilot ® US Mid Cap Index. |
Pacer Trendpilot ® 100 ETF
Sector(a) | Percentage of
Net Assets |
Technology | 43.5% |
Communications | 33.9% |
Consumer, Non-Cyclical | 13.9% |
Consumer, Cyclical | 7.1% |
Utilities | 0.8% |
Industrial | 0.6% |
Financial | 0.3% |
Short-Term Investments | 0.0%(b) |
Investments Purchased with Proceeds from Securities Lending | 13.4% |
Liabilities in Excess of Other Assets | -13.5% |
Total | 100.0% |
(a) | The Fund may classify a company in a different category than the Pacer Nasdaq-100 Trendpilot ® Index. |
Pacer Trendpilot ® European Index ETF
Country(a) | Percentage of
Net Assets |
Spain | 0.0%(b) |
Greece | 0.0%(b) |
Short-Term Investments | 99.5% |
Investments Purchased with Proceeds from Securities Lending | 29.4% |
Liabilities in excess of other assets | -28.9% |
Total | 100.0% |
(a) | The Fund generally classifies a company based on its country of incorporation, but may designate a different country in certain circumstances. |
14
Pacer Funds
PORTFOLIO ALLOCATION (Unaudited) (Continued)
As of April 30, 2020
Pacer Global Cash Cows Dividend ETF
Sector(a) | Percentage of
Net Assets |
Consumer, Non-Cyclical | 25.8% |
Communications | 22.3% |
Energy | 15.0% |
Basic Materials | 12.7% |
Consumer, Cyclical | 8.9% |
Industrial | 4.1% |
Technology | 3.6% |
Financial | 3.5% |
Utilities | 2.5% |
Diversified | 0.4% |
Short-Term Investments | 0.1% |
Investments Purchased with Proceeds from Securities Lending | 26.4% |
Liabilities in excess of other assets | -25.3% |
Total | 100.0% |
(a) | The Fund may classify a company in a different category than the Pacer Global Cash Cows Dividend 100 Index. |
Pacer US Cash Cows 100 ETF
Sector(a) | Percentage of
Net Assets |
Consumer, Non-Cyclical | 23.8% |
Technology | 16.8% |
Communications | 14.3% |
Consumer, Cyclical | 13.2% |
Basic Materials | 10.1% |
Industrial | 9.9% |
Energy | 8.5% |
Utilities | 2.7% |
Financial | 0.6% |
Short-Term Investments | 0.1% |
Investments Purchased with Proceeds from Securities Lending | 29.3% |
Liabilities in excess of other assets | -29.3% |
Total | 100.0% |
(a) | The Fund may classify a company in a different category than the Pacer US Cash Cows 100 Index. |
Pacer US Small Cap Cash Cows 100 ETF
Sector(a) | Percentage of
Net Assets |
Industrial | 33.2% |
Consumer, Cyclical | 29.4% |
Consumer, Non-Cyclical | 19.6% |
Technology | 8.0% |
Basic Materials | 5.7% |
Energy | 2.3% |
Financial | 1.5% |
Short-Term Investments | 0.2% |
Investments Purchased with Proceeds from Securities Lending | 25.4% |
Liabilities in excess of other assets | -25.3% |
Total | 100.0% |
(a) | The Fund may classify a company in a different category than the Pacer US Small Cap Cash Cows 100 Index. |
15
Pacer Funds
PORTFOLIO ALLOCATION (Unaudited) (Continued)
As of April 30, 2020
Pacer Developed Markets International Cash Cows 100 ETF
Sector(a) | Percentage of
Net Assets |
Consumer, Non-Cyclical | 21.7% |
Consumer, Cyclical | 19.4% |
Basic Materials | 19.2% |
Energy | 13.2% |
Communications | 11.8% |
Technology | 7.0% |
Industrial | 4.5% |
Utilities | 1.9% |
Financial | 0.4% |
Investments Purchased with Proceeds from Securities Lending | 20.3% |
Liabilities in excess of other assets | -19.4% |
Total | 100.0% |
(a) | The Fund may classify a company in a different category than the Pacer Developed Markets International Cash Cows 100 Index. |
Pacer WealthShield ETF
Sector(a) | Percentage of
Net Assets |
U.S. Treasury Notes/Bonds | 94.6% |
Exchange Traded Funds | 4.7% |
Short-Term Investments | 0.0%(b) |
Investments Purchased with Proceeds from Securities Lending | 28.9% |
Liabilities in excess of other assets | -28.2% |
Total | 100.0% |
(a) | The Fund may classify a company in a different category than the Pacer WealthShield Index. |
Pacer Military Times Best Employers ETF
Sector(a) | Percentage of
Net Assets |
Consumer, Non-Cyclical | 23.4% |
Financial | 19.4% |
Industrial | 15.6% |
Technology | 11.7% |
Communications | 11.5% |
Consumer, Cyclical | 9.3% |
Utilities | 8.8% |
Exchange Traded Funds | 0.0%(b) |
Short-Term Investments | 0.2% |
Other assets in excess of liabilities | 0.1% |
Total | 100.0% |
(a) | The Fund may classify a company in a different category than the Military Times Best for VETS Total Return Index. |
16
Pacer Funds
PORTFOLIO ALLOCATION (Unaudited) (Continued)
As of April 30, 2020
Pacer Benchmark Retail Real Estate SCTRSM ETF
Sector(a) | Percentage of
Net Assets |
Financial | 99.5% |
Short-Term Investments | 0.1% |
Investments Purchased with Proceeds from Securities Lending | 20.7% |
Liabilities in excess of other assets | -20.3% |
Total | 100.0% |
(a) | The Fund may classify a company in a different category than the Benchmark Retail Real Estate SCTRSM Index. |
Pacer Benchmark Industrial Real Estate SCTRSM ETF
Sector(a) | Percentage of
Net Assets |
Financial | 99.2% |
Short-Term Investments | 0.7% |
Investments Purchased with Proceeds from Securities Lending | 4.7% |
Liabilities in excess of other assets | -4.6% |
Total | 100.0% |
(a) | The Fund may classify a company in a different category than the Benchmark Industrial Real Estate SCTRSM Index. |
Pacer Benchmark Data & Infrastructure Real Estate SCTRSM ETF
Sector(a) | Percentage of
Net Assets |
Financial | 84.2% |
Communications | 14.1% |
Short-Term Investments | 1.7% |
Exchange Traded Funds | 1.6% |
Investments Purchased with Proceeds from Securities Lending | 19.0% |
Liabilities in excess of other assets | -20.6% |
Total | 100.0% |
(a) | The Fund may classify a company in a different category than the Benchmark Data & Infrastructure Real Estate SCTRSM Index. |
Pacer US Export Leaders ETF
Sector(a) | Percentage of
Net Assets |
Technology | 27.7% |
Industrial | 27.0% |
Consumer, Non-Cyclical | 16.3% |
Consumer, Cyclical | 10.4% |
Basic Materials | 9.5% |
Communications | 4.1% |
Energy | 2.1% |
Exchange Traded Funds | 1.0% |
Financial | 0.9% |
Utilities | 0.9% |
Short-Term Investments | 0.1% |
Other assets in excess of liabilities | 0.0%(b) |
Total | 100.0% |
(a) | The Fund may classify a company in a different category than the Pacer US Export Leaders Index. |
17
Pacer Funds
PORTFOLIO ALLOCATION (Unaudited) (Continued)
As of April 30, 2020
Pacer CFRA-Stovall Equal Weight Seasonal Rotation ETF
Sector(a) | Percentage of
Net Assets |
Consumer, Non-Cyclical | 91.4% |
Consumer, Cyclical | 4.4% |
Industrial | 3.4% |
Technology | 0.8% |
Short-Term Investments | 0.2% |
Liabilities in excess of other assets | -0.2% |
Total | 100.0% |
(a) | The Fund may classify a company in a different category than the Pacer CFRA-Stovall Equal Weight Seasonal Rotation Index. |
Pacer US Cash Cows Growth ETF
Sector(a) | Percentage of
Net Assets |
Technology | 42.7% |
Industrial | 16.3% |
Communications | 15.0% |
Consumer, Cyclical | 10.6% |
Basic Materials | 6.1% |
Energy | 6.1% |
Consumer, Non-Cyclical | 1.8% |
Utilities | 1.2% |
Short-Term Investments | 0.2% |
Liabilities in excess of other assets | 0.0%(b) |
Total | 100.0% |
(a) | The Fund may classify a company in a different category than the Pacer US Cash Cows Growth Index. |
Pacer Trendpilot ® International ETF
Sector(a) | Percentage of
Net Assets |
Consumer, Non-Cyclical | 0.0%(b) |
Financial | 0.0%(b) |
Consumer, Cyclical | 0.0%(b) |
Energy | 0.0%(b) |
Basic Materials | 0.0%(b) |
Communications | 0.0%(b) |
Utilities | 0.0%(b) |
Short-Term Investments | 100.0% |
Liabilities in excess of other assets | 0.0%(b) |
Total | 100.0% |
(a) | The Fund may classify a company in a different category than the Pacer Trendpilot ® International Index. |
18
Pacer Funds
PORTFOLIO ALLOCATION (Unaudited) (Continued)
As of April 30, 2020
Pacer Emerging Markets Cash Cows 100 ETF
Sector(a) | Percentage of
Net Assets |
Basic Materials | 19.6% |
Energy | 18.0% |
Industrial | 15.5% |
Communications | 12.6% |
Consumer, Non-Cyclical | 9.4% |
Technology | 9.1% |
Consumer, Cyclical | 7.0% |
Utilities | 4.6% |
Financial | 2.5% |
Diversified | 1.3% |
Short-Term Investments | 0.5% |
Liabilities in excess of other assets | -0.1% |
Total | 100.0% |
(a) | The Fund may classify a company in a different category than the Pacer Emerging Markets Cash Cows 100 Index. |
Pacer Cash Cows Fund of Funds ETF
Sector(a) | Percentage of
Net Assets |
Exchange Traded Funds | 100.0% |
Short-Term Investments | 0.0%(b) |
Liabilities in excess of other assets | 0.0%(b) |
Total | 100.0% |
(a) | The Fund may classify a company in a different category than the Pacer Cash Cows Fund of Funds Index. |
Pacer Trendpilot ® Fund of Funds ETF
Sector(a) | Percentage of
Net Assets |
Exchange Traded Funds | 100.0% |
Short-Term Investments | 0.0%(b) |
Liabilities in excess of other assets | 0.0%(b) |
Total | 100.0% |
(a) | The Fund may classify a company in a different category than the Pacer Trendpilot ® Fund of Funds Index. |
19
Pacer Funds
PORTFOLIO ALLOCATION (Unaudited) (Continued)
As of April 30, 2020
Pacer Trendpilot ® US Bond ETF
Sector(a) | Percentage of
Net Assets |
U.S. Treasury Notes/Bonds | 99.2% |
Short-Term Investments | 0.1% |
Other assets in excess of liabilities | 0.7% |
Total | 100.0% |
(a) | The Fund may classify a company in a different category than the Pacer Trendpilot ® US Bond Index. |
Pacer CSOP FTSE China A50 ETF
Sector(a) | Percentage of
Net Assets |
Financial | 51.0% |
Consumer, Non-Cyclical | 24.5% |
Industrial | 8.5% |
Consumer, Cyclical | 8.2% |
Communications | 2.7% |
Technology | 1.9% |
Energy | 1.6% |
Utilities | 1.2% |
Short-Term Investments | 0.4% |
Other assets in excess of liabilities | 0.0%(b) |
Total | 100.0% |
(a) | The Fund may classify a company in a different category than the FTSE China A50 Net Total Return Index. |
20
Pacer Trendpilot ® US Large Cap ETF
PERFORMANCE SUMMARY
(Unaudited)
Growth of $10,000
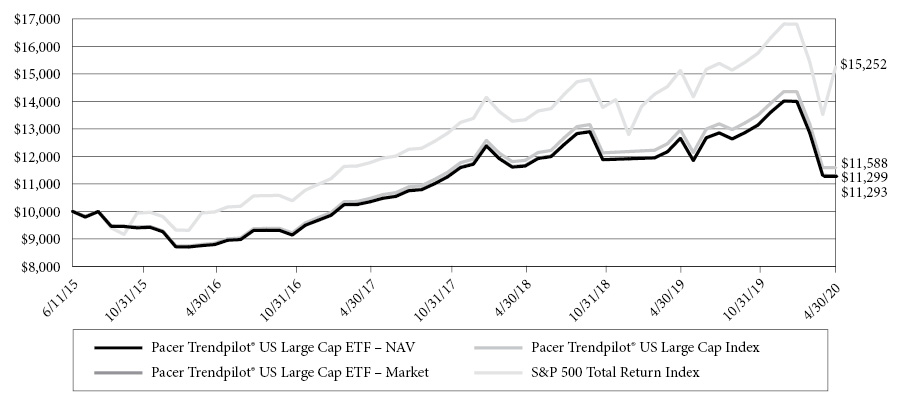
This chart illustrates the performance of a hypothetical $10,000 investment made on June 11, 2015, and is not intended to imply any future performance. The returns shown do not reflect the deduction of taxes that a shareholder would pay on fund distributions or the redemption of fund shares. The chart assumes reinvestment of capital gains and dividends.
The Pacer Trendpilot ® US Large Cap Index uses an objective, rules-based methodology to implement a systematic trend-following strategy that directs exposure (i) 100% to the S&P 500 Index, (ii) 50% to the S&P 500 Total Return Index and 50% to 3-Month US Treasury bills, or (iii) 100% to 3-Month US Treasury bills, depending on the relative performance of the S&P 500 Total Return Index and its 200-business day historical simple moving average.
The S&P 500 Total Return Index consists of approximately 500 leading U.S.-listed companies representing approximately 8% of the U.S. equity market capitalization.
Annualized Returns(1)
(For the year ended April 30, 2020)
| | One Year | Three Year | Since Inception(2) |
Pacer Trendpilot ® US Large Cap ETF - NAV | -10.71% | 2.98% | 2.53% |
Pacer Trendpilot ® US Large Cap ETF - Market | -10.78% | 2.95% | 2.52% |
Pacer Trendpilot ® US Large Cap Index(3) | -10.25% | 3.58% | 3.14% |
S&P 500 ® Total Return Index(3) | 0.86% | 9.04% | 9.02% |
(1) | The performance data quoted is historical. Past performance is no guarantee of future results. Current performance may be higher or lower than the performance data quoted. The principal value and investment return of an investment will fluctuate so that investor’s shares, when redeemed, may be worth more or less than the original cost. The returns shown do not reflect the deduction of taxes that a shareholder would pay on Fund distributions or on redemptions of Fund shares. The total annual operating expenses as stated in the fee table to the Fund’s prospectus dated August 31, 2019, is 0.60%. For performance information current to the most recent month-end, please call 1-877-337-0500. |
(2) | Inception date is June 11, 2015. |
(3) | Indexes are unmanaged statistical composites and their returns do not include fees an investor would pay to purchase the securities they represent. Such costs would lower performance. It is not possible to invest directly in an index. |
21
Pacer Trendpilot ® US Mid Cap ETF
PERFORMANCE SUMMARY
(Unaudited)
Growth of $10,000

This chart illustrates the performance of a hypothetical $10,000 investment made on June 11, 2015, and is not intended to imply any future performance. The returns shown do not reflect the deduction of taxes that a shareholder would pay on fund distributions or the redemption of fund shares. The chart assumes reinvestment of capital gains and dividends.
The Pacer Trendpilot ® US Mid Cap Index uses an objective, rules-based methodology to implement a systematic trend-following strategy that directs exposure (i) 100% to the S&P MidCap 400 Index, (ii) 50% to the S&P MidCap 400 Index and 50% to 3-Month US Treasury bills, or (iii) 100% to 3-Month US Treasury bills, depending on the relative performance of the S&P MidCap 400 Total Return Index and its 200-business day historical simple moving average.
The S&P MidCap 400 Index is a total return version of the S&P MidCap 400 Index and reflects the reinvestment of dividends paid by the securities in the S&P MidCap 400 Index. The S&P Midcap 400 measures the performance of mid-capitalization stocks in the United States.
Annualized Returns(1)
(For the year ended April 30, 2020)
| | One Year | Three Year | Since Inception(2) |
Pacer Trendpilot ® US Mid Cap ETF - NAV | -7.11% | 1.40% | 3.38% |
Pacer Trendpilot ® US Mid Cap ETF - Market | -7.18% | 1.33% | 3.37% |
Pacer Trendpilot ® US Mid Cap Index(3) | -6.72% | 1.90% | 3.97% |
S&P MidCap 400 Index(3) | -14.94% | -0.03% | 3.09% |
(1) | The performance data quoted is historical. Past performance is no guarantee of future results. Current performance may be higher or lower than the performance data quoted. The principal value and investment return of an investment will fluctuate so that investor’s shares, when redeemed, may be worth more or less than the original cost. The returns shown do not reflect the deduction of taxes that a shareholder would pay on Fund distributions or on redemptions of Fund shares. The total annual operating expenses as stated in the fee table to the Fund’s prospectus dated August 31, 2019, is 0.60%. For performance information current to the most recent month-end, please call 1-877-337-0500. |
(2) | Inception date is June 11, 2015. |
(3) | Indexes are unmanaged statistical composites and their returns do not include fees an investor would pay to purchase the securities they represent. Such costs would lower performance. It is not possible to invest directly in an index. |
22
Pacer Trendpilot ® 100 ETF
PERFORMANCE SUMMARY
(Unaudited)
Growth of $10,000

This chart illustrates the performance of a hypothetical $10,000 investment made on June 11, 2015, and is not intended to imply any future performance. The returns shown do not reflect the deduction of taxes that a shareholder would pay on fund distributions or the redemption of fund shares. The chart assumes reinvestment of capital gains and dividends.
Pacer NASDAQ-100 Trendpilot ® Index uses an objective, rules-based methodology to implement a systematic trend-following strategy that directs exposure (i) 100% to the NASDAQ-100 Index, (ii) 50% to the NASDAQ-100 Index and 50% to 3-Month US Treasury bills, or (iii) 100% to 3-Month US Treasury bills, depending on the relative performance of the NASDAQ-100 Index and its 200-business day historical simple moving average.
The NASDAQ-100 Index includes approximately 100 of the largest non-financial securities listed on The NASDAQ Stock Market based on market capitalization. The NASDAQ-100 Index comprises securities of companies across major industry groups, including computer, biotechnology, healthcare, telecommunications and transportation. However, it does not contain securities of financial companies, including investment companies. The NASDAQ-100 Index was developed by NASDAQ OMX. There is no minimum market capitalization requirement for inclusion in the NASDAQ-100 Index. Inclusion is determined based on the top 100 largest issuers based on market capitalization meeting all other eligibility requirements.
Annualized Returns(1)
(For the year ended April 30, 2020)
| | One Year | Three Year | Since Inception(2) |
Pacer Trendpilot ® 100 ETF - NAV | 5.78% | 13.39% | 9.28% |
Pacer Trendpilot ® 100 ETF - Market | 5.82% | 13.46% | 9.30% |
Pacer NASDAQ-100 Trendpilot ® Index(3) | 6.09% | 13.93% | 9.89% |
NASDAQ-100 Index(3) | 16.90% | 18.52% | 16.61% |
(1) | The performance data quoted is historical. Past performance is no guarantee of future results. Current performance may be higher or lower than the performance data quoted. The principal value and investment return of an investment will fluctuate so that investor’s shares, when redeemed, may be worth more or less than the original cost. The returns shown do not reflect the deduction of taxes that a shareholder would pay on Fund distributions or on redemptions of Fund shares. The total annual operating expenses as stated in the fee table to the Fund’s prospectus dated August 31, 2019, is 0.65%. For performance information current to the most recent month-end, please call 1-877-337-0500. |
(2) | Inception date is June 11, 2015. |
(3) | Indexes are unmanaged statistical composites and their returns do not include fees an investor would pay to purchase the securities they represent. Such costs would lower performance. It is not possible to invest directly in an index. |
23
Pacer Trendpilot ® European Index ETF
PERFORMANCE SUMMARY
(Unaudited)
Growth of $10,000
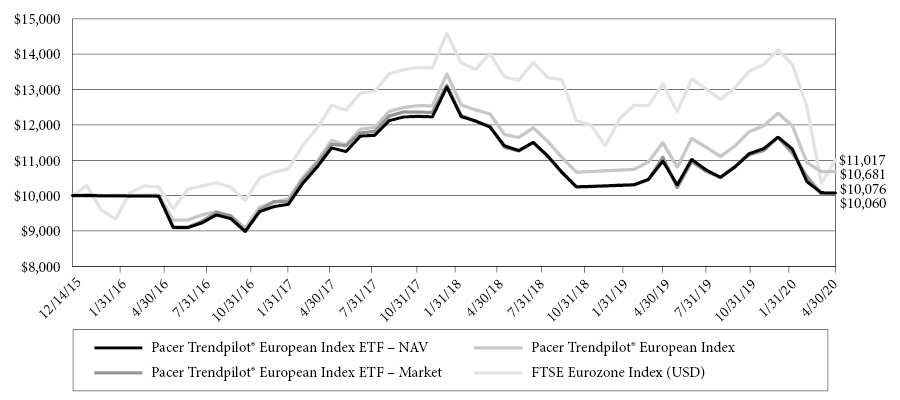
This chart illustrates the performance of a hypothetical $10,000 investment made on December 14, 2015, and is not intended to imply any future performance. The returns shown do not reflect the deduction of taxes that a shareholder would pay on fund distributions or the redemption of fund shares. The chart assumes reinvestment of capital gains and dividends.
The Pacer Trendpilot ® European Index uses an objective, rules-based methodology to implement a systematic trend-following strategy that directs exposure (i) 100% to the FTSE Eurozone Index, (ii) 50% to the FTSE Eurozone Index and 50% to 3-Month US Treasury bills, or (iii) 100% to 3-Month US Treasury bills, depending on the relative performance of the FTSE Eurozone Total Return Index and its 200-business day historical simple moving average.
The FTSE Eurozone Index is a rules-based, float-adjusted, market capitalization-weighted index comprised of large- and mid-capitalization stocks providing coverage of the developed markets in the euro zone, including primarily France, Germany, Spain, the Netherlands, and Italy. The FTSE Eurozone Index is a subset of the FTSE Global Equity Index Series, which covers 98% of the world’s investable market capitalization.
Annualized Returns(1)
(For the year ended April 30, 2020)
| | One Year | Three Year | Since Inception(2) |
Pacer Trendpilot ® European Index ETF - NAV | -8.18% | -2.32% | 0.17% |
Pacer Trendpilot ® European Index ETF - Market | -9.24% | -2.66% | 0.14% |
Pacer Trendpilot ® European Index(3) | -7.11% | -0.89% | 1.52% |
FTSE Eurozone Index (USD)(3) | -16.31% | -2.57% | 2.23% |
(1) | The performance data quoted is historical. Past performance is no guarantee of future results. Current performance may be higher or lower than the performance data quoted. The principal value and investment return of an investment will fluctuate so that investor’s shares, when redeemed, may be worth more or less than the original cost. The returns shown do not reflect the deduction of taxes that a shareholder would pay on Fund distributions or on redemptions of Fund shares. The total annual operating expenses as stated in the fee table to the Fund’s prospectus dated August 31, 2019, is 0.65%. For performance information current to the most recent month-end, please call 1-877-337-0500. |
(2) | Inception date is December 14, 2015. |
(3) | Indexes are unmanaged statistical composites and their returns do not include fees an investor would pay to purchase the securities they represent. Such costs would lower performance. It is not possible to invest directly in an index. |
24
Pacer Global Cash Cows Dividend ETF
PERFORMANCE SUMMARY
(Unaudited)
Growth of $10,000

This chart illustrates the performance of a hypothetical $10,000 investment made on February 22, 2016, and is not intended to imply any future performance. The returns shown do not reflect the deduction of taxes that a shareholder would pay on fund distributions or the redemption of fund shares. The chart assumes reinvestment of capital gains and dividends.
The Pacer Global Cash Cows Dividend Index uses an objective, rules-based methodology to provide exposure to global companies with high dividend yield backed by a high free cash flow yield. The initial index universe is derived from the component companies of the FTSE All-World Developed Large Cap Index. The initial universe of companies is screened based on their average projected free cash flows and earnings over each of the next two fiscal years. Companies with negative average projected free cash flows or earnings are removed from the Index universe. Additionally, financial companies, other than real estate investment trusts, are excluded from the Index universe. The remaining companies are ranked by their free cash flow yield for the trailing twelve month period. The 300 companies with the highest free cash flow yield are then ranked by their dividend yield. The equity securities of the 100 companies with the highest dividend yield are included in the Index.
The FTSE All-World Developed Large-Cap Index is a market-capitalization weighted index representing the performance of large-cap stocks in developed markets.
Annualized Returns(1)
(For the year ended April 30, 2020)
| | One Year | Three Year | Since Inception(2) |
Pacer Global Cash Cows Dividend ETF - NAV | -17.32% | -1.09% | 3.08% |
Pacer Global Cash Cows Dividend ETF - Market | -17.89% | -1.38% | 2.95% |
Pacer Global Cash Cows Dividend Index(3) | -16.46% | -0.15% | 4.02% |
FTSE All-World Developed Large-Cap Index(3) | -1.78% | 6.29% | 10.11% |
(1) | The performance data quoted is historical. Past performance is no guarantee of future results. Current performance may be higher or lower than the performance data quoted. The principal value and investment return of an investment will fluctuate so that investor’s shares, when redeemed, may be worth more or less than the original cost. The returns shown do not reflect the deduction of taxes that a shareholder would pay on Fund distributions or on redemptions of Fund shares. The total annual operating expenses as stated in the fee table to the Fund’s prospectus dated August 31, 2019, is 0.60%. For performance information current to the most recent month-end, please call 1-877-337-0500. |
(2) | Inception date is February 22, 2016. |
(3) | Indexes are unmanaged statistical composites and their returns do not include fees an investor would pay to purchase the securities they represent. Such costs would lower performance. It is not possible to invest directly in an index. |
25
Pacer US Cash Cows 100 ETF
PERFORMANCE SUMMARY
(Unaudited)
Growth of $10,000
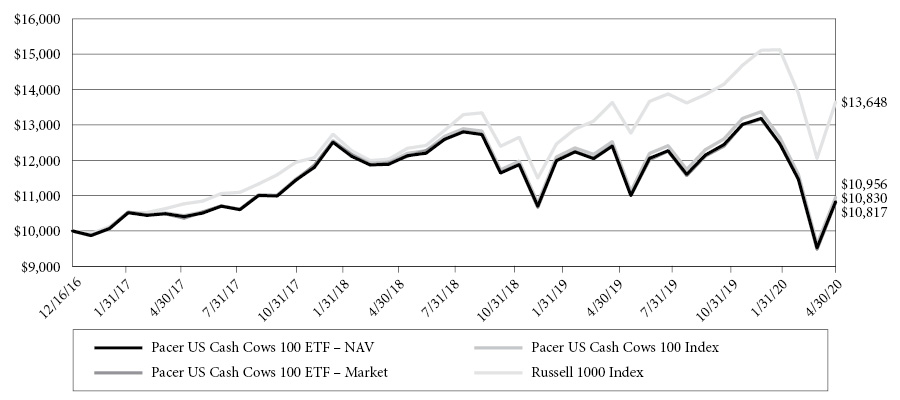
This chart illustrates the performance of a hypothetical $10,000 investment made on December 16, 2016, and is not intended to imply any future performance. The returns shown do not reflect the deduction of taxes that a shareholder would pay on fund distributions or the redemption of fund shares. The chart assumes reinvestment of capital gains and dividends.
The Pacer US Cash Cows 100 Index uses an objective, rules-based methodology to provide exposure to large and mid-capitalization U.S. companies with high free cash flow yields. Companies with high free cash flow yields are commontly referred to as “cash cows.” The initial index universe is derived from the component companies of the Russell 1000 ® Index. The initial universe of companies is screened based on their average projected free cash flows and earnings over each of the next two fiscal years. Companies with no forward year estimates available for free cash flows or earnings will remain in the Index universe. Companies with negative average projected free cash flows or earnings are removed from the Index universe. Additionally, financial companies, other than real estate investment trusts, are excluded from the Index universe. The remaining companies are ranked by their free cash flow yield for the trailing twelve month period. The equity securities of the 100 companies with the highest free cash flow yield are included in the Index.
The Russell 1000 Index is a market-capitalization weighted index representing the top 1,000 large-cap stocks in the Russell 3000 Index.
Annualized Returns(1)
(For the year ended April 30, 2020)
| | One Year | Three Year | Since Inception(2) |
Pacer US Cash Cows 100 ETF - NAV | -12.63% | 1.08% | 2.40% |
Pacer US Cash Cows 100 ETF - Market | -12.90% | 1.05% | 2.36% |
Pacer US Cash Cows 100 Index(3) | -12.54% | 1.39% | 2.75% |
Russell 1000 ® Index(3) | 0.09% | 8.68% | 9.67% |
(1) | The performance data quoted is historical. Past performance is no guarantee of future results. Current performance may be higher or lower than the performance data quoted. The principal value and investment return of an investment will fluctuate so that investor’s shares, when redeemed, may be worth more or less than the original cost. The returns shown do not reflect the deduction of taxes that a shareholder would pay on Fund distributions or on redemptions of Fund shares. The total annual operating expenses as stated in the fee table to the Fund’s prospectus dated August 31, 2019, is 0.49%. For performance information current to the most recent month-end, please call 1-877-337-0500. |
(2) | Inception date is December 16, 2016. |
(3) | Indexes are unmanaged statistical composites and their returns do not include fees an investor would pay to purchase the securities they represent. Such costs would lower performance. It is not possible to invest directly in an index. |
26
Pacer US Small Cap Cash Cows 100 ETF
PERFORMANCE SUMMARY
(Unaudited)
Growth of $10,000
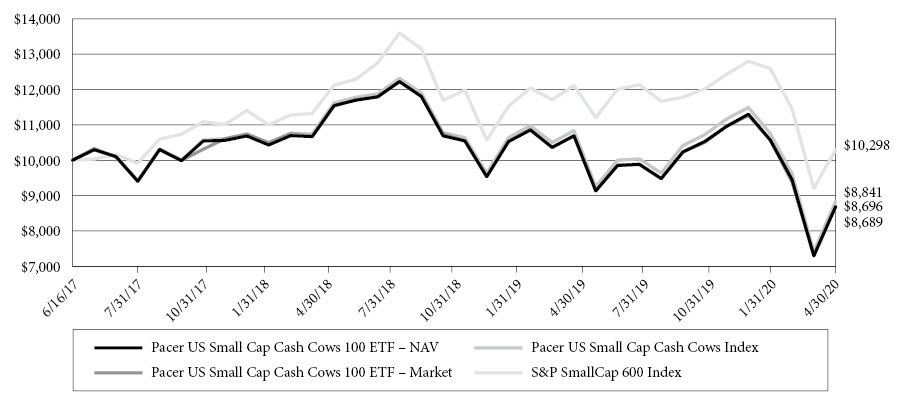
This chart illustrates the performance of a hypothetical $10,000 investment made on June 16, 2017, and is not intended to imply any future performance. The returns shown do not reflect the deduction of taxes that a shareholder would pay on fund distributions or the redemption of fund shares. The chart assumes reinvestment of capital gains and dividends.
The Pacer US Small Cap Cash Cows Index uses an objective, rules-based methodology to provide exposure to small-capitalization U.S. companies with high free cash flow yields. Companies with high free cash flow yields are commonly referred to as “cash cows.” The initial Index universe is derived from the component companies of the S&P Small Cap 600 ® Index. The initial universe of companies is screened based on their average projected free cash flows and earnings over each of the next two fiscal years. Companies with no forward year estimates available for free cash flows or earnings will remain in the Index universe. Companies with negative average projected free cash flows or earnings are removed from the Index universe. Additionally, financial companies, other than real estate investment trusts, are excluded from the Index universe. The remaining companies are ranked by their free cash flow yield for the trailing twelve month period. The equity securities of the 100 companies with the highest free cash flow yield are included in the Index.
The S&P SmallCap 600 ® Index measures the performance of 600 small sized companies in the US equity market, with market capitalization ranging from $450 million to $2.1 billion USD. The Index does not overlap holdings with the S&P 500 or S&P MidCap 400.
Annualized Returns(1)
(For the year ended April 30, 2020)
| | One Year | Since Inception(2) |
Pacer US Small Cap Cash Cows 100 ETF - NAV | -18.72% | -4.78% |
Pacer US Small Cap Cash Cows 100 ETF - Market | -18.68% | -4.75% |
Pacer US Small Cap Cash Cows Index(3) | -18.83% | -4.70% |
S&P SmallCap 600 ® Index(3) | -19.60% | -1.99% |
(1) | The performance data quoted is historical. Past performance is no guarantee of future results. Current performance may be higher or lower than the performance data quoted. The principal value and investment return of an investment will fluctuate so that investor’s shares, when redeemed, may be worth more or less than the original cost. The returns shown do not reflect the deduction of taxes that a shareholder would pay on Fund distributions or on redemptions of Fund shares. The total annual operating expenses as stated in the fee table to the Fund’s prospectus dated August 31, 2019, is 0.59%. For performance information current to the most recent month-end, please call 1-877-337-0500. |
(2) | Inception date is June 16, 2017. |
(3) | Indexes are unmanaged statistical composites and their returns do not include fees an investor would pay to purchase the securities they represent. Such costs would lower performance. It is not possible to invest directly in an index. |
27
Pacer Developed Markets International Cash Cows 100 ETF
PERFORMANCE SUMMARY
(Unaudited)
Growth of $10,000

This chart illustrates the performance of a hypothetical $10,000 investment made on June 16, 2017, and is not intended to imply any future performance. The returns shown do not reflect the deduction of taxes that a shareholder would pay on fund distributions or the redemption of fund shares. The chart assumes reinvestment of capital gains and dividends.
The Pacer Developed Markets International Cash Cows 100 Index uses an objective, rules-based methodology to provide exposure to large and mid-capitalization non-U.S. companies in developed markets with high free cash flow yields. The initial index universe is derived from the component companies of the FTSE Developed ex US Index. The initial universe of companies is screened based on their average projected free cash flows and earnings over each of the next two fiscal years. Companies with no forward year estimates available for free cash flows or earnings will remain in the Index universe. Companies with negative average projected free cash flows or earnings are removed from the Index universe. Additionally, financial companies, other than real estate investment trusts, and companies with a market capitalization of less than $3 billion are excluded from the Index universe. The remaining companies are ranked by their average daily trading value (“ADTV”) for the prior three months. The 500 companies with the highest ADTV are then ranked by their free cash flow yield for the trailing twelve month period. The equity securities of the 100 companies with the highest free cash flow yield are included in the Index.
The FTSE Developed ex-US Index is comprised of Large (85%) and Mid (15%) cap stocks providing coverage of Developed markets (24 countries) excluding the US. The index is derived from the FTSE Global Equity Index Series, which covers 98% of the world’s investable market capitalization.
Annualized Returns(1)
(For the year ended April 30, 2020)
| | One Year | Since Inception(2) |
Pacer Developed Markets International Cash Cows 100 ETF - NAV | -20.04% | -3.79% |
Pacer Developed Markets International Cash Cows 100 ETF - Market | -21.39% | -4.13% |
Pacer Developed Markets International Cash Cows 100 Index(3) | -18.97% | -2.86% |
FTSE Developed ex-US Index(3) | -11.18% | -1.87% |
(1) | The performance data quoted is historical. Past performance is no guarantee of future results. Current performance may be higher or lower than the performance data quoted. The principal value and investment return of an investment will fluctuate so that investor’s shares, when redeemed, may be worth more or less than the original cost. The returns shown do not reflect the deduction of taxes that a shareholder would pay on Fund distributions or on redemptions of Fund shares. The total annual operating expenses as stated in the fee table to the Fund’s prospectus dated August 31, 2019, is 0.65%. For performance information current to the most recent month-end, please call 1-877-337-0500. |
(2) | Inception date is June 16, 2017. |
(3) | Indexes are unmanaged statistical composites and their returns do not include fees an investor would pay to purchase the securities they represent. Such costs would lower performance. It is not possible to invest directly in an index. |
28
Pacer WealthShield ETF
PERFORMANCE SUMMARY
(Unaudited)
Growth of $10,000

This chart illustrates the performance of a hypothetical $10,000 investment made on December 11, 2017, and is not intended to imply any future performance. The returns shown do not reflect the deduction of taxes that a shareholder would pay on fund distributions or the redemption of fund shares. The chart assumes reinvestment of capital gains and dividends.
The Pacer WealthShield Index uses an objective, rules-based methodology to implement a trend-following strategy that directs some or all of the Index’s exposure to (i) U.S. equity securities or (ii) U.S. Treasury securities depending on the strength of the high-yield corporate (“junk”) bond market relative to U.S. Treasury bonds and the momentum of certain U.S. equity sectors or industries and of long-term U.S. Treasury bonds.
The S&P 500 Total Return Index consists of approximately 500 leading U.S.-listed companies representing approximately 8% of the U.S. equity market capitalization.
Annualized Returns(1)
(For the year ended April 30, 2020)
| | One Year | Since Inception(2) |
Pacer WealthShield ETF - NAV | -3.04% | -0.60% |
Pacer WealthShield ETF - Market | -3.51% | -0.79% |
Pacer WealthShield Index(3) | -3.59% | -0.28% |
S&P 500 ® Total Return Index(3) | 0.86% | 5.93% |
(1) | The performance data quoted is historical. Past performance is no guarantee of future results. Current performance may be higher or lower than the performance data quoted. The principal value and investment return of an investment will fluctuate so that investor’s shares, when redeemed, may be worth more or less than the original cost. The returns shown do not reflect the deduction of taxes that a shareholder would pay on Fund distributions or on redemptions of Fund shares. The total annual operating expenses as stated in the fee table to the Fund’s prospectus dated August 31, 2019, is 0.60%. For performance information current to the most recent month-end, please call 1-877-337-0500. |
(2) | Inception date is December 11, 2017. |
(3) | Indexes are unmanaged statistical composites and their returns do not include fees an investor would pay to purchase the securities they represent. Such costs would lower performance. It is not possible to invest directly in an index. |
29
Pacer Military Times Best Employers ETF
PERFORMANCE SUMMARY
(Unaudited)
Growth of $10,000

This chart illustrates the performance of a hypothetical $10,000 investment made on April 9, 2018, and is not intended to imply any future performance. The returns shown do not reflect the deduction of taxes that a shareholder would pay on fund distributions or the redemption of fund shares. The chart assumes reinvestment of capital gains and dividends.
The Military Times Best for VETSSM Index is composed of the U.S.-listed stocks of companies that have been included in the Best for Vets List for the last three consecutive years, have a minimum market capitalization of $200 million, and meet the Index’s liquidity threshold. Index components are equally weighted at the time of each annual reconstitution of the Index, which is effective at the close of business on the third Friday of each September. As of June 30, 2019, the Index was made up of 43 companies and included significant allocations to companies in the financial, industrial, and information technology sectors. Companies previously included in the Index for two consecutive years that are no longer on the Best for Vets List may continue to be included in the Index if the reason that they are no longer on the Best for Vets List is because they did not complete the most recent Best for Vets Survey.
The S&P 500 Total Return Index consists of approximately 500 leading U.S.-listed companies representing approximately 8% of the U.S. equity market capitalization.
Annualized Returns(1)
(For the year ended April 30, 2020)
| | One Year | Since Inception(2) |
Pacer Military Times Best Employers ETF - NAV | -1.59% | 7.33% |
Pacer Military Times Best Employers ETF - Market | -3.11% | 4.48% |
Military Times Best for VETSSM Index(3) | -1.76% | 7.50% |
S&P 500 ® Total Return Index(3) | 0.86% | 7.51% |
(1) | The performance data quoted is historical. Past performance is no guarantee of future results. Current performance may be higher or lower than the performance data quoted. The principal value and investment return of an investment will fluctuate so that investor’s shares, when redeemed, may be worth more or less than the original cost. The returns shown do not reflect the deduction of taxes that a shareholder would pay on Fund distributions or on redemptions of Fund shares. The total annual operating expenses as stated in the fee table to the Fund’s prospectus dated August 31, 2019, is 0.60%. For performance information current to the most recent month-end, please call 1-877-337-0500. |
(2) | Inception date is April 9, 2018. |
(3) | Indexes are unmanaged statistical composites and their returns do not include fees an investor would pay to purchase the securities they represent. Such costs would lower performance. It is not possible to invest directly in an index. |
30
Pacer Benchmark Retail Real Estate SCTRSM ETF
PERFORMANCE SUMMARY
(Unaudited)
Growth of $10,000
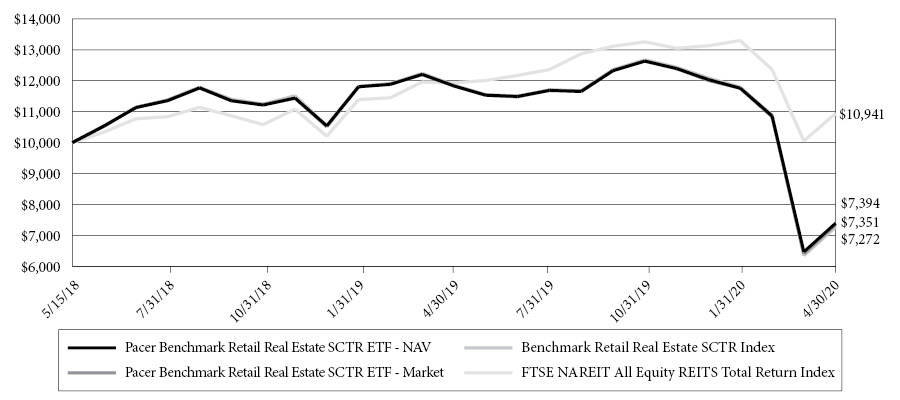
This chart illustrates the performance of a hypothetical $10,000 investment made on May 15, 2018, and is not intended to imply any future performance. The returns shown do not reflect the deduction of taxes that a shareholder would pay on fund distributions or the redemption of fund shares. The chart assumes reinvestment of capital gains and dividends.
The Benchmark Retail Real Estate SCTRSM Index is generally composed of the U.S.-listed equity securities of companies that derive at least 85% of their earnings or revenues from real estate operations in the retail real estate sector (“Eligible Companies”). At the time of each reconstitution of the Index, Eligible Companies with a market capitalization of more than $200 million and average daily traded volume of at least 10,000 shares are included in the Index (the “Index Constituents”). A significant portion of the Index is expected to be composed of real estate investment trusts (“REITs”).
The FTSE Nareit All Equity REITs Index is a free-float adjusted, market capitalization-weighted index of U.S. equity REITs. Constituents of the index include all tax-qualified REITs with more than 50% of total assets in qualifying real estate assets other than mortgages secured by real property.
Annualized Returns(1)
(For the year ended April 30, 2020)
| | One Year | Since Inception(2) |
Pacer Benchmark Retail Real Estate SCTRSM ETF - NAV | -37.49% | -14.28% |
Pacer Benchmark Retail Real Estate SCTRSM ETF - Market | -37.87% | -14.54% |
Benchmark Retail Real Estate SCTRSM Index(3) | -38.66% | -15.01% |
FTSE NAREIT All Equity REITS Total Return Index(3) | -8.30% | 4.69% |
(1) | The performance data quoted is historical. Past performance is no guarantee of future results. Current performance may be higher or lower than the performance data quoted. The principal value and investment return of an investment will fluctuate so that investor’s shares, when redeemed, may be worth more or less than the original cost. The returns shown do not reflect the deduction of taxes that a shareholder would pay on Fund distributions or on redemptions of Fund shares. The total annual operating expenses as stated in the fee table to the Fund’s prospectus dated August 31, 2019, is 0.60%. For performance information current to the most recent month-end, please call 1-877-337-0500. |
(2) | Inception date is May 15, 2018. |
(3) | Indexes are unmanaged statistical composites and their returns do not include fees an investor would pay to purchase the securities they represent. Such costs would lower performance. It is not possible to invest directly in an index. |
31
Pacer Benchmark Industrial Real Estate SCTRSM ETF
PERFORMANCE SUMMARY
(Unaudited)
Growth of $10,000
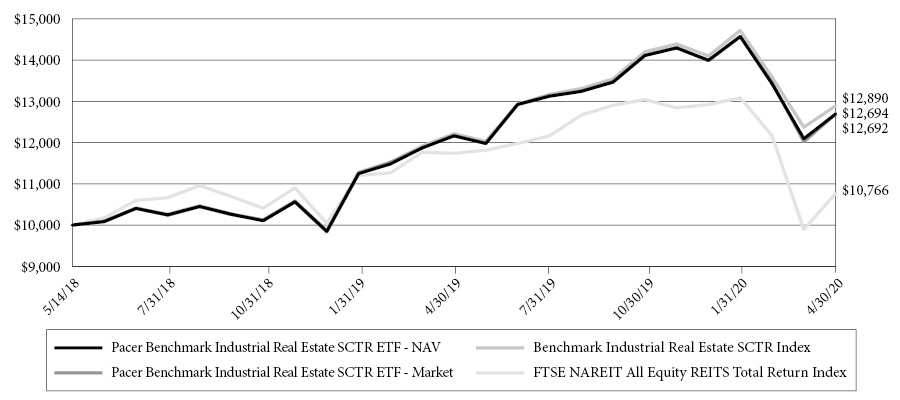
This chart illustrates the performance of a hypothetical $10,000 investment made on May 14, 2018, and is not intended to imply any future performance. The returns shown do not reflect the deduction of taxes that a shareholder would pay on fund distributions or the redemption of fund shares. The chart assumes reinvestment of capital gains and dividends.
The Benchmark Industrial Real Estate SCTRSM Index is generally composed of the U.S.-listed equity securities of companies that derive at least 85% of their earnings or revenues from real estate operations in the industrial real estate sector (“Industrial Companies”), including companies that derivate at least 85% of their earnings or revenues from self-storage real estate operations (“Self-Storage Companies”). At the time of each reconstitution of the Index, Industrial Companies with a market capitalization of more than $200 million and average daily traded volume of at least 10,000 shares are included in the Index (the “Index Constituents”). A significant portion of the Index is expected to be composed of real estate investment trusts (“REITs”).
The FTSE Nareit All Equity REITs Index is a free-float adjusted, market capitalization-weighted index of U.S. equity REITs. Constituents of the index include all tax-qualified REITs with more than 50% of total assets in qualifying real estate assets other than mortgages secured by real property.
Annualized Returns(1)
(For the year ended April 30, 2020)
| | One Year | Since Inception(2) |
Pacer Benchmark Industrial Real Estate SCTRSM ETF - NAV | 4.38% | 12.93% |
Pacer Benchmark Industrial Real Estate SCTRSM ETF - Market | 4.20% | 12.92% |
Benchmark Industrial Real Estate SCTRSM Index(3) | 5.55% | 13.82% |
FTSE NAREIT All Equity REITS Total Return Index(3) | -8.30% | 3.83% |
(1) | The performance data quoted is historical. Past performance is no guarantee of future results. Current performance may be higher or lower than the performance data quoted. The principal value and investment return of an investment will fluctuate so that investor’s shares, when redeemed, may be worth more or less than the original cost. The returns shown do not reflect the deduction of taxes that a shareholder would pay on Fund distributions or on redemptions of Fund shares. The total annual operating expenses as stated in the fee table to the Fund’s prospectus dated August 31, 2019, is 0.60%. For performance information current to the most recent month-end, please call 1-877-337-0500. |
(2) | Inception date is May 14, 2018. |
(3) | Indexes are unmanaged statistical composites and their returns do not include fees an investor would pay to purchase the securities they represent. Such costs would lower performance. It is not possible to invest directly in an index. |
32
Pacer Benchmark Data & Infrastructure Real Estate SCTRSM ETF
PERFORMANCE SUMMARY
(Unaudited)
Growth of $10,000

This chart illustrates the performance of a hypothetical $10,000 investment made on May 15, 2018, and is not intended to imply any future performance. The returns shown do not reflect the deduction of taxes that a shareholder would pay on fund distributions or the redemption of fund shares. The chart assumes reinvestment of capital gains and dividends.
The Benchmark Data & Infrastructure Real Estate SCTRSM Index is generally composed of the U.S.-listed equity securities of companies that derive at least 85% of their earnings or revenues from real estate operations in the data and infrastructure real estate sectors (“Eligible Companies”). At the time of each reconstitution of the Index, Eligible Companies with a market capitalization of more than $200 million and average daily traded volume of at least 10,000 shares are included in the Index (the “Index Constituents”). A significant portion of the Index is expected to be composed of real estate investment trusts (“REITs”).
The FTSE Nareit All Equity REITs Index is a free-float adjusted, market capitalization-weighted index of U.S. equity REITs. Constituents of the index include all tax-qualified REITs with more than 50% of total assets in qualifying real estate assets other than mortgages secured by real property.
Annualized Returns(1)
(For the year ended April 30, 2020)
| | One Year | Since Inception(2) |
Pacer Benchmark Data & Infrastructure Real Estate SCTRSM ETF - NAV | 19.50% | 19.12% |
Pacer Benchmark Data & Infrastructure Real Estate SCTRSM ETF - Market | 19.40% | 19.17% |
Benchmark Data & Infrastructure Real Estate SCTRSM Index(3) | 20.30% | 20.27% |
FTSE NAREIT All Equity REITS Total Return Index(3) | -8.30% | 4.69% |
(1) | The performance data quoted is historical. Past performance is no guarantee of future results. Current performance may be higher or lower than the performance data quoted. The principal value and investment return of an investment will fluctuate so that investor’s shares, when redeemed, may be worth more or less than the original cost. The returns shown do not reflect the deduction of taxes that a shareholder would pay on Fund distributions or on redemptions of Fund shares. The total annual operating expenses as stated in the fee table to the Fund’s prospectus dated August 31, 2019, is 0.60%. For performance information current to the most recent month-end, please call 1-877-337-0500. |
(2) | Inception date is May 15, 2018. |
(3) | Indexes are unmanaged statistical composites and their returns do not include fees an investor would pay to purchase the securities they represent. Such costs would lower performance. It is not possible to invest directly in an index. |
33
Pacer US Export Leaders ETF
PERFORMANCE SUMMARY
(Unaudited)
Growth of $10,000

This chart illustrates the performance of a hypothetical $10,000 investment made on July 23, 2018, and is not intended to imply any future performance. The returns shown do not reflect the deduction of taxes that a shareholder would pay on fund distributions or the redemption of fund shares. The chart assumes reinvestment of capital gains and dividends.
The Pacer US Export Leaders Index uses an objective, rules-based methodology to measure the performance of an equal weight portfolio of approximately 100 large- and mid-capitalization U.S. companies with a high percentage of foreign sales and high free cash flow growth. Free cash flow is a company’s cash flow from operations minus its capital expenditures. Construction of the Index begins with an initial universe of the 200 companies across the S&P 900 ® Index (which is comprised of the S&P 500 ® Index (“S&P 500”) and S&P MidCap 400 ® Index (“S&P MidCap 400”)) that have the highest annual foreign sales as a percentage of total sales. The 200 companies are then narrowed to the 100 companies with the highest change in free cash flow growth over the past five years, and those 100 companies are equally weighted to create the Index. The Index is reconstituted and rebalanced to equal-weight quarterly.
The S&P 900 ® combines the S&P 500 ® and the S&P MidCap 400 ® to form an investable benchmark for the mid- to large-cap segment of the U.S. equity market.
Annualized Returns(1)
(For the year ended April 30, 2020)
| | One Year | Since Inception(2) |
Pacer US Export Leaders ETF - NAV | -2.53% | 0.95% |
Pacer US Export Leaders ETF - Market | -2.55% | 0.90% |
Pacer US Export Leaders Index(3) | -1.96% | 1.59% |
S&P 900 IndexTM(3) | -0.19% | 3.29% |
(1) | The performance data quoted is historical. Past performance is no guarantee of future results. Current performance may be higher or lower than the performance data quoted. The principal value and investment return of an investment will fluctuate so that investor’s shares, when redeemed, may be worth more or less than the original cost. The returns shown do not reflect the deduction of taxes that a shareholder would pay on Fund distributions or on redemptions of Fund shares. The total annual operating expenses as stated in the fee table to the Fund’s prospectus dated August 31, 2019, is 0.60%. For performance information current to the most recent month-end, please call 1-877-337-0500. |
(2) | Inception date is July 23, 2018. |
(3) | Indexes are unmanaged statistical composites and their returns do not include fees an investor would pay to purchase the securities they represent. Such costs would lower performance. It is not possible to invest directly in an index. |
34
Pacer CFRA-Stovall Equal Weight Seasonal Rotation ETF
PERFORMANCE SUMMARY
(Unaudited)
Growth of $10,000

This chart illustrates the performance of a hypothetical $10,000 investment made on July 23, 2018, and is not intended to imply any future performance. The returns shown do not reflect the deduction of taxes that a shareholder would pay on fund distributions or the redemption of fund shares. The chart assumes reinvestment of capital gains and dividends.
The Pacer CFRA-Stovall Equal Weight Seasonal Rotation Index uses an objective, rules-based methodology to track the performance of a semi-annual rotation of certain sectors within the S&P 500 Equal Weight Index (“EWI”). The S&P 500 EWI is an equal-weighted version of the S&P 500 ®, which measures the performance of the large-cap segment of the U.S. equity market.
The S&P 500 Total Return Index consists of approximately 500 leading U.S.-listed companies representing approximately 8% of the U.S. equity market capitalization.
Annualized Returns(1)
(For the year ended April 30, 2020)
| | One Year | Since Inception(2) |
Pacer CFRA-Stovall Equal Weight Seasonal Rotation ETF - NAV | -8.80% | 2.06% |
Pacer CFRA-Stovall Equal Weight Seasonal Rotation ETF - Market | -8.97% | 1.98% |
Pacer CFRA-Stovall Equal Weight Seasonal Rotation Index(3) | -7.16% | 3.30% |
S&P 500 ® Total Return Index(3) | 0.86% | 4.16% |
(1) | The performance data quoted is historical. Past performance is no guarantee of future results. Current performance may be higher or lower than the performance data quoted. The principal value and investment return of an investment will fluctuate so that investor’s shares, when redeemed, may be worth more or less than the original cost. The returns shown do not reflect the deduction of taxes that a shareholder would pay on Fund distributions or on redemptions of Fund shares. The total annual operating expenses as stated in the fee table to the Fund’s prospectus dated August 31, 2019, is 0.60%. For performance information current to the most recent month-end, please call 1-877-337-0500. |
(2) | Inception date is July 23, 2018. |
(3) | Indexes are unmanaged statistical composites and their returns do not include fees an investor would pay to purchase the securities they represent. Such costs would lower performance. It is not possible to invest directly in an index. |
35
Pacer US Cash Cows Growth ETF
PERFORMANCE SUMMARY
(Unaudited)
Growth of $10,000

This chart illustrates the performance of a hypothetical $10,000 investment made on May 2, 2019, and is not intended to imply any future performance. The returns shown do not reflect the deduction of taxes that a shareholder would pay on fund distributions or the redemption of fund shares. The chart assumes reinvestment of capital gains and dividends.
The Pacer US Cash Cows Growth Index uses an objective, rules-based methodology to provide exposure to mid- and large-capitalization U.S. companies with high free cash flow yields. Companies with high free cash flow yields are commonly referred to as “cash cows”.
The S&P 900 Pure Growth Index is made up of approximately 150 companies that exhibit strong growth characteristcs from the S&P 500 and S&P MidCap 400.
Cumulative Returns(1)
(For the period ended April 30, 2020)
| | Since Inception(2) |
Pacer US Cash Cows Growth ETF - NAV | -6.52% |
Pacer US Cash Cows Growth ETF - Market | -6.37% |
Pacer US Cash Cows Growth Index(3) | -6.49% |
S&P 900 Pure Growth Index(3) | -5.48% |
(1) | The performance data quoted is historical. Past performance is no guarantee of future results. Current performance may be higher or lower than the performance data quoted. The principal value and investment return of an investment will fluctuate so that investor’s shares, when redeemed, may be worth more or less than the original cost. The returns shown do not reflect the deduction of taxes that a shareholder would pay on Fund distributions or on redemptions of Fund shares. The total annual operating expenses as stated in the fee table to the Fund’s prospectus dated April 30, 2019, is 0.60%. For performance information current to the most recent month-end, please call 1-877-337-0500. |
(2) | Inception date is May 2, 2019. |
(3) | Indexes are unmanaged statistical composites and their returns do not include fees an investor would pay to purchase the securities they represent. Such costs would lower performance. It is not possible to invest directly in an index. |
36
Pacer Trendpilot International ETF
PERFORMANCE SUMMARY
(Unaudited)
Growth of $10,000
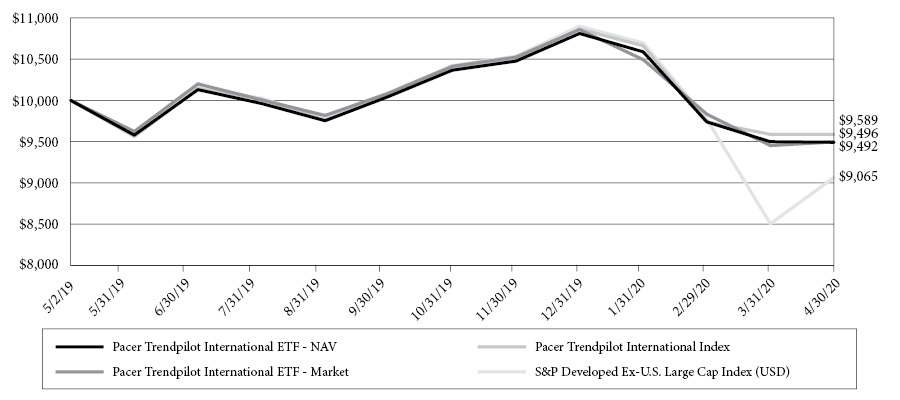
This chart illustrates the performance of a hypothetical $10,000 investment made on May 2, 2019, and is not intended to imply any future performance. The returns shown do not reflect the deduction of taxes that a shareholder would pay on fund distributions or the redemption of fund shares. The chart assumes reinvestment of capital gains and dividends.
The Pacer Trendpilot International Index uses an objective, rules-based methodology to implement a systematic trend-following strategy that directs exposure (i) 100% to the S&P Developed Ex-U.S. LargeCap Index, (ii) 50% to the S&P Developed Ex-U.S. LargeCap Index and 50% to 3-Month US Treasury bills, or (iii) 100% to 3-Month US Treasury bills, depending on the relative performance of the S&P Developed Ex-U.S. LargeCap Index and its 200-business day historical simple moving average (the “200-day moving average”). The calculation of the 200-day moving average for the S&P Developed Ex-U.S. LargeCap Index is based on the total return version of the S&P Developed Ex-U.S. LargeCap Local Currency Index and reflects the reinvestment of dividends paid by the securities in the S&P Developed Ex-U.S. LargeCap Index. The Index is expected to be predominantly invested in the components of the S&P Developed Ex-U.S. LargeCap Index over most short- and long-term periods and is only expected to invest in 3-Month US Treasury bills from time to time in response to adverse market conditions as defined by the “50/50 Indicator” and “T-Bill Indicator” below.
The S&P Developed Ex-US LargeCap Index is a rules-based, float-adjusted, market capitalization-weighted index comprised of large-capitalization stocks providing coverage of the developed markets excluding the United States.
Cumulative Returns(1)
(For the period ended April 30, 2020)
| | Since Inception(2) |
Pacer Trendpilot International ETF - NAV | -5.08% |
Pacer Trendpilot International ETF - Market | -5.04% |
Pacer Trendpilot International Index | -4.11% |
S&P Developed Ex-US Large Cap Index (USD)(3) | -9.35% |
(1) | The performance data quoted is historical. Past performance is no guarantee of future results. Current performance may be higher or lower than the performance data quoted. The principal value and investment return of an investment will fluctuate so that investor’s shares, when redeemed, may be worth more or less than the original cost. The returns shown do not reflect the deduction of taxes that a shareholder would pay on Fund distributions or on redemptions of Fund shares. The total annual operating expenses as stated in the fee table to the Fund’s prospectus dated April 30, 2019, is 0.65%. For performance information current to the most recent month-end, please call 1-877-337-0500. |
(2) | Inception date is May 2, 2019. |
(3) | Indexes are unmanaged statistical composites and their returns do not include fees an investor would pay to purchase the securities they represent. Such costs would lower performance. It is not possible to invest directly in an index. |
37
Pacer Emerging Markets Cash Cows 100 ETF
PERFORMANCE SUMMARY
(Unaudited)
Growth of $10,000
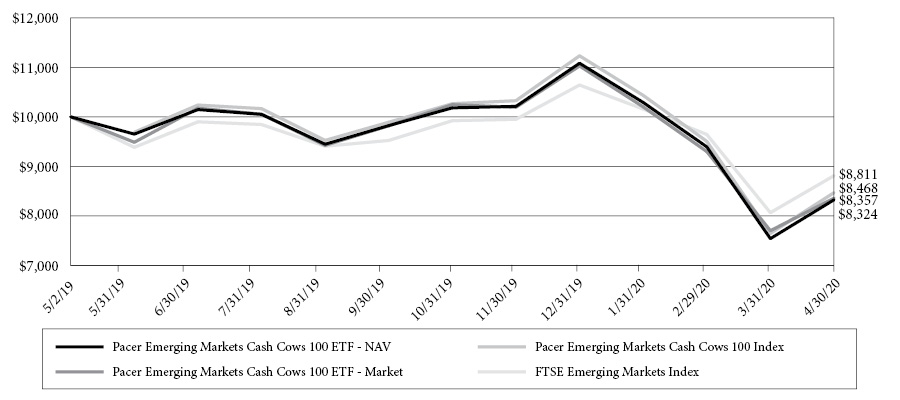
This chart illustrates the performance of a hypothetical $10,000 investment made on May 2, 2019, and is not intended to imply any future performance. The returns shown do not reflect the deduction of taxes that a shareholder would pay on fund distributions or the redemption of fund shares. The chart assumes reinvestment of capital gains and dividends.
The Pacer Emerging Markets Cash Cows 100 Index uses an objective, rules-based methodology to provide exposure to large and mid-capitalization companies in emerging markets with high free cash flow yields.
The FTSE Emerging Markets Index is comprised of all the countries that make up the advanced emerging markets and secondary emerging markets within the FTSE Global Equity Index Series.
Cumulative Returns(1)
(For the period ended April 30, 2020)
| | Since Inception(2) |
Pacer Emerging Markets Cash Cows 100 ETF - NAV | -16.76% |
Pacer Emerging Markets Cash Cows 100 ETF - Market | -16.43% |
Pacer Emerging Markets Cash Cows 100 Index(3) | -15.32% |
FTSE Emerging Markets Index(3) | -11.89% |
(1) | The performance data quoted is historical. Past performance is no guarantee of future results. Current performance may be higher or lower than the performance data quoted. The principal value and investment return of an investment will fluctuate so that investor’s shares, when redeemed, may be worth more or less than the original cost. The returns shown do not reflect the deduction of taxes that a shareholder would pay on Fund distributions or on redemptions of Fund shares. The total annual operating expenses as stated in the fee table to the Fund’s prospectus dated April 30, 2019, is 0.70%. For performance information current to the most recent month-end, please call 1-877-337-0500. |
(2) | Inception date is May 2, 2019. |
(3) | Indexes are unmanaged statistical composites and their returns do not include fees an investor would pay to purchase the securities they represent. Such costs would lower performance. It is not possible to invest directly in an index. |
38
Pacer Cash Cows Fund of Funds ETF
PERFORMANCE SUMMARY
(Unaudited)
Growth of $10,000
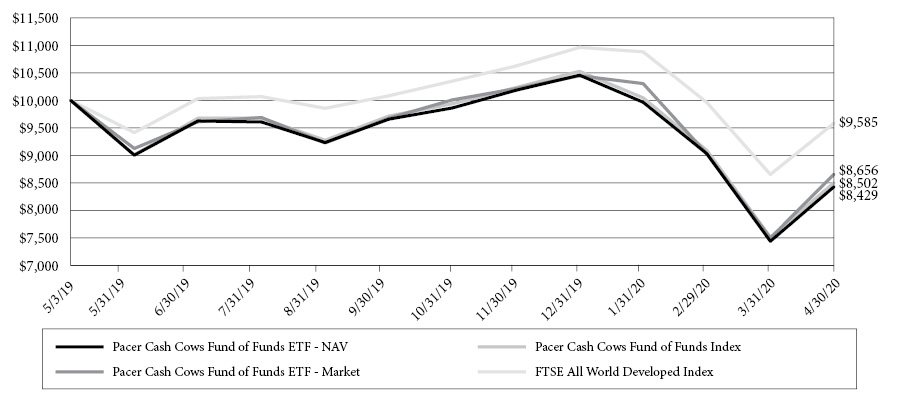
This chart illustrates the performance of a hypothetical $10,000 investment made on May 3, 2019, and is not intended to imply any future performance. The returns shown do not reflect the deduction of taxes that a shareholder would pay on fund distributions or the redemption of fund shares. The chart assumes reinvestment of capital gains and dividends.
The Pacer Cash Cows Fund of Funds Index uses an objective, rules-based approach to construct a portfolio that, as of each quarterly rebalance, is composed of the ETFs listed in the following table, each advised by the Adviser (collectively, the “Cash Cows ETFs”). Each of the Cash Cows ETFs is an index-based ETF that seeks to track the total return performance, before fees and expenses, of the applicable underlying index listed in the following table (collectively, the “Cash Cows Indexes”). Each Cash Cows Index uses an objective, rules-based methodology to provide exposure to companies with high free cash flow yields (commonly referred to as “cash cows”) selected from the applicable “Equity Universe” as indicated in the following table.
Weight | Cash Cows ETF | Cash Cows Index | Equity Universe |
20% | Pacer US Cash Cows 100 ETF | Pacer US Cash Cows 100 ETF | Russell 1000 Index |
20% | Pacer Global Cash Cows Dividend ETF | Pacer Global Cash Cows Dividend Index | FTSE All-World Developed Large Cap Index |
20% | Pacer US Small Cap Cash Cows 100 ETF | Pacer US Small Cap Cash Cows 100 Index | S&P Small Cap 600 ® Index |
20% | Pacer US Cash Cows Growth ETF | Pacer US Cash Cows Growth Index | S&P 900 ® Pure Growth Index |
20% | Pacer Developed Markets International Cash Cows 100 ETF | Pacer Developed Markets International Cash Cows 100 Index | FTSE Developed ex US Index |
The FTSE All World Developed Index is a market-capitalization weighted index representing the performance of large and mid cap companies in Developed and Emerging Markets, excluding the USA. The index is derived from the FTSE Global Equity Index Series (GEIS), which covers 98% of the world’s investable market capitalization.
39
Pacer Cash Cows Fund of Funds ETF
PERFORMANCE SUMMARY (Continued)
(Unaudited)
Cumulative Returns(1)
(For the period ended April 30, 2020)
| | Since Inception(2) |
Pacer Cash Cows Fund of Funds ETF - NAV | -15.71% |
Pacer Cash Cows Fund of Funds ETF - Market | -13.44% |
Pacer Cash Cows Fund of Funds Index(3) | -14.98% |
FTSE All World Developed Index(3) | -4.15% |
(1) | The performance data quoted is historical. Past performance is no guarantee of future results. Current performance may be higher or lower than the performance data quoted. The principal value and investment return of an investment will fluctuate so that investor’s shares, when redeemed, may be worth more or less than the original cost. The returns shown do not reflect the deduction of taxes that a shareholder would pay on Fund distributions or on redemptions of Fund shares. The total annual operating expenses as stated in the fee table to the Fund’s prospectus dated April 30, 2019, is 0.15%. For performance information current to the most recent month-end, please call 1-877-337-0500. |
(2) | Inception date is May 3, 2019. |
(3) | Indexes are unmanaged statistical composites and their returns do not include fees an investor would pay to purchase the securities they represent. Such costs would lower performance. It is not possible to invest directly in an index. |
40
Pacer Trendpilot Fund of Funds ETF
PERFORMANCE SUMMARY
(Unaudited)
Growth of $10,000
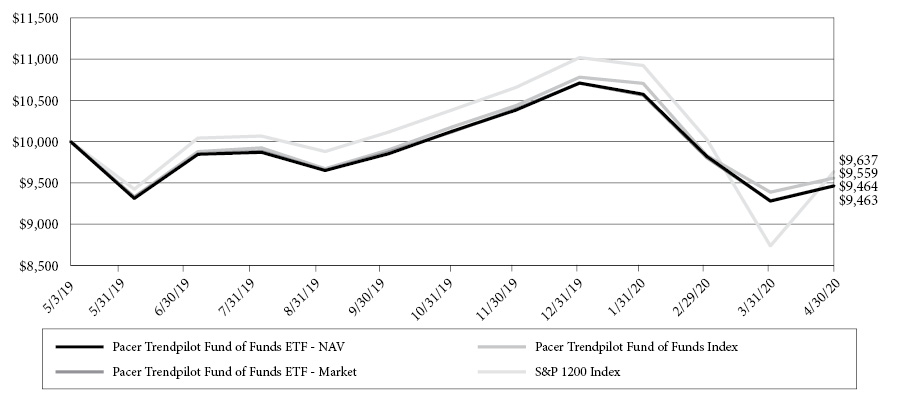
This chart illustrates the performance of a hypothetical $10,000 investment made on May 3, 2019, and is not intended to imply any future performance. The returns shown do not reflect the deduction of taxes that a shareholder would pay on fund distributions or the redemption of fund shares. The chart assumes reinvestment of capital gains and dividends.
The Pacer Trendpilot Fund of Funds Index uses an objective, rules-based approach to construct a portfolio that, as of each quarterly rebalance, is composed of the ETFs listed in the following table, each advised by the Adviser (collectively, the “Trendpilot ETFs”). Each of the Trendpilot ETFs is an index-based ETF that seeks to track the total return performance, before fees and expenses, of the underlying index listed in the following table (collectively, the “Trendpilot Indexes”). Each Trendpilot Index uses an objective, rules-based methodology to implement a systematic trend-following strategy that directs exposure (i) 100% to the “Equity Component” specified in the table below, (ii) 50% to the applicable Equity Component and 50% to 3-Month US Treasury bills, or (iii) 100% to 3-Month US Treasury bills, depending on the relative performance of the Equity Component and its 200-business day historical simple moving average (the “200-day moving average”). The calculation of the 200-day moving average for each Equity Component is based on the total return version of such Equity Component and reflects the reinvestment of dividends paid by the securities in such Equity Component.
Weight | Trendpilot ETF | Trendpilot Index | Equity Component |
20% | Pacer Trendpilot ® US Large Cap ETF | Pacer Trendpilot ® US Large Cap Index | S&P 500 ® Index |
20% | Pacer Trendpilot ® US Mid Cap ETF | Pacer Trendpilot ® US Mid Cap Index | S&P MidCap 400 ® Index |
20% | Pacer Trendpilot ® 100 ETF | Pacer NASDAQ-100 Trendpilot ® Index | NASDAQ-100 ® Index |
40% | Pacer Trendpilot ® International ETF | Pacer Trendpilot ® International Index | S&P Developed Ex-US Large Cap Index |
The S&P 1200 Index captures approximately 70% of global market capitalization.
41
Pacer Trendpilot Fund of Funds ETF
PERFORMANCE SUMMARY (Continued)
(Unaudited)
Cumulative Returns(1)
(For the period ended April 30, 2020)
| | Since Inception(2) |
Pacer Trendpilot Fund of Funds ETF - NAV | -5.37% |
Pacer Trendpilot Fund of Funds ETF - Market | -5.36% |
Pacer Trendpilot Fund of Funds Index(3) | -4.41% |
S&P 1200 Index(3) | -3.63% |
(1) | The performance data quoted is historical. Past performance is no guarantee of future results. Current performance may be higher or lower than the performance data quoted. The principal value and investment return of an investment will fluctuate so that investor’s shares, when redeemed, may be worth more or less than the original cost. The returns shown do not reflect the deduction of taxes that a shareholder would pay on Fund distributions or on redemptions of Fund shares. The total annual operating expenses as stated in the fee table to the Fund’s prospectus dated April 30, 2019, is 0.15%. For performance information current to the most recent month-end, please call 1-877-337-0500. |
(2) | Inception date is May 3, 2019. |
(3) | Indexes are unmanaged statistical composites and their returns do not include fees an investor would pay to purchase the securities they represent. Such costs would lower performance. It is not possible to invest directly in an index. |
42
Pacer Trendpilot US Bond ETF
PERFORMANCE SUMMARY
(Unaudited)
Growth of $10,000

This chart illustrates the performance of a hypothetical $10,000 investment made on October 22, 2019, and is not intended to imply any future performance. The returns shown do not reflect the deduction of taxes that a shareholder would pay on fund distributions or the redemption of fund shares. The chart assumes reinvestment of capital gains and dividends.
The Pacer Trendpilot US Bond Index uses an objective, rules-based methodology to implement a systematic trend-following strategy that directs exposure to one of the following positions: (i) 100% to the S&P U.S. High Yield Corporate Bond Index, (ii) 50% to the S&P U.S. High Yield Corporate Bond Index and 50% to the S&P U.S. Treasury Bond 7-10 Year Index or (iii) 100% to S&P U.S. Treasury Bond 7-10 Year Index.
The S&P U.S. High Yield Corporate Bond Index is designed to track the performance of U.S. dollar-denominated, high-yield corporate bonds issued in the U.S.
Cumulative Returns(1)
(For the period ended April 30, 2020)
| | Since Inception(2) |
Pacer Trendpilot US Bond ETF - NAV | 4.24% |
Pacer Trendpilot US Bond ETF - Market | 4.90% |
Pacer Trendpilot US Bond Index(3) | 4.34% |
S&P U.S. High Yield Corporate Bond IndexTM(3) | -6.85% |
(1) | The performance data quoted is historical. Past performance is no guarantee of future results. Current performance may be higher or lower than the performance data quoted. The principal value and investment return of an investment will fluctuate so that investor’s shares, when redeemed, may be worth more or less than the original cost. The returns shown do not reflect the deduction of taxes that a shareholder would pay on Fund distributions or on redemptions of Fund shares. The total annual operating expenses as stated in the fee table to the Fund’s prospectus dated October 18, 2019 as supplemented October 28, 2019, is 0.60%. For performance information current to the most recent month-end, please call 1-877-337-0500. |
(2) | Inception date is October 22, 2019. |
(3) | Indexes are unmanaged statistical composites and their returns do not include fees an investor would pay to purchase the securities they represent. Such costs would lower performance. It is not possible to invest directly in an index. |
43
Pacer CSOP FTSE China A50 ETF
PERFORMANCE SUMMARY
(Unaudited)
Growth of $10,000
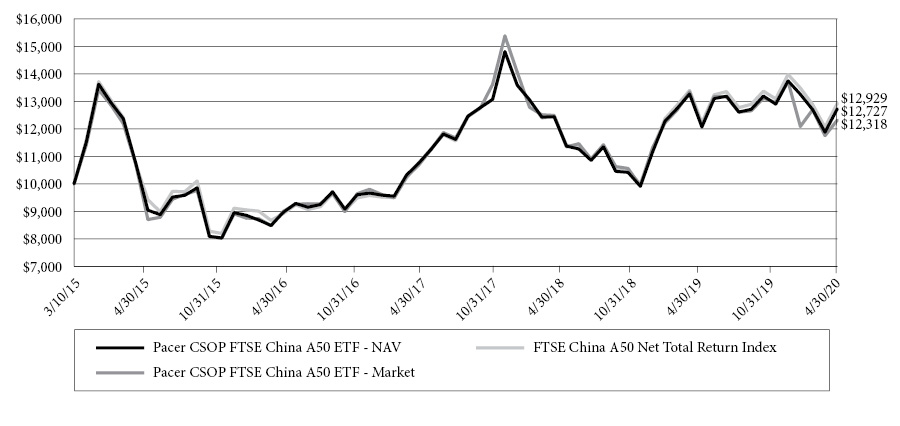
This chart illustrates the performance of a hypothetical $10,000 investment made on March 10, 2015, and is not intended to imply any future performance. The returns shown do not reflect the deduction of taxes that a shareholder would pay on fund distributions or the redemption of fund shares. The chart assumes reinvestment of capital gains and dividends.
The FTSE China A50 Net Total Return Index ® is comprised of the A-Shares issued by the 50 largest companies in the China A-Shares market. The Index is a free float-adjusted market capitalization-weighted index compiled and published by FTSE International Limited, which is not affiliated with the Fund, Pacer Advisors, Inc, CSOP Asset Management LImited or the Fund’s distributor. The Index is a real-time, tradable index comprising of the largest 50 China A-Share companies by full market capitalization of the FTSE China A All Cap Free Index.
Annualized Returns(1)
(For the period ended April 30, 2020)
| | 7 Month | One Year | Three Year | Five Year | Since Inception(2) |
Pacer CSOP FTSE China A50 ETF - NAV | 0.14% | -4.08% | 10.03% | -1.35% | 4.80% |
Pacer CSOP FTSE China A50 ETF - Market | -2.64% | -7.66% | 9.07% | -1.70% | 4.14% |
FTSE China A50 Net Total Return Index ®(3) | 0.30% | -3.49% | 10.83% | -1.17% | 5.13% |
(1) | The performance data quoted is historical. Past performance is no guarantee of future results. Current performance may be higher or lower than the performance data quoted. The principal value and investment return of an investment will fluctuate so that investor’s shares, when redeemed, may be worth more or less than the original cost. The returns shown do not reflect the deduction of taxes that a shareholder would pay on Fund distributions or on redemptions of Fund shares. The total annual operating expenses as stated in the fee table to the Fund’s prospectus dated January 22, 2020, is 0.70%. For performance information current to the most recent month-end, please call 1-877-337-0500. |
(2) | Inception date is March 10, 2015. The Fund is the successor to the investment performance of the CSOP FTSE China A50 ETF (the “Predecessor CSOP”) as a result of the reorganization of the Predecessor CSOP Fund into the Fund on January 23, 2020. Accordingly, the performance information shown in the chart and table above for periods prior to January 23, 2020 is that of the Predecessor CSOP Fund’s Shares for the Fund. The Predecessor CSOP Fund was managed by the same portfolio managers as the Fund and had substantially the same investment objectives, policies, and strategies as the Fund. |
(3) | Indexes are unmanaged statistical composites and their returns do not include fees an investor would pay to purchase the securities they represent. Such costs would lower performance. It is not possible to invest directly in an index. |
44
Pacer Funds
EXPENSE EXAMPLE
For the Six-Months Ended April 30, 2020 (Unaudited)
As a shareholder of a Fund, you pay ongoing expenses, such as advisory fees, and other fund expenses. The following examples are intended to help you understand the ongoing cost (in dollars) of investing in a Fund and to compare these costs with the ongoing costs of investing in other funds. Please note, the expenses shown in the tables are meant to highlight ongoing costs only and do not reflect any transactional costs. You may pay brokerage commissions on your purchase and sale of Fund shares, which are not reflected in the following examples. Each example is based on an investment of $1,000 invested at the beginning of the period and held for the entire period as indicated below.
Actual Expenses
The columns under the heading entitled “Actual” help you estimate the actual expenses you paid over the period. The “Actual Ending Account Value” shown is derived from a Fund’s actual return and the “Actual Expenses Paid During Period” show the dollar amount that would have been paid by an investor who started with $1,000 in a Fund. To estimate the expenses you paid on your account during this period, simply divide your account value by $1,000 (for example, an $8,600 account value divided by $1,000=8.6), then multiply the result by the number in the column under the heading untitled “Actual Expenses Paid During Period”.
Hypothetical Example for Comparison Purposes
The columns under the heading entitled “Hypothetical” provide information about hypothetical account value and hypothetical expenses based on a Fund’s actual expense ratio and an assumed rate of return of 5% per year before expenses, which is not the Fund’s return. The hypothetical account values and expenses may not be used to estimate the actual ending account balance or expenses you paid for the period. You may use this information to compare the ongoing costs of investing in a Fund and other funds. To do so, compare this 5% hypothetical example with the 5% hypothetical examples that appear in the shareholder reports of other funds.
Please note that the expenses shown in the table are meant to highlight your ongoing costs only and do not reflect any transactional costs which may be applicable to your account. Therefore, the last column of the table (Hypothetical Expenses Paid During Period) is useful in comparing ongoing costs only and will not help you determine the relative total costs of owning different funds. In addition, if these transactional costs were included, your costs would have been higher.
| | Fund’s Annual
Expense Ratio | Beginning Account
Value 11/01/19 | Ending Account
Value 04/30/20 | Expenses Paid
During Period(a) |
Pacer Trendpilot ® US Large Cap ETF | | | | |
Actual | 0.60% | $1,000.00 | $ 860.10 | $ 2.77 |
Hypothetical(b) | 0.60% | $1,000.00 | $ 1,021.88 | $ 3.02 |
Pacer Trendpilot ® US Mid Cap ETF | | | | |
Actual | 0.60% | $1,000.00 | $ 975.40 | $ 2.95 |
Hypothetical(b) | 0.60% | $1,000.00 | $ 1,021.88 | $ 3.02 |
Pacer TrendpilotTM 100 ETF | | | | |
Actual | 0.65% | $1,000.00 | $ 1,015.70 | $ 3.26 |
Hypothetical(b) | 0.65% | $1,000.00 | $ 1,021.63 | $ 3.27 |
Pacer Trendpilot ® European Index ETF | | | | |
Actual | 0.65% | $1,000.00 | $ 900.80 | $ 3.07 |
Hypothetical(b) | 0.65% | $1,000.00 | $ 1,021.63 | $ 3.27 |
Pacer Global Cash Cows Dividend ETF | | | | |
Actual | 0.60% | $1,000.00 | $ 829.10 | $ 2.73 |
Hypothetical(b) | 0.60% | $1,000.00 | $ 1,021.88 | $ 3.02 |
Pacer U.S. Cash Cows 100 ETF | | | | |
Actual | 0.49% | $1,000.00 | $ 870.50 | $ 2.28 |
Hypothetical(b) | 0.49% | $1,000.00 | $ 1,022.43 | $ 2.46 |
Pacer U.S. Small Cap Cash Cows 100 ETF | | | | |
Actual | 0.59% | $1,000.00 | $ 825.00 | $ 2.68 |
Hypothetical(b) | 0.59% | $1,000.00 | $ 1,021.93 | $ 2.97 |
Pacer Developed Markets International Cash Cows 100 ETF | | | | |
Actual | 0.65% | $1,000.00 | $ 811.10 | $ 2.93 |
Hypothetical(b) | 0.65% | $1,000.00 | $ 1,021.63 | $ 3.27 |
Pacer WealthShield ETF | | | | |
Actual | 0.60% | $1,000.00 | $ 1,040.40 | $ 3.04 |
Hypothetical(b) | 0.60% | $1,000.00 | $ 1,021.88 | $ 3.02 |
45
Pacer Funds
EXPENSE EXAMPLE
For the Six-Months Ended April 30, 2020 (Unaudited) (Continued)
| | Fund’s Annual
Expense Ratio | Beginning Account
Value 11/01/19 | Ending Account
Value 04/30/20 | Expenses Paid
During Period(a) |
Pacer Military Times Best Employers ETF | | | | |
Actual | 0.60% | $1,000.00 | $ 926.30 | $ 2.87 |
Hypothetical(b) | 0.60% | $1,000.00 | $ 1,021.88 | $ 3.02 |
Pacer Benchmark Retail Real Estate ETF | | | | |
Actual | 0.60% | $1,000.00 | $ 585.30 | $ 2.36 |
Hypothetical(b) | 0.60% | $1,000.00 | $ 1,021.88 | $ 3.02 |
Pacer Benchmark Industrial Real Estate ETF | | | | |
Actual | 0.60% | $1,000.00 | $ 899.70 | $ 2.83 |
Hypothetical(b) | 0.60% | $1,000.00 | $ 1,021.88 | $ 3.02 |
Pacer Benchmark Data & Infrastructure Real Estate ETF | | | | |
Actual | 0.60% | $1,000.00 | $ 1,063.80 | $ 3.08 |
Hypothetical(b) | 0.60% | $1,000.00 | $ 1,021.88 | $ 3.02 |
Pacer US Export Leaders ETF | | | | |
Actual | 0.60% | $1,000.00 | $ 951.30 | $ 2.91 |
Hypothetical(b) | 0.60% | $1,000.00 | $ 1,021.88 | $ 3.02 |
Pacer CFRA-Stovall Equal Weight Seasonal Rotation ETF | | | | |
Actual | 0.60% | $1,000.00 | $ 870.80 | $ 2.79 |
Hypothetical(b) | 0.60% | $1,000.00 | $ 1,021.88 | $ 3.02 |
Pacer US Cash Cows Growth ETF | | | | |
Actual | 0.60% | $1,000.00 | $ 936.70 | $ 2.89 |
Hypothetical(b) | 0.60% | $1,000.00 | $ 1,021.88 | $ 3.02 |
Pacer Trendpilot International ETF | | | | |
Actual | 0.65% | $1,000.00 | $ 915.70 | $ 3.10 |
Hypothetical(b) | 0.65% | $1,000.00 | $ 1,021.63 | $ 3.27 |
Pacer Emerging Markets Cash Cows 100 ETF | | | | |
Actual | 0.70% | $1,000.00 | $ 817.50 | $ 3.16 |
Hypothetical(b) | 0.70% | $1,000.00 | $ 1,021.38 | $ 3.52 |
Pacer Cash Cows Fund of Funds ETF | | | | |
Actual | 0.15% | $1,000.00 | $ 854.70 | $ 0.69 |
Hypothetical(b) | 0.15% | $1,000.00 | $ 1,024.12 | $ 0.75 |
Pacer Trendpilot Fund of Funds ETF | | | | |
Actual | 0.15% | $1,000.00 | $ 934.50 | $ 0.72 |
Hypothetical(b) | 0.15% | $1,000.00 | $ 1,024.12 | $ 0.75 |
Pacer Trendpilot US Bond ETF | | | | |
Actual | 0.60% | $1,000.00 | $ 1,044.90 | $ 3.05 |
Hypothetical(b) | 0.60% | $1,000.00 | $ 1,021.88 | $ 3.02 |
Pacer CSOP FTSE China A50 ETF | | | | |
Actual | 0.70% | $1,000.00 | $ 964.70 | $ 3.42 |
Hypothetical(b) | 0.70% | $1,000.00 | $ 1,021.38 | $ 3.52 |
(a) | The dollar amounts shown as expenses paid during the period are equal to the annualized six-month expense ratio multiplied by the average account value during the period, multiplied by the number of days (182) in the most recent six-month period and divided by the number of days in the most recent twelve-month period (366). |
(b) | Assumes 5% return before expenses. |
46
Pacer Trendpilot ® US Large Cap ETF
SCHEDULE OF INVESTMENTS
April 30, 2020
| | | Principal
Amount | | | Value | |
SHORT-TERM INVESTMENTS — 100.8% | | | | |
| | | | | | | | | |
Money Market Deposit Accounts, — 0.0% (a) | | | | |
U.S. Bank Money Market Deposit Account, 0.20% (b) | | $ | 176,611 | | | $ | 176,611 | |
| | | | | |
U.S. Treasury Bills — 100.8% | | | | |
0.00% 6/11/20 (c) | | | 2,422,311,600 | | | | 2,422,073,656 | |
TOTAL SHORT-TERM INVESTMENTS (Cost $2,421,893,307) | | | | | | | 2,422,250,267 | |
| | | Shares | | | | | |
INVESTMENTS PURCHASED WITH PROCEEDS FROM SECURITIES LENDING — 31.1% | | | | |
Mount Vernon Liquid Assets Portfolio, LLC, 0.48% (b) | | | 748,680,000 | | | | 748,680,000 | |
TOTAL INVESTMENTS PURCHASED WITH PROCEEDS FROM SECURITIES LENDING (Cost $748,680,000) | | | | | | | 748,680,000 | |
Total Investments (Cost $3,170,573,307) — 131.9% | | | | | | | 3,170,930,267 | |
Liabilities in Excess of Other Assets — (31.9)% | | | | | | | (767,090,973 | ) |
TOTAL NET ASSETS — 100.0% | | | | | | $ | 2,403,839,294 | |
Percentages are stated as a percent of net assets.
| | (b) | The rate shown is as of April 30, 2020. |
| | (c) | All or a portion of this security is on loan as of April 30, 2020. The total value of securities on loan is $733,919,260 or 30.5% of net assets. |
For Fund compliance purposes, the Fund’s industry classifications refer to any one or more of the industry sub-classifications used by one or more widely recognized market indexes or ratings group indexes, and/or they may be defined by Fund management. This definition does not apply for all purposes of this report, which may combine sub-classifications for reporting ease. Categories are shown as a percentage of net assets.
The accompanying notes are an integral part of the financial statements.
47
Pacer Trendpilot ® US Mid Cap ETF
SCHEDULE OF INVESTMENTS
April 30, 2020
| | | Shares | | | Value | |
COMMON STOCKS — 0.0% (a) | | | | |
| | | | | | | | | |
Food — 0.0% (a) | | | | |
Tootsie Roll Industries, Inc. (b) | | | 190 | | | $ | 6,676 | |
TOTAL COMMON STOCKS (Cost $6,457) | | | | | | | 6,676 | |
| | | Principal
Amount | | | | | |
SHORT-TERM INVESTMENTS — 100.1% | | | | |
| | | | | | | | | |
Money Market Deposit Accounts, — 3.8% | | | | |
U.S. Bank Money Market Deposit Account 0.20% (c) | | $ | 20,298,720 | | | | 20,298,720 | |
| | | | | |
U.S. Treasury Bills — 96.3% | | | | |
0.000% 06/04/2020 (b) | | | 520,000,000 | | | | 519,959,482 | |
TOTAL SHORT-TERM INVESTMENTS (Cost $539,994,231) | | | | | | | 540,258,202 | |
| | | Shares | | | Value | |
INVESTMENTS PURCHASED WITH PROCEEDS FROM SECURITIES LENDING — 30.1% | | | | |
Mount Vernon Liquid Assets Portfolio, LLC, 0.48% (c) | | | 162,796,536 | | | $ | 162,796,536 | |
TOTAL INVESTMENTS PURCHASED WITH PROCEEDS FROM SECURITIES LENDING (Cost $162,796,536) | | | | | | | | |
Total Investments (Cost $702,797,224) — 130.2% | | | | | | | 703,061,414 | |
Liabilities in Excess of Other Assets — (30.2)% | | | | | | | (163,010,894 | ) |
TOTAL NET ASSETS — 100.0% | | | | | | $ | 540,050,520 | |
Percentages are stated as a percent of net assets.
| | (b) | All or a portion of this security is on loan as of April 30, 2020. The total value of securities on loan is $159,590,062 or 29.6% of net assets. |
| | (c) | The rate shown is as of April 30, 2020. |
For Fund compliance purposes, the Fund’s industry classifications refer to any one or more of the industry sub-classifications used by one or more widely recognized market indexes or ratings group indexes, and/or they may be defined by Fund management. This definition does not apply for all purposes of this report, which may combine sub-classifications for reporting ease. Categories are shown as a percentage of net assets.
The accompanying notes are an integral part of the financial statements.
48
Pacer Trendpilot ® 100 ETF
SCHEDULE OF INVESTMENTS
April 30, 2020
| | | Shares | | | Value | |
COMMON STOCKS — 100.1% | | | | |
| | | | | | | | | |
Administrative and Support and Waste Management and Remediation Services — 0.2% | | | | |
Trip.com Group Ltd. - ADR (a) | | | 42,657 | | | $ | 1,098,844 | |
| | | | | | | | | |
Airlines — 0.1% | | | | |
American Airlines Group, Inc. (b) | | | 35,730 | | | | 429,117 | |
United Airlines Holdings, Inc. (a)(b) | | | 20,638 | | | | 610,472 | |
| | | | | | | | 1,039,589 | |
Auto Manufacturers — 1.8% | | | | |
PACCAR, Inc. (b) | | | 28,211 | | | | 1,953,047 | |
Tesla Motors, Inc. (a)(b) | | | 14,701 | | | | 11,494,418 | |
| | | | | | | | 13,447,465 | |
Beverages — 2.4% | | | | |
Monster Beverage Corp. (a) | | | 43,856 | | | | 2,710,739 | |
PepsiCo, Inc. | | | 113,738 | | | | 15,046,400 | |
| | | | | | | | 17,757,139 | |
Biotechnology — 6.1% | | | | |
Alexion Pharmaceuticals, Inc. (a) | | | 18,049 | | | | 1,939,726 | |
Amgen, Inc. | | | 48,465 | | | | 11,593,797 | |
Biogen, Inc. (a) | | | 14,717 | | | | 4,368,447 | |
BioMarin Pharmaceutical, Inc. (a)(b) | | | 14,650 | | | | 1,348,093 | |
Gilead Sciences, Inc. | | | 103,193 | | | | 8,668,212 | |
Illumina, Inc. (a)(b) | | | 11,989 | | | | 3,824,851 | |
Incyte Corp. (a) | | | 17,569 | | | | 1,715,789 | |
Regeneron Pharmaceuticals, Inc. (a) | | | 8,804 | | | | 4,629,847 | |
Seattle Genetics, Inc. (a) | | | 13,978 | | | | 1,918,201 | |
Vertex Pharmaceuticals, Inc. (a) | | | 20,973 | | | | 5,268,418 | |
| | | | | | | | 45,275,381 | |
Commercial Services — 3.1% | | | | |
Automatic Data Processing, Inc. | | | 35,293 | | | | 5,177,130 | |
Cintas Corp. (b) | | | 8,441 | | | | 1,872,467 | |
CoStar Group, Inc. (a)(b) | | | 2,987 | | | | 1,936,353 | |
PayPal Holdings, Inc. (a) | | | 95,774 | | | | 11,780,202 | |
Verisk Analytics, Inc. | | | 13,366 | | | | 2,042,726 | |
| | | | | | | | 22,808,878 | |
Computers — 12.0% | | | | |
Apple, Inc. | | | 282,918 | | | | 83,121,308 | |
Check Point Software Technologies Ltd. (a)(b) | | | 12,416 | | | | 1,312,868 | |
Cognizant Technology Solutions Corp. - Class A | | | 44,662 | | | | 2,591,289 | |
NetApp, Inc. (b) | | | 18,614 | | | | 814,735 | |
Western Digital Corp. (b) | | | 24,258 | | | | 1,117,809 | |
| | | | | | | | 88,958,009 | |
Distribution/Wholesale — 0.4% | | | | |
Copart, Inc. (a) | | | 18,959 | | | | 1,518,806 | |
Fastenal Co. (b) | | | 46,779 | | | | 1,694,335 | |
| | | | | | | | 3,213,141 | |
| | | Shares | | | Value | |
Electric — 0.8% | | | | |
Exelon Corp. | | | 79,291 | | | $ | 2,940,110 | |
Xcel Energy, Inc. | | | 43,739 | | | | 2,780,051 | |
| | | | | | | | 5,720,161 | |
Food — 1.2% | | | | |
Mondelez International, Inc. - Class A (b) | | | 117,442 | | | | 6,041,216 | |
The Kraft Heinz Co. | | | 99,606 | | | | 3,021,050 | |
| | | | | | | | 9,062,266 | |
Healthcare-Products — 1.1% | | | | |
Align Technology, Inc. (a)(b) | | | 6,428 | | | | 1,381,056 | |
IDEXX Laboratories, Inc. (a)(b) | | | 6,995 | | | | 1,941,812 | |
Intuitive Surgical, Inc. (a)(b) | | | 9,427 | | | | 4,816,065 | |
| | | | | | | | 8,138,933 | |
Insurance — 0.3% | | | | |
Willis Towers Watson PLC | | | 10,486 | | | | 1,869,549 | |
| | | | | | | | | |
Internet — 27.4% | | | | |
Alphabet, Inc. - Class A (a) | | | 21,713 | | | | 29,240,897 | |
Alphabet, Inc. - Class C (a) | | | 21,473 | | | | 28,959,776 | |
Amazon.com, Inc. (a) | | | 31,634 | | | | 78,262,516 | |
BAIDU, Inc. - ADR (a) | | | 22,551 | | | | 2,276,072 | |
Booking Holdings, Inc. (a) | | | 3,413 | | | | 5,053,185 | |
CDW Corp. (b) | | | 11,720 | | | | 1,298,576 | |
eBay, Inc. | | | 66,357 | | | | 2,642,999 | |
Expedia Group, Inc. | | | 11,367 | | | | 806,830 | |
Facebook, Inc. - Class A (a) | | | 153,677 | | | | 31,459,219 | |
JD.com, Inc. - ADR (a) | | | 75,605 | | | | 3,258,576 | |
MercadoLibre, Inc. (a)(b) | | | 4,054 | | | | 2,365,550 | |
Netflix, Inc. (a) | | | 35,746 | | | | 15,007,958 | |
VeriSign, Inc. (a) | | | 9,576 | | | | 2,006,076 | |
| | | | | | | | 202,638,230 | |
Lodging — 0.3% | | | | |
Marriott International, Inc. - Class A (b) | | | 26,667 | | | | 2,425,097 | |
| | | | | | | | | |
Media — 3.7% | | | | |
Charter Communications, Inc. - Class A (a)(b) | | | 17,517 | | | | 8,674,944 | |
Comcast Corp. - Class A | | | 370,298 | | | | 13,934,314 | |
FOX Corp. - Class A (b) | | | 28,916 | | | | 748,057 | |
FOX Corp. - Class B | | | 21,710 | | | | 554,908 | |
Liberty Global PLC - Class A (a)(b) | | | 14,804 | | | | 287,494 | |
Liberty Global PLC - Class C (a)(b) | | | 35,789 | | | | 655,296 | |
Sirius XM Holdings, Inc. (b) | | | 360,830 | | | | 2,132,505 | |
| | | | | | | | 26,987,518 | |
Retail — 4.3% | | | | |
Costco Wholesale Corp. | | | 36,034 | | | | 10,918,302 | |
Dollar Tree, Inc. (a) | | | 19,303 | | | | 1,537,870 | |
Lululemon Athletica, Inc. (a)(b) | | | 10,043 | | | | 2,244,410 | |
The accompanying notes are an integral part of the financial statements.
49
Pacer Trendpilot ® 100 ETF
SCHEDULE OF INVESTMENTS
April 30, 2020 (Continued)
| | | Shares | | | Value | |
COMMON STOCKS — 100.1% (Continued) | | | | |
| | | | | | | | | |
Retail — 4.3% (Continued) | | | | | | | | |
O’Reilly Automotive, Inc. (a) | | | 6,170 | | | $ | 2,383,718 | |
Ross Stores, Inc. | | | 29,504 | | | | 2,695,485 | |
Starbucks Corp. (b) | | | 96,330 | | | | 7,391,401 | |
Ulta Salon Cosmetics & Fragrance, Inc. (a)(b) | | | 4,800 | | | | 1,046,016 | |
Walgreens Boots Alliance, Inc. (b) | | | 72,801 | | | | 3,151,555 | |
| | | | | | | | 31,368,757 | |
Semiconductors — 12.5% | | | | |
Advanced Micro Devices, Inc. (a)(b) | | | 90,834 | | | | 4,758,793 | |
Analog Devices, Inc. | | | 30,041 | | | | 3,292,494 | |
Applied Materials, Inc. | | | 75,348 | | | | 3,743,289 | |
ASML Holding NV - ADR (b) | | | 6,040 | | | | 1,742,117 | |
Broadcom, Inc. | | | 32,353 | | | | 8,787,722 | |
Intel Corp. | | | 354,815 | | | | 21,281,804 | |
KLA Corp. (b) | | | 12,871 | | | | 2,112,002 | |
Lam Research Corp. | | | 11,833 | | | | 3,020,728 | |
Maxim Integrated Products, Inc. | | | 22,072 | | | | 1,213,519 | |
Microchip Technology, Inc. (b) | | | 19,491 | | | | 1,709,945 | |
Micron Technology, Inc. (a)(b) | | | 90,297 | | | | 4,324,323 | |
NVIDIA Corp. | | | 49,921 | | | | 14,590,910 | |
NXP Semiconductors NV (b) | | | 22,799 | | | | 2,270,096 | |
QUALCOMM, Inc. | | | 93,135 | | | | 7,326,931 | |
Skyworks Solutions, Inc. (b) | | | 13,896 | | | | 1,443,517 | |
Texas Instruments, Inc. (b) | | | 76,246 | | | | 8,849,873 | |
Xilinx, Inc. (b) | | | 20,510 | | | | 1,792,574 | |
| | | | | | | | 92,260,637 | |
Software — 19.0% | | | | |
Activision Blizzard, Inc. | | | 62,663 | | | | 3,993,513 | |
Adobe Systems, Inc. (a) | | | 39,484 | | | | 13,963,122 | |
ANSYS, Inc. (a)(b) | | | 6,866 | | | | 1,797,725 | |
Autodesk, Inc. (a) | | | 17,909 | | | | 3,351,311 | |
Cadence Design System, Inc. (a) | | | 22,886 | | | | 1,856,741 | |
Cerner Corp. (b) | | | 25,619 | | | | 1,777,703 | |
Citrix Systems, Inc. (b) | | | 10,621 | | | | 1,540,151 | |
Electronic Arts, Inc. (a) | | | 23,816 | | | | 2,721,216 | |
Fiserv, Inc. (a) | | | 55,457 | | | | 5,715,399 | |
Intuit, Inc. (b) | | | 21,232 | | | | 5,728,606 | |
Microsoft Corp. | | | 484,929 | | | | 86,904,126 | |
NetEase, Inc. - ADR | | | 5,950 | | | | 2,052,512 | |
Paychex, Inc. (b) | | | 29,195 | | | | 2,000,441 | |
Splunk, Inc. (a) | | | 12,344 | | | | 1,732,604 | |
Synopsys, Inc. (a)(b) | | | 12,258 | | | | 1,925,977 | |
Take-Two Interactive Software, Inc. (a) | | | 9,244 | | | | 1,118,986 | |
Workday, Inc. - Class A (a) | | | 13,376 | | | | 2,058,566 | |
| | | | | | | | 140,238,699 | |
| | | Shares | | | Value | |
Telecommunications — 2.8% | | | | |
Cisco Systems, Inc. | | | 346,029 | | | $ | 14,664,709 | |
T-Mobile US, Inc. (a)(b) | | | 69,785 | | | | 6,127,123 | |
| | | | | | | | 20,791,832 | |
Transportation — 0.6% | | | | |
CSX Corp. | | | 63,812 | | | | 4,226,269 | |
TOTAL COMMON STOCKS (Cost $644,807,420) | | | | | | | 739,326,394 | |
| | | Principal
Amount | | | | | |
SHORT-TERM INVESTMENTS — 0.0% (c) | | | | |
| | | | | | | | | |
Money Market Deposit Accounts, — 0.0% (c) | | | | |
U.S. Bank Money Market Deposit Account, 0.20% (d) | | $ | 209,575 | | | | 209,575 | |
TOTAL SHORT-TERM INVESTMENTS (Cost $209,575) | | | | | | | 209,575 | |
| | | | | |
INVESTMENTS PURCHASED WITH PROCEEDS FROM SECURITIES LENDING — 13.4% | | | | |
Mount Vernon Liquid Assets Portfolio, LLC, 0.48% (d) | | | 99,368,834 | | | | 99,368,834 | |
TOTAL INVESTMENTS PURCHASED WITH PROCEEDS FROM SECURITIES LENDING (Cost $99,368,834) | | | | | | | 99,368,834 | |
Total Investments (Cost $744,385,829) — 113.5% | | | | | | | 838,904,803 | |
Liabilities in Excess of Other Assets — (13.5)% | | | | | | | (99,647,019 | ) |
TOTAL NET ASSETS — 100.0% | | | | | | $ | 739,257,784 | |
Percentages are stated as a percent of net assets.
ADR American Depositary Receipt
| | (a) | Non-income producing security. |
| | (b) | All or a portion of this security is on loan as of April 30, 2020. The total value of securities on loan is $95,098,293 or 12.9% of net assets. |
| | (d) | The rate shown is as of April 30, 2020. |
For Fund compliance purposes, the Fund’s industry classifications refer to any one or more of the industry sub-classifications used by one or more widely recognized market indexes or ratings group indexes, and/or they may be defined by Fund management. This definition does not apply for all purposes of this report, which may combine sub-classifications for reporting ease. Categories are shown as a percentage of net assets.
The accompanying notes are an integral part of the financial statements.
50
Pacer Trendpilot ® European Index ETF
SCHEDULE OF INVESTMENTS
April 30, 2020
| | | Shares | | | Value | |
COMMON STOCKS — 0.0% (a) | | | | |
| | | | | | | | | |
Engineering & Construction — 0.0% (a) | | | | |
ACS Actividades de Construccion y Servicios SA | | | 92 | | | $ | 2,295 | |
| | | | | | | | | |
Retail — 0.0% (a) | | | | |
FF Group (b)(e) | | | 1,259 | | | | 6,622 | |
TOTAL COMMON STOCKS (Cost $26,935) | | | | | | | 8,917 | |
| | | Principal
Amount | | | | | |
SHORT-TERM INVESTMENTS — 99.5% | | | | |
| | | | | | | | | |
Money Market Deposit Accounts, — 7.7% | | | | |
U.S. Bank Money Market Deposit Account, 0.20% (c) | | $ | 7,001,125 | | | | 7,001,125 | |
| | | | | |
| | | | | |
U.S. Treasury Bills — 91.8% | | | | |
0.00% 5/21/20 (d) | | | 36,000,000 | | | | 35,998,500 | |
0.00% 6/04/20 (d) | | | 48,000,000 | | | | 47,996,260 | |
| | | | | | | | 83,994,760 | |
TOTAL SHORT-TERM INVESTMENTS (Cost $90,966,244) | | | | | | | 90,995,885 | |
| | | Shares | | | Value | |
INVESTMENTS PURCHASED WITH PROCEEDS FROM SECURITIES LENDING — 29.4% | | | | |
Mount Vernon Liquid Assets Portfolio, LLC, 0.48% (c) | | | 26,928,000 | | | $ | 26,928,000 | |
TOTAL INVESTMENTS PURCHASED WITH PROCEEDS FROM SECURITIES LENDING (Cost $26,928,000) | | | | | | | 26,928,000 | |
Total Investments (Cost $117,921,179) — 128.9% | | | | | | | 117,932,802 | |
Liabilities in Excess of Other Assets — (28.9)% | | | | | | | (26,445,129 | ) |
TOTAL NET ASSETS — 100.0% | | | | | | $ | 91,487,673 | |
Percentages are stated as a percent of net assets.
| | (b) | As of April 30, 2020, the Fund has fair valued this security. This security is deemed illiquid according to the Fund’s liquidity guidelines. Value determined using significant unobservable inputs. |
| | (c) | The rate shown is as of April 30, 2020. |
| | (d) | All or a portion of this security is on loan as of April 30, 2020. The total value of securities on loan is $26,397,624 or 28.9% of net assets. |
| | (e) | Non-Income producing security. |
For Fund compliance purposes, the Fund’s industry classifications refer to any one or more of the industry sub-classifications used by one or more widely recognized market indexes or ratings group indexes, and/or they may be defined by Fund management. This definition does not apply for all purposes of this report, which may combine sub-classifications for reporting ease. Categories are shown as a percentage of net assets.
The following is a reconciliation of investments in which significant unobservable inputs (Level 3) were used in determining fair value:
| | Balance
as of
04/30/2019 | Net
Realized
Gain
(Loss) | Change in Net
Unrealized
Appreciation
(Depreciation) | Purchases | Sales | Transfers
Into
Level 3 | Transfers
Out of
Level 3 | Balance as of
04/30/2020 |
Common Stocks | $ 6,778 | $ — | $ (156) | $ — | $ — | $ — | $ — | $ 6,622 |
The following is a summary of quantitative information about Level 3 Fair Value Measurements:
| | Fair Value as
of 04/30/2020 | | | Valuation
Techniques | | | Unobservable
Input | | | Range/Weighted Average
Unobservable Input* | |
Common Stocks | | $ | 6,622 | | | | Last Trade Price | | | | Stale Data | | | | 5.26 EUR | |
* | Table presents information for one security, which has been valued at 5.26 EUR throughout the period. |
For the period ended April 30, 2020, the Fund did not recognize any transfers to or from Level 3.
The accompanying notes are an integral part of the financial statements.
51
Pacer Global Cash Cows Dividend ETF
SCHEDULE OF INVESTMENTS
April 30, 2020
| | | Shares | | | Value | |
COMMON STOCKS — 96.5% | | | | |
| | | | | | | | | |
Australia — 7.1% | | | | |
AGL Energy Ltd. | | | 44,068 | | | $ | 487,038 | |
Alumina Ltd. | | | 365,210 | | | | 412,910 | |
Aurizon Holdings Ltd. | | | 101,750 | | | | 310,972 | |
Bhp Billiton Ltd - ADR (a) | | | 60,393 | | | | 2,456,787 | |
Boral Ltd. | | | 80,632 | | | | 158,682 | |
CIMIC Group Ltd. | | | 17,381 | | | | 279,080 | |
Coca-Cola Amatil Ltd. | | | 37,364 | | | | 211,342 | |
Fortescue Metals Group Ltd. | | | 400,834 | | | | 3,123,986 | |
GPT Group | | | 99,605 | | | | 274,558 | |
Scentre Group | | | 347,561 | | | | 527,716 | |
South32 Ltd. | | | 235,520 | | | | 304,650 | |
Tabcorp Holdings Ltd. | | | 116,875 | | | | 245,240 | |
Woodside Petroleum Ltd. | | | 57,244 | | | | 837,451 | |
| | | | | | | | 9,630,412 | |
Austria — 0.3% | | | | |
OMV AG | | | 13,500 | | | | 442,342 | |
| | | | | | | | | |
Bermuda — 0.9% | | | | |
CK Infrastructure Holdings Ltd. | | | 122,755 | | | | 731,542 | |
Dairy Farm International Holdings Ltd. | | | 55,605 | | | | 266,348 | |
NWS Holdings Ltd. | | | 241,478 | | | | 251,679 | |
| | | | | | | | 1,249,569 | |
Canada — 2.4% | | | | |
BCE, Inc. | | | 51,707 | | | | 2,091,031 | |
Suncor Energy, Inc. | | | 64,658 | | | | 1,154,145 | |
| | | | | | | | 3,245,176 | |
Cayman Islands — 1.3% | | | | |
Chow Tai Fook Jewellery Group Ltd. | | | 941,522 | | | | 803,982 | |
Tingyi Cayman Islands Holding Corp. | | | 235,351 | | | | 416,513 | |
Wynn Macau Ltd. | | | 270,337 | | | | 474,245 | |
| | | | | | | | 1,694,740 | |
Finland — 1.2% | | | | |
Fortum OYJ | | | 51,664 | | | | 857,736 | |
UPM-Kymmene OYJ | | | 26,502 | | | | 733,609 | |
| | | | | | | | 1,591,345 | |
France — 3.4% | | | | |
Cie de Saint-Gobain | | | 23,151 | | | | 614,211 | |
Peugeot SA | | | 37,985 | | | | 544,260 | |
Publicis Groupe SA | | | 14,267 | | | | 424,165 | |
TOTAL SA - ADR | | | 66,052 | | | | 2,321,728 | |
Unibail-Rodamco-Westfield | | | 12,592 | | | | 741,282 | |
| | | | | | | | 4,645,646 | |
Germany — 5.4% | | | | |
Bayer AG | | | 42,202 | | | | 2,781,310 | |
Continental AG | | | 9,897 | | | | 837,286 | |
Deutsche Telekom AG | | | 209,893 | | | | 3,064,912 | |
| | | Shares | | | Value | |
Germany — 5.4% (Continued) | | | | | | | | |
Evonik Industries AG | | | 23,264 | | | $ | 572,594 | |
| | | | | | | | 7,256,102 | |
Hong Kong — 2.7% | | | | |
Lenovo Group Ltd. | | | 717,776 | | | | 390,715 | |
Power Assets Holdings Ltd. | | | 116,050 | | | | 776,162 | |
Sands China Ltd. | | | 433,787 | | | | 1,784,947 | |
Swire Pacific Ltd. - Class A | | | 75,878 | | | | 498,186 | |
Xinyi Glass Holdings Ltd. | | | 233,975 | | | | 271,927 | |
| | | | | | | | 3,721,937 | |
Israel — 0.2% | | | | |
Israel Chemicals Ltd. | | | 68,140 | | | | 237,884 | |
| | | | | | | | | |
Italy — 2.0% | | | | |
Atlantia SpA | | | 41,340 | | | | 672,971 | |
Eni SpA | | | 219,561 | | | | 2,096,648 | |
| | | | | | | | 2,769,619 | |
Japan — 11.7% | | | | |
Canon, Inc. | | | 63,427 | | | | 1,350,221 | |
JXTG Holdings, Inc. | | | 157,671 | | | | 562,276 | |
Marubeni Corp. | | | 81,928 | | | | 400,040 | |
Mitsubishi Chemical Holdings Corp. | | | 78,256 | | | | 450,219 | |
Mitsubishi Corp. | | | 74,255 | | | | 1,591,450 | |
Mitsui & Co. Ltd. | | | 80,011 | | | | 1,128,795 | |
Nippon Telegraph & Telephone Corp. | | | 137,559 | | | | 3,131,497 | |
NTT DOCOMO, Inc. | | | 123,938 | | | | 3,635,623 | |
Softbank Corp. | | | 259,706 | | | | 3,542,931 | |
| | | | | | | | 15,793,052 | |
Jersey — 0.4% | | | | |
WPP PLC - ADR (a) | | | 15,494 | | | | 599,773 | |
| | | | | | | | | |
Luxembourg — 0.2% | | | | |
Tenaris SA - ADR | | | 24,282 | | | | 332,178 | |
| | | | | | | | | |
Netherlands — 1.0% | | | | |
Koninklijke Ahold Delhaize NV | | | 54,916 | | | | 1,333,587 | |
| | | | | | | | | |
Netherlands Antilles — 1.0% | | | | |
Schlumberger Ltd. (a) | | | 76,907 | | | | 1,293,576 | |
| | | | | | | | | |
New Zealand — 0.2% | | | | |
Spark New Zealand Ltd. | | | 120,721 | | | | 328,811 | |
| | | | | | | | | |
Norway — 1.7% | | | | |
Equinor ASA - ADR (a) | | | 172,593 | | | | 2,343,813 | |
| | | | | | | | | |
Portugal — 0.4% | | | | |
Galp Energia SGPS SA | | | 41,707 | | | | 480,586 | |
The accompanying notes are an integral part of the financial statements.
52
Pacer Global Cash Cows Dividend ETF
SCHEDULE OF INVESTMENTS
April 30, 2020 (Continued)
| | | Shares | | | Value | |
COMMON STOCKS — 96.5% (Continued) | | | | |
| | | | | | | | | |
Republic of Korea — 0.5% | | | | |
POSCO - ADR | | | 16,830 | | | $ | 626,244 | |
| | | | | | | | | |
Singapore — 1.8% | | | | |
Genting Singapore Ltd. | | | 528,883 | | | | 294,418 | |
Jardine Cycle & Carriage Ltd. | | | 17,272 | | | | 246,314 | |
Singapore Telecommunications Ltd. | | | 945,668 | | | | 1,897,841 | |
| | | | | | | | 2,438,573 | |
South Korea — 0.4% | | | | |
KT&G Corp. | | | 7,467 | | | | 497,003 | |
| | | | | | | | | |
Spain — 2.5% | | | | |
Endesa SA | | | 54,498 | | | | 1,209,368 | |
Repsol SA | | | 94,707 | | | | 862,869 | |
Telefonica SA - ADR (a) | | | 291,302 | | | | 1,328,337 | |
| | | | | | | | 3,400,574 | |
Sweden — 1.8% | | | | |
Hennes & Mauritz AB - Class B | | | 101,207 | | | | 1,412,958 | |
Telia Co. AB | | | 289,488 | | | | 1,001,488 | |
| | | | | | | | 2,414,446 | |
Switzerland — 3.6% | | | | |
Glencore PLC | | | 993,404 | | | | 1,840,494 | |
Kuehne + Nagel International AG | | | 4,908 | | | �� | 701,942 | |
LafargeHolcim Ltd. | | | 25,595 | | | | 1,061,719 | |
Swisscom AG (a) | | | 2,481 | | | | 1,289,786 | |
| | | | | | | | 4,893,941 | |
United Kingdom — 14.9% | | | | |
Anglo American PLC | | | 58,441 | | | | 1,041,673 | |
BAE Systems PLC | | | 138,316 | | | | 885,674 | |
BP PLC - ADR (a) | | | 95,680 | | | | 2,277,184 | |
British American Tobacco PLC - ADR (a) | | | 76,787 | | | | 2,929,424 | |
Fiat Chrysler Automobiles NV | | | 86,123 | | | | 756,536 | |
GlaxoSmithKline PLC - ADR (a) | | | 72,313 | | | | 3,042,208 | |
Imperial Brands PLC | | | 126,153 | | | | 2,667,744 | |
Rio Tinto PLC - ADR | | | 57,401 | | | | 2,651,352 | |
Royal Dutch Shell PLC - Class B - ADR | | | 60,282 | | | | 1,927,216 | |
Vodafone Group PLC - ADR | | | 146,384 | | | | 2,069,870 | |
| | | | | | | | 20,248,881 | |
United States — 27.5% | | | | |
AbbVie, Inc. (a) | | | 38,221 | | | | 3,141,766 | |
Altria Group, Inc. | | | 67,699 | | | | 2,657,186 | |
AT&T, Inc. (a) | | | 86,901 | | | | 2,647,873 | |
Chevron Corp. (a) | | | 28,392 | | | | 2,612,064 | |
DuPont de Nemours, Inc. (a) | | | 39,276 | | | | 1,846,758 | |
Ford Motor Co. (a) | | | 293,963 | | | | 1,496,272 | |
General Mills, Inc. (a) | | | 24,776 | | | | 1,483,835 | |
Gilead Sciences, Inc. (a) | | | 51,721 | | | | 4,344,564 | |
| | | Shares | | | Value | |
United States — 27.5% (Continued) | | | | |
International Business Machines Corp. (a) | | | 25,230 | | | $ | 3,167,879 | |
LyondellBasell Industries NV - Class A | | | 15,690 | | | | 909,235 | |
Pfizer, Inc. | | | 86,756 | | | | 3,327,960 | |
Philip Morris International, Inc. | | | 39,533 | | | | 2,949,162 | |
The Kraft Heinz Co. | | | 78,334 | | | | 2,375,870 | |
Valero Energy Corp. (a) | | | 16,725 | | | | 1,059,529 | |
Verizon Communications, Inc. | | | 55,425 | | | | 3,184,166 | |
| | | | | | | | 37,204,119 | |
TOTAL COMMON STOCKS (Cost $167,088,975) | | | | | | | 130,713,929 | |
| | | | | |
REAL ESTATE INVESTMENT TRUSTS — 2.3% | | | | |
| | | | | | | | | |
Australia — 0.2% | | | | |
Vicinity Centres | | | 272,843 | | | | 264,919 | |
| | | | | | | | | |
Hong Kong — 0.2% | | | | |
Champion REIT | | | 361,207 | | | | 213,393 | |
| | | | | | | | | |
United States — 2.0% | | | | |
Public Storage (a) | | | 7,352 | | | | 1,363,428 | |
Simon Property Group, Inc. (a) | | | 19,156 | | | | 1,279,046 | |
| | | | | | | | 2,642,474 | |
TOTAL REAL ESTATE INVESTMENT TRUSTS (Cost $5,518,682) | | | | | | | 3,120,786 | |
| | | Principal
Amount | | | | | |
SHORT-TERM INVESTMENTS — 0.1% | | | | |
| | | | | | | | | |
Money Market Deposit Accounts, — 0.1% | | | | |
U.S. Bank Money Market Deposit Account, 0.20% (b) | | $ | 173,418 | | | | 173,418 | |
TOTAL SHORT-TERM INVESTMENTS (Cost $173,418) | | | | | | | 173,418 | |
The accompanying notes are an integral part of the financial statements.
53
Pacer Global Cash Cows Dividend ETF
SCHEDULE OF INVESTMENTS
April 30, 2020 (Continued)
| | | Shares | | | Value | |
INVESTMENTS PURCHASED WITH PROCEEDS FROM SECURITIES LENDING — 26.4% | | | | |
Mount Vernon Liquid Assets Portfolio, LLC, 0.48% (b) | | | 35,692,945 | | | $ | 35,692,945 | |
TOTAL INVESTMENTS PURCHASED WITH PROCEEDS FROM SECURITIES LENDING (Cost $35,692,945) | | | | | | | 35,692,945 | |
Total Investments (Cost $208,474,020) — 125.3% | | | | | | | 169,701,078 | |
Liabilities in Excess of Other Assets — (25.3)% | | | | | | | (34,221,432 | ) |
TOTAL NET ASSETS — 100.0% | | | | | | $ | 135,479,646 | |
Percentages are stated as a percent of net assets.
ADR American Depositary Receipt
| | (a) | All or a portion of this security is on loan as of April 30, 2020. The total value of securities on loan is $33,833,161 or 25.0% of net assets. |
| | (b) | The rate shown is as of April 30, 2020. |
For Fund compliance purposes, the Fund’s industry classifications refer to any one or more of the industry sub-classifications used by one or more widely recognized market indexes or ratings group indexes, and/or they may be defined by Fund management. This definition does not apply for all purposes of this report, which may combine sub-classifications for reporting ease. Categories are shown as a percentage of net assets.
The accompanying notes are an integral part of the financial statements.
54
Pacer US Cash Cows 100 ETF
SCHEDULE OF INVESTMENTS
April 30, 2020
| | | Shares | | | Value | |
COMMON STOCKS — 99.3% | | | | |
| | | | | | | | | |
Advertising — 2.5% | | | | |
Interpublic Group of Cos., Inc. (a) | | | 120,114 | | | $ | 2,039,536 | |
Omnicom Group, Inc. (a) | | | 48,621 | | | | 2,772,855 | |
| | | | | | | | 4,812,391 | |
Aerospace/Defense — 0.3% | | | | |
Spirit AeroSystems Holdings, Inc. - Class A | | | 26,379 | | | | 584,559 | |
| | | | | | | | | |
Agriculture — 2.0% | | | | |
Altria Group, Inc. | | | 97,197 | | | | 3,814,982 | |
| | | | | | | | | |
Airlines — 5.0% | | | | |
Alaska Air Group, Inc. | | | 41,073 | | | | 1,335,694 | |
Copa Holdings SA - Class A | | | 15,983 | | | | 706,608 | |
Delta Air Lines, Inc. | | | 88,570 | | | | 2,294,849 | |
Southwest Airlines Co. (a) | | | 89,574 | | | | 2,799,187 | |
United Airlines Holdings, Inc. (a)(b) | | | 78,608 | | | | 2,325,225 | |
| | | | | | | | 9,461,563 | |
Apparel — 0.6% | | | | |
Hanesbrands, Inc. (a) | | | 105,752 | | | | 1,051,175 | |
| | | | | | | | | |
Auto Parts & Equipment — 1.7% | | | | |
Allison Transmission Holdings, Inc. | | | 31,639 | | | | 1,149,761 | |
BorgWarner, Inc. (a) | | | 33,035 | | | | 943,810 | |
LEAR Corp. | | | 12,009 | | | | 1,172,679 | |
| | | | | | | | 3,266,250 | |
Biotechnology — 7.1% | | | | |
Alexion Pharmaceuticals, Inc. (b) | | | 38,101 | | | | 4,094,715 | |
Biogen, Inc. (a)(b) | | | 12,980 | | | | 3,852,853 | |
Exelixis, Inc. (b) | | | 49,891 | | | | 1,232,058 | |
Gilead Sciences, Inc. | | | 51,063 | | | | 4,289,292 | |
| | | | | | | | 13,468,918 | |
Building Materials — 0.5% | | | | |
Owens Corning | | | 20,995 | | | | 910,343 | |
| | | | | | | | | |
Chemicals — 5.6% | | | | |
Cabot Corp. | | | 13,791 | | | | 467,377 | |
Celanese Corp. (a) | | | 21,264 | | | | 1,766,401 | |
CF Industries Holdings, Inc. (a) | | | 54,089 | | | | 1,487,448 | |
Dow, Inc. (a) | | | 105,586 | | | | 3,873,950 | |
Eastman Chemical Co. (a) | | | 34,291 | | | | 2,074,948 | |
Huntsman Corp. | | | 63,094 | | | | 1,060,610 | |
| | | | | | | | 10,730,734 | |
Commercial Services — 2.1% | | | | |
Grand Canyon Education, Inc. (b) | | | 6,129 | | | | 527,217 | |
H&R Block, Inc. | | | 42,891 | | | | 714,135 | |
ManpowerGroup, Inc. (a) | | | 18,900 | | | | 1,403,136 | |
Robert Half International, Inc. (a) | | | 16,974 | | | | 802,361 | |
| | | Shares | | | Value | |
Commercial Services — 2.1% (Continued) | | | | |
Sabre Corp. | | | 83,109 | | | $ | 604,202 | |
| | | | | | | | 4,051,051 | |
Computers — 11.6% | | | | |
CACI International, Inc. - Class A (b) | | | 4,640 | | | | 1,160,650 | |
Cognizant Technology Solutions Corp. - Class A | | | 66,325 | | | | 3,848,176 | |
Dell Technologies, Inc. - Class C (a)(b) | | | 103,819 | | | | 4,432,033 | |
DXC Technology Co. | | | 216,368 | | | | 3,922,752 | |
HP, Inc. | | | 191,334 | | | | 2,967,590 | |
International Business Machines Corp. (a) | | | 32,117 | | | | 4,032,611 | |
NetApp, Inc. | | | 38,909 | | | | 1,703,047 | |
| | | | | | | | 22,066,859 | |
Electric — 2.7% | | | | |
NRG Energy, Inc. | | | 62,984 | | | | 2,111,854 | |
Vistra Energy Corp. | | | 151,149 | | | | 2,953,451 | |
| | | | | | | | 5,065,305 | |
Electrical Components & Equipment — 0.4% | | | | |
Acuity Brands, Inc. | | | 7,760 | | | | 671,938 | |
| | | | | | | | | |
Electronics — 2.5% | | | | |
ADT, Inc. (a) | | | 345,263 | | | | 1,978,357 | |
Arrow Electronics, Inc. (b) | | | 18,919 | | | | 1,190,384 | |
AVNET, Inc. (a) | | | 51,014 | | | | 1,531,440 | |
| | | | | | | | 4,700,181 | |
Food — 0.3% | | | | |
Sprouts Farmers Market, Inc. (b) | | | 27,305 | | | | 567,398 | |
| | | | | | | | | |
Forest Products & Paper — 2.2% | | | | |
DOMTAR Corp. | | | 11,780 | | | | 275,181 | |
International Paper Co. (a) | | | 114,713 | | | | 3,928,920 | |
| | | | | | | | 4,204,101 | |
Hand/Machine Tools — 0.3% | | | | |
Regal Beloit Corp. | | | 7,518 | | | | 533,853 | |
| | | | | | | | | |
Healthcare-Services — 0.3% | | | | |
MEDNAX, Inc. (b) | | | 35,536 | | | | 515,983 | |
| | | | | | | | | |
Home Builders — 0.7% | | | | |
PulteGroup, Inc. | | | 44,457 | | | | 1,256,799 | |
| | | | | | | | | |
Home Furnishings — 0.5% | | | | |
Leggett & Platt, Inc. | | | 25,156 | | | | 883,730 | |
| | | | | | | | | |
Information — 1.4% | | | | |
NortonLifeLock, Inc. | | | 128,107 | | | | 2,724,836 | |
| | | | | | | | | |
The accompanying notes are an integral part of the financial statements.
55
Pacer US Cash Cows 100 ETF
SCHEDULE OF INVESTMENTS
April 30, 2020 (Continued)
| | | Shares | | | Value | |
COMMON STOCKS — 99.3% (Continued) | | | | |
| | | | | | | | | |
Internet — 4.5% | | | | |
eBay, Inc. | | | 113,083 | | | $ | 4,504,096 | |
Expedia Group, Inc. | | | 31,961 | | | | 2,268,592 | |
F5 Networks, Inc. (b) | | | 9,068 | | | | 1,262,810 | |
TripAdvisor, Inc. (a) | | | 28,050 | | | | 560,158 | |
| | | | | | | | 8,595,656 | |
Iron/Steel — 2.2% | | | | |
Nucor Corp. (a) | | | 61,364 | | | | 2,527,583 | |
Reliance Steel & Aluminum Co. (a) | | | 18,665 | | | | 1,672,011 | |
| | | | | | | | 4,199,594 | |
Machinery-Diversified — 3.7% | | | | |
AGCO Corp. | | | 12,450 | | | | 657,858 | |
CRANE Co. | | | 9,046 | | | | 492,555 | |
Cummins, Inc. | | | 27,650 | | | | 4,520,775 | |
GrafTech International Ltd. (a) | | | 172,870 | | | | 1,403,704 | |
| | | | | | | | 7,074,892 | |
Media — 3.9% | | | | |
AMC Networks, Inc. - Class A (a)(b) | | | 25,965 | | | | 619,265 | |
Discovery, Inc. - Class A (a)(b) | | | 161,858 | | | | 3,628,857 | |
FOX Corp. (a) | | | 124,932 | | | | 3,231,991 | |
| | | | | | | | 7,480,113 | |
Metal Fabricate/Hardware — 0.4% | | | | |
The Timken Co. | | | 17,984 | | | | 675,839 | |
| | | | | | | | | |
Office/Business Equipment — 0.7% | | | | |
Xerox Holdings Corp. | | | 73,341 | | | | 1,341,407 | |
| | | | | | | | | |
Oil & Gas — 6.7% | | | | |
Cabot Oil & Gas Corp. (a) | | | 72,874 | | | | 1,575,536 | |
ConocoPhillips (a) | | | 90,954 | | | | 3,829,163 | |
Helmerich & Payne, Inc. (a) | | | 29,747 | | | | 588,098 | |
HollyFrontier Corp. (a) | | | 79,975 | | | | 2,642,374 | |
Valero Energy Corp. (a) | | | 64,919 | | | | 4,112,619 | |
| | | | | | | | 12,747,790 | |
Oil & Gas Services — 1.5% | | | | |
Schlumberger Ltd. | | | 171,811 | | | | 2,889,861 | |
| | | | | | | | | |
Oil & Gas — 0.3% | | | | |
PBF Energy, Inc. - Class A | | | 50,825 | | | | 579,405 | |
| | | | | | | | | |
Packaging & Containers — 0.8% | | | | |
Packaging Corp. of America (a) | | | 16,031 | | | | 1,549,396 | |
| | | | | | | | | |
| | | Shares | | | Value | |
Pharmaceuticals — 12.0% | | | | |
AbbVie, Inc. | | | 46,358 | | | $ | 3,810,628 | |
Allergan PLC | | | 21,472 | | | | 4,022,564 | |
AmerisourceBergen Corp. | | | 36,550 | | | | 3,277,073 | |
Cardinal Health, Inc. | | | 59,711 | | | | 2,954,500 | |
Jazz Pharmaceuticals PLC (b) | | | 9,070 | | | | 999,968 | |
McKesson Corp. | | | 28,925 | | | | 4,085,656 | |
Mylan NV (a)(b) | | | 165,551 | | | | 2,776,290 | |
Premier, Inc. - Class A (b) | | | 26,898 | | | | 891,938 | |
| | | | | | | | 22,818,617 | |
Retail — 4.2% | | | | |
AutoNation, Inc. (b) | | | 31,765 | | | | 1,182,929 | |
Foot Locker, Inc. (a) | | | 35,563 | | | | 911,480 | |
Kohl’s Corp. (a) | | | 55,157 | | | | 1,018,198 | |
MSC Industrial Direct Co., Inc. - Class A | | | 8,679 | | | | 517,616 | |
Nu Skin Enterprises, Inc. - Class A | | | 8,086 | | | | 236,192 | |
Qurate Retail Group, Inc. QVC Group - Class A (a)(b) | | | 337,754 | | | | 2,720,608 | |
Urban Outfitters, Inc. (a)(b) | | | 24,209 | | | | 419,784 | |
Williams-Sonoma, Inc. (a) | | | 14,497 | | | | 896,494 | |
| | | | | | | | 7,903,301 | |
Semiconductors — 2.2% | | | | |
QUALCOMM, Inc. | | | 52,862 | | | | 4,158,654 | |
| | | | | | | | | |
Software — 0.9% | | | | |
Cerence, Inc. (b) | | | 7,370 | | | | 155,949 | |
Take-Two Interactive Software, Inc. (b) | | | 12,843 | | | | 1,554,645 | |
| | | | | | | | 1,710,594 | |
Telecommunications — 3.3% | | | | |
Arista Networks, Inc. (a)(b) | | | 8,985 | | | | 1,970,411 | |
Cisco Systems, Inc. | | | 103,624 | | | | 4,391,585 | |
| | | | | | | | 6,361,996 | |
Textiles — 0.6% | | | | |
Mohawk Industries, Inc. (b) | | | 13,329 | | | | 1,169,220 | |
| | | | | | | | | |
Transportation — 1.1% | | | | |
CH Robinson Worldwide, Inc. (a) | | | 20,948 | | | | 1,485,213 | |
Landstar System, Inc. | | | 5,151 | | | | 532,150 | |
| | | | | | | | 2,017,363 | |
TOTAL COMMON STOCKS (Cost $204,992,894) | | | | | | | 188,616,647 | |
| | | | | |
REAL ESTATE INVESTMENT TRUSTS — 0.6% | | | | |
Apple Hospitality REIT, Inc. (a) | | | 43,095 | | | | 417,159 | |
Corporate Office Properties Trust | | | 25,024 | | | | 661,135 | |
TOTAL REAL ESTATE INVESTMENT TRUSTS (Cost $1,101,776) | | | | | | | 1,078,294 | |
The accompanying notes are an integral part of the financial statements.
56
Pacer US Cash Cows 100 ETF
SCHEDULE OF INVESTMENTS
April 30, 2020 (Continued)
| | | Principal
Amount | | | Value | |
SHORT-TERM INVESTMENTS — 0.1% | | | | |
| | | | | | | | | |
Money Market Deposit Accounts, — 0.1% | | | | |
U.S. Bank Money Market Deposit Account, 0.20% (c) | | $ | 247,294 | | | $ | 247,294 | |
TOTAL SHORT-TERM INVESTMENTS (Cost $247,294) | | | | | | | 247,294 | |
| | | Shares | | | | | |
INVESTMENTS PURCHASED WITH PROCEEDS FROM SECURITIES LENDING — 29.3% | | | | |
Mount Vernon Liquid Assets Portfolio, LLC, 0.48% (c) | | | 55,713,285 | | | $ | 55,713,285 | |
TOTAL INVESTMENTS PURCHASED WITH PROCEEDS FROM SECURITIES LENDING (Cost $55,713,285) | | | | | | | 55,713,285 | |
Total Investments (Cost $262,055,249) — 129.3% | | | | | | | 245,655,520 | |
Liabilities in Excess of Other Assets — (29.3)% | | | | | | | (55,628,679 | ) |
TOTAL NET ASSETS — 100.0% | | | | | | $ | 190,026,841 | |
Percentages are stated as a percent of net assets.
| | (a) | All or a portion of this security is on loan as of April 30, 2020. The total value of securities on loan is $52,125,060 or 27.4% of net assets. |
| | (b) | Non-income producing security. |
| | (c) | The rate shown is as of April 30, 2020. |
For Fund compliance purposes, the Fund’s industry classifications refer to any one or more of the industry sub-classifications used by one or more widely recognized market indexes or ratings group indexes, and/or they may be defined by Fund management. This definition does not apply for all purposes of this report, which may combine sub-classifications for reporting ease. Categories are shown as a percentage of net assets.
The accompanying notes are an integral part of the financial statements.
57
Pacer US Small Cap Cash Cows 100 ETF
SCHEDULE OF INVESTMENTS
April 30, 2020
| | | Shares | | | Value | |
COMMON STOCKS — 98.2% | | | | |
| | | | | | | | | |
Accommodation and Food Services — 0.5% | | | | |
Fiesta Restaurant Group, Inc. (a) | | | 9,745 | | | $ | 70,895 | |
| | | | | | | | | |
Apparel — 2.9% | | | | |
Kontoor Brands, Inc. (b) | | | 9,563 | | | | 185,618 | |
Steven Madden Ltd. (b) | | | 9,184 | | | | 230,243 | |
| | | | | | | | 415,861 | |
Auto Manufacturers — 0.8% | | | | |
Wabash National Corp. (b) | | | 14,909 | | | | 122,254 | |
| | | | | | | | | |
Auto Parts & Equipment — 1.4% | | | | |
GARRETT MOTION, Inc. (a) | | | 36,685 | | | | 199,933 | |
| | | | | | | | | |
Biotechnology — 2.4% | | | | |
Innoviva, Inc. (a)(b) | | | 24,192 | | | | 343,043 | |
| | | | | | | | | |
Building Materials — 5.3% | | | | |
American Woodmark Corp. (a) | | | 2,928 | | | | 150,528 | |
Boise Cascade Co. | | | 7,210 | | | | 225,457 | |
Gibraltar Industries, Inc. (a) | | | 3,430 | | | | 158,809 | |
Patrick Industries, Inc. | | | 5,853 | | | | 241,261 | |
| | | | | | | | 776,055 | |
Chemicals — 0.3% | | | | |
Hawkins, Inc. | | | 1,237 | | | | 46,301 | |
| | | | | | | | | |
Coal — 1.7% | | | | |
Warrior Met Coal, Inc. | | | 19,332 | | | | 242,617 | |
| | | | | | | | | |
Commercial Services — 5.1% | | | | |
American Public Education, Inc. (a) | | | 1,654 | | | | 42,624 | |
Heidrick & Struggles International, Inc. | | | 3,953 | | | | 88,705 | |
Kelly Services, Inc. - Class A | | | 9,576 | | | | 147,949 | |
Korn/Ferry International | | | 9,696 | | | | 279,536 | |
Resources Connection, Inc. | | | 6,245 | | | | 67,946 | |
TrueBlue, Inc. (a) | | | 7,399 | | | | 114,906 | |
| | | | | | | | 741,666 | |
Computers — 1.6% | | | | |
TTEC Holdings, Inc. | | | 6,176 | | | | 240,740 | |
| | | | | | | | | |
Distribution/Wholesale — 2.4% | | | | |
G-III Apparel Group Ltd. (a)(b) | | | 10,936 | | | | 123,905 | |
ScanSource, Inc. (a) | | | 8,941 | | | | 231,751 | |
| | | | | | | | 355,656 | |
Educational Services — 0.7% | | | | |
Perdoceo Education Corp. (a) | | | 7,343 | | | | 95,459 | |
| | | | | | | | | |
| | | Shares | | | Value | |
Electrical Components & Equiptment — 1.0% | | | | |
Insteel Industries, Inc. | | | 4,636 | | | $ | 81,455 | |
Powell Industries, Inc. | | | 2,758 | | | | 69,970 | |
| | | | | | | | 151,425 | |
Electronics — 6.3% | | | | |
Benchmark Electronics, Inc. | | | 3,075 | | | | 63,530 | |
Comtech Telecommunications Corp. | | | 5,212 | | | | 96,474 | |
Plexus Corp. (a) | | | 3,193 | | | | 200,169 | |
Sanmina Corp. (a) | | | 12,512 | | | | 346,958 | |
SMART Global Holdings, Inc. (a)(b) | | | 8,093 | | | | 204,672 | |
| | | | | | | | 911,803 | |
Energy-Alternate Sources — 0.2% | | | | |
FutureFuel Corp. | | | 2,662 | | | | 27,632 | |
| | | | | | | | | |
Engineering & Construction — 1.8% | | | | |
Arcosa, Inc. | | | 7,098 | | | | 264,542 | |
| | | | | | | | | |
Food — 1.7% | | | | |
John B Sanfilippo & Son, Inc. | | | 1,245 | | | | 102,252 | |
Seneca Foods Corp. - Class A (a) | | | 3,923 | | | | 141,149 | |
| | | | | | | | 243,401 | |
Forest Products & Paper — 2.4% | | | | |
Mercer International, Inc. | | | 17,489 | | | | 176,289 | |
Schweitzer-Mauduit International, Inc. (b) | | | 5,342 | | | | 172,119 | |
| | | | | | | | 348,408 | |
Healthcare-Products — 0.7% | | | | |
AngioDynamics, Inc. (a) | | | 3,427 | | | | 35,744 | |
Meridian Bioscience, Inc. (a) | | | 5,407 | | | | 64,884 | |
| | | | | | | | 100,628 | |
Home Builders — 3.4% | | | | |
Meritage Homes Corp. (a) | | | 5,609 | | | | 294,809 | |
Winnebago Industries, Inc. (b) | | | 4,481 | | | | 198,822 | |
| | | | | | | | 493,631 | |
Home Furnishings — 1.3% | | | | |
Ethan Allen Interiors, Inc. (b) | | | 5,232 | | | | 59,174 | |
Sleep Number Corp. (a)(b) | | | 4,342 | | | | 129,826 | |
| | | | | | | | 189,000 | |
Household Products/Wares — 2.2% | | | | |
Central Garden & Pet Co. (a) | | | 6,659 | | | | 219,347 | |
Quanex Building Products Corp. | | | 7,972 | | | | 99,411 | |
| | | | | | | | 318,758 | |
Lodging — 0.6% | | | | |
The Marcus Corp. | | | 5,987 | | | | 87,051 | |
| | | | | | | | | |
Machinery-Diversified — 1.5% | | | | |
SPX FLOW, Inc. (a)(b) | | | 6,583 | | | | 214,408 | |
| | | | | | | | | |
Manufacturing — 11.3% | | | | |
DMC Global, Inc. | | | 1,993 | | | | 51,439 | |
Dorian LPG Ltd. (a) | | | 14,744 | | | | 139,921 | |
The accompanying notes are an integral part of the financial statements.
58
Pacer US Small Cap Cash Cows 100 ETF
SCHEDULE OF INVESTMENTS
April 30, 2020 (Continued)
| | | Shares | | | Value | |
COMMON STOCKS — 98.2% (Continued) | | | | |
| | | | | | | | | |
Manufacturing — 11.3% (Continued) | | | | |
Haynes International, Inc. | | | 1,872 | | | $ | 41,371 | |
iRobot Corp. (a)(b) | | | 2,602 | | | | 158,618 | |
Lantheus Holdings, Inc. (a) | | | 5,385 | | | | 70,274 | |
Lydall, Inc. (a) | | | 6,638 | | | | 74,346 | |
Materion Corp. | | | 2,226 | | | | 115,173 | |
Medifast, Inc. | | | 1,293 | | | | 98,113 | |
PH Glatfelter Co. | | | 7,854 | | | | 114,668 | |
Power Integrations, Inc. (b) | | | 2,607 | | | | 266,826 | |
Universal Electronics, Inc. (a) | | | 2,168 | | | | 89,495 | |
Universal Forest Products, Inc. | | | 6,690 | | | | 275,093 | |
US Concrete, Inc. (a) | | | 7,477 | | | | 143,409 | |
| | | | | | | | 1,638,746 | |
Metal Fabricate/Hardware — 3.7% | | | | |
AZZ, Inc. | | | 3,793 | | | | 119,062 | |
Mueller Industries, Inc. | | | 8,498 | | | | 220,098 | |
Olympic Steel, Inc. | | | 14,310 | | | | 135,087 | |
Tredegar Corp. | | | 3,684 | | | | 60,712 | |
| | | | | | | | 534,959 | |
Mining — 1.2% | | | | |
Kaiser Aluminum Corp. (b) | | | 2,441 | | | | 176,313 | |
| | | | | | | | | |
Miscellaneous Manufacturing — 2.4% | | | | |
Myers Industries, Inc. | | | 4,291 | | | | 53,037 | |
Trinseo SA | | | 14,644 | | | | 299,470 | |
| | | | | | | | 352,507 | |
Oil & Gas Services — 0.3% | | | | |
Matrix Service Co. (a) | | | 4,012 | | | | 41,885 | |
| | | | | | | | | |
Oil-Field Services — 0.1% | | | | |
ERA GROUP, Inc. (a) | | | 3,753 | | | | 19,215 | |
| | | | | | | | | |
Pharmaceuticals — 6.5% | | | | |
Anika Therapeutics, Inc. (a) | | | 1,316 | | | | 43,731 | |
Corcept Therapeutics, Inc. (a)(b) | | | 15,067 | | | | 190,748 | |
Eagle Pharmaceuticals, Inc. (a)(b) | | | 1,669 | | | | 85,086 | |
Lannett Co, Inc. (a)(b) | | | 14,352 | | | | 136,918 | |
Supernus Pharmaceuticals, Inc. (a) | | | 10,100 | | | | 236,340 | |
USANA Health Sciences, Inc. (a) | | | 2,114 | | | | 188,611 | |
Vanda Pharmaceuticals, Inc. (a) | | | 5,236 | | | | 60,214 | |
| | | | | | | | 941,648 | |
Professional, Scientific, and Technical Services — 0.5% |
NextGen Healthcare, Inc. (a) | | | 7,490 | | | | 79,019 | |
| | | | | | | | | |
Retail — 15.6% | | | | |
Asbury Automotive Group, Inc. (a) | | | 4,806 | | | | 324,405 | |
Chico’s FAS, Inc. | | | 124,580 | | | | 186,870 | |
Genesco, Inc. (a)(b) | | | 8,109 | | | | 153,503 | |
GMS, Inc. (a) | | | 14,653 | | | | 269,322 | |
| | | Shares | | | Value | |
Retail — 15.6% (Continued) | | | | | | | | |
Haverty Furniture Cos, Inc. | | | 3,760 | | | $ | 50,873 | |
Hibbett Sports, Inc. (a) | | | 6,664 | | | | 102,826 | |
La-Z-Boy, Inc. | | | 6,724 | | | | 157,678 | |
Michaels Cos., Inc. (a)(b) | | | 100,514 | | | | 305,563 | |
PetMed Express, Inc. (b) | | | 1,620 | | | | 64,103 | |
Shoe Carnival, Inc. (b) | | | 4,228 | | | | 99,865 | |
Signet Jewelers Ltd. (b) | | | 18,789 | | | | 189,017 | |
The Buckle, Inc. (b) | | | 9,190 | | | | 140,699 | |
The Cato Corp. - Class A (b) | | | 4,565 | | | | 51,402 | |
Vera Bradley, Inc. (a) | | | 6,636 | | | | 36,564 | |
Zumiez, Inc. (a) | | | 6,468 | | | | 136,734 | |
| | | | | | | | 2,269,424 | |
Semiconductors — 3.6% | | | | |
Rambus, Inc. (a) | | | 15,162 | | | | 189,980 | |
Ultra Clean Holdings, Inc. (a) | | | 6,634 | | | | 121,999 | |
Xperi Corp. | | | 14,007 | | | | 214,027 | |
| | | | | | | | 526,006 | |
Software — 0.4% | | | | |
Computer Programs & Systems, Inc. | | | 2,240 | | | | 53,827 | |
| | | | | | | | | |
Transportation — 1.1% | | | | |
ArcBest Corp. | | | 4,265 | | | | 86,878 | |
Echo Global Logistics, Inc. (a) | | | 4,284 | | | | 75,099 | |
| | | | | | | | 161,977 | |
Transportation and Warehousing — 2.2% | | | | |
Hub Group, Inc. - Class A (a) | | | 4,589 | | | | 220,777 | |
SEACOR Holdings, Inc. (a) | | | 3,486 | | | | 98,514 | |
| | | | | | | | 319,291 | |
Wholesale Trade — 1.1% | | | | |
Foundation Building Materials, Inc. (a) | | | 13,623 | | | | 159,389 | |
TOTAL COMMON STOCKS (Cost $16,873,868) | | | | | | | 14,275,373 | |
| | | | | |
REAL ESTATE INVESTMENT TRUSTS — 1.5% | | | | |
Tanger Factory Outlet Centers, Inc. (b) | | | 29,499 | | | | 221,833 | |
TOTAL REAL ESTATE INVESTMENT TRUSTS (Cost $204,872) | | | | | | | 221,833 | |
| | | Principal
Amount | | | | |
SHORT-TERM INVESTMENTS — 0.2% | | | | |
| | | | | | | | | |
Money Market Deposit Accounts, — 0.2% | | | | |
U.S. Bank Money Market Deposit Account, 0.20% (c) | | $ | 25,861 | | | | 25,861 | |
TOTAL SHORT-TERM INVESTMENTS (Cost $25,861) | | | | | | | 25,861 | |
The accompanying notes are an integral part of the financial statements.
59
Pacer US Small Cap Cash Cows 100 ETF
SCHEDULE OF INVESTMENTS
April 30, 2020 (Continued)
| | | Shares | | | Value | |
INVESTMENTS PURCHASED WITH PROCEEDS FROM SECURITIES LENDING — 25.4% | | | | |
Mount Vernon Liquid Assets Portfolio, LLC, 0.48% (c) | | | 3,692,829 | | | $ | 3,692,829 | |
TOTAL INVESTMENTS PURCHASED WITH PROCEEDS FROM SECURITIES LENDING (Cost $3,692,829) | | | | | | | 3,692,829 | |
| | | | | |
Total Investments (Cost $20,797,430) — 125.3% | | | | | | | 18,215,896 | |
Liabilities in Excess of Other Assets — (25.3)% | | | | | | | (3,681,952 | ) |
TOTAL NET ASSETS — 100.0% | | | | | | $ | 14,533,944 | |
Percentages are stated as a percent of net assets.
| | (a) | Non-income producing security. |
| | (b) | All or a portion of this security is on loan as of April 30, 2020. The total value of securities on loan is $3,451,069 or 23.7% of net assets. |
| | (c) | The rate shown is as of April 30, 2020. |
For Fund compliance purposes, the Fund’s industry classifications refer to any one or more of the industry sub-classifications used by one or more widely recognized market indexes or ratings group indexes, and/or they may be defined by Fund management. This definition does not apply for all purposes of this report, which may combine sub-classifications for reporting ease. Categories are shown as a percentage of net assets.
The accompanying notes are an integral part of the financial statements.
60
Pacer Developed Markets International Cash Cows 100 ETF
SCHEDULE OF INVESTMENTS
April 30, 2020
| | | Shares | | | Value | |
COMMON STOCKS — 96.8% | | | | |
| | | | | | | | | |
Australia — 8.7% | | | | |
Aurizon Holdings Ltd. | | | 20,549 | | | $ | 62,803 | |
BHP Billiton Ltd. - ADR (a) | | | 9,846 | | | | 400,535 | |
BlueScope Steel Ltd. | | | 13,350 | | | | 89,170 | |
Coles Group Ltd. | | | 12,372 | | | | 125,045 | |
Fortescue Metals Group Ltd. | | | 73,155 | | | | 570,149 | |
Newcrest Mining Ltd. | | | 6,699 | | | | 120,223 | |
Qantas Airways Ltd. | | | 17,776 | | | | 44,713 | |
Santos Ltd. | | | 34,755 | | | | 111,881 | |
South32 Ltd. | | | 87,640 | | | | 113,364 | |
Woodside Petroleum Ltd. | | | 13,112 | | | | 191,822 | |
| | | | | | | | 1,829,705 | |
Belgium — 3.5% | | | | |
Galapagos NV - ADR (a)(b) | | | 2,755 | | | | 607,340 | |
Solvay SA | | | 1,502 | | | | 117,259 | |
| | | | | | | | 724,599 | |
Canada — 5.3% | | | | |
Alimentation Couche-Tard, Inc. - Class B | | | 10,428 | | | | 290,976 | |
Canadian Natural Resources Ltd. (a) | | | 14,539 | | | | 243,674 | |
Cenovus Energy, Inc. | | | 21,803 | | | | 79,363 | |
Magna International, Inc. | | | 5,335 | | | | 207,888 | |
Suncor Energy, Inc. (a) | | | 16,753 | | | | 299,041 | |
| | | | | | | | 1,120,942 | |
Denmark — 1.9% | | | | |
AP Moller - Maersk A/S - Class B | | | 296 | | | | 294,294 | |
Pandora A/S | | | 3,187 | | | | 113,219 | |
| | | | | | | | 407,513 | |
Finland — 1.4% | | | | |
Stora Enso OYJ - Class R | | | 8,765 | | | | 103,736 | |
UPM-Kymmene OYJ | | | 6,669 | | | | 184,606 | |
| | | | | | | | 288,342 | |
France — 7.2% | | | | |
Air France-KLM (b) | | | 15,360 | | | | 78,220 | |
Arkema SA | | | 909 | | | | 75,407 | |
Atos SE | | | 1,324 | | | | 94,396 | |
Capgemini SE | | | 1,962 | | | | 184,347 | |
Edenred | | | 2,746 | | | | 110,649 | |
Peugeot SA | | | 22,342 | | | | 320,123 | |
Publicis Groupe SA | | | 6,739 | | | | 200,354 | |
Sodexo SA | | | 1,287 | | | | 102,251 | |
TOTAL SA - ADR (a) | | | 10,057 | | | | 353,504 | |
| | | | | | | | 1,519,251 | |
Germany — 1.1% | | | | |
Covestro AG (c) | | | 1,743 | | | | 58,601 | |
HUGO BOSS AG | | | 1,233 | | | | 34,293 | |
Wirecard AG (a) | | | 1,446 | | | | 143,248 | |
| | | | | | | | 236,142 | |
| | | Shares | | | Value | |
Hong Kong — 1.2% | | | | |
Galaxy Entertainment Group Ltd. | | | 38,770 | | | $ | 252,299 | |
| | | | | | | | | |
Italy — 1.8% | | | | |
Eni SpA | | | 35,060 | | | | 334,797 | |
Saipem SpA (b) | | | 19,361 | | | | 49,669 | |
| | | | | | | | 384,466 | |
Japan — 23.3% | | | | |
Astellas Pharma, Inc. | | | 15,281 | | | | 254,387 | |
Bandai Namco Holdings, Inc. | | | 1,516 | | | | 76,722 | |
FamilyMart UNY Holdings Co Ltd. | | | 15,027 | | | | 256,669 | |
FUJIFILM Holdings Corp. | | | 6,485 | | | | 310,548 | |
ITOCHU Corp. | | | 23,559 | | | | 466,504 | |
Japan Airlines Co. Ltd. | | | 3,350 | | | | 60,560 | |
JXTG Holdings, Inc. | | | 73,553 | | | | 262,300 | |
Marubeni Corp. | | | 47,680 | | | | 232,813 | |
Mitsubishi Chemical Holdings Corp. | | | 39,058 | | | | 224,707 | |
Nexon Co. Ltd. | | | 12,181 | | | | 197,956 | |
Nippon Telegraph & Telephone Corp. | | | 21,861 | | | | 497,660 | |
NTT DOCOMO, Inc. | | | 19,695 | | | | 577,737 | |
Otsuka Holdings Co. Ltd. | | | 4,761 | | | | 188,772 | |
Seven & i Holdings Co. Ltd. | | | 10,426 | | | | 345,185 | |
Shionogi & Co. Ltd. | | | 3,086 | | | | 170,497 | |
Showa Denko KK | | | 5,656 | | | | 125,174 | |
Skylark Holdings Co Ltd. | | | 2,714 | | | | 40,515 | |
Sony Corp. - ADR (a) | | | 7,770 | | | | 499,222 | |
SUMCO Corp. | | | 3,641 | | | | 52,589 | |
Trend Micro, Inc. | | | 951 | | | | 48,474 | |
| | | | | | | | 4,888,991 | |
Jersey — 0.6% | | | | |
WPP PLC - ADR (a) | | | 3,240 | | | | 125,420 | |
| | | | | | | | | |
Luxembourg — 0.5% | | | | |
Tenaris SA - ADR | | | 8,087 | | | | 110,630 | |
| | | | | | | | | |
Netherlands — 2.6% | | | | |
Koninklijke Ahold Delhaize NV | | | 17,359 | | | | 421,548 | |
Randstad Holding NV | | | 3,132 | | | | 125,722 | |
| | | | | | | | 547,270 | |
Norway — 1.8% | | | | |
Equinor ASA - ADR (a) | | | 27,420 | | | | 372,364 | |
| | | | | | | | | |
Republic of Korea — 5.1% | | | | |
Hyundai Mobis Co. Ltd. | | | 1,245 | | | | 175,748 | |
Kakao Corp. | | | 596 | | | | 90,003 | |
POSCO - ADR (a) | | | 8,960 | | | | 333,402 | |
Samsung Electronics Co. Ltd. | | | 11,264 | | | | 462,226 | |
| | | | | | | | 1,061,379 | |
The accompanying notes are an integral part of the financial statements.
61
Pacer Developed Markets International Cash Cows 100 ETF
SCHEDULE OF INVESTMENTS
April 30, 2020 (Continued)
| | | Shares | | | Value | |
COMMON STOCKS — 96.8% (Continued) | | | | |
| | | | | | | | | |
Spain — 5.0% | | | | |
ACS Actividades de Construccion y Servicios SA | | | 5,871 | | | $ | 146,497 | |
Enagas SA | | | 5,502 | | | | 128,366 | |
Endesa SA | | | 12,331 | | | | 273,638 | |
Repsol SA | | | 18,216 | | | | 165,965 | |
Telefonica SA - ADR (a) | | | 74,410 | | | | 339,309 | |
| | | | | | | | 1,053,775 | |
Sweden — 2.3% | | | | |
Sandvik AB (b) | | | 11,251 | | | | 174,491 | |
SKF AB | | | 4,887 | | | | 77,921 | |
Telefonaktiebolaget LM Ericsson - ADR (a) | | | 26,353 | | | | 222,946 | |
| | | | | | | | 475,358 | |
Switzerland — 6.4% | | | | |
Adecco Group AG | | | 1,616 | | | | 70,834 | |
Dufry AG | | | 2,107 | | | | 68,607 | |
Glencore PLC | | | 175,317 | | | | 324,812 | |
LafargeHolcim Ltd. | | | 7,302 | | | | 302,898 | |
Roche Holding AG - ADR (a) | | | 13,461 | | | | 585,150 | |
| | | | | | | | 1,352,301 | |
United Kingdom — 17.1% | | | | |
Anglo American PLC | | | 16,789 | | | | 299,253 | |
Antofagasta PLC | | | 15,126 | | | | 154,885 | |
Barratt Developments PLC | | | 8,586 | | | | 56,125 | |
Berkeley Group Holdings PLC | | | 1,241 | | | | 65,382 | |
British American Tobacco PLC - ADR (a) | | | 12,701 | | | | 484,543 | |
Bunzl PLC | | | 3,332 | | | | 72,497 | |
Fiat Chrysler Automobiles NV | | | 34,899 | | | | 306,566 | |
Imperial Brands PLC | | | 19,909 | | | | 421,014 | |
ITV PLC | | | 37,033 | | | | 35,682 | |
J Sainsbury PLC | | | 45,977 | | | | 114,715 | |
Kingfisher PLC | | | 25,537 | | | | 50,593 | |
Marks & Spencer Group PLC | | | 29,601 | | | | 34,337 | |
Next PLC | | | 1,280 | | | | 76,190 | |
Pearson PLC | | | 8,574 | | | | 49,653 | |
Persimmon PLC | | | 3,306 | | | | 91,814 | |
Rio Tinto PLC - ADR | | | 9,180 | | | | 424,024 | |
Royal Dutch Shell PLC - Class B - ADR (a) | | | 9,894 | | | | 316,311 | |
The Sage Group PLC | | | 8,653 | | | | 69,750 | |
Taylor Wimpey PLC | | | 34,200 | | | | 63,341 | |
Vodafone Group PLC - ADR | | | 27,748 | | | | 392,357 | |
| | | | | | | | 3,579,032 | |
TOTAL COMMON STOCKS (Cost $26,608,347) | | | | | | | 20,329,779 | |
| | | Shares | | | Value | |
PREFERRED STOCKS — 1.9% | | | | |
| | | | | | | | | |
Germany — 1.9% | | | | |
Henkel AG & Co. KGaA | | | 4,379 | | | $ | 388,890 | |
TOTAL PREFERRED STOCKS (Cost $448,603) | | | | | | | 388,890 | |
| | | | | |
REAL ESTATE INVESTMENT TRUSTS — 0.4% | | | | |
| | | | | | | | | |
United Kingdom — 0.4% | | | | |
The British Land Co. PLC | | | 15,721 | | | | 80,113 | |
TOTAL REITS (Cost $125,305) | | | | | | | 80,113 | |
| | | | | |
INVESTMENTS PURCHASED WITH PROCEEDS FROM SECURITIES LENDING — 20.3% | | | | |
Mount Vernon Liquid Assets Portfolio, LLC, 0.48% (d) | | | 4,268,426 | | | | 4,268,426 | |
TOTAL INVESTMENTS PURCHASED WITH PROCEEDS FROM SECURITIES LENDING (Cost $4,268,426) | | | | | | | 4,268,426 | |
Total Investments (Cost $31,450,681) — 119.4% | | | | | | | 25,067,208 | |
Liabilities in Excess of Other Assets — (19.4)% | | | | | | | (4,075,894 | ) |
TOTAL NET ASSETS — 100.0% | | | | | | $ | 20,991,314 | |
Percentages are stated as a percent of net assets.
ADR | American Depositary Receipt |
| | (a) | All or a portion of this security is on loan as of April 30, 2020. The total value of securities on loan is $4,045,773 or 19.3% of net assets. |
| | (b) | Non-income producing security. |
| | (c) | Security exempt from registration under Rule 144(a) and Regulation S of the Securities Act of 1933. Such securities are treated as liquid securities according to the Fund’s liquidity guidelines. The value of those securities total $58,601 or 0.3% of net assets. |
| | (d) | The rate shown is as of April 30, 2020. |
The accompanying notes are an integral part of the financial statements.
62
Pacer WealthShield ETF
SCHEDULE OF INVESTMENTS
April 30, 2020
| | | Shares | | | Value | |
CONTINGENT VALUE RIGHTS — 0.0% (a) | | | | |
| | | | | | | | | |
Biotechnology — 0.0% (a) | | | | |
Achillion Pharmaceuticals (b)(c) | | | 6,273 | | | $ | 2,886 | |
TOTAL CONTINGENT VALUE RIGHTS (Cost $0) | | | | | | | 2,886 | |
| | | | | |
EXCHANGE TRADED FUNDS — 4.7% | | | | |
| | | | | | | | | |
iShares 20+ Year Treasury Bond ETF (d) | | | 14,419 | | | | 2,404,224 | |
TOTAL EXCHANGE TRADED FUNDS (Cost $2,292,488) | | | | | | | 2,404,224 | |
| | | | | | | | | |
| | | Principal
Amount | | | | | |
U.S. TREASURY NOTES/BONDS — 94.6% | | | | |
| | | | | | | | | |
4.375%, 05/15/2040 | | $ | 462,000 | | | | 738,767 | |
3.875%, 08/15/2040 | | | 406,000 | | | | 612,584 | |
4.250%, 11/15/2040 | | | 418,000 | | | | 660,930 | |
4.750%, 02/15/2041 | | | 478,000 | | | | 803,208 | |
4.375%, 05/15/2041 | | | 362,000 | | | | 584,093 | |
3.750%, 08/15/2041 | | | 403,000 | | | | 602,737 | |
3.125%, 11/15/2041 | | | 368,000 | | | | 505,986 | |
3.125%, 02/15/2042 | | | 464,000 | | | | 639,740 | |
3.000%, 05/15/2042 | | | 389,000 | | | | 526,290 | |
2.750%, 08/15/2042 | | | 595,000 | | | | 774,708 | |
2.750%, 11/15/2042 (d) | | | 723,000 | | | | 941,284 | |
3.125%, 02/15/2043 | | | 733,000 | | | | 1,010,395 | |
2.875%, 05/15/2043 (d) | | | 1,045,000 | | | | 1,388,544 | |
3.625%, 08/15/2043 | | | 863,000 | | | | 1,282,398 | |
3.750%, 11/15/2043 | | | 1,021,000 | | | | 1,547,692 | |
3.625%, 02/15/2044 | | | 1,046,000 | | | | 1,561,604 | |
3.375%, 05/15/2044 | | | 1,051,000 | | | | 1,516,232 | |
3.125%, 08/15/2044 | | | 1,062,000 | | | | 1,478,420 | |
3.000%, 11/15/2044 | | | 1,060,000 | | | | 1,450,171 | |
2.500%, 02/15/2045 | | | 1,062,000 | | | | 1,340,775 | |
3.000%, 05/15/2045 (d) | | | 1,062,000 | | | | 1,459,669 | |
2.875%, 08/15/2045 | | | 1,061,000 | | | | 1,430,153 | |
3.000%, 11/15/2045 | | | 1,057,000 | | | | 1,458,908 | |
2.500%, 02/15/2046 | | | 984,000 | | | | 1,249,065 | |
2.500%, 05/15/2046 | | | 982,000 | | | | 1,249,020 | |
2.250%, 08/15/2046 (d) | | | 986,000 | | | | 1,200,147 | |
2.875%, 11/15/2046 | | | 977,000 | | | | 1,331,812 | |
3.000%, 02/15/2047 (d) | | | 986,000 | | | | 1,377,049 | |
3.000%, 05/15/2047 | | | 959,000 | | | | 1,340,465 | |
2.750%, 08/15/2047 (d) | | | 929,000 | | | | 1,244,497 | |
2.750%, 11/15/2047 | | | 932,000 | | | | 1,251,538 | |
3.000%, 02/15/2048 | | | 1,061,000 | | | | 1,489,793 | |
3.125%, 05/15/2048 | | | 1,134,000 | | | | 1,630,524 | |
| | | Principal
Amount | | | Value | |
U.S. TREASURY NOTES/BONDS — 94.6% (Continued) |
3.000%, 08/15/2048 (d) | | $ | 1,210,000 | | | $ | 1,706,903 | |
3.375%, 11/15/2048 | | | 1,247,000 | | | | 1,878,878 | |
3.000%, 02/15/2049 | | | 1,287,000 | | | | 1,823,970 | |
2.875%, 05/15/2049 (d) | | | 1,280,000 | | | | 1,778,000 | |
2.250%, 08/15/2049 (d) | | | 1,288,000 | | | | 1,593,699 | |
2.375%, 11/15/2049 (d) | | | 1,288,000 | | | | 1,637,018 | |
2.000%, 02/15/2050 (d) | | | 481,000 | | | | 567,599 | |
TOTAL U.S. TREASURY NOTES/BONDS (Cost $45,037,909) | | | | | | | 48,665,264 | |
| | | | | |
SHORT-TERM INVESTMENTS — 0.0% (a) | | | | |
| | | | | |
Money Market Deposit Accounts, — 0.0% (a) | | | | |
U.S. Bank Money Market Deposit Account, 0.20% (e) | | | 16,775 | | | | 16,775 | |
TOTAL SHORT-TERM INVESTMENTS (Cost $16,775) | | | | | | | 16,775 | |
| | | | | | | | | |
| | | Shares | | | | | |
INVESTMENTS PURCHASED WITH PROCEEDS FROM SECURITIES LENDING — 28.9% | | | | |
| | | | | | | | | |
Mount Vernon Liquid Assets Portfolio, LLC, 0.48% (e) | | | 14,840,252 | | | | 14,840,252 | |
TOTAL INVESTMENTS PURCHASED WITH PROCEEDS FROM SECURITIES LENDING (Cost $14,840,252) | | | | | | | 14,840,252 | |
Total Investments (Cost $62,187,424) — 128.2% | | | | | | | 65,929,401 | |
Liabilities in Excess of Other Assets — (28.2)% | | | | | | | (14,501,496 | ) |
TOTAL NET ASSETS — 100.0% | | | | | | $ | 51,427,905 | |
Percentages are stated as a percent of net assets.
| | (b) | Non-income producing security. |
| | (c) | As of April 30, 2020, the Fund has fair valued this security. This security is deemed illiquid according to the Fund’s liquidity guidelines. Value determined using significant unobservable inputs. |
| | (d) | All or a portion of this security is on loan as of April 30, 2020. The total value of securities on loan is $14,451,332 or 28.1% of net assets. |
| | (e) | The rate shown is as of April 30, 2020. |
The accompanying notes are an integral part of the financial statements.
63
Pacer WealthShield ETF
SCHEDULE OF INVESTMENTS
April 30, 2020 (Continued)
For Fund compliance purposes, the Fund’s industry classifications refer to any one or more of the industry sub-classifications used by one or more widely recognized market indexes or ratings group indexes, and/or they may be defined by Fund management. This definition does not apply for all purposes of this report, which may combine sub-classifications for reporting ease. Categories are shown as a percentage of net assets.
The following is a reconciliation of investments in which significant unobservable inputs (Level 3) were used in determining fair value:
| | Balance
as of
04/30/2019 | Net
Realized
Gain
(Loss) | Change in Net
Unrealized
Appreciation
(Depreciation) | Purchases | Sales | Corporate
Action | Transfers
Into
Level 3 | Transfers
Out of
Level 3 | Balance as of
04/30/2020 | Net Change
in Unrealized
Appreciation
(Depreciation)
on securities
held at
04/30/2020 |
Contingent Value Rights | $ — | $ — | $ — | $ — | $ — | $ 2,886 | $ — | $ — | $ 2,886 | $ 2,886 |
The following is a summary of quantitative information about Level 3 Fair Value Measurements:
| | Fair Value as
of 04/30/2020 | | | Valuation
Techniques | | | Unobservable
Input | | | Range/Weighted Average
Unobservable Input* | |
Contingent Value Rights | | $ | 2,886 | | | | Last Trade Price | | | | Stale Data | | | | $0.46 | |
* | Table presents information for one security, which has been valued at $0.46 per share throughout the period. |
For the period ended April 30, 2020, the Fund did not recognize any transfers to or from Level 3.
The accompanying notes are an integral part of the financial statements.
64
Pacer Military Times Best Employers ETF
SCHEDULE OF INVESTMENTS
April 30, 2020
| | | Shares | | | Value | |
COMMON STOCKS — 99.7% | | | | |
| | | | | | | | | |
Aerospace/Defense — 3.2% | | | | |
Boeing Co. | | | 171 | | | $ | 24,114 | |
Lockheed Martin Corp. | | | 169 | | | | 65,751 | |
| | | | | | | | 89,865 | |
Airlines — 1.3% | | | | |
Southwest Airlines Co. | | | 1,146 | | | | 35,812 | |
| | | | | | | | | |
Auto Manufacturers — 1.5% | | | | |
General Motors Co. | | | 1,835 | | | | 40,902 | |
| | | | | | | | | |
Banks — 8.0% | | | | |
Associated Banc-Corp. | | | 3,082 | | | | 43,579 | |
Bank of America Corp. | | | 1,983 | | | | 47,691 | |
Citigroup, Inc. | | | 880 | | | | 42,733 | |
JPMorgan Chase & Co. | | | 501 | | | | 47,976 | |
US Bancorp | | | 1,101 | | | | 40,187 | |
| | | | | | | | 222,166 | |
Beverages — 2.2% | | | | |
Brown-Forman Corp. - Class B | | | 974 | | | | 60,583 | |
| | | | | | | | | |
Commercial Services — 6.8% | | | | |
Booz Allen Hamilton Holding Corp. | | | 908 | | | | 66,683 | |
United Rentals, Inc. (a) | | | 432 | | | | 55,512 | |
Vectrus, Inc. (a) | | | 1,297 | | | | 67,457 | |
| | | | | | | | 189,652 | |
Computers — 7.3% | | | | |
Accenture PLC - Class A | | | 328 | | | | 60,743 | |
CACI International, Inc. - Class A (a) | | | 276 | | | | 69,039 | |
Leidos Holdings, Inc. | | | 727 | | | | 71,835 | |
| | | | | | | | 201,617 | |
Diversified Financial Services — 3.4% | | | | |
Capital One Financial Corp. | | | 661 | | | | 42,807 | |
Charles Schwab Corp. | | | 1,335 | | | | 50,356 | |
| | | | | | | | 93,163 | |
Electric — 8.9% | | | | |
Dominion Energy, Inc. | | | 795 | | | | 61,319 | |
Exelon Corp. | | | 1,488 | | | | 55,175 | |
Southern Co. | | | 1,066 | | | | 60,474 | |
Xcel Energy, Inc. | | | 1,075 | | | | 68,327 | |
| | | | | | | | 245,295 | |
Environmental Control — 2.1% | | | | |
Waste Management, Inc. | | | 585 | | | | 58,512 | |
| | | | | | | | | |
Food — 4.9% | | | | |
Hormel Foods Corp. | | | 1,484 | | | | 69,525 | |
Kellogg Co. | | | 1,015 | | | | 66,483 | |
| | | | | | | | 136,008 | |
| | | Shares | | | Value | |
Healthcare-Services — 5.3% | | | | |
DaVita, Inc. (a) | | | 921 | | | $ | 72,768 | |
Humana, Inc. | | | 194 | | | | 74,073 | |
| | | | | | | | 146,841 | |
Insurance — 8.0% | | | | |
Marsh & McLennan Cos., Inc. | | | 611 | | | | 59,469 | |
Progressive Corp. | | | 905 | | | | 69,957 | |
Prudential Financial, Inc. | | | 706 | | | | 44,033 | |
Travelers Cos., Inc. | | | 483 | | | | 48,884 | |
| | | | | | | | 222,343 | |
Internet — 5.3% | | | | |
Amazon.com, Inc. (a) | | | 37 | | | | 91,538 | |
CDW Corp. | | | 489 | | | | 54,181 | |
| | | | | | | | 145,719 | |
Lodging — 1.7% | | | | |
Hilton Worldwide Holdings, Inc. | | | 629 | | | | 47,622 | |
| | | | | | | | | |
Media — 2.0% | | | | |
Comcast Corp. - Class A | | | 1,497 | | | | 56,332 | |
| | | | | | | | | |
Miscellaneous Manufacturing — 3.6% | | | | |
Eaton Corp. PLC | | | 714 | | | | 59,619 | |
General Electric Co. | | | 5,863 | | | | 39,868 | |
| | | | | | | | 99,487 | |
Packaging & Containers — 1.9% | | | | |
Sonoco Products Co. | | | 1,092 | | | | 53,333 | |
| | | | | | | | | |
Pharmaceuticals — 4.1% | | | | |
CVS Health Corp. | | | 878 | | | | 54,041 | |
Merck & Co., Inc. | | | 758 | | | | 60,140 | |
| | | | | | | | 114,181 | |
Retail — 4.8% | | | | |
Home Depot, Inc. | | | 300 | | | | 65,949 | |
Walmart, Inc. | | | 555 | | | | 67,460 | |
| | | | | | | | 133,409 | |
Software — 4.4% | | | | |
Fiserv, Inc. (a) | | | 568 | | | | 58,538 | |
ManTech International Corp. VA - Class A | | | 852 | | | | 63,525 | |
| | | | | | | | 122,063 | |
Telecommunications — 4.2% | | | | |
AT&T, Inc. | | | 1,768 | | | | 53,871 | |
Verizon Communications, Inc. | | | 1,097 | | | | 63,023 | |
| | | | | | | | 116,894 | |
Transportation — 4.8% | | | | |
Union Pacific Corp. | | | 375 | | | | 59,921 | |
Werner Enterprises, Inc. | | | 1,797 | | | | 72,096 | |
| | | | | | | | 132,017 | |
TOTAL COMMON STOCKS (Cost $2,845,193) | | | | | | | 2,763,816 | |
The accompanying notes are an integral part of the financial statements.
65
Pacer Military Times Best Employers ETF
SCHEDULE OF INVESTMENTS
April 30, 2020 (Continued)
| | | Shares | | | Value | |
EXCHANGE TRADED FUNDS — 0.0% (b) | | | | |
| | | | | | | | | |
SPDR S&P 500 ETF Trust | | | 5 | | | $ | 1,452 | |
TOTAL EXCHANGE TRADED FUNDS (Cost $1,603) | | | | | | | 1,452 | |
| | | Principal
Amount | | | | | |
SHORT-TERM INVESTMENTS — 0.2% | | | | |
| | | | | | | | | |
Money Market Deposit Accounts, — 0.2% | | | | |
U.S. Bank Money Market Deposit Account, 0.20% (c) | | $ | 5,884 | | | | 5,884 | |
TOTAL SHORT-TERM INVESTMENTS (Cost $5,884) | | | | | | | 5,884 | |
Total Investments (Cost $2,852,680) — 99.9% | | | | | | | 2,771,152 | |
Other Assets in Excess of Liabilities — 0.1% | | | | | | | 1,785 | |
TOTAL NET ASSETS — 100.0% | | | | | | $ | 2,772,937 | |
Percentages are stated as a percent of net assets.
| | (a) | Non-income producing security. |
| | (c) | The rate shown is as of April 30, 2020. |
For Fund compliance purposes, the Fund’s industry classifications refer to any one or more of the industry sub-classifications used by one or more widely recognized market indexes or ratings group indexes, and/or they may be defined by Fund management. This definition does not apply for all purposes of this report, which may combine sub-classifications for reporting ease. Categories are shown as a percentage of net assets.
The accompanying notes are an integral part of the financial statements.
66
Pacer Benchmark Retail Real Estate SCTRSM ETF
SCHEDULE OF INVESTMENTS
April 30, 2020
| | | Shares | | | Value | |
REAL ESTATE INVESTMENT TRUSTS — 99.5% | | | | |
| | | | | | | | | |
Diversified — 3.1% | | | | |
EPR Properties | | | 845 | | | $ | 24,860 | |
| | | | | | | | | |
Regional Malls — 18.3% | | | | |
Macerich Co. | | | 1,302 | | | | 9,726 | |
Simon Property Group, Inc. (a) | | | 1,508 | | | | 100,689 | |
Tanger Factory Outlet Centers, Inc. (a) | | | 1,047 | | | | 7,874 | |
Taubman Centers, Inc. | | | 666 | | | | 28,705 | |
Washington Prime Group, Inc. | | | 2,010 | | | | 1,728 | |
| | | | | | | | 148,722 | |
Shopping Centers — 38.7% | | | | |
Acadia Realty Trust | | | 662 | | | | 8,202 | |
Alexander’s, Inc. | | | 35 | | | | 11,034 | |
Brixmor Property Group, Inc. | | | 3,010 | | | | 34,465 | |
Cedar Realty Trust, Inc. | | | 763 | | | | 801 | |
Federal Realty Investment Trust | | | 481 | | | | 40,053 | |
Kimco Realty Corp. | | | 3,227 | | | | 35,207 | |
Kite Realty Group Trust | | | 888 | | | | 9,084 | |
Regency Centers Corp. | | | 1,645 | | | | 72,232 | |
Retail Opportunity Investments Corp. | | | 1,267 | | | | 12,296 | |
Retail Properties of America, Inc. - Class A (a) | | | 2,575 | | | | 15,965 | |
RPT Realty | | | 761 | | | | 5,190 | |
Saul Centers, Inc. | | | 128 | | | | 4,175 | |
Seritage Growth Properties - Class A | | | 264 | | | | 2,793 | |
SITE Centers Corp. | | | 1,936 | | | | 11,732 | |
Urban Edge Properties | | | 1,368 | | | | 15,732 | |
Urstadt Biddle Properties, Inc. - Class A | | | 323 | | | | 4,719 | |
Weingarten Realty Investors | | | 1,499 | | | | 27,267 | |
Whitestone REIT | | | 425 | | | | 2,882 | |
| | | | | | | | 313,829 | |
Single Tenant — 39.4% | | | | |
Agree Realty Corp. (a) | | | 467 | | | | 30,406 | |
Essential Properties Realty Trust, Inc. (a) | | | 848 | | | | 12,457 | |
Getty Realty Corp. | | | 381 | | | | 10,348 | |
National Retail Properties, Inc. | | | 1,694 | | | | 55,292 | |
Realty Income Corp. | | | 2,554 | | | | 140,266 | |
Spirit Realty Capital, Inc. | | | 1,183 | | | | 36,389 | |
STORE Capital Corp. | | | 1,674 | | | | 33,597 | |
| | | | | | | | 318,755 | |
TOTAL REAL ESTATE INVESTMENT TRUSTS (Cost $1,427,136) | | | | | | | 806,166 | |
| | | Principal
Amount | | | Value | |
SHORT-TERM INVESTMENTS — 0.1% | | | | |
| | | | | | | | | |
Money Market Deposit Accounts, — 0.1% | | | | |
U.S. Bank Money Market Deposit Account, 0.20% (b) | | $ | 703 | | | $ | 703 | |
TOTAL SHORT-TERM INVESTMENTS (Cost $703) | | | | | | | 703 | |
| | | Shares | | | | | |
INVESTMENTS PURCHASED WITH PROCEEDS FROM SECURITIES LENDING — 20.7% | | | | |
Mount Vernon Liquid Assets Portfolio, LLC, 0.48% (b) | | | 167,149 | | | | 167,149 | |
TOTAL INVESTMENTS PURCHASED WITH PROCEEDS FROM SECURITIES LENDING (Cost $167,149) | | | | | | | 167,149 | |
Total Investments (Cost $1,594,988) — 120.3% | | | | | | | 974,018 | |
Liabilities in Excess of Other Assets — (20.3)% | | | | | | | (164,621 | ) |
TOTAL NET ASSETS — 100.0% | | | | | | $ | 809,397 | |
Percentages are stated as a percent of net assets.
| | (a) | All or a portion of this security is on loan as of April 30, 2020. The total value of securities on loan is $158,924 or 19.6% of net assets. |
| | (b) | The rate shown is as of April 30, 2020. |
For Fund compliance purposes, the Fund’s industry classifications refer to any one or more of the industry sub-classifications used by one or more widely recognized market indexes or ratings group indexes, and/or they may be defined by Fund management. This definition does not apply for all purposes of this report, which may combine sub-classifications for reporting ease. Categories are shown as a percentage of net assets.
The accompanying notes are an integral part of the financial statements.
67
Pacer Benchmark Industrial Real Estate SCTRSM ETF
SCHEDULE OF INVESTMENTS
April 30, 2020
| | | Shares | | | Value | |
REAL ESTATE INVESTMENT TRUSTS — 99.2% | | | | |
| | | | | | | | | |
Diversified — 28.8% | | | | |
Duke Realty Corp. (a) | | | 234,037 | | | $ | 8,121,084 | |
Lexington Realty Trust | | | 218,428 | | | | 2,282,572 | |
One Liberty Properties, Inc. | | | 94,603 | | | | 1,487,159 | |
PS Business Parks, Inc. | | | 15,426 | | | | 1,991,342 | |
| | | | | | | | 13,882,157 | |
Real Estate and Rental and Leasing — 3.5% | | | | |
Plymouth Industrial REIT, Inc. | | | 121,478 | | | | 1,701,907 | |
| | | | | | | | | |
Storage — 3.8% | | | | |
Life Storage, Inc. | | | 20,982 | | | | 1,837,813 | |
| | | | | | | | | |
Warehouse/Industrial — 63.1% | | | | |
Americold Realty Trust (a) | | | 183,558 | | | | 5,615,039 | |
EastGroup Properties, Inc. | | | 18,236 | | | | 1,933,016 | |
First Industrial Realty Trust, Inc. | | | 58,874 | | | | 2,223,671 | |
Industrial Logistics Properties Trust | | | 109,642 | | | | 2,049,209 | |
Innovative Industrial Properties, Inc. (a) | | | 24,663 | | | | 1,935,059 | |
Monmouth Real Estate Investment Corp. | | | 160,917 | | | | 2,186,862 | |
Prologis, Inc. | | | 90,187 | | | | 8,047,386 | |
Rexford Industrial Realty, Inc. | | | 48,476 | | | | 1,973,943 | |
STAG Industrial, Inc. | | | 80,999 | | | | 2,126,224 | |
Terreno Realty Corp. | | | 41,671 | | | | 2,284,404 | |
| | | | | | | | 30,374,813 | |
TOTAL REAL ESTATE INVESTMENT TRUSTS (Cost $49,384,781) | | | | | | | 47,796,690 | |
| | | Principal
Amount | | | | | |
SHORT-TERM INVESTMENTS — 0.7% | | | | |
| | | | | | | | | |
Money Market Deposit Accounts, — 0.7% | | | | |
U.S. Bank Money Market Deposit Account, 0.20% (b) | | $ | 327,290 | | | | 327,290 | |
TOTAL SHORT-TERM INVESTMENTS (Cost $327,290) | | | | | | | 327,290 | |
| | | Shares | | | Value | |
INVESTMENTS PURCHASED WITH PROCEEDS FROM SECURITIES LENDING — 4.7% | | | | |
Mount Vernon Liquid Assets Portfolio, LLC, 0.48% (b) | | | 2,260,475 | | | $ | 2,260,475 | |
TOTAL INVESTMENTS PURCHASED WITH PROCEEDS FROM SECURITIES LENDING (Cost $2,260,475) | | | | | | | 2,260,475 | |
Total Investments (Cost $51,972,546) — 104.6% | | | | | | | 50,384,455 | |
Liabilities in Excess of Other Assets — (4.6)% | | | | | | | (2,237,007 | ) |
TOTAL NET ASSETS — 100.0% | | | | | | $ | 48,147,448 | |
Percentages are stated as a percent of net assets.
| | (a) | All or a portion of this security is on loan as of April 30, 2020. The total value of securities on loan is $2,162,701 or 4.5% of net assets. |
| | (b) | The rate shown is as of April 30, 2020. |
For Fund compliance purposes, the Fund’s industry classifications refer to any one or more of the industry sub-classifications used by one or more widely recognized market indexes or ratings group indexes, and/or they may be defined by Fund management. This definition does not apply for all purposes of this report, which may combine sub-classifications for reporting ease. Categories are shown as a percentage of net assets.
The accompanying notes are an integral part of the financial statements.
68
Pacer Benchmark Data & Infrastructure Real Estate SCTRSM ETF
SCHEDULE OF INVESTMENTS
April 30, 2020
| | | Shares | | | Value | |
COMMON STOCKS — 14.7% | | | | |
| | | | | | | | | |
Advertising Sales — 1.0% | | | | |
Clear Channel Outdoor Holdings, Inc. (a) | | | 5,605,552 | | | $ | 5,408,237 | |
| | | | | | | | | |
Information — 1.7% | | | | |
21Vianet Group, Inc. - ADR (a) | | | 620,261 | | | | 9,285,307 | |
| | | | | | | | | |
Internet — 4.8% | | | | |
Cogent Communications Holdings, Inc. (b) | | | 317,227 | | | | 26,593,139 | |
| | | | | | | | | |
Real Estate Operations/Development — 0.5% | | | | |
Landmark Infrastructure Partners LP | | | 266,294 | | | | 3,001,133 | |
| | | | | | | | | |
Telecom Services — 6.7% | | | | |
GDS Holdings Ltd. - ADR (a)(b) | | | 414,801 | | | | 23,776,393 | |
Switch, Inc. - Class A | | | 761,410 | | | | 13,073,410 | |
| | | | | | | | 36,849,803 | |
TOTAL COMMON STOCKS (Cost $75,745,015) | | | | | | | 81,137,619 | |
| | | | | |
EXCHANGE TRADED FUNDS — 1.6% | | | | |
| | | | | | | | | |
Finance and Insurance — 1.6% | | | | |
Vanguard Real Estate ETF | | | 116,702 | | | | 8,882,189 | |
TOTAL EXCHANGE TRADED FUNDS (Cost $9,039,914) | | | | | | | 8,882,189 | |
| | | | | |
REAL ESTATE INVESTMENT TRUSTS — 83.6% | | | | |
| | | | | | | | | |
Diversified — 70.9% | | | | |
American Tower Corp. | | | 353,354 | | | | 84,098,252 | |
CoreSite Realty Corp. | | | 220,847 | | | | 26,764,448 | |
Crown Castle International Corp. (b) | | | 559,423 | | | | 89,188,809 | |
Digital Realty Trust, Inc. (b) | | | 182,486 | | | | 27,279,832 | |
Equinix, Inc. | | | 139,873 | | | | 94,442,250 | |
Lamar Advertising Co. - Class A | | | 287,206 | | | | 16,557,426 | |
Outfront Media, Inc. | | | 912,812 | | | | 14,322,020 | |
SBA Communications Corp. | | | 90,641 | | | | 26,278,639 | |
Uniti Group, Inc. (b) | | | 1,823,104 | | | | 12,871,114 | |
| | | | | | | | 391,802,790 | |
Warehouse/Industrial — 12.7% | | | | |
CyrusOne, Inc. (b) | | | 381,816 | | | | 26,784,393 | |
Iron Mountain, Inc. | | | 790,684 | | | | 19,118,739 | |
QTS Realty Trust, Inc. - Class A (b) | | | 386,646 | | | | 24,176,974 | |
| | | | | | | | 70,080,106 | |
TOTAL REAL ESTATE INVESTMENT TRUSTS (Cost $430,939,810) | | | | | | | 461,882,896 | |
| | | Principal
Amount | | | Value | |
SHORT-TERM INVESTMENTS — 1.7% | | | | |
| | | | | | | | | |
Money Market Deposit Accounts, — 1.7% | | | | |
U.S. Bank Money Market Deposit Account, 0.20% (c) | | $ | 9,503,044 | | | $ | 9,503,044 | |
TOTAL SHORT-TERM INVESTMENTS (Cost $9,503,044) | | | | | | | 9,503,044 | |
| | | Shares | | | | | |
INVESTMENTS PURCHASED WITH PROCEEDS FROM SECURITIES LENDING — 19.0% | | | | |
Mount Vernon Liquid Assets Portfolio, LLC, 0.48% (c) | | | 104,768,136 | | | | 104,768,136 | |
TOTAL INVESTMENTS PURCHASED WITH PROCEEDS FROM SECURITIES LENDING (Cost $104,768,136) | | | | | | | 104,768,136 | |
Total Investments (Cost $629,995,919) — 120.6% | | | | | | | 666,173,884 | |
Liabilities in Excess of Other Assets — (20.6)% | | | | | | | (113,959,456 | ) |
TOTAL NET ASSETS — 100.0% | | | | | | $ | 552,214,428 | |
Percentages are stated as a percent of net assets.
ADR | American Depositary Receipt |
| | (a) | Non-income producing security. |
| | (b) | All or a portion of this security is on loan as of April 30, 2020. The total value of securities on loan is $100,894,107 or 18.3% of net assets. |
| | (c) | The rate shown is as of April 30, 2020. |
For Fund compliance purposes, the Fund’s industry classifications refer to any one or more of the industry sub-classifications used by one or more widely recognized market indexes or ratings group indexes, and/or they may be defined by Fund management. This definition does not apply for all purposes of this report, which may combine sub-classifications for reporting ease. Categories are shown as a percentage of net assets.
The accompanying notes are an integral part of the financial statements.
69
Pacer US Export Leaders ETF
SCHEDULE OF INVESTMENTS
April 30, 2020
| | | Shares | | | Value | |
COMMON STOCKS — 98.0% | | | | |
| | | | | | | | | |
Apparel — 0.9% | | | | |
Skechers U.S.A, Inc. - Class A (a) | | | 425 | | | $ | 11,976 | |
| | | | | | | | | |
Auto Parts & Equipment — 2.8% | | | | |
BorgWarner, Inc. | | | 437 | | | | 12,485 | |
Goodyear Tire & Rubber Co. | | | 1,556 | | | | 11,156 | |
VISTEON Corp. (a) | | | 199 | | | | 12,000 | |
| | | | | | | | 35,641 | |
Biotechnology — 1.1% | | | | |
Bio-Rad Laboratories, Inc. - Class A (a) | | | 32 | | | | 14,083 | |
| | | | | | | | | |
Chemicals — 6.6% | | | | |
Air Products & Chemicals, Inc. | | | 54 | | | | 12,181 | |
Celanese Corp. | | | 143 | | | | 11,879 | |
FMC Corp. | | | 127 | | | | 11,671 | |
Linde PLC | | | 64 | | | | 11,776 | |
NewMarket Corp. | | | 30 | | | | 12,343 | |
PPG Industries, Inc. | | | 119 | | | | 10,809 | |
The Chemours Co. | | | 1,089 | | | | 12,774 | |
| | | | | | | | 83,433 | |
Commercial Services — 2.4% | | | | |
ManpowerGroup, Inc. | | | 149 | | | | 11,062 | |
Sabre Corp. | | | 1,347 | | | | 9,793 | |
The Brink’s Co. | | | 176 | | | | 8,997 | |
| | | | | | | | 29,852 | |
Computers — 4.2% | | | | |
Accenture PLC - Class A | | | 67 | | | | 12,408 | |
DXC Technology Co. | | | 741 | | | | 13,434 | |
Fortinet, Inc. (a) | | | 136 | | | | 14,653 | |
Lumentum Holdings, Inc. (a) | | | 155 | | | | 12,541 | |
| | | | | | | | 53,036 | |
Cosmetics/Personal Care — 0.6% | | | | |
Coty, Inc. - Class A | | | 1,444 | | | | 7,870 | |
| | | | | | | | | |
Distribution/Wholesale — 0.9% | | | | |
LKQ Corp. (a) | | | 451 | | | | 11,794 | |
| | | | | | | | | |
Electric — 0.9% | | | | |
AES Corp. | | | 863 | | | | 11,435 | |
| | | | | | | | | |
Electrical Components & Equipment — 2.9% | | | | |
AMETEK, Inc. | | | 150 | | | | 12,581 | |
Littelfuse, Inc. | | | 87 | | | | 12,636 | |
Universal Display Corp. | | | 77 | | | | 11,559 | |
| | | | | | | | 36,776 | |
| | | Shares | | | Value | |
Electronics — 9.5% | | | | |
Agilent Technologies, Inc. | | | 155 | | | $ | 11,882 | |
Allegion PLC | | | 100 | | | | 10,054 | |
Amphenol Corp. - Class A | | | 141 | | | | 12,445 | |
AVNET, Inc. | | | 420 | | | | 12,608 | |
Coherent, Inc. (a) | | | 101 | | | | 12,915 | |
Gentex Corp. | | | 445 | | | | 10,787 | |
Jabil, Inc. | | | 452 | | | | 12,855 | |
Keysight Technologies, Inc. (a) | | | 122 | | | | 11,806 | |
Mettler-Toledo International, Inc. (a) | | | 17 | | | | 12,239 | |
Tech Data Corp. (a) | | | 84 | | | | 11,814 | |
| | | | | | | | 119,405 | |
Energy-Alternate Sources — 1.1% | | | | |
SolarEdge Technologies, Inc. (a) | | | 123 | | | | 13,726 | |
| | | | | | | | | |
Engineering & Construction — 2.0% | | | | |
AECOM (a) | | | 336 | | | | 12,183 | |
KBR, Inc. | | | 618 | | | | 12,521 | |
| | | | | | | | 24,704 | |
Food — 0.9% | | | | |
Mondelez International, Inc. - Class A | | | 220 | | | | 11,317 | |
| | | | | | | | | |
Healthcare-Products — 6.1% | | | | |
Abbott Laboratories | | | 137 | | | | 12,616 | |
Align Technology, Inc. (a) | | | 57 | | | | 12,247 | |
Repligen Corp. (a) | | | 114 | | | | 13,241 | |
The Cooper Cos., Inc. | | | 39 | | | | 11,181 | |
Thermo Fisher Scientific, Inc. | | | 37 | | | | 12,383 | |
West Pharmaceutical Services, Inc. | | | 77 | | | | 14,573 | |
| | | | | | | | 76,241 | |
Healthcare-Services — 2.4% | | | | |
Catalent, Inc. (a) | | | 234 | | | | 16,181 | |
IQVIA Holdings, Inc. (a) | | | 95 | | | | 13,546 | |
| | | | | | | | 29,727 | |
Household Products/Wares — 0.9% | | | | |
Avery Dennison Corp. | | | 106 | | | | 11,701 | |
| | | | | | | | | |
Internet — 3.0% | | | | |
Alphabet, Inc. - Class A (a) | | | 9 | | | | 12,120 | |
Booking Holdings, Inc. (a) | | | 8 | | | | 11,845 | |
Facebook, Inc. - Class A (a) | | | 66 | | | | 13,511 | |
| | | | | | | | 37,476 | |
Leisure Time — 1.3% | | | | |
Royal Caribbean Cruises Ltd. | | | 347 | | | | 16,229 | |
| | | | | | | | | |
Machinery-Diversified — 4.9% | | | | |
AGCO Corp. | | | 203 | | | | 10,727 | |
Cognex Corp. | | | 251 | | | | 13,865 | |
Nordson Corp. | | | 89 | | | | 14,321 | |
The accompanying notes are an integral part of the financial statements.
70
Pacer US Export Leaders ETF
SCHEDULE OF INVESTMENTS
April 30, 2020 (Continued)
| | | Shares | | | Value | |
COMMON STOCKS — 98.0% (Continued) | | | | |
| | | | | | | | | |
Machinery-Diversified — 4.9% (Continued) | | | | |
Wabtec Corp. | | | 204 | | | $ | 11,510 | |
Xylem, Inc. | | | 156 | | | | 11,216 | |
| | | | | | | | 61,639 | |
Metal Fabricate/Hardware — 1.0% | | | | |
The Timken Co. | | | 324 | | | | 12,176 | |
| | | | | | | | | |
Mining — 2.9% | | | | |
Newmont Goldcorp Corp. | | | 284 | | | | 16,892 | |
Royal Gold, Inc. | | | 156 | | | | 19,115 | |
| | | | | | | | 36,007 | |
Miscellaneous Manufacturing — 2.9% | | | | |
AptarGroup, Inc. | | | 116 | | | | 12,421 | |
Illinois Tool Works, Inc. | | | 72 | | | | 11,700 | |
ITT, Inc. | | | 238 | | | | 12,548 | |
| | | | | | | | 36,669 | |
Office/Business Equipment — 1.1% | | | | |
Zebra Technologies Corp. - Class A (a) | | | 58 | | | | 13,320 | |
| | | | | | | | | |
Oil & Gas — 1.0% | | | | |
Chevron Corp. | | | 135 | | | | 12,420 | |
| | | | | | | | | |
Packaging & Containers — 1.9% | | | | |
Ball Corp. | | | 176 | | | | 11,544 | |
Sealed Air Corp. | | | 440 | | | | 12,579 | |
| | | | | | | | 24,123 | |
Pharmaceuticals — 1.9% | | | | |
Merck & Co., Inc. | | | 140 | | | | 11,108 | |
Mylan NV (a) | | | 746 | | | | 12,510 | |
| | | | | | | | 23,618 | |
Retail — 3.2% | | | | |
Domino’s Pizza, Inc. | | | 35 | | | | 12,668 | |
Nu Skin Enterprises, Inc. - Class A | | | 574 | | | | 16,766 | |
Tiffany & Co. | | | 88 | | | | 11,132 | |
| | | | | | | | 40,566 | |
Semiconductors — 17.1% | | | | |
Advanced Micro Devices, Inc. (a) | | | 256 | | | | 13,413 | |
Analog Devices, Inc. | | | 112 | | | | 12,275 | |
Applied Materials, Inc. | | | 221 | | | | 10,979 | |
Broadcom, Inc. | | | 48 | | | | 13,038 | |
Cabot Microelectronics Corp. | | | 93 | | | | 11,396 | |
Cirrus Logic, Inc. (a) | | | 181 | | | | 13,684 | |
Intel Corp. | | | 206 | | | | 12,356 | |
IPG Photonics Corp. (a) | | | 100 | | | | 12,933 | |
KLA Corp. | | | 77 | | | | 12,635 | |
Lam Research Corp. | | | 43 | | | | 10,977 | |
Microchip Technology, Inc. | | | 160 | | | | 14,037 | |
MKS Instruments, Inc. | | | 123 | | | | 12,328 | |
| | | Shares | | | Value | |
Semiconductors — 17.1% (Continued) | | | | |
Monolithic Power Systems, Inc. | | | 66 | | | $ | 13,194 | |
NVIDIA Corp. | | | 47 | | | | 13,737 | |
Qorvo, Inc. (a) | | | 134 | | | | 13,136 | |
Synaptics, Inc. (a) | | | 187 | | | | 12,228 | |
Texas Instruments, Inc. | | | 106 | | | | 12,303 | |
| | | | | | | | 214,649 | |
Software — 5.4% | | | | |
Autodesk, Inc. (a) | | | 71 | | | | 13,286 | |
Cadence Design System, Inc. (a) | | | 180 | | | | 14,604 | |
Electronic Arts, Inc. (a) | | | 116 | | | | 13,254 | |
Microsoft Corp. | | | 71 | | | | 12,724 | |
Synopsys, Inc. (a) | | | 86 | | | | 13,512 | |
| | | | | | | | 67,380 | |
Telecommunications — 1.1% | | | | |
Arista Networks, Inc. (a) | | | 63 | | | | 13,816 | |
| | | | | | | | | |
Toys/Games/Hobbies — 1.2% | | | | |
Hasbro, Inc. | | | 204 | | | | 14,731 | |
| | | | | | | | | |
Transportation — 1.9% | | | | |
Expeditors International of Washington, Inc. | | | 172 | | | | 12,316 | |
Kansas City Southern | | | 88 | | | | 11,488 | |
| | | | | | | | 23,804 | |
TOTAL COMMON STOCKS (Cost $1,283,142) | | | | | | | 1,231,340 | |
| | | | | |
EXCHANGE TRADED FUNDS — 1.0% | | | | |
Invesco S&P 500 Pure Growth ETF | | | 110 | | | | 12,842 | |
TOTAL EXCHANGE TRADED FUNDS (Cost $12,287) | | | | | | | 12,842 | |
| | | | | |
REAL ESTATE INVESTMENT TRUSTS — 0.9% | | | | |
Rayonier, Inc. | | | 483 | | | | 11,606 | |
TOTAL REAL ESTATE INVESTMENT TRUSTS (Cost $9,726) | | | | | | | 11,606 | |
.
The accompanying notes are an integral part of the financial statements.
71
Pacer US Export Leaders ETF
SCHEDULE OF INVESTMENTS
April 30, 2020 (Continued)
| | | Principal
Amount | | | Value | |
SHORT-TERM INVESTMENTS — 0.1% | | | | |
| | | | | | | | | |
Money Market Deposit Accounts, — 0.1% | | | | |
U.S. Bank Money Market Deposit Account, 0.20% (b) | | $ | 1,602 | | | $ | 1,602 | |
TOTAL SHORT-TERM INVESTMENTS (Cost $1,602) | | | | | | | 1,602 | |
Total Investments (Cost $1,306,757) — 100.0% | | | | | | | 1,257,390 | |
Other Assets in Excess of Liabilities — 0.0% (c) | | | | | | | 13 | |
TOTAL NET ASSETS — 100.0% | | | | | | $ | 1,257,403 | |
Percentages are stated as a percent of net assets.
| | (a) | Non-income producing security. |
| | (b) | The rate shown is as of April 30, 2020. |
For Fund compliance purposes, the Fund’s industry classifications refer to any one or more of the industry sub-classifications used by one or more widely recognized market indexes or ratings group indexes, and/or they may be defined by Fund management. This definition does not apply for all purposes of this report, which may combine sub-classifications for reporting ease. Categories are shown as a percentage of net assets.
The accompanying notes are an integral part of the financial statements.
72
Pacer CFRA-Stovall Equal Weight Seasonal Rotation ETF
SCHEDULE OF INVESTMENTS
April 30, 2020
| | | Shares | | | Value | |
COMMON STOCKS — 100.0% | | | | |
| | | | | | | | | |
Agriculture — 4.4% | | | | |
Altria Group, Inc. | | | 22,788 | | | $ | 894,429 | |
Archer-Daniels-Midland Co. | | | 24,235 | | | | 900,088 | |
Philip Morris International, Inc. | | | 11,941 | | | | 890,798 | |
| | | | | | | | 2,685,315 | |
Beverages — 9.0% | | | | |
Brown-Forman Corp. - Class B | | | 14,552 | | | | 905,134 | |
Coca-Cola Co. | | | 19,370 | | | | 888,889 | |
Constellation Brands, Inc. - Class A | | | 5,722 | | | | 942,356 | |
Molson Coors Brewing Co. - Class B | | | 20,976 | | | | 860,226 | |
Monster Beverage Corp. (a) | | | 14,969 | | | | 925,234 | |
PepsiCo, Inc. | | | 6,768 | | | | 895,339 | |
| | | | | | | | 5,417,178 | |
Biotechnology — 6.6% | | | | |
Alexion Pharmaceuticals, Inc. (a) | | | 4,943 | | | | 531,224 | |
Amgen, Inc. | | | 2,177 | | | | 520,782 | |
Biogen, Inc. (a) | | | 1,493 | | | | 443,167 | |
Gilead Sciences, Inc. | | | 6,090 | | | | 511,560 | |
Illumina, Inc. (a) | | | 1,617 | | | | 515,872 | |
Incyte Corp. (a) | | | 5,115 | | | | 499,531 | |
Regeneron Pharmaceuticals, Inc. (a) | | | 899 | | | | 472,766 | |
Vertex Pharmaceuticals, Inc. (a) | | | 1,891 | | | | 475,019 | |
| | | | | | | | 3,969,921 | |
Cosmetics/Personal Care — 5.9% | | | | |
Colgate-Palmolive Co. | | | 12,679 | | | | 890,953 | |
Coty, Inc. - Class A | | | 161,895 | | | | 882,328 | |
Estee Lauder Cos., Inc. - Class A | | | 5,170 | | | | 911,988 | |
Procter & Gamble Co. | | | 7,466 | | | | 880,017 | |
| | | | | | | | 3,565,286 | |
Electronics — 3.4% | | | | |
Agilent Technologies, Inc. | | | 6,429 | | | | 492,847 | |
Mettler-Toledo International, Inc. (a) | | | 709 | | | | 510,437 | |
PerkinElmer, Inc. | | | 6,116 | | | | 553,682 | |
Waters Corp. (a) | | | 2,590 | | | | 484,330 | |
| | | | | | | | 2,041,296 | |
Food — 21.2% | | | | |
Campbell Soup Co. | | | 18,492 | | | | 924,230 | |
ConAgra Foods, Inc. | | | 27,722 | | | | 927,024 | |
General Mills, Inc. | | | 15,344 | | | | 918,952 | |
Hershey Co. | | | 6,356 | | | | 841,725 | |
Hormel Foods Corp. | | | 18,430 | | | | 863,445 | |
JM Smucker Co. | | | 7,657 | | | | 879,866 | |
Kellogg Co. | | | 14,317 | | | | 937,763 | |
Kroger Co. | | | 29,154 | | | | 921,558 | |
Lamb Weston Holdings, Inc. | | | 15,038 | | | | 922,732 | |
McCormick & Co., Inc. | | | 5,933 | | | | 930,532 | |
Mondelez International, Inc. - Class A | | | 17,406 | | | | 895,365 | |
| | | Shares | | | Value | |
Food — 21.2% (Continued) | | | | | | | | |
Sysco Corp. | | | 17,976 | | | $ | 1,011,510 | |
The Kraft Heinz Co. | | | 30,743 | | | | 932,435 | |
Tyson Foods, Inc. - Class A | | | 14,933 | | | | 928,683 | |
| | | | | | | | 12,835,820 | |
Healthcare-Products — 18.6% | | | | |
Abbott Laboratories | | | 5,327 | | | | 490,563 | |
ABIOMED, Inc. (a) | | | 3,081 | | | | 589,241 | |
Align Technology, Inc. (a) | | | 2,650 | | | | 569,353 | |
Baxter International, Inc. | | | 5,503 | | | | 488,556 | |
Becton Dickinson and Co. | | | 1,957 | | | | 494,201 | |
Boston Scientific Corp. (a) | | | 13,358 | | | | 500,658 | |
Danaher Corp. | | | 3,267 | | | | 534,024 | |
DENTSPLY SIRONA, Inc. | | | 12,517 | | | | 531,221 | |
Edwards Lifesciences Corp. (a) | | | 2,239 | | | | 486,983 | |
Henry Schein, Inc. (a) | | | 9,535 | | | | 520,230 | |
Hologic, Inc. (a) | | | 11,680 | | | | 585,168 | |
IDEXX Laboratories, Inc. (a) | | | 1,929 | | | | 535,490 | |
Intuitive Surgical, Inc. (a) | | | 972 | | | | 496,575 | |
Medtronic PLC | | | 4,950 | | | | 483,269 | |
ResMed, Inc. | | | 3,097 | | | | 481,026 | |
STERIS PLC | | | 3,300 | | | | 470,250 | |
Stryker Corp. | | | 2,699 | | | | 503,175 | |
Teleflex, Inc. | | | 1,475 | | | | 494,715 | |
The Cooper Cos., Inc. | | | 1,670 | | | | 478,789 | |
Thermo Fisher Scientific, Inc. | | | 1,542 | | | | 516,077 | |
Varian Medical Systems, Inc. (a) | | | 4,419 | | | | 505,445 | |
Zimmer Biomet Holdings, Inc. | | | 4,313 | | | | 516,266 | |
| | | | | | | | 11,271,275 | |
Healthcare-Services — 8.7% | | | | |
Anthem, Inc. | | | 1,910 | | | | 536,194 | |
Centene Corp. (a) | | | 7,174 | | | | 477,645 | |
DaVita, Inc. (a) | | | 6,544 | | | | 517,042 | |
HCA Healthcare, Inc. | | | 4,422 | | | | 485,889 | |
Humana, Inc. | | | 1,369 | | | | 522,712 | |
IQVIA Holdings, Inc. (a) | | | 3,887 | | | | 554,247 | |
Laboratory Corp. of American Holdings (a) | | | 3,444 | | | | 566,366 | |
Quest Diagnostics, Inc. | | | 5,361 | | | | 590,300 | |
UnitedHealth Group, Inc. | | | 1,760 | | | | 514,747 | |
Universal Health Services, Inc. - Class B | | | 4,745 | | | | 501,499 | |
| | | | | | | | 5,266,641 | |
Household Products/Wares — 4.4% | | | | |
Church & Dwight Co., Inc. | | | 12,657 | | | | 885,863 | |
Clorox Co. | | | 4,811 | | | | 896,963 | |
Kimberly-Clark Corp. | | | 6,558 | | | | 908,152 | |
| | | | | | | | 2,690,978 | |
Pharmaceuticals — 12.6% | | | | |
AbbVie, Inc. | | | 6,129 | | | | 503,804 | |
Allergan PLC | | | 2,735 | | | | 512,375 | |
The accompanying notes are an integral part of the financial statements.
73
Pacer CFRA-Stovall Equal Weight Seasonal Rotation ETF
SCHEDULE OF INVESTMENTS
April 30, 2020 (Continued)
| | | Shares | | | Value | |
COMMON STOCKS — 100.0% (Continued) | | | | |
| | | | | | | | | |
Pharmaceuticals — 12.6% (Continued) | | | | |
AmerisourceBergen Corp. | | | 5,734 | | | $ | 514,111 | |
Bristol-Myers Squibb Co. | | | 8,440 | | | | 513,236 | |
Cardinal Health, Inc. | | | 9,984 | | | | 494,008 | |
Cigna Corp. | | | 2,635 | | | | 515,880 | |
CVS Health Corp. | | | 8,072 | | | | 496,832 | |
Eli Lilly & Co. | | | 3,252 | | | | 502,889 | |
Johnson & Johnson | | | 3,364 | | | | 504,735 | |
McKesson Corp. | | | 3,612 | | | | 510,195 | |
Merck & Co., Inc. | | | 6,128 | | | | 486,196 | |
Mylan NV (a) | | | 31,748 | | | | 532,414 | |
Perrigo Co. PLC | | | 9,860 | | | | 525,538 | |
Pfizer, Inc. | | | 13,857 | | | | 531,555 | |
Zoetis, Inc. | | | 3,913 | | | | 505,990 | |
| | | | | | | | 7,649,758 | |
Retail — 4.4% | | | | |
Costco Wholesale Corp. | | | 2,928 | | | | 887,184 | |
Walgreens Boots Alliance, Inc. | | | 20,919 | | | | 905,584 | |
Walmart, Inc. | | | 7,046 | | | | 856,441 | |
| | | | | | | | 2,649,209 | |
Software — 0.8% | | | | |
Cerner Corp. | | | 7,306 | | | | 506,963 | |
TOTAL COMMON STOCKS (Cost $60,556,629) | | | | | | | 60,549,640 | |
| | | Principal
Amount | | | Value | |
SHORT-TERM INVESTMENTS — 0.2% | | | | |
| | | | | | | | | |
Money Market Deposit Accounts, — 0.2% | | | | |
U.S. Bank Money Market Deposit Account, 0.20% (b) | | $ | 105,263 | | | $ | 105,263 | |
TOTAL SHORT-TERM INVESTMENTS (Cost $105,263) | | | | | | | 105,263 | |
Total Investments (Cost $60,661,892) — 100.2% | | | | | | | 60,654,903 | |
Liabilities in Excess of Other Assets — (0.2)% | | | | | | | (100,525 | ) |
TOTAL NET ASSETS — 100.0% | | | | | | $ | 60,554,378 | |
Percentages are stated as a percent of net assets.
| | (a) | Non-income producing security. |
| | (b) | The rate shown is as of April 30, 2020. |
For Fund compliance purposes, the Fund’s industry classifications refer to any one or more of the industry sub-classifications used by one or more widely recognized market indexes or ratings group indexes, and/or they may be defined by Fund management. This definition does not apply for all purposes of this report, which may combine sub-classifications for reporting ease. Categories are shown as a percentage of net assets.
The accompanying notes are an integral part of the financial statements.
74
Pacer US Cash Cows Growth ETF
SCHEDULE OF INVESTMENTS
April 30, 2020
| | | Shares | | | Value | |
COMMON STOCKS — 99.8% | | | | |
| | | | | | | | | |
Aerospace/Defense — 5.4% | | | | |
Lockheed Martin Corp. | | | 158 | | | $ | 61,472 | |
| | | | | | | | | |
Apparel — 0.6% | | | | |
Deckers Outdoor Corp. (a) | | | 45 | | | | 6,694 | |
| | | | | | | | | |
Biotechnology — 1.0% | | | | |
Exelixis, Inc. (a) | | | 491 | | | | 12,125 | |
| | | | | | | | | |
Building Materials — 2.9% | | | | |
Eagle Materials, Inc. | | | 67 | | | | 4,088 | |
Fortune Brands Home & Security, Inc. | | | 225 | | | | 10,845 | |
Masco Corp. | | | 447 | | | | 18,345 | |
| | | | | | | | 33,278 | |
Chemicals — 5.3% | | | | |
Celanese Corp. - Class A | | | 192 | | | | 15,950 | |
Dow, Inc. | | | 1,209 | | | | 44,358 | |
| | | | | | | | 60,308 | |
Commercial Services — 0.8% | | | | |
WEX, Inc. (a) | | | 70 | | | | 9,262 | |
| | | | | | | | | |
Computers — 9.6% | | | | |
Apple, Inc. | | | 186 | | | | 54,647 | |
CACI International, Inc. - Class A (a) | | | 40 | | | | 10,006 | |
Fortinet, Inc. (a) | | | 277 | | | | 29,844 | |
Lumentum Holdings, Inc. (a) | | | 120 | | | | 9,709 | |
Perspecta, Inc. | | | 260 | | | | 5,608 | |
| | | | | | | | 109,814 | |
Electric — 1.2% | | | | |
NRG Energy, Inc. | | | 398 | | | | 13,345 | |
| | | | | | | | | |
Electrical Components & Equipment — 3.7% | | | | |
AMETEK, Inc. | | | 374 | | | | 31,367 | |
Hubbell, Inc. | | | 88 | | | | 10,950 | |
| | | | | | | | 42,317 | |
Electronics — 1.5% | | | | |
Gentex Corp. | | | 404 | | | | 9,793 | |
Jabil, Inc. | | | 245 | | | | 6,968 | |
| | | | | | | | 16,761 | |
Engineering & Construction — 0.8% | | | | |
KBR, Inc. | | | 228 | | | | 4,619 | |
MasTec, Inc. (a) | | | 123 | | | | 4,416 | |
| | | | | | | | 9,035 | |
Hand/Machine Tools — 0.7% | | | | |
Lincoln Electric Holdings, Inc. | | | 97 | | | | 7,809 | |
| | | | | | | | | |
| | | Shares | | | Value | |
Home Builders — 5.2% | | | | |
DR Horton, Inc. | | | 599 | | | $ | 28,285 | |
NVR, Inc. (a) | | | 6 | | | | 18,600 | |
PulteGroup, Inc. | | | 434 | | | | 12,269 | |
| | | | | | | | 59,154 | |
Internet — 9.2% | | | | |
Booking Holdings, Inc. (a) | | | 36 | | | | 53,300 | |
eBay, Inc. | | | 1,296 | | | | 51,620 | |
| | | | | | | | 104,920 | |
Iron/Steel — 0.8% | | | | |
Reliance Steel & Aluminum Co. | | | 108 | | | | 9,675 | |
| | | | | | | | | |
Leisure Time — 0.6% | | | | |
Polaris Industries, Inc. | | | 99 | | | | 7,022 | |
| | | | | | | | | |
Lodging — 0.2% | | | | |
Boyd Gaming Corp. | | | 179 | | | | 2,988 | |
| | | | | | | | | |
Metal Fabricate/Hardware — 0.4% | | | | |
The Timken Co. | | | 122 | | | | 4,585 | |
| | | | | | | | | |
Miscellaneous Manufacturing — 0.9% | | | | |
Carlisle Cos., Inc. | | | 90 | | | | 10,886 | |
| | | | | | | | | |
Office Furnishings — 0.2% | | | | |
Herman Miller, Inc. | | | 95 | | | | 2,141 | |
| | | | | | | | | |
Office/Business Equipment — 2.3% | | | | |
Xerox Holdings Corp. | | | 342 | | | | 6,255 | |
Zebra Technologies Corp. - Class A (a) | | | 87 | | | | 19,981 | |
| | | | | | | | 26,236 | |
Oil & Gas — 6.1% | | | | |
ConocoPhillips | | | 1,649 | | | | 69,423 | |
| | | | | | | | | |
Retail — 3.8% | | | | |
AutoZone, Inc. (a) | | | 38 | | | | 38,772 | |
RH (a) | | | 31 | | | | 4,457 | |
| | | | | | | | 43,229 | |
Semiconductors — 28.3% | | | | |
Applied Materials, Inc. | | | 1,017 | | | | 50,524 | |
Broadcom, Inc. | | | 219 | | | | 59,485 | |
KLA Corp. | | | 255 | | | | 41,843 | |
Lam Research Corp. | | | 196 | | | | 50,035 | |
Microchip Technology, Inc. | | | 385 | | | | 33,776 | |
Qorvo, Inc. (a) | | | 186 | | | | 18,233 | |
QUALCOMM, Inc. | | | 683 | | | | 53,732 | |
Teradyne, Inc. | | | 268 | | | | 16,761 | |
| | | | | | | | 324,389 | |
The accompanying notes are an integral part of the financial statements.
75
Pacer US Cash Cows Growth ETF
SCHEDULE OF INVESTMENTS
April 30, 2020 (Continued)
| | | Shares | | | Value | |
COMMON STOCKS — 99.8% (Continued) | | | | |
| | | | | | | | | |
Software — 2.5% | | | | |
J2 Global, Inc. | | | 78 | | | $ | 6,290 | |
Take-Two Interactive Software, Inc. (a) | | | 182 | | | | 22,031 | |
| | | | | | | | 28,321 | |
Telecommunications — 5.8% | | | | |
Arista Networks, Inc. (a) | | | 123 | | | | 26,974 | |
Motorola Solutions, Inc. | | | 278 | | | | 39,979 | |
| | | | | | | | 66,953 | |
TOTAL COMMON STOCKS (Cost $1,210,773) | | | | | | | 1,142,142 | |
| | | Principal
Amount | | | | | |
SHORT-TERM INVESTMENTS — 0.2% | | | | |
| | | | | | | | | |
Money Market Deposit Accounts, — 0.2% | | | | |
U.S. Bank Money Market Deposit Account, 0.20% (b) | | $ | 2,386 | | | | 2,386 | |
TOTAL SHORT-TERM INVESTMENTS (Cost $2,386) | | | | | | | 2,386 | |
Total Investments (Cost $1,213,159) — 100.0% | | | | | | | 1,144,528 | |
Liabilities in Excess of Other Assets — 0.0% (c) | | | | | | | (196 | ) |
TOTAL NET ASSETS — 100.0% | | | | | | $ | 1,144,332 | |
Percentages are stated as a percent of net assets.
| | (a) | Non-income producing security. |
| | (b) | The rate shown is as of April 30, 2020. |
For Fund compliance purposes, the Fund’s industry classifications refer to any one or more of the industry sub-classifications used by one or more widely recognized market indexes or ratings group indexes, and/or they may be defined by Fund management. This definition does not apply for all purposes of this report, which may combine sub-classifications for reporting ease. Categories are shown as a percentage of net assets.
The accompanying notes are an integral part of the financial statements.
76
Pacer Trendpilot International ETF
SCHEDULE OF INVESTMENTS
April 30, 2020
| | | Shares | | | Value | |
COMMON STOCKS — 0.0% (a) | | | | |
| | | | | | | | | |
Australia — 0.0% (a) | | | | |
AGL Energy Ltd. | | | 160 | | | $ | 1,768 | |
Coles Group Ltd. | | | 195 | | | | 1,971 | |
Commonwealth Bank of Australia | | | 419 | | | | 17,117 | |
Fortescue Metals Group Ltd. | | | 1,256 | | | | 9,789 | |
Insurance Australia Group Ltd. | | | 311 | | | | 1,171 | |
Newcrest Mining Ltd. | | | 27 | | | | 485 | |
Origin Energy Ltd. | | | 454 | | | | 1,645 | |
Telstra Corp. Ltd. | | | 890 | | | | 1,769 | |
Wesfarmers Ltd. | | | 204 | | | | 5,010 | |
Woodside Petroleum Ltd. | | | 279 | | | | 4,082 | |
| | | | | | | | 44,807 | |
Germany — 0.0% (a) | | | | |
Allianz SE - ADR (b) | | | 1 | | | | 18 | |
| | | | | | | | | |
Israel — 0.0% (a) | | | | |
Isracard Ltd. (c) | | | 0 | | | | 1 | |
| | | | | | | | | |
United Kingdom — 0.0% (a) | | | | |
SSE PLC | | | 132 | | | | 2,078 | |
TOTAL COMMON STOCKS (Cost $46,263) | | | | | | | 46,904 | |
| | | Principal
Amount | | | Value | |
SHORT-TERM INVESTMENTS — 100.0% | | | | |
| | | | | | | | | |
Money Market Deposit Accounts, — 13.9% | | | | |
U.S. Bank Money Market Deposit Account, 0.20% (d) | | $ | 21,009,813 | | | $ | 21,009,813 | |
| | | | | |
U.S. Treasury Bills — 86.1% | | | | |
0.00% 6/18/2020 | | | 25,000,000 | | | | 24,997,583 | |
0.00% 5/21/2020 | | | 50,000,000 | | | | 49,997,917 | |
0.00% 6/4/2020 | | | 55,000,000 | | | | 54,995,714 | |
| | | | | | | | 129,991,214 | |
TOTAL SHORT TERM INVESTMENTS (Cost $150,968,732) | | | | | | | 151,001,027 | |
Total Investments (Cost $151,014,995) — 100.0% | | | | | | | 151,047,931 | |
Liabilities in Excess of Other Assets — 0.0% (a) | | | | | | | (9,460 | ) |
TOTAL NET ASSETS — 100.0% | | | | | | $ | 151,038,471 | |
Percentages are stated as a percent of net assets.
ADR American Depositary Receipt
| | (b) | Non-income producing security. |
| | (c) | Less than 1 full share |
| | (d) | The rate shown is as of April 30, 2020. |
For Fund compliance purposes, the Fund’s industry classifications refer to any one or more of the industry sub-classifications used by one or more widely recognized market indexes or ratings group indexes, and/or they may be defined by Fund management. This definition does not apply for all purposes of this report, which may combine sub-classifications for reporting ease. Categories are shown as a percentage of net assets.
The accompanying notes are an integral part of the financial statements.
77
Pacer Emerging Markets Cash Cows 100 ETF
SCHEDULE OF INVESTMENTS
April 30, 2020
| | | Shares | | | Value | |
COMMON STOCKS — 92.1% | | | | |
| | | | | | | | | |
Bermuda — 0.2% | | | | |
Luye Pharma Group Ltd. (a) | | | 3,317 | | | $ | 1,617 | |
| | | | | | | | | |
Brazil — 7.2% | | | | |
Ambev SA - ADR | | | 5,431 | | | | 11,677 | |
Cosan SA | | | 373 | | | | 4,138 | |
CPFL Energia SA | | | 1,173 | | | | 6,497 | |
JBS SA | | | 3,882 | | | | 16,955 | |
Petrobras Distribuidora SA | | | 1,268 | | | | 4,601 | |
TIM Participacoes SA - ADR | | | 492 | | | | 5,717 | |
Transmissora Alianca de Energia Eletrica SA | | | 307 | | | | 1,553 | |
Vale SA - ADR | | | 1,958 | | | | 16,153 | |
YDUQS Participacoes SA | | | 248 | | | | 1,410 | |
| | | | | | | | 68,701 | |
China — 12.5% | | | | |
Air China Ltd. | | | 24,624 | | | | 17,692 | |
Angang Steel Co. Ltd. | | | 15,164 | | | | 4,127 | |
Anhui Conch Cement Co. Ltd. | | | 3,504 | | | | 27,571 | |
China Communications Services Corp Ltd. | | | 5,405 | | | | 3,842 | |
China Shenhua Energy Co Ltd. | | | 12,026 | | | | 21,500 | |
Great Wall Motor Co. Ltd. | | | 11,472 | | | | 7,665 | |
Weichai Power Co. Ltd. | | | 12,374 | | | | 21,643 | |
Zhuzhou CRRC Times Electric Co Ltd. | | | 1,786 | | | | 5,506 | |
Zoomlion Heavy Industry Science and Technology Co. Ltd. | | | 11,950 | | | | 9,619 | |
| | | | | | | | 119,165 | |
Colombia — 1.4% | | | | |
Ecopetrol SA - ADR | | | 1,263 | | | | 13,198 | |
| | | | | | | | | |
Greece — 0.3% | | | | |
OPAP SA | | | 312 | | | | 2,804 | |
| | | | | | | | | |
Hong Kong — 11.7% | | | | |
China Medical System Holdings Ltd. | | | 2,738 | | | | 3,264 | |
China Resources Cement Holdings Ltd. | | | 14,281 | | | | 19,342 | |
China Unicom Hong Kong Ltd. | | | 27,063 | | | | 17,489 | |
CITIC Ltd. | | | 18,991 | | | | 19,769 | |
CNOOC Ltd. - ADR | | | 163 | | | | 18,316 | |
Kingboard Holdings Ltd. | | | 2,574 | | | | 6,348 | |
Kingboard Laminates Holdings Ltd. | | | 4,975 | | | | 4,871 | |
Kunlun Energy Co Ltd. | | | 14,655 | | | | 9,546 | |
Sinotruk Hong Kong Ltd. | | | 6,409 | | | | 12,913 | |
| | | | | | | | 111,858 | |
| | | Shares | | | Value | |
Indonesia — 4.1% | | | | |
Adaro Energy Tbk PT | | | 57,088 | | | $ | 3,531 | |
Gudang Garam Tbk PT | | | 1,640 | | | | 4,994 | |
Hanjaya Mandala Sampoerna Tbk PT | | | 72,520 | | | | 7,776 | |
Perusahaan Gas Negara Tbk PT | | | 71,770 | | | | 4,125 | |
Telekomunikasi Indonesia Persero Tbk PT | | | 80,587 | | | | 18,962 | |
| | | | | | | | 39,388 | |
Kuwait — 1.2% | | | | |
Mobile Telecommunications Co KSC | | | 6,546 | | | �� | 11,217 | |
| | | | | | | | | |
Malaysia — 2.0% | | | | |
MISC Bhd | | | 5,126 | | | | 9,406 | |
Petronas Chemicals Group Bhd | | | 7,162 | | | | 9,327 | |
| | | | | | | | 18,733 | |
Mexico — 4.6% | | | | |
Fomento Economico Mexicano SAB de CV - ADR | | | 270 | | | | 17,369 | |
Grupo Aeroportuario del Sureste SAB de CV - ADR | | | 32 | | | | 3,191 | |
Grupo Mexico SAB de CV | | | 8,855 | | | | 18,830 | |
Orbia Advance Corp SAB de CV | | | 3,514 | | | | 4,180 | |
| | | | | | | | 43,570 | |
Russian Federation — 13.0% | | | | |
Inter RAO UES PJSC | | | 226,162 | | | | 15,237 | |
LUKOIL PJSC - ADR | | | 256 | | | | 16,768 | |
Magnitogorsk Iron & Steel Works PJSC | | | 17,207 | | | | 9,334 | |
MMC Norilsk Nickel PJSC - ADR | | | 811 | | | | 22,530 | |
Novolipetsk Steel PJSC | | | 9,938 | | | | 17,185 | |
Severstal PAO | | | 1,105 | | | | 13,245 | |
Surgutneftegas PJSC | | | 30,861 | | | | 15,433 | |
Tatneft PJSC | | | 336 | | | | 14,992 | |
| | | | | | | | 124,724 | |
Singapore — 0.5% | | | | |
Yangzijiang Shipbuilding Holdings Ltd. | | | 7,454 | | | | 5,207 | |
| | | | | | | | | |
South Africa — 4.0% | | | | |
African Rainbow Minerals Ltd. | | | 362 | | | | 2,662 | |
AVI Ltd. | | | 230 | | | | 976 | |
Foschini Group Ltd/The | | | 295 | | | | 1,162 | |
Impala Platinum Holdings Ltd. | | | 708 | | | | 4,286 | |
Kumba Iron Ore Ltd. | | | 649 | | | | 12,350 | |
Mr Price Group Ltd. | | | 301 | | | | 2,144 | |
MultiChoice Group (b) | | | 574 | | | | 2,701 | |
Vodacom Group Ltd. | | | 1,826 | | | | 12,139 | |
| | | | | | | | 38,420 | |
The accompanying notes are an integral part of the financial statements.
78
Pacer Emerging Markets Cash Cows 100 ETF
SCHEDULE OF INVESTMENTS
April 30, 2020 (Continued)
| | | Shares | | | Value | |
COMMON STOCKS — 92.1% (Continued) | | | | |
| | | | | | | | | |
Taiwan — 16.5% | | | | |
Asia Cement Corp. | | | 5,960 | | | $ | 8,799 | |
Catcher Technology Co. Ltd. | | | 1,337 | | | | 10,251 | |
Cheng Shin Rubber Industry Co Ltd. | | | 2,829 | | | | 3,287 | |
Chicony Electronics Co Ltd. | | | 994 | | | | 2,821 | |
Compal Electronics, Inc. | | | 4,888 | | | | 3,140 | |
Foxconn Technology Co. Ltd. | | | 4,328 | | | | 8,383 | |
Globalwafers Co. Ltd. | | | 414 | | | | 5,360 | |
Hon Hai Precision Industry Co Ltd. | | | 8,285 | | | | 21,453 | |
Lite-On Technology Corp. | | | 2,494 | | | | 3,900 | |
MediaTek, Inc. | | | 843 | | | | 11,765 | |
Novatek Microelectronics Corp. | | | 387 | | | | 2,427 | |
Pegatron Corp. | | | 4,449 | | | | 9,890 | |
President Chain Store Corp. | | | 1,039 | | | | 10,762 | |
Realtek Semiconductor Corp. | | | 372 | | | | 3,221 | |
Taiwan Mobile Co Ltd. | | | 3,144 | | | | 11,366 | |
Uni-President Enterprises Corp. | | | 7,080 | | | | 16,547 | |
Walsin Technology Corp. | | | 854 | | | | 6,117 | |
Wistron Corp. | | | 8,467 | | | | 8,044 | |
Yageo Corp. | | | 773 | | | | 10,164 | |
| | | | | | | | 157,697 | |
Thailand — 7.6% | | | | |
Advanced Info Service PCL | | | 2,326 | | | | 14,234 | |
Electricity Generating PCL | | | 769 | | | | 6,798 | |
Indorama Ventures PCL | | | 16,445 | | | | 14,613 | |
PTT Exploration & Production PCL | | | 6,120 | | | | 15,983 | |
PTT PCL | | | 17,220 | | | | 18,894 | |
Ratch Group PCL | | | 1,154 | | | | 2,372 | |
| | | | | | | | 72,894 | |
Turkey — 5.3% | | | | |
BIM Birlesik Magazalar AS | | | 546 | | | | 4,324 | |
Eregli Demir ve Celik Fabrikalari TAS | | | 8,838 | | | | 10,229 | |
KOC Holding AS | | | 5,380 | | | | 11,808 | |
Tofas Turk Otomobil Fabrikasi AS | | | 1,520 | | | | 4,858 | |
Tupras Turkiye Petrol Rafinerileri AS (b) | | | 608 | | | | 7,898 | |
Turk Telekomunikasyon AS (b) | | | 6,330 | | | | 6,684 | |
Turkcell Iletisim Hizmetleri AS | | | 2,493 | | | | 4,976 | |
| | | | | | | | 50,777 | |
TOTAL COMMON STOCKS (Cost $1,066,200) | | | | | | | 879,970 | |
| | | | | |
| | | Shares | | | Value | |
PREFERRED STOCKS — 5.0% | | | | |
| | | | | | | | | |
Brazil — 3.5% | | | | |
Cia de Transmissao de Energia Eletrica Paulista | | | 784 | | | $ | 2,783 | |
Cia Paranaense de Energia | | | 433 | | | | 4,412 | |
Petroleo Brasileiro SA - ADR | | | 1,718 | | | | 11,459 | |
Telefonica Brasil SA - ADR | | | 1,770 | | | | 14,868 | |
| | | | | | | | 33,522 | |
Russian Federation — 1.5% | | | | |
Transneft PJSC | | | 8 | | | | 14,713 | |
TOTAL PREFERRED STOCKS (Cost $80,277) | | | | | | | 48,235 | |
| | | | | |
EXCHANGE TRADED FUNDS — 2.1% | | | | |
iShares MSCI Emerging Markets ETF | | | 175 | | | | 6,412 | |
iShares MSCI Saudi Arabia ETF | | | 515 | | | | 13,169 | |
TOTAL EXCHANGE TRADED FUNDS (Cost $22,900) | | | | | | | 19,581 | |
| | | | | |
REAL ESTATE INVESTMENT TRUSTS — 0.4% | | | | |
| | | | | | | | | |
South Africa — 0.4% | | | | |
Growthpoint Properties Ltd. | | | 3,872 | | | | 2,910 | |
Redefine Properties Ltd. | | | 8,203 | | | | 1,004 | |
TOTAL REAL ESTATE INVESTMENT TRUSTS (Cost $11,128) | | | | | | | 3,914 | |
The accompanying notes are an integral part of the financial statements.
79
Pacer Emerging Markets Cash Cows 100 ETF
SCHEDULE OF INVESTMENTS
April 30, 2020 (Continued)
| | | Principal
Amount | | | Value | |
SHORT-TERM INVESTMENTS 0.5% |
| | | | | | | | | |
Money Market Deposit Accounts — 0.5% | | | | |
U.S. Bank Money Market Deposit Account 0.20% (c) | | $ | 4,684 | | | $ | 4,684 | |
TOTAL MONEY MARKET FUNDS (Cost $4,684) | | | | | | | 4,684 | |
Total Investments (Cost $1,185,189) — 100.1% | | | | | | | 956,384 | |
Liabilities in Excess of Other Assets — (0.1)% | | | | | | | (818 | ) |
TOTAL NET ASSETS — 100.0% | | | | | | $ | 955,566 | |
Percentages are stated as a percent of net assets.
ADR American Depositary Receipt
| | (a) | Security exempt from registration under Rule 144(a) of the Securities Act of 1933. Such securities are treated as liquid securities according to the Fund’s liquidity guidelines. The value of those securities total $1,617 or 0.2% of net assets. |
| | (b) | Non-income producing security. |
| | (c) | The rate shown is as of April 30, 2020. |
The accompanying notes are an integral part of the financial statements.
80
Pacer Cash Cows Fund of Funds ETF
SCHEDULE OF INVESTMENTS
April 30, 2020
| | | Shares | | | Value | |
AFFILIATED EXCHANGE TRADED FUNDS — 100.0% | | | | |
Pacer Developed Markets International Cash Cows 100 ETF | | | 9,510 | | | $ | 197,754 | |
Pacer Global Cash Cows Dividend ETF | | | 8,196 | | | | 201,182 | |
Pacer US Cash Cows 100 ETF | | | 8,322 | | | | 209,699 | |
Pacer US Cash Cows Growth ETF | | | 9,353 | | | | 214,516 | |
Pacer US Small Cap Cash Cows 100 ETF | | | 10,472 | | | | 217,841 | |
TOTAL EXCHANGE TRADED FUNDS (Cost $1,261,689) | | | | | | | 1,040,992 | |
| | | Principal
Amount | | | | | |
SHORT-TERM INVESTMENTS — 0.0% (a) | | | | |
| | | | | | | | | |
Money Market Deposit Accounts, — 0.0% (a) | | | | |
U.S. Bank Money Market Deposit Account, 0.20% (b) | | $ | 411 | | | | 411 | |
TOTAL SHORT-TERM INVESTMENTS (Cost $411) | | | | | | | 411 | |
Total Investments (Cost $1,262,100) — 100.0% | | | | | | | 1,041,403 | |
Liabilities in Excess of Other Assets — 0.0% (a) | | | | | | | (118 | ) |
TOTAL NET ASSETS — 100.0% | | | | | | $ | 1,041,285 | |
Percentages are stated as a percent of net assets.
| | (b) | The rate shown is as of April 30, 2020. |
For Fund compliance purposes, the Fund’s industry classifications refer to any one or more of the industry sub-classifications used by one or more widely recognized market indexes or ratings group indexes, and/or they may be defined by Fund management. This definition does not apply for all purposes of this report, which may combine sub-classifications for reporting ease. Categories are shown as a percentage of net assets.
The accompanying notes are an integral part of the financial statements.
81
Pacer Trendpilot Fund of Funds ETF
SCHEDULE OF INVESTMENTS
April 30, 2020
| | | Shares | | | Value | |
AFFILIATED EXCHANGE TRADED FUNDS — 100.0% |
Pacer Trendpilot 100 ETF | | | 156,725 | | | $ | 5,947,714 | |
Pacer Trendpilot International ETF | | | 457,345 | | | | 10,715,594 | |
Pacer Trendpilot US Large Cap ETF | | | 198,393 | | | | 5,352,643 | |
Pacer Trendpilot US Mid Cap ETF | | | 188,916 | | | | 5,351,990 | |
TOTAL EXCHANGE TRADED FUNDS (Cost $28,450,361) | | | | | | | 27,367,941 | |
| | | Principal
Amount | | | | | |
SHORT-TERM INVESTMENTS — 0.0% (a) | | | | |
| | | | | | | | | |
Money Market Deposit Accounts, — 0.0% (a) | | | | |
U.S. Bank Money Market Deposit Account, 0.20% (b) | | $ | 13,373 | | | | 13,373 | |
TOTAL SHORT-TERM INVESTMENTS (Cost $13,373) | | | | | | | 13,373 | |
Total Investments (Cost $28,463,734) — 100.0% | | | | | | | 27,381,314 | |
Liabilities in Excess of Other Assets — 0.0% (a) | | | | | | | (3,164 | ) |
TOTAL NET ASSETS — 100.0% | | | | | | $ | 27,378,150 | |
Percentages are stated as a percent of net assets.
| | (b) | The rate shown is as of April 30, 2020. |
For Fund compliance purposes, the Fund’s industry classifications refer to any one or more of the industry sub-classifications used by one or more widely recognized market indexes or ratings group indexes, and/or they may be defined by Fund management. This definition does not apply for all purposes of this report, which may combine sub-classifications for reporting ease. Categories are shown as a percentage of net assets.
The accompanying notes are an integral part of the financial statements.
82
Pacer Trendpilot US Bond ETF
SCHEDULE OF INVESTMENTS
April 30, 2020
| | | Principal
Amount | | | Value | |
U.S. TREASURY NOTES/BONDS — 99.2% | | | | |
2.375%, 05/15/2027 | | $ | 9,555,000 | | | $ | 10,791,551 | |
6.375%, 08/15/2027 | | | 565,000 | | | | 803,426 | |
2.250%, 08/15/2027 | | | 9,075,000 | | | | 10,200,867 | |
6.125%, 11/15/2027 | | | 1,315,000 | | | | 1,863,961 | |
2.250%, 11/15/2027 | | | 8,525,000 | | | | 9,610,605 | |
2.750%, 02/15/2028 | | | 9,960,000 | | | | 11,634,914 | |
2.875%, 05/15/2028 | | | 10,580,000 | | | | 12,507,130 | |
2.875%, 08/15/2028 | | | 10,815,000 | | | | 12,835,208 | |
5.500%, 08/15/2028 | | | 950,000 | | | | 1,331,930 | |
5.250%, 11/15/2028 | | | 1,265,000 | | | | 1,761,908 | |
3.125%, 11/15/2028 | | | 10,790,000 | | | | 13,080,346 | |
5.250%, 02/15/2029 | | | 880,000 | | | | 1,234,578 | |
2.625%, 02/15/2029 | | | 10,515,000 | | | | 12,350,607 | |
2.375%, 05/15/2029 | | | 9,330,000 | | | | 10,790,728 | |
1.625%, 08/15/2029 | | | 9,930,000 | | | | 10,852,016 | |
6.125%, 08/15/2029 | | | 720,000 | | | | 1,083,291 | |
1.750%, 11/15/2029 | | | 6,670,000 | | | | 7,376,864 | |
1.500%, 02/15/2030 | | | 12,160,000 | | | | 13,171,988 | |
| | | | | | | | 143,281,918 | |
TOTAL U.S. TREASURY NOTES/BONDS (Cost $140,182,085) | | | | | | | 143,281,918 | |
| | | | | |
| | | Principal
Amount | | | Value | |
SHORT-TERM INVESTMENTS — 0.1% | | | | |
| | | | | | | | | |
Money Market Deposit Accounts, — 0.1% | | | | |
U.S. Bank Money Market Deposit Account 0.20% (a) | | $ | 75,263 | | | $ | $75,263 | |
| | | | | |
TOTAL SHORT-TERM INVESTMENTS (Cost $75,263) | | | | | | | 75,263 | |
Total Investments (Cost $140,257,348) — 99.3% | | | | | | | 143,357,181 | |
Other Assets in Excess of Liabilities — 0.7% | | | | | | | 969,872 | |
TOTAL NET ASSETS — 100.0% | | | | | | $ | 144,327,053 | |
Percentages are stated as a percent of net assets.
| | (a) | The rate shown is as of April 30, 2020. |
For Fund compliance purposes, the Fund’s industry classifications refer to any one or more of the industry sub-classifications used by one or more widely recognized market indexes or ratings group indexes, and/or they may be defined by Fund management. This definition does not apply for all purposes of this report, which may combine sub-classifications for reporting ease. Categories are shown as a percentage of net assets.
The accompanying notes are an integral part of the financial statements.
83
Pacer CSOP FTSE China A50 ETF
SCHEDULE OF INVESTMENTS
April 30, 2020
| | | Shares | | | Value | |
COMMON STOCKS — 99.6% | | | | |
| | | | | | | | | |
Agriculture — 1.5% | | | | |
Muyuan Foodstuff Co. Ltd. | | | 6,500 | | | $ | 117,426 | |
Wens Foodstuffs Group Co. Ltd. | | | 4,700 | | | | 20,147 | |
| | | | | | | | 137,573 | |
Auto Manufacturers — 0.9% | | | | |
SAIC Motor Corp. Ltd. | | | 30,000 | | | | 80,402 | |
| | | | | | | | | |
Banks — 28.3% | | | | |
Agricultural Bank of China Ltd. | | | 424,500 | | | | 208,274 | |
Bank of China Ltd. | | | 233,500 | | | | 115,225 | |
Bank of Communications Co. Ltd. | | | 221,800 | | | | 162,919 | |
China CITIC Bank Corp. Ltd. | | | 30,200 | | | | 22,269 | |
China Construction Bank Corp. | | | 99,700 | | | | 90,905 | |
China Everbright Bank Co. Ltd. | | | 154,400 | | | | 81,665 | |
China Merchants Bank Co. Ltd. | | | 130,300 | | | | 648,350 | |
China Minsheng Banking Corp. Ltd. | | | 306,400 | | | | 255,909 | |
Industrial & Commercial Bank of China Ltd. | | | 239,000 | | | | 175,215 | |
Industrial Bank Co. Ltd. | | | 153,500 | | | | 361,760 | |
Ping An Bank Co. Ltd. | | | 90,300 | | | | 178,370 | |
Shanghai Pudong Development Bank Co. Ltd. | | | 159,400 | | | | 240,272 | |
| | | | | | | | 2,541,133 | |
Beverages — 14.7% | | | | |
Jiangsu Yanghe Brewery Joint-Stock Co. Ltd. | | | 4,900 | | | | 68,399 | |
Kweichow Moutai Co. Ltd. | | | 4,900 | | | | 879,445 | |
Wuliangye Yibin Co. Ltd. | | | 19,500 | | | | 375,422 | |
| | | | | | | | 1,323,266 | |
Building Materials — 1.8% | | | | |
Anhui Conch Cement Co. Ltd. | | | 19,100 | | | | 162,396 | |
| | | | | | | | | |
Coal — 0.6% | | | | |
China Shenhua Energy Co. Ltd. | | | 21,900 | | | | 49,470 | |
| | | | | | | | | |
Consumer Discretionary — 1.9% | | | | |
Midea Group Co. Ltd. | | | 23,000 | | | | 175,302 | |
| | | | | | | | | |
Electric — 1.2% | | | | |
China Yangtze Power Co. Ltd. | | | 43,900 | | | | 108,628 | |
| | | | | | | | | |
Electrical Components & Equipment — 2.5% | | | | |
BOE Technology Group Co. Ltd. | | | 228,900 | | | | 122,044 | |
Contemporary Amperex Technology Co. Ltd. | | | 2,400 | | | | 49,136 | |
Will Semiconductor Ltd. | | | 1,900 | | | | 52,397 | |
| | | | | | | | 223,577 | |
| | | Shares | | | Value | |
Electronics — 3.2% | | | | |
Hangzhou Hikvision Digital Technology Co. Ltd. | | | 31,400 | | | $ | 142,749 | |
Luxshare Precision Industry Co. Ltd. | | | 22,100 | | | | 148,261 | |
| | | | | | | | 291,010 | |
Engineering & Construction — 1.5% | | | | |
China State Construction Engineering Corp. Ltd. | | | 186,100 | | | | 138,280 | |
| | | | | | | | | |
Financial — 4.4% | | | | |
CITIC Securities Co. Ltd. | | | 86,100 | | | | 289,356 | |
CSC Financial Co. Ltd. | | | 4,400 | | | | 21,831 | |
Guotai Junan Securities Co. Ltd. | | | 36,600 | | | | 87,814 | |
| | | | | | | | 399,001 | |
Food — 3.1% | | | | |
Foshan Haitian Flavouring & Food Co. Ltd. | | | 3,000 | | | | 52,295 | |
Inner Mongolia Yili Industrial Group Co. Ltd. | | | 55,400 | | | | 229,704 | |
| | | | | | | | 281,999 | |
Healthcare-Products — 5.2% | | | | |
Gree Electric Appliances Inc. of Zhuhai | | | 47,100 | | | | 365,801 | |
Shenzhen Mindray Bio-Medical Electronics Co. Ltd. | | | 2,800 | | | | 101,763 | |
| | | | | | | | 467,564 | |
Hotels, Restaurants & Leisure — 1.3% | | | | |
China International Travel Service Corp. Ltd. | | | 8,700 | | | | 112,635 | |
| | | | | | | | | |
Insurance — 14.1% | | | | |
China Life Insurance Co. Ltd. | | | 16,200 | | | | 65,562 | |
China Pacific Insurance Group Co. Ltd. | | | 27,900 | | | | 121,734 | |
Ping An Insurance Group Co. of China Ltd. | | | 102,000 | | | | 1,076,973 | |
| | | | | | | | 1,264,269 | |
Internet — 0.1% | | | | |
360 Security Technology, Inc. | | | 4,400 | | | | 11,642 | |
| | | | | | | | | |
Miscellaneous Manufacturing — 0.8% | | | | |
CRRC Corp. Ltd. | | | 82,500 | | | | 72,415 | |
| | | | | | | | | |
Oil & Gas — 1.1% | | | | |
China Petroleum & Chemical Corp. | | | 105,900 | | | | 66,975 | |
PetroChina Co. Ltd. | | | 44,900 | | | | 28,269 | |
| | | | | | | | 95,244 | |
Pharmaceuticals — 3.3% | | | | |
Jiangsu Hengrui Medicine Co. Ltd. | | | 22,500 | | | | 296,720 | |
| | | | | | | | | |
The accompanying notes are an integral part of the financial statements.
84
Pacer CSOP FTSE China A50 ETF
SCHEDULE OF INVESTMENTS
April 30, 2020 (Continued)
| | | Shares | | | Value | |
COMMON STOCKS — 99.6% (Continued) | | | | |
| | | | | | | | | |
Real Estate — 5.0% | | | | |
China Vanke Co. Ltd. | | | 71,700 | | | $ | 272,481 | |
Poly Developments and Holdings Group Co. Ltd. | | | 75,900 | | | | 174,787 | |
| | | | | | | | 447,268 | |
Telecommunications — 2.5% | | | | |
China United Network Communications Ltd. | | | 84,300 | | | | 62,398 | |
Foxconn Industrial Internet Co. Ltd. | | | 12,400 | | | | 25,830 | |
ZTE Corp. (a) | | | 23,800 | | | | 138,674 | |
| | | | | | | | 226,902 | |
Transportation — 0.6% | | | | |
SF Holding Co. Ltd. | | | 7,900 | | | | 52,416 | |
TOTAL COMMON STOCKS (Cost $9,574,873) | | | | | | | 8,959,112 | |
| | | Principal
Amount | | | | | |
SHORT-TERM INVESTMENTS — 0.4% | | | | |
| | | | | | | | | |
Money Market Deposit Accounts, — 0.4% | | | | |
U.S. Bank Money Market Deposit Account, 0.20% (b) | | $ | 31,921 | | | | 31,921 | |
TOTAL SHORT-TERM INVESTMENTS (Cost $31,921) | | | | | | | 31,921 | |
Total Investments (Cost $9,606,794) — 100.0% | | | | | | | 8,991,033 | |
Other Assets in Excess of Liabilities — 0.0% (c) | | | | | | | 1,314 | |
TOTAL NET ASSETS — 100.0% | | | | | | $ | 8,992,347 | |
Percentages are stated as a percent of net assets.
| | (a) | Non-income producing security. |
| | (b) | The rate shown is as of April 30, 2020. |
For Fund compliance purposes, the Fund’s industry classifications refer to any one or more of the industry sub-classifications used by one or more widely recognized market indexes or ratings group indexes, and/or they may be defined by Fund management. This definition does not apply for all purposes of this report, which may combine sub-classifications for reporting ease. Categories are shown as a percentage of net assets.
The accompanying notes are an integral part of the financial statements.
85
Pacer Funds
STATEMENTS OF ASSETS & LIABILITIES
April 30, 2020
| | | Pacer
Trendpilot ®
US Large
Cap ETF | | | Pacer
Trendpilot ®
US Mid
Cap ETF | | | Pacer
Trendpilot ®
100 ETF | | | Pacer
Trendpilot ®
European
Index ETF | | | Pacer
Global
Cash Cows
Dividend ETF | |
ASSETS | | | | | | | | | | | | | | | | | | | | |
Investments in Securities, at Value* ^ | | $ | 3,170,930,267 | | | $ | 703,061,414 | | | $ | 838,904,803 | | | $ | 117,932,802 | | | $ | 169,701,078 | |
Foreign Currency at Value* | | | — | | | | — | | | | — | | | | 4,688 | | | | 365,644 | |
Interest and Dividends Receivable | | | 5,173 | | | | 8,455 | | | | 64,781 | | | | 522,035 | | | | 1,163,143 | |
Receivable for Investment Securities Sold | | | 24,446,449 | | | | — | | | | 1,880,728 | | | | — | | | | — | |
Securities Lending Income Receivable | | | 209,788 | | | | 44,503 | | | | 36,816 | | | | 7,875 | | | | 9,545 | |
Total Assets | | | 3,195,591,677 | | | | 703,114,372 | | | | 840,887,128 | | | | 118,467,400 | | | | 171,239,410 | |
| | | | | | | | | | | | | | | | | | | | | |
LIABILITIES | | | | | | | | | | | | | | | | | | | | |
Management Fees Payable | | | 1,230,998 | | | | 267,316 | | | | 369,190 | | | | 51,727 | | | | 66,819 | |
Payable for Fund Shares Redeemed | | | 41,841,385 | | | | — | | | | 1,891,320 | | | | — | | | | — | |
Collateral Received For Securities Loaned (See Note 5) | | | 748,680,000 | | | | 162,796,536 | | | | 99,368,834 | | | | 26,928,000 | | | | 35,692,945 | |
Total Liabilities | | | 791,752,383 | | | | 163,063,852 | | | | 101,629,344 | | | | 26,979,727 | | | | 35,759,764 | |
| | | | | | | | | | | | | | | | | | | | | |
NET ASSETS | | $ | 2,403,839,294 | | | $ | 540,050,520 | | | $ | 739,257,784 | | | $ | 91,487,673 | | | $ | 135,479,646 | |
| | | | | | | | | | | | | | | | | | | | | |
NET ASSETS CONSIST OF: | | | | | | | | | | | | | | | | | | | | |
Paid-in Capital | | $ | 2,874,678,587 | | | $ | 653,215,204 | | | $ | 715,698,598 | | | $ | 139,068,868 | | | $ | 191,234,791 | |
Total Distributable Earnings (Accumulated Deficit) | | | (470,839,293 | ) | | | (113,164,684 | ) | | | 23,559,186 | | | | (47,581,195 | ) | | | (55,755,145 | ) |
Net Assets | | $ | 2,403,839,294 | | | $ | 540,050,520 | | | $ | 739,257,784 | | | $ | 91,487,673 | | | $ | 135,479,646 | |
* Identified Cost: | | | | | | | | | | | | | | | | | | | | |
Investments in Securities | | $3,170,573,307 | | | | $ | 702,797,224 | | | $ | 744,385,829 | | | $ | 117,921,179 | | | $ | 208,474,020 | |
Foreign Currencies | | | — | | | | — | | | | — | | | | 4,619 | | | | 367,221 | |
^ Includes Loaned Securities with a value of | | | 733,919,260 | | | | 159,590,062 | | | | 95,098,293 | | | | 26,397,624 | | | | 33,833,161 | |
| | | | | | | | | | | | | | | | | | | | | |
Net Asset Value: | | | | | | | | | | | | | | | | | | | | |
Net Assets | | $ | 2,403,839,294 | | | $ | 540,050,520 | | | $ | 739,257,784 | | | $ | 91,487,673 | | | $ | 135,479,646 | |
Shares Outstanding (No Par Value) | | | 89,050,000 | | | | 19,050,000 | | | | 19,500,000 | | | | 3,850,000 | | | | 5,500,000 | |
Net Asset Value, Offering and Redemption Price per Share | | $ | 26.99 | | | $ | 28.35 | | | $ | 37.91 | | | $ | 23.76 | | | $ | 24.63 | |
The accompanying notes are an integral part of the financial statements.
86
Pacer Funds
STATEMENTS OF ASSETS & LIABILITIES
April 30, 2020
| | | Pacer
US
Cash Cows
100 ETF | | | Pacer
US Small
Cap Cash
Cows
100 ETF | | | Pacer
Developed
Markets
International
Cash Cows
100 ETF | | | Pacer
WealthShield
ETF | | | Pacer
Military Times
Best Employers
ETF | |
ASSETS | | | | | | | | | | | | | | | | | | | | |
Investments in Securities, at Value* ^ | | $ | 245,655,520 | | | $ | 18,215,896 | | | $ | 25,067,208 | | | $ | 65,929,401 | | | $ | 2,771,152 | |
Foreign Currency at Value* | | | — | | | | — | | | | 968 | | | | — | | | | — | |
Interest and Dividends Receivable | | | 148,397 | | | | 15,719 | | | | 178,501 | | | | 360,247 | | | | 3,080 | |
Receivable for Investment Securities Sold | | | 1,291,239 | | | | — | | | | 177,992 | | | | — | | | | — | |
Securities Lending Income Receivable | | | 10,923 | | | | 1,563 | | | | 1,498 | | | | 3,408 | | | | — | |
Total Assets | | | 247,106,079 | | | | 18,233,178 | | | | 25,426,167 | | | | 66,293,056 | | | | 2,774,232 | |
| | | | | | | | | | | | | | | | | | | | | |
LIABILITIES | | | | | | | | | | | | | | | | | | | | |
Management Fees Payable | | | 70,133 | | | | 6,405 | | | | 12,241 | | | | 24,899 | | | | 1,295 | |
Due to Custodian | | | — | | | | — | | | | 154,186 | | | | — | | | | — | |
Payable for Fund Shares Redeemed | | | 1,295,820 | | | | — | | | | — | | | | — | | | | — | |
Collateral Received For Securities Loaned (See Note 5) | | | 55,713,285 | | | | 3,692,829 | | | | 4,268,426 | | | | 14,840,252 | | | | — | |
Total Liabilities | | | 57,079,238 | | | | 3,699,234 | | | | 4,434,853 | | | | 14,865,151 | | | | 1,295 | |
| | | | | | | | | | | | | | | | | | | | | |
NET ASSETS | | $ | 190,026,841 | | | $ | 14,533,944 | | | $ | 20,991,314 | | | $ | 51,427,905 | | | $ | 2,772,937 | |
| | | | | | | | | | | | | | | | | | | | | |
NET ASSETS CONSIST OF: | | | | | | | | | | | | | | | | | | | | |
Paid-in Capital | | $ | 249,592,628 | | | $ | 31,420,049 | | | $ | 32,021,406 | | | $ | 71,185,942 | | | $ | 2,916,492 | |
Total Distributable Earnings (Accumulated Deficit) | | | (59,565,787 | ) | | | (16,886,105 | ) | | | (11,030,092 | ) | | | (19,758,037 | ) | | | (143,555 | ) |
Net Assets | | $ | 190,026,841 | | | $ | 14,533,944 | | | $ | 20,991,314 | | | $ | 51,427,905 | | | $ | 2,772,937 | |
* Identified Cost: | | | | | | | | | | | | | | | | | | | | |
Investments in Securities | | $ | 262,055,249 | | | $ | 20,797,430 | | | $ | 31,450,681 | | | $ | 62,187,424 | | | $ | 2,852,680 | |
Foreign Currencies | | | — | | | | — | | | | 796 | | | | — | | | | — | |
^ Includes Loaned Securities with a value of | | | 52,125,060 | | | | 3,451,069 | | | | 4,045,773 | | | | 14,451,332 | | | | — | |
| | | | | | | | | | | | | | | | | | | | | |
Net Asset Value: | | | | | | | | | | | | | | | | | | | | |
Net Assets | | $ | 190,026,841 | | | $ | 14,533,944 | | | $ | 20,991,314 | | | $ | 51,427,905 | | | $ | 2,772,937 | |
Shares Outstanding (No Par Value) | | | 7,550,000 | | | | 700,000 | | | | 1,000,000 | | | | 2,150,000 | | | | 100,000 | |
Net Asset Value, Offering and Redemption Price per Share | | $ | 25.17 | | | $ | 20.76 | | | $ | 20.99 | | | $ | 23.92 | | | $ | 27.73 | |
The accompanying notes are an integral part of the financial statements.
87
Pacer Funds
STATEMENTS OF ASSETS & LIABILITIES
April 30, 2020
| | | Pacer
Benchmark
Retail Real Estate
SCTRSM ETF | | | Pacer
Benchmark
Industrial
Real Estate
SCTRSM ETF | | | Pacer
Benchmark
Data &
Infrastructure
Real Estate
SCTRSM ETF | | | Pacer
US Export
Leaders ETF | | | Pacer
CFRA-Stovall
Equal Weight
Seasonal
Rotation ETF | |
ASSETS | | | | | | | | | | | | | | | | | | | | |
Investments in Securities, at Value* ^ | | $ | 974,018 | | | $ | 50,384,455 | | | $ | 666,173,884 | | | $ | 1,257,390 | | | $ | 60,654,903 | |
Interest and Dividends Receivable | | | 2,817 | | | | 44,794 | | | | 227 | | | | 581 | | | | 28,193 | |
Receivable for Investment Securities Sold | | | — | | | | — | | | | — | | | | — | | | | 61,753,409 | |
Receivable for Fund Shares Sold | | | — | | | | — | | | | 4,997,520 | | | | — | | | | — | |
Securities Lending Income Receivable | | | 57 | | | | 735 | | | | 21,895 | | | | — | | | | — | |
Total Assets | | | 976,892 | | | | 50,429,984 | | | | 671,193,526 | | | | 1,257,971 | | | | 122,436,505 | |
| | | | | | | | | | | | | | | | | | | | | |
LIABILITIES | | | | | | | | | | | | | | | | | | | | |
Management Fees Payable | | | 346 | | | | 22,061 | | | | 233,401 | | | | 568 | | | | 28,223 | |
Payable for Investment Securities Purchased | | | — | | | | — | | | | 13,977,561 | | | | — | | | | 60,556,629 | |
Payable for Fund Shares Redeemed | | | — | | | | — | | | | — | | | | — | | | | 1,297,275 | |
Collateral Received For Securities Loaned (See Note 5) | | | 167,149 | | | | 2,260,475 | | | | 104,768,136 | | | | — | | | | — | |
Total Liabilities | | | 167,495 | | | | 2,282,536 | | | | 118,979,098 | | | | 568 | | | | 61,882,127 | |
| | | | | | | | | | | | | | | | | | | | | |
NET ASSETS | | $ | 809,397 | | | $ | 48,147,448 | | | $ | 552,214,428 | | | $ | 1,257,403 | | | $ | 60,554,378 | |
| | | | | | | | | | | | | | | | | | | | | |
NET ASSETS CONSIST OF: | | | | | | | | | | | | | | | | | | | | |
Paid-in Capital | | $ | 1,504,832 | | | $ | 52,491,678 | | | $ | 524,757,754 | | | $ | 1,574,006 | | | $ | 75,567,568 | |
Total Distributable Earnings (Accumulated Deficit) | | | (695,435 | ) | | | (4,344,230 | ) | | | 27,456,674 | | | | (316,603 | ) | | | (15,013,190 | ) |
Net Assets | | $ | 809,397 | | | $ | 48,147,448 | | | $ | 552,214,428 | | | $ | 1,257,403 | | | $ | 60,554,378 | |
* Identified Cost: | | | | | | | | | | | | | | | | | | | | |
Investments in Securities | | $ | 1,594,988 | | | $ | 51,972,546 | | | $ | 629,995,919 | | | $ | 1,306,757 | | | $ | 60,661,892 | |
Foreign Currencies | | | — | | | | — | | | | — | | | | — | | | | — | |
^ Includes Loaned Securities with a value of | | | 158,924 | | | | 2,162,701 | | | | 100,894,107 | | | | — | | | | — | |
| | | | | | | | | | | | | | | | | | | | | |
Net Asset Value: | | | | | | | | | | | | | | | | | | | | |
Net Assets | | $ | 809,397 | | | $ | 48,147,448 | | | $ | 552,214,428 | | | $ | 1,257,403 | | | $ | 60,554,378 | |
Shares Outstanding (No Par Value) | | | 50,000 | | | | 1,600,000 | | | | 16,600,000 | | | | 50,000 | | | | 2,400,000 | |
Net Asset Value, Offering and Redemption Price per Share | | $ | 16.19 | | | $ | 30.09 | | | $ | 33.27 | | | $ | 25.15 | | | $ | 25.23 | |
The accompanying notes are an integral part of the financial statements.
88
Pacer Funds
STATEMENTS OF ASSETS & LIABILITIES
April 30, 2020
| | | Pacer
US
Cash Cows
Growth ETF | | | Pacer
Trendpilot
International
ETF | | | Pacer
Emerging
Markets
Cash Cows
100 ETF | | | Pacer
Cash Cows
Fund of Funds
ETF | | | Pacer
Trendpilot
Fund of Funds
ETF | |
ASSETS | | | | | | | | | | | | | | | | | | | | |
Investments in Unaffiliated Securities, at Value* | | $ | 1,144,528 | | | $ | 151,047,931 | | | $ | 956,384 | | | $ | 411 | | | $ | 13,373 | |
Investments in Affiliated Securities, at Value* | | $ | — | | | $ | — | | | $ | — | | | $ | 1,040,992 | | | $ | 27,367,941 | |
Foreign Currency at Value* | | | — | | | | | | | | 321 | | | | — | | | | — | |
Interest and Dividends Receivable | | | 322 | | | | 54,672 | | | | 6,813 | | | | — | | | | 2 | |
Receivable for Investment Securities Sold | | | — | | | | 20,188 | | | | 950,611 | | | | — | | | | — | |
Return of Capital Receivable | | | — | | | | 784 | | | | — | | | | — | | | | — | |
Total Assets | | | 1,144,850 | | | | 151,123,575 | | | | 1,914,129 | | | | 1,041,403 | | | | 27,381,316 | |
| | | | | | | | | | | | | | | | | | | | | |
LIABILITIES | | | | | | | | | | | | | | | | | | | | |
Management Fees Payable | | | 518 | | | | 79,416 | | | | 1,043 | | | | 118 | | | | 3,166 | |
Due to Custodian | | | — | | | | 5,688 | | | | — | | | | — | | | | — | |
Payable for Fund Shares Redeemed | | | — | | | | — | | | | 957,520 | | | | — | | | | — | |
Total Liabilities | | | 518 | | | | 85,104 | | | | 958,563 | | | | 118 | | | | 3,166 | |
| | | | | | | | | | | | | | | | | | | | | |
NET ASSETS | | $ | 1,144,332 | | | $ | 151,038,471 | | | $ | 955,566 | | | $ | 1,041,285 | | | $ | 27,378,150 | |
| | | | | | | | | | | | | | | | | | | | | |
NET ASSETS CONSIST OF: | | | | | | | | | | | | | | | | | | | | |
Paid-in Capital | | $ | 1,424,476 | | | $ | 163,395,749 | | | $ | 1,221,121 | | | $ | 1,266,699 | | | $ | 28,519,960 | |
Total Distributable Earnings (Accumulated Deficit) | | | (280,144 | ) | | | (12,357,278 | ) | | | (265,555 | ) | | | (225,414 | ) | | | (1,141,810 | ) |
Net Assets | | $ | 1,144,332 | | | $ | 151,038,471 | | | $ | 955,566 | | | $ | 1,041,285 | | | $ | 27,378,150 | |
* Identified Cost: | | | | | | | | | | | | | | | | | | | | |
Investments in Unaffiliated Securities | | $ | 1,213,159 | | | $ | 151,014,995 | | | $ | 1,185,189 | | | $ | 411 | | | $ | 13,373 | |
Investments in Affiliated Securities | | | — | | | | — | | | | — | | | | 1,261,689 | | | | 28,450,361 | |
Foreign Currencies | | | — | | | | — | | | | 334 | | | | — | | | | — | |
| | | | | | | | | | | | | | | | | | | | | |
Net Asset Value: | | | | | | | | | | | | | | | | | | | | |
Net Assets | | $ | 1,144,332 | | | $ | 151,038,471 | | | $ | 955,566 | | | $ | 1,041,285 | | | $ | 27,378,150 | |
Shares Outstanding (No Par Value) | | | 50,000 | | | | 6,450,000 | | | | 50,000 | | | | 50,000 | | | | 1,150,000 | |
Net Asset Value, Offering and Redemption Price per Share | | $ | 22.89 | | | $ | 23.42 | | | $ | 19.11 | | | $ | 20.83 | | | $ | 23.81 | |
The accompanying notes are an integral part of the financial statements.
89
Pacer Funds
STATEMENTS OF ASSETS & LIABILITIES
April 30, 2020
| | | Pacer
Trendpilot
US Bond
ETF | | | Pacer
CSOP FTSE
China A50
ETF | |
ASSETS | | | | | | | | |
Investments in Securities, at Value* ^ | | $ | 143,357,181 | | | $ | 8,991,033 | |
Foreign Currency at Value* | | | — | | | | 6,257 | |
Interest and Dividends Receivable | | | 1,044,686 | | | | 6 | |
Receivable for Investment Securities Sold | | | 7,402,546 | | | | — | |
Total Assets | | | 151,804,413 | | | | 8,997,296 | |
| | | | | | | | | |
LIABILITIES | | | | | | | | |
Management Fees Payable | | | 65,766 | | | | 4,949 | |
Payable for Investment Securities Purchased | | | 7,411,594 | | | | — | |
Total Liabilities | | | 7,477,360 | | | | 4,949 | |
| | | | | | | | | |
NET ASSETS | | $ | 144,327,053 | | | $ | 8,992,347 | |
| | | | | | | | | |
NET ASSETS CONSIST OF: | | | | | | | | |
Paid-in Capital | | $ | 142,231,133 | | | $ | 10,799,869 | |
Total Distributable Earnings (Accumulated Deficit) | | | 2,095,920 | | | | (1,807,522 | ) |
Net Assets | | $ | 144,327,053 | | | $ | 8,992,347 | |
* Identified Cost: | | | | | | | | |
Investments in Securities | | $ | 140,257,348 | | | $ | 9,606,794 | |
Foreign Currencies | | | — | | | | 6,175 | |
| | | | | | | | | |
Net Asset Value: | | | | | | | | |
Net Assets | | $ | 144,327,053 | | | $ | 8,992,347 | |
Shares Outstanding (No Par Value) | | | 5,600,000 | | | | 555,882 | |
Net Asset Value, Offering and Redemption Price per Share | | $ | 25.77 | | | $ | 16.18 | |
The accompanying notes are an integral part of the financial statements.
90
Pacer Funds
STATEMENTS OF OPERATIONS
For the Year Ended April 30, 2020
| | Pacer
Trendpilot ®
US Large
Cap ETF | | | Pacer
Trendpilot ®
US Mid
Cap ETF | | | Pacer
Trendpilot ®
100 ETF | | | Pacer
Trendpilot ®
European
Index ETF | | | Pacer
Global
Cash Cows
Dividend ETF | |
INVESTMENT INCOME | | | | | | | | | | | | | | | | | | | | |
Income: | | | | | | | | | | | | | | | | | | | | |
Dividends* | | $ | 48,340,546 | | | $ | 8,605,630 | | | $ | 6,375,580 | | | $ | 3,229,345 | | | $ | 10,050,560 | |
Interest | | | 790,323 | | | | 992,254 | | | | 14,630 | | | | 80,824 | | | | 6,742 | |
Securities Lending Income | | | 648,643 | | | | 306,164 | | | | 131,804 | | | | 74,587 | | | | 78,863 | |
Total Investment Income | | | 49,779,512 | | | | 9,904,048 | | | | 6,522,014 | | | | 3,384,756 | | | | 10,136,165 | |
| | | | | | | | | | | | | | | | | | | | | |
Expenses: | | | | | | | | | | | | | | | | | | | | |
Management fees | | | 16,107,113 | | | | 3,798,300 | | | | 4,047,795 | | | | 817,129 | | | | 1,188,131 | |
Total Expenses | | | 16,107,113 | | | | 3,798,300 | | | | 4,047,795 | | | | 817,129 | | | | 1,188,131 | |
Net Investment Income (Loss) | | | 33,672,399 | | | | 6,105,748 | | | | 2,474,219 | | | | 2,567,627 | | | | 8,948,034 | |
| | | | | | | | | | | | | | | | | | | | | |
REALIZED & UNREALIZED GAIN (LOSS) ON INVESTMENTS | | | | | | | | | | | | | | | | | | | | |
Net Realized Gain (Loss) on: | | | | | | | | | | | | | | | | | | | | |
Net Realized Gain (Loss) on Investments | | | (445,918,608 | ) | | | (72,080,115 | ) | | | (51,866,455 | ) | | | (11,510,267 | ) | | | (8,380,660 | ) |
Net Realized Gain (Loss) on In-Kind Redemptions | | | 152,994,042 | | | | 32,298,842 | | | | 19,066,067 | | | | 7,519,816 | | | | 6,216,192 | |
Net Realized Gain (Loss) on Foreign Currency | | | — | | | | — | | | | — | | | | (709,363 | ) | | | 19,552 | |
Total | | | (292,924,566 | ) | | | (39,781,273 | ) | | | (32,800,388 | ) | | | (4,699,814 | ) | | | (2,144,916 | ) |
Net Change in Unrealized Appreciation (Depreciation) of: | | | | | | | | | | | | | | | | | | | | |
Change in Unrealized Appreciation (Depreciation) on Investments | | | (112,490,262 | ) | | | (13,366,245 | ) | | | 52,334,741 | | | | (9,768,718 | ) | | | (43,300,573 | ) |
Change in Unrealized Appreciation (Depreciation) on Foreign Currency | | | — | | | | — | | | | — | | | | (9,943 | ) | | | 6,818 | |
Total | | | (112,490,262 | ) | | | (13,366,245 | ) | | | 52,334,741 | | | | (9,778,661 | ) | | | (43,293,755 | ) |
Net Realized and Unrealized Gain (Loss) on Investments | | | (405,414,828 | ) | | | (53,147,518 | ) | | | 19,534,353 | | | | (14,478,475 | ) | | | (45,438,671 | ) |
NET INCREASE (DECREASE) IN NET ASSETS RESULTING FROM OPERATIONS | | $ | (371,742,429 | ) | | $ | (47,041,770 | ) | | $ | 22,008,572 | | | $ | (11,910,848 | ) | | $ | (36,490,637 | ) |
| | | | | | | | | | | | | | | | | | | | | |
* Net of fees and foreign witholding tax of | | $ | 53 | | | $ | 3,414 | | | $ | 6,896 | | | $ | 508,255 | | | $ | 577,395 | |
The accompanying notes are an integral part of the financial statements.
91
Pacer Funds
STATEMENTS OF OPERATIONS
For the Year Ended April 30, 2020
| | | Pacer
US
Cash Cows
100 ETF | | | Pacer
US Small
Cap Cash
Cows
100 ETF | | | Pacer
Developed
Markets
International
Cash Cows
100 ETF | | | Pacer
WealthShield
ETF | | | Pacer
Military Times
Best Employers
ETF | |
INVESTMENT INCOME | | | | | | | | | | | | | | | | | | | | |
Income: | | | | | | | | | | | | | | | | | | | | |
Dividends* | | $ | 7,381,868 | | | $ | 651,643 | | | $ | 1,127,246 | | | $ | 1,057,568 | | | $ | 68,695 | |
Interest | | | 7,840 | | | | 1,177 | | | | 997 | | | | 538,894 | | | | 169 | |
Securities Lending Income | | | 142,240 | | | | 21,982 | | | | 10,903 | | | | 21,563 | | | | — | |
Total Investment Income | | | 7,531,948 | | | | 674,802 | | | | 1,139,146 | | | | 1,618,025 | | | | 68,864 | |
| | | | | | | | | | | | | | | | | | | | | |
Expenses: | | | | | | | | | | | | | | | | | | | | |
Management fees | | | 1,147,200 | | | | 233,898 | | | | 204,919 | | | | 490,393 | | | | 17,811 | |
Total Expenses | | | 1,147,200 | | | | 233,898 | | | | 204,919 | | | | 490,393 | | | | 17,811 | |
Net Investment Income (Loss) | | | 6,384,748 | | | | 440,904 | | | | 934,227 | | | | 1,127,632 | | | | 51,053 | |
| | | | | | | | | | | | | | | | | | | | | |
REALIZED & UNREALIZED GAIN (LOSS) ON INVESTMENTS | | | | | | | | | | | | | | | | | | | | |
Net Realized Gain (Loss) on: | | | | | | | | | | | | | | | | | | | | |
Net Realized Gain (Loss) on Investments | | | (29,512,532 | ) | | | (10,921,832 | ) | | | (2,646,964 | ) | | | (8,851,261 | ) | | | (45,799 | ) |
Net Realized Gain (Loss) on In-Kind Redemptions | | | 20,338,001 | | | | 2,844,207 | | | | 1,547,891 | | | | 3,274,584 | | | | 328,018 | |
Net Realized Gain (Loss) on Foreign Currency | | | — | | | | — | | | | (38,637 | ) | | | — | | | | — | |
Total | | | (9,174,531 | ) | | | (8,077,625 | ) | | | (1,137,710 | ) | | | (5,576,677 | ) | | | 282,219 | |
Net Change in Unrealized Appreciation (Depreciation) of: | | | | | | | | | | | | | | | | | | | | |
Change in Unrealized Appreciation (Depreciation) on Investments | | | (25,628,588 | ) | | | (4,564,010 | ) | | | (6,003,802 | ) | | | (1,499,370 | ) | | | (395,605 | ) |
Change in Unrealized Appreciation (Depreciation) on Foreign Currency | | | — | | | | — | | | | 1,768 | | | | — | | | | — | |
Total | | | (25,628,588 | ) | | | (4,564,010 | ) | | | (6,002,034 | ) | | | (1,499,370 | ) | | | (395,605 | ) |
Net Realized and Unrealized Gain (Loss) on Investments | | | (34,803,119 | ) | | | (12,641,635 | ) | | | (7,139,744 | ) | | | (7,076,047 | ) | | | (113,386 | ) |
NET INCREASE (DECREASE) IN NET ASSETS RESULTING FROM OPERATIONS | | $ | (28,418,371 | ) | | $ | (12,200,731 | ) | | $ | (6,205,517 | ) | | $ | (5,948,415 | ) | | $ | (62,333 | ) |
| | | | | | | | | | | | | | | | | | | | | |
* Net of fees and foreign witholding tax of | | $ | 4,889 | | | $ | 879 | | | $ | 110,070 | | | $ | — | | | $ | — | |
The accompanying notes are an integral part of the financial statements.
92
Pacer Funds
STATEMENTS OF OPERATIONS
For the Year Ended April 30, 2020
| | | Pacer
Benchmark
Retail Real Estate
SCTRSM ETF | | | Pacer
Benchmark
Industrial
Real Estate
SCTRSM ETF | | | Pacer
Benchmark
Data &
Infrastructure
Real Estate
SCTRSM ETF | | | Pacer
US Export
Leaders ETF | | | Pacer
CFRA-Stovall
Equal Weight
Seasonal
Rotation ETF | |
INVESTMENT INCOME | | | | | | | | | | | | | | | | | | | | |
Income: | | | | | | | | | | | | | | | | | | | | |
Dividends* | | $ | 66,585 | | | $ | 824,355 | | | $ | 3,812,506 | | | $ | 15,734 | | | $ | 1,230,678 | |
Interest | | | 84 | | | | 777 | | | | 3,183 | | | | 31 | | | | 1,470 | |
Securities Lending Income | | | 619 | | | | 30,479 | | | | 75,719 | | | | — | | | | — | |
Total Investment Income | | | 67,288 | | | | 855,611 | | | | 3,891,408 | | | | 15,765 | | | | 1,232,148 | |
| | | | | | | | | | | | | | | | | | | | | |
Expenses: | | | | | | | | | | | | | | | | | | | | |
Management fees | | | 10,118 | | | | 171,277 | | | | 1,016,781 | | | | 7,801 | | | | 314,928 | |
Total Expenses | | | 10,118 | | | | 171,277 | | | | 1,016,781 | | | | 7,801 | | | | 314,928 | |
Net Investment Income (Loss) | | | 57,170 | | | | 684,334 | | | | 2,874,627 | | | | 7,964 | | | | 917,220 | |
| | | | | | | | | | | | | | | | | | | | | |
REALIZED & UNREALIZED GAIN (LOSS) ON INVESTMENTS | | | | | | | | | | | | | | | | | | | | |
Net Realized Gain (Loss) on: | | | | | | | | | | | | | | | | | | | | |
Net Realized Gain (Loss) on Investments | | | (32,298 | ) | | | (2,768,408 | ) | | | (8,494,365 | ) | | | (230,223 | ) | | | (14,895,501 | ) |
Net Realized Gain (Loss) on In-Kind Redemptions | | | 191,232 | | | | 222,076 | | | | 3,031,680 | | | | 287,024 | | | | (3,441,334 | ) |
Net Realized Gain (Loss) on Foreign Currency | | | — | | | | — | | | | — | | | | — | | | | — | |
Total | | | 158,934 | | | | (2,546,332 | ) | | | (5,462,685 | ) | | | 56,801 | | | | (18,336,835 | ) |
Net Change in Unrealized Appreciation (Depreciation) of: | | | | | | | | | | | | | | | | | | | | |
Change in Unrealized Appreciation (Depreciation) on Investments | | | (681,351 | ) | | | (1,898,576 | ) | | | 34,852,455 | | | | (99,287 | ) | | | (5,007 | ) |
Change in Unrealized Appreciation (Depreciation) on Foreign Currency | | | — | | | | — | | | | — | | | | — | | | | — | |
Total | | | (681,351 | ) | | | (1,898,576 | ) | | | 34,852,455 | | | | (99,287 | ) | | | (5,007 | ) |
Net Realized and Unrealized Gain (Loss) on Investments | | | (522,417 | ) | | | (4,444,908 | ) | | | 29,389,770 | | | | (42,486 | ) | | | (18,341,842 | ) |
NET INCREASE (DECREASE) IN NET ASSETS RESULTING FROM OPERATIONS | | $ | (465,247 | ) | | $ | (3,760,574 | ) | | $ | 32,264,397 | | | $ | (34,522 | ) | | $ | (17,424,622 | ) |
| | | | | | | | | | | | | | | | | | | | | |
* Net of fees and foreign witholding tax of | | $ | — | | | $ | — | | | $ | — | | | $ | — | | | $ | 405 | |
The accompanying notes are an integral part of the financial statements.
93
Pacer Funds
STATEMENTS OF OPERATIONS
For the Period Ended April 30, 2020
| | | Pacer
US
Cash Cows
Growth ETF(a) | | | Pacer
Trendpilot
International
ETF(a) | | | Pacer
Emerging
Markets
Cash Cows
100 ETF(a) | | | Pacer
Cash Cows
Fund of Funds
ETF(b) | | | Pacer
Trendpilot
Fund of Funds
ETF(b) | |
INVESTMENT INCOME | | | | | | | | | | | | | | | | | | | | |
Income: | | | | | | | | | | | | | | | | | | | | |
Dividends from Unaffiliated Investments* | | $ | 37,086 | | | $ | 1,626,351 | | | $ | 118,274 | | | $ | — | | | $ | — | |
Dividends from Affiliated Investments | | | — | | | | — | | | | — | | | | 45,309 | | | | 143,438 | |
Interest | | | 77 | | | | 92,777 | | | | 472 | | | | 35 | | | | 141 | |
Total Investment Income | | | 37,163 | | | | 1,719,128 | | | | 118,746 | | | | 45,344 | | | | 143,579 | |
| | | | | | | | | | | | | | | | | | | | | |
Expenses: | | | | | | | | | | | | | | | | | | | | |
Management fees | | | 12,680 | | | | 583,490 | | | | 16,063 | | | | 2,815 | | | | 18,277 | |
Total Expenses | | | 12,680 | | | | 583,490 | | | | 16,063 | | | | 2,815 | | | | 18,277 | |
Net Investment Income (Loss) | | | 24,483 | | | | 1,135,638 | | | | 102,683 | | | | 42,529 | | | | 125,302 | |
| | | | | | | | | | | | | | | | | | | | | |
REALIZED & UNREALIZED GAIN (LOSS) ON INVESTMENTS | | | | | | | | | | | | | | | | | | | | |
Net Realized Gain (Loss) on: | | | | | | | | | | | | | | | | | | | | |
Net Realized Gain (Loss) on Investments in Unaffiliated Securities | | | (251,297 | ) | | | (12,387,187 | ) | | | (33,112 | ) | | | — | | | | — | |
Net Realized Gain (Loss) on Investments in Affiliated Securities | | | — | | | | — | | | | — | | | | (4,717 | ) | | | (47,411 | ) |
Net Realized Gain (Loss) on In-Kind Redemptions | | | 286,571 | | | | 2,874,669 | | | | 178,277 | | | | (4,200 | ) | | | — | |
Net Realized Gain (Loss) on Foreign Currency | | | — | | | | (68,367 | ) | | | (2,097 | ) | | | — | | | | — | |
Total | | | 35,274 | | | | (9,580,885 | ) | | | 143,068 | | | | (8,917 | ) | | | (47,411 | ) |
Net Change in Unrealized Appreciation (Depreciation) of: | | | | | | | | | | | | | | | | | | | | |
Change in Unrealized Appreciation (Depreciation) on Investments in Unaffiliated Securities | | | (68,631 | ) | | | 32,936 | | | | (228,805 | ) | | | — | | | | — | |
Change in Unrealized Appreciation (Depreciation) on Investments in Affiliated Securities | | | — | | | | — | | | | — | | | | (220,697 | ) | | | (1,082,420 | ) |
Change in Unrealized Appreciation (Depreciation) on Foreign Currency | | | — | | | | (316 | ) | | | (1,104 | ) | | | — | | | | — | |
Total | | | (68,631 | ) | | | 32,620 | | | | (229,909 | ) | | | (220,697 | ) | | | (1,082,420 | ) |
Net Realized and Unrealized Gain (Loss) on Investments | | | (33,357 | ) | | | (9,548,265 | ) | | | (86,841 | ) | | | (229,614 | ) | | | (1,129,831 | ) |
NET INCREASE (DECREASE) IN NET ASSETS RESULTING FROM OPERATIONS | | $ | (8,874 | ) | | $ | (8,412,627 | ) | | $ | 15,842 | | | $ | (187,085 | ) | | $ | (1,004,529 | ) |
| | | | | | | | | | | | | | | | | | | | | |
* Net of fees and foreign witholding tax of | | $ | — | | | $ | 149,935 | | | $ | 18,857 | | | $ | — | | | $ | — | |
(a) | Fund commenced operations on May 2, 2019. The information presented is from May 2, 2019 to April 30, 2020. |
(b) | Fund commenced operations on May 3, 2019. The information presented is from May 3, 2019 to April 30, 2020. |
The accompanying notes are an integral part of the financial statements.
94
Pacer Funds
STATEMENTS OF OPERATIONS
For the Period Ended April 30, 2020
| | | Pacer
Trendpilot
US Bond
ETF(a) | | | Pacer
CSOP FTSE
China A50
ETF(b) | | | Pacer
CSOP FTSE
China A50
ETF(c) | |
INVESTMENT INCOME | | | | | | | | | | | | |
Income: | | | | | | | | | | | | |
Dividends* | | $ | — | | | $ | 513 | | | $ | 301,595 | |
Interest | | | 1,185,896 | | | | 2,407 | | | | 978 | |
Total Investment Income | | | 1,185,896 | | | | 2,920 | | | | 302,573 | |
| | | | | | | | | | | | | |
Expenses: | | | | | | | | | | | | |
Management fees | | | 231,894 | | | | 58,123 | | | | 79,410 | |
Total Expenses | | | 231,894 | | | | 58,123 | | | | 79,410 | |
Net Investment Income (Loss) | | | 954,002 | | | | (55,203 | ) | | | 223,163 | |
| | | | | | | | | | | | | |
REALIZED & UNREALIZED GAIN (LOSS) ON INVESTMENTS | | | | | | | | | | | | |
Net Realized Gain (Loss) on: | | | | | | | | | | | | |
Net Realized Gain (Loss) on Investments | | | (1,052,497 | ) | | | 3,753,967 | | | | (714,900 | ) |
Net Realized Gain (Loss) on In-Kind Redemptions | | | 131,641 | | | | — | | | | — | |
Net Realized Gain (Loss) on Foreign Currency | | | — | | | | (12,690 | ) | | | (6,443 | ) |
Total | | | (920,856 | ) | | | 3,741,277 | | | | (721,343 | ) |
Net Change in Unrealized Appreciation (Depreciation) of: | | | | | | | | | | | | |
Change in Unrealized Appreciation (Depreciation) on Investments | | | 3,099,833 | | | | (2,319,450 | ) | | | 1,769,590 | |
Change in Unrealized Appreciation (Depreciation) on Foreign Currency | | | — | | | | (582,414 | ) | | | (406 | ) |
Total | | | 3,099,833 | | | | (2,901,864 | ) | | | 1,769,184 | |
Net Realized and Unrealized Gain (Loss) on Investments | | | 2,178,977 | | | | 839,413 | | | | 1,047,841 | |
NET INCREASE (DECREASE) IN NET ASSETS RESULTING FROM OPERATIONS | | $ | 3,132,979 | | | $ | 784,210 | | | $ | 1,271,004 | |
| | | | | | | | | | | | | |
* Net of fees and foreign witholding tax of | | $ | — | | | $ | 81 | | | $ | 33,638 | |
(a) | Fund commenced operations on October 22, 2019. The information presented is from October 22, 2019 to April 30, 2020. |
(b) | For the period ended October 1, 2019 to April 30, 2020. Shares of the Predecessor CSOP Fund converted Shares at the close of business on January 23, 2020. See Note 1 to the Financial Statements. |
(c) | For the year ended September 30, 2019. See Note 1 to the Financial Statements. |
The accompanying notes are an integral part of the financial statements.
95
Pacer Funds
STATEMENTS OF CHANGES IN NET ASSETS
| | Pacer Trendpilot ®
US Large Cap ETF | | | Pacer Trendpilot ®
US Mid Cap ETF | |
| | | For the
Year Ended
April 30,
2020 | | | For the
Year Ended
April 30,
2019 | | | For the
Year Ended
April 30,
2020 | | | For the
Year Ended
April 30,
2019 | |
OPERATIONS | | | | | | | | | | | | | | | | |
Net Investment Income (Loss) | | $ | 33,672,399 | | | $ | 20,310,926 | | | $ | 6,105,748 | | | $ | 8,303,392 | |
Net Realized Gain (Loss) on Investments and Foreign Currency Transactions | | | (292,924,566 | ) | | | 101,688,613 | | | | (39,781,273 | ) | | | 6,792,457 | |
Change in Unrealized Appreciation (Depreciation) of Investments and Foreign Currency Transactions | | | (112,490,262 | ) | | | 11,669,402 | | | | (13,366,245 | ) | | | (12,346,289 | ) |
Net Increase (Decrease) in Net Assets Resulting from Operations | | | (371,742,429 | ) | | | 133,668,941 | | | | (47,041,770 | ) | | | 2,749,560 | |
| | | | | | | | | | | | | | | | | |
DISTRIBUTIONS TO SHAREHOLDERS | | | | | | | | | | | | | | | | |
Dividends and Distributions | | | (33,554,677 | ) | | | (14,704,858 | ) | | | (8,738,254 | ) | | | (5,930,872 | ) |
Total Distributions to Shareholders | | | (33,554,677 | ) | | | (14,704,858 | ) | | | (8,738,254 | ) | | | (5,930,872 | ) |
| | | | | | | | | | | | | | | | | |
CAPITAL SHARE TRANSACTIONS | | | | | | | | | | | | | | | | |
Proceeds from Shares Sold | | | 1,910,014,995 | | | | 1,416,889,645 | | | | 166,856,260 | | | | 524,354,675 | |
Payments for Shares Redeemed | | | (1,264,868,215 | ) | | | (293,839,015 | ) | | | (332,331,150 | ) | | | (257,458,190 | ) |
Net Increase (Decrease) in Net Assets Derived from Capital Share Transactions (a) | | | 645,146,780 | | | | 1,123,050,630 | | | | (165,474,890 | ) | | | 266,896,485 | |
Net Increase (Decrease) in Net Assets | | $ | 239,849,674 | | | $ | 1,242,014,713 | | | $ | (221,254,914 | ) | | $ | 263,715,173 | |
| | | | | | | | | | | | | | | | | |
NET ASSETS | | | | | | | | | | | | | | | | |
Beginning of Year | | $ | 2,163,989,620 | | | $ | 921,974,907 | | | $ | 761,305,434 | | | $ | 497,590,261 | |
End of Year | | $ | 2,403,839,294 | | | $ | 2,163,989,620 | | | $ | 540,050,520 | | | $ | 761,305,434 | |
(a) | Summary of capital share transactions is as follows: |
| | | Shares | | | Shares | | | Shares | | | Shares | |
Subscriptions | | | 65,400,000 | | | | 48,500,000 | | | | 6,000,000 | | | | 16,600,000 | |
Redemptions | | | (47,150,000 | ) | | | (10,150,000 | ) | | | (11,550,000 | ) | | | (8,200,000 | ) |
Net Increase (Decrease) | | | 18,250,000 | | | | 38,350,000 | | | | (5,550,000 | ) | | | 8,400,000 | |
The accompanying notes are an integral part of the financial statements.
96
Pacer Funds
STATEMENTS OF CHANGES IN NET ASSETS
| | | Pacer Trendpilot ® 100 ETF | | | Pacer Trendpilot ®
European Index ETF | |
| | | For the
Year Ended
April 30,
2020 | | | For the
Year Ended
April 30,
2019 | | | For the
Year Ended
April 30,
2020 | | | For the
Year Ended
April 30,
2019 | |
OPERATIONS | | | | | | | | | | | | | | | | |
Net Investment Income (Loss) | | $ | 2,474,219 | | | $ | 2,561,059 | | | $ | 2,567,627 | | | $ | 4,666,930 | |
Net Realized Gain (Loss) on Investments and Foreign Currency Transactions | | | (32,800,388 | ) | | | 35,916,395 | | | | (4,699,814 | ) | | | (31,506,593 | ) |
Change in Unrealized Appreciation (Depreciation) of Investments and Foreign Currency Transactions | | | 52,334,741 | | | | 11,973,440 | | | | (9,778,661 | ) | | | 12,234,413 | |
Net Increase (Decrease) in Net Assets Resulting from Operations | | | 22,008,572 | | | | 50,450,894 | | | | (11,910,848 | ) | | | (14,605,250 | ) |
| | | | | | | | | | | | | | | | | |
DISTRIBUTIONS TO SHAREHOLDERS | | | | | | | | | | | | | | | | |
Dividends and Distributions | | | (3,044,420 | ) | | | (1,575,175 | ) | | | (4,195,663 | ) | | | (2,870,463 | ) |
Total Distributions to Shareholders | | | (3,044,420 | ) | | | (1,575,175 | ) | | | (4,195,663 | ) | | | (2,870,463 | ) |
| | | | | | | | | | | | | | | | | |
CAPITAL SHARE TRANSACTIONS | | | | | | | | | | | | | | | | |
Proceeds from Shares Sold | | | 313,516,410 | | | | 384,518,860 | | | | 42,658,960 | | | | 62,381,365 | |
Payments for Shares Redeemed | | | (95,395,915 | ) | | | (143,127,810 | ) | | | (118,444,135 | ) | | | (20,229,155 | ) |
Transaction Fees (See Note 1) | | | — | | | | — | | | | — | | | | 67 | |
Net Increase (Decrease) in Net Assets Derived from Capital Share Transactions (a) | | | 218,120,495 | | | | 241,391,050 | | | | (75,785,175 | ) | | | 42,152,277 | |
Net Increase (Decrease) in Net Assets | | $ | 237,084,647 | | | $ | 290,266,769 | | | $ | (91,891,686 | ) | | $ | 24,676,564 | |
| | | | | | | | | | | | | | | | | |
NET ASSETS | | | | | | | | | | | | | | | | |
Beginning of Year | | $ | 502,173,137 | | | $ | 211,906,368 | | | $ | 183,379,359 | | | $ | 158,702,795 | |
End of Year | | $ | 739,257,784 | | | $ | 502,173,137 | | | $ | 91,487,673 | | | $ | 183,379,359 | |
(a) | Summary of capital share transactions is as follows: |
| | | Shares | | | Shares | | | Shares | | | Shares | |
Subscriptions | | | 8,300,000 | | | | 11,500,000 | | | | 1,700,000 | | | | 2,300,000 | |
Redemptions | | | (2,750,000 | ) | | | (4,350,000 | ) | | | (4,700,000 | ) | | | (800,000 | ) |
Net Increase (Decrease) | | | 5,550,000 | | | | 7,150,000 | | | | (3,000,000 | ) | | | 1,500,000 | |
The accompanying notes are an integral part of the financial statements.
97
Pacer Funds
STATEMENTS OF CHANGES IN NET ASSETS
| | | Pacer Global Cash
Cows Dividend ETF | | | Pacer US Cash Cows 100 ETF | |
| | | For the
Year Ended
April 30,
2020 | | | For the
Year Ended
April 30,
2019 | | | For the
Year Ended
April 30,
2020 | | | For the
Year Ended
April 30,
2019 | |
OPERATIONS | | | | | | | | | | | | | | | | |
Net Investment Income (Loss) | | $ | 8,948,034 | | | $ | 7,722,639 | | | $ | 6,384,748 | | | $ | 2,694,079 | |
Net Realized Gain (Loss) on Investments and Foreign Currency Transactions | | | (2,144,916 | ) | | | (1,112,320 | ) | | | (9,174,531 | ) | | | (9,497,993 | ) |
Change in Unrealized Appreciation (Depreciation) of Investments and Foreign Currency Transactions | | | (43,293,755 | ) | | | 3,751,284 | | | | (25,628,588 | ) | | | 8,755,096 | |
Net Increase (Decrease) in Net Assets Resulting from Operations | | | (36,490,637 | ) | | | 10,361,603 | | | | (28,418,371 | ) | | | 1,951,182 | |
| | | | | | | | | | | | | | | | | |
DISTRIBUTIONS TO SHAREHOLDERS | | | | | | | | | | | | | | | | |
Dividends and Distributions | | | (8,770,455 | ) | | | (7,760,389 | ) | | | (6,190,930 | ) | | | (2,630,630 | ) |
Total Distributions to Shareholders | | | (8,770,455 | ) | | | (7,760,389 | ) | | | (6,190,930 | ) | | | (2,630,630 | ) |
| | | | | | | | | | | | | | | | | |
CAPITAL SHARE TRANSACTIONS | | | | | | | | | | | | | | | | |
Proceeds from Shares Sold | | | 82,306,360 | | | | 86,580,140 | | | | 105,467,960 | | | | 297,399,660 | |
Payments for Shares Redeemed | | | (112,070,715 | ) | | | (52,389,240 | ) | | | (146,849,935 | ) | | | (59,683,405 | ) |
Transaction Fees (See Note 1) | | | 232 | | | | 2,621 | | | | — | | | | 26 | |
Net Increase (Decrease) in Net Assets Derived from Capital Share Transactions (a) | | | (29,764,123 | ) | | | 34,193,521 | | | | (41,381,975 | ) | | | 237,716,281 | |
Net Increase (Decrease) in Net Assets | | $ | (75,025,215 | ) | | $ | 36,794,735 | | | $ | (75,991,276 | ) | | $ | 237,036,833 | |
| | | | | | | | | | | | | | | | | |
NET ASSETS | | | | | | | | | | | | | | | | |
Beginning of Year | | $ | 210,504,861 | | | $ | 173,710,126 | | | $ | 266,018,117 | | | $ | 28,981,284 | |
End of Year | | $ | 135,479,646 | | | $ | 210,504,861 | | | $ | 190,026,841 | | | $ | 266,018,117 | |
(a) | Summary of capital share transactions is as follows: |
| | | Shares | | | Shares | | | Shares | | | Shares | |
Subscriptions | | | 2,650,000 | | | | 2,850,000 | | | | 3,700,000 | | | | 10,050,000 | |
Redemptions | | | (3,900,000 | ) | | | (1,750,000 | ) | | | (5,100,000 | ) | | | (2,100,000 | ) |
Net Increase (Decrease) | | | (1,250,000 | ) | | | 1,100,000 | | | | (1,400,000 | ) | | | 7,950,000 | |
The accompanying notes are an integral part of the financial statements.
98
Pacer Funds
STATEMENTS OF CHANGES IN NET ASSETS
| | | Pacer US Small Cap
Cash Cows 100 ETF | | | Pacer Developed Markets
International Cash Cows 100 ETF | |
| | | For the
Year Ended
April 30,
2020 | | | For the
Year Ended
April 30,
2019 | | | For the
Year Ended
April 30,
2020 | | | For the
Year Ended
April 30,
2019 | |
OPERATIONS | | | | | | | | | | | | | | | | |
Net Investment Income (Loss) | | $ | 440,904 | | | $ | 335,862 | | | $ | 934,227 | | | $ | 905,517 | |
Net Realized Gain (Loss) on Investments and Foreign Currency Transactions | | | (8,077,625 | ) | | | (2,404,883 | ) | | | (1,137,710 | ) | | | (1,658,309 | ) |
Change in Unrealized Appreciation (Depreciation) of Investments and Foreign Currency Transactions | | | (4,564,010 | ) | | | 1,900,238 | | | | (6,002,034 | ) | | | (742,141 | ) |
Net Increase (Decrease) in Net Assets Resulting from Operations | | | (12,200,731 | ) | | | (168,783 | ) | | | (6,205,517 | ) | | | (1,494,933 | ) |
| | | | | | | | | | | | | | | | | |
DISTRIBUTIONS TO SHAREHOLDERS | | | | | | | | | | | | | | | | |
Dividends and Distributions | | | (419,742 | ) | | | (329,410 | ) | | | (1,009,491 | ) | | | (731,370 | ) |
Total Distributions to Shareholders | | | (419,742 | ) | | | (329,410 | ) | | | (1,009,491 | ) | | | (731,370 | ) |
| | | | | | | | | | | | | | | | | |
CAPITAL SHARE TRANSACTIONS | | | | | | | | | | | | | | | | |
Proceeds from Shares Sold | | | 20,281,980 | | | | 62,486,265 | | | | 12,100,810 | | | | 26,199,335 | |
Payments for Shares Redeemed | | | (43,601,320 | ) | | | (16,747,460 | ) | | | (17,740,240 | ) | | | (10,378,335 | ) |
Transaction Fees (See Note 1) | | | — | | | | — | | | | 1,376 | | | | 15,033 | |
Net Increase (Decrease) in Net Assets Derived from Capital Share Transactions (a) | | | (23,319,340 | ) | | | 45,738,805 | | | | (5,638,054 | ) | | | 15,836,033 | |
Net Increase (Decrease) in Net Assets | | $ | (35,939,813 | ) | | $ | 45,240,612 | | | $ | (12,853,062 | ) | | $ | 13,609,730 | |
| | | | | | | | | | | | | | | | | |
NET ASSETS | | | | | | | | | | | | | | | | |
Beginning of Year | | $ | 50,473,757 | | | $ | 5,233,145 | | | $ | 33,844,376 | | | $ | 20,234,646 | |
End of Year | | $ | 14,533,944 | | | $ | 50,473,757 | | | $ | 20,991,314 | | | $ | 33,844,376 | |
(a) | Summary of capital share transactions is as follows: |
| | | Shares | | | Shares | | | Shares | | | Shares | |
Subscriptions | | | 800,000 | | | | 2,400,000 | | | | 450,000 | | | | 950,000 | |
Redemptions | | | (2,050,000 | ) | | | (650,000 | ) | | | (700,000 | ) | | | (400,000 | ) |
Net Increase (Decrease) | | | (1,250,000 | ) | | | 1,750,000 | | | | (250,000 | ) | | | 550,000 | |
The accompanying notes are an integral part of the financial statements.
99
Pacer Funds
STATEMENTS OF CHANGES IN NET ASSETS
| | | Pacer WealthShield ETF | | | Pacer Military Times
Best Employers ETF | |
| | | For the
Year Ended
April 30,
2020 | | | For the
Year Ended
April 30,
2019 | | | For the
Year Ended
April 30,
2020 | | | For the
Year Ended
April 30,
2019 | |
OPERATIONS | | | | | | | | | | | | | | | | |
Net Investment Income (Loss) | | $ | 1,127,632 | | | $ | 1,414,287 | | | $ | 51,053 | | | $ | 41,763 | |
Net Realized Gain (Loss) on Investments | | | (5,576,677 | ) | | | (6,807,401 | ) | | | 282,219 | | | | 171,135 | |
Change in Unrealized Appreciation (Depreciation) of Investments | | | (1,499,370 | ) | | | 5,265,168 | | | | (395,605 | ) | | | 269,984 | |
Net Increase (Decrease) in Net Assets Resulting from Operations | | | (5,948,415 | ) | | | (127,946 | ) | | | (62,333 | ) | | | 482,882 | |
| | | | | | | | | | | | | | | | | |
DISTRIBUTIONS TO SHAREHOLDERS | | | | | | | | | | | | | | | | |
Dividends and Distributions | | | (1,151,877 | ) | | | (1,397,954 | ) | | | (52,852 | ) | | | (38,615 | ) |
Total Distributions to Shareholders | | | (1,151,877 | ) | | | (1,397,954 | ) | | | (52,852 | ) | | | (38,615 | ) |
| | | | | | | | | | | | | | | | | |
CAPITAL SHARE TRANSACTIONS | | | | | | | | | | | | | | | | |
Proceeds from Shares Sold | | | 28,716,405 | | | | 134,051,800 | | | | 1,499,390 | | | | 1,289,730 | |
Payments for Shares Redeemed | | | (80,267,410 | ) | | | (84,986,710 | ) | | | (1,483,825 | ) | | | (1,394,875 | ) |
Transaction Fees (See Note 1) | | | 1,088 | | | | — | | | | — | | | | — | |
Net Increase (Decrease) in Net Assets Derived from Capital Share Transactions (a) | | | (51,549,917 | ) | | | 49,065,090 | | | | 15,565 | | | | (105,145 | ) |
Net Increase (Decrease) in Net Assets | | $ | (58,650,209 | ) | | $ | 47,539,190 | | | $ | (99,620 | ) | | $ | 339,122 | |
| | | | | | | | | | | | | | | | | |
NET ASSETS | | | | | | | | | | | | | | | | |
Beginning of Year | | $ | 110,078,114 | | | $ | 62,538,924 | | | $ | 2,872,557 | | | $ | 2,533,435 | |
End of Year | | $ | 51,427,905 | | | $ | 110,078,114 | | | $ | 2,772,937 | | | $ | 2,872,557 | |
(a) | Summary of capital share transactions is as follows: |
| | | Shares | | | Shares | | | Shares | | | Shares | |
Subscriptions | | | 1,200,000 | | | | 5,250,000 | | | | 50,000 | | | | 50,000 | |
Redemptions | | | (3,450,000 | ) | | | (3,350,000 | ) | | | (50,000 | ) | | | (50,000 | ) |
Net Increase (Decrease) | | | (2,250,000 | ) | | | 1,900,000 | | | | — | | | | — | |
The accompanying notes are an integral part of the financial statements.
100
Pacer Funds
STATEMENTS OF CHANGES IN NET ASSETS
| | | Pacer Benchmark
Retail Real Estate SCTRSM ETF | | | Pacer Benchmark
Industrial Real Estate SCTRSM ETF | |
| | | For the
Year Ended
April 30,
2020 | | | For the
Period Ended
April 30,
2019(a) | | | For the
Year Ended
April 30,
2020 | | | For the
Period Ended
April 30,
2019(b) | |
OPERATIONS | | | | | | | | | | | | | | | | |
Net Investment Income (Loss) | | $ | 57,170 | | | $ | 83,796 | | | $ | 684,334 | | | $ | 69,245 | |
Net Realized Gain (Loss) on Investments and Foreign Currency Transactions | | | 158,934 | | | | 315,102 | | | | (2,546,332 | ) | | | 165,946 | |
Change in Unrealized Appreciation (Depreciation) of Investments and Foreign Currency Transactions | | | (681,351 | ) | | | 60,380 | | | | (1,898,576 | ) | | | 310,485 | |
Net Increase (Decrease) in Net Assets Resulting from Operations | | | (465,247 | ) | | | 459,278 | | | | (3,760,574 | ) | | | 545,676 | |
| | | | | | | | | | | | | | | | | |
DISTRIBUTIONS TO SHAREHOLDERS | | | | | | | | | | | | | | | | |
Net Investment Income | | | (57,170 | ) | | | (83,796 | ) | | | (656,033 | ) | | | (67,295 | ) |
Long-Term Capital Gain | | | — | | | | (5,909 | ) | | | (6,106 | ) | | | — | |
Return of Capital | | | (15,792 | ) | | | (20,617 | ) | | | — | | | | — | |
Total Distributions to Shareholders | | | (72,962 | ) | | | (110,322 | ) | | | (662,139 | ) | | | (67,295 | ) |
| | | | | | | | | | | | | | | | | |
CAPITAL SHARE TRANSACTIONS | | | | | | | | | | | | | | | | |
Proceeds from Shares Sold | | | 4,080,945 | | | | 5,126,240 | | | | 50,782,050 | | | | 13,242,420 | |
Payments for Shares Redeemed | | | (4,111,900 | ) | | | (4,096,635 | ) | | | (5,567,595 | ) | | | (6,365,095 | ) |
Net Increase (Decrease) in Net Assets Derived from Capital Share Transactions (c) | | | (30,955 | ) | | | 1,029,605 | | | | 45,214,455 | | | | 6,877,325 | |
Net Increase (Decrease) in Net Assets | | $ | (569,164 | ) | | $ | 1,378,561 | | | $ | 40,791,742 | | | $ | 7,355,706 | |
| | | | | | | | | | | | | | | | | |
NET ASSETS | | | | | | | | | | | | | | | | |
Beginning of Period/Year | | $ | 1,378,561 | | | $ | — | | | $ | 7,355,706 | | | $ | — | |
End of Period/Year | | $ | 809,397 | | | $ | 1,378,561 | | | $ | 48,147,448 | | | $ | 7,355,706 | |
(a) | Fund commenced operations on May 15, 2018. The information presented is from May 15, 2018 to April 30, 2019. |
(b) | Fund commenced operations on May 14, 2018. The information presented is from May 14, 2018 to April 30, 2019. |
(c) | Summary of capital share transactions is as follows: |
| | | Shares | | | Shares | | | Shares | | | Shares | |
Subscriptions | | | 150,000 | | | | 200,000 | | | | 1,550,000 | | | | 500,000 | |
Redemptions | | | (150,000 | ) | | | (150,000 | ) | | | (200,000 | ) | | | (250,000 | ) |
Net Increase (Decrease) | | | — | | | | 50,000 | | | | 1,350,000 | | | | 250,000 | |
The accompanying notes are an integral part of the financial statements.
101
Pacer Funds
STATEMENTS OF CHANGES IN NET ASSETS
| | | Pacer Benchmark Data
& Infrastructure Real
Estate SCTRSM ETF | | | Pacer US Export Leaders ETF | |
| | | For the
Year Ended
April 30,
2020 | | | For the
Period Ended
April 30,
2019(a) | | | For the
Year Ended
April 30,
2020 | | | For the
Period Ended
April 30,
2019(b) | |
OPERATIONS | | | | | | | | | | | | | | | | |
Net Investment Income (Loss) | | $ | 2,874,627 | | | $ | 89,288 | | | $ | 7,964 | | | $ | 7,415 | |
Net Realized Gain (Loss) on Investments and Foreign Currency Transactions | | | (5,462,685 | ) | | | (60,129 | ) | | | 56,801 | | | | (157,032 | ) |
Change in Unrealized Appreciation (Depreciation) of Investments and Foreign Currency Transactions | | | 34,852,455 | | | | 1,325,510 | | | | (99,287 | ) | | | 49,919 | |
Net Increase (Decrease) in Net Assets Resulting from Operations | | | 32,264,397 | | | | 1,354,669 | | | | (34,522 | ) | | | (99,698 | ) |
| | | | | | | | | | | | | | | | | |
DISTRIBUTIONS TO SHAREHOLDERS | | | | | | | | | | | | | | | | |
Net Investment Income | | | (2,911,078 | ) | | | (89,513 | ) | | | (7,790 | ) | | | (6,972 | ) |
Long-Term Capital Gain | | | — | | | | (1,372 | ) | | | — | | | | — | |
Return of Capital | | | (340,803 | ) | | | (37,487 | ) | | | — | | | | — | |
Total Distributions to Shareholders | | | (3,251,881 | ) | | | (128,372 | ) | | | (7,790 | ) | | | (6,972 | ) |
| | | | | | | | | | | | | | | | | |
CAPITAL SHARE TRANSACTIONS | | | | | | | | | | | | | | | | |
Proceeds from Shares Sold | | | 513,245,545 | | | | 24,042,230 | | | | 2,760,720 | | | | 2,498,000 | |
Payments for Shares Redeemed | | | (12,735,020 | ) | | | (2,577,140 | ) | | | (2,759,395 | ) | | | (1,092,940 | ) |
Net Increase (Decrease) in Net Assets Derived from Capital Share Transactions (c) | | | 500,510,525 | | | | 21,465,090 | | | | 1,325 | | | | 1,405,060 | |
Net Increase (Decrease) in Net Assets | | $ | 529,523,041 | | | $ | 22,691,387 | | | $ | (40,987 | ) | | $ | 1,298,390 | |
| | | | | | | | | | | | | | | | | |
NET ASSETS | | | | | | | | | | | | | | | | |
Beginning of Period/Year | | $ | 22,691,387 | | | $ | — | | | $ | 1,298,390 | | | $ | — | |
End of Period/Year | | $ | 552,214,428 | | | $ | 22,691,387 | | | $ | 1,257,403 | | | $ | 1,298,390 | |
(a) | Fund commenced operations on May 15, 2018. The information presented is from May 15, 2018 to April 30, 2019. |
(b) | Fund commenced operations on July 23, 2018. The information presented is from July 23, 2018 to April 30, 2019. |
(c) | Summary of capital share transactions is as follows: |
| | | Shares | | | Shares | | | Shares | | | Shares | |
Subscriptions | | | 16,200,000 | | | | 900,000 | | | | 100,000 | | | | 100,000 | |
Redemptions | | | (400,000 | ) | | | (100,000 | ) | | | (100,000 | ) | | | (50,000 | ) |
Net Increase (Decrease) | | | 15,800,000 | | | | 800,000 | | | | — | | | | 50,000 | |
The accompanying notes are an integral part of the financial statements.
102
Pacer Funds
STATEMENTS OF CHANGES IN NET ASSETS
| | | Pacer CFRA-Stovall Equal
Weight Seasonal Rotation ETF | | | Pacer US
Cash Cows
Growth ETF | |
| | | For the
Year Ended
April 30,
2020 | | | For the
Period Ended
April 30,
2019(a) | | | For the
Period Ended
April 30,
2020(b) | |
OPERATIONS | | | | | | | | | | | | |
Net Investment Income (Loss) | | $ | 917,220 | | | $ | 33,358 | | | $ | 24,483 | |
Net Realized Gain (Loss) on Investments and Foreign Currency Transactions | | | (18,336,835 | ) | | | 647,636 | | | | 35,274 | |
Change in Unrealized Appreciation (Depreciation) of Investments and Foreign Currency Transactions | | | (5,007 | ) | | | (1,983 | ) | | | (68,631 | ) |
Net Increase (Decrease) in Net Assets Resulting from Operations | | | (17,424,622 | ) | | | 679,011 | | | | (8,874 | ) |
| | | | | | | | | | | | | |
DISTRIBUTIONS TO SHAREHOLDERS | | | | | | | | | | | | |
Dividends and Distributions | | | (898,227 | ) | | | (29,474 | ) | | | (24,159 | ) |
Total Distributions to Shareholders | | | (898,227 | ) | | | (29,474 | ) | | | (24,159 | ) |
| | | | | | | | | | | | | |
CAPITAL SHARE TRANSACTIONS | | | | | | | | | | | | |
Proceeds from Shares Sold | | | 123,166,500 | | | | 13,278,420 | | | | 6,249,605 | |
Payments for Shares Redeemed | | | (51,328,850 | ) | | | (6,888,380 | ) | | | (5,072,240 | ) |
Net Increase (Decrease) in Net Assets Derived from Capital Share Transactions (c) | | | 71,837,650 | | | | 6,390,040 | | | | 1,177,365 | |
Net Increase (Decrease) in Net Assets | | $ | 53,514,801 | | | $ | 7,039,577 | | | $ | 1,144,332 | |
| | | | | | | | | | | | | |
NET ASSETS | | | | | | | | | | | | |
Beginning of Period/Year | | $ | 7,039,577 | | | $ | — | | | $ | — | |
End of Period/Year | | $ | 60,554,378 | | | $ | 7,039,577 | | | $ | 1,144,332 | |
(a) | Fund commenced operations on July 23, 2018. The information presented is from July 23, 2018 to April 30, 2019. |
(b) | Fund commenced operations on May 2, 2019. The information presented is from May 2, 2019 to April 30, 2020. |
(c) | Summary of capital share transactions is as follows: |
| | | Shares | | | Shares | | | Shares | |
Subscriptions | | | 4,100,000 | | | | 500,000 | | | | 250,000 | |
Redemptions | | | (1,950,000 | ) | | | (250,000 | ) | | | (200,000 | ) |
Net Increase (Decrease) | | | 2,150,000 | | | | 250,000 | | | | 50,000 | |
The accompanying notes are an integral part of the financial statements.
103
Pacer Funds
STATEMENTS OF CHANGES IN NET ASSETS
| | | Pacer
Trendpilot
International ETF | | | Pacer Emerging
Markets Cash
Cows 100 ETF | |
| | | For the
Period Ended
April 30,
2020(a) | | | For the
Period Ended
April 30,
2020(a) | |
OPERATIONS | | | | | | | | |
Net Investment Income (Loss) | | $ | 1,135,638 | | | $ | 102,683 | |
Net Realized Gain (Loss) on Investments and Foreign Currency Transactions | | | (9,580,885 | ) | | | 143,068 | |
Change in Unrealized Appreciation (Depreciation) of Investments and Foreign Currency Transactions | | | 32,620 | | | | (229,909 | ) |
Net Increase (Decrease) in Net Assets Resulting from Operations | | | (8,412,627 | ) | | | 15,842 | |
| | | | | | | | | |
DISTRIBUTIONS TO SHAREHOLDERS | | | | | | | | |
Dividends and Distributions | | | (1,060,524 | ) | | | (149,137 | ) |
Total Distributions to Shareholders | | | (1,060,524 | ) | | | (149,137 | ) |
| | | | | | | | | |
CAPITAL SHARE TRANSACTIONS | | | | | | | | |
Proceeds from Shares Sold | | | 175,364,155 | | | | 5,831,035 | |
Payments for Shares Redeemed | | | (14,856,015 | ) | | | (4,744,030 | ) |
Transaction Fees (See Note 1) | | | 3,482 | | | | 1,856 | |
Net Increase (Decrease) in Net Assets Derived from Capital Share Transactions (b) | | | 160,511,622 | | | | 1,088,861 | |
Net Increase (Decrease) in Net Assets | | $ | 151,038,471 | | | $ | 955,566 | |
| | | | | | | | | |
NET ASSETS | | | | | | | | |
Beginning of Period | | $ | — | | | $ | — | |
End of Period | | $ | 151,038,471 | | | $ | 955,566 | |
(a) | Fund commenced operations on May 2, 2019. The information presented is from May 2, 2019 to April 30, 2020. |
(b) | Summary of capital share transactions is as follows: |
| | | Shares | | | Shares | |
Subscriptions | | | 7,050,000 | | | | 250,000 | |
Redemptions | | | (600,000 | ) | | | (200,000 | ) |
Net Increase | | | 6,450,000 | | | | 50,000 | |
The accompanying notes are an integral part of the financial statements.
104
Pacer Funds
STATEMENTS OF CHANGES IN NET ASSETS
| | | Pacer
Cash Cows
Fund of Funds
ETF | | | Pacer
Trendpilot
Fund of Funds
ETF | |
| | | For the
Period Ended
April 30,
2020(a) | | | For the
Period Ended
April 30,
2020(a) | |
OPERATIONS | | | | | | | | |
Net Investment Income (Loss) | | $ | 42,529 | | | $ | 125,302 | |
Net Realized Gain (Loss) on Investments and Foreign Currency Transactions | | | (8,917 | ) | | | (47,411 | ) |
Change in Unrealized Appreciation (Depreciation) of Investments and Foreign Currency Transactions | | | (220,697 | ) | | | (1,082,420 | ) |
Net Increase (Decrease) in Net Assets Resulting from Operations | | | (187,085 | ) | | | (1,004,529 | ) |
| | | | | | | | | |
DISTRIBUTIONS TO SHAREHOLDERS | | | | | | | | |
Net Investment Income | | | (42,529 | ) | | | (137,281 | ) |
Return of Capital | | | (151 | ) | | | — | |
Total Distributions to Shareholders | | | (42,680 | ) | | | (137,281 | ) |
| | | | | | | | | |
CAPITAL SHARE TRANSACTIONS | | | | | | | | |
Proceeds from Shares Sold | | | 2,531,000 | | | | 28,519,960 | |
Payments for Shares Redeemed | | | (1,259,950 | ) | | | — | |
Net Increase (Decrease) in Net Assets Derived from Capital Share Transactions (b) | | | 1,271,050 | | | | 28,519,960 | |
Net Increase (Decrease) in Net Assets | | $ | 1,041,285 | | | $ | 27,378,150 | |
| | | | | | | | | |
NET ASSETS | | | | | | | | |
Beginning of Period | | $ | — | | | $ | — | |
End of Period | | $ | 1,041,285 | | | $ | 27,378,150 | |
(a) | Fund commenced operations on May 3, 2019. The information presented is from May 3, 2019 to April 30, 2020. |
(b) | Summary of capital share transactions is as follows: |
| | | Shares | | | Shares | |
Subscriptions | | | 100,000 | | | | 1,150,000 | |
Redemptions | | | (50,000 | ) | | | — | |
Net Increase | | | 50,000 | | | | 1,150,000 | |
The accompanying notes are an integral part of the financial statements.
105
Pacer Funds
STATEMENTS OF CHANGES IN NET ASSETS
| | | Pacer
Trendpilot
US Bond
ETF | | | Pacer
CSOP FTSE China A50
ETF | |
| | | For the
Period Ended
April 30,
2020(a) | | | For the
Period Ended
April 30,
2020(b) | | | For the
Year Ended
September 30,
2019 | | | For the
Year Ended
September 30,
2018 | |
OPERATIONS | | | | | | | | | | | | | | | | |
Net Investment Income (Loss) | | $ | 954,002 | | | $ | (55,203 | ) | | $ | 223,163 | | | $ | 152,694 | |
Net Realized Gain (Loss) on Investments and Foreign Currency Transactions | | | (920,856 | ) | | | 3,741,277 | | | | (721,343 | ) | | | (176,170 | ) |
Change in Unrealized Appreciation (Depreciation) of Investments and Foreign Currency Transactions | | | 3,099,833 | | | | (2,901,864 | ) | | | 1,769,184 | | | | (524,082 | ) |
Net Increase (Decrease) in Net Assets Resulting from Operations | | | 3,132,979 | | | | 784,210 | | | | 1,271,004 | | | | (547,558 | ) |
| | | | | | | | | | | | | | | | | |
DISTRIBUTIONS TO SHAREHOLDERS | | | | | | | | | | | | | | | | |
Net Investment Income | | | (913,550 | ) | | | (961,121 | ) | | | (183,318 | ) | | | (472,784 | ) |
Return of Capital | | | — | | | | (58,489 | ) | | | — | | | | — | |
Total Distributions to Shareholders | | | (913,550 | ) | | | (1,019,610 | ) | | | (183,318 | ) | | | (472,784 | ) |
| | | | | | | | | | | | | | | | | |
CAPITAL SHARE TRANSACTIONS | | | | | | | | | | | | | | | | |
Proceeds from Shares Sold | | | 152,226,140 | | | | 14,683,370 | | | | 6,544,377 | | | | 3,496,289 | |
Payments for Shares Redeemed | | | (10,137,840 | ) | | | (18,254,205 | ) | | | (4,160,844 | ) | | | — | |
Transaction Fees (See Note 1) | | | 19,324 | | | | 58,539 | | | | — | | | | — | |
Net Increase (Decrease) in Net Assets Derived from Capital Share Transactions(c) | | | 142,107,624 | | | | (3,512,296 | ) | | | 2,383,533 | | | | 3,496,289 | |
Net Increase (Decrease) in Net Assets | | $ | 144,327,053 | | | $ | (3,747,696 | ) | | $ | 3,471,219 | | | $ | 2,475,947 | |
| | | | | | | | | | | | | | | | | |
NET ASSETS | | | | | | | | | | | | | | | | |
Beginning of Period/Year | | $ | — | | | $ | 12,740,043 | | | $ | 9,268,824 | | | $ | 6,792,877 | |
End of Period/Year | | $ | 144,327,053 | | | $ | 8,992,347 | | | $ | 12,740,043 | | | $ | 9,268,824 | |
(a) | Fund commenced operations on October 22, 2019. The information presented is from October 22, 2019 to April 30, 2020. |
(b) | For the period ended October 1, 2019 to April 30, 2020. See Note 1 to the Financial Statements. |
(c) | Summary of capital share transactions is as follows: |
| | | Shares | | | Shares(d) | | | Shares(d) | | | Shares(d) | |
Subscriptions | | | 6,000,000 | | | | 850,000 | | | | 400,000 | | | | 200,000 | |
Redemptions | | | (400,000 | ) | | | (1,050,000 | ) | | | (250,000 | ) | | | — | |
Net Increase (Decrease) | | | 5,600,000 | | | | (200,000 | ) | | | 150,000 | | | | 200,000 | |
(d) | Shares of Predecessor Fund converted into Fund Shares at the close of business on January 22, 2020. See Note 1 to the Financial Statements. |
The accompanying notes are an integral part of the financial statements.
106
Pacer Trendpilot ® US Large Cap ETF
FINANCIAL HIGHLIGHTS
For a capital share outstanding throughout the year/period
| | For the
Year Ended
April 30,
2020 | | | For the
Year Ended
April 30,
2019 | | | For the
Year Ended
April 30,
2018 | | | For the
Year Ended
April 30,
2017 | | | For the
Period Ended
April 30,
2016(a) | |
Net Asset Value, Beginning of Period | | $ | 30.56 | | | $ | 28.41 | | | $ | 25.48 | | | $ | 21.88 | | | $ | 25.00 | |
| | | | | | | | | | | | | | | | | | | | | |
INCOME (LOSS) FROM INVESTMENT OPERATIONS: | | | | | | | | | | | | | | | | | | | | |
Net Investment Income (Loss) (b) | | | 0.39 | | | | 0.43 | | | | 0.37 | | | | 0.34 | | | | 0.13 | |
Net Realized and Unrealized Gain (Loss) on Investments (f) | | | (3.59 | ) | | | 2.01 | | | | 2.84 | | | | 3.52 | | | | (3.15 | ) |
Total from Investment Operations | | | (3.20 | ) | | | 2.44 | | | | 3.21 | | | | 3.86 | | | | (3.02 | ) |
| | | | | | | | | | | | | | | | | | | | | |
LESS DISTRIBUTIONS: | | | | | | | | | | | | | | | | | | | | |
Distributions from Net Investment Income | | | (0.37 | ) | | | (0.29 | ) | | | (0.28 | ) | | | (0.26 | ) | | | (0.10 | ) |
Total Distributions | | | (0.37 | ) | | | (0.29 | ) | | | (0.28 | ) | | | (0.26 | ) | | | (0.10 | ) |
Net Asset Value, End of Period | | $ | 26.99 | | | $ | 30.56 | | | $ | 28.41 | | | $ | 25.48 | | | $ | 21.88 | |
Total Return | | | -10.71 | % | | | 8.65 | % | | | 12.56 | % | | | 17.72 | % | | | -12.10 | %(c) |
| | | | | | | | | | | | | | | | | | | | | |
SUPPLEMENTAL DATA: | | | | | | | | | | | | | | | | | | | | |
Net Assets at End of Period (000’s) | | $ | 2,403,839 | | | $ | 2,163,990 | | | $ | 921,975 | | | $ | 456,180 | | | $ | 365,448 | |
| | | | | | | | | | | | | | | | | | | | | |
RATIOS TO AVERAGE NET ASSETS: | | | | | | | | | | | | | | | | | | | | |
Expenses to Average Net Assets | | | 0.60 | % | | | 0.60 | % | | | 0.60 | % | | | 0.60 | % | | | 0.60 | %(d) |
Net Investment Income (Loss) to Average Net Assets | | | 1.25 | % | | | 1.43 | % | | | 1.32 | % | | | 1.44 | % | | | 0.62 | %(d) |
Portfolio Turnover Rate (e) | | | 5 | % | | | 162 | % | | | 12 | % | | | 7 | % | | | 317 | %(c) |
(a) | Commencement of operations on June 11, 2015. |
(b) | Calculated based on average shares outstanding during the period. |
(e) | Excluded impact of in-kind transactions. |
(f) | Realized and unrealized gains and losses per share in this caption are balancing amounts necessary to reconcile to the change in net asset value for the period and may reconcile with the aggregate gains and losses in the statement of operations due to share transactions for the period. |
The accompanying notes are an integral part of the financial statements.
107
Pacer Trendpilot ® US Mid Cap ETF
FINANCIAL HIGHLIGHTS
For a capital share outstanding throughout the year/period
| | | For the
Year Ended
April 30,
2020 | | | For the
Year Ended
April 30,
2019 | | | For the
Year Ended
April 30,
2018 | | | For the
Year Ended
April 30,
2017 | | | For the
Period Ended
April 30,
2016(a) | |
Net Asset Value, Beginning of Period | | $ | 30.95 | | | $ | 30.72 | | | $ | 28.00 | | | $ | 23.78 | | | $ | 25.00 | |
| | | | | | | | | | | | | | | | | | | | | |
INCOME (LOSS) FROM INVESTMENT OPERATIONS: | | | | | | | | | | | | | | | | | | | | |
Net Investment Income (Loss) (b) | | | 0.28 | | | | 0.41 | | | | 0.27 | | | | 0.27 | | | | (0.04 | ) |
Net Realized and Unrealized Gain (Loss) on Investments (f) | | | (2.45 | ) | | | 0.10 | | | | 2.66 | | | | 4.13 | | | | (1.16 | ) |
Total from Investment Operations | | | (2.17 | ) | | | 0.51 | | | | 2.93 | | | | 4.40 | | | | (1.20 | ) |
| | | | | | | | | | | | | | | | | | | | | |
LESS DISTRIBUTIONS: | | | | | | | | | | | | | | | | | | | | |
Distributions from Net Investment Income | | | (0.43 | ) | | | (0.28 | ) | | | (0.21 | ) | | | (0.18 | ) | | | — | |
Distributions from Return of Capital | | | — | | | | — | | | | — | | | | — | | | | (0.02 | ) |
Total Distributions | | | (0.43 | ) | | | (0.28 | ) | | | (0.21 | ) | | | (0.18 | ) | | | (0.02 | ) |
Net Asset Value, End of Period | | $ | 28.35 | | | $ | 30.95 | | | $ | 30.72 | | | $ | 28.00 | | | $ | 23.78 | |
Total Return | | | -7.11 | % | | | 1.66 | % | | | 10.42 | % | | | 18.54 | % | | | -4.82 | %(c) |
| | | | | | | | | | | | | | | | | | | | | |
SUPPLEMENTAL DATA: | | | | | | | | | | | | | | | | | | | | |
Net Assets at End of Period (000’s) | | $ | 540,051 | | | $ | 761,305 | | | $ | 497,590 | | | $ | 281,430 | | | $ | 149,808 | |
| | | | | | | | | | | | | | | | | | | | | |
RATIOS TO AVERAGE NET ASSETS: | | | | | | | | | | | | | | | | | | | | |
Expenses to Average Net Assets | | | 0.60 | % | | | 0.60 | % | | | 0.60 | % | | | 0.60 | % | | | 0.60 | %(d) |
Net Investment Income (Loss) to Average Net Assets | | | 0.96 | % | | | 1.30 | % | | | 0.91 | % | | | 1.02 | % | | | -0.17 | %(d) |
Portfolio Turnover Rate (e) | | | 143 | % | | | 405 | % | | | 66 | % | | | 27 | % | | | 379 | %(c) |
(a) | Commencement of operations on June 11, 2015. |
(b) | Calculated based on average shares outstanding during the period. |
(e) | Excluded impact of in-kind transactions. |
(f) | Realized and unrealized gains and losses per share in this caption are balancing amounts necessary to reconcile to the change in net asset value for the period and may reconcile with the aggregate gains and losses in the statement of operations due to share transactions for the period. |
The accompanying notes are an integral part of the financial statements.
108
Pacer Trendpilot ® 100 ETF
FINANCIAL HIGHLIGHTS
For a capital share outstanding throughout the year/period
| | | For the
Year Ended
April 30,
2020 | | | For the
Year Ended
April 30,
2019 | | | For the
Year Ended
April 30,
2018 | | | For the
Year Ended
April 30,
2017 | | | For the
Period Ended
April 30,
2016(a) | |
Net Asset Value, Beginning of Period | | $ | 36.00 | | | $ | 31.16 | | | $ | 26.32 | | | $ | 21.44 | | | $ | 25.00 | |
| | | | | | | | | | | | | | | | | | | | | |
INCOME (LOSS) FROM INVESTMENT OPERATIONS: | | | | | | | | | | | | | | | | | | | | |
Net Investment Income (Loss) (b) | | | 0.15 | | | | 0.26 | | | | 0.11 | | | | 0.11 | | | | 0.04 | |
Net Realized and Unrealized Gain (Loss) on Investments (f) | | | 1.94 | | | | 4.73 | | | | 4.83 | | | | 4.84 | | | | (3.55 | ) |
Total from Investment Operations | | | 2.09 | | | | 4.99 | | | | 4.94 | | | | 4.95 | | | | (3.51 | ) |
| | | | | | | | | | | | | | | | | | | | | |
LESS DISTRIBUTIONS: | | | | | | | | | | | | | | | | | | | | |
Distributions from Net Investment Income | | | (0.18 | ) | | | (0.15 | ) | | | (0.10 | ) | | | (0.07 | ) | | | (0.05 | ) |
Total Distributions | | | (0.18 | ) | | | (0.15 | ) | | | (0.10 | ) | | | (0.07 | ) | | | (0.05 | ) |
Net Asset Value, End of Period | | $ | 37.91 | | | $ | 36.00 | | | $ | 31.16 | | | $ | 26.32 | | | $ | 21.44 | |
Total Return | | | 5.78 | % | | | 16.04 | % | | | 18.78 | % | | | 23.11 | % | | | -14.04 | %(c) |
| | | | | | | | | | | | | | | | | | | | | |
SUPPLEMENTAL DATA: | | | | | | | | | | | | | | | | | | | | |
Net Assets at End of Period (000’s) | | $ | 739,258 | | | $ | 502,173 | | | $ | 211,906 | | | $ | 73,696 | | | $ | 69,689 | |
| | | | | | | | | | | | | | | | | | | | | |
RATIOS TO AVERAGE NET ASSETS: | | | | | | | | | | | | | | | | | | | | |
Expenses to Average Net Assets | | | 0.65 | % | | | 0.65 | % | | | 0.65 | % | | | 0.65 | % | | | 0.65 | %(d) |
Net Investment Income (Loss) to Average Net Assets | | | 0.40 | % | | | 0.76 | % | | | 0.38 | % | | | 0.46 | % | | | 0.18 | %(d) |
Portfolio Turnover Rate (e) | | | 61 | % | | | 107 | % | | | 3 | % | | | 125 | % | | | 295 | %(c) |
(a) | Commencement of operations on June 11, 2015. |
(b) | Calculated based on average shares outstanding during the period. |
(e) | Excluded impact of in-kind transactions. |
(f) | Realized and unrealized gains and losses per share in this caption are balancing amounts necessary to reconcile to the change in net asset value for the period and may reconcile with the aggregate gains and losses in the statement of operations due to share transactions for the period. |
The accompanying notes are an integral part of the financial statements.
109
Pacer Trendpilot ® European Index ETF
FINANCIAL HIGHLIGHTS
For a capital share outstanding throughout the year/period
| | | For the
Year Ended
April 30,
2020 | | | For the
Year Ended
April 30,
2019 | | | For the
Year Ended
April 30,
2018 | | | For the
Year Ended
April 30,
2017 | | | For the
Period Ended
April 30,
2016(a) | |
Net Asset Value, Beginning of Period | | $ | 26.77 | | | $ | 29.66 | | | $ | 27.03 | | | $ | 24.97 | | | $ | 25.00 | |
| | | | | | | | | | | | | | | | | | | | | |
INCOME (LOSS) FROM INVESTMENT OPERATIONS: | | | | | | | | | | | | | | | | | | | | |
Net Investment Income (Loss) (b) | | | 0.54 | | | | 0.74 | | | | 0.51 | | | | 0.18 | | | | (0.04 | ) |
Net Realized and Unrealized Gain (Loss) on Investments (h) | | | (2.61 | ) | | | (3.16 | ) | | | 2.31 | | | | 1.88 | (c) | | | 0.01 | |
Total from Investment Operations | | | (2.07 | ) | | | (2.42 | ) | | | 2.82 | | | | 2.06 | | | | (0.03 | ) |
| | | | | | | | | | | | | | | | | | | | | |
LESS DISTRIBUTIONS: | | | | | | | | | | | | | | | | | | | | |
Distributions from Net Investment Income | | | (0.94 | ) | | | (0.47 | ) | | | (0.19 | ) | | | — | | | | — | |
Total Distributions | | | (0.94 | ) | | | (0.47 | ) | | | (0.19 | ) | | | — | | | | — | |
Net Asset Value, End of Period | | $ | 23.76 | | | $ | 26.77 | | | $ | 29.66 | | | $ | 27.03 | | | $ | 24.97 | |
Total Return | | | -8.18 | % | | | -8.07 | % | | | 10.43 | % | | | 8.25 | %(e) | | | -0.13 | %(d) |
| | | | | | | | | | | | | | | | | | | | | |
SUPPLEMENTAL DATA: | | | | | | | | | | | | | | | | | | | | |
Net Assets at End of Period (000’s) | | $ | 91,488 | | | $ | 183,379 | | | $ | 158,703 | | | $ | 31,081 | | | $ | 22,470 | |
| | | | | | | | | | | | | | | | | | | | | |
RATIOS TO AVERAGE NET ASSETS: | | | | | | | | | | | | | | | | | | | | |
Expenses to Average Net Assets | | | 0.65 | % | | | 0.65 | % | | | 0.65 | % | | | 0.65 | % | | | 0.65 | %(f) |
Net Investment Income (Loss) to Average Net Assets | | | 2.04 | % | | | 2.77 | % | | | 1.69 | % | | | 0.77 | % | | | -0.39 | %(f) |
Portfolio Turnover Rate (g) | | | 12 | % | | | 396 | % | | | 228 | % | | | 143 | % | | | 0 | %(d) |
(a) | Commencement of operations on December 14, 2015. |
(b) | Calculated based on average shares outstanding during the period. |
(c) | Includes $0.41 gain derived from contribution from a settlement. See Note 8. |
(e) | Before the contribution from a settlement, the total return for the year would have been 6.60%. See Note 8. |
(g) | Excluded impact of in-kind transactions. |
(h) | Realized and unrealized gains and losses per share in this caption are balancing amounts necessary to reconcile to the change in net asset value for the period and may reconcile with the aggregate gains and losses in the statement of operations due to share transactions for the period. |
The accompanying notes are an integral part of the financial statements.
110
Pacer Global Cash Cows Dividend ETF
FINANCIAL HIGHLIGHTS
For a capital share outstanding throughout the year/period
| | | For the
Year Ended
April 30,
2020 | | | For the
Year Ended
April 30,
2019 | | | For the
Year Ended
April 30,
2018 | | | For the
Year Ended
April 30,
2017 | | | For the
Period Ended
April 30,
2016(a) | |
Net Asset Value, Beginning of Period | | $ | 31.19 | | | $ | 30.75 | | | $ | 28.60 | | | $ | 27.16 | | | $ | 25.00 | |
| | | | | | | | | | | | | | | | | | | | | |
INCOME (LOSS) FROM INVESTMENT OPERATIONS: | | | | | | | | | | | | | | | | | | | | |
Net Investment Income (Loss) (b) | | | 1.32 | | | | 1.21 | | | | 1.07 | | | | 0.88 | | | | 0.23 | |
Net Realized and Unrealized Gain (Loss) on Investments (f) | | | (6.60 | ) | | | 0.43 | | | | 2.01 | | | | 1.26 | | | | 1.93 | |
Total from Investment Operations | | | (5.28 | ) | | | 1.64 | | | | 3.08 | | | | 2.14 | | | | 2.16 | |
| | | | | | | | | | | | | | | | | | | | | |
LESS DISTRIBUTIONS: | | | | | | | | | | | | | | | | | | | | |
Distributions from Net Investment Income | | | (1.28 | ) | | | (1.20 | ) | | | (0.93 | ) | | | (0.70 | ) | | | — | |
Total Distributions | | | (1.28 | ) | | | (1.20 | ) | | | (0.93 | ) | | | (0.70 | ) | | | — | |
Net Asset Value, End of Period | | $ | 24.63 | | | $ | 31.19 | | | $ | 30.75 | | | $ | 28.60 | | | $ | 27.16 | |
Total Return | | | -17.32 | % | | | 5.56 | % | | | 10.86 | % | | | 8.03 | % | | | 8.64 | %(c) |
| | | | | | | | | | | | | | | | | | | | | |
SUPPLEMENTAL DATA: | | | | | | | | | | | | | | | | | | | | |
Net Assets at End of Period (000’s) | | $ | 135,480 | | | $ | 210,505 | | | $ | 173,710 | | | $ | 70,059 | | | $ | 5,432 | |
| | | | | | | | | | | | | | | | | | | | | |
RATIOS TO AVERAGE NET ASSETS: | | | | | | | | | | | | | | | | | | | | |
Expenses to Average Net Assets | | | 0.60 | % | | | 0.60 | % | | | 0.60 | % | | | 0.60 | % | | | 0.60 | %(d) |
Net Investment Income (Loss) to Average Net Assets | | | 4.52 | % | | | 4.00 | % | | | 3.50 | % | | | 3.19 | % | | | 4.63 | %(d) |
Portfolio Turnover Rate (e) | | | 91 | % | | | 74 | % | | | 76 | % | | | 44 | % | | | 0 | %(c) |
(a) | Commencement of operations on February 22, 2016. |
(b) | Calculated based on average shares outstanding during the period. |
(e) | Excluded impact of in-kind transactions. |
(f) | Realized and unrealized gains and losses per share in this caption are balancing amounts necessary to reconcile to the change in net asset value for the period and may reconcile with the aggregate gains and losses in the statement of operations due to share transactions for the period. |
The accompanying notes are an integral part of the financial statements.
111
Pacer US Cash Cows 100 ETF
FINANCIAL HIGHLIGHTS
For a capital share outstanding throughout the year/period
| | | For the
Year Ended
April 30,
2020 | | | For the
Year Ended
April 30,
2019 | | | For the
Year Ended
April 30,
2018 | | | For the
Period Ended
April 30,
2017(a) | |
Net Asset Value, Beginning of Period | | $ | 29.72 | | | $ | 28.98 | | | $ | 26.13 | | | $ | 25.00 | |
| | | | | | | | | | | | | | | | | |
INCOME (LOSS) FROM INVESTMENT OPERATIONS: | | | | | | | | | | | | | | | | |
Net Investment Income (Loss) (b) | | | 0.77 | | | | 0.53 | | | | 0.61 | | | | 0.13 | |
Net Realized and Unrealized Gain (Loss) on Investments (f) | | | (4.55 | ) | | | 0.67 | | | | 2.84 | | | | 1.09 | |
Total from Investment Operations | | | (3.78 | ) | | | 1.20 | | | | 3.45 | | | | 1.22 | |
| | | | | | | | | | | | | | | | | |
LESS DISTRIBUTIONS: | | | | | | | | | | | | | | | | |
Distributions from Net Investment Income | | | (0.77 | ) | | | (0.46 | ) | | | (0.60 | ) | | | (0.09 | ) |
Total Distributions | | | (0.77 | ) | | | (0.46 | ) | | | (0.60 | ) | | | (0.09 | ) |
Net Asset Value, End of Period | | $ | 25.17 | | | $ | 29.72 | | | $ | 28.98 | | | $ | 26.13 | |
Total Return | | | -12.63 | % | | | 4.28 | % | | | 13.35 | % | | | 4.87 | %(c) |
| | | | | | | | | | | | | | | | | |
SUPPLEMENTAL DATA: | | | | | | | | | | | | | | | | |
Net Assets at End of Period (000’s) | | $ | 190,027 | | | $ | 266,018 | | | $ | 28,981 | | | $ | 11,759 | |
| | | | | | | | | | | | | | | | | |
RATIOS TO AVERAGE NET ASSETS: | | | | | | | | | | | | | | | | |
Expenses to Average Net Assets | | | 0.49 | % | | | 0.49 | % | | | 0.49 | % | | | 0.49 | %(d) |
Net Investment Income (Loss) to Average Net Assets | | | 2.73 | % | | | 1.82 | % | | | 2.16 | % | | | 1.37 | %(d) |
Portfolio Turnover Rate (e) | | | 85 | % | | | 122 | % | | | 101 | % | | | 36 | %(c) |
(a) | Commencement of operations on December 16, 2016. |
(b) | Calculated based on average shares outstanding during the period. |
(e) | Excluded impact of in-kind transactions |
(f) | Realized and unrealized gains and losses per share in this caption are balancing amounts necessary to reconcile to the change in net asset value for the period and may reconcile with the aggregate gains and losses in the statement of operations due to share transactions for the period. |
The accompanying notes are an integral part of the financial statements.
112
Pacer US Small Cap Cash Cows 100 ETF
FINANCIAL HIGHLIGHTS
For a capital share outstanding throughout the year/period
| | | For the
Year Ended
April 30,
2020 | | | For the
Year Ended
April 30,
2019 | | | For the
Period Ended
April 30,
2018(a) | |
Net Asset Value, Beginning of Period | | $ | 25.88 | | | $ | 26.17 | | | $ | 24.78 | |
| | | | | | | | | | | | | |
INCOME (LOSS) FROM INVESTMENT OPERATIONS: | | | | | | | | | | | | |
Net Investment Income (Loss) (b) | | | 0.27 | | | | 0.32 | | | | 0.28 | |
Net Realized and Unrealized Gain (Loss) on Investments (f) | | | (5.12 | ) | | | (0.29 | ) | | | 1.38 | |
Total from Investment Operations | | | (4.85 | ) | | | 0.03 | | | | 1.66 | |
| | | | | | | | | | | | | |
LESS DISTRIBUTIONS: | | | | | | | | | | | | |
Distributions from Net Investment Income | | | (0.27 | ) | | | (0.32 | ) | | | (0.27 | ) |
Total Distributions | | | (0.27 | ) | | | (0.32 | ) | | | (0.27 | ) |
Net Asset Value, End of Period | | $ | 20.76 | | | $ | 25.88 | | | $ | 26.17 | |
Total Return | | | -18.72 | %(c) | | | 0.20 | % | | | 6.69 | %(c) |
| | | | | | | | | | | | | |
SUPPLEMENTAL DATA: | | | | | | | | | | | | |
Net Assets at End of Period (000’s) | | $ | 14,534 | | | $ | 50,474 | | | $ | 5,233 | |
| | | | | | | | | | | | | |
RATIOS TO AVERAGE NET ASSETS: | | | | | | | | | | | | |
Expenses to Average Net Assets | | | 0.59 | %(d) | | | 0.59 | % | | | 0.59 | %(d) |
Net Investment Income (Loss) to Average Net Assets | | | 1.11 | %(d) | | | 1.21 | % | | | 1.25 | %(d) |
Portfolio Turnover Rate (e) | | | 128 | %(c) | | | 123 | % | | | 97 | %(c) |
(a) | Commencement of operations on June 16, 2017. |
(b) | Calculated based on average shares outstanding during the period. |
(e) | Excluded impact of in-kind transactions |
(f) | Realized and unrealized gains and losses per share in this caption are balancing amounts necessary to reconcile to the change in net asset value for the period and may reconcile with the aggregate gains and losses in the statement of operations due to share transactions for the period. |
The accompanying notes are an integral part of the financial statements.
113
Pacer Developed Markets International Cash Cows 100 ETF
FINANCIAL HIGHLIGHTS
For a capital share outstanding throughout the year/period
| | | For the
Year Ended
April 30,
2020 | | | For the
Year Ended
April 30,
2019 | | | For the
Period Ended
April 30,
2018(a) | |
Net Asset Value, Beginning of Year/Period | | $ | 27.08 | | | $ | 28.91 | | | $ | 25.09 | |
| | | | | | | | | | | | | |
INCOME (LOSS) FROM INVESTMENT OPERATIONS: | | | | | | | | | | | | |
Net Investment Income (Loss) (b) | | | 0.74 | | | | 0.85 | | | | 0.60 | |
Net Realized and Unrealized Gain (Loss) on Investments (f) | | | (6.05 | ) | | | (2.01 | ) | | | 3.53 | |
Total from Investment Operations | | | (5.31 | ) | | | (1.16 | ) | | | 4.13 | |
| | | | | | | | | | | | | |
LESS DISTRIBUTIONS: | | | | | | | | | | | | |
Distributions from Net Investment Income | | | (0.78 | ) | | | (0.67 | ) | | | (0.31 | ) |
Total Distributions | | | (0.78 | ) | | | (0.67 | ) | | | (0.31 | ) |
Net Asset Value, End of Period | | $ | 20.99 | | | $ | 27.08 | | | $ | 28.91 | |
Total Return | | | -20.04 | % | | | -3.92 | % | | | 16.48 | %(c) |
| | | | | | | | | | | | | |
SUPPLEMENTAL DATA: | | | | | | | | | | | | |
Net Assets at End of Period (000’s) | | $ | 20,991 | | | $ | 33,844 | | | $ | 20,235 | |
| | | | | | | | | | | | | |
RATIOS TO AVERAGE NET ASSETS: | | | | | | | | | | | | |
Expenses to Average Net Assets | | | 0.65 | % | | | 0.65 | % | | | 0.65 | %(d) |
Net Investment Income (Loss) to Average Net Assets | | | 2.96 | % | | | 3.18 | % | | | 2.42 | %(d) |
Portfolio Turnover Rate (e) | | | 149 | % | | | 80 | % | | | 25 | %(c) |
(a) | Commencement of operations on June 16, 2017. |
(b) | Calculated based on average shares outstanding during the period. |
(e) | Excluded impact of in-kind transactions |
(f) | Realized and unrealized gains and losses per share in this caption are balancing amounts necessary to reconcile to the change in net asset value for the period and may reconcile with the aggregate gains and losses in the statement of operations due to share transactions for the period. |
The accompanying notes are an integral part of the financial statements.
114
Pacer WealthShield ETF
FINANCIAL HIGHLIGHTS
For a capital share outstanding throughout the year/period
| | | For the
Year Ended
April 30,
2020 | | | For the
Year Ended
April 30,
2019 | | | For the
Period Ended
April 30,
2018(a) | |
Net Asset Value, Beginning of Period | | $ | 25.02 | | | $ | 25.02 | | | $ | 25.02 | |
| | | | | | | | | | | | | |
INCOME (LOSS) FROM INVESTMENT OPERATIONS: | | | | | | | | | | | | |
Net Investment Income (Loss) (b) | | | 0.33 | | | | 0.38 | | | | 0.10 | |
Net Realized and Unrealized Gain (Loss) on Investments (f) | | | (1.10 | ) | | | (0.01 | ) | | | (0.05 | ) |
Total from Investment Operations | | | (0.77 | ) | | | 0.37 | | | | 0.05 | |
| | | | | | | | | | | | | |
LESS DISTRIBUTIONS: | | | | | | | | | | | | |
Distributions from Net Investment Income | | | (0.33 | ) | | | (0.37 | ) | | | (0.05 | ) |
Total Distributions | | | (0.33 | ) | | | (0.37 | ) | | | (0.05 | ) |
Net Asset Value, End of Period | | $ | 23.92 | | | $ | 25.02 | | | $ | 25.02 | |
Total Return | | | -3.04 | %(c) | | | 1.43 | % | | | 0.23 | %(c) |
| | | | | | | | | | | | | |
SUPPLEMENTAL DATA: | | | | | | | | | | | | |
Net Assets at End of Period (000’s) | | $ | 51,428 | | | $ | 110,078 | | | $ | 62,539 | |
| | | | | | | | | | | | | |
RATIOS TO AVERAGE NET ASSETS: | | | | | | | | | | | | |
Expenses to Average Net Assets | | | 0.60 | %(d) | | | 0.60 | % | | | 0.60 | %(d) |
Net Investment Income (Loss) to Average Net Assets | | | 1.38 | %(d) | | | 1.52 | % | | | 1.04 | %(d) |
Portfolio Turnover Rate (e) | | | 676 | %(c) | | | 542 | % | | | 131 | %(c) |
(a) | Commencement of operations on December 11, 2017. |
(b) | Calculated based on average shares outstanding during the period. |
(e) | Excluded impact of in-kind transactions |
(f) | Realized and unrealized gains and losses per share in this caption are balancing amounts necessary to reconcile to the change in net asset value for the period and may reconcile with the aggregate gains and losses in the statement of operations due to share transactions for the period. |
The accompanying notes are an integral part of the financial statements.
115
Pacer Military Times Best Employers ETF
FINANCIAL HIGHLIGHTS
For a capital share outstanding throughout the year/period
| | | For the
Year Ended
April 30,
2020 | | | For the
Year Ended
April 30,
2019 | | | For the
Period Ended
April 30,
2018(a) | |
Net Asset Value, Beginning of Year/Period | | $ | 28.73 | | | $ | 25.33 | | | $ | 24.89 | |
| | | | | | | | | | | �� | | |
INCOME (LOSS) FROM INVESTMENT OPERATIONS: | | | | | | | | | | | | |
Net Investment Income (Loss) (b) | | | 0.51 | | | | 0.44 | | | | — | (c) |
Net Realized and Unrealized Gain (Loss) on Investments (g) | | | (0.98 | ) | | | 3.43 | | | | 0.44 | |
Total from Investment Operations | | | (0.47 | ) | | | 3.87 | | | | 0.44 | |
| | | | | | | | | | | | | |
LESS DISTRIBUTIONS: | | | | | | | | | | | | |
Distributions from Net Investment Income | | | (0.53 | ) | | | (0.47 | ) | | | — | |
Total Distributions | | | (0.53 | ) | | | (0.47 | ) | | | — | |
Net Asset Value, End of Period | | $ | 27.73 | | | $ | 28.73 | | | $ | 25.33 | |
Total Return | | | -1.59 | % | | | 15.46 | % | | | 1.79 | %(d) |
| | | | | | | | | | | | | |
SUPPLEMENTAL DATA: | | | | | | | | | | | | |
Net Assets at End of Period (000’s) | | $ | 2,773 | | | $ | 2,873 | | | $ | 2,533 | |
| | | | | | | | | | | | | |
RATIOS TO AVERAGE NET ASSETS: | | | | | | | | | | | | |
Expenses to Average Net Assets | | | 0.60 | % | | | 0.60 | % | | | 0.60 | %(e) |
Net Investment Income (Loss) to Average Net Assets | | | 1.72 | % | | | 1.66 | % | | | 0.25 | %(e) |
Portfolio Turnover Rate (f) | | | 19 | % | | | 9 | % | | | 0 | %(d) |
(a) | Commencement of operations on April 9, 2018. |
(b) | Calculated based on average shares outstanding during the period. |
(f) | Excluded impact of in-kind transactions |
(g) | Realized and unrealized gains and losses per share in this caption are balancing amounts necessary to reconcile to the change in net asset value for the period and may reconcile with the aggregate gains and losses in the statement of operations due to share transactions for the period. |
The accompanying notes are an integral part of the financial statements.
116
Pacer Benchmark Retail Real Estate SCTRSM ETF
FINANCIAL HIGHLIGHTS
For a capital share outstanding throughout the year/period
| | | For the
Year Ended
April 30,
2020 | | | For the
Period Ended
April 30,
2019(a) | |
Net Asset Value, Beginning of Period | | $ | 27.57 | | | $ | 24.30 | |
| | | | | | | | | |
INCOME (LOSS) FROM INVESTMENT OPERATIONS: | | | | | | | | |
Net Investment Income (Loss) (b) | | | 0.89 | | | | 0.87 | |
Net Realized and Unrealized Gain (Loss) on Investments (f) | | | (11.17 | ) | | | 3.50 | |
Total from Investment Operations | | | (10.28 | ) | | | 4.37 | |
| | | | | | | | | |
LESS DISTRIBUTIONS: | | | | | | | | |
Distributions from: | | | | | | | | |
Net Investment Income | | | (0.86 | ) | | | (0.83 | ) |
Long-Term Capital Gain | | | — | | | | (0.06 | ) |
Return of Capital | | | (0.24 | ) | | | (0.21 | ) |
Total Distributions | | | (1.10 | ) | | | (1.10 | ) |
Net Asset Value, End of Period | | $ | 16.19 | | | $ | 27.57 | |
Total Return | | | -37.49 | % | | | 18.30 | %(c) |
| | | | | | | | | |
SUPPLEMENTAL DATA: | | | | | | | | |
Net Assets at End of Period (000’s) | | $ | 809 | | | $ | 1,379 | |
| | | | | | | | | |
RATIOS TO AVERAGE NET ASSETS: | | | | | | | | |
Expenses to Average Net Assets | | | 0.60 | % | | | 0.60 | %(d) |
Net Investment Income (Loss) to Average Net Assets | | | 3.39 | % | | | 3.33 | %(d) |
Portfolio Turnover Rate (e) | | | 36 | % | | | 60 | %(c) |
(a) | Commencement of operations on May 15, 2018. |
(b) | Calculated based on average shares outstanding during the period. |
(e) | Excluded impact of in-kind transactions |
(f) | Realized and unrealized gains and losses per share in this caption are balancing amounts necessary to reconcile to the change in net asset value for the period and may reconcile with the aggregate gains and losses in the statement of operations due to share transactions for the period. |
The accompanying notes are an integral part of the financial statements.
117
Pacer Benchmark Industrial Real Estate SCTRSM ETF
FINANCIAL HIGHLIGHTS
For a capital share outstanding throughout the year/period
| | | For the
Year Ended
April 30,
2020 | | | For the
Period Ended
April 30,
2019(a) | |
Net Asset Value, Beginning of Period | | $ | 29.42 | | | $ | 24.83 | |
| | | | | | | | | |
INCOME (LOSS) FROM INVESTMENT OPERATIONS: | | | | | | | | |
Net Investment Income (Loss) (b) | | | 0.77 | | | | 0.65 | |
Net Realized and Unrealized Gain (Loss) on Investments (f) | | | 0.52 | | | | 4.61 | |
Total from Investment Operations | | | 1.29 | | | | 5.26 | |
| | | | | | | | | |
LESS DISTRIBUTIONS: | | | | | | | | |
Distributions from: | | | | | | | | |
Net Investment Income | | | (0.61 | ) | | | (0.67 | ) |
Long-Term Capital Gain | | | (0.01 | ) | | | — | |
Total Distributions | | | (0.62 | ) | | | (0.67 | ) |
Net Asset Value, End of Period | | $ | 30.09 | | | $ | 29.42 | |
Total Return | | | 4.38 | % | | | 21.62 | %(c) |
| | | | | | | | | |
SUPPLEMENTAL DATA: | | | | | | | | |
Net Assets at End of Period (000’s) | | $ | 48,147 | | | $ | 7,356 | |
| | | | | | | | | |
RATIOS TO AVERAGE NET ASSETS: | | | | | | | | |
Expenses to Average Net Assets | | | 0.60 | % | | | 0.60 | %(d) |
Net Investment Income (Loss) to Average Net Assets | | | 2.40 | % | | | 2.60 | %(d) |
Portfolio Turnover Rate (e) | | | 29 | % | | | 36 | %(c) |
(a) | Commencement of operations on May 14, 2018. |
(b) | Calculated based on average shares outstanding during the period. |
(e) | Excluded impact of in-kind transactions |
(f) | Realized and unrealized gains and losses per share in this caption are balancing amounts necessary to reconcile to the change in net asset value for the period and may reconcile with the aggregate gains and losses in the statement of operations due to share transactions for the period. |
The accompanying notes are an integral part of the financial statements.
118
Pacer Benchmark Data & Infrastructure Real Estate SCTRSM ETF
FINANCIAL HIGHLIGHTS
For a capital share outstanding throughout the year/period
| | | For the
Year Ended
April 30,
2020 | | | For the
Period Ended
April 30,
2019(a) | |
Net Asset Value, Beginning of Year/Period | | $ | 28.36 | | | $ | 24.67 | |
| | | | | | | | | |
INCOME (LOSS) FROM INVESTMENT OPERATIONS: | | | | | | | | |
Net Investment Income (Loss) (b) | | | 0.54 | | | | 0.39 | |
Net Realized and Unrealized Gain (Loss) on Investments (f) | | | 4.92 | | | | 3.93 | |
Total from Investment Operations | | | 5.46 | | | | 4.32 | |
| | | | | | | | | |
LESS DISTRIBUTIONS: | | | | | | | | |
Distributions from: | | | | | | | | |
Net Investment Income | | | (0.49 | ) | | | (0.44 | ) |
Long-Term Capital Gain | | | — | | | | (0.01 | ) |
Return of Capital | | | (0.06 | ) | | | (0.18 | ) |
Total Distributions | | | (0.55 | ) | | | (0.63 | ) |
Net Asset Value, End of Period | | $ | 33.27 | | | $ | 28.36 | |
Total Return | | | 19.50 | % | | | 17.89 | %(c) |
| | | | | | | | | |
SUPPLEMENTAL DATA: | | | | | | | | |
Net Assets at End of Period (000’s) | | $ | 552,214 | | | $ | 22,691 | |
| | | | | | | | | |
RATIOS TO AVERAGE NET ASSETS: | | | | | | | | |
Expenses to Average Net Assets | | | 0.60 | % | | | 0.60 | %(d) |
Net Investment Income (Loss) to Average Net Assets | | | 1.70 | % | | | 1.55 | %(d) |
Portfolio Turnover Rate (e) | | | 28 | % | | | 27 | %(c) |
(a) | Commencement of operations on May 15, 2018. |
(b) | Calculated based on average shares outstanding during the period. |
(e) | Excluded impact of in-kind transactions |
(f) Realized and unrealized gains and losses per share in this caption are balancing amounts necessary to reconcile to the change in net asset value for the period and may reconcile with the aggregate gains and losses in the statement of operations due to share transactions for the period.
The accompanying notes are an integral part of the financial statements.
119
Pacer US Export Leaders ETF
FINANCIAL HIGHLIGHTS
For a capital share outstanding throughout the year/period
| | | For the
Year Ended
April 30,
2020 | | | For the
Period Ended
April 30,
2019(a) | |
Net Asset Value, Beginning of Year/Period | | $ | 25.97 | | | $ | 24.98 | |
| | | | | | | | | |
INCOME (LOSS) FROM INVESTMENT OPERATIONS: | | | | | | | | |
Net Investment Income (Loss) (b) | | | 0.16 | | | | 0.09 | |
Net Realized and Unrealized Gain (Loss) on Investments (f) | | | (0.82 | ) | | | 0.98 | |
Total from Investment Operations | | | (0.66 | ) | | | 1.07 | |
| | | | | | | | | |
LESS DISTRIBUTIONS: | | | | | | | | |
Distributions from Net Investment Income | | | (0.16 | ) | | | (0.08 | ) |
Total Distributions | | | (0.16 | ) | | | (0.08 | ) |
Net Asset Value, End of Period | | $ | 25.15 | | | $ | 25.97 | |
Total Return | | | -2.53 | % | | | 4.33 | %(c) |
| | | | | | | | | |
SUPPLEMENTAL DATA: | | | | | | | | |
Net Assets at End of Period (000’s) | | $ | 1,257 | | | $ | 1,298 | |
| | | | | | | | | |
RATIOS TO AVERAGE NET ASSETS: | | | | | | | | |
Expenses to Average Net Assets | | | 0.60 | % | | | 0.60 | %(d) |
Net Investment Income (Loss) to Average Net Assets | | | 0.61 | % | | | 0.50 | %(d) |
Portfolio Turnover Rate (e) | | | 79 | % | | | 55 | %(c) |
(a) | Commencement of operations on July 23, 2018. |
(b) | Calculated based on average shares outstanding during the period. |
(e) | Excluded impact of in-kind transactions |
(f) | Realized and unrealized gains and losses per share in this caption are balancing amounts necessary to reconcile to the change in net asset value for the period and may reconcile with the aggregate gains and losses in the statement of operations due to share transactions for the period. |
The accompanying notes are an integral part of the financial statements.
120
Pacer CFRA-Stovall Equal Weight Seasonal Rotation ETF
FINANCIAL HIGHLIGHTS
For a capital share outstanding throughout the year/period
| | | For the
Year Ended
April 30,
2020 | | | For the
Period Ended
April 30,
2019(a) | |
Net Asset Value, Beginning of Year/Period | | $ | 28.16 | | | $ | 25.01 | |
| | | | | | | | | |
INCOME (LOSS) FROM INVESTMENT OPERATIONS: | | | | | | | | |
Net Investment Income (Loss) (b) | | | 0.50 | | | | 0.25 | |
Net Realized and Unrealized Gain (Loss) on Investments (g) | | | 3.00 | | | | 3.11 | |
Total from Investment Operations | | | (2.50 | ) | | | 3.36 | |
| | | | | | | | | |
LESS DISTRIBUTIONS: | | | | | | | | |
Distributions from Net Investment Income | | | (0.43 | ) | | | (0.21 | ) |
Total Distributions | | | (0.43 | ) | | | (0.21 | ) |
Net Asset Value, End of Period | | $ | 25.23 | | | $ | 28.16 | |
Total Return(f) | | | -8.80 | % | | | 13.67 | %(c) |
| | | | | | | | | |
SUPPLEMENTAL DATA: | | | | | | | | |
Net Assets at End of Period (000’s) | | $ | 60,554 | | | $ | 7,040 | |
| | | | | | | | | |
RATIOS TO AVERAGE NET ASSETS: | | | | | | | | |
Expenses to Average Net Assets | | | 0.60 | % | | | 0.60 | %(d) |
Net Investment Income (Loss) to Average Net Assets | | | 1.75 | % | | | 1.23 | %(d) |
Portfolio Turnover Rate (e) | | | 225 | % | | | 262 | %(c) |
(a) | Commencement of operations on July 23, 2018. |
(b) | Calculated based on average shares outstanding during the period. |
(e) | Excluded impact of in-kind transactions |
(f) | Total Return was calculated using the traded NAV due to the rebalancing of the portfolio at April 30, 2020 and April 30, 2019. |
(g) | Realized and unrealized gains and losses per share in this caption are balancing amounts necessary to reconcile to the change in net asset value for the period and may reconcile with the aggregate gains and losses in the statement of operations due to share transactions for the period. |
The accompanying notes are an integral part of the financial statements.
121
Pacer US Cash Cows Growth ETF
FINANCIAL HIGHLIGHTS
For a capital share outstanding throughout the period
| | | For the
Period Ended
April 30,
2020(a) | |
Net Asset Value, Beginning of Period | | $ | 24.78 | |
| | | | | |
INCOME (LOSS) FROM INVESTMENT OPERATIONS: | | | | |
Net Investment Income (Loss) (b) | | | 0.28 | |
Net Realized and Unrealized Gain (Loss) on Investments (f) | | | (1.90 | ) |
Total from Investment Operations | | | (1.62 | ) |
| | | | | |
LESS DISTRIBUTIONS: | | | | |
Distributions from Net Investment Income | | | (0.27 | ) |
Total Distributions | | | (0.27 | ) |
Net Asset Value, End of Period | | $ | 22.89 | |
Total Return | | | -6.52 | %(c) |
| | | | | |
SUPPLEMENTAL DATA: | | | | |
Net Assets at End of Period (000’s) | | $ | 1,144 | |
| | | | | |
RATIOS TO AVERAGE NET ASSETS: | | | | |
Expenses to Average Net Assets | | | 0.60 | %(d) |
Net Investment Income (Loss) to Average Net Assets | | | 1.16 | %(d) |
Portfolio Turnover Rate (e) | | | 166 | %(c) |
(a) | Commencement of operations on May 2, 2019. |
(b) | Calculated based on average shares outstanding during the period. |
(e) | Excluded impact of in-kind transactions |
(f) | Realized and unrealized gains and losses per share in this caption are balancing amounts necessary to reconcile to the change in net asset value for the period and may reconcile with the aggregate gains and losses in the statement of operations due to share transactions for the period. |
The accompanying notes are an integral part of the financial statements.
122
Pacer Trendpilot International ETF
FINANCIAL HIGHLIGHTS
For a capital share outstanding throughout the period
| | | For the
Period Ended
April 30,
2020(a) | |
Net Asset Value, Beginning of Period | | $ | 24.91 | |
| | | | | |
INCOME (LOSS) FROM INVESTMENT OPERATIONS: | | | | |
Net Investment Income (Loss) (b) | | | 0.32 | |
Net Realized and Unrealized Gain (Loss) on Investments (f) | | | (1.55 | ) |
Total from Investment Operations | | | (1.23 | ) |
| | | | | |
LESS DISTRIBUTIONS: | | | | |
Distributions from Net Investment Income | | | (0.26 | ) |
Total Distributions | | | (0.26 | ) |
Net Asset Value, End of Period | | $ | 23.42 | |
Total Return | | | -5.08 | %(c) |
| | | | | |
SUPPLEMENTAL DATA: | | | | |
Net Assets at End of Period (000’s) | | $ | 151,038 | |
| | | | | |
RATIOS TO AVERAGE NET ASSETS: | | | | |
Expenses to Average Net Assets | | | 0.65 | %(d) |
Net Investment Income (Loss) to Average Net Assets | | | 1.26 | %(d) |
Portfolio Turnover Rate (e) | | | 39 | %(c) |
(a) | Commencement of operations on May 2, 2019. |
(b) | Calculated based on average shares outstanding during the period. |
(e) | Excluded impact of in-kind transactions |
(f) | Realized and unrealized gains and losses per share in this caption are balancing amounts necessary to reconcile to the change in net asset value for the period and may reconcile with the aggregate gains and losses in the statement of operations due to share transactions for the period. |
The accompanying notes are an integral part of the financial statements.
123
Pacer Emerging Markets Cash Cows 100 ETF
FINANCIAL HIGHLIGHTS
For a capital share outstanding throughout the period
| | | For the
Period Ended
April 30,
2020(a) | |
Net Asset Value, Beginning of Period | | $ | 24.95 | |
| | | | | |
INCOME (LOSS) FROM INVESTMENT OPERATIONS: | | | | |
Net Investment Income (Loss) (b) | | | 1.05 | |
Net Realized and Unrealized Gain (Loss) on Investments (f) | | | (4.81 | ) |
Total from Investment Operations | | | (3.76 | ) |
| | | | | |
LESS DISTRIBUTIONS: | | | | |
Distributions from Net Investment Income | | | (2.08 | ) |
Total Distributions | | | (2.08 | ) |
Net Asset Value, End of Period | | $ | 19.11 | |
Total Return | | | -16.76 | %(c) |
| | | | | |
SUPPLEMENTAL DATA: | | | | |
Net Assets at End of Period (000’s) | | $ | 956 | |
| | | | | |
RATIOS TO AVERAGE NET ASSETS: | | | | |
Expenses to Average Net Assets | | | 0.70 | %(d) |
Net Investment Income (Loss) to Average Net Assets | | | 4.43 | %(d) |
Portfolio Turnover Rate (e) | | | 144 | %(c) |
(a) | Commencement of operations on May 2, 2019. |
(b) | Calculated based on average shares outstanding during the period. |
(e) | Excluded impact of in-kind transactions |
(f) | Realized and unrealized gains and losses per share in this caption are balancing amounts necessary to reconcile to the change in net asset value for the period and may reconcile with the aggregate gains and losses in the statement of operations due to share transactions for the period. |
The accompanying notes are an integral part of the financial statements.
124
Pacer Cash Cows Fund of Funds ETF
FINANCIAL HIGHLIGHTS
For a capital share outstanding throughout the period
| | | For the
Period Ended
April 30,
2020(a) | |
Net Asset Value, Beginning of Period | | $ | 25.31 | |
| | | | | |
INCOME (LOSS) FROM INVESTMENT OPERATIONS: | | | | |
Net Investment Income (Loss) (b)(c) | | | 0.53 | |
Net Realized and Unrealized Gain (Loss) on Investments (h) | | | (4.46 | ) |
Total from Investment Operations | | | (3.93 | ) |
| | | | | |
LESS DISTRIBUTIONS: | | | | |
Distributions from: | | | | |
Net Investment Income | | | (0.55 | ) |
Return of Capital | | | (0.00 | )(i) |
Total Distributions | | | (0.55 | ) |
Net Asset Value, End of Period | | $ | 20.83 | |
Total Return | | | -15.71 | %(d) |
| | | | | |
SUPPLEMENTAL DATA: | | | | |
Net Assets at End of Period (000’s) | | $ | 1,041 | |
| | | | | |
RATIOS TO AVERAGE NET ASSETS: | | | | |
Expenses to Average Net Assets (f) | | | 0.15 | %(e) |
Net Investment Income (Loss) to Average Net Assets (f) | | | 2.27 | %(e) |
Portfolio Turnover Rate (g) | | | 2 | %(d) |
(a) | Commencement of operations on May 3, 2019. |
(b) | Calculated based on average shares outstanding during the period. |
(c) | Recognition of net investment income by the Fund is affected by the timing of the delcaration of dividends by the underlying investment companies in which the Fund invests. The ratio does not include the net investment income of the underlying companies in which the Fund invests. |
(f) | Does not include expenses of the investment companies in which the Fund invests. |
(g) | Excluded impact of in-kind transactions |
(h) | Realized and unrealized gains and losses per share in this caption are balancing amounts necessary to reconcile to the change in net asset value for the period and may reconcile with the aggregate gains and losses in the statement of operations due to share transactions for the period. |
The accompanying notes are an integral part of the financial statements.
125
Pacer Trendpilot Fund of Funds ETF
FINANCIAL HIGHLIGHTS
For a capital share outstanding throughout the period
| | | For the
Period Ended
April 30,
2020(a) | |
Net Asset Value, Beginning of Period | | $ | 25.39 | |
| | | | | |
INCOME (LOSS) FROM INVESTMENT OPERATIONS: | | | | |
Net Investment Income (Loss) (b)(c) | | | 0.26 | |
Net Realized and Unrealized Gain (Loss) on Investments (h) | | | (1.59 | ) |
Total from Investment Operations | | | (1.33 | ) |
| | | | | |
LESS DISTRIBUTIONS: | | | | |
Distributions from Net Investment Income | | | (0.25 | ) |
Total Distributions | | | (0.25 | ) |
Net Asset Value, End of Period | | $ | 23.81 | |
Total Return | | | -5.37 | %(d) |
| | | | | |
SUPPLEMENTAL DATA: | | | | |
Net Assets at End of Period (000’s) | | $ | 27,378 | |
| | | | | |
RATIOS TO AVERAGE NET ASSETS: | | | | |
Expenses to Average Net Assets (f) | | | 0.15 | %(e) |
Net Investment Income (Loss) to Average Net Assets (f) | | | 1.03 | %(e) |
Portfolio Turnover Rate (g) | | | 6 | %(d) |
(a) | Commencement of operations on May 3, 2019. |
(b) | Calculated based on average shares outstanding during the period. |
(c) | Recognition of net investment income by the Fund is affected by the timing of the delcaration of dividends by the underlying investment companies in which the Fund invests. The ratio does not include the net investment income of the underlying companies in which the Fund invests. |
(f) | Does not include expenses of the investment companies in which the Fund invests. |
(g) | Excluded impact of in-kind transactions |
(h) | Realized and unrealized gains and losses per share in this caption are balancing amounts necessary to reconcile to the change in net asset value for the period and may reconcile with the aggregate gains and losses in the statement of operations due to share transactions for the period. |
The accompanying notes are an integral part of the financial statements.
126
Pacer Trendpilot US Bond ETF
FINANCIAL HIGHLIGHTS
For a capital share outstanding throughout the period
| | | For the
Period Ended
April 30,
2020(a) | |
Net Asset Value, Beginning of Period | | $ | 25.00 | |
| | | | | |
INCOME (LOSS) FROM INVESTMENT OPERATIONS: | | | | |
Net Investment Income (Loss) (b) | | | 0.33 | |
Net Realized and Unrealized Gain (Loss) on Investments (f) | | | 0.72 | |
Total from Investment Operations | | | 1.05 | |
| | | | | |
LESS DISTRIBUTIONS: | | | | |
Distributions from Net Investment Income | | | (0.28 | ) |
Total Distributions | | | (0.28 | ) |
Net Asset Value, End of Period | | $ | 25.77 | |
Total Return | | | 4.24 | %(c) |
| | | | | |
SUPPLEMENTAL DATA: | | | | |
Net Assets at End of Period (000’s) | | $ | 144,327 | |
| | | | | |
RATIOS TO AVERAGE NET ASSETS: | | | | |
Expenses to Average Net Assets | | | 0.60 | %(d) |
Net Investment Income (Loss) to Average Net Assets | | | 2.47 | %(d) |
Portfolio Turnover Rate (e) | | | 131 | %(c) |
(a) | Commencement of operations on October 22, 2019. |
(b) | Calculated based on average shares outstanding during the period. |
(e) | Excluded impact of in-kind transactions |
(f) | Realized and unrealized gains and losses per share in this caption are balancing amounts necessary to reconcile to the change in net asset value for the period and may reconcile with the aggregate gains and losses in the statement of operations due to share transactions for the period. |
The accompanying notes are an integral part of the financial statements.
127
Pacer CSOP FTSE China A50 ETF
FINANCIAL HIGHLIGHTS
For a capital share outstanding throughout the year/period
| | | For the
Period Ended
April 30,
2020 (a) | | | For the
Year Ended
September 30,
2019 | | | For the
Year Ended
September 30,
2018 | | | For the
Year Ended
September 30,
2017 | | | For the
Year Ended
September 30,
2016 | | | For the
Period Ended
September 30,
2015 (b) | |
Net Asset Value, Beginning of Period | | $ | 16.85 | | | $ | 15.30 | | | $ | 16.74 | | | $ | 13.34 | | | $ | 15.09 | | | $ | 17.00 | |
| | | | | | | | | | | | | | | | | | | | | | | | | |
INCOME (LOSS) FROM INVESTMENT OPERATIONS: | | | | | | | | | | | | | | | | | | | | | | | | |
Net Investment Income (Loss) (c) | | | (0.07 | ) | | | 0.31 | | | | 0.31 | | | | 0.23 | | | | 0.13 | | | | 0.17 | |
Net Realized and Unrealized Gain (Loss) on Investments (g) | | | 0.15 | | | | 1.48 | | | | (0.59 | ) | | | 3.32 | | | | 0.50 | | | | (2.08 | ) |
Total from Investment Operations | | | 0.08 | | | | 1.79 | | | | (0.28 | ) | | | 3.55 | | | | 0.63 | | | | (1.91 | ) |
| | | | | | | | | | | | | | | | | | | | | | | | | |
LESS DISTRIBUTIONS: | | | | | | | | | | | | | | | | | | | | | | | | |
Distributions from: | | | | | | | | | | | | | | | | | | | | | | | | |
Net Investment Income | | | (0.71 | ) | | | (0.24 | ) | | | (1.16 | ) | | | (0.15 | ) | | | (2.38 | ) | | | — | |
Return of Capital | | | (0.04 | ) | | | — | | | | — | | | | — | | | | — | | | | — | |
Total Distributions | | | (0.75 | ) | | | (0.24 | ) | | | (1.16 | ) | | | (0.15 | ) | | | (2.38 | ) | | | — | |
Net Asset Value, End of Period | | $ | 16.18 | | | $ | 16.85 | | | $ | 15.30 | | | $ | 16.74 | | | $ | 13.34 | | | $ | 15.09 | |
Total Return | | | 0.14 | %(d) | | | 12.05 | % | | | -2.34 | % | | | 26.94 | % | | | 3.07 | % | | | -11.24 | %(d) |
| | | | | | | | | | | | | | | | | | | | | | | | | |
SUPPLEMENTAL DATA: | | | | | | | | | | | | | | | | | | | | | | | | |
Net Assets at End of Period (000’s) | | $ | 8,992 | | | $ | 12,740 | | | $ | 9,269 | | | $ | 6,793 | | | $ | 6,082 | | | $ | 6,880 | |
| | | | | | | | | | | | | | | | | | | | | | | | | |
RATIOS TO AVERAGE NET ASSETS: | | | | | | | | | | | | | | | | | | | | | | | | |
Expenses to Average Net Assets (Before Advisory Fees Waived) | | | 0.70 | %(e) | | | 0.70 | % | | | 0.70 | % | | | 0.70 | % | | | 0.70 | % | | | 0.99 | %(e) |
Expenses to Average Net Assets (After Advisory Fees Waived) | | | 0.70 | %(e) | | | 0.70 | % | | | 0.70 | % | | | 0.70 | % | | | 0.69 | % | | | 0.99 | %(e) |
Net Investment Income (Loss) to Average Net Assets | | | -0.66 | %(e) | | | 1.97 | % | | | 1.84 | % | | | 1.57 | % | | | 0.95 | % | | | 1.44 | %(e) |
Portfolio Turnover Rate (f) | | | 193 | %(d) | | | 45 | % | | | 20 | % | | | 34 | % | | | 410 | % | | | 266 | %(d) |
(a) | For the period October 1, 2019 to April 30, 2020. See Note 1. |
(b) | Commencement of operations on March 10, 2015. |
(c) | Calculated based on average shares outstanding during the period. |
(f) | Excludes the impact of in-kind transactions. |
(g) | Realized and unrealized gains and losses per share in this caption are balancing amounts necessary to reconcile to the change in net asset value for the period and may reconcile with the aggregate gains and losses in the statement of operations due to share transactions for the period. |
The accompanying notes are an integral part of the financial statements.
128
Pacer Funds
NOTES TO FINANCIAL STATEMENTS
April 30, 2020
NOTE 1 – ORGANIZATION
Pacer Trendpilot ® US Large Cap ETF (“PTLC”), Pacer Trendpilot ® US Mid Cap ETF (“PTMC”), Pacer Trendpilot ® 100 ETF (“PTNQ”), Pacer Trendpilot ® European Index ETF (“PTEU”), Pacer Global Cash Cows Dividend ETF (“GCOW”), Pacer US Cash Cows 100 ETF (“COWZ”), Pacer US Small Cap Cash Cows 100 ETF (“CALF”), Pacer Developed Markets International Cash Cows 100 ETF (“ICOW”), Pacer WealthShield ETF (“PWS”), Pacer Military Times Best Employers ETF (“VETS”), Pacer Benchmark Industrial Real Estate SCTRSM ETF (“INDS”), Pacer Benchmark Retail Real Estate SCTRSM ETF (“RTL”), Pacer Benchmark Data & Infrastructure Real Estate SCTRSM ETF (“SRVR”), Pacer US Export Leaders ETF (“PEXL”), Pacer CFRA-Stovall Equal Weight Seasonal Rotation Index ETF (“SZNE”), Pacer US Cash Cows Growth ETF (“BUL”), Pacer Trendpilot ® International ETF (“PTIN”), Pacer Emerging Markets Cash Cows 100 ETF (“ECOW”), Pacer Trendpilot ® Fund of Funds ETF (“TRND”), Pacer Cash Cows Fund of Funds ETF (“HERD”), Pacer Trendpilot ® US Bond ETF (“PTBD”), Pacer CSOP FTSE China A50 ETF (“AFTY”) and Pacer American Energy Independence ETF (“USAI”), (individually the “Fund” or collectively the “Funds”) are series of Pacer Funds Trust (the “Trust”), a Delaware statutory trust organized on August 12, 2014. USAI fiscal year end is October 31st and as such is not included in these financial statements. The Trust is registered with the Securities and Exchange Commission (the “SEC”) under the Investment Company Act of 1940, as amended (the “1940 Act”), as an open-end management investment company and the offering of the Funds’ shares (“Shares”) is registered under the Securities Act of 1933, as amended (the “Securities Act”). The investment objectives of the Funds are to seek to track the total return performance, before fees and expenses, of the Pacer Trendpilot ® US Large Cap Index, the Pacer Trendpilot ® US Mid-Cap Index, the Pacer NASDAQ-100 Trendpilot ® Index, the Pacer Trendpilot ® European Index, the Pacer Global Cash Cows High Dividends 100 Index, the Pacer US Cash Cows 100 Index, the Pacer US Small Cap Cash Cows Index, the Pacer Developed Markets International Cash Cows 100 Index, the Pacer WealthShield Index, the Military Times Best for VETSSM Index, the Benchmark Retail Real Estate SCTRSM Index, the Benchmark Industrial Real Estate SCTRSM Index, the Benchmark Data & Infrastructure Real Estate SCTRSM Index, the US Export Leaders Index, the Pacer CFRA-Stovall Equal Weight Seasonal Rotation Index, the Pacer US Cash Cows Growth Index, the Pacer Trendpilot ® International Index, the Pacer Emerging Markets Cash Cows 100 Index, Pacer Trendpilot ® Fund of Funds Index, the Pacer US Cash Cows Growth Index, the Pacer Trendpilot ® US Bond Index, and the FTSE China A50 Net Total Return Index. PTLC, PTMC, and PTNQ commenced operations on June 11, 2015. PTEU commenced operations on December 14, 2015. GCOW commenced operations on February 22, 2016. COWZ commenced operations on December 16, 2016. CALF and ICOW commenced operations on June 16, 2017. PWS commenced operations on December 11, 2017. VETS commenced operations on April 9, 2018. INDS commenced operations on May 14, 2018. RTL and SRVR commenced operations on May 15, 2018. PEXL and SZNE commenced operations on July 23, 2018. BUL, PTIN, and ECOW commenced operations on May 2, 2019. TRND and HERD commenced operations on May 3, 2019. PTBD commenced operations on October 22, 2019. AFTY commenced operations on March 10, 2015. Each of the Funds are non-diversfied series of the Trust except for PTLC, PTMC, PTEU, GCOW, PEXL and COWZ.
AFTY is the successor in interest to CSOP FTSE China A50 ETF (the “Predecessor Fund”) having the same investment objective that was included as a series of another investment company, CSOP ETF Trust, and advised by AFTY’s investment adviser at the time and current sub-adviser, CSOP Asset Management Limited (“CSOP). On January 21, 2020, the shareholders of the Predecessor Fund approved the tax-free reorganization of the Predecessor Fund with and into Pacer CSOP FTSE China A50 ETF, and effective as of the close of business on January 22, 2020, the assets and liabilities of the Predecessor Fund were transferred to the Trust in exchange for shares of Pacer CSOP FTSE China A50 ETF. For financial reporting purposes, assets received, and shares issued by AFTY were recorded at fair value; however, Chinese regulations prohibited free of payment (i.e., in-kind) transfers of China A shares and required that all securities be crossed on an exchange against local currency. These constraints prevented the Predecessor Fund from directly transferring the securities within its portfolio to AFTY. The Predecessor Fund sold all of its assets and transferred the proceeds to AFTY, at which time AFTY used the transferred proceeds to repurchase the same or similar securities to those sold by the Predecessor Fund. The Predecessor Fund recognized taxable gain on the sale of its assets; however, AFTY also expects to use its capital loss carryforwards to offset any gain recognized from the selling of its assets. Accordingly, neither the Predecessor Fund nor AFTY expects to make a capital gain distribution solely because of the reorganization. While the Predecessor Fund may also realize losses on the sale of its assets, to the extent AFTY repurchased (or entered into a contract to or option to repurchase) the same shares of stock or securities within a period of 61 days (beginning 30 days before and ending 30 days after the disposition of such securities) any losses by the Predecessor Fund have been disallowed under the “wash sales” rule. Such losses will be reflected in an adjustment to the basis of the securities acquired by AFTY. Costs incurred by AFTY in connection with the reorganization were paid by the Sub-Adviser. The fiscal year end of the Predecessor Fund was September 30. The reporting period covered by this annual report for AFTY is October 1, 2019 through April 30, 2020. Operations prior to January 22, 2020 were for the Predecessor Fund. The net assets were $13,150,293, including ($3,630,464) of net unrealized depreciation, ($1,198,629) of undistributed (accumulated) net investment income, and ($3,267,672) of undistributed (accumulated) net realized loss and shares outstanding were 755,882, all of which were transferred into the Trust at NAV at the close of business on January 22, 2020.
129
Pacer Funds
NOTES TO FINANCIAL STATEMENTS
April 30, 2020 (Continued)
The primary purpose of the reorganization was to move the existing Fund from its existing trust to another trust, which the Pacer Advisors, Inc. (the “Adviser”) believed would allow the Fund to become part of a series of a stable fund family with a consistent Adviser across all funds in the Trust. Shareholders are expected to benefit accordingly and to enjoy an improvement in the level and quality of services provided to them and the Fund. During the fiscal year ended April 30, 2020, the Fund accepted a cash contribution of $25,686 to reimburse the Fund for securities transactions related to the reorganization.
Shares of the Funds are listed and traded on the Cboe BZX Exchange, Inc. (“Cboe”) with the exceptions of VETS, ECOW, and HERD, which is listed and traded on the Nasdaq Stock Market LLC (“Nasdaq”) and RTL, INDS, SRVR, PEXL, SZNE, BUL, PTIN, TRND, PTBD, and AFTY, which are listed and traded on the NYSE Arca, Inc. (“NYSE”). Market prices for the shares may be different from their net asset value (“NAV”). The Funds issue and redeem shares on a continuous basis at NAV only in large blocks of shares, called “Creation Units,” which generally consist of 50,000 shares except PTBD which generally consist of 100,000 shares.. Creation Units are issued and redeemed principally in-kind for securities included in a specified universe. Once created, Shares generally trade in the secondary market at market prices that change throughout the day in amounts less than a Creation Unit. Except when aggregated in Creation Units, Shares are not redeemable securities of a Fund. Shares of a Fund may only be purchased directly from or redeemed directly to a Fund by certain financial institutions (“Authorized Participants”). An Authorized Participant is either (i) a broker-dealer or other participant in the clearing process through the Continuous Net Settlement System of the National Securities Clearing Corporation or (ii) a DTC participant and, in each case, must have executed a Participant Agreement with Pacer Financial, Inc. (the “Distributor”). Prior to January 23, 2020, ALPS Distributors, Inc. acted as the principal underwriter for AFTY. Most retail investors do not qualify as Authorized Participants nor have the resources to buy and sell whole Creation Units. Therefore, they are unable to purchase or redeem the shares directly from a Fund. Rather, most retail investors may purchase Shares in the secondary market with the assistance of a broker and are subject to customary brokerage commissions or fees.
The Funds each currently offer one class of Shares, which have no front end sales loads, no deferred sales charges, and no redemption fees. A purchase (i.e., creation) transaction fee is imposed for the transfer and other transaction costs associated with the purchase of Creation Units. PTLC charges $500, PTMC charges $500, PTNQ charges $250, PTEU charges $2,000, GCOW charges $1,500, COWZ charges $250, CALF charges $250, ICOW charges $1,500, PWS charges $500, VETS charges $250, INDS charges $250, RTL charges $250, SRVR charges $250, PEXL charges $250, SZNE charges $500, BUL charges $250, PTIN charges $8,000, ECOW charges $1,750, HERD charges $250, TRND charges $250, PTBD charges $500, and AFTY charges $250 for the standard fixed creation fee, payable to the Custodian. For the PTLC, PTMC, PTNQ, PTEU, and PTIN, the standard fixed creation transaction fee is $200 when the Deposit Securities include only U.S. Treasury bills. For PTBD, the standard fixed creation transaction fee is $250 when the Deposit Securities include only U.S. Treasury bills. The fixed transaction fee may be waived on certain orders if the Fund’s Custodian has determined to waive some or all of the costs associated with the order, or another party, such as the Adviser, has agreed to pay such fee. In addition, a variable fee may be charged on all cash transactions or substitutes for Creation Units of up to a maximum of 2% as a percentage of the value of the Creation Units subject to the transaction for the Funds, except AFTY which may charge up to a maximum of 8% as a percentage of the value of the Creation Units subject to the transaction. Variable fees received by each Fund are displayed in the Capital Share Transaction section of the Statement of Changes in Net Assets. Each Fund may issue an unlimited number of shares of beneficial interest, with no par value. Shares of each Fund have equal rights and privileges with respect to such Fund.
NOTE 2 – SIGNIFICANT ACCOUNTING POLICIES
The following is a summary of significant accounting policies consistently followed by the Funds in the preparation of the financial statements. The financial statements have been prepared in conformity with accounting principals generally accepted in the United States of America (“GAAP”). The Funds are investment companies that follow the accounting and reporting guidelines of Accounting Standards Codification Topic 946 applicable to investment companies.
Securities listed on a securities exchange, market or automated quotation system for which quotations are readily available, are valued at the last quoted sale price on the primary exchange or market (foreign or domestic) on which they are traded, except for securities listed on Nasdaq Global Market (“Nasdaq”). If, on a particular day, there is no such reported sale, then the most recent quoted bid price will be used. For securities traded on Nasdaq, the Nasdaq Official Closing Price (“NOCP”) will be used. If a Fund holds foreign shares of a security for which there is no reported volume, and there is an actively trading local version of the security, the last quoted sale price of the local security shall be used. Prices denominated in foreign currencies are converted to U.S. dollar equivalents at the current exchange rate.
Investments in other open-end investment companies, including money market funds, are valued at the investment company’s net asset value per share, with the exceptin of exchange-traded open-end investment companies, which are priced as equity securities described above.
130
Pacer Funds
NOTES TO FINANCIAL STATEMENTS
April 30, 2020 (Continued)
Fixed-income securities are normally valued on the basis of quotes obtained from independent pricing services in accordance with procedures adopted by the Board of Trustees. The independent pricing services may employ methodologies that utilize market transactions (if the security is actively traded), broker-dealer supplied valuations, or matrix pricing. Short-term securities that have maturies of less than 60 days, at the time of purchase, are valued at amortized cost, which, when combined with accrued interest, approximates market value.
Foreign currency forward contracts are valued at the current day’s interpolated foreign exchange rate, as calculated using the current day’s spot rate, and the twenty, sixty, ninety, and one-hundred eighty day forward rates provided by an independent source.
Any securities for which there are no readily available market quotations and other assets will be valued at their fair value as determined in good faith by the Fair Value Pricing Committee using the Fair Value Procedures approved by the Board of Trustees (the “Board”).
As described above, the Funds utilize various methods to measure the fair value of their investments on a recurring basis. GAAP establishes a hierarchy that prioritizes inputs to valuations methods. The three levels of inputs are:
| | Level 1 | – Unadjusted quoted prices in active markets for identical assets or liabilities that the Funds have the ability to access. |
| | Level 2 | – Observable inputs other than quoted prices included in Level 1 that are observable for the asset or liability, either directly or indirectly. These inputs may include quoted prices for the identical instrument on an inactive market, prices for similar instruments, interest rates, prepayment speeds, credit risk, yield curves, default rates and similar data. |
| | Level 3 | – Unobservable inputs for the asset or liability, to the extent relevant observable inputs are not available; representing the Funds’ own assumptions about the assumptions a market participant would use in valuing the asset or liability, and would be based on the best information available. |
The availability of observable inputs can vary from security to security and is affected by a wide variety of factors, including, for example, the type of security, whether the security is new and not yet established in the marketplace, the liquidity of markets, and other characteristics particular to the security. To the extent that valuation is based on models or inputs that are less observable or unobservable in the market, the determination of fair value requires more judgment. Accordingly, the degree of judgment exercised in determining fair value is greatest for instruments categorized in Level 3.
The inputs used to measure fair value may fall into different levels of the fair value hierarchy. In such cases, for disclosure purposes, the level in the fair value hierarchy within which the fair value measurement falls in its entirety, is determined based on the lowest level input that is significant to the fair value measurement in its entirety.
The following is a summary of the inputs used to value the Funds’ investments as of April 30, 2020:
PTLC
Description^ | | Level 1 | | | Level 2 | | | Level 3 | | | Investments
Measured at
Net Asset Value | | | Total | |
Short-Term Investments | | $ | 176,611 | | | $ | 2,422,073,656 | | | $ | — | | | $ | — | | | $ | 2,422,250,267 | |
Investments Purchased with Proceeds from Securities Lending | | | — | | | | — | | | | — | | | | 748,680,000 | | | | 748,680,000 | |
Total Investments in Securities | | $ | 176,611 | | | $ | 2,422,073,656 | | | $ | — | | | $ | 748,680,000 | | | $ | 3,170,930,267 | |
^ See Schedule of Investments for industry breakouts.
PTMC
Description^ | | Level 1 | | | Level 2 | | | Level 3 | | | Investments
Measured at
Net Asset Value | | | Total | |
Common Stocks | | $ | 6,676 | | | $ | — | | | $ | — | | | $ | — | | | $ | 6,676 | |
Short-Term Investments | | | 20,298,720 | | | | 519,959,482 | | | | — | | | | — | | | | 540,258,201 | |
Investments Purchased with Proceeds from Securities Lending | | | — | | | | — | | | | — | | | | 162,796,536 | | | | 162,796,536 | |
Total Investments in Securities | | $ | 20,305,396 | | | $ | 519,959,482 | | | $ | — | | | $ | 162,796,536 | | | $ | 703,061,414 | |
^ See Schedule of Investments for industry breakouts.
131
Pacer Funds
NOTES TO FINANCIAL STATEMENTS
April 30, 2020 (Continued)
PTNQ
Description^ | | Level 1 | | | Level 2 | | | Level 3 | | | Investments
Measured at
Net Asset Value | | | Total | |
Common Stocks | | $ | 739,326,394 | | | $ | — | | | $ | — | | | $ | — | | | $ | 739,326,394 | |
Short-Term Investments | | | 209,575 | | | | — | | | | — | | | | — | | | | 209,575 | |
Investments Purchased with Proceeds from Securities Lending | | | — | | | | — | | | | — | | | | 99,368,834 | | | | 99,368,834 | |
Total Investments in Securities | | $ | 739,535,969 | | | $ | — | | | $ | — | | | $ | 99,368,834 | | | $ | 838,904,803 | |
^ See Schedule of Investments for industry breakouts.
PTEU
Description^ | | Level 1 | | | Level 2 | | | Level 3 | | | Investments
Measured at
Net Asset Value | | | Total | |
Common Stocks | | $ | 2,295 | | | $ | — | | | $ | 6,622 | | | $ | — | | | $ | 8,917 | |
Short-Term Investments | | | 7,001,125 | | | | 83,994,760 | | | | — | | | | — | | | | 90,995,885 | |
Investments Purchased with Proceeds from Securities Lending | | | — | | | | — | | | | — | | | | 26,928,000 | | | | 26,928,000 | |
Total Investments in Securities | | $ | 7,003,420 | | | $ | 83,994,760 | | | $ | 6,622 | | | $ | 26,928,000 | | | $ | 117,932,802 | |
^ See Schedule of Investments for industry breakouts.
The following is a reconciliation of investments in which significant unobservable inputs (Level 3) were used in determining fair value:
PTEU(a) | Balance
as of
4/30/2019 | Net
Realized
Gain
(Loss) | Change in Net
Unrealized
Appreciation
(Depreciation) | Purchases | Sales | Transfers
Out of
Level 3 | Transfers
Into Level 3 | Balance as of
04/30/20 | Net Change
in Unrealized
Appreciation
(Depreciation)
on securities
held at
04/30/20 |
Common Stocks | $ 6,778 | $ — | $ (156) | $ — | $ — | $ — | $ — | $ 6,622 | $ (17,745) |
The following is a summary of quantitative information about Level 3 Fair Value Measurements:
PTEU | | Fair Value as
of 4/30/2020 | | | Valuation
Techniques | | | Unobservable
Input | | | Impact to valuation from
an increase to input | |
Common Stocks | | $ | 6,622 | | | | Last Trade Price | | | | Stale Data | | | | 5.26 EUR | |
| | * | Table presents information for one security, which has been valued at 5.26 EUR throughout the period. |
For the period ended April 30, 2020, the Fund did not recognize any transfers to or from Level 3.
GCOW
Description^ | | Level 1 | | | Level 2 | | | Level 3 | | | Investments
Measured at
Net Asset Value | | | Total | |
Common Stocks | | $ | 130,713,929 | | | $ | — | | | $ | — | | | $ | — | | | $ | 130,713,929 | |
Real Estate Investment Trusts | | | 3,120,786 | | | | — | | | | — | | | | — | | | | 3,120,786 | |
Short-Term Investments | | | 173,418 | | | | — | | | | — | | | | — | | | | 173,418 | |
Investments Purchased with Proceeds from Securities Lending | | | — | | | | — | | | | — | | | | 35,692,945 | | | | 35,692,945 | |
Total Investments in Securities | | $ | 134,008,133 | | | $ | — | | | $ | — | | | $ | 35,692,945 | | | $ | 169,701,078 | |
^ See Schedule of Investments for country breakouts.
132
Pacer Funds
NOTES TO FINANCIAL STATEMENTS
April 30, 2020 (Continued)
COWZ
Description^ | | Level 1 | | | Level 2 | | | Level 3 | | | Investments
Measured at
Net Asset Value | | | Total | |
Common Stocks | | $ | 188,616,647 | | | $ | — | | | $ | — | | | $ | — | | | $ | 188,616,647 | |
Real Estate Investment Trusts | | | 1,078,294 | | | | — | | | | — | | | | — | | | | 1,078,294 | |
Short-Term Investments | | | 247,294 | | | | — | | | | — | | | | — | | | | 247,294 | |
Investments Purchased with Proceeds from Securities Lending | | | — | | | | — | | | | — | | | | 55,713,285 | | | | 55,713,285 | |
Total Investments in Securities | | $ | 189,942,235 | | | $ | — | | | $ | — | | | $ | 55,713,285 | | | $ | 245,655,520 | |
^ See Schedule of Investments for industry breakouts.
CALF
Description^ | | Level 1 | | | Level 2 | | | Level 3 | | | Investments
Measured at
Net Asset Value | | | Total | |
Common Stocks | | $ | 14,275,373 | | | $ | — | | | $ | — | | | $ | — | | | $ | 14,275,373 | |
Real Estate Investment Trusts | | | 221,833 | | | | — | | | | — | | | | — | | | | 221,833 | |
Short-Term Investments | | | 25,861 | | | | — | | | | — | | | | — | | | | 25,861 | |
Investments Purchased with Proceeds from Securities Lending | | | — | | | | — | | | | — | | | | 3,692,829 | | | | 3,692,829 | |
Total Investments in Securities | | $ | 14,523,067 | | | $ | — | | | $ | — | | | $ | 3,692,829 | | | $ | 18,215,896 | |
^ See Schedule of Investments for industry breakouts.
ICOW
Description^ | | Level 1 | | | Level 2 | | | Level 3 | | | Investments
Measured at
Net Asset Value | | | Total | |
Common Stocks | | $ | 20,329,779 | | | $ | — | | | $ | — | | | $ | — | | | $ | 20,329,779 | |
Preferred Stocks | | | 388,890 | | | | — | | | | — | | | | — | | | | 388,890 | |
Real Estate Investment Trusts | | | 80,113 | | | | — | | | | — | | | | — | | | | 80,113 | |
Investments Purchased with Proceeds from Securities Lending | | | — | | | | — | | | | — | | | | 4,268,426 | | | | 4,268,426 | |
Total Investments in Securities | | $ | 20,798,782 | | | $ | — | | | $ | — | | | $ | 4,268,426 | | | $ | 25,067,208 | |
^ See Schedule of Investments for country breakouts.
PWS
Description^ | | Level 1 | | | Level 2 | | | Level 3 | | | Investments
Measured at
Net Asset Value | | | Total | |
Contingent Value Rights | | $ | — | | | $ | — | | | $ | 2,886 | | | $ | — | | | $ | 2,886 | |
Exchange Traded Funds | | | 2,404,224 | | | | — | | | | — | | | | — | | | | 2,404,224 | |
U.S. Treasury Notes/Bonds | | | — | | | | 48,665,264 | | | | — | | | | — | | | | 48,665,264 | |
Short-Term Investments | | | 16,775 | | | | — | | | | — | | | | — | | | | 16,775 | |
Investments Purchased with Proceeds from Securities Lending | | | — | | | | — | | | | — | | | | 14,840,252 | | | | 14,840,252 | |
Total Investments in Securities | | $ | 2,420,999 | | | $ | 48,665,264 | | | $ | 2,886 | | | $ | 14,840,252 | | | $ | 65,929,401 | |
^ See Schedule of Investments for industry breakouts.
133
Pacer Funds
NOTES TO FINANCIAL STATEMENTS
April 30, 2020 (Continued)
The following is a reconciliation of investments in which significant unobservable inputs (Level 3) were used in determining fair value:
PWS(a) | Balance
as of
4/30/2019 | Net
Realized
Gain
(Loss) | Change in Net
Unrealized
Appreciation
(Depreciation) | Purchases | Sales | Corporate
Action | Transfers
Out of
Level 3 | Transfers
Into Level 3 | Balance
as of
04/30/20 | Net Change
in Unrealized
Appreciation
(Depreciation)
on securities
held at
04/30/20 |
Contingent Value Rights | $ — | $ — | $ — | $ — | $ — | $ 2,886 | $ — | $ — | $ 2,886 | $ 2,886 |
The following is a summary of quantitative information about Level 3 Fair Value Measurements:
PWS | | Fair Value as
of 4/30/2020 | | | Valuation
Techniques | | | Unobservable
Input | | | Impact to valuation from
an increase to input | |
Contingent Value Rights | | $ | 2,886 | | | | Acquisition Price | | | | Stale Data | | | | $0.46 | |
| | * | Table presents information for one security, which has been valued at $0.46 throughout the period. |
VETS
Description^ | | Level 1 | | | Level 2 | | | Level 3 | | | Investments
Measured at
Net Asset Value | | | Total | |
Common Stocks | | $ | 2,763,816 | | | $ | — | | | $ | — | | | $ | — | | | $ | 2,763,816 | |
Exchange Traded Funds | | | 1,452 | | | | — | | | | — | | | | — | | | | 1,452 | |
Short-Term Investments | | | 5,884 | | | | — | | | | — | | | | — | | | | 5,884 | |
Total Investments in Securities | | $ | 2,771,152 | | | $ | — | | | $ | — | | | $ | — | | | $ | 2,771,152 | |
^ See Schedule of Investments for industry breakouts.
RTL
Description^ | | Level 1 | | | Level 2 | | | Level 3 | | | Investments
Measured at
Net Asset Value | | | Total | |
Real Estate Investment Trusts | | $ | 806,166 | | | $ | — | | | $ | — | | | $ | — | | | $ | 806,166 | |
Short-Term Investments | | | 703 | | | | — | | | | — | | | | — | | | | 703 | |
Investments Purchased with Proceeds from Securities Lending | | | — | | | | — | | | | — | | | | 167,149 | | | | 167,149 | |
Total Investments in Securities | | $ | 806,869 | | | $ | — | | | $ | — | | | $ | — | | | $ | 974,018 | |
^ See Schedule of Investments for industry breakouts.
INDS
Description^ | | Level 1 | | | Level 2 | | | Level 3 | | | Investments
Measured at
Net Asset Value | | | Total | |
Real Estate Investment Trusts | | $ | 47,796,690 | | | $ | — | | | $ | — | | | $ | — | | | $ | 47,796,690 | |
Short-Term Investments | | | 327,290 | | | | — | | | | — | | | | — | | | | 327,290 | |
Investments Purchased with Proceeds from Securities Lending | | | — | | | | — | | | | — | | | | 2,260,475 | | | | 2,260,475 | |
Total Investments in Securities | | $ | 48,123,980 | | | $ | — | | | $ | — | | | $ | 2,260,475 | | | $ | 50,384,455 | |
^ See Schedule of Investments for industry breakouts.
134
Pacer Funds
NOTES TO FINANCIAL STATEMENTS
April 30, 2020 (Continued)
SRVR
Description^ | | Level 1 | | | Level 2 | | | Level 3 | | | Investments
Measured at
Net Asset Value | | | Total | |
Common Stocks | | $ | 81,137,619 | | | $ | — | | | $ | — | | | $ | — | | | $ | 81,137,619 | |
Exchange Traded Funds | | | 8,882,189 | | | | — | | | | — | | | | — | | | | 8,882,189 | |
Real Estate Investment Trusts | | | 461,882,896 | | | | — | | | | — | | | | — | | | | 461,882,896 | |
Short-Term Investments | | | 9,503,044 | | | | — | | | | — | | | | — | | | | 9,503,044 | |
Investments Purchased with Proceeds from Securities Lending | | | — | | | | — | | | | — | | | | 104,768,136 | | | | 104,768,136 | |
Total Investments in Securities | | $ | 561,405,748 | | | $ | — | | | $ | — | | | $ | — | | | $ | 666,173,884 | |
^ See Schedule of Investments for industry breakouts.
PEXL
Description^ | | Level 1 | | | Level 2 | | | Level 3 | | | Investments
Measured at
Net Asset Value | | | Total | |
Common Stocks | | $ | 1,231,340 | | | $ | — | | | $ | — | | | $ | — | | | $ | 1,231,340 | |
Exchange Traded Funds | | | 12,842 | | | | — | | | | — | | | | — | | | | 12,842 | |
Real Estate Investment Trusts | | | 11,606 | | | | — | | | | — | | | | — | | | | 11,606 | |
Short-Term Investments | | | 1,602 | | | | — | | | | — | | | | — | | | | 1,602 | |
Total Investments in Securities | | $ | 1,257,390 | | | $ | — | | | $ | — | | | $ | — | | | $ | 1,257,390 | |
^ See Schedule of Investments for industry breakouts.
SZNE
Description^ | | Level 1 | | | Level 2 | | | Level 3 | | | Investments
Measured at
Net Asset Value | | | Total | |
Common Stocks | | $ | 60,549,640 | | | $ | — | | | $ | — | | | $ | — | | | $ | 60,549,640 | |
Short-Term Investments | | | 105,263 | | | | — | | | | — | | | | — | | | | 105,263 | |
Total Investments in Securities | | $ | 60,654,903 | | | $ | — | | | $ | — | | | $ | — | | | $ | 60,654,903 | |
^ See Schedule of Investments for industry breakouts.
BUL
Description^ | | Level 1 | | | Level 2 | | | Level 3 | | | Investments
Measured at
Net Asset Value | | | Total | |
Common Stocks | | $ | 1,142,142 | | | $ | — | | | $ | — | | | $ | — | | | $ | 1,142,142 | |
Short-Term Investments | | | 2,386 | | | | — | | | | — | | | | — | | | | 2,386 | |
Total Investments in Securities | | $ | 1,144,528 | | | $ | — | | | $ | — | | | $ | — | | | $ | 1,144,528 | |
^ See Schedule of Investments for industry breakouts.
PTIN
Description^ | | Level 1 | | | Level 2 | | | Level 3 | | | Investments
Measured at
Net Asset Value | | | Total | |
Common Stocks | | $ | 46,904 | | | $ | — | | | $ | — | | | $ | — | | | $ | 46,904 | |
Short-Term Investments | | | 21,009,813 | | | | 129,991,214 | | | | — | | | | — | | | | 151,001,027 | |
Total Investments in Securities | | $ | 21,056,717 | | | $ | 129,991,214 | | | $ | — | | | $ | — | | | $ | 151,047,931 | |
^ See Schedule of Investments for country breakouts.
135
Pacer Funds
NOTES TO FINANCIAL STATEMENTS
April 30, 2020 (Continued)
ECOW
Description^ | | Level 1 | | | Level 2 | | | Level 3 | | | Investments
Measured at
Net Asset Value | | | Total | |
Common Stocks | | $ | 879,970 | | | $ | — | | | $ | — | | | $ | — | | | $ | 879,970 | |
Preferred Stocks | | | 48,235 | | | | — | | | | — | | | | — | | | | 48,235 | |
Exchange Traded Funds | | | 19,581 | | | | — | | | | — | | | | — | | | | 19,581 | |
Real Estate Investment Trusts | | | 3,914 | | | | — | | | | — | | | | — | | | | 3,914 | |
Short-Term Investments | | | 4,684 | | | | — | | | | — | | | | — | | | | 4,684 | |
Total Investments in Securities | | $ | 956,384 | | | $ | — | | | $ | — | | | $ | — | | | $ | 956,384 | |
^ See Schedule of Investments for country breakouts.
HERD
Description | | Level 1 | | | Level 2 | | | Level 3 | | | Investments
Measured at
Net Asset Value | | | Total | |
Affiliated Exchange Traded Funds | | $ | 1,040,992 | | | $ | — | | | $ | — | | | $ | — | | | $ | 1,040,992 | |
Short-Term Investments | | | 411 | | | | — | | | | — | | | | — | | | | 411 | |
Total Investments in Securities | | $ | 1,041,403 | | | $ | — | | | $ | — | | | $ | — | | | $ | 1,041,403 | |
TRND
Description | | Level 1 | | | Level 2 | | | Level 3 | | | Investments
Measured at
Net Asset Value | | | Total | |
Affiliated Exchange Traded Funds | | $ | 27,367,941 | | | $ | — | | | $ | — | | | $ | — | | | $ | 27,367,941 | |
Short-Term Investments | | | 13,373 | | | | — | | | | — | | | | — | | | | 13,373 | |
Total Investments in Securities | | $ | 27,381,314 | | | $ | — | | | $ | — | | | $ | — | | | $ | 27,381,314 | |
PTBD
Description | | Level 1 | | | Level 2 | | | Level 3 | | | Investments
Measured at
Net Asset Value | | | Total | |
U.S. Treasury Notes/Bonds | | $ | — | | | $ | 143,281,918 | | | $ | — | | | $ | — | | | $ | 143,281,918 | |
Short-Term Investments | | | 75,263 | | | | — | | | | — | | | | — | | | | 75,263 | |
Total Investments in Securities | | $ | 75,263 | | | $ | 143,281,918 | | | $ | — | | | $ | — | | | $ | 143,357,181 | |
AFTY
Description^ | | Level 1 | | | Level 2 | | | Level 3 | | | Investments
Measured at
Net Asset Value | | | Total | |
Common Stocks | | $ | 8,959,112 | | | $ | — | | | $ | — | | | $ | — | | | $ | 8,959,112 | |
Short-Term Investments | | | 31,921 | | | | — | | | | — | | | | — | | | | 31,921 | |
Total Investments in Securities | | $ | 8,991,033 | | | $ | — | | | $ | — | | | $ | — | | | $ | 8,991,033 | |
^ See Schedule of Investments for industry breakouts.
During the period ended April 30, 2020, the Funds did not recognize any transfers to or from Level 3.
B. | Foreign Currency. Investment securities and other assets and liabilities denominated in foreign currencies are translated into U.S. dollar amounts at the date of valuation. Purchases and sales of investment securities and income and expense items denominated in foreign currencies are translated into U.S. dollar amounts on the respective dates of such transactions. The Funds do not isolate that portion of the results of operations resulting from changes in foreign exchange rates on investments from fluctuations arising from changes in |
136
Pacer Funds
NOTES TO FINANCIAL STATEMENTS
April 30, 2020 (Continued)
market prices of securities held. Such fluctuations are included with the net realized and unrealized gain or loss from investments. The Funds report net realized foreign exchange gains or losses that arise from sales of foreign currencies, currency gains or losses realized between the trade and settlement dates on foreign currency transactions, and the differences between the amounts of dividends, interest and foreign withholding taxes recorded on the Funds’ books and the U.S. dollar equivalent of the amounts actually received or paid. Net unrealized foreign exchange gains and losses arise from changes in the values of assets and liabilities, other than investments in securities at fiscal period end, resulting from changes in exchange rates.
C. | Federal Income Taxes. The Funds comply with the requirements of Subchapter M of the Internal Revenue Code of 1986, as amended, necessary to qualify as regulated investment companies and distribute substantially all net taxable investment income and net realized gains to shareholders in a manner which results in no tax cost to the Funds. Therefore, no federal income tax provision is required. As of and during the fiscal period/year ended April 30, 2020, the Funds did not have any tax positions that did not meet the “more-likely-than-not” threshold of being sustained by the applicable tax authority. As of and during the fiscal period/year ended April 30, 2020, the Funds did not have liabilities for any unrecognized tax benefits on uncertain tax positions as income tax expense in the Statement of Operations. Management has analyzed each of the Fund’s tax positions and concluded that no liability for unrecognized tax benefits should be recorded related to uncertain tax positions taken on returns filed for open tax years (2017-2019) or expected to be taken in each of the Fund’s 2020 tax returns. During the year/period ended April 30, 2020, the Funds did not incur any interest or penalties. |
D. | Security Transactions and Investment Income. Investment securities transactions are accounted for on the trade date. Gains and losses realized on sales of securities are computed on the basis of highest amortized cost. Dividend income is recorded on the ex-dividend date. Interest income is recorded on an accrual basis. Discounts and premiums on securities purchased are accreted and amortized over the lives of the respective securities. Withholding taxes on foreign dividends have been provided for in accordance with the Funds’ understanding of the applicable tax rules and regulations. |
Distributions received from the Fund’s investments in Real Estate Investment Trusts (“REIT”) may be characterized as ordinary income, net capital gain, or a return of capital. The proper characterization of REIT distributions is generally not known until after the end of each calendar year. As such, the Funds must use estimates in reporting the character of their income and distributions for financial statement purposes. The actual character of distributions to the Fund’s shareholders will be reflected on the Form 1099 received by shareholders after the end of the calendar year. Due to the nature of REIT investments, a portion of the distributions received by the Fund’s shareholders may represent a return of capital.
E. | Distributions to Shareholders. Distributions to shareholders from net investment income for the PTLC, PTMC, PTNQ, PTEU, PTIN, TRND, and AFTY, are declared and paid on an annual basis. The GCOW, COWZ, CALF, ICOW, PWS, VETS, PEXL, INDS, RTL, SRVR, SZNE, BUL, ECOW, HERD and PTBD are declared and paid on a quarterly basis. The net realized gains on securities normally are declared and paid on an annual basis for all Funds. Distributions are recorded on the ex-dividend date. |
F. | Use of Estimates. The preparation of financial statements in conformity with GAAP requires management to make estimates and assumptions that affect the reported amounts of assets and liabilities and disclosure of contingent assets and liabilities at the date of the financial statements, and the reported amounts of increases and decreases in net assets from operations during the reporting period. Actual results could differ from those estimates. |
G. | Share Valuation. The NAV per share of each Fund is calculated by dividing the sum of the value of the securities held by the Fund, plus cash and other assets, minus all liabilities (including estimated accrued expenses) by the total number of shares outstanding for the Fund, rounded to the nearest cent. The Funds’ shares will not be priced on the days on which the Cboe, Nasdaq and/or New York’s Stock Exchange (“NYSE”) is closed for trading. The offering and redemption price per share for each Fund is equal to the Fund’s net asset value per share. |
H. | Guarantees and Indemnifications. In the normal course of business, the Funds enter into contracts with service providers that contain general indemnification clauses. Each Fund’s maximum exposure under these arrangements is unknown as this would involve future claims that may be against the Funds that have not yet occurred. |
137
Pacer Funds
NOTES TO FINANCIAL STATEMENTS
April 30, 2020 (Continued)
I. | Reclassification of Capital Accounts. Additionally, U.S. GAAP requires that certain components of net assets relating to permanent differences be reclassified between financial and tax reporting. These reclassifications have no effect on net assets or net asset value per share. For the fiscal period/year ended April 30, 2020, the following table shows the reclassifications made: |
| | | Distributable
Earnings
(Accumulated
Deficit) | | | Paid In Capital | |
PTLC | | $ | (146,749,396 | ) | | $ | 146,749,396 | |
PTMC | | | (15,413,212 | ) | | | 15,413,212 | |
PTNQ | | | (18,103,919 | ) | | | 18,103,919 | |
PTEU | | | (7,513,275 | ) | | | 7,513,275 | |
GCOW | | | (4,967,660 | ) | | | 4,967,660 | |
COWZ | | | (16,682,090 | ) | | | 16,682,090 | |
CALF | | | (1,752,977 | ) | | | 1,752,977 | |
ICOW | | | (1,263,971 | ) | | | 1,263,971 | |
PWS | | | (3,271,211 | ) | | | 3,271,211 | |
VETS | | | (327,505 | ) | | | 327,505 | |
RTL | | | (185,031 | ) | | | 185,031 | |
INDS | | | (236,208 | ) | | | 236,208 | |
SRVR | | | (3,025,386 | ) | | | 3,025,386 | |
PEXL | | | (239,319 | ) | | | 239,319 | |
SZNE | | | 3,476,053 | | | | (3,476,053 | ) |
BUL | | | (247,111 | ) | | | 247,111 | |
PTIN | | | (2,884,127 | ) | | | 2,884,127 | |
ECOW | | | (132,260 | ) | | | 132,260 | |
HERD | | | 4,200 | | | | (4,200 | ) |
TRND | | | — | | | | — | |
PTBD | | | (123,509 | ) | | | 123,509 | |
AFTY | | | 28,865 | | | | (28,865 | ) |
During the fiscal year/period ended April 30, 2020, the Funds’ realized the following net capital gains/(losses) resulting from in-kind redemptions, in which shareholders exchanged Fund shares for securities held by the Fund rather than for cash. Because such gains are not taxable to the Fund, and are not distributed to shareholders, they have been reclassified from accumulated net realized losses to paid-in-capital.
PTLC | | $ | 152,994,042 | |
PTMC | | | 32,298,842 | |
PTNQ | | | 19,066,067 | |
PTEU | | | 7,519,816 | |
GCOW | | | 6,216,192 | |
COWZ | | | 20,338,001 | |
CALF | | | 2,844,207 | |
ICOW | | | 1,547,891 | |
PWS | | | 3,274,584 | |
VETS | | | 328,018 | |
RTL | | | 191,232 | |
INDS | | | 222,076 | |
SRVR | | | 3,031,680 | |
PEXL | | | 287,024 | |
SZNE | | | (3,441,334 | ) |
BUL | | | 286,571 | |
PTIN | | | 2,874,669 | |
ECOW | | | 178,277 | |
138
Pacer Funds
NOTES TO FINANCIAL STATEMENTS
April 30, 2020 (Continued)
HERD | | $ | (4,200 | ) |
TRND | | | — | |
PTBD | | | 131,641 | |
AFTY | | | — | |
NOTE 3 – COMMITMENTS AND OTHER RELATED PARTY TRANSACTIONS
Pacer Advisors, Inc. (“the Adviser”) serves as the investment adviser to the Funds. Pursuant to an Investment Advisory Agreement (“Investment Advisory Agreement”) between the Trust, on behalf of the Funds, and the Adviser, the Adviser provides investment advice to the Funds and oversees the day-to-day operations of the Funds, subject to the direction and control of the Board and the officers of the Trust. The Adviser administers the Funds’ business affairs, provides office facilities and equipment and certain clerical, bookkeeping and administrative services. The Adviser bears the costs of all advisory and non-advisory services required to operate the Funds, in exchange for a single unitary management fee. For services provided to the Funds, PTLC pays the Adviser 0.60%, PTMC pays the Adviser 0.60%, PTNQ pays the Adviser 0.65%, PTEU pays the Adviser 0.65%, GCOW pays the Adviser 0.60%, COWZ pays the Adviser 0.49%, CALF pays the Adviser 0.59%, ICOW pays the Adviser 0.65%, PWS pays the Adviser 0.60%, VETS pays the Adviser 0.60%, INDS pays the Adviser 0.60%, RTL pays the Adviser 0.60%, SRVR pays the Adviser 0.60%, PEXL pays the Adviser 0.60%, SZNE pays the Adviser 0.60%, BUL pays the Adviser 0.60%, PTIN pays the Adviser 0.65%, ECOW pays the Adviser 0.70%, HERD pays the Adviser 0.15%, TRND pays the Adviser 0.15%, PTBD pays the Adviser 0.60%, and AFTY pays the Adviser 0.70% at an annual rate based on each Fund’s average daily net assets.
The Adviser has overall responsibility for overseeing the investment of the Funds’ assets, managing the Funds’ business affairs and providing certain clerical, bookkeeping and other administrative services for the Trust. Vident Investment Advisory, LLC (“Vident”) serves as the sub-adviser to PTBD and CSOP serves as the sub-adviser to AFTY. Each sub-adviser has responsibility for selecting and continuously monitoring the Fund’s investments. Sub-Advisory fees earned by Vident and CSOP are paid by the Adviser.
The Distributor acts as the Funds’ principal underwriter in a continuous public offering of the Funds’ shares. The Distributor is an affiliate of the Adviser. The Funds did not pay any fees or commissions to the Distributor during the fiscal period ended April 30, 2020.
Certain officers and a Trustee of the Trust are affiliated with the Adviser and Distributor.
NOTE 4 – SERVICE AND CUSTODY AGREEMENTS
The Funds have entered into Service Agreements with U.S. Bancorp Fund Services, LLC (“Fund Services” or “Administrator”) doing business as U.S. Global Fund Services and a Custody Agreement with U.S. Bank, N.A. (the “Custodian”), an affiliate of Fund Services. Under these agreements, Fund Services and the Custodian provide certain transfer agency, administrative, accounting and custody services. The Custodian acts as securities lending agent (the “Securities Lending Agent”) for the Funds.
Prior to January 23, 2020, Brown Brothers Harriman & Co. (“BBH) served as administrator and custodian for AFTY.
NOTE 5 – SECURITIES LENDING
The Funds may lend up to 33 1/3% of the value of the securities in their portfolios to brokers, dealers and financial institutions (but not individuals) under terms of participation in a securities lending program administered by the Securities Lending Agent. The securities lending agreement requires that loans are collateralized at all times in an amount equal to at least 102% of the value of any domestic loaned securities at the time of the loan, plus accrued interest. The use of loans of foreign securities, which are denominated and payable in U.S. dollars, shall be collateralized in an amount equal to 105% of the value of any loaned securities at the time of the loan plus accrued interest. The Funds receive compensation in the form of fees and earn interest on the cash collateral. Due to timing issues of when a security is recalled from loan, the financial statements may differ in presentation. The amount of fees depends on a number of factors including the type of security and length of the loan. The Funds continue to receive interest payments or dividends on the securities loaned during the borrowing period. Gain or loss in the value of securities loaned that may occur during the term of the loan will be for the account of the Funds. The Funds have the right under the terms of the securities lending agreements to recall the securities from the borrower on demand.
As of April 30, 2020, the Funds had loaned securities and received cash collateral for the loans. The cash collateral is invested in the Mount Vernon Liquid Assets Portfolio, LLC of which the investment objective is to seek to maximize income to the extent consistent with the preservation of capital and liquidity and maintain a stable Net Asset Value (“NAV”) of $1.00. Although risk is mitigated by the collateral, the Funds could experience a delay in recovering their securities and possible loss of income or value if the borrower fails to return the borrowed securities. In addition, the Funds bear the risk of loss associated with the investment of cash collateral received.
139
Pacer Funds
NOTES TO FINANCIAL STATEMENTS
April 30, 2020 (Continued)
During the period ended April 30, 2020, the Funds (excluding VETS, PEXL, SZNE, BUL, PTIN, ECOW, HERD, TRND, PTBD, and AFTY) had loaned securities that were collateralized by cash. The cash collateral received was invested in securities as listed in each Fund’s Schedule of Investments. Income earned from these investments is allocated to each Fund based on each Fund’s portion of total cash collateral received. Securities lending income is disclosed in each Fund’s Statement of Operations.
NOTE 6 – SECURED BORROWINGS
The following represents gross obligations for secured borrowings by remaining time to maturity as of April 30, 2020.
Securities Lending Transactions
Overnight and Continuous | | Investments Purchased
with Proceeds from
Securities Lending
Collateral* | |
PTLC | | $ | 748,680,000 | |
PTMC | | | 162,796,536 | |
PTNQ | | | 99,368,834 | |
PTEU | | | 26,928,000 | |
GCOW | | | 35,692,945 | |
COWZ | | | 55,713,285 | |
CALF | | | 3,692,829 | |
ICOW | | | 4,268,426 | |
PWS | | | 14,840,252 | |
VETS | | | — | |
RTL | | | 167,149 | |
INDS | | | 2,260,475 | |
SRVR | | | 104,768,136 | |
PEXL | | | — | |
SZNE | | | — | |
BUL | | | — | |
PTIN | | | — | |
ECOW | | | — | |
HERD | | | — | |
TRND | | | — | |
PTBD | | | — | |
AFTY | | | — | |
* | Proceeds from securities lending (Investments Purchased with Proceeds from Securities Lending Collateral). |
Due to the absence of a master netting agreement related to the Funds’ participation in securities lending, no additional offsetting disclosures have been made on behalf of the Funds for the total borrowings listed above.
140
Pacer Funds
NOTES TO FINANCIAL STATEMENTS
April 30, 2020 (Continued)
NOTE 7 – OFFSETTING ASSETS AND LIABILITIES
The following is a summary of the Assets and Liabilities for each Fund subject to offsets as of April 30, 2020:
Liabilities
| | | | | | | | | | | | | | | Gross Amounts Net Offset in the
Statements of Assets and Liabilities | | | | | |
Description | | Gross Amounts
of Recognized
Liabilities | | | Gross Amounts
Offset in the
Statement of
Assets and
Liabilities | | | Net Amounts
Presented in
the Statements
of Assets and
Liabilities | | | Financial
Instruments | | | Collateral
Pledged
(Received) | | | Net
Amount | |
PTLC | | | | | | | | | | | | | | | | | | | | | | | | |
Securities Lending | | $ | 748,680,000 | | | $ | — | | | $ | 748,680,000 | | | $ | 748,680,000 | | | $ | — | | | $ | — | |
PTMC | | | | | | | | | | | | | | | | | | | | | | | | |
Securities Lending | | | 162,796,536 | | | | — | | | | 162,796,536 | | | | 162,796,536 | | | | — | | | | — | |
PTNQ | | | | | | | | | | | | | | | | | | | | | | | | |
Securities Lending | | | 99,368,834 | | | | — | | | | 99,368,834 | | | | 99,368,834 | | | | — | | | | — | |
PTEU | | | | | | | | | | | | | | | | | | | | | | | | |
Securities Lending | | | 26,928,000 | | | | — | | | | 26,928,000 | | | | 26,928,000 | | | | — | | | | — | |
GCOW | | | | | | | | | | | | | | | | | | | | | | | | |
Securities Lending | | | 35,692,945 | | | | — | | | | 35,692,945 | | | | 35,692,945 | | | | — | | | | — | |
COWZ | | | | | | | | | | | | | | | | | | | | | | | | |
Securities Lending | | | 55,713,285 | | | | — | | | | 55,713,285 | | | | 55,713,285 | | | | — | | | | — | |
CALF | | | | | | | | | | | | | | | | | | | | | | | | |
Securities Lending | | | 3,692,829 | | | | — | | | | 3,692,829 | | | | 3,692,829 | | | | — | | | | — | |
ICOW | | | | | | | | | | | | | | | | | | | | | | | | |
Securities Lending | | | 4,268,426 | | | | — | | | | 4,268,426 | | | | 4,268,426 | | | | — | | | | — | |
PWS | | | | | | | | | | | | | | | | | | | | | | | | |
Securities Lending | | | 14,840,252 | | | | — | | | | 14,840,252 | | | | 14,840,252 | | | | — | | | | — | |
VETS | | | | | | | | | | | | | | | | | | | | | | | | |
Securities Lending | | | — | | | | — | | | | — | | | | — | | | | — | | | | — | |
RTL | | | | | | | | | | | | | | | | | | | | | | | | |
Securities Lending | | | 167,149 | | | | — | | | | 167,149 | | | | 167,149 | | | | — | | | | — | |
INDS | | | — | | | | — | | | | — | | | | — | | | | | | | | | |
Securities Lending | | | 2,260,475 | | | | — | | | | 2,260,475 | | | | 2,260,475 | | | | — | | | | — | |
SRVR | | | | | | | | | | | | | | | | | | | | | | | | |
Securities Lending | | | 104,768,136 | | | | — | | | | 104,768,136 | | | | 104,768,136 | | | | — | | | | — | |
PEXL | | | | | | | | | | | | | | | | | | | | | | | | |
Securities Lending | | | — | | | | — | | | | — | | | | — | | | | — | | | | — | |
SZNE | | | | | | | | | | | | | | | | | | | | | | | | |
Securities Lending | | | — | | | | — | | | | — | | | | — | | | | — | | | | — | |
BUL | | | | | | | | | | | | | | | | | | | | | | | | |
Securities Lending | | | — | | | | — | | | | — | | | | — | | | | — | | | | — | |
PTIN | | | | | | | | | | | | | | | | | | | | | | | | |
Securities Lending | | | — | | | | — | | | | — | | | | — | | | | — | | | | — | |
ECOW | | | | | | | | | | | | | | | | | | | | | | | | |
Securities Lending | | | — | | | | — | | | | — | | | | — | | | | — | | | | — | |
HERD | | | | | | | | | | | | | | | | | | | | | | | | |
Securities Lending | | | — | | | | — | | | | — | | | | — | | | | — | | | | — | |
TRND | | | | | | | | | | | | | | | | | | | | | | | | |
Securities Lending | | | — | | | | — | | | | — | | | | — | | | | — | | | | — | |
141
Pacer Funds
NOTES TO FINANCIAL STATEMENTS
April 30, 2020 (Continued)
| | | | | | | | | | | | | | | Gross Amounts Net Offset in the
Statements of Assets and Liabilities | | | | | |
Description | | Gross Amounts
of Recognized
Liabilities | | | Gross Amounts
Offset in the
Statement of
Assets and
Liabilities | | | Net Amounts
Presented in
the Statements
of Assets and
Liabilities | | | Financial
Instruments | | | Collateral
Pledged
(Received) | | | Net
Amount | |
PTBD | | | | | | | | | | | | | | | | | | | | | | | | |
Securities Lending | | $ | — | | | $ | — | | | $ | — | | | $ | — | | | $ | — | | | $ | — | |
AFTY | | | | | | | | | | | | | | | | | | | | | | | | |
Securities Lending | | | — | | | | — | | | | — | | | | — | | | | — | | | | — | |
NOTE 8 – INVESTMENT TRANSACTIONS
For the period ended April 30, 2020, the aggregate purchases and sales of securities by the Funds, excluding short-term securities and in-kind transactions, were as follows:
| | Purchases | | | Sales | |
PTLC | | $ | 130,021,868 | | | $ | 108,812,402 | |
PTMC | | | 774,622,196 | | | | 1,342,923,018 | |
PTNQ | | | 423,657,030 | | | | 359,870,260 | |
PTEU | | | 12,629,330 | | | | 108,836,259 | |
GCOW | | | 211,574,559 | | | | 175,089,666 | |
COWZ | | | 200,845,782 | | | | 197,768,867 | |
CALF | | | 49,840,792 | | | | 49,810,438 | |
ICOW | | | 52,810,493 | | | | 45,921,528 | |
PWS | | | 545,607,777 | | | | 572,852,583 | |
VETS | | | 585,982 | | | | 568,171 | |
RTL | | | 612,062 | | | | 601,420 | |
INDS | | | 11,130,929 | | | | 8,289,517 | |
SRVR | | | 53,168,710 | | | | 50,867,892 | |
PEXL | | | 1,015,713 | | | | 1,291,658 | |
SZNE | | | 115,292,500 | | | | 114,475,193 | |
BUL | | | 3,398,318 | | | | 3,348,385 | |
PTIN | | | 27,783,643 | | | | 131,806,464 | |
ECOW | | | 4,081,949 | | | | 3,047,875 | |
HERD | | | 43,128 | | | | 41,390 | |
TRND | | | 755,174 | | | | 754,922 | |
PTBD | | | 101,822,942 | | | | 99,412,336 | |
AFTY | | | 28,605,522 | | | | 33,129,345 | |
For the period ended April 30, 2020, in-kind transactions associated with creations and redemptions are as follows:
| | | Purchases | | | Sales | |
PTLC | | $ | 921,249,917 | | | $ | (63,276,120 | ) |
PTMC | | | 129,474,447 | | | | (258,180,683 | ) |
PTNQ | | | 246,889,648 | | | | (90,099,485 | ) |
PTEU | | | 26,652,545 | | | | (98,097,170 | ) |
GCOW | | | 45,977,792 | | | | (111,643,363 | ) |
COWZ | | | 104,426,533 | | | | (144,494,363 | ) |
CALF | | | 20,208,571 | | | | (43,477,928 | ) |
ICOW | | | 4,725,757 | | | | (17,206,207 | ) |
PWS | | | 24,547,312 | | | | (68,519,382 | ) |
142
Pacer Funds
NOTES TO FINANCIAL STATEMENTS
April 30, 2020 (Continued)
| | | Purchases | | | Sales | |
VETS | | $ | 1,493,266 | | | $ | (1,490,929 | ) |
RTL | | | 4,059,344 | | | | (4,092,896 | ) |
INDS | | | 44,312,334 | | | | (5,565,424 | ) |
SRVR | | | 511,505,610 | | | | (12,715,261 | ) |
PEXL | | | 2,754,601 | | | | (2,476,657 | ) |
SZNE | | | 120,437,176 | | | | (56,419,180 | ) |
BUL | | | 6,232,889 | | | | (5,106,984 | ) |
PTIN | | | 128,642,571 | | | | (14,884,262 | ) |
ECOW | | | 1,626,362 | | | | (4,138,096 | ) |
HERD | | | 2,528,090 | | | | (1,259,222 | ) |
TRND | | | 28,497,519 | | | | — | |
PTBD | | | 149,118,158 | | | | (9,987,291 | ) |
AFTY | | | — | | | | — | |
For the period ended April 30, 2020, long-term purchases and sales of U.S. Government Securities were as follows:
| | | Purchases | | | Sales | |
PTLC | | $ | 2,498,707,639 | | | $ | 77,678,862 | |
PTMC | | | 1,205,199,859 | | | | 686,574,011 | |
PTNQ | | | 305,022,875 | | | | 304,926,461 | |
PWS | | | 292,388,606 | | | | 245,887,943 | |
PTIN | | | 129,882,824 | | | | — | |
PTBD | | | 159,700,728 | | | | 19,386,865 | |
During the fiscal year ended April 30, 2017, PTEU accepted a cash contribution in the amount of $409,837 to reimburse the Fund from prior securities transactions.
NOTE 9 – TRANSACTIONS WITH AFFILIATED SECURITIES
The Pacer Cash Cows Fund of Funds Index uses an objective, rules-based approach to construct a portfolio that, as of each quarterly rebalance, is composed of the ETFs listed in the following table, each advised by the Adviser (collectively, the “Cash Cows ETFs”). Each of the Cash Cows ETFs is an index-based ETF that seeks to track the total return performance, before fees and expenses, of the applicable underlying index listed in the following table (collectively, the “Cash Cows Indexes”). Each Cash Cows Index uses an objective, rules-based methodology to provide exposure to companies with high free cash flow yields (commonly referred to as “cash cows”) selected from the applicable “Equity Universe” as indicated in the following table.
Weight | Cash Cows ETF | Cash Cows Index | Equity Universe |
20% | Pacer US Cash Cows 100 ETF | Pacer US Cash Cows 100 ETF | Russell 1000 Index |
20% | Pacer Global Cash Cows Dividend ETF | Pacer Global Cash Cows Dividend Index | FTSE Developed Large Cap Index |
20% | Pacer US Small Cap Cash Cows 100 ETF | Pacer US Small Cap Cash Cows 100 Index | S&P Small Cap 600® Index |
20% | Pacer US Cash Cows Growth ETF | Pacer US Cash Cows Growth Index | S&P 900® Pure Growth Index |
20% | Pacer Developed Markets International Cash Cows 100 ETF | Pacer Developed Markets International Cash Cows 100 Index | FTSE Developed ex US Index |
143
Pacer Funds
NOTES TO FINANCIAL STATEMENTS
April 30, 2020 (Continued)
HERD had the following transactions during the current fiscal period with affiliates:
| | | Share Activity | |
Security Name | | Balance
May 1, 2019 | | | Purchases | | | Sales | | | Balance
April 30, 2020 | |
BUL | | | — | | | | 20,373 | | | | 11,020 | | | | 9,353 | |
CALF | | | — | | | | 20,406 | | | | 9,934 | | | | 10,472 | |
COWZ | | | — | | | | 17,002 | | | | 8,680 | | | | 8,322 | |
GCOW | | | — | | | | 16,362 | | | | 8,166 | | | | 8,196 | |
ICOW | | | — | | | | 19,171 | | | | 9,661 | | | | 9,510 | |
| | | Year Ended April 30, 2020 | |
Security Name | | Value | | | Dividend Income | | | Gain (Loss) Realized
on Sale of Shares | | | Net Change
in Unrealized
Depreciation
on Investments
in Affiliate | |
BUL | | $ | 214,516 | | | $ | 4,070 | | | $ | (1,954 | ) | | $ | (18,731 | ) |
CALF | | | 217,841 | | | | 3,932 | | | | (3,035 | ) | | | (48,997 | ) |
COWZ | | | 209,699 | | | | 8,933 | | | | 6,092 | | | | (38,380 | ) |
GCOW | | | 201,182 | | | | 16,122 | | | | (3,320 | ) | | | (53,707 | ) |
ICOW | | | 197,754 | | | | 12,252 | | | | (6,700 | ) | | | (60,882 | ) |
The Pacer Trendpilot Fund of Funds Index uses an objective, rules-based approach to construct a portfolio that, as of each quarterly rebalance, is composed of the ETFs listed in the following table, each advised by the Adviser (collectively, the “Trendpilot ETFs”). Each of the Trendpilot ETFs is an index-based ETF that seeks to track the total return performance, before fees and expenses, of the underlying index listed in the following table (collectively, the “Trendpilot Indexes”). Each Trendpilot Index uses an objective, rules-based methodology to implement a systematic trend-following strategy that directs exposure (i) 100% to the “Equity Component” specified in the table below, (ii) 50% to the applicable Equity Component and 50% to 3-Month US Treasury bills, or (iii) 100% to 3-Month US Treasury bills, depending on the relative performance of the Equity Component and its 200-business day historical simple moving average (the “200-day moving average”). The calculation of the 200-day moving average for each Equity Component is based on the total return version of such Equity Component and reflects the reinvestment of dividends paid by the securities in such Equity Component.
Weight | Trendpilot ETF | Trendpilot Index | Equity Component |
20% | Pacer Trendpilot® US Large Cap ETF | Pacer Trendpilot® US Large Cap Index | S&P 500® Index |
20% | Pacer Trendpilot® US Mid Cap ETF | Pacer Trendpilot® US Mid Cap Index | S&P MidCap 400® Index |
20% | Pacer Trendpilot® 100 ETF | Pacer NASDAQ-100 Trendpilot® Index | NASDAQ-100® Index |
40% | Pacer Trendpilot® International ETF | Pacer Trendpilot® International Index | S&P Developed Ex-US Large Cap Index |
TRND had the following transactions during the current fiscal period with affiliates:
| | | Share Activity | |
Security Name | | Balance
May 1, 2019 | | | Purchases | | | Sales | | | Balance
April 30, 2020 | |
PTIN | | | — | | | | 463,584 | | | | 6,239 | | | | 457,345 | |
PTLC | | | — | | | | 201,024 | | | | 2,631 | | | | 198,393 | |
PTMC | | | — | | | | 200,416 | | | | 11,500 | | | | 188,916 | |
PTNQ | | | — | | | | 161,862 | | | | 5,137 | | | | 156,725 | |
144
Pacer Funds
NOTES TO FINANCIAL STATEMENTS
April 30, 2020 (Continued)
| | | Year Ended April 30, 2020 | |
Security Name | | Value | | | Dividend Income | | | Gain (Loss) Realized
on Sale of Shares | | | Net Change
in Unrealized
Appreciation
(Depreciation)
on Investments
in Affiliate | |
PTIN | | $ | 10,715,594 | | | $ | 56,429 | | | $ | (18,549 | ) | | $ | (618,681 | ) |
PTLC | | | 5,352,643 | | | | 32,650 | | | | (173 | ) | | | (576,282 | ) |
PTMC | | | 5,351,990 | | | | 40,813 | | | | (33,141 | ) | | | (127,934 | ) |
PTNQ | | | 5,947,714 | | | | 13,546 | | | | 4,452 | | | | 240,477 | |
NOTE 10 – TAX COST BASIS
The components of tax basis cost of investments and net unrealized appreciation for federal income tax purposes at April 30, 2020 were as follows:
| | | PTLC | | | PTMC | | | PTNQ | | | PTEU | | | GCOW | |
Tax cost of investments | | $ | 3,170,570,008 | | | $ | 702,799,261 | | | $ | 798,281,717 | | | $ | 117,923,023 | | | $ | 210,392,185 | |
Gross tax unrealized appreciation | | | 360,259 | | | | 264,190 | | | | 104,735,993 | | | | 29,640 | | | | 3,473,286 | |
Gross tax unrealized depreciation | | | — | | | | (2,037 | ) | | | (64,112,907 | ) | | | (19,792 | ) | | | (44,165,970 | ) |
Net tax unrealized appreciation (depreciation) | | | 360,259 | | | | 262,153 | | | | 40,623,086 | | | | 9,848 | | | | (40,692,684 | ) |
Undistributed ordinary income | | | 8,861,367 | | | | 892,895 | | | | 518,444 | | | | — | | | | 1,003,305 | |
Undistributed long-term gain | | | — | | | | — | | | | — | | | | — | | | | — | |
Total distributable earnings | | | 8,861,367 | | | | 892,895 | | | | 518,444 | | �� | | — | | | | 1,003,305 | |
Other accumulated (loss) | | | (480,060,919 | ) | | | (114,319,732 | ) | | | (17,582,345 | ) | | | (47,591,043 | ) | | | (16,065,766 | ) |
Total accumulated gain (loss) | | $ | (470,839,293 | ) | | $ | (113,164,684 | ) | | $ | 23,559,185 | | | $ | (47,581,195 | ) | | $ | (55,755,145 | ) |
| | | COWZ | | | CALF | | | ICOW | | | PWS | | | VETS | |
Tax cost of investments | | $ | 265,194,167 | | | $ | 20,965,531 | | | $ | 31,710,603 | | | $ | 62,185,260 | | | $ | 2,868,687 | |
Gross tax unrealized appreciation | | | 19,007,834 | | | | 1,412,888 | | | | 392,687 | | | | 3,763,162 | | | | 232,427 | |
Gross tax unrealized depreciation | | | (38,546,481 | ) | | | (4,162,523 | ) | | | (7,035,962 | ) | | | (19,021 | ) | | | (329,962 | ) |
Net tax unrealized appreciation (depreciation) | | | (19,538,647 | ) | | | (2,749,635 | ) | | | (6,643,275 | ) | | | 3,744,141 | | | | (97,535 | ) |
Undistributed ordinary income | | | 294,997 | | | | 29,901 | | | | 99,871 | | | | 49,843 | | | | 1,691 | |
Undistributed long-term gain | | | — | | | | — | | | | — | | | | — | | | | — | |
Total distributable earnings | | | 294,997 | | | | 29,901 | | | | 99,871 | | | | 49,843 | | | | 1,691 | |
Other accumulated (loss) | | | (40,322,137 | ) | | | (14,166,371 | ) | | | (4,486,688 | ) | | | (23,552,021 | ) | | | (47,711 | ) |
Total accumulated gain (loss) | | $ | (59,565,787 | ) | | $ | (16,886,105 | ) | | $ | (11,030,092 | ) | | $ | (19,758,037 | ) | | $ | (143,555 | ) |
| | RTL | | | INDS | | | SRVR | | | PEXL | | | SZNE | |
Tax cost of investments | | $ | 1,596,709 | | | $ | 52,780,742 | | | $ | 638,180,881 | | | $ | 1,316,565 | | | $ | 60,661,892 | |
Gross tax unrealized appreciation | | | 14,088 | | | | 2,173,457 | | | | 56,195,327 | | | | 123,586 | | | | — | |
Gross tax unrealized depreciation | | | (636,779 | ) | | | (4,569,744 | ) | | | (28,202,324 | ) | | | (182,761 | ) | | | (6,989 | ) |
Net tax unrealized appreciation (depreciation) | | | (622,691 | ) | | | (2,396,287 | ) | | | 27,993,003 | | | | (59,175 | ) | | | (6,989 | ) |
Undistributed ordinary income | | | — | | | | 30,349 | | | | — | | | | 617 | | | | 23,090 | |
Undistributed long-term gain | | | — | | | | — | | | | — | | | | — | | | | — | |
Total distributable earnings | | | — | | | | 30,349 | | | | — | | | | 617 | | | | 23,090 | |
Other accumulated (loss) | | | (72,744 | ) | | | (1,978,292 | ) | | | (536,329 | ) | | | (258,045 | ) | | | (15,029,291 | ) |
Total accumulated gain (loss) | | $ | (695,435 | ) | | $ | (4,344,230 | ) | | $ | 27,456,674 | | | $ | (316,603 | ) | | $ | (15,013,190 | ) |
145
Pacer Funds
NOTES TO FINANCIAL STATEMENTS
April 30, 2020 (Continued)
| | BUL | | | PTIN | | | ECOW | | | HERD | | | TRND | |
Tax cost of investments | | $ | 1,219,620 | | | $ | 151,020,429 | | | $ | 1,194,453 | | | $ | 1,262,100 | | | $ | 28,517,104 | |
Gross tax unrealized appreciation | | | 96,071 | | | | 38,733 | | | | 48,677 | | | | 2,904 | | | | 360,438 | |
Gross tax unrealized depreciation | | | (171,163 | ) | | | (11,231 | ) | | | (286,759 | ) | | | (223,601 | ) | | | (1,496,228 | ) |
Net tax unrealized appreciation (depreciation) | | | (75,092 | ) | | | 27,502 | | | | (238,082 | ) | | | (220,697 | ) | | | (1,135,790 | ) |
Undistributed ordinary income | | | 324 | | | | 227,453 | | | | 13,585 | | | | — | | | | — | |
Undistributed long-term gain | | | — | | | | — | | | | — | | | | — | | | | — | |
Total distributable earnings | | | 324 | | | | 227,453 | | | | 13,585 | | | | — | | | | — | |
Other accumulated (loss) | | | (205,376 | ) | | | (12,612,233 | ) | | | (41,058 | ) | | | (4,717 | ) | | | (6,020 | ) |
Total accumulated gain (loss) | | $ | (280,144 | ) | | $ | (12,357,278 | ) | | $ | (265,555 | ) | | $ | (225,414 | ) | | $ | (1,141,810 | ) |
| | PTBD | | | AFTY | |
Tax cost of investments | | $ | 140,301,610 | | | $ | 9,606,950 | |
Gross tax unrealized appreciation | | | 3,109,727 | | | | 256,734 | |
Gross tax unrealized depreciation | | | (54,156 | ) | | | (872,569 | ) |
Net tax unrealized appreciation (depreciation) | | | 3,055,571 | | | | (615,835 | ) |
Undistributed ordinary income | | | 40,452 | | | | — | |
Undistributed long-term gain | | | — | | | | — | |
Total distributable earnings | | | 40,452 | | | | — | |
Other accumulated (loss) | | | (1,000,103 | ) | | | (1,191,687 | ) |
Total accumulated gain (loss) | | $ | 2,095,920 | | | $ | (1,807,522 | ) |
The difference between book and tax-basis cost is attributable to the realization for tax purposes of unrealized gains on investments in Real Estate Investment Trusts, partnerships, passive foreign investment companies and wash sales. Under tax law, certain capital and foreign currency losses realized after April 30 and within the taxable year are deemed to arise on the first business day of the Fund’s next taxable year.
At April 30, 2020, the Funds had the following capital loss carryforwards:
| | | Short-Term | | | Long-Term | | | Expires | |
PTLC | | $ | 228,446,268 | | | $ | 251,614,651 | | | | Indefinite | |
PTMC | | | 106,713,763 | | | | 7,605,969 | | | | Indefinite | |
PTNQ | | | 16,331,208 | | | | 1,251,137 | | | | Indefinite | |
PTEU | | | 38,573,148 | | | | 8,767,332 | | | | Indefinite | |
GCOW | | | 7,383,320 | | | | 8,684,188 | | | | Indefinite | |
COWZ | | | 26,797,213 | | | | 13,524,924 | | | | Indefinite | |
CALF | | | 10,982,976 | | | | 3,183,395 | | | | Indefinite | |
ICOW | | | 2,707,011 | | | | 1,779,379 | | | | Indefinite | |
PWS | | | 23,552,021 | | | | — | | | | Indefinite | |
VETS | | | 30,831 | | | | 16,880 | | | | Indefinite | |
RTL | | | 72,743 | | | | — | | | | Indefinite | |
INDS | | | 1,978,292 | | | | — | | | | Indefinite | |
SRVR | | | 536,329 | | | | — | | | | Indefinite | |
PEXL | | | 230,870 | | | | 27,175 | | | | Indefinite | |
SZNE | | | 15,029,291 | | | | — | | | | Indefinite | |
BUL | | | 205,376 | | | | — | | | | Indefinite | |
PTIN | | | 12,611,917 | | | | — | | | | Indefinite | |
ECOW | | | 39,967 | | | | — | | | | Indefinite | |
HERD | | | 4,717 | | | | — | | | | Indefinite | |
TRND | | | — | | | | — | | | | Indefinite | |
PTBD | | | 1,000,103 | | | | — | | | | Indefinite | |
AFTY | | | 1,166,967 | | | | — | | | | Indefinite | |
146
Pacer Funds
NOTES TO FINANCIAL STATEMENTS
April 30, 2020 (Continued)
AFTY utilized $2,385,684 of capital loss carryforward during the current period ended April 30, 2020.
At April 30, 2020, PTEU, TRND and AFTY deferred on a tax basis, a post-October capital loss of $232,971, $6,020 and $24,720, respectively. None of the Funds deferred on a tax bases late-year ordinary losses.
NOTE 11 – DISTRIBUTIONS TO SHAREHOLDERS
The tax character of distributions paid by the Funds during the fiscal period ended April 30, 2020 was as follows:
| | | Ordinary Income | | | Capital Gains | | | Return of Capital | |
PTLC | | $ | 33,554,677 | | | $ | — | | | $ | — | |
PTMC | | | 8,738,254 | | | | — | | | | — | |
PTNQ | | | 3,044,420 | | | | — | | | | — | |
PTEU | | | 4,195,663 | | | | — | | | | — | |
GCOW | | | 8,770,455 | | | | — | | | | — | |
COWZ | | | 6,190,930 | | | | — | | | | — | |
CALF | | | 419,742 | | | | — | | | | — | |
ICOW | | | 1,009,491 | | | | — | | | | — | |
PWS | | | 1,151,877 | | | | — | | | | — | |
VETS | | | 52,852 | | | | — | | | | — | |
RTL | | | 57,170 | | | | — | | | | 15,792 | |
INDS | | | 656,033 | | | | 6,106 | | | | — | |
SRVR | | | 2,911,078 | | | | — | | | | 340,803 | |
PEXL | | | 7,790 | | | | — | | | | — | |
SZNE | | | 898,227 | | | | — | | | | — | |
BUL | | | 24,159 | | | | — | | | | — | |
PTIN | | | 1,060,524 | | | | — | | | | — | |
ECOW | | | 149,137 | | | | — | | | | — | |
HERD | | | 42,529 | | | | — | | | | 151 | |
TRND | | | 137,281 | | | | — | | | | — | |
PTBD | | | 913,550 | | | | — | | | | — | |
AFTY | | | 961,121 | | | | — | | | | 58,489 | |
The tax character of distributions paid by the Funds during the fiscal year/period ended April 30, 2019 was as follows:
| | Ordinary Income | | | Capital Gains | | | Return of Capital | |
PTLC | | $ | 14,704,858 | | | $ | — | | | $ | — | |
PTMC | | | 5,930,872 | | | | — | | | | — | |
PTNQ | | | 1,575,175 | | | | — | | | | — | |
PTEU | | | 2,870,463 | | | | — | | | | — | |
GCOW | | | 7,760,389 | | | | — | | | | — | |
COWZ | | | 2,630,630 | | | | — | | | | — | |
CALF | | | 329,410 | | | | — | | | | — | |
ICOW | | | 731,370 | | | | — | | | | — | |
PWS | | | 1,397,954 | | | | — | | | | — | |
VETS | | | 38,615 | | | | — | | | | — | |
RTL | | | 83,796 | | | | 5,909 | | | | 20,617 | |
INDS | | | 67,295 | | | | — | | | | — | |
SRVR | | | 89,513 | | | | 1,372 | | | | 37,487 | |
PEXL | | | 6,972 | | | | — | | | | — | |
SZNE | | | 29,474 | | | | — | | | | — | |
The tax character of distributions paid by AFTY during the fiscal year ended September 30, 2019 was $183,318 of ordinary income.
147
Pacer Funds
NOTES TO FINANCIAL STATEMENTS
April 30, 2020 (Continued)
NOTE 12 – NEW ACCOUNTING PRONOUNCEMENTS
In March 2017, the Financial Accounting Standards Board (“FASB”) issued Accounting Standards Update (“ASU”) No. 2017-08, Receivables-Nonrefundable Fees and Other Costs (Subtopic 310-20): Premium Amortization on Purchased Callable Debt Securities. The amendments in the ASU shorten the amortization period for certain callable debt securities, held at a premium, to be amortized to the earliest call date. The ASU does not require an accounting change for securities held at a discount; which continues to be amortized to estimated maturity. The ASU is effective for fiscal years and interim periods within those fiscal years beginning after December 15, 2018. Management has evaluated and adopted ASU 2017-08 and concluded these changes do not have a material impact on the Funds’ financial statements.
In August 2018, FASB issued ASU 2018-13, Fair Value Measurement (Topic 820): Disclosure Framework—Changes to the Disclosure Requirements for Fair Value Measurement (“ASU 2018-13”). The primary focus of ASU 2018-13 is to improve the effectiveness of the disclosure requirements for fair value measurements. The changes affect all companies that are required to include fair value measurement disclosures. In general, the amendments in ASU 2018-13 are effective for all entities for fiscal years and interim periods within those fiscal years, beginning after December 15, 2019. An entity is permitted to early adopt the removed or modified disclosures upon the issuance of ASU 2018-13 and may delay adoption of the additional disclosures, which are required for public companies only, until their effective date. Management has evaluated the ASU 2018-13 and has decided to adopt the disclosure framework.
NOTE 13 – SUBSEQUENT EVENT
Management of the Funds has evaluated the need for disclosures and/or adjustments resulting from subsequent events through the date these financial statements were issued. The evaluation did not result in any subsequent events that necessitated disclosures and/or adjustments other than below.
On June 19, 2020, the following Funds declared distributions from ordinary income to shareholders of record as of June 23, 2020, Payable June 26, 2020, as follows:
| | | Ordinary Income | | | Per Share Amount | |
GCOW | | $ | 844,846 | | | $ | 0.16247039 | |
COWZ | | $ | 831,412 | | | $ | 0.10868132 | |
CALF | | $ | 10,857 | | | $ | 0.01085660 | |
ICOW | | $ | 50,773 | | | $ | 0.09231436 | |
PWS | | $ | 69,210 | | | $ | 0.03219073 | |
VETS | | $ | 5,424 | | | $ | 0.10848020 | |
INDS | | $ | 138,409 | | | $ | 0.07284705 | |
SRVR | | $ | 2,528,291 | | | $ | 0.12641453 | |
PEXL | | $ | 1,786 | | | $ | 0.03571240 | |
SZNE | | $ | 104,972 | | | $ | 0.04466907 | |
BUL | | $ | 3,387 | | | $ | 0.06773880 | |
ECOW | | $ | 10,378 | | | $ | 0.20756760 | |
PTBD | | $ | 75,509 | | | $ | 0.01048739 | |
On June 22, 2020, the following Funds declared distributions from ordinary income to shareholders of record as of June 24, 2020, Payable June 29, 2020, as follows:
| | | Ordinary Income | | | Per Share Amount | |
HERD | | $ | 7,398 | | | $ | 0.07397700 | |
On May 22, 2020, the Adviser liquidated the assets of RTL.
On June 25, 2020 the Adviser launched four new funds in the Pacer Funds Trust: Pacer BioThreat Strategy ETF, Pacer Lunt Large Cap Alternator ETF, Pacer Lunt Midcap Multi-Factor Alternator ETF, and Pacer Lunt Large Cap Multi-Factor Alternator ETF.
The global outbreak of COVID-19 (commonly referred to as “coronavirus”) has disrupted economic markets and the prolonged economic impact is uncertain. The ultimate economic fallout from the pandemic, and the long-term impact on economies, markets, industries and individual issuers, are not known. The operational and financial performance of the issuers of securities in which each Funds invests depends on future developments, including the duration and spread of the outbreak, and such uncertainty may in turn adversely affect the value and liquidity of each Fund’s investments, impair the Fund’s ability to satisfy redemption requests, and negatively impact the Fund’s performance.
148
Pacer Funds
Report of Independent Registered Public Accounting Firm
To the Board of Trustees of Pacer Funds Trust and the Shareholders of
Pacer Trendpilot® US Large Cap ETF, Pacer Trendpilot® US Mid Cap ETF, Pacer Trendpilot® 100 ETF, Pacer Trendpilot® European Index ETF, Pacer Global Cash Cows Dividend ETF, Pacer US Cash Cows 100 ETF, Pacer US Small Cap Cash Cows 100 ETF, Pacer Developed Markets International Cash Cows 100 ETF, Pacer WealthShield ETF, Pacer Military Times Best Employers ETF, Pacer Benchmark Retail Real Estate SCTRSM ETF, Pacer Benchmark Industrial Real Estate SCTRSM ETF, Pacer Benchmark Data & Infrastructure Real Estate SCTRSM ETF, Pacer US Export Leaders ETF, Pacer CFRA-Stovall Equal Weight Seasonal Rotation ETF, Pacer US Cash Cows Growth ETF, Pacer Trendpilot ® International ETF, Pacer Emerging Markets Cash Cows 100 ETF, Pacer Cash Cows Fund of Funds ETF, Pacer Trendpilot ® Fund of Funds ETF, Pacer Trendpilot ® US Bond ETF and Pacer CSOP FTSE China A50 ETF
Opinion on the Financial Statements
We have audited the accompanying statements of assets and liabilities of the Pacer Trendpilot® US Large Cap ETF, Pacer Trendpilot® US Mid Cap ETF, Pacer Trendpilot® 100 ETF, Pacer Trendpilot® European Index ETF, Pacer Global Cash Cows Dividend ETF, Pacer US Cash Cows 100 ETF, Pacer US Small Cap Cash Cows 100 ETF, Pacer Developed Markets International Cash Cows 100 ETF, Pacer WealthShield ETF, Pacer Military Times Best Employers ETF, Pacer Benchmark Retail Real Estate SCTRSM ETF, Pacer Benchmark Industrial Real Estate SCTRSM ETF, Pacer Benchmark Data & Infrastructure Real Estate SCTRSM ETF, Pacer US Export Leaders ETF, Pacer CFRA-Stovall Equal Weight Seasonal Rotation ETF, Pacer US Cash Cows Growth ETF, Pacer Trendpilot ® International ETF, Pacer Emerging Markets Cash Cows 100 ETF, Pacer Cash Cows Fund of Funds ETF, Pacer Trendpilot ® Fund of Funds ETF, and Pacer Trendpilot ® US Bond ETF (the “Funds”), including the schedules of investments, as of April 30, 2020 and the related statements of operations for the year or period then ended, the statements of changes in net assets for each of the two years or periods in the period then ended and the related notes (collectively, referred to as the “financial statements”) and the financial highlights for each of the five years or periods in the period then ended. We have audited the accompanying statement of assets and liabilities of the Pacer CSOP FTSE China A50 ETF, including the schedule of investments as of April 30, 2020 and the related statements of operations and changes in net assets and the financial highlights for the period from October 1, 2019 to April 30, 2020. The statement of operations for the year ended September 30, 2019 and the statements of changes in net assets for each of the years ended September 30, 2019 and 2018 and the financial highlights for each of the years or period in the five-year period ended September 30, 2019 was audited by other auditors whose opinion dated November 19, 2019 expressed an unqualified opinion on those financial statements. The Pacer CSOP FTSE China A50 ETF is included in (the “Funds”) reference for all other paragraphs.
In our opinion, the financial statements and financial highlights present fairly, in all material respects, the financial positions of the Funds, as of April 30, 2020, the results of their operations for the year or period then ended, the changes in their net assets for each of the two years or periods in the period then ended, and the financial highlights for each of the five years or periods in the period then ended, as noted in the previous paragraph, in conformity with accounting principles generally accepted in the United States of America.
Basis for Opinion
These financial statements and financial highlights are the responsibility of the Funds’ management. Our responsibility is to express an opinion on these financial statements and financial highlights based on our audits. We are a public accounting firm registered with the Public Company Accounting Oversight Board (United States) (“PCAOB”) and are required to be independent with respect to the Funds in accordance with the U.S. federal securities laws and the applicable rules and regulations of the Securities and Exchange Commission and the PCAOB.
We conducted our audits in accordance with the standards of the PCAOB. Those standards require that we plan and perform the audits to obtain reasonable assurance about whether the financial statements and financial highlights are free of material misstatement, whether due to error or fraud. The Funds are not required to have, nor were we engaged to perform, an audit of their internal control over financial reporting. As part of our audits, we are required to obtain an understanding of internal control over financial reporting but not for the purpose of expressing an opinion on the effectiveness of the Funds’ internal control over financial reporting. Accordingly, we express no such opinion.
149
Pacer Funds
REPORT OF INDEPENDENT REGISTERED PUBLIC ACCOUNTING FIRM
(Continued)
Our audits included performing procedures to assess the risk of material misstatement of the financial statements and financial highlights, whether due to error or fraud, and performing procedures that respond to those risks. Such procedures included examining, on a test basis, evidence regarding the amounts and disclosures in the financial statements and financial highlights. Our procedures included confirmation of securities and cash owned as of April 30, 2020, by correspondence with the custodian, and brokers; when replies were not received from brokers, we performed other auditing procedures. Our audits also included evaluating the accounting principles used and significant estimates made by management, as well as evaluating the overall presentation of the financial statements and financial highlights. We believe that our audits provide a reasonable basis for our opinion.

We have served as the Funds’ auditor since 2015
Abington, Pennsylvania
June 29, 2020
150
Pacer Funds
ADDITIONAL INFORMATION
(Unaudited)
NOTE 1 – FREQUENCY DISTRIBUTION OF PREMIUMS AND DISCOUNTS
Information regarding how often shares of each other Fund traded on the Exchange at a price above (i.e., at a premium) or below (i.e., at a discount) the NAV of the Fund is available on the Funds’ website at www.PacerETFs.com.
NOTE 2 – FEDERAL TAX INFORMATION
Qualified Dividend Income/Dividends Received Deduction
For the fiscal year/period ended April 30, 2020, certain dividends paid by the Funds may be subject to a maximum tax rate of 23%, as provided for by the Tax Cuts and Jobs Act of 2017.
The percentage of dividends declared from ordinary income designated as qualified dividend income was as follows:
PTLC | 97.51% |
PTMC | 75.77% |
PTNQ | 94.93% |
PTEU | 99.94% |
GCOW | 97.34% |
COWZ | 100.00% |
CALF | 100.00% |
ICOW | 100.00% |
PWS | 64.11% |
VETS | 100.00% |
RTL | 2.25% |
INDS | 0.07% |
SRVR | 3.15% |
PEXL | 100.00% |
SZNE | 100.00% |
BUL | 100.00% |
PTIN | 100.00% |
ECOW | 45.09% |
HERD | 95.50% |
TRND | 93.23% |
PTBD | 0.00% |
AFTY | 94.27% |
For corporate shareholders, the percent of ordinary income distributions qualifying for the corporate dividends received deduction for the fiscal year/period ended April 30, 2020 was as follows:
PTLC | 96.80% |
PTMC | 75.12% |
PTNQ | 93.34% |
PTEU | 0.00% |
GCOW | 26.86% |
COWZ | 100.00% |
CALF | 100.00% |
ICOW | 0.08% |
PWS | 62.64% |
VETS | 100.00% |
RTL | 2.25% |
INDS | 0.00% |
SRVR | 1.52% |
PEXL | 100.00% |
SZNE | 100.00% |
151
Pacer Funds
ADDITIONAL INFORMATION
(Unaudited) (Continued)
BUL | 100.00% |
PTIN | 0.03% |
ECOW | 0.00% |
HERD | 0.00% |
TRND | 52.77% |
PTBD | 0.00% |
AFTY | 0.00% |
Short Term Capital Gains
The percentage of taxable ordinary income distributions that are designated as short-term capital gain distributions under Internal Revenue Section 871(k)(2)(C) for each fund were as follows:
PTLC | 0.00% |
PTMC | 0.00% |
PTNQ | 0.00% |
PTEU | 0.00% |
GCOW | 0.00% |
COWZ | 0.00% |
CALF | 0.00% |
ICOW | 0.00% |
PWS | 0.00% |
VETS | 0.00% |
RTL | 0.00% |
INDS | 0.00% |
SRVR | 0.00% |
PEXL | 0.00% |
SZNE | 0.00% |
BUL | 0.00% |
PTIN | 0.00% |
ECOW | 0.00% |
HERD | 0.00% |
TRND | 4.34% |
PTBD | 0.00% |
AFTY | 0.00% |
Foreign Tax Credit Pass Through
Pursuant to Section 853 of the Internal Revenue code, the Funds designate the following amounts as foreign taxes paid for the year/period ended April 30, 2020. Foreign taxes paid for purposes of Section 853 may be less than actual foreign taxes paid for financial statement purposes.
| | | | | | | | | | | Per Share | |
Fund | | Gross Foreign
Source Income | | | Foreign Taxes
Passthrough | | | Gross Foreign
Source Income | | | Foreign Taxes
Passthrough | |
PTLC | | $ | — | | | $ | — | | | $ | — | | | $ | — | |
PTMC | | | — | | | | — | | | | — | | | | — | |
PTNQ | | | — | | | | — | | | | — | | | | — | |
PTEU | | | 508,255 | | | | 508,255 | | | | 0.13 | | | | 0.13 | |
GCOW | | | 575,395 | | | | 558,448 | | | | 0.10 | | | | 0.10 | |
COWZ | | | — | | | | — | | | | — | | | | — | |
CALF | | | — | | | | — | | | | — | | | | — | |
ICOW | | | 110,070 | | | | 109,411 | | | | 0.10 | | | | 0.10 | |
PWS | | | — | | | | — | | | | — | | | | — | |
152
Pacer Funds
ADDITIONAL INFORMATION
(Unaudited) (Continued)
| | | | | | | | | | | Per Share | |
Fund | | Gross Foreign
Source Income | | | Foreign Taxes
Passthrough | | | Gross Foreign
Source Income | | | Foreign Taxes
Passthrough | |
VETS | | $ | — | | | $ | — | | | $ | — | | | $ | — | |
RTL | | | — | | | | — | | | | — | | | | — | |
INDS | | | — | | | | — | | | | — | | | | — | |
SRVR | | | — | | | | — | | | | — | | | | — | |
PEXL | | | — | | | | — | | | | — | | | | — | |
SZNE | | | — | | | | — | | | | — | | | | — | |
BUL | | | — | | | | — | | | | — | | | | — | |
PTIN | | | 149,935 | | | | 149,358 | | | | 0.02 | | | | 0.02 | |
ECOW | | | 18,857 | | | | 18,786 | | | | 0.19 | | | | 0.19 | |
HERD | | | 1,853 | | | | 1,853 | | | | 0.04 | | | | 0.04 | |
TRND | | | 5,580 | | | | 5,580 | | | | 0.01 | | | | 0.01 | |
PTBD | | | — | | | | — | | | | — | | | | — | |
AFTY | | | — | | | | — | | | | — | | | | — | |
Foreign taxes paid or withheld should be included in taxable income with an offsetting deduction from gross income or as a credit for taxes paid to foreign governements.
Above figures may differ from those cited elsewhere in this report due to difference in the calculation of income and gains under GAAP purposes and Internal Revenue Service purposes.
Shareholders are strongly advised to consult their own tax advisers with respect to the tax consequences of their investments in the Funds.
NOTE 3 – DISCLOSURE OF PORTFOLIO HOLDINGS
The Funds file their complete schedule of portfolio holdings for their first and third fiscal quarters with the Securities and Exchange Commission (“SEC”) on Part F of Form N-PORT. The Funds’ Part F of Form N-PORT is available on the website of the SEC at http://www.sec.gov. Each Fund’s portfolio holdings are posted on their website at www.paceretfs.com daily.
NOTE 4 – PROXY VOTING POLICIES AND PROCEDURES
A description of the policies and procedures the Funds use to determine how to vote proxies relating to portfolio securities is provided in the Statement of Additional Information (“SAI”). The SAI is available without charge upon request by calling toll-free at (800) 617-0004, by accessing the SEC’s website at http://www.sec.gov, or by accessing the Funds’ website at www.paceretfs.com. Information on how the Fund voted proxies relating to portfolio securities during the year ended June 30 is available without charge, upon request, by calling (800) 617-0004 or by accessing the website of the SEC.
NOTE 5 – BOARD CONSIDERATIONS IN APPROVING THE INVESTMENT ADVISORY AGREEMENT FOR THE FUNDS
The Board of Trustees (the “Board”) of Pacer Funds Trust (the “Trust”), including the Trustees thereof who are not “interested persons,” as defined by the Investment Company Act of 1940, as amended (the “1940 Act”), of the Trust (the “Independent Trustees”), held a meeting on March 16, 2020 (the “Meeting”) for the purpose of, among other things, the consideration of, and voting on, the proposed approval of the investment advisory agreement (the “Investment Advisory Agreement”) between the Trust and Pacer Advisors, Inc. (the “Advisor”), relating to Pacer Trendpilot US Large Cap ETF, Pacer Trendpilot US Mid Cap ETF, Pacer Trendpilot 100 ETF, Pacer Trendpilot European ETF, Pacer Global Cash Cows Dividend ETF, Pacer US Cash Cows ETF, Pacer Small Cap Cash Cows, Pacer Developed Markets International Cash Cows 100 ETF, Pacer WealthShield ETF, Pacer Military Times Best Employers ETF, Pacer Benchmark Retail Real Estate ETF, Pacer Benchmark Industrial Real Estate ETF, Pacer Benchmark Data & Infrastructure Real Estate ETF, Pacer CFRA-Stovall Equal Weight Seasonal Rotation ETF, and the Pacer U.S. Export Leaders ETF. Additionally, the Board, including the Independent Trustees, held in-person meetings on October 8 and October 21, 2019, for the purpose of, among other things, the consideration of, and voting on, the proposed approval of the Investment Advisory Agreement relating to Pacer CSOP FTSE CHINA A50 ETF (“AFTY”) and the proposed approval of an investment
153
Pacer Funds
ADDITIONAL INFORMATION
(Unaudited) (Continued)
sub-advisory agreement (the “Sub-Advisory Agreement”) between the Advisor and CSOP Asset Management Limited (the “Sub-Advisor”) with respect to AFTY. Each of the aforenamed funds is referred to as a “Fund” and, together, as the “Funds”. Each of the aforementioned meetings is referred to as a “Meeting” and, together, as the “Meetings”.
The Board, including a majority of the Trust’s Independent Trustees voting separately, approved the Investment Advisory Agreement and the Sub-Advisory Agreement at the Meetings, respectively, based on its review of qualitative and quantitative information provided by the Advisor and the Sub-Advisor, as well as the Trust’s other service providers. Prior to deciding to approve the Investment Advisory Agreement and the Sub-Advisory Agreement at the Meetings, respectively, the Independent Trustees requested and obtained from the Advisor and he Sub-Advisor such information as the Independent Trustees deemed reasonably necessary to evaluate the terms of the Investment Advisory Agreement and the Sub-Advisory Agreement. The Independent Trustees received assistance and advice from, and met separately with, independent counsel. In addition, the Independent Trustees received a memorandum from independent counsel regarding the responsibilities of the Board with respect to the approval of the Investment Advisory Agreement and the Sub-Advisory Agreement.
Prior to approval, the Board obtained and reviewed a variety of information, including certain information regarding each Fund’s proposed expenses relative to the expenses of other comparable funds. At the Meetings, respectively, the Board, including the Independent Trustees, evaluated a number of factors and various materials in connection with the approval process, including: (1) a copy of the Investment Advisory Agreement and the Sub-Advisory Agreement; (2) the Advisor’s and the Sub-Advisor’s responses to questionnaires designed to provide the Board with information reasonably necessary to evaluate the terms of the Investment Advisory Agreement and the Sub-Advisory Agreement; (3) the Advisor’s and Sub-Advisor’s Form ADV disclosures; (4) information describing the nature, quality and extent of services that the Advisor and the Sub-Advisor is prepared to provide to each Fund under consideration; (5) the advisory fee payable by each such Fund to the Advisor for its services and the sub-advisory fee payable to the Sub-Advisor by the Advisor under its respective Sub-Advisory Agreement; (6) certain comparative information regarding each such Fund’s expenses and performance relative to the expenses and performance of other funds; (7) a copy of the Trust’s registration statement and prospectuses; and (8) information regarding the ownership and management structure, financial condition, and compliance program of the Advisor and the Sub-Advisor. Representatives from the Advisor and the Sub-Advisor presented additional information and participated in question and answer sessions at the Meetings to help the Board evaluate the Advisor’s and the Sub-Advisor’s services and fees, as well as other aspects of the Investment Advisory Agreement and the Sub-Advisory Agreement.
In considering the approval of the Investment Advisory Agreement and the Sub-Advisory Agreement at the Meetings, respectively, the Board considered various factors that the Trustees determined were relevant, including: (i) the nature, extent and quality of the services to be provided by the Advisor and the Sub-Adviser, including the performance of the Advisor and Sub-Advisor with respect to each relevant Fund; (ii) the costs and benefits, including the fee to be paid to the Advisor by each Fund, of the advisory services to be provided to the Funds; (iii) the fee paid to the Sub-Advisor by the Advisor; and (iv) potential economies of scale.
● | Nature, Extent and Quality of Services to be Provided by the Advisor and the Sub-Advisor. The Board reviewed the scope of services to be provided by the Advisor under the Investment Advisory Agreement and the Sub-Advisor under the Sub-Advisory Agreement. In this regard, the Trustees reviewed each Fund’s investment goal and proposed investment strategy, and each of the Advisor’s and Sub-Advisor’s ability to implement such investment goal and/or investment strategy, including, but not limited to, trading practices. With respect to sub-advisory services to be provided by the Sub-Advisor, the Board noted that the Sub-Advisor would have assets allocated to it by the Advisor and considered the proposed Sub-Advisor’s ability to ensure compliance with AFTY’s strategies, policies, and limitations. The Trustees also considered the successful performance of the Sub-Advisor in managing investment products with investment strategies similar to the investment strategy of AFTY. In addition, the Trustees reviewed the management team at the Advisor and the Sub-Advisor that would be responsible for managing each Fund, including staffing, skills and compensation program, and considered various other portfolios advised by the Advisor and the Sub-Advisor and any potential conflicts. The Board also considered a report from the Trust’s Chief Compliance Officer regarding the Sub-Advisor’s compliance program as such relates to the operation of AFTY. Finally, the Board considered the selection and due diligence process employed by the Advisor in proposing the Sub-Advisor to the AFTY, including the due diligence undertaken with respect to the Sub-Advisor’s compliance capabilities. |
Based on its review, the Board determined that each of the Advisor and the Sub-Advisor is capable of providing all necessary advisory and sub-advisory services required by each relevant Fund, as indicated by the Advisor’s and Sub-Advisor’s management capabilities, the professional qualifications and experience of its portfolio management personnel and the performance of the Funds relative to comparable funds managed by other investment advisers (each a “Peer Group”) and other products managed by the Advisor and the Sub-Advisor with similar investment objectives and strategies as each Fund. The Board also considered other services provided to the Funds by the Advisor and the Sub-Advisor, where relevant, such as selecting broker-dealers for executing portfolio transactions, monitoring adherence to each Fund’s investment restrictions, and monitoring compliance with various policies and procedures and with applicable securities regulations.
154
Pacer Funds
ADDITIONAL INFORMATION
(Unaudited) (Continued)
Based on the factors above, as well as those discussed below, the Board concluded, within the context of its full deliberations, that it was satisfied with the nature, extent and quality of the services provided and to be provided to the Funds by the Advisor and the Sub-Advisor, respectively.
● | Costs and Benefits of Advisory Services to be Provided to the Funds. In considering the advisory fees payable by the Trust to the Advisor and each Fund’s expense ratio, the Board reviewed data compiled by the Advisor comparing the expense ratios of each Fund with the expense ratios of the ETFs and other funds in each Fund’s Peer Group. The Board compared each Fund’s expense ratio to the expense ratios of funds in its Peer Group, focusing on whether each Fund was charged fees that were within the range of fees charged by those in the Peer Group. It also noted that the Advisor had contractually agreed to pay the operating expenses of each Fund, including the cost of transfer agency, custody, fund administration, legal, audit and other services, except interest, taxes, brokerage commissions and other expenses in connection with the execution of portfolio transactions, and extraordinary and non-routine expenses. It was noted that this contractual agreement cannot be changed without shareholder approval. The Board also evaluated the compensation and incidental or “fall-out” benefits received (or proposed or likely to be received) by the Advisor from its relationship with the Funds, taking into account assessments of the Advisor’s profitability prepared and shared by the Advisor’s management. |
Based on the factors above, as well as those discussed below, the Board concluded, within the context of its full deliberations, that each Fund’s advisory fee was reasonable in light of the nature and quality of the services expected to be rendered by the Advisor.
● | Costs and Benefits of Sub-Advisory Advisory Services to be Provided to the Funds. The Board noted that the sub-advisory fees paid to the Sub-Advisor would be paid by the Advisor and would not be additional fees to be borne by AFTY. The Board also noted that the sub-advisory fees were the product of arms-length negotiations between the Advisor and the Sub-Advisor. In considering the sub-advisory fees payable by the Advisor to the Sub-Advisor, the Board evaluated the compensation and benefits proposed or likely to be received by the Sub-Advisor from the Advisor relating to AFTY. Based on the factors above, as well as those discussed below, the Board concluded, within the context of its full deliberations, that the sub-advisory fees payable to the Sub-Advisor under the Sub-Advisory Agreement with the Advisor were reasonable in light of the nature and quality of the services rendered and, where relevant, expected to be rendered by the Sub-Advisor. |
● | Economies of Scale. The Board also reviewed and considered the extent to which economies of scale would be realized by the Advisor and the Sub-Advisor as the assets of the Funds may grow in the future. |
Based on its deliberations and its evaluation of the information described above, at the Meetings, respectively, the Board, including the Independent Trustees: (a) concluded that the terms of the Investment Advisory Agreement with respect to each Fund are fair and reasonable; (b) concluded that the terms of the Sub-Advisory Agreement with respect to AFTY is fair and reasonable; (c) concluded that the Advisor’s fees are reasonable in light of the nature and quality of the services expected to be rendered by the Advisor to each Fund; (d) concluded that the Sub-Advisor’s fees are reasonable in light of the nature and quality of the services expected to be rendered by the Sub- Advisor; (e) agreed to approve the Investment Advisory Agreement as to each Fund for a term of two years; and (f) agreed to approve the Sub-Advisory Agreement as to AFTY for a term of two years. In its deliberations at the Meetings, the Board did not identify any particular factor (or conclusion with respect thereto) or single piece of information that was all-important, controlling or determinative of its decision, but considered all of the factors together, and each Trustee may have attributed different weights to the various factors (and conclusions with respect thereto) and information.
155
Pacer Funds
ADDITIONAL INFORMATION
(Unaudited) (Continued)
NOTE 6 – TRUSTEES AND OFFICERS
The business of the Funds is managed under the direction of the Board of Trustees. The Board of Trustees formulates the general policies of the Funds and meets periodically to review the Funds’ performance, monitor investment activities and practices, and discuss other matters affecting the Funds. The Trustees are fiduciaries for the Funds’ shareholders and are governed by the laws of the State of Delaware in this regard. The names and addresses of the Trustees and officers of the Trust are listed below along with a description of their principal occupations over at least the last five years. There are currently four Trustees, three of whom are not “interested persons” of the Trust within the meaning of that term under the 1940 Act (“Independent Trustee”). The Trustees, in turn, elect the officers of the Trust to actively supervise its day-to-day operations. The address of each Trustee and officer of the Trust, unless otherwise indicated below, is c/o Pacer Advisors, Inc., 500 Chesterfield Parkway, Malvern, PA 19335. The Funds’ Statement of Additional Information includes additional information about the Trustees and is available upon request by calling toll free (800) 617-0004.
Name and Year of Birth | Position(s)
Held with
the Trust | Term of Office
and Length of
Time Served | Principal Occupation(s)
During Past 5 Years | Number of
Portfolios in
Fund
Complex
Overseen
By Trustee | Other
Directorships
held by
Trustee During
Past Five Years |
Interested Trustee | | | | | |
Joe M. Thomson
Born: 1944 | Trustee , Chairman, President and Principal Executive Officer | Indefinite Term; since 2014 | Founder/President, Pacer Advisors, Inc. (since 2005); President and Chief Compliance Officer, Pacer Financial, Inc. (since 2004) | 23 | Director, First Cornerstone Bank (2000-2016) |
Independent Trustees | | | | | |
Deborah G. Wolk
Born: 1950 | Lead Independent Trustee | Indefinite Term; since 2015 | Self-employed providing accounting services and computer modeling (since 1997) | 23 | None |
Jonathan H. Newman, Sr.
Born: 1962 | Trustee | Indefinite Term; since 2015 | CEO and Chairman, Newman Wine & Spirits (since 2007) | 23 | None |
Dennis J. Ryan
Born: 1947 | Trustee | Indefinite Term; since 2017 | Principal/Owner, Brendan Abstract Company, Inc. (title insurance) (since 1999) | 23 | None |
Officers who are not Trustees: | | | | | |
Sean E. O’Hara
Born: 1962 | Treasurer and Principal Financial Officer | Indefinite Term; since 2014 | Director, Index Design Group (since 2015); Director, Pacer Financial, Inc. (since 2007); Director, Pacer Advisors, Inc. (since 2007) | N/A | None |
Bruce Kavanaugh
Born: 1964 | Secretary | Indefinite Term; since 2016 | Vice President, Pacer Advisors, Inc. (since 2004), Vice President, Pacer Financial, Inc. (since 2004) | N/A | None |
Perpetua Seidenberg Gateway Corporate Center, Suite 216
223 Wilmington West Chester Pike Chadds Ford, PA 19317 Born: 1990 | Chief Compliance Officer and AML Officer | Indefinite Term; since 2018 | Compliance Director, Vigilant Compliance, LLC (an investment management services company) (since 2014); Auditor, PricewaterhouseCoopers (2012-2014) | N/A | None |
156
Pacer Funds
ADDITIONAL INFORMATION
(Unaudited) (Continued)
Mr. Thomson is an “Interested Person” by reason of his relationship with the Adviser.
Each Trustee shall serve during the lifetime of the Trust until he or she: (a) dies; (b) resigns; (c) has reached the mandatory retirement age, if any, as set by the Trustees; (d) is declared incompetent by a court of appropriate jurisdiction; or (e) is removed, or, if sooner, until the next meeting of shareholders called for the purpose of electing Trustees and until the election and qualification of his or her successor inaccordance with the Trust’s Declaration of Trust and By-laws. Each officer holds office at the pleasure of the Board and services for a period of one year, or until his or her successor is duly elected and qualified.
The Statement of Additional Information includes additional information, including compensation, about the Funds’ Trustees.
NOTE 7 – CHANGE IN INDEPENDENT REGISTERED PUBLIC ACCOUNTING FIRM
BBD,LLP was previously the principal accountant for AFTY. On January 22, 2020 that firm resigned and Sanville & Company was engaged as principal accountants. The decision to change accountants was approved by the audit committee of the Board of Trustees. During the fiscal year ended September 30, 2019, there were no: (1) disagreements with BBD, LLP on any matter of accounting principles or practices, financial statement disclosure or auditing scope or procedures, which disagreements if not resolved to their satisfaction would have caused them to make reference in connection with their opinion to the subject matter of the disagreements, or (2) reportable events.
The audit reports of BBD, LLP on the financial statements of AFTY as of and for the year ended September 30, 2019 did not contain any adverse opinion or disclaimer of opinion, nor were they qualified or modified as to uncertainty, audit scope or accounting principles.
157
Advisor Pacer Advisors, Inc.
500 Chesterfield Parkway
Malvern, PA 19355 |
Index Provider Index Design Group, LLC
500 Chesterfield Parkway
Malvern, PA 19355 Benchmark Investments, LLC
1115 Broadway, 12th Floor
New York, NY 10010 CFRA
One New York Plaza, 34th Floor
New York, NY 10004 FTSE International Limited
12th Floor, 10 Upper Bank Street
Canary Wharf, London E14 5NP VETS Indexes, LLC
6 East 39th Street, Suite 1003
New York, NY 10016 |
Sub Adviser Vident Investment Advisory, LLC
1125 Sanctuary Parkway, Suite 515
Alpharetta, GA 30009 CSOP Asset Management Limited
2801-2803, Two Exchange Square, 8 Connaught Place
Central, Hong Kong |
Distributor Pacer Financial, Inc.
500 Chesterfield Parkway
Malvern, PA 19355 |
Custodian U.S. Bank National Association
Custody Operations
1555 North Rivercenter Drive
Milwaukee, WI 53212 |
Transfer Agent U.S. Bancorp Fund Services, LLC
615 East Michigan Street
Milwaukee, WI 53202 |
Independent Registered
Public Accounting Firm Sanville & Company
1514 Old York Rd.
Abington, PA 19001 |
Legal Counsel Practus, LLP
137 Airdale Road
Bryn Mawr, PA 19010 |

Item 2. Code of Ethics.
The registrant has adopted a code of ethics that applies to the registrant’s principal executive officer and principal financial officer. The registrant has not made any substantive amendments to its code of ethics during the period covered by this report. The registrant has not granted any waivers from any provisions of the code of ethics during the period covered by this report.
A copy of the registrant’s Code of Ethics is filed herewith.
Item 3. Audit Committee Financial Expert.
The registrant’s board of trustees has determined that there is at least one audit committee financial expert serving on its audit committee. Deborah Wolk is the “audit committee financial expert” and is considered to be “independent” as each term is defined in Item 3 of Form N-CSR.
Item 4. Principal Accountant Fees and Services.
The registrant has engaged its principal accountant to perform audit services, audit-related services, tax services and other services during the past two fiscal years. “Audit services” refer to performing an audit of the registrant's annual financial statements or services that are normally provided by the accountant in connection with statutory and regulatory filings or engagements for those fiscal years. “Audit-related services” refer to the assurance and related services by the principal accountant that are reasonably related to the performance of the audit. “Tax services” refer to professional services rendered by the principal accountant for tax compliance, tax advice, and tax planning. No “Other services” were provided by the principal accountant were. The following table details the aggregate fees billed or expected to be billed for each of the last two fiscal years for audit fees, audit-related fees, tax fees and other fees by the principal accountant.
| | FYE 04/30/2020 | FYE 04/30/2019 |
| Audit Fees | $184,130 | $126,500 |
| Audit-Related Fees | $0 | $0 |
| Tax Fees | $25,826 | $17,400 |
| All Other Fees | $0 | $0 |
The audit committee has adopted pre-approval policies and procedures that require the audit committee to pre-approve all audit and non-audit services of the registrant, including services provided to any entity affiliated with the registrant.
The percentage of fees billed by Sanville & Company applicable to non-audit services pursuant to waiver of pre-approval requirement were as follows:
| | FYE 04/30/2020 | FYE 04/30/2019 |
| Audit-Related Fees | 0% | 0% |
| Tax Fees | 0% | 0% |
| All Other Fees | 0% | 0% |
All of the principal accountant’s hours spent on auditing the registrant’s financial statements were attributed to work performed by full-time permanent employees of the principal accountant. (If more than 50 percent of the accountant’s hours were spent to audit the registrant's financial statements for the most recent fiscal year, state how many hours were attributed to work performed by persons other than the principal accountant's full-time, permanent employees.)
The following table indicates the non-audit fees billed or expected to be billed by the registrant’s accountant for services to the registrant and to the registrant’s investment adviser (and any other controlling entity, etc.—not sub-adviser) for the last two years. The audit committee of the board of trustees/directors has considered whether the provision of non-audit services that were rendered to the registrant's investment adviser is compatible with maintaining the principal accountant's independence and has concluded that the provision of such non-audit services by the accountant has not compromised the accountant’s independence.
| Non-Audit Related Fees | FYE 04/30/2020 | FYE 04/30/2019 |
| Registrant | $0 | $0 |
| Registrant’s Investment Adviser | $0 | $0 |
Item 5. Audit Committee of Listed Registrants.
The registrant is an issuer as defined in Rule 10A-3 under the Securities Exchange Act of 1934, (the “Act”) and has a separately-designated standing audit committee established in accordance with Section 3(a)(58)(A) of the Act. The independent members of the committee are as follows: Jonathan Newman, Dennis Ryan and Deborah Wolk.
Item 6. Investments.
Schedule of Investments is included as part of the report to shareholders filed under Item 1 of this Form.
Item 7. Disclosure of Proxy Voting Policies and Procedures for Closed-End Management Investment Companies.
Not applicable to open-end investment companies.
Item 8. Portfolio Managers of Closed-End Management Investment Companies.
Not applicable to open-end investment companies.
Item 9. Purchases of Equity Securities by Closed-End Management Investment Company and Affiliated Purchasers.
Not applicable to open-end investment companies.
Item 10. Submission of Matters to a Vote of Security Holders.
There have been no material changes to the procedures by which shareholders may recommend nominees to the registrant’s board of trustees.
Item 11. Controls and Procedures.
| (a) | The Registrant’s President/Principal Executive Officer and Treasurer/Principal Financial Officer have reviewed the Registrant's disclosure controls and procedures (as defined in Rule 30a-3(c) under the Investment Company Act of 1940 (the “Act”)) as of a date within 90 days of the filing of this report, as required by Rule 30a-3(b) under the Act and Rules 13a-15(b) or 15d-15(b) under the Securities Exchange Act of 1934. Based on their review, such officers have concluded that the disclosure controls and procedures are effective in ensuring that information required to be disclosed in this report is appropriately recorded, processed, summarized and reported and made known to them by others within the Registrant and by the Registrant’s service provider. |
| (b) | There were no changes in the Registrant's internal control over financial reporting (as defined in Rule 30a-3(d) under the Act) that occurred during the second fiscal quarter of the period covered by this report that has materially affected, or is reasonably likely to materially affect, the Registrant's internal control over financial reporting. |
Item 12. Exhibits.
(2) A separate certification for each principal executive officer and principal financial officer pursuant to Section 302 of the Sarbanes-Oxley Act of 2002. Filed herewith.
(3) Any written solicitation to purchase securities under Rule 23c-1 under the Act sent or given during the period covered by the report by or on behalf of the registrant to 10 or more persons. Not applicable to open-end investment companies.
(4) Change in the registrant’s independent public accountant. There were no changes in the registrant’s independent public accountant for the period covered by this report.
SIGNATURES
Pursuant to the requirements of the Securities Exchange Act of 1934 and the Investment Company Act of 1940, the registrant has duly caused this report to be signed on its behalf by the undersigned, thereunto duly authorized.
| (Registrant) | Pacer Funds Trust | |
| | | |
| By (Signature and Title) | /s/ Joe Thomson | |
| | Joe M. Thomson, President (Principal Executive Officer) | |
| | | |
| Date | 7/6/2020 | |
Pursuant to the requirements of the Securities Exchange Act of 1934 and the Investment Company Act of 1940, this report has been signed below by the following persons on behalf of the registrant and in the capacities and on the dates indicated.
| By (Signature and Title) | /s/ Joe Thomson | |
| | Joe M. Thomson, President (Principal Executive Officer) | |
| | | |
| Date | 7/6/2020 | |
| | | |
| By (Signature and Title) | /s/ Sean O’Hara | |
| | Sean E. O’Hara, Treasurer (Principal Financial Officer) | |
| | | |
| Date | 7/6/2020 | |
| * | Print the name and title of each signing officer under his or her signature. |