As filed with the U.S. Securities and Exchange Commission on 1/8/2021.
UNITED STATES
SECURITIES AND EXCHANGE COMMISSION
Washington, D.C. 20549
FORM N-CSR
CERTIFIED SHAREHOLDER REPORT OF REGISTERED
MANAGEMENT INVESTMENT COMPANIES
Investment Company Act file number 811-23024
Pacer Funds Trust
(Exact name of registrant as specified in charter)
500 Chesterfield Parkway
Malvern, PA 19355
(Address of principal executive offices) (Zip code)
Joe M. Thomson, President
500 Chesterfield Parkway
Malvern, PA 19355
(Name and address of agent for service)
610-644-8100
Registrant's telephone number, including area code
Date of fiscal year end: October 31
Date of reporting period: October 31, 2020
Item 1. Reports to Stockholders.

Pacer Funds
TABLE OF CONTENTS
| | Page |
Letter to Shareholders | 1 |
Portfolio Allocation | 2 |
Performance Summary | 3 |
Expense Example | 6 |
Schedules of Investments | 7 |
Statements of Assets & Liabilities | 12 |
Statements of Operations | 13 |
Statements of Changes in Net Assets | 14 |
Financial Highlights | 16 |
Notes to Financial Statements | 19 |
Report of Independent Registered Public Accounting Firm | 27 |
Review of Liquidity Risk Management Program | 28 |
Additional Information | 29 |
Pacer Funds
Dear Shareholder,
Looking back on this difficult and taxing year, I am still filled with an overwhelming sense of gratitude and pride for our accomplishments as a company. Despite rocky market conditions and a global pandemic, our team has persisted. We maintained our assets under management and continued to launch products and bring new people onto our team aiming to serve more financial advisors and their clients across the country. Our unique model, which centers around the distribution of our exchange traded funds (ETFs) through the financial advisor community, continues to be our focus, albeit with an adaptive model in these challenging times.
Since our inception more than five years ago, our goal has been to design innovative products to help investors and financial advisors reach their own objectives. Since our launch, we have expanded our product offerings beyond our seven-fund flagship family, the Trendpilot ETF Series, to include seven funds in the Cash Cows ETF Series, nine within our Custom ETF Series, and one Pacer Leaders ETF. This year, we partnered with SL Advisors to add a new fund to the Pacer Custom ETF Series, the Pacer American Energy Independence ETF (USAI), to provide investors with exposure to midstream energy infrastructure activities. Additionally, we launched a new fund family: the Pacer Factor ETF Series. As we expand this exciting new investment series, we also teamed up with Salt Financial to create the Pacer Salt High truBeta US Market ETF (SLT) and Pacer Salt Low truBeta US Market ETF (LSLT). These three fund additions allow us to offer a more comprehensive range of products.
We thank the investors, financial advisors and our partners for entrusting your assets with us as we look forward to growing with you.
Joe M. Thomson Chairman, Pacer Funds Trust
Market Environment Overview
2019 was another strong year for equity market performance as the 10-year long bull market continued to make all-time highs.2020 started off with a sharp January advance before peaking in February as news of the escalating Coronavirus pandemic began to surface. The selloff intensified in early March as reports of the increasing spread of the virus roiled markets and resulted in government-imposed shutdowns. The market bottomed in late March after recording one of the largest and fastest declines in history. The market ultimately found a bottom in late March as the number of reported new cases flatted and market participants began to price in a v-shaped recovery in economic activity. The market continued to move higher before making a new all-time high in August. Since August, the market has churned sideways as investors weigh the uncertainty of the November election.
2020 has been one of the narrowest markets in history with a small subset of large cap technology stocks driving a large proportion of the advance in major market averages. Technology, Consumer, and Healthcare stocks have led the way, while Energy and Financials have lagged. Growth stocks have continued to outperform value stocks and US stocks have outperformed International stocks.
The outlook for the rest of the year looks likely to be driven by news regarding the containment of the virus and the threat of increased shutdowns weighing on the recent recovery in economic activity. In addition, uncertainty about the election will likely continue into January as investors learn what the policy outlook in Washington will look like. The key risks facing this market are signs of a worsening spread of the virus, slower than expected economic recovery, narrow market participation, and partisan divisions undermining fiscal policy support from Washington. With the Federal Reserve directive that interest rates will remain low for the near future, thus making higher yielding investments hard to find, the equity market rally may continue into 2021 as investors search for a total return solution.
USAI: The top 3 contributors to return for the fund were New Fortress Energy Inc., Antero Midstream Corp, and Hess Midstream LP, which contributed 4.46%, 1.76%, and 1.49% to the Fund’s overall performance, respectively. The bottom 3 contributors to return were ONEOK, Inc., Kinder Morgan Inc., and Energy Transfer, LP. These contributed -4.37%, -3.99%, and -2.71% respectively to the Fund’s overall return.
SLT: The top 3 contributors to return for the fund were Immunomedics, Inc., Cloudflare, Inc., and Enphase Energy, Inc., which contributed 2.41%, 1.48%, and 1.43% to the Fund’s overall performance, respectively. The bottom 3 contributors to return were Expedia Group, Inc., Wynn Resorts, Limited, and Athene Holding Limited. These contributed -1.08%, -0.89% and -0.87% respectively to the Fund’s overall return.
LSLT: The top 3 contributors to return for the fund were Danaher Corporation, Conagra Brancds, Inc., and Rollins, Inc., which contributed 0.49%, 0.34%, and 0.34% to the Fund’s overall performance, respectively. The bottom 3 contributors to return were Equity Residential, FirstEnergy Corp, and Molson Coors Beverage Company. These contributed -0.84%, -0.59% and -0.47% respectively to the Fund’s overall return.
1
Pacer Funds
PORTFOLIO ALLOCATION (Unaudited)
As of October 31, 2020
Pacer American Energy Independence ETF
Sector(a) | | Percentage of
Net Assets | |
Transportation and Warehousing | | | 43.5 | % |
Utilities | | | 31.7 | % |
Mining, Quarrying, and Oil and Gas Extraction | | | 17.8 | % |
Real Estate and Rental and Leasing | | | 2.8 | % |
Wholesale Trade | | | 2.6 | % |
Retail Trade | | | 0.4 | % |
Short-Term Investments | | | 0.6 | % |
Other Assets in Excess of Liabilities | | | 0.6 | % |
Total | | | 100.0 | % |
(a) | The Fund may classify a company in a different category than the American Energy Independence Index. |
Pacer Salt High truBetaTM US Market ETF
Sector(a) | | Percentage of
Net Assets | |
Technology | | | 28.1 | % |
Communications | | | 19.6 | % |
Consumer Cyclical | | | 16.8 | % |
Financial | | | 14.5 | % |
Consumer, Non-cyclical | | | 12.4 | % |
Energy | | | 3.4 | % |
Industrial | | | 1.9 | % |
Basic Materials | | | 1.0 | % |
Short-Term Investments | | | 2.3 | % |
Liabilities in Excess of Other Assets | | | 0.0 | %(b) |
| | | | 100.0 | % |
(a) | The Fund may classify a company in a different category than the Salt High truBetaTM US Market Index. |
Pacer Salt Low truBetaTM US Market ETF
Sector(a) | | Percentage of
Net Assets | |
Consumer, Non-cyclical | | | 38.2 | % |
Utilities | | | 19.6 | % |
Financials | | | 15.7 | % |
Consumer Cyclical | | | 7.3 | % |
Communications | | | 6.8 | % |
Industrials | | | 5.5 | % |
Technology | | | 4.7 | % |
Basic Materials | | | 1.8 | % |
Short-Term Investments | | | 0.3 | % |
Other Assets in Excess of Liabilities | | | 0.1 | % |
| | | | 100.0 | % |
(a) | The Fund may classify a company in a different category than the Salt Low truBetaTM US Market Index. |
2
Pacer American Energy Independence ETF
PERFORMANCE SUMMARY
(Unaudited)
Growth of $10,000
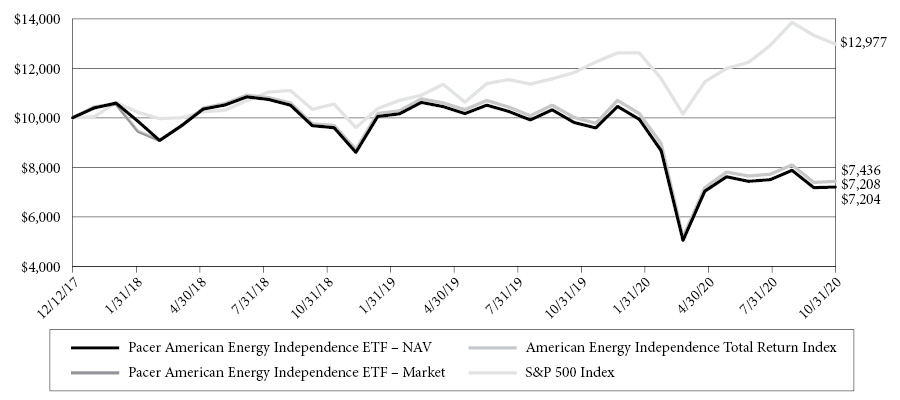
This chart illustrates the performance of a hypothetical $10,000 investment made on December 12, 2017, and is not intended to imply any future performance. The returns shown do not reflect the deduction of taxes that a shareholder would pay on fund distributions or the redemption of fund shares. The chart assumes reinvestment of capital gains and dividends.
The American Energy Independence Total Return Index uses a proprietary, rules based methodology to measure the performance of a portfolio of U.S. and Canadian exchange-listed equity securities of companies that generate a majority of their cash flow from certain qualifying “midstream” energy infrastructure activities. The companies in the Index are expected to benefit from regulatory policies favoring and industry trends toward American energy independence (i.e., a reduced or eliminated need for the United States to import fuels, such as coal, crude oil, or natural gas). Midstream energy infrastructure refers to the processing, storage, transportation, and distribution of crude oil, natural gas, refined products, and their related products as well as the transmission or storage of renewable energy. The following activity segments are considered qualifying midstream energy infrastructure activities: gathering & processing, compression, fractionation, logistics, midstream services, pipeline transportation, storage and terminaling of oil, gas, natural gas liquids, and refined products, as well as liquid natural gas facilities, renewable energy transmission and storage infrastructure. The following activity segments are not qualifying activities: refining, shipping, exploration, production, retail, distribution, coal related activities, power generation or oil services. The Index may include small-, mid-, and large-capitalization companies.
The S&P 500 Total Return Index consists of approximately 500 leading U.S.-listed companies representing approximately 8% of the U.S. equity market capitalization.
Annualized Returns(1)
(For the period ended October 31, 2020)
| | 11 Months | One Year | Since Inception(2) |
Pacer American Energy Independence ETF - NAV | -24.76% | -26.61% | -10.73% |
Pacer American Energy Independence ETF - Market | -24.90% | -26.60% | -10.75% |
American Energy Independence Total Return Index (3) | -23.95% | -25.78% | -9.76% |
S&P 500 Index (3) | 5.87% | 9.71% | 9.45% |
(1) | The performance data quoted is historical. Past performance is no guarantee of future results. Current performance may be higher or lower than the performance data quoted. The principal value and investment return of an investment will fluctuate so that investor’s shares, when redeemed, may be worth more or less than the original cost. The returns shown do not reflect the deduction of taxes that a shareholder would pay on Fund distributions or on redemptions of Fund shares. The total annual operating expenses as stated in the fee table to the Fund’s prospectus dated March 31, 2020, is 0.75%. For performance information current to the most recent month-end, please call 1-877-337-0500. |
(2) | Inception date is December 12, 2017. The Fund is the sucessor to the investment performance of the American Energy Independence ETF (the “Predecessor USAI”) as a result of the reorganization of the Predecessor USAI Fund into the Fund on December 16, 2019. Accordingly, the performance information shown in the chart and table above for periods prior to December 16, 2019 is that of the Predecessor USAI Fund’s Shares for the Fund. The Predecessor USAI Fund was advised by SL Advisors, LLC and sub-advised by Penserra Capital Management LLC and had substantially the same investment objectives, policies, and strategies as the Fund. |
(3) | Indexes are unmanaged statistical composites and their returns do not include fees an investor would pay to purchase the securities they represent. Such costs would lower performance. It is not possible to invest directly in an index. |
3
Pacer Salt High truBetaTM US Market ETF
PERFORMANCE SUMMARY
(Unaudited)
Growth of $10,000
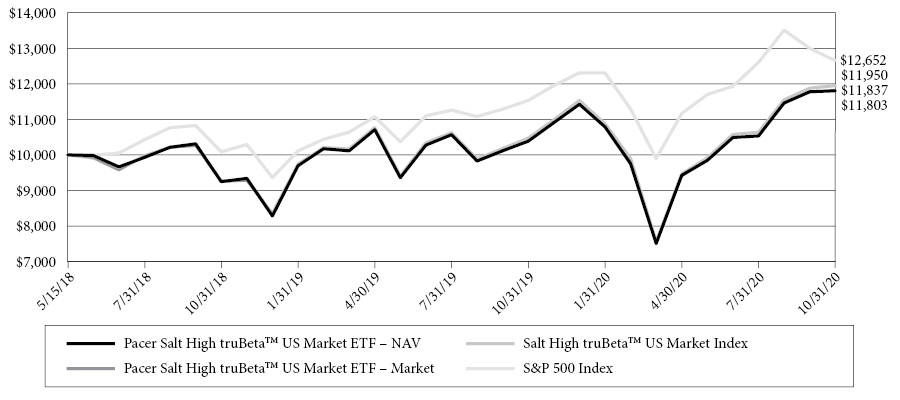
This chart illustrates the performance of a hypothetical $10,000 investment made on May 15, 2018, and is not intended to imply any future performance. The returns shown do not reflect the deduction of taxes that a shareholder would pay on fund distributions or the redemption of fund shares. The chart assumes reinvestment of capital gains and dividends.
The Salt High truBetaTM US Market Index uses an objective, rules-based methodology to measure the performance of an equal-weighted portfolio of approximately 100 large- and mid-capitalization U.S.-listed stocks with the highest forecasted systematic risk relative to the market (known as “beta”). Construction of the Index begins with the constituents of the Solactive US Large & Mid Cap Index (the “Equity Universe”), generally the 1,000 largest U.S.-listed common stocks and real estate investment trusts (“REITs”). Companies in the Equity Universe are then screened to keep only the 500 stocks with the highest average daily traded value over the past 30 days. Those 500 stocks are then analyzed using a proprietary algorithm developed by the Index Provider to calculate each stock’s truBetaTM forecast, i.e., its projected beta for the subsequent quarter, and to eliminate stocks whose performance is weakly correlated with the broader U.S. equity market (the remaining securities are referred to as the “Index Universe”).
The S&P 500 Index consists of approximately 500 leading U.S.-listed companies representing approximately 8% of the U.S. equity market capitalization.
Annualized Returns(1)
(For the period ended October 31, 2020)
| | Ten Months | One Year | Since Inception(2) |
Pacer Salt High truBetaTM US Market ETF - NAV | 3.55% | 13.91% | 7.09% |
Pacer Salt High truBetaTM US Market ETF - Market | 3.32% | 13.65% | 6.96% |
Salt High truBetaTM US Market Index (3) | 3.64% | 14.13% | 7.50% |
S&P 500® Index (3) | 2.77% | 9.71% | 10.02% |
(1) | The performance data quoted is historical. Past performance is no guarantee of future results. Current performance may be higher or lower than the performance data quoted. The principal value and investment return of an investment will fluctuate so that investor’s shares, when redeemed, may be worth more or less than the original cost. The returns shown do not reflect the deduction of taxes that a shareholder would pay on Fund distributions or on redemptions of Fund shares. The total annual operating expenses as stated in the fee table to the Fund’s prospectus dated September 27, 2020, is 0.60%. For performance information current to the most recent month-end, please call 1-877-337-0500. |
(2) | Inception date is May 15, 2018. The Fund is the successor to the investment performance of the Salt Low truBetaTM US Market ETF, as a result of the reorganization of the Salt Low truBetaTM US Market ETF into the Fund on October 5, 2020. In addition, the Salt Low truBetaTM US Market ETF was the successor to the investment performance of Salt Low truBetaTM US Market ETF, a series of Salt Funds Trust, as a result of the reorganization of the series of Salt Funds Trust into a series of ETF Series Solutions that occurred on December 16, 2019 (together, the “Predecessor SLT”). Accordingly, any performance information for periods prior to October 5, 2020 is that of the series of ETF Series Solutions; any performance for periods prior to December 16, 2019 is that of the series of Salt Funds Trust. The Predecessor SLT Fund was advised by Salt Financial LLC and sub-advised by Penserra Capital Management LLC and had substantially the same investment objectives, policies, and strategies as the Fund. |
(3) | Indexes are unmanaged statistical composites and their returns do not include fees an investor would pay to purchase the securities they represent. Such costs would lower performance. It is not possible to invest directly in an index. |
4
Pacer Salt Low truBetaTM US Market ETF
PERFORMANCE SUMMARY
(Unaudited)
Growth of $10,000

This chart illustrates the performance of a hypothetical $10,000 investment made on March 12, 2019, and is not intended to imply any future performance. The returns shown do not reflect the deduction of taxes that a shareholder would pay on fund distributions or the redemption of fund shares. The chart assumes reinvestment of capital gains and dividends.
The Salt High truBetaTM US Market Total Return Index uses a an objective, rules-based methodology to to measure the performance of an equal-weighted portfolio of approximately 100 large and mid-capitalization U.S.-listed stocks with the lowest levels of variability in their historical beta calculations (“Beta Variability”) and forecasted beta of less than 1.00. “Beta” is a calculation of an investment’s systematic risk relative to the market.
The S&P 500 Index consists of approximately 500 leading U.S.-listed companies representing approximately 8% of the U.S. equity market capitalization.
Annualized Returns(1)
(For the period ended October 31, 2020)
| | Ten Months | One Year | Since Inception(2) |
Pacer Salt Low truBetaTM US Market ETF - NAV | -5.04% | -1.27% | 6.13% |
Pacer Salt Low truBetaTM US Market ETF - Market | -5.37% | -1.59% | 5.90% |
Salt Low truBetaTM US Market Market Index(3) | -4.98% | -1.18% | 6.24% |
S&P 500® Index(3) | 2.77% | 9.71% | 12.25% |
(1) | The performance data quoted is historical. Past performance is no guarantee of future results. Current performance may be higher or lower than the performance data quoted. The principal value and investment return of an investment will fluctuate so that investor’s shares, when redeemed, may be worth more or less than the original cost. The returns shown do not reflect the deduction of taxes that a shareholder would pay on Fund distributions or on redemptions of Fund shares. The total annual operating expenses as stated in the fee table to the Fund’s prospectus dated September 27, 2020, is 0.60%. For performance information current to the most recent month-end, please call 1-877-337-0500. |
(2) | Inception date is March 12, 2019. The Fund is the successor to the Salt Low truBetaTM US Market ETF, a series of ETF Series Solutions, as a result of the reorganization of the Salt Low truBetaTM US Market ETF into the Fund on October 2, 2020. In addition, the Salt Low truBetaTM US Market ETF was the successor to the investment performance of Salt Low truBetaTM US Market ETF, a series of Salt Funds Trust, as a result of the reorganization of the series of Salt Funds Trust into a series of ETF Series Solutions that occurred on December 16, 2019 (together, the “Predecessor LSLT”). The Predecessor LSLT Fund commenced operations on March 12, 2019. Accordingly, any performance information for periods prior to October 2, 2020 is that of the series of ETF Series Solutions; any performance for periods prior to December 16, 2019 is that of the series of Salt Funds Trust. The Predecessor SLT Fund was advised by Salt Financial LLC and sub-advised by Penserra Capital Management LLC and had substantially the same investment objectives, policies, and strategies as the Fund. |
(3) | Indexes are unmanaged statistical composites and their returns do not include fees an investor would pay to purchase the securities they represent. Such costs would lower performance. It is not possible to invest directly in an index. |
5
Pacer Funds
EXPENSE EXAMPLE
For the Six-Months Ended October 31, 2020 (Unaudited)
As a shareholder of a Fund, you pay ongoing expenses, such as advisory fees, and other fund expenses. The following examples are intended to help you understand the ongoing cost (in dollars) of investing in a Fund and to compare these costs with the ongoing costs of investing in other funds. Please note, the expenses shown in the tables are meant to highlight ongoing costs only and do not reflect any transactional costs. You may pay brokerage commissions on your purchase and sale of Fund shares, which are not reflected in the following examples. Each example is based on an investment of $1,000 invested at the beginning of the period and held for the entire period as indicated below.
Actual Expenses
The columns under the heading entitled “Actual” help you estimate the actual expenses you paid over the period. The “Actual Ending Account Value” shown is derived from a Fund’s actual return and the “Actual Expenses Paid During Period” show the dollar amount that would have been paid by an investor who started with $1,000 in the Fund. To estimate the expenses you paid on your account during this period, simply divide your account value by $1,000 (for example, an $8,600 account value divided by $1,000=8.6), then multiply the result by the number in the column under the heading untitled “Actual Expenses Paid During Period”.
Hypothetical Example for Comparison Purposes
The columns under the heading entitled “Hypothetical” provide information about hypothetical account value and hypothetical expenses based on a Fund’s actual expense ratio and an assumed rate of return of 5% per year before expenses, which is not the Fund’s return. The hypothetical account value and expenses may not be used to estimate the actual ending account balance or expenses you paid for the period. You may use this information to compare the ongoing costs of investing in a Fund and other funds. To do so, compare this 5% hypothetical example with the 5% hypothetical examples that appear in the shareholder reports of other funds.
Please note that the expenses shown in the table are meant to highlight your ongoing costs only and do not reflect any transactional costs which may be applicable to your account. Therefore, the last column of the table (Hypothetical Expenses Paid During Period) is useful in comparing ongoing costs only and will not help you determine the relative total costs of owning different funds. In addition, if these transactional costs were included, your costs would have been higher.
| | Fund’s Annual
Expense Ratio | Beginning
Account Value
05/01/20 | Ending
Account Value
10/31/20 | Expenses Paid
During Period(a) |
Pacer American Energy Independence ETF | | | | |
Actual | 0.75% | $ 1,000.00 | $ 1,029.40 | $ 3.83 |
Hypothetical(b) | 0.75% | $ 1,000.00 | $ 1,021.37 | $ 3.81 |
Pacer Salt High truBetaTM US Market ETF | | | | |
Actual | 0.33% | $ 1,000.00 | $ 1,259.90 | $ 1.87 |
Hypothetical(b) | 0.33% | $ 1,000.00 | $ 1,023.48 | $ 1.68 |
Pacer Salt Low truBetaTM US Market ETF | | | | |
Actual | 0.34% | $ 1,000.00 | $ 1,069.60 | $ 1.77 |
Hypothetical(b) | 0.34% | $ 1,000.00 | $ 1,023.43 | $ 1.73 |
(a) | The dollar amounts shown as expenses paid during the period are equal to the annualized six-month expense ratio multiplied by the average account value during the period, multiplied by the number of days (184) in the most recent six-month period and divided by the number of days in the most recent twelve-month period (366). |
(b) | Assumes 5% return before expenses. |
6
Pacer American Energy Independence ETF
SCHEDULES OF INVESTMENTS
October 31, 2020
| | | Shares | | | Value | |
COMMON STOCKS — 73.5% | | | | |
| | | | | | | | | |
Energy — 25.8% (a) | | | | |
Enbridge, Inc. | | | 29,448 | | | $ | 811,406 | |
Gibson Energy, Inc. | | | 22,992 | | | | 338,590 | |
Keyera Corp. | | | 28,539 | | | | 405,068 | |
Pembina Pipeline Corp. | | | 36,306 | | | | 760,020 | |
TC Energy Corp. | | | 19,534 | | | | 768,868 | |
| | | | | | | | 3,083,952 | |
Mining, Quarrying, and Oil and Gas Extraction — 5.4% |
Archrock, Inc. | | | 56,758 | | | | 336,575 | |
Hess Midstream LP - Class A | | | 18,368 | | | | 313,725 | |
| | | | | | | | 650,300 | |
Pipelines — 42.3% (a) | | | | |
Antero Midstream Corp. | | | 67,017 | | | | 384,007 | |
Cheniere Energy, Inc. (b) | | | 10,454 | | | | 500,433 | |
Equitrans Midstream Corp. | | | 50,950 | | | | 369,897 | |
Inter Pipeline Ltd. | | | 47,850 | | | | 425,956 | |
Kinder Morgan, Inc. | | | 69,713 | | | | 829,585 | |
New Fortress Energy, Inc. | | | 8,420 | | | | 304,215 | |
ONEOK, Inc. | | | 20,515 | | | | 594,935 | |
Plains GP Holdings LP - Class A | | | 52,938 | | | | 338,274 | |
Targa Resources Corp. | | | 30,238 | | | | 485,320 | |
Williams Cos., Inc. | | | 43,178 | | | | 828,586 | |
| | | | | | | | 5,061,208 | |
TOTAL COMMON STOCKS (Cost $10,407,295 | | | | | | | 8,795,460 | |
| | | | | |
MASTER LIMITED PARTNERSHIPS AND RELATED COMPANIES — 25.3% |
| | | | | | | | | |
Gas — 0.7% | | | | |
Western Midstream Partners LP | | | 10,072 | | | | 82,086 | |
| | | | | | | | | |
Pipelines — 24.6% | | | | |
Crestwood Equity Partners LP | | | 3,004 | | | | 45,000 | |
Energy Transfer LP | | | 89,407 | | | | 460,446 | |
EnLink Midstream LLC | | | 124,918 | | | | 338,528 | |
Enterprise Products Partners LP | | | 55,775 | | | | 924,192 | |
Genesis Energy LP | | | 7,173 | | | | 30,126 | |
Holly Energy Partners LP | | | 2,765 | | | | 31,687 | |
Magellan Midstream Partners LP | | | 10,013 | | | | 355,862 | |
MPLX LP | | | 16,200 | | | | 278,802 | |
Noble Midstream Partners LP | | | 2,939 | | | | 23,424 | |
NuStar Energy LP | | | 5,208 | | | | 51,507 | |
PBF Logistics LP | | | 2,310 | | | | 16,955 | |
| | | Shares | | | Value | |
Pipelines — 24.6% (Continued) | | | | |
Phillips 66 Partners LP | | | 3,050 | | | $ | 71,583 | |
Rattler Midstream LP | | | 43,900 | | | | 257,693 | |
Shell Midstream Partners LP | | | 6,445 | | | | 56,394 | |
| | | | | | | | 2,942,199 | |
TOTAL MASTER LIMITED PARTNERSHIPS AND RELATED COMPANIES (Cost $3,788,825) | | | | | | | 3,024,285 | |
| | | | | |
| | | Principal
Amount | | | | | |
SHORT-TERM INVESTMENTS — 0.6% | | | | |
| | | | | | | | | |
Money Market Deposit Accounts, — 0.6% | | | | |
U.S. Bank Money Market Deposit Account, 0.025% (c) | | $ | 71,062 | | | | 71,062 | |
TOTAL SHORT-TERM INVESTMENTS (Cost $71,062) | | | | | | | 71,062 | |
| | | | | |
Total Investments (Cost $14,267,182) — 99.4% | | | | | | | 11,890,807 | |
Other Assets in Excess of Liabilities — 0.6% | | | | | | | 75,235 | |
TOTAL NET ASSETS — 100.0% | | | | | | $ | 11,966,042 | |
| | (a) | To the extent that the Fund invests more heavily in particular industry groups of the economy, its performance will be especially sensitive to developments that significantly affect those industry groups or strategies. |
| | (b) | Non-income producing security. |
| | (c) | The rate shown is as of October 31, 2020. |
For Fund compliance purposes, the Fund’s industry classifications refer to any one or more of the industry sub-classifications used by one or more widely recognized market indexes or ratings group indexes, and/or they may be defined by Fund management. This definition does not apply for all purposes of this report, which may combine sub-classifications for reporting ease. Categories are shown as a percentage of net assets.
The accompanying notes are an integral part of the financial statements.
7
Pacer Salt High truBetaTM US Market ETF
SCHEDULES OF INVESTMENTS
October 31, 2020
| | | Shares | | | Value | |
COMMON STOCKS — 95.9% | | | | |
| | | | | | | | | |
Agriculture — 1.2% | | | | |
Darling Ingredients, Inc. (a) | | | 2,167 | | | $ | 93,181 | |
| | | | | | | | | |
Auto Manufacturers — 1.0% | | | | |
Tesla Motors, Inc. (a) | | | 209 | | | | 81,100 | |
| | | | | | | | | |
Banks — 2.7% | | | | |
Goldman Sachs Group, Inc. | | | 374 | | | | 70,701 | |
Morgan Stanley | | | 2,999 | | | | 144,402 | |
| | | | | | | | 215,103 | |
Biotechnology — 1.3% | | | | |
Amicus Therapeutics, Inc. (a) | | | 5,830 | | | | 103,949 | |
| | | | | | | | | |
Commercial Services — 6.0% | | | | |
Chegg, Inc. (a) | | | 1,144 | | | | 84,016 | |
Global Payments, Inc. | | | 462 | | | | 72,876 | |
PayPal Holdings, Inc. (a) | | | 418 | | | | 77,802 | |
Quanta Services, Inc. | | | 1,463 | | | | 91,335 | |
Square, Inc. - Class A (a) | | | 550 | | | | 85,184 | |
TransUnion | | | 891 | | | | 70,977 | |
| | | | | | | | 482,190 | |
Computers — 3.7% | | | | |
Apple, Inc. | | | 671 | | | | 73,045 | |
Crowdstrike Holdings, Inc. - Class A (a) | | | 594 | | | | 73,561 | |
DXC Technology Co. | | | 3,839 | | | | 70,715 | |
Zscaler, Inc. (a) | | | 583 | | | | 79,142 | |
| | | | | | | | 296,463 | |
Distribution/Wholesale — 0.9% | | | | |
LKQ Corp. (a) | | | 2,343 | | | | 74,953 | |
| | | | | | | | | |
Diversified Financial Services — 2.7% | | | | |
Jefferies Financial Group, Inc. | | | 4,334 | | | | 84,556 | |
MasterCard, Inc. - Class A | | | 220 | | | | 63,501 | |
Visa, Inc. - Class A | | | 385 | | | | 69,958 | |
| | | | | | | | 218,015 | |
Energy-Alternate Sources — 2.6% | | | | |
Enphase Energy, Inc. (a) | | | 1,155 | | | | 113,294 | |
First Solar, Inc. (a) | | | 1,067 | | | | 92,877 | |
| | | | | | | | 206,171 | |
Engineering & Construction — 0.9% | | | | |
KBR, Inc. | | | 3,058 | | | | 68,163 | |
| | | | | | | | | |
Food — 1.0% | | | | |
Beyond Meat, Inc. (a) | | | 561 | | | | 79,903 | |
| | | | | | | | | |
| | | Shares | | | Value | |
Healthcare-Services — 2.0% | | | | |
Catalent, Inc. (a) | | | 913 | | | $ | 80,134 | |
Teladoc Health, Inc. (a) | | | 396 | | | | 77,798 | |
| | | | | | | | 157,932 | |
Home Builders — 3.5% | | | | |
DR Horton, Inc. | | | 1,056 | | | | 70,552 | |
Lennar Corp. - Class A | | | 968 | | | | 67,983 | |
PulteGroup, Inc. | | | 1,661 | | | | 67,702 | |
Toll Brothers, Inc. | | | 1,683 | | | | 71,157 | |
| | | | | | | | 277,394 | |
Insurance — 3.6% | | | | |
Athene Holding Ltd. - Class A (a) | | | 2,090 | | | | 67,047 | |
Equitable Holdings, Inc. | | | 3,817 | | | | 82,028 | |
Principal Financial Group, Inc. | | | 1,815 | | | | 71,184 | |
Prudential Financial, Inc. | | | 1,111 | | | | 71,126 | |
| | | | | | | | 291,385 | |
Internet — 18.9% | | | | |
Alphabet, Inc. - Class A (a) | | | 44 | | | | 71,109 | |
Alphabet, Inc. - Class C (a) | | | 55 | | | | 89,155 | |
Amazon.com, Inc. (a) | | | 22 | | | | 66,795 | |
Chewy, Inc. - Class A (a) | | | 1,397 | | | | 86,055 | |
eBay, Inc. | | | 1,441 | | | | 68,635 | |
Etsy, Inc. (a) | | | 682 | | | | 82,924 | |
Expedia Group, Inc. | | | 792 | | | | 74,567 | |
Facebook, Inc. - Class A (a) | | | 286 | | | | 75,249 | |
IAC/InterActiveCorp (a) | | | 616 | | | | 74,363 | |
Netflix, Inc. (a) | | | 154 | | | | 73,264 | |
Okta, Inc. (a) | | | 385 | | | | 80,785 | |
Pinterest, Inc. - Class A (a) | | | 2,200 | | | | 129,690 | |
Roku, Inc. (a) | | | 484 | | | | 97,962 | |
Snap, Inc. - Class A (a) | | | 3,113 | | | | 122,621 | |
Twitter, Inc. (a) | | | 1,925 | | | | 79,618 | |
Wayfair, Inc. - Class A (a) | | | 297 | | | | 73,665 | |
Zendesk, Inc. (a) | | | 803 | | | | 89,085 | |
Zillow Group, Inc. - Class C (a) | | | 880 | | | | 77,986 | |
| | | | | | | | 1,513,528 | |
Leisure Time — 2.1% | | | | |
Harley-Davidson, Inc. | | | 2,706 | | | | 88,973 | |
Planet Fitness, Inc. - Class A (a) | | | 1,331 | | | | 78,889 | |
| | | | | | | | 167,862 | |
Lodging — 2.5% | | | | |
Marriott International, Inc. - Class A | | | 748 | | | | 69,474 | |
MGM Resorts International | | | 3,300 | | | | 67,881 | |
Wynn Resorts Ltd. | | | 913 | | | | 66,129 | |
| | | | | | | | 203,484 | |
Media — 0.7% | | | | |
DISH Network Corp. - Class A (a) | | | 2,343 | | | | 59,723 | |
| | | | | | | | | |
The accompanying notes are an integral part of the financial statements.
8
Pacer Salt High truBetaTM US Market ETF
SCHEDULES OF INVESTMENTS
October 31, 2020 (Continued)
| | | Shares | | | Value | |
COMMON STOCKS — 95.9% (Continued) | | | | |
| | | | | | | | | |
Mining — 1.0% | | | | |
Freeport-McMoRan, Inc. | | | 4,609 | | | $ | 79,920 | |
| | | | | | | | | |
Oil & Gas Services — 0.8% | | | | |
Halliburton Co. | | | 5,258 | | | | 63,411 | |
| | | | | | | | | |
Pharmaceuticals — 1.0% | | | | |
Horizon Therapeutics PLC (a) | | | 1,056 | | | | 79,126 | |
| | | | | | | | | |
Private Equity — 2.6% | | | | |
Apollo Global Management, Inc. | | | 1,683 | | | | 62,035 | |
The Blackstone Group Inc. - Class A | | | 1,463 | | | | 73,765 | |
KKR & Co, Inc. | | | 2,178 | | | | 74,379 | |
| | | | | | | | 210,179 | |
Real Estate — 1.0% | | | | |
CBRE Group, Inc. - Class A (a) | | | 1,606 | | | | 80,942 | |
| | | | | |
Retail — 6.8% | | | | |
Best Buy Co., Inc. | | | 704 | | | | 78,531 | |
Carvana Co. (a) | | | 440 | | | | 81,554 | |
Darden Restaurants, Inc. | | | 858 | | | | 78,868 | |
Floor & Decor Holdings, Inc. - Class A (a) | | | 1,056 | | | | 77,088 | |
Lowe’s Cos., Inc. | | | 462 | | | | 73,042 | |
The Wendy’s Co. | | | 3,498 | | | | 76,431 | |
Williams-Sonoma, Inc. | | | 825 | | | | 75,248 | |
| | | | | | | | 540,762 | |
Semiconductors — 6.1% | | | | |
Advanced Micro Devices, Inc. (a) | | | 979 | | | | 73,709 | |
CREE, Inc. (a) | | | 1,254 | | | | 79,754 | |
KLA Corp. | | | 440 | | | | 86,759 | |
Lam Research Corp. | | | 253 | | | | 86,546 | |
NVIDIA Corp. | | | 154 | | | | 77,210 | |
Teradyne, Inc. | | | 1,001 | | | | 87,938 | |
| | | | | | | | 491,916 | |
Software — 18.3% | | | | |
Adobe Systems, Inc. (a) | | | 154 | | | | 68,853 | |
Alteryx, Inc. - Class A (a) | | | 704 | | | | 88,246 | |
Autodesk, Inc. (a) | | | 330 | | | | 77,728 | |
Ceridian HCM Holding, Inc. (a) | | | 1,023 | | | | 88,203 | |
Cloudflare, Inc. - Class A (a) | | | 2,200 | | | | 114,334 | |
Coupa Software, Inc. (a) | | | 308 | | | | 82,452 | |
DocuSign, Inc. (a) | | | 374 | | | | 75,642 | |
Dynatrace, Inc. (a) | | | 1,914 | | | | 67,583 | |
Microsoft Corp. | | | 363 | | | | 73,497 | |
Nutanix, Inc. - Class A (a) | | | 3,135 | | | | 76,306 | |
Salesforce.com, Inc. (a) | | | 308 | | | | 71,539 | |
ServiceNow, Inc. (a) | | | 165 | | | | 82,099 | |
| | | Shares | | | Value | |
Software — 18.3% (Continued) | | | | |
Slack Technologies, Inc. - Class A (a) | | | 2,926 | | | $ | 74,847 | |
Smartsheet, Inc. - Class A (a) | | | 1,617 | | | | 80,607 | |
Twilio, Inc. - Class A (a) | | | 330 | | | | 92,060 | |
Workday, Inc. - Class A (a) | | | 363 | | | | 76,274 | |
Zoom Video Communications, Inc. - Class A (a) | | | 198 | | | | 91,260 | |
Zynga, Inc. - Class A (a) | | | 9,031 | | | | 81,189 | |
| | | | | | | | 1,462,719 | |
Transportation — 1.0% | | | | |
FedEx Corp. | | | 319 | | | | 82,771 | |
TOTAL COMMON STOCKS (Cost $7,166,070) | | | | | | | 7,682,245 | |
| | | | | |
REAL ESTATE INVESTMENT TRUSTS — 1.8% | | | | |
| | | | | | | | | |
VICI Properties, Inc. | | | 3,113 | | | | 71,443 | |
Weyerhaeuser Co. | | | 2,651 | | | | 72,346 | |
TOTAL REAL ESTATE INVESTMENT TRUSTS (Cost $134,249) | | | | | | | 143,789 | |
| | | | | | | | | |
| | | Principal
Amount | | | | | |
SHORT-TERM INVESTMENTS — 2.3% | | | | |
| | | | | | | | | |
Money Market Deposit Accounts, — 2.3% | | | | |
U.S. Bank Money Market Deposit Account, 0.025% (c) | | $ | 181,658 | | | | 181,658 | |
TOTAL SHORT-TERM INVESTMENTS (Cost $181,658) | | | | | | | 181,658 | |
| | | | | |
Total Investments (Cost $7,481,977) — 100.0% | | | | | | | 8,007,692 | |
Liabilities in Excess of Other Assets — 0.0% (b) | | | | | | | (1,629 | ) |
TOTAL NET ASSETS — 100.0% | | | | | | $ | 8,006,063 | |
| | (a) | Non-income producing security. |
| | (c) | The rate shown is as of October 31, 2020. |
For Fund compliance purposes, the Fund’s industry classifications refer to any one or more of the industry sub-classifications used by one or more widely recognized market indexes or ratings group indexes, and/or they may be defined by Fund management. This definition does not apply for all purposes of this report, which may combine sub-classifications for reporting ease. Categories are shown as a percentage of net assets.
The accompanying notes are an integral part of the financial statements.
9
Pacer Salt Low truBetaTM US Market ETF
SCHEDULES OF INVESTMENTS
October 31, 2020
| | | Shares | | | Value | |
COMMON STOCKS — 90.6% | | | | |
| | | | | | | | | |
Aerospace/Defense — 0.9% | | | | |
General Dynamics Corp. | | | 564 | | | $ | 74,070 | |
| | | | | | | | | |
Agriculture — 2.7% | | | | |
Altria Group, Inc. | | | 1,848 | | | | 66,676 | |
Archer-Daniels-Midland Co. | | | 1,740 | | | | 80,457 | |
Philip Morris International, Inc. | | | 984 | | | | 69,884 | |
| | | | | | | | 217,017 | |
Apparel — 1.0% | | | | |
NIKE, Inc. - Class B | | | 684 | | | | 82,135 | |
| | | | | | | | | |
Auto Parts & Equipment — 1.1% | | | | |
Gentex Corp. | | | 3,060 | | | | 84,670 | |
| | | | | | | | | |
Beverages — 4.8% | | | | |
Brown-Forman Corp. - Class B | | | 1,032 | | | | 71,941 | |
Coca-Cola Co. | | | 1,596 | | | | 76,704 | |
Keurig Dr Pepper, Inc. | | | 2,796 | | | | 75,212 | |
Molson Coors Brewing Co. - Class B | | | 2,328 | | | | 82,085 | |
PepsiCo, Inc. | | | 588 | | | | 78,375 | |
| | | | | | | | 384,317 | |
Biotechnology — 0.9% | | | | |
Amgen, Inc. | | | 324 | | | | 70,289 | |
| | | | | | | | | |
Chemicals — 1.8% | | | | |
Air Products & Chemicals, Inc. | | | 264 | | | | 72,927 | |
Ecolab, Inc. | | | 396 | | | | 72,702 | |
| | | | | | | | 145,629 | |
Commercial Services — 2.2% | | | | |
Rollins, Inc. | | | 1,512 | | | | 87,469 | |
Service Corp. International | | | 1,896 | | | | 87,804 | |
| | | | | | | | 175,273 | |
Cosmetics/Personal Care — 3.1% | | | | |
Colgate-Palmolive Co. | | | 1,044 | | | | 82,361 | |
Estee Lauder Cos., Inc. - Class A | | | 384 | | | | 84,349 | |
Procter & Gamble Co. | | | 576 | | | | 78,970 | |
| | | | | | | | 245,680 | |
Distribution/Wholesale — 1.1% | | | | |
Copart, Inc. (a) | | | 804 | | | | 88,729 | |
| | | | | | | | | |
Diversified Financial Services — 2.8% | | | | |
CME Group, Inc. | | | 504 | | | | 75,963 | |
Intercontinental Exchange, Inc. | | | 816 | | | | 77,030 | |
Western Union Co. | | | 3,672 | | | | 71,384 | |
| | | | | | | | 224,377 | |
| | | Shares | | | Value | |
Electric — 19.6% | | | | |
Alliant Energy Corp. | | | 1,560 | | | $ | 86,237 | |
Ameren Corp. | | | 1,056 | | | | 85,663 | |
American Electric Power Co., Inc. | | | 1,032 | | | | 92,808 | |
CMS Energy Corp. | | | 1,332 | | | | 84,355 | |
Consolidated Edison, Inc. | | | 1,104 | | | | 86,653 | |
Dominion Energy, Inc. | | | 1,008 | | | | 80,983 | |
Duke Energy Corp. | | | 984 | | | | 90,636 | |
Edison International | | | 1,608 | | | | 90,112 | |
Evergy, Inc. | | | 1,536 | | | | 84,787 | |
Eversource Energy | | | 996 | | | | 86,921 | |
Exelon Corp. | | | 2,232 | | | | 89,034 | |
FirstEnergy Corp. | | | 2,712 | | | | 80,601 | |
Pinnacle West Capital Corp. | | | 1,152 | | | | 93,969 | |
PPL Corp. | | | 2,940 | | | | 80,850 | |
Public Service Enterprise Group, Inc. | | | 1,548 | | | | 90,016 | |
Southern Co. | | | 1,572 | | | | 90,311 | |
WEC Energy Group, Inc. | | | 852 | | | | 85,669 | |
Xcel Energy, Inc. | | | 1,164 | | | | 81,515 | |
| | | | | | | | 1,561,120 | |
Environmental Control — 1.9% | | | | |
Republic Services, Inc. | | | 828 | | | | 73,005 | |
Waste Management, Inc. | | | 720 | | | | 77,695 | |
| | | | | | | | 150,700 | |
Food — 7.9% | | | | |
Campbell Soup Co. | | | 1,788 | | | | 83,446 | |
ConAgra Foods, Inc. | | | 2,340 | | | | 82,111 | |
General Mills, Inc. | | | 1,380 | | | | 81,586 | |
Hershey Co. | | | 552 | | | | 75,878 | |
Hormel Foods Corp. | | | 1,632 | | | | 79,462 | |
Kellogg Co. | | | 1,224 | | | | 76,977 | |
Kroger Co. | | | 2,340 | | | | 75,371 | |
Mondelez International, Inc. - Class A | | | 1,416 | | | | 75,218 | |
| | | | | | | | 630,049 | |
Healthcare-Products — 5.1% | | | | |
Baxter International, Inc. | | | 960 | | | | 74,467 | |
Danaher Corp. | | | 396 | | | | 90,898 | |
Edwards Lifesciences Corp. (a) | | | 972 | | | | 69,683 | |
Medtronic PLC | | | 780 | | | | 78,444 | |
ResMed, Inc. | | | 468 | | | | 89,828 | |
| | | | | | | | 403,320 | |
Healthcare-Services — 1.0% | | | | |
UnitedHealth Group, Inc. | | | 264 | | | | 80,557 | |
| | | | | | | | | |
Household Products/Wares — 2.8% | | | | |
Church & Dwight Co., Inc. | | | 852 | | | | 75,308 | |
Clorox Co. | | | 372 | | | | 77,097 | |
Kimberly-Clark Corp. | | | 540 | | | | 71,599 | |
| | | | | | | | 224,004 | |
The accompanying notes are an integral part of the financial statements.
10
Pacer Salt Low truBetaTM US Market ETF
SCHEDULES OF INVESTMENTS
October 31, 2020 (Continued)
| | | Shares | | | Value | |
COMMON STOCKS — 90.6% (Continued) | | | | |
| | | | | | | | | |
Insurance — 3.9% | | | | |
Allstate Corp. | | | 864 | | | $ | 76,680 | |
Brown & Brown, Inc. | | | 1,800 | | | | 78,318 | |
Marsh & McLennan Cos., Inc. | | | 708 | | | | 73,250 | |
Progressive Corp. | | | 864 | | | | 79,401 | |
| | | | | | | | 307,649 | |
Media — 1.9% | | | | |
Comcast Corp. - Class A | | | 1,824 | | | | 77,046 | |
The New York Times Co. - Class A | | | 1,872 | | | | 74,243 | |
| | | | | | | | 151,289 | |
Pharmaceuticals — 7.7% | | | | |
Alkermes PLC (a) | | | 4,668 | | | | 75,855 | |
Bristol-Myers Squibb Co. | | | 1,380 | | | | 80,661 | |
CVS Health Corp. | | | 1,428 | | | | 80,097 | |
Eli Lilly & Co. | | | 540 | | | | 70,448 | |
Johnson & Johnson | | | 540 | | | | 74,039 | |
Merck & Co., Inc. | | | 960 | | | | 72,202 | |
Pfizer, Inc. | | | 2,232 | | | | 79,191 | |
Zoetis, Inc. | | | 516 | | | | 81,812 | |
| | | | | | | | 614,305 | |
Retail — 4.1% | | | | |
Costco Wholesale Corp. | | | 240 | | | | 85,829 | |
Dollar General Corp. | | | 396 | | | | 82,649 | |
McDonald’s Corp. | | | 360 | | | | 76,680 | |
Yum! Brands, Inc. | | | 876 | | | | 81,757 | |
| | | | | | | | 326,915 | |
Software — 4.7% | | | | |
Akamai Technologies, Inc. (a) | | | 768 | | | | 73,052 | |
Black Knight, Inc. (a) | | | 996 | | | | 87,598 | |
Citrix Systems, Inc. | | | 600 | | | | 67,962 | |
Fidelity National Information Services, Inc. | | | 564 | | | | 70,269 | |
Oracle Corp. | | | 1,404 | | | | 78,779 | |
| | | | | | | | 377,660 | |
Telecommunications — 4.9% | | | | |
AT&T, Inc. | | | 2,772 | | | | 74,899 | |
Cisco Systems, Inc. | | | 2,004 | | | | 71,944 | |
Motorola Solutions, Inc. | | | 528 | | | | 83,456 | |
T-Mobile US, Inc. (a) | | | 733 | | | | 80,315 | |
Verizon Communications, Inc. | | | 1,356 | | | | 77,278 | |
| | | | | | | | 387,892 | |
Transportation — 2.7% | | | | |
Expeditors International of Washington, Inc. | | | 876 | | | | 77,412 | |
Knight-Swift Transportation Holdings, Inc. | | | 1,788 | | | | 67,926 | |
Union Pacific Corp. | | | 408 | | | | 72,294 | |
| | | | | | | | 217,632 | |
TOTAL COMMON STOCKS (Cost $7,035,082) | | | | | | | 7,225,278 | |
| | | | | |
| | | Shares | | | Value | |
REAL ESTATE INVESTMENT TRUSTS — 9.0% | | | | |
AGNC Investment Corp. | | | 5,736 | | | $ | 80,132 | |
American Campus Communities, Inc. | | | 2,352 | | | | 88,106 | |
American Homes 4 Rent - Class A | | | 2,808 | | | | 79,382 | |
Crown Castle International Corp. | | | 516 | | | | 80,599 | |
CubeSmart | | | 2,520 | | | | 85,504 | |
Digital Realty Trust, Inc. | | | 552 | | | | 79,654 | |
Duke Realty Corp. | | | 2,172 | | | | 82,514 | |
Equity Residential | | | 1,488 | | | | 69,906 | |
Lexington Realty Trust | | | 7,344 | | | | 72,926 | |
TOTAL REAL ESTATE INVESTMENT TRUSTS (Cost $706,040) | | | | | | | 718,723 | |
| | | | | | | | | |
| | | Principal
Amount | | | | | |
SHORT-TERM INVESTMENTS — 0.3% | | | | |
| | | | | | | | | |
Money Market Deposit Accounts, — 0.3% | | | | |
U.S. Bank Money Market Deposit Account, 0.025% (b) | | $ | 24,042 | | | | 24,042 | |
TOTAL SHORT-TERM INVESTMENTS (Cost $24,042) | | | | | | | 24,042 | |
| | | | | |
Total Investments (Cost $7,765,164 — 99.9% | | | | | | | 7,968,043 | |
Other Assets in Excess of Liabilities — 0.1% | | | | | | | 8,050 | |
TOTAL NET ASSETS — 100.0% | | | | | | $ | 7,976,093 | |
| | (a) | Non-income producing security. |
| | (b) | The rate shown is as of October 31, 2020. |
For Fund compliance purposes, the Fund’s industry classifications refer to any one or more of the industry sub-classifications used by one or more widely recognized market indexes or ratings group indexes, and/or they may be defined by Fund management. This definition does not apply for all purposes of this report, which may combine sub-classifications for reporting ease. Categories are shown as a percentage of net assets.
The accompanying notes are an integral part of the financial statements.
11
Pacer Funds
Statements of Assets & Liabilities
October 31, 2020
| | | Pacer
American Energy
Independence
ETF | | | Pacer
Salt High
truBetaTM US
Market ETF | | | Pacer
Salt Low
truBetaTM US
Market ETF | |
ASSETS | | | | | | | | | | | | |
Investments in Securities, at Value* | | $ | 11,890,807 | | | $ | 8,007,692 | | | $ | 7,968,043 | |
Foreign Currency at Value* | | | 834 | | | | — | | | | — | |
Interest and Dividends Receivable | | | 134,097 | | | | 2,110 | | | | 11,734 | |
Total Assets | | | 12,025,738 | | | | 8,009,802 | | | | 7,979,777 | |
| | | | | | | | | | | | | |
LIABILITIES | | | | | | | | | | | | |
Management Fees Payable | | | 7,946 | | | | 3,739 | | | | 3,684 | |
Payable for Distributions to Shareholders | | | 51,750 | | | | — | | | | — | |
Total Liabilities | | | 59,696 | | | | 3,739 | | | | 3,684 | |
| | | | | | | | | | | | | |
NET ASSETS | | $ | 11,966,042 | | | $ | 8,006,063 | | | $ | 7,976,093 | |
| | | | | | | | | | | | | |
NET ASSETS CONSIST OF: | | | | | | | | | | | | |
Paid-in Capital | | $ | 17,623,677 | | | $ | 11,052,238 | | | $ | 8,596,892 | |
Total Distributable Earnings (Accumulated Deficit) | | | (5,657,635 | ) | | | (3,046,175 | ) | | | (620,799 | ) |
Net Assets | | $ | 11,966,042 | | | $ | 8,006,063 | | | $ | 7,976,093 | |
* Identified Cost: | | | | | | | | | | | | |
Investments in Securities | | $ | 14,267,182 | | | $ | 7,481,977 | | | $ | 7,765,164 | |
Foreign Currencies | | | 861 | | | | — | | | | — | |
| | | | | | | | | | | | | |
Net Asset Value: | | | | | | | | | | | | |
Net Assets | | $ | 11,966,042 | | | $ | 8,006,063 | | | $ | 7,976,093 | |
Shares Outstanding (No Par Value) | | | 800,000 | | | | 275,000 | | | | 300,000 | |
Net Asset Value, Offering and Redemption Price per Share | | $ | 14.96 | | | $ | 29.11 | | | $ | 26.59 | |
The accompanying notes are an integral part of the financial statements.
12
Pacer Funds
STATEMENTS OF OPERATIONS
For the Period Ended October 31, 2020
| | Pacer American Energy
Independence ETF (a) | | | Pacer Salt High truBetaTM
US Market ETF (c) | | | Pacer Salt Low truBetaTM
US Market ETF (e) | |
| | | For the
Period Ended
October 31,
2020 (b) | | | For the
Year Ended
November 30,
2019 | | | For the
Period Ended
October 31,
2020 (d) | | | For the
Year Ended
December 31,
2019 | | | For the
Period Ended
October 31,
2020 (d) | | | For the
Period Ended
December 31,
2019 (f) | |
INVESTMENT INCOME | | | | | | | | | | | | | | | | | | | | | | | | |
Income: | | | | | | | | | | | | | | | | | | | | | | | | |
Dividends* | | $ | 270,348 | | | $ | 266,863 | | | $ | 198,704 | | | $ | 190,020 | | | $ | 194,407 | | | $ | 135,270 | |
Interest | | | 433 | | | | 1,119 | | | | 223 | | | | 950 | | | | 174 | | | | 410 | |
Adviser contributions | | | — | | | | — | | | | — | | | | — | | | | — | | | | 2,167 | |
Total Investment Income | | | 270,781 | | | | 267,982 | | | | 198,927 | | | | 190,970 | | | | 194,581 | | | | 137,847 | |
| | | | | | | | | | | | | | | | | | | | | | | | | |
EXPENSES | | | | | | | | | | | | | | | | | | | | | | | | |
Management fees | | | 79,334 | | | | 86,164 | | | | 29,438 | | | | 35,882 | | | | 24,204 | | | | 14,101 | |
Total Expenses | | | 79,334 | | | | 86,164 | | | | 29,438 | | | | 35,882 | | | | 24,204 | | | | 14,101 | |
Less: fees waived | | | — | | | | — | | | | — | | | | — | | | | (13,970 | ) | | | (12,572 | ) |
Net Expenses | | | 79,334 | | | | 86,164 | | | | 29,438 | | | | 35,882 | | | | 10,234 | | | | 1,529 | |
Net Investment Income | | | 191,447 | | | | 181,818 | | | | 169,489 | | | | 155,088 | | | | 184,347 | | | | 136,318 | |
| | | | | | | | | | | | | | | | | | | | | | | | | |
REALIZED & UNREALIZED GAIN (LOSS) ON INVESTMENTS | | | | | | | | | | | | | | | | | | | | | | | | |
Net Realized Gain (Loss) on(g): | | | | | | | | | | | | | | | | | | | | | | | | |
Net Realized Gain (Loss) on Investments | | | (3,105,529 | ) | | | (378,745 | ) | | | (3,226,845 | ) | | | 156,397 | | | | (851,123 | ) | | | 21,452 | |
Net Realized Gain (Loss) on In-Kind Redemptions | | | 1,208,719 | | | | 995,446 | | | | 4,019,141 | | | | 1,839,406 | | | | 400,084 | | | | — | |
Net realized Gain (Loss) on Foreign Currency | | | 264 | | | | (554 | ) | | | — | | | | — | | | | — | | | | — | |
Total | | | (1,896,546 | ) | | | 616,147 | | | | 792,296 | | | | 1,995,803 | | | | (451,039 | ) | | | 21,452 | |
Net Change in Unrealized Appreciation (Depreciation) of: | | | | | | | | | | | | | | | | | | | | | | | | |
Change in Unrealized Appreciation (Depreciation) on Investments | | | (1,114,930 | ) | | | (500,471 | ) | | | (552,103 | ) | | | 1,458,045 | | | | (460,175 | ) | | | 663,054 | |
Change in Unrealized Appreciation (Depreciation) on Foreign Currency | | | (134 | ) | | | 18 | | | | — | | | | — | | | | — | | | | — | |
Total | | | (1,115,064 | ) | | | (500,453 | ) | | | (552,103 | ) | | | 1,458,045 | | | | (460,175 | ) | | | 663,054 | |
Net Realized and Unrealized Gain (Loss) on Investments | | | (3,011,610 | ) | | | 115,694 | | | | 240,193 | | | | 3,453,848 | | | | (911,214 | ) | | | 684,506 | |
NET INCREASE (DECREASE) IN NET ASSETS RESULTING FROM OPERATIONS | | $ | (2,820,163 | ) | | $ | 297,512 | | | $ | 409,682 | | | $ | 3,608,936 | | | $ | (726,867 | ) | | $ | 820,824 | |
| | | | | | | | | | | | | | | | | | | | | | | | | |
* Net of fees and foreign withholding tax of | | $ | 28,954 | | | $ | 28,485 | | | $ | — | | | $ | — | | | $ | — | | | $ | — | |
(a) | Shares of the Predecessor USAI Fund converted Shares at the close of business on December 13, 2019. See Note 1 to the Financial Statements. |
(b) | For the period ended December 1, 2019 to October 31, 2020. |
(c) | Shares of the Predecessor SLT Fund converted Shares at the close of business on October 2, 2020. See Note 1 to the Financial Statements. |
(d) | For the period ended January 1, 2020 to October 31, 2020. |
(e) | Shares of the Predecessor LSLT Fund converted Shares at the close of business on October 2, 2020. See Note 1 to the Financial Statements. |
(f) | The Fund commenced operations on March 12, 2019. The information presented is for the period from March 12, 2019 to December 31, 2019. |
(g) | Certain amounts in the prior period’s Statement of Operations were reclassified for comparability to the current period’s presentation. See Note 1 to the Financial Statements. |
The accompanying notes are an integral part of the financial statements.
13
Pacer Funds
STATEMENTS OF CHANGES IN NET ASSETS
| | Pacer American Energy Independence ETF (a) | |
| | | For the
Period Ended
October 31,
2020 (b) | | | For the
Year Ended
November 30,
2019 | | | For the
Period Ended
November 30,
2018 (c) | |
OPERATIONS | | | | | | | | | | | | |
Net Investment Income (Loss) | | $ | 191,447 | | | $ | 181,818 | | | $ | 135,122 | |
Net Realized Gain (Loss) on Investments and Foreign Currency Transactions | | | (1,896,546 | ) | | | 616,147 | | | | (142,992 | ) |
Change in Unrealized Appreciation (Depreciation) of Investments and Foreign Currency Transactions | | | (1,115,064 | ) | | | (500,453 | ) | | | (761,014 | ) |
Net Increase (Decrease) in Net Assets Resulting from Operations | | | (2,820,163 | ) | | | 297,512 | | | | (768,884 | ) |
| | | | | | | | | | | | | |
DISTRIBUTIONS TO SHAREHOLDERS | | | | | | | | | | | | |
Net Investment Income | | | (245,568 | ) | | | (112,296 | ) | | | (133,840 | ) |
Return of Capital | | | (709,985 | ) | | | (626,154 | ) | | | (88,652 | ) |
Total Distributions to Shareholders | | | (955,553 | ) | | | (738,450 | ) | | | (222,492 | ) |
| | | | | | | | | | | | | |
CAPITAL SHARE TRANSACTIONS | | | | | | | | | | | | |
Proceeds from Shares Sold | | | 9,066,280 | | | | 17,042,250 | | | | 10,275,020 | |
Payments for Shares Redeemed | | | (4,221,315 | ) | | | (14,988,310 | ) | | | — | |
Transaction Fees (See Note 1) | | | — | | | | 147 | | | | — | |
Net Increase (Decrease) in Net Assets Derived from Capital Share Transactions (d) | | | 4,844,965 | | | | 2,054,087 | | | | 10,275,020 | |
Net Increase (Decrease) in Net Assets | | $ | 1,069,249 | | | $ | 1,613,149 | | | $ | 9,283,644 | |
| | | | | | | | | | | | | |
NET ASSETS | | | | | | | | | | | | |
Beginning of Period/Year | | $ | 10,896,793 | | | $ | 9,283,644 | | | $ | — | |
End of Period/Year | | $ | 11,966,042 | | | $ | 10,896,793 | | | $ | 9,283,644 | |
(a) | Shares of the Predecessor USAI Fund converted Shares at the close of business on December 13, 2019. See Note 1 to the Financial Statements. |
(b) | For the period ended December 1, 2019 to October 31, 2020. |
(c) | Fund inception date of December 12, 2017. The information presented is from December 12, 2017 to November 30, 2018. |
(d) | A summary of capital share transactions is as follows: |
| | | Shares (e) | | | Shares (e) | | | Shares | |
Subscriptions | | | 550,000 | | | | 700,000 | | | | 400,000 | |
Redemptions | | | (250,000 | ) | | | (600,000 | ) | | | — | |
Net Increase (Decrease) | | | 300,000 | | | | 100,000 | | | | 400,000 | |
(e) | Shares of Predecessor Fund converted into Fund Shares at the close of business on December 13, 2019. See Note 1 to the Financial Statements. |
The accompanying notes are an integral part of the financial statements.
14
Pacer Funds
STATEMENTS OF CHANGES IN NET ASSETS
| | | Pacer Salt High truBetaTM US Market ETF (a) | | | Pacer Salt Low truBetaTM
US Market ETF (a) | |
| | | For the
Period Ended
October 31,
2020 (b) | | | For the
Year Ended
December 31,
2019 | | | For the
Period Ended
December 31,
2018 (c) | | | For the
Period Ended
October 31,
2020 (b) | | | For the
Period Ended
December 31,
2019 (d) | |
OPERATIONS | | | | | | | | | | | | | | | | | | | | |
Net Investment Income (Loss) | | $ | 169,489 | | | $ | 155,088 | | | $ | 26,398 | | | $ | 184,347 | | | $ | 136,318 | |
Net Realized Gain (Loss) on Investments | | | 792,296 | | | | 1,995,803 | | | | (769,325 | ) | | | (451,039 | ) | | | 21,452 | |
Change in Unrealized Appreciation (Depreciation) of Investments | | | (552,103 | ) | | | 1,458,045 | | | | (380,227 | ) | | | (460,175 | ) | | | 663,054 | |
Net Increase (Decrease) in Net Assets Resulting from Operations | | | 409,682 | | | | 3,608,936 | | | | (1,123,154 | ) | | | (726,867 | ) | | | 820,824 | |
| | | | | | | | | | | | | | | | | | | | | |
DISTRIBUTIONS TO SHAREHOLDERS | | | | | | | | | | | | | | | | | | | | |
Dividends and Distributions | | | — | | | | (155,507 | ) | | | (49,240 | ) | | | (179,737 | ) | | | (138,282 | ) |
Total Distributions to Shareholders | | | — | | | | (155,507 | ) | | | (49,240 | ) | | | (179,737 | ) | | | (138,282 | ) |
| | | | | | | | | | | | | | | | | | | | | |
CAPITAL SHARE TRANSACTIONS | | | | | | | | | | | | | | | | | | | | |
Proceeds from Shares Sold | | | 4,923,967 | | | | 11,643,208 | | | | 10,077,645 | | | | 2,801,520 | | | | 8,610,788 | |
Payments for Shares Redeemed | | | (12,790,613 | ) | | | (7,909,050 | ) | | | (629,817 | ) | | | (3,212,153 | ) | | | — | |
Transaction Fees (See Note 1) | | | — | | | | — | | | | 6 | | | | — | | | | — | |
Net Increase (Decrease) in Net Assets Derived from Capital Share Transactions (a) | | | (7,866,646 | ) | | | 3,734,158 | | | | 9,447,834 | | | | (410,633 | ) | | | 8,610,788 | |
Net Increase (Decrease) in Net Assets | | $ | (7,456,964 | ) | | $ | 7,187,587 | | | $ | 8,275,440 | | | $ | (1,317,237 | ) | | $ | 9,293,330 | |
| | | | | | | | | | | | | | | | | | | | | |
NET ASSETS | | | | | | | | | | | | | | | | | | | | |
Beginning of Period/Year | | $ | 15,463,027 | | | $ | 8,275,440 | | | $ | — | | | $ | 9,293,330 | | | $ | — | |
End of Period/Year | | $ | 8,006,063 | | | $ | 15,463,027 | | | $ | 8,275,440 | | | $ | 7,976,093 | | | $ | 9,293,330 | |
(a) | Shares of the Predecessor SLT Fund and the Predecessor LSLT Fund each converted Shares at the close of business on October 2, 2020. See Note 1 to the Financial Statements. |
(b) | For the period ended January 1, 2020 to October 31, 2020. |
(c) | Fund commenced operations on May 15, 2018 . The information presented is from May 15, 2018 to December 31, 2018. |
(d) | The Fund commenced operations on March 12, 2019. The information presented is for the period from March 12, 2019 to December 31, 2019. Shares of the Predecessor Fund converted to shares of the Fund at the close of business December 13, 2019. |
(e) | Summary of capital share transactions is as follows: |
| | | Shares (f) | | | Shares (f) | | | Shares | | | Shares (f) | | | Shares (d) | |
Subscriptions | | | 200,000 | | | | 450,000 | | | | 425,000 | | | | 100,000 | | | | 325,000 | |
Redemptions | | | (475,000 | ) | | | (300,000 | ) | | | (25,000 | ) | | | (125,000 | ) | | | — | |
Net Increase (Decrease) | | | (275,000 | ) | | | 150,000 | | | | 400,000 | | | | (25,000 | ) | | | 325,000 | |
(f) | Shares of each Predecessor Fund converted into separate Fund Shares at the close of business on October 2, 2020. See Note 1 to the Financial Statements. |
The accompanying notes are an integral part of the financial statements.
15
Pacer American Energy Independence ETF
FINANCIAL HIGHLIGHTS
For a capital share outstanding throughout the year/period
| | For the
Period Ended
October 31,
2020(a) | | | For the
Year Ended
November 30,
2019 | | | For the
Period Ended
November 30,
2018(b) | |
Net Asset Value, Beginning of Period | | $ | 21.79 | | | $ | 23.21 | | | $ | 25.00 | |
| | | | | | | | | | | | | |
INCOME (LOSS) FROM INVESTMENT OPERATIONS: | | | | | | | | | | | | |
Net Investment Income (c) | | | 0.28 | | | | 0.37 | | | | 0.55 | |
Net Realized and Unrealized Gain (Loss) on Investments (d) | | | (5.55 | ) | | | (0.34 | ) | | | (1.51 | ) |
Total from Investment Operations | | | (5.27 | ) | | | 0.03 | | | | (0.96 | ) |
| | | | | | | | | | | | | |
LESS DISTRIBUTIONS: | | | | | | | | | | | | |
Distributions From: | | | | | | | | | | | | |
Net Investment Income | | | (0.52 | ) | | | (0.22 | ) | | | (0.50 | ) |
Return of Capital | | | (1.04 | ) | | | (1.23 | ) | | | (0.33 | ) |
Total Distributions | | | (1.56 | ) | | | (1.45 | ) | | | (0.83 | ) |
| | | | | | | | | | | | | |
CAPITAL SHARE TRANSACTIONS: | | | | | | | | | | | | |
Transaction Fees (See Note 1) | | | — | | | | 0.00 | (e) | | | — | |
| | | | | | | | | | | | | |
Net Asset Value, End of Period | | $ | 14.96 | | | $ | 21.79 | | | $ | 23.21 | |
Total return | | | -24.76 | %(f) | | | -0.13 | % | | | -4.06 | %(f) |
| | | | | | | | | | | | | |
SUPPLEMENTAL DATA: | | | | | | | | | | | | |
Net Assets at End of Period (000’s) | | $ | 11,966 | | | $ | 10,897 | | | $ | 9,284 | |
| | | | | | | | | | | | | |
RATIOS TO AVERAGE NET ASSETS: | | | | | | | | | | | | |
Expenses to Average Net Assets | | | 0.75 | %(g) | | | 0.75 | % | | | 0.75 | %(g) |
Net Investment Income (Loss) to Average Net Assets | | | 1.81 | %(g) | | | 1.58 | % | | | 2.25 | %(g) |
Portfolio Turnover Rate (h) | | | 41 | %(f) | | | 26 | % | | | 61 | %(f) |
(a) | Shares of the Predecessor USAI Fund converted Shares at the close of business on December 13, 2019. See Note 1 in the Financial Statements. For the period ended December 1, 2019 to October 31, 2020. |
(b) | Commencement of operations on December 12, 2017. |
(c) | Calculated based on average shares outstanding during the period. |
(d) | Realized and unrealized gains and losses per share are balancing amounts necessary to reconcile to the change in net asset value for the period and may reconcile with aggregate gains and losses in the statement of operations due to share transactions for the period. |
(e) | Represents less than $0.005. |
(h) | Excludes the impact of in-kind transactions. |
The accompanying notes are an integral part of the financial statements.
16
Pacer Salt High truBetaTM US Market ETF
FINANCIAL HIGHLIGHTS
For a capital share outstanding throughout the year/period
| | | For the
Period Ended
October 31,
2020(a) | | | For the
Year Ended
December 31,
2019 | | | For the
Period Ended
December 31,
2018(b) | |
Net Asset Value, Beginning of Period | | $ | 28.11 | | | $ | 20.69 | | | $ | 25.00 | |
| | | | | | | | | | | | | |
INCOME (LOSS) FROM INVESTMENT OPERATIONS: | | | | | | | | | | | | |
Net Investment Income (Loss) (c) | | | 0.37 | | | | 0.32 | | | | 0.14 | |
Net Realized and Unrealized Gain (Loss) on Investments (g) | | | 0.63 | | | | 7.40 | | | | (4.32 | ) |
Total from Investment Operations | | | 1.00 | | | | 7.72 | | | | (4.18 | ) |
| | | | | | | | | | | | | |
LESS DISTRIBUTIONS: | | | | | | | | | | | | |
Distributions from: | | | | | | | | | | | | |
Net Investment Income | | | — | | | | (0.30 | ) | | | (0.07 | ) |
Realized Gains | | | — | | | | — | | | | (0.06 | ) |
Total Distributions | | | — | | | | (0.30 | ) | | | (0.13 | ) |
| | | | | | | | | | | | | |
CAPITAL SHARE TRANSACTIONS: | | | | | | | | | | | | |
Transaction fees (See Note 1) | | | — | | | | — | | | | (0.00 | )(h) |
Net Asset Value, End of Period | | $ | 29.11 | | | $ | 28.11 | | | $ | 20.69 | |
Total Return | | | 3.55% | | | | 37.32 | % | | | -16.76 | %(d) |
| | | | | | | | | | | | | |
SUPPLEMENTAL DATA: | | | | | | | | | | | | |
Net Assets at End of Period (000’s) | | $ | 8,006 | | | $ | 15,463 | | | $ | 8,275 | |
| | | | | | | | | | | | | |
RATIOS TO AVERAGE NET ASSETS: | | | | | | | | | | | | |
Expenses to Average Net Assets | | | 0.31 | %(e) | | | 0.30 | %(i) | | | 0.50 | %(e) |
Net Investment Income (Loss) to Average Net Assets | | | 1.79 | %(e) | | | 1.28 | % | | | 0.97 | %(e) |
Portfolio Turnover Rate (f) | | | 157 | %(d) | | | 202 | % | | | 145 | %(d) |
(a) | Shares of the Predecessor SLT Fund converted Shares at the close of business on October 2, 2020. See Note 1 in the Financial Statements. For the period ended January 1, 2020 to October 31, 2020. |
(b) | The Fund commenced operations on May 15, 2018. The information presented is for the period from May 15, 2018 to December 31, 2018. |
(c) | Calculated based on average shares outstanding during the period. |
(f) | Excludes the impact of in-kind transactions. |
(g) | Realized and unrealized gains and losses per share in this caption are balancing amounts necessary to reconcile to the change in net asset value for the period and may reconcile with the aggregate gains and losses in the statement of operations due to share transactions for the period. |
(h) | Represents less than $0.005. |
(i) | Effective January 14, 2019, the Predessor SLT Fund’s adviser reduced its management fee from 0.50% to 0.29%. See Note 3 to the Financial Statements. |
The accompanying notes are an integral part of the financial statements.
17
Pacer Salt Low truBetaTM US Market ETF
FINANCIAL HIGHLIGHTS
For a capital share outstanding throughout the period
| | | For the
Period Ended
October 31,
2020(a) | | | For the
Period Ended
December 31,
2019(b) | |
Net Asset Value, Beginning of Period | | $ | 28.59 | | | $ | 25.00 | |
| | | | | | | | | |
INCOME (LOSS) FROM INVESTMENT OPERATIONS: | | | | | | | | |
Net Investment Income (Loss) (c) | | | 0.53 | | | | 0.62 | |
Net Realized and Unrealized Gain (Loss) on Investments (g) | | | (2.01 | ) | | | 3.40 | |
Total from Investment Operations | | | (1.48 | ) | | | 4.02 | |
| | | | | | | | | |
LESS DISTRIBUTIONS: | | | | | | | | |
Distributions from: | | | | | | | | |
Net Investment Income | | | (0.45 | ) | | | (0.43 | ) |
Realized Gains | | | (0.07 | ) | | | — | |
Total Distributions | | | (0.52 | ) | | | (0.43 | ) |
| | | | | | | | | |
Net Asset Value, End of Period | | $ | 26.59 | | | $ | 28.59 | |
Total Return | | | -5.04 | %(d) | | | 16.09 | %(d)(i) |
| | | | | | | | | |
SUPPLEMENTAL DATA: | | | | | | | | |
Net Assets at End of Period (000’s) | | $ | 7,976 | | | $ | 9,293 | |
| | | | | | | | | |
RATIOS TO AVERAGE NET ASSETS: | | | | | | | | |
Expenses to Average Net Assets before Fees Waived | | | 0.31 | %(e) | | | 0.29 | %(e) |
Expenses to Average Net Assets after Fees Waived | | | 0.13 | %(e) | | | 0.03 | %(h)(e) |
Net Investment Income (Loss) to Average Net Assets before Fees Waived | | | 2.21 | %(e) | | | 2.54 | %(e) |
Net Investment Income (Loss) to Average Net Assets after Fees Waived | | | 2.39 | %(e) | | | 2.79 | %(e) |
Portfolio Turnover Rate (f) | | | 39 | %(d) | | | 31 | %(d) |
(a) | Shares of the Predecessor LSLT Fund converted Shares at the close of business on October 2, 2020. See Note 1 in the Financial Statements. For the period ended January 1, 2020 to October 31, 2020. |
(b) | The Fund commenced operations on March 12, 2019. The information presented is for the period from March 12, 2019 to December 31, 2019. Shares of the Predecessor Fund converted to shares of the Fund at the close of business December 13, 2019. |
(c) | Calculated based on average shares outstanding during the period. |
(f) | Excludes the impact of in-kind transactions. |
(g) | Realized and unrealized gains and losses per share in this caption are balancing amounts necessary to reconcile to the change in net asset value for the period and may reconcile with the aggregate gains and losses in the statement of operations due to share transactions for the period. |
(h) | Effective May 13, 2019, the Predecessor Fund’s adviser agreed to waive the Fund’s full unitary management fee of 0.29% on the first $100 million in net assets. See Note 3 to the Financial Statements. |
(i) | Net increase from contributions contributed 0.04% to this return. See Note 3 to the Financial Statements. |
The accompanying notes are an integral part of the financial statements.
18
Pacer Funds
NOTES TO FINANCIAL STATEMENTS
October 31, 2020
NOTE 1 – ORGANIZATION
Pacer American Energy Independence ETF (“USAI”), Pacer Salt High truBetaTM US Market ETF (“SLT”) and Pacer Salt Low truBetaTM US Market ETF (“LSLT”), (individually the “Fund” or collectively the “Funds”) are series of Pacer Funds Trust (the “Trust”), a Delaware statutory trust organized on August 12, 2014. All Funds in the Trust, except USAI, SLT and LSLT, fiscal year ends are April 30th and as such are not included in these financial statements. The Trust is registered with the Securities and Exchange Commission (the “SEC”) under the Investment Company Act of 1940, as amended (the “1940 Act”), as an open-end management investment company and the offering of the Funds’ shares (“Shares”) is registered under the Securities Act of 1933, as amended (the “Securities Act”). The investment objective of the Funds is to track the performance, before fees and expenses, of the American Energy Independence Index, the Pacer Salt High truBetaTM US Market Index and the Salt Low truBetaTM US Market Index. USAI commenced operations on December 12, 2017. SLT commenced operations on May 15, 2018, and LSLT commenced operations on March 12, 2019. Each of the Funds are non-diversified series of the Trust.
USAI is the successor in interest to American Energy Independence ETF (the “USAI Predecessor Fund”) having the same investment objective that was included as a series of another investment company, ETF Series Solutions that was advised by SL Advisors, LLC and sub-advised by Penserra Capital Management LLC. On December 10, 2019, the shareholders of the USAI Predecessor Fund approved the reorganization of the USAI Predecessor Fund with and into USAI and effective as of the close of business on December 13, 2019, the assets and liabilities of the USAI Predecessor Fund were transferred to USAI in exchange for shares of USAI. For financial reporting purposes, assets received and shares issued by USAI were recorded at fair value; however, the cost basis of the investments received from the USAI Predecessor Fund was carried forward to align ongoing reporting of USAI’s realized and unrealized gains and losses with amounts distributable to shareholders for tax purposes. Costs incurred by USAI in connection with the reorganization were paid by the Pacer Advisors, Inc. (the “Adviser”). The fiscal year end of the USAI Predecessor Fund was November 30. The reporting period covered by this annual report for USAI is December 1, 2019 through October 31, 2020. Operations prior to December 16, 2019 were for the USAI Predecessor Fund. The net assets were $11,300,062, including ($873,236) of net unrealized depreciation, ($556,632) of undistributed (accumulated) net investment income, and $479,349 of undistributed (accumulated) net realized gain and shares outstanding were 500,000, all of which were transferred into the Trust at NAV at the close of business on December 13, 2019.
SLT is the successor in interest to Salt High truBetaTM US Market ETF (the “SLT Predecessor Fund”) having the same investment objective that was included as a series of another investment company, ETF Series Solutions that was advised by Salt Financial LLC and sub-advised by Penserra Capital Management LLC. On September 29, 2020, the shareholders of the SLT Predecessor Fund approved the reorganization of the SLT Predecessor Fund with and into SLT, and effective as of the close of business on October 2, 2020, the assets and liabilities of the SLT Predecessor Fund were transferred to SLT in exchange for shares of SLT. For financial reporting purposes, assets received and shares issued bySLT were recorded at fair value; however, the cost basis of the investments received from the SLT Predecessor Fund was carried forward to align ongoing reporting of SLT’s realized and unrealized gains and losses with amounts distributable to shareholders for tax purposes. Costs incurred by SLT in connection with the reorganization were paid by the Pacer Advisors, Inc. (the “Adviser”). The fiscal year end of the SLT Predecessor Fund was December 31. The reporting period covered by this annual report for SLT is January 1, 2020 through October 31, 2020. Operations prior to October 5, 2020 were for the SLT Predecessor Fund. The net assets were $8,245,397, including $768,257 of net unrealized appreciation, ($425) of undistributed (accumulated) net investment income, and ($1,203,643) of undistributed (accumulated) net realized loss and shares outstanding were 275,000, all of which were transferred into the Trust at NAV at the close of business on October 2, 2020.
LSLT is the successor in interest to Salt Low truBetaTM US Market ETF (the “LSLT Predecessor Fund”) having the same investment objective that was included as a series of another investment company, ETF Series Solutions that was advised by Salt Financial LLC and sub-advised by Penserra Capital Management LLC. On September 29, 2020, the shareholders of the LSLT Predecessor Fund approved the reorganization of the LSLT Predecessor Fund with and into LSLT, and effective as of the close of business on October 2, 2020, the assets and liabilities of the LSLT Predecessor Fund were transferred to LSLT in exchange for shares of LSLT. For financial reporting purposes, assets received and shares issued by LSLT were recorded at fair value; however, the cost basis of the investments received from the LSLT Predecessor Fund was carried forward to align ongoing reporting of LSLT’s realized and unrealized gains and losses with amounts distributable to shareholders for tax purposes. Costs incurred by LSLT in connection with the reorganization were paid by the Pacer Advisors, Inc. (the “Adviser”). The fiscal year end of the LSLT Predecessor Fund was December 31. The reporting period covered by this annual report for LSLT is January 1, 2020 through October 31, 2020. Operations prior to October 5, 2020 were for the LSLT Predecessor Fund. The net assets were $8,269,463, including $497,549 of net unrealized appreciation, $9,209 of undistributed (accumulated) net investment income, and $14,478 of undistributed (accumulated) net realized gain and shares outstanding were 300,000, all of which were transferred into the Trust at NAV at the close of business on October 2, 2020.
The primary purpose of each of the reorganizations was to move the existing Funds from its existing trusts to another trust, which Pacer Advisors, Inc. (the “Adviser”) believed would allow each Fund to become part of a series of a stable fund family with a consistent Adviser across all funds in the Trust. Shareholders are expected to benefit accordingly and to enjoy an improvement in the level and quality of services provided to them and each Fund.
19
Pacer Funds
NOTES TO FINANCIAL STATEMENTS
October 31, 2020 (Continued)
Shares of the USAI are listed and traded on the NYSE Arca, Inc., (“NYSE”) and shares of SLT and LSLT are listed and traded on the Cboe BZX Exchange, Inc., (“Cboe”). Market prices for the shares may be different from their net asset value (“NAV”). The Funds issue and redeem shares on a continuous basis at NAV only in large blocks of shares, called “Creation Units,” which generally consist of 50,000 shares except SLT and LSLT which generally consist of 25,000 shares. Creation Units are issued and redeemed principally in-kind for securities included in a specified universe. Once created, Shares generally trade in the secondary market at market prices that change throughout the day in amounts less than a Creation Unit. Except when aggregated in Creation Units, Shares are not redeemable securities of a Fund. Shares of a Fund may only be purchased directly from or redeemed directly to a Fund by certain financial institutions (“Authorized Participants”). An Authorized Participant is either (i) a broker-dealer or other participant in the clearing process through the Continuous Net Settlement System of the National Securities Clearing Corporation or (ii) a DTC participant and, in each case, must have executed a Participant Agreement with Pacer Financial, Inc. (the “Distributor”). Prior to December 16, 2019, Quasar Distributors, LLC acted as the principal underwriter for USAI. Prior to October 5, 2020, Compass Distributors, LLC acted as the principal underwriter for SLT and LSLT. Most retail investors do not qualify as Authorized Participants nor have the resources to buy and sell whole Creation Units. Therefore, they are unable to purchase or redeem the shares directly from a Fund. Rather, most retail investors may purchase Shares in the secondary market with the assistance of a broker and are subject to customary brokerage commissions or fees.
The Funds currently offer one class of Shares, which have no front end sales load, no deferred sales charge, and no redemption fee. A purchase (i.e., creation) transaction fee is imposed for the transfer and other transaction costs associated with the purchase of Creation Units. Each Fund charges $250 for the standard fixed creation fee, payable to the Custodian. The fixed transaction fee may be waived on certain orders if the Fund’s Custodian has determined to waive some or all of the costs associated with the order, or another party, such as the Adviser, has agreed to pay such fee. In addition, a variable fee may be charged on all cash transactions or substitutes for Creation Units of up to a maximum of 2% as a percentage of the value of the Creation Units subject to the transaction. Variable fees received by the Funds, if any, are displayed in the Capital Shares Transactions section of the Statements of Changes in Net Assets. Each Fund may issue an unlimited number of shares of beneficial interest, with no par value. Shares of each Fund have equal rights and privileges to such Fund.
NOTE 2 – SIGNIFICANT ACCOUNTING POLICIES
The following is a summary of significant accounting policies consistently followed by the Funds in the preparation of their financial statements. The financial statements have been prepared in conformity with accounting principals generally accepted in the United States of America (“GAAP”). The Funds are investment companies that follow the accounting and reporting guidelines of Accounting Standards Codification Topic 946 applicable to investment companies.
Securities, including master limited partnerships (“MLPs”), listed on a securities exchange, market or automated quotation system for which quotations are readily available, are valued at the last quoted sale price on the primary exchange or market (foreign or domestic) on which they are traded, except for securities listed on Nasdaq Global Market (“Nasdaq”). If, on a particular day, there is no such reported sale, then the most recent quoted bid price will be used. For securities traded on Nasdaq, the Nasdaq Official Closing Price (“NOCP”) will be used. If a Fund holds foreign shares of a security for which there is no reported volume, and there is an actively trading local version of the security, the last quoted sale price of the local security shall be used. Prices denominated in foreign currencies are converted to U.S. dollar equivalents at the current exchange rate.
Investments in other open-end investment companies, including money market funds, are valued at the investment company’s net asset value per share, with the exception of exchange-traded open-end investment companies, which are priced as equity securities described above. Deposit accounts are valued at acquisition cost, which approximates fair value.
Any securities for which there are no readily available market quotations and other assets will be valued at their fair value as determined in good faith by the Fair Value Pricing Committee using the Fair Value Procedures approved by the Board of Trustees (the “Board”).
As described above, the Funds utilize various methods to measure the fair value of their investments on a recurring basis. GAAP establishes a hierarchy that prioritizes inputs to valuations methods. The three levels of inputs are:
| | Level 1 | – Unadjusted quoted prices in active markets for identical assets or liabilities that the Funds have the ability to access. |
| | Level 2 | – Observable inputs other than quoted prices included in Level 1 that are observable for the asset or liability, either directly or indirectly. These inputs may include quoted prices for the identical instrument on an inactive market, prices for similar instruments, interest rates, prepayment speeds, credit risk, yield curves, default rates and similar data. |
20
Pacer Funds
NOTES TO FINANCIAL STATEMENTS
October 31, 2020 (Continued)
| | Level 3 | – Unobservable inputs for the asset or liability, to the extent relevant observable inputs are not available; representing the Funds’ own assumptions about the assumptions a market participant would use in valuing the asset or liability, and would be based on the best information available. |
The availability of observable inputs can vary from security to security and is affected by a wide variety of factors, including, for example, the type of security, whether the security is new and not yet established in the marketplace, the liquidity of markets, and other characteristics particular to the security. To the extent that valuation is based on models or inputs that are less observable or unobservable in the market, the determination of fair value requires more judgment. Accordingly, the degree of judgment exercised in determining fair value is greatest for instruments categorized in Level 3.
The inputs used to measure fair value may fall into different levels of the fair value hierarchy. In such cases, for disclosure purposes, the level in the fair value hierarchy within which the fair value measurement falls in its entirety, is determined based on the lowest level input that is significant to the fair value measurement in its entirety.
The following is a summary of the inputs used to value the Fund’s investments as of October 31, 2020:
USAI | | | | | | | | | | | | | | | | |
Description^ | | Level 1 | | | Level 2 | | | Level 3 | | | Total | |
Common Stocks | | $ | 8,795,460 | | | $ | — | | | $ | — | | | $ | 11,890,807 | |
Master Limited Partnerships and Related Companies | | | 3,024,285 | | | | — | | | | — | | | | 3,024,285 | |
Short-Term Investments | | | 71,062 | | | | — | | | | — | | | | 71,062 | |
Total Investments in Securities | | $ | 11,890,807 | | | $ | — | | | $ | — | | | $ | 11,890,807 | |
^ See Schedule of Investments for industry breakouts.
SLT | | | | | | | | | | | | | | | | |
Description^ | | Level 1 | | | Level 2 | | | Level 3 | | | Total | |
Common Stocks | | $ | 7,682,245 | | | $ | — | | | $ | — | | | $ | 7,682,245 | |
Real Estate Investment Trusts | | | 143,789 | | | | — | | | | — | | | | 143,789 | |
Short-Term Investments | | | 181,658 | | | | — | | | | — | | | | 181,658 | |
Total Investments in Securities | | $ | 8,007,692 | | | $ | — | | | $ | — | | | $ | 8,007,692 | |
^ See Schedule of Investments for industry breakouts.
LSLT | | | | | | | | | | | | | | | | |
Description^ | | Level 1 | | | Level 2 | | | Level 3 | | | Total | |
Common Stocks | | $ | 7,225,278 | | | $ | — | | | $ | — | | | $ | 7,225,278 | |
Real Estate Investment Trusts | | | 718,723 | | | | — | | | | — | | | | 718,723 | |
Short-Term Investments | | | 24,042 | | | | — | | | | — | | | | 24,042 | |
Total Investments in Securities | | $ | 7,968,043 | | | $ | — | | | $ | — | | | $ | 7,968,043 | |
^ See Schedule of Investments for industry breakouts.
During the period ended October 31, 2020, the Funds did not recognize any transfers to or from Level 3.
B. | Foreign Currency. Investment securities and other assets and liabilities denominated in foreign currencies are translated into U.S. dollar amounts at the date of valuation. Purchases and sales of investment securities and income and expense items denominated in foreign currencies are translated into U.S. dollar amounts on the respective dates of such transactions. The Funds do not isolate that portion of the result of operations resulting from changes in foreign exchange rates on investments from fluctuations arising from changes in market prices of securities held. Such fluctuations are included with the net realized and unrealized gain or loss from investments. The Funds report net realized foreign exchange gains or losses that arise from sales of foreign currencies, currency gains or losses realized between the trade and settlement dates on foreign currency transactions, and the differences between the amounts of dividends, interest and foreign withholding taxes recorded on the Funds’ books and the U.S. dollar equivalent of the amounts actually received or paid. Net unrealized foreign exchange gains and losses arise from changes in the values of assets and liabilities, other than investments in securities at fiscal period end, resulting from changes in exchange rates. |
21
Pacer Funds
NOTES TO FINANCIAL STATEMENTS
October 31, 2020 (Continued)
C. | Federal Income Taxes. The Funds comply with the requirements of Subchapter M of the Internal Revenue Code of 1986, as amended, necessary to qualify as regulated investment companies and distribute substantially all net taxable investment income and net realized gains to shareholders in a manner which results in no tax cost to the Funds. Therefore, no federal income tax provision is required. As of and during the fiscal period ended October 31, 2020, the Funds did not have any tax positions that did not meet the “more-likely-than-not” threshold of being sustained by the applicable tax authority. As of and during the fiscal period ended October 31, 2020, the Funds did not have liabilities for any unrecognized tax benefits on uncertain tax positions as income tax expense in the Statement of Operations. Management has analyzed each of the Fund’s tax positions and concluded that no liability for unrecognized tax benefits should be recorded related to uncertain tax positions taken on returns filed for open tax years (2018-2019) or expected to be taken in each of the Fund’s 2020 tax returns. During the period ended October 31, 2020, the Funds did not incur any interest or penalties. |
D. | Security Transactions and Investment Income. Investment securities transactions are accounted for on the trade date. Gains and losses realized on sales of securities are computed on the basis of highest amortized cost. Dividend income is recorded on the ex-dividend date. Interest income is recorded on an accrual basis. Discounts and premiums on securities purchased are accreted and amortized over the lives of the respective securities. Withholding taxes on foreign dividends have been provided for in accordance with the Funds’ understanding of the applicable tax rules and regulations. |
Distributions received from the Funds’ investments in REITs and MLPs may be characterized as ordinary income net capital gain, or return of capital. The proper characterization of such distributions is generally not known until after the end of each calendar year. As such, the Funds must use estimates in reporting the character of their income and distributions for financial statement purposes. Such estimates are based on historical information available from each MLP and other industry sources. The actual character of distributions to each Fund’s shareholders will be reflected on the Form 1099 received by shareholders after the end of the calendar year. Due to the nature of such investments, a portion of the distributions received by each Fund’s shareholders may represent a return of capital.
E. | Distributions to Shareholders. Distributions to shareholders from net investment income for the USAI Fund is declared and paid on a monthly basis and distributions to shareholders from net investment income for SLT and LSLT are declared and paid at least annually. Distributions from net realized gains on securities normally are declared and paid on an annual basis. Distributions are recorded on the ex-dividend date. |
F. | Use of Estimates. The preparation of financial statements in conformity with GAAP requires management to make estimates and assumptions that affect the reported amounts of assets and liabilities and disclosure of contingent assets and liabilities at the date of the financial statements, and the reported amounts of increases and decreases in net assets from operations during the reporting period. Actual results could differ from those estimates. |
G. | Share Valuation. The NAV per share of each Fund is calculated by dividing the sum of the value of the securities held by the Fund, plus cash and other assets, minus all liabilities (including estimated accrued expenses) by the total number of shares outstanding for the Fund, rounded to the nearest cent. The Funds’ shares will not be priced on the days on which the NYSE or Cboe are is closed for trading. The offering and redemption price per share of the Fund is equal to each Fund’s NAV per share. |
H. | Guarantees and Indemnifications. In the normal course of business, the Funds enters into contracts with service providers that contain general indemnification clauses. Each Fund’s maximum exposure under these arrangements is unknown as this would involve future claims that may be against the Funds that have not yet occurred. |
I. | Reclassification of Capital Accounts. Additionally, U.S. GAAP requires that certain components of net assets relating to permanent differences be reclassified between financial and tax reporting. These reclassifications have no effect on net assets or net asset value per share. For the fiscal period ended October 31, 2020, the following table shows the reclassifications made: |
| | | Distributable
Earnings
(Accumulated
Deficit) | | | Paid-In Capital | |
USAI | | $ | (168,965 | ) | | $ | 168,965 | |
SLT | | | (3,870,557 | ) | | | 3,870,557 | |
LSLT | | | (396,737 | ) | | | 396,737 | |
22
Pacer Funds
NOTES TO FINANCIAL STATEMENTS
October 31, 2020 (Continued)
During the fiscal period ended October 31, 2020, the Fund realized the following in net capital gains/(losses) resulting from in-kind redemptions, in which shareholders exchanged Fund shares for securities held by the Fund rather than for cash. Because such gains are not taxable to the Fund, and are not distributed to shareholders, they have been reclassified from net realized losses to paid-in capital.
USAI | | $ | 1,208,719 | |
SLT | | | 4,019,141 | |
LSLT | | | 400,084 | |
NOTE 3 – COMMITMENTS AND OTHER RELATED PARTY TRANSACTIONS
Effective December 16, 2019, Pacer Advisors, Inc. (the “Adviser”) serves as the investment adviser to the USAI. Effective October 5, 2020, Pacer Advisors, Inc. (the “Adviser”) serves as the investment adviser to the SLT and LSLT. Pursuant to an Investment Advisory Agreement (“Investment Advisory Agreement”) between the Trust, on behalf of the Funds, and the Adviser, the Adviser provides investment advice to the Funds and oversees the day-to-day operations of the Funds, subject to the direction and control of the Board and the officers of the Trust. The Adviser administers the Funds’ business affairs, provides office facilities and equipment and certain clerical, bookkeeping and administrative services. The Adviser bears the costs of all advisory and non-advisory services required to operate the Funds, in exchange for a single unitary management fee. For services provided to the Funds, the USAI Fund pays the Adviser 0.75%, SLT pays the Adviser 0.60% and LSLT pays the Adviser 0.60% at an annual rate based on the Fund’s average daily net assets. For the period ended October 31, 2020, the Adviser earned:
Fund | | | | |
USAI (a) | | $ | 75,950 | |
SLT (b) | | $ | 3,739 | |
LSLT (b) | | $ | 3,684 | |
(a) | Period from December 16, 2019 to October 31, 2020. |
(b) | Period from October 5, 2020 to October 31, 2020. |
Prior to December 16, 2019, SL Advisors, LLC (the “USAI Predecessor Adviser”), served as the investment adviser and index provider to the Predecessor USAI. Pursuant to an Investment Advisory Agreement (“Predecessor USAI Advisory Agreement”) between the ETF Series Solutions, on behalf of the Predecessor USAI, and the USAI Predecessor Adviser, the USAI Predecessor Adviser provided investment advice to the Predecessor USA and oversaw the day-to-day operations of the Predecessor USAI, subject to the direction and control of the Board and the officers of the ETF Series Solution. Under the Predecessor USAI Advisory Agreement, the USAI Predecessor Adviser was also responsible for arranging, in consultation with Penserra Capital Management, LLC (the “USAI Sub-Adviser”) transfer agency, custody, fund administration, accounting, distribution and other related services necessary for the Predecessor USAI to operate. Under the Predecessor USUAI Advisory Agreement, the USAI Predecessor Adviser had agreed to pay all expenses of the Predecessor USAI, except for: the fee paid to the USA Predecessor Adviser pursuant to the Predecessor USAI Advisory Agreement, interest charges on any borrowings, dividends and other expenses on securities sold short, taxes, brokerage commissions and other expenses incurred in placing orders for the purchase and sale of securities and other investment instruments, acquired fund fees and expenses, accrued deferred tax liability, extraordinary expenses, and distribution (12b-1) fees and expenses. For services provided to the Predecessor USAI, the Predecessor USAI paid the USAI Predecessor Adviser 0.75% at an annual rate based on the Predecessor USAI’s average daily net assets.
Prior to October 5, 2020 Salt Financial LLC (the “SLT and LSLT Predecessor Adviser”), served as the investment adviser to SLT and LSLT. Pursuant to an Investment Advisory Agreement (“Predecessor SLT and LSLT Advisory Agreement”) between Salt Financial, on behalf of SLT and LSLT, and the SLT and LSLT Predecessor Adviser, the SLT and LSLT Predecessor Adviser provided investment advice to SLT and LSTL and oversaw the day-to-day operations of SLT and LSLT, subject to the direction and control of the Board and the officers of the ETF Series Solutions. Under the Predecessor SLT and LSLT Advisory Agreement, the SLT and LSLT Predecessor Adviser was also responsible for arranging, in consultation with Penserra Capital Management LLC, (the “SLT and LSLT Sub-Adviser”), transfer agency, custody, fund administration and accounting, and other non-distribution related services necessary for SLT and LSLT to operate. Under the Predecessor SLT and LSLT Advisory Agreement, the SLT and LSLT Predecessor Adviser had agreed to pay all expenses of SLT and LSLT except for the fee paid to the SLT and LSLT Predecessor Adviser pursuant to the Predecessor SLT and LSLT Investment Advisory Agreement, interest charges on any borrowings, dividends, and other expenses on securities sold short, taxes, brokerage commissions and other expenses incurred in placing orders for the purchase and sale of securities and other investment instruments, acquired fund fees and expenses, accrued deferred tax liability, extraordinary expenses, and distribution (12b-1) fees and expenses. For services provided to Predecessor SLT and LSLT, Predecessor SLT paid the SLT and LSLT Predecessor Adviser 0.29% at an annual rate based on each Fund’s average daily net assets. Prior to January 14, 2019, Predecessor SLT paid the SLT and LSLT Predecessor Adviser 0.50% at an annual rate based on the Predecessor SLT’s average daily net assets.
23
Pacer Funds
NOTES TO FINANCIAL STATEMENTS
October 31, 2020 (Continued)
From May 13, 2019 to May 31, 2020, SLT and LSLT Predecessor Adviser contractually agreed to waive the LSLT Predecessor Fund’s full unitary management fee of 0.29% of the LSLT’s average daily net assets on the first $100 million in net assets (the “Fee Waiver”) and to contribute to the LSLT Predecessor Fund’s assets an amount equal to an annual rate of 0.05% of the LSLT Predecessor Fund’s average daily net assets on the first $100 million in net assets (i.e., up to $50,000 per annum) until May 31, 2020 (the “Contribution”). No portion of the Fee Waiver is permitted to be recouped or recaptured at any time. For the period ended October 31, 2020, LSLT waived $11,916 in unitary management fees and the LSLT Predecessor Adviser contributed $2,054 to LSLT.
For the period ended October 31, 2020, the USAI Predecessor Adviser, SLT Predecessor Adviser and LSLT Predecessor Adviser earned the following:
Fund | | | | |
USAI (a) | | $ | 3,384 | |
SLT (b) | | $ | 25,699 | |
LSLT (b) | | $ | 6,550 | |
(a) | Period from December 1, 2019 to December 15, 2019. |
(b) | Period from January 1, 2020 to October 4, 2020. |
The Distributor acts as the Fund’s principal underwriter in a continuous public offering of the Funds’ shares. The Distributor is an affiliate of the Adviser. The Funds did not pay any fees or commissions to the Distributor during the fiscal period ended October 31, 2020.
Certain officers and a Trustee of the Trust are affiliated with the Adviser and Distributor.
NOTE 4 – SERVICE AND CUSTODY AGREEMENTS
The Funds have entered into Service Agreements with U.S. Bancorp Fund Services, LLC (“Fund Services” or “Administrator”) doing business as U.S. Global Fund Services and a Custody Agreement with U.S. Bank, N.A. (the “Custodian”), an affiliate of Fund Services. Under these agreements, Fund Services and the Custodian provide certain transfer agency, administrative, accounting and custody services. The Predecessor USAI, SLT and LSLT each had agreements with the Administrator and Custodian prior to December 16, 2019 and October 5, 2020, respectively.
NOTE 5 – INVESTMENT TRANSACTIONS
For the period ended October 31, 2020, the aggregate purchases and sales of securities by the Funds, excluding short-term securities and in-kind transactions were as follows:
| | | Purchases | | | Sales | |
USAI | | $ | 4,300,713 | | | $ | 4,419,410 | |
SLT | | | 17,971,814 | | | | 17,933,831 | |
LSLT | | | 3,616,279 | | | | 3,527,373 | |
For the period ended October 31, 2020, in-kind transactions associated with creations and redemptions are as follows:
| | | Purchases | | | Sales | |
USAI | | $ | 8,979,322 | | | $ | 4,182,362 | |
SLT | | | 4,899,675 | | | | 12,711,964 | |
LSLT | | | 2,739,254 | | | | 3,190,999 | |
For the period ended October 31, 2020, there were no long-term purchases or sales of U.S. Government Securities for the Funds.
For the period ended October 31, 2020, the Funds did not pay any brokerage commissions on trades of securities to Penserra Securities LLC, an affiliate of Penserra Capital Management LLC, the Sub-Adviser to the USAI Predecessor Fund, SLT Predecessor Fund and LSLT Predecessor Fund.
24
Pacer Funds
NOTES TO FINANCIAL STATEMENTS
October 31, 2020 (Continued)
NOTE 6 – TAX COST BASIS
The components of tax basis cost of investments and net unrealized appreciation for federal income tax purposes at October 31, 2020 were as follows:
| | | USAI | | | SLT | | | LSLT | |
Tax cost of investments | | $ | 15,279,221 | | | $ | 7,502,843 | | | $ | 7,834,352 | |
Gross tax unrealized appreciation | | | 621,723 | | | | 824,072 | | | | 640,975 | |
Gross tax unrealized depreciation | | | (4,009,303 | ) | | | (319,223 | ) | | | (507,284 | ) |
Net tax unrealized appreciation (depreciation) | | | (3,387,580 | ) | | | 504,849 | | | | 133,691 | |
Undistributed ordinary income | | | — | | | | 169,488 | | | | 27,628 | |
Undistributed long-term gain | | | — | | | | — | | | | — | |
Total distributable earnings | | | — | | | | 169,488 | | | | 27,628 | |
Other accumulated (loss) | | | (2,270,055 | ) | | | (3,720,512 | ) | | | (782,118 | ) |
Total accumulated gain (loss) | | $ | (5,657,635 | ) | | $ | (3,046,175 | ) | | $ | (620,799 | ) |
The difference between book and tax-basis cost is attributable to the realization for tax purposes of unrealized gains on investments in Real Estate Investment Trusts, partnerships, passive foreign investment companies and wash sales. Under tax law, certain capital and foreign currency losses realized after October 31 and within the taxable year are deemed to arise on the first business day of the Fund’s next taxable year. At October 31, 2020, the Funds, on a tax basis, did not defer any post-October or late year ordinary losses.
At October 31, 2020, the Fund had the following capital loss carryforwards:
| | | Short-Term | | | Long-Term | | | Expires | |
USAI | | $ | (1,290,365 | ) | | $ | (979,561 | ) | | | Indefinite | |
SLT | | | (3,155,635 | ) | | | (564,877 | ) | | | Indefinite | |
LSLT | | | (598,874 | ) | | | (183,244 | ) | | | Indefinite | |
NOTE 7 – DISTRIBUTIONS TO SHAREHOLDERS
The tax character of distributions paid by the Fund during the fiscal period ended October 31, 2020, was as follows:
| | | Ordinary Income | | | Capital Gains | | | Return of Capital | |
USAI | | $ | 245,568 | | | $ | — | | | $ | 709,985 | |
SLT | | | — | | | | — | | | | — | |
LSLT | | | 173,605 | | | | 6,132 | | | | — | |
The tax character of distributions paid by USAI during the fiscal period ended November 30, 2019, was as follows:
| | | Ordinary Income | | | Return of Capital | |
| | $ | 112,296 | | | $ | 626,154 | |
The tax character of distributions paid by SLT & LSLT during the fiscal period ended December 31, 2019, was as follows:
| | | Ordinary Income | |
SLT | | $ | 155,507 | |
LSLT | | $ | 138,282 | |
NOTE 8 – NEW ACCOUNTING PRONOUNCEMENTS
In August 2018, FASB issued ASU 2018-13, Fair Value Measurement (Topic 820): Disclosure Framework—Changes to the Disclosure Requirements for Fair Value Measurement (“ASU 2018-13”). The primary focus of ASU 2018-13 is to improve the effectiveness of the disclosure requirements for fair value measurements. The changes affect all companies that are required to include fair value measurement disclosures. In general, the amendments in ASU 2018-13 are effective for all entities for fiscal years and interim periods within those fiscal
25
Pacer Funds
NOTES TO FINANCIAL STATEMENTS
October 31, 2020 (Continued)
years, beginning after December 15, 2019. An entity is permitted to early adopt the removed or modified disclosures upon the issuance of ASU 2018-13 and may delay adoption of the additional disclosures, which are required for public companies only, until their effective date. Management has evaluated the ASU 2018-13 and has decided to adopt the disclosure framework.
In March 2020, FASB issued ASU 2020-04, Reference Rate Reform: Facilitation of the Effects of Reference Rate Reform on Financial Reporting. The main objective of the new guidance is to provide relief to companies that will be impacted by the expected change in benchmark interest rates at the end of 2021, when participating banks will no longer be required to submit London Interbank Offered Rate (“LIBOR”) quotes by the UK Financial Conduct Authority. The new guidance allows companies to, provided the only change to existing contracts are a change to an approved benchmark interest rate, account for modifications as a continuance of the existing contract without additional analysis. In addition, derivative contracts that qualified for hedge accounting prior to modification, will be allowed to continue to receive such treatment, even if critical terms change due to a change in the benchmark interest rate. For new and existing contracts, the Funds may elect to apply the amendments as of March 12, 2020 through December 31, 2022. Management is currently assessing the impact of the ASU’s adoption to the Funds’ financial statements and various filings.
NOTE 9 – SUBSEQUENT EVENT
Management of the Fund has evaluated the need for disclosures and/or adjustments resulting from subsequent events through the date these financial statements were issued. The evaluation did not result in any subsequent events that necessitated disclosures and/or adjustments other than the below:
On December 18, 2020, the following Funds declared distributions from ordinary income to shareholders of record as of December 22, 2020, Payable December 28, 2020, as follows:
| | | Ordinary Income | | | Per Share Amount | |
SLT | | $ | 172,868 | | | $ | 0.62861091 | |
LSLT | | | 37,001 | | | | 0.12333668 | |
On December 22, 2020, the Adviser launched three new funds in the Pacer Funds Trust: Pacer Swan SOS Conservative (December) ETF, Pacer Swan SOS Flex (December) ETF, and Pacer Swan SOS Moderate (December) ETF.
The global outbreak of COVID-19 (commonly referred to as “coronavirus”) has disrupted economic markets and the prolonged economic impact is uncertain. The ultimate economic fallout from the pandemic, and the long-term impact on economies, markets, industries and individual issuers, are not known. The operational and financial performance of the issuers of securities in which each Funds invests depends on future developments, including the duration and spread of the outbreak, and such uncertainty may in turn adversely affect the value and liquidity of each Fund’s investments, impair each Fund’s ability to satisfy redemption requests, and negatively impact each Fund’s performance.
26
Pacer Funds
Report of Independent Registered Public Accounting Firm
To the Board of Trustees of Pacer Funds Trust and the Shareholders of
Pacer American Energy Independence ETF, Pacer Salt High truBeta™ US Market ETF, and
Pacer Salt Low truBeta™ US Market ETF
Opinion on the Financial Statements
We have audited the accompanying statements of assets and liabilities of the Pacer American Energy Independence ETF (“USAI”), Pacer Salt High truBeta™ US Market ETF (“SLT”), and Pacer Salt Low truBeta™ US Market ETF (“LSLT”) (collectively the “Funds”), each a series of the Pacer Funds Trust (the “Trust”) including the schedules of investments, as of October 31, 2020, the related statements of operations, the changes in net assets, the related notes (collectively, referred to as the “financial statements”) and the financial highlights for the periods indicated in the table below. The statement of operations for the year ended November 30, 2019, and the statements of changes in net assets and financial highlights for each of the years or period in the two-year period ended November 30, 2019 for the USAI Fund were audited by other auditors whose opinion dated January 28, 2020, expressed an unqualified opinion on those financial statements. The statements of operations for the year or period ended December 31, 2019, and the statements of changes in net assets and financial highlights for each of the years or period in the two-year period ended December 31, 2019 for the SLT and LSLT Funds were audited by other auditors whose opinion dated February 28, 2020, expressed an unqualified opinion on those financial statements.
In our opinion, the financial statements and financial highlights present fairly, in all material respects, the financial positions of the Funds, as of October 31, 2020, the results of their operations for the period then ended, the changes in their net assets, and the financial highlights for the period then ended, as noted in the table below, in conformity with accounting principles generally accepted in the United States of America.
Individual Funds
Included in the Trust | Statements of
Operations | Statements of Changes
in Net Assets | Financial
Highlights |
Pacer American Energy Independence ETF | For the period December 1, 2019 to October 31, 2020 |
Pacer Salt High truBeta™ US Market ETF | For the period January 1, 2020 to October 31, 2020 |
Pacer Salt Low truBeta™ US Market ETF | For the period January 1, 2020 to October 31, 2020 |
Basis for Opinion
These financial statements and financial highlights are the responsibility of the Funds’ management. Our responsibility is to express an opinion on these financial statements and financial highlights based on our audit. We are a public accounting firm registered with the Public Company Accounting Oversight Board (United States) (“PCAOB”) and are required to be independent with respect to the Funds in accordance with the U.S. federal securities laws and the applicable rules and regulations of the Securities and Exchange Commission and the PCAOB.
We conducted our audit in accordance with the standards of the PCAOB. Those standards require that we plan and perform the audit to obtain reasonable assurance about whether the financial statements and financial highlights are free of material misstatement, whether due to error or fraud. The Funds are not required to have, nor were we engaged to perform, an audit of their internal control over financial reporting. As part of our audit, we are required to obtain an understanding of internal control over financial reporting but not for the purpose of expressing an opinion on the effectiveness of the Funds’ internal control over financial reporting. Accordingly, we express no such opinion.
Our audit included performing procedures to assess the risk of material misstatement of the financial statements and financial highlights, whether due to error or fraud, and performing procedures that respond to those risks. Such procedures included examining, on a test basis, evidence regarding the amounts and disclosures in the financial statements and financial highlights. Our procedures included confirmation of securities and cash owned as of October 31, 2020, by correspondence with the custodian. Our audit also included evaluating the accounting principles used and significant estimates made by management, as well as evaluating the overall presentation of the financial statements and financial highlights. We believe that our audit provides a reasonable basis for our opinion.

We have served as the Trusts’ auditor since 2015
Abington, Pennsylvania
December 28, 2020
27
Pacer Funds
REVIEW OF LIQUIDITY RISK MANAGEMENT PROGRAM
(Unaudited)
Pursuant to Rule 22e-4 under the Investment Company Act of 1940, the Trust has adopted a liquidity risk management program to govern the Trust’s approach to managing liquidity risk. Rule 22e-4 seeks to promote effective liquidity risk management, thereby reducing the risk that a fund will be unable to meet its redemption obligations and mitigating dilution of the interests of fund shareholders. The Trust’s liquidity risk management program is tailored to reflect its particular risks, but not to eliminate all adverse impacts of liquidity risk.
The Investment Adviser to the Trust has adopted and implemented its own written liquidity risk management program (the “Program”) tailored specifically to assess and manage the liquidity risk of the funds it advises.
On June 22, 2020, the Trustees of Pacer Funds Trust reviewed and considered a written report prepared by the program administrator of the Fund’s Liquidity Risk Management Program (the “Program”), which addressed the operation of the Program and assessed the Program’s adequacy and effectiveness of implementation. In considering the report, the Trustees noted that the Program Administrator has determined that several of the funds within the Pacer Funds Trust are deemed “In-Kind” in accordance with Rule 22e-4. They then confirmed with the Program Administrator that no material changes were made to the Program, and reviewed all of the material features of the Program to ensure that they understand how the Program is designed to assess and manage the risk that the funds within the Trust could not meet requests to redeem shares issued by the funds without significant dilution of remaining investors in the funds. Following this review and discussion, the Trustees determined that they believe the disclosures in the report, taken as a whole, provide the information necessary for the Trustees to effectively assess the Program and its implementation, and that they are comfortable with the report’s conclusion that the Program is reasonably designed to assess and manage each Fund’s liquidity risk, and that the Program has operated as intended during the past year.
28
Pacer Funds
ADDITIONAL INFORMATION
(Unaudited)
NOTE 1 – FREQUENCY DISTRIBUTION OF PREMIUMS AND DISCOUNTS
Information regarding how often shares of the Fund trade on the Exchange at a price above (i.e., at a premium) or below (i.e., at a discount) the NAV of the Fund is available on the Fund’s website at www.PacerETFs.com.
NOTE 2 – FEDERAL TAX INFORMATION
Qualified Dividend Income/Dividends Received Deduction
For the fiscal period ended October 31, 2020, certain dividends paid by the Fund may be subject to a maximum tax rate of 20%, as provided for by the Jobs and Growth Tax Relief Reconciliation Act of 2003.
The percentage of dividends declared from ordinary income was as follows:
USAI | 100.00% |
SLT | 0.00% |
LSLT | 88.18% |
For corporate shareholders, the percent of ordinary income distributions qualifying for corporate dividends received deduction for the fiscal period ended October 31, 2020 was as follows:
USAI | 100.00% |
SLT | 0.00% |
LSLT | 87.40% |
Short Term Capital Gains
The percentage of taxable ordinary income distributions that are designated as short-term capital gain distributions under Internal Revenue Section 871(k)(2)(C) for each fund were as follows:
USAI | 0.00% |
SLT | 0.00% |
LSLT | 9.39% |
NOTE 3 – DISCLOSURE OF PORTFOLIO HOLDINGS
The Funds files their complete schedule of portfolio holdings for their first and third fiscal quarters with the Securities and Exchange Commission (“SEC”) on Part F of Form N-PORT. The Funds’ Part F of Form N-PORT is available on the website of the SEC at www.sec.gov. Each Fund’s portfolio holdings are posted on its website at www.PacerETFs.com daily.
NOTE 4 – PROXY VOTING POLICIES AND PROCEDURES
A description of the policies and procedures the Funds use to determine how to vote proxies relating to portfolio securities is provided in the Statement of Additional Information (“SAI”). The SAI is available without charge upon request by calling toll-free at (800) 617-0004, by accessing the SEC’s website at www.sec.gov, or by accessing the Funds’ website at www.paceretfs.com. Information how the Funds voted proxies relating to portfolio securities during the year ended June 30 is available without charge, upon request, by calling (800) 617-0004 or by accessing the website of the SEC.
NOTE 5 – BOARD CONSIDERATIONS IN APPROVING THE INVESTMENT ADVISORY AGREEMENT FOR THE FUND
The Board of Trustees (the “Board”) of Pacer Funds Trust (the “Trust”), including the Trustees thereof who are not “interested persons,” as defined by the Investment Company Act of 1940, as amended (the “1940 Act”), of the Trust (the “Independent Trustees”), held meetings on June 22, 2020 (the “Meeting”), for the purpose of, among other things, the consideration of, and voting on, the proposed approval of the investment advisory agreement (the “Investment Advisory Agreement”) between the Trust and Pacer Advisors, Inc. (the “Advisor”), relating to the Pacer Salt Low truBetaTM US Market ETF (“SLT”) and the Pacer Salt High truBeta U.S. Market ETF (“LST”), each a “Fund” and, together, the “Funds.
The Board, including a majority of the Trust’s Independent Trustees voting separately, approved the Investment Advisory Agreement for each of the Funds, based on its review of qualitative and quantitative information provided by the Advisor as well as the Trust’s other service providers. Prior to deciding to approve the Investment Advisory Agreement, the Independent Trustees requested and obtained from
29
Pacer Funds
ADDITIONAL INFORMATION
(Unaudited) (Continued)
the Advisor such information as the Independent Trustees deemed reasonably necessary to evaluate the terms of the Investment Advisory Agreement. The Independent Trustees received assistance and advice from, and met separately with, independent counsel. In addition, the Independent Trustees received a memorandum from independent counsel regarding the responsibilities of the Board with respect to the approval of the Investment Advisory Agreement.
Prior to approval, the Board obtained and reviewed a variety of information, including certain information regarding each Fund’s proposed expenses relative to the expenses of other comparable funds. At the Meetings, the Board, including the Independent Trustees, evaluated a number of factors and various materials in connection with the approval process, including: (1) a copy of the Investment Advisory Agreement; (2) the Advisor’s responses to questionnaires designed to provide the Board with information reasonably necessary to evaluate the terms of the Investment Advisory Agreement; (3) the Advisor’s Form ADV disclosures; (4) information describing the nature, quality and extent of services that the Advisor is prepared to provide to each Fund, the advisory fee payable by each Fund to the Advisor for the Advisor’s services; (5) certain comparative information regarding the Funds’ expenses relative to the expenses of other funds; (6) a copy of the Trust’s registration statement; and (7) information regarding the ownership and management structure, financial condition and compliance program of the Advisor. Representatives from the Advisor presented additional information and participated in question and answer sessions at the Meeting to help the Board evaluate the Advisor’s services, fees and other aspects of the Investment Advisory Agreement.
In considering the approval of the Investment Advisory Agreement, the Board considered various factors that its members determined were relevant, including: (i) the nature, extent and quality of the services to be provided by the Advisor, including where relevant the performance of the firm with respect to other, comparable funds; (ii) the fee to be paid to the Advisor by each Fund; and (iii) potential economies of scale.
● | Nature, Extent and Quality of Services to be Provided by the Advisor. The Board reviewed the scope of services to be provided by the Advisor under the Investment Advisory Agreement. In this regard, its members reviewed each Fund’s investment goal and proposed investment strategy, and each firm’s ability to implement such investment goal and/or investment strategy, including, but not limited to, trading practices. |
Based on its review, the Board determined that the Advisor was capable of providing all necessary advisory services required by the Funds, as indicated by the firm’s management capabilities, the professional qualifications and experience of its portfolio management personnel and the performance of comparable funds managed by the firm. The Board also considered other services provided to the Funds by the Advisor, such as selecting broker-dealers for executing portfolio transactions, monitoring adherence to each Fund’s investment restrictions, and monitoring compliance with various policies and procedures and with applicable securities regulations.
Based on the factors above, as well as those discussed below, the Board concluded, within the context of its full deliberations, that it was satisfied with the nature, extent and quality of the services provided and to be provided to the Funds by the Advisor.
● | Costs of Advisory Services to be Provided to the Funds. In considering the advisory fees payable by the Trust to the Advisor and each Fund’s expense ratio, the Board reviewed data compiled by the Advisor comparing the expense ratios of each Fund with the expense ratios of the ETFs in each Fund’s projected peer group. The Board compared each Fund’s expense ratio to the expense ratios of ETFs in its peer group, focusing on whether each Fund was charged fees that were within the range of fees charged by those in the peer group. It also noted that the Advisor had contractually agreed to pay all operating expenses of each Fund, including the cost of transfer agency, custody, fund administration, legal, audit and other services, except interest, taxes, brokerage commissions and other expenses in connection with the execution of portfolio transactions, and extraordinary and non-routine expenses. It was noted that this contractual agreement cannot be changed without shareholder approval. The Board also evaluated the compensation and benefits received (or proposed or likely to be received), by the Advisor from its relationship with the Funds, taking into account assessments of the Advisor’s profitability prepared and shared by the Advisor’s management. Based on the factors above, as well as those discussed below, the Board concluded, within the context of its full deliberations, that each Fund’s advisory fee was reasonable in light of the nature and quality of the services rendered and, where relevant, expected to be rendered by the Advisor. |
● | Economies of Scale. The Board also reviewed and considered the extent to which economies of scale would be realized by the Advisor as the assets of the Funds may grow in the future. |
Based on the Board’s deliberations and its evaluation of the information described above, the Board, including the Independent Trustees: (a) concluded that the terms of the Investment Advisory Agreement with respect to each Fund are fair and reasonable; (b) concluded that the Advisor’s fees are reasonable in light of the nature and quality of the services rendered and expected to be rendered by the Advisor to each Fund; and (c) agreed to approve the Investment Advisory Agreement as to each Fund for a term of two years. In its deliberations, the Board did not identify any particular factor (or conclusion with respect thereto) or single piece of information that was all-important, controlling or determinative of its decision, but considered all of the factors together, and each Trustee may have attributed different weights to the various factors (and conclusions with respect thereto) and information.
30
Pacer Funds
ADDITIONAL INFORMATION
(Unaudited) (Continued)
NOTE 6 – TRUSTEES AND OFFICERS
The business of the Funds is managed under the direction of the Board of Trustees. The Board of Trustees formulates the general policies of the Funds and meets periodically to review the Funds’ performance, monitor investment activities and practices, and discuss other matters affecting the Funds. The Trustees are fiduciaries for the Funds’ shareholders and are governed by the laws of the State of Delaware in this regard. The names and addresses of the Trustees and officers of the Trust are listed below along with a description of their principal occupations over at least the last five years. There are currently four Trustees, three of whom are not “interested persons” of the Trust within the meaning of that term under the 1940 Act (“Independent Trustee”).The Trustees, in turn, elect the officers of the Trust to actively supervise its day-to-day operations. The address of each Trustee and officer of the Trust, unless otherwise indicated below, is c/o Pacer Advisors, Inc., 500 Chesterfield Parkway, Malvern, PA 19335.The Funds’ Statement of Additional Information includes additional information about the Trustees and is available upon request by calling toll free (800) 617-0004.
Name and Year of Birth | Position(s)
Held with
the Trust | Term of Office
and Length of
Time Served | Principal Occupation(s)
During Past 5 Years | Number of
Portfolios in
Fund
Complex
Overseen
By Trustee | Other
Directorships
held by
Trustee During
Past Five Years |
Interested Trustee | | | | | |
Joe M. Thomson
Born: 1944 | Trustee , Chairman, President and Principal Executive Officer | Indefinite Term; since 2014 | Founder/President, Pacer Advisors, Inc. (since 2005); President and Chief Compliance Officer, Pacer Financial, Inc. (since 2004) | 28 | Director, First Cornerstone Bank (2000-2016) |
Independent Trustees | | | | | |
Deborah G. Wolk
Born: 1950 | Lead Independent Trustee | Indefinite Term; since 2015 | Self-employed providing accounting services and computer modeling (since 1997) | 28 | None |
Jonathan H. Newman, Sr.
Born: 1962 | Trustee | Indefinite Term; since 2015 | CEO and Chairman, Newman Wine & Spirits (since 2007) | 28 | None |
Dennis J. Ryan
Born: 1947 | Trustee | Indefinite Term; since 2017 | Principal/Owner, Brendan Abstract Company, Inc. (title insurance) (since 1999) | 28 | None |
Officers who are not Trustees: | | | | | |
Sean E. O’Hara
Born: 1962 | Treasurer and Principal Financial Officer | Indefinite Term; since 2014 | Director, Index Design Group (since 2015); Director, Pacer Financial, Inc. (since 2007); Director, Pacer Advisors, Inc. (since 2007) | N/A | None |
Bruce Kavanaugh
Born: 1964 | Secretary and Portfolio Manager | Indefinite Term; since 2016 | Vice President, Pacer Advisors, Inc. (since 2005), Vice President, Pacer Financial, Inc. (since 2004) | N/A | None |
Perpetua Seidenberg Gateway Corporate Center, Suite 216
223 Wilmington West Chester Pike Chadds Ford, PA 19317 Born: 1990 | Chief Compliance Officer and AML Officer | Indefinite Term; since 2018 | Compliance Director, Vigilant Compliance, LLC (an investment management services company) (since 2014); Auditor, PricewaterhouseCoopers (2012-2014) | N/A | None |
31
Pacer Funds
ADDITIONAL INFORMATION
(Unaudited) (Continued)
Mr. Thomson is an “Interested Person” by reason of his relationship with the Adviser.
Each Trustee shall serve during the lifetime of the Trust until he or she: (a) dies; (b) resigns; (c) has reached the mandatory retirement age, if any, as set by the Trustees; (d) is declared incompetent by a court of appropriate jurisdiction; or (e) is removed, or, if sooner, until the next meeting of shareholders called for the purpose of electing Trustees and until the election and qualification of his or her successor inaccordance with the Trust’s Declaration of Trust and By-laws. Each officer holds office at the pleasure of the Board and services for a period of one year, or until his or her successor is duly elected and qualified.
The Statement of Additional Information includes additional information, including compensation, about the Funds’ Trustees.
NOTE 7 – CHANGE IN INDEPENDENT REGISTERED PUBLIC ACCOUNTING FIRM
Cohen & Company, Ltd. was the principal accountant for USAI while the Fund was part of a different trust. On December 13, 2019, Sanville & Company was engaged as principal accountants for the Fund as a series of the Trust. During the periods ended November 30, 2018 and November 30, 2019, there were no: (1) disagreements with Cohen & Company, Ltd. on any matter of accounting principles or practices, financial statement disclosure or auditing scope or procedures, which disagreements if not resolved to their satisfaction would have caused them to make reference in connection with their opinion to the subject matter of the disagreements, or (2) reportable events. The audit reports of Cohen & Company, Ltd. on the financial statements of USAI as of and for the periods ended November 30, 2018 and November 30, 2019 did not contain any adverse opinion or disclaimer of opinion, nor were they qualified or modified as to uncertainty, audit scope or accounting principles.
Cohen & Company, Ltd. was previously the principal accountant for SLT and LSLT while the Funds were part of a different trust. On October 2, 2020, Sanville & Company was engaged as principal accountants. During the periods ended December 31, 2018 and December 31, 2019, there were no: (1) disagreements with Cohen & Company, Ltd. on any matter of accounting principles or practices, financial statement disclosure or auditing scope or procedures, which disagreements if not resolved to their satisfaction would have caused them to make reference in connection with their opinion to the subject matter of the disagreements, or (2) reportable events. The audit reports of Cohen & Company, Ltd. on the financial statements of SLT and LSLT as of and for the periods ended December 31, 2018 and December 31, 2019 did not contain any adverse opinion or disclaimer of opinion, nor were they qualified or modified as to uncertainty, audit scope or accounting principles.
32
(This Page Intentionally Left Blank.)
Advisor Pacer Advisors, Inc.
500 Chesterfield Parkway
Malvern, PA 19355 |
Index Provider SL Advisors, LLC
220 Lenox Avenue, Suite 303
Westfield, New Jersey 07090 Salt Financial Indices LLC
20 West 22nd Street, Suite 511
New York, New York 10010 |
Distributor Pacer Financial, Inc.
500 Chesterfield Parkway
Malvern, PA 19355 |
Custodian U.S. Bank National Association
1555 North Rivercenter Drive
Milwaukee, WI 53212 |
Transfer Agent U.S. Bancorp Fund Services, LLC
615 East Michigan Street
Milwaukee, WI 53202 |
Independent Registered
Public Accounting Firm Sanville & Company
1514 Old York Rd.
Abington, PA 19001 |
Legal Counsel Practus, LLP
137 Airdale Road
Bryn Mawr, PA 19010 |


Item 2. Code of Ethics.
The registrant has adopted a code of ethics that applies to the registrant’s principal executive officer and principal financial officer. The registrant has not made any substantive amendments to its code of ethics during the period covered by this report. The registrant has not granted any waivers from any provisions of the code of ethics during the period covered by this report.
A copy of the registrant’s Code of Ethics is filed herewith.
Item 3. Audit Committee Financial Expert.
The registrant’s board of trustees has determined that there is at least one audit committee financial expert serving on its audit committee. Deborah Wolk is the “audit committee financial expert” and is considered to be “independent” as each term is defined in Item 3 of Form N-CSR.
Item 4. Principal Accountant Fees and Services.
The registrant has engaged its principal accountant to perform audit services, audit-related services, tax services and other services during the past two fiscal years. “Audit services” refer to performing an audit of the registrant's annual financial statements or services that are normally provided by the accountant in connection with statutory and regulatory filings or engagements for those fiscal years. “Audit-related services” refer to the assurance and related services by the principal accountant that are reasonably related to the performance of the audit. “Tax services” refer to professional services rendered by the principal accountant for tax compliance, tax advice, and tax planning. No “Other services” were provided by the principal accountant were. The following table details the aggregate fees billed or expected to be billed for each of the last two fiscal years for audit fees, audit-related fees, tax fees and other fees by the principal accountant.
| | FYE 10/31/2020 | FYE 10/31/2019 |
| Audit Fees | $30,000 | N/A |
| Audit-Related Fees | $0 | N/A |
| Tax Fees | $3,800 | N/A |
| All Other Fees | $0 | N/A |
The audit committee has adopted pre-approval policies and procedures that require the audit committee to pre-approve all audit and non-audit services of the registrant, including services provided to any entity affiliated with the registrant.
The percentage of fees billed by Sanville & Company applicable to non-audit services pursuant to waiver of pre-approval requirement were as follows:
| | FYE 10/31/2020 | FYE 10/31/2019 |
| Audit-Related Fees | 0% | 0% |
| Tax Fees | 0% | 0% |
| All Other Fees | 0% | 0% |
All of the principal accountant’s hours spent on auditing the registrant’s financial statements were attributed to work performed by full-time permanent employees of the principal accountant. (If more than 50 percent of the accountant’s hours were spent to audit the registrant's financial statements for the most recent fiscal year, state how many hours were attributed to work performed by persons other than the principal accountant's full-time, permanent employees.)
The following table indicates the non-audit fees billed or expected to be billed by the registrant’s accountant for services to the registrant and to the registrant’s investment adviser (and any other controlling entity, etc.—not sub-adviser) for the last two years. The audit committee of the board of trustees/directors has considered whether the provision of non-audit services that were rendered to the registrant's investment adviser is compatible with maintaining the principal accountant's independence and has concluded that the provision of such non-audit services by the accountant has not compromised the accountant’s independence.
| Non-Audit Related Fees | FYE 10/31/2020 | FYE 10/31/2019 |
| Registrant | $0 | $0 |
| Registrant’s Investment Adviser | $0 | $0 |
Item 5. Audit Committee of Listed Registrants.
The registrant is an issuer as defined in Rule 10A-3 under the Securities Exchange Act of 1934, (the “Act”) and has a separately-designated standing audit committee established in accordance with Section 3(a)(58)(A) of the Act. The independent members of the committee are as follows: Jonathan Newman, Dennis Ryan and Deborah Wolk.
Item 6. Investments.
Schedule of Investments is included as part of the report to shareholders filed under Item 1 of this Form
Item 7. Disclosure of Proxy Voting Policies and Procedures for Closed-End Management Investment Companies.
Not applicable to open-end investment companies.
Item 8. Portfolio Managers of Closed-End Management Investment Companies.
Not applicable to open-end investment companies.
Item 9. Purchases of Equity Securities by Closed-End Management Investment Company and Affiliated Purchasers.
Not applicable to open-end investment companies.
Item 10. Submission of Matters to a Vote of Security Holders.
There have been no material changes to the procedures by which shareholders may recommend nominees to the registrant’s board of Trustees
Item 11. Controls and Procedures.
| (a) | The Registrant’s President/Principal Executive Officer and Treasurer/Principal Financial Officer have reviewed the Registrant's disclosure controls and procedures (as defined in Rule 30a-3(c) under the Investment Company Act of 1940 (the “Act”)) as of a date within 90 days of the filing of this report, as required by Rule 30a-3(b) under the Act and Rules 13a-15(b) or 15d-15(b) under the Securities Exchange Act of 1934. Based on their review, such officers have concluded that the disclosure controls and procedures are effective in ensuring that information required to be disclosed in this report is appropriately recorded, processed, summarized and reported and made known to them by others within the Registrant and by the Registrant’s service provider. |
| (b) | There were no changes in the Registrant's internal control over financial reporting (as defined in Rule 30a-3(d) under the Act) that occurred during the period covered by this report that have materially affected, or are reasonably likely to materially affect, the Registrant's internal control over financial reporting. |
Item 12. Disclosure of Securities Lending Activities for Closed-End Management Investment Companies.
Not applicable to open-end investment companies.
Item 13. Exhibits.
(2) A separate certification for each principal executive officer and principal financial officer pursuant to Section 302 of the Sarbanes-Oxley Act of 2002. Filed herewith.
(3) Any written solicitation to purchase securities under Rule 23c-1 under the Act sent or given during the period covered by the report by or on behalf of the registrant to 10 or more persons. Not applicable to open-end investment companies.
(4) Change in registrant’s independent public accountant. Filed herewith.
SIGNATURES
Pursuant to the requirements of the Securities Exchange Act of 1934 and the Investment Company Act of 1940, the registrant has duly caused this report to be signed on its behalf by the undersigned, thereunto duly authorized.
| (Registrant) | Pacer Funds Trust | |
| | | |
| By (Signature and Title | /s/ Joe Thomson | |
| | Joe M. Thomson, President (Principal Executive Officer) | |
| | | |
| Date | 1-5-2021 | |
Pursuant to the requirements of the Securities Exchange Act of 1934 and the Investment Company Act of 1940, this report has been signed below by the following persons on behalf of the registrant and in the capacities and on the dates indicated.
| By (Signature and Title)* | /s/ Joe Thomson | |
| | Joe M. Thomson, President (Principal Executive Officer) | |
| | | |
| Date | 1-5-2021 | |
| | | |
| By (Signature and Title)* | /s/ Sean O’Hara | |
| | Sean E. O’Hara, Treasurer (Principal Financial Officer) | |
| | | |
| Date | 1-5-2021 | |
| * | Print the name and title of each signing officer under his or her signature. |