As filed with the Securities and Exchange Commission on 11/08/2023
UNITED STATES
SECURITIES AND EXCHANGE COMMISSION
Washington, D.C. 20549
FORM N-CSR
CERTIFIED SHAREHOLDER REPORT OF REGISTERED
MANAGEMENT INVESTMENT COMPANIES
811-23011
Investment Company Act file number
The RBB FUND TRUST
(Exact name of registrant as specified in charter)
615 East Michigan Street
Milwaukee, WI 53202
(Address of principal executive offices) (Zip code)
Steven Plump, President
c/o U.S. Bank Global Fund Services
615 East Michigan Street
Milwaukee, WI 53202
(Name and address of agent for service)
(609) 731-6256
Registrant's telephone number, including area code
Date of fiscal year end: August 31
Date of reporting period: August 31, 2023
Item 1. Reports to Stockholders.

THE ENERGY & MINERALS GROUP EV, SOLAR & BATTERY MATERIALS
(LITHIUM, NICKEL, COPPER, COBALT) FUTURES STRATEGY ETF
A Series of
THE RBB FUND TRUST
Annual Report
August 31, 2023
| |
The Energy & Minerals Group EV, Solar & Battery Materials (Lithium, Nickel, Copper, |
|
Table of Contents |
Shareholder Letter | 1 |
Performance Data | 4 |
Fund Expense Example | 5 |
Consolidated Portfolio Holdings Summary Table | 7 |
Consolidated Portfolio of Investments | 8 |
Consolidated Financial Statements | 10 |
Notes to Consolidated Financial Statements | 14 |
Report of Independent Registered Public Accounting Firm | 25 |
Notice to Shareholders | 26 |
Trustees and Executive Officers | 28 |
Privacy Notice | 33 |
The Energy & Minerals Group EV, Solar & Battery Materials
(Lithium, Nickel, Copper, Cobalt) Futures Strategy ETF
Shareholder Letter
(Unaudited)
To the Shareholders of CHRG,
On behalf of The Energy & Minerals Group Advisors, LLC (“EMG Advisors”) team, we want to express our appreciation for the confidence you have placed in The Energy & Minerals Group EV, Solar & Battery Materials Futures Strategy ETF (the “Fund” or “CHRG”).
Performance
The Fund’s share price closed on August 31, 2023 at $19.11; year-to-date performance as of this day was -24.00%. Despite this near-term downward pressure on commodities broadly, we continue to believe that the global energy expansion that is underway will drive demand for the commodities necessary to shift from a fuel-intensive to a material-intensive energy system. This shift is maturing faster than anyone could have predicted, underpinned by an alignment of domestic politics, geopolitics, and technological innovation, on a scale that the world has never seen.
Our strategy is to provide investors with actively managed exposure to the commodities required for this global shift, currently Copper, Lithium, and Nickel. Leveraging our team’s decades worth of experience in the energy and mineral sector, we have summarized our key drivers of both positive and negative pressures on the future prices of the underlying metals in this letter, and communicate about these same themes daily via our LinkedIn and Twitter feeds, and weekly through a newsletter you can subscribe to at www.emgadvisors.com.
The table below represents the holdings of the Fund as of August 31, 2023.
Collateral | Security | Symbol | Value (USD) | Weight (%) |
— | UNITED STATES TREAS BILLS 12/28/2023 | — | 1,965,387 | 82.75% |
— | Cash & other | — | 409,648 | 17.25% |
Commodities | Security | Contracts | Value (USD) | Weight (%) |
Copper | COPPER FUTURE Mar24 | 17 | 1,633,700 | 63.73% |
Lithium | Lithium LiOH COME Oct23 | 2 | 65,400 | 2.55% |
Lithium | Lithium LiOH COME Nov23 | 2 | 75,000 | 2.93% |
Lithium | Lithium LiOH COME Dec23 | 2 | 75,000 | 2.93% |
Lithium | Lithium LiOH COME Jan24 | 2 | 77,580 | 3.03% |
Lithium | Lithium LiOH COME Feb24 | 2 | 77,580 | 3.03% |
Lithium | Lithium LiOH COME Mar24 | 5 | 193,950 | 7.57% |
Nickel | LME NICKEL FUTURE Sep23 | 2 | 241,356 | 9.42% |
Nickel | LME NICKEL FUTURE Mar24 | 1 | 123,726 | 4.83% |
1 |
The Energy & Minerals Group EV, Solar & Battery Materials
(Lithium, Nickel, Copper, Cobalt) Futures Strategy ETF
Shareholder Letter (Continued)
(Unaudited)
Allocations
The Portfolio Managers increased the Fund’s Copper exposure at the beginning of April 2023, lowering exposure to Lithium, Nickel, and Cobalt; Copper futures outperformed most other “green energy metals” futures contracts to the downside. Cobalt was removed from the portfolio on June 1. Lithium exposure was increased to 25% as of July 1. The table below represents the Fund’s target exposures month-to-month.
Commodity | Jan | Feb | Mar | Apr | May | Jun | Jul | Aug |
Cobalt | 3.8% | 3.8% | 1.5% | 1.5% | 1.5% | — | — | — |
Copper | 52.4% | 52.4% | 52.4% | 75.8% | 75.8% | 75.8% | 70.0% | 70.0% |
Lithium | 28.5% | 28.5% | 11.8% | 11.8% | 11.8% | 11.8% | 25.0% | 25.0% |
Nickel | 15.3% | 15.3% | 10.3% | 10.3% | 10.3% | 10.3% | 5.0% | 5.0% |
Markets
There has been increased volatility across commodity markets (metals, oil, agriculture, etc.); low global inventories of industrial and base metals are lending price support, while uncertainty in demand is resulting in downward pressure. There is a lack of conviction in China’s post-pandemic recovery, against a backdrop of a global economic slowdown that’s been intensified amid high inflation and ongoing interest rate hikes. We continue to believe that these pressures are near-term, and that the future supply / demand imbalance is not yet priced into the green energy metals.
We believe that the global energy expansion, transition, shift, or whatever you want to call it, is happening. Over $4 trillion dollars has been committed to be spent through 2030 to enable this shift. This commitment dwarfs many of the greatest infrastructure projects in human history combined. For example, the nearly 50,000 mile US Interstate Highway System, known as one of America’s greatest investments, took 35 years and over $530 billion (in today’s dollars) to complete. The capital committed to global green energy initiatives is nearly 8x that and is expected to be spent within one decade, not three.
2 |
The Energy & Minerals Group EV, Solar & Battery Materials
(Lithium, Nickel, Copper, Cobalt) Futures Strategy ETF
Shareholder Letter (Concluded)
(Unaudited)
We expect that this high velocity of investment will drive demand for the commodities necessary to facilitate the shift from a fuel-intensive to a material-intensive energy system. Our strategy is to invest in the commodities that we believe are required for this long-term shift, leveraging our team’s 70+ years of combined domain experience to actively manage the Fund’s exposures to the underlying metals required as technology develops and this shift breaks out of its infancy.
CHRG!
Thank you,

Will McDonough
Founder, CEO & Portfolio Manager
The Energy & Minerals Group Advisors, LLC
The views expressed herein reflect the opinion of EMG Advisors as of the date of this report and are subject to change based on changes in the market, economic, or other conditions. These views are not intended to be a forecast of future events and are no guarantee of future results. Fund holdings and allocations are subject to change at any time.
There is significant risk in trading commodity interests. Investors may experience substantial loss of investment with commodity interest products.
3 |
The Energy & Minerals Group EV, Solar & Battery Materials
(Lithium, Nickel, Copper, Cobalt) Futures Strategy ETF
Performance Data
(Unaudited)
AVERAGE ANNUAL TOTAL RETURNS FOR THE PERIOD ENDED August 31, 2023 | |
Since | |
The Energy & Minerals Group EV, Solar & Battery Materials (Lithium, Nickel, Copper, Cobalt) Futures Strategy ETF (at NAV) | -24.00%(1) |
The Energy & Minerals Group EV, Solar & Battery Materials (Lithium, Nickel, Copper, Cobalt) Futures Strategy ETF (at Market Price) | -23.54%(1) |
S&P 500® Total Return Index | 19.15%(2) |
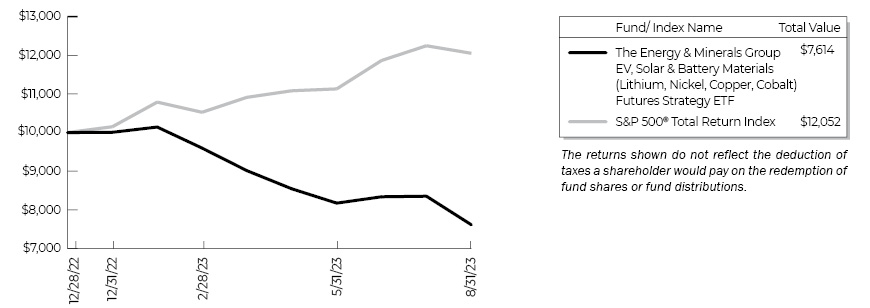
The performance data quoted represents past performance and does not guarantee future results. Current performance may be lower or higher. The investment return and principal value of an investment will fluctuate so that shares, when redeemed or sold, may be worth more or less than their original cost.
(1) | The Energy & Minerals Group EV,Solar & Battery Materials (Lithium, Nickel, Copper, Cobalt Futures Strategy ETF (the “Fund”) commenced operations on December 29, 2022. |
(2) | Benchmark performance is from the inception date of the Fund only and is not the inception date of the benchmark itself. |
The S&P 500® Total Return Index is the total return version of the S&P 500® Index. Dividends are reinvested on a daily basis and all regular cash dividends are assumed reinvested in the index on the ex-dividend date.
4 |
The Energy & Minerals Group EV, Solar & Battery Materials
(Lithium, Nickel, Copper, Cobalt) Futures Strategy ETF
Fund Expense Example
August 31, 2023 (Unaudited)
As a shareholder of the Fund, you incur two types of costs: (1) transaction costs and (2) ongoing costs, including management fees, and other Fund expenses. This example is intended to help you understand your ongoing costs (in dollars) of investing in the Fund and to compare these costs with the ongoing costs of investing in other mutual funds.
This example is based on an investment of $1,000 invested at the beginning of the six-month period from March 1, 2023 through August 31, 2023, and held for the entire period.
Actual Expenses
The first line of the accompanying table provides information about actual account values and actual expenses. You may use the information in this line, together with the amount you invested, to estimate the expenses that you paid over the period. Simply divide your account value by $1,000 (for example, an $8,600 account value divided by $1,000 = 8.6), then multiply the result by the number in the first line under the heading entitled “Expenses Paid During Period” to estimate the expenses you paid on your account during this period.
Hypothetical Example for Comparison Purposes
The second line of the accompanying table provides information about hypothetical account values and hypothetical expenses based on the Fund’s actual expense ratio and an assumed rate of return of 5% per year before expenses, which is not the Fund’s actual return. The hypothetical account values and expenses may not be used to estimate the actual ending account balance or expenses you paid for the period. You may use this information to compare the ongoing costs of investing in the Fund and other funds. To do so, compare this 5% hypothetical example with the 5% hypothetical examples that appear in the shareholder reports of other funds.
Please note that the expenses shown in the accompanying table are meant to highlight your ongoing costs only and do not reflect any transactional costs. Therefore, the second line of the accompanying table is useful in comparing ongoing costs only, and will not help you determine the relative total costs of owning different funds. In addition, if these transactional costs were included, your costs would have been higher.
5 |
The Energy & Minerals Group EV, Solar & Battery Materials
(Lithium, Nickel, Copper, Cobalt) Futures Strategy ETF
Fund Expense Example (concluded)
August 31, 2023 (Unaudited)
| Beginning | Ending | Expenses | Annualized | Actual Six Months |
The Energy & Minerals Group EV, Solar & Battery Materials (Lithium, Nickel, Copper, Cobalt) Futures Strategy ETF | |||||
Actual | $ 1,000.00 | $ 793.30 | $ 4.29 | 0.95% | -20.67% |
Hypothetical (5% return before expenses) | 1,000.00 | 1,020.42 | 4.84 | 0.95 | N/A |
* | Expenses are equal to the Fund’s annualized six-month expense ratio for the period March 1, 2023 to August 31, 2023, multiplied by the average account value over the period, multiplied by the number of days (184) in the most recent fiscal half-year, then divided by 365 to reflect the one half-year period. The Fund’s ending account values on the first line in the table is based on the actual six-month total investment return for the Fund. |
6 |
The Energy & Minerals Group EV, Solar & Battery Materials
(Lithium, Nickel, Copper, Cobalt) Futures Strategy ETF
Consolidated Portfolio Holdings Summary Table
(Unaudited)
The following table presents a consolidated summary of the portfolio holdings of the Fund:
| % OF Net | VALUE | ||||||
SHORT-TERM INVESTMENTS: | ||||||||
U.S. Treasury Obligations | 82.8 | % | $ | 1,965,387 | ||||
Money Market Deposit Account | 5.5 | 131,189 | ||||||
OTHER ASSETS IN EXCESS OF LIABILITIES (including futures contracts) | 11.7 | 278,459 | ||||||
NET ASSETS | 100.0 | % | $ | 2,375,035 | ||||
The Fund seeks to achieve its investment objective by concentrating its investments in a combination of financial instruments that are economically linked to elements necessary for the production of batteries and battery energy storage systems (“BESS”) used in the electric vehicle and solar industries.
As a result of the Fund’s use of derivatives, the Fund may hold significant amounts of U.S. Treasuries or short-term investments.
Portfolio holdings are subject to change at any time.
Refer to the Consolidated Portfolio of Investments for a detailed listing of the Fund’s holdings.
7 |
The Energy & Minerals Group EV, Solar & Battery Materials
(Lithium, Nickel, Copper, Cobalt) Futures Strategy ETF
Consolidated Portfolio of Investments
August 31, 2023
| COUPON* | MATURITY | PAR | VALUE | ||||||||||||
SHORT-TERM INVESTMENTS — 88.3% | ||||||||||||||||
U.S. TREASURY OBLIGATIONS — 82.8% | ||||||||||||||||
United States Treasury Bill | 3.553 | % | 12/28/23 | $ | 2,000 | $ | 1,965,387 | |||||||||
TOTAL U.S. TREASURY OBLIGATIONS | ||||||||||||||||
(Cost $1,965,485) | 1,965,387 | |||||||||||||||
| NUMBER OF |
| ||||||
MONEY MARKET DEPOSIT ACCOUNT — 5.5% | ||||||||
U.S. Bank Money Market Deposit Account, 5.20%(a) | 131 | 131,189 | ||||||
TOTAL MONEY MARKET DEPOSIT ACCOUNT | ||||||||
(Cost $131,189) | 131,189 | |||||||
TOTAL SHORT-TERM INVESTMENTS | ||||||||
(Cost $2,096,674) | 2,096,576 | |||||||
TOTAL INVESTMENTS — 88.3% | ||||||||
(Cost $2,096,674) | 2,096,576 | |||||||
OTHER ASSETS IN EXCESS OF LIABILITIES — 11.7% | 278,459 | |||||||
NET ASSETS — 100.0% | $ | 2,375,035 | ||||||
* | Short-term investments’ coupon reflects the annualized yield on the date of purchase for discounted investments. |
(a) | The rate shown is as of August 31, 2023. |
The accompanying notes are an integral part of these financial statements.
8 |
The Energy & Minerals Group EV, Solar & Battery Materials
(Lithium, Nickel, Copper, Cobalt) Futures Strategy ETF
CONSOLIDATED PORTFOLIO OF INVESTMENTS IN FUTURES
COnTRACTS
August 31, 2023
Futures contracts outstanding as of August 31, 2023 were as follows:
LONG CONTRACTS(1) | EXPIRATION | NUMBER OF | NOTIONAL | VALUE AND | ||||||||||||
Copper | Mar-24 | 17 | $ | 1,633,700 | $ | 13,578 | ||||||||||
Lithium Hydroxide Monohydrate | Oct-23 | 2 | 65,400 | (50,605 | ) | |||||||||||
Lithium Hydroxide Monohydrate | Nov-23 | 2 | 75,000 | (41,005 | ) | |||||||||||
Lithium Hydroxide Monohydrate | Dec-23 | 2 | 75,000 | (41,005 | ) | |||||||||||
Lithium Hydroxide Monohydrate | Jan-24 | 2 | 77,580 | (1,436 | ) | |||||||||||
Lithium Hydroxide Monohydrate | Feb-24 | 2 | 77,580 | (1,436 | ) | |||||||||||
Lithium Hydroxide Monohydrate | Mar-24 | 5 | 193,950 | (35,090 | ) | |||||||||||
London Metals Exchange Nickel | Sep-23 | 2 | 241,356 | (49,107 | ) | |||||||||||
London Metals Exchange Nickel | Mar-24 | 1 | 123,726 | (45 | ) | |||||||||||
| $ | (206,151 | ) | ||||||||||||||
SHORT CONTRACTS(1) | EXPIRATION | NUMBER OF | NOTIONAL | VALUE AND | ||||||||||||
London Metals Exchange Nickel | Sep-23 | 2 | $ | (241,356 | ) | $ | 2,304 | |||||||||
| $ | 2,304 | |||||||||||||||
Total Futures Contracts | $ | (203,847 | ) | |||||||||||||
(1) | All futures contracts are held by The Energy & Minerals Group EV & Solar Battery Materials Futures Cayman Fund, Ltd., a wholly-owned subsidiary of the Fund. |
The accompanying notes are an integral part of these financial statements.
9 |
The Energy & Minerals Group EV, Solar & Battery Materials
(Lithium, Nickel, Copper, Cobalt) Futures Strategy ETF
CONSOLIDATED Statement of Assets and Liabilities
August 31, 2023
ASSETS | ||||
Short-term investments in securities, at value (cost $2,096,674) | $ | 2,096,576 | ||
Deposits with brokers for futures contracts | 420,727 | |||
Cash and cash equivalents | 62,719 | |||
Unrealized appreciation on futures contracts | 15,882 | |||
Interest receivable | 826 | |||
Total assets | 2,596,730 | |||
LIABILITIES | ||||
Unrealized depreciation on futures contracts | 219,729 | |||
Payables for: | ||||
Advisory fees | 1,966 | |||
Total liabilities | 221,695 | |||
Net assets | $ | 2,375,035 | ||
NET ASSETS CONSIST OF: | ||||
Paid-in capital | $ | 2,355,601 | ||
Total distributable earnings/(losses) | 19,434 | |||
Net assets | $ | 2,375,035 | ||
Shares issued and outstanding (unlimited number of shares authorized without par value) | 125,000 | |||
Net asset value and redemption price per share | $ | 19.00 |
The accompanying notes are an integral part of these financial statements.
10 |
The Energy & Minerals Group EV, Solar & Battery Materials
(Lithium, Nickel, Copper, Cobalt) Futures Strategy ETF
CONSOLIDATED Statement of Operations
FOR THE Period ENDED August 31, 2023(1)
INVESTMENT INCOME | ||||
Interest | $ | 83,984 | ||
Total investment income | 83,984 | |||
EXPENSES | ||||
Advisory fees (Note 2) | 19,603 | |||
Total expenses | 19,603 | |||
Net investment income/(loss) | 64,381 | |||
NET REALIZED AND UNREALIZED GAIN/(LOSS) FROM INVESTMENTS | ||||
Net realized gain/(loss) from: | ||||
Investments | (340 | ) | ||
Futures contracts | (599,215 | ) | ||
Net change in unrealized appreciation/(depreciation) from: | ||||
Investments | (98 | ) | ||
Futures contracts | (203,847 | ) | ||
Net realized and unrealized gain/(loss) from investments | (803,500 | ) | ||
NET INCREASE/(DECREASE) IN NET ASSETS RESULTING FROM OPERATIONS | $ | (739,119 | ) |
(1) | Inception date of the Fund was December 29, 2022. |
The accompanying notes are an integral part of these financial statements.
11 |
The Energy & Minerals Group EV, Solar & Battery Materials
(Lithium, Nickel, Copper, Cobalt) Futures Strategy ETF
CONSOLIDATED Statement of Changes in Net Assets
| For the | |||
INCREASE/(DECREASE) IN NET ASSETS FROM OPERATIONS: | ||||
Net investment income/(loss) | $ | 64,381 | ||
Net realized gain/(loss) from investments and futures contracts | (599,555 | ) | ||
Net change in unrealized appreciation/(depreciation) from investments and futures contracts | (203,945 | ) | ||
Net increase/(decrease) in net assets resulting from operations | (739,119 | ) | ||
CAPITAL SHARE TRANSACTIONS: | ||||
Proceeds from shares sold | 5,626,324 | |||
Shares redeemed | (2,512,170 | ) | ||
Net increase/(decrease) in net assets from capital share transactions | 3,114,154 | |||
Total increase/(decrease) in net assets | 2,375,035 | |||
NET ASSETS: | ||||
Beginning of period | — | |||
End of period | $ | 2,375,035 | ||
SHARE TRANSACTIONS: | ||||
Shares sold | 225,000 | |||
Shares redeemed | (100,000 | ) | ||
Net increase/(decrease) in shares outstanding | 125,000 | |||
(1) | Inception date of the Fund was December 29, 2022. |
The accompanying notes are an integral part of these financial statements.
12 |
The Energy & Minerals Group EV, Solar & Battery Materials
(Lithium, Nickel, Copper, Cobalt) Futures Strategy ETF
CONSOLIDATED Financial Highlights
Contained below is per share operating performance data for shares outstanding, total investment return/(loss), ratios to average net assets and other supplemental data for the period. This information has been derived from information provided in the financial statements.
| PERIOD | ||||
PER SHARE OPERATING PERFORMANCE | |||||
Net asset value, beginning of period | $ | 25.00 | |||
Net investment income/(loss)(2) | 0.47 | ||||
Net realized and unrealized gain/(loss) from investments and futures contracts | (6.47 | ) | |||
Net increase/(decrease) in net assets resulting from operations | (6.00 | ) | |||
Net asset value, end of period | $ | 19.00 | |||
Market value, end of period | $ | 19.11 | |||
Total investment return/(loss) on net asset value(3) | (24.00 | )%(5) | |||
Total investment return/(loss) on market price(4) | (23.54 | )%(5) | |||
RATIOS/SUPPLEMENTAL DATA | |||||
Net assets, end of period (000’s omitted) | $ | 2,375 | |||
Ratio of expenses to average net assets | 0.95 | %(6) | |||
Ratio of net investment income/(loss) to average net assets | 3.12 | %(6) | |||
Portfolio turnover rate | 0 | %(5) | |||
(1) | Inception date of the Fund was December 29, 2022. |
(2) | Per share data calculated using average shares outstanding method. |
(3) | Total investment return/(loss) on net asset value is calculated assuming a purchase of shares on the first day and a sale of shares on the last day of each period reported and includes reinvestments of dividends and distributions, if any. |
(4) | Total investment return/(loss) on market price is calculated assuming an initial investment made at the market price on the first day of the period, reinvestment of dividends and distributions at market price during the period and redemption at market price on the last day of the period. |
(5) | Not annualized. |
(6) | Annualized. |
The accompanying notes are an integral part of these financial statements.
13 |
The Energy & Minerals Group EV, Solar & Battery Materials
(Lithium, Nickel, Copper, Cobalt) Futures Strategy ETF
Notes to Consolidated Financial Statements
August 31, 2023
1. Organization And Significant Accounting Policies
The RBB Fund Trust, (the “Trust”) was organized as a Delaware statutory trust on August 29, 2014, and is registered under the Investment Company Act of 1940 as amended (the “1940 Act”), as an open-end management investment company. The Trust is a “series fund,” which is a mutual fund complex divided into separate portfolios. Each portfolio is treated as a separate entity for certain matters under the 1940 Act, and for other purposes, and a shareholder of one portfolio is not deemed to be a shareholder of any other portfolio. Currently, the Trust has eight separate investment portfolios, including The Energy & Minerals Group EV, Solar & Battery Materials (Lithium, Nickel, Copper, Cobalt) Futures Strategy ETF (the “Fund”), which commenced investment operations on December 29, 2022.
The Fund seeks long-term capital appreciation. The Fund seeks to achieve its investment objective by concentrating its investments in a combination of financial instruments that are economically linked to elements necessary for the production of batteries and battery energy storage systems (“BESS”) used in the electric vehicle and solar industries. Such elements are currently lithium, nickel, copper and cobalt. The Fund may also invest in financial instruments that are economically linked to manganese or graphite.
The Fund is an investment company and follows accounting and reporting guidance in the Financial Accounting Standards Board (“FASB”) Accounting Standards Codification Topic 946 “Financial Services - Investment Companies.”
The end of the reporting period for the Fund is August 31, 2023, and the period covered by these Notes to Consolidated Financial Statements is the since inception period from December 29, 2022 through August 31, 2023 (the “current fiscal period”).
CONSOLIDATION OF SUBSIDIARY — The Fund invests up to 25% of its total assets in The Energy & Minerals Group EV & Solar Battery Materials Futures Cayman Fund, Ltd., a wholly-owned subsidiary of the Fund (the “Subsidiary”), organized under the laws of the Cayman Islands. The consolidated financial statements of the Fund include the financial statements of the Subsidiary. The Fund consolidates the results of subsidiaries in which the Fund holds a controlling financial interest. All inter-company accounts and transactions have been eliminated. As of the end of the reporting period, the net assets of the Subsidiary were $279,599, which represented 11.77% of the Fund’s net assets.
PORTFOLIO VALUATION — The Fund’s net asset value (“NAV”) is calculated once daily at the close of regular trading hours on the New York Stock Exchange (“NYSE”) (generally 4:00 p.m. Eastern time) on each day the NYSE is open. Securities held by the Fund are valued using the closing price or the last sales price on a national securities exchange or the National Association of Securities Dealers Automatic Quotation System (“NASDAQ”) market system where they are primarily traded. Fixed income securities are valued using an independent pricing service, which considers such factors as security prices, yields, maturities and ratings, and are deemed representative of market values at the close of the market. Investments in other open-end investment companies are valued based on the NAV of those investment companies (which may use fair value pricing as discussed in their prospectuses). Forward currency exchange contracts are valued by interpolating between spot and forward currency rates as quoted by an independent pricing service. Futures contracts are generally valued using the settlement price determined by the relevant exchange. If market quotations are unavailable or deemed unreliable, securities will be valued by the Valuation Designee (as defined below) in accordance with procedures adopted by the Trust’s Board of Trustees (the “Board”). Relying on prices supplied by pricing services or dealers or using fair valuation may result in values that are higher or lower than the values used by other investment companies and investors to price the same investments.
14 |
The Energy & Minerals Group EV, Solar & Battery Materials
(Lithium, Nickel, Copper, Cobalt) Futures Strategy ETF
Notes to CONSOLIDATED Financial Statements (continued)
August 31, 2023
The Board has adopted a pricing and valuation policy for use by the Fund and its Valuation Designee (as defined below) in calculating the Fund’s NAV. Pursuant to Rule 2a-5 under the 1940 Act, the Fund has designated The Energy & Minerals Group Advisors, LLC (the “Adviser”) as its “Valuation Designee” to perform all of the fair value determinations as well as to perform all of the responsibilities that may be performed by the Valuation Designee in accordance with Rule 2a-5. The Valuation Designee is authorized to make all necessary determinations of the fair values of portfolio securities and other assets for which market quotations are not readily available or if it is deemed that the prices obtained from brokers and dealers or independent pricing services are unreliable.
FAIR VALUE MEASUREMENTS — The inputs and valuation techniques used to measure the fair value of the Fund’s investments are summarized into three levels as described in the hierarchy below:
● Level 1 – Prices are determined using quoted prices in active markets for identical securities.
● Level 2 – Prices are determined using other significant observable inputs (including quoted prices for similar securities, interest rates, prepayment speeds, credit risk, etc.).
● Level 3 – Prices are determined using significant unobservable inputs (including the Fund’s own assumptions in determining the fair value of investments).
The inputs or methodologies used for valuing securities are not necessarily an indication of the risk associated with investing in those securities.
The following is a summary of the inputs used, as of the end of the reporting period, in valuing the Fund’s investments carried at fair value:
| TOTAL | LEVEL 1 | LEVEL 2 | LEVEL 3 | ||||||||||||
Short-Term Investments | $ | 2,096,576 | $ | 131,189 | $ | 1,965,387 | $ | — | ||||||||
Commodity Futures Contracts | 15,882 | 15,882 | — | — | ||||||||||||
Total Assets | $ | 2,112,458 | $ | 147,071 | $ | 1,965,387 | $ | — | ||||||||
| TOTAL | LEVEL 1 | LEVEL 2 | LEVEL 3 | ||||||||||||
Commodity Futures Contracts | $ | (219,729 | ) | $ | (219,729 | ) | $ | — | $ | — | ||||||
Total Liabilities | $ | (219,729 | ) | $ | (219,729 | ) | $ | — | $ | — | ||||||
At the end of each quarter, management evaluates the classification of Levels 1, 2 and 3 assets and liabilities. Various factors are considered, such as changes in liquidity from the prior reporting period; whether or not a broker is willing to execute at the quoted price; the depth and consistency of prices from third party pricing services; and the existence of contemporaneous, observable trades in the market. Additionally, management evaluates the classification of Levels 1, 2 and 3 assets and liabilities on a quarterly basis for changes in listings or delistings on national exchanges.
Due to the inherent uncertainty of determining the fair value of investments that do not have a readily available market value, the fair value of the Fund’s investments may fluctuate from period to period. Additionally, the fair value of investments may differ significantly from the values that would
15 |
The Energy & Minerals Group EV, Solar & Battery Materials
(Lithium, Nickel, Copper, Cobalt) Futures Strategy ETF
Notes to CONSOLIDATED Financial Statements (continued)
August 31, 2023
have been used had a ready market existed for such investments and may differ materially from the values the Fund may ultimately realize. Further, such investments may be subject to legal and other restrictions on resale or otherwise less liquid than publicly traded securities.
For fair valuations using significant unobservable inputs, U.S. generally accepted accounting principles (“U.S. GAAP”) requires the Fund to present a reconciliation of the beginning to ending balances for reported market values that presents changes attributable to total realized and unrealized gains or losses, purchase and sales, and transfers in and out of Level 3 during the period. Transfers in and out between levels are based on values at the end of the period. A reconciliation of Level 3 investments is presented only when the Fund had an amount of Level 3 investments at the end of the reporting period that was meaningful in relation to its net assets. The amounts and reasons for Level 3 transfers are disclosed if the Fund had an amount of total transfers during the reporting period that was meaningful in relation to its net assets as of the end of the reporting period.
During the current fiscal period, the Fund had no Level 3 transfers.
DISCLOSURES ABOUT DERIVATIVE INSTRUMENTS AND HEDGING ACTIVITIES
Derivative instruments are defined as financial instruments whose value and performance are based on the value and performance of another security or financial instrument. Derivative instruments that the Fund used during the period include futures contracts.
During the current fiscal period, the Fund used long and short contracts on commodities (through investment in the Subsidiary) to gain investment exposure in accordance with its investment objective.
The following tables provide quantitative disclosures about fair value amounts of, and gains and losses on, the Fund’s derivative instruments as of and for the current fiscal period.
The following tables list the fair values and location on the Consolidated Statement of Assets and Liabilities of the Fund’s derivative holdings as of the end of the reporting period, grouped by derivative type and primary risk exposure category by contract type.
DERIVATIVE TYPE | CONSOLIDATED | COMMODITY | TOTAL | |||||||||
Asset Derivatives | ||||||||||||
Futures Contracts (a) | Unrealized appreciation on futures contracts | $ | 15,882 | $ | 15,882 | |||||||
Total Value - Assets | $ | 15,882 | $ | 15,882 | ||||||||
Liability Derivatives | ||||||||||||
Futures Contracts (a) | Unrealized depreciation on futures contracts | $ | (219,729 | ) | $ | (219,729 | ) | |||||
Total Value - Liabilities | $ | (219,729 | ) | $ | (219,729 | ) | ||||||
(a) | This amount represents the cumulative appreciation/(depreciation) of futures contracts as reported in the Consolidated Portfolio of Investments. |
16 |
The Energy & Minerals Group EV, Solar & Battery Materials
(Lithium, Nickel, Copper, Cobalt) Futures Strategy ETF
Notes to CONSOLIDATED Financial Statements (continued)
August 31, 2023
The following table lists the amounts of net realized gains/(losses) included in net increase/(decrease) in net assets resulting from operations during the current fiscal period, grouped by derivative type and primary risk exposure category by contract type.
DERIVATIVE TYPE | CONSOLIDATED | COMMODITY | TOTAL | |||||||||
Realized Gain/(Loss) | ||||||||||||
Futures Contracts | Net realized gain/(loss) from futures contracts | $ | (599,215 | ) | $ | (599,215 | ) | |||||
Total Realized Gain/(Loss) | $ | (599,215 | ) | $ | (599,215 | ) | ||||||
The following table lists the amounts of net change in unrealized appreciation/(depreciation) included in net increase/(decrease) in net assets resulting from operations during the current fiscal period, grouped by derivative type and primary risk exposure category by contract type.
DERIVATIVE TYPE | CONSOLIDATED | COMMODITY | TOTAL | |||||||||
Change in Unrealized Appreciation/(Depreciation) | ||||||||||||
Futures Contracts | Net change in unrealized appreciation/(depreciation) on futures contracts | $ | (203,847 | ) | $ | (203,847 | ) | |||||
Total Change in Unrealized Appreciation/(Depreciation) | $ | (203,847 | ) | $ | (203,847 | ) | ||||||
During the current fiscal period, the Fund’s quarterly average volume of derivatives was as follows:
LONG FUTURES | SHORT FUTURES | ||||||
| $ | 2,836,360 | $ | (229,126 | ) | |||
FUTURES CONTRACTS — The Fund uses futures contracts in the normal course of pursuing its investment objective. Upon entering into a futures contract, the Fund must deposit initial margin in addition to segregating cash or liquid assets sufficient to meet its obligation to purchase or provide securities, or to pay the amount owed at the expiration of an index-based futures contract. Such liquid assets may consist of cash, cash equivalents, liquid debt or equity securities or other acceptable assets. Pursuant to the futures contract, the Fund agrees to receive from, or pay to the broker, an amount of cash equal to the daily fluctuation in value of the contract. Such a receipt of payment is known as “variation margin” and is recorded by the Fund as an unrealized gain or loss. When the contract is closed, the Fund records a realized gain or loss equal to the difference between the proceeds from (or
17 |
The Energy & Minerals Group EV, Solar & Battery Materials
(Lithium, Nickel, Copper, Cobalt) Futures Strategy ETF
Notes to CONSOLIDATED Financial Statements (continued)
August 31, 2023
cost of) the closing transactions and the Fund’s basis in the contract. Futures contracts have market risks, including the risk that the change in the value of the contract may not correlate with changes in the value of the underlying securities. Use of long futures contracts subjects the Fund to risk of loss in excess of the amount shown on the Consolidated Statement of Assets and Liabilities, up to the notional value of the futures contract. Use of short futures contracts subjects the Fund to unlimited risk of loss.
USE OF ESTIMATES — The preparation of consolidated financial statements in conformity with U.S. GAAP requires management to make estimates and assumptions that affect the reported amounts of assets and liabilities and disclosure of contingent assets and liabilities at the date of the consolidated financial statements and the reported amounts of revenues and expenses during the reporting period. Actual results could differ from those estimates and those differences could be significant.
INVESTMENT TRANSACTIONS, INVESTMENT INCOME AND EXPENSES — The Fund records security transactions based on trade date for financial reporting purposes. The cost of investments sold is determined by use of the specific identification method for both financial reporting and income tax purposes in determining realized gains and losses on investments. Interest income (including amortization of premiums and accretion of discounts) is accrued when earned. Dividend income is recorded on the ex-dividend date. Distributions received on securities that represent a return of capital or capital gain are recorded as a reduction of cost of investments and/or as a realized gain. The Fund’s investment income, expenses (other than class specific expenses) and unrealized and realized gains and losses are allocated daily to each class of shares based upon the relative proportion of net assets of each class at the beginning of the day. Certain expenses are shared with The RBB Fund, Inc. (“RBB”), a series trust of affiliated funds. Expenses incurred on behalf of a specific class, fund or fund family of the Trust or RBB, are charged directly to the class, fund or fund family (in proportion to net assets). Expenses incurred for all funds (such as director or professional fees) are charged to all funds in proportion to their average net assets of the Trust and RBB, or in such other manner as the Board deems fair or equitable. Expenses and fees, including investment advisory and administration fees, are accrued daily and taken into account for the purpose of determining the NAV of the Fund.
DIVIDENDS AND DISTRIBUTIONS TO SHAREHOLDERS — Dividends from net investment income and distributions from net realized capital gains, if any, are declared and paid at least annually to shareholders and recorded on the ex-dividend date. Income dividends and capital gain distributions are determined in accordance with U.S. federal income tax regulations, which may differ from U.S. GAAP.
U.S. TAX STATUS — No provision is made for U.S. income taxes as it is the Fund’s intention to continue to qualify for and elect the tax treatment applicable to regulated investment companies under Subchapter M of the Internal Revenue Code of 1986, as amended, and make the requisite distributions to its shareholders which will be sufficient to relieve it from U.S. income and excise taxes.
For tax purposes, the Subsidiary is an exempted Cayman Islands investment company. The Subsidiary has received an undertaking from the Government of the Cayman Islands exempting it from all local income, profits and capital gains taxes. No such taxes are levied in the Cayman Islands at the present time. For U.S. income tax purposes, the Subsidiary is a Controlled Foreign Corporation and as such is not subject to U.S. income tax.
SEC RULE 18f-4 — Effective August 19, 2022, the Securities and Exchange Commission (the “SEC”) implemented Rule 18f-4 under the 1940 Act (“Rule 18f-4”), providing for the regulation of a registered investment company’s use of derivatives and certain related instruments. Among other things, Rule 18f-4 limits a fund’s derivatives exposure through a value-at-risk test and requires the adoption and implementation of a derivatives risk management program for certain derivatives users. The Fund, as a
18 |
The Energy & Minerals Group EV, Solar & Battery Materials
(Lithium, Nickel, Copper, Cobalt) Futures Strategy ETF
Notes to CONSOLIDATED Financial Statements (continued)
August 31, 2023
full derivatives user (as defined in Rule 18f-4), is subject to the full requirements of Rule 18f-4. The Fund is required to comply with Rule 18f-4 and has adopted procedures for investing in derivatives and other transactions in compliance with Rule 18f-4.
COMMODITY SECTOR RISK — Exposure to the commodities markets may subject the Fund to greater volatility than investments in traditional securities. The value of commodity-linked derivative instruments may be affected by changes in overall market movements, commodity index volatility, changes in interest rates or factors affecting a particular industry or commodity, such as drought, floods, weather, livestock disease, embargoes, tariffs and international economic, political and regulatory developments. The prices of energy, industrial metals, precious metals, agriculture and livestock sector commodities may fluctuate widely due to factors such as changes in value, supply and demand and governmental regulatory policies. The commodity-linked securities in which the Fund invests may be issued by companies in the financial services sector, and events affecting the financial services sector may cause the Fund’s share value to fluctuate.
FOREIGN SECURITIES MARKET RISK — There is no limit to the amount of assets of the Fund that may be committed to trading on foreign markets. The risk of loss in trading foreign futures and options on futures contracts can be substantial. Participation in foreign futures and options on futures contracts involves the execution and clearing of trades on, or subject to the rules of, a foreign board of trade or exchange. Some of these foreign markets, in contrast to U.S. exchanges, are so-called principals’ markets in which performance is the responsibility only of the individual counterparty with whom the trader has entered into a commodity interest transaction and not of the exchange or clearing corporation. In these kinds of markets, there is risk of bankruptcy or other failure or refusal to perform by the counterparty.
CREDIT RISK — Credit risk refers to the possibility that the issuer of the security or a counterparty in respect of a derivative instrument will not be able to satisfy its payment obligations to the Fund when due. Changes in an issuer’s credit rating or the market’s perception of an issuer’s creditworthiness may also affect the value of the Fund’s investment in that issuer. Securities rated in the four highest categories by the rating agencies are considered investment grade but they may also have some speculative characteristics. Investment grade ratings do not guarantee that bonds will not lose value or default. In addition, the credit quality of securities may be lowered if an issuer’s financial condition changes.
U.S. GOVERNMENT SECURITIES — The Fund may invest in U.S. government securities. Securities issued or guaranteed by the U.S. government or its agencies or instrumentalities include U.S. Treasury securities, which are backed by the full faith and credit of the U.S. Treasury and which differ only in their interest rates, maturities, and times of issuance. U.S. Treasury bills have initial maturities of one-year or less; U.S. Treasury notes have initial maturities of one to ten years; and U.S. Treasury bonds generally have initial maturities of greater than ten years. Certain U.S. government securities are issued or guaranteed by agencies or instrumentalities of the U.S. government including, but not limited to, obligations of U.S. government agencies or instrumentalities such as Fannie Mae, Freddie Mac, Ginnie Mae, the Small Business Administration, the Federal Farm Credit Administration, the Federal Home Loan Banks, Banks for Cooperatives (including the Central Bank for Cooperatives), the Federal Land Banks, the Federal Intermediate Credit Banks, the Tennessee Valley Authority, the Export-Import Bank of the United States, the Commodity Credit Corporation, the Federal Financing Bank, the Student Loan Marketing Association, the National Credit Union Administration and the Federal Agricultural Mortgage Corporation (Farmer Mac).
Some obligations issued or guaranteed by U.S. government agencies and instrumentalities, including, for example, Ginnie Mae pass-through certificates, are supported by the full faith and credit of the U.S. Treasury. Other obligations issued by or guaranteed by federal agencies, such as those securities issued by Fannie Mae, are supported by the discretionary authority of the U.S. government
19 |
The Energy & Minerals Group EV, Solar & Battery Materials
(Lithium, Nickel, Copper, Cobalt) Futures Strategy ETF
Notes to CONSOLIDATED Financial Statements (continued)
August 31, 2023
to purchase certain obligations of the federal agency, while other obligations issued by or guaranteed by federal agencies, such as those of the Federal Home Loan Banks, are supported by the right of the issuer to borrow from the U.S. Treasury, while the U.S. government provides financial support to such U.S. government-sponsored federal agencies, no assurance can be given that the U.S. government will always do, since the U.S. government is not so obligated by law. U.S. Treasury notes and bonds typically pay coupon interest semi-annually and repay the principal at maturity.
CASH AND CASH EQUIVALENTS — Cash and cash equivalents are valued at cost plus accrued interest, which approximates fair value.
OTHER — In the normal course of business, the Fund may enter into contracts that provide general indemnifications. The Fund’s maximum exposure under these arrangements is dependent on claims that may be made against the Fund in the future, and, therefore, cannot be estimated; however, the Fund expects the risk of material loss from such claims to be remote.
2. Investment Adviser and Other Services
The Energy & Minerals Group Advisors, LLC serves as the Adviser to the Fund. Vident Investment Advisory, LLC (“VIA”) served as investment sub-adviser to the Fund since inception. On July 14, 2023, VIA contributed substantially all of its assets and certain liabilities to Vident Advisory, LLC (“Vident” or Sub-Adviser”), an affiliate of VIA. Vident was then acquired by Casey Crawford through various holding entities. This transaction resulted in a “change of control” of the Fund’s investment sub-adviser, causing the assignment and automatic termination of the sub-advisory agreement as required by the 1940 Act. As a result of this change in control, the Board, at a meeting held on May 16-17, 2023, approved a new sub-advisory agreement between the Adviser and Vident, which is materially identical to the previous agreement. The new sub-advisory agreement with Vident became effective July 14, 2023 when the change in control became effective.
Expenses of the Fund are deducted from the Fund’s total income before dividends are paid. Subject to the overall supervision of the Board, the Adviser manages the overall investment operations of the Fund in accordance with the Fund’s investment objective and policies and formulates a continuing investment strategy for the Fund pursuant to the terms of Investment Advisory Agreement between the Trust and the Adviser (the “Advisory Agreement”). Under the terms of the Advisory Agreement, the Fund pays the Adviser a unitary management fee that is computed and paid monthly at an annual rate of 0.95% of the Fund’s average daily net assets during the month. From the unitary management fees, the Adviser pays most of the expenses of the Fund, including the cost of sub-advisory fees to Vident, Subsidiary expenses, transfer agency, custody, fund administration, legal, audit and other services. However, under the Advisory Agreement, the Adviser is not responsible for interest expenses, brokerage commissions and other trading expenses, taxes and other extraordinary costs such as litigation and other expenses not incurred in the ordinary course of business.
During the current fiscal period, investment advisory fees accrued were as follows:
ADVISORY FEES | |||
| $ | 19,603 | ||
U.S. Bancorp Fund Services, LLC, doing business as U.S. Bank Global Fund Services (“Fund Services”), serves as administrator for the Fund. For providing administrative and accounting services, Fund Services is entitled to receive a monthly fee, subject to certain minimum and out of pocket expenses.
20 |
The Energy & Minerals Group EV, Solar & Battery Materials
(Lithium, Nickel, Copper, Cobalt) Futures Strategy ETF
Notes to CONSOLIDATED Financial Statements (continued)
August 31, 2023
Fund Services serves as the Fund’s transfer and dividend disbursing agent. For providing transfer agent services, Fund Services is entitled to receive a monthly fee, subject to certain minimum and out of pocket expenses.
U.S. Bank, N.A. (the “Custodian”) provides certain custodial services to the Fund. The Custodian is entitled to receive a monthly fee, subject to certain minimum and out of pocket expenses.
Quasar Distributors, LLC (the “Distributor”), a wholly-owned broker-dealer subsidiary of Foreside Financial Group, LLC, serves as the principal underwriter and distributor of the Fund’s shares pursuant to a Distribution Agreement with the Trust.
Under the Fund’s unitary fee, the Adviser compensates Fund Services and the Custodian for services provided.
3. Trustee And Officer Compensation
The Trustees of the Trust receive an annual retainer and meeting fees for meetings attended. An employee of Vigilant Compliance, LLC serves as Chief Compliance Officer of the Trust. Vigilant Compliance, LLC is compensated for the services provided to the Trust. Employees of the Trust serve as President, Chief Financial Officer, Chief Operating Officer, Secretary and Director of Marketing & Business Development of the Trust. They are compensated by the Trust for services provided. Certain employees of Fund Services serve as officers of the Trust. They are not compensated by the Fund or the Trust. As of the end of the reporting period, there were no trustee and officer fees charged or paid by the Fund.
4. Purchases and Sales of Investment Securities
During the current fiscal period, there were no purchases or sales of investment securities or long-term U.S. Government securities (excluding short-term investments and derivative transactions) by the Fund.
5. Federal Income Tax Information
It is the Fund’s intention to meet the requirements of Subchapter M of the Internal Revenue Code of 1986, as amended (the “Code”), that are applicable to a regulated investment company (“RIC”). The Fund intends to continue to operate so as to qualify to be taxed as a RIC under the Code and, as such, to not be subject to federal income tax on the portion of its taxable income and gains distributed to stockholders. To qualify for RIC tax treatment, among other requirements, the Fund is required to distribute at least 90% of its investment company taxable income, as defined by the Code. Accordingly, the Fund intends to distribute its taxable income and net realized gains, if any, to shareholders in accordance with timing requirements imposed by the Code. While the Fund intends to distribute substantially all of its taxable net investment income and capital gains, if any, in a manner necessary to minimize the imposition of a 4% excise tax, there can be no assurance that it will avoid any or all of the excise tax. In such event, the Fund will be liable only for the amount by which it does not meet the foregoing distribution requirements. The Fund has adopted August 31 as its tax year end.
In accounting for income taxes, the Fund follows the guidance in FASB ASC Codification 740, as amended by ASU 2009-06, “Accounting for Uncertainty in Income Taxes” (“ASC 740”). ASC 740 prescribes the minimum recognition threshold a tax position must meet in connection with accounting for uncertainties in income tax positions taken or expected to be taken by an entity before being measured and recognized in the consolidated financial statements. Management has concluded, there were no uncertain tax positions as of August 31, 2023 for federal income tax purposes or in, the Fund’s major state and local tax jurisdiction of Delaware.
21 |
The Energy & Minerals Group EV, Solar & Battery Materials
(Lithium, Nickel, Copper, Cobalt) Futures Strategy ETF
Notes to CONSOLIDATED Financial Statements (continued)
August 31, 2023
Because U.S. federal income tax regulations differ from U.S. GAAP, distributions in accordance with tax regulations may differ from net investment income and realized gains recognized for financial reporting purposes. Differences may be permanent or temporary. Permanent difference are reclassified among capital accounts in the financial statements to reflect the applicable tax characterization. Temporary differences arise when certain items of income, expense, gain or loss are recognized at some time in the future. The tax basis components of distributable earnings may differ from the amount reflected in the Statement of Assets and Liabilities due to temporary book/tax differences due to a tax free incorporation transfer.
As of August 31, 2023, the federal tax cost, aggregate gross unrealized appreciation and depreciation of securities held by the Fund were as follows:
FEDERAL | UNREALIZED | UNREALIZED | NET | ||||||||||||
| $ | 2,096,674 | $ | — | $ | (98 | ) | $ | (98 | ) | ||||||
Distributions to shareholders, if any, from net investment income and realized gains are determined in accordance with federal income tax regulations, which may differ from net investment income and realized gains recognized for financial reporting purposes. Accordingly, the character of distributions and composition of net assets for tax purposes may differ from those reflected in the accompanying consolidated financial statements. To the extent these differences are permanent, such amounts are reclassified within the capital accounts based on the tax treatment; temporary differences do not require such reclassification.
The following permanent differences as of August 31, 2023, primarily attributable to investments in the Subsidiary were reclassified among the following accounts:
DISTRIBUTABLE | PAID-IN | ||||||
| $ | 758,553 | $ | (758,553 | ) | |||
As of August 31, 2023, the components of distributable earnings on a tax basis were as follows:
UNDISTRIBUTED | UNDISTRIBUTED | Other | NET | ||||||||||||
| $ | 66,719 | $ | — | $ | (47,187 | ) | $ | (98 | ) | ||||||
The differences between the book and tax basis components of distributable earnings relate principally to the timing of recognition of income and gains of the Subsidiary for federal income tax purposes. Short-term and foreign currency gains are reported as ordinary income for federal income tax purposes.
22 |
The Energy & Minerals Group EV, Solar & Battery Materials
(Lithium, Nickel, Copper, Cobalt) Futures Strategy ETF
Notes to CONSOLIDATED Financial Statements (continued)
August 31, 2023
The tax character of dividends and distributions paid during the fiscal year ended August 31, 2023 were as follows:
ORDINARY | LONG-TERM | total | |||||||||
| $ | — | $ | — | $ | — | ||||||
The Fund is permitted to carry forward capital losses for an unlimited period. Capital losses that are carried forward will retain their character as either short-term or long-term capital losses. As of August 31, 2023, the Fund had unexpiring short-term capital loss carryovers of $340 to offset future capital gains.
Pursuant to federal income tax rules applicable to regulated investment companies, the Fund may elect to treat certain capital losses between November 1 and August 31 and late year ordinary losses ((i) ordinary losses between January 1 and August 31, and (ii) specified ordinary and currency losses between November 1 and August 31) as occurring on the first day of the following tax year. For the fiscal period ended August 31, 2023, any amount of losses elected within the tax return will not be recognized for federal income tax purposes until September 1, 2023. As of August 31, 2023, the Fund did not elect to defer any post-October capital losses or late-year ordinary losses.
6. SHARE TRANSACTIONS
Shares of the Fund are listed and traded on the NYSE Arca, Inc. (the “Exchange”). Market prices for the shares may be different from their NAV. The Fund issues and redeems shares on a continuous basis at NAV only in blocks of 25,000 shares, called “Creation Units.” Creation Units are issued and redeemed principally in-kind for securities included in a specified universe. Once created, shares generally trade in the secondary market at market prices that change throughout the day. Except when aggregated in Creation Units, shares are not redeemable securities of the Fund. Creation Units may only be purchased or redeemed by certain financial institutions (“Authorized Participants”). An Authorized Participant is either (i) a broker-dealer or other participant in the clearing process through the Continuous Net Settlement System of the National Securities Clearing Corporation or (ii) a Depository Trust Company participant and, in each case, must have executed a Participant Agreement with the Distributor. Most retail investors do not qualify as Authorized Participants nor have the resources to buy and sell whole Creation Units. Therefore, they are unable to purchase or redeem shares directly from the Fund. Rather, most retail investors may purchase shares in the secondary market with the assistance of a broker and are subject to customary brokerage commissions or fees.
The Fund currently offers one class of shares, which has no front-end sales load, no deferred sales charge, and no redemption fee. A fixed transaction fee is imposed for the transfer and other transaction costs associated with the purchase or sale of Creation Units. The standard fixed transaction fee for the Fund is $300, payable to the custodian. In addition, a variable fee may be charged on all cash transactions or substitutes for Creation Units of up to a maximum of 2% as a percentage of the value of the Creation Units subject to the transaction. Variable fees are imposed to compensate the Fund for the transaction costs associated with the cash transactions. Variable fees received by the Fund, if any, are displayed in the capital shares transactions section of the Consolidated Statement of Changes in Net Assets.
23 |
The Energy & Minerals Group EV, Solar & Battery Materials
(Lithium, Nickel, Copper, Cobalt) Futures Strategy ETF
Notes to CONSOLIDATED Financial Statements (CONCLUDED)
August 31, 2023
7. New Accounting Pronouncements And Regulatory Updates
In June 2022, the FASB issued Accounting Standards Update 2022-03, which amends Fair Value Measurement (Topic 820): Fair Value Measurement of Equity Securities Subject to Contractual Sale Restrictions (“ASU 2022-03”). ASU 2022-03 clarifies guidance for fair value measurement of an equity security subject to a contractual sale restriction and establishes new disclosure requirements for such equity securities. ASU 2022-03 is effective for fiscal years beginning after December 15, 2023 and for interim periods within those fiscal years, with early adoption permitted. Management is currently evaluating the impact of these amendments on the financial statements.
In October 2022, the SEC adopted and form admendments rule relating tailored shareholder reports for mutual funds and ETFs and fee information in investment company advertisements. The rule and form amendments will, among other things, require the Fund to transmit concise and visually engaging shareholder reports that highlight key information. The amendments will require that funds tag information in a structured data format and that certain more in-depth information be made available online and available for delivery free of charge to investors on request. The amendments became effective January 24, 2023. There is an 18-month transition period after the effective date of the amendments until the Fund is required to comply.
In December 2022, the FASB issued an Accounting Standards Update, ASU 2022-06, Reference Rate Reform (Topic 848) – Deferral of the Sunset Date of Topic 848 (“ASU 2022-06”). ASU 2022-06 is an amendment to ASU 2020-04, which provided optional guidance to ease the potential accounting burden due to the discontinuation of the London Inter-Bank Offered Rate and other interbank-offered based reference rates and which was effective as of March 12, 2020 through December 31, 2022. ASU 2022-06 extends the effective period through December 31, 2024. Management is currently evaluating the impact, if any, of applying ASU 2022-06.
8. Subsequent Events
In preparing these financial statements, management of the Fund has evaluated events and transactions for potential recognition or disclosure through the date the financial statements were available to be issued, and has determined that there was the following subsequent event: The U.S.-designated terrorist group Hamas attacked Israel on October 7, 2023, resulting in an ensuing war in the region. Current hostilities and the potential for future hostilities may diminish the value, or cause significant volatility in the share price, of companies based in or having significant operations in Israel. The Israeli securities market may be closed for extended periods of time or trading on the Israeli securities market may be suspended altogether. How long the armed conflict and related events will last cannot be predicted.
24 |
The Energy & Minerals Group EV, Solar & Battery Materials
(Lithium, Nickel, Copper, Cobalt) Futures Strategy ETF
Report of Independent Registered Public Accounting Firm
To the Shareholders of The Energy & Minerals Group EV, Solar & Battery Materials (Lithium, Nickel, Copper, Cobalt) Futures Strategy ETF and
Board of Trustees of The RBB Fund Trust
Opinion on the Financial Statements
We have audited the accompanying consolidated statement of assets and liabilities, including the consolidated portfolio of investments and consolidated portfolio of investments in futures contracts, of The Energy & Minerals Group EV, Solar & Battery Materials (Lithium, Nickel, Copper, Cobalt) Futures Strategy ETF (the “Fund”), a series of The RBB Fund Trust, as of August 31, 2023, the consolidated statements of operations and changes in net assets, the related notes, and the consolidated financial highlights for the period December 29, 2022 (commencement of operations) through August 31, 2023 (collectively referred to as the “financial statements”). In our opinion, the financial statements present fairly, in all material respects, the financial position of the Fund as of August 31, 2023, the results of its operations, the changes in net assets, and the financial highlights for the period indicated above, in conformity with accounting principles generally accepted in the United States of America.
Basis for Opinion
These financial statements are the responsibility of the Fund’s management. Our responsibility is to express an opinion on the Fund’s financial statements based on our audit. We are a public accounting firm registered with the Public Company Accounting Oversight Board (United States) (“PCAOB”) and are required to be independent with respect to the Fund in accordance with the U.S. federal securities laws and the applicable rules and regulations of the Securities and Exchange Commission and the PCAOB.
We conducted our audit in accordance with the standards of the PCAOB. Those standards require that we plan and perform the audit to obtain reasonable assurance about whether the financial statements are free of material misstatement whether due to error or fraud.
Our audit included performing procedures to assess the risks of material misstatement of the financial statements, whether due to error or fraud, and performing procedures that respond to those risks. Such procedures included examining, on a test basis, evidence regarding the amounts and disclosures in the financial statements. Our procedures included confirmation of securities owned as of August 31, 2023, by correspondence with the custodian and broker. Our audit also included evaluating the accounting principles used and significant estimates made by management, as well as evaluating the overall presentation of the financial statements. We believe that our audit provides a reasonable basis for our opinion.
We have served as the Fund’s auditor since 2022.

COHEN & COMPANY, LTD.
Cleveland, Ohio
October 30, 2023
25 |
The Energy & Minerals Group EV, Solar & Battery Materials
(Lithium, Nickel, Copper, Cobalt) Futures Strategy ETF
Notice to Shareholders
(Unaudited)
Information on Proxy Voting
Policies and procedures that the Fund uses to determine how to vote proxies relating to portfolio securities as well as information regarding how the Fund voted proxies relating to portfolio securities during the most recent 12-month period ended June 30 are available (i) without charge, upon request, by calling (800) 617-0004; and (ii) on the SEC’s website at http://www.sec.gov.
Quarterly Schedule of Investments
The Trust files a complete schedule of portfolio holdings with the SEC for the first and third fiscal quarters of each fiscal year (quarters ended November 30 and May 31) as an exhibit to its report on Form N-PORT. The Trust’s Forms N-PORT filings are available on the SEC’s website at http://www.sec.gov.
Frequency Distributions of Premiums and Discounts
Information regarding how often shares of the Fund trade on an exchange at a price above (i.e., at a premium) or below (i.e., at a discount) the NAV of the Fund is available, without charge, on the Fund’s website at www.emgadvisors.com.
LIQUIDITY RISK MANAGEMENT PROGRAM
The Trust has adopted and implemented a Liquidity Risk Management Program (the “Trust Program”) as required by rule 22e-4 under the 1940 Act. In accordance with the Trust Program, the Adviser has adopted and implemented a liquidity risk management program (the “Adviser Program” and together with the Trust Program, the “Programs”) on behalf of the Fund. The Programs seek to assess, manage and review the Fund’s Liquidity Risk. “Liquidity Risk” is defined as the risk that the Fund could not meet requests to redeem shares issued by the Fund without significant dilution of remaining investors’ interest in the Fund.
The Board has appointed Vigilant Compliance, LLC (“Vigilant”) as the program administrator for the Trust Program and the Liquidity Risk Management Committee of the Adviser as the program administrator for the Adviser Program. The process of monitoring and determining the liquidity of the Fund’s investments is supported by one or more third-party vendors.
At meetings held during the current fiscal period, the Board and its Regulatory Oversight Committee received and reviewed a written report (the “Report”) of Vigilant and the Adviser concerning the operation of the Programs for the period from December 28, 2022 to December 31, 2022 (the “Period”). The Report summarized the operation of the Programs and the information and factors considered by Vigilant and the Adviser in reviewing the adequacy and effectiveness of the implementation of the Programs with respect to the Fund. Such information and factors included, among other things: (i) the methodology used to classify the liquidity of the Fund’s portfolio investments and the Adviser’s assessment that the Fund’s strategy remained appropriate for an exchange traded fund; (ii) analyses of the Fund’s trading environment and reasonably anticipated trading size; (iii) that the Fund held primarily highly liquid assets (investments that the Fund anticipates can be converted to cash within 3 business days or less in current market conditions without significantly changing their market value); (iv) that the Fund either held a percentage of highly liquid assets above its highly liquid investment minimum at all times during the Period or did not require the establishment of a highly liquid investment minimum; (v) confirmation that the Fund did not breach the 15% maximum illiquid security threshold (investments that cannot be sold or disposed of in seven days or less in current market conditions without the sale of the investment significantly changing the market value of the investment) during the Period and the procedures for monitoring compliance with the limit; (vi) that the processes, technologies and third-party vendors used to assess, manage, and/or periodically review the
26 |
The Energy & Minerals Group EV, Solar & Battery Materials
(Lithium, Nickel, Copper, Cobalt) Futures Strategy ETF
Notice to Shareholders (concluded)
(Unaudited)
Fund’s Liquidity Risk functioned appropriately during the Period; and (vii) that the Programs operated adequately during the Period. The Report also indicated that there were no material changes made to the Programs during the Period.
Based on the review, the Report concluded that the Programs were being implemented effectively and reasonably designed to assess and manage Liquidity Risk in the Fund’s portfolio.
There can be no assurance that the Trust Program or the Adviser Program will achieve its objectives under all circumstances in the future. Please refer to the Fund’s prospectus for more information regarding the Fund’s exposure to liquidity risk and other risks to which it may be subject.
APPROVAL OF INVESTMENT SUB-ADVISORY AGREEMENTS
As required by the 1940 Act, the Board, including all of the Trustees who are not “interested persons” of the Trust, as that term is defined in the 1940 Act (the “Independent Trustees”), considered the approval of a new Sub-Advisory Agreement (the “Sub-Advisory Agreement”) by and among the Adviser and Vident, with respect to The Energy & Minerals Group EV, Solar & Battery Materials (Lithium, Nickel, Copper, Cobalt) Futures Strategy ETF (the “Fund”) at a meeting of the Board held on May 16-17, 2023 (the “Meeting”). At the Meeting, the Board, including all of the Independent Trustees, approved the new Sub-Advisory Agreement for an initial period ending August 16, 2024. The Board’s decision to approve the Sub-Advisory Agreement reflects the exercise of its business judgment. In approving the Sub-Advisory Agreement, the Board considered information provided by the Adviser and Vident, with the assistance and advice of counsel to the Independent Trustees and the Trust.
In considering the approval of the Sub-Advisory Agreement by and among the Adviser and Vident, with respect to the Fund, the Board took into account all materials provided prior to and during the Meeting and at other meetings throughout the past year, the presentations made during the Meeting, and the discussions held during the Meeting. Among other things, the Board considered (i) the nature, extent, and quality of services to be provided to the Fund by Vident; (ii) descriptions of the experience and qualifications of the personnel providing those services; (iii) Vident’s investment philosophies and processes; (iv) Vident’s assets under management and client descriptions; (v) Vident’s soft dollar commission and trade allocation policies; (vi) Vident’s advisory fee arrangements with the Fund and other similarly managed clients, as applicable; (vii) Vident’s compliance procedures; and (viii) Vident’s financial information and insurance coverage.
The Board also considered the fees payable to Vident under the proposed Sub-Advisory Agreement with Vident and the services to be provided by Vident. In this regard, the Board noted that the fees for Vident were payable by the Adviser.
After reviewing the information regarding the Adviser’s and Vident’s costs, profitability and economies of scale, and after considering the services to be provided by Vident, the Board concluded that the sub-advisory fees to be paid by the Adviser to Vident were fair and reasonable, that the Sub-Advisory Agreement is in the best interests of the Fund and its shareholders and does not involve a conflict of interest from which the Adviser or Vident derives an inappropriate advantage, and that the Sub-Advisory Agreement should be approved for an initial period ending August 16, 2024.
27 |
The Energy & Minerals Group EV, Solar & Battery Materials
(Lithium, Nickel, Copper, Cobalt) Futures Strategy ETF
Trustees and Executive Officers
(Unaudited)
TRUSTEES and Executive Officers
The business and affairs of the Trust are managed under the direction of the Trust’s Board. The Trustees and executive officers of the Trust, their ages, business addresses and principal occupations during the past five years are set forth below.
Name, Address | Position(s) | Term of | Principal | Other | Number of |
INDEPENDENT TRUSTEES | |||||
Julian A. Brodsky | Trustee | June 2021 to present | Retired. | AMDOCS Limited (service provider to telecommunications companies). | 63 |
Gregory P. Chandler | Trustee | June 2021 to present | Since 2020, Chief Financial Officer, HC Parent Corp. d/b/a Herspiegel Consulting LLC (life sciences consulting services); 2020, Chief Financial Officer, Avocado Systems Inc. (cyber security software provider); from 2009 - 2020, Chief Financial Officer, Emtec, Inc. (information technology consulting/services). | FS Energy and Power Fund (business development company); Wilmington Funds (12 portfolios) (registered investment company); Emtec, Inc. (until December 2019); FS Investment Corporation (business development company) (until December 2018). | 63 |
Lisa A. Dolly | Trustee | October 2021 to present | From July 2019-December 2019, Chairman, Pershing LLC (broker dealer, clearing and custody firm); January 2016-June 2019, Chief Executive Officer, Pershing, LLC. | Allfunds Group PLC (United Kingdom wealthtech and fund distribution provider); Securities Industry and Financial Markets Association (trade association for broker dealers, investment banks and asset managers); Hightower Advisors (wealth management firm). | 63 |
28 |
The Energy & Minerals Group EV, Solar & Battery Materials
(Lithium, Nickel, Copper, Cobalt) Futures Strategy ETF
Trustees and Executive Officers (CONTINUED)
(Unaudited)
Name, Address | Position(s) | Term of | Principal | Other | Number of |
Nicholas A. Giordano | Trustee | June 2021 to present | Since 1997, Consultant, financial services organizations. | IntriCon Corporation (biomedical device manufacturer) (until May 2022); Wilmington Funds (12 portfolios) (registered investment company); Independence Blue Cross (healthcare insurance) (until March 2021). | 63 |
Arnold M. Reichman | Chair and Trustee | June 2021 to present | Retired. | EIP Investment Trust (registered investment company) (until August 2022). | 63 |
Brian T. Shea | Trustee | June 2021 to present | From 2014-2017, Chief Executive Officer, BNY Mellon Investment Services (fund services, global custodian and securities clearing firm); from 1983- 2014, Chief Executive Officer and various positions, Pershing LLC (broker dealer, clearing and custody firm). | Fidelity National Information Services, Inc. (financial services technology company); Ameriprise Financial, Inc. (financial services company); WisdomTree Investments, Inc. (asset management company) (until March 2019). | 63 |
Robert A. Straniere | Trustee | June 2021 to present | Since 2009, Administrative Law Judge, New York City; since 1980, Founding Partner, Straniere Law Group (law firm). | None. | 63 |
INTERESTED TRUSTEE2 | |||||
Robert Sablowsky | Vice Chair and Trustee | June 2021 to present | Since 2002, Senior Director – Investments and, prior thereto, Executive Vice President, of Oppenheimer & Co., Inc. (a registered broker-dealer). | None. | 63 |
29 |
The Energy & Minerals Group EV, Solar & Battery Materials
(Lithium, Nickel, Copper, Cobalt) Futures Strategy ETF
Trustees and Executive Officers (CONTINUED)
(Unaudited)
Name, Address | Position(s) | Term of | Principal | Other | Number of |
OFFICERS | |||||
Steven Plump | President | August 2022 to present | From 2011 to 2021, Executive Vice President, PIMCO LLC. | N/A | N/A |
Salvatore Faia, JD, CPA, CFE Vigilant Compliance, LLC Gateway Corporate Center, Ste. 216 | Chief Compliance Officer | June 2021 to present | Since 2004, President, Vigilant Compliance, LLC (investment management services company); since 2005, Independent Trustee of EIP Investment Trust (registered investment company); Since 2004, Chief Compliance Officer of The RBB Fund, Inc.; President of The RBB Fund, Inc. from 2009 to 2022; President of The RBB Fund Trust from 2021 to 2022. | N/A | N/A |
James G. Shaw | Chief Financial Officer and Secretary Chief Operating Officer | June 2021 to present August 2022 to present | Chief Financial Officer and Secretary (since 2016) and Chief Operating Officer (since 2022) of The RBB Fund,Inc.; Chief Financial Officer and Secretary (since 2021) and Chief Operating Officer (since 2022) of The RBB Fund Trust. | N/A | N/A |
Craig A. Urciuoli | Director of Marketing & Business Development | June 2021 to present | Director of Marketing & Business Development of The RBB Fund, Inc. (since 2019); from 2000-2019, Managing Director, Third Avenue Management LLC (investment advisory firm). | N/A | N/A |
30 |
The Energy & Minerals Group EV, Solar & Battery Materials
(Lithium, Nickel, Copper, Cobalt) Futures Strategy ETF
Trustees and Executive Officers (CONTINUED)
(Unaudited)
Name, Address | Position(s) | Term of | Principal | Other | Number of |
Jennifer Witt | Assistant Treasurer | June 2021 to present | Since 2020, Vice President, U.S. Bank Global Fund Services (fund administrative services firm); from 2016 to 2020, Assistant Vice President, U.S. Bank Global Fund Services. | N/A | N/A |
Edward Paz | Assistant Secretary | June 2021 to present | Since 2007, Vice President and Counsel, U.S. Bancorp Fund Services, LLC (fund administrative services firm). | N/A | N/A |
Michael P. Malloy | Assistant Secretary | June 2021 to present | Since 1993, Partner, Faegre Drinker Biddle & Reath LLP (law firm). | N/A | N/A |
Jillian L. Bosmann | Assistant Secretary | June 2021 to present | Since 2017, Partner, Faegre Drinker Biddle & Reath LLP (law firm). | N/A | N/A |
* | Each Trustee oversees 63 portfolios of the fund complex, consisting of the series in the Trust (10 portfolios) and The RBB Fund, Inc. (53 portfolios). |
1 | Subject to the Trust’s Retirement Policy, each Trustee may continue to serve as a Trustee until the last day of the calendar year in which the applicable Trustee attains age 75 or until his or her successor is elected and qualified or his or her death, resignation or removal. The Board reserves the right to waive the requirements of the Policy with respect to an individual Trustee. The Board has approved waivers of the policy with respect to Messrs. Brodsky, Giordano, Sablowsky and Straniere. Each officer holds office at the pleasure of the Board until the next special meeting of the Trust or until his or her successor is duly elected and qualified, or until he or she dies, resigns or is removed. |
2 | Mr. Sablowsky is considered an “interested person” of the Trust as that term is defined in the 1940 Act and is referred to as an “Interested Trustee.” Mr. Sablowsky is considered an “Interested Trustee” of the Trust by virtue of his position as an employee of Oppenheimer & Co., Inc., a registered broker-dealer. |
Trustee Experience, Qualifications, Attributes and/or Skills
The information above includes each Trustee’s principal occupations during the last five years. Each Trustee possesses extensive additional experience, skills and attributes relevant to his or her qualifications to serve as a Trustee. The cumulative background of each Trustee led to the conclusion that each Trustee should serve as a Trustee of the Trust. Mr. Brodsky has over 40 years of senior
31 |
The Energy & Minerals Group EV, Solar & Battery Materials
(Lithium, Nickel, Copper, Cobalt) Futures Strategy ETF
Trustees and Executive Officers (CONCLUDED)
(Unaudited)
executive-level management experience in the cable television and communications industry. Mr. Chandler has demonstrated leadership and management abilities as evidenced by his senior executive level positions in the investment technology consulting/services and investment banking/brokerage industries, and also serves on various boards. Ms. Dolly has over three decades of experience in the financial services industry, and she has demonstrated her leadership and management abilities by serving in numerous senior executive-level positions. Mr. Giordano has years of experience as a consultant to financial services organizations and also serves on the boards of other registered investment companies. Mr. Reichman brings decades of investment management experience to the Board, in addition to senior executive-level management experience. Mr. Sablowsky has demonstrated leadership and management abilities as evidenced by his senior executive-level positions in the financial services industry. Mr. Shea has demonstrated leadership and management abilities as evidenced by his senior executive-level positions in the brokerage, clearing, banking, and investment services industry, including service on the boards of public companies, industry regulatory organizations and a university. Mr. Straniere has been a practicing attorney for over 30 years and has served on the boards of an asset management company and another registered investment company.
32 |
The Energy & Minerals Group EV, Solar & Battery Materials
(Lithium, Nickel, Copper, Cobalt) Futures Strategy ETF
Privacy Notice
Exhibit A
FACTS | WHAT DOES THE ENERGY & MINERALS GROUP ADVISORS, LLC (“EMG”) DO WITH YOUR PERSONAL INFORMATION? | ||
Why? | Financial companies choose how they share your personal information. Federal law gives consumers the right to limit some but not all sharing. Federal law also requires us to tell you how we collect, share, and protect your personal information. Please read this notice carefully to understand what we do. | ||
What? | The type of personal information we collect, and share depend on the product of service you have with us. This information can include: ● Social Security number and transaction history ● Account balances and checking account information ● Account transactions and wire transfer instructions When you are no longer a customer, we continue to share your information as described in this notice. | ||
How? | All financial companies need to share customers’ personal information to run their everyday business. In the section below, we list the reasons financial companies can share their customers’ personal information; the reasons EMG chooses to share; and whether you can limit this sharing. | ||
Reasons we share your personal information | Does EMG share? | Can you limit this? | |
For our everyday business purposes — | Yes | No | |
For our marketing purposes — | Yes | Yes | |
For joint marketing with other financial companies | No | We don’t share. | |
For our affiliates’ everyday business purposes — | Yes | No | |
For our affiliates’ everyday business purposes — | No | We don’t share. | |
For our affiliates to market to you | Yes | No | |
For non-affiliates to market to you | No | We don’t share. | |
To limit our sharing | Please note: If you are a new customer, we can begin sharing your information 30 days from the days from the date we sent this notice. When you are no longer our customer, we continue to share your information as described in this notice. However, you can contact us at any time to limit our sharing |
Questions? | Call 1-800-617-0004 or visit www.emgadvisors.com should you have any questions. |
33 |
The Energy & Minerals Group EV, Solar & Battery Materials
(Lithium, Nickel, Copper, Cobalt) Futures Strategy ETF
Privacy Notice (continued)
Exhibit A
What we do | |
How does EMG protect my personal information? | To protect your personal information from unauthorized access and use, we use security measures that comply with federal law. These measures include computer safeguards and secured files and buildings. |
How does EMG collect my personal information? | We collect your personal information, for example, when you ● open an account ● provide account information ● give us your contact information ● make a wire transfer ● tell us where to send the money We also collect your information from others, such as credit bureaus, affiliates, or other companies |
Why can’t I limit all sharing? | Federal law gives you the right to limit only ● sharing for affiliates’ everyday business purposes-information about your creditworthiness ● affiliates from using your information to market to you ● sharing for nonaffiliates to market to you State laws and individual companies may give you additional rights to limit sharing. |
What happens when I limit sharing for an account I hold jointly with someone else? | In addition to the above information, where applicable, you have the following rights under the European Union’s General Data Protection Regulation (“GDPR”) and U.S. Privacy Laws, as applicable and to the extent permitted by law, to ● Check whether we hold personal information about you and to access such data (in accordance with our policy) ● Request the correction of personal information about you that is ● inaccurate ● Have a copy of the personal information we hold about you provided to you or another “controller” where technically feasible ● Request the erasure of your personal information ● Request the restriction of processing concerning you The legal grounds for processing of your personal information is for contractual necessity and compliance with law. If you wish to exercise any of your rights above, please call:1-888-229-1855. You are required to ensure the personal information we hold about you is up-to-date and accurate and you must notify us of any changes to the personal data you provided to us. The Funds shall retain your personal data for as long as you are an investor in the Funds and thereafter as long as necessary to comply with applicable laws that require the Funds to retain your personal data, such as the Securities and Exchange Commission’s data retention rules. Your personal data will be transferred to the United States so that the Funds may provide the agreed upon services for you. No adequacy decision has been rendered by the European Commission as to the data protection of your personal data when transferring it to the United States. However, the Funds do take the security of your personal data seriously. |
European Union’s General Data Protection Regulation | To protect your personal information from unauthorized access and use, we use security measures that comply with federal law. These measures include computer safeguards and secured files and buildings. |
34 |
The Energy & Minerals Group EV, Solar & Battery Materials
(Lithium, Nickel, Copper, Cobalt) Futures Strategy ETF
Privacy Notice (CONCLUDED)
Exhibit A
Definitions | |
Affiliates | Companies related by common ownership or control. They can be financial and nonfinancial companies. |
Non-affiliates | Companies not related by common ownership or control. They can be financial and nonfinancial companies. EMG does not share with non-affiliates so they can market to you. |
Joint marketing | A formal agreement between non-affiliated financial companies that together market financial products or services to you. EMG doesn’t jointly market. |
Controller | “Controller” means the natural or legal person, public authority, agency or other body which, alone or jointly with others, determines the purposes and means of the processing of personal data; where the purposes and means of such processing are determined by European union or European Member state law, the controller or the specific criteria for its nomination may be provided for by European union or European Member state law. |
35 |
(This Page Intentionally Left Blank.)
(This Page Intentionally Left Blank.)
INVESTMENT ADVISER
The Energy & Minerals Group Advisors, LLC
704 Goodlette Frank Road North, Suite 118
Naples, FL 34102
INVESTMENT SUB-ADVISER
Vident Advisory, LLC
1125 Sanctuary Parkway, Suite 515
Alpharetta, Georgia 30009
ADMINISTRATOR AND TRANSFER AGENT
U.S. Bancorp Global Fund Services, LLC
P.O. Box 701
Milwaukee, WI 53202-0701
CUSTODIAN
U.S. Bank, N.A.
1555 North Rivercenter Drive, Suite 302
Milwaukee, WI 53202
INDEPENDENT REGISTERED
PUBLIC ACCOUNTING FIRM
Cohen & Company, Ltd.
1350 Euclid Avenue, Suite 800
Cleveland, OH 44115
DISTRIBUTOR
Quasar Distributors, LLC
Three Canal Plaza, Suite 100
Portland, Maine 04101
LEGAL COUNSEL
Faegre Drinker Biddle & Reath LLP
One Logan Square, Suite 2000
Philadelphia, PA 19103-6996
EMG-AR23

Evermore Global Value Fund
of The RBB Fund Trust
Annual Report ● August 31, 2023
This report is submitted for the general information of the shareholders of the Evermore Global Value Fund and may not be used as sales literature unless preceded or accompanied by a current prospectus for the Fund.
Table of Contents
Shareholder Letter & Management Discussion of Fund Performance (Unaudited) | 1 |
Performance Information (Unaudited) | 7 |
Sector Allocation (Unaudited) | 8 |
Expense Example (Unaudited) | 9 |
Schedule of Investments | 10 |
Statement of Assets and Liabilities | 13 |
Statement of Operations | 14 |
Statements of Changes in Net Assets | 15 |
Financial Highlights | 17 |
Notes to Financial Statements | 21 |
Report of Independent Registered Public Accounting Firm | 36 |
Annual Review of Liquidity Risk Management Program (Unaudited) | 37 |
Trustees and Executive Officers (Unaudited) | 38 |
Additional Information (Unaudited) | 43 |
Privacy Notice (Unaudited) | 44 |
Evermore Global Value Fund
Elements of Our Investment Approach
As the sub-adviser to the Evermore Global Value Fund, MFP Investors LLC seeks to leverage our deep operating and investing experience, and extensive global relationships to identify and invest in special situations -- companies around the world that have compelling valuations and are undergoing strategic changes which we believe will unlock value.
Seeking to Generate Value . . .
● | Catalyst-Driven Investing. We do more than simply pick undervalued stocks and hope for their prices to rise. We invest in companies where we have determined a series of catalysts exist to unlock value. The catalysts we look for are not broadly recognized, but they are likely to have a significant impact on a stock’s performance over time. Catalysts may include management changes, shareholder activism, and operational and financial restructurings (e.g., cost-cutting, asset sales, breakups, spinoffs, mergers, acquisitions, liquidations, share buybacks, recapitalizations, etc.). |
Supporting Our Active Value Orientation . . .
● | Original Fact-Based Research. We conduct our own, original fact-based research to validate management’s stated objectives and identify catalysts to unlock value. We also perform detailed business segment analysis on each company we research. |
● | Business Operating Experience. Our senior team has hands-on business operating experience including starting and managing businesses, sitting on company boards, and assisting management of multi-national corporations restructure their businesses. We rely on this experience to better evaluate investment opportunities. |
● | A Global Network of Strategic Relationships. Over the past 25+ years, members of our investment team have developed extensive global networks of strategic relationships, including individuals and families that control businesses, corporate board members, corporate management, regional brokerage firms, press contacts, etc. We leverage these relationships to help generate ideas and better evaluate investment opportunities. |
● | We Invest Like Owners. When we are interested in an investment opportunity, we get to know the management team of the company, study the company’s business model, evaluate the competitive and regulatory environment, and test and crosscheck everything the management team tells us against our own experience. We ask ourselves if we would want to own the entire company. If the answer is No, we will not invest in the company. |
● | Not Activists, Often Collaborators. We almost always take the approach of collaborative engagement with management, rather than taking an aggressive activist stance. On limited occasions, when we are not satisfied with the efforts of the incumbent company leadership, we may work with other shareholders to help facilitate change. |
Executing Our Approach . . .
● | Concentration Maintains Focus. Focused and disciplined investing means knowing our businesses intimately and staying patient as the process of value creation unfolds. We maintain focus by typically investing in 30 to 40 names with a high percentage of investments in our top 10 holdings. |
● | Investing Across the Capital Structure. We evaluate all components of a company’s capital structure to determine where the best risk-adjusted return potential exists. At times, we may invest in multiple parts of a company’s capital structure (e.g., investing in both a company’s debt and equity). |
● | Targeting Complex Investment Opportunities. We often research family-controlled holding companies or conglomerates that are often under-researched and/or misunderstood, which can create gaps between price and value. |
● | Merger Arbitrage and Distressed Companies. We may take advantage of announced merger and acquisition deals where an attractive spread (difference) exists between the market price and the announced deal price for the target company. We also look for opportunities in distressed companies that have filed or may file for bankruptcy, distressed companies involved in reorganizations or financial restructurings, and distressed companies that emerged from bankruptcy or reorganization. |
● | Tactically Managing Cash Levels. We are not afraid to hold significant cash positions when it makes sense for the portfolio. |
1
Evermore Global Value Fund
A Letter from the Portfolio Managers
Dear Shareholder,
The Evermore Global Value Fund (the “Fund”) moved onto The RBB Fund Trust platform in December 2022 and, in connection with that transition, the Fund’s fiscal year end was changed to August 31st from December 31st. In light of our recently published Semi-Annual letter, which was posted on our website at the end of August 2023, we will be relatively brief in this Annual Shareholder letter and portfolio update, as much of the salient discussion points were covered in that recent Semi-Annual letter.
Portfolio Review – Investment Performance
For the year-to-date (YTD) period ended August 31, 2023 (the “Period”), the Institutional Class shares of the Fund were up 9.28%, outperforming the MSCI All Country World Index ex USA, which was up 8.78% for the Period. As shown in the chart below, the Fund’s performance during the Period exceeded that of its benchmark indices and peer group.
The performance data quoted represents past performance and is no guarantee of future results. Investment return and principal value will fluctuate so that an investor’s shares, when redeemed, may be worth more or less than their original cost. Current performance may be lower or higher than the performance data quoted. Performance data current to the most recent month end may be obtained by calling 866-EVERMORE (866-383-7667). Prior to December 28, 2022, the Fund imposed a 2% redemption fee on shares redeemed within 90 days. Performance data quoted does not reflect the redemption fee. If reflected, total returns would be reduced. The performance data quoted reflects fee waivers in effect and would have been less in their absence.
Year-to-Date Period Ended August 31, 2023

Morningstar Global Small/Mid Stock Category Average represents an average of all funds in the Morningstar Global Small/Mid Stock Category.
2
Portfolio Review – Characteristics
The Fund ended the Period with $106.1 million in net assets and 23 issuer positions. As of August 31, 2023, 36.4% of the Fund’s net assets were in micro- and small-capitalization (up to $2 billion) companies; 16.3% were in mid-capitalization (between $2 billion and $10 billion) companies; and 25.2% were in large- capitalization (> $10 billion) companies.
Set forth below please find the following geographic and strategy classification breakdowns (shown as a % of Fund net assets) as of August 31, 2023.
Region Exposure | Strategy Classification |
|
|


Country Exposure

As we discussed in the Semi-Annual letter (available on our website), the largest contributors to Fund performance during the Period were in a category we categorize as Family-Controlled Companies (FCC). We expect this area to continue to grow within the portfolio, as the number of family-controlled businesses that are undergoing value-accretive changes has been growing over the last few years. Excluding the impact of cash, our investments in family-controlled companies represent 76.2% of the portfolio (68.2% inclusive of cash) at the end of the Period.
3
Portfolio Review – New Investments
The Fund initiated four new positions during the Period – DHT Holdings, Inc. (ticker: DHT US), Stainless Tankers ASA (STST NO), Genco Shipping & Trading (GNK US) and Solvay SA (SOLB BB). Below please find a summary of our recent investment in Solvay SA.
The Fund initiated a position in Solvay SA (SOLB BB) during the Period. Headquartered in Belgium, Solvay is a $11.2 billion market cap diversified chemicals company with market leading positions in a variety of segments, including soda ash, silica, specialty polymers, composites, mining reagents, etc.
Solvay is a classic investment case for the Fund that underscores the intersection of a family-controlled company and catalysts on the horizon:
● | A family-controlled company with a longstanding history that began in 1863 with brothers Ernest and Alfred Solvay that developed the breakthrough ammonia-soda process that is still implemented today to produce soda ash. The Solvay family owns about 31% of the company through its investment holding company, Solvac SA. |
● | A “new” CEO with a proven, multi-year track record. Since taking the helm in March 2019, CEO Ilham Kadri has helped to transform the company over the last few years by optimizing the portfolio (divested product lines), deleveraging the balance sheet and focusing on free cash flow generation. |
● | Separation of the company is the next major step in Solvay’s transformation. While the company first announced this initiative back in March 2022, Solvay is now ready to split into two separately-listed companies by the end of 2023. Solvay (parent) will split into Syensqo (SpecialtyCo), which will focus on the growth-oriented assets, and Solvay (EssentialsCo), which will focus on the more resilient, mature assets in the portfolio. |
We believe this transformation will help to crystallize the true intrinsic value of Solvay’s specialty chemical assets, which are masked within a conglomerate that generally tends to trade closer to the segment with the lowest valuation multiple. Given that we are still in the market opportunistically adding to our position, we expect to discuss Solvay in greater detail in future portfolio commentaries.
Portfolio Review – Exited Investments
The Fund exited four investments during the Period: BW LPG (BWLPG NO), Viaplay Group (VPLAYB SS), Atlantic Sapphire (ASA NO) and Aker Horizon (AKH NO).
Portfolio Review – Top Contributors & Detractors
The top three contributors to, and detractors from, Fund performance during the Period can be found below. The summaries for the most impactful contributor and detractor for the Period are the same securities as discussed in our Semi-Annual letter.

BW LPG (BWLPG NO) is one of the leading liquified petroleum gas (“LPG”) vessel operators in the world. The Fund exited its position in BW LPG during the second quarter of 2023, realizing a healthy gain for a position that we held for just under a year. It was the largest contributor to Fund performance during the Period.
Headquartered in Singapore and listed on the Oslo exchange, BW LPG has a market cap of $1.4 billion and a fleet of 45 Very Large Gas Carriers (VLGCs), of which 16 vessels are outfitted with the latest cost-effective, low emissions LPG dual-fuel propulsion technology. The main family-controlled shareholder is the BW Group (41% stake), a well-regarded maritime and green-related family-controlled holding company managed by the long-term oriented value creator and savvy investor, Andreas Sohmen-Pao. It should be noted that the BW Group is also an anchor shareholder in another Fund investment, Cadeler, an offshore wind installation vessel operator.
4
Since we initiated our position in late August 2022, the VLGC rates continued to strengthen, and the order book of new vessels delivered this year has been well absorbed. Given the strong cash flow generation, BW LPG has paid a significant amount of dividends so far this year, representing a 100% payout ratio and dividend yield (the dividend per share, divided by the price per share) in excess of 30%. In May 2023, the company announced a share buyback program to purchase up to 6 million shares for a maximum of $50 million. In mid-June 2023, BW LPG announced a reverse book building process to purchase shares through a Dutch Auction. We decided to tender all our shares at NOK 108 per share and lock in a substantial return as the share price appreciated faster than we expected.
Viaplay Group (VPLAYB SS), a $453 million market cap, Nordic streaming media company, was the largest detractor to performance during the Period. In June 2023, Viaplay had an unexpected turn of events, announcing a profit warning and the CEO’s resignation on a Sunday afternoon (NY time).
We were certainly surprised and extremely disappointed by these recent developments, especially for our long-term holding that had successfully navigated the pandemic and grew the subscriber base significantly over the last two years. Earlier this year, Viaplay initiated its planned price increases across various markets but clearly those efforts were unsuccessful with a higher-than-expected churn recently. Management revised downward the full-year 2023 guidance and withdrew the operating and financial targets for 2025 citing a rapid deterioration of advertising revenues and lower demand in the Nordic and international streaming markets. They attributed the higher churn levels to the rising cost of living following the price increases.
Anders Jensen, who was the CEO since Viaplay spun out from its former parent, Modern Times Group (MTG) in April 2019, resigned effective immediately. Anders was replaced by Jorgen Madsen Lindemann, who was the former CEO of the predecessor parent company, MTG, and prior to that held senior leadership positions at MTG spanning over 26 years, including head of Nordic operations and international operations, and head of sports rights acquisition and production. Subsequent to the end of the second quarter of 2023, Viaplay withdrew its full year 2023 guidance (but kept the Q2 2023 guidance intact) on the back of the new CEO’s review of current operations and the Chairman, Pernille Erenbjerg stepped down from the board due to personal health-related reasons in July 2023. With increased uncertainty, diminishing investor confidence, and a greater likelihood of impairments in the expanded international markets, we ultimately decided to exit our position in Viaplay at a loss during the third quarter of 2023. While we believe there should be minimal solvency risk, a potential liquidity constraint could result in a dilutive equity raise if Viaplay’s core Nordic markets slow down at a sharper pace. We will monitor how the situation unfolds at Viaplay as the company provides an update on its strategy and medium-term outlook, which will include a cost savings program, content cost savings initiatives, review of the international operations and non-core assets and renegotiations with its distribution partners. Our thesis was no longer intact so we exited the investment.
Closing Thoughts
In 2023, we have been busier than ever scouring the globe for interesting situations across the entire capital structure. Our focus continues to be steadfast on finding compelling investment cases across various regions, sectors, and industries and “tagging along” with great value creators in compelling yet cheap family-controlled companies that have the ability to compound well over time. We look forward to discussing the recent developments and portfolio updates in our next commentary.
Please feel free to contact us at dmarcus@mfpllc.com or to@mfpllc.com with any questions or thoughts.
Sincerely,
|
|
David E. Marcus
Lead Portfolio Manager | Thomas O
Co-Portfolio Manager |


Opinions expressed are those of MFP Investors LLC and are subject to change, are not guaranteed and should not be considered investment advice.
Fund holdings and sector allocations are subject to change at any time and should not be considered recommendations to buy or sell any security. Current and future portfolio holdings are subject to risk. Please refer to the Schedules of Investments for complete holdings information.
MSCI All-Country World ex USA Index captures large and mid-cap representation across 22 Developed Markets countries (excluding the United States) and 24 Emerging Markets countries.
HFRX Event Driven Index utilizes a UCITSIII compliant methodology to construct the HFRX Hedge Fund Indices. The methodology is based on defined and predetermined rules and objective criteria to select and rebalance components to maximize representation of the Hedge Fund Universe.
5
Mutual fund investing involves risk. Principal loss is possible. Investments in foreign securities involve greater volatility and political, economic and currency risks and differences in accounting methods. This risk is greater for investments in Emerging Markets. Investing in smaller companies involves additional risks such as limited liquidity and greater volatility than larger companies. The Fund may make short sales of securities, which involve the risk that losses may exceed the original amount invested in the securities. Investments in debt securities typically decrease in value when interest rates rise. This risk is usually greater for longer-term debt securities. Investment in lower-rated, non-rated and distressed securities presents a greater risk of loss to principal and interest than higher-rated securities. Due to the focused portfolio, the Fund may have more volatility and more risk than a fund that invests in a greater number of securities. Additional special risks relevant to the fund involve liquidity, currency, derivatives and hedging. Please refer to the Fund’s prospectus for further details.
You cannot invest directly in an index.
MFP Investors LLC is the sub-adviser to the Evermore Global Value Fund, which is distributed by Quasar Distributors, LLC.
6
Evermore Global Value Fund
Performance Information (Unaudited) |
Comparison of Change in Value of $10,000 Investment in Evermore Global Value Fund vs. MSCI All-Country World Index ex USA & HFRX Event Driven Index

Average Annual Total Returns For The Periods Ended August 31, 2023: | ||||||
Calendar | 1 Year | 5 Year | 10 Year | Since Inception | Value of | |
Investor Class(1) | 8.94% | 0.93% | -4.61% | 2.67% | 2.27% | $13,010 |
Institutional Class(1) | 9.28% | 1.21% | -4.36% | 2.92% | 2.52% | $13,335 |
MSCI All-Country World Index ex USA | 8.78% | 11.89% | 3.33% | 4.38% | 4.27%(2) | $15,350 |
HFRX Event Driven Index | -1.01% | -3.25% | 0.54% | 0.78% | 1.38%(2) | $10,804 |
(1) The Fund commenced operations on January 1, 2010 as a separate series (the “Predecessor Fund”) of Evermore Funds Trust. Effective as of the close of business on December 27, 2022, the Predecessor Fund was reorganized as a new series of The RBB Fund Trust (the “Reorganization”). The performance shown for periods prior to December 28, 2022 represents the performance of the Predecessor Fund.
(2) Index performance shown is from inception date of the Fund and is not the inception date of the index itself.
(3) Not annualized.
This chart illustrates the performance of a hypothetical $10,000 investment made on August 31, 2013, and reflects all Fund expenses. The chart is not intended to imply any future performance. The returns shown do not reflect the deduction of taxes that a shareholder would pay on fund distributions or the redemption of fund shares. The chart assumes reinvestment of capital gains and dividends for a fund and dividends for an index. Index returns do not reflect the effects of fees and expenses. It is not possible to invest directly in an index.
Performance data quoted represents past performance; past performance does not guarantee future results. The performance data quoted reflects fee waivers in effect and would have been less in their absence. The investment returns and principal value of an investment will fluctuate so that an investor’s shares, when redeemed, may be worth more or less than their original cost. Current performance of the Fund may be lower or higher than the performance quoted. Performance data current to the most recent month end may be obtained by calling 866-EVERMORE or (866-383-7667). The Total Annual Fund Operating Expenses as stated in the Fund’s Prospectus dated March 30, 2023, as revised May 2, 2023, are 1.73% and 1.48% for Investor Class and Institutional Class, respectively. The Total Annual Fund Operating Expenses After Fee Waiver/Expense Reimbursements, as stated in the Fund’s Prospectus dated March 30, 2023, as revised May 2, 2023, are 1.61% and 1.36% for Investor Class and Institutional Class, respectively.
7
Evermore Global Value Fund
Sector Allocation as a Percentage of Total Portfolio at August 31, 2023 (Unaudited) |

* | Data is expressed as a percentage of total portfolio. Data expressed excludes collateral on loaned securities and forward foreign currency contracts. Please refer to the Schedule of Investments and Schedule of Forward Foreign Currency Contracts for more details on the Fund’s individual holdings. |
8
Evermore Global Value Fund
Expense Example for the Six Months Ended August 31, 2023 (Unaudited) |
As a shareholder of the Evermore Global Value Fund (the “Fund”), you incur two types of costs: (1) transaction costs, and (2) ongoing costs, including investment advisory fees, distribution fees, and other Fund expenses. This example is intended to help you understand your ongoing costs (in dollars) of investing in the Fund and to compare these costs with the ongoing costs of investing in other mutual funds.
The example is based on an investment of $1,000 invested at the beginning of the period and held for the six-month period from March 1, 2023 through August 31, 2023, and held for the entire period.
Actual Expenses
The first line of the accompanying table provides information about actual account values based on actual returns and actual expenses. You will be assessed fees for outgoing wire transfers, returned checks and stop payment orders at prevailing rates charged by U.S. Bancorp Fund Services, LLC, the Fund’s transfer agent. If you request a redemption be made by wire transfer, currently a $15.00 fee is charged by the Fund’s transfer agent. An Individual Retirement Account (“IRA”) will be charged a $15.00 annual maintenance fee. To the extent the Fund invests in shares of other investment companies as part of its investment strategy, you will indirectly bear your proportionate share of any fees and expenses charged by the underlying funds in which the Fund invests in addition to the expenses of the Fund. Actual expenses of the underlying funds may vary. These expenses are not included in the example below. The example below includes, but is not limited to, investment advisory fees, shareholder servicing fees, fund accounting fees, custody fees and transfer agent fees. However, the example below does not include portfolio trading commissions and related expenses, and other extraordinary expenses as determined under generally accepted accounting principles. You may use the information in this line, together with the amount you invested, to estimate the expenses that you paid over the period. Simply divide your account value by $1,000 (for example, an $8,600 account value divided by $1,000 = 8.6), then multiply the result by the number in the first line under the heading entitled “Expenses Paid During the Period’’ to estimate the expenses you paid on your account during this period.
Hypothetical Example for Comparison Purposes
The second line of the accompanying table provides information about hypothetical account values and hypothetical expenses based on the Fund’s actual expense ratios and an assumed rate of return of 5% per year before expenses, which is not the Fund’s actual return. The hypothetical account values and expenses may not be used to estimate the actual ending account balance or expenses you paid for the period. You may use this information to compare the ongoing costs of investing in the Fund and other funds. To do so, compare this 5% hypothetical example with the 5% hypothetical examples that appear in the shareholder reports of the other funds. Please note that the expenses shown in the table are meant to highlight your ongoing costs only and do not reflect any transactional costs, such as sales charges (loads), or exchange fees. Therefore, the second line of the table is useful in comparing ongoing costs only and will not help you determine the relative total costs of owning different funds. In addition, if these transactional costs were included, your costs would have been higher.
Beginning | Ending Account | Expenses Paid | Annualized | |||||||||||||
Investor Class Actual * | $ | 1,000 | $ | 979.90 | $ | 7.98 | 1.60 | % | ||||||||
Investor Class Hypothetical (5% annual return before expenses) | $ | 1,000 | $ | 1,017.14 | $ | 8.13 | 1.60 | % | ||||||||
Institutional Class Actual* | $ | 1,000 | $ | 981.90 | $ | 6.74 | 1.35 | % | ||||||||
Institutional Class Hypothetical (5% annual return before expenses) | $ | 1,000 | $ | 1,018.40 | $ | 6.87 | 1.35 | % | ||||||||
* | Expenses are equal to the Fund’s annualized six-month expense ratio for the period March 1, 2023 to August 31, 2023, multiplied by the average account value over the period, multiplied by the number of days (184) in the most recent fiscal half-year, then divided by 365 to reflect the one half year period. The Fund’s ending account value on the first line in the table is based on the actual six-month total investment return for the Fund. |
9
Evermore Global Value Fund
Schedule of Investments at August 31, 2023 |
Country Allocation for Investments in Securities at August 31, 2023 |
Country | Long Exposure | |||
United States^ | 22.8 | % | ||
Ireland | 11.6 | % | ||
Netherlands | 9.5 | % | ||
France | 9.3 | % | ||
Sweden | 8.4 | % | ||
Monaco | 6.8 | % | ||
Norway | 6.8 | % | ||
Denmark | 4.6 | % | ||
Italy | 3.1 | % | ||
Belgium | 2.5 | % | ||
Austria | 2.5 | % | ||
Switzerland | 1.6 | % | ||
Subtotal | 89.5 | % | ||
Percentages are stated as a percent of net assets.
^ | Excludes cash and equivalent (10.5% of net assets) consisting of Short-Term Investment-Money Market (10.5%), Securities Held as Collateral on Loaned Securities (1.3%) and net of Liabilities in Excess of Other Assets (-1.3%). |
Shares |
| Value | ||||||
COMMON STOCK — 77.9% | ||||||||
Aerospace & Defense — 1.6% | ||||||||
| 109,450 | Montana Aerospace AG (Switzerland) (1) | $ | 1,717,300 | |||||
Capital Markets — 5.1% | ||||||||
| 86,155 | KKR & Co., Inc. - Class A (United States) | 5,411,395 | ||||||
Chemicals — 2.5% | ||||||||
| 23,200 | Solvay SA (Belgium) | 2,689,279 | ||||||
Entertainment — 2.5% | ||||||||
| 389,297 | Modern Times Group MTG AB (Sweden) (1) | 2,647,227 | ||||||
Health Care Equipment & Supplies — 1.6% | ||||||||
| 29,600 | Enovis Corp. (United States) (1) | 1,658,784 | ||||||
Industrial Conglomerates — 15.6% | ||||||||
| 896,827 | Bollore SE (France) | 5,314,581 | ||||||
| 67,968 | EXOR NV (Netherlands) (1) | 6,024,338 | ||||||
| 287,085 | LIFCO AB (Sweden) | 5,265,257 | ||||||
| 16,604,176 | ||||||||
IT Services — 1.0% | ||||||||
| 57,000 | Hemnet Group AB (Sweden) | 1,033,429 | ||||||
Machinery — 3.3% | ||||||||
| 48,800 | Esab Corp. (United States) | 3,521,896 | ||||||
Marine — 16.6% | ||||||||
| 1,287,384 | Cadeler A/S (Denmark) (1)(2) | 4,841,146 | ||||||
| 389,973 | Eneti, Inc. (Monaco) | 4,227,307 | ||||||
| 91,300 | Genco Shipping & Trading, Ltd. (United States) | 1,248,071 | ||||||
| 739,873 | Hoegh Autoliners ASA (Norway) | 5,160,189 | ||||||
| 454,000 | Stainless Tankers ASA (Norway)(1) | 2,092,422 | ||||||
| 17,569,135 | ||||||||
Media — 10.3% | ||||||||
| 41,851 | IAC, Inc. (United States)(1) | $ | 2,315,616 | |||||
| 161,892 | Universal Music Group NV (Netherlands) | 4,018,291 | ||||||
| 501,648 | Vivendi SA (France) | 4,574,728 | ||||||
| 10,908,635 | ||||||||
Oil, Gas & Consumable Fuels — 12.2% | ||||||||
| 571,155 | Calumet Specialty Products Partners LP (United States) (1) | 10,012,347 | ||||||
| 318,300 | DHT Holdings, Inc. (Monaco) | 2,944,275 | ||||||
| 12,956,622 | ||||||||
Real Estate Management — 3.1% | ||||||||
| 263,500 | Infrastrutture Wireless Italiane SpA (Italy) | 3,261,570 | ||||||
Technology Hardware, Storage & Peripherals — 2.5% | ||||||||
| 122,313 | Kontron AG (Austria) | 2,665,869 | ||||||
TOTAL COMMON STOCKS | ||||||||
(Cost $55,902,753) | 82,645,317 | |||||||
The accompanying notes are an integral part of these financial statements.
10
Evermore Global Value Fund
Schedule of Investments at August 31, 2023, Continued |
|
| Principal | ||||||
CORPORATE OBLIGATION — 11.6% | ||||||||
Consumer Finance — 11.6% | ||||||||
| 15,546,058 | Lamington Road DAC 9.750%, Cash or 14.000% PIK, 4/7/2121 (Ireland)(3)(5)(6) | $ | 12,301,596 | |||||
TOTAL CORPORATE OBLIGATION | ||||||||
(Cost $14,976,054) | 12,301,596 | |||||||
SHORT-TERM INVESTMENT — 10.5% | ||||||||
Money Market — 10.5% | ||||||||
| 11,187,456 | First American Treasury Obligations Fund - Class X, 5.27% (United States)(4) | 11,187,456 | ||||||
TOTAL SHORT—TERM INVESTMENT | ||||||||
(Cost $11,187,456) | 11,187,456 | |||||||
SECURITIES HELD AS COLLATERAL ON LOANED SECURITIES — 1.3% | ||||||||
Money Market — 1.3% | ||||||||
| 1,384,695 | First American Government Obligations Fund, Class X, 5.25% (United States)(4) | 1,384,695 | ||||||
TOTAL SECURITIES HELD AS COLLATERAL ON LOANED SECURITIES | ||||||||
(Cost $1,384,695) | 1,384,695 | |||||||
TOTAL INVESTMENTS IN SECURITIES — 101.3% | ||||||||
(Cost $83,450,958) | 107,519,064 | |||||||
Liabilities in Excess of Other Assets (Including Forward Foreign Currency Contracts) — (1.3)% | (1,373,842 | ) | ||||||
TOTAL NET ASSETS — 100.0% | $ | 106,145,222 | ||||||
Percentages are stated as a percent of net assets.
(1) | Non-income producing security. |
(2) | All or a portion of this security is on loan. At August 31, 2023 the total value of securities on loan was $1,285,040, which represents 1.2% of total net assets. The remaining contractual maturity of all of the securities lending transactions is overnight and continuous. |
(3) | This security was fair valued in good faith by F/m Investments, LLC d/b/a North |
Slope Capital, LLC (the “Adviser”), as Valuation Designee, under the oversight |
of The RBB Fund Trust’s Board of Trustees. The aggregate value of this security at August 31, 2023 was $12,301,596, which represents 11.6% of net assets. |
(4) | Seven-day yield as of August 31, 2023. |
(5) | The Adviser has deemed all or a portion of this security as illiquid. This security has a value of $12,301,596, which represents 11.6% of total net assets at August 31, 2023 |
(6) | Value determined using significant unobservable inputs. |
Glossary of Terms
PIK - | Payment In Kind |
The Global Industry Classification Standard (GICS®) was developed by and/or is the exclusive property of MSCI, Inc. and Standard & Poor Financial Services LLC (“S&P”). GICS® is a service mark of MSCI, Inc. and S&P and has been licensed for use by the Fund’s Administrator, U.S. Bancorp Fund Services, LLC, doing business as U.S. Bank Global Fund Services (“Fund Services”).
The accompanying notes are an integral part of these financial statements.
11
Evermore Global Value Fund
Schedule of Investments at August 31, 2023, Continued |
SCHEDULE OF FORWARD FOREIGN CURRENCY CONTRACTS at August 31, 2023 |
As of August 31, 2023, the Fund had the following forward currency contracts outstanding
Currency to be Received | Currency to be Delivered | |||||||||||||||||||||||||||
Settlement Date | Amount | Currency | USD Value | Amount | Currency | USD Value | Net | |||||||||||||||||||||
9/28/2023 | 1,616,978 | USD | $ | 1,616,978 | 1,421,000 | CHF | $ | 1,613,533 | $ | 3,445 | (a) | |||||||||||||||||
9/28/2023 | 28,101,500 | USD | 28,101,500 | 25,900,000 | EUR | 28,115,523 | (14,023 | )(a) | ||||||||||||||||||||
9/28/2023 | 11,618,973 | USD | 11,618,973 | 124,000,000 | NOK | 11,639,996 | (21,023 | )(a) | ||||||||||||||||||||
9/28/2023 | 8,565,193 | USD | 8,565,193 | 93,800,000 | SEK | 8,619,820 | (54,627 | )(a) | ||||||||||||||||||||
| $ | 49,902,644 | $ | 49,988,872 | $ | (86,228 | ) | ||||||||||||||||||||||
CHF | Swiss Franc |
EUR | Euro |
NOK | Norwegian Krone |
SEK | Swedish Krona |
USD | U.S. Dollar |
(a) | Counterparty: forward foreign currency contracts outstanding with Bank of New York Mellon. |
The accompanying notes are an integral part of these financial statements.
12
Evermore Global Value Fund
Statement of Assets and Liabilities as of August 31, 2023 |
ASSETS | ||||
Investments in securities, at value (cost $83,450,958) (1) (Note 2) | $ | 107,519,064 | ||
Foreign currency, at value (cost $276,437) | 247,864 | |||
Unrealized appreciation on forward foreign currency contracts | 3,445 | |||
Receivables: | ||||
Fund shares sold | 84,465 | |||
Securities lending income | 10,427 | |||
Dividends and interest, net of foreign withholding taxes | 308,734 | |||
Dividend reclaims | 426,089 | |||
Prepaid expenses | 2,959 | |||
Total assets | 108,603,047 | |||
LIABILITIES | ||||
Unrealized depreciation on forward foreign currency contracts | 89,673 | |||
Payables: | ||||
Securities lending collateral(1) | 1,384,695 | |||
Fund shares redeemed | 739,991 | |||
Investment advisory fees | 102,174 | |||
Transfer agent fees | 32,700 | |||
Administration fees | 11,577 | |||
Custody fees | 9,088 | |||
Distribution fees - Investor Class | 2,992 | |||
Other accrued fees | 84,935 | |||
Total liabilities | 2,457,825 | |||
NET ASSETS | $ | 106,145,222 | ||
COMPONENTS OF NET ASSETS | ||||
Paid-in capital | $ | 151,026,348 | ||
Total distributable earnings | (44,881,126 | ) | ||
Net assets | $ | 106,145,222 | ||
Investor Class: | ||||
Net assets | $ | 14,392,170 | ||
Shares issued and outstanding (unlimited number of shares authorized without par value) | 1,342,119 | |||
Net asset value | $ | 10.72 | ||
Institutional Class: | ||||
Net assets | $ | 91,753,052 | ||
Shares issued and outstanding (unlimited number of shares authorized without par value) | 8,475,147 | |||
Net asset value | $ | 10.83 |
(1) | The market value of securities out on loan was $1,285,040 as of August 31, 2023. |
The accompanying notes are an integral part of these financial statements.
13
Evermore Global Value Fund
Statement of Operations |
Fiscal Period | Fiscal Year | |||||||
INVESTMENT INCOME | ||||||||
Dividends (2) | $ | 1,928,635 | $ | 4,532,220 | ||||
Interest received in-kind | 405,114 | — | ||||||
Interest | 1,086,596 | 1,685,790 | ||||||
Securities lending income | 140,916 | 307,130 | ||||||
Total investment income | 3,561,261 | 6,525,140 | ||||||
EXPENSES (Note 3) | ||||||||
Advisory fees | 714,806 | 1,546,689 | ||||||
Legal fees | 90,968 | 134,931 | ||||||
Transfer agent fees | 85,148 | 102,439 | ||||||
Administration and accounting fees | 46,570 | 169,306 | ||||||
Shareholder reporting fees | 38,579 | 13,061 | ||||||
Audit and tax fees | 33,208 | 68,847 | ||||||
Registration fees | 31,308 | 49,232 | ||||||
Custody fees | 26,884 | 36,723 | ||||||
Distribution fees - Investor Class | 24,690 | 45,598 | ||||||
Interest expense | 729 | 930 | ||||||
Trustee fees | — | 80,509 | ||||||
Chief Compliance Officer fees | — | 48,567 | ||||||
Insurance fees | — | 43,268 | ||||||
Miscellaneous fees | 23,721 | 5,905 | ||||||
Total expenses before waivers and/or reimbursements | 1,116,611 | 2,346,005 | ||||||
Less: waivers and/or reimbursements | (116,456 | ) | (190,356 | ) | ||||
Net expenses after waivers and/or reimbursements | 1,000,155 | 2,155,649 | ||||||
Net investment income/(loss) | 2,561,106 | 4,369,491 | ||||||
REALIZED AND UNREALIZED GAIN (LOSS) ON INVESTMENTS, FOREIGN CURRENCY TRANSACTIONS, FORWARD FOREIGN CURRENCY CONTRACTS & WRITTEN OPTIONS | ||||||||
Net realized gain (loss) on: | ||||||||
Investments in unaffiliated securities | (7,463,797 | ) | (19,017,571 | ) | ||||
Investments in affiliated securities | — | (2,381,175 | ) | |||||
Foreign currency transactions | (50,746 | ) | (83,421 | ) | ||||
Forward foreign currency contracts | 1,695,160 | 11,463,945 | ||||||
Written options | — | (2,051,032 | ) | |||||
Change in net unrealized appreciation (depreciation) on: | ||||||||
Investments in unaffiliated securities | 12,283,936 | (43,095,616 | ) | |||||
Investments in affiliated securities | — | (1,632,235 | ) | |||||
Foreign currency translations | 11,401 | (35,763 | ) | |||||
Forward foreign currency contracts | 541,857 | 722,025 | ||||||
Written options | — | 293,745 | ||||||
Net realized and unrealized gain (loss) on investments, foreign currencies, forward foreign currency contracts & written options | 7,017,811 | (57,449,333 | ) | |||||
Net increase/(decrease) in net assets resulting from operations | $ | 9,578,917 | $ | (53,079,842 | ) | |||
^ | Prior to the close of business on December 27, 2022, the Fund was a series (the “Predecessor Fund”) of Evermore Funds Trust, an open-end management investment company organized as a Massachusetts business trust. The Predecessor Fund was reorganized into the Fund following the close of business on December 27, 2022 (the “Reorganization”). As a result of the Reorganization, the performance and accounting history of the Predecessor Fund was assumed by the Fund. Performance and accounting information prior to December 28, 2022 included herein is that of the Predecessor Fund. |
(1) | The Fund changed its fiscal year end to August 31 during the period. The period ended is from January 1, 2023 to August 31, 2023. |
(2) | Net of $266,258 foreign withholding taxes for the fiscal period ended August 31, 2023 and net of $897,996 foreign withholding taxes for the fiscal year ended December 31, 2022. |
The accompanying notes are an integral part of these financial statements.
14
Evermore Global Value Fund
Statements of Changes in Net Assets |
| Fiscal | Fiscal | Fiscal | |||||||||
INCREASE (DECREASE) IN NET ASSETS FROM: | ||||||||||||
OPERATIONS | ||||||||||||
Net investment income (loss) | $ | 2,561,106 | $ | 4,369,491 | $ | 4,168,816 | ||||||
Net realized gain (loss) on investments, foreign currency transactions, forward foreign currency contracts & written options | (5,819,383 | ) | (12,069,254 | ) | 27,455,210 | |||||||
Change in unrealized appreciation/(depreciation) on investments, foreign currency transactions, forward foreign currency contracts & written options | 12,837,194 | (45,380,079 | ) | (14,943,640 | ) | |||||||
Net increase (decrease) in net assets resulting from operations | 9,578,917 | (53,079,842 | ) | 16,680,386 | ||||||||
DIVIDENDS AND DISTRIBUTIONS TO SHAREHOLDERS (NOTE 6) | ||||||||||||
Investor Class | — | (324,216 | ) | (599,203 | ) | |||||||
Institutional Class | — | (2,263,202 | ) | (5,826,290 | ) | |||||||
Total distributable earnings | — | (2,587,418 | ) | (6,425,493 | ) | |||||||
CAPITAL SHARE TRANSACTIONS | ||||||||||||
Net decrease in net assets derived from net change in outstanding shares – Investor Class | (1,773,365 | ) | (1,895,450 | ) | (6,023,401 | ) | ||||||
Net decrease in net assets derived from net change in outstanding shares – Institutional Class | (6,109,656 | ) | (64,577,199 | ) | (58,962,614 | ) | ||||||
Total decrease in net assets from capital share transactions | (7,883,021 | ) | (66,472,649 | ) | (64,986,015 | ) | ||||||
Total increase/(decrease) in net assets | 1,695,896 | (122,139,909 | ) | (54,731,122 | ) | |||||||
NET ASSETS | ||||||||||||
Beginning of period | 104,449,326 | 226,589,235 | 281,320,357 | |||||||||
End of period | $ | 106,145,222 | $ | 104,449,326 | $ | 226,589,235 | ||||||
The accompanying notes are an integral part of these financial statements.
15
Evermore Global Value Fund
Statements of Changes in Net Assets Continued |
Summary of capital share transactions is as follows:
Fiscal Period Ended | Fiscal Year Ended | Fiscal Year Ended | ||||||||||||||||||||
Investor Class | Shares | Value | Shares | Value | Shares | Value | ||||||||||||||||
Shares sold | 107,943 | $ | 1,141,258 | 169,348 | $ | 1,892,776 | 185,192 | $ | 2,607,506 | |||||||||||||
Shares issued in reinvestment of distributions | — | — | 30,832 | 313,248 | 43,349 | 585,217 | ||||||||||||||||
Shares redeemed* | (275,251 | ) | (2,914,623 | ) | (375,107 | ) | (4,101,474 | ) | (655,279 | ) | (9,216,124 | ) | ||||||||||
Net decrease | (167,308 | ) | $ | (1,773,365 | ) | (174,927 | ) | $ | (1,895,450 | ) | (426,738 | ) | $ | (6,023,401 | )(2) | |||||||
Fiscal Period Ended | Fiscal Year Ended | Fiscal Year Ended | ||||||||||||||||||||
Institutional Class | Shares | Value | Shares | Value | Shares | Value | ||||||||||||||||
Shares sold | 724,465 | $ | 7,755,300 | 1,664,628 | $ | 17,782,419 | 1,656,438 | $ | 23,481,894 | |||||||||||||
Shares issued in reinvestment of distributions | — | — | 214,739 | 2,196,781 | 414,328 | 5,639,010 | ||||||||||||||||
Shares redeemed* | (1,287,898 | ) | (13,864,956 | ) | (7,622,197 | ) | (84,556,399 | ) | (6,263,848 | ) | (88,083,518 | )(3) | ||||||||||
Net decrease | (563,433 | ) | $ | (6,109,656 | ) | (5,742,830 | ) | $ | (64,577,199 | ) | (4,193,082 | ) | $ | (58,962,614 | ) | |||||||
^ | Prior to the close of business on December 27, 2022, the Fund was a series (the “Predecessor Fund”) of Evermore Funds Trust, an open-end management investment company organized as a Massachusetts business trust. The Predecessor Fund was reorganized into the Fund following the close of business on December 27, 2022 (the “Reorganization”). As a result of the Reorganization, the performance and accounting history of the Predecessor Fund was assumed by the Fund. Performance and accounting information prior to December 28, 2022 included herein is that of the Predecessor Fund. |
* | Prior to December 28, 2022, there was a 2.00% redemption fee to the value of shares redeemed or exchanged within 90 days of purchase. The redemption fees were retained by the Fund for the benefit of the remaining shareholders and recorded as paid-in capital. Effective December 28, 2022, the Fund eliminated its redemption fee. |
(1) | The Fund changed its fiscal year end to August 31 during the period. The period ended is from January 1, 2023 to August 31, 2023. |
(2) | Net of redemption fees of $2,020. |
(3) | Net of redemption fees of $11,826. |
The accompanying notes are an integral part of these financial statements.
16
Evermore Global Value Fund
Financial Highlights for a capital share outstanding throughout the period/year |
Investor Class
Fiscal Period | Year Ended December 31, | |||||||||||||||||||||||
| 2023# | 2022^ | 2021^ | 2020^ | 2019^ | 2018^ | ||||||||||||||||||
Net asset value, beginning of period | $ | 9.84 | $ | 13.66 | $ | 13.24 | $ | 14.26 | $ | 11.70 | $ | 15.08 | ||||||||||||
INCOME FROM INVESTMENT OPERATIONS | ||||||||||||||||||||||||
Net investment income (loss)* | 0.22 | 0.28 | 0.19 | (0.00 | )1 | 0.09 | 0.06 | |||||||||||||||||
Net realized and unrealized gain (loss) on investments | 0.66 | (3.89 | ) | 0.59 | (1.00 | ) | 2.83 | (3.16 | ) | |||||||||||||||
Total from investment operations | 0.88 | (3.61 | ) | 0.78 | (1.00 | ) | 2.92 | (3.10 | ) | |||||||||||||||
LESS DISTRIBUTIONS | ||||||||||||||||||||||||
From net investment income | — | (0.21 | ) | (0.36 | ) | (0.02 | ) | (0.10 | ) | (0.06 | ) | |||||||||||||
From net realized capital gains | — | — | — | — | (0.26 | ) | (0.22 | ) | ||||||||||||||||
Total distributions | — | (0.21 | ) | (0.36 | ) | (0.02 | ) | (0.36 | ) | (0.28 | ) | |||||||||||||
Paid-in capital from redemption fees(2) | — | — | 0.00 | (1) | 0.00 | (1) | 0.00 | (1) | 0.00 | (1) | ||||||||||||||
Net asset value, end of period | $ | 10.72 | $ | 9.84 | $ | 13.66 | $ | 13.24 | $ | 14.26 | $ | 11.70 | ||||||||||||
Total investment return/(loss)(4) | 8.94 | %(5) | (26.48 | )% | 5.93 | % | (7.01 | )% | 25.05 | % | (21.07 | )% | ||||||||||||
SUPPLEMENTAL DATA | ||||||||||||||||||||||||
Net assets, end of period (thousands) | $ | 14,392 | $ | 14,847 | $ | 23,009 | $ | 27,956 | $ | 61,296 | $ | 63,584 | ||||||||||||
Portfolio turnover rate | 14 | %(5) | 17 | % | 33 | % | 21 | % | 28 | % | 29 | % | ||||||||||||
RATIO OF EXPENSES TO AVERAGE NET ASSETS(3) | ||||||||||||||||||||||||
Before expense waivers/reimbursement and recoupments, including interest and dividend expense | 1.76 | %(6) | 1.72 | % | 1.57 | % | 1.55 | % | 1.47 | % | 1.44 | % | ||||||||||||
Before expense waivers/reimbursement and recoupments, excluding interest and dividend expense | 1.76 | %(6) | 1.72 | % | 1.57 | % | 1.55 | % | 1.47 | % | 1.44 | % | ||||||||||||
After expense waivers/reimbursement and recoupments, including interest and dividend expense | 1.60 | %(6) | 1.60 | % | 1.57 | % | 1.55 | % | 1.47 | % | 1.44 | % | ||||||||||||
After expense waivers/reimbursement and recoupments, excluding interest and dividend expense | 1.60 | %(6) | 1.60 | % | 1.57 | % | 1.55 | % | 1.47 | % | 1.44 | % | ||||||||||||
The accompanying notes are an integral part of these financial statements.
17
Evermore Global Value Fund
Financial Highlights for a capital share outstanding throughout the period/year, Continued |
Fiscal Period | Year Ended December 31, | |||||||||||||||||||||||
| 2023# | 2022^ | 2021^ | 2020^ | 2019^ | 2018^ | ||||||||||||||||||
RATIO OF NET INVESTMENT INCOME (LOSS) TO AVERAGE NET ASSETS(2) | ||||||||||||||||||||||||
Before expense waivers/reimbursement and recoupments, including interest and dividend expense | 3.16 | %(6) | 2.39 | % | 1.35 | % | (0.04 | )% | 0.69 | % | 0.35 | % | ||||||||||||
After expense waivers/reimbursement and recoupments, including interest and dividend expense | 3.32 | %(6) | 2.52 | % | 1.35 | % | (0.04 | )% | 0.69 | % | 0.35 | % | ||||||||||||
Portfolio turnover is calculated for the Fund as a whole.
^ | Prior to the close of business on December 27, 2022, the Fund was a series (the “Predecessor Fund”) of Evermore Funds Trust, an open-end management investment company organized as a Massachusetts business trust. The Predecessor Fund was reorganized into the Fund following the close of business on December 27, 2022 (the “Reorganization”). As a result of the Reorganization, the performance and accounting history of the Predecessor Fund was assumed by the Fund. Performance and accounting information prior to December 28, 2022 included herein is that of the Predecessor Fund. |
# | Effective March 31, 2023, the Fund’s former investment adviser (the “Predecessor Adviser”) sold substantially all of its business and advisory assets to MFP Investors LLC (the “Sub-Adviser”). In connection with the change of control, F/m Investments, LLC d/b/a North Slope Capital, LLC was appointed as the investment adviser to the Fund. The performance shown for periods prior to March 31, 2023 represents the performance of the Fund or Predecessor Fund, as applicable, under the management of the Predecessor Adviser. The Fund changed its fiscal year end to August 31. The amounts shown are for the fiscal period from January 1, 2023 to August 31, 2023. |
* | Calculated using the average shares outstanding method. |
1 | Amount less than $0.01. |
2 | Prior to December 28, 2022, there was a 2.00% redemption fee to the value of shares redeemed or exchanged within 90 days of purchase. The redemption fees were retained by the Fund for the benefit of the remaining shareholders and recorded as paid-in capital. Effective December 28, 2022, the Fund eliminated its redemption fee. |
3 | Does not include expenses of the investment companies in which the Fund invests. |
4 | Total investment return/(loss) is calculated assuming a purchase of shares on the first day and a sale of shares on the last day of each period reported and includes reinvestments of dividends and distributions, if any. Total investment return does not reflect any applicable sales charge. |
5 | Not Annualized |
6 | Annualized |
The accompanying notes are an integral part of these financial statements.
18
Evermore Global Value Fund
Financial Highlights for a capital share outstanding throughout the period/year, Continued |
Institutional Class
Fiscal Period | Year Ended December 31, | |||||||||||||||||||||||
| 2023# | 2022^ | 2021^ | 2020^ | 2019^ | 2018^ | ||||||||||||||||||
Net asset value, beginning of period | $ | 9.91 | $ | 13.77 | $ | 13.35 | $ | 14.35 | $ | 11.77 | $ | 15.20 | ||||||||||||
INCOME FROM INVESTMENT OPERATIONS | ||||||||||||||||||||||||
Net investment income (loss)* | 0.26 | 0.33 | 0.23 | 0.03 | 0.12 | 0.09 | ||||||||||||||||||
Net realized and unrealized gain (loss) on investments | 0.66 | (3.95 | ) | 0.59 | (1.00 | ) | 2.86 | (3.30 | ) | |||||||||||||||
Total from investment operations | 0.92 | (3.62 | ) | 0.82 | (0.97 | ) | 2.98 | (3.21 | ) | |||||||||||||||
LESS DISTRIBUTIONS | ||||||||||||||||||||||||
From net investment income | — | (0.24 | ) | (0.40 | ) | (0.03 | ) | (0.14 | ) | 0.00 | (1) | |||||||||||||
From net realized capital gains | — | — | — | — | (0.26 | ) | (0.22 | ) | ||||||||||||||||
Total distributions | — | (0.24 | ) | (0.40 | ) | (0.03 | ) | (0.40 | ) | (0.22 | ) | |||||||||||||
Paid-in capital from redemption fees(2) | — | — | 0.00 | (1) | 0.00 | (1) | 0.00 | (1) | 0.00 | (1) | ||||||||||||||
Net asset value, end of period | $ | 10.83 | $ | 9.91 | $ | 13.77 | $ | 13.35 | $ | 14.35 | $ | 11.77 | ||||||||||||
Total investment return/(loss)(4) | 9.28 | %(5) | (26.35 | )% | 6.16 | % | (6.78 | )% | 25.41 | % | (20.92 | )% | ||||||||||||
SUPPLEMENTAL DATA | ||||||||||||||||||||||||
Net assets, end of period (thousands) | $ | 91,753 | $ | 89,603 | $ | 203,580 | $ | 253,364 | $ | 533,731 | $ | 443,904 | ||||||||||||
Portfolio turnover rate | 14 | %(5) | 17 | % | 33 | % | 21 | % | 28 | % | 29 | % | ||||||||||||
RATIO OF EXPENSES TO AVERAGE NET ASSETS(3) | ||||||||||||||||||||||||
Before expense waivers/reimbursement and recoupments, including interest and dividend expense | 1.51 | %(6) | 1.47 | % | 1.32 | % | 1.29 | % | 1.22 | % | 1.19 | % | ||||||||||||
Before expense waivers/reimbursement and recoupments, excluding interest and dividend expense | 1.51 | %(6) | 1.47 | % | 1.32 | % | 1.29 | % | 1.22 | % | 1.19 | % | ||||||||||||
After expense waivers/reimbursement and recoupments, including interest and dividend expense | 1.35 | %(6) | 1.35 | % | 1.32 | % | 1.29 | % | 1.22 | % | 1.19 | % | ||||||||||||
After expense waivers/reimbursement and recoupments, excluding interest and dividend expense | 1.35 | %(6) | 1.35 | % | 1.32 | % | 1.29 | % | 1.22 | % | 1.19 | % | ||||||||||||
The accompanying notes are an integral part of these financial statements.
19
Evermore Global Value Fund
Financial Highlights for a capital share outstanding throughout the period/year, Continued |
Fiscal Period | Year Ended December 31, | |||||||||||||||||||||||
| 2023# | 2022^ | 2021^ | 2020^ | 2019^ | 2018^ | ||||||||||||||||||
RATIO OF NET INVESTMENT INCOME (LOSS) TO AVERAGE NET ASSETS2 | ||||||||||||||||||||||||
Before expense waivers/reimbursement and recoupments, including interest and dividend expense | 3.42 | %(6) | 2.71 | % | 1.60 | % | 0.21 | % | 0.91 | % | 0.60 | % | ||||||||||||
After expense waivers/reimbursement and recoupments, including interest and dividend expense | 3.58 | %(6) | 2.83 | % | 1.60 | % | 0.21 | % | 0.91 | % | 0.60 | % | ||||||||||||
Portfolio turnover is calculated for the Fund as a whole.
^ | Prior to the close of business on December 27, 2022, the Fund was a series (the “Predecessor Fund”) of Evermore Funds Trust, an open-end management investment company organized as a Massachusetts business trust. The Predecessor Fund was reorganized into the Fund following the close of business on December 27, 2022 (the “Reorganization”). As a result of the Reorganization, the performance and accounting history of the Predecessor Fund was assumed by the Fund. Performance and accounting information prior to December 28, 2022 included herein is that of the Predecessor Fund. |
# | Effective March 31, 2023, the Fund’s former investment adviser (the “Predecessor Adviser”) sold substantially all of its business and advisory assets to MFP Investors LLC (the “Sub-Adviser”). In connection with the change of control, F/m Investments, LLC d/b/a North Slope Capital, LLC was appointed as the investment adviser to the Fund. The performance shown for periods prior to March 31, 2023 represents the performance of the Fund or Predecessor Fund, as applicable, under the management of the Predecessor Adviser. The Fund changed its fiscal year end to August 31. The amounts shown are for the fiscal period from January 1, 2023 to August 31, 2023. |
* | Calculated using the average shares outstanding method. |
1 | Amount less than $0.01. |
2 | Prior to December 28, 2022, there was a 2.00% redemption fee to the value of shares redeemed or exchanged within 90 days of purchase. The redemption fees were retained by the Fund for the benefit of the remaining shareholders and recorded as paid-in capital. Effective December 28, 2022, the Fund eliminated its redemption fee. |
3 | Does not include expenses of the investment companies in which the Fund invests. |
4 | Total investment return/(loss) is calculated assuming a purchase of shares on the first day and a sale of shares on the last day of each period reported and includes reinvestments of dividends and distributions, if any. Total investment return does not reflect any applicable sales charge. |
5 | Not Annualized |
6 | Annualized |
20
Evermore Global Value Fund
Notes to Financial Statements August 31, 2023 |
NOTE 1 – ORGANIZATION
The Evermore Global Value Fund (the “Fund”) is a series of The RBB Fund Trust (the “Trust”). The Trust was organized as a Delaware statutory trust on August 29, 2014 and is registered under the Investment Company Act of 1940, as amended (the “1940 Act”), as an open-end management investment company. The Fund commenced operations on January 1, 2010 as a separate series (the “Predecessor Fund”) of Evermore Funds Trust, a Massachusetts business trust. Effective as of the close of business on December 27, 2022, the Predecessor Fund was reorganized into a new series of the Trust in a tax-free reorganization (the “Reorganization”). The Agreement and Plan of Reorganization pursuant to which the Reorganization was accomplished was approved by shareholders of the Predecessor Fund on December 21, 2022. Unless otherwise indicated, references to the “Fund” in these Notes to Financial Statements refer to the Predecessor Fund and Fund. Evermore Global Advisors, LLC (the “Predecessor Adviser”) served as the investment adviser to the Predecessor Fund until December 27, 2022 and served as the investment adviser to the Fund until March 31, 2023. Effective March 31, 2023, the Predecessor Adviser sold substantially all of its business and advisory assets to MFP Investors LLC (the “Sub-Adviser” or “MFP”). In connection with the change of control of the Predecessor Adviser, F/m Investments, LLC d/b/a North Slope Capital, LLC (the “Adviser”) was appointed as the investment adviser to the Fund, MFP was appointed as sub-adviser to the Fund, and David Marcus and Thomas O were hired by MFP to be the sole portfolio managers of the Fund. Other than the Adviser replacing the Predecessor Adviser as the Fund’s investment adviser and MFP becoming the sub-adviser to the Fund, the change of control did not result in any significant changes to the day-to-day management or operation of the Fund. At a meeting of the Board of Trustees of the Trust (the “Board”) held on September 13-14, 2023, the Board approved a change in fiscal year end for the Fund from December 31st to August 31st, effective August 31, 2023.
The investment objective of the Fund is to seek capital appreciation by investing in securities from markets around the world, including U.S. markets.
The Fund is an investment company and accordingly follows the investment company accounting and reporting guidance of the Financial Accounting Standards Board (“FASB”) Accounting Standard Codification Topic 946 “Financial Services-Investment Companies.”
The Fund offers Investor Class and Institutional Class shares. Each class of shares has equal rights as to earnings and assets except that each class bears different distribution expenses. Each class of shares has exclusive voting rights with respect to matters that affect just that class. Income, expenses (other than expenses attributable to a specific class), and realized and unrealized gains or losses on investments are allocated to each class of shares based on its relative net assets. Investor Class shares have no sales charge. Institutional Class shares have no sales charge and are offered primarily for direct investment by investors such as pension and profit sharing plans, employee benefit trusts, certain financial intermediaries, endowments, foundations and corporations. For Investor Class and Institutional Class shares, the offering and redemption price per share for the Fund is equal to the Fund’s net asset value (“NAV”) per share.
The end of the reporting period for the Fund is August 31, 2023, and the period covered by these Notes to Financial Statements is the fiscal period from January 1, 2023 through August 31, 2023 (the “current fiscal period”).
NOTE 2 – SIGNIFICANT ACCOUNTING POLICIES
The following is a summary of significant accounting policies consistently followed by the Fund. These policies are in conformity with U.S. generally accepted accounting principles (“U.S. GAAP”).
A. | Investment Valuation and Fair Value Measurement. The Board has adopted a pricing and valuation policy for use by the Fund and its Valuation Designee (as defined below) in calculating the Fund’s NAV. Pursuant to Rule 2a-5 under the 1940 Act, the Fund has designated the Adviser as its “Valuation Designee” to perform all of the fair value determinations as well as to perform all of the responsibilities that may be performed by the Valuation Designee in accordance with Rule 2a-5. The Valuation Designee is authorized to make all necessary determinations of the fair values of portfolio securities and other assets for which market quotations are not readily available or if it is deemed that the prices obtained from brokers and dealers or independent pricing services are unreliable. All domestic equity securities that are traded on a national securities exchange, except those listed on the National Association of Securities Dealers Automated Quotation System (“NASDAQ”) Global Market® are valued at the last reported sale price on the exchange on which the security is principally traded. Securities traded on NASDAQ will be valued at the NASDAQ Official Closing Price on each business day. If, on a particular day, an exchange-traded or NASDAQ security does not trade, then the mean between the most recent quoted bid and ask prices will be used, except on days when the ask price is more than 10% greater than the bid price. In such instances, the Valuation Designee will price the security based on fair value. All equity securities that are not traded on a listed exchange are valued at the last sale price in the over-the-counter (“OTC”) market. If a non-exchange traded security does not trade on a particular day, then the mean between the last quoted closing bid and ask price will be used, except on days when the ask price is more than 10% greater than the bid price. In such instances, the Valuation Designee will price the security based on fair value. |
21
Evermore Global Value Fund
Notes to Financial Statements August 31, 2023, Continued |
The Fund invests substantially in securities traded on foreign exchanges (see “Foreign Currency Translation” below). Investments that are primarily traded on foreign exchanges are generally valued in their local currencies as of the close of their primary exchange or market, or if there were no transactions on such day, at the mean between the bid and ask prices, except on days when the ask price is more than 10% greater than the bid price. In such instances, the Valuation Designee will price the security based on fair value. The local prices are converted to U.S. dollars using the applicable currency exchange rates as of the close of the New York Stock Exchange (“NYSE”). Exchange rates are provided daily by recognized independent pricing agents. Foreign currency forward contracts are valued at the current day’s interpolated foreign exchange rate, as calculated using the current day’s exchange rate, and the relevant forward rates provided by an independent pricing service.
There may be less publicly available information about a foreign company than about a U.S. company. Foreign issuers may not be subject to accounting, auditing and financial reporting standards and requirements comparable to, or as uniform as, those of U.S. issuers. The number of securities traded, and the frequency of such trading, in non-U.S. securities markets, while growing in volume, is for the most part, substantially less in U.S. markets. As a result, securities of many foreign issuers may be less liquid and their prices more volatile than securities of comparable U.S. issues. Transaction costs, the costs associated with buying and selling securities on non-U.S. securities markets may be higher than in the U.S. There is generally less government supervision and regulation of exchanges, brokers and issuers than there is in the U.S. The Fund’s foreign investments may include both voting and non-voting securities, sovereign debt and participations in foreign government deals. The Fund may have greater difficulty taking appropriate legal action with respect to foreign issuers in U.S. courts.
For foreign securities traded on foreign exchanges, the Trust has selected Intercontinental Exchange’s Fair Value Information Services (“FVIS”) to provide pricing data with respect to foreign security holdings held by the Fund. The use of this third-party pricing service is designed to capture events occurring after a foreign exchange closes that may affect the value of certain holdings of the Fund’s securities traded on those foreign exchanges. The Fund utilizes a “trigger level”, which is a pre-determined percentage move in a specified index that must occur before foreign securities will be fair value priced using FVIS prices. The Fund utilizes a “confidence interval” when determining the use of the FVIS prices. The confidence interval is a measure of the historical relationship that each foreign exchange traded security has to movements in various indices and the price of the security’s corresponding American Depositary Receipt, if one exists. FVIS provides the confidence interval for each security for which it provides a price. If the FVIS provided price falls within the confidence interval, the Fund will value the particular security at that price. If the FVIS provided price does not fall within the confidence interval, the particular security will be valued at the preceding closing price on its respective foreign exchange, or if there were no transactions on such day, at the mean between the bid and asked prices. There were no foreign equities fair valued using FVIS as of August 31, 2023.
Securities for which quotations are not readily available are fair valued in accordance with the Fund’s pricing and valuation policy. When a security is “fair valued,” consideration is given to the facts and circumstances relevant to the particular situation. Fundamental valuation methods may be used to fair value a security held by the Fund, which methods may include, but are not limited to, an analysis of the effect of any restrictions on the resale of the security, industry analysis and trends, significant changes in the issuer’s financial position, and any other event that could have a significant impact on the value of the security. The use of fair value pricing by a fund may cause the NAV of its shares to differ significantly from the NAV that would be calculated without regard to such considerations.
As described above, the Fund utilizes various methods to measure the fair value of its investments on a recurring basis. U.S. GAAP establishes a hierarchy that prioritizes inputs to valuation methods. The three levels of inputs are:
Level 1 — | Unadjusted quoted prices in active markets for identical assets or liabilities that the Fund has the ability to access. The types of assets generally included in this category are domestic equities listed in active markets and foreign equities listed in active markets that have not been fair valued using FVIS. |
Level 2 — | Observable inputs other than quoted prices included in Level 1 that are observable for the asset or liability, either directly or indirectly. These inputs may include quoted prices for the identical instrument on an inactive market, prices for similar instruments, interest rates, credit risk, yield curves and similar data. The types of assets generally included in this category are bonds, financial instruments classified as derivatives and foreign equities fair valued using FVIS. |
Level 3 — | Significant unobservable inputs that are supported by limited or no market activity. Level 3 may include financial instruments whose values are determined using indicative market quotes or required significant management judgment or estimation. These unobservable valuation inputs may include estimates for current yields, maturity/duration, prepayment speed, default rates and indicative market quotes for comparable investments along with other assumptions relating to credit quality, collateral value, complexity of the investment structure, general market conditions and liquidity. This category may also include investments where trading has been halted or there are certain restrictions on trading. While these investments are priced using unobservable inputs, the valuation of these investments reflects the best available data and management believes the prices are a reasonable representation of exit price. |
22
Evermore Global Value Fund
Notes to Financial Statements August 31, 2023, Continued |
The availability of observable inputs can vary from security to security and is affected by a wide variety of factors, including, for example, the type of security, whether the security is new and not yet established in the marketplace, the liquidity of markets, and other characteristics particular to the security. To the extent that valuation is based on models or inputs that are less observable or unobservable in the market, the determination of fair value requires more judgment. Accordingly, the degree of judgment exercised in determining fair value is greatest for instruments categorized in Level 3.
The inputs used to measure fair value may fall into different levels of the fair value hierarchy. In such cases, for disclosure purposes, the level in the fair value hierarchy within which the fair value measurement falls in its entirety, is determined based on the lowest level input that is significant to the fair value measurement in its entirety.
The inputs or methodology used for valuing securities are not necessarily an indication of the risk associated with investing in those securities. The following is a summary of the level inputs used to value the Fund’s net assets as of August 31, 2023 (see Schedule of Investments for industry breakout):
Level 1 | Level 2 | Level 3 | Total | |||||||||||||
Assets | ||||||||||||||||
Common Stocks | $ | 82,645,317 | $ | — | $ | — | $ | 82,645,317 | ||||||||
Corporate Obligations | — | — | 12,301,596 | 12,301,596 | ||||||||||||
Short-Term Investments | 11,187,456 | — | — | 11,187,456 | ||||||||||||
Securities Held as Collateral on Loaned Securities | 1,384,695 | — | — | 1,384,695 | ||||||||||||
Total Investments in Securities | 95,217,468 | — | 12,301,596 | 107,519,064 | ||||||||||||
Unrealized appreciation on Forward Foreign Currency * | — | 3,445 | — | — | ||||||||||||
Total Assets | $ | 95,217,468 | $ | 3,445 | $ | 12,301,596 | 107,522,509 | |||||||||
Liabilities | ||||||||||||||||
Unrealized depreciation on Forward Foreign Currency* | — | $ | 89,673 | — | $ | 89,673 | ||||||||||
Total Liabilities | $ | — | $ | 89,673 | $ | — | $ | 89,673 | ||||||||
* | Forward foreign currency contracts are reflected at the unrealized appreciation (depreciation). |
Below is a reconciliation of Level 3 assets for which significant unobservable inputs were used to determine fair value:
Description | Corporate | |||
Balance as of January 1, 2023 | $ | 11,202,784 | ||
Investment received in-kind | 405,114 | |||
Sales proceeds and paydowns | — | |||
Accreted discounts, net | — | |||
Corporate Actions | — | |||
Realized gain (loss) | — | |||
Change in unrealized appreciation (depreciation) | 693,698 | |||
Transfers into/(out of ) Level 3 | — | |||
Balance as of August 31, 2023 | $ | 12,301,596 | ||
Change in unrealized appreciation (depreciation) during the current fiscal period for Level 3 investments held at August 31, 2023 | $ | 693,698 | ||
23
Evermore Global Value Fund
Notes to Financial Statements August 31, 2023, Continued |
The Level 3 amounts disclosed in the table above consist of one security that is fair valued in good faith, using significant unobservable inputs, by the Valuation Designee. The table below indicates the quantitative information about Level 3 fair value measurements for the securities still held at August 31, 2023:
Investment Type | Fair Value | Valuation | Unobservable | Inputs | Market Value |
Corporate Obligation | 12,301,596 | Discounted Cash Flow | Yield | 27.91% to 29.07% (28.43%) | Decrease |
B. | Option Writing. Writing options may permit the writer to generate additional income in the form of the premium received for writing the option. The writer of an option may have no control over when the underlying reference instruments must be sold (in the case of a call option) or purchased (in the case of a put option) because the writer may be notified of exercise at any time prior to the expiration of the option (for American style options). In general, though, options are infrequently exercised prior to expiration. Whether or not an option expires unexercised, the writer retains the amount of the premium. Writing “covered” call options means that the writer owns the underlying reference instrument that is subject to the call option. Call options may also be written on reference instruments that the writer does not own. |
When the Fund writes an option, an amount equal to the premium received by the Fund is recorded as a liability and is subsequently adjusted to the current fair value of the option written. Premiums received from writing options that expire unexercised are treated by the Fund on the expiration date as realized gains from investments. The difference between the premium received and the amount paid for the closing purchase transaction, including brokerage commissions, is also treated as a realized gain, or, if the premium is less than the amount paid for the closing purchase transaction, as a realized loss. If a call option is exercised, the premium is added to the proceeds from the sale of the underlying security or currency in determining whether the Fund has realized a gain or loss. If a put option is exercised, the premium reduces the cost basis of the securities purchased by the Fund. The Fund as writer of an option bears the market risk of an unfavorable change in the price of the security underlying the written option. As of August 31, 2023, there were no written options held.
C. Financial Derivative Instruments. The Fund may use derivative instruments for risk management purposes and as part of its investment strategies. Generally, derivatives are financial instruments whose value depends on, or is derived from, the value of one or more underlying assets, reference rates, or indices (a “reference instrument”) and may relate to stocks, bonds, interest rates, currencies, commodities or related indices. Derivative instruments allow the Fund to gain or reduce exposure to the value of a reference instrument without actually owning or selling the instrument.
Derivative instruments may be used for “hedging,” which means that they may be used when the Sub-Adviser seeks to protect the Fund’s investments from a decline in value resulting from changes to interest rates, market prices, currency fluctuations or other market factors. Derivative instruments may also be used for other purposes, including to seek to increase liquidity, provide efficient portfolio management, broaden investment opportunities (including taking short or negative positions), implement a tax or cash management strategy, gain exposure to a particular security or segment of the market, modify the effective duration of the Fund’s portfolio investments and/or enhance total return. However derivative instruments are used, their successful use is not assured and will depend upon, among other factors, the Sub-Adviser’s ability to gauge relevant market movements.
During the current fiscal period, the Fund utilized forward foreign currency exchange contracts to hedge its currency exposure through the use of forward foreign currency contracts. During the current fiscal period, these forward foreign currency contracts have contributed positively to Fund performance. The Fund may invest in options to hedge portfolio tail risk. During the current fiscal period, the Fund did not invest in options.
24
Evermore Global Value Fund
Notes to Financial Statements August 31, 2023, Continued |
Statement of Assets and Liabilities
The following tables show the fair value of derivative instruments as of August 31, 2023 and their location on the Fund’s Statement of Assets and Liabilities:
Asset Derivatives | Liability Derivatives | |||||||||
Derivative | Statement of Assets | Value | Statement of Assets | Value | ||||||
Foreign Exchange Contracts – Forward foreign currency contracts | Unrealized appreciation on forward foreign currency contracts | $ | 3,445 | Unrealized depreciation on forward foreign currency contracts | $ | 89,673 | ||||
Total | $ | 3,445 | $ | 89,673 | ||||||
Statement of Operations
The following table shows the effect of derivative instruments on the Statement of Operations for the current fiscal period:
Amount of Realized Gain (Loss) on Derivatives Recognized in Income | ||||
Forward | ||||
Foreign Exchange Contracts | $ | 1,695,160 | ||
Total | $ | 1,695,160 | ||
Change in Unrealized Appreciation or (Depreciation) on Derivatives Recognized in Income | ||||||||
Forward | Total | |||||||
Foreign Exchange Contracts | $ | 541,857 | $ | 541,857 | ||||
Total | $ | 541,857 | $ | 541,857 | ||||
For the current fiscal period 2023, the Fund’s monthly average volume of derivatives was as follows:
Forward Foreign | Forward Foreign |
(55,730,563) | 55,554,920 |
D. | Principal Risks from the Investments. |
Foreign Securities Risk. Securities of companies located outside the U.S. involve additional risks that can increase the potential for losses in the Fund to the extent that it invests in these securities. Investments in foreign securities may be affected by currency controls and exchange rates; different accounting, auditing, financial reporting, and legal standards and practices; expropriation; changes in tax policy; greater market volatility; differing securities market structures; higher transaction costs; and various administrative difficulties, such as delays in clearing and settling portfolio transactions or in receiving payment of dividends. Certain of these risks also may apply to securities of U.S. companies with significant foreign operations. These risks can increase the potential for losses in the Fund and affect its share price. To the extent that the Fund’s assets are significantly invested in a single country or geographic region, the Fund will be subject to the risks associated with that particular country or region.
25
Evermore Global Value Fund
Notes to Financial Statements August 31, 2023, Continued |
Special Situations Risk. Investments in special situations (undervalued equities, merger arbitrage situations, distressed companies, etc.) may involve greater risks when compared to other investments the Fund may make due to a variety of factors. For example, mergers, acquisitions, reorganizations, liquidations or recapitalizations may fail or not be completed on the terms originally contemplated, and expected developments may not occur in a timely manner, if at all.
Small and/or Mid-Sized Companies Risk. Investments in securities of small and mid-sized companies tend to be more vulnerable to adverse developments and are more volatile and less liquid than securities of large companies. Compared to large companies, small and mid-sized companies tend to have analyst coverage by fewer Wall Street firms and may trade at prices that reflect incomplete or inaccurate information about the issuers of the securities or have less market interest for such securities.
Industry and Sector Risk. To the extent the Fund invests a significant portion of its assets in a particular industry or sector, the value of its investments will be affected by factors related to that industry or sector and may fluctuate more widely than that of a fund that invests more broadly across industries or sectors.
● | Communication Services Sector Risk. The Fund’s investments are exposed to issuers conducting business in the communication services sector. The communication services sector includes companies that facilitate communication and offer related content and information through various mediums. It includes telecom and media & entertainment companies including producers of interactive gaming products and companies engaged in content and information creation or distribution through proprietary platforms. The Fund is subject to the risk that the securities of such issuers will underperform the market as a whole due to legislative or regulatory changes, adverse market conditions and/or increased competition affecting the communication services sector. The performance of companies operating in the communication services sector has historically been closely tied to the performance of the overall economy, and also is affected by economic growth, consumer confidence, attitudes and spending. Increased sensitivity to short product cycles and aggressive pricing, challenges in bringing products to market and changes in demographics and consumer tastes also can affect the demand for, and success of, communication services products and services in the marketplace. |
● | Energy Sector Risk. The Fund may invest to a significant extent in the energy sector of the economy. Companies in the energy industry may be significantly affected by volatile energy prices and supply and demand of energy fuels, conservation efforts, energy exploration and production, government regulation, weather or natural disasters and global events. Energy companies may also operate in, or do business in, countries with less developed regulatory regimes or countries with a history of expropriation, nationalization or other adverse policies. Because of this, the securities of energy companies can be very volatile. Energy companies may also have high levels of debt, making them more likely to restructure their businesses if there are market downturns in the energy sector or in the market as a whole. |
● | Financial Sector Risk. Financial services companies are subject to extensive governmental regulation which may limit both the amounts and types of loans and other financial commitments they can make, the interest rates and fees they can charge, the scope of their activities, the prices they can charge and the amount of capital they must maintain. Profitability is largely dependent on the availability and cost of capital funds and can fluctuate significantly when interest rates change or due to increased competition. In addition, deterioration of the credit markets generally may cause an adverse impact in a broad range of markets, including U.S. and international credit and interbank money markets generally, thereby affecting a wide range of financial institutions and markets. |
● | Industrials Sector Risk. The Fund may invest to a significant extent in the industrials sector of the economy. The value of securities issued by companies in the industrials sector may be adversely affected by supply and demand related to their specific products or services and industrials sector products in general. The products of manufacturing companies may face obsolescence due to rapid technological developments and frequent new product introduction. Government regulations, world events, economic conditions and exchange rates may adversely affect the performance of companies in the industrials sector. Companies in the industrials sector may be adversely affected by liability for environmental damage and product liability claims. The industrials sector may also be adversely affected by changes or trends in commodity prices, which may be influenced by unpredictable factors. |
● | Information Technology Sector Risk. The information technology sector includes companies in the software and services, technology hardware and equipment, and semiconductors and semiconductor equipment industry groups. Companies in the information technology sector are subject to rapid obsolescence of existing technology, short product cycles, falling prices and profits, competition from new market entrants, and general economic conditions. Stocks of companies in the information technology sector, especially those of smaller, less-seasoned companies, tend to be more volatile than the overall market. Technological developments, fixed rate pricing, and the ability to retain skilled employees can significantly affect the industries in the information technology sector. Additionally, success in the internet services and infrastructure industry is subject to continued demand for internet services. |
26
Evermore Global Value Fund
Notes to Financial Statements August 31, 2023, Continued |
Currency Exchange Rate Risk. The values of foreign securities issued or traded in foreign currencies may be affected by changes in exchange rates between foreign currencies and the U.S. dollar, as well as between currencies of countries other than the U.S. For example, if the value of the U.S. dollar goes up compared to a foreign currency, an investment traded in that foreign currency will go down in value because it will be worth fewer U.S. dollars. The Fund may also employ strategies intended to increase exposure to certain currencies. Such currency transactions involve additional risks, and the Fund’s strategies, if unsuccessful, may decrease the value of the Fund.
Derivative Investment Risk. Derivatives are subject to a number of risks, such as interest rate risk, market risk, credit risk, and foreign exchange risk. Changes in the value of the derivative may not correlate perfectly with the underlying asset, rate or index, and the Fund may lose more money than its initial investment in the derivative. A small investment in a derivative could have a relatively large positive or negative impact on the performance of the Fund, potentially resulting in losses to Fund shareholders. In addition, there is the risk that an investment in derivatives will not perform as anticipated, cannot be closed out at a favorable time or price, or will increase the Fund’s volatility; that derivatives may create investment leverage; that, when a derivative is used as a substitute or alternative to a direct cash investment, the transaction may not provide a return that corresponds precisely with that of the cash investment; or that, when used for hedging purposes, derivatives will not provide the anticipated protection, causing the Fund to lose money on both the derivatives transaction and the exposure the Fund sought to hedge. The use of derivatives is a highly specialized activity that involves investment techniques and risks different from those associated with investments in more traditional securities and instruments.
Emerging Market Risk. The risks of foreign investments in emerging market countries may involve risks greater than, or in addition to, the risks of investing in more developed countries. These risks include volatile currency exchange rates, periods of high inflation, increased risk of default, greater social, economic and political uncertainty and instability, less governmental supervision and regulation of securities markets, weaker auditing and financial reporting standards, lack of liquidity in the markets, and the significantly smaller market capitalizations of emerging market issuers. The information available about an emerging market issuer may be less reliable than for comparable issuers in more developed capital markets. In addition, investments in certain emerging markets are subject to an elevated risk of loss resulting from market manipulation and the imposition of exchange controls (including repatriation restrictions). The legal rights and remedies available for investors in emerging markets may be more limited than the rights and remedies available in the U.S., and the ability of U.S. authorities (e.g., Securities and Exchange Commission (“SEC”) and the U.S. Department of Justice) to bring actions against bad actors in emerging markets may be limited. Political and economic structures in emerging market countries may be less established and may change rapidly. These countries also are more likely to experience high levels of inflation, deflation or currency devaluation, which can harm their economies and securities markets and increase volatility. In fact, short-term volatility in these markets and declines of 50% or more are not uncommon. Restrictions on currency trading that may be imposed by emerging market countries will have an adverse effect on the value of the securities of companies that trade or operate in such countries.
Family-Controlled Companies Risk. The Fund may invest a significant portion of its assets in the securities of issuers that it deems to be “family-controlled companies.” Corporate governance standards of some family-controlled companies may be weaker and less transparent, which increases the potential for loss and unequal treatment of investors. In addition, many family-controlled companies utilize a dual class ownership structure where insider shares carry greater voting rights per share than non-insider shares and therefore allow the family to continue to have outsized control even after selling of a significant portion of the company to outsiders.
United States Investing Risk. A decrease in imports or exports, changes in trade regulations and/or an economic recession in the U.S. may have a material adverse effect on the U.S. economy and the securities listed on U.S. exchanges. Proposed and adopted policy and legislative changes in the U.S. are changing many aspects of financial and other regulation and may have a significant effect on the U.S. markets generally, as well as on the value of certain securities. In addition, a continued rise in the U.S. public debt level or U.S. austerity measures may adversely affect U.S. economic growth and the securities to which the Fund has exposure.
An investment in the Fund is not a bank deposit or obligation of any bank and is not endorsed or guaranteed by any bank and is not insured or guaranteed by the U.S. government, the Federal Deposit Insurance Corporation, the Federal Reserve Board or any other governmental agency.
E. | Offsetting Assets and Liabilities. The Fund is subject to various Master Netting Arrangements, which govern the terms of certain transactions with select counterparties. The Master Netting Arrangements allow the Fund to close out and net its total exposure to a counterparty in the event of a default with respect to all the transactions governed under a single agreement with a counterparty. The Master Netting Arrangements also specify collateral posting arrangements at pre-arranged exposure levels. Under the Master Netting Arrangements, collateral is routinely transferred if the total net exposure to certain transactions (net of existing collateral already in place) governed under the relevant Master Netting Arrangement with a counterparty in a given account exceeds a specified threshold depending on the counterparty and the type of Master Netting Arrangement. |
27
Evermore Global Value Fund
Notes to Financial Statements August 31, 2023, Continued |
The table below, as of August 31, 2023, discloses both gross information and net information about instruments and transactions eligible for offset in the Statement of Assets and Liabilities and instruments and transactions that are subject to an agreement similar to a master netting agreement, as well as amounts related to collateral held at clearing brokers and counterparties. For financial reporting purposes, the Fund does not offset derivative assets and liabilities, and any related collateral received or pledged, on the Statement of Assets and Liabilities.
Assets
Gross Amounts not | ||||||||||||||||||||||||
Description/ | Gross | Gross | Net | Financial | Collateral | Net | ||||||||||||||||||
Securities out on loan U.S. Bank N.A. | $ | 1,285,040 | $ | — | $ | 1,285,040 | $ | — | $ | (1,285,040 | )1 | $ | — | |||||||||||
Forward Foreign Currency Contracts Bank of New York | 3,445 | — | 3,445 | (3,445 | ) | — | — | |||||||||||||||||
| $ | 1,288,485 | $ | — | $ | 1,288,485 | $ | (3,445 | ) | $ | (1,285,040 | )1 | $ | — | |||||||||||
Liabilities
Gross Amounts not | ||||||||||||||||||||||||
Description/ | Gross | Financial | Net | Financial | Collateral | Net | ||||||||||||||||||
Forward Foreign Currency Contracts Bank of New York | $ | 89,673 | $ | — | $ | 89,673 | $ | (3,445 | ) | $ | (86,228 | ) | $ | — | ||||||||||
| $ | 89,673 | $ | — | $ | 89,673 | $ | (3,445 | ) | $ | (86,228 | ) | $ | — | |||||||||||
1 | The Fund received cash collateral of $1,384,695, which was subsequently invested in the First American Government Obligations Fund - Class X as reported in the Schedule of Investments. |
In some instances, the collateral amounts disclosed in the tables were adjusted due to the requirement to limit the collateral amounts to avoid the effect of overcollateralization. Actual collateral received/pledged may be more than the amounts disclosed herein.
F. | Foreign Currency Translation. Investment securities and other assets and liabilities denominated in foreign currencies are translated into U.S. dollar amounts at the date of valuation. Purchases and sales of investment securities and income and expense items denominated in foreign currencies are translated into U.S. dollar amounts on the respective dates of such transactions. |
28
Evermore Global Value Fund
Notes to Financial Statements August 31, 2023, Continued |
The Fund does not isolate that portion of the results of operations resulting from changes in foreign exchange rates on investments from the fluctuations arising from changes in market prices of securities held. Such fluctuations are included with the net realized and unrealized gain or loss from investments.
The Fund reports net realized foreign exchange gains or losses that arise from sales of foreign currencies, currency gains or losses realized between the trade and settlement dates on securities transactions, and the difference between the amounts of dividends, interest, and foreign withholding taxes recorded on the Fund’s books and the U.S. dollar equivalent of the amounts actually received or paid. Net unrealized foreign exchange gains and losses arise from changes in the fair values of assets and liabilities, other than investments in securities at fiscal year end, resulting from changes in exchange rates.
G. | Federal Income Taxes. The Fund has elected to be taxed as a “regulated investment company” and intends to distribute substantially all taxable income to its shareholders and otherwise comply with the provisions of Subchapter M of the Internal Revenue Code applicable to regulated investment companies. Therefore, no provision for federal income taxes or excise taxes has been made. |
In order to avoid imposition of the excise tax applicable to regulated investment companies, the Fund intends to declare each year as dividends in each calendar year at least 98.0% of its net investment income (earned during the calendar year) and 98.2% of its net realized capital gains (earned during the twelve months ended October 31) plus undistributed amounts, if any, from prior years.
A regulated investment company may elect to treat any portion of its qualified late year losses as arising on the first day of the next taxable year. Qualified late year losses are any ordinary and net capital losses incurred between November 1 and the end of the fiscal year, August 31. For the taxable year ended August 31, 2023, the Fund does not intend to defer any late-year ordinary and capital losses.
As of August 31, 2023, the Fund had Short Term Capital Loss Carryovers of $6,649,411 and Long Term Capital Loss Carryovers of $64,789,573 available for federal income tax purposes. During the tax year ended August 31, 2023, the Fund did not utilize any Short Term Capital Loss Carryover or Long Term Capital Loss Carryover.
Additionally, U.S. generally accepted accounting principles require that certain components of net assets relating to permanent differences be reclassified between financial and tax reporting. These reclassifications have no effect on net assets or NAV per share. For the fiscal period ended August 31, 2023, the Fund had no reclassifications of net assets.
The Fund recognizes the tax benefits of uncertain tax positions only where the position is “more likely than not” to be sustained assuming examination by tax authorities. The Fund recognizes interest and penalties, if any, related to unrecognized tax benefits as other expense in the Statement of Operations. Management has analyzed the Fund’s tax positions, and has concluded that no liability for unrecognized tax benefits should be recorded related to uncertain tax positions taken on returns filed for the open tax years (2020 - 2022), or expected to be taken in the Fund’s 2023 tax returns. In the normal course of business, the Fund is subject to examination by federal, state and local jurisdictions, where applicable, for tax years for which applicable statutes of limitations have not expired.
The Fund seeks to recover a portion of foreign withholding taxes applied to income earned in jurisdictions where favorable treaty rates for US investors are available. The portion of such taxes believed to be recoverable is reflected as an asset on the Statement of Assets and Liabilities under the caption “Dividend Reclaims”.
H. | Forward Foreign Currency Contracts. The Fund may enter into forward foreign currency contracts as hedges against either specific transactions or fund positions. The aggregate principal amount of the contracts are not recorded because the Fund intends to settle the contracts prior to delivery. All commitments are marked-to-market daily at the applicable foreign exchange rate, and any resulting unrealized gains or losses are recorded currently. The Fund realizes gains or losses at the time the forward contracts are extinguished. For federal income tax purposes, the Fund elected capital treatment for all realized and unrealized transactions on forward foreign currency contracts during the current fiscal period. |
The use of forward foreign currency contracts does not eliminate fluctuations in the underlying prices of the securities, but it does establish a rate of exchange that can be achieved in the future. Although forward foreign currency contracts limit the risk of loss due to a decline in the value of the hedged currency, they also limit a potential gain that might result should the value of the currency increase. These contracts involve market risk in excess of the amount reflected in the Fund’s Statement of Assets and Liabilities. The face or contract amount in U.S. dollars reflects the total exposure the Fund has in that particular currency contract. In addition, there could be exposure to risks (limited to the amount of unrealized gains) if the counterparties to the contracts are unable to meet the terms of their contracts.
The Fund helps manage counterparty credit risk by entering into agreements only with counterparties the Sub-Adviser believes have the financial resources to honor their obligations and by having the Sub-Adviser monitor the financial stability of counterparties. Collateral pledges are monitored and subsequently adjusted if and when the valuations fluctuate, either up or down by at least the predetermined threshold amount.
29
Evermore Global Value Fund
Notes to Financial Statements August 31, 2023, Continued |
I. | Short Sales. The Fund may make short sales of securities, including “short sales against the box.” In a short transaction, a fund sells a security it does not own in anticipation that the market price of that security will decline. The Fund expects to make short sales (i) as a form of hedging to offset potential declines in long positions in similar securities, (ii) in order to maintain portfolio flexibility and (iii) for profit. |
When the Fund makes a short sale, its broker borrows the security to be sold short and the broker-dealer maintains the proceeds of the short sale while the short position is open. The Fund must keep the proceeds account marked to market and must post additional collateral for its obligation to deliver securities to replace the securities that were borrowed and sold short. The Fund may have to pay a fee to borrow particular securities and is often obligated to pay over any payments received on such borrowed securities.
A Fund’s obligation to replace borrowed securities will be secured by collateral deposited with the broker-dealer or the Fund’s custodian bank, which usually consists of U.S. government securities or other high grade liquid securities similar to those borrowed. The Fund will also be required to segregate similar collateral to the extent, if any (excluding any proceeds of the short sales), necessary so that the value of both collateral deposits in the aggregate is at all times equal to at least 100% of the current market value of the security sold short.
Short sales carry risks of loss if the price of the security sold short increases after the sale. In this situation, when a Fund replaces the borrowed security by buying the security in the securities market, the Fund may pay more for the security than it has received from the purchaser in the short sale. A Fund may, however, profit from a change in the value of the security sold short, if the price decreases. As of August 31, 2023, there were no short sales.
J. | Security Transactions and Investment Income. Investment securities transactions are accounted for on the trade date. Gains and losses realized on sales of securities are determined by use of the specific identification method for both financial reporting and income tax purposes in determining realized gains and losses on investments. Discounts/premiums on debt securities purchased are accreted/ amortized over the life of the respective securities using the effective interest method. Dividend income is recorded on the ex-dividend date. Interest income is recorded on an accrual basis. Other non-cash dividends are recognized as investment income at the full value of the property received. Withholding taxes on foreign dividends have been provided for in accordance with the Trust’s understanding of the applicable country’s tax rules and rates. |
K. | Distributions to Shareholders. Distributions to shareholders from net investment income and net realized gains on securities for the Fund, which are determined in accordance with income tax regulations, are normally declared and paid on an annual basis. Distributions are recorded on the ex-dividend date. The Fund may also pay a special distribution at the end of the calendar year to comply with Federal tax requirements. |
L. | Use of Estimates. The preparation of financial statements in conformity with U.S. GAAP requires management to make estimates and assumptions that affect the reported amounts of assets and liabilities at the date of the financial statements and the reported amount of revenue and expenses during the current fiscal period. Actual results could differ from those estimates. |
M. Share Valuation. The NAV per share of the Fund is calculated by dividing the sum of the value of the securities held by the Fund, plus cash or other assets, minus all liabilities (including estimated accrued expenses) by the total number of shares outstanding for the Fund, rounded to the nearest cent. The Fund’s shares will not be priced on the days on which the NYSE is closed for trading.
N. | Guarantees and Indemnifications. In the normal course of business, the Fund enters into contracts with service providers that contain general indemnification clauses. The Fund’s maximum exposure under these arrangements is unknown as this would involve future claims that may be made against the Fund that have not yet occurred. However, based on experience, the Fund expects the risk of loss to be remote. |
O. | Securities Lending. The Fund is authorized to lend securities it holds to brokers, and other financial organizations. This activity is subject to an agreement where U.S. Bank N.A. acts as the Fund’s agent. When loaning securities, the Fund retains the benefits of owning the securities, including the economic equivalent of dividends or interest generated by the security. Pursuant to these agreements, income earned from the securities lending program is paid to the Fund, net of any fees paid to U.S. Bank N.A. and is recognized as “Securities lending net income” on the Statement of Operations. |
Lending of the Fund’s securities exposes the Fund to risks such as the following: (i) the borrower may fail to return the loaned securities, (ii) the borrower may not be able to provide additional collateral in instances when the value of the collateral is less than the loaned securities, (iii) the Fund may experience delays in recovery of the loaned securities or delays in access to collateral, or (iv) the Fund may experience losses related to the reinvestment of collateral. To minimize these risks, loans must be continuously secured by collateral consisting of cash or securities issued or guaranteed by the U.S. government or one of its agencies or instrumentalities, or an irrevocable standby letter of credit or any combination thereof. The collateral and the securities loaned shall be marked to market daily. Upon the origination of any
30
Evermore Global Value Fund
Notes to Financial Statements August 31, 2023, Continued |
loan, collateral required by U.S. Bank N.A. shall be equal to 100% of the market value (plus accrued interest) of the securities loaned. The collateral must be received concurrently with delivery of the loaned securities and the collateral must be kept in an account appropriately segregated by the custodian from any assets belonging to the Fund. The value of the collateral requirement is determined based upon the closing price of a borrowed security, with the collateral balance adjusted the following business day. Although there is no specified time limit regarding how long a security may be out on loan, the Fund or the borrower may request that a security on loan be returned at any time. If the Fund requests that a specific security be returned, and the borrower fails to return such security, the Fund will be able to retain the borrower’s collateral. Assets in the collateral account will be invested by U.S. Bank N.A., as directed by the Sub-Adviser in a short term U.S. government money market instrument that constitutes an “Eligible Security” (as defined in Rule 2a-7 under the 1940 Act). All of the assets that are held by the collateral account will be valued on an amortized cost basis to the extent permitted by applicable Commission or staff releases, rules, letters or orders.
During the current fiscal period, the Fund had loaned securities that were collateralized by cash. The cash collateral received was invested in the First American Government Obligations Fund - X Class Shares and is presented in the Fund’s Schedule of Investments as “Securities Held as Collateral on Loaned Securities.” The securities lending program restricts investments to several prescribed money market funds along with a collateralized separate account investment option.
P. | Restricted and Illiquid Securities. The Fund will not purchase nor otherwise acquire any investment if, as a result, more than 15% of its net assets (taken at current market value) would be invested in securities that are illiquid. Generally speaking, an illiquid security is any asset or investment of which the Fund cannot sell a normal trading unit in the ordinary course of business within seven days at approximately the value at which the Fund has valued the asset or investment, including securities that cannot be sold publicly due to legal or contractual restrictions. The sale of illiquid securities often requires more time and results in higher brokerage charges or dealer discounts and other selling expenses than does the sale of securities eligible for trading on national securities exchanges or in the OTC markets. Restricted securities may sell at a price lower than similar securities that are not subject to restrictions on resale. |
Over the past several years, strong institutional markets have developed for various types of restricted securities, including repurchase agreements, some types of commercial paper, and some corporate bonds and notes (commonly known as “Rule 144A Securities”). Securities freely salable among qualified institutional investors under special rules adopted by the SEC, or otherwise determined to be liquid, may be treated as liquid if they satisfy liquidity standards established by the Board. The continued liquidity of such securities is not as well assured as that of publicly traded securities, and accordingly, the Board will monitor their liquidity. The Board will review pertinent factors such as trading activity, reliability of price information and trading patterns of comparable securities in determining whether to treat any such security as liquid for purposes of the foregoing 15% test. To the extent the Board treats such securities as liquid, temporary impairments to trading patterns of such securities may adversely affect the Fund’s liquidity. The Fund may, from time to time, participate in private investment vehicles and/or in equity or debt instruments that do not trade publicly and may never trade publicly. These types of investments carry a number of special risks in addition to the normal risks associated with equity and debt investments. In particular, private investments are likely to be illiquid, and it may be difficult or impossible to sell these investments under many conditions. The Fund may from time to time establish one or more wholly-owned special purpose subsidiaries in order to facilitate the Fund’s investment program which may reduce certain of the costs (e.g. tax consequences) to the Fund.
Q. REIT Distributions. The character of distributions received from real estate investment trusts (“REITs”) held by the Fund is generally comprised of net investment income, capital gains, and return of capital. It is the policy of the Fund to estimate the character of distributions received from underlying REITs based on historical data provided by the REITs. After each calendar year end, REITs report the actual tax character of these distributions. Differences between the estimated and actual amounts reported by the REITs are reflected in the Fund’s records in the year in which they are reported by the REITs by adjusting related investment cost basis, capital gains and income, as necessary.
R. | LIBOR Discontinuation. Many financial instruments use or may use a floating rate based on the London Interbank Offered Rate, or “LIBOR,” which is the offered rate for short-term Eurodollar deposits between major international banks. On July 27, 2017, the Financial Conduct Authority (“FCA”) announced a desire to phase out the use of LIBOR by the end of 2021. The FCA and ICE Benchmark Administrator have since announced that most LIBOR settings will no longer be published after December 31, 2021 and a majority of U.S. dollar LIBOR settings will cease publication after June 30, 2023. It is possible that a subset of LIBOR settings will be published after these dates on a “synthetic” basis, but any such publications would be considered non-representative of the underlying market. The U.S. Federal Reserve, based on the recommendations of the New York Federal Reserve’s Alternative Reference Rate Committee (comprised of major derivative market participants and their regulators), has begun publishing Secured Overnight Financing Rate (“SOFR”) that is intended to replace U.S. dollar LIBOR. Proposals for alternative reference rates for other currencies have also been announced or have already begun publication. Markets are developing in response to these new reference rates. Uncertainty related to the liquidity impact of the change in rates, and how to appropriately adjust these rates at the time of transition, poses risks for the Fund. The effect |
31
Evermore Global Value Fund
Notes to Financial Statements August 31, 2023, Continued |
of any changes to, or discontinuation of, LIBOR on the Fund will depend on, among other things, (1) existing fallback or termination provisions in individual contracts and (2) whether, how, and when industry participants develop and adopt new reference rates and fallbacks for both legacy and new instruments and contracts. The expected discontinuation of LIBOR could have a significant impact on the financial markets in general and may also present heightened risk to market participants, including public companies, investment advisers, investment companies, and broker-dealers. The risks associated with this discontinuation and transition will be exacerbated if the work necessary to effect an orderly transition to an alternative reference rate is not completed in a timely manner. For example, current information technology systems may be unable to accommodate new instruments and rates with features that differ from LIBOR. Accordingly, it is difficult to predict the full impact of the transition away from LIBOR on the Fund until new reference rates and fallbacks for both legacy and new instruments and contracts are commercially accepted and market practices become settled.
S. | SEC Rule 18f-4. Effective August 19, 2022, the SEC implemented Rule 18f-4 under the 1940 Act (“Rule 18f-4”), providing for the regulation of a registered investment company’s use of derivatives and certain related instruments. Among other things, Rule 18f-4 limits a fund’s derivatives exposure through a value-at-risk test and requires the adoption and implementation of a derivatives risk management program for certain derivatives users. The Fund, as a limited derivatives user (as defined in Rule 18f-4), is not subject to the full requirements of Rule 18f-4. The Fund is required to comply with Rule18f-4 and has adopted procedures for investing in derivatives and other transactions in compliance with Rule 18f-4. |
T. | Subsequent Events. In preparing these financial statements, management of the Fund has evaluated events and transactions for potential recognition or disclosure through the date the financial statements were available to be issued, and has determined that there were the following subsequent events: |
Change in Fiscal Year End: The Fund changed its annual fiscal year end from December 31st to August 31st starting with the August 31, 2023 fiscal year end. As part of this change in year end, the Fund declared a distribution with a record date of October 13, 2023 to distribute its undistributed investment company taxable income and undistributed net tax-exempt income, if any, from its December 31, 2022 fiscal year end, as required for tax purposes.
Israel Conflict risk: The U.S.-designated terrorist group Hamas attacked Israel on October 7, 2023, resulting in an ensuing war in the region. Current hostilities and the potential for future hostilities may diminish the value, or cause significant volatility in the share price, of companies based in or having significant operations in Israel. The Israeli securities market may be closed for extended periods of time or trading on the Israeli securities market may be suspended altogether. How long the armed conflict and related events will last cannot be predicted.
NOTE 3 – INVESTMENT ADVISORY FEES, SERVICING FEES, AND OTHER FEES AND EXPENSES
Effective March 31, 2023, the Adviser serves as the investment adviser for the Fund and the Sub-Adviser serves as the investment sub-adviser to the Fund. Subject to the supervision of the Board, the Adviser manages the overall investment operations of the Fund, primarily in the form of oversight of the Fund’s Sub-Adviser, pursuant to the terms of an investment advisory agreement between the Trust, on behalf of the Fund, and the Adviser (the “Advisory Agreement”). Pursuant to the Advisory Agreement, the Fund compensates the Adviser for its services at the annual rate of 0.99% of the Fund’s average daily net assets, payable on a monthly basis in arrears. Pursuant to the sub-advisory agreement between the Adviser and the Sub-Adviser (the “Sub-Advisory Agreement”), the Adviser compensates the Sub-Adviser for its services at an annual rate of 0.89% of the Fund’s average daily net assets.
The Adviser has contractually agreed to limit the amount of the Fund’s total annual operating expenses (excluding taxes, interest on borrowings, acquired fund fees and expenses, dividends on securities sold short, brokerage commissions, and other expenditures, which are capitalized in accordance with generally accepted accounting principles, and other extraordinary expenses not incurred in the ordinary course of business) to 1.60% of the Fund’s average daily net assets attributable to Investor Class shares and to 1.35% of the Fund’s average daily net assets attributable to Institutional Class shares for the period from March 31, 2023 through December 31, 2025 (the “Expense Limitation Agreement”). The Adviser is permitted to recoup, on a class by class basis, any fees it has waived or deferred or expenses it has borne pursuant to the Expense Limitation Agreement to the extent that the Fund’s expenses (after any repayment is taken into account) do not exceed both of (i) the expense limitations that were in effect at the time of the waiver or reimbursement, and (ii) the current expense limitations. The Board must approve any recoupment payment made to the Adviser. The Fund will not be obligated to pay any such deferred fees and expenses more than three years after date on which the fees and expenses were waived or deferred.
32
Evermore Global Value Fund
Notes to Financial Statements August 31, 2023, Continued |
Pursuant to the Sub-Advisory Agreement, the Sub-Adviser contractually agreed to reduce its fee under the Sub-Advisory Agreement by any amounts paid to the Fund by the Adviser related to applicable voluntary fee waivers, expense reimbursements (including the Expense Limitation Agreement) or other payments related to any voluntary expense cap applicable to the Fund. Accordingly, the Sub-Adviser will be entitled to recoupment from the Adviser of any recoupment received by Advisor from the Fund that Adviser has waived or deferred or expenses it has borne pursuant to the Expense Limitation Agreement related to any period during the term of the Sub-Advisory Agreement.
From December 28, 2022 to March 31, 2023, the Predecessor Adviser served as the investment adviser to the Fund pursuant to an investment advisory agreement between the Trust, on behalf of the Fund, and Predecessor Adviser (the “Prior Advisory Agreement”). The fee structure under the Prior Advisory Agreement was identical to the fee structure under the Advisory Agreement. In addition, the Predecessor Adviser contractually agreed until March 31, 2023 to limit the amount of the Fund’s total annual operating expenses pursuant to an expense limitation agreement that had the same terms as the Fund’s current Expense Limitation Agreement with the Adviser.
During the current fiscal period, the Fund incurred a total of $714,806 in advisory fees from the Adviser and Predecessor Adviser, of which $102,174 was payable at August 31, 2023.
During the current fiscal period, investment advisory fees accrued, waived and/or reimbursed were as follows:
GROSS | WAIVERS AND/OR | RECOUPMENTS | NET | ||||||||||||
| $ | 714,806 | $ | (116,456 | ) | $ | — | $ | 598,350 | |||||||
As of the end of the current fiscal period, the Fund had amounts available for recoupment by the Adviser as follows:
EXPIRATION | |||||||||||||||
December 31, | December 31, | August 31, | TOTAL | ||||||||||||
| $ | — | $ | — | $ | 67,954 | $ | 67,954 | ||||||||
* | Amount recoupable for the fiscal period January 1, 2023 through August 31, 2023 was $67,954. The total amount waived for the period was $116,456 of which $48,502 was waived by the Predecessor Adviser prior to March 31, 2023 and is no longer recoupable. |
U.S. Bancorp Fund Services, LLC, doing business as U.S. Bank Global Fund Services (“Fund Services”), an indirect wholly-owned subsidiary of U.S. Bank N.A., serves as the Fund’s administrator (the “Administrator”) and, in that capacity, performs various administrative and accounting services for the Fund. Fund Services also serves as the Fund’s fund accountant, transfer agent, dividend disbursing agent and registrar. The Administrator prepares various federal and state regulatory filings, reports and returns for the Fund; prepares reports and materials to be supplied to the trustees; monitors the activities of the Fund’s custodian, transfer agent and accountants; coordinates the preparation and payment of Fund expenses and reviews the Fund’s expense accruals.
Quasar Distributors, LLC (the “Distributor”), a wholly-owned broker-dealer subsidiary of Foreside Financial Group, LLC, serves as the principal underwriter and distributor of the Fund’s shares pursuant to a Distribution Agreement with the Trust. Prior to the Reorganization, Compass Distributors, LLC, an affiliate of Foreside Financial Group, LLC, served as the Fund’s distributor.
The Fund has adopted a Distribution Plan (the “Plan”) in accordance with Rule 12b-1 under the 1940 Act with respect to Investor Class shares. The Plan provides that the Fund may pay a fee to the Distributor at an annual rate of 0.25% of the average daily net assets of Investor Class shares. No distribution or shareholder servicing fees are paid by Institutional Class shares. These fees may be used by the Distributor to provide compensation for sales support distribution activities, or shareholder servicing activities.
NOTE 4 – TRUSTEE AND OFFICER COMPENSATION
The Trustees of the Trust receive an annual retainer and meeting fees for meetings attended. An employee of Vigilant Compliance, LLC serves as Chief Compliance Officer of the Trust. Vigilant Compliance, LLC is compensated for the services provided to the Trust. Employees of the Trust serve as President, Chief Financial Officer, Chief Operating Officer, Secretary and Director of Marketing & Business Development of the Trust. They are compensated for services provided. Certain employees of Fund Services serve as officers of the Trust. They are not compensated by the Fund or the Trust. For Trustee and Officer compensation amounts, please refer to the Statement of Operations.
33
Evermore Global Value Fund
Notes to Financial Statements August 31, 2023, Continued |
NOTE 5 – PURCHASES AND SALES OF SECURITIES
For the current fiscal period, the cost of purchases and the proceeds from the sale of securities, excluding short-term investments, were $15,017,639 and $13,520,172, respectively.
There were no purchases or sales of long-term U.S. government securities for the current fiscal period.
NOTE 6 – FEDERAL INCOME TAX INFORMATION
The tax character of distributions paid by the Fund during the current fiscal period, the year ended December 31, 2022 and the year ended December 31, 2021 were as follows:
Fiscal | December 31, | December 31, | ||||||||||
Distributions paid from: | ||||||||||||
Ordinary income* | $ | — | $ | 2,587,418 | $ | 6,425,493 | ||||||
Long-term capital gains** | — | — | — | |||||||||
Total distributions | $ | — | $ | 2,587,418 | $ | 6,425,493 | ||||||
* | For federal income tax purposes, distributions of short-term capital gains are treated as ordinary income distributions. |
** | The Fund designates this distribution as long-term capital gain dividends pursuant to Internal Revenue Code Section 852(b)(3)(C). |
As of August 31, 2023, the federal tax cost and aggregate gross unrealized appreciation and depreciation of investments held by the Fund was as follows:
Cost of investments | $ | 80,455,028 | ||
Gross tax unrealized appreciation | 35,997,135 | |||
Gross tax unrealized depreciation | (8,933,099 | ) | ||
Net tax unrealized appreciation | 27,064,036 |
As of August 31, 2023, the components of distributable earnings (losses) on a tax basis were as follows:
Undistributed ordinary income | $ | 2,053,713 | ||
Undistributed long-term capital gain | — | |||
Capital loss carryforward | (71,438,984 | ) | ||
Other accumulated losses | (43,828 | ) | ||
Unrealized appreciation/(depreciation) | 27,035,463 | |||
Qualified late-year loss deferral | (2,487,490 | ) | ||
Total distributable earnings | (44,881,126 | ) |
Permanent differences as of August 31, 2023, primarily attributable to excise tax paid and investments in partnerships were reclassified among the following accounts:
Distributable earnings | $ | 39,204 | ||
Paid-in-capital | $ | (39,204 | ) |
The difference between cost of investments for financial reporting and cost of investments for Federal income tax purposes was due primarily to timing differences in recognizing certain gains and losses on security transactions (e.g., wash sale loss deferrals, passive foreign investment company transactions, unrealized gains (losses) recognition of derivatives, and investments in publicly traded partnerships).
34
Evermore Global Value Fund
Notes to Financial Statements August 31, 2023, Continued |
The Fund is permitted to carry forward capital losses incurred for an unlimited period. Additionally, capital losses that are carried forward will retain their character as either short-term or long-term capital losses. As of August 31, 2023, the Fund had unexpiring short-term capital loss carryforwards of $6,649,411 and long-term capital loss carryforwards of $64,789,573. For the fiscal year ended August 31, 2023, the Fund deferred to September 1, 2023, $2,487,490 in qualified late-year losses.
Pursuant to federal income tax rules applicable to regulated investment companies, the Funds may elect to treat certain capital losses between November 1 and August 31 and late year ordinary losses ((i) ordinary losses between January 1 and August 31, and (ii) specified ordinary and currency losses between November 1 and August 31) as occurring on the first day of the following tax year. For the year ended August 31, 2023, any amount of losses elected within the tax return will not be recognized for federal income tax purposes until September 1, 2023.
NOTE 7 — New Accounting Pronouncements and Regulatory Updates
In June 2022, the FASB issued Accounting Standards Update 2022-03, which amends Fair Value Measurement (Topic 820): Fair Value Measurement of Equity Securities Subject to Contractual Sale Restrictions (“ASU 2022-03”). ASU 2022-03 clarifies guidance for fair value measurement of an equity security subject to a contractual sale restriction and establishes new disclosure requirements for such equity securities. ASU 2022-03 is effective for fiscal years beginning after December 15, 2023 and for interim periods within those fiscal years, with early adoption permitted. Management is currently evaluating the impact of these amendments on the financial statements.
In October 2022, the SEC adopted a final rule relating to tailored shareholder reports for mutual funds and exchange-traded funds and fee information in investment company advertisements. The rule and form amendments will, among other things, require the Fund to transmit concise and visually engaging shareholder reports that highlight key information. The amendments will require that funds tag information in a structured data format and that certain more in-depth information be made available online and available for delivery free of charge to investors on request. The amendments became effective January 24, 2023. There is an 18-month transition period after the effective date of the amendments until the Fund is required to comply.
In December 2022, the FASB issued an Accounting Standards Update, ASU 2022-06, Reference Rate Reform (Topic 848) – Deferral of the Sunset Date of Topic 848 (“ASU 2022-06”). ASU 2022-06 is an amendment to ASU 2020-04, which provided optional guidance to ease the potential accounting burden due to the discontinuation of the London Inter-Bank Offered Rate and other interbank-offered based reference rates and which was effective as of March 12, 2020 through December 31, 2022. ASU 2022-06 extends the effective period through December 31, 2024. Management is currently evaluating the impact, if any, of applying ASU 2022-06.
35
Evermore Global Value Fund
Report of Independent Registered Public Accounting Firm |
To the Shareholders of Evermore Global Value Fund and the Board of Trustees of The RBB Fund Trust
Opinion on the Financial Statements
We have audited the accompanying statement of assets and liabilities of Evermore Global Value Fund (the “Fund”) (one of the funds constituting The RBB Fund Trust (“the Trust”), including the schedule of investments, as of August 31, 2023, and the related statement of operations for the period from January 1, 2023 through August 31, 2023 and the year ended December 31, 2022, the statements of changes in net assets for the period from January 1, 2023 through August 31, 2023 and for each of the two years in the period ended December 31, 2022, the financial highlights for the period from January 1, 2023 through August 31, 2023 and for each of the five years in the period ended December 31, 2022 and the related notes (collectively referred to as the “financial statements”). In our opinion, the financial statements present fairly, in all material respects, the financial position of the Fund (one of the funds constituting The RBB Fund Trust) at August 31, 2023, the results of its operations for the period from January 1, 2023 through August 31, 2023 and the year ended December 31, 2022, the changes in its net assets for the period from January 1, 2023 through August 31, 2023 and for each of the two years in the period ended December 31, 2022 and financial highlights for the period from January 1, 2023 through August 31, 2023 and for each of the five years in the period ended December 31, 2022, in conformity with U.S. generally accepted accounting principles.
Basis for Opinion
These financial statements are the responsibility of the Trust’s management. Our responsibility is to express an opinion on the Fund’s financial statements based on our audits. We are a public accounting firm registered with the Public Company Accounting Oversight Board (United States) (“PCAOB”) and are required to be independent with respect to the Trust in accordance with the U.S. federal securities laws and the applicable rules and regulations of the Securities and Exchange Commission and the PCAOB.
We conducted our audits in accordance with the standards of the PCAOB. Those standards require that we plan and perform the audit to obtain reasonable assurance about whether the financial statements are free of material misstatement, whether due to error or fraud. The Trust is not required to have, nor were we engaged to perform, an audit of the Trust’s internal control over financial reporting. As part of our audits, we are required to obtain an understanding of internal control over financial reporting but not for the purpose of expressing an opinion on the effectiveness of the Trust’s internal control over financial reporting. Accordingly, we express no such opinion.
Our audits included performing procedures to assess the risks of material misstatement of the financial statements, whether due to error or fraud, and performing procedures that respond to those risks. Such procedures included examining, on a test basis, evidence regarding the amounts and disclosures in the financial statements. Our procedures included confirmation of securities owned as of August 31, 2023, by correspondence with the custodian and brokers. Our audits also included evaluating the accounting principles used and significant estimates made by management, as well as evaluating the overall presentation of the financial statements. We believe that our audits provide a reasonable basis for our opinion.

We have served as the Fund’s auditor since 2009.
Philadelphia, Pennsylvania
October 30, 2023
36
Evermore Global Value Fund
Annual Review of Liquidity Risk Management Program (Unaudited) |
The Trust has adopted and implemented a Liquidity Risk Management Program (the “Trust Program”) as required by Rule 22e-4 under the 1940 Act. In accordance with the Trust Program, the Adviser has adopted and implemented a Liquidity Risk Management Program (the “Adviser Program”) on behalf of the Fund, which took effect on March 31, 2023. From December 28, 2022 through March 30, 2023, in accordance with the Trust Program, the Predecessor Adviser adopted and implemented a Liquidity Risk Management Program (the “Predecessor Adviser Program” and together with the Trust Program, the “Programs”) on behalf of the Fund.
The Trust Program and Adviser Program seek, and the Predecessor Advisor Program sought, to assess, manage and review the Fund’s Liquidity Risk. “Liquidity Risk” is defined as the risk that the Fund could not meet requests to redeem shares issued by the Fund without significant dilution of remaining investors’ interest in the Fund.
The Board has appointed Vigilant Compliance, LLC (“Vigilant”) as the program administrator for the Trust Program and the Adviser as the program administrator for the Adviser Program. From December 28, 2022 through March 30, 2023, the Board appointed the Predecessor Adviser as the program administrator for the Predecessor Adviser Program. The process of monitoring and determining the liquidity of the Fund’s investments is supported by one or more third-party vendors.
At meetings held during the current fiscal period, the Board and its Regulatory Oversight Committee received and reviewed a written report (the “Report”) of Vigilant and the Predecessor Adviser concerning the operation of the Programs for the period from December 28, 2022 to December 31, 2022 (the “Period”). The Report summarized the operation of the Programs and the information and factors considered by Vigilant and the Predecessor Adviser in reviewing the adequacy and effectiveness of the implementation of the Programs with respect to the Fund. Such information and factors included, among other things: (i) the methodology used to classify the liquidity of the Fund’s portfolio investments and the Predecessor Adviser’s assessment that the Fund’s strategy remained appropriate for an open-end mutual fund; (ii) analyses of the Fund’s trading environment and reasonably anticipated trading size; (iii) that the Fund held primarily highly liquid assets (investments that the Fund anticipates can be converted to cash within 3 business days or less in current market conditions without significantly changing their market value); (iv) the Liquidity Risk associated with the Fund’s ownership of certain securities classified as illiquid investments (investments that cannot be sold or disposed of in seven days or less in current market conditions without the sale of the investment significantly changing the market value of the investment) by the Predecessor Adviser; (v) that the Fund did not require the establishment of a highly liquid investment minimum and the methodology for that determination; (vi) confirmation that the Fund did not breach the 15% maximum illiquid security threshold during the Period and the procedures for monitoring compliance with the limit; (vii) that the processes, technologies and third-party vendors used to assess, manage, and/or periodically review the Fund’s Liquidity Risk functioned appropriately during the Period; and (viii) that the Programs operated adequately during the Period. The Report also indicated that there were no material changes made to the Programs during the Period.
Based on the review, the Report concluded that the Programs were being implemented effectively and reasonably designed to assess and manage Liquidity Risk in the Fund’s portfolio.
There can be no assurance that the Trust Program or the Adviser Program will achieve its objectives under all circumstances in the future. Please refer to the Fund’s prospectus for more information regarding the Fund’s exposure to liquidity risk and other risks to which it may be subject.
37
Evermore Global Value Fund
Trustees and Executive Officers (Unaudited) |
The business and affairs of the Trust are managed under the direction of the Trust’s Board. The Trustees and executive officers of the Trust, their ages, business addresses and principal occupations during the past five years are set forth below.
Name, Address and Age | Position(s) | Term of Office | Principal Occupations | Other Directorships | Number of |
Independent Trustees | |||||
Julian A. Brodsky | Trustee | June 2021 | Retired. | AMDOCS Limited (service provider to telecommunications companies). | 63 |
Gregory P. Chandler | Trustee | June 2021 | Since 2020, Chief Financial Officer, HC Parent Corp. d/b/a Herspiegel Consulting LLC (life sciences consulting services); 2020, Chief Financial Officer, Avocado Systems Inc. (cyber security software provider); from 2009 - 2020, Chief Financial Officer, Emtec, Inc. (information technology consulting/services). | FS Energy and Power Fund (business development company); Wilmington Funds (12 portfolios) (registered investment company); Emtec, Inc. (until December 2019); FS Investment Corporation (business development company) (until December 2018). | 63 |
Lisa A. Dolly | Director | October 2021 to present | From July 2019-December 2019, Chairman, Pershing LLC (broker dealer, clearing and custody firm); January 2016-June 2019, Chief Executive Officer, Pershing, LLC. | Allfunds Group PLC (United Kingdom wealthtech and fund distribution provider); Securities Industry and Financial Markets Association (trade association for broker dealers, investment banks and asset managers); Hightower Advisors (wealth management firm). | 63 |
Nicholas A. Giordano | Trustee | June 2021 | Since 1997, Consultant, financial services organizations. | IntriCon Corporation (biomedical device manufacturer); Wilmington Funds (12 portfolios) (registered investment company); Independence Blue Cross (healthcare insurance) (until March 2021). | 63 |
38
Evermore Global Value Fund
Trustees and Executive Officers (Unaudited), Continued |
Name, Address and Age | Position(s) | Term of Office | Principal Occupations | Other Directorships | Number of |
Independent Trustees (continued) | |||||
Arnold M. Reichman | Chair and Trustee | June 2021 | Retired. | EIP Investment Trust (registered investment company) (until August 2022). | 63 |
Brian T. Shea | Trustee | June 2021 | From 2014-2017, Chief Executive Officer, BNY Mellon Investment Services (fund services, global custodian and securities clearing firm); from 1983- 2014, Chief Executive Officer and various positions, Pershing LLC (broker dealer, clearing and custody firm). | Fidelity National Information Services, Inc. (financial services technology company); Ameriprise Financial, Inc. (financial services company); WisdomTree Investments, Inc. (asset management company) (until March 2019). | 63 |
Robert A. Straniere | Trustee | June 2021 | Since 2009, Administrative Law Judge, New York City; since 1980, Founding Partner, Straniere Law Group (law firm). | None. | 63 |
Interested Trustee2 | |||||
Robert Sablowsky | Vice Chair and Trustee | June 2021 | Since 2002, Senior Director – Investments and, prior thereto, Executive Vice President, of Oppenheimer & Co., Inc. (a registered broker-dealer). | None. | 63 |
Officers | |||||
Steven Plump | President | August 2022 to present | From 2011 to 2021, Executive Vice President, PIMCO LLC. | N/A | N/A |
39
Evermore Global Value Fund
Trustees and Executive Officers (Unaudited), Continued |
Name, Address and Age | Position(s) | Term of Office | Principal Occupations | Other Directorships | Number of |
Officers (continued) | |||||
Salvatore Faia, JD, CPA, CFE | Chief Compliance Officer | June 2021 | Since 2004, President, Vigilant Compliance, LLC (investment management services company); since 2005, Independent Trustee of EIP Investment Trust (registered investment company); Since 2004, Chief Compliance Officer of The RBB Fund, Inc.; President of The RBB Fund, Inc. from 2009 to 2022; President of The RBB Fund Trust from 2021 to 2022. | N/A | N/A |
James G. Shaw | Chief Financial Officer and Secretary
Chief Operating Officer | June 2021
August 2022 to present | Chief Financial Officer and Secretary of The RBB Fund, Inc. (since 2016); Chief Operating Officer of The RBB Fund, Inc. (since 2022). | N/A | N/A |
Craig A. Urciuoli | Director of Marketing & Business Development | June 2021 | Director of Marketing & Business Development of The RBB Fund, Inc. (since 2019); from 2000-2019, Managing Director, Third Avenue Management LLC (investment advisory firm). | N/A | N/A |
Jennifer Witt | Assistant Treasurer | June 2021 | Since 2020, Vice President, U.S. Bank Global Fund Services (fund administrative services firm); from 2016 to 2020, Assistant Vice President, U.S. Bank Global Fund Services. | N/A | N/A |
40
Evermore Global Value Fund
Trustees and Executive Officers (Unaudited), Continued |
Name, Address and Age | Position(s) | Term of Office | Principal Occupations | Other Directorships | Number of |
Officers (continued) | |||||
Edward Paz | Assistant Secretary | June 2021 | Since 2007, Vice President and Counsel, U.S. Bancorp Fund Services, LLC (fund administrative services firm). | N/A | N/A |
Michael P. Malloy | Assistant Secretary | June 2021 | Since 1993, Partner, Faegre Drinker Biddle & Reath LLP (law firm). | N/A | N/A |
Jillian L. Bosmann | Assistant Secretary | June 2021 | Since 2017, Partner, Faegre Drinker Biddle & Reath LLP (law firm). | N/A | N/A |
* | Each Trustee oversees 63 portfolios of the fund complex, consisting of the series in the Trust (10 portfolios) and The RBB Fund, Inc. (53 portfolios). |
1 | Subject to the Trust’s Retirement Policy, each Trustee may continue to serve as a Trustee until the last day of the calendar year in which the applicable Trustee attains age 75 or until his or her successor is elected and qualified or his or her death, resignation or removal. The Board reserves the right to waive the requirements of the Policy with respect to an individual Trustee. The Board has approved waivers of the policy with respect to Messrs. Brodsky, Giordano, Sablowsky and Straniere. Each officer holds office at the pleasure of the Board until the next special meeting of the Trust or until his or her successor is duly elected and qualified, or until he or she dies, resigns or is removed. |
2 | Mr. Sablowsky is considered an “interested person” of the Trust as that term is defined in the 1940 Act and is referred to as an “Interested Trustee.” Mr. Sablowsky is considered an “Interested Trustee” of the Trust by virtue of his position as an employee of Oppenheimer & Co., Inc., a registered broker-dealer. |
41
Evermore Global Value Fund
Trustees and Executive Officers (Unaudited), Continued |
Trustee Experience, Qualifications, Attributes and/or Skills
The information above includes each Trustee’s principal occupations during the last five years. Each Trustee possesses extensive additional experience, skills and attributes relevant to his or her qualifications to serve as a Trustee. The cumulative background of each Trustee led to the conclusion that each Trustee should serve as a Trustee of the Trust. Mr. Brodsky has over 40 years of senior executive-level management experience in the cable television and communications industry. Mr. Chandler has demonstrated leadership and management abilities as evidenced by his senior executive level positions in the investment technology consulting/services and investment banking/brokerage industries, and also serves on various boards. Ms. Dolly has over three decades of experience in the financial services industry, and she has demonstrated her leadership and management abilities by serving in numerous senior executive-level positions. Mr. Giordano has years of experience as a consultant to financial services organizations and also serves on the boards of other registered investment companies. Mr. Reichman brings decades of investment management experience to the Board, in addition to senior executive-level management experience. Mr. Sablowsky has demonstrated leadership and management abilities as evidenced by his senior executive-level positions in the financial services industry. Mr. Shea has demonstrated leadership and management abilities as evidenced by his senior executive-level positions in the brokerage, clearing, banking, and investment services industry, including service on the boards of public companies, industry regulatory organizations and a university. Mr. Straniere has been a practicing attorney for over 30 years and has served on the boards of an asset management company and another registered investment company.
42
Evermore Global Value Fund
Additional Information (Unaudited) |
Federal Tax Information (Unaudited) |
For the fiscal period ended August 31, 2023, certain dividends paid by the Fund may be subject to a maximum tax rate of 23.80%, as provided for by the American Taxpayer Relief Act of 2012. The percentage of dividends declared from ordinary income designated as qualified dividend income was 0.00%.
For corporate shareholders, the percent of ordinary income distributions qualifying for the corporate dividends received deduction for the fiscal period ended August 31, 2023 was 0.00%.
The percentage of taxable ordinary income distributions that are designated as short-term capital gain distributions under Internal Revenue Section 871(k)(2)(c) for the fiscal period ended August 31, 2023 was 0.00%.
Pursuant to Section 853 of the Internal Revenue Code the Fund designated the following amounts as foreign taxes paid for the fiscal period ended August 31, 2023. Foreign taxes paid for purposes of Section 853 may be less than actual foreign taxes paid for financial statement purposes.
Foreign Dividend Income | $ | 2,147,739 | ||
Foreign Taxes Paid | 266,258 | |||
Foreign Taxes Paid per share | 0.027121 | |||
Foreign Tax Credit/Deduction | 266,258 | |||
Foreign Tax Credit/Deduction per share | 0.027121 | |||
Fund shares Outstanding as of August 31, 2023 | 9,817,266 |
Proxy Voting (Unaudited) |
Policies and procedures that the Fund uses to determine how to vote proxies relating to portfolio securities as well as information regarding how the Fund voted proxies relating to portfolio securities for the most recent twelve-month period ended August 31 are available without charge, upon request, by calling 866-EVERMORE (866) 383-7667 and on the SEC’s website at http://www.sec.gov.
QUARTERLY PORTFOLIO SCHEDULES (Unaudited) |
The Trust files its complete schedule of portfolio holdings with the SEC for the first and third fiscal quarters of each fiscal year (quarters ended November 30 and May 31) as an exhibit to its report on Form N-PORT. The Trust’s Form N-PORT filings are available on the SEC’s website at http://www.sec.gov.
Information About Householding (Unaudited) |
In an effort to decrease costs, the Fund intends to reduce the number of duplicate prospectuses and Annual and Semi-Annual Reports you receive by sending only one copy of each to those addresses shared by two or more accounts and to shareholders the Transfer Agent reasonably believes are from the same family or household. Once implemented, if you would like to discontinue householding for your accounts, please call toll-free at 866-EVERMORE (866) 383-7667 to request individual copies of these documents. Once the Transfer Agent receives notice to stop householding, the Transfer Agent will begin sending individual copies thirty days after receiving your request. This policy does not apply to account statements.
43
Evermore Global Value Fund
Privacy Notice (Unaudited) |
FACTS | WHAT DOES EVERMORE GLOBAL VALUE FUND DO WITH YOUR PERSONAL INFORMATION? | ||
Why? | Financial companies choose how they share your personal information. Federal law gives consumers the right to limit some but not all sharing. Federal law also requires us to tell you how we collect, share, and protect your personal information. Please read this notice carefully to understand what we do. | ||
What? | The types of personal information we collect and share depend on the product or service you have with us. This information can include: ● Social Security number ● account balances ● account transactions ● transaction history ● wire transfer instructions ● checking account information When you are no longer our customer, we continue to share your information as described in this notice. | ||
How? | All financial companies need to share customers’ personal information to run their everyday business. In the section below, we list the reasons financial companies can share their customers’ personal information; the reasons the Evermore Global Value Fund chooses to share; and whether you can limit this sharing. | ||
Reasons we can share your personal information | Does the Evermore Global Value Fund share? | Can you limit this | |
For our everyday business purposes — | Yes | No | |
For our marketing purposes — | No | We don’t share. | |
For joint marketing with other financial companies | No | We don’t share. | |
For our affiliates’ everyday business purposes — | Yes | No | |
For our affiliates’ everyday business purposes — | No | We don’t share. | |
For our affiliates to market to you | No | We don’t share. | |
For nonaffiliates to market to you | No | We don’t share. | |
Questions? | Call 866-EVERMORE (866-383-7667) or go to www.evermoreglobal.com |
44
Evermore Global Value Fund
Privacy Notice (Unaudited), Continued |
What we do | |
How does Evermore Global Value Fund protect my personal information? | To protect your personal information from unauthorized access and use, we use security measures that comply with federal law. These measures include computer safeguards and secured files and buildings. |
How does Evermore Global Value Fund collect my personal information? | We collect your personal information, for example, when you ● open an account ● provide account information ● give us your contact information ● make a wire transfer ● tell us where to send the money We also collect your information from others, such as credit bureaus, affiliates, or other companies. |
Why can’t I limit all sharing? | Federal law gives you the right to limit only ● sharing for affiliates’ everyday business purposes – information about your creditworthiness ● affiliates from using your information to market to you ● sharing for nonaffiliates to market to you State laws and individual companies may give you additional rights to limit sharing. |
Definitions | |
Affiliates | Companies related by common ownership or control. They can be financial and nonfinancial companies. ● Our affiliates include companies such as F/m Investments, LLC, Diffractive Managers Group, LLC and MFP Investors LLC. |
Nonaffiliates | Companies not related by common ownership or control. They can be financial and nonfinancial companies. |
Joint marketing | A formal agreement between nonaffiliated financial companies that together market financial products or services to you. ● Evermore Global Value Fund doesn’t jointly market. |
45
Investment Adviser
F/M INVESTMENTS, LLC D/B/A NORTH SLOPE CAPITAL, LLC
3050 K Street NW, Suite W-201
Washington D.C. 20007
Investment Sub-Adviser
MFP INVESTORS LLC
909 Third Avenue
33rd Floor
New York, NY 10022
Administrator and Transfer Agent
U.S. BANCORP FUND SERVICES, LLC
P.O Box 701
Milwaukee, WI 53202
Principal Underwriter
QUASAR DISTRIBUTORS, LLC
111 E Kilbourn Ave, Suite 2200
Milwaukee, WI 53202
Custodian
U S BANK N.A.
Custody Operations
1555 N RiverCenter Drive, Suite 302
Milwaukee, WI 53212
Independent Registered Public Accounting Firm
ERNST & YOUNG LLP
One Commerce Square
2005 Market Street, Suite 700
Philadelphia, PA 19103
Legal Counsel
FAEGRE DRINKER BIDDLE & REATH LLP
One Logan Square, Suite 2000
Philadelphia, PA 19103
Ticker | Cusip | |
Evermore Global Value Fund | ||
Investor Class | EVGBX | 300397106 |
Institutional Class | EVGIX | 300397122 |

WWW.EVERMOREGLOBAL.COM
Ever-AR23

P/E GLOBAL ENHANCED INTERNATIONAL FUND
A Series of
THE RBB FUND TRUST
Institutional Class (TICKER: PEIEX)
Annual Report
August 31, 2023
| |
P/E Global Enhanced International Fund |
|
Table of Contents |
Letter to Shareholders (Unaudited) | 1 |
Performance Data (Unaudited) | 3 |
Fund Expense Example (Unaudited) | 4 |
Portfolio Holdings Summary Table | 6 |
Portfolio of Investments | 8 |
Financial Statements | 9 |
Notes to Financial Statements | 13 |
Report of Independent Registered Public Accounting Firm | 23 |
Shareholder Tax Information (Unaudited) | 24 |
Notice to Shareholders (Unaudited) | 25 |
Privacy Notice (Unaudited) | 26 |
Trustees and Officers (Unaudited) | 29 |
P/E Global Enhanced International Fund
Letter to Shareholders
AUGUST 31, 2023 (UNAUDITED)
Annual Commentary*
P/E Global Enhanced International Fund, a Series of The RBB Fund Trust
* The P/E Global Enhanced International Fund (the “Fund”) launched on December 29, 2022. Annual commentary as provided below pertains to the period since Fund launch through August 31, 2023.
The Fund’s investment objective is to seek total return. While many international equity products consist of active equity and passive currency components, the Fund seeks to augment passive international equity exposures with active currency positions, providing a unique, diversifying source of potential alpha1 within the space. More specifically, the Fund’s investment strategy seeks to combine the performance of 1) certain U.S. Dollar hedged global equity index futures and 2) the proprietary Foreign Currency (“FX”) Strategy of P/E Global LLC (“P/E”), which is focused on providing exposure to international currency markets.
Global Equity Index & Hedge:
For the period from December 29, 2022 through August 31, 2023, both the global equity index and hedge component posted positive returns, as global equities rallied and the U.S. Dollar strengthened versus the Australian Dollar and the Japanese Yen.
FX Strategy:
During the first eight months of 2023, P/E’s FX Strategy factors continued to point to continued global growth and inflation risk. Year to date performance, as of August 31, 2023, has been positive for the FX Strategy. While past performance is not indicative of future performance, we do note that the FX Strategy has historically performed well during periods of increasing volatility.
Entering 2023, the currency markets experienced a significant shift, as positions in some currencies, such as the Euro, became crowded on the long side. By contrast, U.S. Dollar short positions soared. Similar extreme periods occurred in early 2021 and 2018. Given these extremes, the FX Strategy forecast a significant rebound in the U.S. Dollar versus the Euro and Australian Dollar, a view contrarian to most market forecasters. These long speculative positions began to unwind in February 2023, with positive results of the FX Strategy. Increased market turbulence in March from the downfalls of Silicon Valley Bank and Credit Suisse subsided in April, and the FX Strategy’s factors shifted from growth-oriented to risk-oriented, as inflation risk continued to increase, and speculative crowding, especially in U.S. Dollar short positions, remained at high levels. Concerns regarding the U.S. debt ceiling declined by the end of May, as government officials worked towards resolutions. Strong employment and inflation data in the U.S., combined with slowing growth in both core Europe and China, supported the U.S. Dollar. In addition, significantly lower inflation data out of Europe reduced the expected hawkishness of the European Central Bank. In June 2023, the Federal Reserve’s “Skip” decision, alongside hawkish moves by other central banks, engendered short term negative sentiment for the U.S. Dollar. Economic growth concerns continued to rise in Asia, as China’s recovery faltered. Global economic data began to diverge, with U.S. economic data improving and European data deteriorating. By August 2023, the strength of European currencies began to reverse as growth slowed and comparable rates fell. The European Central Bank appeared to be near the end of its hiking cycle. Ultimately, thus far 2023 has been a year of
1 | Alpha describes an investment strategy’s ability to beat the market, or its “edge.” Alpha is thus also often referred to as “excess return” or the “abnormal rate of return” in relation to a benchmark, when adjusted for risk. |
1 |
P/E Global Enhanced International Fund
Letter to Shareholders (Concluded)
AUGUST 31, 2023 (UNAUDITED)
currency divergence. The Japanese Yen and the Australian Dollar have depreciated versus the U.S. Dollar by more than 10% and 5%, respectively. By contrast, the Euro and the British Pound have appreciated versus the U.S. Dollar.
Best regards,
Warren Naphtal - Portfolio Manager
P/E Global Enhanced International Fund
Must be preceded or accompanied by a current prospectus.
The Fund has exposure to foreign securities which involve political, economic and currency risks, greater volatility and differences in accounting methods. These risks are greater for investments in emerging markets. The primary types of derivatives in which the Fund invests in are futures contracts. The Fund may also invest in forward contracts. Futures contracts and forward contracts can be highly volatile, illiquid and difficult to value, and changes in the value of such instruments held directly or indirectly by the Fund may not correlate with the underlying instrument. A small position in futures contracts or forward contracts could have a potentially large impact on the Fund’s performance. The Fund should be considered highly leveraged and is suitable only for investors with high tolerance for investment risk. The fund may make short sales, which involves the risk that losses may exceed the original amount invested. The Fund has exposure to mid-cap companies, which involve additional risks such as limited liquidity and greater volatility than larger companies. Investments in debt securities typically decrease in value when interest rates rise. This risk is usually greater for longer-term debt securities.
2 |
P/E GLOBAL ENHANCED INTERNATIONAL FUND
Performance Data
(Unaudited)
AVERAGE ANNUAL TOTAL RETURNS FOR THE Period ended August 31, 2023 | |
Since | |
P/E Global Enhanced International Fund | 10.90%(1) |
MSCI EAFE Index | 10.94%(2) |

This chart above assumes a hypothetical initial investment of $10,000 made on December 29, 2022, inception of the Fund’s Institutional Class shares. Returns shown in the chart and table include the reinvestment of all dividends, but do not reflect the deduction of taxes that a shareholder would pay on Fund distributions or the redemption of Fund shares. Index returns do not reflect the effects of fees, transaction costs or expenses. It is not possible to invest directly in an index.
(1) | The Fund’s Institutional Class Shares commenced operations on December 29, 2022. |
(2) | Index performance is from inception date of the Fund only and is not the inception date of the index itself. |
The performance of P/E Global Enhanced International Fund (the “Fund”) quoted reflects fee waivers in effect and would have been less in their absence. P/E Global LLC (“Adviser”) has contractually agreed to waive its advisory fee and/or reimburse expenses in order to limit total annual Fund operating expenses (excluding acquired fund fees and expenses, brokerage commissions, extraordinary items, interest or taxes) to 1.00% of the Fund’s average daily net assets attributable to Institutional Class Shares. Without the limitation arrangement, the gross expense ratio is 1.11% for Institutional Class Shares as stated in the current prospectus. This contractual limitation is in effect until December 31, 2023 and may not be terminated without the approval of the Board of Trustees (“Board”) of The RBB Fund Trust. Please see the Financial Highlights for current figures.
The performance data quoted represents past performance and does not guarantee future results. Current performance may be lower or higher. The investment return and principal value of investments will fluctuate so that shares, when redeemed or sold, may be worth more or less than their original cost. Performance data current to the most recent month-end can be obtained by calling 1-855-610-4766.
3 |
P/E GLOBAL ENHANCED INTERNATIONAL FUND
Fund Expense Example
August 31, 2023 (UNAUDITED)
As a shareholder of the Fund, you incur two types of costs: (1) transaction costs, including sales charges (loads) on purchase payments, (if any) and (2) ongoing costs, including management fees, distribution and/or service (12b-1) fees and other Fund expenses. This example is intended to help you understand your ongoing costs (in dollars) of investing in the Fund and to compare these costs with the ongoing costs of investing in other mutual funds.
This example is based on an investment of $1,000 invested at the beginning of the six-month period from March 1, 2023 through August 31, 2023, and held for the entire period.
Actual Expenses
The first line of the accompanying table provides information about actual account values and actual expenses. You may use the information in this line, together with the amount you invested, to estimate the expenses that you paid over the period. Simply divide your account value by $1,000 (for example, an $8,600 account value divided by $1,000 = 8.6), then multiply the result by the number in the first line under the heading entitled “Expenses Paid During Period” to estimate the expenses you paid on your account during this period.
Hypothetical Example for Comparison Purposes
The second line of the accompanying table provides information about hypothetical account values and hypothetical expenses based on the Fund’s actual expense ratio and an assumed rate of return of 5% per year before expenses, which is not the Fund’s actual return. The hypothetical account values and expenses may not be used to estimate the actual ending account balance or expenses you paid for the period. You may use this information to compare the ongoing costs of investing in the Fund and other funds. To do so, compare this 5% hypothetical example with the 5% hypothetical examples that appear in the shareholder reports of other funds.
Please note that the expenses shown in the accompanying table are meant to highlight your ongoing costs only and do not reflect any transactional costs. Therefore, the second line of the accompanying table is useful in comparing ongoing costs only, and will not help you determine the relative total costs of owning different funds. In addition, if these transactional costs were included, your costs would have been higher.
4 |
P/E GLOBAL ENHANCED INTERNATIONAL FUND
Fund Expense Example (concluded)
August 31, 2023 (UNAUDITED)
| Institutional | Ending | Expenses | Annualized | Actual SIX-MONTH Total Investment Return |
Actual | $ 1,000.00 | $ 1,038.40 | $ 5.11 | 1.00% | 3.84% |
Hypothetical (5% return before expenses) | $ 1,000.00 | $ 1,020.05 | $ 5.06 | 1.00% | N/A |
* | Expenses are equal to the Fund’s annualized six-month expense ratio for the period March 1, 2023 to August 31, 2023, which include waived fees or reimbursed expenses, multiplied by the average account value over the period, multiplied by the number of days (184) in the most recent fiscal half-year, then divided by 365 to reflect the one half-year period. The Fund’s ending account values on the first line in the table is based on the actual six-month total investment return for the Fund. |
5 |
P/E GLOBAL ENHANCED INTERNATIONAL FUND
PORTFOLIO HOLDINGS SUMMARY TABLE
August 31, 2023
The following table presents a summary of the portfolio holdings of the Fund:
| % OF NET | Value | ||||||
SHORT-TERM INVESTMENTS: U.S. Treasury Obligations | 68.4 | % | $ | 14,873,406 | ||||
OTHER ASSETS IN EXCESS OF LIABILITIES (including futures currency contracts) | 31.6 | 6,879,487 | ||||||
NET ASSETS | 100.0 | % | $ | 21,752,893 | ||||
The Fund seeks to achieve its investment objective by allocating its assets among derivatives and fixed income securities.
As a result of the Fund’s use of derivatives, the Fund may hold significant amounts of U.S. Treasuries or short-term investments.
Portfolio holdings are subject to change at any time.
Refer to the Portfolio Investments for a detailed listing of the Fund’s holdings.
The accompanying notes are an integral part of these financial statements.
6 |
P/E GLOBAL ENHANCED INTERNATIONAL FUND
PORTFOLIO OF INVESTMENTS
August 31, 2023
| COUPON* | MATURITY | PAR | Value | ||||||||||||
SHORT-TERM INVESTMENTS — 68.4% | ||||||||||||||||
U.S. TREASURY OBLIGATIONS — 68.4% | ||||||||||||||||
United States Treasury Bill | 4.057 | % | 09/28/23 | $ | 5,000 | $ | 4,980,181 | |||||||||
United States Treasury Bill | 4.748 | % | 10/26/23 | 5,000 | 4,959,600 | |||||||||||
United States Treasury Bill | 4.974 | % | 11/30/23 | 5,000 | 4,933,625 | |||||||||||
TOTAL U.S. TREASURY OBLIGATIONS (Cost $14,875,800) | 14,873,406 | |||||||||||||||
TOTAL SHORT-TERM INVESTMENTS (Cost $14,875,800) | 14,873,406 | |||||||||||||||
TOTAL INVESTMENTS — 68.4% (Cost $14,875,800) | 14,873,406 | |||||||||||||||
OTHER ASSETS IN EXCESS OF LIABILITIES — 31.6% | 6,879,487 | |||||||||||||||
NET ASSETS — 100.0% | $ | 21,752,893 | ||||||||||||||
* | Short-term investments’ coupon reflects the annualized yield on the date of purchase for discounted investments. |
The accompanying notes are an integral part of these financial statements.
7 |
P/E GLOBAL ENHANCED INTERNATIONAL FUND
Portfolio of Investments in Futures Contracts
August 31, 2023
Futures contracts outstanding as of August 31, 2023 were as follows:
LONG CONTRACTS | EXPIRATION | NUMBER OF | NOTIONAL | VALUE AND | ||||||||||||
iShares MSCI EAFE ETF | Sep-23 | 198 | $ | 20,882,070 | $ | (718,354 | ) | |||||||||
NOK Currency Futures | Sep-23 | 2 | 199,932 | 387 | ||||||||||||
SEK Currency Futures | Sep-23 | 8 | 798,922 | 21,699 | ||||||||||||
ZAR Currency Futures | Sep-23 | 2 | 52,900 | (550 | ) | |||||||||||
| $ | (696,818 | ) | ||||||||||||||
SHORT CONTRACTS | EXPIRATION | NUMBER OF | NOTIONAL | VALUE AND | ||||||||||||
AUD Currency Futures | Sep-23 | 183 | $ | (11,854,740 | ) | $ | 562,979 | |||||||||
CAD Currency Futures | Sep-23 | 7 | (517,895 | ) | 9,258 | |||||||||||
CHF Currency Futures | Sep-23 | 22 | (3,118,363 | ) | (30,514 | ) | ||||||||||
EUR Currency Futures | Sep-23 | 142 | (19,263,187 | ) | 11,050 | |||||||||||
GBP Currency Futures | Sep-23 | 73 | (5,778,406 | ) | (12,863 | ) | ||||||||||
JPY Currency Futures | Sep-23 | 98 | (8,442,700 | ) | 353,637 | |||||||||||
NZD Currency Futures | Sep-23 | 5 | (297,875 | ) | 9,795 | |||||||||||
| $ | 903,342 | |||||||||||||||
Total Futures Contracts | $ | 206,524 | ||||||||||||||
AUD | Australian Dollar |
GBP | British Pound |
CAD | Canadian Dollar |
CHF | Swiss Franc |
EUR | Euro |
JPY | Japanese Yen |
NOK | Norwegian Krone |
NZD | New Zealand Dollar |
SEK | Swedish Krona |
ZAR | South African Rand |
The accompanying notes are an integral part of these financial statements.
8 |
P/E GLOBAL ENHANCED INTERNATIONAL FUND
Statement of Assets and Liabilities
August 31, 2023
ASSETS | ||||
Investments, at value (cost $14,875,800) | $ | 14,873,406 | ||
Deposits with broker for futures contracts | 4,381,629 | |||
Cash and cash equivalents | 2,229,336 | |||
Unrealized appreciation on futures contracts | 968,805 | |||
Foreign currency deposits with broker for futures contracts (cost $50,986) | 51,726 | |||
Prepaid expenses and other assets | 46,673 | |||
Total assets | 22,551,575 | |||
LIABILITIES | ||||
Unrealized depreciation on futures contracts | 762,281 | |||
Payable for advisory fees | 3,191 | |||
Other accrued expenses and liabilities | 33,210 | |||
Total liabilities | 798,682 | |||
Net assets | $ | 21,752,893 | ||
NET ASSETS CONSIST OF: | ||||
Paid-in capital | $ | 20,405,909 | ||
Total distributable earnings/(losses) | 1,346,984 | |||
Net assets | $ | 21,752,893 | ||
Shares issued and outstanding (unlimited number of shares authorized without par value) | 1,962,191 | |||
Net asset value, offering and redemption price per share | $ | 11.09 |
The accompanying notes are an integral part of these financial statements.
9 |
P/E GLOBAL ENHANCED INTERNATIONAL FUND
Statement of Operations
FOR THE PERIOD ended August 31, 2023(1)
INVESTMENT INCOME | ||||
Interest | $ | 18,030 | ||
Total investment income | 18,030 | |||
EXPENSES | ||||
Advisory fees (Note 2) | 103,147 | |||
Offering costs | 63,519 | |||
Registration and filing fees | 35,512 | |||
Transfer agent fees (Note 2) | 32,728 | |||
Administration and accounting fees (Note 2) | 29,525 | |||
Audit and tax service fees | 19,201 | |||
Printing and shareholder reporting fees | 5,054 | |||
Custodian fees (Note 2) | 634 | |||
Other expenses | 2,688 | |||
Total expenses before waivers and/or reimbursements | 292,008 | |||
Less: waivers and/or reimbursements (Note 2) | (183,432 | ) | ||
Net expenses after waivers and/or reimbursements | 108,576 | |||
Net investment income/(loss) | (90,546 | ) | ||
NET REALIZED AND UNREALIZED GAIN/(LOSS) FROM INVESTMENTS | ||||
Net realized gain/(loss) from: | ||||
Futures contracts | 1,235,987 | |||
Foreign currency transactions | (1,847 | ) | ||
Net change in unrealized appreciation/(depreciation) from: | ||||
Investments | (2,394 | ) | ||
Futures contracts | 206,524 | |||
Foreign currency translations | (740 | ) | ||
Net realized and unrealized gain/(loss) from investments | 1,437,530 | |||
NET INCREASE/(DECREASE) IN NET ASSETS RESULTING FROM OPERATIONS | $ | 1,346,984 |
(1) | Inception date of the Fund was December 29, 2022. |
The accompanying notes are an integral part of these financial statements.
10 |
P/E GLOBAL ENHANCED INTERNATIONAL FUND
STATEMENT of Changes in Net Assets
| For the | |||
INCREASE/(DECREASE) IN NET ASSETS FROM OPERATIONS: | ||||
Net investment income/(loss) | $ | (90,546 | ) | |
Net realized gain/(loss) from investments, futures contracts and foreign currency transactions | 1,234,140 | |||
Net change in unrealized appreciation/(depreciation) on investments, futures contracts and foreign currency translations | 203,390 | |||
Net increase/(decrease) in net assets resulting from operations | 1,346,984 | |||
CAPITAL SHARE TRANSACTIONS: | ||||
Proceeds from shares sold | 20,405,952 | |||
Shares redeemed | (43 | ) | ||
Net increase/(decrease) in net assets from capital share transactions | 20,405,909 | |||
Total increase/(decrease) in net assets | 21,752,893 | |||
NET ASSETS: | ||||
Beginning of period | — | |||
End of period | $ | 21,752,893 | ||
SHARE TRANSACTIONS: | ||||
Shares sold | 1,962,195 | |||
Shares redeemed | (4 | ) | ||
Net increase/(decrease) in shares outstanding | 1,962,191 | |||
(1) | Inception date of the Fund was December 29, 2022. |
The accompanying notes are an integral part of these financial statements.
11 |
P/E GLOBAL ENHANCED INTERNATIONAL FUND
Financial Highlights
Contained below is per share operating performance data for institutional class shares outstanding, total investment return/(loss), ratios to average net assets and other supplemental data for the period. This information has been derived from information provided in the financial statements.
| For the | |||
PER SHARE OPERATING PERFORMANCE | ||||
Net asset value, beginning of period | $ | 10.00 | ||
Net investment income/(loss)(2) | (0.06 | ) | ||
Net realized and unrealized gain/(loss) from investments | 1.15 | |||
Net increase/(decrease) in net assets resulting from operations | 1.09 | |||
Net asset value, end of period | 11.09 | |||
Total investment return/(loss)(3) | 10.90 | %(4) | ||
RATIOS/SUPPLEMENTAL DATA | ||||
Net assets, end of period (000’s omitted) | $ | 21,753 | ||
Ratio of expenses to average net assets with waivers and/or reimbursements | 1.00 | %(5) | ||
Ratio of expenses to average net assets without waivers and/or reimbursements | 2.69 | %(5) | ||
Ratio of net investment income/(loss) to average net assets | (0.83 | )%(5) | ||
Portfolio turnover rate | 0 | %(4) | ||
(1) | Inception date of the Institutional Class Shares of the Fund was December 29, 2022. |
(2) | Per share data calculated using average shares outstanding method. |
(3) | Total investment return/(loss) is calculated assuming a purchase of shares on the first day and a sale of shares on the last day of the period reported and includes reinvestments of dividends and distributions, if any. |
(4) | Not annualized. |
(5) | Annualized. |
The accompanying notes are an integral part of these financial statements.
12 |
P/E GLOBAL ENHANCED INTERNATIONAL FUND
Notes to Financial Statements
August 31, 2023
1. Organization And Significant Accounting Policies
The RBB Fund Trust, (the “Trust”) was organized as a Delaware statutory trust on August 29, 2014, and is registered under the Investment Company Act of 1940, as amended (the “1940 Act”), as an open-end management investment company. The Trust is a “series fund,” which is a mutual fund complex divided into separate portfolios. Each portfolio is treated as a separate entity for certain matters under the 1940 Act, and for other purposes, and a shareholder of one portfolio is not deemed to be a shareholder of any other portfolio. Currently, the Trust has eight separate investment portfolios, including the P/E Global Enhanced International Fund (the “Fund”), which commenced investment operations on December 29, 2022. The Fund is authorized to offer three classes of shares, Institutional Class, Investor Class, and Class A Shares. Investor Class Shares and Class A Shares have not yet commenced operations as of the end of August 31, 2023, the reporting period.
The investment objective of the Fund is to seek total return.
The Fund is an investment company and follows accounting and reporting guidance in the Financial Accounting Standards Board (“FASB”) Accounting Standards Codification Topic 946 “Financial Services - Investment Companies.”
The end of the reporting period for the Fund is August 31, 2023, and the period covered by these Notes to Financial Statements is the since inception period from December 29, 2022 through August 31, 2023 (the “current fiscal period”).
PORTFOLIO VALUATION — The Fund’s net asset value (“NAV”) is calculated once daily at the close of regular trading hours on the New York Stock Exchange (“NYSE”) (generally 4:00 p.m. Eastern time) on each day the NYSE is open. Securities held by the Fund are valued using the closing price or the last sales price on a national securities exchange or the National Association of Securities Dealers Automatic Quotation System (“NASDAQ”) market system where they are primarily traded. Fixed income securities are valued using an independent pricing service, which considers factors such as security prices, yields, maturities and ratings, and are deemed representative of market values at the close of the market. Investments in other open-end investment companies are valued based on the NAV of those investment companies (which may use fair value pricing as discussed in their prospectuses). Forward currency exchange contracts are valued by interpolating between spot and forward currency rates as quoted by an independent pricing service. Futures contracts are generally valued using the settlement price determined by the relevant exchange. If market quotations are unavailable or deemed unreliable, securities will be valued by the Valuation Designee (as defined below) in accordance with procedures adopted by the Trust’s Board of Trustees (the “Board”). Relying on prices supplied by pricing services or dealers or using fair valuation may result in values that are higher or lower than the values used by other investment companies and investors to price the same investments.
The Board has adopted a pricing and valuation policy for use by the Fund and its Valuation Designee (as defined below) in calculating the Fund’s NAV. Pursuant to Rule 2a-5 under the 1940 Act, the Fund has designated the Adviser as its “Valuation Designee” to perform all of the fair value determinations as well as to perform all of the responsibilities that may be performed by the Valuation Designee in accordance with Rule 2a-5. The Valuation Designee is authorized to make all necessary determinations of the fair values of portfolio securities and other assets for which market quotations are not readily available or if it is deemed that the prices obtained from brokers and dealers or independent pricing services are unreliable.
FAIR VALUE MEASUREMENTS — The inputs and valuation techniques used to measure the fair value of the Fund’s investments are summarized into three levels as described in the hierarchy below:
● | Level 1 – Prices are determined using quoted prices in active markets for identical securities. |
● | Level 2 – Prices are determined using other significant observable inputs (including quoted prices for similar securities, interest rates, prepayment speeds, credit risk, etc.). |
13 |
P/E GLOBAL ENHANCED INTERNATIONAL FUND
Notes to Financial Statements (continued)
August 31, 2023
● | Level 3 – Prices are determined using significant unobservable inputs (including the Fund’s own assumptions in determining the fair value of investments). |
The inputs or methodologies used for valuing securities are not necessarily an indication of the risk associated with investing in those securities.
The following is a summary of the inputs used, as of the end of the reporting period, in valuing the Fund’s investments carried at fair value:
| TOTAL | LEVEL 1 | LEVEL 2 | LEVEL 3 | ||||||||||||
Short-Term Investments | $ | 14,873,406 | $ | — | $ | 14,873,406 | $ | — | ||||||||
Foreign Currency Contracts | ||||||||||||||||
Futures Contracts | 968,805 | 968,805 | — | — | ||||||||||||
Total Assets | $ | 15,842,211 | $ | 968,805 | $ | 14,873,406 | $ | — | ||||||||
| TOTAL | LEVEL 1 | LEVEL 2 | LEVEL 3 | ||||||||||||
Foreign Currency Contracts | ||||||||||||||||
Futures Contracts | $ | (43,927 | ) | $ | (43,927 | ) | $ | — | $ | — | ||||||
Equity Contracts | ||||||||||||||||
Futures Contracts | (718,354 | ) | (718,354 | ) | — | — | ||||||||||
Total Liabilities | $ | (762,281 | ) | $ | (762,281 | ) | $ | — | $ | — | ||||||
At the end of each quarter, management evaluates the classification of Levels 1, 2 and 3 assets and liabilities. Various factors are considered, such as changes in liquidity from the prior reporting period; whether or not a broker is willing to execute at the quoted price; the depth and consistency of prices from third party pricing services; and the existence of contemporaneous, observable trades in the market. Additionally, management evaluates the classification of Levels 1, 2 and 3 assets and liabilities on a quarterly basis for changes in listings or delistings on national exchanges.
Due to the inherent uncertainty of determining the fair value of investments that do not have a readily available market value, the fair value of the Fund’s investments may fluctuate from period to period. Additionally, the fair value of investments may differ significantly from the values that would have been used had a ready market existed for such investments and may differ materially from the values the Fund may ultimately realize. Further, such investments may be subject to legal and other restrictions on resale or otherwise less liquid than publicly traded securities.
For fair valuations using significant unobservable inputs, U.S. generally accepted accounting principles (“U.S. GAAP”) requires the Fund to present a reconciliation of the beginning to ending balances for reported market values that presents changes attributable to total realized and unrealized gains or losses, purchase and sales, and transfers in and out of Level 3 during the current fiscal period. Transfers in and out between levels are based on values at the end of the current fiscal period. A reconciliation of Level 3 investments is presented only when the Fund had an amount of Level 3 investments at the end of the reporting period that was meaningful in relation to its net assets. The amounts and reasons for Level 3 transfers are disclosed if the Fund had an amount of total transfers during the reporting period that was meaningful in relation to its net assets as of the end of the reporting period.
During the current fiscal period, the Fund had no Level 3 transfers.
14 |
P/E GLOBAL ENHANCED INTERNATIONAL FUND
Notes to Financial Statements (continued)
August 31, 2023
DISCLOSURES ABOUT DERIVATIVE INSTRUMENTS AND HEDGING ACTIVITIES
Derivative instruments are defined as financial instruments whose value and performance are based on the value and performance of another security or financial instrument. Derivative instruments that the Fund used during the current fiscal period include futures contracts.
During the current fiscal period, the Fund used long and short contracts on U.S. equity market indices and foreign currencies, to gain investment exposure in accordance with its investment objective.
The following tables provide quantitative disclosures about fair value amounts of, and gains and losses on, the Fund’s derivative instruments as of and for the current fiscal period.
The following tables list the fair values and location on the Statement of Assets and Liabilities of the Fund’s derivative holdings as of the end of the reporting period, grouped by derivative type and primary risk exposure category by contract type.
DERIVATIVE TYPE | STATEMENT OF | EQUITY | FOREIGN | TOTAL | ||||||||||||
Asset Derivatives | ||||||||||||||||
Futures Contracts (a) | Unrealized appreciation on futures contracts | $ | — | $ | 968,805 | $ | 968,805 | |||||||||
Total Value - Assets | $ | — | $ | 968,805 | $ | 968,805 | ||||||||||
Liability Derivatives | ||||||||||||||||
Futures Contracts (a) | Unrealized depreciation on futures contracts | $ | (718,354 | ) | $ | (43,927 | ) | $ | (762,281 | ) | ||||||
Total Value - Liabilities | $ | (718,354 | ) | $ | (43,927 | ) | $ | (762,281 | ) | |||||||
(a) | This amount represents the cumulative appreciation/(depreciation) of futures contracts as reported in the Portfolio of Investments. |
The following table lists the amounts of realized gains/(losses) included in net increase/(decrease) in net assets resulting from operations during the current fiscal period, grouped by derivative type and primary risk exposure category by contract type.
DERIVATIVE TYPE | STATEMENT OF | EQUITY | FOREIGN | TOTAL | ||||||||||||
Realized Gain/(Loss) | ||||||||||||||||
Futures Contracts | Net realized gain/(loss from futures contracts | ) | $ | 1,377,407 | $ | (141,420 | ) | $ | 1,235,987 | |||||||
Total Realized Gain/(Loss) | $ | 1,377,407 | $ | (141,420 | ) | $ | 1,235,987 | |||||||||
15 |
P/E GLOBAL ENHANCED INTERNATIONAL FUND
Notes to Financial Statements (continued)
August 31, 2023
The following table lists the amounts of change in unrealized appreciation/(depreciation) included in net increase/(decrease) in net assets resulting from operations during the current fiscal period, grouped by derivative type and primary risk exposure category by contract type.
DERIVATIVE TYPE | STATEMENT OF | EQUITY | FOREIGN | TOTAL | ||||||||||||
Change in Unrealized Appreciation/(Depreciation) | ||||||||||||||||
Futures Contracts | Net change in unrealized appreciation/(depreciation) on futures contracts | $ | (718,354 | ) | $ | 924,878 | $ | 206,524 | ||||||||
Total Change in Unrealized Appreciation/(Depreciation) | $ | (718,354 | ) | $ | 924,878 | $ | 206,524 | |||||||||
During the current fiscal period, the Fund’s quarterly average volume of derivatives was as follows:
LONG FUTURES | SHORT FUTURES | ||||||
| $ | 16,152,327 | $ | (36,441,040 | ) | |||
USE OF ESTIMATES — The preparation of financial statements in conformity with U.S. GAAP requires management to make estimates and assumptions that affect the reported amounts of assets and liabilities and disclosure of contingent assets and liabilities at the date of the financial statements and the reported amounts of revenues and expenses during the current fiscal period. Actual results could differ from those estimates and those differences could be significant.
INVESTMENT TRANSACTIONS, INVESTMENT INCOME AND EXPENSES — The Fund records security transactions based on trade date for financial reporting purposes. The cost of investments sold is determined by use of the specific identification method for both financial reporting and income tax purposes in determining realized gains and losses on investments. Interest income (including amortization of premiums and accretion of discounts) is accrued when earned. Dividend income is recorded on the ex-dividend date. Distributions received on securities that represent a return of capital or capital gain are recorded as a reduction of cost of investments and/or as a realized gain. The Fund’s investment income, expenses (other than class specific expenses) and unrealized and realized gains and losses are allocated daily to each class of shares based upon the relative proportion of net assets of each class at the beginning of the day. Certain expenses are shared with The RBB Fund, Inc. (“RBB”) a series trust of affiliated funds. Expenses incurred on behalf of a specific class, fund or fund family of the Trust or RBB are charged directly to the class, fund or fund family (in proportion to net assets). Expenses incurred for all funds (such as director or professional fees) are charged to all funds in proportion to their average net assets of the Trust and RBB, or in such other manner as the Board deems fair or equitable. Expenses and fees, including investment advisory and administration fees, are accrued daily and taken into account for the purpose of determining the NAV of the Fund.
DIVIDENDS AND DISTRIBUTIONS TO SHAREHOLDERS — Dividends from net investment income and distributions from net realized capital gains, if any, are declared and paid at least annually to shareholders and recorded on the ex-dividend date. Income dividends and capital gain distributions are determined in accordance with U.S. federal income tax regulations, which may differ from U.S. GAAP.
16 |
P/E GLOBAL ENHANCED INTERNATIONAL FUND
Notes to Financial Statements (continued)
August 31, 2023
U.S. TAX STATUS — No provision is made for U.S. income taxes as it is the Fund’s intention to continue to qualify for and elect the tax treatment applicable to regulated investment companies under Subchapter M of the Internal Revenue Code of 1986, as amended, and make the requisite distributions to its shareholders which will be sufficient to relieve it from U.S. income and excise taxes.
SEC RULE 18f-4 — Effective August 19, 2022, the U.S. Securities and Exchange Commission (the “SEC”) implemented Rule 18f-4 under the 1940 Act (“Rule 18f-4”), providing for the regulation of a registered investment company’s use of derivatives and certain related instruments. Among other things, Rule 18f-4 limits a fund’s derivatives exposure through a value-at-risk test and requires the adoption and implementation of a derivatives risk management program for certain derivatives users. The Fund, as a full derivatives user (as defined in Rule 18f-4), is subject to the full requirements of Rule 18f-4. The Fund is required to comply with Rule 18f-4 and has adopted procedures for investing in derivatives and other transactions in compliance with Rule 18f-4.
FUTURES CONTRACTS — The Fund uses futures contracts in the normal course of pursuing its investment objective. Upon entering into a futures contract, the Fund must deposit initial margin in addition to segregating cash or liquid assets sufficient to meet its obligation to purchase or provide securities, or to pay the amount owed at the expiration of an index-based futures contract. Such liquid assets may consist of cash, cash equivalents, liquid debt or equity securities or other acceptable assets. Pursuant to the futures contract, the Fund agrees to receive from, or pay to the broker, an amount of cash equal to the daily fluctuation in value of the contract. Such a receipt of payment is known as “variation margin” and is recorded by the Fund as an unrealized gain or loss. When the contract is closed, the Fund records a realized gain or loss equal to the difference between the proceeds from (or cost of) the closing transactions and the Fund’s basis in the contract. Futures contracts have market risks, including the risk that the change in the value of the contract may not correlate with changes in the value of the underlying securities. Use of long futures contracts subjects the Fund to risk of loss in excess of the amount shown on the Statement of Assets and Liabilities, up to the notional value of the futures contract. Use of short futures contracts subjects the Fund to unlimited risk of loss.
COMMODITY SECTOR RISK — Exposure to the commodities markets may subject the Fund to greater volatility than investments in traditional securities. The value of commodity-linked derivative instruments may be affected by changes in overall market movements, commodity index volatility, changes in interest rates or factors affecting a particular industry or commodity, such as drought, floods, weather, livestock disease, embargoes, tariffs and international economic, political and regulatory developments. The prices of energy, industrial metals, precious metals, agriculture and livestock sector commodities may fluctuate widely due to factors such as changes in value, supply and demand and governmental regulatory policies. The commodity-linked securities in which the Fund invests may be issued by companies in the financial services sector, and events affecting the financial services sector may cause the Fund’s share value to fluctuate.
FOREIGN CURRENCY TRANSLATION — Assets and liabilities initially expressed in non-U.S. currencies are translated into U.S. dollars based on the applicable exchange rates at the date of the last business day of the financial statement period. Purchases and sales of securities, interest income, dividends, variation margin received and expenses denominated in foreign currencies are translated into U.S. dollars at the exchange rates in effect on the transaction date. The Fund does not separately report the effect of changes in foreign exchange rates from changes in market prices of securities held. Such changes are included with the net realized gain or loss and change in unrealized appreciation or depreciation on investments in the Statement of Operations. Other foreign currency transactions resulting in realized and unrealized gain or loss are reported separately as net realized gain or loss and change in unrealized appreciation or depreciation on foreign currencies in the Statement of Operations.
17 |
P/E GLOBAL ENHANCED INTERNATIONAL FUND
Notes to Financial Statements (continued)
August 31, 2023
CURRENCY RISK — Investment in foreign securities involves currency risk associated with securities that trade or are denominated in currencies other than the U.S. dollar and which may be affected by fluctuations in currency exchange rates. An increase in the strength of the U.S. dollar relative to a foreign currency may cause the U.S. dollar value of an investment in that country to decline. Foreign currencies also are subject to risks caused by inflation, interest rates, budget deficits and low savings rates, political factors and government controls. Forward foreign currency exchange contracts may limit potential gains from a favorable change in value between the U.S. dollar and foreign currencies. Unanticipated changes in currency pricing may result in poorer overall performance for the Fund than if it had not engaged in these contracts.
FOREIGN SECURITIES MARKET RISK — A substantial portion of the trades of the Fund are expected to take place on markets or exchanges outside the United States. There is no limit to the amount of assets of the Fund that may be committed to trading on foreign markets. The risk of loss in trading foreign futures and options on futures contracts can be substantial. Participation in foreign futures and options on futures contracts involves the execution and clearing of trades on, or subject to the rules of, a foreign board of trade or exchange. Some of these foreign markets, in contrast to U.S. exchanges, are so-called principals’ markets in which performance is the responsibility only of the individual counterparty with whom the trader has entered into a commodity interest transaction and not of the exchange or clearing corporation. In these kinds of markets, there is risk of bankruptcy or other failure or refusal to perform by the counterparty.
COUNTERPARTY RISK — The derivative contracts entered into by the Fund or its subsidiary may be privately negotiated in the over-the-counter market. These contracts also involve exposure to credit risk, since contract performance depends in part on the financial condition of the counterparty. Relying on a counterparty exposes the Fund to the risk that a counterparty will not settle a transaction in accordance with its terms and conditions because of a dispute over the terms of the contract (whether or not bona fide) or because of a credit or liquidity problem, thus causing the Fund to suffer a loss. If a counterparty defaults on its payment obligations to the Fund, this default will cause the value of an investment in the Fund to decrease.
CREDIT RISK — Credit risk refers to the possibility that the issuer of the security or a counterparty in respect of a derivative instrument will not be able to satisfy its payment obligations to the Fund when due. Changes in an issuer’s credit rating or the market’s perception of an issuer’s creditworthiness may also affect the value of the Fund’s investment in that issuer. Securities rated in the four highest categories by the rating agencies are considered investment grade but they may also have some speculative characteristics. Investment grade ratings do not guarantee that bonds will not lose value or default. In addition, the credit quality of securities may be lowered if an issuer’s financial condition changes.
U.S. GOVERNMENT SECURITIES — The Fund may invest in U.S. government securities. Securities issued or guaranteed by the U.S. government or its agencies or instrumentalities include U.S. Treasury securities, which are backed by the full faith and credit of the U.S. Treasury and which differ only in their interest rates, maturities, and times of issuance. U.S. Treasury bills have initial maturities of one year or less; U.S. Treasury notes have initial maturities of one to ten years; and U.S. Treasury bonds generally have initial maturities of greater than ten years. Certain U.S. government securities are issued or guaranteed by agencies or instrumentalities of the U.S. government including, but not limited to, obligations of U.S. government agencies or instrumentalities such as Fannie Mae, Freddie Mac, Ginnie Mae, the Small Business Administration, the Federal Farm Credit Administration, the Federal Home Loan Banks, Banks for Cooperatives (including the Central Bank for Cooperatives), the Federal Land Banks, the Federal Intermediate Credit Banks, the Tennessee Valley Authority, the Export-Import Bank of the United States, the Commodity Credit Corporation, the Federal Financing Bank, the Student Loan Marketing Association, the National Credit Union Administration and the Federal Agricultural Mortgage Corporation (Farmer Mac).
18 |
P/E GLOBAL ENHANCED INTERNATIONAL FUND
Notes to Financial Statements (continued)
August 31, 2023
Some obligations issued or guaranteed by U.S. government agencies and instrumentalities, including, for example, Ginnie Mae pass-through certificates, are supported by the full faith and credit of the U.S. Treasury. Other obligations issued by or guaranteed by federal agencies, such as those securities issued by Fannie Mae, are supported by the discretionary authority of the U.S. government to purchase certain obligations of the federal agency, while other obligations issued by or guaranteed by federal agencies, such as those of the Federal Home Loan Banks, are supported by the right of the issuer to borrow from the U.S. Treasury, while the U.S. government provides financial support to such U.S. government-sponsored federal agencies, no assurance can be given that the U.S. government will always do, since the U.S. government is not so obligated by law. U.S. Treasury notes and bonds typically pay coupon interest semi-annually and repay the principal at maturity.
CASH AND CASH EQUIVALENTS — Cash and cash equivalents are valued at cost plus accrued interest, which approximates market value.
OTHER — In the normal course of business, the Fund may enter into contracts that provide general indemnifications. The Fund’s maximum exposure under these arrangements is dependent on claims that may be made against the Fund in the future, and, therefore, cannot be estimated; however, the Fund expects the risk of material loss from such claims to be remote.
2. Investment Adviser and Other Services
P/E Global LLC serves as the investment adviser to the Fund. The Fund compensates the Adviser for its services at an annual rate based on the Fund’s average daily net assets (the “Advisory Fee”), payable on a monthly basis in arrears, as shown in the following table.
The Adviser has contractually agreed to waive advisory fees and/or reimburse expenses to the extent that total annual Fund operating expenses (excluding certain items discussed below) exceed the rate (“Expense Cap”) shown in the following table of the Fund’s average daily net assets. In determining the Adviser’s obligation to waive advisory fees and/or reimburse expenses, the following expenses are not taken into account and could cause total annual Fund operating expenses to exceed the Expense Cap as applicable: acquired fund fees and expenses, brokerage commissions, extraordinary expenses interest and taxes. This contractual limitation is in effect until December 31, 2023 and may not be terminated without the approval of the Board. The Adviser may discontinue this arrangement at any time after December 31, 2023.
ADVISORY FEE | EXPENSE CAP |
0.95% | 1.00% |
During the current fiscal period, investment advisory fees accrued, waived and/or reimbursed by the Adviser were as follows:
GROSS | WAIVERS AND/OR | NET | |||||||||
| $ | 103,147 | $ | (183,432 | ) | $ | (80,285 | ) | ||||
19 |
P/E GLOBAL ENHANCED INTERNATIONAL FUND
Notes to Financial Statements (continued)
August 31, 2023
If at any time the Fund’s total annual Fund operating expenses for a year are less than the Expense Cap, the Adviser is entitled to reimbursement by the Fund of the advisory fees forgone and other payments remitted by the Adviser to the Fund within three years from the date on which such waiver or reimbursement was made, provided such reimbursement does not cause the Fund to exceed the Expense Cap that was in effect at the time of the waiver or reimbursement.
As of the end of the reporting period, the Fund had amounts available for recoupment as follows:
EXPIRATION | |||
| $ | 183,432 | ||
U.S. Bancorp Fund Services, LLC, doing business as U.S. Bank Global Fund Services (“Fund Services”), serves as administrator for the Fund. For providing administrative and accounting services, Fund Services is entitled to receive a monthly fee, subject to certain minimum and out of pocket expenses.
Fund Services serves as the Fund’s transfer and dividend disbursing agent. For providing transfer agent services, Fund Services is entitled to receive a monthly fee, subject to certain minimum and out of pocket expenses.
U.S. Bank, N.A. (the “Custodian”) provides certain custodial services to the Fund. The Custodian is entitled to receive a monthly fee, subject to certain minimum and out of pocket expenses.
Quasar Distributors, LLC (the “Distributor”), a wholly-owned broker-dealer subsidiary of Foreside Financial Group, LLC, serves as the principal underwriter and distributor of the Fund’s shares pursuant to a Distribution Agreement with the Trust.
For compensation amounts paid to Fund Services and the Custodian, please refer to the Statement of Operations.
3. Trustee And Officer Compensation
The Trustees of the Trust receive an annual retainer and meeting fees for meetings attended. An employee of Vigilant Compliance, LLC serves as Chief Compliance Officer of the Trust. Vigilant Compliance, LLC is compensated for the services provided to the Trust. Employees of the Trust serve as President, Chief Financial Officer, Chief Operating Officer, Secretary and Director of Marketing & Business Development of the Trust. They are compensated for services provided. Certain employees of Fund Services serve as officers of the Trust. They are not compensated by the Fund or the Trust. For Trustee and Officer compensation amounts, please refer to the Statement of Operations.
4. Purchases and Sales of Investment Securities
During the current fiscal period, there were no purchases or sales of investment securities or long-term U.S. Government securities (excluding short-term investments and derivative transactions) by the Fund.
5. Federal Income Tax Information
The Fund has followed the authoritative guidance on accounting for and disclosure of uncertainty in tax positions, which requires the Fund to determine whether a tax position is more likely than not to be sustained upon examination, including resolution of any related appeals or litigation processes, based on the technical merits of the position. The Fund has determined that there was no effect on the
20 |
P/E GLOBAL ENHANCED INTERNATIONAL FUND
Notes to Financial Statements (continued)
August 31, 2023
financial statements from following this authoritative guidance. In the normal course of business, the Fund is subject to examination by federal, state and local jurisdictions, where applicable, for tax years for which applicable statutes of limitations have not expired.
As of August 31, 2023, the federal tax cost and aggregate gross unrealized appreciation and depreciation of investments held by the Fund were as follows:
Federal Tax Cost | Unrealized | Unrealized | Net Unrealized | ||||||||||||
| $ | 14,875,800 | $ | — | $ | (3,134 | ) | $ | (3,134 | ) | ||||||
Distributions to shareholders, if any, from net investment income and realized gains are determined in accordance with federal income tax regulations, which may differ from net investment income and realized gains recognized for financial reporting purposes. Accordingly, the character of distributions and composition of net assets for tax purposes may differ from those reflected in the accompanying financial statements. To the extent these differences are permanent, such amounts are reclassified within the capital accounts based on the tax treatment; temporary differences do not require such reclassification.
As of August 31, 2023, there were no permanent differences between distributable earnings/(loss) and paid in capital.
As of August 31, 2023, the components of distributable earnings on a tax basis were as follows:
Undistributed | Undistributed Long- | Unrealized | |||||||||
| $ | 484,612 | $ | 865,506 | $ | (3,134 | ) | |||||
The tax character of dividends and distributions paid during the current fiscal period ended August 31, 2023 was as follows:
Ordinary Income | Long-Term Gains | Total | |||||||||
| $ | — | $ | — | $ | — | ||||||
Pursuant to federal income tax rules applicable to regulated investment companies, the Fund may elect to treat certain capital losses between November 1 and August 31 and late year ordinary losses ((i) ordinary losses between January 1 and August 31, and (ii) specified ordinary and currency losses between November 1 and August 31) as occurring on the first day of the following tax year. For the fiscal period ended August 31, 2023, any amount of losses elected within the tax return will not be recognized for federal income tax purposes until September 1, 2023. As of August 31, 2023, the Fund had no tax basis qualified late-year loss deferral or Post-October capital loss.
21 |
P/E GLOBAL ENHANCED INTERNATIONAL FUND
Notes to Financial Statements (CONCLUDED)
August 31, 2023
6. New Accounting Pronouncements And Regulatory Updates
In June 2022, the FASB issued Accounting Standards Update 2022-03, which amends Fair Value Measurement (Topic 820): Fair Value Measurement of Equity Securities Subject to Contractual Sale Restrictions (“ASU 2022-03”). ASU 2022-03 clarifies guidance for fair value measurement of an equity security subject to a contractual sale restriction and establishes new disclosure requirements for such equity securities. ASU 2022-03 is effective for fiscal years beginning after December 15, 2023 and for interim periods within those fiscal years, with early adoption permitted. Management is currently evaluating the impact of these amendments on the financial statements.
In October 2022, the SEC adopted rule and form amendments relating to tailored shareholder reports for mutual funds and ETFs and fee information in investment company advertisements. The rule and form amendments will, among other things, require the Fund to transmit concise and visually engaging shareholder reports that highlight key information. The amendments will require that funds tag information in a structured data format and that certain more in-depth information be made available online and available for delivery free of charge to investors on request. The amendments became effective January 24, 2023. There is an 18-month transition period after the effective date of the amendments until the Fund is required to comply.
In December 2022, the FASB issued an Accounting Standards Update, ASU 2022-06, Reference Rate Reform (Topic 848) – Deferral of the Sunset Date of Topic 848 (“ASU 2022-06”). ASU 2022-06 is an amendment to ASU 2020-04, which provided optional guidance to ease the potential accounting burden due to the discontinuation of the London Inter-Bank Offered Rate and other interbank-offered based reference rates and which was effective as of March 12, 2020 through December 31, 2022. ASU 2022-06 extends the effective period through December 31, 2024. Management is currently evaluating the impact, if any, of applying ASU 2022-06.
7. Subsequent Events
In preparing these financial statements, management of the Fund has evaluated events and transactions for potential recognition or disclosure through the date the financial statements were available to be issued, and has determined that there was the following subsequent event: The U.S.-designated terrorist group Hamas attacked Israel on October 7, 2023, resulting in an ensuing war in the region. Current hostilities and the potential for future hostilities may diminish the value, or cause significant volatility in the share price, of companies based in or having significant operations in Israel. The Israeli securities market may be closed for extended periods of time or trading on the Israeli securities market may be suspended altogether. How long the armed conflict and related events will last cannot be predicted.
22 |
P/E GLOBAL ENHANCED INTERNATIONAL FUND
Report of Independent Registered Public Accounting Firm
To the Shareholders of P/E Global Enhanced International Fund and
Board of Trustees of The RBB Fund Trust
Opinion on the Financial Statements
We have audited the accompanying statement of assets and liabilities, including the portfolio of investments and portfolio of investments in futures contracts, of P/E Global Enhanced International Fund (the “Fund”), a series of The RBB Fund Trust, as of August 31, 2023, the related statements of operations and changes in net assets, the related notes, and the financial highlights for the period December 29, 2022 (commencement of operations) through August 31, 2023 (collectively referred to as the “financial statements”). In our opinion, the financial statements present fairly, in all material respects, the financial position of the Fund as of August 31, 2023, the results of its operations, the changes in net assets, and the financial highlights for the period indicated above, in conformity with accounting principles generally accepted in the United States of America.
Basis for Opinion
These financial statements are the responsibility of the Fund’s management. Our responsibility is to express an opinion on the Fund’s financial statements based on our audit. We are a public accounting firm registered with the Public Company Accounting Oversight Board (United States) (“PCAOB”) and are required to be independent with respect to the Fund in accordance with the U.S. federal securities laws and the applicable rules and regulations of the Securities and Exchange Commission and the PCAOB.
We conducted our audit in accordance with the standards of the PCAOB. Those standards require that we plan and perform the audit to obtain reasonable assurance about whether the financial statements are free of material misstatement whether due to error or fraud.
Our audit included performing procedures to assess the risks of material misstatement of the financial statements, whether due to error or fraud, and performing procedures that respond to those risks. Such procedures included examining, on a test basis, evidence regarding the amounts and disclosures in the financial statements. Our procedures included confirmation of securities owned as of August 31, 2023, by correspondence with the custodian and broker. Our audit also included evaluating the accounting principles used and significant estimates made by management, as well as evaluating the overall presentation of the financial statements. We believe that our audit provides a reasonable basis for our opinion.
We have served as the Fund’s auditor since 2022.

COHEN & COMPANY, LTD.
Cleveland, Ohio
October 30, 2023
23 |
P/E GLOBAL ENHANCED INTERNATIONAL FUND
Shareholder Tax Information
(Unaudited)
Certain tax information regarding the Fund is required to be provided to shareholders based upon the Fund’s income and distributions for the taxable year ended August 31, 2023. The information and distribution reported herein may differ from information and distributions taxable to the shareholders for the calendar year ended December 31, 2023. During the current fiscal period ended August 31, 2023, the Fund paid no ordinary income dividends that are designated as “qualified dividend income” to its shareholders. Dividends from net investment income and short-term capital gains are treated as ordinary income dividends for federal income tax purposes.
Because the Fund’s fiscal year is not the calendar year, another notification will be sent with respect to calendar year 2023. The second notification, which will reflect the amount, if any, to be used by calendar year taxpayers on their U.S. federal income tax returns, will be made in conjunction with Form 1099-DIV and will be mailed in January 2024.
Foreign shareholders will generally be subject to U.S. withholding tax on the amount of their ordinary income dividends. They will generally not be entitled to a foreign tax credit or deduction for the withholding taxes paid by the Fund, if any.
In general, dividends received by tax-exempt recipients (e.g., IRAs and Keoghs) need not be reported as taxable income for U.S. federal income tax purposes. However, some retirement trusts (e.g., corporate, Keogh and 403(b)(7) plans) may need this information for their annual information reporting.
Shareholders are advised to consult their own tax advisers with respect to the tax consequences of their investment in the Fund.
24 |
P/E GLOBAL ENHANCED INTERNATIONAL FUND
Notice to Shareholders
(Unaudited)
Information on Proxy Voting
Policies and procedures that the Fund uses to determine how to vote proxies relating to portfolio securities as well as information regarding how the Fund voted proxies relating to portfolio securities during the most recent 12-month period ended June 30 are available (i) without charge, upon request, by calling (855) 610-4766; and (ii) on the SEC’s website at http://www.sec.gov.
Quarterly Schedule of Investments
The Trust files a complete schedule of portfolio holdings with the SEC for the first and third fiscal quarters of each fiscal year (quarters ended November 30 and May 31) as an exhibit to its report on Form N-PORT. The Trust’s Form N-PORT filings are available on the SEC’s website at http://www.sec.gov.
LIQUIDITY RISK MANAGEMENT PROGRAM
The Trust has adopted and implemented a Liquidity Risk Management Program (the “Trust Program”) as required by rule 22e-4 under the 1940 Act. In accordance with the Trust Program, the Adviser has adopted and implemented a liquidity risk management program (the “Adviser Program” and together with the Trust Program, the “Programs”) on behalf of the Fund. The Programs seek to assess, manage and review the Fund’s Liquidity Risk. “Liquidity Risk” is defined as the risk that the Fund could not meet requests to redeem shares issued by the Fund without significant dilution of remaining investors’ interest in the Fund.
The Board has appointed Vigilant Compliance, LLC (“Vigilant”) as the program administrator for the Trust Program and the Liquidity Risk Management Committee of the Adviser as the program administrator for the Adviser Program. The process of monitoring and determining the liquidity of the Fund’s investments is supported by one or more third-party vendors.
At meetings held during the current fiscal period, the Board and its Regulatory Oversight Committee received and reviewed a written report (the “Report”) of Vigilant and the Adviser concerning the operation of the Programs for the period from December 28, 2022 to December 31, 2022 (the “Period”). The Report summarized the operation of the Programs and the information and factors considered by Vigilant and the Adviser in reviewing the adequacy and effectiveness of the implementation of the Programs with respect to the Fund. Such information and factors included, among other things: (i) the methodology used to classify the liquidity of the Fund’s portfolio investments and the Adviser’s assessment that the Fund’s strategy remained appropriate for an open-end mutual fund; (ii) analyses of the Fund’s trading environment and reasonably anticipated trading size; (iii) that the Fund held primarily highly liquid assets (investments that the Fund anticipates can be converted to cash within 3 business days or less in current market conditions without significantly changing their market value); (iv) that the Fund either held a percentage of highly liquid assets above its highly liquid investment minimum at all times during the Period or did not require the establishment of a highly liquid investment minimum; (v) confirmation that the Fund did not breach the 15% maximum illiquid security threshold (investments that cannot be sold or disposed of in seven days or less in current market conditions without the sale of the investment significantly changing the market value of the investment) during the Period and the procedures for monitoring compliance with the limit; (vi) that the processes, technologies and third-party vendors used to assess, manage, and/or periodically review the Fund’s Liquidity Risk functioned appropriately during the Period; and (vii) that the Programs operated adequately during the Period. The Report also indicated that there were no material changes made to the Programs during the Period.
Based on the review, the Report concluded that the Programs were being implemented effectively and reasonably designed to assess and manage Liquidity Risk in the Fund’s portfolio.
There can be no assurance that the Trust Program or the Adviser Program will achieve its objectives under all circumstances in the future. Please refer to the Fund’s prospectus for more information regarding the Fund’s exposure to liquidity risk and other risks to which it may be subject.
25 |
P/E GLOBAL ENHANCED INTERNATIONAL FUND
Privacy Notice
(Unaudited)
Exhibit A
FACTS | WHAT DOES P/E GLOBAL ENHANCED INTERNATIONAL FUND (“P/E”) DO WITH YOUR PERSONAL INFORMATION? | ||
Why? | Financial companies choose how they share your personal information. Federal law gives consumers the right to limit some but not all sharing. Federal law also requires us to tell you how we collect, share, and protect your personal information. Please read this notice carefully to understand what we do. | ||
What? | The type of personal information we collect, and share depend on the product of service you have with us. This information can include: ● Social Security number and transaction history ● Account balances and checking account information ● Account transactions and wire transfer instructions When you are no longer a customer, we continue to share your information as described in this notice. | ||
How? | All financial companies need to share customers’ personal information to run their everyday business. In the section below, we list the reasons financial companies can share their customers’ personal information; the reasons P/E chooses to share; and whether you can limit this sharing. | ||
Reasons we share your personal information | Does P/E Global Enhanced International Fund share? | Can you limit this? | |
For our everyday business purposes — | Yes | No | |
For our marketing purposes — | Yes | Yes | |
For joint marketing with other financial companies | No | We don’t share. | |
For our affiliates’ everyday business purposes — | Yes | No | |
For our affiliates’ everyday business purposes — | No | We don’t share. | |
For our affiliates to market to you | Yes | No | |
For non-affiliates to market to you | No | We don’t share. | |
To limit our sharing | Please note: If you are a new customer, we can begin sharing your information 30 days from the days from the date we sent this notice. When you are no longer our customer, we continue to share your information as described in this notice. However, you can contact us at any time to limit our sharing |
Questions? | Call 1-855-610-4766 or visit https://peinvestments.com should you have any questions. |
26 |
P/E GLOBAL ENHANCED INTERNATIONAL FUND
Privacy Notice (continued)
(Unaudited)
Exhibit A
What we do | |
How does P/E protect my personal information? | To protect your personal information from unauthorized access and use, we use security measures that comply with federal law. These measures include computer safeguards and secured files and buildings. |
How does P/E collect my personal information? | We collect your personal information, for example, when you ● open an account ● provide account information ● give us your contact information ● make a wire transfer ● tell us where to send the money We also collect your information from others, such as credit bureaus, affiliates, or other companies |
Why can’t I limit all sharing? | Federal law gives you the right to limit only ● sharing for affiliates’ everyday business purposes-information about your creditworthiness ● affiliates from using your information to market to you ● sharing for nonaffiliates to market to you State laws and individual companies may give you additional rights to limit sharing. |
What happens when I limit sharing for an account I hold jointly with someone else? | In addition to the above information, where applicable, you have the following rights under the European Union’s General Data Protection Regulation (“GDPR”) and U.S. Privacy Laws, as applicable and to the extent permitted by law, to ● Check whether we hold personal information about you and to access such data (in accordance with our policy) ● Request the correction of personal information about you that is ● inaccurate ● Have a copy of the personal information we hold about you provided to you or another “controller” where technically feasible ● Request the erasure of your personal information ● Request the restriction of processing concerning you The legal grounds for processing of your personal information is for contractual necessity and compliance with law. If you wish to exercise any of your rights above, please call:1-888-229-1855. You are required to ensure the personal information we hold about you is up-to-date and accurate and you must notify us of any changes to the personal data you provided to us. The Funds shall retain your personal data for as long as you are an investor in the Funds and thereafter as long as necessary to comply with applicable laws that require the Funds to retain your personal data, such as the Securities and Exchange Commission’s data retention rules. Your personal data will be transferred to the United States so that the Funds may provide the agreed upon services for you. No adequacy decision has been rendered by the European Commission as to the data protection of your personal data when transferring it to the United States. However, the Funds do take the security of your personal data seriously. |
European Union’s General Data Protection Regulation | To protect your personal information from unauthorized access and use, we use security measures that comply with federal law. These measures include computer safeguards and secured files and buildings. |
27 |
P/E GLOBAL ENHANCED INTERNATIONAL FUND
Privacy Notice (CONCLUDED)
(Unaudited)
Exhibit A
Definitions | |
Affiliates | Companies related by common ownership or control. They can be financial and nonfinancial companies. |
Non-affiliates | Companies not related by common ownership or control. They can be financial and nonfinancial companies. P/E Global Enhanced International Fund does not share with non-affiliates so they can market to you. |
Joint marketing | A formal agreement between non-affiliated financial companies that together market financial products or services to you. P/E Global Enhanced International Fund doesn’t jointly market. |
Controller | “Controller” means the natural or legal person, public authority, agency or other body which, alone or jointly with others, determines the purposes and means of the processing of personal data; where the purposes and means of such processing are determined by European union or European Member state law, the controller or the specific criteria for its nomination may be provided for by European union or European Member state law. |
28 |
P/E GLOBAL ENHANCED INTERNATIONAL FUND
Trustees and Officers
(Unaudited)
The business and affairs of the Trust are managed under the direction of the Trust’s Board. The Trustees and executive officers of the Trust, their ages, business addresses and principal occupations during the past five years are set forth below.
Name, Address, | Positions(s) | Term of | Principal | Other | Number of |
Independent Trustees | |||||
Julian A. Brodsky | Trustee | June 2021 | Retired. | AMDOCS Limited (service provider to telecommunications companies). | 63 |
Gregory P. Chandler | Trustee | June 2021 | Since 2020, Chief Financial Officer, HC Parent Corp. d/b/a Herspiegel Consulting LLC (life sciences consulting services); 2020, Chief Financial Officer, Avocado Systems Inc. (cyber security software provider); from 2009 - 2020, Chief Financial Officer, Emtec, Inc. (information technology consulting/services). | FS Energy and Power Fund (business development company); Wilmington Funds (12 portfolios) (registered investment company); Emtec, Inc. (until December 2019); FS Investment Corporation (business development company) (until December 2018). | 63 |
Lisa A. Dolly | Trustee | October 2021 to present | From July 2019-December 2019, Chairman, Pershing LLC (broker dealer, clearing and custody firm); January 2016-June 2019, Chief Executive Officer, Pershing, LLC. | Allfunds Group PLC (United Kingdom wealthtech and fund distribution provider); Securities Industry and Financial Markets Association (trade association for broker dealers, investment banks and asset managers); Hightower Advisors (wealth management firm). | 63 |
29 |
P/E GLOBAL ENHANCED INTERNATIONAL FUND
Trustees and Officers (CONTINUED)
(Unaudited)
Name, Address, | Positions(s) | Term of | Principal | Other | Number of |
Independent Trustees (continued) | |||||
Nicholas A. Giordano | Trustee | June 2021 | Since 1997, Consultant, financial services organizations. | IntriCon Corporation (biomedical device manufacturer) (until May 2022); Wilmington Funds (12 portfolios) (registered investment company); Independence Blue Cross (healthcare insurance) (until March 2021). | 63 |
Arnold M. Reichman | Chair and Trustee | June 2021 | Retired. | EIP Investment Trust (registered investment company) (until August 2022). | 63 |
Brian T. Shea | Trustee | June 2021 | From 2014-2017, Chief Executive Officer, BNY Mellon Investment Services (fund services, global custodian and securities clearing firm); from 1983- 2014, Chief Executive Officer and various positions, Pershing LLC (broker dealer, clearing and custody firm). | Fidelity National Information Services, Inc. (financial services technology company); Ameriprise Financial, Inc. (financial services company); WisdomTree Investments, Inc. (asset management company) (until March 2019). | 63 |
Robert A. Straniere | Trustee | June 2021 | Since 2009, Administrative Law Judge, New York City; since 1980, Founding Partner, Straniere Law Group (law firm). | None. | 63 |
30 |
P/E GLOBAL ENHANCED INTERNATIONAL FUND
Trustees and Officers (CONTINUED)
(Unaudited)
Name, Address, | Positions(s) | Term of | Principal | Other | Number of |
Interested Trustee2 | |||||
Robert Sablowsky | Vice Chair and Trustee | June 2021 | Since 2002, Senior Director – Investments and, prior thereto, Executive Vice President, of Oppenheimer & Co., Inc. (a registered broker-dealer). | None. | 63 |
Officers | |||||
Steven Plump | President | August 2022 to present | From 2011 to 2021, Executive Vice President, PIMCO LLC. | N/A | N/A |
Salvatore Faia, JD, CPA, CFE | Chief Compliance Officer | June 2021 | Since 2004, President, Vigilant Compliance, LLC (investment management services company); since 2005, Independent Trustee of EIP Investment Trust (registered investment company); Since 2004, Chief Compliance Officer of The RBB Fund, Inc.; President of The RBB Fund, Inc. from 2009 to 2022; President of The RBB Fund Trust from 2021 to 2022. | N/A | N/A |
31 |
P/E GLOBAL ENHANCED INTERNATIONAL FUND
Trustees and Officers (CONTINUED)
(Unaudited)
Name, Address, | Positions(s) | Term of | Principal | Other | Number of |
Officers (continued) | |||||
James G. Shaw | Chief Financial Officer and Secretary
Chief Operating Officer | June 2021
August 2022 to present | Chief Financial Officer and Secretary (since 2016) and Chief Operating Officer (since 2022) of The RBB Fund,Inc.; Chief Financial Officer and Secretary (since 2021) and Chief Operating Officer (since 2022) of The RBB Fund Trust. | N/A | N/A |
Craig A. Urciuoli | Director of Marketing & Business Development | June 2021 | Director of Marketing & Business Development of The RBB Fund, Inc. (since 2019); from 2000-2019, Managing Director, Third Avenue Management LLC (investment advisory firm). | N/A | N/A |
Jennifer Witt | Assistant Treasurer | June 2021 | Since 2020, Vice President, U.S. Bank Global Fund Services (fund administrative services firm); from 2016 to 2020, Assistant Vice President, U.S. Bank Global Fund Services. | N/A | N/A |
32 |
P/E GLOBAL ENHANCED INTERNATIONAL FUND
Trustees and Officers (CONTINUED)
(Unaudited)
Name, Address, | Positions(s) | Term of | Principal | Other | Number of |
Officers (continued) | |||||
Edward Paz | Assistant Secretary | June 2021 | Since 2007, Vice President and Counsel, U.S. Bancorp Fund Services, LLC (fund administrative services firm). | N/A | N/A |
Michael P. Malloy | Assistant Secretary | June 2021 | Since 1993, Partner, Faegre Drinker Biddle & Reath LLP (law firm). | N/A | N/A |
Jillian L. Bosmann | Assistant Secretary | June 2021 | Since 2017, Partner, Faegre Drinker Biddle & Reath LLP (law firm). | N/A | N/A |
* | Each Trustee oversees 63 portfolios of the fund complex, consisting of the series in the Trust (10 portfolios) and The RBB Fund, Inc. (53 portfolios). |
1 | Subject to the Trust’s Retirement Policy, each Trustee may continue to serve as a Trustee until the last day of the calendar year in which the applicable Trustee attains age 75 or until his or her successor is elected and qualified or his or her death, resignation or removal. The Board reserves the right to waive the requirements of the Policy with respect to an individual Trustee. The Board has approved waivers of the policy with respect to Messrs. Brodsky, Giordano, Sablowsky and Straniere. Each officer holds office at the pleasure of the Board until the next special meeting of the Trust or until his or her successor is duly elected and qualified, or until he or she dies, resigns or is removed. |
2 | Mr. Sablowsky is considered an “interested person” of the Trust as that term is defined in the 1940 Act and is referred to as an “Interested Trustee.” Mr. Sablowsky is considered an “Interested Trustee” of the Trust by virtue of his position as an employee of Oppenheimer & Co., Inc., a registered broker-dealer. |
33 |
P/E GLOBAL ENHANCED INTERNATIONAL FUND
Trustees and Officers (CONTINUED)
(Unaudited)
Trustee Experience, Qualifications, Attributes and/or Skills
The information above includes each Trustee’s principal occupations during the last five years. Each Trustee possesses extensive additional experience, skills and attributes relevant to his or her qualifications to serve as a Trustee. The cumulative background of each Trustee led to the conclusion that each Trustee should serve as a Trustee of the Trust. Mr. Brodsky has over 40 years of senior executive-level management experience in the cable television and communications industry. Mr. Chandler has demonstrated leadership and management abilities as evidenced by his senior executive level positions in the investment technology consulting/services and investment banking/brokerage industries, and also serves on various boards. Ms. Dolly has over three decades of experience in the financial services industry, and she has demonstrated her leadership and management abilities by serving in numerous senior executive-level positions. Mr. Giordano has years of experience as a consultant to financial services organizations and also serves on the boards of other registered investment companies. Mr. Reichman brings decades of investment management experience to the Board, in addition to senior executive-level management experience. Mr. Sablowsky has demonstrated leadership and management abilities as evidenced by his senior executive-level positions in the financial services industry. Mr. Shea has demonstrated leadership and management abilities as evidenced by his senior executive-level positions in the brokerage, clearing, banking, and investment services industry, including service on the boards of public companies, industry regulatory organizations and a university. Mr. Straniere has been a practicing attorney for over 30 years and has served on the boards of an asset management company and another registered investment company.
34 |
(This Page Intentionally Left Blank.)
(This Page Intentionally Left Blank.)
(This Page Intentionally Left Blank.)
INVESTMENT ADVISER
P/E Global LLC
75 State Street, 31st Floor
Boston MA 02109
ADMINISTRATOR AND TRANSFER AGENT
U.S. Bancorp Fund Services, LLC
P.O. Box 701
Milwaukee, WI 53202-0701
CUSTODIAN
U.S. Bank, N.A.
1555 North Rivercenter Drive, Suite 302
Milwaukee, WI 53202
INDEPENDENT REGISTERED
PUBLIC ACCOUNTING FIRM
Cohen & Company, Ltd.
1350 Euclid Avenue, Suite 800
Cleveland, OH 44115
UNDERWRITER
Quasar Distributors, LLC
111 E Kilbourn Ave, Suite 2200
Milwaukee, WI 53202
LEGAL COUNSEL
Faegre Drinker Biddle & Reath LLP
One Logan Square, Suite 2000
Philadelphia, PA 19103-6996
PE-AR23

ANNUAL REPORT
August 31, 2023
PENN CAPITAL MID CAP CORE FUND
PENN CAPITAL OPPORTUNISTIC HIGH INCOME FUND
PENN CAPITAL SHORT DURATION HIGH INCOME FUND
PENN CAPITAL SPECIAL SITUATIONS SMALL CAP EQUITY FUND
Each a series of The RBB Fund Trust
TABLE OF CONTENTS
Advisor’s Letter to Shareholders | 1 | |
Fund Summary | 5 | |
Disclosure of Fund Expenses | 9 | |
Fund | Schedule of Investments | |
Penn Capital Mid Cap Core Fund | 11 | |
Penn Capital Opportunistic High Income Fund | 14 | |
Penn Capital Short Duration High Income Fund | 19 | |
Penn Capital Special Situations Small Cap Equity Fund | 23 | |
Statements of Assets and Liabilities | 26 | |
Statements of Operations | 27 | |
Statements of Changes in Net Assets | 30 | |
Financial Highlights | 32 | |
Notes to the Financial Statements | 36 | |
Additional Information | 48 | |
Report of Independent Registered Public Accounting Firm | 52 | |
Trustees and Officers | 53 | |
Privacy Policy | 58 | |
[THIS PAGE INTENTIONALLY LEFT BLANK.]
THE RBB FUND TRUST
Advisor’s Letter to Shareholders (Unaudited)
Dear Penn Capital Funds Shareholder:
Our investment strategies incorporate Penn Capital’s Complete Capital Structure Analysis®, an in-depth high yield (“HY”) and equity research philosophy used to identify a company’s optimal capital structure. Our investment professionals are capital structure generalists, meaning they are responsible for understanding the entire capital structure of the companies they follow. By following this philosophy, we believe that integrating credit and equity research allows us to construct a more comprehensive investment mosaic. Participating in both credit and equity markets, along with this integrated research process, provides Penn Capital’s investment team with what we believe is an informational advantage. Finding inefficiencies in the market can be challenging, but we remain committed to the pursuit of strong investment returns on behalf of our shareholders.
The following pages review the current market environment and provide additional insight into our funds and their performance over the past fiscal year beginning September 1, 2022 and ended August 31, 2023. Once again, I would like to thank you for your confidence in investing with us.
Overview
Headline inflation peaked in mid-2022 and has steadily decelerated to-date driven by lower prices for goods as supply chains normalize, a shift in consumer demand from goods to services, and the resumption of widespread discounting at retail to clear excess inventories. While labor inflation has proven stickier, the most acute labor supply/demand imbalances appear to have receded. Defying the bearish consensus, the domestic economy has remained on solid footing despite the variable, lagged, and cumulative effects of the US Federal Reserve’s (the “Fed”) campaign of interest rate increases as well as the regional banking crisis that threatened further tightening of financial conditions. On balance, the U.S. consumer has been surprisingly resilient buoyed by excess savings, low unemployment, rising wages, and pent-up demand for experiences exiting the pandemic. The wealth effect has been supportive given rising stock prices and stable home prices despite the sharp rise in mortgage rates. Many homeowners opportunistically refinanced at low rates in recent years, thereby insulating themselves from a significant source of inflationary pressure. Corporate credit fundamentals are healthy with low overall leverage, solid liquidity, low defaults, and high interest coverage. To wit, the spread to worst on the JP Morgan U.S. High Yield Index was 410 basis points as of August 31, 2023, well below long term averages and the lowest level since early 2022. The new issue market is functioning well, allowing companies to refinance maturities and fund acquisitions.
While the 2023 recession calls appear to have been premature, it remains an open question whether the Fed can engineer a soft landing. Inflation has not yet fully returned to the Fed’s target range, suggesting rates may need to stay higher for longer. The consumer faces incremental headwinds from rising oil prices and the resumption of student loan payments. Higher interest rates reduce free cash flow and increase the hurdle rate for businesses to invest in new projects to drive growth. Reflecting these risks, small cap equity valuations trade at a significant discount to long term averages and are historically cheap relative to large cap equities.
High-yield credit spreads will be a key indicator to determine if raising interest rates to combat inflation will ultimately lead to a recession. Shrinking high-yield credit spreads is a signal to position portfolios opportunistically, while rising high-yield credit spread is a signal to position portfolios defensively. If a recession occurs, high yield credit spreads can bottom prior to the equity market, providing a strong signal to reposition for recovery. During the Global Financial Crisis, the high-yield credit spread hit its widest point in November 2008 while the equity market reached its low in March 2009, providing a large opportunity for our strategy. These relationships drive Penn Capital’s investing philosophy as we navigate into the future.
Performance
The following paragraphs provide more detailed information on the performance of our funds for the fiscal year September 1, 2022 and ended August 31, 2023, as well as selected holdings.
Penn Capital Short Duration High Income Fund
For the fiscal year ended August 31, 2023, the Penn Capital Short Duration High Income Fund (the “Short Duration Fund”) generated a 6.50% return, outperforming its benchmark, ICE BofA 1-3 Year BB US Cash Pay High Yield Index, which returned 6.16% over the same period. The Short Duration Fund maintains an average portfolio maturity of three years or less and excludes CCC-rated bonds. The portfolio will typically underperform the broad short-duration market, which includes triple CCC-rated bonds, during low-quality rallies (like 2021), and outperform during low-quality sell-offs (like 2020).
1
The portfolio benefited from an underweight to the Auto Loans industry (the largest benchmark position), which lagged the market. Security selection within the Specialty Retail and Leisure sectors drove performance during the fiscal year. Specialty Retail sector leaders were QVC Inc. and Abercrombie and Fitch, while Royal Caribbean performed within the Leisure. sector
The largest detractor to performance during the fiscal year was the overweighting of the Wireline Telecom sector, despite good security selection. Names in the Investment Companies sector lagged during the fiscal year due to weakness in Icahn Partners. Real estate investment trust (“REIT”) security selection lagged primarily due to a defensive positioning in Vici Properties, which lagged the sector overall.
During the fiscal year, “off-index” asset allocations contributed value as the Short Duration High Income Fund’s loan allocation and convertible bond allocations outperformed. The Short Duration High Income Fund held an average weighting of 4.2% in bank loan securities via exposure from a combination of individual bank loan holdings and investment in the Penn Capital Floating Rate Income Fund. The allocation to convertible bonds averaged a weighting of less than 1%. As of August 31, 2023, the Short Duration High Income Fund had no “off-index” asset allocations in bank loan or convertible bond securities.
Penn Capital Opportunistic High Income Fund
For the fiscal year ended August 31, 2023, the Penn Capital Opportunistic High Income Fund (the “Opportunistic High Income Fund”) generated a 6.14% return, underperforming its benchmark, the ICE BofA US High Yield Constrained Index, which returned 7.03% over the same period.
The portfolio benefitted from asset allocation and security selection within Wireline Telecom, Oil Field Services and Energy Exploration & Production sectors where the portfolio (i) underweighted the Wireless Telecom sector through lower exposure to Lumen/Level Three and an overweight of Cogent Communications and (ii) overweighted the Oil Field Services sector through investment in Transocean Ltd and Weatherford International. Strong security selection drove performance in the Energy Exploration & Production sector, with investments in Ranger Oil and Northern Oil and Gas.
The largest detractors from performance were security selections within the Chemicals, Leisure and Advertising sectors: (i) in the Chemicals sector, Venator Materials underperformed before we sold the position; (ii) in the Leisure sector, SeaWorld and Six Flags underperformed, as consumer spending shifted toward other experiences; and (iii) .in the Advertising sector, Stagwell struggled from a weaker advertising environment.
The credit quality positioning of the portfolio was also a drag on performance compared to the benchmark. The lowest quality CCC or lower bonds returned 9.05% during the fiscal year, which was an area that the Opportunistic High Income Fund was overweight during the fiscal year ended August 31, 2023.
During the fiscal year, “off-index” asset allocations averaged 3.80% in bank loans and 1.66% in convertible bonds. At August 31, 2023, there was no “off-index” asset allocation to bank loans or convertible bonds.
Penn Capital Mid Cap Core Fund
For the fiscal year ended August 31, 2023, the Penn Capital Mid Cap Core Fund (the “Mid Cap Core Fund”) generated a 7.14% return, outperforming the 6.76% return of its benchmark, the Bloomberg 2500 Index, over the same period. Best performing sectors during the period were the Energy, Health Care and Financials sectors. Within the Energy sector, a provider of oilfield services and equipment is benefitting from accelerating international demand, while improved margins and free- cash-flow have driven significant balance sheet de-leveraging and a narrowing of the valuation discount relative to its peers. In the Health Care sector, a hospital operator is experiencing a recovery in patient volumes post-pandemic and notably improved labor trends, with contract labor utilization and spending declining. Within the Financials sector, an insurance company is experiencing strong pricing in property and casualty and driving improved underwriting profitability in its mortgage insurance business. The sectors that hindered performance during the fiscal year were Communications Services, Consumer Discretionary, and Real Estate. In the Communications Services sector, a provider of in-flight internet connectivity systems and services reduced its outlook as the company delayed the launch of its next-generation 5G network and is experiencing higher subscription suspensions due to routine maintenance and secondary market aircraft sales. Within the Consumer Discretionary sector, a regional gaming company underperformed due to recession fears and investor concerns regarding its competitive position and path to profitability in its digital businesses. In the Real Estate sector, a REIT focused on high-quality medical office buildings lagged due to the rising interest rate environment and limited internal and external growth opportunities.
2
Penn Capital Special Situations Small Cap Equity Fund
For the fiscal year ended August 31, 2023, the Penn Capital Special Situations Small Cap Equity Fund (the “Special Situations Fund”) generated a 4.40% return, outperforming the 4.55% return of its benchmark, the Bloomberg US 2000 Index, over the same period. Top contributors in the fiscal year were the Energy, Health Care, and Real Estate sectors. Within the Energy sector, a provider of oilfield services and equipment is benefitting from accelerating international demand, while improved margins and free-cash-flow have driven significant balance sheet de-leveraging and a narrowing of the valuation discount relative to its peers. In the Health Care sector, a provider of spine surgery solutions is generating higher volumes as COVID effects abate and comparisons ease. The company is gaining market share due to strong surgeon customer adds, deeper penetration with existing accounts, and new products with leading technology. Within the Real Estate sector, a hotel REIT with unique assets in attractive markets continues to benefit from the robust recovery in group and leisure travel. The top detractors in the quarter were the Communications Services, Consumer Discretionary, and Industrials sectors. In the Communications Services sector, a television broadcaster underperformed amid investor concerns regarding soft advertising trends, flattening net retransmission revenue, and elevated balance sheet leverage. In the Consumer Discretionary sector, a regional gaming company underperformed due to recession fears and investor concerns regarding its competitive position and path to profitability in its digital businesses. Within the Industrials sector, despite tailwinds from the post-pandemic aviation recovery, a maker of airplane components has been plagued by execution missteps in product quality and labor challenges.
Conclusion
We would like to take this opportunity to thank our shareholders for entrusting their investments with our firm. We do not take your faith in us for granted. Our team remains committed to focusing our efforts on behalf of our shareholders, and we value your continued confidence in our vision. We believe the Penn Capital Funds offer a product line-up that embodies our investment philosophy and dedicated research-driven process.
Looking Forward
This report contains performance data and financial information. Please keep in mind that all securities markets, as well as mutual fund prices, fluctuate in value. If you would like more frequent updates, http://www.penncapitalfunds.com provides daily NAV, monthly performance figures, portfolio holdings, and other valuable information. We encourage you to visit penncapitalfunds.com, through which you may access your account, buy and sell shares, and find other helpful tools.
At Penn Capital Funds, we believe that active management continues to serve as a critical element of investing in high yield debt securities and equity securities of smaller and mid-sized companies. Although challenges remain, and markets may continue to be uneven, we are confident that investors with a well-diversified portfolio and a patient, long-term outlook should be well positioned for the years ahead.
We thank you for investing with us and look forward to continuing to serve your investment needs.
Sincerely,

Eric Green
Chief Investment Officer
Penn Capital Management LLC
3
Past performance is no guarantee of future results. Unusually favorable market conditions and high returns may not be sustainable or repeated in the future.
This letter reflects Penn Capital’s analysis and opinions as of the most recent fiscal period. The information is not a complete analysis of any market, country, industry, security, or fund and should not be considered as a recommendation to buy, sell or hold any specific security or securities. Portfolio holdings are subject to change at any time. Please see the Schedules of Investments provided in this report for the complete listing of each Fund’s holdings.
All investments involve risk, including possible loss of principal, and there is no guarantee the Funds will achieve their investment objectives. Investments made in small and mid-capitalization companies may be more volatile and less liquid due to limited resources or product lines and more sensitive to economic factors. Investments in ETFs are subject to the same risks as the underlying securities in which the ETF invests as well as entails higher expenses than if invested into the underlying ETF directly. Investments in foreign securities and ADRs involve certain risks such as currency volatility, political and social instability and reduced market liquidity. As interest rates rise the value of bond prices will decline. Credit risk refers to the loss in the value of a security based on a default in the payment of principle and/or interest of the security, or the perception of the market of such default. High-yield bonds have a higher risk of default or other adverse credit events, but have the potential to pay higher earnings over investment grade bonds. The value of convertible securities tends to decline as interest rates rise and, because of the conversion feature, tends to vary with fluctuations in the market value of the underlying securities. Bank loans in which the Fund may invest have similar risks to below investment grade fixed income securities. In the event of the insolvency of an agent bank, a loan could be subject to settlement risk as well as the risk of interruptions in the administrative duties performed in the day to day administration of the loan.
Index Definitions
The ICE BofA US High Yield Constrained Index contains all securities in the ICE BofA US High Yield Index but caps issuer exposure at 2%.
The ICE BofA 1-3 Year BB US Cash Pay High Yield Index is a subset of the ICE BofA US Cash Pay High Yield Index, which tracks the performance of non-investment-grade corporate bonds with a remaining term to final maturity less than three years and rated BB.
The Bloomberg US 2000 Index is a float market-cap-weighted benchmark of the lower 2000 in capitalization of the Bloomberg US 3000 Index.
The Bloomberg US 2500 Index is a float market-cap-weighted benchmark of the lower 2500 in capitalization of the Bloomberg US 3000 Index.
The JP Morgan U.S. High Yield Index is designed to mirror the investable universe of the U.S. dollar domestic high yield corporate debt market.
An investment cannot be made directly in an index.
One basis point is equal to 1/100th (0.01%) of a percent.
4
PENN CAPITAL MID CAP CORE FUND
Fund Summary (UNAUDITED)
PENN CAPITAL MID CAP CORE FUND
Fund Summary (UNAUDITED)
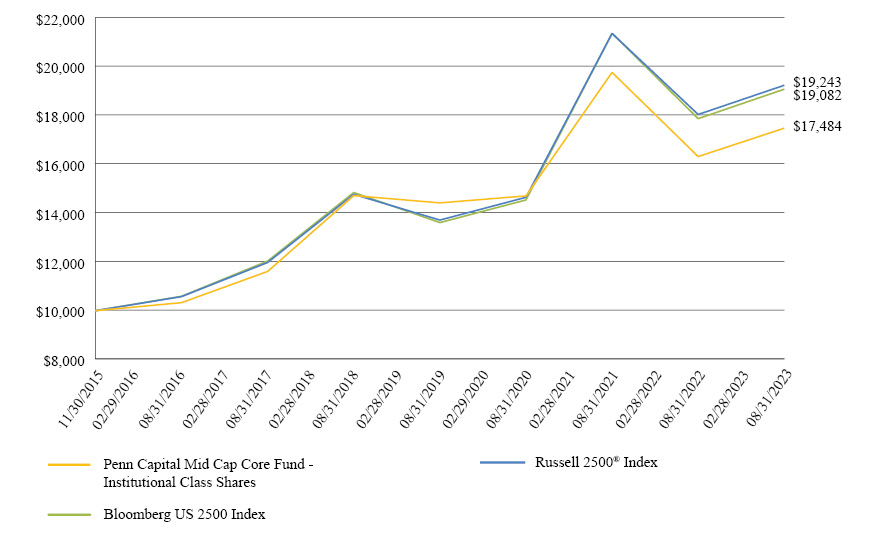
This chart assumes a hypothetical initial gross investment of $10,000 made on November 30, 2015, inception of the Institutional Class shares. Returns shown in the chart and table include the reinvestment of all dividends, but do not reflect the deduction of taxes that a shareholder would pay on Fund distributions or the redemption of Fund shares. In the absence of fee waivers and reimbursements, when they are necessary to keep expenses at the expense cap, total return would be reduced. Past performance is not predictive of future performance. Investment return and principal value will fluctuate so that your shares, when redeemed, may be worth more or less than the original cost. Current performance may be lower or higher than that shown. To obtain performance current to the most recent month-end please call 844-302 PENN (7366) or visit www.penncapitalfunds.com. Index returns do not reflect the effects of fees, transaction costs or expenses. It is not possible to invest directly in an index.
Average Annual Total Returns for the | One Year | Three Years | Five Years | Since |
Penn Capital Mid Cap Core Fund | ||||
Institutional Class Shares | 7.14% | 5.94% | 3.50% | 7.47% |
Bloomberg US 2500 Index(2) | 6.76% | 9.48% | 5.15% | 8.69% |
Russell 2500® Index | 6.64% | 9.52% | 5.43% | 8.81%(3) |
(1) | Inception date is 11/30/15. |
(2) | Effective May 31, 2022, the Fund changed its primary benchmark from the Russell 2500® Index to the Bloomberg US 2500 Index to better reflect the securities in which the Fund invests. |
(3) | The return shown for the Russell 2500® Index is from the inception date of the Institutional Class shares. |
The Bloomberg US 2500 Index is a float market-cap-weighted benchmark of the lower 2,500 companies in capitalization of the Bloomberg US 3000 Index. The Russell 2500® Index is composed of the bottom 500 stocks in the Russell 1000 Index and all the stocks in the Russell 2000 Index.
Gross Expense Ratio: 1.49%, Net Expense Ratio: 1.06%, per the most recent Prospectus dated December 31, 2022.
The Advisor has contractually agreed to waive management fees and/or pay certain Fund expenses through at least December 31, 2023.
5
PENN CAPITAL OPPORTUNISTIC HIGH INCOME FUND
FUND SUMMARY (UNAUDITED)
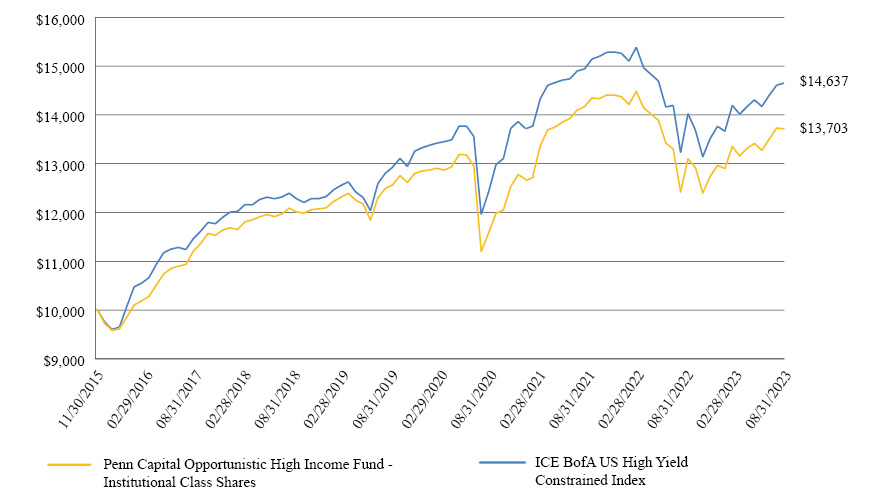
This chart assumes a hypothetical initial gross investment of $10,000 made on November 30, 2015, inception of the Institutional Class shares. Returns shown in the chart and table include the reinvestment of all dividends, but do not reflect the deduction of taxes that a shareholder would pay on Fund distributions or the redemption of Fund shares. In the absence of fee waivers and reimbursements, when they are necessary to keep expenses at the expense cap, total return would be reduced. Past performance is not predictive of future performance. Investment return and principal value will fluctuate so that your shares, when redeemed, may be worth more or less than the original cost. Current performance may be lower or higher than that shown. To obtain performance current to the most recent month-end please call 844-302 PENN (7366) or visit www.penncapitalfunds.com. Index returns do not reflect the effects of fees, transaction costs or expenses. It is not possible to invest directly in an index.
Average Annual Total Returns for the | One Year | Three Years | Five Years | Since |
Penn Capital Opportunistic High Income Fund | ||||
Institutional Class Shares | 6.14% | 2.40% | 2.19% | 4.15% |
ICE BofA US High Yield Constrained Index | 7.03% | 1.86% | 3.14% | 5.04%(2) |
(1) | Inception date is 11/30/15. |
(2) | The return shown for the ICE BofA US High Yield Constrained Index is from the inception date of the Institutional Class shares. |
The ICE BofA US High Yield Constrained Index is a market value-weighted index designed to measure the performance of the US high yield bond market but caps issuer exposure at 2%.
Gross Expense Ratio: 1.46%, Net Expense Ratio: 0.76%, per the most recent Prospectus dated December 31, 2022.
The Advisor has contractually agreed to waive management fees and/or pay certain Fund expenses through at least December 31, 2023.
6
PENN CAPITAL SHORT DURATION HIGH INCOME FUND
FUND SUMMARY (UNAUDITED)
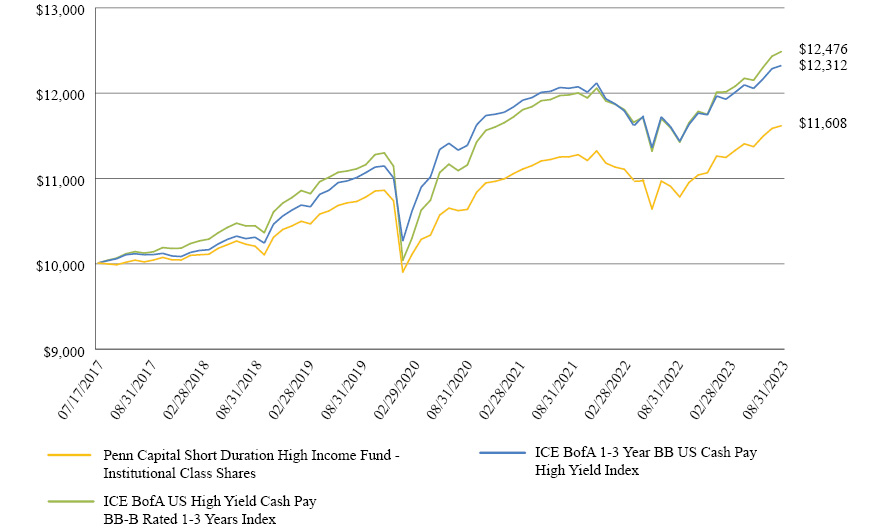
This chart assumes a hypothetical initial gross investment of $10,000 made on July 17, 2017, inception of the Institutional Class shares. Returns shown in the chart and table include the reinvestment of all dividends, but do not reflect the deduction of taxes that a shareholder would pay on Fund distributions or the redemption of Fund shares. In the absence of fee waivers and reimbursements, when they are necessary to keep expenses at the expense cap, total return would be reduced. Past performance is not predictive of future performance. Current performance may be lower or higher than that shown. To obtain performance current to the most recent month-end please call 844-302 PENN (7366) or visit www.penncapitalfunds.com. Investment return and principal value will fluctuate so that your shares, when redeemed, may be worth more or less than the original cost. Index returns do not reflect the effects of fees, transaction costs or expenses. It is not possible to invest directly in an index.
Average Annual Total Returns for the | One Year | Three Years | Five Years | Since |
Penn Capital Short Duration High Income Fund | ||||
Institutional Class Shares | 6.50% | 2.94% | 2.59% | 2.47% |
ICE BofA 1-3 Year BB US Cash Pay High Yield Index | 6.16% | 2.60% | 3.68% | 3.46%(2) |
ICE BofA US High Yield Cash Pay BB-B Rated 1-3 Years Index | 7.69% | 3.80% | 3.67% | 3.68%(3) |
(1) | Inception date is 7/17/17. |
(2) | The return shown for the ICE BofA 1-3 Year BB US Cash Pay High Yield Index is from the inception date of the Institutional Class shares. |
(3) | The return shown for the ICE BofA US High Yield Cash Pay BB-B Rated 1-3 Years Index is from the inception date of the Institutional Class shares. The ICE BofA US High Yield Cash Pay BB-B Rated 1-3 Years Imdex is comprised of bonds within the ICE BofA High Yield Index whose ratings are at or between B1 through BB3, with maturities between 1 and 3 years. |
The ICE BofA 1-3 Year BB US Cash Pay High Yield Index is a subset of the ICE Bank of America US Cash Pay High Yield Index including all securities with a remaining term to final maturity less than 3 years and rated BB1 through BB3, inclusive. The ICE BofA US High Yield Cash Pay BB-B Rated 1-3 Year Index is comprised of bonds within the ICE BofA High Yield Index whose ratings are at or between B1 through BB3, with maturities between 1 and 3 years.
Gross Expense Ratio: 0.92%, Net Expense Ratio: 0.58%, per the most recent Prospectus dated December 31, 2022.
The Advisor has contractually agreed to waive management fees and/or pay certain Fund expenses through at least December 31, 2023.
7
PENN CAPITAL SPECIAL SITUATIONS SMALL CAP EQUITY FUND
FUND SUMMARY (UNAUDITED)

This chart assumes a hypothetical initial gross investment of $10,000 made on December 17, 2015, inception of the Institutional Class shares. Returns shown in the chart and table include the reinvestment of all dividends, but do not reflect the deduction of taxes that a shareholder would pay on Fund distributions or the redemption of Fund shares. In the absence of fee waivers and reimbursements, when they are necessary to keep expenses at the expense cap, total return would be reduced. Past performance is not predictive of future performance. Investment return and principal value will fluctuate so that your shares, when redeemed, may be worth more or less than the original cost. Current performance may be lower or higher than that shown. To obtain performance current to the most recent month-end please call 844-302 PENN (7366) or visit www.penncapitalfunds.com. Index returns do not reflect the effects of fees, transaction costs or expenses. It is not possible to invest directly in an index.
Average Annual Total Returns for the | One Year | Three Years | Five Years | Since |
Penn Capital Special Situations Small Cap Equity Fund | ||||
Institutional Class Shares | 4.40% | 18.80% | 7.69% | 11.34% |
Bloomberg US 2000 Index(2) | 4.55% | 9.97% | 3.89% | 8.96% |
Russell 2000® Index | 4.65% | 8.12% | 3.14% | 8.37%(3) |
(1) | Inception date is 12/17/15. |
(2) | Effective May 31, 2022, the Fund changed its primary benchmark from the Russell 2000® Index to the Bloomberg US 2000 Index to better reflect the securities in which the Fund invests. |
(3) | The return shown for the Russell 2000® Index is from the inception date of the Institutional Class shares. |
The Bloomberg US 2000 Index is a float market-cap-weighted benchmark of the lower 2,000 companies in capitalization of the Bloomberg US 3000 Index. The Russell 2000® Index is comprised of the 2,000 smallest companies in the Russell 3000 Index.
Gross Expense Ratio: 1.58%, Net Expense Ratio: 1.09%, per the most recent Prospectus dated December 31, 2022.
The Advisor has contractually agreed to waive management fees and/or pay certain Fund expenses through at least December 31, 2023.
8
THE RBB FUND TRUST
Disclosure of Fund Expenses (Unaudited)
FOR THE PERIOD FROM SEPTEMBER 1, 2022 TO AUGUST 31, 2023
Cost in Dollars of a $1,000 Investment
The examples below are intended to describe the fees and expenses borne by shareholders during the six-month period from March 1, 2023 to August 31, 2023, and the impact of those costs on your investment.
Example
As a shareholder of a Fund, you incur two types of costs: (1) transaction costs and (2) ongoing costs, including management fees and other Fund expenses. This example is intended to help you understand your ongoing costs (in dollars) of investing in a Fund and to compare these costs with the ongoing costs of investing in other mutual funds. These examples are based on an investment of $1,000 made at the beginning of the six-month period and held for the entire period from March 1, 2023 to August 31, 2023.
These examples illustrate your Fund’s ongoing costs in two ways:
Actual Expenses
The second and third data columns in the accompanying table provide information about actual account values and actual expenses. You may use the information in these columns, together with the amount you invested, to estimate the expenses that you paid over the period. Simply divide your account value by $1,000 (for example, an $8,600 account value divided by $1,000 = 8.6), then multiply the result by the number under the heading entitled Expenses Paid During Period to estimate the expenses you paid on your account during this period.
Hypothetical Examples for Comparison Purposes
The fourth and fifth data columns in the table below provide information about hypothetical account values and hypothetical expenses based on each Fund’s actual expense ratio and an assumed rate of return of 5% per year before expenses, which is not a Fund’s actual return. The hypothetical account values and expenses may not be used to estimate the actual ending account balances or expenses you paid for the six-month period shown. You may use this information to compare the ongoing costs of investing in a Fund with the ongoing costs of investing in other funds. To do so, compare these 5% hypothetical examples with the 5% hypothetical examples that appear in the shareholder reports of the other funds.
Please note that the expenses shown in the table are meant to highlight your ongoing costs only and do not reflect any transactional costs, such as redemption fees. Therefore, the fourth and fifth data columns of the table are useful in comparing ongoing costs only and will not help you determine the relative total costs of owning different funds. In addition, if these transactional costs were included, your costs would have been higher.
9
Beginning | Ending | Expenses Paid | Annualized | Actual Six-Month | ||||||||||||||||
Penn Capital Mid Cap Core Fund(1) | ||||||||||||||||||||
Actual | $ | 1,000.00 | $ | 988.10 | $ | 5.31 | 1.06 | % | (1.19 | )% | ||||||||||
Hypothetical (5% return before expenses) | 1,000.00 | 1,019.86 | 5.40 | 1.06 | N/A | |||||||||||||||
Penn Capital Opportunistic High Income Fund(1) | ||||||||||||||||||||
Actual | $ | 1,000.00 | $ | 1,042.40 | $ | 3.71 | 0.72 | % | 4.24 | % | ||||||||||
Hypothetical (5% return before expenses) | 1,000.00 | 1,021.58 | 3.67 | 0.72 | N/A | |||||||||||||||
Penn Capital Short Duration High Income Fund(1) | ||||||||||||||||||||
Actual | $ | 1,000.00 | $ | 1,033.10 | $ | 2.77 | 0.54 | % | 3.31 | % | ||||||||||
Hypothetical (5% return before expenses) | 1,000.00 | 1,022.48 | 2.75 | 0.54 | N/A | |||||||||||||||
Penn Capital Special Situations Small Cap Equity Fund(1) | ||||||||||||||||||||
Actual | $ | 1,000.00 | $ | 968.20 | $ | 5.41 | 1.09 | % | (3.18 | )% | ||||||||||
Hypothetical (5% return before expenses) | 1,000.00 | 1,019.71 | 5.55 | 1.09 | N/A | |||||||||||||||
(1) | Information is for Institutional Class shares. |
(2) | Expenses are equal to each Fund’s annualized expense ratio, net of waivers and excluding acquired fund fees and expenses, if any, multiplied by the average account value over the period, multiplied by the number of days (184) in the most recent fiscal half-year, then divided by 365 to reflect the one-half year period. |
(3) | Ratios reflect expenses waived by the Funds’ investment adviser. Without these waivers, each Fund’s expenses would have been higher and the ending account values would have been lower. |
10
THE RBB FUND TRUST
Penn Capital Mid Cap Core Fund
SCHEDULE OF INVESTMENTS
AUGUST 31, 2023
Number of | Value | |||||||
Common Stocks: 93.6% | ||||||||
Aerospace & Defense: 2.4% | ||||||||
Spirit AeroSystems Holdings, Inc. - Class A* | 5,963 | $ | 127,131 | |||||
Textron, Inc. | 2,484 | 193,032 | ||||||
| 320,163 | ||||||||
Air Freight & Logistics: 1.9% | ||||||||
GXO Logistics, Inc.* | 3,936 | 251,786 | ||||||
Banks: 5.8% | ||||||||
Pinnacle Financial Partners, Inc. | 2,524 | 167,997 | ||||||
Popular, Inc. | 3,830 | 261,512 | ||||||
South State Corp. | 2,455 | 177,497 | ||||||
Texas Capital Bancshares, Inc.* | 2,591 | 161,782 | ||||||
| 768,788 | ||||||||
Biotechnology: 4.4% | ||||||||
ACADIA Pharmaceuticals, Inc.* | 4,100 | 110,782 | ||||||
Halozyme Therapeutics, Inc.* | 5,986 | 254,764 | ||||||
United Therapeutics Corp.* | 947 | 212,469 | ||||||
| 578,015 | ||||||||
Chemicals: 2.3% | ||||||||
Ingevity Corp.* | 2,466 | 132,893 | ||||||
Livent Corp.* | 8,133 | 174,615 | ||||||
| 307,508 | ||||||||
Communications Equipment: 1.5% | ||||||||
Calix, Inc.* | 4,150 | 193,016 | ||||||
Construction Materials: 1.6% | ||||||||
Summit Materials, Inc. - Class A* | 5,679 | 212,451 | ||||||
Consumer Staples Distribution & Retail: 1.4% | ||||||||
Performance Food Group Co.* | 2,988 | 185,644 | ||||||
Containers & Packaging: 1.6% | ||||||||
O-I Glass, Inc.* | 10,797 | 214,428 | ||||||
Electrical Equipment: 1.6% | ||||||||
nVent Electric PLC | 3,750 | 212,025 | ||||||
Number of | Value | |||||||
Energy Equipment & Services: 7.1% | ||||||||
Patterson-UTI Energy, Inc. | 14,119 | $ | 199,642 | |||||
Transocean Ltd.* | 32,687 | 267,380 | ||||||
Weatherford International PLC* | 5,338 | 472,520 | ||||||
| 939,542 | ||||||||
Food Products: 1.4% | ||||||||
Darling Ingredients, Inc.* | 3,035 | 187,442 | ||||||
Ground Transportation: 2.7% | ||||||||
ArcBest Corp. | 1,748 | 184,572 | ||||||
XPO, Inc.* | 2,248 | 167,768 | ||||||
| 352,340 | ||||||||
Health Care Equipment & Supplies: 2.2% | ||||||||
Alphatec Holdings, Inc.* | 17,737 | 290,000 | ||||||
Health Care Providers & Services: 3.4% | ||||||||
Progyny, Inc.* | 5,204 | 194,317 | ||||||
Tenet Healthcare Corp.* | 3,228 | 250,364 | ||||||
| 444,681 | ||||||||
Hotels, Restaurants & Leisure: 11.6% | ||||||||
Caesars Entertainment, Inc.* | 4,897 | 270,608 | ||||||
Golden Entertainment, Inc. | 7,073 | 257,528 | ||||||
Hilton Grand Vacations, Inc.* | 3,577 | 156,386 | ||||||
MGM Resorts International | 5,060 | 222,539 | ||||||
Papa John’s International, Inc. | 2,554 | 193,338 | ||||||
Planet Fitness, Inc. - Class A* | 3,172 | 192,858 | ||||||
SeaWorld Entertainment, Inc.* | 4,997 | 243,354 | ||||||
| 1,536,611 | ||||||||
Insurance: 4.4% | ||||||||
Arch Capital Group Ltd.* | 2,730 | 209,828 | ||||||
Axis Capital Holdings Ltd. | 2,626 | 144,062 | ||||||
Primerica, Inc. | 1,159 | 232,913 | ||||||
| 586,803 | ||||||||
Machinery: 3.4% | ||||||||
Chart Industries, Inc.* | 1,496 | 270,148 | ||||||
Hillman Solutions Corp.* | 19,683 | 178,131 | ||||||
| 448,279 | ||||||||
Marine Transportation: 1.7% | ||||||||
Kirby Corp.* | 2,636 | 218,340 | ||||||
The Accompanying Footnotes are an Integral Part of these Financial Statements
11
THE RBB FUND TRUST
Penn Capital Mid Cap Core Fund
SCHEDULE OF INVESTMENTS
AUGUST 31, 2023
Number of | Value | |||||||
Media: 3.2% | ||||||||
Nexstar Media Group, Inc. - Class A | 1,668 | $ | 271,550 | |||||
Stagwell, Inc.* | 27,813 | 151,581 | ||||||
| 423,131 | ||||||||
Metals & Mining: 3.5% | ||||||||
Carpenter Technology Corp. | 4,126 | 258,411 | ||||||
Commercial Metals Co. | 3,626 | 204,108 | ||||||
| 462,519 | ||||||||
Oil, Gas & Consumable Fuels: 4.7% | ||||||||
Chesapeake Energy Corp. | 3,125 | 275,656 | ||||||
Diamondback Energy, Inc. | 2,289 | 347,425 | ||||||
| 623,081 | ||||||||
Pharmaceuticals: 1.0% | ||||||||
Perrigo Co. PLC | 3,903 | 136,605 | ||||||
Semiconductors & Semiconductor Equipment: 6.2% | ||||||||
Allegro MicroSystems, Inc.* | 5,910 | 226,058 | ||||||
Kulicke & Soffa Industries, Inc. | 3,965 | 205,109 | ||||||
Rambus, Inc.* | 3,531 | 199,396 | ||||||
Teradyne, Inc. | 1,735 | 187,154 | ||||||
| 817,717 | ||||||||
Software: 2.0% | ||||||||
PTC, Inc.* | 1,798 | 264,612 | ||||||
Specialty Retail: 2.9% | ||||||||
Five Below, Inc.* | 959 | 164,910 | ||||||
Floor & Decor Holdings, Inc. - Class A* | 2,197 | 219,041 | ||||||
| 383,951 | ||||||||
Technology Hardware, Storage & Peripherals: 2.3% | ||||||||
Western Digital Corp.* | 6,811 | 306,495 | ||||||
Textiles, Apparel & Luxury Goods: 1.0% | ||||||||
Crocs, Inc.* | 1,400 | 136,276 | ||||||
Trading Companies & Distributors: 3.5% | ||||||||
FTAI Aviation Ltd. | 4,777 | 176,558 | ||||||
H&E Equipment Services, Inc. | 6,267 | 284,020 | ||||||
| 460,578 | ||||||||
Wireless Telecommunication Services: 0.9% | ||||||||
Gogo, Inc.* | 10,961 | 124,407 | ||||||
Total Common Stocks (cost $10,388,936) | 12,387,234 | |||||||
Number of | Value | |||||||
REITs: 4.9% | ||||||||
Hotel & Resort REITs: 1.5% | ||||||||
Ryman Hospitality Properties, Inc. | 2,316 | $ | 196,930 | |||||
Industrial REITs: 1.8% | ||||||||
STAG Industrial, Inc. | 6,608 | 241,390 | ||||||
Specialized REITs: 1.6% | ||||||||
Gaming & Leisure Properties, Inc. | 4,387 | 207,944 | ||||||
Total REITs (cost $683,432) | 646,264 | |||||||
Short-Term Investments: 2.0% | ||||||||
U.S. Bank Money Market Deposit Account, 3.41%(a) | 265,050 | 265,050 | ||||||
Total Short-Term Investments (cost $265,050) | 265,050 | |||||||
Total Investments - 100.5% (cost $11,337,418) | 13,298,548 | |||||||
Liabilities in Excess of Other Assets (0.5)% | (67,162 | ) | ||||||
Net Assets: 100.0% | $ | 13,231,386 | ||||||
* | Non-income producing security. |
(a) | Rate reported is the current yield as of August 31, 2023. |
The Accompanying Footnotes are an Integral Part of these Financial Statements
12
THE RBB FUND TRUST
Penn Capital Mid Cap Core Fund
SCHEDULE OF INVESTMENTS
AUGUST 31, 2023
Country Exposure (as a percentage of total investments) | |
United States | 85.8% |
Ireland | 6.2% |
Bermuda | 2.7% |
Switzerland | 2.0% |
Puerto Rico | 2.0% |
Cayman Islands | 1.3% |
Asset Type (as a percentage of total investments) (Unaudited) |

The industry classifications presented in this report, present the Global Industry Classification Standard (GICS®). GICS® was developed by and/or is the exclusive property of MSCI, Inc. and Standard & Poor Financial Services LLC (“S&P”). GICS® is a service mark of MSCI and S&P and has been licensed for use by U.S. Bank Global Fund Services.
The Accompanying Footnotes are an Integral Part of these Financial Statements
13
THE RBB FUND TRUST
Penn Capital Opportunistic High Income Fund
SCHEDULE OF INVESTMENTS
AUGUST 31, 2023
Principal | Value | |||||||
Corporate Bonds: 97.1% | ||||||||
Automotive: 3.3% | ||||||||
American Axle & Manufacturing, Inc., 6.875%, 7/1/28 | $ | 105,000 | $ | 96,308 | ||||
Ford Motor Credit Co. LLC, 7.350%, 11/4/27 | 320,000 | 325,158 | ||||||
Ford Motor Credit Co. LLC, 5.113%, 5/3/29 | 245,000 | 225,354 | ||||||
The Goodyear Tire & Rubber Co., 7.000%, 3/15/28 | 55,000 | 54,165 | ||||||
The Goodyear Tire & Rubber Co., 5.000%, 7/15/29 | 100,000 | 88,750 | ||||||
The Goodyear Tire & Rubber Co., 5.250%, 7/15/31 | 75,000 | 64,594 | ||||||
| 854,329 | ||||||||
Banking: 3.1% | ||||||||
Fifth Third Bancorp, 8.250%, 3/1/38 | 185,000 | 208,863 | ||||||
Huntington Bancshares, Inc., 4.443% (SOFR + 1.970%), 8/4/28 | 190,000 | 178,731 | ||||||
KeyCorp, 4.100%, 4/30/28 | 235,000 | 211,272 | ||||||
Texas Capital Bancshares, Inc., 4.000% (5 Year CMT Rate + 3.150%), 5/6/31 | 250,000 | 207,239 | ||||||
| 806,105 | ||||||||
Basic Industry: 9.6% | ||||||||
Ashton Woods USA LLC, 4.625%, 8/1/29* | 115,000 | 99,636 | ||||||
Ashton Woods USA LLC, 4.625%, 4/1/30* | 115,000 | 99,044 | ||||||
Avient Corp., 7.125%, 8/1/30* | 255,000 | 254,756 | ||||||
Builders FirstSource, Inc., 6.375%, 6/15/32* | 115,000 | 112,118 | ||||||
Carpenter Technology Corp., 7.625%, 3/15/30 | 230,000 | 232,808 | ||||||
Commercial Metals Co., 3.875%, 2/15/31 | 85,000 | 72,452 | ||||||
Commercial Metals Co., 4.125%, 1/15/30 | 190,000 | 168,073 | ||||||
Commercial Metals Co., 4.375%, 3/15/32 | 100,000 | 85,816 | ||||||
Eco Material Technologies, Inc., 7.875%, 1/31/27* | 170,000 | 165,748 | ||||||
FMG Resources August 2006 Pty Ltd., 6.125%, 4/15/32* | 85,000 | 79,115 | ||||||
Freeport-McMoRan, Inc., 4.625%, 8/1/30 | 115,000 | 106,357 | ||||||
Kaiser Aluminum Corp., 4.625%, 3/1/28* | 150,000 | 132,649 | ||||||
Knife River Corp., 7.750%, 5/1/31* | 120,000 | 122,830 | ||||||
Principal | Value | |||||||
Mercer International, Inc., 5.125%, 2/1/29 | $ | 250,000 | $ | 204,515 | ||||
Olin Corp., 5.625%, 8/1/29 | 235,000 | 225,483 | ||||||
Pike Corp., 5.500%, 9/1/28* | 195,000 | 175,482 | ||||||
The Chemours Co., 5.750%, 11/15/28* | 145,000 | 130,256 | ||||||
| 2,467,138 | ||||||||
Capital Goods: 5.7% | ||||||||
Ardagh Packaging Finance PLC, 4.125%, 8/15/26* | 245,000 | 229,152 | ||||||
Bombardier, Inc., 7.125%, 6/15/26* | 180,000 | 177,009 | ||||||
Madison IAQ LLC, 5.875%, 6/30/29* | 160,000 | 134,720 | ||||||
Mauser Packaging Solutions Holding Co., 7.875%, 8/15/26* | 80,000 | 78,780 | ||||||
Pactiv Evergreen Group Issuer LLC, 4.375%, 10/15/28* | 140,000 | 124,250 | ||||||
Spirit AeroSystems, Inc., 7.500%, 4/15/25* | 115,000 | 113,575 | ||||||
Titan International, Inc., 7.000%, 4/30/28 | 290,000 | 276,299 | ||||||
TransDigm, Inc., 6.875%, 12/15/30* | 125,000 | 125,825 | ||||||
Triumph Group, Inc., 7.750%, 8/15/25 | 90,000 | 84,915 | ||||||
Triumph Group, Inc., 9.000%, 3/15/28* | 125,000 | 125,846 | ||||||
| 1,470,371 | ||||||||
Consumer Goods: 4.5% | ||||||||
BellRing Brands, Inc., 7.000%, 3/15/30* | 170,000 | 170,071 | ||||||
Coty Inc/HFC Prestige Products Inc/HFC Prestige International US LLC, 6.625%, 7/15/30* | 110,000 | 110,020 | ||||||
Energizer Holdings, Inc., 6.500%, 12/31/27* | 85,000 | 82,120 | ||||||
HLF Financing Sarl LLC, 4.875%, 6/1/29* | 65,000 | 48,635 | ||||||
HLF Financing Sarl LLC, 7.875%, 9/1/25* | 135,000 | 129,905 | ||||||
KeHE Distributors LLC, 8.625%, 10/15/26* | 96,000 | 96,000 | ||||||
Simmons Foods, Inc., 4.625%, 3/1/29* | 130,000 | 108,191 | ||||||
Tempur Sealy International, Inc., 4.000%, 4/15/29* | 295,000 | 253,400 | ||||||
Turning Point Brands, Inc., 5.625%, 2/15/26* | 170,000 | 158,675 | ||||||
| 1,157,017 | ||||||||
The Accompanying Footnotes are an Integral Part of these Financial Statements
14
THE RBB FUND TRUST
PENN CAPITAL OPPORTUNISTIC HIGH INCOME FUND
SCHEDULE OF INVESTMENTS
AUGUST 31, 2023
Principal | Value | |||||||
Energy: 13.6% | ||||||||
Antero Resources Corp., 7.625%, 2/1/29* | $ | 295,000 | $ | 302,318 | ||||
Comstock Resources, Inc., 6.750%, 3/1/29* | 270,000 | 252,633 | ||||||
Crestwood Midstream Partners LP, 6.000%, 2/1/29* | 110,000 | 107,989 | ||||||
Crestwood Midstream Partners LP, 7.375%, 2/1/31* | 70,000 | 72,111 | ||||||
DT Midstream, Inc., 4.375%, 6/15/31* | 150,000 | 129,857 | ||||||
Earthstone Energy Holdings LLC, 8.000%, 4/15/27* | 175,000 | 178,621 | ||||||
Energy Ventures Gom LLC / EnVen Finance Corp., 11.750%, 4/15/26* | 70,000 | 72,594 | ||||||
EnLink Midstream LLC, 6.500%, 9/1/30* | 150,000 | 150,383 | ||||||
EnLink Midstream Partners LP, 5.050%, 4/1/45 | 335,000 | 267,178 | ||||||
EQM Midstream Partners LP, 6.500%, 7/15/48 | 70,000 | 63,542 | ||||||
EQM Midstream Partners LP, 7.500%, 6/1/27* | 115,000 | 116,071 | ||||||
Hilcorp Energy I LP, 6.250%, 11/1/28* | 220,000 | 212,229 | ||||||
Nabors Industries Ltd., 7.250%, 1/15/26* | 135,000 | 129,865 | ||||||
New Fortress Energy, Inc., 6.750%, 9/15/25* | 150,000 | 144,972 | ||||||
New Fortress Energy, Inc., 6.500%, 9/30/26* | 70,000 | 65,067 | ||||||
Northern Oil and Gas, Inc., 8.125%, 3/1/28* | 240,000 | 240,578 | ||||||
SM Energy Co., 6.750%, 9/15/26 | 75,000 | 74,685 | ||||||
SM Energy Co., 6.500%, 7/15/28 | 40,000 | 39,100 | ||||||
Solaris Midstream Holdings LLC, 7.625%, 4/1/26* | 77,000 | 75,673 | ||||||
Talos Production, Inc., 12.000%, 1/15/26 | 175,000 | 182,438 | ||||||
Transocean, Inc., 6.800%, 3/15/38 | 175,000 | 136,299 | ||||||
Transocean, Inc., 8.750%, 2/15/30* | 66,500 | 68,031 | ||||||
USA Compression Partners LP / USA Compression Finance Corp., 6.875%, 9/1/27 | 90,000 | 87,734 | ||||||
Venture Global LNG, Inc., 8.375%, 6/1/31* | 155,000 | 156,348 | ||||||
Weatherford International Ltd., 8.625%, 4/30/30* | 170,000 | 174,115 | ||||||
| 3,500,431 | ||||||||
Principal | Value | |||||||
Financial Services: 3.6% | ||||||||
Fortress Transportation and Infrastructure Investors LLC, 9.750%, 8/1/27* | $ | 130,000 | $ | 134,911 | ||||
Fortress Transportation and Infrastructure Investors LLC, 5.500%, 5/1/28* | 75,000 | 69,669 | ||||||
LPL Holdings, Inc., 4.000%, 3/15/29* | 145,000 | 128,895 | ||||||
Navient Corp., 6.750%, 6/25/25 | 115,000 | 114,203 | ||||||
Navient Corp., 4.875%, 3/15/28 | 165,000 | 143,710 | ||||||
OneMain Finance Corp., 6.625%, 1/15/28 | 230,000 | 215,050 | ||||||
PRA Group, Inc., 5.000%, 10/1/29* | 170,000 | 128,200 | ||||||
| 934,638 | ||||||||
Healthcare: 9.0% | ||||||||
AdaptHealth LLC, 6.125%, 8/1/28* | 185,000 | 167,001 | ||||||
CHS/Community Health Systems, Inc., 6.000%, 1/15/29* | 245,000 | 205,187 | ||||||
CHS/Community Health Systems, Inc., 6.875%, 4/15/29* | 232,000 | 142,290 | ||||||
DaVita, Inc., 4.625%, 6/1/30* | 280,000 | 240,171 | ||||||
Encompass Health Corp., 4.750%, 2/1/30 | 180,000 | 163,952 | ||||||
Fortrea Holdings, Inc., 7.500%, 7/1/30* | 120,000 | 117,450 | ||||||
Medline Borrower LP, 3.875%, 4/1/29* | 170,000 | 148,406 | ||||||
Modivcare Escrow Issuer, Inc., 5.000%, 10/1/29* | 140,000 | 103,250 | ||||||
Modivcare, Inc., 5.875%, 11/15/25* | 135,000 | 128,081 | ||||||
Option Care Health, Inc., 4.375%, 10/31/29* | 170,000 | 149,562 | ||||||
Owens & Minor, Inc., 6.625%, 4/1/30* | 325,000 | 295,656 | ||||||
Pediatrix Medical Group, Inc., 5.375%, 2/15/30* | 245,000 | 223,428 | ||||||
Tenet Healthcare Corp., 6.125%, 10/1/28 | 75,000 | 72,235 | ||||||
Tenet Healthcare Corp., 6.125%, 6/15/30 | 45,000 | 43,605 | ||||||
Tenet Healthcare Corp., 4.375%, 1/15/30 | 125,000 | 111,042 | ||||||
| 2,311,316 | ||||||||
The Accompanying Footnotes are an Integral Part of these Financial Statements
15
THE RBB FUND TRUST
PENN CAPITAL OPPORTUNISTIC HIGH INCOME FUND
SCHEDULE OF INVESTMENTS
AUGUST 31, 2023
Principal | Value | |||||||
Leisure: 8.4% | ||||||||
Affinity Interactive, 6.875%, 12/15/27* | $ | 75,000 | $ | 66,409 | ||||
Caesars Entertainment, Inc., 7.000%, 2/15/30* | 335,000 | 336,282 | ||||||
Cinemark USA, Inc., 5.875%, 3/15/26* | 125,000 | 120,002 | ||||||
Hilton Grand Vacations LLC, 5.000%, 6/1/29* | 95,000 | 84,223 | ||||||
Hilton Grand Vacations LLC, 4.875%, 7/1/31* | 55,000 | 46,369 | ||||||
Life Time, Inc., 8.000%, 4/15/26* | 110,000 | 109,175 | ||||||
Lindblad Expeditions Holdings, Inc., 9.000%, 5/15/28* | 210,000 | 215,610 | ||||||
NCL Corp Ltd., 5.875%, 3/15/26* | 205,000 | 193,290 | ||||||
NCL Corp Ltd., 8.375%, 2/1/28* | 110,000 | 113,385 | ||||||
Royal Caribbean Cruises Ltd., 5.375%, 7/15/27* | 155,000 | 145,857 | ||||||
Royal Caribbean Cruises Ltd., 7.250%, 1/15/30* | 125,000 | 126,900 | ||||||
Scientific Games Holdings LP, 6.625%, 3/1/30* | 125,000 | 110,189 | ||||||
SeaWorld Parks & Entertainment, Inc., 8.750%, 5/1/25* | 60,000 | 61,350 | ||||||
SeaWorld Parks & Entertainment, Inc., 5.250%, 8/15/29* | 160,000 | 143,656 | ||||||
Six Flags Entertainment Corp., 7.250%, 5/15/31* | 160,000 | 153,426 | ||||||
Station Casinos LLC, 4.625%, 12/1/31* | 170,000 | 140,143 | ||||||
| 2,166,266 | ||||||||
Media: 10.6% | ||||||||
CCO Holdings LLC, 4.500%, 8/15/30* | 305,000 | 256,565 | ||||||
CCO Holdings LLC, 7.375%, 3/1/31* | 30,000 | 29,827 | ||||||
Clear Channel Outdoor Holdings, Inc., 5.125%, 8/15/27* | 60,000 | 53,738 | ||||||
Clear Channel Outdoor Holdings, Inc., 7.500%, 6/1/29* | 140,000 | 104,341 | ||||||
CSC Holdings LLC, 7.500%, 4/1/28* | 245,000 | 155,731 | ||||||
CSC Holdings LLC, 11.250%, 5/15/28* | 200,000 | 197,265 | ||||||
Cumulus Media New Holdings, Inc., 6.750%, 7/1/26* | 116,000 | 85,032 | ||||||
DIRECTV Holdings LLC, 5.875%, 8/15/27* | 195,000 | 172,812 | ||||||
DISH DBS Corp., 7.750%, 7/1/26 | 115,000 | 86,008 | ||||||
DISH Network Corp., 11.750%, 11/15/27* | 185,000 | 187,709 | ||||||
Principal | Value | |||||||
Gannett Holdings LLC, 6.000%, 11/1/26* | $ | 100,000 | $ | 85,780 | ||||
Gray Television, Inc., 7.000%, 5/15/27* | 230,000 | 206,439 | ||||||
Gray Television, Inc., 4.750%, 10/15/30* | 140,000 | 97,752 | ||||||
Match Group Holdings II LLC, 5.625%, 2/15/29* | 115,000 | 108,402 | ||||||
News Corp., 3.875%, 5/15/29* | 140,000 | 122,947 | ||||||
Scripps Escrow II, Inc., 5.375%, 1/15/31* | 155,000 | 110,717 | ||||||
Scripps Escrow, Inc., 5.875%, 7/15/27* | 180,000 | 145,436 | ||||||
Sinclair Television Group, Inc., 5.500%, 3/1/30* | 145,000 | 77,256 | ||||||
Sinclair Television Group, Inc., 4.125%, 12/1/30* | 195,000 | 125,666 | ||||||
Stagwell Global LLC, 5.625%, 8/15/29* | 295,000 | 246,366 | ||||||
Urban One, Inc., 7.375%, 2/1/28* | 80,000 | 69,564 | ||||||
| 2,725,353 | ||||||||
Real Estate: 2.4% | ||||||||
Kennedy-Wilson, Inc., 4.750%, 2/1/30 | 110,000 | 84,741 | ||||||
RHP Hotel Properties LP / RHP Finance Corp., 7.250%, 7/15/28* | 170,000 | 170,849 | ||||||
Service Properties Trust, 4.350%, 10/1/24 | 135,000 | 129,884 | ||||||
Service Properties Trust, 7.500%, 9/15/25 | 60,000 | 59,283 | ||||||
Starwood Property Trust, Inc., 4.375%, 1/15/27* | 200,000 | 178,612 | ||||||
| 623,369 | ||||||||
Retail: 5.6% | ||||||||
Bath & Body Works, Inc., 5.250%, 2/1/28 | 65,000 | 62,363 | ||||||
Bath & Body Works, Inc., 9.375%, 7/1/25* | 18,000 | 18,832 | ||||||
Bath & Body Works, Inc., 6.625%, 10/1/30* | 115,000 | 112,162 | ||||||
Crocs, Inc., 4.250%, 3/15/29* | 315,000 | 265,614 | ||||||
Foot Locker, Inc., 4.000%, 10/1/29* | 255,000 | 191,931 | ||||||
Macy’s Retail Holdings LLC, 5.875%, 4/1/29* | 270,000 | 244,075 | ||||||
Neiman Marcus Group LLC, 7.125%, 4/1/26* | 140,000 | 133,058 | ||||||
Papa John’s International, Inc., 3.875%, 9/15/29* | 330,000 | 277,578 | ||||||
The Accompanying Footnotes are an Integral Part of these Financial Statements
16
THE RBB FUND TRUST
PENN CAPITAL OPPORTUNISTIC HIGH INCOME FUND
SCHEDULE OF INVESTMENTS
AUGUST 31, 2023
Principal | Value | |||||||
SEG Holding LLC, 5.625%, 10/15/28* | $ | 145,000 | $ | 139,925 | ||||
| 1,445,538 | ||||||||
Services: 4.3% | ||||||||
H&E Equipment Services, Inc., 3.875%, 12/15/28* | 250,000 | 218,288 | ||||||
SRS Distribution, Inc., 4.625%, 7/1/28* | 140,000 | 124,603 | ||||||
SRS Distribution, Inc., 6.000%, 12/1/29* | 145,000 | 123,975 | ||||||
The ADT Security Corp., 4.125%, 8/1/29* | 75,000 | 65,461 | ||||||
The ADT Security Corp., 4.875%, 7/15/32* | 55,000 | 47,443 | ||||||
The Hertz Corp., 4.625%, 12/1/26* | 130,000 | 117,701 | ||||||
The Hertz Corp., 5.000%, 12/1/29* | 60,000 | 49,332 | ||||||
United Rentals North America, Inc., 6.000%, 12/15/29* | 155,000 | 154,031 | ||||||
White Cap Buyer LLC, 6.875%, 10/15/28* | 100,000 | 91,753 | ||||||
Windsor Holdings III LLC, 8.500%, 6/15/30* | 125,000 | 125,545 | ||||||
| 1,118,132 | ||||||||
Technology & Electronics: 4.4% | ||||||||
Dell, Inc., 6.500%, 4/15/38 | 255,000 | 259,053 | ||||||
Gen Digital, Inc., 6.750%, 9/30/27* | 145,000 | 145,365 | ||||||
GoDaddy, Inc., 3.500%, 3/1/29* | 150,000 | 128,932 | ||||||
RingCentral, Inc., 8.500%, 8/15/30* | 190,000 | 187,150 | ||||||
Seagate HDD Cayman, 8.500%, 7/15/31* | 165,000 | 172,872 | ||||||
Unisys Corp., 6.875%, 11/1/27* | 130,000 | 102,558 | ||||||
Ziff Davis, Inc., 4.625%, 10/15/30* | 145,000 | 124,719 | ||||||
| 1,120,649 | ||||||||
Telecommunications: 2.7% | ||||||||
Cogent Communications Group, Inc., 3.500%, 5/1/26* | 140,000 | 129,611 | ||||||
Cogent Communications Group, Inc., 7.000%, 6/15/27* | 85,000 | 82,510 | ||||||
Frontier Communications Holdings LLC, 5.000%, 5/1/28* | 230,000 | 197,076 | ||||||
Frontier Communications Holdings LLC, 6.000%, 1/15/30* | 190,000 | 140,371 | ||||||
Qwest Corp., 7.250%, 9/15/25 | 145,000 | 137,847 | ||||||
| 687,415 | ||||||||
Transportation: 3.5% | ||||||||
American Airlines, Inc., 11.750%, 7/15/25* | 100,000 | 109,454 | ||||||
Principal | Value | |||||||
American Airlines, Inc., 7.250%, 2/15/28* | $ | 220,000 | $ | 216,110 | ||||
Spirit Loyalty Cayman Ltd., 8.000%, 9/20/25* | 110,000 | 110,121 | ||||||
VistaJet Malta Finance PLC, 6.375%, 2/1/30* | 70,000 | 57,399 | ||||||
VistaJet Malta Finance PLC, 7.875%, 5/1/27* | 85,000 | 76,925 | ||||||
VistaJet Malta Finance PLC, 9.500%, 6/1/28* | 75,000 | 69,210 | ||||||
XPO CNW, Inc., 6.700%, 5/1/34 | 160,000 | 158,904 | ||||||
XPO Escrow Sub LLC, 7.500%, 11/15/27* | 95,000 | 96,592 | ||||||
| 894,715 | ||||||||
Utility: 2.8% | ||||||||
Calpine Corp., 5.250%, 6/1/26* | 125,000 | 122,647 | ||||||
Calpine Corp., 5.000%, 2/1/31* | 155,000 | 131,141 | ||||||
Talen Energy Supply LLC, 8.625%, 6/1/30* | 180,000 | 187,417 | ||||||
Vistra Corp., 8.000% (5 Year CMT Rate + 6.930%), 4/15/27* | 160,000 | 152,906 | ||||||
Vistra Operations Co. LLC, 5.625%, 2/15/27* | 125,000 | 120,339 | ||||||
| 714,450 | ||||||||
Total Corporate Bonds (cost $25,798,587) | 24,997,232 | |||||||
The Accompanying Footnotes are an Integral Part of these Financial Statements
17
THE RBB FUND TRUST
PENN CAPITAL OPPORTUNISTIC HIGH INCOME FUND
SCHEDULE OF INVESTMENTS
AUGUST 31, 2023
Number of | Value | |||||||
Short-Term Investments: 0.7% | ||||||||
U.S. Bank Money Market Deposit Account, 3.41%(a) | 173,852 | $ | 173,852 | |||||
Total Short-Term Investments (cost $173,852) | 173,852 | |||||||
Total Investments - 97.8% (cost $25,972,439) | 25,171,084 | |||||||
Other Assets and Liabilities 2.2% | 566,911 | |||||||
Net Assets: 100.0% | $ | 25,737,995 | ||||||
* | Securities purchased pursuant to Rule 144A of the Securities Act of 1933, as amended, and may be sold only to dealers in that program or other “qualified institutional buyers.” As of August 31, 2023, the value of these investments was $19,187,225, or 74.55% of total net assets. |
(a) | Rate reported is the current yield as of August 31, 2023. |
Country Exposure (as a percentage of total investments) | |
United States | 90.6% |
Cayman Islands | 3.2% |
Bermuda | 2.4% |
Liberia | 1.1% |
Ireland | 0.9% |
Malta | 0.8% |
Canada | 0.7% |
Australia | 0.3% |
Asset Type (as a percentage of total investments) (Unaudited) |
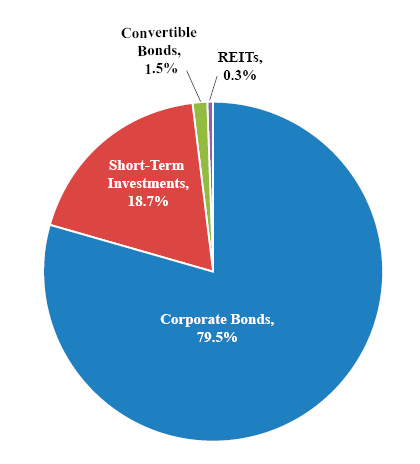
The Accompanying Footnotes are an Integral Part of these Financial Statements
18
THE RBB FUND TRUST
Penn Capital Short Duration High Income Fund
SCHEDULE OF INVESTMENTS
AUGUST 31, 2023
Principal | Value | |||||||
Corporate Bonds: 97.5% | ||||||||
Automotive: 2.9% | ||||||||
Ford Motor Credit Co. LLC, 5.584%, 3/18/24 | $ | 650,000 | $ | 646,650 | ||||
The Goodyear Tire & Rubber Co., 9.500%, 5/31/25 | 255,000 | 260,419 | ||||||
| 907,069 | ||||||||
Banking: 1.3% | ||||||||
Fifth Third Bancorp, 4.300%, 1/16/24 | 215,000 | 213,260 | ||||||
Huntington Bancshares, Inc., 2.625%, 8/6/24 | 215,000 | 207,666 | ||||||
| 420,926 | ||||||||
Basic Industry: 8.5% | ||||||||
Avient Corp., 5.750%, 5/15/25* | 240,000 | 236,806 | ||||||
Carpenter Technology Corp., 6.375%, 7/15/28 | 135,000 | 131,896 | ||||||
Clearwater Paper Corp., 5.375%, 2/1/25* | 270,000 | 261,761 | ||||||
Meritage Homes Corp., 6.000%, 6/1/25 | 230,000 | 228,850 | ||||||
NOVA Chemicals Corp., 4.875%, 6/1/24* | 530,000 | 521,288 | ||||||
OCI NV, 4.625%, 10/15/25* | 315,000 | 300,260 | ||||||
Olin Corp., 5.125%, 9/15/27 | 705,000 | 674,953 | ||||||
TRI Pointe Group, Inc., 5.875%, 6/15/24 | 300,000 | 299,250 | ||||||
| 2,655,064 | ||||||||
Capital Goods: 9.6% | ||||||||
Bombardier, Inc., 7.125%, 6/15/26* | 155,000 | 152,425 | ||||||
Crown Cork & Seal Co., Inc., 7.375%, 12/15/26 | 618,000 | 642,253 | ||||||
Hillenbrand, Inc., 5.750%, 6/15/25 | 235,000 | 233,531 | ||||||
Moog, Inc., 4.250%, 12/15/27* | 630,000 | 573,303 | ||||||
Owens-Brockway Glass Container, Inc., 6.625%, 5/13/27* | 95,000 | 93,905 | ||||||
Regal Rexnord Corp., 6.050%, 2/15/26* | 180,000 | 179,029 | ||||||
Spirit AeroSystems, Inc., 7.500%, 4/15/25* | 655,000 | 646,882 | ||||||
Titan International, Inc., 7.000%, 4/30/28 | 165,000 | 157,205 | ||||||
TransDigm, Inc., 6.250%, 3/15/26* | 170,000 | 168,380 | ||||||
Triumph Group, Inc., 9.000%, 3/15/28* | 155,000 | 156,049 | ||||||
| 3,002,962 | ||||||||
Consumer Goods: 1.7% | ||||||||
HLF Financing Sarl LLC, 7.875%, 9/1/25* | $ | 266,000 | $ | 255,961 | ||||
KeHE Distributors LLC, 8.625%, 10/15/26* | 132,000 | 132,000 | ||||||
Turning Point Brands, Inc., 5.625%, 2/15/26* | 165,000 | 154,008 | ||||||
| 541,969 | ||||||||
Energy: 13.2% | ||||||||
Blue Racer Midstream LLC, 7.625%, 12/15/25* | 255,000 | 255,741 | ||||||
Buckeye Partners LP, 4.125%, 3/1/25* | 395,000 | 380,397 | ||||||
Chesapeake Energy Corp., 5.500%, 2/1/26* | 175,000 | 170,860 | ||||||
Crestwood Midstream Partners LP, 5.750%, 4/1/25 | 230,000 | 228,052 | ||||||
DCP Midstream Operating LP, 5.375%, 7/15/25 | 255,000 | 252,454 | ||||||
Earthstone Energy Holdings LLC, 8.000%, 4/15/27* | 165,000 | 168,414 | ||||||
Energy Ventures Gom LLC / EnVen Finance Corp., 11.750%, 4/15/26* | 80,000 | 82,965 | ||||||
EQM Midstream Partners LP, 4.000%, 8/1/24 | 351,000 | 342,461 | ||||||
EQT Corp., 6.125%, 2/1/25 | 139,000 | 138,695 | ||||||
Methanex Corp., 4.250%, 12/1/24 | 255,000 | 249,082 | ||||||
New Fortress Energy, Inc., 6.500%, 9/30/26* | 160,000 | 148,724 | ||||||
Northern Oil and Gas, Inc., 8.125%, 3/1/28* | 330,000 | 330,795 | ||||||
Oceaneering International, Inc., 4.650%, 11/15/24 | 226,000 | 221,277 | ||||||
SM Energy Co., 6.750%, 9/15/26 | 105,000 | 104,559 | ||||||
Solaris Midstream Holdings LLC, 7.625%, 4/1/26* | 165,000 | 162,157 | ||||||
Talos Production, Inc., 12.000%, 1/15/26 | 85,000 | 88,612 | ||||||
TechnipFMC PLC, 6.500%, 2/1/26* | 182,000 | 180,054 | ||||||
USA Compression Partners LP / USA Compression Finance Corp., 6.875%, 9/1/27 | 160,000 | 155,972 | ||||||
Venture Global LNG, Inc., 8.125%, 6/1/28* | 250,000 | 252,186 | ||||||
Western Midstream Operating LP, 3.100%, 2/1/25 | 250,000 | 239,413 | ||||||
| 4,152,870 | ||||||||
The Accompanying Footnotes are an Integral Part of these Financial Statements
19
THE RBB FUND TRUST
PENN CAPITAL SHORT DURATION HIGH INCOME FUND
SCHEDULE OF INVESTMENTS
AUGUST 31, 2023
Principal | Value | |||||||
Financial Services: 6.2% | ||||||||
Fortress Transportation and Infrastructure Investors LLC, 6.500%, 10/1/25* | $ | 237,000 | $ | 234,021 | ||||
Fortress Transportation and Infrastructure Investors LLC, 9.750%, 8/1/27* | 100,000 | 103,777 | ||||||
Navient Corp., 7.250%, 9/25/23 | 163,000 | 163,000 | ||||||
Navient Corp., 6.750%, 6/25/25 | 345,000 | 342,608 | ||||||
OneMain Finance Corp., 7.125%, 3/15/26 | 365,000 | 359,067 | ||||||
OneMain Finance Corp., 6.625%, 1/15/28 | 375,000 | 350,625 | ||||||
Oppenheimer Holdings, Inc., 5.500%, 10/1/25 | 220,000 | 209,825 | ||||||
SLM Corp., 4.200%, 10/29/25 | 205,000 | 192,794 | ||||||
| 1,955,717 | ||||||||
Healthcare: 5.4% | ||||||||
Acadia Healthcare Co, Inc., 5.500%, 7/1/28* | 330,000 | 312,625 | ||||||
HCA, Inc., 5.375%, 2/1/25 | 465,000 | 461,985 | ||||||
Modivcare, Inc., 5.875%, 11/15/25* | 105,000 | 99,619 | ||||||
Owens & Minor, Inc., 4.375%, 12/15/24 | 625,000 | 606,674 | ||||||
Teva Pharmaceutical Finance Netherlands III BV, 6.000%, 4/15/24 | 200,000 | 198,751 | ||||||
| 1,679,654 | ||||||||
Insurance: 4.2% | ||||||||
Enact Holdings, Inc., 6.500%, 8/15/25* | 275,000 | 272,517 | ||||||
NMI Holdings, Inc., 7.375%, 6/1/25* | 490,000 | 493,317 | ||||||
Radian Group, Inc., 4.500%, 10/1/24 | 575,000 | 557,031 | ||||||
| 1,322,865 | ||||||||
Leisure: 10.3% | ||||||||
Caesars Entertainment, Inc., 6.250%, 7/1/25* | 385,000 | 382,011 | ||||||
Cinemark USA, Inc., 8.750%, 5/1/25* | 69,000 | 69,697 | ||||||
International Game Technology PLC, 6.500%, 2/15/25* | 199,000 | 199,177 | ||||||
Las Vegas Sands Corp., 3.200%, 8/8/24 | 440,000 | 425,994 | ||||||
Lindblad Expeditions Holdings, Inc., 9.000%, 5/15/28* | 150,000 | 154,007 | ||||||
Live Nation Entertainment, Inc., 4.875%, 11/1/24* | 135,000 | 132,611 | ||||||
NCL Corp Ltd., 8.375%, 2/1/28* | 265,000 | 273,154 | ||||||
Principal | Value | |||||||
Royal Caribbean Cruises Ltd., 5.375%, 7/15/27* | $ | 555,000 | $ | 522,264 | ||||
SeaWorld Parks & Entertainment, Inc., 8.750%, 5/1/25* | 270,000 | 276,075 | ||||||
Travel + Leisure Co., 5.875%, 10/1/25 | 325,000 | 323,759 | ||||||
Travel + Leisure Co., 6.625%, 7/31/26* | 260,000 | 258,039 | ||||||
Vail Resorts, Inc., 6.250%, 5/15/25* | 215,000 | 214,246 | ||||||
| 3,231,034 | ||||||||
Media: 6.7% | ||||||||
AMC Networks, Inc., 5.000%, 4/1/24 | 273,000 | 270,075 | ||||||
CCO Holdings LLC, 5.125%, 5/1/27* | 592,000 | 556,533 | ||||||
DISH Network Corp., 11.750%, 11/15/27* | 250,000 | 253,660 | ||||||
Gray Television, Inc., 7.000%, 5/15/27* | 180,000 | 161,561 | ||||||
Match Group Holdings II LLC, 5.000%, 12/15/27* | 615,000 | 577,081 | ||||||
TripAdvisor, Inc., 7.000%, 7/15/25* | 275,000 | 274,344 | ||||||
| 2,093,254 | ||||||||
Real Estate: 7.6% | ||||||||
HAT Holdings I LLC, 6.000%, 4/15/25* | 345,000 | 338,643 | ||||||
Newmark Group, Inc., 6.125%, 11/15/23 | 385,000 | 384,180 | ||||||
Park Intermediate Holdings LLC, 7.500%, 6/1/25* | 252,000 | 252,286 | ||||||
RHP Hotel Properties LP / RHP Finance Corp., 7.250%, 7/15/28* | 225,000 | 226,124 | ||||||
Starwood Property Trust, Inc., 5.500%, 11/1/23* | 400,000 | 398,539 | ||||||
Starwood Property Trust, Inc., 3.750%, 12/31/24* | 195,000 | 187,444 | ||||||
VICI Properties LP, 5.625%, 5/1/24* | 595,000 | 590,347 | ||||||
| 2,377,563 | ||||||||
Retail: 3.5% | ||||||||
Abercrombie & Fitch Management Co., 8.750%, 7/15/25* | 230,000 | 234,025 | ||||||
Bath & Body Works, Inc., 9.375%, 7/1/25* | 268,000 | 280,384 | ||||||
Dave & Buster’s, Inc., 7.625%, 11/1/25* | 205,000 | 207,035 | ||||||
Michael Kors USA, Inc., 4.250%, 11/1/24* | 260,000 | 255,419 | ||||||
Neiman Marcus Group LLC, 7.125%, 4/1/26* | 115,000 | 109,298 | ||||||
| 1,086,161 | ||||||||
The Accompanying Footnotes are an Integral Part of these Financial Statements
20
THE RBB FUND TRUST
PENN CAPITAL SHORT DURATION HIGH INCOME FUND
SCHEDULE OF INVESTMENTS
AUGUST 31, 2023
Principal | Value | |||||||
Services: 3.3% | ||||||||
Arrow Bidco LLC, 9.500%, 3/15/24* | $ | 110,000 | $ | 109,906 | ||||
Prime Security Services Borrower LLC, 5.250%, 4/15/24* | 434,000 | 430,136 | ||||||
United Rentals North America, Inc., 5.500%, 5/15/27 | 100,000 | 98,012 | ||||||
WESCO Distribution, Inc., 7.125%, 6/15/25* | 408,000 | 409,802 | ||||||
| 1,047,856 | ||||||||
Technology & Electronics: 0.9% | ||||||||
Gen Digital, Inc., 6.750%, 9/30/27* | 235,000 | 235,592 | ||||||
Xerox Corp., 3.800%, 5/15/24 | 50,000 | 48,971 | ||||||
| 284,563 | ||||||||
Telecommunications: 3.3% | ||||||||
Cogent Communications Group, Inc., 7.000%, 6/15/27* | 160,000 | 155,312 | ||||||
Frontier Communications Holdings LLC, 5.875%, 10/15/27* | 595,000 | 541,927 | ||||||
Hughes Satellite Systems Corp., 6.625%, 8/1/26 | 380,000 | 329,650 | ||||||
| 1,026,889 | ||||||||
Transportation: 5.0% | ||||||||
Allegiant Travel Co., 8.500%, 2/5/24* | 324,000 | 324,000 | ||||||
American Airlines, Inc., 11.750%, 7/15/25* | 115,000 | 125,873 | ||||||
American Airlines, Inc., 7.250%, 2/15/28* | 500,000 | 491,159 | ||||||
Spirit Loyalty Cayman Ltd., 8.000%, 9/20/25* | 215,000 | 215,234 | ||||||
VistaJet Malta Finance PLC, 7.875%, 5/1/27* | 260,000 | 235,300 | ||||||
XPO, Inc., 6.250%, 5/1/25* | 192,000 | 188,949 | ||||||
| 1,580,515 | ||||||||
Utility: 4.0% | ||||||||
Calpine Corp., 5.250%, 6/1/26* | 510,000 | 500,399 | ||||||
NextEra Energy Operating Partners LP, 4.250%, 7/15/24* | 260,000 | 255,103 | ||||||
Vistra Operations Co. LLC, 5.500%, 9/1/26* | 509,000 | 490,965 | ||||||
| 1,246,467 | ||||||||
Total Corporate Bonds (cost $31,090,485) | 30,613,398 | |||||||
Number of | Value | |||||||
Short-Term Investments: 1.6% | ||||||||
U.S. Bank Money Market Deposit Account, 3.41%(a) | 510,121 | $ | 510,121 | |||||
Total Short-Term Investments (cost $510,121) | 510,121 | |||||||
Total Investments - 99.2% (cost $31,600,606) | 31,123,519 | |||||||
Other Assets and Liabilities 0.8% | 265,519 | |||||||
Net Assets: 100.0% | $ | 31,389,038 | ||||||
* | Securities purchased pursuant to Rule 144A of the Securities Act of 1933, as amended, and may be sold only to dealers in that program or other “qualified institutional buyers.” As of August 31, 2023, the value of these investments was $19,573,888, or 62.4% of total net assets. |
(a) | Rate reported is the current yield as of August 31, 2023. |
The Accompanying Footnotes are an Integral Part of these Financial Statements
21
THE RBB FUND TRUST
PENN CAPITAL SHORT DURATION HIGH INCOME FUND
SCHEDULE OF INVESTMENTS
AUGUST 31, 2023
Country Exposure (as a percentage of total investments) | |
United States | 88.3% |
Canada | 2.9% |
Cayman Islands | 2.6% |
Liberia | 1.7% |
Netherlands | 1.6% |
United Kingdom | 1.2% |
Bermuda | 0.9% |
Malta | 0.8% |
Asset Type (as a percentage of total investments) (Unaudited) |
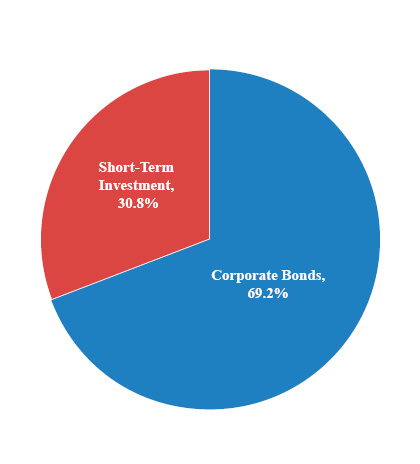
The Accompanying Footnotes are an Integral Part of these Financial Statements
22
THE RBB FUND TRUST
Penn Capital Special Situations Small Cap Equity Fund
SCHEDULE OF INVESTMENTS
AUGUST 31, 2023
Number of | Value | |||||||
Common Stocks: 96.5% | ||||||||
Aerospace & Defense: 2.3% | ||||||||
Spirit AeroSystems Holdings, Inc. - Class A* | 18,590 | $ | 396,339 | |||||
Triumph Group, Inc.* | 57,129 | 537,584 | ||||||
| 933,923 | ||||||||
Air Freight & Logistics: 1.8% | ||||||||
GXO Logistics, Inc.* | 11,406 | 729,642 | ||||||
Automobile Components: 1.3% | ||||||||
American Axle & Manufacturing Holdings, Inc.* | 70,466 | 532,018 | ||||||
Banks: 8.8% | ||||||||
Ameris Bancorp | 15,088 | 614,836 | ||||||
FB Financial Corp. | 15,340 | 466,029 | ||||||
Hancock Whitney Corp. | 13,402 | 552,833 | ||||||
Pinnacle Financial Partners, Inc. | 7,105 | 472,909 | ||||||
Popular, Inc. | 10,048 | 686,078 | ||||||
Seacoast Banking Corp of Florida | 13,730 | 324,165 | ||||||
South State Corp. | 7,091 | 512,679 | ||||||
| 3,629,529 | ||||||||
Biotechnology: 3.0% | ||||||||
ACADIA Pharmaceuticals, Inc.* | 12,777 | 345,235 | ||||||
Halozyme Therapeutics, Inc.* | 12,934 | 550,471 | ||||||
Mirum Pharmaceuticals, Inc.* | 12,166 | 321,547 | ||||||
| 1,217,253 | ||||||||
Chemicals: 3.1% | ||||||||
Aspen Aerogels, Inc.* | 39,094 | 238,083 | ||||||
Avient Corp. | 12,066 | 483,967 | ||||||
Livent Corp.* | 25,070 | 538,253 | ||||||
| 1,260,303 | ||||||||
Commercial Services & Supplies: 1.1% | ||||||||
Viad Corp.* | 16,188 | 459,577 | ||||||
Communications Equipment: 0.4% | ||||||||
Calix, Inc.* | 3,094 | 143,902 | ||||||
Construction & Engineering: 0.9% | ||||||||
Construction Partners, Inc. - Class A* | 11,032 | 383,362 | ||||||
Construction Materials: 1.5% | ||||||||
Summit Materials, Inc. - Class A* | 16,256 | 608,137 | ||||||
Number of | Value | |||||||
Consumer Finance: 0.5% | ||||||||
Green Dot Corp. - Class A* | 14,539 | $ | 215,759 | |||||
Containers & Packaging: 1.5% | ||||||||
O-I Glass, Inc.* | 31,805 | 631,647 | ||||||
Electronic Equipment, Instruments & Components: 0.5% | ||||||||
Ouster, Inc.* | 36,345 | 204,622 | ||||||
Energy Equipment & Services: 8.3% | ||||||||
ChampionX Corp. | 14,066 | 507,642 | ||||||
Patterson-UTI Energy, Inc. | 39,056 | 552,252 | ||||||
Transocean Ltd.* | 99,987 | 817,893 | ||||||
Weatherford International PLC* | 17,590 | 1,557,067 | ||||||
| 3,434,854 | ||||||||
Ground Transportation: 2.5% | ||||||||
ArcBest Corp. | 5,973 | 630,689 | ||||||
XPO, Inc.* | 5,214 | 389,121 | ||||||
| 1,019,810 | ||||||||
Health Care Equipment & Supplies: 3.4% | ||||||||
Alphatec Holdings, Inc.* | 54,635 | 893,282 | ||||||
SI-BONE, Inc.* | 22,555 | 516,059 | ||||||
| 1,409,341 | ||||||||
Health Care Providers & Services: 4.5% | ||||||||
Progyny, Inc.* | 13,573 | 506,816 | ||||||
RadNet, Inc.* | 18,917 | 632,017 | ||||||
Tenet Healthcare Corp.* | 9,118 | 707,192 | ||||||
| 1,846,025 | ||||||||
Hotels, Restaurants & Leisure: 13.3% | ||||||||
Bloomin’ Brands, Inc. | 24,281 | 681,325 | ||||||
Boyd Gaming Corp. | 7,145 | 477,786 | ||||||
Golden Entertainment, Inc. | 23,691 | 862,589 | ||||||
Hilton Grand Vacations, Inc.* | 11,159 | 487,872 | ||||||
Papa John’s International, Inc. | 7,132 | 539,893 | ||||||
Penn Entertainment, Inc.* | 22,141 | 524,520 | ||||||
Planet Fitness, Inc. - Class A* | 8,524 | 518,259 | ||||||
PlayAGS, Inc.* | 32,563 | 222,405 | ||||||
SeaWorld Entertainment, Inc.* | 15,517 | 755,678 | ||||||
Xponential Fitness, Inc. - Class A* | 18,259 | 395,490 | ||||||
| 5,465,817 | ||||||||
The Accompanying Footnotes are an Integral Part of these Financial Statements
23
THE RBB FUND TRUST
PENN CAPITAL SPECIAL SITUATIONS SMALL CAP EQUITY FUND
SCHEDULE OF INVESTMENTS
AUGUST 31, 2023
Number of | Value | |||||||
Insurance: 0.5% | ||||||||
Axis Capital Holdings Ltd. | 4,032 | $ | 221,196 | |||||
Machinery: 3.5% | ||||||||
Chart Industries, Inc.* | 4,258 | 768,909 | ||||||
Hillman Solutions Corp.* | 72,394 | 655,166 | ||||||
| 1,424,075 | ||||||||
Marine Transportation: 1.4% | ||||||||
Kirby Corp.* | 7,004 | 580,141 | ||||||
Media: 6.7% | ||||||||
Clear Channel Outdoor Holdings, Inc.* | 234,965 | 340,699 | ||||||
Gray Television, Inc. | 109,777 | 884,803 | ||||||
Magnite, Inc.* | 44,940 | 370,755 | ||||||
Nexstar Media Group, Inc. - Class A | 4,346 | 707,529 | ||||||
Stagwell, Inc.* | 85,528 | 466,127 | ||||||
| 2,769,913 | ||||||||
Metals & Mining: 3.0% | ||||||||
Carpenter Technology Corp. | 11,894 | 744,921 | ||||||
Kaiser Aluminum Corp. | 6,351 | 482,168 | ||||||
| 1,227,089 | ||||||||
Oil, Gas & Consumable Fuels: 4.6% | ||||||||
California Resources Corp. | 10,948 | 611,336 | ||||||
Northern Oil and Gas, Inc. | 18,438 | 771,261 | ||||||
Talos Energy, Inc.* | 29,853 | 514,069 | ||||||
| 1,896,666 | ||||||||
Pharmaceuticals: 1.0% | ||||||||
Perrigo Co. PLC | 12,343 | 432,005 | ||||||
Real Estate Management & Development: 1.1% | ||||||||
Newmark Group, Inc. - Class A | 65,435 | 463,934 | ||||||
Semiconductors & Semiconductor Equipment: 6.0% | ||||||||
Allegro MicroSystems, Inc.* | 15,047 | 575,548 | ||||||
Kulicke & Soffa Industries, Inc. | 13,558 | 701,355 | ||||||
Navitas Semiconductor Corp.* | 62,111 | 548,440 | ||||||
Rambus, Inc.* | 11,734 | 662,619 | ||||||
| 2,487,962 | ||||||||
Software: 3.3% | ||||||||
New Relic, Inc.* | 2,853 | $ | 242,819 | |||||
RingCentral, Inc. - Class A* | 17,699 | 547,430 | ||||||
Zuora, Inc. - Class A* | 63,645 | 579,806 | ||||||
| 1,370,055 | ||||||||
Textiles, Apparel & Luxury Goods: 0.9% | ||||||||
Crocs, Inc.* | 3,730 | 363,078 | ||||||
Trading Companies & Distributors: 4.9% | ||||||||
FTAI Aviation Ltd. | 15,750 | 582,120 | ||||||
H&E Equipment Services, Inc. | 16,658 | 754,941 | ||||||
NOW, Inc.* | 60,789 | 679,013 | ||||||
| 2,016,074 | ||||||||
Wireless Telecommunication Services: 0.9% | ||||||||
Gogo, Inc.* | 33,220 | 377,047 | ||||||
Total Common Stocks (cost $38,986,122) | 39,754,756 | |||||||
REITs: 2.6% | ||||||||
Hotel & Resort REITs: 1.5% | ||||||||
Ryman Hospitality Properties, Inc. | 7,350 | 624,970 | ||||||
Industrial REITs: 1.0% | ||||||||
STAG Industrial, Inc. | 11,656 | 425,794 | ||||||
Total REITs (cost $1,049,456) | 1,050,764 | |||||||
Short-Term Investments: 1.9% | ||||||||
U.S. Bank Money Market Deposit Account, 3.41%(a) | 802,932 | 802,932 | ||||||
Total Short-Term Investments (cost $802,932) | 802,932 | |||||||
Total Investments - 100.9% (cost $40,838,510) | 41,608,452 | |||||||
Liabilities in Excess of Other Assets (0.9)% | (350,747 | ) | ||||||
Net Assets: 100.0% | $ | 41,257,705 | ||||||
* | Non-income producing security. |
(a) | Rate reported is the current yield as of August 31, 2023. |
The Accompanying Footnotes are an Integral Part of these Financial Statements
24
THE RBB FUND TRUST
PENN CAPITAL SPECIAL SITUATIONS SMALL CAP EQUITY FUND
SCHEDULE OF INVESTMENTS
AUGUST 31, 2023
Country Exposure (as a percentage of total investments) | |
United States | 89.6% |
Ireland | 4.8% |
Switzerland | 2.0% |
Puerto Rico | 1.7% |
Cayman Islands | 1.4% |
Bermuda | 0.5% |
Asset Type (as a percentage of total investments) (Unaudited) |

The industry classifications presented in this report, present the Global Industry Classification Standard (GICS®). GICS® was developed by and/or is the exclusive property of MSCI, Inc. and Standard & Poor Financial Services LLC (“S&P”). GICS® is a service mark of MSCI and S&P and has been licensed for use by U.S. Bank Global Fund Services.
The Accompanying Footnotes are an Integral Part of these Financial Statements
25
THE RBB FUND TRUST
Statements of Assets and Liabilities
AUGUST 31, 2023
Assets | Penn Capital | Penn Capital | Penn Capital | Penn Capital | ||||||||||||
Investments, at fair value (1) | ||||||||||||||||
Unaffiliated issuers | $ | 13,298,548 | $ | 25,171,084 | $ | 31,123,519 | $ | 41,608,452 | ||||||||
Receivables: | ||||||||||||||||
Advisor reimbursement due | 5,683 | 21,952 | 23,124 | — | ||||||||||||
Dividends and interest | 7,898 | 462,306 | 512,990 | 19,391 | ||||||||||||
Investments sold | 273,281 | 275,173 | — | 99,048 | ||||||||||||
Other assets | 2,385 | 2,146 | 3,161 | 2,307 | ||||||||||||
Total assets | 13,587,795 | 25,932,661 | 31,662,794 | 41,729,198 | ||||||||||||
Liabilities | ||||||||||||||||
Payables: | ||||||||||||||||
Investments purchased | 321,872 | 147,520 | 158,089 | 361,221 | ||||||||||||
Fund shares redeemed | — | 11,314 | 62,629 | 60,000 | ||||||||||||
Dividends | — | — | 441 | — | ||||||||||||
Investment advisory fees | — | — | — | 14,290 | ||||||||||||
Accrued expenses: | ||||||||||||||||
Professional fees | 25,750 | 27,491 | 36,979 | 28,599 | ||||||||||||
Administration fees | 4,842 | 7,553 | 10,407 | 4,739 | ||||||||||||
Other accrued expenses | 3,945 | 788 | 5,211 | 2,644 | ||||||||||||
Total liabilities | 356,409 | 194,666 | 273,756 | 471,493 | ||||||||||||
Net assets | $ | 13,231,386 | $ | 25,737,995 | $ | 31,389,038 | $ | 41,257,705 | ||||||||
Composition of Net Assets | ||||||||||||||||
Paid-in capital | $ | 10,030,884 | $ | 28,763,329 | $ | 34,478,899 | $ | 40,545,680 | ||||||||
Total distributable earnings/accumulated loss | 3,200,502 | (3,025,334 | ) | (3,089,861 | ) | 712,025 | ||||||||||
Net assets | $ | 13,231,386 | $ | 25,737,995 | $ | 31,389,038 | $ | 41,257,705 | ||||||||
Institutional Class | ||||||||||||||||
Net assets applicable to outstanding shares | $ | 13,231,386 | $ | 25,737,995 | $ | 31,389,038 | $ | 41,257,705 | ||||||||
Shares of beneficial interest outstanding, no par value, unlimited authorization | 999,362 | 3,033,929 | 3,368,670 | 2,946,284 | ||||||||||||
Net asset value per share outstanding | $ | 13.24 | $ | 8.48 | $ | 9.32 | $ | 14.00 | ||||||||
(1) | Investment in securities at cost |
Unaffiliated issuers | $ | 11,337,418 | $ | 25,972,439 | $ | 31,600,606 | $ | 40,838,510 |
The Accompanying Footnotes are an Integral Part of these Financial Statements
26
THE RBB FUND TRUST
Statements of Operations
FISCAL YEAR ENDED AUGUST 31, 2023
Investment Income (Loss) | Penn Capital | Penn Capital | Penn Capital | Penn Capital | ||||||||||||
Income | ||||||||||||||||
Dividends (net of foreign withholding taxes) | $ | 128,104 | $ | 6,539 | $ | — | $ | 212,365 | ||||||||
Short-term capital gain distributions from affiliated mutual fund | — | 48,433 | 84,590 | — | ||||||||||||
Interest and fees | 8,152 | 1,541,483 | 1,479,116 | 16,532 | ||||||||||||
Total income | 136,256 | 1,596,455 | 1,563,706 | 228,897 | ||||||||||||
Expenses | ||||||||||||||||
Advisory fees | 114,428 | 156,137 | 141,192 | 178,160 | ||||||||||||
Professional Expense | 30,286 | 35,597 | 48,179 | 34,528 | ||||||||||||
Administration and accounting fees | 29,807 | 81,086 | 76,590 | 37,488 | ||||||||||||
Registration and filing fees | 21,251 | 21,107 | 24,780 | 21,251 | ||||||||||||
Service Fees | 5,693 | 4,016 | 27,823 | 14,242 | ||||||||||||
Transfer agent fees | 5,430 | 7,091 | 14,737 | 9,043 | ||||||||||||
Director fees | 4,987 | 7,712 | 12,614 | 6,636 | ||||||||||||
Officer fees | 3,475 | 6,369 | 9,473 | 4,771 | ||||||||||||
Printing and shareholder reporting fees | 3,013 | 5,122 | 9,104 | 4,473 | ||||||||||||
Custodian fees | 1,767 | 1,808 | 823 | 4,640 | ||||||||||||
Interest Expenses | — | — | — | 88 | ||||||||||||
Other expenses | 7,249 | 13,587 | 15,961 | 8,518 | ||||||||||||
Total expenses before waivers and reimbursements | 227,386 | 339,632 | 381,276 | 323,838 | ||||||||||||
Less: waivers and reimbursement | (92,617 | ) | (176,705 | ) | (211,846 | ) | (119,334 | ) | ||||||||
Expense waiver and reimbursement from Advisor | ||||||||||||||||
Net expenses | 134,769 | 162,927 | 169,430 | 204,504 | ||||||||||||
Net investment income (loss) | 1,487 | 1,433,528 | 1,394,276 | 24,393 | ||||||||||||
Realized and Unrealized Gain (Loss) on Investments | ||||||||||||||||
Net realized gain (loss) on investments | ||||||||||||||||
Unaffiliated issuers | 1,320,521 | (1,105,434 | ) | (521,643 | ) | 32,210 | ||||||||||
Affiliated mutual fund (See Note 8) | — | (71,087 | ) | (150,041 | ) | — | ||||||||||
Net realized gain (loss) on investments | 1,320,521 | (1,176,521 | ) | (671,684 | ) | 32,210 | ||||||||||
Net change in unrealized appreciation (depreciation) | ||||||||||||||||
Unaffiliated issuers | (429,910 | ) | 1,107,541 | 1,036,001 | (769,382 | ) | ||||||||||
Affiliated mutual fund (See Note 8) | — | 78,147 | 162,371 | — | ||||||||||||
Net realized and unrealized gain (loss) on investments | 890,611 | 9,167 | 526,688 | (737,172 | ) | |||||||||||
Net increase (decrease) in net assets resulting from operations | $ | 892,098 | $ | 1,442,695 | $ | 1,920,964 | $ | (712,779 | ) | |||||||
Net of foreign taxes withheld | $ | 383 | $ | — | $ | — | $ | 829 | ||||||||
The Accompanying Footnotes are an Integral Part of these Financial Statements
27
[THIS PAGE INTENTIONALLY LEFT BLANK.]
[THIS PAGE INTENTIONALLY LEFT BLANK.]
THE RBB FUND TRUST
Statements of Changes in Net Assets
Penn Capital | Penn Capital | |||||||||||||||
Increase (Decrease) in Net Assets | Fiscal Year | Fiscal Year | Fiscal Year | Fiscal Year | ||||||||||||
Operations | ||||||||||||||||
Net investment income (loss) | $ | 1,487 | $ | 24,128 | $ | 1,433,528 | $ | 946,198 | ||||||||
Net realized gain (loss) on investments: | ||||||||||||||||
Unaffiliated issuers | 1,320,521 | 396,672 | (1,176,521 | ) | (454,505 | ) | ||||||||||
Net change in unrealized appreciation (depreciation) | (429,910 | ) | (3,534,958 | ) | 1,185,688 | (2,605,097 | ) | |||||||||
Net increase (decrease) in net assets resulting from operations | 892,098 | (3,114,158 | ) | 1,442,695 | (2,113,404 | ) | ||||||||||
Dividends and distributions to shareholders | ||||||||||||||||
Net dividends and distributions from net investment income and realized gain - Institutional Class | (63,731 | ) | (2,002,649 | ) | (1,429,097 | ) | (943,646 | ) | ||||||||
Total dividends and distributions to shareholders | (63,731 | ) | (2,002,649 | ) | (1,429,097 | ) | (943,646 | ) | ||||||||
Capital share transactions | ||||||||||||||||
Net proceeds from sale of shares | 288,039 | 344,227 | 9,579,685 | 2,179,258 | ||||||||||||
Dividends and distributions reinvested | 49,196 | 1,592,243 | 1,162,266 | 747,008 | ||||||||||||
Cost of shares redeemed | (611,426 | ) | (3,002,147 | ) | (3,019,225 | ) | (826,310 | ) | ||||||||
Net increase (decrease) in net assets resulting from capital share transactions | (274,191 | ) | (1,065,677 | ) | 7,722,726 | 2,099,956 | ||||||||||
Net increase (decrease) in net assets | 554,176 | (6,182,484 | ) | 7,736,324 | (957,094 | ) | ||||||||||
Net Assets | ||||||||||||||||
Beginning of period | 12,677,210 | 18,859,694 | 18,001,671 | 18,958,765 | ||||||||||||
End of period | $ | 13,231,386 | $ | 12,677,210 | $ | 25,737,995 | $ | 18,001,671 | ||||||||
The Accompanying Footnotes are an Integral Part of these Financial Statements
30
THE RBB FUND TRUST
Statements of Changes in Net Assets
Penn Capital | Penn Capital | ||||||||||||||
Fiscal Year | Fiscal Year | Fiscal Year | Fiscal Year | ||||||||||||
| $ | 1,394,276 | $ | 1,205,182 | $ | 24,393 | $ | (56,705 | ) | |||||||
| (671,684 | ) | (99,367 | ) | 32,210 | 617,231 | ||||||||||
| 1,198,372 | (2,410,109 | ) | (769,382 | ) | (3,000,682 | ) | |||||||||
| 1,920,964 | (1,304,294 | ) | (712,779 | ) | (2,440,156 | ) | |||||||||
| (1,405,413 | ) | (1,192,175 | ) | (277,739 | ) | (3,352,825 | ) | ||||||||
| (1,405,413 | ) | (1,192,175 | ) | (277,739 | ) | (3,352,825 | ) | ||||||||
| 8,132,094 | 2,759,420 | 27,597,016 | 5,556,932 | ||||||||||||
| 1,260,198 | 1,063,957 | 246,703 | 2,834,632 | ||||||||||||
| (12,423,328 | ) | (11,293,367 | ) | (2,211,975 | ) | (2,875,898 | ) | ||||||||
| (3,031,036 | ) | (7,469,990 | ) | 25,631,744 | 5,515,666 | ||||||||||
| (2,515,485 | ) | (9,966,459 | ) | 24,641,226 | (277,315 | ) | |||||||||
| 33,904,523 | 43,870,982 | 16,616,479 | 16,893,794 | ||||||||||||
| $ | 31,389,038 | $ | 33,904,523 | $ | 41,257,705 | $ | 16,616,479 | ||||||||
The Accompanying Footnotes are an Integral Part of these Financial Statements
31
THE RBB FUND TRUST
Financial Highlights
Per Common | ||||||||||||||||||||||||||||
Income from | Distributions | |||||||||||||||||||||||||||
Net asset | Net | Net | Total from | Dividends | Distributions | Total | ||||||||||||||||||||||
Penn Capital Mid Cap Core Fund | ||||||||||||||||||||||||||||
Institutional Class | ||||||||||||||||||||||||||||
9/1/22 to 8/31/23 | $ | 12.42 | — | (g) | 0.89 | 0.89 | (0.02 | ) | (0.05 | ) | (0.07 | ) | ||||||||||||||||
9/1/21 to 8/31/22 | $ | 16.79 | 0.02 | (2.62 | ) | (2.60 | ) | (0.05 | ) | (1.72 | ) | (1.77 | ) | |||||||||||||||
7/1/21 to 8/31/21(e) | $ | 16.76 | (0.01 | ) | 0.04 | 0.03 | — | — | — | |||||||||||||||||||
7/1/20 to 6/30/21 | $ | 11.49 | 0.03 | 5.24 | 5.27 | — | (g) | — | — | (g) | ||||||||||||||||||
7/1/19 to 6/30/20 | $ | 12.68 | — | (g) | (0.60 | ) | (0.60 | ) | — | (0.59 | ) | (0.59 | ) | |||||||||||||||
7/1/18 to 6/30/19 | $ | 13.55 | (0.01 | ) | 0.37 | 0.36 | (f) | — | (1.23 | ) | (1.23 | ) | ||||||||||||||||
Penn Capital Opportunisitic High Income Fund | ||||||||||||||||||||||||||||
Institutional Class | ||||||||||||||||||||||||||||
9/1/22 to 8/31/23 | $ | 8.50 | 0.53 | (0.03 | ) | 0.50 | (0.52 | ) | — | (0.52 | ) | |||||||||||||||||
9/1/21 to 8/31/22 | $ | 9.96 | 0.46 | (1.46 | ) | (1.00 | ) | (0.46 | ) | — | (0.46 | ) | ||||||||||||||||
7/1/21 to 8/31/21(e) | $ | 10.00 | 0.08 | (0.04 | ) | 0.04 | (0.08 | ) | — | (0.08 | ) | |||||||||||||||||
7/1/20 to 6/30/21 | $ | 8.88 | 0.54 | 1.12 | 1.66 | (0.54 | ) | — | (0.54 | ) | ||||||||||||||||||
7/1/19 to 6/30/20 | $ | 9.99 | 0.53 | (1.10 | ) | (0.57 | )(f) | (0.54 | ) | — | (0.54 | ) | ||||||||||||||||
7/1/18 to 6/30/19 | $ | 10.06 | 0.59 | (0.02 | ) | 0.57 | (f) | (0.61 | ) | (0.03 | ) | (0.64 | ) | |||||||||||||||
Penn Capital Short Duration High Income Fund | ||||||||||||||||||||||||||||
Institutional Class | ||||||||||||||||||||||||||||
9/1/22 to 8/31/23 | $ | 9.15 | 0.41 | 0.17 | 0.58 | (0.41 | ) | — | (0.41 | ) | ||||||||||||||||||
9/1/21 to 8/31/22 | $ | 9.73 | 0.29 | (0.58 | ) | (0.29 | ) | (0.29 | ) | — | (0.29 | ) | ||||||||||||||||
7/1/21 to 8/31/21(e) | $ | 9.74 | 0.05 | (0.01 | ) | 0.04 | (0.05 | ) | — | (0.05 | ) | |||||||||||||||||
7/1/20 to 6/30/21 | $ | 9.33 | 0.36 | 0.41 | 0.77 | (0.36 | ) | — | (0.36 | ) | ||||||||||||||||||
7/1/19 to 6/30/20 | $ | 9.93 | 0.37 | (0.59 | ) | (0.22 | ) | (0.38 | ) | — | (0.38 | ) | ||||||||||||||||
7/1/18 to 6/30/19 | $ | 9.85 | 0.35 | 0.10 | 0.45 | (f) | (0.37 | ) | — | (0.37 | ) | |||||||||||||||||
(a) | Information presented related to a share outstanding for the entire period. |
(b) | Annualized for periods less than one full year. |
(c) | Portfolio turnover is calculated on the basis of the Fund as a whole without distinguishing between the classes of shares issued. |
(d) | Not annualized. |
(e) | The Funds changed their fiscal year end to August 31. |
(f) | Total from investment operations per share includes redemption fees of less than $0.01 per share. |
(g) | Amount is less than $0.005 per share. |
Per share data calculated using average shares outstanding method. |
The Accompanying Footnotes are an Integral Part of these Financial Statements
32
THE RBB FUND TRUST
Financial Highlights
Per Common | Supplemental | ||||||||||||||||||||||||||||||
Net asset | Total | Net assets, | Ratio of | Ratio of | Ratio of net | Ratio of net | Portfolio | ||||||||||||||||||||||||
| $ | 13.24 | 7.14 | % | $ | 13,231 | 1.06 | % | 1.79 | % | 0.01 | % | (0.76 | )% | 94 | % | ||||||||||||||||
| $ | 12.42 | (17.45 | )% | $ | 12,677 | 1.06 | % | 1.49 | % | 0.14 | % | (0.29 | )% | 38 | % | ||||||||||||||||
| $ | 16.79 | 0.18 | % | $ | 18,860 | 1.06 | % | 1.70 | % | (0.28 | )% | (0.92 | )% | 3 | % | ||||||||||||||||
| $ | 16.76 | 45.88 | % | $ | 19,972 | 1.06 | % | 2.19 | % | 0.30 | % | (0.83 | )% | 59 | % | ||||||||||||||||
| $ | 11.49 | (5.23 | )% | $ | 15,966 | 1.06 | % | 2.14 | % | (0.04 | )% | (1.12 | )% | 57 | % | ||||||||||||||||
| $ | 12.68 | 3.64 | % | $ | 14,363 | 1.06 | % | 2.20 | % | (0.11 | )% | (1.25 | )% | 40 | % | ||||||||||||||||
| $ | 8.48 | 6.14 | % | $ | 25,738 | 0.72 | % | 1.50 | % | 6.34 | % | 5.52 | % | 61 | % | ||||||||||||||||
| $ | 8.50 | (10.31 | )% | $ | 18,002 | 0.72 | % | 1.42 | % | 4.94 | % | 4.24 | % | 71 | % | ||||||||||||||||
| $ | 9.96 | 0.43 | % | $ | 18,959 | 0.72 | % | 1.65 | % | 4.69 | % | 3.76 | % | 18 | % | ||||||||||||||||
| $ | 10.00 | 19.08 | % | $ | 20,099 | 0.72 | % | 2.08 | % | 5.27 | % | 4.21 | % | 156 | % | ||||||||||||||||
| $ | 8.88 | (5.86 | )% | $ | 17,819 | 0.72 | % | 2.08 | % | 5.66 | % | 4.30 | % | 149 | % | ||||||||||||||||
| $ | 9.99 | 5.83 | % | $ | 15,236 | 0.72 | % | 2.26 | % | 5.90 | % | 4.36 | % | 85 | % | ||||||||||||||||
| $ | 9.32 | 6.50 | % | $ | 31,389 | 0.54 | % | 1.22 | % | 4.44 | % | 3.72 | % | 67 | % | ||||||||||||||||
| $ | 9.15 | (3.05 | )% | $ | 33,905 | 0.54 | % | 0.88 | % | 3.02 | % | 2.68 | % | 54 | % | ||||||||||||||||
| $ | 9.73 | 0.41 | % | $ | 43,871 | 0.54 | % | 0.99 | % | 2.97 | % | 2.52 | % | 11 | % | ||||||||||||||||
| $ | 9.74 | 11.96 | % | $ | 40,180 | 0.54 | % | 1.16 | % | 3.77 | % | 3.15 | % | 104 | % | ||||||||||||||||
| $ | 9.33 | (2.33 | )% | $ | 44,462 | 0.54 | % | 1.15 | % | 3.87 | % | 3.26 | % | 113 | % | ||||||||||||||||
| $ | 9.93 | 4.65 | % | $ | 34,924 | 0.54 | % | 1.44 | % | 3.75 | % | 2.85 | % | 48 | % | ||||||||||||||||
The Accompanying Footnotes are an Integral Part of these Financial Statements
33
THE RBB FUND TRUST
Financial Highlights
Per Common | ||||||||||||||||||||||||||||
Income from | Distributions | |||||||||||||||||||||||||||
Net asset | Net | Net | Total from | Dividends | Distributions | Total | ||||||||||||||||||||||
Penn Capital Special Situations Small Cap Equity Fund | ||||||||||||||||||||||||||||
Institutional Class | ||||||||||||||||||||||||||||
9/1/22 to 8/31/23 | $ | 13.64 | 0.02 | 0.57 | 0.59 | — | (0.23 | ) | (0.23 | ) | ||||||||||||||||||
9/1/21 to 8/31/22 | $ | 19.62 | (0.05 | ) | (2.12 | ) | (2.17 | ) | — | (3.81 | ) | (3.81 | ) | |||||||||||||||
7/1/21 to 8/31/21(e) | $ | 19.79 | (0.01 | ) | (0.16 | ) | (0.17 | ) | — | — | — | |||||||||||||||||
7/1/20 to 6/30/21 | $ | 9.33 | (0.01 | ) | 10.47 | 10.46 | — | — | — | |||||||||||||||||||
7/1/19 to 6/30/20 | $ | 10.67 | (0.03 | ) | (1.31 | ) | (1.34 | ) | — | — | — | |||||||||||||||||
7/1/18 to 6/30/19 | $ | 12.59 | (0.05 | ) | (0.98 | ) | (1.03 | )(f) | — | (0.89 | ) | (0.89 | ) | |||||||||||||||
(a) | Information presented related to a share outstanding for the entire period. |
(b) | Annualized for periods less than one full year. |
(c) | Portfolio turnover is calculated on the basis of the Fund as a whole without distinguishing between the classes of shares issued. |
(d) | Not annualized. |
(e) | The Funds changed their fiscal year end to August 31. |
(f) | Total from investment operations per share includes redemption fees of less than $0.01 per share. |
Per share data calculated using average shares outstanding method. |
The Accompanying Footnotes are an Integral Part of these Financial Statements
34
THE RBB FUND TRUST
Financial Highlights
Per Common | Supplemental | ||||||||||||||||||||||||||||||
Net asset | Total | Net assets, | Ratio of | Ratio of | Ratio of net | Ratio of net | Portfolio | ||||||||||||||||||||||||
| $ | 14.00 | 4.40 | % | $ | 41,258 | 1.09 | % | 1.73 | % | 0.13 | % | (0.55 | )% | 69 | % | ||||||||||||||||
| $ | 13.64 | (14.39 | )% | $ | 16,616 | 1.09 | % | 1.58 | % | (0.34 | )% | (0.83 | )% | 87 | % | ||||||||||||||||
| $ | 19.62 | (0.86 | )% | $ | 16,894 | 1.09 | % | 1.71 | % | (0.46 | )% | (1.08 | )% | 11 | % | ||||||||||||||||
| $ | 19.79 | 112.11 | % | $ | 16,923 | 1.09 | % | 2.97 | % | (0.02 | )% | (1.90 | )% | 132 | % | ||||||||||||||||
| $ | 9.33 | (12.56 | )% | $ | 7,245 | 1.09 | % | 3.09 | % | (0.42 | )% | (2.42 | )% | 115 | % | ||||||||||||||||
| $ | 10.67 | (7.91 | )% | $ | 10,198 | 1.09 | % | 2.38 | % | (0.35 | )% | (1.64 | )% | 97 | % | ||||||||||||||||
The Accompanying Footnotes are an Integral Part of these Financial Statements
35
THE RBB FUND TRUST
Notes to the Financial Statements
AUGUST 31, 2023
1. Organization
The RBB Fund Trust (the “Trust”) was organized as a Delaware statutory trust on August 29, 2014, and is registered under the Investment Company Act of 1940 (the “1940 Act”), as amended, as an open-end management investment company. This report covers four series that are available for investment including: the Penn Capital Mid Cap Core Fund, the Penn Capital Opportunistic High Income Fund, the Penn Capital Short Duration High Income Fund, and the Penn Capital Special Situations Small Cap Equity Fund (collectively referred to as the “Funds” and each individually referred to as a “Fund”). Two other series, the Penn Capital Micro Cap Equity Fund and the Penn Capital Enterprise Value Small Cap Equity Fund, are not currently offered. The Funds follow the Financial Accounting Standards Board (“FASB”) Accounting Standard Codification Topic 946 “Financial Services - Investment Companies”.
The Penn Capital Opportunistic High Income Fund’s investment objective is to seek to provide total return through interest income and capital appreciation. The Penn Capital Opportunistic High Income Fund commenced operations on November 30, 2015.
The Penn Capital Short Duration High Income Fund’s investment objective is to seek to provide a high level of current income. The Penn Capital Short Duration High Income Fund commenced operations on July 17, 2017.
The Penn Capital Mid Cap Core Fund and the Penn Capital Special Situations Small Cap Equity Fund’s investment objective is to seek to provide capital appreciation. The Penn Capital Mid Cap Core Fund commenced operations on November 30, 2015. The Penn Capital Special Situations Small Cap Equity Fund commenced operations on December 17, 2015.
Each Fund’s investment objective is non-fundamental, and may be changed by the Trust’s Board of Trustees (the “Board” or “Trustees”) without shareholder approval. Unless otherwise noted, all of the other investment policies and strategies described in the Prospectus or hereafter are nonfundamental. The Penn Capital Management Company, LLC (the “Advisor” or “Penn Capital”) serves as the investment advisor to the Funds.
The Trust offers Institutional Class shares for the Penn Capital Mid Cap Core Fund, the Penn Capital Opportunistic High Income Fund, the Penn Capital Special Situations Small Cap Equity Fund and the Penn Capital Short Duration High Income Fund. The Trust has also registered two other series, each with one class: the Penn Capital Micro Cap Equity Fund and the Penn Capital Enterprise Value Small Cap Equity Fund: Institutional Class. Institutional Class shares do not have a front-end or back-end sales charge. The Penn Capital Micro Cap Equity Fund and Penn Capital Enterprise Value Small Cap Fund have not commenced operations as of August 31, 2023.
The end of the reporting period for the Funds is August 31, 2023, and the period covered by these Notes to Financial Statements is the fiscal year ended August 31, 2023 (the “current fiscal period”).
2. Significant Accounting Policies
The following is a summary of significant accounting policies consistently followed by the Funds in the preparation of their financial statements. The financial statements have been prepared in conformity with accounting principles generally accepted in the United States of America (“GAAP”).
A. Investment Valuation
The Funds use the following valuation methods to determine fair value as either fair value for investments for which market quotations are available, or if not available, the fair value, as determined in good faith pursuant to such policies and procedures as may be approved by the Trust’s Board from time to time. The valuation of the portfolio investments of the Funds currently includes the following processes:
Portfolio securities listed on a national or foreign securities exchange, except those listed on the NASDAQ® Stock Market and Small CapSM exchanges (“NASDAQ®”), for which market quotations are available, are valued at the official closing price of such exchange on each business day (defined as days on which the Funds are open for business (“Business Day”)). Portfolio securities traded on the NASDAQ® will be valued at the NASDAQ® Official Closing Price on each Business Day. If there is no such reported sale on an exchange or NASDAQ®, the portfolio security will be valued at the most recent quoted bid price. Price information on listed securities is taken from the exchange where the security is primarily traded.
36
THE RBB FUND TRUST
Notes to the Financial Statements
AUGUST 31, 2023
Other assets and securities for which no quotations are readily available (such as for certain restricted or unlisted securities and private placements) or that may not be reliably priced (such as in the case of trade suspensions or halts, price movement limits set by certain foreign markets, and thinly traded or illiquid securities) will be valued in good faith at fair value using procedures and methods approved by the Board. Under the procedures adopted by the Board, the Board has delegated day-to-day responsibility for fair value determinations to the Advisor, as valuation designee (the “Valuation Designee”).
A Fund’s portfolio holdings may also consist of shares of other investment companies in which the Fund invests. The value of each such investment company will be its net asset value (“NAV”) at the time the Fund’s shares are priced. Each investment company calculates its NAV based on the current market value for its portfolio holdings. Each investment company values securities and other instruments in a manner as described in that investment company’s prospectus. The investment company’s prospectus explains the circumstances under which the company will use fair value pricing and the effects of using fair value pricing.
Because a Fund may invest in foreign securities, the Fund’s NAV may change on days when a shareholder will not be able to purchase or redeem Fund shares because foreign markets are open at times and on days when U.S. markets are not. Investments quoted in foreign currencies will be valued daily in U.S. dollars on the basis of the foreign currency exchange rates prevailing at the time such valuation is determined. Foreign currency exchange rates are generally determined as of the close of the New York Stock Exchange (“NYSE”) (generally 4:00 p.m. Eastern time). If an event that could materially affect the value of the Fund’s foreign securities has occurred between the time the securities were last traded and the time that the Fund calculates its NAV, the closing price of the Fund’s securities may no longer reflect their market value at the time the Fund calculates its NAV. In such a case, the Valuation Designee may use fair value methods to value such securities.
Fixed income securities shall be valued at the evaluated bid price supplied by the Fund’s pricing agent based on broker-dealer supplied valuations and other criteria, or directly by independent brokers when the pricing agent does not provide a price or the Valuation Designee does not believe that the pricing agent price reflects the current market value. If a price of a position is sought using independent brokers, the Advisor shall seek to obtain an evaluation bid price from at least two independent brokers who are knowledgeable about the position. The price of the position would be deemed to be an average of such bid prices. In the absence of sufficient broker dealer quotes, securities shall be valued at fair value pursuant to procedures adopted by the Board.
Bank loans are not listed on any securities exchange or board of trade. They are typically bought and sold by institutional investors in individually negotiated private transactions that function in many respects like an over-the-counter secondary market. This market generally has fewer trades and less liquidity than the secondary market for other types of securities. Some bank loans have few or no trades, or trade infrequently, and information regarding a specific bank loan may not be widely available or may be incomplete. Except as otherwise specified, bank loan securities shall be valued at the evaluated bid prices supplied by the Fund’s pricing agent based on broker-dealer supplied valuations and other criteria, such as, issuer details, interest rates, yield curves, prepayment speeds, credit risks/spreads, default rates and quoted prices for similar assets, or directly by independent brokers when the pricing agent does not provide a price or the Valuation Designee does not believe that the pricing agent price reflects the current market value. If a price of a position is sought using independent brokers, the Advisor shall seek to obtain a bid price from at least two independent brokers who are knowledgeable about the position. The price of the position would be deemed to be an average of such bid prices. In the absence of sufficient broker dealer quotes, securities shall be valued at fair value pursuant to procedures adopted by the Board.
Occasionally, reliable market quotations are not readily available (such as for certain restricted or unlisted securities and private placements) or securities and other assets may not be reliably priced (such as in the case of trade suspensions or halts, price movement limits set by certain foreign markets, and thinly traded or illiquid securities), or there may be events affecting the value of foreign securities or other securities held by the Funds that occur when regular trading on foreign or other exchanges is closed, but before trading on the NYSE is closed. Fair value determinations are then made in good faith in accordance with procedures adopted by the Board. Under the procedures adopted by the Board, the Board has delegated the responsibility for making fair value determinations to the Valuation Designee, subject to the Board’s oversight. Generally, the fair value of a portfolio security or other asset shall be the amount that the owner of the security or asset might reasonably expect to receive upon its current sale. A three-tier hierarchy is utilized to maximize the use of observable market data and minimize the use of unobservable inputs and to establish classification of fair value measurements for disclosure purposes. Inputs may be observable or unobservable and refer broadly to the assumptions that market participants would use in pricing the asset or liability, including assumptions about risk. Observable inputs are inputs that reflect the assumptions market participants would use in pricing the asset or liability and are developed based
37
THE RBB FUND TRUST
Notes to the Financial Statements
AUGUST 31, 2023
on market data obtained from sources independent of the reporting entity. Unobservable inputs are inputs that reflect the reporting entity’s own assumptions about the assumptions market participants would use in pricing the asset or liability and are developed based on the best information available under the circumstances. The three-tier hierarchy of inputs is summarized in the three broad levels listed below.
Level 1 — Prices are determined using quoted prices in active markets for identical securities.
Level 2 — Prices are determined using other significant observable inputs (including quoted prices for similar securities, interest rates, prepayment speeds, credit risk, etc.).
Level 3 — Prices are determined using significant unobservable inputs (including the Funds’ own assumptions in determining the fair value of investments).
The availability of observable inputs can vary from security to security and is affected by a wide variety of factors, including, for example, the type of security, whether the security is new and not yet established in the marketplace, the liquidity of markets, and other characteristics particular to the security. To the extent that valuation is based on models or inputs that are less observable or unobservable in the market, the determination of fair value requires more judgment. Accordingly, the degree of judgment exercised in determining fair value is greatest for instruments categorized in Level 3.
The inputs used to measure fair value may fall into different levels of the fair value hierarchy. In such cases, for disclosure purposes, the level in the fair value hierarchy within which the fair value measurement falls in its entirety is determined based on the lowest level input that is significant to the fair value measurement in its entirety.
The following table summarizes the inputs used as of the end of the reporting period, in valuing each Fund’s investments:
Description | ||||||||||||||||
Penn Capital Mid Cap Core Fund | Level 1 | Level 2 | Level 3 | Total | ||||||||||||
Investments in Securities(a) | ||||||||||||||||
Common Stocks | $ | 12,387,234 | $ | — | $ | — | $ | 12,387,234 | ||||||||
Real Estate Investment Trusts (REITs) | 646,264 | — | — | 646,264 | ||||||||||||
Short-Term Investments | 265,050 | — | — | 265,050 | ||||||||||||
Total Investments in Securities | $ | 13,298,548 | $ | — | $ | — | $ | 13,298,548 | ||||||||
Penn Capital Opportunistic High Income Fund | Level 1 | Level 2 | Level 3 | Total | ||||||||||||
Investments in Securities(a) | ||||||||||||||||
Corporate Bonds | $ | — | $ | 24,997,232 | $ | — | $ | 24,997,232 | ||||||||
Short-Term Investments | 173,852 | — | — | 173,852 | ||||||||||||
Total Investments in Securities | $ | 173,852 | $ | 24,997,232 | $ | — | $ | 25,171,084 | ||||||||
Penn Capital Short Duration High Income Fund | Level 1 | Level 2 | Level 3 | Total | ||||||||||||
Investments in Securities(a) | ||||||||||||||||
Corporate Bonds | $ | — | $ | 30,613,398 | $ | — | $ | 30,613,398 | ||||||||
Short-Term Investments | 510,121 | — | — | 510,121 | ||||||||||||
Total Investments in Securities | $ | 510,121 | $ | 30,613,398 | $ | — | $ | 31,123,519 | ||||||||
38
THE RBB FUND TRUST
Notes to the Financial Statements
AUGUST 31, 2023
Penn Capital Special Situations Small Cap Equity Fund | Level 1 | Level 2 | Level 3 | Total | ||||||||||||
Investments in Securities(a) | ||||||||||||||||
Common Stocks | $ | 39,754,756 | — | — | $ | 39,754,756 | ||||||||||
Real Estate Investment Trusts (REITs) | 1,050,764 | — | — | 1,050,764 | ||||||||||||
Short-Term Investments | 802,932 | — | — | 802,932 | ||||||||||||
Total Investments in Securities | $ | 41,608,452 | $ | — | $ | — | $ | 41,608,452 | ||||||||
(a) | All other industry classifications are identified in the Schedule of Investments for the Fund. |
During the current fiscal period, the Funds had no Level 3 transfers.
B. Investment Transactions and Related Investment Income
Investment transactions are accounted for on a trade-date basis. Interest income is recorded on the accrual basis, including the amortization of premiums and accretion of discounts on bonds held using the yield-to-maturity method. Dividend income is recognized on ex-dividend date.
Realized gains and losses on investment transactions and unrealized appreciation and depreciation of investments are reported for financial statement and federal income tax purposes on the identified cost method.
C. Expenses
Certain expenses are shared with The RBB Fund, Inc. (“RBB”), an affiliated fund. Expenses incurred on behalf of a specific class, fund or fund family of the Trust or RBB are charged directly to the class, fund or fund family (in proportion to net assets). Expenses incurred for all of the funds (such as trustee or professional fees) are charged to all funds in proportion to their average net assets of the Trust and RBB, or in such other manner as the Board deems fair or equitable.
D. Use of Estimates
The preparation of the financial statements in conformity with GAAP requires management to make estimates and assumptions that affect the reported amounts of assets and liabilities and disclosure of contingent assets and liabilities at the date of the financial statements and the reported amounts of increases and decreases in net assets from operations during the reporting year. Actual results could differ from those estimates.
E. Dividends and Distributions
Dividends and distributions to Shareholders are recorded on the ex-date. The Penn Capital Opportunistic High Income Fund and the Penn Capital Short Duration High Income Fund declare and distribute their net investment income, if any, monthly and make distributions of their net realized capital gains, if any, at least annually, usually in December. The Penn Capital Mid Cap Core Fund and the Penn Capital Special Situations Small Cap Equity Fund declare and distribute their net investment income, if any, annually and make distributions of net realized capital gains, if any, at least annually, usually in December.
The character of distributions made during the period from net investment income or net realized gains may differ from its ultimate characterization for federal income tax purposes. In addition, due to the timing of dividend distributions, the fiscal period in which the amounts are distributed may differ from the period that income or realized gains (losses) were recorded by each Fund.
F. Federal Income Taxes
Each Fund intends to qualify as a regulated investment company under Subchapter M of the Internal Revenue Code of 1986, as amended. If so qualified, the Funds will not be subject to federal income tax to the extent they distribute all of their net investment income and capital gains to shareholders. Therefore, no federal income tax provision is required.
The Funds evaluate tax positions taken or expected to be taken in the course of preparing their tax returns to determine whether it is more-likely-than-not (i.e., greater than 50%) that each tax position will be sustained upon examination by a taxing authority based on the technical merits of the position. Tax positions not deemed to meet the more-likely-than-not threshold are recorded as
39
THE RBB FUND TRUST
Notes to the Financial Statements
AUGUST 31, 2023
a tax benefit or expense in the current year. The Funds did not record any tax provision in the current period and have no provision for taxes in the financial statements. However, management’s conclusions regarding tax positions taken may be subject to review and adjustment at a later date based on factors including, but not limited to, examination by tax authorities (i.e., the last three open tax year ends, as applicable) and on-going analysis of and changes to tax laws, regulations and interpretations thereof.
G. Indemnifications
Under the Trust’s organizational documents, its officers and Trustees are indemnified against certain liabilities arising out of the performance of their duties to the Trust and each Fund. In addition, in the normal course of business, the Trust may enter into contracts that provide general indemnification to other parties. The Trust’s maximum exposure under these arrangements is unknown, as this would involve future claims that may be made against the Trust that have not yet occurred, and may not occur. However, the Trust has not had prior claims or losses pursuant to these contracts and considers the risk of loss to be remote.
3. Agreements and Related Party Transactions
Investment Advisory Agreement
The Trust has entered into an investment advisory agreement with the Advisor. Under the terms of the agreement, each Fund pays the Advisor a fee, payable at the end of each month, at an annual rate, set forth in the table below, of the respective Fund’s average daily net assets.
Penn Capital Mid Cap Core Fund | 0.90% |
Penn Capital Opportunistic High Income Fund | 0.69% |
Penn Capital Short Duration High Income Fund | 0.45% |
Penn Capital Special Situations Small Cap Equity Fund | 0.95% |
With respect to each Fund other than the Penn Capital Opportunistic High Income Fund and the Penn Capital Short Duration High Income Fund, the Advisor has contractually agreed to waive its fees and/or pay Fund expenses so that the Funds’ total annual operating expenses (excluding any acquired fund fees and expenses, taxes, interest, brokerage fees, certain insurance costs, and extraordinary and other non-routine expenses) do not exceed the amounts shown below as a percentage of each Fund’s average daily net assets. With respect to the Penn Capital Opportunistic High Income Fund and the Penn Capital Short Duration High Income Fund, the Advisor has contractually agreed to waive its fees and/or pay Fund expenses so that the Fund’s total annual operating expenses (including any acquired fund fees and expenses incurred by the Fund as a result of its investments in other investment companies managed by the Advisor, but excluding any acquired fund fees and expenses incurred by the Fund as a result of its investments in unaffiliated investment companies, taxes, interest, brokerage fees, certain insurance costs, and extraordinary and other non-routine expenses) do not exceed the amounts shown below as a percentage of each Fund’s average daily net assets. The expense limitation agreement will remain in place through December 31, 2023. Thereafter, the expense limitation agreement for the Funds will be reviewed annually by the Advisor and the Board.
Institutional | |
Penn Capital Mid Cap Core Fund | 1.06% |
Penn Capital Opportunistic High Income Fund | 0.72% |
Penn Capital Short Duration High Income Fund | 0.54% |
Penn Capital Special Situations Small Cap Equity Fund | 1.09% |
40
THE RBB FUND TRUST
Notes to the Financial Statements
AUGUST 31, 2023
Any waived or reimbursed expenses by the Advisor to the Funds excluding any waivers related to acquired fund fees and expenses incurred by the Funds as a result of its investments in other investment companies managed by the Advisor, are subject to repayment by a Fund in the three years following the date the fees were waived or the expenses were paid, provided that the respective Fund is able to make the repayment without exceeding the Fund’s expense limitation in place when the fees were waived or expenses paid. The Advisor’s waived fees and paid expenses that are subject to potential recoupment are as follows:
Fiscal Period Incurred | Amount | Amount | Amount | Year of | ||||||||||||
Penn Capital Mid Cap Core Fund | ||||||||||||||||
June 30, 2021 | $ | 198,611 | $ | — | $ | 198,611 | 2024 | |||||||||
August 31, 2021(1) | 20,634 | — | 20,634 | 2024 | ||||||||||||
August 31, 2022 | 72,939 | — | 72,939 | 2025 | ||||||||||||
August 31, 2023 | 92,617 | — | 92,617 | 2026 | ||||||||||||
Total | $ | 384,801 | $ | — | $ | 384,801 | ||||||||||
Penn Capital Opportunistic High Income Fund | ||||||||||||||||
June 30, 2021 | $ | 256,142 | (2) | $ | — | $ | 253,063 | 2024 | ||||||||
August 31, 2021(1) | 30,361 | — | 30,361 | 2024 | ||||||||||||
August 31, 2022 | 133,924 | (2) | — | 126,522 | 2025 | |||||||||||
August 31, 2023 | 176,705 | (2) | — | 171,999 | 2026 | |||||||||||
Total | $ | 597,132 | $ | — | $ | 581,945 | ||||||||||
Penn Capital Short Duration High Income Fund | ||||||||||||||||
June 30, 2021 | $ | 271,231 | (2) | $ | — | $ | 265,384 | 2024 | ||||||||
August 31, 2021(1) | 33,215 | (2) | — | 31,724 | 2024 | |||||||||||
August 31, 2022 | 133,986 | (2) | — | 118,474 | 2025 | |||||||||||
August 31, 2023 | 211,846 | (2) | — | 203,627 | 2026 | |||||||||||
Total | $ | 650,278 | $ | — | $ | 619,209 | ||||||||||
Penn Capital Special Situations Small Cap Equity Fund | ||||||||||||||||
June 30, 2021 | $ | 222,981 | $ | — | $ | 222,981 | 2024 | |||||||||
August 31, 2021(1) | 17,080 | — | 17,080 | 2024 | ||||||||||||
August 31, 2022 | 80,812 | — | 80,812 | 2025 | ||||||||||||
August 31, 2023 | 119,334 | — | 119,334 | 2026 | ||||||||||||
Total | $ | 440,207 | $ | — | $ | 440,207 | ||||||||||
(1) | Period from July 1, 2021 through August 31, 2021. |
(2) | Includes fees waived that are not subject to potential recoupment. |
Distribution Agreement
Foreside Fund Services, LLC is the Trust’s distributor and principal underwriter (the “Distributor”).
Agreements with the Administrator, Transfer Agent, and Custodian
U.S. Bancorp Fund Services, LLC (“Fund Services”), doing business as U.S. Bank Global Fund Services, serves as the Funds’ administrator. For providing administrative and accounting services, Fund Services is entitled to receive a monthly fee, subject to certain minimum and out of pocket expenses.
41
THE RBB FUND TRUST
Notes to the Financial Statements
AUGUST 31, 2023
Fund Services serves as the Funds’ transfer and dividend disbursing agent. For providing transfer agent services, Fund Services is entitled to receive a monthly fee, subject to certain minimum and out of pocket expenses.
U.S. Bank, N.A. (the “Custodian”) provides certain custodial services to the Funds. The Custodian is entitled to receive a monthly fee, subject to certain minimum and out of pocket expenses.
Shareholder Servicing Plan
The Trust has adopted a Shareholder Servicing Plan on behalf of each Fund’s Institutional Class. Under the plan, each Class can pay for non-distribution related shareholder support services (‘‘service fees’’) in an amount up to 0.15% of its average daily net assets. The amount actually incurred by the Institutional Class shares for the current fiscal period on an annualized basis was 0.04% for the Penn Capital Mid Cap Core Fund, 0.02% for the Penn Capital Opportunistic High Income Fund, 0.09% for the Penn Capital Short Duration High Income Fund and 0.08% for the Penn Capital Special Situations Small Cap Equity Fund.
Other Related Party Transactions
The Advisor and its affiliates have made investments in the Funds and accordingly, as shareholders of the Funds, pay a proportionate share of the Funds’ investment advisory fees and other expenses identified in the Funds’ Prospectus.
4. Federal Tax Information
It is each Fund’s intention to continue to qualify as a regulated investment company under Subchapter M of the Internal Revenue Code and distribute all of its taxable income. Accordingly, no provision for federal income taxes is required in the financial statements.
The amount and character of income and capital gain distributions to be paid, if any, are determined in accordance with federal income tax regulations, which may differ from GAAP. These differences are primarily due to differences in the timing of recognition of gains or losses on investments. Permanent book and tax basis differences, if any, may result in reclassifications to distributable earnings and additional paid-in capital.
The following information is provided on a tax basis as of August 31, 2023:
Penn Capital | Penn Capital | Penn Capital | Penn Capital | |||||||||||||
Cost of investments | $ | 11,434,823 | $ | 25,972,439 | $ | 31,600,606 | $ | 41,113,399 | ||||||||
Gross unrealized appreciation | 2,477,664 | 263,944 | 87,187 | 3,991,015 | ||||||||||||
Gross unrealized (depreciation) | (613,939 | ) | (1,065,299 | ) | (564,274 | ) | (3,495,962 | ) | ||||||||
Net unrealized appreciation (depreciation) | 1,863,725 | (801,355 | ) | (477,087 | ) | 495,053 | ||||||||||
Undistributed ordinary income | 42,112 | 7,003 | 4,533 | 111,188 | ||||||||||||
Undistributed long-term capital gains | 1,294,665 | — | — | 105,784 | ||||||||||||
Total distributable earnings | 1,336,777 | 7,003 | 4,533 | 216,972 | ||||||||||||
Other accumulated losses | — | (2,230,982 | ) | (2,617,307 | ) | — | ||||||||||
Total accumulated earnings (losses) | $ | 3,200,502 | $ | (3,025,334 | ) | $ | (3,089,861 | ) | $ | 712,025 | ||||||
42
THE RBB FUND TRUST
Notes to the Financial Statements
AUGUST 31, 2023
Net investment income and net realized gains and losses for federal income tax purposes may differ from that reported on the financial statements because of permanent book-to-tax differences. GAAP requires that permanent differences between financial reporting and tax reporting be reclassified between various components of net assets.
These differences are primarily due to net operating losses. On the Statement of Assets and Liabilities, the following adjustments were made:
Distributable | Paid-In Capital | |||||||
Penn Capital Special Situations Small Cap Equity Fund | $ | (469 | ) | $ | 469 | |||
The Funds intend to utilize capital loss carryforwards to offset future realized gains. Capital loss carryforwards available for federal income tax purposes are as follows:
Capital Loss | Short-Term | Long-Term | ||||||||||
Penn Capital Opportunistic High Income Fund | unlimited | $ | 846,907 | $ | 1,384,075 | |||||||
Penn Capital Short Duration High Income Fund | unlimited | 1,955,605 | 661,261 | |||||||||
A regulated investment company may elect for any taxable year to treat any portion of the qualified late year loss as arising on the first day of the next taxable year. Qualified late year losses are certain capital and ordinary losses which occur during the portion of the taxable year subsequent to October 31 and December 31, respectively. For the fiscal period ended August 31, 2023, there were no deferred Post October Losses to report.
The character of distributions for tax purposes paid during the fiscal period ended August 31, 2023, is as follows:
Ordinary | Long-Term | |||||||
Penn Capital Mid Cap Core Fund | $ | 16,811 | $ | 46,920 | ||||
Penn Capital Opportunistic High Income Fund | 1,429,097 | — | ||||||
Penn Capital Short Duration High Income Fund | 1,405,413 | — | ||||||
Penn Capital Special Situations Small Cap Equity Fund | — | 277,739 | ||||||
The character of distributions for tax purposes paid during the fiscal period ended August 31, 2022, is as follows:
Ordinary | Long-Term | |||||||
Penn Capital Mid Cap Core Fund | $ | 162,152 | $ | 1,840,497 | ||||
Penn Capital Opportunistic High Income Fund | 943,646 | — | ||||||
Penn Capital Short Duration High Income Fund | 1,192,175 | — | ||||||
Penn Capital Special Situations Small Cap Equity Fund | 1,940,765 | 1,412,060 | ||||||
43
THE RBB FUND TRUST
Notes to the Financial Statements
AUGUST 31, 2023
5. Trustee and Officer Compensation
The Trustees of the Trust receive an annual retainer and meeting fees for meetings attended. An employee of Vigilant-Compliance, LLC serves as Chief Compliance Officer of the Trust. Vigilant Compliance, LLC is compensated for the services provided to the Trust. Employees of the Trust serve as President, Chief Financial Officer, Chief Operating Officer, Secretary and Director of Marketing & Business Development of the Trust. They are compensated by the Trust for services provided. Certain employees of U.S. Bancorp Fund Services, LLC serve as officers of the Trust. They are not compensated by the Funds or the Trust. For Trustee and Officer compensation amounts, please refer to the Statement of Operations.
6. Investment Transactions
The cost of security purchases and the proceeds from security sales, other than short-term investments, for the period ended August 31, 2023, were as follows:
Non-U.S. Government | U.S. Government | |||||||||||||||
Purchases | Sales | Purchases | Sales | |||||||||||||
Penn Capital Mid Cap Core Fund | $ | 11,787,264 | $ | 11,704,561 | $ | — | $ | — | ||||||||
Penn Capital Opportunistic High Income Fund | 20,471,215 | 13,181,419 | — | — | ||||||||||||
Penn Capital Short Duration High Income Fund | 20,014,854 | 21,886,490 | — | — | ||||||||||||
Penn Capital Special Situations Small Cap Equity Fund | 39,022,781 | 13,707,087 | — | — | ||||||||||||
7. Capital Share Transactions
Penn Capital | Penn Capital | Penn Capital | Penn Capital | |||||||||||||
Institutional Class Shares | ||||||||||||||||
Shares sold | 22,943 | 1,137,429 | 876,942 | 1,867,211 | ||||||||||||
Shares issued in reinvestment of dividends | 3,919 | 138,065 | 136,348 | 18,577 | ||||||||||||
Shares redeemed | (48,414 | ) | (359,951 | ) | (1,349,025 | ) | (157,754 | ) | ||||||||
Net increase (decrease) | (21,552 | ) | 915,543 | (335,735 | ) | 1,728,034 | ||||||||||
44
THE RBB FUND TRUST
Notes to the Financial Statements
AUGUST 31, 2023
8. Transactions with Affiliates
The following issuers are affiliated with the Funds; that is, the Adviser had control of 5% or more of the outstanding voting securities during the period from September 1, 2022 through August 31, 2023. As defined in Section (2)(a)(3) of the Investment Company Act of 1940; such issuers are:
September 1, 2022 | Additions | Reductions | ||||||||||||||||||||||
Issuer Name | Share | Cost | Share | Cost | Share | Cost | ||||||||||||||||||
Penn Capital Opportunistic High Income Fund | ||||||||||||||||||||||||
Penn Capital Floating Rate Income Fund | 158,977 | $ | 1,539,143 | 6,191 | $ | 56,573 | (165,168 | ) | $ | (1,595,716 | ) | |||||||||||||
| $ | 1,539,143 | $ | 56,573 | $ | (1,595,716 | ) | ||||||||||||||||||
Penn Capital Short Duration High Income Fund | ||||||||||||||||||||||||
Penn Capital Floating Rate Income Fund | 277,659 | $ | 2,714,060 | 10,813 | $ | 98,807 | (288,472 | ) | $ | (2,812,867 | ) | |||||||||||||
| $ | 2,714,060 | $ | 98,807 | $ | (2,812,867 | ) | ||||||||||||||||||
August 31, 2023 | August 31, 2023 | |||||||||||||||||||||||||||
Issuer Name | Share | Dividend | Long Term/ | Unrealized | Realized | Value | Cost | |||||||||||||||||||||
Penn Capital Opportunistic High Income Fund | ||||||||||||||||||||||||||||
Penn Capital Floating Rate Income Fund | — | $ | 48,433 | $ | — | $ | 78,147 | $ | (71,087 | ) | $ | — | $ | — | ||||||||||||||
| $ | 48,433 | $ | — | $ | 78,147 | $ | (71,087 | ) | $ | — | $ | — | ||||||||||||||||
Penn Capital Short Duration High Income Fund | ||||||||||||||||||||||||||||
Penn Capital Floating Rate Income Fund | — | $ | 84,590 | $ | — | $ | 162,371 | $ | (150,041 | ) | $ | — | $ | — | ||||||||||||||
| $ | 84,590 | $ | — | $ | 162,371 | $ | (150,041 | ) | $ | — | $ | — | ||||||||||||||||
45
THE RBB FUND TRUST
Notes to the Financial Statements
AUGUST 31, 2023
9. Credit Risk, LIBOR and Asset Concentration
Small- and mid-capitalization companies may not have the size, resources and other assets of large capitalization companies. As a result, the securities of small- and mid-capitalization companies may be subject to greater market risks and fluctuations in value than large capitalization companies or may not correspond to changes in the stock market in general. In addition, small- and mid-capitalization companies may be particularly affected by interest rate increases, as they may find it more difficult to borrow money to continue or expand operations, or may have difficulty in repaying any loans.
High yield securities and unrated securities of similar credit quality have speculative characteristics and involve greater volatility of price and yield, greater of liquidity risk, and generally reflect a greater possibility of an adverse change in financial condition that could affect an issuer’s ability to honor its obligations.
There are a number of risks associated with an investment in bank loans, including credit risk, interest rate risk, liquidity risk and prepayment risk. Lack of an active trading market, restrictions on resale, irregular trading activity, wide bid/ask spreads and extended trade settlement periods may impair the Fund’s ability to sell bank loans within its desired time frame or at an acceptable price and its ability to accurately value existing and prospective investments. Extended trade settlement periods may result in cash not being immediately available to the Fund. As a result of such illiquidity, the Fund may have to sell other investments or engage in borrowing transactions to raise cash to meet its obligations.
A Fund may invest in certain instruments that rely in some fashion upon London Interbank Offered Rate (“LIBOR”). LIBOR is an average interest rate, determined by the ICE Benchmark Administration, that banks charge one another for the use of short-term money. The United Kingdom’s Financial Conduct Authority, which regulates LIBOR, announced plans to phase out the use of LIBOR by the end of 2021. The FCA and ICE Benchmark Administrator have since announced that most LIBOR settings will no longer be published after December 31, 2021 and a majority of U.S. dollar LIBOR settings will cease publication after June 30, 2023. The U.S. Federal Reserve, based on the recommendations of the New York Federal Reserve’s Alternative Reference Rate Committee (comprised of major derivative market participants and their regulators), has begun publishing SOFR that is intended to replace U.S. dollar LIBOR. Proposals for alternative reference rates for other currencies have also been announced or have already begun publication. Uncertainty related to the liquidity impact of the change in rates, and how to appropriately adjust these rates at the time of transition, poses risks for the Funds. The effect of any changes to, or discontinuation of, LIBOR on the Funds will depend on, among other things, (1) existing fallback or termination provisions in individual contracts and (2) whether, how, and when industry participants develop and adopt new reference rates and fallbacks for both legacy and new instruments and contracts. The expected discontinuation of LIBOR could have a significant impact on the financial markets in general and may also present heightened risk to market participants, including public companies, investment advisers, investment companies, and broker-dealers. The risks associated with this discontinuation and transition will be exacerbated if the work necessary to effect an orderly transition to an alternative reference rate is not completed in a timely manner. Accordingly, it is difficult to predict the full impact of the transition away from LIBOR on the Funds until new reference rates and fallbacks for both legacy and new instruments and contracts are commercially accepted and market practices become settled.
10. Line of Credit
The Funds have a $10,000,000 uncommitted, unsecured, umbrella 365-day line of credit, for temporary purposes, including to meet redemption requests. The interest rate as of August 31, 2023 was 8.50%. During the current fiscal period, the Penn Capital Mid Cap Core Fund, the Penn Capital Opportunistic High Income Fund, and the Penn Capital Short Duration High Income Fund did not use the credit line.
During the current fiscal period, line of credit activity for the Penn Capital Special Situations Small Cap Equity Fund was as follows:
Fund | Average | Amount | Interest | Maximum | Average | |||||||||||||||
Penn Capital Special Situations Small Cap Equity Fund | $ | 1,129 | $ | — | $ | 88 | $ | 226,000 | 7.66 | % | ||||||||||
46
THE RBB FUND TRUST
Notes to the Financial Statements
AUGUST 31, 2023
11. Recent Accounting Pronouncements and Regulatory Updates
In June 2022, the FASB issued Accounting Standards Update 2022-03, which amends Fair Value Measurement (Topic 820): Fair Value Measurement of Equity Securities Subject to Contractual Sale Restrictions (“ASU 2022-03”). ASU 2022-03 clarifies guidance for fair value measurement of an equity security subject to a contractual sale restriction and establishes new disclosure requirements for such equity securities. ASU 2022-03 is effective for fiscal years beginning after December 25, 2023 and for interim periods within those fiscal years, with early adoption permitted. Management is currently evaluating the impact of these amendments on the financial statements.
In October 2022, the SEC adopted a final rule relating to tailored shareholder reports for mutual funds and exchange-traded funds and fee information in investment company advertisements. The rule and form amendments will, among other things, require the Funds to transmit concise and visually engaging shareholder reports that highlight key information. The amendments will require that funds tag information in a structured data format and that certain more in-depth information be made available online and available for delivery free of charge to investors on request. The amendments became effective January 24, 2023. There is an 18-month transition period after the effective date of the amendments until the Funds are required to comply.
In December 2022, the FASB issued an Accounting Standards Update, ASU 2022-06, Reference Rate Reform (Topic 848) – Deferral of the Sunset Date of Topic 848 (“ASU 2022-06”). ASU 2022-06 is an amendment to ASU 2020-04, which provided optional guidance to ease the potential accounting burden due to the discontinuation of the London Inter-Bank Offered Rate and other interbank-offered based reference rates and which was effective as of March 12, 2020 through December 31, 2022. ASU 2022-06 extends the effective period through December 31, 2024. Management is currently evaluating the impact, if any, of applying ASU 2022-06.
12. Concentration Risks
The Advisor and its employees collectively have beneficial ownership, either directly or indirectly, of more than 20% of each of the Funds as of August 31, 2023. In addition to the Advisor, one or more individual investors own more than 10% of the Penn Capital Mid Cap Core Fund, the Penn Capital Opportunistic High Income Fund, the Penn Capital Short Duration High Income Fund, the Penn Capital Special Situations Small Cap Equity Fund as of August 31, 2023. To the extent multiple investors in the Funds rely on the advice of a common investment advisor the Funds may have the risk of a concentrated investor base.
13. Unfunded Commitments
The Funds may enter into unfunded loan commitments. Unfunded loan commitments may be partially or wholly funded. During the contractual period, the Funds are obliged to provide funding to the borrower upon demand. Unfunded loan commitments are fair valued in accordance with the valuation policy described in Note 2(a) and unrealized appreciation or depreciation, if any, is recorded on the Statements of Assets and Liabilities. As of August 31, 2023, there were no unfunded commitments to report.
14. Subsequent Events
Management has evaluated the impact of all subsequent events on the Funds through the date the financial statements were issued and has determined that there were no significant events requiring recognition or disclosure in the financial statements.
47
THE RBB FUND TRUST
Additional Information
AUGUST 31, 2023 (UNAUDITED)
Shareholder Notification of Federal Tax Status
For the fiscal period ended August 31, 2023, certain dividends paid by the Funds may be reported as qualified dividend income and may be eligible for taxation at capital gain rates. The percentage of dividends declared from ordinary income designated as qualified dividend income was as follows:
Penn Capital Mid Cap Core Fund. | 100.00% |
Penn Capital Opportunistic High Income Fund | 0.00% |
Penn Capital Short Duration High Income Fund | 0.00% |
Penn Capital Special Situations Small Cap Equity Fund | 0.00% |
For corporate shareholders, the percentage of ordinary income distributions qualifying for the corporate dividends received deduction for the fiscal period ended August 31, 2023 was as follows:
Penn Capital Mid Cap Core Fund | 100.00% |
Penn Capital Opportunistic High Income Fund | 0.00% |
Penn Capital Short Duration High Income Fund | 0.00% |
Penn Capital Special Situations Small Cap Equity Fund. | 0.00% |
The percentage of taxable ordinary income distributions designated as short-term capital gain distributions under Internal Revenue Section 871(k)(2)(c) for the fiscal period ended August 31, 2023 was as follows:
Penn Capital Mid Cap Core Fund | 0.00% |
Penn Capital Opportunistic High Income Fund | 0.00% |
Penn Capital Short Duration High Income Fund | 0.00% |
Penn Capital Special Situations Small Cap Equity Fund. | 0.00% |
Proxy Voting Policies
A description of the policies and procedures that each Fund uses to determine how to vote proxies relating to portfolio securities owned by that Fund is available: (1) without charge, upon request, by calling 844-302-7366; (2) in the Statement of Additional Information on the Trust’s website www.penncapitalfunds.com; and (3) on the SEC’s website at www.sec.gov. Information about how the Funds voted proxies relating to portfolio securities during the most recent 12 month period ended June 30 may be obtained (1) without charge, upon request, by calling 844-302-7366 and (2) on the SEC’s website at www.sec.gov.
Form N-PORT
Each Fund will file its complete schedule of portfolio holdings with the SEC for the first and third quarters of each fiscal year on Part F of Form N-PORT. The Funds’ Part F of Form N-PORT will be available on the EDGAR database on the SEC’s website at www.sec.gov.
Householding
In an effort to decrease costs, the Funds intend to reduce the number of duplicate prospectuses, annual and semi-annual reports, proxy statements and other similar documents you receive by sending only one copy of each to those addresses shared by two or more accounts and to shareholders that the transfer agent reasonably believes are from the same family or household. Once implemented, if you would like to discontinue householding for your accounts, please call (844) 302-7366 to request individual copies of these documents. The transfer agent will begin sending individual copies thirty days after receiving your request to stop householding. This policy does not apply to account statements.
48
THE RBB FUND TRUST
Additional Information
AUGUST 31, 2023 (UNAUDITED)
Approval of Investment Advisory Agreement
As required by the 1940 Act, the Board, including all of the Trustees who are not “interested persons” of the Trust, as that term is defined in the 1940 Act (the “Independent Trustees”), considered the renewal of the investment advisory agreement between Penn Capital and the Trust (the “Investment Advisory Agreement”) on behalf of the Penn Capital Short Duration High Income Fund, Penn Capital Opportunistic High Income Fund, Penn Capital Mid Cap Core Fund, and Penn Capital Special Situations Small Cap Equity Fund (for this section only, each a “Fund” and collectively the “Funds”), at a meeting of the Board held on May 16-17, 2023 (the “Meeting”). At the Meeting, the Board, including all of the Independent Trustees, approved the Investment Advisory Agreement for an additional one-year term. The Board’s decision to approve the Investment Advisory Agreement reflects the exercise of its business judgment to continue the existing arrangement. In approving the Investment Advisory Agreement, the Board considered information provided by Penn Capital with the assistance and advice of counsel to the Independent Trustees and the Trust.
In considering the renewal and approval of the Investment Advisory Agreement between the Trust and Penn Capital, with respect to the Funds, the Trustees took into account all the materials provided prior to and during the Meeting and at other meetings throughout the past year, the presentations made during the Meeting, and the discussions held during the Meeting. The Trustees reviewed these materials with management of Penn Capital, and discussed the Investment Advisory Agreement with counsel in executive sessions, at which no representatives of Penn Capital were present. Among other things, the Trustees considered (i) the nature, extent, and quality of Penn Capital’s services provided to the Funds; (ii) descriptions of the experience and qualifications of Penn Capital personnel providing those services; (iii) Penn Capital’s investment philosophies and processes; (iv) Penn Capital’s assets under management and client descriptions; (v) Penn Capital’s soft dollar commission and trade allocation policies, including information on the types of research and services obtained in connection with soft dollar commissions; (vi) Penn Capital’s current advisory fee arrangements with the Trust and other similarly managed clients; (vii) Penn Capital’s compliance procedures; (viii) Penn Capital’s financial information, insurance coverage and profitability analysis related to providing advisory services to the Funds; (ix) the extent to which economies of scale are relevant to the Funds; (x) a report prepared by FUSE comparing each Fund’s management fees and total expense ratios to a group of mutual funds deemed comparable to each Fund based primarily on investment strategy similarity (“Peer Group”) and comparing the performance of each Fund to the performance of its Peer Group; and (xi) a report comparing the performance of each Fund to the performance of its benchmark.
As part of their review, the Trustees considered the nature, extent and quality of the services provided by Penn Capital. The Trustees concluded that Penn Capital had substantial resources to provide services to the Funds and that Penn Capital’s services had been acceptable.
The Trustees also considered the investment performance of the Funds. Information on the Funds’ investment performance was provided for the three-month, one-year, three-year, five-year, and since inception periods ended March 31, 2023, as applicable. The Trustees considered the Funds’ investment performance in light of their respective investment objectives and investment strategies. The Trustees concluded that the investment performance of each of the Funds as compared to their respective benchmarks and Peer Groups was acceptable.
In reaching this conclusion, the Trustees noted that the Penn Capital Short Duration High Income Fund outperformed its primary benchmark, the ICE BofA 1-3 Year BB US Cash Pay High Yield Index, for the three-month, and the one-year periods ended March 31, 2023, and underperformed its benchmark for the three-year, five-year, and since-inception periods ended March 31, 2023. The Trustees noted that the Penn Capital Short Duration High Income Fund outperformed the performance of the median of its Peer Group for the one-year period ended December 31, 2022, and underperformed the median of its Peer Group for the three-month, three-year, five-year, and since-inception periods ended December 31, 2022.
The Trustees noted that the Penn Capital Opportunistic High Income Fund outperformed its primary benchmark, the ICE BofA High Yield Constrained Index, for the three-year period ended March 31, 2023, and underperformed its benchmark for the three-month, one-year, five-year, and since-inception periods ended March 31, 2023. The Trustees noted that the Penn Capital Opportunistic High Income Fund outperformed the median of its Peer Group for the three-month period ended December 31, 2022, and underperformed the median of its Peer Group for the one-year, three-year, five-year, and since-inception periods ended December 31, 2022.
49
THE RBB FUND TRUST
Additional Information
AUGUST 31, 2023 (UNAUDITED)
The Trustees noted that the Penn Capital Mid Cap Core Fund outperformed its primary benchmark, the Bloomberg US 2500 Index, for the three-month period ended March 31, 2023, and underperformed its benchmark for the one-year, three-year, five-year, and since-inception periods ended March 31, 2023. The Trustees noted that the Penn Capital Mid Cap Core Fund underperformed the median of its Peer Group for the three-month, one-year, three-year, five-year, and since-inception periods ended December 31, 2022.
Finally, the Trustees noted that the Penn Capital Special Situations Small Cap Equity Fund outperformed its primary benchmark, the Bloomberg US 2000 Index, for the three-month, three-year, five-year, and since-inception periods ended March 31, 2023, and underperformed its primary benchmark for the one-year period ended March 31, 2023. The Trustees noted that the Penn Capital Special Situations Small Cap Equity Fund outperformed the median of its Peer Group for the three-month, three-year, five-year, and since-inception periods ended December 31, 2022, and underperformed the median of its Peer Group for the one-year period ended December 31, 2022.
The Board also considered the advisory fee rates payable by the Funds under the Investment Advisory Agreement. In this regard, information on the fees paid by the Funds and the Funds’ total operating expense ratios (before and after fee waivers and expense reimbursements) were compared to similar information for mutual funds advised by other, unaffiliated investment advisory firms. The Trustees noted that Penn Capital had contractually agreed to waive management fees and reimburse expenses through at least December 31, 2023 for the Funds to limit total annual operating expenses to agreed upon levels for each Fund.
The Trustees noted that both the net advisory fee and the total net expenses of the Penn Capital Short Duration High Income Fund ranked below the median and in the 1st quintile of its Peer Group.
The Trustees noted that the Penn Capital Opportunistic High Income Fund’s net advisory fee was below the median of its Peer Group and ranked in the 1st quintile of its Peer Group, and its total net expenses equaled the median of its Peer Group and ranked in the 3rd quintile of its Peer Group.
The Trustees noted that the Penn Capital Mid Cap Core Fund’s net advisory fee was below the median of its Peer Group and ranked in the 3rd quintile of its Peer Group, and its total net expenses was above the median of its Peer Group and ranked in the 5th quintile of its Peer Group.
The Trustees noted that the Penn Capital Special Situations Small Cap Equity Fund’s net advisory fee was below the median of its Peer Group and ranked in the 1st quintile of its Peer Group, and its total net expenses was above the median of its Peer Group and ranked in the 4th quintile of its Peer Group.
After reviewing the information regarding the Funds’ costs, profitability and economies of scale, and after considering Penn Capital’s services, the Trustees concluded that the investment advisory fees to be paid by the Funds were fair and reasonable and that the Investment Advisory Agreement should be approved and continued for an additional one-year period ending August 16, 2024.
Liquidity Risk Management Program
The Trust has adopted and implemented a Liquidity Risk Management Program (the “Trust Program”) as required by rule 22e-4 under the 1940 Act. In accordance with the Trust Program, the Adviser has adopted and implemented a liquidity risk management program (the “Adviser Program” and together with the Trust Program, the “Programs”) on behalf of the Funds. The Programs seek to assess, manage and review each Fund’s Liquidity Risk. “Liquidity Risk” is defined as the risk that a Fund could not meet requests to redeem shares issued by the Fund without significant dilution of remaining investors’ interest in the Fund.
The Board has appointed Vigilant Compliance, LLC (“Vigilant”) as the program administrator for the Trust Program and Liquidity Risk Management Committee of the Adviser as the program administrator for the Adviser Program. The process of monitoring and determining the liquidity of each Fund’s investments is supported by one or more third-party vendors.
At meetings held during the current fiscal period, the Board and its Regulatory Oversight Committee received and reviewed a written report (the “Report”) of Vigilant and the Adviser concerning the operation of the Programs for the period from January 1, 2022 to December 31, 2022 (the “Period”). The Report summarized the operation of the Programs and the information and factors considered by Vigilant and the Adviser in reviewing the adequacy and effectiveness of the implementation of the Programs with respect to each Fund. Such information and factors included, among other things: (i) the methodology used to classify the liquidity of each Fund’s portfolio investments and the Adviser’s assessment that each Fund’s strategy remained appropriate for an open-end
50
THE RBB FUND TRUST
Additional Information
AUGUST 31, 2023 (UNAUDITED)
mutual fund; (ii) analyses of each Fund’s trading environment and reasonably anticipated trading size; (iii) that each Fund held primarily highly liquid assets (investments that the Fund anticipates can be converted to cash within 3 business days or less in current market conditions without significantly changing their market value); (iv) that the Funds did not require the establishment of a highly liquid investment minimum and the methodology for that determination; (v) confirmation that the Funds did not breach the 15% maximum illiquid security threshold (investments that cannot be sold or disposed of in seven days or less in current market conditions without the sale of the investment significantly changing the market value of the investment) during the Period and the procedures for monitoring compliance with the limit; (vi) that the processes, technologies and third-party vendors used to assess, manage, and/or periodically review each Fund’s Liquidity Risk functioned appropriately during the Period; and (vii) that the Programs operated adequately during the Period. The Report also indicated that there were no material changes made to the Programs during the Period.
Based on the review, the Report concluded that the Programs were being implemented effectively and reasonably designed to assess and manage Liquidity Risk in each Fund’s portfolio.
There can be no assurance that the Trust Program or the Adviser Program will achieve its objectives under all circumstances in the future.
Please refer to the Funds’ prospectus for more information regarding a Fund’s exposure to liquidity risk and other risks to which it may be subject.
51
THE RBB FUND TRUST
Report of Independent Registered Public Accounting Firm
To the Shareholders and Trustees of
The RBB Fund Trust
Opinion on the Financial Statements
We have audited the accompanying statements of assets and liabilities of the Penn Capital Mid Cap Core Fund, the Penn Capital Opportunistic High Income Fund, the Penn Capital Short Duration High Income Fund, and the Penn Capital Special Situations Small Cap Equity Fund (the “Funds”), each a series of The RBB Fund Trust (the “Trust”), including the schedules of investments, as of August 31, 2023, the related statements of operations for the year then ended, the statements of changes in net assets for each of the two years in the period then ended, financial highlights for each of the two years in the period then ended, for the two month period ended August 31, 2021, and for the year ended June 30, 2021, and the related notes (collectively referred to as the “financial statements”). In our opinion, the financial statements present fairly, in all material respects, the financial position of the Funds as of August 31, 2023, the results of their operations for the year then ended, the changes in their net assets for each of the two years in the period then ended, and their financial highlights for each of the two years in the period then ended, the two month period ended August 31, 2021 and for the year ended June 30, 2021, in conformity with accounting principles generally accepted in the United States of America.
The financial highlights of the Funds, for each of the two years in the period ended June 30, 2020, were audited by other auditors, whose report dated August 28, 2020 expressed unqualified opinions on those financial highlights.
Basis for Opinion
These financial statements are the responsibility of the Funds’ management. Our responsibility is to express an opinion on the Funds’ financial statements based on our audits. We are a public accounting firm registered with the Public Company Accounting Oversight Board (United States) (“PCAOB”) and are required to be independent with respect to the Funds in accordance with the U.S. federal securities laws and the applicable rules and regulations of the Securities and Exchange Commission and the PCAOB. We have served as the auditor of one or more of the funds in the Trust since 2021.
We conducted our audits in accordance with the standards of the PCAOB. Those standards require that we plan and perform the audits to obtain reasonable assurance about whether the financial statements are free of material misstatement, whether due to error or fraud. The Funds are not required to have, nor were we engaged to perform, an audit of the Funds’ internal control over financial reporting. As part of our audits we are required to obtain an understanding of internal control over financial reporting, but not for the purpose of expressing an opinion on the effectiveness of the Funds’ internal control over financial reporting. Accordingly, we express no such opinion.
Our audits included performing procedures to assess the risks of material misstatement of the financial statements, whether due to error or fraud, and performing procedures that respond to those risks. Such procedures included examining, on a test basis, evidence regarding the amounts and disclosures in the financial statements. Our audits also included evaluating the accounting principles used and significant estimates made by management, as well as evaluating the overall presentation of the financial statements. Our procedures included confirmation of securities owned as of August 31, 2023 by correspondence with the custodian and brokers; when replies were not received from brokers, we performed other auditing procedures. We believe that our audits provide a reasonable basis for our opinion.

TAIT, WELLER & BAKER LLP
Philadelphia, Pennsylvania
October 30, 2023
52
THE RBB FUND TRUST
Trustees and Officers (UNAUDITED)
The business and affairs of the Trust are managed under the direction of the Trust’s Board. The Trustees and executive officers of the Trust, their ages, business addresses and principal occupations during the past five years are set forth below.
Name, Address and Age | Position(s) | Term of | Principal Occupations | Other Directorships | Number of |
Independent Trustees | |||||
Julian A. Brodsky | Trustee | June 2021 to present | Retired. | AMDOCS Limited (service provider to telecommunications companies). | 63 |
Gregory P. Chandler | Trustee | June 2021 to present | Since 2020, Chief Financial Officer, HC Parent Corp. d/b/a Herspiegel Consulting LLC (life sciences consulting services); 2020, Chief Financial Officer, Avocado Systems Inc. (cyber security software provider); from 2009 - 2020, Chief Financial Officer, Emtec, Inc. (information technology consulting/services). | FS Energy and Power Fund (business development company); Wilmington Funds (12 portfolios) (registered investment company); Emtec, Inc. (until December 2019); FS Investment Corporation (business development company) (until December 2018). | 63 |
Lisa A. Dolly Age: 57 | Director | October 2021 to present | From July 2019-December 2019, Chairman, Pershing LLC (broker dealer, clearing and custody firm); January 2016-June 2019, Chief Executive Officer, Pershing, LLC. | Allfunds Group PLC (United Kingdom wealthtech and fund distribution provider); Securities Industry and Financial Markets Association (trade association for broker dealers, investment banks and asset managers); Hightower Advisors (wealth management firm). | 63 |
53
THE RBB FUND TRUST
Trustees and Officers (UNAUDITED)
Name, Address and Age | Position(s) | Term of | Principal Occupations | Other Directorships | Number of |
Independent Trustees (continued) | |||||
Nicholas A. Giordano | Trustee | June 2021 to present | Since 1997, Consultant, financial services organizations. | IntriCon Corporation (biomedical device manufacturer); Wilmington Funds (12 portfolios) (registered investment company); Independence Blue Cross (healthcare insurance) (until March 2021). | 63 |
Arnold M. Reichman | Trustee | June 2021 to present | Retired. | EIP Investment Trust (registered investment company) (until August 2022). | 63 |
Brian T. Shea | Trustee | June 2021 to present | From 2014-2017, Chief Executive Officer, BNY Mellon Investment Services (fund services, global custodian and securities clearing firm); from 1983- 2014, Chief Executive Officer and various positions, Pershing LLC (broker dealer, clearing and custody firm). | Fidelity National Information Services, Inc. (financial services technology company); Ameriprise Financial, Inc. (financial services company); WisdomTree Investments, Inc. (asset management company) (until March 2019). | 63 |
Robert A. Straniere | Trustee | June 2021 to present | Since 2009, Administrative Law Judge, New York City; since 1980, Founding Partner, Straniere Law Group (law firm). | None. | 63 |
Interested Trustee2 | |||||
Robert Sablowsky | Trustee | June 2021 to present | Since 2002, Senior Director – Investments and, prior thereto, Executive Vice President, of Oppenheimer & Co., Inc. (a registered broker-dealer). | None. | 63 |
54
THE RBB FUND TRUST
Trustees and Officers (UNAUDITED)
Name, Address and Age | Position(s) | Term of | Principal Occupations | Other Directorships | Number of |
Officers | |||||
Steven Plump 615 East Michigan Street Milwaukee, WI 53202 Age: 64 | President | August 2022 to present | From 2011 to 2021, Executive Vice President, PIMCO LLC. | N/A | N/A |
Salvatore Faia, JD, CPA, CFE Vigilant Compliance, LLC Age: 60 | Chief Compliance Officer | June 2021 to present | Since 2021, Chief Compliance Officer of The RBB Fund Trust (formerly, Penn Capital Funds Trust); Since 2004, President, Vigilant Compliance, LLC (investment management services company); since 2005, Independent Trustee of EIP Investment Trust (registered investment company); Since 2004, Chief Compliance Officer of the RBB Fund, Inc.; President of The RBB Fund, Inc. from 2009 to 2022; President of The RBB Fund Trust from 2021 to 2022. | N/A | N/A |
James G. Shaw | Chief Financial Officer and Secretary
Chief Operating Officer | June 2021 to present
August 2022 to present | Chief Financial Officer and Secretary of The RBB Fund, Inc. (since 2016); Chief Operating Officer of The RBB Fund, Inc. (since 2022). | N/A | N/A |
Craig A. Urciuoli | Director of Marketing & Business Development | June 2021 to present | Director of Marketing & Business Development of The RBB Fund, Inc. (since 2019) and The RBB Fund Trust (formerly, Penn Capital Funds Trust) (since 2021); from 2000-2019, Managing Director, Third Avenue Management LLC (investment advisory firm). | N/A | N/A |
55
THE RBB FUND TRUST
Trustees and Officers (UNAUDITED)
Name, Address and Age | Position(s) | Term of | Principal Occupations | Other Directorships | Number of |
Officers (continued) | |||||
Jennifer Witt Milwaukee, WI 53202 Age: 40 | Assistant Treasurer | June 2021 to present | Since 2020, Vice President, U.S. Bank Global Fund Services (fund administrative services firm); from 2016 to 2020, Assistant Vice President, U.S. Bank Global Fund Services. | N/A | N/A |
Edward Paz 615 East Michigan Street Milwaukee, WI 53202 Age: 52 | Assistant Secretary | June 2021 to present | Since 2007, Vice President and Counsel, U.S. Bancorp Fund Services, LLC (fund administrative services firm). | N/A | N/A |
Michael P. Malloy One Logan Square Ste. 2000 Philadelphia, PA 19103 Age: 64 | Assistant Secretary | June 2021 to present | Since 1993, Partner, Faegre Drinker Biddle & Reath LLP (law firm). | N/A | N/A |
Jillian L. Bosmann One Logan Square Ste. 2000 Philadelphia, PA 19103 Age: 44 | Assistant Secretary | June 2021 to present | Since 2017, Partner, Faegre Drinker Biddle & Reath LLP (law firm). | N/A | N/A |
* | Each Trustee oversees 63 portfolios of the fund complex, consisting of the series in the Trust and the RBB Fund, Inc. (53 portfolios). |
1 | Subject to the Trust’s Retirement Policy, each Trustee may continue to serve as a Trustee until the last day of the calendar year in which the applicable Trustee attains age 75 or until his or her successor is elected and qualified or his or her death, resignation or removal. The Board reserves the right to waive the requirements of the Policy with respect to an individual Trustee. The Board has approved waivers of the policy with respect to Messrs. Brodsky, Carnall, Giordano, Sablowsky and Straniere. Each officer holds office at the pleasure of the Board until the next special meeting of the Trust or until his or her successor is duly elected and qualified, or until he or she dies, resigns or is removed. |
2 | Mr. Sablowsky is considered an “interested person” of the Trust as that term is defined in the 1940 Act and is referred to as an “Interested Trustee.” Mr. Sablowsky is considered an “Interested Trustee” of the Trust by virtue of his position as an employee of Oppenheimer & Co., Inc., a registered broker-dealer that may execute portfolio transactions for the Funds or other accounts managed by the Advisor. |
Trustee Experience, Qualifications, Attributes and/or Skills
The information above includes each Trustee’s principal occupations during the last five years. Each Trustee possesses extensive additional experience, skills and attributes relevant to his or her qualifications to serve as a Trustee. The cumulative background of each Trustee led to the conclusion that each Trustee should serve as a Trustee of the Company. Mr. Brodsky has over 40 years of senior executive-level management experience in the cable television and communications industry. Mr. Chandler has demonstrated leadership and management abilities as evidenced by his senior executive level positions in the investment technology consulting/services and investment banking/brokerage industries, and also serves on various boards. Ms. Dolly has over three decades of experience in the financial services industry, and she has demonstrated her leadership and management abilities by serving in numerous senior executive-level positions. Mr. Giordano has years of experience as a consultant to financial services organizations and also serves on the boards of other registered investment companies. Mr. Reichman brings decades of investment management experience to the Board, in addition to senior executive-level management experience. Mr. Sablowsky has demonstrated leadership and management abilities as evidenced by his senior executive-level positions in the financial services industry. Mr. Shea has
56
THE RBB FUND TRUST
Trustees and Officers (UNAUDITED)
demonstrated leadership and management abilities as evidenced by his senior executive-level positions in the brokerage, clearing, banking and investment services industry, including service on the boards of public companies, industry regulatory organizations and a university. Mr. Straniere has been a practicing attorney for over 30 years and has served on the boards of an asset management company and another registered investment company.
57
THE RBB FUND TRUST
Privacy Policy
FACTS | WHAT DO THE PENN CAPITAL FUNDS DO WITH YOUR PERSONAL INFORMATION? | ||
Why? | Financial companies choose how they share your personal information. Federal law gives consumers the right to limit some but not all sharing. Federal law also requires us to tell you how we collect, share, and protect your personal information. Please read this notice carefully to understand what we do. | ||
What? | The types of personal information we collect and share depend on the product or service you have with us. The information can include: ● Social Security number ● Account balances and account transactions ● Assets and transaction history When you are no longer our client, we continue to share your information as described in this notice. | ||
How? | All financial companies need to share clients’ personal information to run the everyday business. In the section below, we list the reasons financial companies can share their clients’ personal information; the reasons PENN chooses to share; and whether you can limit this sharing. | ||
Reasons we can share your personal information | Does Penn share? | Can you limit | |
For everyday business purposes - | Yes | No | |
For marketing purposes - | No | No | |
For joint marketing with other financial companies | No | No | |
For affiliates’ everyday business purposes - | Yes | No | |
For affiliates’ everyday business purposes - | No | No | |
For nonaffiliates to market to you | No | No | |
Questions? | Call 215-302-1500 or go to www.penncapital.com |
58
THE RBB FUND TRUST
PRIVACY POLICY
What we do | |
Who is providing this notice? | Penn Capital Management Company, LLC and its affiliates (“Penn”) |
What we do | |
How does Penn protect my personal information? | To protect your personal information from unauthorized access and use, we use security measures that comply with federal law. These measures include computer and secured files and buildings. |
How does Penn collect my personal information? | We collect your personal information, for example, when you ● Open an account or deposit money ● Provide information on client questionnaires |
Why can’t I limit all sharing? | Federal law gives you the right to limit only ● sharing for affiliates everyday business purposes - information about your creditworthiness ● affiliates from using your information to market to you ● sharing for nonaffiliates to market to you State laws and individual companies may give you additional rights to limit sharing. |
Definitions | |
Affiliates | Companies related by common ownership or control. They can be financial or nonfinancial companies ● PENN Capital Funds Group LLC ● PENN Capital Funds Trust ● Penn Capital Management Company, LLC |
Nonaffiliates | Companies not related by common ownership or control. They can be financial or nonfinancial companies ● Penn does not share information with nonaffiliates |
Joint marketing | A formal agreement between non affiliated companies that together market financial products or services to you. ● Penn does not have joint marketing partners |
Other important information | |
This notice replaces all previous notices of our consumer privacy policy, and may be amended from time to time. Penn will inform you of updates or changes as required by law. | |
59
Investment Advisor
Penn Capital Management Company, LLC
Navy Yard Corporate Center
1200 Intrepid Avenue, Suite 400
Philadelphia, Pennsylvania 19112
Legal Counsel
Faegre Drinker Biddle & Reath LLP
One Logan Square, Suite 2000
Philadelphia, PA 19103
Independent Registered Public Accounting Firm
Tait, Weller & Baker LLP
50 South 16th Street, Suite 2900
Philadelphia, PA 19102
Custodian
U.S. Bank N.A.
1555 N. Rivercenter Drive, Suite 302
Milwaukee, WI 53212
Distributor
Foreside Fund Services, LLC
Three Canal Plaza
Portland, ME 04101
Administrator, Transfer Agent
and Dividend Disbursing Agent
U.S. Bancorp Fund Services, LLC
doing business as U.S. Bank Global Fund Services
615 East Michigan Street
Milwaukee, WI 53202
Shareholder/Investor Information
1.844.302.PENN (7366)
www.penncapitalfunds.com
BEFORE INVESTING YOU SHOULD CAREFULLY CONSIDER THE FUNDS’ INVESTMENT OBJECTIVES, RISKS, CHARGES AND EXPENSES. THIS AND OTHER RELEVANT INFORMATION CAN BE FOUND IN THE PROSPECTUS AND STATEMENT OF ADDITIONAL INFORMATION, COPIES OF WHICH MAY BE OBTAINED BY CALLING (844) 302-PENN (7366) OR BY VISITING WWW.PENNCAPITALFUNDS.COM. PLEASE READ THE PROSPECTUS CAREFULLY BEFORE YOU INVEST.
PENN-AR23
The Torray Fund
TABLE OF CONTENTS
Page | |
Letter to Shareholders | 1 |
Performance Data | 3 |
Fund Profile | 5 |
Schedule of Investments | 6 |
Statement of Assets and Liabilities | 8 |
Statements of Operations | 9 |
Statements of Changes in Net Assets | 11 |
Financial Highlights | 12 |
Notes to Financial Statements | 14 |
Report of Independent Registered Public Accounting Firm | 22 |
Trustees and Executive Officers | 23 |
Other Information | 29 |
About Your Fund’s Expenses | 30 |
Tax Information | 31 |
Privacy Notice | 32 |
The Torray Fund
Letter to Shareholders
October 19, 2023
Dear Fellow Shareholders:
As a result of the 2022 reorganization of the Torray Fund (the “Fund”) into The RBB Fund Trust, the fiscal year end for the Fund has been changed from December 31 to August 31. We are pleased to bring you the first annual report under the new schedule, which covers the trailing eight months ended August 31, 2023.
For the eight months ended August 31, 2023, the Fund returned 6.03%, compared to 7.92% for the Morningstar U.S. Large-Mid Cap Broad Value Index (“Morningstar Value Index”) and 18.73% for the Standard & Poor’s 500 Index (“S&P 500”). Stock selection in the Financial, Energy and Industrial sectors positively contributed to Fund performance during the period. In contrast, select holdings in the Communication Services and Consumer Discretionary sectors detracted from relative performance during the period. There have been no purchases or sales of Fund holdings since we last reported to you.
Once again, strength in several large-capitalization technology companies – a factor we mentioned in our July 2023 semi-annual letter – dominated the return of the S&P 500. When just a handful of companies’ shares influence market returns over the short term, the Fund may lag. However, over longer periods that include market drawdowns, we expect to hold up better than the market. We believe declining less than the market in downturns positions the Fund to deliver satisfactory results over the long haul. For example, looking at the trailing three-year period ended August 31, 2023, the Fund’s annualized return was 13.16%, compared to 12.46% for the Morningstar Value Index and 10.52% for the S&P 500.
The Financial sector remains the Fund’s largest exposure at 33.1% of the portfolio. This is a diverse group of companies in industries which include insurance, banking, asset management and financial services technology. The largest holding in the sector, and the Fund, is Berkshire Hathaway at 7.0%, which we have owned since 2017. Roughly 20% of Berkshire Hathaway’s operating income comes from insurance, with the balance derived from its interests in non-financial segments such as railroads, energy and manufacturing. We believe our Financial sector holdings have competitive strengths, solid capital positions, shareholder-oriented managements and reasonable valuations. Having weathered the extended suppression of interest rates begun by the Federal Reserve during the 2007-08 recession, we think these companies should continue to benefit from normalizing interest rates.
1
The Torray Fund
LETTER TO SHAREHOLDERS
October 19, 2023
At the time of this letter, the S&P 500 has returned 29.3% since October 2022, recovering almost all the ground lost during the 2022 decline. We find this surprising, given that interest rates across the yield curve have reached levels not seen in over 15 years (22 years in the case of fixed rate mortgages). The Federal Reserve has made clear it is willing to lower employment and business activity to reach its two percent inflation goal. Still, we understand its balancing act is art, not science. Faith in the Federal Reserve’s ability to orchestrate a “soft landing” seems to have increased as equity prices have risen. We would not be surprised to see this tested in the year ahead.
In accordance with the schedule for the Fund’s new fiscal year, our next report to you will cover the six months ending February 29, 2024. Thank you for your support and continued investment in the Fund.
Sincerely,
 |  |  |
Shawn M. Hendon | Jeffrey D. Lent | Brian R. Zaczynski |
Mutual fund investing involves risk including the possible loss of principal value. At times, the Fund’s portfolio may be more concentrated than that of a more diversified fund subjecting it to greater fluctuation and risk. Portfolio holdings are subject to change at any time.
You should consider the Fund’s investment objectives, risks, charges and expenses carefully before investing. The Fund’s prospectus contains this and other information about the Fund. For more information about the Fund, including fees and expenses, or to receive a prospectus, please call us toll free at (800) 626-9769.
Fund holdings and sector allocations are subject to change. Please refer to the schedule of Investments included in this report for additional portfolio information.
Past performance does not guarantee future results.
Shares of the Torray Fund are distributed by Quasar Distributors LLC, Milwaukee, WI.
2
The Torray Fund
Performance Data
As of August 31, 2023 (unaudited)
The Torray Fund (the “Fund”) operated as a series (the “Predecessor Fund”) of The Torray Fund prior to the close of business on December 9, 2022, at which time the Predecessor Fund was reorganized into the Fund. The performance information provided below for periods prior to December 12, 2022 represents the performance of the Predecessor Fund.
Average Annual Total Returns For The Periods Ended August 31, 2023
Calendar YTD* | 1 Year | 3 Years | 5 Years | 10 Years | Since | ||||||
The Torray Fund | 6.03% | 11.31% | 13.16% | 5.83% | 7.72% | 9.28% | |||||
Morningstar US Large-Mid Cap Broad Value Total Return Index** | 7.92% | 11.20% | 12.46% | 8.74% | 10.58% | N/A | |||||
Russell 1000 Value Total Return Index | 5.88% | 8.59% | 11.59% | 7.11% | 9.15% | 10.03% | |||||
S&P 500 Total Return Index | 18.73% | 15.94% | 10.52% | 11.12% | 12.81% | 10.54% |
* | Not annualized. |
** | Effective January 1, 2023, the primary benchmark index for the Fund changed from the Russell 1000 Value Total Return Index to the Morningstar US Large-Mid Cap Broad Value Total Return Index, as Torray Investment Partners LLC (formerly known as Torray LLC) (the “Adviser”) determined that it better reflects the Fund’s investment strategy. |
The returns quoted represent past performance and do not guarantee future results. Investment return and principal value will fluctuate so that shares, when redeemed, may be worth more or less than their original cost. Current performance may be lower or higher. For perfomance current to the most recent month end, please call (800) 626-9769.
3
The Torray Fund
PERFORMANCE DATA (continued)
As of August 31, 2023 (unaudited)
Change in Value of $10,000 Invested
on August 31, 2013 to:

The returns shown do not reflect the deduction of taxes a shareholder would pay on the redemption of fund shares and distributions. As of the Fund’s most recent prospectus, dated April 30, 2023, the Fund’s gross expense ratio, based on estimated expenses, is 0.93%. Returns on the Fund, the Morningstar US Large-Mid Cap Broad Value Total Return Index, the Russell 1000 Value Total Return Index and the S&P 500 Total Return Index assume reinvestment of all dividends and distributions. The Morningstar US Large-Mid Cap Broad Value Total Return Index is designed to provide comprehensive, consistent representation of the large-mid cap value segment of the US equity market. The Russell 1000 Value Total Return Index measures the performance of the large capitalization value segment of the U.S. equity universe. The S&P 500 Total Return Index measures the performance of 500 large capitalization U.S. Companies. These indexes are unmanaged and do not reflect the fees and expenses typically paid by mutual funds. It is not possible to invest directly in an index. Current and future portfolio holdings are subject to change and risk. Mutual fund investing involves risk, including the possible loss of principal value. At times, the Fund’s portfolio may be more concentrated than that of a more diversified fund, subjecting it to greater fluctuation and risk.
4
The Torray Fund
Fund Profile
As of August 31, 2023 (unaudited)
DIVERSIFICATION (% of net assets) | |
Financials | 33.1% |
Industrials | 12.3% |
Energy | 11.1% |
Health Care | 10.1% |
Consumer Discretionary | 10.1% |
Information Technology | 10.0% |
Consumer Staples | 6.3% |
Communication Services | 4.3% |
Short-Term Investment | 2.6% |
Other Asset and Liabilities, Net | 0.1% |
100.0% | |
TOP TEN EQUITY HOLDINGS (% of net assets) | ||
1. | Berkshire Hathaway, Inc. - Class B | 7.0% |
2. | Marsh & McLennan Cos., Inc. | 5.2% |
3. | Eaton Corp. PLC | 5.0% |
4. | Alphabet, Inc. - Class A | 4.3% |
5. | Phillips 66 | 4.0% |
6. | General Dynamics Corp. | 3.9% |
7. | UnitedHealth Group Inc. | 3.9% |
8. | Fiserv, Inc. | 3.8% |
9. | JPMorgan Chase & Co. | 3.8% |
10. | Home Depot, Inc., (The) | 3.7% |
44.6% | ||
PORTFOLIO CHARACTERISTICS | |||||
Net Assets (millions) | $ | 319 | |||
Number of Equity Holdings | 26 | ||||
Portfolio Turnover | 9 | %* | |||
P/E Multiple (forward) | 13.2x | ||||
Trailing Weighted Average Dividend Yield | 2.2 | % | |||
Market Capitalization (billion) | Average | $ | 217 | ||
Median | $ | 87.9 | |||
* | Not Annualized |
5
The Torray Fund
Schedule of Investments
As of August 31, 2023
Shares | Market Value | ||||
COMMON STOCKS — 97.3% | |||||
33.1% Financials+ | |||||
72,253 | American Express Co. | $ | 11,415,251 | ||
61,790 | Berkshire Hathaway, Inc. - Class B * | 22,256,758 | |||
52,650 | Chubb Limited | 10,575,806 | |||
98,950 | Fiserv, Inc. * | 12,011,541 | |||
81,910 | JPMorgan Chase & Co. | 11,985,890 | |||
84,956 | Marsh & McLennan Cos., Inc. | 16,565,570 | |||
95,310 | T. Rowe Price Group, Inc. | 10,696,641 | |||
160,635 | W R Berkley Corp. | 9,936,881 | |||
| 105,444,338 | |||||
12.3% Industrials | |||||
69,210 | Eaton Corp. PLC | 15,943,907 | |||
55,255 | General Dynamics Corp. | 12,522,993 | |||
56,265 | Honeywell International, Inc. | 10,574,444 | |||
| 39,041,344 | |||||
11.1% Energy | |||||
88,309 | EOG Resources, Inc. | 11,358,304 | |||
111,080 | Phillips 66 | 12,680,892 | |||
197,085 | Schlumberger Ltd. | 11,620,132 | |||
| 35,659,328 | |||||
10.1% Health Care | |||||
72,950 | Johnson & Johnson | 11,794,556 | |||
270,835 | Royalty Pharma PLC – Class A | 8,076,300 | |||
26,108 | UnitedHealth Group Inc. | 12,442,551 | |||
| 32,313,407 | |||||
10.1% Consumer Discretionary | |||||
259,708 | General Motors Co. | 8,702,815 | |||
36,120 | Home Depot, Inc., (The) | 11,930,436 | |||
108,610 | Lennar Corp. – Class B | 11,584,343 | |||
| 32,217,594 | |||||
10.0% Information Technology | |||||
75,295 | Applied Materials, Inc. | 11,502,064 | |||
82,970 | Qualcomm, Inc. | 9,502,554 | |||
63,980 | Texas Instruments, Inc. | 10,752,479 | |||
| 31,757,097 | |||||
See notes to the financial statements.
6
The Torray Fund
SCHEDULE OF INVESTMENTS (concluded)
As of August 31, 2023
Shares | Market Value | ||||
6.3% Consumer Staples | |||||
255,850 | Altria Group, Inc. | $ | 11,313,687 | ||
266,344 | Kraft Heinz Co., (The) | 8,813,323 | |||
| 20,127,010 | |||||
4.3% Communication Services | |||||
100,570 | Alphabet, Inc. - Class A * | 13,694,618 | |||
TOTAL COMMON STOCKS | |||||
(COST $200,337,034) | 310,254,736 | ||||
SHORT-TERM INVESTMENTS — 2.6% | |||||
2.6% Money Market Funds | |||||
8,246 | Fidelity Institutional Government Portfolio - Class I, 5.24% (a) | 8,246,455 | |||
TOTAL MONEY MARKET FUNDS | |||||
(COST $8,246,455) | 8,246,455 | ||||
TOTAL SHORT-TERM INVESTMENTS | |||||
(COST $8,246,455) | 8,246,455 | ||||
TOTAL INVESTMENTS — 99.9% | |||||
(COST $208,583,489) | 318,501,191 | ||||
OTHER ASSETS IN EXCESS OF LIABILITIES — 0.1% | 279,457 | ||||
TOTAL NET ASSETS — 100.0% | $ | 318,780,648 | |||
+ | As of August 31, 2023, the Fund had a significant portion of its assets invested in this sector. See Note 9 in the Notes to the Financial Statements. |
* | Non-income producing security. |
(a) | The rate shown is as of August 31, 2023. |
The Global Industry Classification Standard (GICS®) was developed by and/or is the exclusive property of Morgan Stanley Capital International, Inc. (“MSCI”) and Standard & Poor’s Financial Services LLC (“S&P”). GICS is a service mark of MSCI and S&P and has been licensed for use by U.S. Bancorp Fund Services, LLC.
Portfolio holdings are subject to change at any time.
7
The Torray Fund
Statement of Assets and Liabilities
As of August 31, 2023
ASSETS: | ||||
Investments in securities at value (cost $208,583,489) | $ | 318,501,191 | ||
Receivable for fund shares sold | 660 | |||
Dividends & interest receivable | 650,934 | |||
Prepaid expenses and other assets | 17,783 | |||
TOTAL ASSETS | 319,170,568 | |||
LIABILITIES: | ||||
Payable for fund shares redeemed | 101,440 | |||
Payable to investment manager | 229,574 | |||
Accrued expenses and other liabilities | 58,906 | |||
TOTAL LIABILITIES | 389,920 | |||
NET ASSETS | $ | 318,780,648 | ||
NET ASSETS CONSIST OF: | ||||
Paid-in capital | $ | 192,933,583 | ||
Total distributable earnings /(losses) | 125,847,065 | |||
Net Assets | $ | 318,780,648 | ||
Shares issued and outstanding (unlimited number of shares authorized without par value) | 6,462,306 | |||
Net asset value and redemption price per share | $ | 49.33 | ||
See notes to the financial statements.
8
The Torray Fund
Statements of Operations
Fiscal Period | Fiscal Year | |||||||
INVESTMENT INCOME: | ||||||||
Dividend income | $ | 4,613,211 | $ | 7,284,102 | ||||
Interest income | 232,729 | 156,455 | ||||||
Total investment income | 4,845,940 | 7,440,557 | ||||||
EXPENSES: | ||||||||
Advisory fees (See Note 4) | 1,783,143 | 3,282,802 | ||||||
Transfer agent fees & expenses | 72,459 | 142,629 | ||||||
Fund administration & accounting fees | 56,680 | 188,194 | ||||||
Printing, postage & mailing fees | 24,212 | 12,458 | ||||||
Federal & state registration fees | 23,055 | 33,784 | ||||||
Trustees’ fees | 14,338 | 73,232 | ||||||
Audit fees | 11,524 | 23,807 | ||||||
Insurance expense | 9,764 | 23,310 | ||||||
Advisory fees - recouped (See Note 4) | 9,517 | — | ||||||
Custody fees | 7,870 | 16,243 | ||||||
Legal fees | 6,073 | 55,890 | ||||||
Compliance fees | — | 7,513 | ||||||
Other fees | 2,893 | 100 | ||||||
Total expenses before waiver and/or reimbursement | 2,021,528 | 3,859,962 | ||||||
Less waiver and/or reimbursement from investment manager (See Note 4) | (29,208 | ) | (344,488 | ) | ||||
Net expenses | 1,992,320 | 3,515,474 | ||||||
NET INVESTMENT INCOME/(LOSS) | 2,853,620 | 3,925,083 | ||||||
See notes to the financial statements.
9
The Torray Fund
Statements of Operations (continued)
Fiscal Period | Fiscal Year | |||||||
REALIZED AND UNREALIZED GAIN/(LOSS) ON INVESTMENTS: | ||||||||
Net realized gain/(loss) on investments | $ | 2,132,484 | $ | 20,982,080 | ||||
Net change in unrealized appreciation/(depreciation) on investments | 13,596,458 | (29,455,877 | ) | |||||
Net realized and unrealized gain/(loss) on investments | 15,728,942 | (8,473,797 | ) | |||||
NET INCREASE/(DECREASE) IN NET ASSETS RESULTING FROM OPERATIONS | $ | 18,582,562 | $ | (4,548,714 | ) | |||
* | Effective August 31, 2023, the Fund changed its fiscal year end date to August 31st. |
See notes to the financial statements.
10
The Torray Fund
Statements of Changes in Net Assets
For each period/year indicated:
Period Ended | Year Ended | Year Ended | ||||||||||
Increase/(Decrease) in Net Assets | ||||||||||||
Net investment income/(loss) | $ | 2,853,620 | $ | 3,925,083 | $ | 4,268,623 | ||||||
Net realized gain/(loss) on investments | 2,132,484 | 20,982,080 | 63,131,959 | |||||||||
Net change in unrealized appreciation/(depreciation) on investments | 13,596,458 | (29,455,877 | ) | 6,372,334 | ||||||||
Net increase/(decrease) in net assets resulting from operations | 18,582,562 | (4,548,714 | ) | 73,772,916 | ||||||||
Distributions to Shareholders: | ||||||||||||
Total distributions to shareholders | (2,189,731 | ) | (31,596,530 | ) | (38,322,607 | ) | ||||||
Shares of Beneficial Interest: | ||||||||||||
Net decrease from share transactions (Note 6) | (18,899,891 | ) | (23,434,576 | ) | (10,924,505 | ) | ||||||
Total increase/(decrease) in net assets | (2,507,060 | ) | (59,579,820 | ) | 24,525,804 | |||||||
Net Assets – Beginning of Period | 321,287,708 | 380,867,528 | 356,341,724 | |||||||||
Net Assets – End of Period | $ | 318,780,648 | $ | 321,287,708 | $ | 380,867,528 | ||||||
* | Effective August 31, 2023, the Fund changed its fiscal year end date to August 31st. |
See notes to the financial statements.
11
The Torray Fund
Financial Highlights
For a Fund share outstanding throughout each period/year.
PER SHARE DATA: | ||||||||||||||||||||||||
Period | Years ended December 31: | |||||||||||||||||||||||
2023(1) | 2022(2) | 2021 | 2020 | 2019 | 2018 | |||||||||||||||||||
Net Asset Value, Beginning of Year | $ | 46.86 | $ | 52.24 | $ | 47.64 | $ | 50.70 | $ | 43.45 | $ | 49.60 | ||||||||||||
Investment operations | ||||||||||||||||||||||||
Net investment income/(loss)(3) | 0.43 | 0.60 | 0.59 | 0.63 | 0.74 | 0.62 | ||||||||||||||||||
Net realized and unrealized gain/(loss) on investments | 2.38 | (1.03 | ) | 9.65 | (2.15 | ) | 7.86 | (5.81 | ) | |||||||||||||||
Total from investment operations | 2.81 | (0.43 | ) | 10.24 | (1.52 | ) | 8.60 | (5.19 | ) | |||||||||||||||
Less distributions from: | ||||||||||||||||||||||||
Net investment income | (0.34 | ) | (0.60 | ) | (0.59 | ) | (0.64 | ) | (0.95 | ) | (0.62 | ) | ||||||||||||
Net capital gains | — | (4.35 | ) | (5.05 | ) | (0.90 | ) | (0.40 | ) | (0.34 | ) | |||||||||||||
Total distributions | (0.34 | ) | (4.95 | ) | (5.64 | ) | (1.54 | ) | (1.35 | ) | (0.96 | ) | ||||||||||||
Net Asset Value, End of Year | $ | 49.33 | $ | 46.86 | $ | 52.24 | $ | 47.64 | $ | 50.70 | $ | 43.45 | ||||||||||||
TOTAL RETURN(4) | 6.03 | %(5) | -0.98 | % | 21.39 | % | -2.51 | % | 19.89 | % | -10.60 | % | ||||||||||||
SUPPLEMENTAL DATA AND RATIOS: | ||||||||||||||||||||||||
Net assets, end of year (000’s omitted) | $ | 318,781 | $ | 321,288 | $ | 380,868 | $ | 356,342 | $ | 408,961 | $ | 370,973 | ||||||||||||
Ratios of expenses to average net assets: | ||||||||||||||||||||||||
Before expense waiver | 0.96 | %(6) | 1.16 | % | 1.16 | % | 1.17 | % | 1.15 | % | 1.16 | % | ||||||||||||
After expense waiver | 0.95 | %(6) | 1.06 | % | 1.07 | % | 1.06 | % | 1.06 | % | 1.07 | % | ||||||||||||
Ratios of net investment income/(loss) to average net assets | 1.36 | %(6) | 1.18 | % | 1.10 | % | 1.46 | % | 1.53 | % | 1.28 | % | ||||||||||||
Portfolio turnover rate | 9 | %(5) | 40 | % | 36 | % | 33 | % | 11 | % | 4 | % | ||||||||||||
See notes to the financial statements.
12
The Torray Fund
Financial Highlights (continued)
For a Fund share outstanding throughout each period/year.
(1) | Effective August 31, 2023, the Fund changed its fiscal year end date to August 31st. |
(2) | Prior to the close of business on December 9, 2022, the Fund was a series (the “Predecessor Fund”) of The Torray Fund, an open-end management investment company organized as a Massachusetts business trust. The Predecessor Fund was reorganized into the Fund following the close of business on December 9, 2022 (the “Reorganization”). As a result of the Reorganization, the performance and accounting history of the Predecessor Fund was assumed by the Fund. Performance and accounting information prior to December 9, 2022 included herein is that of the Predecessor Fund. See Note 1. |
(3) | Calculated based on average amount of shares outstanding during the period. |
(4) | Past performance is not predictive of future performance. Returns assume reinvestment of all dividends and distributions. |
(5) | Not annualized. |
(6) | Annualized. |
See notes to the financial statements.
13
The Torray Fund
Notes to Financial Statements
As of August 31, 2023
NOTE 1 – ORGANIZATION
The Torray Fund (“Fund”) is a separate diversified series of The RBB Fund Trust (“Trust”). The Trust was organized as a Delaware statutory trust on August 29, 2014 and is registered under the Investment Company Act of 1940, as amended (the “1940 Act”) as an open-end management investment company. The Fund commenced operations on December 31, 1990 as a separate series (the “Predecessor Fund”) of The Torray Fund, a Massachusetts business trust. Effective as of the close of business on December 9, 2022, the Predecessor Fund was reorganized into a new series of the Trust in a tax-free reorganization (the “Reorganization”), whereby the Fund acquired all the assets and liabilities of the Predecessor Fund, in exchange for shares of the Fund which were distributed pro rata by the Predecessor Fund to its shareholders, in complete liquidation and termination of the Predecessor Fund. The Agreement and Plan of Reorganization pursuant to which the Reorganization was accomplished was approved by shareholders of the Predecessor Fund on November 1, 2022. Unless otherwise indicated, references to the “Fund” in these Notes to Financial Statements refer to the Predecessor Fund and Fund. At the September 13, 2023 meeting of the Board of Trustees of the Trust (the “Board”), the Board approved a change in fiscal year end for the Fund from December 31st to August 31st effective August, 31 2023. The period covered in these financial statements is from January 1, 2023 to August 31, 2023.
The Fund’s investment objectives are to build investor wealth over extended periods and to minimize shareholder capital gains tax liability by limiting the realization of long- and short-term gains. The Fund invests principally in common stock of larger-capitalization companies that generally have demonstrated records of profitability, conservative financial structures and shareholder-oriented management. The Fund seeks to invest in such companies when it believes that valuations are modest relative to earnings, cash flow or asset values. Large capitalization companies are those with market capitalizations of $8 billion or more. Investments are held as long as the issuers’ fundamentals remain intact, and the Fund believes issuers’ shares are reasonably valued. There can be no assurance that the Fund’s investment objectives will be achieved.
The Fund is an investment company and accordingly follows the investment companies accounting and reporting guidance of the Financial Accounting Standards Board (“FASB”) Accounting Standards Codification Topic 946 Financial Services – Investment Companies.
14
The Torray Fund
NOTES TO FINANCIAL STATEMENTS (continued)
As of August 31, 2023
As a tax-free reorganization, any unrealized appreciation or depreciation on the securities held by the Fund on the date of Reorganization was treated as a non-taxable event, thus the cost basis of the securities held reflects their historical cost basis as of the date of Reorganization. As a result of the Reorganization, the Fund is the accounting successor. The Reorganization was accomplished by a tax-free exchange of the Fund’s shares and value of net assets for the same shares and value of the Predecessor Fund’s shares. For financial reporting purposes, assets received and shares issued by the Fund were recorded at fair value; however, the cost basis of the investments received from the Fund was carried forward to align ongoing reporting of the Fund’s realized and unrealized gains and losses with amounts distributable to shareholders for tax purposes. Immediately prior to the Reorganization, the net assets, fair value of investments, net unrealized appreciation and fund shares outstanding of the Predecessor Fund were as follows:
Net Assets | Fair Value of | Net Unrealized | Fund Shares | ||||||||||||
| $ | 327,634,260 | $ | 326,806,119 | $ | 105,738,265 | 6,858,304 | |||||||||
NOTE 2 – SIGNIFICANT ACCOUNTING POLICIES
The following is a summary of accounting policies followed by the Fund in the preparation of its financial statements. These policies are in conformity with accounting principles generally accepted in the United States of America (“GAAP”).
Security Valuation – All investments in securities are recorded at their estimated fair value, as described in Note 3.
Federal Income Taxes – The Fund complies with the requirements of subchapter M of the Internal Revenue Code of 1986, as amended, necessary to qualify as a regulated investment company and distributes substantially all net taxable investment income and net realized gains to shareholders in a manner which results in no tax cost to the Fund. Therefore, no federal income tax provision is required. As of and during the period ended August 31, 2023, the Fund did not have any tax positions that did not meet the “more-likely-than-not” threshold of being sustained by the applicable tax authority. As of and during the period ended August 31, 2023, the Fund did not have liabilities for any unrecognized tax benefits. The Fund recognizes interest and penalties, if any, related to unrecognized tax benefits on uncertain tax positions as income tax expense in the Statement of Operations. As of and during the period ended August 31, 2023, the Fund did not incur any interest or penalties. The Fund is not subject to examination by U.S. tax authorities for tax years prior to December 31, 2019.
Security Transactions and Investment Income and Distributions – The Fund follows industry practice and records security transactions on the trade date. Realized gains and losses on sales of securities are calculated on the basis of identified cost. Dividend income is recorded on the ex-dividend date and interest income is recorded on an accrual basis. Withholding taxes on foreign dividends have been provided for in accordance with the Fund’s understanding of the applicable country’s tax rules and regulations. Discounts and premiums on securities purchased are amortized over the expected life of the respective securities using the constant yield method. Non-cash dividend income is recognized at the fair value of property received.
15
The Torray Fund
NOTES TO FINANCIAL STATEMENTS (continued)
As of August 31, 2023
The Fund distributes all net investment income, if any, quarterly and net realized capital gains, if any, annually. Distributions to shareholders are recorded on the ex-dividend date. The treatment for financial reporting purposes of distributions made to shareholders during the year from net investment income or net realized capital gains may differ from their ultimate treatment for federal income tax purposes. These differences are caused primarily by differences in the timing of the recognition of certain components of income, expense or realized capital gain for federal income tax purposes. Where such differences are permanent in nature, GAAP requires that they be reclassified in the components of the net assets based on their ultimate characterization for federal income tax purposes. Any such reclassifications will have no effect on net assets, results of operations or net asset values per share of the Fund. For the period ended August 31, 2023, no such reclassifications were made.
Certain expenses are shared with The RBB Fund, Inc. (“RBB”), a series trust of affiliated funds. Expenses incurred on behalf of a specific class, fund or fund family of the Trust or RBB are charged directly to the class, fund or fund family (in proportion to net assets). Expenses incurred for all funds (such as director or professional fees) are charged to all funds in proportion to their average net assets of the Trust and RBB, or in such other manner as the Board deems fair or equitable. Expenses and fees, including investment advisory and administration fees, are accrued daily and taken into account for the purpose of determining the NAV of the Fund.
Use of Estimates – The preparation of financial statements in conformity with GAAP requires management to make estimates and assumptions that affect the reported amounts of assets and liabilities and disclosure of contingent assets and liabilities at the date of the financial statements and the reported amounts of revenues and expenses during the reporting period. Actual results could differ from those estimates.
NOTE 3 — SECURITIES VALUATION
The Fund has adopted authoritative fair value accounting standards which establish an authoritative definition of fair value and set out a hierarchy for measuring fair value. These standards require additional disclosures about the various inputs and valuation techniques used to develop the measurements of fair value, a discussion of changes in valuation techniques and related inputs during the period and expanded disclosure of valuation levels for major security types. These inputs are summarized in the three broad levels listed below:
● | Level 1 – Unadjusted quoted prices in active markets for identical assets or liabilities that the Fund has the ability to access. |
● | Level 2 – Observable inputs other than quoted prices included in Level 1 that are observable for the asset or liability, either directly or indirectly. These inputs may include quoted prices for the identical instrument on an inactive market, prices for similar instruments, interest rates, prepayment speeds, credit risk, yield curves, default rates and similar data. |
● | Level 3 – Unobservable inputs for the asset or liability, to the extent relevant observable inputs are not available, representing the Fund’s own assumptions about the assumptions a market participant would use in valuing the asset or liability, and would be based on the best information available. |
16
The Torray Fund
NOTES TO FINANCIAL STATEMENTS (continued)
As of August 31, 2023
Following is a description of the valuation techniques applied to the Fund’s major categories of assets and liabilities measured at fair value on a recurring basis. The Fund’s investments are carried at fair value.
Equity Securities – Securities that are primarily traded on a national securities exchange are valued at the last sale price on the exchange on which they are primarily traded on the day of valuation or, if there has been no sale on such day, at the mean between the bid and ask prices. Securities traded primarily in the Nasdaq Global Market System for which market quotations are readily available are valued using the Nasdaq Official Closing Price (“NOCP”). If the NOCP is not available, such securities are valued at the last sale price on the day of valuation, or if there has been no sale on such day, at the mean between the bid and ask prices. To the extent these securities are actively traded and valuation adjustments are not applied, they are categorized in Level 1 of the fair value hierarchy. If the market for a particular security is not active, and the mean between bid and ask prices is used, these securities are categorized in Level 2 of the fair value hierarchy.
Short-Term Investments – Investments in money market funds are valued at their net asset value per share. To the extent these securities are actively traded and valuation adjustments are not applied, they are categorized in Level 1 of the fair value hierarchy. Short-term debt securities (maturing in 60 days or less), such as U.S. Treasury Bills, are valued at amortized cost, which approximates market value and are categorized in Level 2 of the fair value hierarchy.
The Board has adopted a pricing and valuation policy for use by the Fund and its Valuation Designee (as defined below) in calculating the Fund’s net asset value. Pursuant to Rule 2a-5 under the 1940 Act, the Fund has designated Torray Investment Partners LLC (formerly known as Torray LLC) (the “Adviser”) as its “Valuation Designee” to perform all of the fair value determinations as well as to perform all of the responsibilities that may be performed by the Valuation Designee in accordance with Rule 2a-5. The Valuation Designee is authorized to make all necessary determinations of the fair values of portfolio securities and other assets for which market quotations are not readily available or if it is deemed that the prices obtained from brokers and dealers or independent pricing services are unreliable.
Securities for which market quotations are not readily available, or if the closing price does not represent fair value, are valued following procedures approved by the Board. As of August 31, 2023, no Fund portfolio securities were priced in accordance with such procedures.
The inputs or methodology used for valuing securities are not an indication of the risk associated with investing in those securities. The following is a summary of the inputs used to value the Fund’s securities as of August 31, 2023:
Level 1 | Level 2 | Level 3 | Total | |||||||||||||
Common Stock | $ | 310,254,736 | $ | — | $ | — | $ | 310,254,736 | ||||||||
Short-Term Investment | 8,246,455 | — | — | 8,246,455 | ||||||||||||
Total Investments* | $ | 318,501,191 | $ | — | $ | — | $ | 318,501,191 | ||||||||
* | Please refer to the Schedule of Investments for further details. |
17
The Torray Fund
NOTES TO FINANCIAL STATEMENTS (continued)
As of August 31, 2023
NOTE 4 — INVESTMENT ADVISORY FEES AND OTHER TRANSACTIONS WITH AFFILIATES
The Trust has an agreement (the “Advisory Agreement”) with the Adviser to furnish investment advisory services and to pay for certain operating expenses of the Fund. Pursuant to the Advisory Agreement between the Trust and the Adviser, the Adviser is entitled to receive, on a monthly basis, an annual advisory fee equal to 0.85% of the Fund’s average daily net assets. For the period ended August 31, 2023, the Fund incurred advisory fees of $1,783,143.
Effective December 9, 2022, the Adviser and the Fund entered into an Operating Expense Limitation Agreement (the “Agreement”) whereby the Adviser has contractually agreed to waive its fee and reimburse the Fund for its current Operating Expenses so as to limit the Fund’s current Operating Expenses (excluding certain items discussed below) to an annual rate, expressed as a percentage of the Fund’s average annual net assets, of 0.95% (the “Expense Cap”). For purposes of the Agreement, the following expenses are not taken into account and could cause net total annual Fund Operating Expenses to exceed the Expense Cap as applicable: acquired fund fees and expenses, taxes, interest expense, dividends on securities sold short and extraordinary expenses. This contractual limitation is in effect until December 31, 2025 and may not be terminated without the approval of the Board. During the current fiscal period, the Fund waived advisory fees in the amount of $29,208, and recouped advisory fees in the amount of $9,517 attributable to fees waived in the fiscal year ended December 31, 2022.
Under the Agreement, if at any time the Fund’s total annual Fund Operating Expenses (not including acquired fund fees and expenses, short sale dividend expenses, brokerage commissions, extraordinary items, interest or taxes) for a year are less than the Expense Cap, the Adviser is entitled to reimbursement by the Fund of the advisory fees forgone and other payments remitted by the Adviser to the Fund within three years from the date on which such waiver or reimbursement was made, provided such reimbursement does not cause the Fund to exceed (i) the expense limitations that were in effect at the time of the waiver or reimbursement and (ii) the current expense limit in effect at the time of the reimbursement.
As of the end of the current reporting period, the Fund had amounts available for recoupment as follows:
Expiration |
$29,208 |
U.S. Bancorp Fund Services, LLC (“Fund Services”), doing business as U.S. Bank Global Fund Services, serves as administrator for the Fund. For providing administrative and accounting services, Fund Services is entitled to receive a monthly fee, subject to certain minimum and out of pocket expenses.
Fund Services serves as the Fund’s transfer and dividend disbursing agent. For providing transfer agent services, Fund Services is entitled to receive a monthly fee, subject to certain minimum and out of pocket expenses.
U.S. Bank, N.A. (the “Custodian”) provides certain custodial services to the Fund. The Custodian is entitled to receive a monthly fee, subject to certain minimum and out of pocket expenses.
18
The Torray Fund
NOTES TO FINANCIAL STATEMENTS (continued)
As of August 31, 2023
Quasar Distributors, LLC (the “Distributor”), a wholly-owned broker-dealer subsidiary of Foreside Financial Group, LLC, serves as the principal underwriter and distributor of the Fund’s shares pursuant to a Distribution Agreement with the Trust.
For compensation amounts paid to Fund Services and the Custodian, please refer to the Statement of Operations.
NOTE 5 — TRUSTEE AND OFFICER COMPENSATION
The Trustees of the Trust receive an annual retainer and meeting fees for meetings attended. An employee of Vigilant Compliance, LLC serves as Chief Compliance Officer of the Trust. Vigilant Compliance, LLC is compensated for the services provided to the Trust. Employees of the Trust serve as President, Chief Financial Officer, Chief Operating Officer, Secretary and Director of Marketing & Business Development of the Trust. They are compensated for services provided. Certain employees of Fund Services serve as officers of the Trust. They are not compensated by the Fund or the Trust. For Trustee and Officer compensation amounts, please refer to the Statement of Operations.
NOTE 6 — SHARES OF BENEFICIAL INTEREST TRANSACTIONS
Transactions in shares of beneficial interest were as follows:
Period ended | Year ended | Year ended | ||||||||||||||||||||||
Shares | Amount | Shares | Amount | Shares | Amount | |||||||||||||||||||
Shares sold | 22,174 | $ | 1,075,591 | 226,400 | $ | 11,219,486 | 48,762 | $ | 2,594,756 | |||||||||||||||
Reinvestment of distributions | 42,498 | 1,977,768 | 577,797 | 27,906,740 | 666,654 | 35,510,492 | ||||||||||||||||||
Shares redeemed | (458,561 | ) | (21,953,250 | ) | (1,238,188 | ) | (62,560,802 | ) | (904,341 | ) | (49,029,753 | ) | ||||||||||||
| (393,889 | ) | $ | (18,899,891 | ) | (433,991 | ) | $ | (23,434,576 | ) | (188,925 | ) | $ | (10,924,505 | ) | ||||||||||
NOTE 7 — INVESTMENT TRANSACTIONS
Purchases and sales of investment securities, other than short-term investments, for the period ended August 31, 2023, aggregated $26,680,574 and $46,827,935, respectively.
NOTE 8 — TAX MATTERS
Distributions to shareholders are determined in accordance with United States federal income tax regulations, which may differ from GAAP.
19
The Torray Fund
NOTES TO FINANCIAL STATEMENTS (continued)
As of August 31, 2023
The tax character of distributions paid during the period ended August 31, 2023, and the years ended December 31, 2022, and December 31, 2021 were as follows:
August 31, | December 31, | December 31, | ||||||||||
Distributions paid from: | ||||||||||||
Ordinary Income | $ | 2,189,731 | $ | 4,709,901 | $ | 16,352,813 | ||||||
Long-Term Capital Gains | — | 26,886,629 | 21,969,794 | |||||||||
| $ | 2,189,731 | $ | 31,596,530 | $ | 38,322,607 | |||||||
As of August 31, 2023, the components of distributable earnings on a tax basis were as follows:
Undistributed ordinary income | $ | 663,889 | ||||||||||
Undistributed long-term capital gain | 16,526,311 | |||||||||||
Net unrealized appreciation/(depreciation) | 108,656,865 | |||||||||||
Total accumulated earnings | $ | 125,847,065 |
As of August 31, 2023, the Fund did not have any capital loss carryovers. A regulated investment company may elect to treat certain capital losses between November 1 and August 31 and late year ordinary losses (i) ordinary losses between January 1 and August 31, and (ii) specified ordinary and currency losses between November 1 and August 31) as occurring on the first day of the following tax year. For the taxable period ended August 31, 2023, any amount of losses elected within the tax return will not be recognized for federal income tax purposes until September 1, 2023. As of August 31, 2023, the Fund had no tax basis post October losses or qualified late-year losses.
The cost basis of investments for federal income tax purposes at August 31, 2023, the Fund’s most recently completed fiscal year end, were as follows:
August 31, | ||||
Gross unrealized appreciation | $ | 115,720,189 | ||
Gross unrealized (depreciation) | (7,063,324 | ) | ||
Net unrealized appreciation | 108,656,865 | |||
Cost | $ | 209,844,326 | ||
The difference between book-basis and tax-basis unrealized appreciation (depreciation) is attributable primarily to the differences in tax treatment of wash sales.
20
The Torray Fund
NOTES TO FINANCIAL STATEMENTS (concluded)
As of August 31, 2023
NOTE 9 — SECTOR RISK AND GENERAL RISK
As of August 31, 2023, the Fund had a significant portion of its assets invested in the Financials sector. The Financials sector may be more greatly impacted by the performance of the overall economy, interest rates, competition, and consumer confidence spending.
For purposes of financial statement reporting, 33.1% of portfolio holdings at year end were classified according to Global Industry Classification Standards (GICS) as belonging to the Financials sector. However, the Fund believes the actual Financials concentration risk to be below that shown for the Financials sector, as several of the constituent companies are diversified holding companies, with portions of their businesses falling outside the sector.
NOTE 10 — COMMITMENTS AND CONTINGENCIES
The Fund indemnifies its officers and Trustees for certain liabilities that may arise from their performance of their duties to the Fund. Additionally, in the normal course of business, the Fund enters into contracts that contain a variety of representations and warranties which provide general indemnifications. The Fund’s maximum exposure under these arrangements is unknown, as this would involve future claims that may be made against the Fund that have not yet occurred.
NOTE 11 — SUBSEQUENT EVENTS
In preparing these financial statements, management of the Fund has evaluated events and transactions for potential recognition or disclosure through the date the financial statements were available to be issued, and has determined that there were the following subsequent event: The Fund paid the following distribution:
Record Date | Ex-Date | Pay Date | Distribution Rate | |||
September 25, 2023 | September 26, 2023 | September 26, 2023 | $ | 0.17002392 | ||
21
The Torray Fund
Report of Independent Registered Public Accounting Firm
To the Shareholders of The Torray Fund and
Board of Trustees of The RBB Fund Trust
Opinion on the Financial Statements
We have audited the accompanying statement of assets and liabilities, including the schedule of investments, of The Torray Fund (the “Fund”), a series of The RBB Fund Trust, as of August 31, 2023, the related statements of operations and changes in net assets, the related notes, and the financial highlights for the period from January 1, 2023 through August 31, 2023 and the year ended December 31, 2022 (collectively referred to as the “financial statements”). In our opinion, the financial statements present fairly, in all material respects, the financial position of the Fund as of August 31, 2023, the results of its operations, the changes in net assets, and the financial highlights for each of the periods indicated above, in conformity with accounting principles generally accepted in the United States of America.
The Fund’s financial statements and financial highlights for the years ended December 31, 2021, and prior, were audited by other auditors whose report dated March 1, 2022, expressed an unqualified opinion on those financial statements and financial highlights.
Basis for Opinion
These financial statements are the responsibility of the Fund’s management. Our responsibility is to express an opinion on the Fund’s financial statements based on our audits. We are a public accounting firm registered with the Public Company Accounting Oversight Board (United States) (“PCAOB”) and are required to be independent with respect to the Fund in accordance with the U.S. federal securities laws and the applicable rules and regulations of the Securities and Exchange Commission and the PCAOB.
We conducted our audits in accordance with the standards of the PCAOB. Those standards require that we plan and perform the audits to obtain reasonable assurance about whether the financial statements are free of material misstatement whether due to error or fraud.
Our audits included performing procedures to assess the risks of material misstatement of the financial statements, whether due to error or fraud, and performing procedures that respond to those risks. Such procedures included examining, on a test basis, evidence regarding the amounts and disclosures in the financial statements. Our procedures included confirmation of securities owned as of August 31, 2023, by correspondence with the custodian. Our audits also included evaluating the accounting principles used and significant estimates made by management, as well as evaluating the overall presentation of the financial statements. We believe that our audits provide a reasonable basis for our opinion.
We have served as the Fund’s auditor since 2022.

COHEN & COMPANY, LTD.
Cleveland, Ohio
October 30, 2023
22
The Torray Fund
Trustees and Executive Officers
As of August 31, 2023 (unaudited)
The business and affairs of the Trust are managed under the direction of the Trust’s Board. The Trustees and executive officers of the Trust, their ages, business addresses and principal occupations during the past five years are set forth below.
Name, Address | Position(s) | Term of | Principal Occupations | Other Directorships | Number of |
Independent Trustees | |||||
Julian A. Brodsky | Trustee | June 2021 | Retired. | AMDOCS Limited (service provider to telecommunications companies). | 63 |
Gregory P. Chandler | Trustee | June 2021 | Since 2020, Chief Financial Officer, HC Parent Corp. d/b/a Herspiegel Consulting LLC (life sciences consulting services); 2020, Chief Financial Officer, Avocado Systems Inc. (cyber security software provider); from 2009 - 2020, Chief Financial Officer, Emtec, Inc. (information technology consulting/services). | FS Energy and Power Fund (business development company); Wilmington Funds (12 portfolios) (registered investment company); Emtec, Inc. (until December 2019); FS Investment Corporation (business development company) (until December 2018). | 63 |
Lisa A. Dolly | Trustee | October 2021 | From July 2019-December 2019, Chairman, Pershing LLC (broker dealer, clearing and custody firm); January 2016-June 2019, Chief Executive Officer, Pershing, LLC. | Allfunds Group PLC (United Kingdom wealthtech and fund distribution provider); Securities Industry and Financial Markets Association (trade association for broker dealers, investment banks and asset managers); Hightower Advisors (wealth management firm). | 63 |
23
The Torray Fund
TRUSTEES AND EXECUTIVE OFFICERS (continued)
As of August 31, 2023 (unaudited)
Name, Address | Position(s) | Term of | Principal Occupations | Other Directorships | Number of |
Independent Trustees (continued) | |||||
Nicholas A. Giordano | Trustee | June 2021 | Since 1997, Consultant, financial services organizations. | IntriCon Corporation (biomedical device manufacturer) (until May 2022); Wilmington Funds (12 portfolios) (registered investment company); Independence Blue Cross (healthcare insurance) (until March 2021). | 63 |
Arnold M. Reichman | Chair and Trustee | June 2021 | Retired. | EIP Investment Trust (registered investment company) (until August 2022). | 63 |
Brian T. Shea | Trustee | June 2021 | From 2014-2017, Chief Executive Officer, BNY Mellon Investment Services (fund services, global custodian and securities clearing firm); from 1983- 2014, Chief Executive Officer and various positions, Pershing LLC (broker dealer, clearing and custody firm). | Fidelity National Information Services, Inc. (financial services technology company); Ameriprise Financial, Inc. (financial services company); WisdomTree Investments, Inc. (asset management company) (until March 2019). | 63 |
Robert A. Straniere | Trustee | June 2021 | Since 2009, Administrative Law Judge, New York City; since 1980, Founding Partner, Straniere Law Group (law firm). | None. | 63 |
24
The Torray Fund
TRUSTEES AND EXECUTIVE OFFICERS (continued)
As of August 31, 2023 (unaudited)
Name, Address | Position(s) | Term of | Principal Occupations | Other Directorships | Number of |
Interested Trustee2 | |||||
Robert Sablowsky | Vice Chair and Trustee | June 2021 | Since 2002, Senior Director – Investments and, prior thereto, Executive Vice President, of Oppenheimer & Co., Inc. (a registered broker-dealer). | None. | 63 |
Officers | |||||
Steven Plump | President | August 2022 | From 2011 to 2021, Executive Vice President, PIMCO LLC. | N/A | N/A |
Salvatore Faia, JD, CPA, CFE | Chief Compliance Officer | June 2021 | Since 2004, President, Vigilant Compliance, LLC (investment management services company); since 2005, Independent Trustee of EIP Investment Trust (registered investment company); Since 2004, Chief Compliance Officer of The RBB Fund, Inc.; President of The RBB Fund, Inc. from 2009 to 2022; President of The RBB Fund Trust from 2021 to 2022. | N/A | N/A |
25
The Torray Fund
TRUSTEES AND EXECUTIVE OFFICERS (continued)
As of August 31, 2023 (unaudited)
Name, Address | Position(s) | Term of | Principal Occupations | Other Directorships | Number of |
Officers (continued) | |||||
James G. Shaw | Chief Financial Officer and Secretary
Chief Operating Officer | June 2021
August 2022 | Chief Financial Officer and Secretary (since 2016) and Chief Operating Officer (since 2022) of The RBB Fund,Inc.; Chief Financial Officer and Secretary (since 2021) and Chief Operating Officer (since 2022) of The RBB Fund Trust. | N/A | N/A |
Craig A. Urciuoli | Director of Marketing & Business Development | June 2021 | Director of Marketing & Business Development of The RBB Fund, Inc. (since 2019); from 2000-2019, Managing Director, Third Avenue Management LLC (investment advisory firm). | N/A | N/A |
Jennifer Witt | Assistant Treasurer | June 2021 | Since 2020, Vice President, U.S. Bank Global Fund Services (fund administrative services firm); from 2016 to 2020, Assistant Vice President, U.S. Bank Global Fund Services. | N/A | N/A |
26
The Torray Fund
TRUSTEES AND EXECUTIVE OFFICERS (continued)
As of August 31, 2023 (unaudited)
Name, Address | Position(s) | Term of | Principal Occupations | Other Directorships | Number of |
Officers (continued) | |||||
Edward Paz | Assistant Secretary | June 2021 | Since 2007, Vice President and Counsel, U.S. Bancorp Fund Services, LLC (fund administrative services firm). | N/A | N/A |
Michael P. Malloy | Assistant Secretary | June 2021 | Since 1993, Partner, Faegre Drinker Biddle & Reath LLP (law firm). | N/A | N/A |
Jillian L. Bosmann | Assistant Secretary | June 2021 | Since 2017, Partner, Faegre Drinker Biddle & Reath LLP (law firm). | N/A | N/A |
* | Each Trustee oversees 63 portfolios of the fund complex, consisting of the series in the Trust (10 portfolios) and The RBB Fund, Inc. (53 portfolios). |
1 | Subject to the Trust’s Retirement Policy, each Trustee may continue to serve as a Trustee until the last day of the calendar year in which the applicable Trustee attains age 75 or until his or her successor is elected and qualified or his or her death, resignation or removal. The Board reserves the right to waive the requirements of the Policy with respect to an individual Trustee. The Board has approved waivers of the policy with respect to Messrs. Brodsky, Giordano, Sablowsky and Straniere. Each officer holds office at the pleasure of the Board until the next special meeting of the Trust or until his or her successor is duly elected and qualified, or until he or she dies, resigns or is removed. |
2 | Mr. Sablowsky is considered an “interested person” of the Trust as that term is defined in the 1940 Act and is referred to as an “Interested Trustee.” Mr. Sablowsky is considered an “Interested Trustee” of the Trust by virtue of his position as an employee of Oppenheimer & Co., Inc., a registered broker-dealer. |
27
The Torray Fund
TRUSTEES AND EXECUTIVE OFFICERS (continued)
As of August 31, 2023 (unaudited)
Trustee Experience, Qualifications, Attributes and/or Skills
The information above includes each Trustee’s principal occupations during the last five years. Each Trustee possesses extensive additional experience, skills and attributes relevant to his or her qualifications to serve as a Trustee. The cumulative background of each Trustee led to the conclusion that each Trustee should serve as a Trustee of the Trust. Mr. Brodsky has over 40 years of senior executive-level management experience in the cable television and communications industry. Mr. Chandler has demonstrated leadership and management abilities as evidenced by his senior executive level positions in the investment technology consulting/services and investment banking/brokerage industries, and also serves on various boards. Ms. Dolly has over three decades of experience in the financial services industry, and she has demonstrated her leadership and management abilities by serving in numerous senior executive-level positions. Mr. Giordano has years of experience as a consultant to financial services organizations and also serves on the boards of other registered investment companies. Mr. Reichman brings decades of investment management experience to the Board, in addition to senior executive-level management experience. Mr. Sablowsky has demonstrated leadership and management abilities as evidenced by his senior executive-level positions in the financial services industry. Mr. Shea has demonstrated leadership and management abilities as evidenced by his senior executive-level positions in the brokerage, clearing, banking, and investment services industry, including service on the boards of public companies, industry regulatory organizations and a university. Mr. Straniere has been a practicing attorney for over 30 years and has served on the boards of an asset management company and another registered investment company.
28
The Torray Fund
Other Information
As of August 31, 2023 (unaudited)
Proxy Voting
Policies and procedures that the Fund uses to determine how to vote proxies relating to portfolio securities as well as information regarding how the Fund voted proxies relating to portfolio securities for the most recent twelve-month period ended June 30 are available without charge, upon request, by calling (800) 626-9769 and on the Securities and Exchange Commission’s (“SEC”) website at http://www.sec.gov.
Quarterly Portfolio Schedules
The Trust files its complete schedule of portfolio holdings with the SEC for the first and third fiscal quarters of each fiscal year (quarters ended November 30 and May 31) as an exhibit to its report on Form N-PORT. The Trust’s Forms N-PORT filings are available on the SEC’s website at http://www.sec.gov.
29
The Torray Fund
About Your Fund’s Expenses
As of August 31, 2023 (unaudited)
We believe it is important for you to understand the impact of costs on your investment. All mutual funds have operating expenses. As a shareholder of the Fund, you incur ongoing costs, including advisory fees, and other fund expenses. Operating expenses, which are deducted directly from the Fund’s gross income, directly reduce the investment return of the Fund.
A mutual fund’s expenses are expressed as a percentage of its average net assets. This figure is known as the expense ratio. The following examples are intended to help you understand the ongoing costs (in dollars) of investing in the Fund and to compare these costs with the ongoing costs of investing in other mutual funds. The examples below are based on an investment of $1,000 made at the beginning of the period and held for the entire period from March 1, 2023 to August 31, 2023.
The table below illustrates the Fund’s cost in two ways:
Actual Fund Return This section helps you estimate the actual expenses that you paid over the period. The “Ending Account Value” shown is derived from the Fund’s actual return, and the third column shows the operating expenses that would have been paid by an investor who started with $1,000 in the Fund. You may use the information here, together with the amount invested, to estimate the expenses that you paid over the period.
To do so, simply divide your account value by $1,000 (for example, an $8,600 account value divided by $1,000 = 8.6), then multiply the result by the number given for the Fund under the heading “Expenses Paid During Period” below.
Hypothetical 5% Return This section is intended to help you compare your Fund’s costs with those of other mutual funds. It assumes that the Fund had an annual return of 5% before expenses, and that the expense ratio is unchanged. In this case, because the return used is not the Fund’s actual return, the results do not apply to your investment. The example is useful in making comparisons because the Commission requires all mutual funds to calculate expenses based on a 5% return. You can assess the Fund’s costs by comparing this hypothetical example with the hypothetical examples that appear in shareholder reports of other funds.
Note that expenses shown in the table are meant to highlight and help you compare ongoing costs only. The Fund does not charge transactions fees, such as purchase or redemption fees, nor does it carry a “sales load.”
The calculation assumes no shares were bought or sold during the period. Your actual costs may have been higher or lower, depending on the amount of your investment and the timing of any purchases or redemptions.
More information about the Fund’s expenses, including recent annual expense ratios, can be found in this report. For additional information on operating expenses and other shareholder costs, please refer to the Fund’s prospectus.
Beginning | Ending | Expenses Paid | |
Based on Actual Fund Return(2) | $1,000 | $1,047.30 | $4.90 |
Based on Hypothetical 5% Return (before expenses) | $1,000 | $1,020.42 | $4.84 |
(1) | Expenses are equal to the Fund’s annualized expense ratio for the most recent six-month period of 0.95%, multiplied by the average account value over the period, multiplied by 184/365 to reflect the one-half year period. |
(2) | Based on the actual returns for the six-month period ended August 31, 2023, of 4.73%. |
30
The Torray Fund
Tax Information
As of August 31, 2023 (unaudited)
We are required to advise you within 60 days of the Fund’s fiscal year end regarding the Federal tax status of certain distributions received by shareholders during such fiscal year. The information below is provided for the Fund’s period ended August 31, 2023. All designations are based on financial information available as of the date of this annual report and, accordingly are subject to change. For each item it is the intention of the Fund to designate the maximum amount permitted under the Internal Revenue Code and the regulations thereunder.
Qualified Dividend Income/Dividends Received Deduction
For the period ended August 31, 2023, certain dividends paid by the Fund may be reported as qualified dividend income and may be eligible for taxation at capital gain rates. The percentage of dividends declared from ordinary income designated as qualified dividend income was 100% for the Fund.
For corporate shareholders, the percent of ordinary income distributions qualifying for the corporate dividends received deduction for the period ended August 31, 2023, was 100% for the Fund.
The percentage of taxable ordinary income distributions that are designated as short-term capital gain distributions under Internal Revenue Section 871(k)(2)(C) for the Fund was 0%.
Dividends and distributions received by retirement plans such as IRA’s, Keogh-type plans and 403(b) plans need not be reported as taxable income. However, many retirement plan trusts may need this information for their information reporting.
31
The Torray Fund
Privacy Notice
The Fund collects only relevant information about you that the law allows or requires it to have in order to conduct its business and properly service you. The Fund collects financial and personal information about you (“Personal Information”) directly (e.g., information on account applications and other forms, such as your name, address, and social security number, and information provided to access account information or conduct account transactions online, such as password, account number, e-mail address, and alternate telephone number), and indirectly (e.g., information about your transactions with us, such as transaction amounts, account balance and account holdings).
The Fund does not disclose any non-public personal information about its shareholders or former shareholders other than for everyday business purposes such as to process a transaction, service an account, respond to court orders and legal investigations or as otherwise permitted by law. Third parties that may receive this information include companies that provide transfer agency, technology and administrative services to the Fund, as well as the Fund’s investment adviser who is an affiliate of the Fund. If you maintain a retirement/educational custodial account directly with the Fund, we may also disclose your Personal Information to the custodian for that account for shareholder servicing purposes. The Fund limits access to your Personal Information provided to unaffiliated third parties to information necessary to carry out their assigned responsibilities to the Fund. All shareholder records will be disposed of in accordance with applicable law. The Fund maintains physical, electronic and procedural safeguards to protect your Personal Information and requires its third-party service providers with access to such information to treat your Personal Information with the same high degree of confidentiality.
In the event that you hold shares of the Fund through a financial intermediary, including, but not limited to, a broker-dealer, credit union, bank or trust company, the privacy policy of your financial intermediary governs how your non-public personal information is shared with unaffiliated third parties.
32
INVESTMENT Adviser
Torray Investment Partners LLC
ADMINISTRATOR AND TRANSFER AGENT
U.S. Bancorp Fund Services, LLC
CUSTODIAN
U.S. Bank, N.A.
INDEPENDENT REGISTERED
Cohen & Company, Ltd.
UNDERWRITER
Quasar Distributors, LLC
LEGAL COUNSEL
Faegre Drinker Biddle & Reath LLP |
This report is not authorized for distribution to prospective investors unless preceded or accompanied by a current prospectus. All indices are unmanaged groupings of stocks that are not available for investment.
The
TORRAY
FUND
of The RBB Fund Trust
ANNUAL REPORT
JANUARY 1, 2023 TO
AUGUST 31, 2023
funds.torray.com
(301) 493-4600
(800) 626-9769
Torray-AR23
Item 2. Code of Ethics.
The registrant has adopted a code of ethics that applies to the registrant’s principal executive officer and principal financial officer. The registrant has not made any substantive amendments to its code of ethics during the period covered by this report. The registrant has not granted any waivers from any provisions of the code of ethics during the period covered by this report. A copy of the registrant’s Code of Ethics is filed herewith.
Item 3. Audit Committee Financial Expert.
The registrant’s board of directors has determined that the registrant has at least one audit committee financial expert serving on its audit committee. Julian A. Brodsky, Gregory P. Chandler and Nicholas A. Giordano are the registrant’s audit committee financial experts and each of them is “independent.”
Item 4. Principal Accountant Fees and Services.
Audit Fees
| (a) | The aggregate fees billed for each of the last two fiscal years for professional services rendered by the principal accountant for the audit of the registrant's annual financial statements or services that are normally provided by the accountant in connection with statutory and regulatory filings or engagements for those fiscal years were: |
| Fiscal Year 2023 | Fiscal Year 2022 | |
| Tait, Weller & Baker | $66,000 | $77,500 |
| Ernst & Young LLP | $46,000 | $0 |
| Cohen & Co | $46,500 | $14,500 |
| Aggregate Fees | $158,500 | $92,000 |
Audit-Related Fees
| (b) | The aggregate fees billed in each of the last two fiscal years for assurance and related services by the principal accountant that are reasonably related to the performance of the audit of the registrant's financial statements and are not reported under paragraph (a) of this Item were related to review of the semi-annual reports for Ernst & Young LLP and review of semi-annual reports for Tait, Weller & Baker and were as follows: |
| Fiscal Year 2023 | Fiscal Year 2022 | |
| Tait, Weller & Baker | $2,000 | $2,500 |
| Ernst & Young LLP | $400 | $0 |
| Cohen & Co | $900 | $0 |
| Aggregate Fees | $3,300 | $2,500 |
Tax Fees
| (c) | The aggregate fees billed in each of the last two fiscal years for professional services rendered by the principal accountant for tax compliance, tax advice, and tax planning were related to federal and state tax return review and excise distribution review and were as follows: |
| Fiscal Year 2023 | Fiscal Year 2022 | |
| Tait, Weller & Baker | $13,000 | $15,000 |
| Ernst & Young LLP | $11,000 | $0 |
| Cohen & Co | $15,500 | $3,500 |
| Aggregate Fees | $39,500 | $18,500 |
All Other Fees
| (d) | The aggregate fees billed in each of the last two fiscal years for products and services provided by the principal accountant, other than the services reported in paragraphs (a) through (c) of this Item were: |
| Fiscal Year 2023 | Fiscal Year 2022 | |
| Tait, Weller & Baker | $0 | $0 |
| Ernst & Young LLP | $0 | $0 |
| Cohen & Co | $0 | $0 |
| Aggregate Fees | $0 | $0 |
| (e)(1) | Pre-Approval of Audit and Permitted Non-Audit Services |
| 1. | Pre-Approval Requirements of the Company. The Committee shall pre-approve all auditing services and permissible non-audit services (e.g., tax services) to be provided to the Company by the Auditor, including the fees associated with those services. |
| 2. | Pre-Approval Requirements of Affiliates. Additionally, the Committee shall pre-approve any engagement of the Auditor to provide non-audit services to an investment adviser of a Portfolio or to any affiliate of such investment adviser that provides ongoing services to the Company, if the engagement relates directly to the operations and financial reporting of the Company. |
| 3. | Delegation. The Committee may delegate to the Chairman of the Committee, or if the Chairman is not available, one or more of its members, the authority to grant pre-approvals. The decisions of any member to whom authority is delegated shall be presented to the full Committee at its next scheduled meeting. |
| 4. | Prohibited Services. The Committee shall confirm with the Auditor that the Auditor is not performing contemporaneously with the Company’s audit any prohibited non-audit services for the Company, any investment adviser of a Portfolio, or any affiliates of the Company or such investment advisers. The Auditor is responsible for informing the Committee of whether it believes that a particular service is permissible or prohibited pursuant to applicable regulations and standards. |
| (e)(2) | The percentage of services described in each of paragraphs (b) through (d) of this Item that were approved by the audit committee pursuant to paragraph (c)(7)(i)(C) of Rule 2-01 of Regulation S-X are as follows: |
(b) Not applicable.
(c) Not applicable.
(d) Not applicable.
| (f) | The percentage of hours expended on the principal accountant’s engagement to audit the registrant’s financial statements for the most recent fiscal year that were attributed to work performed by persons other than the principal accountant’s full-time, permanent employees was less than 50%. |
| (g) | The aggregate non-audit fees billed by the registrant’s accountant for services rendered to the registrant, and rendered to the registrant’s investment adviser (not including any sub-adviser whose role is primarily portfolio management and is subcontracted with or overseen by another investment adviser), and any entity controlling, controlled by, or under common control with the adviser that provides ongoing services to the registrant for each of the last two fiscal years of the registrant were: |
| Fiscal Year 2023 | Fiscal Year 2022 | |
| Tait, Weller & Baker | $15,000 | $17,500 |
| Ernst & Young LLP | $11,400 | $0 |
| Cohen & Co | $16,400 | $3,500 |
| Aggregate Fees | $42,800 | $21,000 |
| (h) | Not applicable. |
| (i) | Not applicable. |
| (j) | Not applicable. |
Item 5. Audit Committee of Listed Registrants.
Not applicable.
Item 6. Investments.
| (a) | The registrant’s Schedule of Investments is included as part of the report to shareholders filed under Item 1 of this Form. |
| (b) | Not applicable. |
Item 7. Disclosure of Proxy Voting Policies and Procedures for Closed-End Management Investment Companies.
Not applicable.
Item 8. Portfolio Managers of Closed-End Management Investment Companies.
Not applicable.
Item 9. Purchases of Equity Securities by Closed-End Management Investment Company and Affiliated Purchasers.
Not applicable.
Item 10. Submission of Matters to a Vote of Security Holders.
There have been no material changes to the procedures by which the shareholders may recommend nominees to the registrant’s board of directors, where those changes were implemented after the registrant last provided disclosure in response to the requirements of Item 407(c)(2)(iv) of Regulation S-K (17 CFR 229.407) (as required by Item 22(b)(15) of Schedule 14A (17 CFR 240.14a-101)), or this Item.
Item 11. Controls and Procedures.
| (a) | The Registrant’s Principal Executive and Principal Financial Officers have reviewed the Registrant's disclosure controls and procedures (as defined in Rule 30a-3(c) under the Investment Company Act of 1940 (the “Act”)) as of a date within 90 days of the filing of this report, as required by Rule 30a-3(b) under the Act and Rules 13a-15(b) or 15d-15(b) under the Securities Exchange Act of 1934. Based on their review, such officers have concluded that the disclosure controls and procedures are effective in ensuring that information required to be disclosed in this report is appropriately recorded, processed, summarized and reported and made known to them by others within the Registrant and by the Registrant’s service provider. |
| (b) | There were no changes in the Registrant's internal control over financial reporting (as defined in Rule 30a-3(d) under the Act) that occurred during the period covered by this report that has materially affected, or is reasonably likely to materially affect, the Registrant's internal control over financial reporting. |
Item 12. Disclosure of Securities Lending Activities for Closed-End Management Investment Companies
Not applicable.
Item 13. Exhibits.
| (a)(1) | Senior Officer Code of Ethics, or any amendment thereto, that is the subject of disclosure required by Item 2 is attached hereto. |
| (a)(2) | A separate certification for each principal executive officer and principal financial officer pursuant to Rule 30a-2(a) under the 1940 Act is attached hereto. |
| (a)(3) | Not applicable. |
| (a)(4) | Certifications pursuant to Section 906 of the Sarbanes-Oxley Act of 2002. Furnished herewith |
SIGNATURES
Pursuant to the requirements of the Securities Exchange Act of 1934 and the Investment Company Act of 1940, the registrant has duly caused this report to be signed on its behalf by the undersigned, thereunto duly authorized.
| (Registrant) | The RBB Fund Trust | |
| By (Signature and Title)* | /s/ Steven Plump | |
| Steven Plump, President (principal executive officer) | ||
| Date | 10/31/2023 |
Pursuant to the requirements of the Securities Exchange Act of 1934 and the Investment Company Act of 1940, this report has been signed below by the following persons on behalf of the registrant and in the capacities and on the dates indicated.
| By (Signature and Title)* | /s/ Steven Plump | |
| Steven Plump, President (principal executive officer) | ||
| Date | 10/31/2023 | |
| By (Signature and Title)* | /s/ James Shaw | |
| James Shaw, Chief Financial Officer (principal financial officer) | ||
| Date | 10/31/2023 |
* Print the name and title of each signing officer under his or her signature.