
Exhibit C.V Project Ocala Board Materials August 17, 2021 0Exhibit C.V Project Ocala Board Materials August 17, 2021 0
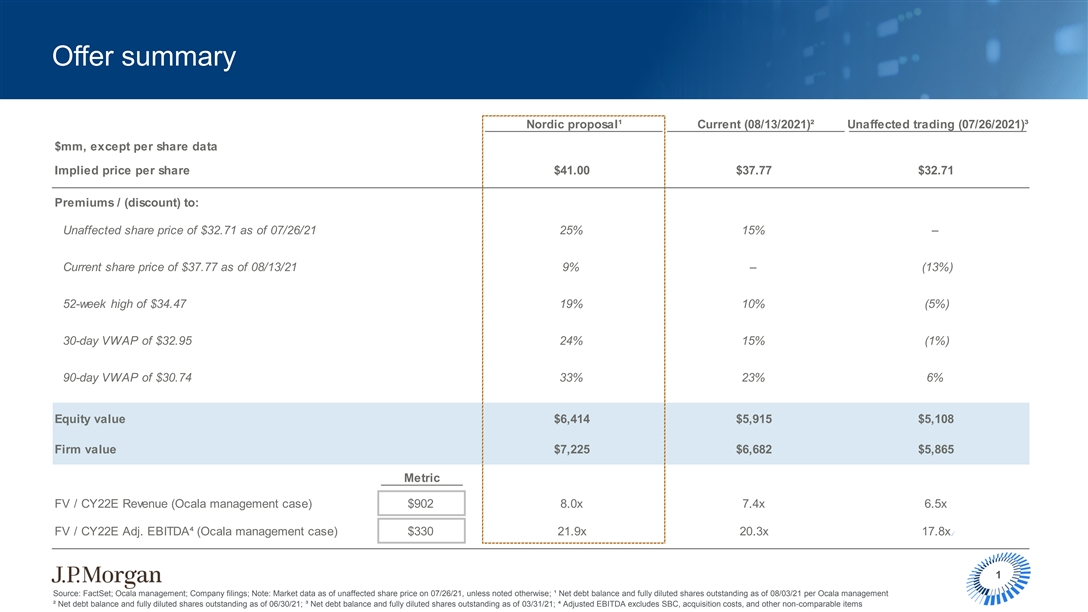
Offer summary Nordic proposal¹ Current (08/13/2021)² Unaffected trading (07/26/2021)³ $mm, except per share data Implied price per share $41.00 $37.77 $32.71 Premiums / (discount) to: Unaffected share price of $32.71 as of 07/26/21 25% 15% – Current share price of $37.77 as of 08/13/21 9% – (13%) 52-week high of $34.47 19% 10% (5%) 30-day VWAP of $32.95 24% 15% (1%) 90-day VWAP of $30.74 33% 23% 6% Equity value $6,414 $5,915 $5,108 Firm value $7,225 $6,682 $5,865 Metric FV / CY22E Revenue (Ocala management case) $902 8.0x 7.4x 6.5x FV / CY22E Adj. EBITDA⁴ (Ocala management case) $330 21.9x 20.3x 17.8x 1 Source: FactSet; Ocala management; Company filings; Note: Market data as of unaffected share price on 07/26/21, unless noted otherwise; ¹ Net debt balance and fully diluted shares outstanding as of 08/03/21 per Ocala management ² Net debt balance and fully diluted shares outstanding as of 06/30/21; ³ Net debt balance and fully diluted shares outstanding as of 03/31/21; ⁴ Adjusted EBITDA excludes SBC, acquisition costs, and other non-comparable items
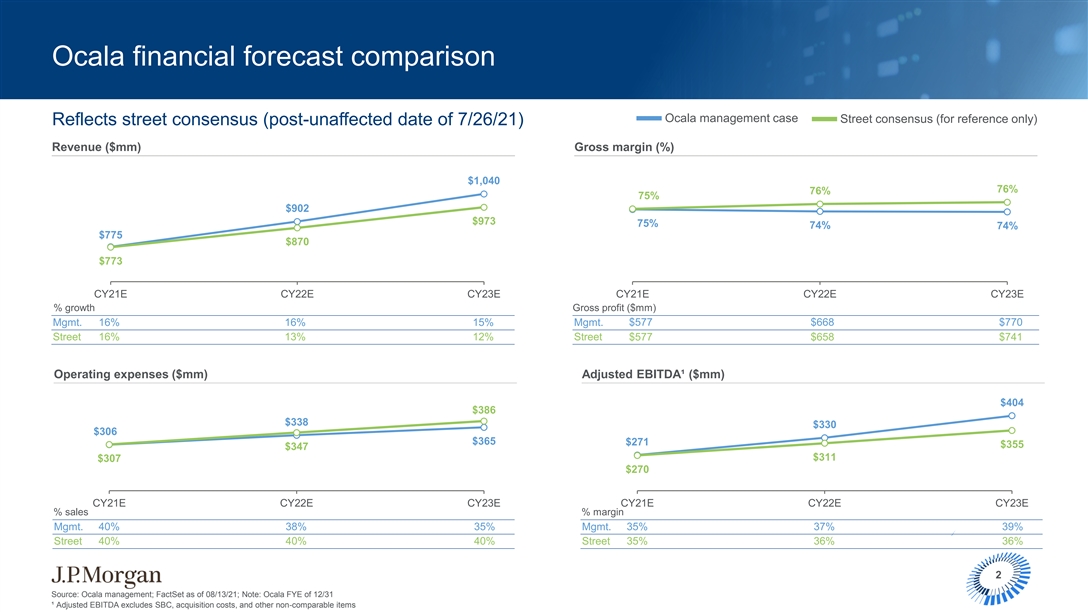
Ocala financial forecast comparison Ocala management case Street consensus (for reference only) Reflects street consensus (post-unaffected date of 7/26/21) Revenue ($mm) Gross margin (%) $1,040 76% 76% 75% $902 $973 75% 74% 74% $775 $870 $773 CY21E CY22E CY23E CY21E CY22E CY23E % growth Gross profit ($mm) Mgmt. 16% 16% 15% Mgmt. $577 $668 $770 Street 16% 13% 12% Street $577 $658 $741 Operating expenses ($mm) Adjusted EBITDA¹ ($mm) $404 $386 $338 $330 $306 $365 $271 $355 $347 $311 $307 $270 CY21E CY22E CY23E CY21E CY22E CY23E % sales % margin Mgmt. 40% 38% 35% Mgmt. 35% 37% 39% Street 40% 40% 40% Street 35% 36% 36% 2 Source: Ocala management; FactSet as of 08/13/21; Note: Ocala FYE of 12/31 ¹ Adjusted EBITDA excludes SBC, acquisition costs, and other non-comparable itemsOcala financial forecast comparison Ocala management case Street consensus (for reference only) Reflects street consensus (post-unaffected date of 7/26/21) Revenue ($mm) Gross margin (%) $1,040 76% 76% 75% $902 $973 75% 74% 74% $775 $870 $773 CY21E CY22E CY23E CY21E CY22E CY23E % growth Gross profit ($mm) Mgmt. 16% 16% 15% Mgmt. $577 $668 $770 Street 16% 13% 12% Street $577 $658 $741 Operating expenses ($mm) Adjusted EBITDA¹ ($mm) $404 $386 $338 $330 $306 $365 $271 $355 $347 $311 $307 $270 CY21E CY22E CY23E CY21E CY22E CY23E % sales % margin Mgmt. 40% 38% 35% Mgmt. 35% 37% 39% Street 40% 40% 40% Street 35% 36% 36% 2 Source: Ocala management; FactSet as of 08/13/21; Note: Ocala FYE of 12/31 ¹ Adjusted EBITDA excludes SBC, acquisition costs, and other non-comparable items
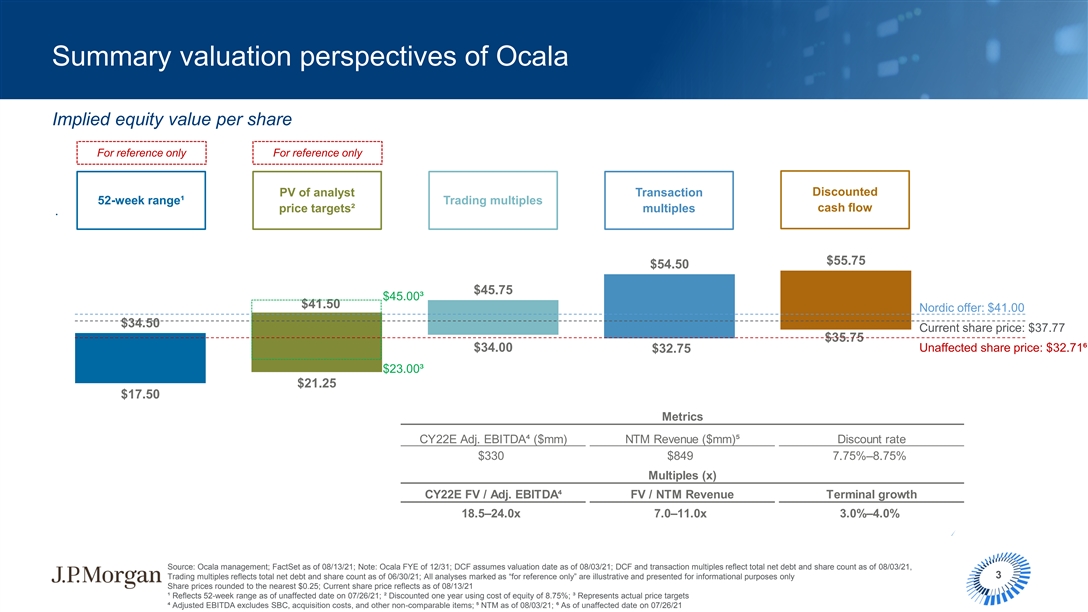
Summary valuation perspectives of Ocala Implied equity value per share For reference only For reference only Discounted PV of analyst Transaction 52-week range¹ Trading multiples price targets² multiples cash flow $55.75 $54.50 $45.75 $45.00³ $41.50 Nordic offer: $41.00 $34.50 Current share price: $37.77 $35.75 $34.00 Unaffected share price: $32.71⁶ $32.75 $23.00³ $21.25 $17.50 Metrics CY22E Adj. EBITDA⁴ ($mm) NTM Revenue ($mm)⁵ Discount rate $330 $849 7.75%–8.75% Multiples (x) CY22E FV / Adj. EBITDA⁴ FV / NTM Revenue Terminal growth 18.5–24.0x 7.0–11.0x 3.0%–4.0% Source: Ocala management; FactSet as of 08/13/21; Note: Ocala FYE of 12/31; DCF assumes valuation date as of 08/03/21; DCF and transaction multiples reflect total net debt and share count as of 08/03/21, Trading multiples reflects total net debt and share count as of 06/30/21; All analyses marked as “for reference only” are illustrative and presented for informational purposes only 3 Share prices rounded to the nearest $0.25; Current share price reflects as of 08/13/21 ¹ Reflects 52-week range as of unaffected date on 07/26/21; ² Discounted one year using cost of equity of 8.75%; ³ Represents actual price targets ⁴ Adjusted EBITDA excludes SBC, acquisition costs, and other non-comparable items; ⁵ NTM as of 08/03/21; ⁶ As of unaffected date on 07/26/21Summary valuation perspectives of Ocala Implied equity value per share For reference only For reference only Discounted PV of analyst Transaction 52-week range¹ Trading multiples price targets² multiples cash flow $55.75 $54.50 $45.75 $45.00³ $41.50 Nordic offer: $41.00 $34.50 Current share price: $37.77 $35.75 $34.00 Unaffected share price: $32.71⁶ $32.75 $23.00³ $21.25 $17.50 Metrics CY22E Adj. EBITDA⁴ ($mm) NTM Revenue ($mm)⁵ Discount rate $330 $849 7.75%–8.75% Multiples (x) CY22E FV / Adj. EBITDA⁴ FV / NTM Revenue Terminal growth 18.5–24.0x 7.0–11.0x 3.0%–4.0% Source: Ocala management; FactSet as of 08/13/21; Note: Ocala FYE of 12/31; DCF assumes valuation date as of 08/03/21; DCF and transaction multiples reflect total net debt and share count as of 08/03/21, Trading multiples reflects total net debt and share count as of 06/30/21; All analyses marked as “for reference only” are illustrative and presented for informational purposes only 3 Share prices rounded to the nearest $0.25; Current share price reflects as of 08/13/21 ¹ Reflects 52-week range as of unaffected date on 07/26/21; ² Discounted one year using cost of equity of 8.75%; ³ Represents actual price targets ⁴ Adjusted EBITDA excludes SBC, acquisition costs, and other non-comparable items; ⁵ NTM as of 08/03/21; ⁶ As of unaffected date on 07/26/21

Public company trading and operating metrics For reference only For reference only For reference only For reference only Revenue CAGR Revenue growth Gross margin EBITDA margin FV / EBITDA Firm value CY19A – CY21E CY22E CY22E CY22E CY22E ($bn) Street Unaffected¹ 4 $5.9 9% 12% 76% 36% 18.8x 23.4x Street Current 4 $6.7 10% 13% 75% 36% 21.5x 26.7x (For reference only) Management 10% 16% 74% 37% $6.7 18% 10% 84% 36% 24.3x $17.1 8% 10% 71% 36% 23.5x $17.1 3 12% 9% N/A 50% 19.0x $15.1 3 NA 12% 10% 65% 23% 15.1x $14.6 15% 16% 74% 23% 26.6x $4.4 17% 16% 75% 28% 19.1x $4.0 12% 12% 80% 42% 21.0x $4.0 26% 24% 17.8x $7.2 11% 15% 2 57% 34% 23.4x $6.8 2% 8% 50% 22% 25.9x $7.2 11% 14% Source: Company filings, Ocala management; FactSet as of 08/13/21; Note: Ocala FYE of 12/31; Sorted by firm value within groupings; All analyses marked as “for reference only” are illustrative and presented for informational purposes only 2 3 4 ¹ Unaffected market date as of 07/26/21; Represents organic growth, which excludes revenue from WageWorks acquisition; Not reported; Adjusted EBITDA burdened by capitalized software (2022E capitalized software calculated as 3-yr historical average), for reference only. Inovalon EBITDA reflects adjusted EBITDA which excludes SBC, acquisition costs, and other non-comparable items 4 Healthcare tech SoftwarePublic company trading and operating metrics For reference only For reference only For reference only For reference only Revenue CAGR Revenue growth Gross margin EBITDA margin FV / EBITDA Firm value CY19A – CY21E CY22E CY22E CY22E CY22E ($bn) Street Unaffected¹ 4 $5.9 9% 12% 76% 36% 18.8x 23.4x Street Current 4 $6.7 10% 13% 75% 36% 21.5x 26.7x (For reference only) Management 10% 16% 74% 37% $6.7 18% 10% 84% 36% 24.3x $17.1 8% 10% 71% 36% 23.5x $17.1 3 12% 9% N/A 50% 19.0x $15.1 3 NA 12% 10% 65% 23% 15.1x $14.6 15% 16% 74% 23% 26.6x $4.4 17% 16% 75% 28% 19.1x $4.0 12% 12% 80% 42% 21.0x $4.0 26% 24% 17.8x $7.2 11% 15% 2 57% 34% 23.4x $6.8 2% 8% 50% 22% 25.9x $7.2 11% 14% Source: Company filings, Ocala management; FactSet as of 08/13/21; Note: Ocala FYE of 12/31; Sorted by firm value within groupings; All analyses marked as “for reference only” are illustrative and presented for informational purposes only 2 3 4 ¹ Unaffected market date as of 07/26/21; Represents organic growth, which excludes revenue from WageWorks acquisition; Not reported; Adjusted EBITDA burdened by capitalized software (2022E capitalized software calculated as 3-yr historical average), for reference only. Inovalon EBITDA reflects adjusted EBITDA which excludes SBC, acquisition costs, and other non-comparable items 4 Healthcare tech Software
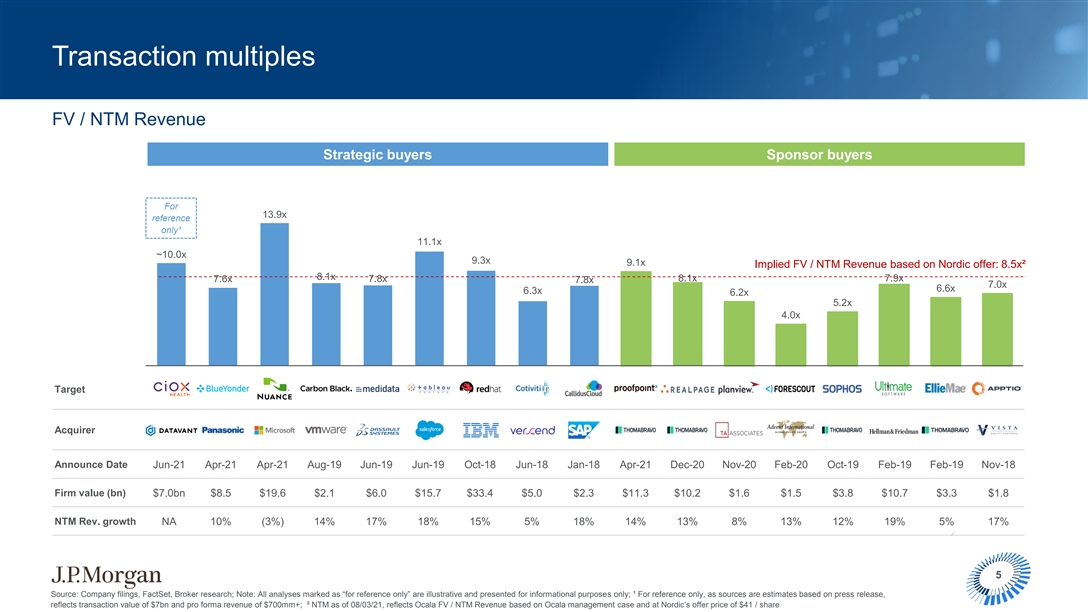
Transaction multiples FV / NTM Revenue Strategic buyers Sponsor buyers For 13.9x reference only¹ 11.1x ~10.0x 9.3x 9.1x Implied FV / NTM Revenue based on Nordic offer: 8.5x² 8.1x 7.6x 7.8x 8.1x 7.9x 7.8x 7.0x 6.6x 6.3x 6.2x 5.2x 4.0x Target Acquirer Announce Date Jun-21 Apr-21 Apr-21 Aug-19 Jun-19 Jun-19 Oct-18 Jun-18 Jan-18 Apr-21 Dec-20 Nov-20 Feb-20 Oct-19 Feb-19 Feb-19 Nov-18 Firm value (bn) $7.0bn $8.5 $19.6 $2.1 $6.0 $15.7 $33.4 $5.0 $2.3 $11.3 $10.2 $1.6 $1.5 $3.8 $10.7 $3.3 $1.8 NTM Rev. growth NA 10% (3%) 14% 17% 18% 15% 5% 18% 14% 13% 8% 13% 12% 19% 5% 17% 5 Source: Company filings, FactSet, Broker research; Note: All analyses marked as “for reference only” are illustrative and presented for informational purposes only; ¹ For reference only, as sources are estimates based on press release, reflects transaction value of $7bn and pro forma revenue of $700mm+; ² NTM as of 08/03/21, reflects Ocala FV / NTM Revenue based on Ocala management case and at Nordic’s offer price of $41 / shareTransaction multiples FV / NTM Revenue Strategic buyers Sponsor buyers For 13.9x reference only¹ 11.1x ~10.0x 9.3x 9.1x Implied FV / NTM Revenue based on Nordic offer: 8.5x² 8.1x 7.6x 7.8x 8.1x 7.9x 7.8x 7.0x 6.6x 6.3x 6.2x 5.2x 4.0x Target Acquirer Announce Date Jun-21 Apr-21 Apr-21 Aug-19 Jun-19 Jun-19 Oct-18 Jun-18 Jan-18 Apr-21 Dec-20 Nov-20 Feb-20 Oct-19 Feb-19 Feb-19 Nov-18 Firm value (bn) $7.0bn $8.5 $19.6 $2.1 $6.0 $15.7 $33.4 $5.0 $2.3 $11.3 $10.2 $1.6 $1.5 $3.8 $10.7 $3.3 $1.8 NTM Rev. growth NA 10% (3%) 14% 17% 18% 15% 5% 18% 14% 13% 8% 13% 12% 19% 5% 17% 5 Source: Company filings, FactSet, Broker research; Note: All analyses marked as “for reference only” are illustrative and presented for informational purposes only; ¹ For reference only, as sources are estimates based on press release, reflects transaction value of $7bn and pro forma revenue of $700mm+; ² NTM as of 08/03/21, reflects Ocala FV / NTM Revenue based on Ocala management case and at Nordic’s offer price of $41 / share
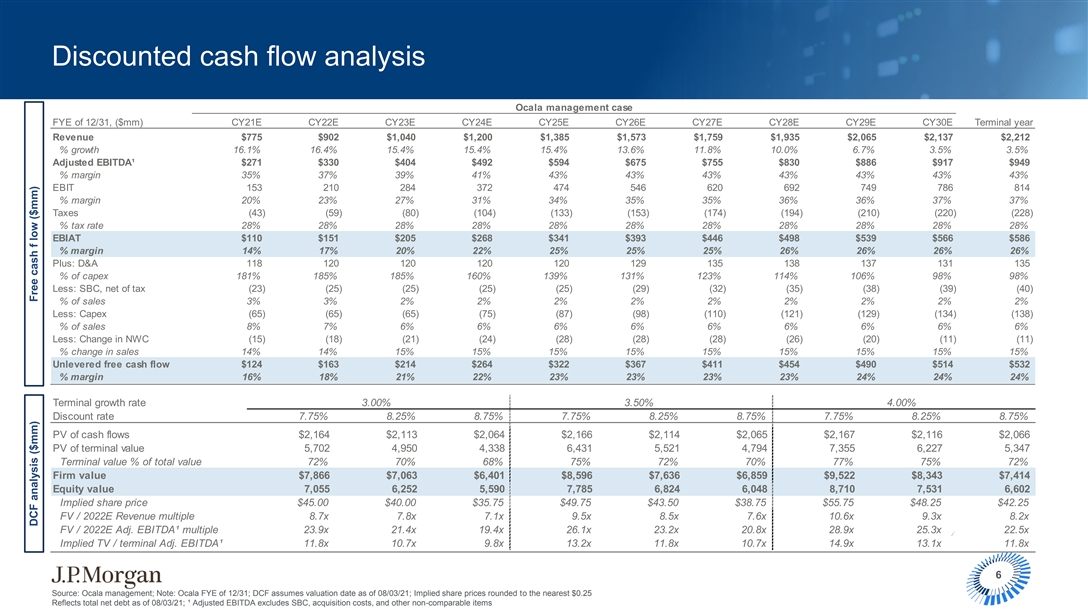
Discounted cash flow analysis Ocala management case FYE of 12/31, ($mm) CY21E CY22E CY23E CY24E CY25E CY26E CY27E CY28E CY29E CY30E Terminal year Revenue $775 $902 $1,040 $1,200 $1,385 $1,573 $1,759 $1,935 $2,065 $2,137 $2,212 % growth 16.1% 16.4% 15.4% 15.4% 15.4% 13.6% 11.8% 10.0% 6.7% 3.5% 3.5% Adjusted EBITDA¹ $271 $330 $404 $492 $594 $675 $755 $830 $886 $917 $949 % margin 35% 37% 39% 41% 43% 43% 43% 43% 43% 43% 43% EBIT 153 210 284 372 474 546 620 692 749 786 814 % margin 20% 23% 27% 31% 34% 35% 35% 36% 36% 37% 37% Taxes (43) (59) (80) (104) (133) (153) (174) (194) (210) (220) (228) % tax rate 28% 28% 28% 28% 28% 28% 28% 28% 28% 28% 28% EBIAT $110 $151 $205 $268 $341 $393 $446 $498 $539 $566 $586 % margin 14% 17% 20% 22% 25% 25% 25% 26% 26% 26% 26% Plus: D&A 118 120 120 120 120 129 135 138 137 131 135 % of capex 181% 185% 185% 160% 139% 131% 123% 114% 106% 98% 98% Less: SBC, net of tax (23) (25) (25) (25) (25) (29) (32) (35) (38) (39) (40) % of sales 3% 3% 2% 2% 2% 2% 2% 2% 2% 2% 2% Less: Capex (65) (65) (65) (75) (87) (98) (110) (121) (129) (134) (138) % of sales 8% 7% 6% 6% 6% 6% 6% 6% 6% 6% 6% Less: Change in NWC (15) (18) (21) (24) (28) (28) (28) (26) (20) (11) (11) % change in sales 14% 14% 15% 15% 15% 15% 15% 15% 15% 15% 15% Unlevered free cash flow $124 $163 $214 $264 $322 $367 $411 $454 $490 $514 $532 % margin 16% 18% 21% 22% 23% 23% 23% 23% 24% 24% 24% Terminal growth rate 3.00% 3.50% 4.00% Discount rate 7.75% 8.25% 8.75% 7.75% 8.25% 8.75% 7.75% 8.25% 8.75% PV of cash flows $2,164 $2,113 $2,064 $2,166 $2,114 $2,065 $2,167 $2,116 $2,066 PV of terminal value 5,702 4,950 4,338 6,431 5,521 4,794 7,355 6,227 5,347 Terminal value % of total value 72% 70% 68% 75% 72% 70% 77% 75% 72% Firm value $7,866 $7,063 $6,401 $8,596 $7,636 $6,859 $9,522 $8,343 $7,414 Equity value 7,055 6,252 5,590 7,785 6,824 6,048 8,710 7,531 6,602 Implied share price $45.00 $40.00 $35.75 $49.75 $43.50 $38.75 $55.75 $48.25 $42.25 FV / 2022E Revenue multiple 8.7x 7.8x 7.1x 9.5x 8.5x 7.6x 10.6x 9.3x 8.2x FV / 2022E Adj. EBITDA¹ multiple 23.9x 21.4x 19.4x 26.1x 23.2x 20.8x 28.9x 25.3x 22.5x Implied TV / terminal Adj. EBITDA¹ 11.8x 10.7x 9.8x 13.2x 11.8x 10.7x 14.9x 13.1x 11.8x 6 Source: Ocala management; Note: Ocala FYE of 12/31; DCF assumes valuation date as of 08/03/21; Implied share prices rounded to the nearest $0.25 Reflects total net debt as of 08/03/21; ¹ Adjusted EBITDA excludes SBC, acquisition costs, and other non-comparable items DCF analysis ($mm) Free cash f low ($mm)Discounted cash flow analysis Ocala management case FYE of 12/31, ($mm) CY21E CY22E CY23E CY24E CY25E CY26E CY27E CY28E CY29E CY30E Terminal year Revenue $775 $902 $1,040 $1,200 $1,385 $1,573 $1,759 $1,935 $2,065 $2,137 $2,212 % growth 16.1% 16.4% 15.4% 15.4% 15.4% 13.6% 11.8% 10.0% 6.7% 3.5% 3.5% Adjusted EBITDA¹ $271 $330 $404 $492 $594 $675 $755 $830 $886 $917 $949 % margin 35% 37% 39% 41% 43% 43% 43% 43% 43% 43% 43% EBIT 153 210 284 372 474 546 620 692 749 786 814 % margin 20% 23% 27% 31% 34% 35% 35% 36% 36% 37% 37% Taxes (43) (59) (80) (104) (133) (153) (174) (194) (210) (220) (228) % tax rate 28% 28% 28% 28% 28% 28% 28% 28% 28% 28% 28% EBIAT $110 $151 $205 $268 $341 $393 $446 $498 $539 $566 $586 % margin 14% 17% 20% 22% 25% 25% 25% 26% 26% 26% 26% Plus: D&A 118 120 120 120 120 129 135 138 137 131 135 % of capex 181% 185% 185% 160% 139% 131% 123% 114% 106% 98% 98% Less: SBC, net of tax (23) (25) (25) (25) (25) (29) (32) (35) (38) (39) (40) % of sales 3% 3% 2% 2% 2% 2% 2% 2% 2% 2% 2% Less: Capex (65) (65) (65) (75) (87) (98) (110) (121) (129) (134) (138) % of sales 8% 7% 6% 6% 6% 6% 6% 6% 6% 6% 6% Less: Change in NWC (15) (18) (21) (24) (28) (28) (28) (26) (20) (11) (11) % change in sales 14% 14% 15% 15% 15% 15% 15% 15% 15% 15% 15% Unlevered free cash flow $124 $163 $214 $264 $322 $367 $411 $454 $490 $514 $532 % margin 16% 18% 21% 22% 23% 23% 23% 23% 24% 24% 24% Terminal growth rate 3.00% 3.50% 4.00% Discount rate 7.75% 8.25% 8.75% 7.75% 8.25% 8.75% 7.75% 8.25% 8.75% PV of cash flows $2,164 $2,113 $2,064 $2,166 $2,114 $2,065 $2,167 $2,116 $2,066 PV of terminal value 5,702 4,950 4,338 6,431 5,521 4,794 7,355 6,227 5,347 Terminal value % of total value 72% 70% 68% 75% 72% 70% 77% 75% 72% Firm value $7,866 $7,063 $6,401 $8,596 $7,636 $6,859 $9,522 $8,343 $7,414 Equity value 7,055 6,252 5,590 7,785 6,824 6,048 8,710 7,531 6,602 Implied share price $45.00 $40.00 $35.75 $49.75 $43.50 $38.75 $55.75 $48.25 $42.25 FV / 2022E Revenue multiple 8.7x 7.8x 7.1x 9.5x 8.5x 7.6x 10.6x 9.3x 8.2x FV / 2022E Adj. EBITDA¹ multiple 23.9x 21.4x 19.4x 26.1x 23.2x 20.8x 28.9x 25.3x 22.5x Implied TV / terminal Adj. EBITDA¹ 11.8x 10.7x 9.8x 13.2x 11.8x 10.7x 14.9x 13.1x 11.8x 6 Source: Ocala management; Note: Ocala FYE of 12/31; DCF assumes valuation date as of 08/03/21; Implied share prices rounded to the nearest $0.25 Reflects total net debt as of 08/03/21; ¹ Adjusted EBITDA excludes SBC, acquisition costs, and other non-comparable items DCF analysis ($mm) Free cash f low ($mm)

Appendix 7Appendix 7
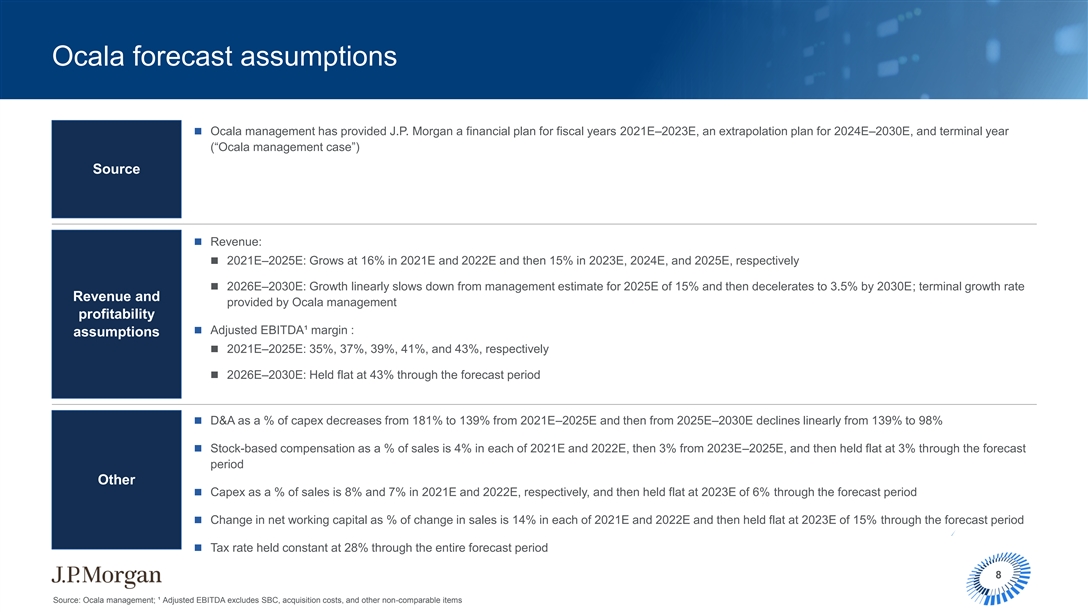
Ocala forecast assumptions n Ocala management has provided J.P. Morgan a financial plan for fiscal years 2021E–2023E, an extrapolation plan for 2024E–2030E, and terminal year (“Ocala management case”) Source n Revenue: n 2021E–2025E: Grows at 16% in 2021E and 2022E and then 15% in 2023E, 2024E, and 2025E, respectively n 2026E–2030E: Growth linearly slows down from management estimate for 2025E of 15% and then decelerates to 3.5% by 2030E; terminal growth rate Revenue and provided by Ocala management profitability n Adjusted EBITDA¹ margin : assumptions n 2021E–2025E: 35%, 37%, 39%, 41%, and 43%, respectively n 2026E–2030E: Held flat at 43% through the forecast period n D&A as a % of capex decreases from 181% to 139% from 2021E–2025E and then from 2025E–2030E declines linearly from 139% to 98% n Stock-based compensation as a % of sales is 4% in each of 2021E and 2022E, then 3% from 2023E–2025E, and then held flat at 3% through the forecast period Other n Capex as a % of sales is 8% and 7% in 2021E and 2022E, respectively, and then held flat at 2023E of 6% through the forecast period n Change in net working capital as % of change in sales is 14% in each of 2021E and 2022E and then held flat at 2023E of 15% through the forecast period n Tax rate held constant at 28% through the entire forecast period 8 Source: Ocala management; ¹ Adjusted EBITDA excludes SBC, acquisition costs, and other non-comparable itemsOcala forecast assumptions n Ocala management has provided J.P. Morgan a financial plan for fiscal years 2021E–2023E, an extrapolation plan for 2024E–2030E, and terminal year (“Ocala management case”) Source n Revenue: n 2021E–2025E: Grows at 16% in 2021E and 2022E and then 15% in 2023E, 2024E, and 2025E, respectively n 2026E–2030E: Growth linearly slows down from management estimate for 2025E of 15% and then decelerates to 3.5% by 2030E; terminal growth rate Revenue and provided by Ocala management profitability n Adjusted EBITDA¹ margin : assumptions n 2021E–2025E: 35%, 37%, 39%, 41%, and 43%, respectively n 2026E–2030E: Held flat at 43% through the forecast period n D&A as a % of capex decreases from 181% to 139% from 2021E–2025E and then from 2025E–2030E declines linearly from 139% to 98% n Stock-based compensation as a % of sales is 4% in each of 2021E and 2022E, then 3% from 2023E–2025E, and then held flat at 3% through the forecast period Other n Capex as a % of sales is 8% and 7% in 2021E and 2022E, respectively, and then held flat at 2023E of 6% through the forecast period n Change in net working capital as % of change in sales is 14% in each of 2021E and 2022E and then held flat at 2023E of 15% through the forecast period n Tax rate held constant at 28% through the entire forecast period 8 Source: Ocala management; ¹ Adjusted EBITDA excludes SBC, acquisition costs, and other non-comparable items

Key updates to J.P Morgan’s analyses of Ocala June 2021 August 2021 Board presentation (Current) n Management provided projections (May 2021)n Management provided projections (August 2021) Management model n Valuation date: 03/31/21n Valuation date: 08/03/21 n 18.0–22.0x CY22E FV / Adj. EBITDAn 18.5–24.0x CY22E FV / Adj. EBITDA Trading multiples n 7.0–11.0x FV / NTM Revenuen No change Transactions multiples n Discount rate: 7.75–8.75%n Discount rate: No change n Beta range: 0.90–1.30n Beta range: No change n Risk free rate: 1.63%n Risk free rate: 1.31% Discounted cash flow Equity risk premium range: 6.00–7.00% Equity risk premium range: 6.25–7.25% nn n Cost of debt: 4.18%n Cost of debt: 3.98% n Terminal growth rate: 3.0–4.0%n Terminal growth rate: No change 9Key updates to J.P Morgan’s analyses of Ocala June 2021 August 2021 Board presentation (Current) n Management provided projections (May 2021)n Management provided projections (August 2021) Management model n Valuation date: 03/31/21n Valuation date: 08/03/21 n 18.0–22.0x CY22E FV / Adj. EBITDAn 18.5–24.0x CY22E FV / Adj. EBITDA Trading multiples n 7.0–11.0x FV / NTM Revenuen No change Transactions multiples n Discount rate: 7.75–8.75%n Discount rate: No change n Beta range: 0.90–1.30n Beta range: No change n Risk free rate: 1.63%n Risk free rate: 1.31% Discounted cash flow Equity risk premium range: 6.00–7.00% Equity risk premium range: 6.25–7.25% nn n Cost of debt: 4.18%n Cost of debt: 3.98% n Terminal growth rate: 3.0–4.0%n Terminal growth rate: No change 9
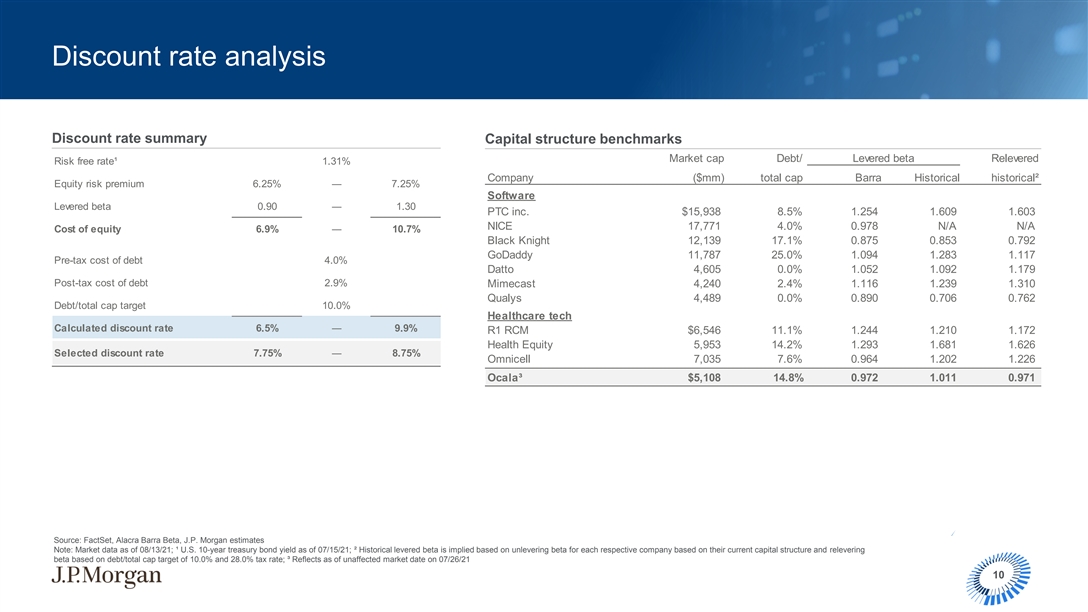
Discount rate analysis Discount rate summary Capital structure benchmarks Market cap Debt/ Levered beta Relevered Risk free rate¹ 1.31% Company ($mm) total cap Barra Historical historical² Equity risk premium 6.25% ― 7.25% Software Other software Levered beta 0.90 ― 1.30 PTC inc. $15,938 8.5% 1.254 1.609 1.603 NICE 17,771 4.0% 0.978 N/A N/A Cost of equity 6.9% ― 10.7% Black Knight 12,139 17.1% 0.875 0.853 0.792 GoDaddy 11,787 25.0% 1.094 1.283 1.117 Pre-tax cost of debt 4.0% Datto 4,605 0.0% 1.052 1.092 1.179 Post-tax cost of debt 2.9% Mimecast 4,240 2.4% 1.116 1.239 1.310 Qualys 4,489 0.0% 0.890 0.706 0.762 Debt/total cap target 10.0% Healthcare tech Calculated discount rate 6.5% ― 9.9% R1 RCM $6,546 11.1% 1.244 1.210 1.172 Health Equity 5,953 14.2% 1.293 1.681 1.626 Selected discount rate 7.75% ― 8.75% Omnicell 7,035 7.6% 0.964 1.202 1.226 Ocala³ $5,108 14.8% 0.972 1.011 0.971 Source: FactSet, Alacra Barra Beta, J.P. Morgan estimates Note: Market data as of 08/13/21; ¹ U.S. 10-year treasury bond yield as of 07/15/21; ² Historical levered beta is implied based on unlevering beta for each respective company based on their current capital structure and relevering beta based on debt/total cap target of 10.0% and 28.0% tax rate; ³ Reflects as of unaffected market date on 07/26/21 10
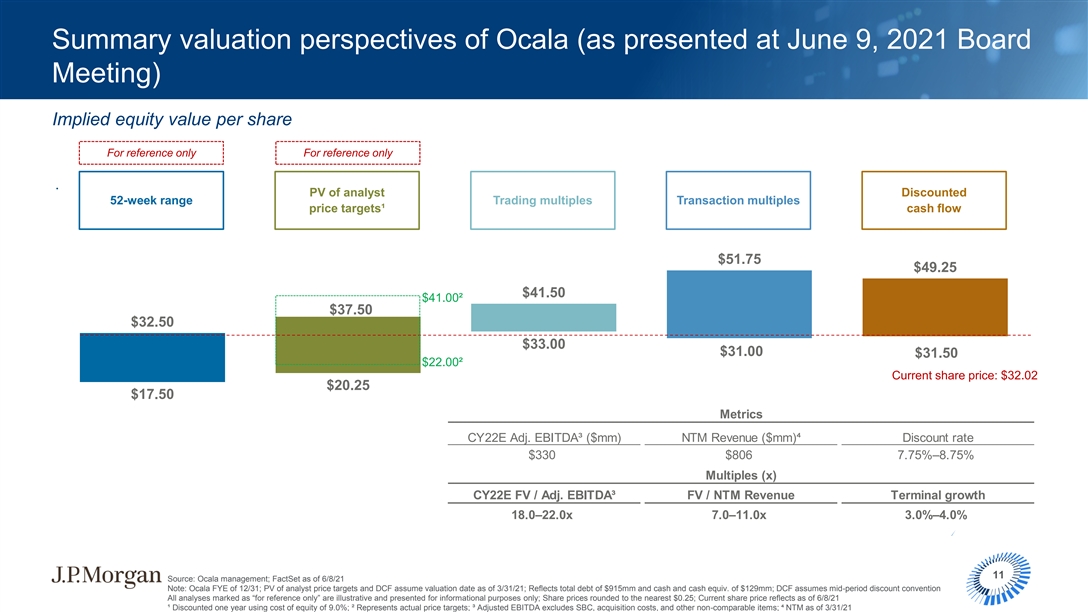
Summary valuation perspectives of Ocala (as presented at June 9, 2021 Board Meeting) Implied equity value per share For reference only For reference only PV of analyst Discounted 52-week range Trading multiples Transaction multiples price targets¹ cash flow $51.75 $49.25 $41.50 $41.00² $37.50 $32.50 $33.00 $31.00 $31.50 $22.00² Current share price: $32.02 $20.25 $17.50 Metrics CY22E Adj. EBITDA³ ($mm) NTM Revenue ($mm)⁴ Discount rate $330 $806 7.75%–8.75% Multiples (x) CY22E FV / Adj. EBITDA³ FV / NTM Revenue Terminal growth 18.0–22.0x 7.0–11.0x 3.0%–4.0% 11 Source: Ocala management; FactSet as of 6/8/21 Note: Ocala FYE of 12/31; PV of analyst price targets and DCF assume valuation date as of 3/31/21; Reflects total debt of $915mm and cash and cash equiv. of $129mm; DCF assumes mid-period discount convention All analyses marked as “for reference only” are illustrative and presented for informational purposes only; Share prices rounded to the nearest $0.25; Current share price reflects as of 6/8/21 ¹ Discounted one year using cost of equity of 9.0%; ² Represents actual price targets; ³ Adjusted EBITDA excludes SBC, acquisition costs, and other non-comparable items; ⁴ NTM as of 3/31/21Summary valuation perspectives of Ocala (as presented at June 9, 2021 Board Meeting) Implied equity value per share For reference only For reference only PV of analyst Discounted 52-week range Trading multiples Transaction multiples price targets¹ cash flow $51.75 $49.25 $41.50 $41.00² $37.50 $32.50 $33.00 $31.00 $31.50 $22.00² Current share price: $32.02 $20.25 $17.50 Metrics CY22E Adj. EBITDA³ ($mm) NTM Revenue ($mm)⁴ Discount rate $330 $806 7.75%–8.75% Multiples (x) CY22E FV / Adj. EBITDA³ FV / NTM Revenue Terminal growth 18.0–22.0x 7.0–11.0x 3.0%–4.0% 11 Source: Ocala management; FactSet as of 6/8/21 Note: Ocala FYE of 12/31; PV of analyst price targets and DCF assume valuation date as of 3/31/21; Reflects total debt of $915mm and cash and cash equiv. of $129mm; DCF assumes mid-period discount convention All analyses marked as “for reference only” are illustrative and presented for informational purposes only; Share prices rounded to the nearest $0.25; Current share price reflects as of 6/8/21 ¹ Discounted one year using cost of equity of 9.0%; ² Represents actual price targets; ³ Adjusted EBITDA excludes SBC, acquisition costs, and other non-comparable items; ⁴ NTM as of 3/31/21

This presentation was prepared exclusively for the benefit and internal use of the J.P. Morgan client to whom it is directly addressed and delivered (including such client’s subsidiaries, the “Company”) in order to assist the Company in evaluating, on a preliminary basis, the feasibility of a possible transaction or transactions and does not carry any right of publication or disclosure, in whole or in part, to any other party. This presentation is for discussion purposes only and is incomplete without reference to, and should be viewed solely in conjunction with, the oral briefing provided by J.P. Morgan. Neither this presentation nor any of its contents may be disclosed or used for any other purpose without the prior written consent of J.P. Morgan. The information in this presentation is based upon any management forecasts supplied to us and reflects prevailing conditions and our views as of this date, all of which are accordingly subject to change. J.P. Morgan’s opinions and estimates constitute J.P. Morgan’s judgment and should be regarded as indicative, preliminary and for illustrative purposes only. In preparing this presentation, we have relied upon and assumed, without independent verification, the accuracy and completeness of all information available from public sources or which was provided to us by or on behalf of the Company or which was otherwise reviewed by us. In addition, our analyses are not and do not purport to be appraisals of the assets, stock, or business of the Company or any other entity. J.P. Morgan makes no representations as to the actual value which may be received in connection with a transaction nor the legal, tax or accounting effects of consummating a transaction. Unless expressly contemplated hereby, the information in this presentation does not take into account the effects of a possible transaction or transactions involving an actual or potential change of control, which may have significant valuation and other effects. Notwithstanding anything herein to the contrary, the Company and each of its employees, representatives or other agents may disclose to any and all persons, without limitation of any kind, the U.S. federal and state income tax treatment and the U.S. federal and state income tax structure of the transactions contemplated hereby and all materials of any kind (including opinions or other tax analyses) that are provided to the Company relating to such tax treatment and tax structure insofar as such treatment and/or structure relates to a U.S. federal or state income tax strategy provided to the Company by J.P. Morgan. J.P. Morgan's policies on data privacy can be found at http://www.jpmorgan.com/pages/privacy. J.P. Morgan is a party to the SEC Research Settlement and as such, is generally not permitted to utilize the firm's research capabilities in pitching for investment banking business. All views contained in this presentation are the views of J.P. Morgan’s Investment Bank, not the Research Department. J.P. Morgan’s policies prohibit employees from offering, directly or indirectly, a favorable research rating or specific price target, or offering to change a rating or price target, to a subject company as consideration or inducement for the receipt of business or for compensation. J.P. Morgan also prohibits its research analysts from being compensated for involvement in investment banking transactions except to the extent that such participation is intended to benefit investors. Changes to Interbank Offered Rates (IBORs) and other benchmark rates: Certain interest rate benchmarks are, or may in the future become, subject to ongoing international, national and other regulatory guidance, reform and proposals for reform. For more information, please consult: https://www.jpmorgan.com/global/disclosures/interbank_offered_rates JPMorgan Chase & Co. and its affiliates do not provide tax advice. Accordingly, any discussion of U.S. tax matters included herein (including any attachments) is not intended or written to be used, and cannot be used, in connection with the promotion, marketing or recommendation by anyone not affiliated with JPMorgan Chase & Co. of any of the matters addressed herein or for the purpose of avoiding U.S. tax-related penalties. J.P. Morgan is a marketing name for investment businesses of JPMorgan Chase & Co. and its subsidiaries and affiliates worldwide. Securities, syndicated loan arranging, financial advisory, lending, derivatives and other investment banking and commercial banking activities are performed by a combination of J.P. Morgan Securities LLC, J.P. Morgan Securities plc, J.P. Morgan AG, JPMorgan Chase Bank, N.A. and the appropriately licensed subsidiaries and affiliates of JPMorgan Chase & Co. worldwide. J.P. Morgan deal team members may be employees of any of the foregoing entities. J.P. Morgan Securities plc is authorized by the Prudential Regulation Authority and regulated by the Financial Conduct Authority and the Prudential Regulation Authority. J.P. Morgan AG is authorized by the German Federal Financial Supervisory Authority (BaFin) and regulated by BaFin and the German Central Bank (Deutsche Bundesbank). For information on any J.P. Morgan German legal entity see: https://www.jpmorgan.com/country/US/en/disclosures/legal-entity-information#germany. For information on any other J.P. Morgan legal entity see: https://www.jpmorgan.com/country/GB/EN/disclosures/investment-bank-legal-entity-disclosures. JPMS LLC intermediates securities transactions effected by its non-U.S. affiliates for or with its U.S. clients when appropriate and in accordance with Rule 15a-6 under the Securities Exchange Act of 1934. Please consult: www.jpmorgan.com/securities-transactions This presentation does not constitute a commitment by any J.P. Morgan entity to underwrite, subscribe for or place any securities or to extend or arrange credit or to provide any other services. Copyright 2021 JPMorgan Chase & Co. All rights reserved. JPMorgan Chase Bank, N.A., organized under the laws of U.S.A. with limited liability. 12This presentation was prepared exclusively for the benefit and internal use of the J.P. Morgan client to whom it is directly addressed and delivered (including such client’s subsidiaries, the “Company”) in order to assist the Company in evaluating, on a preliminary basis, the feasibility of a possible transaction or transactions and does not carry any right of publication or disclosure, in whole or in part, to any other party. This presentation is for discussion purposes only and is incomplete without reference to, and should be viewed solely in conjunction with, the oral briefing provided by J.P. Morgan. Neither this presentation nor any of its contents may be disclosed or used for any other purpose without the prior written consent of J.P. Morgan. The information in this presentation is based upon any management forecasts supplied to us and reflects prevailing conditions and our views as of this date, all of which are accordingly subject to change. J.P. Morgan’s opinions and estimates constitute J.P. Morgan’s judgment and should be regarded as indicative, preliminary and for illustrative purposes only. In preparing this presentation, we have relied upon and assumed, without independent verification, the accuracy and completeness of all information available from public sources or which was provided to us by or on behalf of the Company or which was otherwise reviewed by us. In addition, our analyses are not and do not purport to be appraisals of the assets, stock, or business of the Company or any other entity. J.P. Morgan makes no representations as to the actual value which may be received in connection with a transaction nor the legal, tax or accounting effects of consummating a transaction. Unless expressly contemplated hereby, the information in this presentation does not take into account the effects of a possible transaction or transactions involving an actual or potential change of control, which may have significant valuation and other effects. Notwithstanding anything herein to the contrary, the Company and each of its employees, representatives or other agents may disclose to any and all persons, without limitation of any kind, the U.S. federal and state income tax treatment and the U.S. federal and state income tax structure of the transactions contemplated hereby and all materials of any kind (including opinions or other tax analyses) that are provided to the Company relating to such tax treatment and tax structure insofar as such treatment and/or structure relates to a U.S. federal or state income tax strategy provided to the Company by J.P. Morgan. J.P. Morgan's policies on data privacy can be found at http://www.jpmorgan.com/pages/privacy. J.P. Morgan is a party to the SEC Research Settlement and as such, is generally not permitted to utilize the firm's research capabilities in pitching for investment banking business. All views contained in this presentation are the views of J.P. Morgan’s Investment Bank, not the Research Department. J.P. Morgan’s policies prohibit employees from offering, directly or indirectly, a favorable research rating or specific price target, or offering to change a rating or price target, to a subject company as consideration or inducement for the receipt of business or for compensation. J.P. Morgan also prohibits its research analysts from being compensated for involvement in investment banking transactions except to the extent that such participation is intended to benefit investors. Changes to Interbank Offered Rates (IBORs) and other benchmark rates: Certain interest rate benchmarks are, or may in the future become, subject to ongoing international, national and other regulatory guidance, reform and proposals for reform. For more information, please consult: https://www.jpmorgan.com/global/disclosures/interbank_offered_rates JPMorgan Chase & Co. and its affiliates do not provide tax advice. Accordingly, any discussion of U.S. tax matters included herein (including any attachments) is not intended or written to be used, and cannot be used, in connection with the promotion, marketing or recommendation by anyone not affiliated with JPMorgan Chase & Co. of any of the matters addressed herein or for the purpose of avoiding U.S. tax-related penalties. J.P. Morgan is a marketing name for investment businesses of JPMorgan Chase & Co. and its subsidiaries and affiliates worldwide. Securities, syndicated loan arranging, financial advisory, lending, derivatives and other investment banking and commercial banking activities are performed by a combination of J.P. Morgan Securities LLC, J.P. Morgan Securities plc, J.P. Morgan AG, JPMorgan Chase Bank, N.A. and the appropriately licensed subsidiaries and affiliates of JPMorgan Chase & Co. worldwide. J.P. Morgan deal team members may be employees of any of the foregoing entities. J.P. Morgan Securities plc is authorized by the Prudential Regulation Authority and regulated by the Financial Conduct Authority and the Prudential Regulation Authority. J.P. Morgan AG is authorized by the German Federal Financial Supervisory Authority (BaFin) and regulated by BaFin and the German Central Bank (Deutsche Bundesbank). For information on any J.P. Morgan German legal entity see: https://www.jpmorgan.com/country/US/en/disclosures/legal-entity-information#germany. For information on any other J.P. Morgan legal entity see: https://www.jpmorgan.com/country/GB/EN/disclosures/investment-bank-legal-entity-disclosures. JPMS LLC intermediates securities transactions effected by its non-U.S. affiliates for or with its U.S. clients when appropriate and in accordance with Rule 15a-6 under the Securities Exchange Act of 1934. Please consult: www.jpmorgan.com/securities-transactions This presentation does not constitute a commitment by any J.P. Morgan entity to underwrite, subscribe for or place any securities or to extend or arrange credit or to provide any other services. Copyright 2021 JPMorgan Chase & Co. All rights reserved. JPMorgan Chase Bank, N.A., organized under the laws of U.S.A. with limited liability. 12