Preliminary Draft (8/10/2021 1PM) - Confidential Exhibit C.VII DRAFT – PRELIMINARY – SUBJECT TO CHANGE Project Ocala Preliminary Discussion Materials Preliminary Draft (8/10/2021 1PM) - Confidential Exhibit C.VII DRAFT – PRELIMINARY – SUBJECT TO CHANGE Project Ocala Preliminary Discussion Materials

Preliminary Draft (8/10/2021 1PM) - Confidential Table of Contents Section Transaction Summary I Company Overview II Valuation Analysis IIIPreliminary Draft (8/10/2021 1PM) - Confidential Table of Contents Section Transaction Summary I Company Overview II Valuation Analysis III

Preliminary Draft (8/10/2021 1PM) - Confidential I. Transaction SummaryPreliminary Draft (8/10/2021 1PM) - Confidential I. Transaction Summary
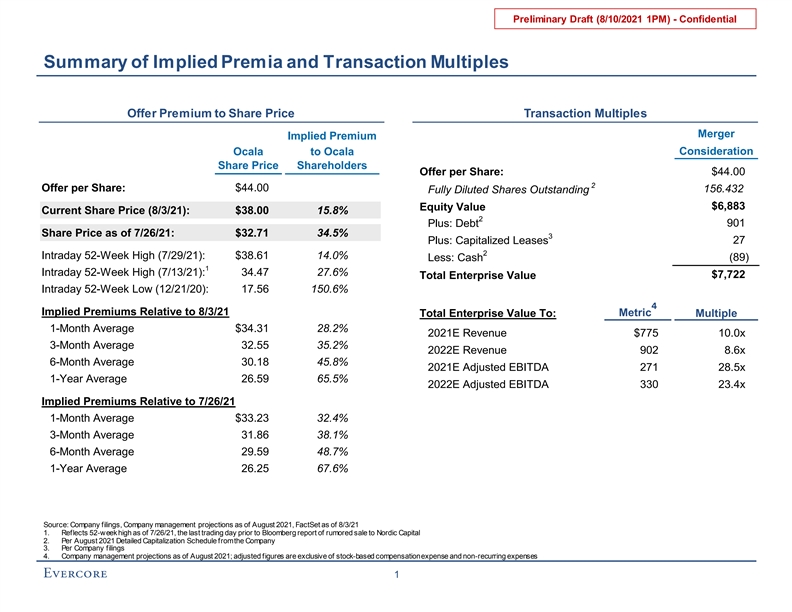
Preliminary Draft (8/10/2021 1PM) - Confidential Summary of Implied Premia and Transaction Multiples Offer Premium to Share Price Transaction Multiples Merger Implied Premium Ocala to Ocala Consideration Share Price Shareholders Offer per Share: $44.00 2 $44.00 Offer per Share: 156.432 Fully Diluted Shares Outstanding $6,883 Equity Value Current Share Price (8/3/21): $38.00 15.8% 2 Plus: Debt 901 Share Price as of 7/26/21: $32.71 34.5% 3 Plus: Capitalized Leases 27 2 Intraday 52-Week High (7/29/21): $38.61 14.0% Less: Cash (89) 1 Intraday 52-Week High (7/13/21): 34.47 27.6% $7,722 Total Enterprise Value Intraday 52-Week Low (12/21/20): 17.56 150.6% 4 Implied Premiums Relative to 8/3/21 Metric Total Enterprise Value To: Multiple 1-Month Average $34.31 28.2% 2021E Revenue $775 10.0x 3-Month Average 32.55 35.2% 2022E Revenue 902 8.6x 6-Month Average 30.18 45.8% 2021E Adjusted EBITDA 271 28.5x 1-Year Average 26.59 65.5% 2022E Adjusted EBITDA 330 23.4x Implied Premiums Relative to 7/26/21 1-Month Average $33.23 32.4% 3-Month Average 31.86 38.1% 6-Month Average 29.59 48.7% 1-Year Average 26.25 67.6% Source: Company filings, Company management projections as of August 2021, FactSet as of 8/3/21 1. Reflects 52-week high as of 7/26/21, the last trading day prior to Bloomberg report of rumored sale to Nordic Capital 2. Per August 2021 Detailed Capitalization Schedule from the Company 3. Per Company filings 4. Company management projections as of August 2021; adjusted figures are exclusive of stock-based compensation expense and non-recurring expenses 1Preliminary Draft (8/10/2021 1PM) - Confidential Summary of Implied Premia and Transaction Multiples Offer Premium to Share Price Transaction Multiples Merger Implied Premium Ocala to Ocala Consideration Share Price Shareholders Offer per Share: $44.00 2 $44.00 Offer per Share: 156.432 Fully Diluted Shares Outstanding $6,883 Equity Value Current Share Price (8/3/21): $38.00 15.8% 2 Plus: Debt 901 Share Price as of 7/26/21: $32.71 34.5% 3 Plus: Capitalized Leases 27 2 Intraday 52-Week High (7/29/21): $38.61 14.0% Less: Cash (89) 1 Intraday 52-Week High (7/13/21): 34.47 27.6% $7,722 Total Enterprise Value Intraday 52-Week Low (12/21/20): 17.56 150.6% 4 Implied Premiums Relative to 8/3/21 Metric Total Enterprise Value To: Multiple 1-Month Average $34.31 28.2% 2021E Revenue $775 10.0x 3-Month Average 32.55 35.2% 2022E Revenue 902 8.6x 6-Month Average 30.18 45.8% 2021E Adjusted EBITDA 271 28.5x 1-Year Average 26.59 65.5% 2022E Adjusted EBITDA 330 23.4x Implied Premiums Relative to 7/26/21 1-Month Average $33.23 32.4% 3-Month Average 31.86 38.1% 6-Month Average 29.59 48.7% 1-Year Average 26.25 67.6% Source: Company filings, Company management projections as of August 2021, FactSet as of 8/3/21 1. Reflects 52-week high as of 7/26/21, the last trading day prior to Bloomberg report of rumored sale to Nordic Capital 2. Per August 2021 Detailed Capitalization Schedule from the Company 3. Per Company filings 4. Company management projections as of August 2021; adjusted figures are exclusive of stock-based compensation expense and non-recurring expenses 1

Preliminary Draft (8/10/2021 1PM) - Confidential Overview of Buyer Outreach As of 8/2/21 Contact Log 13 9 11 9 14 13 4 4 3 All parties Signed NDAs Management meeting Declined Submitted proposal Source: Contact log as of 8/2/21 2
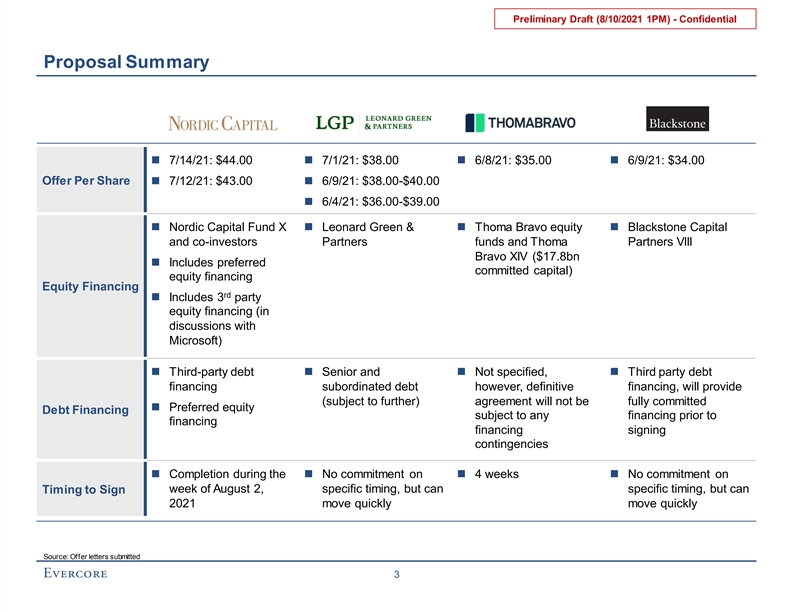
Preliminary Draft (8/10/2021 1PM) - Confidential Proposal Summary n 7/14/21: $44.00n 7/1/21: $38.00 n 6/8/21: $35.00n 6/9/21: $34.00 Offer Per Share n 7/12/21: $43.00n 6/9/21: $38.00-$40.00 n 6/4/21: $36.00-$39.00 n Nordic Capital Fund X n Leonard Green & n Thoma Bravo equity n Blackstone Capital and co-investors Partners funds and Thoma Partners VIII Bravo XIV ($17.8bn n Includes preferred committed capital) equity financing Equity Financing rd n Includes 3 party equity financing (in discussions with Microsoft) n Third-party debt n Senior and n Not specified, n Third party debt financing subordinated debt however, definitive financing, will provide (subject to further) agreement will not be fully committed n Preferred equity Debt Financing subject to any financing prior to financing financing signing contingencies n Completion during the n No commitment on n 4 weeksn No commitment on week of August 2, specific timing, but can specific timing, but can Timing to Sign 2021 move quickly move quickly Source: Offer letters submitted 3Preliminary Draft (8/10/2021 1PM) - Confidential Proposal Summary n 7/14/21: $44.00n 7/1/21: $38.00 n 6/8/21: $35.00n 6/9/21: $34.00 Offer Per Share n 7/12/21: $43.00n 6/9/21: $38.00-$40.00 n 6/4/21: $36.00-$39.00 n Nordic Capital Fund X n Leonard Green & n Thoma Bravo equity n Blackstone Capital and co-investors Partners funds and Thoma Partners VIII Bravo XIV ($17.8bn n Includes preferred committed capital) equity financing Equity Financing rd n Includes 3 party equity financing (in discussions with Microsoft) n Third-party debt n Senior and n Not specified, n Third party debt financing subordinated debt however, definitive financing, will provide (subject to further) agreement will not be fully committed n Preferred equity Debt Financing subject to any financing prior to financing financing signing contingencies n Completion during the n No commitment on n 4 weeksn No commitment on week of August 2, specific timing, but can specific timing, but can Timing to Sign 2021 move quickly move quickly Source: Offer letters submitted 3

Preliminary Draft (8/10/2021 1PM) - Confidential II. Company OverviewPreliminary Draft (8/10/2021 1PM) - Confidential II. Company Overview

Preliminary Draft (8/10/2021 1PM) - Confidential Ocala Share Price Performance Over Last 3 Years Trading days post Bloomberg report 300.0% 10/31/19: 250.0% 1/11/21: Announced Q3 ’19 10/28/20: Announced results, beating Announced Q3 ’20 preliminary Q4 and quarterly consensus 211.5% results, missing FY ’20 results at revenue estimates quarterly consensus JPM Healthcare by ~3% 200.0% revenue estimates Conference by 10% 8/1/19: 7/26/21: After market hours, Announced Q2 ’19 9/24/20: 3/23/20: results, beating Bloomberg Announced launch Announced reported Nordic quarterly consensus 150.0% of DataStream API telehealth revenue estimates Capital rumored configuration of by ~12% to be in talks to ONE platform acquire Ocala; stock closed up 6/24/21: ~13% on 100.0% Announced 7/27/21 over 2/21/19: extension of previous close Announced FY’18 customer contract of $32.71 results, missing with Walmart quarterly consensus 55.7% revenue estimates 50.0% by ~17% 0.0% (50.0%) Aug-18 Mar-19 Oct-19 May-20 Dec-20 Aug-21 Ocala S&P 500 Source: FactSet (8/3/21), Company filings 4Preliminary Draft (8/10/2021 1PM) - Confidential Ocala Share Price Performance Over Last 3 Years Trading days post Bloomberg report 300.0% 10/31/19: 250.0% 1/11/21: Announced Q3 ’19 10/28/20: Announced results, beating Announced Q3 ’20 preliminary Q4 and quarterly consensus 211.5% results, missing FY ’20 results at revenue estimates quarterly consensus JPM Healthcare by ~3% 200.0% revenue estimates Conference by 10% 8/1/19: 7/26/21: After market hours, Announced Q2 ’19 9/24/20: 3/23/20: results, beating Bloomberg Announced launch Announced reported Nordic quarterly consensus 150.0% of DataStream API telehealth revenue estimates Capital rumored configuration of by ~12% to be in talks to ONE platform acquire Ocala; stock closed up 6/24/21: ~13% on 100.0% Announced 7/27/21 over 2/21/19: extension of previous close Announced FY’18 customer contract of $32.71 results, missing with Walmart quarterly consensus 55.7% revenue estimates 50.0% by ~17% 0.0% (50.0%) Aug-18 Mar-19 Oct-19 May-20 Dec-20 Aug-21 Ocala S&P 500 Source: FactSet (8/3/21), Company filings 4
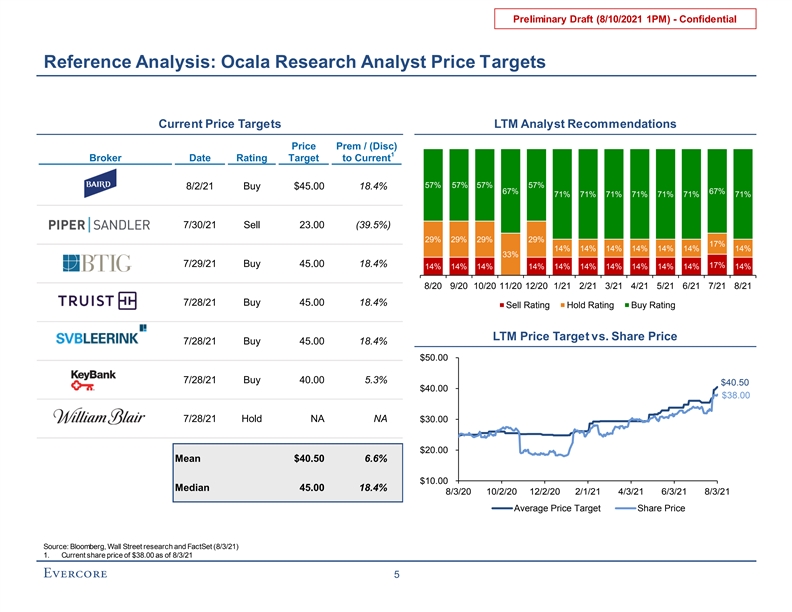
Preliminary Draft (8/10/2021 1PM) - Confidential Reference Analysis: Ocala Research Analyst Price Targets Current Price Targets LTM Analyst Recommendations Price Prem / (Disc) 1 Broker Date Rating Target to Current 57% 57% 57% 57% 8/2/21 Buy $45.00 18.4% 67% 67% 71% 71% 71% 71% 71% 71% 71% 7/30/21 Sell 23.00 (39.5%) 29% 29% 29% 29% 17% 14% 14% 14% 14% 14% 14% 14% 33% 7/29/21 Buy 45.00 18.4% 17% 14% 14% 14% 14% 14% 14% 14% 14% 14% 14% 14% 8/20 9/20 10/20 11/20 12/20 1/21 2/21 3/21 4/21 5/21 6/21 7/21 8/21 7/28/21 Buy 45.00 18.4% Sell Rating Hold Rating Buy Rating LTM Price Target vs. Share Price 7/28/21 Buy 45.00 18.4% $50.00 7/28/21 Buy 40.00 5.3% $40.50 $40.00 $38.00 7/28/21 Hold NA NA $30.00 $20.00 Mean $40.50 6.6% $10.00 Median 45.00 18.4% 8/3/20 10/2/20 12/2/20 2/1/21 4/3/21 6/3/21 8/3/21 Average Price Target Share Price Source: Bloomberg, Wall Street research and FactSet (8/3/21) 1. Current share price of $38.00 as of 8/3/21 5Preliminary Draft (8/10/2021 1PM) - Confidential Reference Analysis: Ocala Research Analyst Price Targets Current Price Targets LTM Analyst Recommendations Price Prem / (Disc) 1 Broker Date Rating Target to Current 57% 57% 57% 57% 8/2/21 Buy $45.00 18.4% 67% 67% 71% 71% 71% 71% 71% 71% 71% 7/30/21 Sell 23.00 (39.5%) 29% 29% 29% 29% 17% 14% 14% 14% 14% 14% 14% 14% 33% 7/29/21 Buy 45.00 18.4% 17% 14% 14% 14% 14% 14% 14% 14% 14% 14% 14% 14% 8/20 9/20 10/20 11/20 12/20 1/21 2/21 3/21 4/21 5/21 6/21 7/21 8/21 7/28/21 Buy 45.00 18.4% Sell Rating Hold Rating Buy Rating LTM Price Target vs. Share Price 7/28/21 Buy 45.00 18.4% $50.00 7/28/21 Buy 40.00 5.3% $40.50 $40.00 $38.00 7/28/21 Hold NA NA $30.00 $20.00 Mean $40.50 6.6% $10.00 Median 45.00 18.4% 8/3/20 10/2/20 12/2/20 2/1/21 4/3/21 6/3/21 8/3/21 Average Price Target Share Price Source: Bloomberg, Wall Street research and FactSet (8/3/21) 1. Current share price of $38.00 as of 8/3/21 5

Preliminary Draft (8/10/2021 1PM) - Confidential Ocala Financial Projections ($ in millions, except per share data) Revenue '21E - '23E 23E - '25E $1,600 $1,385 CAGR CAGR $1,200 $1,200 12.2% NA $1,040 $973 $902 $870 15.9% 15.4% $773 $775 $800 $400 $0 2021E 2022E 2023E 2024E 2025E Research Projections 12.6% 11.9% NA NA Growth % Management Projections 16.4% 15.4% 15.4% 15.4% Growth % Adj. EBITDA '21E - '23E 23E - '25E $594 $600 CAGR CAGR $492 14.8% NA $404 $450 22.2% 21.2% $356 $330 $311 $270 $271 $300 $150 $0 2021E 2022E 2023E 2024E 2025E Research Projections 34.9% 35.8% 36.5% NA NA Margin % Management Projections 35.0% 36.6% 38.9% 41.0% 42.9% Margin % Research Projections Management Projections Source: FactSet (8/3/21), Company management projections as of August 2021 6

Preliminary Draft (8/10/2021 1PM) - Confidential III. Valuation AnalysisPreliminary Draft (8/10/2021 1PM) - Confidential III. Valuation Analysis

Preliminary Draft (8/10/2021 1PM) - Confidential Summary of Valuation Methodologies ($ in millions, except per share data) Methodology Metric Implied Price Per Share Implied TEV Offer Price: $44.00 Peer Multiples: 7.0x - 10.0x $775 $5,423 - $7,748 $29.32 $44.19 CY 2021E Revenue Peer Multiples: 6.0x - 9.0x $902 $5,410 - $8,115 $29.24 $46.54 CY 2022E Revenue Public Market Trading Analysis Peer Multiples: 22.0x - 28.0x $271 $32.76 $43.16 $5,961 - $7,587 CY 2021E Adj. EBITDA Peer Multiples: 19.0x - 25.0x $330 $6,266 - $8,244 $34.71 $47.36 CY 2022E Adj. EBITDA Transaction Multiples: 7.0x - 11.0x $719 $5,031 - $7,906 $26.81 $45.20 Precedent LTM 6/30/21 Revenue Transaction Transaction Multiples: 6.0x - 10.0x 1 Analysis $838 $5,029 - $8,382 $48.25 $26.80 NTM 6/30/21 Revenue 10-Year DCF: Discounted Cash $33.82 $51.29 Perpetuity Growth: 3.0% - 4.0%; $6,129 - $8,862 Flow Analysis Discount Rate: 8.0% - 9.0% Intraday 52-Week Low / High $17.56 $34.47 $3,585 - $6,231 (as of 7/26/21) Premium Paid to Price on 7/26/21 For Reference Only: $39.25 $44.16 $6,979 - $7,747 2 25th to 75th Percentile M ean (7/26/21) M ean (8/3/21) Current Analyst Price Targets $23.00 $45.00 $4,436 - $7,878 $0.00 $10.00 $20.00 $30.00 $40.00 $50.00 $60.00 Source: Company filings, Company Management projections as of August 2021, FactSet (8/3/21) Note: For reference values are for informational purposes only and are not part of fairness determination; Share count and balance sheet per August 2021 Detailed Capitalization Schedule per the Company 1. NTM Revenue shown as average of CY 2021E and CY 2022E revenues, as forecasted by management th th 2. 25 to 75 percentile represents an ~20% to ~35% premium paid to the unaffected share price of select all cash healthcare and technology deals in the $1.0-$15.0 billion range 7Preliminary Draft (8/10/2021 1PM) - Confidential Summary of Valuation Methodologies ($ in millions, except per share data) Methodology Metric Implied Price Per Share Implied TEV Offer Price: $44.00 Peer Multiples: 7.0x - 10.0x $775 $5,423 - $7,748 $29.32 $44.19 CY 2021E Revenue Peer Multiples: 6.0x - 9.0x $902 $5,410 - $8,115 $29.24 $46.54 CY 2022E Revenue Public Market Trading Analysis Peer Multiples: 22.0x - 28.0x $271 $32.76 $43.16 $5,961 - $7,587 CY 2021E Adj. EBITDA Peer Multiples: 19.0x - 25.0x $330 $6,266 - $8,244 $34.71 $47.36 CY 2022E Adj. EBITDA Transaction Multiples: 7.0x - 11.0x $719 $5,031 - $7,906 $26.81 $45.20 Precedent LTM 6/30/21 Revenue Transaction Transaction Multiples: 6.0x - 10.0x 1 Analysis $838 $5,029 - $8,382 $48.25 $26.80 NTM 6/30/21 Revenue 10-Year DCF: Discounted Cash $33.82 $51.29 Perpetuity Growth: 3.0% - 4.0%; $6,129 - $8,862 Flow Analysis Discount Rate: 8.0% - 9.0% Intraday 52-Week Low / High $17.56 $34.47 $3,585 - $6,231 (as of 7/26/21) Premium Paid to Price on 7/26/21 For Reference Only: $39.25 $44.16 $6,979 - $7,747 2 25th to 75th Percentile M ean (7/26/21) M ean (8/3/21) Current Analyst Price Targets $23.00 $45.00 $4,436 - $7,878 $0.00 $10.00 $20.00 $30.00 $40.00 $50.00 $60.00 Source: Company filings, Company Management projections as of August 2021, FactSet (8/3/21) Note: For reference values are for informational purposes only and are not part of fairness determination; Share count and balance sheet per August 2021 Detailed Capitalization Schedule per the Company 1. NTM Revenue shown as average of CY 2021E and CY 2022E revenues, as forecasted by management th th 2. 25 to 75 percentile represents an ~20% to ~35% premium paid to the unaffected share price of select all cash healthcare and technology deals in the $1.0-$15.0 billion range 7
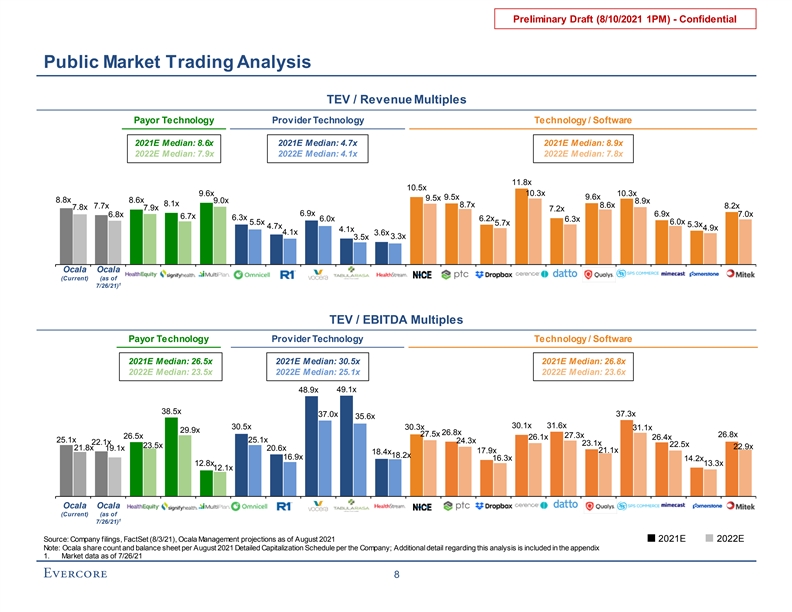
Preliminary Draft (8/10/2021 1PM) - Confidential Public Market Trading Analysis TEV / Revenue Multiples Payor Technology Provider Technology Technology / Software 2021E Median: 8.6x 2021E Median: 4.7x 2021E Median: 8.9x 2022E Median: 7.9x 2022E Median: 4.1x 2022E Median: 7.8x 11.8x 10.5x 9.6x 10.3x 10.3x 9.5x 9.6x 9.5x 8.8x 8.6x 9.0x 8.9x 8.1x 8.7x 8.6x 7.7x 8.2x 7.8x 7.9x 7.2x 6.9x 6.8x 6.9x 7.0x 6.7x 6.3x 6.2x 6.0x 6.3x 6.0x 5.5x 5.7x 5.3x 4.7x 4.9x 4.1x 4.1x 3.6x 3.3x 3.5x Ocala Ocala (Current) (as of 1 7/26/21) TEV / EBITDA Multiples Payor Technology Provider Technology Technology / Software 2021E Median: 26.5x 2021E Median: 30.5x 2021E Median: 26.8x 2022E Median: 23.5x 2022E Median: 25.1x 2022E Median: 23.6x 49.1x 48.9x 38.5x 37.0x 37.3x 35.6x 30.1x 31.6x 30.5x 30.3x 31.1x 29.9x 26.8x 27.5x 26.8x 27.3x 26.5x 26.1x 26.4x 25.1x 25.1x 24.3x 22.1x 23.1x 22.5x 23.5x 22.9x 21.8x 19.1x 20.6x 17.9x 21.1x 18.4x 18.2x 16.9x 16.3x 14.2x 12.8x 13.3x 12.1x Ocala Ocala (Current) (as of 1 7/26/21) Source: Company filings, FactSet (8/3/21), Ocala Management projections as of August 2021 2021E 2022E Note: Ocala share count and balance sheet per August 2021 Detailed Capitalization Schedule per the Company; Additional detail regarding this analysis is included in the appendix 1. Market data as of 7/26/21 8Preliminary Draft (8/10/2021 1PM) - Confidential Public Market Trading Analysis TEV / Revenue Multiples Payor Technology Provider Technology Technology / Software 2021E Median: 8.6x 2021E Median: 4.7x 2021E Median: 8.9x 2022E Median: 7.9x 2022E Median: 4.1x 2022E Median: 7.8x 11.8x 10.5x 9.6x 10.3x 10.3x 9.5x 9.6x 9.5x 8.8x 8.6x 9.0x 8.9x 8.1x 8.7x 8.6x 7.7x 8.2x 7.8x 7.9x 7.2x 6.9x 6.8x 6.9x 7.0x 6.7x 6.3x 6.2x 6.0x 6.3x 6.0x 5.5x 5.7x 5.3x 4.7x 4.9x 4.1x 4.1x 3.6x 3.3x 3.5x Ocala Ocala (Current) (as of 1 7/26/21) TEV / EBITDA Multiples Payor Technology Provider Technology Technology / Software 2021E Median: 26.5x 2021E Median: 30.5x 2021E Median: 26.8x 2022E Median: 23.5x 2022E Median: 25.1x 2022E Median: 23.6x 49.1x 48.9x 38.5x 37.0x 37.3x 35.6x 30.1x 31.6x 30.5x 30.3x 31.1x 29.9x 26.8x 27.5x 26.8x 27.3x 26.5x 26.1x 26.4x 25.1x 25.1x 24.3x 22.1x 23.1x 22.5x 23.5x 22.9x 21.8x 19.1x 20.6x 17.9x 21.1x 18.4x 18.2x 16.9x 16.3x 14.2x 12.8x 13.3x 12.1x Ocala Ocala (Current) (as of 1 7/26/21) Source: Company filings, FactSet (8/3/21), Ocala Management projections as of August 2021 2021E 2022E Note: Ocala share count and balance sheet per August 2021 Detailed Capitalization Schedule per the Company; Additional detail regarding this analysis is included in the appendix 1. Market data as of 7/26/21 8

Preliminary Draft (8/10/2021 1PM) - Confidential Selected Transactions Analysis | Healthcare Platform Technology ($ in billions) TEV / Revenue 8.8x 7.6x 6.6x 6.3x Median: 5.1x 5.1x 4.3x 4.4x 4.3x 4.1x 4.1x Median: 4.4x LTM NTM Acquiror Target 100% Cash 100% Cash 100% Cash 100% Cash 100% Cash Cash / Stock % Ann. Date Jan-21 Dec-20 Jun-19 Nov-18 Jun-18 Trans. Value $13.4 $3.4 $6.0 $5.7 $4.9 Source: Company filings and press releases 9Preliminary Draft (8/10/2021 1PM) - Confidential Selected Transactions Analysis | Healthcare Platform Technology ($ in billions) TEV / Revenue 8.8x 7.6x 6.6x 6.3x Median: 5.1x 5.1x 4.3x 4.4x 4.3x 4.1x 4.1x Median: 4.4x LTM NTM Acquiror Target 100% Cash 100% Cash 100% Cash 100% Cash 100% Cash Cash / Stock % Ann. Date Jan-21 Dec-20 Jun-19 Nov-18 Jun-18 Trans. Value $13.4 $3.4 $6.0 $5.7 $4.9 Source: Company filings and press releases 9
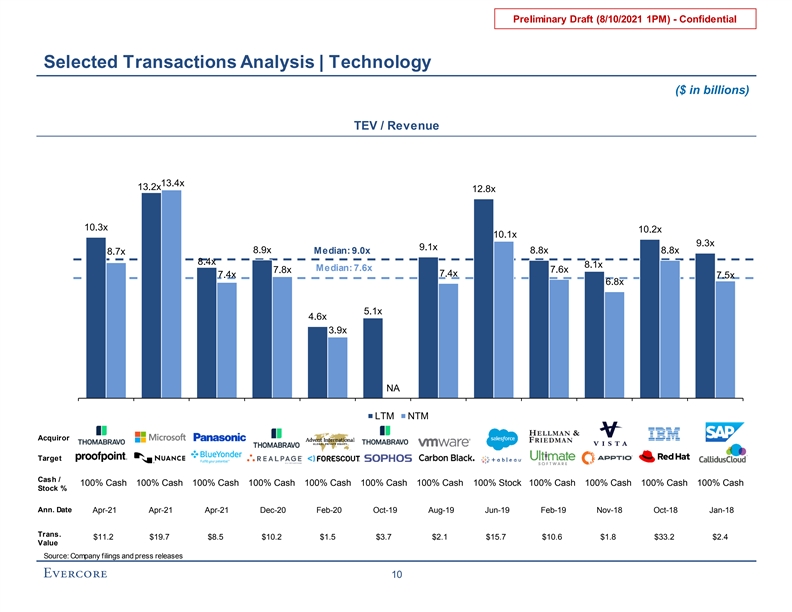
Preliminary Draft (8/10/2021 1PM) - Confidential Selected Transactions Analysis | Technology ($ in billions) TEV / Revenue 13.4x 13.2x 12.8x 10.3x 10.2x 10.1x 9.3x 9.1x 8.9x Median: 9.0x 8.8x 8.8x 8.7x 8.4x 8.1x Median: 7.6x 7.8x 7.6x 7.4x 7.4x 7.5x 6.8x 5.1x 4.6x 3.9x NA LTM NTM Acquiror Target Cash / 100% Cash 100% Cash 100% Cash 100% Cash 100% Cash 100% Cash 100% Cash 100% Stock 100% Cash 100% Cash 100% Cash 100% Cash Stock % Ann. Date Apr-21 Apr-21 Apr-21 Dec-20 Feb-20 Oct-19 Aug-19 Jun-19 Feb-19 Nov-18 Oct-18 Jan-18 Trans. $11.2 $19.7 $8.5 $10.2 $1.5 $3.7 $2.1 $15.7 $10.6 $1.8 $33.2 $2.4 Value Source: Company filings and press releases 10Preliminary Draft (8/10/2021 1PM) - Confidential Selected Transactions Analysis | Technology ($ in billions) TEV / Revenue 13.4x 13.2x 12.8x 10.3x 10.2x 10.1x 9.3x 9.1x 8.9x Median: 9.0x 8.8x 8.8x 8.7x 8.4x 8.1x Median: 7.6x 7.8x 7.6x 7.4x 7.4x 7.5x 6.8x 5.1x 4.6x 3.9x NA LTM NTM Acquiror Target Cash / 100% Cash 100% Cash 100% Cash 100% Cash 100% Cash 100% Cash 100% Cash 100% Stock 100% Cash 100% Cash 100% Cash 100% Cash Stock % Ann. Date Apr-21 Apr-21 Apr-21 Dec-20 Feb-20 Oct-19 Aug-19 Jun-19 Feb-19 Nov-18 Oct-18 Jan-18 Trans. $11.2 $19.7 $8.5 $10.2 $1.5 $3.7 $2.1 $15.7 $10.6 $1.8 $33.2 $2.4 Value Source: Company filings and press releases 10

Preliminary Draft (8/10/2021 1PM) - Confidential Illustrative 10-year Discounted Cash Flow Analysis ($ in millions, except per share data) Assumes 8/3/21 valuation date, 8.5% discount rate, 3.5% PGR Discounted Cash Flow Analysis 2021E 2022E 2023E 2024E 2025E 2026E 2027E 2028E 2029E 2030E Terminal Revenue $775 $902 $1,040 $1,200 $1,385 $1,573 $1,759 $1,935 $2,065 $2,137 $2,137 % Growth 16.4% 15.4% 15.4% 15.4% 13.6% 11.8% 10.0% 6.7% 3.5% Adj. EBITDA $271 $330 $404 $492 $594 $675 $755 $830 $886 $917 $917 % Margin 35.0% 36.6% 38.9% 41.0% 42.9% 42.9% 42.9% 42.9% 42.9% 42.9% 42.9% Less: Stock-Based Compensation (Post-Tax) ($23) ($25) ($25) ($25) ($25) ($29) ($32) ($35) ($38) ($39) ($39) Less: Taxes (43) (59) (80) (104) (133) (153) (174) (194) (210) (220) (220) Less: CapEx (65) (65) (65) (75) (87) (98) (110) (121) (129) (134) (134) Less: Change in NWC (15) (18) (21) (24) (28) (28) (28) (26) (20) (11) (11) Unlevered FCF $124 $163 $214 $264 $322 $367 $411 $454 $490 $514 $514 PV of Unlevered FCF $51 $151 $183 $208 $234 $246 $254 $258 $257 $248 NPV of Cash Flows $2,089 Perpetuity Growth Rate: 3.50% PV of Cash Flows $2,089 Terminal Year Cash Flow $514 PV of Terminal Value $5,136 Total Enterprise Value $7,225 Less: Debt (928) Plus: Cash 89 Total Equity Value $6,387 Shares Outstanding 156.4 Implied Share Price $40.83 Source: Company Management projections as of August 2021; August 2021 Detailed Capitalization Schedule per the Company Note: Cash flows discounted using mid-year convention; 28.0% tax rate per Company management; Share count and balance sheet per August 2021 Detailed Capitalization Schedule per the Company 11
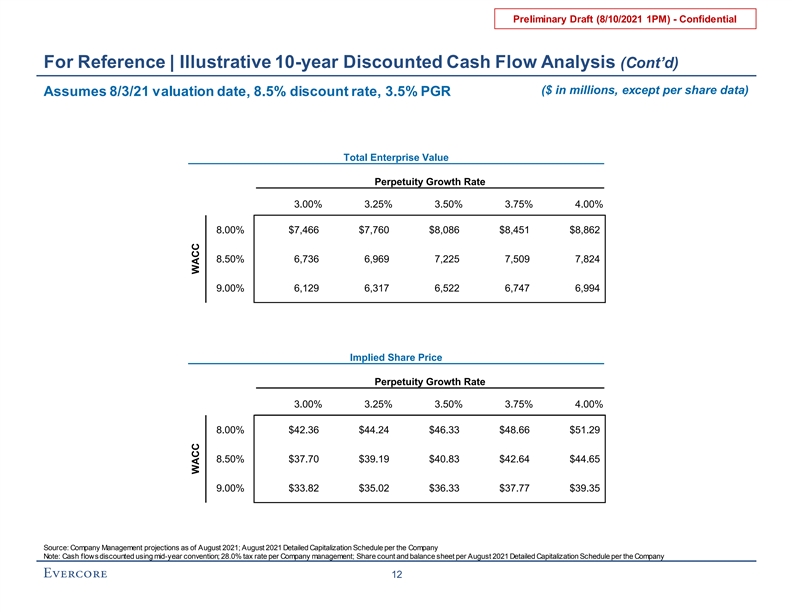
Preliminary Draft (8/10/2021 1PM) - Confidential For Reference | Illustrative 10-year Discounted Cash Flow Analysis (Cont’d) ($ in millions, except per share data) Assumes 8/3/21 valuation date, 8.5% discount rate, 3.5% PGR Total Enterprise Value Implied Share Price Perpetuity Growth Rate Perpetuity Growth Rate 3.00% 3.25% 3.50% 3.75% 4.00% 8.00% $7,466 $7,760 $8,086 $8,451 $8,862 8.50% 6,736 6,969 7,225 7,509 7,824 9.00% 6,129 6,317 6,522 6,747 6,994 Implied Share Price Perpetuity Growth Rate 3.00% 3.25% 3.50% 3.75% 4.00% 8.00% $42.36 $44.24 $46.33 $48.66 $51.29 8.50% $37.70 $39.19 $40.83 $42.64 $44.65 9.00% $33.82 $35.02 $36.33 $37.77 $39.35 Source: Company Management projections as of August 2021; August 2021 Detailed Capitalization Schedule per the Company Note: Cash flows discounted using mid-year convention; 28.0% tax rate per Company management; Share count and balance sheet per August 2021 Detailed Capitalization Schedule per the Company 12 WACC WACCPreliminary Draft (8/10/2021 1PM) - Confidential For Reference | Illustrative 10-year Discounted Cash Flow Analysis (Cont’d) ($ in millions, except per share data) Assumes 8/3/21 valuation date, 8.5% discount rate, 3.5% PGR Total Enterprise Value Implied Share Price Perpetuity Growth Rate Perpetuity Growth Rate 3.00% 3.25% 3.50% 3.75% 4.00% 8.00% $7,466 $7,760 $8,086 $8,451 $8,862 8.50% 6,736 6,969 7,225 7,509 7,824 9.00% 6,129 6,317 6,522 6,747 6,994 Implied Share Price Perpetuity Growth Rate 3.00% 3.25% 3.50% 3.75% 4.00% 8.00% $42.36 $44.24 $46.33 $48.66 $51.29 8.50% $37.70 $39.19 $40.83 $42.64 $44.65 9.00% $33.82 $35.02 $36.33 $37.77 $39.35 Source: Company Management projections as of August 2021; August 2021 Detailed Capitalization Schedule per the Company Note: Cash flows discounted using mid-year convention; 28.0% tax rate per Company management; Share count and balance sheet per August 2021 Detailed Capitalization Schedule per the Company 12 WACC WACC
Preliminary Draft (8/10/2021 1PM) - Confidential These materials have been prepared by Evercore Group L.L.C. (“Evercore”) for the Special Committee of the Board of Directors of Ocala (the “Company”) to whom such materials are directly addressed and delivered and may not be used or relied upon for any purpose other than as specifically contemplated by a written agreement with Evercore. These materials are based on information provided by or on behalf of the Company and/or other potential transaction participants, from public sources or otherwise reviewed by Evercore. Evercore assumes no responsibility for independent investigation or verification of such information and has relied on such information being complete and accurate in all material respects. To the extent such information includes estimates and forecasts of future financial performance prepared by or reviewed with the management of the Company and/or other potential transaction participants or obtained from public sources, Evercore has assumed that such estimates and forecasts have been reasonably prepared on bases reflecting the best currently available estimates and judgments of such management (or, with respect to estimates and forecasts obtained from public sources, represent reasonable estimates). No representation or warranty, express or implied, is made as to the accuracy or completeness of such information and nothing contained herein is, or shall be relied upon as, a representation, whether as to the past, the present or the future. These materials were designed for use by specific persons familiar with the business and affairs of the Company. These materials are not intended to provide the sole basis for evaluating, and should not be considered a recommendation with respect to, any transaction or other matter. These materials have been developed by and are proprietary to Evercore and were prepared exclusively for the benefit and internal use of the Special Committee of the Board of Directors of the Company. These materials were compiled on a confidential basis for use by the Special Committee of the Board of Directors of the Company in evaluating the potential transaction described herein and not with a view to public disclosure or filing thereof under state or federal securities laws, and may not be reproduced, disseminated, quoted or referred to, in whole or in part, without the prior written consent of Evercore. These materials do not constitute an offer or solicitation to sell or purchase any securities and are not a commitment by Evercore (or any affiliate) to provide or arrange any financing for any transaction or to purchase any security in connection therewith. Evercore assumes no obligation to update or otherwise revise these materials. These materials may not reflect information known to other professionals in other business areas of Evercore and its affiliates. Evercore and its affiliates do not provide legal, accounting or tax advice. Accordingly, any statements contained herein as to tax matters were neither written nor intended by Evercore or its affiliates to be used and cannot be used by any taxpayer for the purpose of avoiding tax penalties that may be imposed on such taxpayer. Each person should seek legal, accounting and tax advice based on his, her or its particular circumstances from independent advisors regarding the impact of the transactions or matters described herein. 13Preliminary Draft (8/10/2021 1PM) - Confidential These materials have been prepared by Evercore Group L.L.C. (“Evercore”) for the Special Committee of the Board of Directors of Ocala (the “Company”) to whom such materials are directly addressed and delivered and may not be used or relied upon for any purpose other than as specifically contemplated by a written agreement with Evercore. These materials are based on information provided by or on behalf of the Company and/or other potential transaction participants, from public sources or otherwise reviewed by Evercore. Evercore assumes no responsibility for independent investigation or verification of such information and has relied on such information being complete and accurate in all material respects. To the extent such information includes estimates and forecasts of future financial performance prepared by or reviewed with the management of the Company and/or other potential transaction participants or obtained from public sources, Evercore has assumed that such estimates and forecasts have been reasonably prepared on bases reflecting the best currently available estimates and judgments of such management (or, with respect to estimates and forecasts obtained from public sources, represent reasonable estimates). No representation or warranty, express or implied, is made as to the accuracy or completeness of such information and nothing contained herein is, or shall be relied upon as, a representation, whether as to the past, the present or the future. These materials were designed for use by specific persons familiar with the business and affairs of the Company. These materials are not intended to provide the sole basis for evaluating, and should not be considered a recommendation with respect to, any transaction or other matter. These materials have been developed by and are proprietary to Evercore and were prepared exclusively for the benefit and internal use of the Special Committee of the Board of Directors of the Company. These materials were compiled on a confidential basis for use by the Special Committee of the Board of Directors of the Company in evaluating the potential transaction described herein and not with a view to public disclosure or filing thereof under state or federal securities laws, and may not be reproduced, disseminated, quoted or referred to, in whole or in part, without the prior written consent of Evercore. These materials do not constitute an offer or solicitation to sell or purchase any securities and are not a commitment by Evercore (or any affiliate) to provide or arrange any financing for any transaction or to purchase any security in connection therewith. Evercore assumes no obligation to update or otherwise revise these materials. These materials may not reflect information known to other professionals in other business areas of Evercore and its affiliates. Evercore and its affiliates do not provide legal, accounting or tax advice. Accordingly, any statements contained herein as to tax matters were neither written nor intended by Evercore or its affiliates to be used and cannot be used by any taxpayer for the purpose of avoiding tax penalties that may be imposed on such taxpayer. Each person should seek legal, accounting and tax advice based on his, her or its particular circumstances from independent advisors regarding the impact of the transactions or matters described herein. 13