
Preliminary Draft (8/16/2021 1:00 PM) - Confidential Exhibit C.VIII DRAFT – PRELIMINARY – SUBJECT TO CHANGE Project Ocala Fairness Opinion Presentation Materials August 16, 2021 Preliminary Draft (8/16/2021 1:00 PM) - Confidential Exhibit C.VIII DRAFT – PRELIMINARY – SUBJECT TO CHANGE Project Ocala Fairness Opinion Presentation Materials August 16, 2021
Preliminary Draft (8/16/2021 1:00 PM) - Confidential Table of Contents Section Transaction Summary I Company Overview II Valuation Analysis IIIPreliminary Draft (8/16/2021 1:00 PM) - Confidential Table of Contents Section Transaction Summary I Company Overview II Valuation Analysis III
Preliminary Draft (8/16/2021 1:00 PM) - Confidential I. Transaction SummaryPreliminary Draft (8/16/2021 1:00 PM) - Confidential I. Transaction Summary
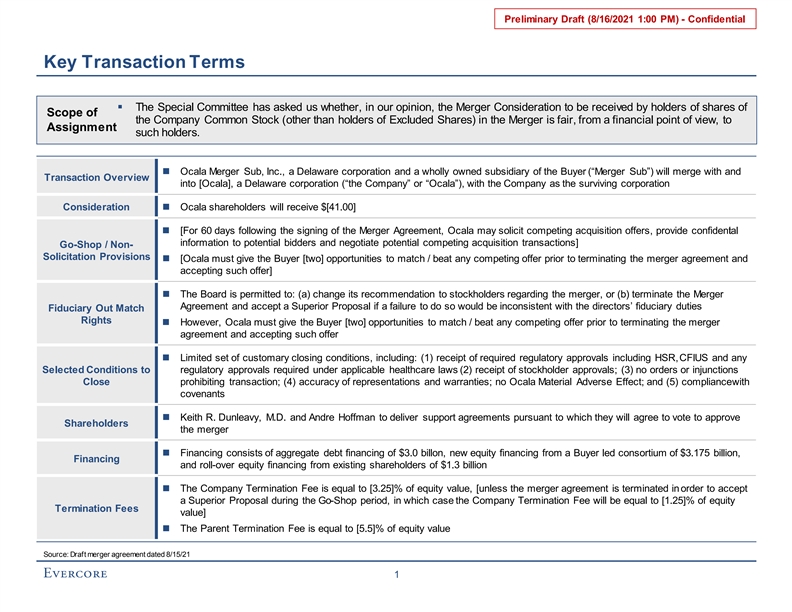
Preliminary Draft (8/16/2021 1:00 PM) - Confidential Key Transaction Terms § The Special Committee has asked us whether, in our opinion, the Merger Consideration to be received by holders of shares of Scope of the Company Common Stock (other than holders of Excluded Shares) in the Merger is fair, from a financial point of view, to Assignment such holders. n Ocala Merger Sub, Inc., a Delaware corporation and a wholly owned subsidiary of the Buyer (“Merger Sub”) will merge with and Transaction Overview into [Ocala], a Delaware corporation (“the Company” or “Ocala”), with the Company as the surviving corporation Considerationn Ocala shareholders will receive $[41.00] n [For 60 days following the signing of the Merger Agreement, Ocala may solicit competing acquisition offers, provide confidential information to potential bidders and negotiate potential competing acquisition transactions] Go-Shop / Non- Solicitation Provisions n [Ocala must give the Buyer [two] opportunities to match / beat any competing offer prior to terminating the merger agreement and accepting such offer] n The Board is permitted to: (a) change its recommendation to stockholders regarding the merger, or (b) terminate the Merger Agreement and accept a Superior Proposal if a failure to do so would be inconsistent with the directors’ fiduciary duties Fiduciary Out Match Rights n However, Ocala must give the Buyer [two] opportunities to match / beat any competing offer prior to terminating the merger agreement and accepting such offer n Limited set of customary closing conditions, including: (1) receipt of required regulatory approvals including HSR,CFIUS and any Selected Conditions to regulatory approvals required under applicable healthcare laws (2) receipt of stockholder approvals; (3) no orders or injunctions Close prohibiting transaction; (4) accuracy of representations and warranties; no Ocala Material Adverse Effect; and (5) compliancewith covenants n Keith R. Dunleavy, M.D. and Andre Hoffman to deliver support agreements pursuant to which they will agree to vote to approve Shareholders the merger n Financing consists of aggregate debt financing of $3.0 billon, new equity financing from a Buyer led consortium of $3.175 billion, Financing and roll-over equity financing from existing shareholders of $1.3 billion n The Company Termination Fee is equal to [3.25]% of equity value, [unless the merger agreement is terminated in order to accept a Superior Proposal during the Go-Shop period, in which case the Company Termination Fee will be equal to [1.25]% of equity Termination Fees value] n The Parent Termination Fee is equal to [5.5]% of equity value Source: Draft merger agreement dated 8/15/21 1
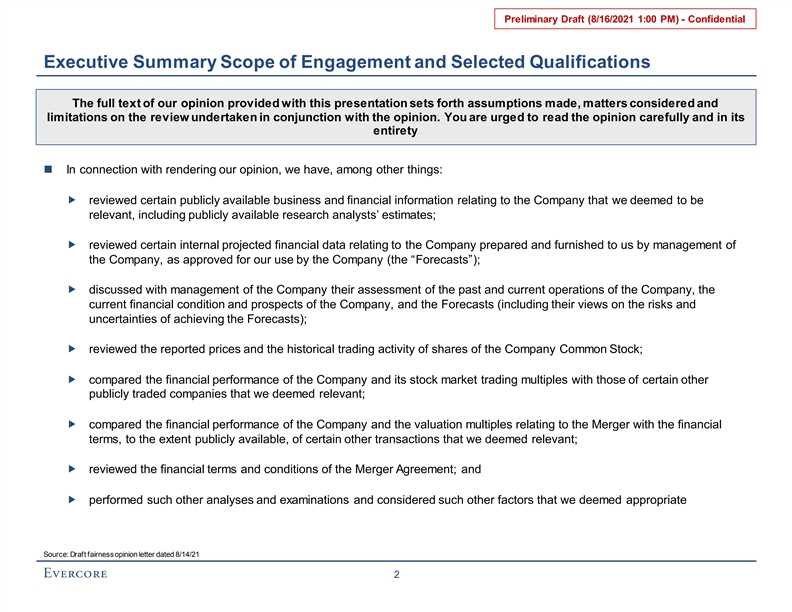
Preliminary Draft (8/16/2021 1:00 PM) - Confidential Executive Summary Scope of Engagement and Selected Qualifications The full text of our opinion provided with this presentation sets forth assumptions made, matters considered and limitations on the review undertaken in conjunction with the opinion. You are urged to read the opinion carefully and in its entirety n In connection with rendering our opinion, we have, among other things: „ reviewed certain publicly available business and financial information relating to the Company that we deemed to be relevant, including publicly available research analysts’ estimates; „ reviewed certain internal projected financial data relating to the Company prepared and furnished to us by management of the Company, as approved for our use by the Company (the “Forecasts”); „ discussed with management of the Company their assessment of the past and current operations of the Company, the current financial condition and prospects of the Company, and the Forecasts (including their views on the risks and uncertainties of achieving the Forecasts); „ reviewed the reported prices and the historical trading activity of shares of the Company Common Stock; „ compared the financial performance of the Company and its stock market trading multiples with those of certain other publicly traded companies that we deemed relevant; „ compared the financial performance of the Company and the valuation multiples relating to the Merger with the financial terms, to the extent publicly available, of certain other transactions that we deemed relevant; „ reviewed the financial terms and conditions of the Merger Agreement; and „ performed such other analyses and examinations and considered such other factors that we deemed appropriate Source: Draft fairness opinion letter dated 8/14/21 2Preliminary Draft (8/16/2021 1:00 PM) - Confidential Executive Summary Scope of Engagement and Selected Qualifications The full text of our opinion provided with this presentation sets forth assumptions made, matters considered and limitations on the review undertaken in conjunction with the opinion. You are urged to read the opinion carefully and in its entirety n In connection with rendering our opinion, we have, among other things: „ reviewed certain publicly available business and financial information relating to the Company that we deemed to be relevant, including publicly available research analysts’ estimates; „ reviewed certain internal projected financial data relating to the Company prepared and furnished to us by management of the Company, as approved for our use by the Company (the “Forecasts”); „ discussed with management of the Company their assessment of the past and current operations of the Company, the current financial condition and prospects of the Company, and the Forecasts (including their views on the risks and uncertainties of achieving the Forecasts); „ reviewed the reported prices and the historical trading activity of shares of the Company Common Stock; „ compared the financial performance of the Company and its stock market trading multiples with those of certain other publicly traded companies that we deemed relevant; „ compared the financial performance of the Company and the valuation multiples relating to the Merger with the financial terms, to the extent publicly available, of certain other transactions that we deemed relevant; „ reviewed the financial terms and conditions of the Merger Agreement; and „ performed such other analyses and examinations and considered such other factors that we deemed appropriate Source: Draft fairness opinion letter dated 8/14/21 2

Preliminary Draft (8/16/2021 1:00 PM) - Confidential Summary of Implied Premia and Transaction Multiples ($ in millions, except per share values) Offer Premium to Share Price Transaction Multiples Merger Implied Premium Consideration Ocala to Ocala Share Price Shareholders Offer per Share: $41.00 2 Offer per Share: $41.00 156.431 Fully Diluted Shares Outstanding $6,414 Equity Value Current Share Price (8/13/21): $37.77 8.6% 2 901 Plus: Debt Share Price as of 7/26/21: $32.71 25.3% 3 27 Plus: Capitalized Leases 2 Intraday 52-Week High (8/6/21): $39.28 4.4% (89) Less: Cash 1 Intraday 52-Week High (7/13/21): 34.47 18.9% $7,252 Total Enterprise Value Intraday 52-Week Low (12/21/20): 17.56 133.5% 4 Implied Premiums Relative to 8/13/21 Metric Total Enterprise Value To: Multiple 1-Month Average $35.81 14.5% 2021E Revenue $775 9.4x 3-Month Average 33.54 22.2% 2022E Revenue 902 8.0x 6-Month Average 30.84 33.0% 2021E Adjusted EBITDA 271 26.8x 1-Year Average 27.01 51.8% 2022E Adjusted EBITDA 330 22.0x Implied Premiums Relative to 7/26/21 1-Month Average $33.23 23.4% 3-Month Average 31.86 28.7% 6-Month Average 29.59 38.5% 1-Year Average 26.25 56.2% Source: Company filings, Company management projections as of August 2021, FactSet (8/13/21), August 2021 Detailed Capitalization Schedule per the Company 1. Reflects 52-week high as of 7/26/21, the last trading day prior to Bloomberg report of rumored sale to Nordic Capital 2. Per August 2021 Detailed Capitalization Schedule from the Company 3. Per Company filings 4. Company management projections as of August 2021; adjusted figures are exclusive of stock-based compensation expense and non-recurring expenses 3Preliminary Draft (8/16/2021 1:00 PM) - Confidential Summary of Implied Premia and Transaction Multiples ($ in millions, except per share values) Offer Premium to Share Price Transaction Multiples Merger Implied Premium Consideration Ocala to Ocala Share Price Shareholders Offer per Share: $41.00 2 Offer per Share: $41.00 156.431 Fully Diluted Shares Outstanding $6,414 Equity Value Current Share Price (8/13/21): $37.77 8.6% 2 901 Plus: Debt Share Price as of 7/26/21: $32.71 25.3% 3 27 Plus: Capitalized Leases 2 Intraday 52-Week High (8/6/21): $39.28 4.4% (89) Less: Cash 1 Intraday 52-Week High (7/13/21): 34.47 18.9% $7,252 Total Enterprise Value Intraday 52-Week Low (12/21/20): 17.56 133.5% 4 Implied Premiums Relative to 8/13/21 Metric Total Enterprise Value To: Multiple 1-Month Average $35.81 14.5% 2021E Revenue $775 9.4x 3-Month Average 33.54 22.2% 2022E Revenue 902 8.0x 6-Month Average 30.84 33.0% 2021E Adjusted EBITDA 271 26.8x 1-Year Average 27.01 51.8% 2022E Adjusted EBITDA 330 22.0x Implied Premiums Relative to 7/26/21 1-Month Average $33.23 23.4% 3-Month Average 31.86 28.7% 6-Month Average 29.59 38.5% 1-Year Average 26.25 56.2% Source: Company filings, Company management projections as of August 2021, FactSet (8/13/21), August 2021 Detailed Capitalization Schedule per the Company 1. Reflects 52-week high as of 7/26/21, the last trading day prior to Bloomberg report of rumored sale to Nordic Capital 2. Per August 2021 Detailed Capitalization Schedule from the Company 3. Per Company filings 4. Company management projections as of August 2021; adjusted figures are exclusive of stock-based compensation expense and non-recurring expenses 3

Preliminary Draft (8/16/2021 1:00 PM) - Confidential Overview of Buyer Outreach As of 8/2/21 Contact Log 13 9 11 9 14 13 4 4 3 All parties Signed NDAs Management meeting Declined Submitted proposal Source: J.P. Morgan Contact log as of 8/2/21 4Preliminary Draft (8/16/2021 1:00 PM) - Confidential Overview of Buyer Outreach As of 8/2/21 Contact Log 13 9 11 9 14 13 4 4 3 All parties Signed NDAs Management meeting Declined Submitted proposal Source: J.P. Morgan Contact log as of 8/2/21 4
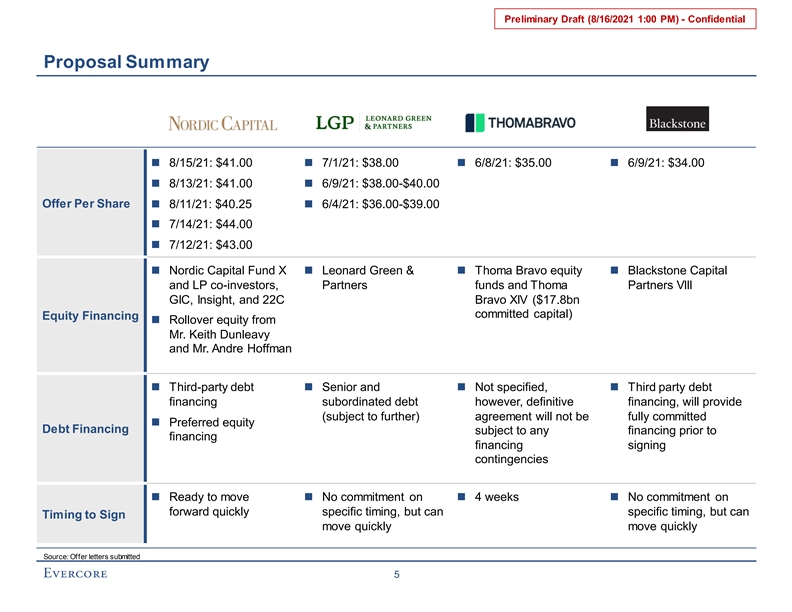
Preliminary Draft (8/16/2021 1:00 PM) - Confidential Proposal Summary n 8/15/21: $41.00n 7/1/21: $38.00 n 6/8/21: $35.00n 6/9/21: $34.00 n 8/13/21: $41.00n 6/9/21: $38.00-$40.00 Offer Per Share n 8/11/21: $40.25n 6/4/21: $36.00-$39.00 n 7/14/21: $44.00 n 7/12/21: $43.00 n Nordic Capital Fund X n Leonard Green & n Thoma Bravo equity n Blackstone Capital and LP co-investors, Partners funds and Thoma Partners VIII GIC, Insight, and 22C Bravo XIV ($17.8bn committed capital) Equity Financing n Rollover equity from Mr. Keith Dunleavy and Mr. Andre Hoffman n Third-party debt n Senior and n Not specified, n Third party debt financing subordinated debt however, definitive financing, will provide (subject to further) agreement will not be fully committed n Preferred equity Debt Financing subject to any financing prior to financing financing signing contingencies n Ready to move n No commitment on n 4 weeksn No commitment on forward quickly specific timing, but can specific timing, but can Timing to Sign move quickly move quickly Source: Offer letters submitted 5Preliminary Draft (8/16/2021 1:00 PM) - Confidential Proposal Summary n 8/15/21: $41.00n 7/1/21: $38.00 n 6/8/21: $35.00n 6/9/21: $34.00 n 8/13/21: $41.00n 6/9/21: $38.00-$40.00 Offer Per Share n 8/11/21: $40.25n 6/4/21: $36.00-$39.00 n 7/14/21: $44.00 n 7/12/21: $43.00 n Nordic Capital Fund X n Leonard Green & n Thoma Bravo equity n Blackstone Capital and LP co-investors, Partners funds and Thoma Partners VIII GIC, Insight, and 22C Bravo XIV ($17.8bn committed capital) Equity Financing n Rollover equity from Mr. Keith Dunleavy and Mr. Andre Hoffman n Third-party debt n Senior and n Not specified, n Third party debt financing subordinated debt however, definitive financing, will provide (subject to further) agreement will not be fully committed n Preferred equity Debt Financing subject to any financing prior to financing financing signing contingencies n Ready to move n No commitment on n 4 weeksn No commitment on forward quickly specific timing, but can specific timing, but can Timing to Sign move quickly move quickly Source: Offer letters submitted 5
Preliminary Draft (8/16/2021 1:00 PM) - Confidential II. Company Overview
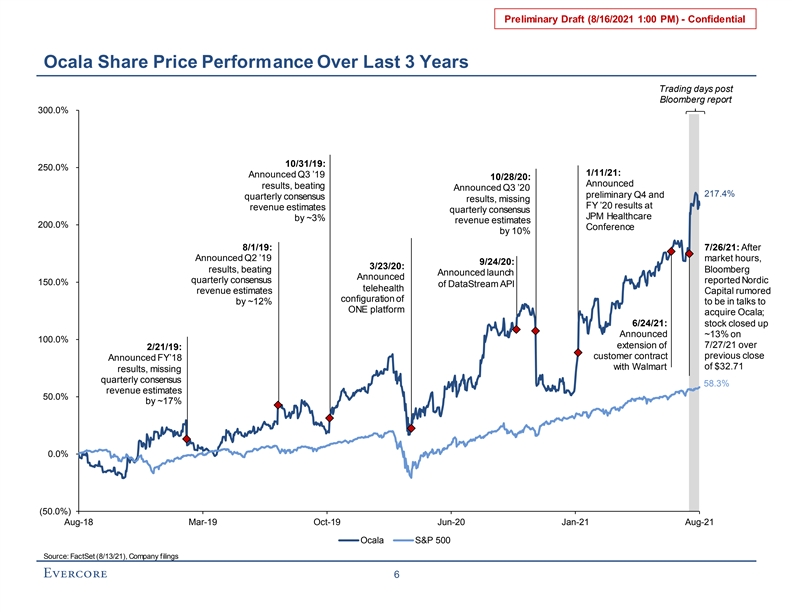
Preliminary Draft (8/16/2021 1:00 PM) - Confidential Ocala Share Price Performance Over Last 3 Years Trading days post Bloomberg report 300.0% 10/31/19: 250.0% 1/11/21: Announced Q3 ’19 10/28/20: Announced results, beating Announced Q3 ’20 217.4% preliminary Q4 and quarterly consensus results, missing FY ’20 results at revenue estimates quarterly consensus JPM Healthcare by ~3% revenue estimates 200.0% Conference by 10% 8/1/19: 7/26/21: After Announced Q2 ’19 market hours, 9/24/20: 3/23/20: results, beating Bloomberg Announced launch Announced quarterly consensus reported Nordic 150.0% of DataStream API telehealth revenue estimates Capital rumored configuration of by ~12% to be in talks to ONE platform acquire Ocala; 6/24/21: stock closed up Announced ~13% on 100.0% extension of 7/27/21 over 2/21/19: customer contract previous close Announced FY’18 of $32.71 with Walmart results, missing quarterly consensus 58.3% revenue estimates 50.0% by ~17% 0.0% (50.0%) Aug-18 Mar-19 Oct-19 Jun-20 Jan-21 Aug-21 Ocala S&P 500 Source: FactSet (8/13/21), Company filings 6Preliminary Draft (8/16/2021 1:00 PM) - Confidential Ocala Share Price Performance Over Last 3 Years Trading days post Bloomberg report 300.0% 10/31/19: 250.0% 1/11/21: Announced Q3 ’19 10/28/20: Announced results, beating Announced Q3 ’20 217.4% preliminary Q4 and quarterly consensus results, missing FY ’20 results at revenue estimates quarterly consensus JPM Healthcare by ~3% revenue estimates 200.0% Conference by 10% 8/1/19: 7/26/21: After Announced Q2 ’19 market hours, 9/24/20: 3/23/20: results, beating Bloomberg Announced launch Announced quarterly consensus reported Nordic 150.0% of DataStream API telehealth revenue estimates Capital rumored configuration of by ~12% to be in talks to ONE platform acquire Ocala; 6/24/21: stock closed up Announced ~13% on 100.0% extension of 7/27/21 over 2/21/19: customer contract previous close Announced FY’18 of $32.71 with Walmart results, missing quarterly consensus 58.3% revenue estimates 50.0% by ~17% 0.0% (50.0%) Aug-18 Mar-19 Oct-19 Jun-20 Jan-21 Aug-21 Ocala S&P 500 Source: FactSet (8/13/21), Company filings 6
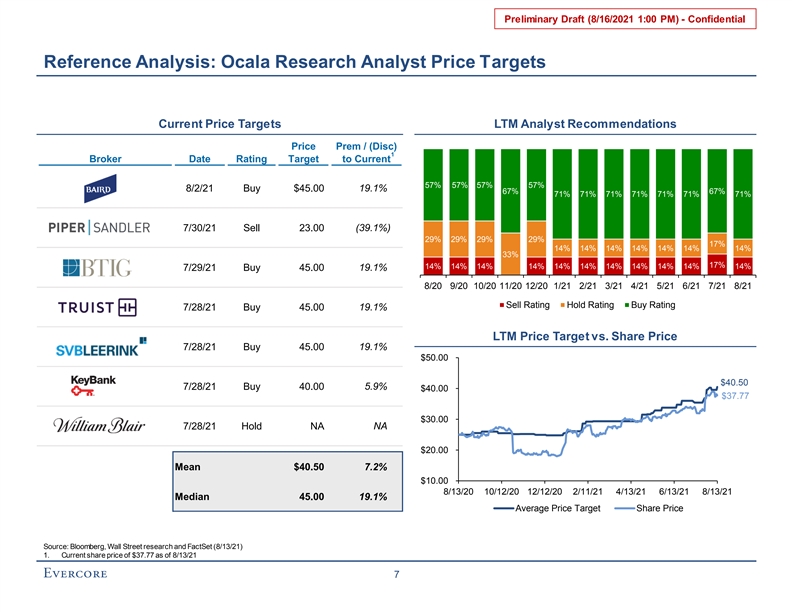
Preliminary Draft (8/16/2021 1:00 PM) - Confidential Reference Analysis: Ocala Research Analyst Price Targets Current Price Targets LTM Analyst Recommendations Price Prem / (Disc) 1 Broker Date Rating Target to Current 57% 57% 57% 57% 8/2/21 Buy $45.00 19.1% 67% 67% 71% 71% 71% 71% 71% 71% 71% 7/30/21 Sell 23.00 (39.1%) 29% 29% 29% 29% 17% 14% 14% 14% 14% 14% 14% 14% 33% 17% 14% 14% 14% 14% 14% 14% 14% 14% 14% 14% 14% 7/29/21 Buy 45.00 19.1% 8/20 9/20 10/20 11/20 12/20 1/21 2/21 3/21 4/21 5/21 6/21 7/21 8/21 Sell Rating Hold Rating Buy Rating 7/28/21 Buy 45.00 19.1% LTM Price Target vs. Share Price 7/28/21 Buy 45.00 19.1% $50.00 $40.50 7/28/21 Buy 40.00 5.9% $40.00 $37.77 $30.00 NA 7/28/21 Hold NA $20.00 Mean $40.50 7.2% $10.00 8/13/20 10/12/20 12/12/20 2/11/21 4/13/21 6/13/21 8/13/21 Median 45.00 19.1% Average Price Target Share Price Source: Bloomberg, Wall Street research and FactSet (8/13/21) 1. Current share price of $37.77 as of 8/13/21 7Preliminary Draft (8/16/2021 1:00 PM) - Confidential Reference Analysis: Ocala Research Analyst Price Targets Current Price Targets LTM Analyst Recommendations Price Prem / (Disc) 1 Broker Date Rating Target to Current 57% 57% 57% 57% 8/2/21 Buy $45.00 19.1% 67% 67% 71% 71% 71% 71% 71% 71% 71% 7/30/21 Sell 23.00 (39.1%) 29% 29% 29% 29% 17% 14% 14% 14% 14% 14% 14% 14% 33% 17% 14% 14% 14% 14% 14% 14% 14% 14% 14% 14% 14% 7/29/21 Buy 45.00 19.1% 8/20 9/20 10/20 11/20 12/20 1/21 2/21 3/21 4/21 5/21 6/21 7/21 8/21 Sell Rating Hold Rating Buy Rating 7/28/21 Buy 45.00 19.1% LTM Price Target vs. Share Price 7/28/21 Buy 45.00 19.1% $50.00 $40.50 7/28/21 Buy 40.00 5.9% $40.00 $37.77 $30.00 NA 7/28/21 Hold NA $20.00 Mean $40.50 7.2% $10.00 8/13/20 10/12/20 12/12/20 2/11/21 4/13/21 6/13/21 8/13/21 Median 45.00 19.1% Average Price Target Share Price Source: Bloomberg, Wall Street research and FactSet (8/13/21) 1. Current share price of $37.77 as of 8/13/21 7

Preliminary Draft (8/16/2021 1:00 PM) - Confidential Ocala Financial Projections ($ in millions, except per share data) Revenue '21E - '23E 23E - '25E $1,600 $1,385 CAGR CAGR $1,200 $1,200 12.2% NA $1,040 $973 $902 $870 15.9% 15.4% $773 $775 $800 $400 $0 2021E 2022E 2023E 2024E 2025E Research Projections 12.5% 11.9% NA NA Growth % Management Projections 16.4% 15.4% 15.4% 15.4% Growth % Adj. EBITDA '21E - '23E 23E - '25E $594 $600 CAGR CAGR $492 14.6% NA $450 $404 22.2% 21.2% $355 $330 $311 $270 $271 $300 $150 $0 2021E 2022E 2023E 2024E 2025E Research Projections 34.9% 35.8% 36.4% NA NA Margin % Management Projections 35.0% 36.6% 38.9% 41.0% 42.9% Margin % Research Projections Management Projections Source: FactSet (8/13/21), Company management projections as of August 2021 8Preliminary Draft (8/16/2021 1:00 PM) - Confidential Ocala Financial Projections ($ in millions, except per share data) Revenue '21E - '23E 23E - '25E $1,600 $1,385 CAGR CAGR $1,200 $1,200 12.2% NA $1,040 $973 $902 $870 15.9% 15.4% $773 $775 $800 $400 $0 2021E 2022E 2023E 2024E 2025E Research Projections 12.5% 11.9% NA NA Growth % Management Projections 16.4% 15.4% 15.4% 15.4% Growth % Adj. EBITDA '21E - '23E 23E - '25E $594 $600 CAGR CAGR $492 14.6% NA $450 $404 22.2% 21.2% $355 $330 $311 $270 $271 $300 $150 $0 2021E 2022E 2023E 2024E 2025E Research Projections 34.9% 35.8% 36.4% NA NA Margin % Management Projections 35.0% 36.6% 38.9% 41.0% 42.9% Margin % Research Projections Management Projections Source: FactSet (8/13/21), Company management projections as of August 2021 8
Preliminary Draft (8/16/2021 1:00 PM) - Confidential III. Valuation AnalysisPreliminary Draft (8/16/2021 1:00 PM) - Confidential III. Valuation Analysis
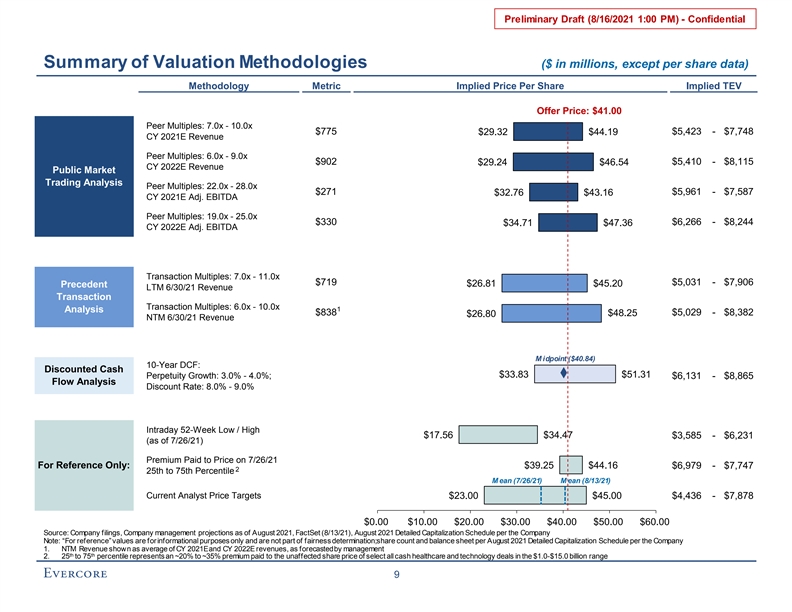
Preliminary Draft (8/16/2021 1:00 PM) - Confidential Summary of Valuation Methodologies ($ in millions, except per share data) Methodology Metric Implied Price Per Share Implied TEV Offer Price: $41.00 Peer Multiples: 7.0x - 10.0x $775 $29.32 $44.19 $5,423 - $7,748 CY 2021E Revenue Peer Multiples: 6.0x - 9.0x $902 $29.24 $46.54 $5,410 - $8,115 CY 2022E Revenue Public Market Trading Analysis Peer Multiples: 22.0x - 28.0x $271 $5,961 - $7,587 $32.76 $43.16 CY 2021E Adj. EBITDA Peer Multiples: 19.0x - 25.0x $330 $6,266 - $8,244 $34.71 $47.36 CY 2022E Adj. EBITDA Transaction Multiples: 7.0x - 11.0x $719 $5,031 - $7,906 $26.81 $45.20 Precedent LTM 6/30/21 Revenue Transaction Transaction Multiples: 6.0x - 10.0x 1 Analysis $838 $48.25 $5,029 - $8,382 $26.80 NTM 6/30/21 Revenue M idpoint ($40.84) 10-Year DCF: Discounted Cash $33.83 $51.31 Perpetuity Growth: 3.0% - 4.0%; $6,131 - $8,865 Flow Analysis Discount Rate: 8.0% - 9.0% Intraday 52-Week Low / High $17.56 $34.47 $3,585 - $6,231 (as of 7/26/21) Premium Paid to Price on 7/26/21 For Reference Only: $39.25 $44.16 $6,979 - $7,747 2 25th to 75th Percentile M ean (7/26/21) M ean (8/13/21) Current Analyst Price Targets $23.00 $45.00 $4,436 - $7,878 $0.00 $10.00 $20.00 $30.00 $40.00 $50.00 $60.00 Source: Company filings, Company management projections as of August 2021, FactSet (8/13/21), August 2021 Detailed Capitalization Schedule per the Company Note: “For reference” values are for informational purposes only and are not part of fairness determination; share count and balance sheet per August 2021 Detailed Capitalization Schedule per the Company 1. NTM Revenue shown as average of CY 2021E and CY 2022E revenues, as forecasted by management th th 2. 25 to 75 percentile represents an ~20% to ~35% premium paid to the unaffected share price of select all cash healthcare and technology deals in the $1.0-$15.0 billion range 9Preliminary Draft (8/16/2021 1:00 PM) - Confidential Summary of Valuation Methodologies ($ in millions, except per share data) Methodology Metric Implied Price Per Share Implied TEV Offer Price: $41.00 Peer Multiples: 7.0x - 10.0x $775 $29.32 $44.19 $5,423 - $7,748 CY 2021E Revenue Peer Multiples: 6.0x - 9.0x $902 $29.24 $46.54 $5,410 - $8,115 CY 2022E Revenue Public Market Trading Analysis Peer Multiples: 22.0x - 28.0x $271 $5,961 - $7,587 $32.76 $43.16 CY 2021E Adj. EBITDA Peer Multiples: 19.0x - 25.0x $330 $6,266 - $8,244 $34.71 $47.36 CY 2022E Adj. EBITDA Transaction Multiples: 7.0x - 11.0x $719 $5,031 - $7,906 $26.81 $45.20 Precedent LTM 6/30/21 Revenue Transaction Transaction Multiples: 6.0x - 10.0x 1 Analysis $838 $48.25 $5,029 - $8,382 $26.80 NTM 6/30/21 Revenue M idpoint ($40.84) 10-Year DCF: Discounted Cash $33.83 $51.31 Perpetuity Growth: 3.0% - 4.0%; $6,131 - $8,865 Flow Analysis Discount Rate: 8.0% - 9.0% Intraday 52-Week Low / High $17.56 $34.47 $3,585 - $6,231 (as of 7/26/21) Premium Paid to Price on 7/26/21 For Reference Only: $39.25 $44.16 $6,979 - $7,747 2 25th to 75th Percentile M ean (7/26/21) M ean (8/13/21) Current Analyst Price Targets $23.00 $45.00 $4,436 - $7,878 $0.00 $10.00 $20.00 $30.00 $40.00 $50.00 $60.00 Source: Company filings, Company management projections as of August 2021, FactSet (8/13/21), August 2021 Detailed Capitalization Schedule per the Company Note: “For reference” values are for informational purposes only and are not part of fairness determination; share count and balance sheet per August 2021 Detailed Capitalization Schedule per the Company 1. NTM Revenue shown as average of CY 2021E and CY 2022E revenues, as forecasted by management th th 2. 25 to 75 percentile represents an ~20% to ~35% premium paid to the unaffected share price of select all cash healthcare and technology deals in the $1.0-$15.0 billion range 9
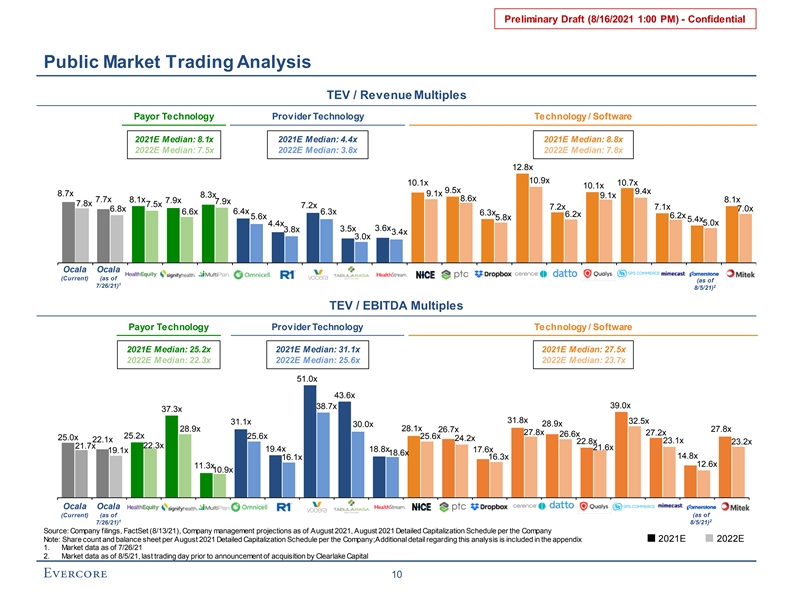
Preliminary Draft (8/16/2021 1:00 PM) - Confidential Public Market Trading Analysis TEV / Revenue Multiples Payor Technology Provider Technology Technology / Software 2021E Median: 8.1x 2021E Median: 4.4x 2021E Median: 8.8x 2022E Median: 7.5x 2022E Median: 3.8x 2022E Median: 7.8x 12.8x 10.9x 10.1x 10.7x 10.1x 9.5x 9.4x 8.7x 9.1x 8.3x 9.1x 8.6x 7.7x 8.1x 7.9x 8.1x 7.9x 7.8x 7.5x 7.2x 7.2x 7.1x 6.8x 7.0x 6.4x 6.6x 6.3x 6.3x 6.2x 6.2x 5.6x 5.8x 5.4x 4.4x 5.0x 3.6x 3.8x 3.5x 3.4x 3.0x Ocala Ocala (Current) (as of (as of 1 7/26/21) 2 8/5/21) TEV / EBITDA Multiples Payor Technology Provider Technology Technology / Software 2021E Median: 25.2x 2021E Median: 31.1x 2021E Median: 27.5x 2022E Median: 22.3x 2022E Median: 25.6x 2022E Median: 23.7x 51.0x 43.6x 39.0x 38.7x 37.3x 31.8x 32.5x 31.1x 28.9x 30.0x 28.1x 28.9x 26.7x 27.8x 27.8x 27.2x 26.6x 25.2x 25.6x 25.6x 25.0x 24.2x 22.1x 23.1x 22.8x 23.2x 22.3x 21.7x 21.6x 19.4x 18.8x 17.6x 19.1x 18.6x 14.8x 16.1x 16.3x 12.6x 11.3x 10.9x Ocala Ocala (Current) (as of (as of 2 1 8/5/21) 7/26/21) Source: Company filings, FactSet (8/13/21), Company management projections as of August 2021, August 2021 Detailed Capitalization Schedule per the Company Note: Share count and balance sheet per August 2021 Detailed Capitalization Schedule per the Company; Additional detail regarding this analysis is included in the appendix 2021E 2022E 1. Market data as of 7/26/21 2. Market data as of 8/5/21, last trading day prior to announcement of acquisition by Clearlake Capital 10

Preliminary Draft (8/16/2021 1:00 PM) - Confidential Selected Transactions Analysis | Healthcare Platform Technology ($ in billions) TEV / Revenue 8.8x 7.6x 6.6x 6.3x Median: 5.1x 5.1x 4.3x 4.4x 4.3x 4.1x 4.1x Median: 4.4x LTM NTM Acquiror Target 100% Cash 100% Cash 100% Cash 100% Cash 100% Cash Cash / Stock % Ann. Date Jan-21 Dec-20 Jun-19 Nov-18 Jun-18 Trans. Value $13.4 $3.4 $6.0 $5.7 $4.9 Source: Company filings and press releases 11Preliminary Draft (8/16/2021 1:00 PM) - Confidential Selected Transactions Analysis | Healthcare Platform Technology ($ in billions) TEV / Revenue 8.8x 7.6x 6.6x 6.3x Median: 5.1x 5.1x 4.3x 4.4x 4.3x 4.1x 4.1x Median: 4.4x LTM NTM Acquiror Target 100% Cash 100% Cash 100% Cash 100% Cash 100% Cash Cash / Stock % Ann. Date Jan-21 Dec-20 Jun-19 Nov-18 Jun-18 Trans. Value $13.4 $3.4 $6.0 $5.7 $4.9 Source: Company filings and press releases 11
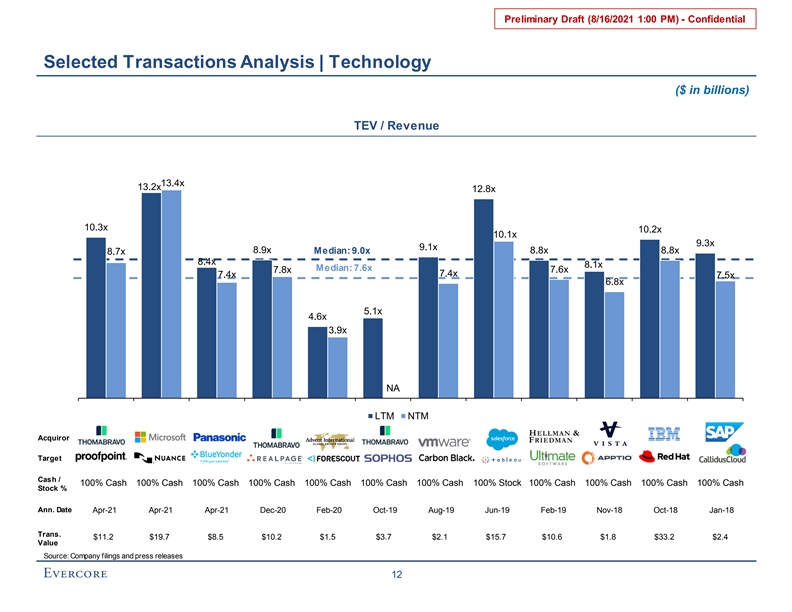
Preliminary Draft (8/16/2021 1:00 PM) - Confidential Selected Transactions Analysis | Technology ($ in billions) TEV / Revenue 13.4x 13.2x 12.8x 10.3x 10.2x 10.1x 9.3x 9.1x 8.9x Median: 9.0x 8.8x 8.8x 8.7x 8.4x 8.1x Median: 7.6x 7.8x 7.6x 7.4x 7.4x 7.5x 6.8x 5.1x 4.6x 3.9x NA LTM NTM Acquiror Target Cash / 100% Cash 100% Cash 100% Cash 100% Cash 100% Cash 100% Cash 100% Cash 100% Stock 100% Cash 100% Cash 100% Cash 100% Cash Stock % Ann. Date Apr-21 Apr-21 Apr-21 Dec-20 Feb-20 Oct-19 Aug-19 Jun-19 Feb-19 Nov-18 Oct-18 Jan-18 Trans. $11.2 $19.7 $8.5 $10.2 $1.5 $3.7 $2.1 $15.7 $10.6 $1.8 $33.2 $2.4 Value Source: Company filings and press releases 12Preliminary Draft (8/16/2021 1:00 PM) - Confidential Selected Transactions Analysis | Technology ($ in billions) TEV / Revenue 13.4x 13.2x 12.8x 10.3x 10.2x 10.1x 9.3x 9.1x 8.9x Median: 9.0x 8.8x 8.8x 8.7x 8.4x 8.1x Median: 7.6x 7.8x 7.6x 7.4x 7.4x 7.5x 6.8x 5.1x 4.6x 3.9x NA LTM NTM Acquiror Target Cash / 100% Cash 100% Cash 100% Cash 100% Cash 100% Cash 100% Cash 100% Cash 100% Stock 100% Cash 100% Cash 100% Cash 100% Cash Stock % Ann. Date Apr-21 Apr-21 Apr-21 Dec-20 Feb-20 Oct-19 Aug-19 Jun-19 Feb-19 Nov-18 Oct-18 Jan-18 Trans. $11.2 $19.7 $8.5 $10.2 $1.5 $3.7 $2.1 $15.7 $10.6 $1.8 $33.2 $2.4 Value Source: Company filings and press releases 12

Preliminary Draft (8/16/2021 1:00 PM) - Confidential Illustrative 10-year Discounted Cash Flow Analysis ($ in millions, except per share data) Assumes 8/3/21 valuation date, 8.5% discount rate, 3.5% PGR Discounted Cash Flow Analysis 2021E 2022E 2023E 2024E 2025E 2026E 2027E 2028E 2029E 2030E Terminal Revenue $775 $902 $1,040 $1,200 $1,385 $1,573 $1,759 $1,935 $2,065 $2,137 $2,137 % Growth 16.4% 15.4% 15.4% 15.4% 13.6% 11.8% 10.0% 6.7% 3.5% Adj. EBITDA $271 $330 $404 $492 $594 $675 $755 $830 $886 $917 $917 % Margin 35.0% 36.6% 38.9% 41.0% 42.9% 42.9% 42.9% 42.9% 42.9% 42.9% 42.9% Less: Stock-Based Compensation (Post-Tax) ($23) ($25) ($25) ($25) ($25) ($29) ($32) ($35) ($38) ($39) ($39) Less: Taxes (43) (59) (80) (104) (133) (153) (174) (194) (210) (220) (220) Less: CapEx (65) (65) (65) (75) (87) (98) (110) (121) (129) (134) (134) Less: Change in NWC (15) (18) (21) (24) (28) (28) (28) (26) (20) (11) (11) 1 Unlevered FCF $124 $163 $214 $264 $322 $367 $411 $454 $490 $514 $514 PV of Unlevered FCF $50 $151 $183 $208 $234 $246 $254 $258 $257 $248 NPV of Cash Flows $2,089 Perpetuity Growth Rate: 3.50% PV of Cash Flows $2,089 Terminal Year Cash Flow $514 PV of Terminal Value $5,138 Total Enterprise Value $7,228 Less: Debt (928) Plus: Cash 89 Total Equity Value $6,389 Shares Outstanding 156.4 Implied Share Price $40.84 Source: Company management projections as of August 2021; August 2021 Detailed Capitalization Schedule per the Company, Company filings Note: Cash flows discounted using mid-year convention; 28.0% tax rate per Company management; share count and balance sheet per August 2021 Detailed Capitalization Schedule per the Company 1. Terminal year unlevered free cash flow assumed to be equal to 2030E unlevered free cash flow per Company management 13Preliminary Draft (8/16/2021 1:00 PM) - Confidential Illustrative 10-year Discounted Cash Flow Analysis ($ in millions, except per share data) Assumes 8/3/21 valuation date, 8.5% discount rate, 3.5% PGR Discounted Cash Flow Analysis 2021E 2022E 2023E 2024E 2025E 2026E 2027E 2028E 2029E 2030E Terminal Revenue $775 $902 $1,040 $1,200 $1,385 $1,573 $1,759 $1,935 $2,065 $2,137 $2,137 % Growth 16.4% 15.4% 15.4% 15.4% 13.6% 11.8% 10.0% 6.7% 3.5% Adj. EBITDA $271 $330 $404 $492 $594 $675 $755 $830 $886 $917 $917 % Margin 35.0% 36.6% 38.9% 41.0% 42.9% 42.9% 42.9% 42.9% 42.9% 42.9% 42.9% Less: Stock-Based Compensation (Post-Tax) ($23) ($25) ($25) ($25) ($25) ($29) ($32) ($35) ($38) ($39) ($39) Less: Taxes (43) (59) (80) (104) (133) (153) (174) (194) (210) (220) (220) Less: CapEx (65) (65) (65) (75) (87) (98) (110) (121) (129) (134) (134) Less: Change in NWC (15) (18) (21) (24) (28) (28) (28) (26) (20) (11) (11) 1 Unlevered FCF $124 $163 $214 $264 $322 $367 $411 $454 $490 $514 $514 PV of Unlevered FCF $50 $151 $183 $208 $234 $246 $254 $258 $257 $248 NPV of Cash Flows $2,089 Perpetuity Growth Rate: 3.50% PV of Cash Flows $2,089 Terminal Year Cash Flow $514 PV of Terminal Value $5,138 Total Enterprise Value $7,228 Less: Debt (928) Plus: Cash 89 Total Equity Value $6,389 Shares Outstanding 156.4 Implied Share Price $40.84 Source: Company management projections as of August 2021; August 2021 Detailed Capitalization Schedule per the Company, Company filings Note: Cash flows discounted using mid-year convention; 28.0% tax rate per Company management; share count and balance sheet per August 2021 Detailed Capitalization Schedule per the Company 1. Terminal year unlevered free cash flow assumed to be equal to 2030E unlevered free cash flow per Company management 13
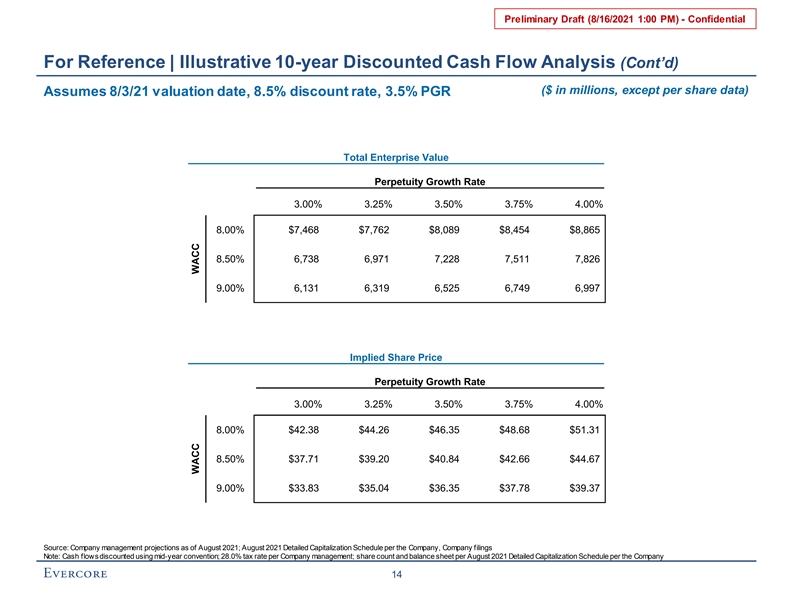
Preliminary Draft (8/16/2021 1:00 PM) - Confidential For Reference | Illustrative 10-year Discounted Cash Flow Analysis (Cont’d) ($ in millions, except per share data) Assumes 8/3/21 valuation date, 8.5% discount rate, 3.5% PGR Total Enterprise Value Implied Share Price Perpetuity Growth Rate Perpetuity Growth Rate 3.00% 3.25% 3.50% 3.75% 4.00% 8.00% $7,468 $7,762 $8,089 $8,454 $8,865 8.50% 6,738 6,971 7,228 7,511 7,826 9.00% 6,131 6,319 6,525 6,749 6,997 Implied Share Price Perpetuity Growth Rate 3.00% 3.25% 3.50% 3.75% 4.00% 8.00% $42.38 $44.26 $46.35 $48.68 $51.31 8.50% $37.71 $39.20 $40.84 $42.66 $44.67 9.00% $33.83 $35.04 $36.35 $37.78 $39.37 Source: Company management projections as of August 2021; August 2021 Detailed Capitalization Schedule per the Company, Company filings Note: Cash flows discounted using mid-year convention; 28.0% tax rate per Company management; share count and balance sheet per August 2021 Detailed Capitalization Schedule per the Company 14 WACC WACCPreliminary Draft (8/16/2021 1:00 PM) - Confidential For Reference | Illustrative 10-year Discounted Cash Flow Analysis (Cont’d) ($ in millions, except per share data) Assumes 8/3/21 valuation date, 8.5% discount rate, 3.5% PGR Total Enterprise Value Implied Share Price Perpetuity Growth Rate Perpetuity Growth Rate 3.00% 3.25% 3.50% 3.75% 4.00% 8.00% $7,468 $7,762 $8,089 $8,454 $8,865 8.50% 6,738 6,971 7,228 7,511 7,826 9.00% 6,131 6,319 6,525 6,749 6,997 Implied Share Price Perpetuity Growth Rate 3.00% 3.25% 3.50% 3.75% 4.00% 8.00% $42.38 $44.26 $46.35 $48.68 $51.31 8.50% $37.71 $39.20 $40.84 $42.66 $44.67 9.00% $33.83 $35.04 $36.35 $37.78 $39.37 Source: Company management projections as of August 2021; August 2021 Detailed Capitalization Schedule per the Company, Company filings Note: Cash flows discounted using mid-year convention; 28.0% tax rate per Company management; share count and balance sheet per August 2021 Detailed Capitalization Schedule per the Company 14 WACC WACC
Preliminary Draft (8/16/2021 1:00 PM) - Confidential These materials have been prepared by Evercore Group L.L.C. (“Evercore”) for the Special Committee of the Board of Directors of Ocala (the “Company”) to whom such materials are directly addressed and delivered and may not be used or relied upon for any purpose other than as specifically contemplated by a written agreement with Evercore. These materials are based on information provided by or on behalf of the Company and/or other potential transaction participants, from public sources or otherwise reviewed by Evercore. Evercore assumes no responsibility for independent investigation or verification of such information and has relied on such information being complete and accurate in all material respects. To the extent such information includes estimates and forecasts of future financial performance prepared by or reviewed with the management of the Company and/or other potential transaction participants or obtained from public sources, Evercore has assumed that such estimates and forecasts have been reasonably prepared on bases reflecting the best currently available estimates and judgments of such management (or, with respect to estimates and forecasts obtained from public sources, represent reasonable estimates). No representation or warranty, express or implied, is made as to the accuracy or completeness of such information and nothing contained herein is, or shall be relied upon as, a representation, whether as to the past, the present or the future. These materials were designed for use by specific persons familiar with the business and affairs of the Company. These materials are not intended to provide the sole basis for evaluating, and should not be considered a recommendation with respect to, any transaction or other matter. These materials have been developed by and are proprietary to Evercore and were prepared exclusively for the benefit and internal use of the Special Committee of the Board of Directors of the Company. These materials were compiled on a confidential basis for use by the Special Committee of the Board of Directors of the Company in evaluating the potential transaction described herein and not with a view to public disclosure or filing thereof under state or federal securities laws, and may not be reproduced, disseminated, quoted or referred to, in whole or in part, without the prior written consent of Evercore. These materials do not constitute an offer or solicitation to sell or purchase any securities and are not a commitment by Evercore (or any affiliate) to provide or arrange any financing for any transaction or to purchase any security in connection therewith. Evercore assumes no obligation to update or otherwise revise these materials. These materials may not reflect information known to other professionals in other business areas of Evercore and its affiliates. Evercore and its affiliates do not provide legal, accounting or tax advice. Accordingly, any statements contained herein as to tax matters were neither written nor intended by Evercore or its affiliates to be used and cannot be used by any taxpayer for the purpose of avoiding tax penalties that may be imposed on such taxpayer. Each person should seek legal, accounting and tax advice based on his, her or its particular circumstances from independent advisors regarding the impact of the transactions or matters described herein. 15Preliminary Draft (8/16/2021 1:00 PM) - Confidential These materials have been prepared by Evercore Group L.L.C. (“Evercore”) for the Special Committee of the Board of Directors of Ocala (the “Company”) to whom such materials are directly addressed and delivered and may not be used or relied upon for any purpose other than as specifically contemplated by a written agreement with Evercore. These materials are based on information provided by or on behalf of the Company and/or other potential transaction participants, from public sources or otherwise reviewed by Evercore. Evercore assumes no responsibility for independent investigation or verification of such information and has relied on such information being complete and accurate in all material respects. To the extent such information includes estimates and forecasts of future financial performance prepared by or reviewed with the management of the Company and/or other potential transaction participants or obtained from public sources, Evercore has assumed that such estimates and forecasts have been reasonably prepared on bases reflecting the best currently available estimates and judgments of such management (or, with respect to estimates and forecasts obtained from public sources, represent reasonable estimates). No representation or warranty, express or implied, is made as to the accuracy or completeness of such information and nothing contained herein is, or shall be relied upon as, a representation, whether as to the past, the present or the future. These materials were designed for use by specific persons familiar with the business and affairs of the Company. These materials are not intended to provide the sole basis for evaluating, and should not be considered a recommendation with respect to, any transaction or other matter. These materials have been developed by and are proprietary to Evercore and were prepared exclusively for the benefit and internal use of the Special Committee of the Board of Directors of the Company. These materials were compiled on a confidential basis for use by the Special Committee of the Board of Directors of the Company in evaluating the potential transaction described herein and not with a view to public disclosure or filing thereof under state or federal securities laws, and may not be reproduced, disseminated, quoted or referred to, in whole or in part, without the prior written consent of Evercore. These materials do not constitute an offer or solicitation to sell or purchase any securities and are not a commitment by Evercore (or any affiliate) to provide or arrange any financing for any transaction or to purchase any security in connection therewith. Evercore assumes no obligation to update or otherwise revise these materials. These materials may not reflect information known to other professionals in other business areas of Evercore and its affiliates. Evercore and its affiliates do not provide legal, accounting or tax advice. Accordingly, any statements contained herein as to tax matters were neither written nor intended by Evercore or its affiliates to be used and cannot be used by any taxpayer for the purpose of avoiding tax penalties that may be imposed on such taxpayer. Each person should seek legal, accounting and tax advice based on his, her or its particular circumstances from independent advisors regarding the impact of the transactions or matters described herein. 15