UNITED STATES
SECURITIES AND EXCHANGE COMMISSION
Washington, D.C. 20549
FORM N-CSR
CERTIFIED SHAREHOLDER REPORT OF REGISTERED
MANAGEMENT INVESTMENT COMPANIES
Investment Company Act File Number 811-23015
SEI Catholic Values Trust
(Exact name of registrant as specified in charter)
SEI Investments
One Freedom Valley Drive
Oaks, Pennsylvania 19456
(Address of principal executive offices) (Zip code)
c/o CT Corporation
155 Federal Street
Boston, MA 02110
(Name and address of agent for service)
Registrant’s telephone number, including area code: 1-800-342-5734
Date of fiscal year end: February 29, 2016
Date of reporting period: February 29, 2016
Item 1. Reports to Stockholders.

February 29, 2016
ANNUAL REPORT
SEI Catholic Values Trust
➤ Catholic Values Equity Fund
➤ Catholic Values Fixed Income Fund

| 1 | ||||
| 4 | ||||
| 8 | ||||
| 23 | ||||
| 24 | ||||
| 25 | ||||
| 26 | ||||
| 27 | ||||
| 37 | ||||
| 38 | ||||
| 41 | ||||
| 42 | ||||
| 43 | ||||
The Trust files its complete schedule of portfolio holdings with the Securities and Exchange Commission for the first and third quarter of each fiscal year on Form N-Q within sixty days after the end of the period. The Trust’s Forms N-Q are available on the Commission’s website at http://www.sec.gov, and may be reviewed and copied at the Commission’s Public Reference Room in Washington, DC. Information on the operation of the Public Reference Room may be obtained by calling 1-800-SEC-0330.
A description of the policies and procedures that the Trust uses to determine how to vote proxies relating to portfolio securities, as well as information relating to how a Fund voted proxies relating to portfolio securities during the most recent 12-month period ended June 30, is available (i) without charge, upon request, by calling 1-800-DIAL-SEI; and (ii) on the Commission’s website at http://www.sec.gov.
SEI CATHOLIC VALUES TRUST — FEBRUARY 29, 2016
To our Shareholders:
The Funds’ inaugural fiscal time period — from the start of the Funds commencement in April 2015 through the end of February 2016 — was notable for several key themes: energy-sector volatility spreading amid continued oil-price weakness, and central-bank policies diverging in the face of disinflationary pressures. The Federal Reserve (“Fed”) commenced rate increases, while the European Central Bank (“ECB”), Bank of Japan and People’s Bank of China deepened their commitments to accommodation — ultimately reinforcing the strong-U.S. dollar/weak-commodity-prices dynamic.
Geopolitical Events
Severe unrest continued in certain areas of the Middle East, driven by the opposing and overlapping interests of Islamic State, the Syrian regime, Syrian nationalists, Kurdish forces and the Iraqi military. Regional superpowers Iran, Saudi Arabia and Turkey also applied varying degrees of indirect influence. Broader involvement escalated, with Russia’s airpower commitment in early fall and a redoubled coalition of Western powers targeting Islamic State after a series of attacks by religious extremists across the globe. A U.S.-Russia-brokered ceasefire between the Syrian regime and nationalist rebels (excluding Islamic State and other terrorist groups) came into effect during the final days of the period. While the conflict that originated in Syria and Iraq appears to have influenced destabilizing events elsewhere in the Middle East and Northern Africa, and taken a terrible human toll, it has not had a significant impact on global markets or the economy. In fact, the price of oil continued to drop despite considerable regional instability.
Oil-price weakness remained primarily attributable to oversupply: the Organization of Petroleum Exporting Countries’ early December meeting yielded no production cuts; U.S. Congress approved the restoration of oil exports in mid-December; and Iran’s multi-lateral agreement on the scope of its nuclear program paved the way for its post-sanction return as a major low-cost oil supplier.
Economic Performance
In the U.S., economic growth during the second quarter of 2015 bordered on impressive, due in large part to strong consumer activity; both retail sales and consumer-spending measures registered significant spikes in May. The pace of growth essentially halved during the third quarter on modest inventory restocking amid slow sales and lackluster export activity. Fourth-quarter growth decelerated further, as industrial production and manufacturing came under pressure from the effects of U.S. dollar strength. The labor market consistently improved, with the unemployment rate declining to 4.9% in January; while the percentage of Americans participating in the labor force bottomed at a 38-year low in September, it rose slowly to finish the period above where it began. The Fed raised the federal funds rate in mid-December for the first time since 2006, leaving behind a near-zero interest rate that had been in place since late 2008.
Market Developments
Financial markets began the Funds’ recently completed fiscal period on generally positive footing, as U.S. dollar strength continued on the expectation of tighter Fed policy — which weighed on a long list of other currencies around the globe. Risk assets came under pressure in late spring, as China’s mainland stock exchanges gave back a significant portion of recent gains, with more-severe declines and a sharp volatility spike in late summer after China moderately devalued its currency. China’s decision to devalue the renminbi in late August was arguably the most significant market surprise of the period; choppy and opaque implementation, coupled with limited commitment to a market-determined exchange rate, has not engendered a great deal of confidence in China’s effectiveness in managing market pressures. As 2015 came to a close, the questionable health of U.S. energy companies, given a persistent multi-year oil-price decline, raised concerns among high-yield bond investors — resulting in a sharp selloff that likely discouraged equity investors and kept a lid on performance at year end. The year of 2016 began with a global flight to quality, benefitting safe-haven assets at the expense of risk assets. A trend reversal took place in mid-February, and
| SEI Catholic Values Trust / Annual Report / February 29, 2016 | 1 |
SEI CATHOLIC VALUES TRUST — FEBRUARY 29, 2016
Letter to Shareholders (Concluded)
risk assets rotated back into favor through the end of the period. Fourth-quarter 2015 earnings for domestically oriented companies outside of energy and commodities were strong, providing rationale for a cautiously optimistic outlook. The U.S. dollar ended the period 8.6% higher against a trade-weighted basket of currencies.
For the period ended February 29, 2016, the MSCI All-Country World Index, a proxy for global equities, fell 13.45% in U.S. dollar terms (though performance was generally better in local currencies), while the S&P 500 Index fell 5.59%, including dividends. Emerging-market equity returns were deeply negative in U.S. dollar terms, with the MSCI Emerging Markets Index falling 27.86%.
U.S. large caps (represented by the Russell 1000 Index) continued to outpace small caps, (represented by the Russell 2000 Index), delivering (6.7%) and (14.24%), respectively. Defensive and less-cyclically sensitive equity sectors (which typically exhibit lower volatility in challenging market environments compared to cyclically-sensitive sectors) fared relatively well. Consumer staples, utilities and telecommunications led (with positive returns in the U.S. and comparably small declines globally), while energy and materials lagged considerably.
Global fixed income, as measured by the Barclays Global Aggregate Bond Index, advanced 0.74% in U.S. dollar terms during the period. U.S. Treasurys delivered positive returns, despite headwinds from rising interest-rate expectations ahead of the Fed’s December move. Short-term Treasury rates increased over the full period, while intermediate-and long-term rates declined, resulting in a flatter yield curve.
U.S. investment-grade corporate debt produced negative returns for the period: the Barclays Investment Grade U.S. Corporate Index fell 1.11%. Meanwhile, the high-yield market swooned — particularly from November through January amid intensifying concerns about distressed energy debt — with the BofA Merrill Lynch U.S. High Yield Constrained Index plummeting 9.11% in the period.
Mortgage-backed securities (“MBS”) delivered positive returns: the Barclays U.S. Mortgage Backed Securities Index advanced 2.09%. MBS spreads were stable compared to the volatility of equity and fixed-income markets, thanks to a continued housing recovery.
Emerging-market debt delivered the most deeply negative performance among fixed-income market segments; but the decline was mostly limited to local-currency bonds, largely a casualty of U.S. dollar strength. The J.P. Morgan GBI Emerging Markets Global Diversified Index, which tracks local-currency-denominated emerging-market bonds, fell 12.37%; the J.P. Morgan EMBI Global Diversified Index, which tracks foreign-currency-denominated debt, declined 0.73%.
The persistent combination of subdued inflation and U.S. dollar strength continued to challenge inflation-sensitive assets such as Treasury inflation-protected securities and commodities. The latter were hit especially hard, with the price per barrel of West Texas Intermediate crude oil declining by more than 40% during the period.
Our View
We continue to expect equities to outperform fixed income over the coming months. Although opportunities appeared to be more promising in developed international equities outside the U.S. at the end of the period, recent market dynamics have brought U.S. equity valuations more closely in line with other developed markets; Japan, however, continues to sell at attractive valuations. While the eurozone economy should continue to be supported by ECB policy, new risks have materialized: an immigration crisis, the possibility that Britain may leave the European Union as well as concerns about the European banking system and the health of some peripheral eurozone countries.
We believe there is good reason to expect equities to show resilience once they adjust to the start of the Fed tightening cycle. Fed policy will likely remain benign relative to past tightening cycles, and the yield curve is far from inversion. The U.S. economy is certainly not at risk of overheating; there is no precedent for rate hikes to come in quick succession. As such, we continue to prefer a strategy of “buying on the dip” selectively.
| 2 | SEI Catholic Values Trust / Annual Report / February 29, 2016 |
Within fixed-income markets, commodity-related weakness and the likelihood of additional rate increases by the Fed have the potential to remain sources of both caution and opportunity. We expect these conditions to favor active management.
Sincerely,

William Lawrence, CFA
Managing Director, Portfolio Management Team
| SEI Catholic Values Trust / Annual Report / February 29, 2016 | 3 |
MANAGEMENT’S DISCUSSION AND ANALYSIS OF FUND PERFORMANCE
SEI CATHOLIC VALUES TRUST — FEBRUARY 29, 2016 (Unaudited)
Catholic Values Equity Fund
I. Objective
The Catholic Values Equity Fund (the “Fund”) seeks long-term capital appreciation.
II. Investment Approach
The Fund uses a multi-manager approach, relying on a number of sub-advisers with differing investment approaches to manage portions of the Fund’s portfolio, under the general supervision of SEI Investments Management Corporation (SIMC). The Fund utilized the following sub-advisers as of February 29, 2016: BlackRock Investment Management, LLC; Brandywine Global Investment Management, LLC; EAM Investors, LLC; EARNEST Partners LLC; Parametric Portfolio Associates LLC; Snow Capital Management, L.P.; and Waddell & Reed Investment Management Company There were no manager changes during the period.
III. Returns
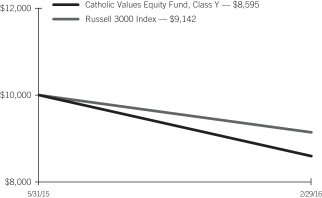
For the period from April 30, 2015 (the Fund’s inception date) through February 29, 2016, the Catholic Values Equity Fund, Class A returned -13.66%. The Fund’s primary benchmark — the Russell 3000 Index (USD) — returned -7.32%.
IV. Performance Discussion
Absolute performance faced significant challenges as equity markets slumped in summer 2015, and particularly in late August, as concerns about emerging markets and oil prices came to the forefront for investors. As noted in the enclosed shareholder letter, losses were more pronounced within energy and cyclical sectors, smaller-cap stocks and outside of the U.S. The Fund recovered most of its losses by early November, as data illustrated an improving domestic economy. This gave way to the Federal Open Market Committee’s modest rate hike in December, which, as the shareholder letter addressed, introduced a backdrop of monetary policy differences between the U.S. and other major developed nations that remained on an easing track. This dissonance led to strong U.S. dollar appreciation versus other currencies, which further exacerbated weakness among non-U.S. investments from a U.S. investor perspective. Concerns had resurfaced by the end of November, evidenced by the widening of spreads in high-yield energy-sector
names and emerging markets. The Fund slid along with equity markets through December and January as investors exercised the preference for safety assets. By early February, momentum shifted back in favor of a broad equity-market advance, which remained intact through the end of the period.
The Fund’s relative performance struggled during the period largely as a result of manager exposures to the trends listed above. Our non-U.S. manager, EARNEST Partners LLC, lagged due to its focus on China and emerging markets, which prompted the Fund’s underweight to the manager versus its strategic target for much of the period. Brandywine Global Investment Management and Snow Capital Management, L.P., domestic deep-value managers within large cap and small cap, respectively, were also challenged during the period. The Fund’s allocations to them led to losses resulting from the dislocation within energy and industrial names. Both managers added to distressed positions and upgraded their portfolio holdings — consistent with their expected management style during a challenging environment — and the Fund modestly added to its allocations late in the period to position for an expected rebound in valuations and on the belief that the market selloff was overdone.
Catholic Values Equity Fund:
AVERAGE ANNUAL TOTAL RETURN1
| Cumulative Inception to Date | ||||
| Class A | (13.66)% | |||
| Class Y | (14.05)% | |||
| Russell 3000 Index | (7.32)% | |||
| 4 | SEI Catholic Values Trust / Annual Report / February 29, 2016 |
Comparison of Change in the Value of a $10,000 Investment in the Catholic Values Equity Fund, Class A, versus the Russell 3000 Index

| 1 | For the period ended 2/29/2016. Past performance is no indication of future performance. Class A shares were offered beginning on 4/30/2015 and Class Y share were offered beginning 5/31/2015. The graph is based on only the Class A; performance for Class Y would be different due to differences in fee structures. Returns shown do not reflect the deduction of taxes that a shareholder would pay on Fund distributions or the redemption of Fund shares. The returns for certain periods reflect fee waivers and/or reimbursements in effect for that period; absent fee waivers and reimbursements, performance would have been lower. |
Comparison of Change in the Value of a $10,000 Investment in the Catholic Values Equity Fund, Class Y, versus the Russell 3000 Index
| 1 | For the period ended 2/29/2016. Past performance is no indication of future performance. Class Y shares were offered beginning on 5/31/2015 and Class A share were offered beginning 4/30/2015. The graph is based on only the Class Y; performance for Class A would be different due to differences in fee structures. Returns shown do not reflect the deduction of taxes that a shareholder would pay on Fund distributions or the redemption of Fund shares. The returns for certain periods reflect fee waivers and/or reimbursements in effect for that period; absent fee waivers and reimbursements, performance would have been lower. |
| SEI Catholic Values Trust / Annual Report / February 29, 2016 | 5 |
MANAGEMENT’S DISCUSSION AND ANALYSIS OF FUND PERFORMANCE
SEI CATHOLIC VALUES TRUST — FEBRUARY 29, 2016
Catholic Values Fixed Income Fund
I. Objective
The Catholic Values Fixed Income Fund (the “Fund”) seeks a high level of current income with preservation of capital.
II. Investment Approach
The Fund uses a multi-manager approach, relying on a number of sub-advisers with differing investment approaches to manage portions of the Fund’s portfolio, under the general supervision of SEI Investments Management Corporation (SIMC). The Fund utilized the following sub-advisers as of February 29, 2016: Income Research & Management; Western Asset Management Company; and Western Asset Management Company Limited. There were no manager changes during the period.
III. Returns
For the period from April 30, 2015 (the Fund’s inception date) through February 29, 2016, the Catholic Values Fixed Income Fund, Class A returned 0.54%. The Fund’s benchmark — the Barclays U.S. Aggregate Bond Index (USD) — returned 1.40%.
IV. Performance Discussion
Absolute performance over the period was driven by a number of sectors. U.S. Treasurys were one of the most significant contributors; as the enclosed shareholder letter notes, the yield curve flattened, with longer-maturity bonds outperforming shorter-maturity bonds. Credit spreads widened in the investment-grade sector, but the contribution to absolute return was positive outside of industrials, where energy and basics experienced negative returns. A meaningful exposure to mortgage-backed securities (MBS), specifically agency MBS, contributed significantly to performance. As addressed in the shareholder letter, the housing market continued to improve during the period.
The Fund’s underweight to U.S. Treasurys detracted from relative performance, as corporate credit underperformed Treasurys amid credit spread widening during the period. An underweight to MBS, coupled with issue selection within the sector, detracted from relative performance. Favorable active yield-curve and duration positioning contributed to relative performance. A yield-curve-flattening position benefitted as longer-dated bonds outperformed shorter-dated bonds.
For Western Asset Management, duration and yield-curve positioning were the most significant contributors to relative performance, while small positions in emerging-market debt and non-investment-grade corporate bonds detracted. For Income Research & Management, an overweight to corporate credit and an underweight to agency MBS detracted from relative performance.
The Fund used U.S. Treasury futures, Eurodollar Futures and to-be-announced (TBA) forward contracts to effectively manage duration, yield-curve and market exposures. (TBA contracts confer the obligation to buy or sell future debt obligations of the three U.S. government-sponsored agencies that issue or guarantee MBS — Fannie Mae, Freddie Mac and Ginnie Mae.) None of these had a meaningful impact on performance.
Catholic Values Fixed Income Fund:
AVERAGE ANNUAL TOTAL RETURN1
| Cumulative Inception to Date | ||||
| Class A | 0.54% | |||
| Class Y | 1.00% | |||
| Barclays U.S. Aggregate Bond Index | 1.40% | |||
Comparison of Change in the Value of a $10,000 Investment in the Fixed Income Fund, Class A, versus the Barclays U.S. Aggregate Bond Index
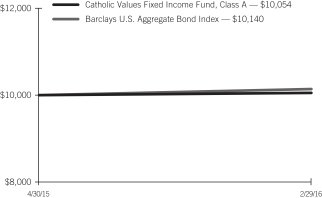
| 1 | For the period ended 2/29/2016. Past performance is no indication of future performance. Class A shares were offered beginning on 4/30/2015 and Class Y share were offered beginning 5/31/2015. The graph is based on only the Class A; performance for Class Y would be different due to differences in fee structures. Returns shown do not reflect the deduction of taxes that a shareholder would pay on Fund distributions or the redemption of Fund shares. The returns for certain periods reflect fee waivers and/or reimbursements in effect for that period; absent fee waivers and reimbursements, performance would have been lower. |
| 6 | SEI Catholic Values Trust / Annual Report / February 29, 2016 |
Comparison of Change in the Value of a $10,000 Investment in the Fixed Income Fund, Class Y, versus the Barclays U.S. Aggregate Bond Index
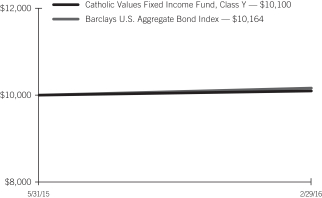
| 1 | For the period ended 2/29/2016. Past performance is no indication of future performance. Class Y shares were offered beginning on 5/31/2015 and Class A share were offered beginning 4/30/2015. The graph is based on only the Class Y; performance for Class A would be different due to differences in fee structures. Returns shown do not reflect the deduction of taxes that a shareholder would pay on Fund distributions or the redemption of Fund shares. The returns for certain periods reflect fee waivers and/or reimbursements in effect for that period; absent fee waivers and reimbursements, performance would have been lower. |
| SEI Catholic Values Trust / Annual Report / February 29, 2016 | 7 |
Catholic Values Equity Fund
February 29, 2016
| Description | Shares | Market Value ($ Thousands) | ||||||
COMMON STOCK — 74.2% |
| |||||||
Consumer Discretionary — 11.8% |
| |||||||
Abercrombie & Fitch, Cl A | 10,348 | $ | 301 | |||||
Amazon.com* | 3,200 | 1,768 | ||||||
Best Buy | 2,579 | 84 | ||||||
Big Lots | 4,527 | 183 | ||||||
Callaway Golf | 9,292 | 83 | ||||||
Carnival | 19,835 | 951 | ||||||
Chipotle Mexican Grill, Cl A* | 1,892 | 963 | ||||||
Comcast, Cl A | 16,026 | 925 | ||||||
Cracker Barrel Old Country Store | 315 | 47 | ||||||
Dave & Buster’s Entertainment* | 2,391 | 88 | ||||||
Dillard’s, Cl A | 2,455 | 205 | ||||||
Dollar General | 2,489 | 185 | ||||||
Domino’s Pizza | 2,418 | 322 | ||||||
Ford Motor | 24,722 | 309 | ||||||
Gap | 2,620 | 72 | ||||||
General Motors | 31,810 | 937 | ||||||
Genesco* | 2,431 | 160 | ||||||
Goodyear Tire & Rubber | 13,884 | 418 | ||||||
Hasbro | 2,175 | 165 | ||||||
Hilton Worldwide Holdings | 4,300 | 89 | ||||||
Home Depot | 12,243 | 1,520 | ||||||
John Wiley & Sons, Cl A | 1,814 | 79 | ||||||
Johnson Controls | 5,015 | 183 | ||||||
Kohl’s | 9,233 | 431 | ||||||
L Brands | 1,996 | 169 | ||||||
Liberty Global, Cl A* | 18,706 | 689 | ||||||
Lowe’s | 1,465 | 99 | ||||||
Macy’s | 12,827 | 554 | ||||||
Magna International | 20,727 | 805 | ||||||
McDonald’s | 1,030 | 121 | ||||||
Netflix* | 7,531 | 703 | ||||||
NIKE, Cl B | 20,308 | 1,251 | ||||||
Nordstrom | 1,997 | 103 | ||||||
Office Depot* | 13,586 | 69 | ||||||
PVH | 956 | 76 | ||||||
Ralph Lauren, Cl A | 1,477 | 134 | ||||||
Royal Caribbean Cruises | 1,916 | 143 | ||||||
Staples | 11,068 | 105 | ||||||
Starbucks | 9,814 | 571 | ||||||
| Description | Shares | Market Value ($ Thousands) | ||||||
Starwood Hotels & Resorts Worldwide | 914 | $ | 63 | |||||
Target | 2,839 | 223 | ||||||
Time Warner | 890 | 59 | ||||||
TJX | 1,445 | 107 | ||||||
TripAdvisor* | 3,562 | 223 | ||||||
Tupperware Brands | 3,740 | 187 | ||||||
VF | 3,024 | 197 | ||||||
Visteon | 1,449 | 101 | ||||||
VOXX International, Cl A* | 28,319 | 113 | ||||||
Walt Disney | 4,056 | 387 | ||||||
Wayfair, Cl A* | 2,227 | 87 | ||||||
Williams-Sonoma | 1,501 | 78 | ||||||
|
| |||||||
| 17,885 | ||||||||
|
| |||||||
Consumer Staples — 5.8% |
| |||||||
Altria Group | 1,949 | 120 | ||||||
Andersons | 8,408 | 226 | ||||||
Campbell Soup | 6,043 | 373 | ||||||
Clorox | 2,458 | 311 | ||||||
Coca-Cola | 8,967 | 387 | ||||||
Coca-Cola Enterprises | 3,388 | 164 | ||||||
Colgate-Palmolive | 1,477 | 97 | ||||||
Constellation Brands, Cl A | 4,666 | 660 | ||||||
Costco Wholesale | 6,339 | 951 | ||||||
CVS Health | 3,797 | 369 | ||||||
General Mills | 5,126 | 302 | ||||||
Hershey | 1,640 | 149 | ||||||
Kellogg | 3,207 | 237 | ||||||
Kimberly-Clark | 3,063 | 399 | ||||||
Kraft Heinz | 9,715 | 748 | ||||||
Kroger | 1,278 | 51 | ||||||
Molson Coors Brewing, Cl B | 4,960 | 423 | ||||||
Mondelez International, Cl A | 4,786 | 194 | ||||||
Omega Protein* | 8,571 | 204 | ||||||
PepsiCo | 6,149 | 601 | ||||||
Philip Morris International | 13,587 | 1,237 | ||||||
Procter & Gamble | 5,857 | 470 | ||||||
Sysco | 2,183 | 96 | ||||||
|
| |||||||
| 8,769 | ||||||||
|
| |||||||
Energy — 4.1% |
| |||||||
Apache | 10,394 | 398 | ||||||
Baker Hughes | 2,580 | 111 | ||||||
Cabot Oil & Gas | 17,962 | 361 | ||||||
California Resources | 1,054 | 1 | ||||||
CARBO Ceramics | 17,963 | 359 | ||||||
Chevron | 1,314 | 110 | ||||||
Cimarex Energy | 7,426 | 624 | ||||||
Concho Resources* | 1,485 | 134 | ||||||
ConocoPhillips | 4,113 | 139 | ||||||
Devon Energy | 24,776 | 488 | ||||||
EOG Resources | 7,081 | 458 | ||||||
Equities | 772 | 43 | ||||||
Exxon Mobil | 8,408 | 674 | ||||||
| 8 | SEI Catholic Values Trust / Annual Report / February 29, 2016 |
| Description | Shares | Market Value ($ Thousands) | ||||||
Halliburton | 9,022 | $ | 291 | |||||
Hess | 3,807 | 166 | ||||||
Newfield Exploration* | 3,310 | 90 | ||||||
Occidental Petroleum | 11,209 | 771 | ||||||
PBF Energy, Cl A | 12,780 | 386 | ||||||
Schlumberger | 2,097 | 150 | ||||||
Southwestern Energy* | 9,303 | 54 | ||||||
Spectra Energy | 6,476 | 189 | ||||||
Tidewater | 41,149 | 237 | ||||||
|
| |||||||
| 6,234 | ||||||||
|
| |||||||
Financials — 12.8% | ||||||||
Allied World Assurance Holdings | 1,601 | 52 | ||||||
Allstate | 5,134 | 326 | ||||||
American Equity Investment Life Holding | 8,447 | 115 | ||||||
American Express | 800 | 44 | ||||||
American Homes 4 Rent, Cl A‡ | 4,082 | 57 | ||||||
American International Group | 8,266 | 415 | ||||||
American Tower‡ | 9,838 | 907 | ||||||
Arthur J Gallagher | 2,146 | 85 | ||||||
Bancorp* | 38,209 | 182 | ||||||
Bank of America | 127,286 | 1,594 | ||||||
Bank of New York Mellon | 5,555 | 197 | ||||||
Berkshire Hathaway, Cl B* | 11,626 | 1,560 | ||||||
BlackRock, Cl A | 260 | 81 | ||||||
Blackstone Group LP (A) | 22,878 | 594 | ||||||
CBRE Group, Cl A* | 3,632 | 92 | ||||||
Chimera Investment‡ | 9,801 | 128 | ||||||
Chubb | 2,151 | 248 | ||||||
Citigroup | 52,602 | 2,044 | ||||||
Corporate Office Properties Trust‡ | 3,415 | 80 | ||||||
Crown Castle International‡ | 5,613 | 485 | ||||||
Everest Re Group | 3,089 | 575 | ||||||
FBR | 7,201 | 126 | ||||||
FCB Financial Holdings, Cl A* | 3,370 | 101 | ||||||
First Commonwealth Financial | 19,970 | 172 | ||||||
First Niagara Financial Group | 4,628 | 43 | ||||||
Goldman Sachs Group | 3,101 | 464 | ||||||
Green Dot, Cl A* | 32,877 | 679 | ||||||
Hartford Financial Services Group | 1,072 | 45 | ||||||
HCP‡ | 5,614 | 166 | ||||||
Highwoods Properties‡ | 2,412 | 105 | ||||||
HomeStreet* | 8,683 | 173 | ||||||
Jones Lang LaSalle | 1,215 | 124 | ||||||
JPMorgan Chase | 34,939 | 1,967 | ||||||
KKR LP (A) | 56,996 | 732 | ||||||
Legg Mason | 1,747 | 50 | ||||||
Manning & Napier, Cl A | 14,085 | 97 | ||||||
McGraw Hill Financial | 3,332 | 299 | ||||||
MetLife | 18,458 | 730 | ||||||
Morgan Stanley | 5,622 | 139 | ||||||
Morningstar | 1,265 | 100 | ||||||
Northern Trust | 9,913 | 589 | ||||||
| Description | Shares | Market Value ($ Thousands) | ||||||
ProAssurance | 3,709 | $ | 183 | |||||
Prologis‡ | 9,307 | 358 | ||||||
Santander Consumer USA Holdings* | 33,236 | 341 | ||||||
Spirit Realty Capital‡ | 3,947 | 42 | ||||||
State Street | 5,663 | 310 | ||||||
Synchrony Financial* | 4,252 | 115 | ||||||
T Rowe Price Group | 2,429 | 168 | ||||||
US Bancorp | 4,708 | 181 | ||||||
Wells Fargo | 13,758 | 645 | ||||||
Welltower‡ | 775 | 49 | ||||||
Weyerhaeuser‡ | 13,418 | 349 | ||||||
|
| |||||||
| 19,503 | ||||||||
|
| |||||||
Health Care — 10.2% | ||||||||
Abbott Laboratories | 4,644 | 180 | ||||||
ABIOMED* | 1,095 | 88 | ||||||
Akorn* | 6,740 | 179 | ||||||
Alexion Pharmaceuticals* | 2,899 | 408 | ||||||
Amgen | 2,040 | 290 | ||||||
Anacor Pharmaceuticals* | 853 | 54 | ||||||
Analogic | 5,743 | 431 | ||||||
Anthem | 2,173 | 284 | ||||||
Baxalta | 2,288 | 88 | ||||||
Biogen* | 2,683 | 696 | ||||||
BioMarin Pharmaceutical* | 713 | 58 | ||||||
BioSpecifics Technologies* | 1,868 | 66 | ||||||
Boston Scientific* | 5,660 | 96 | ||||||
Bruker | 8,311 | 216 | ||||||
Cambrex* | 7,064 | 272 | ||||||
Celgene* | 10,102 | 1,019 | ||||||
Charles River Laboratories International* | 3,356 | 246 | ||||||
Cigna | 1,258 | 176 | ||||||
Collegium Pharmaceutical* | 4,202 | 73 | ||||||
Cytokinetics* | 7,723 | 49 | ||||||
Dynavax Technologies* | 3,336 | 54 | ||||||
Express Scripts Holding* | 626 | 44 | ||||||
FibroGen* | 3,132 | 54 | ||||||
Gilead Sciences | 3,311 | 289 | ||||||
Horizon Pharma* | 19,452 | 334 | ||||||
Humana | 1,115 | 197 | ||||||
Integra LifeSciences Holdings* | 8,882 | 545 | ||||||
Intuitive Surgical* | 152 | 86 | ||||||
Kindred Healthcare | 19,833 | 208 | ||||||
Kite Pharma* | 1,227 | 55 | ||||||
Lannett* | 5,557 | 140 | ||||||
Lipocine* | 12,074 | 122 | ||||||
McKesson | 663 | 103 | ||||||
Medtronic | 17,704 | 1,370 | ||||||
Mettler-Toledo International* | 2,175 | 685 | ||||||
Molina Healthcare* | 1,432 | 89 | ||||||
NeoGenomics* | 25,277 | 161 | ||||||
Neurocrine Biosciences* | 2,220 | 82 | ||||||
Nevro* | 1,655 | 95 | ||||||
| SEI Catholic Values Trust / Annual Report / February 29, 2016 | 9 |
SCHEDULE OF INVESTMENTS
Catholic Values Equity Fund (Continued)
February 29, 2016
| Description | Shares | Market Value ($ Thousands) | ||||||
NxStage Medical* | 5,715 | $ | 85 | |||||
Ophthotech* | 1,685 | 76 | ||||||
OPKO Health* | 4,521 | 42 | ||||||
Otonomy* | 2,928 | 37 | ||||||
Pacira Pharmaceuticals* | 2,999 | 156 | ||||||
Portola Pharmaceuticals* | 2,681 | 75 | ||||||
Premier, Cl A* | 2,544 | 83 | ||||||
PTC Therapeutics* | 2,962 | 24 | ||||||
Quintiles Transnational Holdings* | 4,164 | 261 | ||||||
Regeneron Pharmaceuticals* | 327 | 126 | ||||||
ResMed | 1,742 | 99 | ||||||
Sirona Dental Systems* | 1,398 | 154 | ||||||
TESARO* | 1,602 | 65 | ||||||
TherapeuticsMD* | 22,954 | 140 | ||||||
United Therapeutics* | 3,544 | 432 | ||||||
UnitedHealth Group | 10,225 | 1,218 | ||||||
Varian Medical Systems* | 4,509 | 353 | ||||||
Vertex Pharmaceuticals* | 5,367 | 459 | ||||||
VWR* | 29,092 | 710 | ||||||
Waters* | 3,224 | 388 | ||||||
Zimmer Biomet Holdings | 929 | 90 | ||||||
Zoetis, Cl A | 18,515 | 760 | ||||||
|
| |||||||
| 15,515 | ||||||||
|
| |||||||
Industrials — 7.5% | ||||||||
3M | 4,377 | 687 | ||||||
Acacia Research | 67,646 | 214 | ||||||
ACCO Brands* | 50,936 | 372 | ||||||
Actuant, Cl A | 3,147 | 74 | ||||||
AGCO | 1,432 | 71 | ||||||
American Airlines Group | 18,274 | 749 | ||||||
Atlas Air Worldwide Holdings* | 8,409 | 304 | ||||||
Caterpillar | 7,837 | 531 | ||||||
Chicago Bridge & Iron | 5,939 | 199 | ||||||
Covanta Holding | 8,121 | 113 | ||||||
Crane | 2,776 | 136 | ||||||
CSX | 2,560 | 62 | ||||||
Cummins | 1,250 | 122 | ||||||
Deere | 2,505 | 201 | ||||||
Delta Air Lines | 26,179 | 1,263 | ||||||
Dover | 1,366 | 83 | ||||||
DXP Enterprises* | 2,768 | 38 | ||||||
Eaton | 8,416 | 477 | ||||||
Emerson Electric | 973 | 47 | ||||||
Illinois Tool Works | 1,299 | 122 | ||||||
Ingersoll-Rand | 4,588 | 255 | ||||||
Kansas City Southern | 3,370 | 275 | ||||||
LB Foster, Cl A | 18,738 | 257 | ||||||
ManpowerGroup | 3,623 | 281 | ||||||
Matson | 2,266 | 91 | ||||||
Nordson | 1,333 | 96 | ||||||
Owens Corning | 3,846 | 165 | ||||||
Parker-Hannifin | 926 | 94 | ||||||
Pitney Bowes | 2,185 | 40 | ||||||
| Description | Shares | Market Value ($ Thousands) | ||||||
Rockwell Automation | 1,196 | $ | 124 | |||||
Rockwell Collins | 8,450 | 740 | ||||||
Southwest Airlines | 2,354 | 99 | ||||||
Stanley Black & Decker | 2,756 | 259 | ||||||
Terex | 12,088 | 271 | ||||||
Titan Machinery* | 12,758 | 121 | ||||||
TransDigm Group* | 414 | 88 | ||||||
Triumph Group | 14,083 | 429 | ||||||
Union Pacific | 2,036 | 161 | ||||||
United Parcel Service, Cl B | 3,789 | 366 | ||||||
Waste Management | 1,918 | 107 | ||||||
Wesco Aircraft Holdings* | 41,595 | 532 | ||||||
WESCO International* | 1,213 | 53 | ||||||
WW Grainger | 1,538 | 334 | ||||||
Xylem | 7,036 | 263 | ||||||
|
| |||||||
| 11,366 | ||||||||
|
| |||||||
Information Technology — 16.4% |
| |||||||
Activision Blizzard | 5,389 | 171 | ||||||
Adobe Systems* | 13,208 | 1,125 | ||||||
Alliance Data Systems* | 1,019 | 214 | ||||||
Alphabet, Cl A* | 4,279 | 3,069 | ||||||
Alphabet, Cl C* | 851 | 594 | ||||||
Analog Devices | 1,606 | 85 | ||||||
Apple | 22,371 | 2,163 | ||||||
Applied Materials | 60,774 | 1,147 | ||||||
Applied Optoelectronics* | 5,229 | 94 | ||||||
Autobytel* | 5,003 | 96 | ||||||
Autodesk* | 1,781 | 92 | ||||||
Black Box | 16,909 | 224 | ||||||
Broadcom | 611 | 82 | ||||||
CA | 8,337 | 244 | ||||||
Cisco Systems | 46,043 | 1,205 | ||||||
Cognizant Technology Solutions, Cl A* | 8,683 | 495 | ||||||
eBay* | 10,272 | 244 | ||||||
Facebook, Cl A* | 20,827 | 2,227 | ||||||
GoDaddy, Cl A* | 1,847 | 58 | ||||||
HP | 8,538 | 91 | ||||||
Intel | 20,433 | 605 | ||||||
International Business Machines | 4,148 | 543 | ||||||
Juniper Networks | 4,590 | 113 | ||||||
Keysight Technologies* | 6,271 | 164 | ||||||
Lam Research | 3,278 | 240 | ||||||
Lexmark International, Cl A | 4,860 | 151 | ||||||
LogMeIn* | 1,471 | 75 | ||||||
MasterCard, Cl A | 9,053 | 787 | ||||||
Micron Technology* | 59,830 | 636 | ||||||
Microsoft | 50,591 | 2,574 | ||||||
National Instruments | 2,999 | 86 | ||||||
NetApp | 2,221 | 55 | ||||||
NVIDIA | 3,110 | 97 | ||||||
Open Text | 5,563 | 277 | ||||||
Oracle | 13,817 | 508 | ||||||
| 10 | SEI Catholic Values Trust / Annual Report / February 29, 2016 |
| Description | Shares | Market Value ($ Thousands) | ||||||
OSI Systems* | 8,049 | $ | 486 | |||||
QUALCOMM | 6,141 | 312 | ||||||
salesforce.com inc* | 8,447 | 572 | ||||||
SanDisk | 1,186 | 86 | ||||||
Silicon Graphics International* | 52,644 | 320 | ||||||
Solera Holdings | 1,471 | 82 | ||||||
Symantec | 14,140 | 273 | ||||||
Texas Instruments | 4,776 | 253 | ||||||
Visa, Cl A | 25,061 | 1,814 | ||||||
Xerox | 9,532 | 92 | ||||||
|
| |||||||
| 24,921 | ||||||||
|
| |||||||
Materials — 3.5% | ||||||||
Air Products & Chemicals | 5,522 | 731 | ||||||
Alcoa | 5,402 | 48 | ||||||
American Vanguard | 3,392 | 43 | ||||||
Ball | 5,110 | 338 | ||||||
Cabot | 1,966 | 88 | ||||||
Dow Chemical | 9,837 | 478 | ||||||
Eastman Chemical | 6,590 | 423 | ||||||
Ecolab | 2,953 | 303 | ||||||
FMC | 3,280 | 123 | ||||||
Louisiana-Pacific* | 16,388 | 260 | ||||||
LSB Industries* | 13,094 | 76 | ||||||
Mosaic | 2,170 | 58 | ||||||
PPG Industries | 1,218 | 118 | ||||||
Praxair | 6,686 | 681 | ||||||
Reliance Steel & Aluminum | 5,696 | 347 | ||||||
Sherwin-Williams | 3,191 | 863 | ||||||
Sonoco Products | 6,077 | 266 | ||||||
United States Steel | 10,810 | 99 | ||||||
|
| |||||||
| 5,343 | ||||||||
|
| |||||||
Telecommunication Services — 1.2% |
| |||||||
8x8* | 7,401 | 86 | ||||||
AT&T | 14,216 | 525 | ||||||
Level 3 Communications* | 8,004 | 389 | ||||||
Sprint* | 30,075 | 103 | ||||||
Verizon Communications | 13,416 | 681 | ||||||
|
| |||||||
| 1,784 | ||||||||
|
| |||||||
Utilities — 0.9% | ||||||||
AES | 8,725 | 86 | ||||||
American Water Works | 4,543 | 295 | ||||||
CMS Energy | 8,598 | 340 | ||||||
Eversource Energy | 1,974 | 107 | ||||||
Exelon | 5,725 | 180 | ||||||
PG&E | 1,952 | 111 | ||||||
Pinnacle West Capital | 678 | 47 | ||||||
Sempra Energy | 667 | 64 | ||||||
Xcel Energy | 5,348 | 211 | ||||||
|
| |||||||
| 1,441 | ||||||||
|
| |||||||
Total Common Stock | 112,761 | |||||||
|
| |||||||
| Description | Shares | Market Value ($ Thousands) | ||||||
FOREIGN COMMON STOCK — 22.6% |
| |||||||
Australia — 0.3% | ||||||||
BHP Billiton ADR | 17,372 | $ | 393 | |||||
|
| |||||||
Austria — 1.0% | ||||||||
Conwert Immobilien Invest | 21,010 | 293 | ||||||
Erste Group Bank | 21,318 | 549 | ||||||
Schoeller-Bleckmann Oilfield Equipment | 4,428 | 251 | ||||||
voestalpine | 13,568 | 394 | ||||||
|
| |||||||
| 1,487 | ||||||||
|
| |||||||
Belgium — 0.8% | ||||||||
Anheuser-Busch InBev ADR | 11,072 | 1,234 | ||||||
|
| |||||||
Bermuda — 0.2% | ||||||||
Aspen Insurance Holdings | 2,284 | 102 | ||||||
Endurance Specialty Holdings | 1,490 | 93 | ||||||
Validus Holdings | 2,718 | 122 | ||||||
|
| |||||||
| 317 | ||||||||
|
| |||||||
Brazil — 0.4% | ||||||||
Banco Bradesco ADR | 42,658 | 226 | ||||||
Banco do Brasil | 29,100 | 100 | ||||||
Qualicorp | 84,007 | 270 | ||||||
|
| |||||||
| 596 | ||||||||
|
| |||||||
British Virgin Islands — 0.7% | ||||||||
Michael Kors Holdings* | 18,214 | 1,032 | ||||||
|
| |||||||
Canada — 1.7% | ||||||||
Canadian Natural Resources | 34,980 | 729 | ||||||
Canadian Pacific Railway | 3,720 | 451 | ||||||
Magna International | 11,610 | 450 | ||||||
Tencent Holdings ADR | 33,681 | 618 | ||||||
Thomson Reuters | 7,621 | 279 | ||||||
|
| |||||||
| 2,527 | ||||||||
|
| |||||||
China — 0.8% | ||||||||
Anhui Conch Cement, Cl H | 117,500 | 233 | ||||||
China Oilfield Services, Cl H | 360,000 | 265 | ||||||
Industrial & Commercial Bank of China, Cl H | 286,000 | 141 | ||||||
Mindray Medical International ADR | 15,068 | 419 | ||||||
Weichai Power, Cl H | 186,000 | 170 | ||||||
|
| |||||||
| 1,228 | ||||||||
|
| |||||||
Colombia — 0.1% | ||||||||
Bancolombia ADR | 6,273 | 189 | ||||||
|
| |||||||
Czech Republic — 0.0% | ||||||||
Komercni banka as | 384 | 72 | ||||||
|
| |||||||
| SEI Catholic Values Trust / Annual Report / February 29, 2016 | 11 |
SCHEDULE OF INVESTMENTS
Catholic Values Equity Fund (Concluded)
February 29, 2016
| Description | Shares | Market Value ($ Thousands) | ||||||
France — 0.7% | ||||||||
Societe Generale | 13,398 | $ | 472 | |||||
Sodexo | 6,175 | 628 | ||||||
|
| |||||||
| 1,100 | ||||||||
|
| |||||||
Germany — 0.3% | ||||||||
BASF | 4,063 | 266 | ||||||
Continental | 1,202 | 241 | ||||||
|
| |||||||
| 507 | ||||||||
|
| |||||||
Hong Kong — 0.8% | ||||||||
China Mobile ADR | 13,480 | 721 | ||||||
Orient Overseas International | 114,500 | 416 | ||||||
|
| |||||||
| 1,137 | ||||||||
|
| |||||||
India — 0.6% | ||||||||
HDFC Bank ADR | 10,729 | 567 | ||||||
ICICI Bank ADR | 59,095 | 335 | ||||||
|
| |||||||
| 902 | ||||||||
|
| |||||||
Indonesia — 0.1% | ||||||||
Indofood Sukses Makmur | 293,300 | 155 | ||||||
|
| |||||||
Ireland — 2.3% | ||||||||
Accenture, Cl A | 3,557 | 357 | ||||||
ICON* | 20,108 | 1,431 | ||||||
Jazz Pharmaceuticals* | 4,230 | 514 | ||||||
Mallinckrodt* | 5,918 | 385 | ||||||
Shire ADR | 5,499 | 858 | ||||||
|
| |||||||
| 3,545 | ||||||||
|
| |||||||
Israel — 0.5% | ||||||||
Orbotech* | 16,951 | 384 | ||||||
SodaStream International* | 25,808 | 385 | ||||||
|
| |||||||
| 769 | ||||||||
|
| |||||||
Japan — 2.2% | ||||||||
Denso | 17,700 | 657 | ||||||
Hitachi | 81,000 | 343 | ||||||
Nippon Steel & Sumitomo Metal | 12,900 | 223 | ||||||
Nomura Holdings ADR | 130,370 | 547 | ||||||
Secom | 7,700 | 548 | ||||||
Toyota Motor ADR | 9,490 | 988 | ||||||
|
| |||||||
| 3,306 | ||||||||
|
| |||||||
Netherlands — 1.9% | ||||||||
AerCap Holdings* | 18,370 | 656 | ||||||
Core Laboratories | 7,802 | 819 | ||||||
NXP Semiconductors* | 7,625 | 543 | ||||||
QIAGEN* | 24,556 | 519 | ||||||
Royal Dutch Shell, Cl A | 13,713 | 315 | ||||||
|
| |||||||
| 2,852 | ||||||||
|
| |||||||
| Description | Shares | Market Value ($ Thousands) | ||||||
Norway — 1.0% | ||||||||
DNB | 66,835 | $ | 770 | |||||
Norsk Hydro | 112,860 | 449 | ||||||
Statoil ADR | 22,574 | 329 | ||||||
|
| |||||||
| 1,548 | ||||||||
|
| |||||||
Puerto Rico — 0.4% | ||||||||
OFG Bancorp | 94,860 | 552 | ||||||
Popular | 4,269 | 113 | ||||||
|
| |||||||
| 665 | ||||||||
|
| |||||||
South Korea — 0.5% | ||||||||
Hyundai Mobis | 2,326 | 468 | ||||||
Samsung Electronics | 369 | 352 | ||||||
|
| |||||||
| 820 | ||||||||
|
| |||||||
Spain — 0.6% | ||||||||
Amadeus IT Holding, Cl A | 21,065 | 851 | ||||||
|
| |||||||
Sweden — 0.4% | ||||||||
Getinge, Cl B | 30,689 | 681 | ||||||
|
| |||||||
Switzerland — 0.3% | ||||||||
Credit Suisse Group ADR | 33,036 | 440 | ||||||
|
| |||||||
Taiwan — 0.7% | ||||||||
Advanced Semiconductor Engineering | 416,000 | 475 | ||||||
Taiwan Semiconductor Manufacturing | 119,000 | 534 | ||||||
|
| |||||||
| 1,009 | ||||||||
|
| |||||||
Turkey — 0.4% | ||||||||
Akbank | 67,865 | 170 | ||||||
Turkiye Garanti Bankasi | 156,753 | 390 | ||||||
|
| |||||||
| 560 | ||||||||
|
| |||||||
United Kingdom — 2.9% | ||||||||
ARM Holdings ADR | 23,404 | 959 | ||||||
BP ADR | 37,346 | 1,087 | ||||||
Diageo | 28,498 | 738 | ||||||
HSBC Holdings | 11,770 | 75 | ||||||
ITV | 79,853 | 277 | ||||||
Rio Tinto ADR | 9,053 | 236 | ||||||
Shire | 20,948 | 1,106 | ||||||
|
| |||||||
| 4,478 | ||||||||
|
| |||||||
Total Foreign Common Stock | 34,400 | |||||||
|
| |||||||
| 12 | SEI Catholic Values Trust / Annual Report / February 29, 2016 |
| Description | Face Amount | Market Value ($ Thousands) | ||||||
U.S. TREASURY OBLIGATION — 0.1% |
| |||||||
United States Treasury Bill | ||||||||
0.437%, 08/18/2016 (B) | $ | 100 | $ | 100 | ||||
|
| |||||||
Total U.S. Treasury Obligation | 100 | |||||||
|
| |||||||
CASH EQUIVALENT — 2.0% |
| |||||||
SEI Daily Income Trust, Prime Obligation Fund, Cl A 0.300%**† | 3,009,631 | 3,010 | ||||||
|
| |||||||
Total Cash Equivalent | 3,010 | |||||||
|
| |||||||
Total Investments — 98.9% |
| $ | 150,271 | |||||
|
| |||||||
A list of the open futures contracts held by the Fund at February 29, 2016, is as follows:
| Type of Contract | Number of Contracts Long | Expiration Date | Unrealized Appreciation ($ Thousands) | |||||||||
Russell 2000 Index | 3 | Mar-2016 | $ | 5 | ||||||||
S&P 500 Index E-MINI | 13 | Mar-2016 | 33 | |||||||||
|
| |||||||||||
| $ | 38 | |||||||||||
|
| |||||||||||
For the period ended February 29, 2016, the total amount of all open futures contracts, as presented in the table above, are representative of the volume of activity for this derivative type during the period.
Percentages are based on a Net Assets of $151,872 ($ Thousands).
| * | Non-income producing security. |
| ** | Rate shown is the 7-day effective yield as of February 29, 2016. |
| † | Investment in Affiliated Security (see Note 2). |
| ‡ | Real Estate Investment Trust. |
| (A) | Security is a Master Limited Partnership. At February 29, 2016, such securities amounted to $1,326 ($ Thousands), or 0.87% of Net Assets (See Note 2). |
| (B) | Security, or portion thereof, has been pledged as collateral on open futures contracts. |
ADR — American Depositary Receipt
Cl — Class
LP — Limited Partnership
The following is a list of the level of inputs used as of February 29, 2016, in valuing the Fund’s investments and other financial instruments carried at value ($ Thousands):
| Investments in Securities | Level 1 | Level 2 | Level 3 | Total | ||||||||||||
Common Stock | $ | 112,761 | $ | — | $ | — | $ | 112,761 | ||||||||
Foreign Common Stock | 34,400 | — | — | 34,400 | ||||||||||||
U.S. Treasury Obligation | — | 100 | — | 100 | ||||||||||||
Cash Equivalent | 3,010 | — | — | 3,010 | ||||||||||||
|
|
|
|
|
|
|
| |||||||||
Total Investments in Securities | $ | 150,171 | $ | 100 | $ | — | $ | 150,271 | ||||||||
|
|
|
|
|
|
|
| |||||||||
| Other Financial Instruments | Level 1 | Level 2 | Level 3 | Total | ||||||||||||
Futures Contracts* | ||||||||||||||||
Unrealized Appreciation | $ | 38 | $ | — | $ | — | $ | 38 | ||||||||
|
|
|
|
|
|
|
| |||||||||
| * | Futures contracts are valued at the unrealized appreciation/ (depreciation) on the instrument. |
For the period ended February 29, 2016, there were no transfers between Level 1 and Level 2 assets and liabilities. For the period ended February 29, 2016, there were no transfers from Level 2 into Level 3 assets and liabilities.
For the period ended February 29, 2016, there were no Level 3 securities.
Amounts designated as “—” are $0.
The accompanying notes are an integral part of the financial statements.
| SEI Catholic Values Trust / Annual Report / February 29, 2016 | 13 |
SCHEDULE OF INVESTMENTS
Catholic Values Fixed Income Fund
February 29, 2016
| Description | Face Amount ($ Thousands) | Market Value ($ Thousands) | ||||||
CORPORATE OBLIGATIONS — 35.3% |
| |||||||
Consumer Discretionary — 3.3% | ||||||||
1011778 BC ULC | ||||||||
6.000%, 04/01/2022 (A) | $ | 20 | $ | 21 | ||||
21st Century Fox America | ||||||||
6.150%, 02/15/2041 | 180 | 194 | ||||||
Amazon.com | ||||||||
4.950%, 12/05/2044 | 30 | 33 | ||||||
CCO Safari II | ||||||||
6.484%, 10/23/2045 (A) | 100 | 105 | ||||||
4.908%, 07/23/2025 (A) | 222 | 228 | ||||||
Comcast | ||||||||
6.400%, 05/15/2038 | 430 | 544 | ||||||
3.375%, 08/15/2025 | 150 | 157 | ||||||
Dollar Tree | ||||||||
5.750%, 03/01/2023 (A) | 180 | 192 | ||||||
Ford Motor | ||||||||
4.750%, 01/15/2043 | 170 | 156 | ||||||
General Motors | ||||||||
6.250%, 10/02/2043 | 40 | 39 | ||||||
4.200%, 03/01/2021 | 405 | 406 | ||||||
Historic TW | ||||||||
9.150%, 02/01/2023 | 100 | 129 | ||||||
L Brands | ||||||||
5.625%, 10/15/2023 | 10 | 11 | ||||||
McDonald’s MTN | ||||||||
3.700%, 01/30/2026 | 30 | 31 | ||||||
NCL | ||||||||
4.625%, 11/15/2020 (A) | 20 | 19 | ||||||
Netflix | ||||||||
5.500%, 02/15/2022 | 80 | 84 | ||||||
Time Warner | ||||||||
7.570%, 02/01/2024 | 101 | 123 | ||||||
4.750%, 03/29/2021 | 140 | 151 | ||||||
3.600%, 07/15/2025 | 135 | 132 | ||||||
Viacom | ||||||||
4.850%, 12/15/2034 | 220 | 174 | ||||||
|
| |||||||
| 2,929 | ||||||||
|
| |||||||
| Description | Face Amount ($ Thousands) | Market Value ($ Thousands) | ||||||
Consumer Staples — 3.5% | ||||||||
Altria Group | ||||||||
5.375%, 01/31/2044 | $ | 60 | $ | 68 | ||||
4.750%, 05/05/2021 | 50 | 55 | ||||||
2.850%, 08/09/2022 | 150 | 151 | ||||||
Anheuser-Busch InBev Finance | ||||||||
4.900%, 02/01/2046 | 386 | 414 | ||||||
3.650%, 02/01/2026 | 230 | 237 | ||||||
3.300%, 02/01/2023 | 50 | 51 | ||||||
2.650%, 02/01/2021 | 30 | 31 | ||||||
Anheuser-Busch InBev Worldwide | ||||||||
2.500%, 07/15/2022 | 150 | 148 | ||||||
Constellation Brands | ||||||||
4.750%, 11/15/2024 | 100 | 105 | ||||||
CVS Health | ||||||||
5.750%, 05/15/2041 | 70 | 82 | ||||||
5.125%, 07/20/2045 | 80 | 90 | ||||||
4.875%, 07/20/2035 | 20 | 22 | ||||||
3.875%, 07/20/2025 | 20 | 21 | ||||||
CVS Pass-Through Trust | ||||||||
7.507%, 01/10/2032 (A) | 428 | 508 | ||||||
Diageo Capital | ||||||||
4.828%, 07/15/2020 | 150 | 165 | ||||||
Kraft Foods Group | ||||||||
5.375%, 02/10/2020 | 30 | 33 | ||||||
3.500%, 06/06/2022 | 40 | 41 | ||||||
Kraft Heinz Foods | ||||||||
5.200%, 07/15/2045 (A) | 20 | 22 | ||||||
5.000%, 07/15/2035 (A) | 20 | 21 | ||||||
4.875%, 02/15/2025 (A) | 10 | 11 | ||||||
3.950%, 07/15/2025 (A) | 150 | 157 | ||||||
Mondelez International | ||||||||
4.000%, 02/01/2024 | 80 | 83 | ||||||
PepsiCo | ||||||||
4.600%, 07/17/2045 | 40 | 44 | ||||||
Pernod Ricard | ||||||||
4.450%, 01/15/2022 (A) | 200 | 212 | ||||||
Philip Morris International | ||||||||
4.500%, 03/20/2042 | 30 | 31 | ||||||
2.900%, 11/15/2021 | 50 | 52 | ||||||
2.500%, 08/22/2022 | 50 | 51 | ||||||
Reynolds American | ||||||||
5.850%, 08/15/2045 | 130 | 153 | ||||||
3.250%, 06/12/2020 | 11 | 11 | ||||||
Wm Wrigley Jr | ||||||||
3.375%, 10/21/2020 (A) | 30 | 31 | ||||||
|
| |||||||
| 3,101 | ||||||||
|
| |||||||
Energy — 3.5% | ||||||||
Anadarko Finance | ||||||||
7.500%, 05/01/2031 | 60 | 54 | ||||||
Anadarko Petroleum | ||||||||
6.200%, 03/15/2040 | 75 | 60 | ||||||
4.335%, 10/10/2036 | 1,000 | 352 | ||||||
| 14 | SEI Catholic Values Trust / Annual Report / February 29, 2016 |
| Description | Face Amount ($ Thousands) | Market Value ($ Thousands) | ||||||
Apache | ||||||||
4.250%, 01/15/2044 | $ | 50 | $ | 36 | ||||
BP Capital Markets | ||||||||
3.506%, 03/17/2025 | 90 | 87 | ||||||
Concho Resources | ||||||||
5.500%, 04/01/2023 | 40 | 37 | ||||||
ConocoPhillips | ||||||||
3.350%, 05/15/2025 | 200 | 177 | ||||||
Devon Energy | ||||||||
5.850%, 12/15/2025 | 30 | 26 | ||||||
5.000%, 06/15/2045 | 30 | 20 | ||||||
Devon Financing | ||||||||
7.875%, 09/30/2031 | 50 | 40 | ||||||
Ecopetrol | ||||||||
5.875%, 05/28/2045 | 100 | 70 | ||||||
Ensco | ||||||||
4.700%, 03/15/2021 | 20 | 11 | ||||||
Enterprise Products Operating | ||||||||
2.550%, 10/15/2019 | 130 | 126 | ||||||
Exxon Mobil | ||||||||
3.043%, 03/01/2026 | 40 | 40 | ||||||
Halliburton | ||||||||
3.800%, 11/15/2025 | 50 | 47 | ||||||
2.700%, 11/15/2020 | 10 | 10 | ||||||
Kinder Morgan | ||||||||
5.300%, 12/01/2034 | 20 | 16 | ||||||
Kinder Morgan Energy Partners | ||||||||
4.250%, 09/01/2024 | 40 | 35 | ||||||
4.150%, 02/01/2024 | 400 | 351 | ||||||
3.500%, 09/01/2023 | 30 | 25 | ||||||
MPLX | ||||||||
4.875%, 06/01/2025 (A) | 110 | 90 | ||||||
Noble Energy | ||||||||
5.250%, 11/15/2043 | 10 | 7 | ||||||
4.150%, 12/15/2021 | 50 | 44 | ||||||
Oasis Petroleum | ||||||||
7.250%, 02/01/2019 | 20 | 12 | ||||||
Occidental Petroleum | ||||||||
4.625%, 06/15/2045 | 20 | 19 | ||||||
3.125%, 02/15/2022 | 19 | 19 | ||||||
Petrobras Global Finance BV | ||||||||
6.850%, 06/05/2115 | 50 | 31 | ||||||
5.375%, 01/27/2021 | 250 | 187 | ||||||
Petroleos Mexicanos | ||||||||
6.875%, 08/04/2026 (A) | 20 | 21 | ||||||
6.625%, 06/15/2035 | 150 | 135 | ||||||
Pride International | ||||||||
6.875%, 08/15/2020 | 10 | 6 | ||||||
QEP Resources | ||||||||
5.250%, 05/01/2023 | 40 | 28 | ||||||
Range Resources | ||||||||
4.875%, 05/15/2025 (A) | 40 | 35 | ||||||
Schlumberger Holdings | ||||||||
4.000%, 12/21/2025 (A) | 30 | 30 | ||||||
3.000%, 12/21/2020 (A) | 283 | 278 | ||||||
| Description | Face Amount ($ Thousands) | Market Value ($ Thousands) | ||||||
Shell International Finance BV | ||||||||
4.375%, 05/11/2045 | $ | 50 | $ | 46 | ||||
Sinopec Group Overseas Development | ||||||||
4.375%, 04/10/2024 (A) | 200 | 212 | ||||||
SM Energy | ||||||||
6.125%, 11/15/2022 | 20 | 9 | ||||||
5.000%, 01/15/2024 | 30 | 12 | ||||||
Sunoco Logistics Partners Operations | ||||||||
3.450%, 01/15/2023 | 147 | 120 | ||||||
Valero Energy | ||||||||
6.125%, 02/01/2020 | 74 | 79 | ||||||
|
| |||||||
| 3,040 | ||||||||
|
| |||||||
Financials — 13.4% | ||||||||
ACE INA Holdings | ||||||||
4.350%, 11/03/2045 | 30 | 32 | ||||||
3.350%, 05/03/2026 | 10 | 10 | ||||||
2.300%, 11/03/2020 | 10 | 10 | ||||||
AgriBank FCB | ||||||||
9.125%, 07/15/2019 | 264 | 321 | ||||||
AIA Group MTN | ||||||||
3.200%, 03/11/2025 (A) | 200 | 198 | ||||||
Ally Financial | ||||||||
8.000%, 11/01/2031 | 50 | 55 | ||||||
American Express | ||||||||
2.650%, 12/02/2022 | 140 | 136 | ||||||
American International Group | ||||||||
4.800%, 07/10/2045 | 183 | 168 | ||||||
3.750%, 07/10/2025 | 80 | 79 | ||||||
Bank of America MTN | ||||||||
5.625%, 07/01/2020 | 150 | 166 | ||||||
5.000%, 01/21/2044 | 160 | 170 | ||||||
4.875%, 04/01/2044 | 150 | 156 | ||||||
4.000%, 01/22/2025 | 300 | 291 | ||||||
3.875%, 08/01/2025 | 40 | 41 | ||||||
2.600%, 01/15/2019 | 300 | 302 | ||||||
1.950%, 05/12/2018 | 229 | 228 | ||||||
Blackstone Holdings Finance | ||||||||
6.625%, 08/15/2019 (A) | 407 | 464 | ||||||
BNP Paribas MTN | ||||||||
4.375%, 09/28/2025 (A) | 200 | 194 | ||||||
Boston Properties | ||||||||
3.850%, 02/01/2023 | 200 | 206 | ||||||
Carlyle Holdings II Finance | ||||||||
5.625%, 03/30/2043 (A) | 235 | 247 | ||||||
CDP Financial | ||||||||
3.150%, 07/24/2024 (A) | 430 | 450 | ||||||
CIT Group | ||||||||
5.500%, 02/15/2019 (A) | 20 | 21 | ||||||
5.000%, 08/15/2022 | 20 | 20 | ||||||
| SEI Catholic Values Trust / Annual Report / February 29, 2016 | 15 |
SCHEDULE OF INVESTMENTS
Catholic Values Fixed Income Fund (Continued)
February 29, 2016
| Description | Face Amount ($ Thousands) | Market Value ($ Thousands) | ||||||
Citigroup | ||||||||
4.450%, 09/29/2027 | $ | 170 | $ | 167 | ||||
3.700%, 01/12/2026 | 170 | 174 | ||||||
2.150%, 07/30/2018 | 120 | 119 | ||||||
Cooperatieve Centrale Raiffeisen-Boerenleenbank | ||||||||
5.750%, 12/01/2043 | 250 | 276 | ||||||
Credit Agricole | ||||||||
8.125%, 12/31/2049 (A) (B) | 260 | 242 | ||||||
Credit Suisse Group Funding Guernsey | ||||||||
4.875%, 05/15/2045 | 250 | 228 | ||||||
Fifth Third Bancorp | ||||||||
2.875%, 07/27/2020 | 192 | 193 | ||||||
GLP Capital | ||||||||
4.875%, 11/01/2020 | 30 | 30 | ||||||
Goldman Sachs Group MTN | ||||||||
7.500%, 02/15/2019 | 185 | 211 | ||||||
6.750%, 10/01/2037 | 100 | 114 | ||||||
6.250%, 02/01/2041 | 50 | 60 | ||||||
5.375%, 03/15/2020 | 100 | 110 | ||||||
5.150%, 05/22/2045 | 30 | 29 | ||||||
4.750%, 10/21/2045 | 30 | 30 | ||||||
4.250%, 10/21/2025 | 30 | 30 | ||||||
3.850%, 07/08/2024 | 190 | 194 | ||||||
2.875%, 02/25/2021 | 131 | 131 | ||||||
HCP | ||||||||
4.250%, 11/15/2023 | 125 | 122 | ||||||
4.000%, 06/01/2025 | 150 | 142 | ||||||
Health Care | ||||||||
4.500%, 01/15/2024 | 200 | 204 | ||||||
HSBC Holdings | ||||||||
4.250%, 03/14/2024 | 200 | 197 | ||||||
Intercontinental Exchange | ||||||||
2.750%, 12/01/2020 | 165 | 168 | ||||||
Intesa Sanpaolo MTN | ||||||||
5.017%, 06/26/2024 (A) | 200 | 184 | ||||||
JPMorgan Chase | ||||||||
4.125%, 12/15/2026 | 150 | 152 | ||||||
3.125%, 01/23/2025 | 150 | 150 | ||||||
KKR Group Finance II | ||||||||
5.500%, 02/01/2043 (A) | 193 | 193 | ||||||
KKR Group Finance III | ||||||||
5.125%, 06/01/2044 (A) | 215 | 209 | ||||||
Liberty Mutual Group | ||||||||
4.250%, 06/15/2023 (A) | 200 | 205 | ||||||
MetLife | ||||||||
3.000%, 03/01/2025 | 175 | 167 | ||||||
Morgan Stanley MTN | ||||||||
6.625%, 04/01/2018 | 585 | 636 | ||||||
Navient MTN | ||||||||
8.000%, 03/25/2020 | 50 | 49 | ||||||
Prudential Financial MTN | ||||||||
7.375%, 06/15/2019 | 385 | 444 | ||||||
| Description | Face Amount ($ Thousands) | Market Value ($ Thousands) | ||||||
Quicken Loans | ||||||||
5.750%, 05/01/2025 (A) | $ | 30 | $ | 28 | ||||
Royal Bank of Scotland Group | ||||||||
5.125%, 05/28/2024 | 200 | 192 | ||||||
Teachers Insurance & Annuity Association of America | ||||||||
4.900%, 09/15/2044 (A) | 150 | 152 | ||||||
UBS Group Funding Jersey | ||||||||
4.125%, 09/24/2025 (A) | 200 | 199 | ||||||
Ventas Realty | ||||||||
4.125%, 01/15/2026 | 136 | 138 | ||||||
2.700%, 04/01/2020 | 215 | 213 | ||||||
WEA Finance | ||||||||
3.750%, 09/17/2024 (A) | 200 | 202 | ||||||
2.700%, 09/17/2019 (A) | 430 | 429 | ||||||
Wells Fargo | ||||||||
4.900%, 11/17/2045 | 50 | 51 | ||||||
4.650%, 11/04/2044 | 100 | 98 | ||||||
4.480%, 01/16/2024 | 200 | 212 | ||||||
4.300%, 07/22/2027 | 100 | 104 | ||||||
3.450%, 02/13/2023 | 160 | 162 | ||||||
|
| |||||||
| 11,705 | ||||||||
|
| |||||||
Health Care — 2.1% | ||||||||
Amgen | ||||||||
3.625%, 05/22/2024 | 60 | 62 | ||||||
Celgene | ||||||||
5.000%, 08/15/2045 | 60 | 62 | ||||||
3.875%, 08/15/2025 | 110 | 113 | ||||||
Cleveland Clinic Foundation | ||||||||
4.858%, 01/01/2114 | 236 | 250 | ||||||
DaVita HealthCare Partners | ||||||||
5.000%, 05/01/2025 | 50 | �� | 50 | |||||
Fresenius Medical Care US Finance II | ||||||||
4.750%, 10/15/2024 (A) | 50 | 51 | ||||||
Gilead Sciences | ||||||||
4.750%, 03/01/2046 | 50 | 53 | ||||||
3.650%, 03/01/2026 | 40 | 42 | ||||||
3.500%, 02/01/2025 | 50 | 52 | ||||||
Howard Hughes Medical Institute | ||||||||
3.500%, 09/01/2023 | 210 | 224 | ||||||
Kindred Healthcare | ||||||||
8.750%, 01/15/2023 | 30 | 27 | ||||||
Mallinckrodt International Finance | ||||||||
4.750%, 04/15/2023 | 30 | 26 | ||||||
Medtronic | ||||||||
3.500%, 03/15/2025 | 80 | 84 | ||||||
New York and Presbyterian Hospital | ||||||||
4.024%, 08/01/2045 | 465 | 461 | ||||||
Zimmer Biomet Holdings | ||||||||
4.450%, 08/15/2045 | 50 | 46 | ||||||
3.550%, 04/01/2025 | 230 | 227 | ||||||
|
| |||||||
| 1,830 | ||||||||
|
| |||||||
| 16 | SEI Catholic Values Trust / Annual Report / February 29, 2016 |
| Description | Face Amount ($ Thousands) | Market Value ($ Thousands) | ||||||
Industrials — 2.9% | ||||||||
Air Canada Pass Through Trust, | ||||||||
3.600%, 03/15/2027 (A) | $ | 215 | $ | 205 | ||||
American Airlines Pass-Through Trust, Ser 2013-1, Cl B | ||||||||
5.625%, 01/15/2021 (A) | 171 | 172 | ||||||
American Airlines Pass-Through Trust, Ser 2013-2, Cl A | ||||||||
4.950%, 01/15/2023 | 437 | 460 | ||||||
American Builders & Contractors Supply | ||||||||
5.750%, 12/15/2023 (A) | 30 | 31 | ||||||
Burlington Northern Santa Fe | ||||||||
3.000%, 04/01/2025 | 150 | 150 | ||||||
Canadian Pacific Railway | ||||||||
6.125%, 09/15/2115 | 127 | 133 | ||||||
Delta Air Lines Pass-Through Trust, | ||||||||
4.950%, 05/23/2019 | 349 | 367 | ||||||
Eaton | ||||||||
4.150%, 11/02/2042 | 70 | 67 | ||||||
Florida East Coast Holdings | ||||||||
6.750%, 05/01/2019 (A) | 30 | 30 | ||||||
International Lease Finance | ||||||||
5.875%, 08/15/2022 | 50 | 53 | ||||||
Siemens Financieringsmaatschappij | ||||||||
2.900%, 05/27/2022 (A) | 342 | 353 | ||||||
United Airlines Pass-Through Trust, Ser 2014-1, Cl A | ||||||||
4.000%, 04/11/2026 | 403 | 412 | ||||||
Waste Management | ||||||||
3.500%, 05/15/2024 | 70 | 72 | ||||||
West | ||||||||
5.375%, 07/15/2022 (A) | 30 | 27 | ||||||
|
| |||||||
| 2,532 | ||||||||
|
| |||||||
Information Technology — 1.0% | ||||||||
Apple | ||||||||
3.200%, 05/13/2025 | 80 | 83 | ||||||
Hewlett Packard Enterprise | ||||||||
4.400%, 10/15/2022 (A) | 160 | 156 | ||||||
Intel | ||||||||
3.700%, 07/29/2025 | 60 | 65 | ||||||
Juniper Networks | ||||||||
3.125%, 02/26/2019 | 128 | 128 | ||||||
Microsoft | ||||||||
4.450%, 11/03/2045 | 40 | 42 | ||||||
QUALCOMM | ||||||||
4.800%, 05/20/2045 | 50 | 46 | ||||||
Telefonaktiebolaget LM Ericsson | ||||||||
4.125%, 05/15/2022 | 190 | 196 | ||||||
| Description | Face Amount ($ Thousands) | Market Value ($ Thousands) | ||||||
Visa | ||||||||
4.300%, 12/14/2045 | $ | 50 | $ | 54 | ||||
3.150%, 12/14/2025 | 80 | 83 | ||||||
|
| |||||||
| 853 | ||||||||
|
| |||||||
Materials — 1.2% | ||||||||
Barrick | ||||||||
4.100%, 05/01/2023 | 181 | 169 | ||||||
BHP Billiton Finance USA | ||||||||
6.750%, 10/19/2075 (A) (B) | 200 | 193 | ||||||
5.000%, 09/30/2043 | 30 | 29 | ||||||
3.250%, 11/21/2021 | 100 | 100 | ||||||
Freeport-McMoRan | ||||||||
4.000%, 11/14/2021 | 60 | 41 | ||||||
3.550%, 03/01/2022 | 230 | 153 | ||||||
Glencore Funding | ||||||||
2.875%, 04/16/2020 (A) | 200 | 166 | ||||||
2.125%, 04/16/2018 (A) | 130 | 119 | ||||||
Rock-Tenn | ||||||||
4.000%, 03/01/2023 | 10 | 10 | ||||||
3.500%, 03/01/2020 | 20 | 21 | ||||||
Vale Overseas | ||||||||
4.375%, 01/11/2022 | 40 | 31 | ||||||
|
| |||||||
| 1,032 | ||||||||
|
| |||||||
Telecommunication Services — 1.9% |
| |||||||
AT&T | ||||||||
5.650%, 02/15/2047 | 170 | 176 | ||||||
3.400%, 05/15/2025 | 438 | 430 | ||||||
Rogers Communications | ||||||||
6.800%, 08/15/2018 | 185 | 206 | ||||||
Verizon Communications | ||||||||
6.550%, 09/15/2043 | 220 | 268 | ||||||
4.522%, 09/15/2048 | 465 | 424 | ||||||
3.500%, 11/01/2024 | 170 | 174 | ||||||
|
| |||||||
| 1,678 | ||||||||
|
| |||||||
Utilities — 2.5% | ||||||||
AES | ||||||||
5.500%, 03/15/2024 | 30 | 28 | ||||||
Berkshire Hathaway Energy | ||||||||
6.500%, 09/15/2037 | 97 | 121 | ||||||
3.500%, 02/01/2025 | 300 | 305 | ||||||
Duke Energy | ||||||||
3.750%, 04/15/2024 | 331 | 342 | ||||||
Electricite de France | ||||||||
3.625%, 10/13/2025 (A) | 137 | 139 | ||||||
Eversource Energy | ||||||||
3.150%, 01/15/2025 | 175 | 174 | ||||||
Exelon | ||||||||
5.625%, 06/15/2035 | 100 | 109 | ||||||
5.100%, 06/15/2045 (A) | 165 | 168 | ||||||
| SEI Catholic Values Trust / Annual Report / February 29, 2016 | 17 |
SCHEDULE OF INVESTMENTS
Catholic Values Fixed Income Fund (Continued)
February 29, 2016
| Description | Face Amount ($ Thousands) | Market Value ($ Thousands) | ||||||
FirstEnergy | ||||||||
7.375%, 11/15/2031 | $ | 220 | $ | 273 | ||||
Pacific Gas & Electric | ||||||||
6.050%, 03/01/2034 | 90 | 110 | ||||||
2.950%, 03/01/2026 | 285 | 287 | ||||||
Virginia Electric & Power | ||||||||
3.150%, 01/15/2026 | 124 | 127 | ||||||
|
| |||||||
| 2,183 | ||||||||
|
| |||||||
Total Corporate Obligations | 30,883 | |||||||
|
| |||||||
MORTGAGE-BACKED SECURITIES — 29.9% |
| |||||||
Agency Mortgage-Backed Obligations — 19.30% |
| |||||||
FHLMC | ||||||||
5.000%, 09/01/40 to 06/01/41 | 580 | 648 | ||||||
4.500%, 06/01/38 | 371 | 404 | ||||||
4.000%, 06/01/43 to 02/01/44 | 1,237 | 1,330 | ||||||
3.500%, 03/01/43 to 03/01/45 | 727 | 764 | ||||||
1.983%, 11/15/38 | 1,213 | 85 | ||||||
FHLMC ARM | ||||||||
2.392%, 03/01/37 (B) | 421 | 444 | ||||||
FHLMC CMO, Ser 2014-328, | ||||||||
1.989%, 02/15/38 (B) | 524 | 40 | ||||||
FHLMC CMO, Ser 2014-4415, | ||||||||
1.905%, 04/15/41 (B) | 803 | 58 | ||||||
FNMA | ||||||||
5.000%, 10/01/33 to 05/01/42 | 2,997 | 3,346 | ||||||
4.500%, 08/01/38 to 06/01/42 | 518 | 564 | ||||||
4.000%, 10/01/40 to 07/01/45 | 1,105 | 1,200 | ||||||
3.500%, 11/01/44 to 01/01/46 | 1,790 | 1,883 | ||||||
2.810%, 04/01/25 | 110 | 113 | ||||||
FNMA ARM | ||||||||
2.489%, 11/01/34 (B) | 193 | 202 | ||||||
2.303%, 05/01/38 (B) | 283 | 299 | ||||||
FNMA CMO, Ser 2013-52, Cl MD | ||||||||
1.250%, 06/25/43 | 271 | 266 | ||||||
FNMA CMO, Ser 2015-55, | ||||||||
1.712%, 08/25/55 (B) | 637 | 41 | ||||||
FNMA CMO, Ser 2015-56, | ||||||||
5.724%, 08/25/45 (B) | 384 | 99 | ||||||
FNMA TBA | ||||||||
5.000%, 03/01/37 | 400 | 443 | ||||||
4.500%, 02/18/19 | 800 | 869 | ||||||
3.500%, 04/01/41 | 400 | 422 | ||||||
3.000%, 03/25/26 | 1,200 | 1,251 | ||||||
2.500%, 03/01/26 | 200 | 205 | ||||||
GNMA | ||||||||
4.000%, 08/20/45 to 12/20/45 | 976 | 1,050 | ||||||
3.500%, 08/15/42 | 108 | 114 | ||||||
3.000%, 09/20/45 | 392 | 407 | ||||||
| Description | Face Amount ($ Thousands) | Market Value ($ Thousands) | ||||||
GNMA, Cl IO, IO | ||||||||
1.084%, 07/16/56 (B) | $ | 1,606 | $ | 120 | ||||
GNMA CMO, Ser 2012-34, | ||||||||
5.624%, 03/20/42 (B) | 258 | 56 | ||||||
GNMA CMO, Ser 2012-43, | ||||||||
6.175%, 04/16/42 (B) | 230 | 54 | ||||||
GNMA CMO, Ser 2014-118, | ||||||||
5.768%, 08/20/44 (B) | 445 | 107 | ||||||
|
| |||||||
| 16,884 | ||||||||
|
| |||||||
Non-Agency Mortgage-Backed Obligations — 10.6% |
| |||||||
BBCCRE Trust 2015-GTP, Ser GTP, Cl D | ||||||||
4.715%, 08/10/33 (A) (B) | 140 | 119 | ||||||
Bear Stearns Commercial Mortgage Securities Trust, | ||||||||
5.201%, 12/11/38 | 610 | 620 | ||||||
Bear Stearns Commercial Mortgage Securities Trust, | ||||||||
5.331%, 02/11/44 | 601 | 615 | ||||||
Chevy Chase Funding Mortgage-Backed Certificates, Ser 2004-2A, Cl B1 | ||||||||
0.704%, 05/25/35 (A) (B) | 426 | 334 | ||||||
Chevy Chase Funding Mortgage-Backed Certificates, Ser 2004-2A, Cl A1 | ||||||||
0.491%, 05/25/35 (A) (B) | 255 | 228 | ||||||
Commercial Mortgage Trust, Ser 2006-C7, Cl A4 | ||||||||
5.963%, 06/10/46 (B) | 168 | 168 | ||||||
Commercial Mortgage Trust, Ser 2014- CR18, Cl D | ||||||||
4.896%, 07/15/47 | 240 | 185 | ||||||
Credit Suisse Commercial Mortgage Trust, Ser 2006-C5, Cl A3 | ||||||||
5.311%, 12/15/39 | 565 | 569 | ||||||
CSAIL Commercial Mortgage Trust, Ser 2015-C2, Cl AS | ||||||||
3.849%, 06/15/57 | 210 | 213 | ||||||
First Horizon Mortgage Pass-Through Trust, Ser 2005-AR1, | ||||||||
2.608%, 04/25/35 (B) | 459 | 332 | ||||||
Freddie Mac Structured Agency Credit Risk Debt Notes, Ser 2015-HQ2, Cl M3 | ||||||||
3.433%, 05/25/25 (B) | 340 | 296 | ||||||
| 18 | SEI Catholic Values Trust / Annual Report / February 29, 2016 |
| Description | Face Amount ($ Thousands) | Market Value ($ Thousands) | ||||||
Greenwich Capital Commercial Mortgage Trust, | ||||||||
5.444%, 03/10/39 | $ | 366 | $ | 374 | ||||
GS Mortgage Securities Trust, Ser 2006-GG8, Cl A5 | ||||||||
5.622%, 11/10/39 | 220 | 205 | ||||||
GS Mortgage Securities Trust, Ser 2012-GC6, Cl AS | ||||||||
4.948%, 01/10/45 (A) | 200 | 224 | ||||||
GS Mortgage Securities Trust, Ser 2012-GCJ7, Cl A4 | ||||||||
3.377%, 05/10/45 | 247 | 259 | ||||||
Homestar Mortgage Acceptance, Ser 2004-5, Cl M2 | ||||||||
0.891%, 10/25/34 (B) | 367 | 340 | �� | |||||
IndyMac INDX Mortgage Loan Trust, Ser 2007-AR5, | ||||||||
2.782%, 05/25/37 (B) | 414 | 311 | ||||||
JP Morgan Chase Commercial Mortgage Securities Trust, Ser 2007-CB18, Cl A4 | ||||||||
5.440%, 06/12/47 | 586 | 598 | ||||||
JPMBB Commercial Mortgage Securities Trust, Ser 2015-C29, Cl C | ||||||||
4.202%, 05/15/48 (B) | 110 | 94 | ||||||
Morgan Stanley Bank of America Merrill Lynch Trust, Ser 2015-C23, Cl B | ||||||||
4.137%, 06/15/25 (B) | 100 | 98 | ||||||
Morgan Stanley Capital I Trust, Ser 2007-IQ16, Cl AJ | ||||||||
6.300%, 12/12/49 (B) | 260 | 237 | ||||||
Morgan Stanley Re-REMIC Trust, Ser 2009-GG10, Cl A4B | ||||||||
5.988%, 08/12/45 (A) (B) | 139 | 142 | ||||||
Morgan Stanley Re-REMIC Trust, Ser 2010-GG10, Cl A4B | ||||||||
5.988%, 08/15/45 (A) (B) | 182 | 189 | ||||||
Motel 6 Trust, | ||||||||
4.532%, 02/05/20 (A) | 230 | 219 | ||||||
MSCG Trust, | ||||||||
3.577%, 06/07/35 (A) (B) | 110 | 115 | ||||||
Reperforming Loan REMIC Trust, Ser 2005- R2, Cl 2A3 | ||||||||
8.000%, 06/25/35 (A) | 195 | 203 | ||||||
UBS-Citigroup Commercial Mortgage Trust, | ||||||||
2.804%, 01/10/45 | 645 | 648 | ||||||
| Description | Face Amount ($ Thousands) | Market Value ($ Thousands) | ||||||
Wachovia Bank Commercial Mortgage Trust, Ser 2006-C28, Cl A4 | ||||||||
5.572%, 10/15/48 | $ | 607 | $ | 613 | ||||
Wachovia Bank Commercial Mortgage Trust, Ser 2007-C31, Cl A5 | ||||||||
5.500%, 04/15/47 | 413 | 425 | ||||||
Wells Fargo Commercial Mortgage Trust, Ser 2015-C28, Cl AS | ||||||||
3.872%, 05/15/48 | 120 | 121 | ||||||
Wells Fargo Commercial Mortgage Trust, Ser 2015-C28, Cl A4 | ||||||||
3.540%, 05/15/48 | 180 | 186 | ||||||
|
| |||||||
| 9,280 | ||||||||
|
| |||||||
Total Mortgage-Backed Securities | 26,164 | |||||||
|
| |||||||
U.S. TREASURY OBLIGATIONS — 21.2% |
| |||||||
U.S. Treasury Bills (C) | ||||||||
2.400%, 03/24/16 | 486 | 486 | ||||||
U.S. Treasury Bonds | ||||||||
4.500%, 02/15/36 | 957 | 1,317 | ||||||
3.000%, 11/15/44 | 950 | 1,026 | ||||||
3.000%, 05/15/45 | 698 | 753 | ||||||
3.000%, 11/15/45 | 180 | 195 | ||||||
2.875%, 05/15/43 | 980 | 1,037 | ||||||
2.875%, 08/15/45 | 120 | 126 | ||||||
2.750%, 11/15/42 | 590 | 610 | ||||||
U.S. Treasury Inflation Indexed Bond | ||||||||
2.375%, 01/15/25 | 188 | 221 | ||||||
1.750%, 01/15/28 | 90 | 103 | ||||||
1.375%, 02/15/44 | 507 | 548 | ||||||
1.000%, 02/15/46 | 339 | 340 | ||||||
0.750%, 02/15/45 | 201 | 187 | ||||||
0.375%, 07/15/23 | 752 | 764 | ||||||
0.375%, 07/15/25 | 140 | 141 | ||||||
U.S. Treasury Notes | ||||||||
2.375%, 08/15/24 | 140 | 148 | ||||||
2.125%, 05/15/25 | 118 | 122 | ||||||
2.000%, 07/31/20 | 30 | 31 | ||||||
2.000%, 08/15/25 | 140 | 143 | ||||||
1.875%, 10/31/22 | 280 | 287 | ||||||
1.625%, 06/30/20 | 1,302 | 1,326 | ||||||
1.625%, 11/30/20 | 1,274 | 1,298 | ||||||
1.500%, 08/28/23 | 770 | 769 | ||||||
1.375%, 04/30/20 | 3,820 | 3,852 | ||||||
1.375%, 10/31/20 | 10 | 10 | ||||||
1.125%, 02/28/21 | 960 | 955 | ||||||
0.500%, 06/15/16 | 216 | 216 | ||||||
0.500%, 04/30/17 | 1,550 | 1,546 | ||||||
|
| |||||||
Total U.S. Treasury Obligations | 18,557 | |||||||
|
| |||||||
| SEI Catholic Values Trust / Annual Report / February 29, 2016 | 19 |
SCHEDULE OF INVESTMENTS
Catholic Values Fixed Income Fund (Continued)
February 29, 2016
| Description | Face Amount ($ Thousands) | Market Value ($ Thousands) | ||||||
ASSET-BACKED SECURITIES — 10.1% |
| |||||||
Mortgage Related Securities — 0.7% |
| |||||||
Bayview Financial Asset Trust, Ser 2007- SR1A, Cl M3 | ||||||||
1.371%, 03/25/37 (A) (B) | $ | 382 | $ | 306 | ||||
Master Asset-Backed Securities Trust, Ser 2006-FRE1, | ||||||||
0.717%, 12/25/35 (B) | 342 | 299 | ||||||
|
| |||||||
| 605 | ||||||||
|
| |||||||
Other Asset-Backed Securities — 9.4% |
| |||||||
Airspeed, Ser 2007-1A, Cl G1 | ||||||||
0.697%, 04/15/24 (A) (B) | 356 | 283 | ||||||
Citibank Credit Card Issuance Trust, Ser 2014-A6, Cl A6 | ||||||||
2.150%, 07/15/21 | 257 | 262 | ||||||
Colony American Homes, Ser 2014-1A, Cl A | ||||||||
1.576%, 05/17/31 (A) (B) | 496 | 484 | ||||||
Conseco Financial, Ser 1997-7, | ||||||||
7.030%, 07/15/28 | 242 | 231 | ||||||
DRB Prime Student Loan Trust, Ser 2015-B, Cl A1 | ||||||||
2.327%, 10/27/31 (A) (B) | 209 | 207 | ||||||
DRB Prime Student Loan Trust, Ser 2015-B, Cl A2 | ||||||||
3.170%, 07/25/31 (A) | 186 | 185 | ||||||
Ford Credit Floorplan Master Owner Trust A, Ser 2015-2, | ||||||||
1.980%, 01/15/22 | 825 | 829 | ||||||
GSAMP Trust, Ser 2004-SEA2, | ||||||||
1.677%, 03/25/34 (B) | 420 | 290 | ||||||
Invitation Homes Trust, Ser 2013-SFR1, Cl A | ||||||||
1.576%, 12/17/30 (A) (B) | 365 | 357 | ||||||
John Deere Owner Trust, | ||||||||
1.650%, 12/15/21 | 205 | 206 | ||||||
Nelnet Student Loan Trust, Ser 2008-3, Cl A4 | ||||||||
2.279%, 11/25/24 (B) | 120 | 120 | ||||||
NextGear Floorplan Master Owner Trust, Ser 2015-2A, Cl A | ||||||||
2.380%, 10/15/18 (A) | 293 | 293 | ||||||
RAMP Trust, Ser 2006-RZ3, | ||||||||
0.547%, 08/25/36 (B) | 470 | 338 | ||||||
SLM Student Loan Trust, Ser 2008-4, Cl A4 | ||||||||
2.269%, 07/25/22 (B) | 110 | 109 | ||||||
| Description | Face Amount ($ Thousands) | Market Value ($ Thousands) | ||||||
SLM Student Loan Trust, Ser 2008-5, Cl A4 | ||||||||
2.319%, 07/25/23 (B) | $ | 110 | $ | 110 | ||||
Small Business Administration, Ser 2010-20B, Cl 1 | ||||||||
4.140%, 02/01/30 | 187 | 205 | ||||||
Small Business Administration, Ser 2011-20H, Cl 1 | ||||||||
3.290%, 08/01/31 | 353 | 375 | ||||||
Small Business Administration, Ser 2013-20G, Cl 1 | ||||||||
3.150%, 07/01/33 | 930 | 974 | ||||||
Small Business Administration, Ser 2014-20C, Cl 1 | ||||||||
3.210%, 03/01/34 | 1,007 | 1,067 | ||||||
Small Business Administration, Ser 2015-20E, Cl 1 | ||||||||
2.770%, 05/01/35 | 1,050 | 1,069 | ||||||
Small Business Administration, Ser 2015-20F, Cl 1 | ||||||||
2.980%, 06/01/35 | 251 | 259 | ||||||
|
| |||||||
| 8,253 | ||||||||
|
| |||||||
Total Asset-Backed Securities | 8,858 | |||||||
|
| |||||||
MUNICIPAL BONDS — 1.4% | ||||||||
Florida — 0.2% | ||||||||
Florida State Board of Administration Finance, Ser A, RB | ||||||||
2.638%, 07/01/21 | 205 | 207 | ||||||
|
| |||||||
Indiana — 0.4% | ||||||||
Indianapolis Local Public Improvement Bond Bank, Build America Bonds, Ser B-2, RB | ||||||||
6.116%, 01/15/40 | 270 | 355 | ||||||
|
| |||||||
New Jersey — 0.4% | ||||||||
New Jersey Economic Development Authority, Ser YY, RB | ||||||||
4.197%, 06/15/19 | 350 | 356 | ||||||
|
| |||||||
Wisconsin — 0.4% | ||||||||
Wisconsin State, Ser A, RB, AGM | ||||||||
5.200%, 05/01/18 | 295 | 311 | ||||||
|
| |||||||
Total Municipal Bonds | 1,229 | |||||||
|
| |||||||
| 20 | SEI Catholic Values Trust / Annual Report / February 29, 2016 |
| Description | Face Amount ($ Thousands)/ Shares | Market Value ($ Thousands) | ||||||
SOVEREIGN DEBT — 1.2% | ||||||||
Brazilian Government International Bond | ||||||||
5.625%, 01/07/41 | $ | 120 | $ | 93 | ||||
4.875%, 01/22/21 | 130 | 127 | ||||||
Indonesia Government International Bond MTN | ||||||||
3.750%, 04/25/22 | 200 | 199 | ||||||
Mexico Government International Bond MTN | ||||||||
5.550%, 01/21/45 | 200 | 208 | ||||||
Peruvian Government International Bond | ||||||||
6.550%, 03/14/37 | 10 | 12 | ||||||
5.625%, 11/18/50 | 40 | 43 | ||||||
Poland Government International Bond | ||||||||
4.000%, 01/22/24 | 110 | 118 | ||||||
Russian Foreign Bond - Eurobond | ||||||||
7.500%, 03/31/30 | 89 | 109 | ||||||
Turkey Government International Bond | ||||||||
5.625%, 03/30/21 | 150 | 160 | ||||||
|
| |||||||
Total Sovereign Debt | 1,069 | |||||||
|
| |||||||
U.S. GOVERNMENT AGENCY OBLIGATION — 0.2% |
| |||||||
Tennessee Valley Authority | ||||||||
4.250%, 09/15/65 | 178 | 187 | ||||||
|
| |||||||
Total U.S. Government Agency Obligation | 187 | |||||||
|
| |||||||
CASH EQUIVALENT — 5.2% | ||||||||
SEI Daily Income Trust, Prime Obligation Fund, Cl A | ||||||||
0.300%**† | 4,564,404 | 4,564 | ||||||
|
| |||||||
Total Cash Equivalent | 4,564 | |||||||
|
| |||||||
Total Investments — 104.5% | $ | 91,511 | ||||||
|
| |||||||
MORTGAGE-BACKED SECURITY SOLD SHORT— (0.8)% |
| |||||||
Agency Mortgage-Backed Obligations — (0.8)% |
| |||||||
FNMA TBA | ||||||||
3.500%, 03/01/40 | (700 | ) | (733 | ) | ||||
|
| |||||||
Total Mortgage-Backed Security Sold Short | $ | (733 | ) | |||||
|
| |||||||
| Description | Contracts | Market Value ($ Thousands) | ||||||
PURCHASED OPTIONS (D)* — 0.0% |
| |||||||
April 2016, U.S. 10 Year Future Option Put, Expires 03/19/16, | 4 | $ | 1 | |||||
April 2016, U.S. 10 Year Future Option Put, Expires 03/19/16, | 4 | — | ||||||
|
| |||||||
Total Purchased Options | $ | 1 | ||||||
|
| |||||||
WRITTEN OPTIONS (D)* — 0.0% |
| |||||||
April 2016, IMM Euro Dollar Future Option Call, Expires 3/19/16 | (4 | ) | $ | (1 | ) | |||
April 2016, U.S. 10 Year Future Option Put, Expires 3/19/16 | (3 | ) | (3 | ) | ||||
|
| |||||||
Total Written Options |
| $ | (4 | ) | ||||
|
| |||||||
A list of the open futures contracts held by the Fund at February 29, 2016, is as follows:
| Type of Contract | Number of Contracts Long (Short) | Expiration Date | Unrealized Appreciation (Depreciation) ($ Thousands) | |||||||||
90-Day Euro$ | 6 | Mar-2017 | $ | 6 | ||||||||
90-Day Euro$ | (31 | ) | Dec-2016 | (9 | ) | |||||||
90-Day Euro$ | (9 | ) | Dec-2017 | (11 | ) | |||||||
Euro-Bund Index | (28 | ) | Mar-2016 | 4 | ||||||||
U.S. 10-Year Treasury Note | (21 | ) | Jun-2016 | — | ||||||||
U.S. 2-Year Treasury Note | (22 | ) | Jul-2016 | 4 | ||||||||
U.S. 5-Year Treasury Note | (33 | ) | Jun-2016 | 7 | ||||||||
U.S. Long Treasury Bond | (15 | ) | Jun-2016 | 7 | ||||||||
U.S. Ultra Long Treasury Bond | 15 | Jun-2016 | (9 | ) | ||||||||
|
| |||||||||||
| $ | (1 | ) | ||||||||||
|
| |||||||||||
For the period ended February 29, 2016, the total amount of all open futures contracts, as presented in the table above, are representative of the volume of activity for this derivative type during the period.
A list of the open forward foreign currency contracts held by the Fund at February 29, 2016, is as follows:
| Settlement Date | Currency | Currency | Unrealized Appreciation (Depreciation) ($ Thousands) | |||||||||||||||||
04/12/16 | SGD | 620 | USD | 434 | $ | (7 | ) | |||||||||||||
04/12/16-05/13/16 | EUR | 1,240 | USD | 1,357 | 8 | |||||||||||||||
04/12/16 | CNY | 5,730 | USD | 858 | (13 | ) | ||||||||||||||
04/12/16 | JPY | 76,483 | USD | 651 | (28 | ) | ||||||||||||||
05/13/16 | USD | 434 | CAD | 607 | 14 | |||||||||||||||
|
| |||||||||||||||||||
| $ | (26 | ) | ||||||||||||||||||
|
| |||||||||||||||||||
| SEI Catholic Values Trust / Annual Report / February 29, 2016 | 21 |
SCHEDULE OF INVESTMENTS
Catholic Values Fixed Income Fund (Concluded)
February 29, 2016
A list of the counterparties for the open forward foreign currency contracts held by the Fund at February 29, 2016, is as follows:
| Counterparty | Currency to Deliver ($ Thousands) | Currency to Receive ($ Thousands) | Unrealized (Depreciation) ($ Thousands) | |||||||||
Bank of America | $ | (667 | ) | $ | 651 | $ | (16 | ) | ||||
Citigroup | (3,108 | ) | 3,098 | (10 | ) | |||||||
|
| |||||||||||
| $ | (26 | ) | ||||||||||
|
| |||||||||||
For the period ended February 29, 2016, the total amount of all open forward foreign currency contracts, as presented in the table above, are representative of the volume of activity for this derivative type during the period.
A list of open centrally cleared swap agreements held by the Fund at February 29, 2016, is as follows:
| Credit Default Swaps | ||||||||||||||||
| Counterparty | Reference Entity/Obligation | Buy/Sell Protection | (Pays)/Receives Rate | Termination Date | Notional Amount ($ Thousands) | Net Unrealized Depreciation ($ Thousands) | ||||||||||
| UBS Warburg | CDX.NA.HY.25 | Sell | 5.00% | 12/20/20 | $ | (610 | ) | $ | (21 | ) | ||||||
| UBS Warburg | CDX.NA.IG SER XR2OZ | Sell | 1.00% | 12/20/20 | (480 | ) | (4 | ) | ||||||||
|
| |||||||||||||||
| $ | (25 | ) | ||||||||||||||
|
| |||||||||||||||
Percentages are based on a Net Assets of $87,591 ($ Thousands).
| * | Non-income producing security. |
| ** | Rate shown is the 7-day effective yield as of February 29, 2016. |
| † | Investment in Affiliated Security (see Note 5). |
| (A) | Securities sold within terms of a private placement memorandum, exempt from registration under Section 144A of the Securities Act of 1933, as amended, and may be sold only to dealers in that program or other “accredited investors.” These securities have been determined to be liquid under guidelines established by the Board of Trustees. |
| (B) | Variable Rate Security — The rate reported on the Schedule of Investments is the rate in effect as of February 29, 2016. |
| (C) | The rate reported is the effective yield at time of purchase. |
| (D) | For the period ended February 29, 2016, the total amount of open purchased swaptions, written options and written swaptions, as presented in the Schedule of Investments, are representative of the volume of activity for these derivative types during the period. |
AGM — Assured Guaranty Municipal
ARM — Adjustable Rate Mortgage
CAD — Canadian Dollar
CL — Class
CMO — Collateralized Mortgage Obligation
CNY — Chinese Yuan
EUR — Euro
FHLMC — Federal Home Loan Mortgage Association
FNMA — Federal National Mortgage Association
GNMA — Government National Mortgage Association
IO — Interest Only — Face amount represents notional amount
JPY — Japanese Yen
MTN — Medium Term Note
RB — Revenue Bond
Re-REMIC — Resecuritization of Real Estate Mortgage Investment Conduit
REMIC — Real Estate Mortgage Investment Conduit
SER — Series
SGD — Singapore Exchange
SLM — Student Loan Marketing Association
TBA — To be announced
USD — United States Dollar
The following is a list of the inputs used as of February 29, 2016, in valuing the Fund’s investments carried at value ($ Thousands):
| Investments in Securities | Level 1 | Level 2 | Level 3 | Total | ||||||||||||
Corporate Obligations | $ | — | $ | 30,883 | $ | — | $ | 30,883 | ||||||||
Mortgage-Backed Securities | — | 26,164 | — | 26,164 | ||||||||||||
U.S. Treasury Obligations | — | 18,557 | — | 18,557 | ||||||||||||
Asset-Backed Securities | — | 8,858 | — | 8,858 | ||||||||||||
Municipal Bonds | — | 1,229 | — | 1,229 | ||||||||||||
Sovereign Debt | — | 1,069 | — | 1,069 | ||||||||||||
U.S. Government Agency Obligation | — | 187 | — | 187 | ||||||||||||
Cash Equivalent | 4,564 | — | — | 4,564 | ||||||||||||
|
|
|
|
|
|
|
| |||||||||
Total Investments in Securities | $ | 4,564 | $ | 86,947 | $ | — | $ | 91,511 | ||||||||
|
|
|
|
|
|
|
| |||||||||
| Securities Sold Short | ||||||||||||||||
Mortgage-Backed Security | $ | — | $ | (733 | ) | $ | — | $ | (733 | ) | ||||||
|
|
|
|
|
|
|
| |||||||||
Total Securities Sold Short | $ | — | $ | (733 | ) | $ | — | $ | (733 | ) | ||||||
|
|
|
|
|
|
|
| |||||||||
| Other Financial Instruments | Level 1 | Level 2 | Level 3 | Total | ||||||||||||
Purchased Options | $ | 1 | $ | — | $ | — | $ | 1 | ||||||||
Written Options | (4 | ) | — | — | (4 | ) | ||||||||||
Futures Contracts* | ||||||||||||||||
Unrealized Appreciation | 28 | — | — | 28 | ||||||||||||
Unrealized Depreciation | (29 | ) | — | — | (29 | ) | ||||||||||
Forwards Contracts* | ||||||||||||||||
Unrealized Appreciation | — | 22 | — | 22 | ||||||||||||
Unrealized Depreciation | — | (48 | ) | — | (48 | ) | ||||||||||
Centrally Cleared Swaps | ||||||||||||||||
Credit Default Swaps* | ||||||||||||||||
Unrealized Depreciation | — | (25 | ) | — | (25 | ) | ||||||||||
|
|
|
|
|
|
|
| |||||||||
Total Other Financial Instruments | $ | (4 | ) | $ | (51 | ) | $ | — | $ | (55 | ) | |||||
|
|
|
|
|
|
|
| |||||||||
| * | Futures contracts, forward contracts, and credit default swaps are valued at the unrealized appreciation/ (depreciation) on the instrument. |
For the period ended February 29, 2016, there were no transfers between Level 1 and Level 2 assets and liabilities. For the period ended February 29, 2016, there were no transfers from Level 2 into Level 3 assets and liabilities.
For the period ended February 29, 2016, there were no Level 3 investments.
Amounts designated as “—” are $0.
The accompanying notes are an integral part of the financial statements.
| 22 | SEI Catholic Values Trust / Annual Report / February 29, 2016 |
Statements of Assets and Liabilities ($ Thousands)
February 29, 2016
| Catholic Values Equity Fund | Catholic Values Fixed Income Fund | |||||||
Assets: | ||||||||
Investments, at value† | $ | 147,261 | $ | 86,947 | ||||
Affiliated investments, at value†† | 3,010 | 4,564 | ||||||
Cash | 1,172 | 98 | ||||||
Cash collateral on futures | — | 120 | ||||||
Cash collateral on swap contracts | — | 42 | ||||||
Foreign currency, at value††† | 19 | — | ||||||
Receivable for fund shares sold | — | 172 | ||||||
Receivable for investment securities sold | 345 | 1,900 | ||||||
Dividends and Interest receivable | 265 | 372 | ||||||
Unrealized appreciation on forward foreign currency contracts | — | 22 | ||||||
Options purchased, at value†††† | — | 1 | ||||||
Receivable for variation margin on futures contracts | — | 4 | ||||||
Receivable for variation margin on swap contracts | — | 3 | ||||||
Deferred offering costs | 29 | 6 | ||||||
Prepaid expenses | 26 | 14 | ||||||
Total Assets | 152,127 | 94,265 | ||||||
Liabilities: | ||||||||
Payable for investment securities purchased | 86 | 5,792 | ||||||
Payable for Securities Sold Short@ | — | 733 | ||||||
Payable for fund shares redeemed | 1 | 2 | ||||||
Options written, at value# | — | 4 | ||||||
Payable for variation margin on futures contracts | 11 | 12 | ||||||
Administration fees payable | 35 | 14 | ||||||
Shareholder servicing fees payable, Class A | 10 | 6 | ||||||
Unrealized depreciation on forward foreign currency contracts | — | 48 | ||||||
Investment advisory fees payable | 34 | 17 | ||||||
Accrued expense payable | 78 | 46 | ||||||
Total Liabilities | 255 | 6,674 | ||||||
Net Assets | $ | 151,872 | $ | 87,591 | ||||
†Cost of investments | $ | 162,180 | $ | 87,296 | ||||
††Cost of affiliated investments | 3,010 | 4,564 | ||||||
†††Cost of foreign currency | 20 | — | ||||||
††††Cost of purchased options | — | 4 | ||||||
@ Proceeds from securities sold short | — | 731 | ||||||
#Premiums received on written options | — | 3 | ||||||
NET ASSETS: | ||||||||
Paid-in Capital — (unlimited authorization — no par value) | $ | 177,063 | $ | 88,574 | ||||
Undistributed net investment income | 151 | 95 | ||||||
Accumulated net realized loss on investments, securities sold short, option contracts, futures, swap contracts and foreign currency | (10,460 | ) | (671 | ) | ||||
Net unrealized depreciation on investments and securities sold short | (14,919 | ) | (351 | ) | ||||
Net unrealized depreciation on options | — | (4 | ) | |||||
Net unrealized appreciation (depreciation) on futures contracts | 38 | (1 | ) | |||||
Net unrealized depreciation on forward foreign currency contracts, foreign currencies and translation of other assets and liabilities denominated in foreign currencies | (1 | ) | (26 | ) | ||||
Net unrealized depreciation on swap contracts | — | (25 | ) | |||||
Net Assets | $ | 151,872 | $ | 87,591 | ||||
Net Asset Value, Offering and Redemption Price Per Share — Class A | $8.57 | $9.89 | ||||||
|
| ($142,563,788 ÷ 16,643,708 shares | ) |
| ($86,405,848 ÷ 8,741,039 shares | ) | |||
Net Asset Value, Offering and Redemption Price Per Share — Class Y | $8.56 | $9.89 | ||||||
|
| ($9,308,148 ÷ 1,086,951 shares | ) |
| ($1,185,157 ÷ 119,813 shares | ) | |||
Amounts designated as “—” are $0 or have been rounded to $0.
The accompanying notes are an integral part of the financial statements.
| SEI Catholic Values Trust / Annual Report / February 29, 2016 | 23 |
Statements of Operations ($ Thousands)
For the period ended February 29, 2016
| Catholic Values Equity Fund* | Catholic Values Fixed Income Fund* | |||||||
Investment Income: | ||||||||
Dividends | $ | 2,571 | $ | — | ||||
Dividends from Affiliated Registered Investment Company(1) | 2 | 4 | ||||||
Interest Income | 1 | 1,804 | ||||||
Less: Foreign Taxes Withheld | (65 | ) | — | |||||
Total Investment Income | 2,509 | 1,808 | ||||||
Expenses: | ||||||||
Investment Advisory Fees | 827 | 254 | ||||||
Administration Fees | 413 | 218 | ||||||
Shareholder Servicing Fees, Class A Shares | 325 | 179 | ||||||
Deferred offering costs(2) | 87 | 54 | ||||||
Professional Fees | 63 | 38 | ||||||
Registration Fees | 22 | 13 | ||||||
Printing Fees | 15 | 9 | ||||||
Custodian/Wire Agent Fees | 14 | 13 | ||||||
Trustees’ Fees | 2 | 1 | ||||||
Other Expenses | 23 | 11 | ||||||
Total Expenses | 1,791 | 790 | ||||||
Less: | ||||||||
Waiver of investment advisory fees | (417 | ) | (93 | ) | ||||
Waiver of shareholder servicing fees, Class A Shares | (195 | ) | (108 | ) | ||||
Waiver of administration fees | — | (73 | ) | |||||
Net Expenses | 1,179 | 516 | ||||||
Net Investment Income | 1,330 | 1,292 | ||||||
Net Realized and Unrealized Gain (Loss) on Investments: | ||||||||
Net Realized Gain (Loss) on: | ||||||||
Investments | (10,745 | ) | (461 | ) | ||||
Securities Sold Short | — | 13 | ||||||
Futures Contracts | 258 | (89 | ) | |||||
Foreign Currency Transactions | 24 | 39 | ||||||
Purchased and Written Options | — | 12 | ||||||
Swap Contracts | — | 11 | ||||||
Net Change in Unrealized Appreciation (Depreciation) on: | ||||||||
Investments | (14,919 | ) | (349 | ) | ||||
Securities Sold Short | — | (2 | ) | |||||
Futures Contracts | 38 | (1 | ) | |||||
Purchased and Written Options | — | (4 | ) | |||||
Swap Contracts | — | (25 | ) | |||||
Foreign Currency and Translation of Other Assets and Liabilities Denominated in Foreign Currencies | (1 | ) | (26 | ) | ||||
Net Increase (Decrease) in Net Assets Resulting from Operations | $ | (24,015 | ) | $ | 410 | |||
| * | Funds commenced operations on April 30, 2015. |
| (1) | See Note 5 in the Notes to the Financial Statements. |
| (2) | See Note 2 in the Notes to Financial Statements. |
Amounts designated as “—” are $0 or have been rounded to $0.
The accompanying notes are an integral part of the financial statements.
| 24 | SEI Catholic Values Trust / Annual Report / February 29, 2016 |
Statements of Changes in Net Assets ($ Thousands)
For the period ended February 29, 2016
| Catholic Values Equity Fund* | Catholic Values Fixed Income Fund* | |||||||
| 2016 | 2016 | |||||||
Operations: | ||||||||
Net Investment Income | $ | 1,330 | $ | 1,292 | ||||
Net Realized Loss on Investments, Securities Sold Short, Futures Contracts, Purchased and Written Options and Swap Contracts | (10,487 | ) | (514 | ) | ||||
Net Realized Gain on Foreign Currency Transactions | 24 | 39 | ||||||
Net Change in Unrealized Depreciation on Investments, Securities Sold Short, Futures Contracts, Purchased and Written Options and Swap Contracts | (14,881 | ) | (381 | ) | ||||
Net Change in Unrealized Appreciation (Depreciation) on Foreign Currency and Translation of Other Assets and Liabilities Denominated in Foreign Currencies | (1 | ) | (26 | ) | ||||
Net Increase (Decrease) in Net Assets Resulting from Operations | (24,015 | ) | 410 | |||||
Dividends and Distributions to Shareholders: | ||||||||
Net Investment Income: | ||||||||
Class A | (1,169 | ) | (1,424 | ) | ||||
Class Y | (86 | ) | (19 | ) | ||||
Total Dividends and Distributions | (1,255 | ) | (1,443 | ) | ||||
Capital Share Transactions: | ||||||||
Class A*: | ||||||||
Proceeds from Shares Issued | 176,363 | 97,064 | ||||||
Reinvestment of Dividends & Distributions | 1,169 | 1,425 | ||||||
Cost of Shares Redeemed | (11,279 | ) | (11,158 | ) | ||||
Net Increase in Net Assets from Class A Transactions | 166,253 | 87,331 | ||||||
Class Y†: | ||||||||
Proceeds from Shares Issued | 11,675 | 1,219 | ||||||
Reinvestment of Dividends & Distributions | 86 | 19 | ||||||
Cost of Shares Redeemed | (872 | ) | (45 | ) | ||||
Net Increase in Net Assets from Class Y Transactions | 10,889 | 1,193 | ||||||
Net Increase in Net Assets Derived from Capital Share Transactions | 177,142 | 88,524 | ||||||
Net Increase in Net Assets | 151,872 | 87,491 | ||||||
Net Assets: | ||||||||
Beginning of Period | — | 100 | (1) | |||||
End of Period | $ | 151,872 | $ | 87,591 | ||||
Undistributed Net Investment Income | $ | 151 | $ | 95 | ||||
Capital Share Transactions: | ||||||||
Class A*: | ||||||||
Shares Issued | 17,727 | 9,720 | ||||||
Shares Issued in Lieu of Dividends & Distributions | 125 | 145 | ||||||
Shares Redeemed | (1,208 | ) | (1,134 | ) | ||||
Net Increase in Class A Shares Outstanding from Share Transactions | 16,644 | 8,731 | ||||||
Capital Share Transactions: | ||||||||
Class Y†: | ||||||||
Shares Issued | 1,172 | 123 | ||||||
Shares Issued in Lieu of Dividends & Distributions | 9 | 2 | ||||||
Shares Redeemed | (94 | ) | (5 | ) | ||||
Net Increase in Class Y Shares Outstanding from Share Transactions | 1,087 | 120 | ||||||
| * | Fund and Class A commenced operations on April 30, 2015. |
| † | Class Y commenced operations May 31, 2015. |
| (1) | Seed money received on March 5, 2015. |
Amounts designated as “—” are $0 or have been rounded to $0.
The accompanying notes are an integral part of the financial statements.
| SEI Catholic Values Trust / Annual Report / February 29, 2016 | 25 |
For the period ended, February 29, 2016, For a share outstanding throughout the period
| Net Asset Value, Beginning of Period | Net Investment Income(1) | Net Realized and Unrealized Gains (Losses) on Investments (1) | Total from Opera tions | Dividends from Net Investment Income | Distri butions from Net Realized Gains | Total Dividends and Distributions | Net End of | Total Return† | Net End of Year | Ratio of Net Expenses to Average Net Assets | Ratio of Expenses to Average Net Assets (Excluding Waivers) | Ratio of Net Investment | Portfolio Turnover Rate† | |||||||||||||||||||||||||||||||||||||||||||
Catholic Values Equity Fund |
| |||||||||||||||||||||||||||||||||||||||||||||||||||||||
Class A |
| |||||||||||||||||||||||||||||||||||||||||||||||||||||||
2016(2) | $ | 10.00 | $ | 0.08 | $ | (1.44 | ) | $ | (1.36 | ) | $ | (0.07 | ) | $ | — | $ | (0.07 | ) | $ | 8.57 | (13.66 | )% | $ | 142,564 | 0.86 | % | 1.32 | % | 0.96 | % | 84 | % | ||||||||||||||||||||||||
Class Y | ||||||||||||||||||||||||||||||||||||||||||||||||||||||||
2016(3) | $ | 10.04 | $ | 0.07 | $ | (1.47 | ) | $ | (1.40 | ) | $ | (0.08 | ) | $ | — | $ | (0.08 | ) | $ | 8.56 | (14.05 | )% | $ | 9,308 | 0.76 | % | 1.07 | % | 1.01 | % | 84 | % | ||||||||||||||||||||||||
Catholic Values Fixed Income Fund |
| |||||||||||||||||||||||||||||||||||||||||||||||||||||||
Class A |
| |||||||||||||||||||||||||||||||||||||||||||||||||||||||
2016(2) | $ | 10.00 | $ | 0.14 | $ | (0.09 | ) | $ | 0.05 | $ | (0.16 | ) | $ | — | $ | (0.16 | ) | $ | 9.89 | 0.54 | % | $ | 86,406 | 0.71 | % | 1.09 | % | 1.77 | % | 216 | % | |||||||||||||||||||||||||
Class Y | ||||||||||||||||||||||||||||||||||||||||||||||||||||||||
2016(3) | $ | 9.95 | $ | 0.14 | $ | (0.04 | ) | $ | 0.10 | $ | (0.16 | ) | $ | — | $ | (0.16 | ) | $ | 9.89 | 1.00 | % | $ | 1,185 | 0.61 | % | 0.84 | % | 1.97 | % | 216 | % | |||||||||||||||||||||||||
| † | Total Returns and portfolio turnover rates are for the period indicated and have not been annualized. Total Returns do not reflect the deduction of taxes the shareholder would pay on fund distributions or redemption of fund shares. |
| (1) | Per share net investment income and net realized and unrealized gains (losses) calculated using average shares. |
| (2) | Commenced operations on April 30, 2015. All ratios for the period have been annualized. |
| (3) | Commenced operations on May 31, 2015. All ratios for the period have been annualized. |
Amounts designated as “—” are either $0 or have been rounded to $0.
The accompanying notes are an integral part of the financial statements.
| 26 | SEI Catholic Values Trust / Annual Report / February 29, 2016 |
February 29, 2016
1. ORGANIZATION
SEI Catholic Values Trust (the “Trust”) is organized as a Delaware statutory trust under a Declaration of Trust dated December 8, 2014.
The Trust is registered under the Investment Company Act of 1940, as amended, as a diversified, open-end investment company with two operational Funds: Catholic Values Equity Fund (“Equity Fund”) and Catholic Values Fixed Income Fund (“Fixed Income Fund”) (each a “Fund,” collectively, the “Funds”), both of which are diversified Funds. The Trust is registered to offer: Class A and Class Y shares of the Funds. The assets of each Fund are segregated, and a shareholder’s interest is limited to the Fund in which shares are held. The Funds’ prospectuses provide a description of each Fund’s investment objective and strategies.
In addition to its objective and strategies, each of the Funds makes investment decisions consistent with Catholic values on a range of social and moral concerns that may include: protecting human life; promoting human dignity; reducing arms production; pursuing economic justice; protecting the environment, and encouraging corporate responsibility. Potential investments for the Funds are first selected for financial soundness and then evaluated according to the Funds’ social criteria. The Adviser has engaged an independent compliance support organization that has identified a list of issuers that do not align with Catholic values. The Funds will not invest in issuers identified through this process. The Adviser reserves the right to modify the criteria from time to time to maintain alignment with evolving Catholic social and moral positions.
2. SIGNIFICANT ACCOUNTING POLICIES
The following is a summary of significant accounting policies consistently followed by the Funds.
Use of Estimates — The preparation of financial statements, in conformity with U.S. generally accepted accounting principles (“U.S. GAAP”), requires management to make estimates and assumptions that affect the reported amount of assets and liabilities and disclosure of contingent assets and liabilities at the date of the financial statements and the reported amounts of increases and decreases in net assets from operations during the reporting period. Actual results could differ from those estimates.
Security Valuation — Securities listed on a securities exchange, market or automated quotation system for which quotations are readily available are valued at the last quoted sale price on the primary exchange or market (foreign or domestic) on which they are traded, or, if there is no such reported sale, at the most recent quoted bid price. Debt securities are priced based upon valuations provided by independent, third-party pricing agents, if available. Such values generally reflect the last reported sales price if the security is actively traded. The third-party pricing agents may also value debt securities at an evaluated bid price by employing methodologies that utilize actual market transactions, broker-supplied valuations, or other
methodologies designed to identify the market value for such securities. Debt obligations with remaining maturities of sixty days or less may be valued at their amortized cost, which approximates market value. The prices for foreign securities are reported in local currency and converted to U.S. dollars using currency exchange rates. Prices for most securities held in the Funds are provided daily by recognized independent pricing agents. SEI Investments Management Corporation (“SIMC”) or a sub-adviser, as applicable, reasonably believes that prices provided by independent pricing agents are reliable. However, there can be no assurance that such pricing service’s prices will be reliable. SIMC or a sub-adviser, as applicable, continuously monitors the reliability of prices obtained from any pricing service and will notify the Funds’ administrator if it believes that a particular pricing service is no longer a reliable source of prices. The Funds’ administrator, in turn, will notify the Trust’s Fair Value Committee if it receives such notification from SIMC or a sub-adviser, as applicable, or if the Funds’ administrator reasonably believes that a particular pricing service is no longer a reliable source for prices. If a security price cannot be obtained from an independent, third-party pricing agent, the Funds seek to obtain a bid price from at least one independent broker.
Securities for which market prices are not “readily available” are valued in accordance with Fair Value Procedures established by the Trust’s Board of Trustees. The Trust’s Fair Value Procedures are implemented through a Fair Value Committee (the “Committee”) designated by the Funds’ Board of Trustees. Some of the more common reasons that may necessitate that a security be valued using Fair Value Procedures include: the security’s trading has been halted or suspended; the security has been delisted from a national exchange; the security’s primary trading market is temporarily closed at a time when under normal conditions it would be open; or the security’s primary pricing source is not able or willing to provide a price. When a security is valued in accordance with the Fair Value Procedures, the Committee will determine the value after taking into consideration relevant information reasonably available to the Committee. As of February 29, 2016, there were no fair valued securities held by the Funds.
For securities that principally trade on a foreign market or exchange, a significant gap in time can exist between the time of a particular security’s last trade and the time at which a Fund calculates its net asset value. The closing prices of such securities may no longer reflect their market value at the time the Fund calculates net asset value if an event that could materially affect the value of those securities (a “Significant Event”) has occurred between the time of the security’s last close and the time that the Fund calculates net asset value. A Significant Event may relate to a single issuer or to an entire market sector. If the adviser or sub-adviser of a Fund becomes aware of a Significant Event that has occurred with respect to a security or group of securities after the closing of the exchange or market on which the security or securities principally trade, but before the time at which the Fund calculates net asset value, it may request that a Committee meeting be called.
| SEI Catholic Values Trust / Annual Report / February 29, 2016 | 27 |
Notes to Financial Statements (Continued)
February 29, 2016
Options for which the primary market is a national securities exchange are valued at the last sale price on the exchange on which they are traded, or, in the absence of any sale, at the closing bid price. Options not traded on a national securities exchange are valued at the last quoted bid price.
In accordance with U.S. GAAP, fair value is defined as the price that a Fund would receive upon selling an investment in an orderly transaction to an independent buyer in the principal or most advantageous market of the investment. A three-tier hierarchy has been established to maximize the use of observable and minimize the use of unobservable inputs and to establish classification of fair value measurements for disclosure purposes. Inputs refer broadly to the assumptions that market participants would use in pricing an asset. Inputs may be observable or unobservable. Observable inputs are inputs that reflect the assumptions market participants would use in pricing the asset or liability based on market data obtained from sources independent of the reporting entity. Unobservable inputs are inputs that reflect the reporting entity’s own assumptions about the assumptions market participants would use in pricing the asset or liability based on the best information available in the circumstances.
The three-tier hierarchy of inputs is summarized in the three broad Levels listed below:
Level 1 — Unadjusted quoted prices in active markets for identical, unrestricted assets or liabilities that the Fund has the ability to access at the measurement date;
Level 2 — Quoted prices which are not active, or inputs that are observable (either directly or indirectly) for substantially the full term of the asset or liability; and
Level 3 — Prices, inputs or exotic modeling techniques which are both significant to the fair value measurement and unobservable (supported by little or no market activity).
The valuation techniques used by the Funds to measure fair value during the period ended February 29, 2016 maximized the use of observable inputs and minimized the use of unobservable inputs.
For the period ended February 29, 2016, there have been no significant changes to the Trust’s fair valuation methodologies. For details of the investment classifications reference the Schedules of Investments.
Security Transactions and Investment Income — Security transactions are recorded on the trade date. Costs used in determining net realized capital gains and losses on the sale of securities are on the basis of specific identification. Dividend income is recognized on the ex-dividend date, and interest income is recognized using the accrual basis of accounting. Income from payment-in-kind securities is recorded daily based on the effective interest method of accrual.
Distributions received on securities that represent a return of capital or capital gains are recorded as a reduction of cost of investments
and/or as a realized gain. The Trust estimates the components of distributions received that may be considered nontaxable distributions or capital gain distributions.
Amortization and accretion is calculated using the scientific interest method, which approximates the effective interest method over the holding period of the security, which is not materially different from the effective interest method. Amortization of premiums and discounts is included in interest income.
Foreign Currency Translation — The books and records of the Funds investing in international securities are maintained in U.S. dollars on the following basis:
(i) market value of investment securities, assets and liabilities at the current rate of exchange; and
(ii) purchases and sales of investment securities, income and expenses at the relevant rates of exchange prevailing on the respective dates of such transactions.
The Funds do not isolate that portion of gains and losses on investments in equity securities that is due to changes in the foreign exchange rates from that which is due to changes in market prices of equity securities.
The Funds report certain foreign-currency-related transactions as components of realized gains for financial reporting purposes, whereas such components are treated as ordinary income for Federal income tax purposes.
Futures Contracts — To the extent consistent with its Investment Objective and Strategies, a Fund may use futures contracts for tactical hedging purposes as well as to enhance the Fund’s returns. In addition, fixed income funds will utilize futures contracts to help manage duration and yield curve exposure. These Funds’ investments in futures contracts are designed to enable the Funds to more closely approximate the performance of their benchmark indices. Initial margin deposits of cash or securities are made upon entering into futures contracts. The contracts are market-to-market daily and the resulting changes in value are accounted for as unrealized gains and losses. Variation margin payments are paid or received, depending upon whether unrealized gains or losses are incurred. When contracts are closed, the Funds record a realized gain or loss equal to the difference between the proceeds from (or cost of) the closing transaction and the amount invested in the contract.
Risks of entering into futures contracts include the possibility that there will be an imperfect price correlation between the futures and the underlying securities. Second, it is possible that a lack of liquidity for futures contracts could exist in the secondary market, resulting in an inability to close a position prior to its maturity date. Third, futures contracts involve the risk that a Fund could lose more than the original margin deposit required to initiate a futures transaction.
| 28 | SEI Catholic Values Trust / Annual Report / February 29, 2016 |
Finally, the risk exists that losses could exceed amounts disclosed on the Statements of Assets and Liabilities.
It is the Funds’ policy to present the gross variation margin payable and the gross variation margin receivable of the future contracts separately on the Statement of Assets and Liabilities as the Funds do not have a master netting agreement with the counter party to the future contracts.
Refer to each Fund’s Schedule of Investments for details regarding open futures contracts as of February 29, 2016, if applicable.
Inflation-Indexed Bonds — Inflation-indexed bonds are fixed income securities whose principal value is periodically adjusted according to the rate of inflation. If the index measuring inflation rises or falls, the principal value of inflation-indexed bonds will be adjusted upward or downward, and consequently the interest payable on these securities (calculated with respect to a larger or smaller principal amount) will be increased or reduced, respectively. Any upward or downward adjustment in the principal amount of an inflation-indexed bond will be included in interest income in the Statement of Operations, even though investors do not receive their principal until maturity. Repayment of the original bond principal upon maturity (as adjusted for inflation) is guaranteed in the case of U.S. Treasury inflation-indexed bonds. For bonds that do not provide a similar guarantee, the adjusted principal value of the bond repaid at maturity may be less than the original principal.
Options Written/Purchased — To the extent consistent with its investment objective and strategies, a Fund may invest in financial options contracts to add return or to hedge their existing portfolio securities. When the Fund writes or purchases an option, an amount equal to the premium received or paid by the Fund is recorded as a liability or an asset and is subsequently adjusted to the current market value of the option written or purchased. Premiums received or paid from purchasing or writing options which expire unexercised are treated by the Fund on the expiration date as realized gains or losses. The difference between the premium and the amount paid or received on effecting a closing purchase or sale transaction, including brokerage commissions, is also treated as a realized gain or loss. If an option is exercised, the premium paid or received is added to the cost of the purchase or proceeds from the sale in determining whether the Fund has realized a gain or a loss. The risk in writing a call option is that the Fund gives up the opportunity for profit if the market price of the security increases. The risk in writing a put option is that the Fund may incur a loss if the market price of the security decreases and the option is exercised. The risk in purchasing an option is that the Fund pays a premium whether or not the option is exercised. The Fund also has the additional risk of being unable to enter into a closing transaction at an acceptable price if a liquid secondary market does not exist. Option contracts also involve the risk that they may not work as intended due to unanticipated developments in market conditions or other causes.
The cost of purchased options and the premiums received for written options that are presented in the Schedule of Investments are representative of the volume of activity during the period ended February 29, 2016. In connection with option agreement securities may be set aside as collateral by a Fund’s custodian.
Written options transactions entered into during the period ended February 29, 2016 are summarized as follows:
| Fixed Income Fund(1) | ||||||||
| Number of Contracts | Premiums ($ Thousands) | |||||||
| Balance at beginning of period | — | $ | — | |||||
| Written | 441 | 179 | ||||||
| Expired | (264 | ) | (100 | ) | ||||
| Closing Buys | (170 | ) | (76 | ) | ||||
| Balance at end of period | 7 | $ | 3 | |||||
| (1) | Fund commenced operations on April 30, 2015. |
Finally, the risk exists that losses on written options could exceed amounts disclosed on the Statements of Assets and Liabilities. Refer to each Fund’s Schedule of Investments for details regarding open options contracts as of February 29, 2016, if applicable.
Securities Sold Short — To the extent consistent with its Investment Objective and Strategies, a Fund may engage in short sales. Short sales are transactions under which a Fund sells a security it does not own. To complete such a transaction, the Fund must borrow the security to make delivery to the buyer. A Fund then is obligated to replace the security borrowed by purchasing the security at the market price at the time of the replacement. The price at such time may be more or less than the price at which the security was sold by a Fund. Until the security is replaced, a Fund is required to pay the lender amounts equal to any dividends or interest that accrue during the period of the loan. Dividends and interest are shown as an expense for financial reporting purposes. To borrow the security, a Fund also may be required to pay a premium, which would decrease proceeds of the security sold. The proceeds of the short sale are retained by the broker, to the extent necessary to meet margin requirements, until the short position is closed out. A gain, limited to the price at which a Fund sold the security short, or a loss, unlimited in size, will be recognized upon the close of a short sale.
Refer to each Fund’s Schedule of Investments for details regarding securities sold short as of February 29, 2016, if applicable.
Swap Agreements — To the extent consistent with its Investment Objective and Strategies, a Fund may invest in swap contracts as an efficient means to synthetically obtain exposure to securities or baskets of securities and to manage a Fund’s interest rate duration and yield curve exposure. Swap contracts may also be used to mitigate a Fund’s overall level of risk and/or a Fund’s risk to particular types of securities, currencies or market segments. Interest rate swaps may further be used to manage a Fund’s yield spread sensitivity. A Fund may buy credit default swaps in an attempt to manage credit risk
| SEI Catholic Values Trust / Annual Report / February 29, 2016 | 29 |
Notes to Financial Statements (Continued)
February 29, 2016
where a Fund has credit exposure to an issuer, and a Fund may sell credit default swaps to more efficiently gain credit exposure to a security or basket of securities. A swap agreement is a two-party contract under which an agreement is made to exchange returns from predetermined investments or instruments, including a particular interest rate, foreign currency, or “basket” of securities representing a particular index. Swap agreements are privately negotiated in the over-the-counter market (“OTC swaps”) or may be executed in a multilateral or other trade facility platform, such as a registered commodities exchange (“Centrally Cleared swaps”). Interest rate swaps involve the exchange by a Fund with another party of their respective commitments to pay or receive interest (e.g., an exchange of floating rate payments for fixed rate payments) with respect to a notional amount of principal. Credit default swaps involve periodic payments by a Fund or counterparty based on a specified rate multiplied by a notional amount assigned to an underlying debt instrument or group of debt instruments in exchange for the assumption of credit risk on the same instruments. In the event of a credit event, usually in the form of a credit rating downgrade, the party receiving periodic payments (i.e. floating rate payer) must pay the other party (i.e. fixed rate payer) an amount equal to the recovery rate used to settle the contracts. The recovery rate is a function of how many credit default swap investors wish to deliver the security or receive the security. The recovery rate is determined through an auction process. Total return swaps allow an investor to benefit from the cash flow without ever actually owning the underlying security. The receiver must pay any decline in value to the payer at the end of the total return swap. However, the investor does not need to make a payment if there is no decline in price. Payments can be made on various indices, bonds (i.e. mortgage backed securities, bank debt and corporate), loans or commodities. The value of a total return swap is equal to the change in value of the underlying asset versus the accrued income payment based on LIBOR or some other form of indices on the notional amount. Payments received or made are recorded as realized gains or loss. A Fund could be exposed to credit or market risk due to unfavorable changes in the fluctuation of interest rates or if the counterparty defaults on its obligation to perform. Risk of loss may exceed amounts recognized on the statement of assets and liabilities. Interest rate swap contracts outstanding at period end, if any, are listed after a Fund’s portfolio. In connection with swap agreements securities may be set aside as collateral by a Fund’s custodian.
Swaps are market-to-market daily based upon quotations from market makers and the resulting changes in market values, if any, are recorded as an unrealized gain or loss in the Statement of Operations. Centrally Cleared swaps are valued at the settlement price established each day by the board on exchange on which they are traded. The daily settlement prices for centrally cleared swaps are provided by an independent source. Net payments of interest are recorded as realized gains or losses. Daily changes in valuation of Centrally Cleared swaps, if any, are recorded as a receivable or payable for the change in value as appropriate (“variation margin”) on the Statements of Assets and Liabilities.
Entering into swap agreements involves, to varying degrees, elements of credit and market risk in excess of the amounts recognized on the Statement of Assets and Liabilities. Such risks involve the possibility that there will be no liquid market for these agreements, that the counterparty to the agreement may default on its obligation to perform and that there may be unfavorable changes in the fluctuation of interest rates. Risks also arise from potential losses from adverse market movements.
It is the Funds’ policy to present the gross variation margin payable and the gross variation margin receivable of the swap contracts separately on the Statement of Assets and Liabilities as the Funds do not have a master netting agreement with the counter party to the swap contracts. See Note 3 for further details. Refer to each Fund’s Schedule of Investments, for details regarding open swap agreements as of February 29, 2016, if applicable.
Delayed Delivery Transactions — To the extent consistent with its Investment Objective and Strategies, a Fund may purchase or sell securities on a when-issued or delayed delivery basis. These transactions involve a commitment by the Fund to purchase or sell securities for a predetermined price or yield, with payment and delivery taking place beyond the customary settlement period. When delayed delivery purchases are outstanding, the Fund will set aside liquid assets in an amount sufficient to meet the purchase price. When purchasing a security on a delayed delivery basis, the Fund assumes the rights and risks of ownership of the security, including the risk of price and yield fluctuations, and takes such fluctuations into account when determining its net asset value. The Fund may dispose of or renegotiate a delayed delivery transaction after it is entered into, and may sell when-issued securities before they are delivered, which may result in a capital gain or loss. When the Fund has sold a security on a delayed delivery basis, the Fund does not participate in future gains and losses with respect to the security.
Collateralized Debt Obligations — To the extent consistent with its Investment Objective and Strategies, a Fund may invest in collateralized debt obligations (“CDOs”), which include collateralized loan obligations (“CLOs”) and other similarly structured securities. CLOs are a type of asset-backed securities. A CLO is a trust typically collateralized by a pool of loans, which may include, among others, domestic and foreign senior secured loans, senior unsecured loans, and subordinate corporate loans, including loans that may be rated below investment grade or equivalent unrated loans. CDOs may charge management fees and administrative expenses.
For CDOs, the cash flows from the trust are split into two or more portions, called tranches, varying in risk and yield. The riskiest portion is the “equity” tranche which bears the bulk of defaults from the bonds or loans in the trust and serves to protect the other, more senior tranches from default in all but the most severe circumstances. Since it is partially protected from defaults, a senior tranche from a CDO trust typically has a higher rating and lower yield than its underlying securities, and can be rated investment grade. Despite the protection
| 30 | SEI Catholic Values Trust / Annual Report / February 29, 2016 |
from the equity tranche, CDO tranches can experience substantial losses due to actual defaults, increased sensitivity to defaults due to collateral default and disappearance of protecting tranches, market anticipation of defaults, as well as aversion to CDO securities as a class.
The risks of an investment in a CDO depend largely on its Class and its collateral securities. Normally, CLOs and other CDOs are privately offered and sold, and thus, are not registered under the securities laws. As a result, investments in CDOs may be characterized by the Funds as illiquid securities; however, an active dealer market may exist for CDOs, allowing a CDO to qualify for Rule 144A transactions. In addition to the normal risks associated with fixed income securities (e.g., interest rate risk and default risk), CDOs carry additional risks including, but not limited to: (i) the possibility that distributions from collateral securities will not be adequate to make interest or other payments; (ii) the quality of the collateral may decline in value or default; (iii) the Funds may invest in CDOs that are subordinate to other classes; and (iv) the complex structure of the security may not be fully understood at the time of investment and may produce disputes with the issuer or unexpected investment results.
Illiquid Securities — A security is considered illiquid if it cannot be sold or disposed of in the ordinary course of business within seven days or less for its approximate carrying value on the books of a Fund. Valuations of illiquid securities may differ significantly from the values that would have been used had an active market value for these securities existed.
Restricted Securities — Throughout the year, the Funds owned private placement investments that were purchased through private offerings or acquired through initial public offerings that could not be sold without prior registration under the Securities Act of 1933 or pursuant to an exemption there from. In addition, the Funds had generally agreed to further restrictions on the disposition of certain holdings as set forth in various agreements entered into in connection with the purchase of those investments. These investments were valued at amortized cost, which approximates fair value, as determined in accordance with the procedures approved by the Board of Trustees. At February 29, 2016, the Funds did not own any restricted securities.
Classes — Class-specific expenses are borne by that class of shares. Income, expenses, and realized and unrealized gains/losses and non- class-specific expenses are allocated to the respective class on the basis of relative daily net assets.
Expenses — Expenses that are directly related to one of the Funds are charged directly to that Fund. Other operating expenses of the Funds are prorated to the Funds on the basis of relative net assets.
Dividends and Distributions to Shareholders — The Equity Fund will distribute its net investment income annually. The Fixed Income Fund declares its net investment income daily and distributes monthly. The Funds make distributions of capital gains, if any, at least annually.
Investments in Real Estate Investment Trusts (“REITs”) — Dividend income is recorded based on the income included in distributions received from the REIT investments using published REIT reclassifications including management estimates when actual amounts are not available. Distributions received in excess of this estimated amount are recorded as a reduction of the cost of investments or reclassified to capital gains. The actual amounts of income, return of capital, and capital gains are only determined by each REIT after its fiscal year-end, and may differ from the estimated amounts.
Offering Costs — The Funds’ offering costs, which include typesetting and prospectus printing, and preparation of the initial registration statement, are being amortized over a twelve-month period from inception and can be found on the Statement of Operations.
3. CREDIT DERIVATIVES
A Fund may use credit default swaps to reduce risk where a Fund has exposure to the issuer, or to take an active long or short position with respect to the likelihood of an event of default. The reference obligation of the swap can be a single issuer, a “basket” of issuers, or an index. The underlying referenced assets are corporate debt, sovereign debt and asset backed securities.
The buyer of a credit default swap is generally obligated to pay the seller a periodic stream of payments over the term of the contract in return for a contingent payment upon the occurrence of a credit event with respect to an underlying reference obligation. Generally, a credit event for corporate or sovereign reference obligations means bankruptcy, failure to pay, obligation acceleration, repudiation/moratorium or restructuring. For credit default swaps on asset-backed securities, credit event may be triggered by events such as failure to pay principal, maturity extension, rating downgrade or write-down.
If a Fund is a seller of protection, and a credit event occurs, as defined under the terms of that particular swap agreement, a Fund will generally either (i) pay to the buyer an amount equal to the notional amount of the swap and take delivery of the referenced obligation, other deliverable obligations, or underlying securities comprising a referenced index or (ii) pay a net settlement amount in the form of cash or securities equal to the notional amount of the swap less the recovery value of the referenced obligation or underlying securities comprising a referenced index.
If a Fund is a buyer of protection and a credit event occurs, as defined under the terms of that particular swap agreement, a Fund will either (i) receive from the seller of protection an amount equal to the notional amount of the swap and deliver the referenced obligation, other deliverable obligations or underlying securities comprising the referenced index or (ii) receive a net settlement amount in the form of cash or securities equal to the notional amount of the swap less the recovery value of the referenced obligation or underlying securities comprising the referenced index. Recovery values are assumed by market makers considering either industry standard recovery rates or
| SEI Catholic Values Trust / Annual Report / February 29, 2016 | 31 |
Notes to Financial Statements (Continued)
February 29, 2016
entity specific factors and considerations until a credit event occurs. If a credit event has occurred, the recovery value is determined by a facilitated auction whereby a minimum number of allowable broker bids, together with a specified valuation method, are used to calculate the settlement value.
As of February 29, 2016, the Fixed Income Fund is the seller (“providing protection”) on a total notional amount of $1.1 million. The notional amounts of the swaps are not recorded in the financial statements. The notional amounts approximate the maximum potential amount of future payments that the Fund could be required to make if the Fund were the seller of protection and a credit event were to occur. Those credit default swaps (“CDS”) for which the Fund is providing protection at balance sheet date are summarized as follows:
FIXED INCOME FUND WRITTEN CREDIT DERIVATIVE CONTRACTS | SINGLE NAME CREDIT DEFAULT SWAPS | CREDIT DEFAULT SWAP INDEX | ||||||||||||||||||
| REFERENCE ASSET | CORPORATE DEBT | SOVERIGN DEBT | ASSET BACKED SECURITIES | CORPORATE DEBT | Total | |||||||||||||||
Fair value of written credit derivatives | $ | — | $ | — | $ | — | $ | (6,840 | ) | $ | (6,840 | ) | ||||||||
Maximum potential amount of future payments | — | — | — | 1,090,000 | 1,090,000 | |||||||||||||||
Recourse provisions with third parties to recover any amounts paid under the credit derivative (including any purchased credit protection)1 | — | — | — | — | — | |||||||||||||||
Collateral held by the Fund can obtain upon occurrence of triggering event | — | — | — | — | — | |||||||||||||||
| 1 | Potential recoveries would include purchased credit derivatives to the extent they offset written credit derivatives which have an identical underlying, or a netting arrangement or credit support annex with the counterparty. There may be other potential recoveries from recourse provisions where agreements cover multiple derivative arrangements but those amounts have not been included. |
| MAXIMUM POTENTIAL AMOUNT OF FUTURE PAYMENTS BY CONTRACT TERM | ||||||||||||||||||||||||
| FIXED INCOME FUND | 0-6 MONTHS | 6-12 MONTHS | 1-5 YEARS | 5-10 YEARS | > 10 YEARS | Total | ||||||||||||||||||
Current credit spread* on underlying (in basis points) | ||||||||||||||||||||||||
0-100 | $ | — | $ | — | $ | 1,090,000 | $ | — | $ | — | $ | 1,090,000 | ||||||||||||
> than 100 | — | — | — | — | — | — | ||||||||||||||||||
Total | $ | — | $ | — | $ | 1,090,000 | $ | — | $ | — | $ | 1,090,000 | ||||||||||||
| * | The credit spread on the underlying asset is generally indicative of the current status of the underlying risk of the Fund having to perform. The spread also reflects the cost of buying/selling protection and may include upfront payments required to be made to enter into a contract. Higher credit spreads with a shorter contract term is indicative of a higher likelihood of performance by the Fund. |
The credit spread disclosed above for each reference obligation where the Fund is the seller of protection is a representation of the current payment/performance risk of the swap.
4. DERIVATIVE TRANSACTIONS
The following tables include only Funds that had exposure to more than one type of risk on derivatives held throughout the period. For Funds that held derivatives throughout the period with only one type of risk exposure, additional information can be found on the Schedule of Investments and the Statement of Operations.
The fair value of derivative instruments as of February 29, 2016 was as follows ($ Thousands):
| Asset Derivatives | Liability Derivatives | |||||||||||
| Statement of Assets and Liabilities Location | Fair Value | Statement of Assets and Liabilities Location | Fair Value | |||||||||
Derivatives not accounted for as hedging instruments: | ||||||||||||
| Fixed Income Fund | ||||||||||||
Interest rate contracts | Net Assets — Unrealized appreciation on futures contracts | $ | 28 | * | Net Assets — Unrealized appreciation on futures contracts | $ | 29 | * | ||||
Options purchased, at value | 1 | Options written, at value | 4 | |||||||||
Foreign exchange contracts | Unrealized gain on forward foreign currency contracts | 22 | Unrealized loss on forward foreign currency contracts | 48 | ||||||||
Credit Contracts | Net Assets — Unrealized appreciation on swap contracts | — | † | Net Assets — Unrealized appreciation on swap contracts | 25 | † | ||||||
|
|
|
| |||||||||
Total Derivatives not accounted for as hedging instruments | $ | 51 | $ | 106 | ||||||||
|
|
|
| |||||||||
| * | Includes cumulative appreciation/depreciation of futures contracts as reported in the Schedules of Investments. Only current day’s variation margin is reported within the Statements of Assets & Liabilities. |
| † | Includes cumulative appreciation/depreciation of swap contracts as reported in the Schedules of Investments. Market Value is reported within the Statements of Assets & Liabilities for swap contracts that have paid premiums. |
| 32 | SEI Catholic Values Trust / Annual Report / February 29, 2016 |
The effect of derivative instruments on the Statements of Operations for the period ended February 29, 2016. Amount of realized gain or (loss) on derivatives recognized in income ($ Thousands):
| Derivatives Not Accounted for as Hedging Instruments | Options | Futures | Forward Currency Contracts | Swaps | Total | |||||||||||||||
Fixed Income Fund | ||||||||||||||||||||
Interest Rates | $ | 12 | $ | (89 | ) | $ | — | $ | — | $ | (77 | ) | ||||||||
Foreign exchange contracts | — | — | 39 | — | 39 | |||||||||||||||
Credit contracts | — | — | — | 11 | 11 | |||||||||||||||
Total | $ | 12 | $ | (89 | ) | $ | 39 | $ | 11 | $ | (27 | ) | ||||||||
Change in unrealized appreciation or (depreciation) on derivatives recognized in income ($ Thousands):
| Derivatives Not Accounted for as Hedging Instruments | Options | Futures | Forward Currency Contracts | Swaps | Total | |||||||||||||||
Fixed Income Fund | ||||||||||||||||||||
Interest Rates | $ | (4 | ) | $ | (1 | ) | $ | — | $ | — | $ | (5 | ) | |||||||
Foreign exchange contracts | — | — | (26 | ) | — | (26 | ) | |||||||||||||
Credit contracts | — | — | — | (25 | ) | (25 | ) | |||||||||||||
Total | $ | (4 | ) | $ | (1 | ) | $ | (26 | ) | $ | (25 | ) | $ | (56 | ) | |||||
5. INVESTMENT ADVISORY, ADMINISTRATION AND DISTRIBUTION AGREEMENTS, INVESTMENT SUB-ADVISORY AGREEMENTS AND OTHER TRANSACTIONS WITH AFFILIATES
Investment Advisory, Administration, Distribution and Custodian Agreements — SIMC serves as each Fund’s investment adviser (the “Adviser”) and “manager of managers” under an investment advisory agreement approved by the shareholders of each Fund. In connection with serving as Adviser, SIMC is entitled to a fee, which is calculated daily and paid monthly, based on the average daily net assets of each Fund.
SEI Investments Global Funds Services (the “Administrator”) provides the Trust with administrative and transfer agency services. For its services, the Administrator is entitled to a fee, which is calculated daily and paid monthly, based on the average daily net assets of each Fund.
The Fund has adopted a shareholder servicing plan (the “Shareholder Servicing Plan”) under which a shareholder servicing fee of up to 0.25% of the average daily net assets of Class A shares of the Funds will be paid to other service providers. Under the Shareholder Servicing Plan, other service providers may perform, or may compensate other service providers for performing, certain shareholder and administrative services.
The Adviser, Administrator and/or Distributor have voluntarily agreed to waive a portion of their fees in order to keep total direct operating expenses (exclusive of interest from borrowings, brokerage commissions, taxes, Trustee fees, prime broker fees, interest and dividend expenses related to short sales and extraordinary expenses not incurred in the ordinary course of the Funds’ business) at a specified level.
The waivers by the Funds’ Adviser, Administrator and/ or Distributor are limited to the Funds’ direct operating expenses and, therefore, do not apply to indirect expenses incurred by the Funds, such as acquired fund fees and expenses. The waivers are voluntary and the Funds’ Adviser,
Administrator and/or Distributor may discontinue all or part of any of these waivers at any time. In addition, some Funds may participate in a commission recapture program where the Funds’ trades may be executed through the Funds’ distributor, and a portion of the commissions paid on those trades are then used to pay the Funds’ expenses.
The following is a summary of annual fees payable to the Adviser, Administrator and Distributor and the voluntary expense limitations for each Fund:
| Advisory Fee | Administration Fee | Shareholder Servicing Fee | Voluntary Expense Limitation | |||||||||||||
Equity Fund | ||||||||||||||||
Class A | 0.60 | % | 0.30 | % | 0.25 | % | 0.86 | % | ||||||||
Class Y | 0.60 | % | 0.30 | % | 0.00 | % | 0.76 | % | ||||||||
Fixed Income Fund | ||||||||||||||||
Class A | 0.35 | % | 0.30 | % | 0.25 | % | 0.71 | % | ||||||||
Class Y | 0.35 | % | 0.30 | % | 0.00 | % | 0.61 | % | ||||||||
Investment Sub-Advisory Agreements — As of February 29, 2016, SIMC has entered into Investment Sub-Advisory Agreements with the following parties:
| Investment Sub-Adviser |
Equity Fund |
BlackRock Investment Management, LLC |
Brandywine Global Investment Management, LLC |
EAM Investors, LLC |
EARNEST Partners, LLC |
Parametric Portfolio Associates LLC |
Snow Capital Management, L.P. |
Waddell & Reed Investment Management Company |
Fixed Income Fund |
Income Research & Management |
Western Asset Management Company |
Western Asset Management Company Limited |
| SEI Catholic Values Trust / Annual Report / February 29, 2016 | 33 |
Notes to Financial Statements (Continued)
February 29, 2016
Under the investment sub-advisory agreements, each sub-adviser receives an annual fee, paid by SIMC.
The Administrator and Distributor have voluntarily agreed to waive a portion of their fee for each fund. The following table lists the waivers for the period ended February 29, 2016 ($ Thousands):
| Administration Fee Waiver | Shareholder Servicing Fee Waiver (Class A) | |||||||
Equity Fund | $ | — | $ | 195 | ||||
Fixed Income Fund | 73 | 108 | ||||||
U.S. Bank, N.A. serves as the custodian of the Fixed Income Fund. Brown Brothers Harriman & Co. serves as the custodian of the Equity Fund. The custodian plays no role in determining the investment policies of the Funds or which securities are to be purchased or sold in the Funds.
Investment in Affiliated Securities — The Funds may invest in the SEI Daily Income Trust Prime Obligation Fund, an affiliated money market fund to manage excess cash or to serve as margin or collateral for derivative positions.
The following is a summary of transactions with affiliates for the period ended February 29, 2016 ($ Thousands):
| SEI Daily Income Trust, Prime Obligation Fund, Cl A | Value 4/30/2015 | Purchases at Cost | Proceeds from Sales | Value 02/29/2016 | Dividend Income | |||||||||||||||
Equity Fund | $ | — | $ | 36,797 | $ | (33,787 | ) | $ | 3,010 | $ | 2 | |||||||||
Fixed Income Fund | — | 92,172 | (87,608 | ) | 4,564 | 4 | ||||||||||||||
Payment to Affiliates — Certain officers and Trustees of the Trust are also officers and/or Trustees of the Administrator, Adviser, or the Distributor. The Trust pays each unaffiliated Trustee an annual fee for attendance at quarterly, interim, and committee meetings. The Administrator, Adviser and/or the Distributor pays compensation of Officers and affiliated Trustees.
A portion of the services provided by the Chief Compliance Officer (“CCO”) and his staff, whom are employees of the administrator, are paid for by the Trust as incurred.
6. INVESTMENT TRANSACTIONS
The cost of security purchases and the proceeds from the sale and maturities of securities other than temporary cash investments, during the period ended February 29, 2016, were as follows:
| U.S. Gov’t ($ Thousands) | Other ($ Thousands) | Total ($ Thousands) | ||||||||||
Equity Fund(1) | ||||||||||||
Purchases | $ | — | $ | 306,843 | $ | 306,843 | ||||||
Sales | — | 134,031 | 134,031 | |||||||||
Fixed Income Fund(1) | ||||||||||||
Purchases | 206,238 | 58,612 | 264,850 | |||||||||
Sales | 171,239 | 9,632 | 180,871 | |||||||||
| (1) | Funds commenced operations on April 30, 2015. |
7. FEDERAL TAX INFORMATION
It is each Fund’s intention to qualify as a regulated investment company for Federal income tax purposes and distribute all of its taxable income (including net capital gains). Accordingly, no provision for Federal income taxes is required.
Dividends from net investment income and distributions from net realized capital gains are determined in accordance with U.S. Federal income tax regulations, which may differ from those amounts determined under U.S. GAAP. These book/tax differences are either temporary or permanent in nature. To the extent these differences are permanent, they are charged or credited to paid-in capital, undistributed net investment income or accumulated net realized gain, as appropriate, in the period that the differences arise.
Accordingly, the following permanent differences, primarily attributable to different treatment for gains and losses on paydowns of mortgage and asset-backed securities for tax purposes, investments in swaps, investments in TIPs, and foreign currency translations, reclassification of long term capital gain distributions on REIT securities, non-deductible expenses (excise tax, organization and registration expenses), and basis adjustments for investments in partnerships, have been reclassified to/ (from) the following accounts as of February 29, 2016:
| Paid-in-Capital ($ Thousands) | Undistributed Net Investment Income ($ Thousands) | Accumulated Realized Gain/ (Loss) ($ Thousands) | ||||||||||
Equity Fund | $ | (79 | ) | $ | 76 | $ | 3 | |||||
Fixed Income Fund | (50 | ) | 246 | (196 | ) | |||||||
These reclassifications have no impact on net assets or net asset value per share.
The tax character of dividends and distributions paid during the period ended February 29, 2016 was as follows:
| Ordinary Income ($ Thousands) | ||||
Equity Fund | ||||
2016 | $ | 1,255 | ||
Fixed Income Fund | ||||
2016 | 1,443 | |||
| 34 | SEI Catholic Values Trust / Annual Report / February 29, 2016 |
As of February 29, 2016, the components of distributable earnings (accumulated losses) were as follows:
| Undistributed Ordinary Income ($ Thousands) | Undistributed Long-Term Capital Gain ($ Thousands) | Capital Loss Carryforwards ($ Thousands) | Post October Losses ($ Thousands) | Late Year Ordinary Losses ($ Thousands) | Unrealized (Depreciation) ($ Thousands) | Other Temporary Differences ($ Thousands) | Total Distributable Earnings/ (Accumulated Losses) ($ Thousands) | |||||||||||||||||||||||||
Equity Fund | $ | 216 | $ | — | $ | (2,682 | ) | $ | (6,174 | ) | $ | — | $ | (16,506 | ) | $ | (45 | ) | $ | (25,191 | ) | |||||||||||
Fixed Income Fund | 254 | — | (215 | ) | — | — | (429 | ) | (593 | ) | (983 | ) | ||||||||||||||||||||
Post October losses represent losses realized on investment transactions from November 1, 2015 through February 29, 2016 that, in accordance with Federal income tax regulations, the Funds may defer and treat as having arisen in the following fiscal year. Deferred Late-Year Losses represent ordinary losses realized on investment transactions from January 1, 2016 through February 29, 2016 and specified losses realized on investment transactions from November 1, 2015 through February 29, 2016, that, in accordance with Federal income tax regulations, the Fund defers and treats as having arisen in the following fiscal year.
Under the recently enacted Regulated Investment Company Modernization Act of 2010, the Funds are permitted to carry forward capital losses incurred in taxable years beginning after December 22, 2010 for an unlimited period. However, any losses incurred during those future taxable years will be required to be utilized prior to the losses incurred in pre-enactment taxable years. Additionally, post-enactment capital losses that are carried forward will retain their character as either short-term or long-term capital losses rather than being considered all short-term as under previous law. Losses carried forward under these new provisions are as follows:
| Short-Term Loss ($ Thousands) | Long-Term Loss ($ Thousands) | Total ($ Thousands) | ||||||||||
Equity Fund | $ | 2,682 | $ | — | $ | 2,682 | ||||||
Fixed Income Fund | — | 215 | 215 | |||||||||
For Federal income tax purposes, the cost of securities owned at February 29, 2016, and net realized gains or losses on securities sold for the period, were different from amounts reported for financial reporting purposes, primarily due to wash sales, QTP basis, PFIC MTM, and investments in TIPs which cannot be used for Federal income tax purposes in the current year and have been deferred for use in future years.
The Federal tax cost and aggregate gross unrealized appreciation and depreciation on investments held (excluding foreign currency, written options and futures) by the Funds at February 29, 2016, were as follows:
| Federal Tax Cost ($ Thousands) | Appreciated Securities ($ Thousands) | Depreciated Securities ($ Thousands) | Net Unrealized Depreciation ($ Thousands) | |||||||||||||
Equity Fund | $ | 166,813 | $ | 4,936 | $ | (21,478 | ) | $ | (16,542 | ) | ||||||
Fixed Income Fund | 91,880 | 1,082 | (1,451 | ) | (369 | ) | ||||||||||
Management has analyzed the Funds’ tax positions taken on Federal income tax returns for all open tax years and has concluded that as of February 29, 2016, no provision for income tax would be required in the Funds’ financial statements. Generally, the Funds’ Federal and state income and Federal excise tax returns for tax years for which the applicable statutes of limitations have not expired are subject to examination by the Internal Revenue Service and state departments of revenue.
8. CONCENTRATION/RISKS
In the normal course of business, a Fund may enter into contracts that provide general indemnifications by a Fund to the counterparty to the contract. A Fund’s maximum exposure under these arrangements is dependent on future claims that may be made against a Fund and, therefore, cannot be established; however, based on experience, management believes the risk of loss from such claim is considered remote.
The following descriptions provide additional information about some of the risks of investing in the Funds:
Asset-Backed Securities Risk — Payment of principal and interest on asset-backed securities is dependent largely on the cash flows generated by the assets backing the securities, and asset-backed securities may not have the benefit of any security interest in the related assets.
Catholic Values Investing Risk — The Funds consider the Guidelines in its investment process and may choose not to purchase, or may sell, otherwise profitable investments in companies which have been identified as being in conflict with the Guidelines. This means that the Funds may underperform other similar mutual funds that do not consider the Guidelines when making investment decisions.
Currency Risk — To the extent a Fund takes positions in currencies, it will be subject to the risk that currency exchange rates may fluctuate in response to, among other things, changes in interest rates, intervention (or failure to intervene) by U.S. or foreign governments, central banks or supranational entities, or by the imposition of currency controls or other political developments in the United States or abroad.
Fixed Income Market Risk — The prices of a Fund’s fixed income securities respond to economic developments, particularly interest rate changes, as well as to perceptions about the creditworthiness of individual issuers, including governments and their agencies. Generally, the Fund’s fixed income securities will decrease in value if interest rates rise and vice versa. In the case of foreign securities, price fluctuations will reflect international economic and political events, as well as changes in currency valuations relative to the U.S. dollar.
| SEI Catholic Values Trust / Annual Report / February 29, 2016 | 35 |
Notes to Financial Statements (Concluded)
February 29, 2016
Foreign Investment/Emerging Markets Risk — The risk that non-U.S. securities may be subject to additional risks due to, among other things, political, social and economic developments abroad, currency movements, and different legal, regulatory and tax environments. These additional risks may be heightened with respect to emerging market countries since political turmoil and rapid changes in economic conditions are more likely to occur in these countries.
Interest Rate Risk — The risk that a rise in interest rates will cause a fall in the value of fixed income securities, including U.S. Government Securities, in which the Fund invests. Although U.S. Government securities are considered to be among the safest investments, they are not guaranteed against price movements due to changing interest rates. A low interest rate environment may present greater interest rate risk, because there may be a greater likelihood of rates increasing and rates may increase more rapidly.
Mortgage-Backed Securities Risk — Mortgage-backed securities are affected by, among other things, interest rate changes and the possibility of prepayment of the underlying mortgage loans. Mortgage-backed securities are also subject to the risk that underlying borrowers will be unable to meet their obligations.
Please refer to each Fund’s current prospectus for additional disclosure regarding the risks associated with investing in the Funds. The foregoing is not intended to be a complete discussion of the risks associated with the investment strategies of the Funds
9. CONCENTRATION OF SHAREHOLDERS
As of February 29, 2016, SEI Private Trust Company, which is under common control with SIMC, held 99.69% of the Equity Fund Class A and Class Y, and 99.69% of the Fixed Income Fund Class A and Class Y, respectively.
SEI Private Trust Company (“SPTC”) is not a direct service provider to the Funds. However, SPTC performs a key role in the comprehensive investment solution that SEI provides to investors. SPTC holds the vast majority of shares in the Funds as custodian for shareholders that are clients of the advisors and financial planners. SPTC maintains accounts at SEI Institutional Transfer Agency (“SITA”), and operates in an omnibus fund account environment.
10. NEW ACCOUNTING PRONOUNCEMENT
In May 2015, the Financial Accounting Standards Board (FASB) issued Accounting Standards Update (ASU) No. 2015-07 regarding “Disclosures for Investments in Certain Entities That Calculate Net Asset Value per Share”. The amendments in this update are effective for fiscal years beginning after December 15, 2015, and interim periods within those fiscal years. ASU No. 2015-07 will eliminate the requirement to categorize investments in the fair value hierarchy if their fair value is measured at net asset value (NAV) per share (or its equivalent) using the practical expedient in the FASB’s fair value measurement guidance. At this time, management is evaluating the
implications of ASU No. 2015-07 and its impact on the financial statement disclosures has not yet been determined.
11. SUBSEQUENT EVENTS
The Trust, on behalf of the Funds, has evaluated the need for disclosures and/or adjustments resulting from subsequent events. Based on this evaluation, no disclosures and/or adjustments were required to the financial statements as of February 29, 2016.
| 36 | SEI Catholic Values Trust / Annual Report / February 29, 2016 |
Report of Independent Registered Public Accounting Firm
The Shareholders and Board of Trustees
SEI Catholic Values Trust:
We have audited the accompanying statements of assets and liabilities, including the schedules of investments, of SEI Catholic Values Trust, comprised of the Catholic Values Equity Fund and Catholic Values Fixed Income Fund (collectively, the “Funds”), as of February 29, 2016, and the related statements of operations, changes in net assets, and the financial highlights for the period April 30, 2015 (commencement of operations) through February 29, 2016. These financial statements and financial highlights are the responsibility of the Funds’ management. Our responsibility is to express an opinion on these financial statements and financial highlights based on our audits.
We conducted our audits in accordance with the standards of the Public Company Accounting Oversight Board (United States). Those standards require that we plan and perform the audits to obtain reasonable assurance about whether the financial statements and financial highlights are free of material misstatement. An audit includes examining, on a test basis, evidence supporting the amounts and disclosures in the financial statements. Our procedures included confirmation of securities owned as of February 29, 2016, by correspondence with the custodians, transfer agent, and brokers or other appropriate auditing procedures. An audit also includes assessing the accounting principles used and significant estimates made by management, as well as evaluating the overall financial statement presentation. We believe that our audits provide a reasonable basis for our opinion.
In our opinion, the financial statements and financial highlights referred to above present fairly, in all material respects, the financial position of each of the funds comprising SEI Catholic Values Trust as of February 29, 2016, and the results of their operations, the changes in their net assets, and the financial highlights for the period April 30, 2015 (commencement of operations) through February 29, 2016, in conformity with U.S. generally accepted accounting principles.

Philadelphia, Pennsylvania
April 28, 2016
| SEI Catholic Values Trust / Annual Report / February 29, 2016 | 37 |
TRUSTEES AND OFFICERS OF THE TRUST
The following chart lists Trustees and Officers as of February 29, 2016.
Set forth below are the names, addresses, ages, position with the Trust, Term of Office and Length of Time Served, the principal occupations for the last five years, number of positions in fund complex overseen by trustee, and other directorships outside the fund complex of each of the persons currently serving as Trustees and Officers of the Trust. The Trust’s Statement of Additional Information (“SAI”) includes additional information about the Trustees and Officers. The SAI may be obtained without charge by calling 1-800-342-5734.
| Name, Address, and Age | Position(s) Held with Trusts | Term of Office and Length of Time Served1 | Principal Occupation(s) During Past Five Years | Number of Portfolios in Fund Complex Overseen by Trustee2 | Other Directorships Held by Trustee | |||||
| INTERESTED TRUSTEES | ||||||||||
| Robert A. Nesher One Freedom Valley Drive Oaks, PA 19456 68 yrs. old | Chairman of the Board of Trustees* | since 1982 | Currently performs various services on behalf of SEI for which Mr. Nesher is compensated. | 99 | Trustee of The Advisors’ Inner Circle Fund, The Advisors’ Inner Circle Fund II, Bishop Street Funds, Director of SEI Global Master Fund, plc, SEI Global Assets Fund, plc, SEI Global Investments Fund, plc, SEI Investments Global, Limited, SEI Investments — Global Fund Services, Limited, SEI Investments (Europe), Limited, SEI Global Nominee Ltd., SEI Structured Credit Fund, L.P. | |||||
| William M. Doran One Freedom Valley Drive Oaks, PA 19456 74 yrs. old | Trustee* | since 1982 | Self-employed consultant since 2003. Partner, Morgan, Lewis & Bockius LLP (law firm) from 1976 to 2003, counsel to the Trust, SEI, SIMC, the Administrator and the Distributor. Secretary of SEI since 1978. | 99 | Trustee of The Advisors’ Inner Circle Fund, The Advisors’ Inner Circle Fund II, Bishop Street Funds, Director of SEI since 1974. Director of the Distributor since 2003. Director of SEI Investments — Global Fund Services, Limited, SEI Investments Global, Limited, SEI Investments (Europe), Limited, SEI Investments (Asia), SEI Global Nominee Ltd., Limited and SEI Asset Korea Co., Ltd. | |||||
| TRUSTEES | ||||||||||
| George J. Sullivan Jr. One Freedom Valley Drive, Oaks, PA 19456 71 yrs. old | Trustee | since 1996 | Retired since January 2012. Self-Employed Consultant, Newfound Consultants Inc. since April 1997-December 2011. | 99 | Trustee of The Advisors’ Inner Circle Fund, The Advisors’ Inner Circle Fund II, Bishop Street Funds, State Street Navigator Securities Lending Trust, and SEI Structured Credit Fund, L.P., member of the independent review committee for SEI’s Canadian-registered mutual funds. | |||||
| * | Messrs. Nesher and Doran are Trustees who may be deemed as “interested” persons of the Trust as that term is defined in the 1940 Act by virtue of their affiliation with SIMC and the Trust’s Distributor. |
| 1 | Each trustee shall hold office during the lifetime of this Trust until the election and qualification of his or her successor, or until he or she sooner dies, resigns or is removed in accordance with the Trust’s Declaration of Trust. |
| 2 | The Fund Complex includes the following Trusts: SEI Asset Allocation Trust, SEI Daily Income Trust, SEI Institutional Investments Trust, Adviser Managed Trust, SEI Institutional International Trust, SEI Institutional Managed Trust, SEI Liquid Asset Trust, SEI Tax Exempt Trust, SEI Insurance Products Trust and New Covenant Funds. |
| 38 | SEI Catholic Values Trust / Annual Report / February 29, 2016 |
| Name Address, and Age | Position(s) Held with Trusts | Term of Office and Length of Time Served1 | Principal Occupation(s) During Past Five Years | Number of Portfolios in Fund Complex Overseen by Trustee2 | Other Directorships Held by Trustee | |||||
| TRUSTEES (continued) | ||||||||||
Nina Lesavoy One Freedom Valley Drive, Oaks, PA 19456 57 yrs. old | Trustee | since 2003 | Founder and Managing Director, Avec Capital since 2008. Managing Director, Cue Capital from March 2002-March 2008. | 99 | Director of SEI Structured Credit Fund, L.P. | |||||
James M. Williams One Freedom Valley Drive, Oaks, PA 19456 66 yrs. old | Trustee | since 2004 | Vice President and Chief Investment Officer, J. Paul Getty Trust, Non-Profit Foundation for Visual Arts, since December 2002. | 99 | Trustee/Director of Ariel Mutual Funds, and SEI Structured Credit Fund, L.P. | |||||
Mitchell A. Johnson One Freedom Valley Drive, Oaks, PA 19456 72 yrs. old | Trustee | since 2007 | Private Investor since 1994. | 99 | Trustee of the Advisors’ Inner Circle Fund, The Advisors’ Inner Circle Fund II, and Bishop Street Funds. | |||||
Hubert L. Harris, Jr. One Freedom Valley Drive, Oaks, PA 19456 71 yrs. old | Trustee | since 2008 | Retired since December 2005. Chief Executive Officer and Chair of the Board of Directors, AMVESCAP Retirement, Inc., 1997-December 2005. Chief Executive Officer, INVESCO North America, September 2003-December 2005. | 99 | Director of Colonial BancGroup, Inc. and St. Joseph’s Translational Research Institute; Chair of the Board of Trustees, Georgia Tech Foundation, Inc. (nonprofit corporation); Board of Councilors of the Carter Center. | |||||
Susan C. Cote One Freedom Valley Drive Oaks, PA 19456 61 years old | Trustee | since 2015 | Independent Consultant to SEI Institutional Managed Trust, Insitutional International Trust and SEI Liquid Asset Allocation Trust. Trustee of SEI Asset Allocation Trust, SEI Daily Income Trust, SEI Institutional Investments Trust, SEI Liquid Asset Trusts, SEI Tax Exempt Trust, SEI Insurance Products Trust, New Covenant Funds and SEI Catholic Values Trust. (2014-Present); Partner, Ernst & Yound LLP from 1997-2015; Global Asset Management Assuance Leader, Ernst & Young LLP from 2006-2015; and America Director of Asset Management, Ernst & Young LLP from 2006-2013. | 72 | N/A | |||||
| OFFICERS | ||||||||||
Robert A. Nesher One Freedom Valley Drive, Oaks, PA 19456 68 yrs. Old | President and CEO | since 2005 | Currently performs various services on behalf of SEI for which Mr. Nesher is compensated. | N/A | N/A | |||||
Arthur Ramanjulu One Freedom Valley Drive, Oaks, PA 19456 51 yrs. old | Controller and Chief Financial Officer | since 2011 | Director, Funds Accounting, SEI Investments Global Funds Services (March 2015); Senior Manager, Funds Accounting, SEI Global Funds Services (March 2007 to February 2015). | N/A | N/A | |||||
| SEI Catholic Values Trust / Annual Report / February 29, 2016 | 39 |
TRUSTEES AND OFFICERS OF THE TRUST (Concluded)
| Name Address, and Age | Position(s) Held with Trusts | Term of Office and Length of Time Served1 | Principal Occupation(s) During Past Five Years | Number of Portfolios in Fund Complex Overseen by Trustee2 | Other Directorships Held by Trustee | |||||
| OFFICERS (continued) | ||||||||||
Russell Emery One Freedom Valley Drive Oaks, PA 19456 52 yrs. old | Chief Compliance Officer | since 2006 | Chief Compliance Officer of SEI Institutional Managed Trust, SEI Asset Allocation Trust, SEI Daily Income Trust, SEI Institutional International Trust, SEI Liquid Asset Trust, SEI Tax Exempt Trust, SEI Institutional Investments Trust, The Advisors’ Inner Circle Fund, The Advisors’ Inner Circle Fund II, and Bishop Street Funds, since March 2006. Chief Compliance Officer of SEI Structured Credit Fund, LP since June 2007. Chief Compliance Officer of Adviser Managed Trust since December 2010. Chief Compliance Officer of New Covenant Funds since February 2012. Chief Compliance Officer of SEI Insurance Products Trust since 2013. Chief Compliance Officer of SEI Catholic Values Trust since 2015. | N/A | N/A | |||||
Timothy D Barto One Freedom Valley Drive Oaks, PA 19456 47 yrs. old | Vice President and Secretary | Since 2002 | General Counsel, Vice President and Secretary of SIMC and the Administrator since 2004. Vice President and Assistant Secretary of SEI since 2001. Vice President of SIMC and the Administrator since 1999. | N/A | N/A | |||||
Aaron Buser One Freedom Valley Drive, Oaks, PA 19456 44 yrs. old | Vice President and Assistant Secretary | since 2008 | Vice President and Assistant Secretary of SIMC since 2007. Associate at Stark & Stark (2004-2007). | N/A | N/A | |||||
David F. McCann One Freedom Valley Drive, Oaks, PA 19456 39 yrs. old | Vice President and Assistant Secretary | since 2009 | Vice President and Assistant Secretary of SIMC since 2008. Attorney, Drinker, Bidder & Reath LLP (law firm), May 2005-October 2008. | N/A | N/A | |||||
Stephen G. MacRae One Freedom Valley Drive, Oaks, PA 19456 47 yrs. old | Vice President | since 2012 | Director of Global Investment Product Management since 2004. | N/A | N/A | |||||
Bridget E. Sudall One Freedom Valley Drive Oaks, PA 19456 35 yrs. old | Anti-Money Laundering Compliance Officer and Privacy Officer | since 2015 | Anti-Money Laundering Compliance Officer and Privacy Officer since 2015. Senior Associate and AML Officer, Morgan Stanley Alternative Investment Partners, April 2011 to March 2015. Investor Services Team Lead, Morgan Stanley Alternative Investment Partners, July 2007 to April 2011. | N/A | N/A | |||||
| 1 | Each trustee shall hold office during the lifetime of this Trust until the election and qualification of his or her successor, or until he or she sooner dies, resigns or is removed in accordance with the Trust’s Declaration of Trust. |
| 2 | The Fund Complex includes the following Trusts: SEI Asset Allocation Trust, SEI Daily Income Trust, SEI Institutional Investments Trust, Adviser Managed Trust, SEI Institutional International Trust, SEI Institutional Managed Trust, SEI Liquid Asset Trust, SEI Tax Exempt Trust, SEI Insurance Products Trust, SEI Catholic Values and New Covenant Funds. |
| 40 | SEI Catholic Values Trust / Annual Report / February 29, 2016 |
SEI CATHOLIC VALUES TRUST — February 29, 2016
All mutual funds have operating expenses. As a shareholder of a fund, your investment is affected by these ongoing costs, which include (among others) costs for portfolio management, administrative services, and shareholder reports like this one. It is important for you to understand the impact of these costs on your investment returns.
Operating expenses such as these are deducted from the fund’s gross income and directly reduce your final investment return. These expenses are expressed as a percentage of the fund’s average net assets; this percentage is known as the fund’s expense ratio.
The following examples use the expense ratio and are intended to help you understand the ongoing costs (in dollars) of investing in your fund and to compare these costs with those of other mutual funds. The examples are based on an investment of $1,000 made at the beginning of the period shown and held for the entire period.
The table on this page illustrates your fund’s costs in two ways:
• Actual fund return. This section helps you to estimate the actual expenses after fee waivers that your Fund incurred over the period. The “Expenses Paid During Period” column shows the actual dollar expense cost incurred by a $1,000 investment in the Fund, and the “Ending Account Value” number is derived from deducting that expense cost from the Fund’s gross investment return.
You can use this information, together with the actual amount you invested in the Fund, to estimate the expenses you paid over that period. Simply divide your actual account value by $1,000 to arrive at a ratio (for example, an $8,600 account value divided by $1,000 = 8.6), then multiply that ratio by the number shown for your Fund under “Expenses Paid During Period.”
• Hypothetical 5% return. This section helps you compare your Fund’s costs with those of other mutual funds. It assumes that the fund had an annual 5% return before expenses during the year, but that the expense ratio (Column 3) for the period is unchanged. This example is useful in making comparisons because the Securities and Exchange Commission requires all mutual funds to make this 5% calculation. You can assess your Fund’s comparative cost by comparing the hypothetical result for your Fund in the “Expense Paid During Period” column with those that appear in the same charts in the shareholder reports for other funds.
NOTE: Because the return is set at 5% for comparison purposes — NOT your Fund’s actual return — the account values shown may not apply to your specific investment.
| Beginning Account Value 9/1/15 | Ending Account Value 2/29/16 | Annualized Expense Ratios | Expenses Paid During Period* | |||||||||||||
Equity Fund | ||||||||||||||||
Actual Fund Return | ||||||||||||||||
Class A | $ | 1,000.00 | $ | 930.40 | 0.86 | % | $ | 4.13 | ||||||||
Class Y | 1,000.00 | 929.90 | 0.76 | 3.65 | ||||||||||||
Hypothetical 5% Return |
| |||||||||||||||
Class A | $ | 1,000.00 | $ | 1,020.59 | 0.86 | % | $ | 4.32 | ||||||||
Class Y | 1,000.00 | 1,021.08 | 0.76 | 3.82 | ||||||||||||
Fixed Income Fund | ||||||||||||||||
Actual Fund Return | ||||||||||||||||
Class A | $ | 1,000.00 | $ | 1,018.10 | 0.71 | % | $ | 3.56 | ||||||||
Class Y | 1,000.00 | 1,018.30 | 0.61 | 3.06 | ||||||||||||
Hypothetical 5% Return |
| |||||||||||||||
Class A | $ | 1,000.00 | $ | 1,021.33 | 0.71 | % | $ | 3.57 | ||||||||
Class Y | 1,000.00 | 1,021.83 | 0.61 | 3.07 | ||||||||||||
| * | Expenses are equal to the Fund’s annualized expense ratio multiplied by the average account value over the period, multiplied by 182/366 (to reflect the one-half year period shown). |
| SEI Catholic Values Trust / Annual Report / February 29, 2016 | 41 |
For shareholders who do not have a February 29, 2016, taxable year end, this notice is for informational purposes only. For shareholders with a February 29, 2016, taxable year end, please consult your tax adviser as to the pertinence of this notice.
For the fiscal year ended February 29, 2016, the Funds are designating long term and qualifying dividend income with regard to distributions paid during the year as follows:
| (A) Return of Capital | (B) Long Term Capital Gains Distributions (Tax Basis) | (C) Ordinary Income Distributions (Tax Basis) | (D) Total Distributions (Tax Basis) | (E) Dividends Qualifying for Corporate Dividends Rec. Deduction (1) | ||||||||||||||||
| Equity Fund | 0.00 | % | 0.00 | % | 100.00 | % | 100.00 | % | 100.00 | % | ||||||||||
| Fixed Income Fund | 0.00 | % | 0.00 | % | 100.00 | % | 100.00 | % | 0.00 | % | ||||||||||
| (F) Qualifying Dividend Income (15% Tax Rate for QDI) (2) | (G) U.S. Government Interest (3) | (H) Interest Related Dividends (4) | (I) Short-Term Capital Gain Dividends (5) | |||||||||||||
| Equity Fund | 100.00 | % | 24.86 | % | 0.04 | % | 0.00 | % | ||||||||
| Fixed Income Fund | 0.00 | % | 83.55 | % | 100.00 | % | 0.00 | % | ||||||||
| (1) | “Dividends Received Deduction” represent dividends which qualify for the corporate dividends received deduction and is reflected as a percentage of ordinary Income distributions (the total of short term capital gain and net investment income distributions). |
| (2) | “Qualifying Dividend Income” represent qualifying dividends as created by the Jobs and Growth Tax Relief Reconciliation Act of 2003. It is the intention of the Fund to designate the max amount permitted by law. |
| (3) | “U.S. Government Interest” represent the amount of interest that was derived from direct U.S. Government obligations and distributed during the fiscal year. Generally, interest from direct U.S. Government obligations is exempt from state income tax. However, for shareholders who are residents of California, Connecticut or New York, the statutory threshold requirements were not satisfied to permit exemption of these amounts from state income. |
| (4) | The percentage in this column represents the amount of “Interest Related Dividend” is reflected as a percentage of ordinary income distribution. Interest related dividends is exempted from U.S. withholding tax when paid to foreign investors. |
| (5) | The percentage of this column represents the amount of “Short Term Capital Gain Dividend” is reflected as a percentage of short term capital gain distribution that is exempted from U.S. withholding tax when paid to foreign investors. |
Items (A), (B), (C) and (D) are based on the percentage of each fund’s total distribution.
Items (E) and (F) are based on the percentage of “Ordinary Income Distributions.”
Item (G) is based on the percentage of gross income of each Fund.
Item (H) is based on the percentage of net investment income distributions.
Item (I) is based on the percentage of short-term capital gains distributions.
Please consult your tax adviser for proper treatment of this information. This notification should be kept with your permanent tax records.
| 42 | SEI Catholic Values Trust / Annual Report / February 29, 2016 |
Shareholder Voting Proxy Results (Unaudited)
At a special meeting held on January 15, 2016, the shareholders of SEI Daily Income Trust (the “Fund”), voted on the proposals listed below. The results of the voting were as follows:
Proposal 1: Vote on Trustees/Directors
| SEI Daily Income Trust | ||||||||||||||
| Shares Voted | % of Shares Present | % of Outstanding Shares | ||||||||||||
| Robert A. Nesher | For | 8,075,875,352.359 | 97.526 | % | 72.785 | % | ||||||||
| Withheld | 204,931,700.674 | 2.474 | % | 1.846 | % | |||||||||
| William M. Doran | For | 8,125,116,672.917 | 98.120 | % | 73.228 | % | ||||||||
| Withheld | 155,690,380.116 | 1.880 | % | 1.403 | % | |||||||||
| George J. Sullivan, JR. | For | 8,122,048,885.252 | 98.083 | % | 73.201 | % | ||||||||
| Withheld | 158,758,167.781 | 1.917 | % | 1.430 | % | |||||||||
| Nina Lesavoy | For | 7,801,123,382.934 | 94.208 | % | 70.308 | % | ||||||||
| Withheld | 479,683,670.099 | 5.792 | % | 4.323 | % | |||||||||
| James M. Williams | For | 8,124,179,092.172 | 98.109 | % | 73.220 | % | ||||||||
| Withheld | 156,627,960.861 | 1.891 | % | 1.411 | % | |||||||||
| Mitchell A. Johnson | For | 8,121,109,311.475 | 98.072 | % | 73.192 | % | ||||||||
| Withheld | 159,697,741.558 | 1.928 | % | 1.439 | % | |||||||||
| Hubert L. Harris, JR. | For | 7,791,872,044.130 | 94.096 | % | 70.225 | % | ||||||||
| Withheld | 488,935,008.903 | 5.904 | % | 4.406 | % | |||||||||
| Susan C. Cote | For | 8,131,364,002.277 | 98.196 | % | 73.285 | % | ||||||||
| Withheld | 149,443,050.756 | 1.804 | % | 1.346 | % | |||||||||
Proposal 2: To amend the agreement and declaration of trust to reduce the shareholder quorum requirement from a majority to one-third (33 - 1/3%).
| SEI Daily Income Trust | ||||||||||||
| Shares Voted | % of Shares Present | % of Outstanding Shares | ||||||||||
| Affirmative | 6,233,970,459.684 | 75.283 | % | 56.631 | % | |||||||
| Against | 1,859,454,829.397 | 22.455 | % | 16.759 | % | |||||||
| Abstain | 185,108,022.497 | 2.235 | % | 1.668 | % | |||||||
| Broker Non-Vote | 2,273,741.455 | 0.027 | % | 0.020 | % | |||||||
|
|
|
|
|
| |||||||
| 8,280,807,053.033 | 100.000 | % | 75.078 | % | ||||||||
|
|
|
|
|
| |||||||
| SEI Catholic Values Trust / Annual Report / February 29, 2016 | 43 |
SEI CATHOLIC VALUES TRUST FEBRUARY 29,2016
Robert A. Nesher, Chairman
Trustees
William M. Doran
George J. Sullivan, Jr.
Nina Lesavoy
James M. Williams
Mitchell A. Johnson
Hubert L. Harris, Jr.
Susan C. Cote
Officers
Robert A. Nesher
President and Chief Executive Officer
Peter A. Rodriguez
Controller and Chief Financial Officer
Russell Emery
Chief Compliance Officer
Timothy D. Barto
Vice President, Secretary
David F. McCann
Vice President, Assistant Secretary
Aaron Buser
Vice President, Assistant Secretary
Stephen G. MacRae
Vice President
Edward McCusker
Anti-Money Laundering Compliance Officer Privacy Officer
Investment Adviser
SEI Investments Management Corporation
Administrator
SEI Investments Global Funds Services
Distributor
SEI Investments Distribution Co.
Legal Counsel
Morgan, Lewis & Bockius LLP
Independent Registered Public Accounting Firm
KPMG LLP
This report and the financial statements contained herein are submitted for the general information of the shareholders of the Trust and must be preceded or accompanied by a current prospectus. Shares of the Funds are not deposits or obligations of, or guaranteed or endorsed by, any bank. The shares are not federally insured by the Federal Deposit Insurance Corporation (FDIC), the Federal Reserve Board, or any other government agency. Investment in the shares involves risk, including the possible loss of principal.
For more information call
1 800 DIAL SEI
(1 800 342 5734)

1 Freedom Valley Drive P.O. Box 1100 Oaks, PA 19456
CATHOLIC VALUES (2/16)
Item 2. Code of Ethics.
The Registrant has adopted a code of ethics that applies to the Registrant’s principal executive officer, principal financial officer, principal accounting officer or controller, or persons performing similar functions.
Item 3. Audit Committee Financial Expert.
(a) (1) The Registrant’s Board of Trustees has determined that the Registrant has at least two audit committee financial experts serving on the audit committee.
Item 4. Principal Accountant Fees and Services.
Fees billed by KPMG LLP (“KPMG”) related to the Registrant.
KPMG billed the Registrant aggregate fees for services rendered to the Registrant for the fiscal period 2016 as follows:
| Fiscal 2016 | ||||||||||||||
| All fees and services to the Registrant that were pre- approved | All fees and services to service affiliates that were pre- approved | All other fees and services to service affiliates that did not require pre- approval | ||||||||||||
(a) | Audit Fees (1) | $ | 55,000 | $ | 0 | N/A | ||||||||
(b) | Audit-Related Fees | $ | 0 | $ | 0 | $ | 0 | |||||||
(c) | Tax Fees | $ | 0 | $ | 0 | $ | 0 | |||||||
(d) | All Other Fees (2) | $ | 0 | $ | 240,350 | $ | 0 | |||||||
Notes:
| (1) | Audit fees include amounts related to the audit of the Registrant’s annual financial statements and services normally provided by the accountant in connection with statutory and regulatory filings. |
| (2) | See Item 4(g) for a description of the services comprising the fees disclosed in this category. |
(e)(1) The Registrant’s Audit Committee has adopted and the Board of Trustees has ratified an Audit and Non-Audit Services Pre-Approval Policy (the “Policy”), which sets forth the procedures and the conditions pursuant to which services proposed to be performed by the independent auditor of the Registrant may be pre-approved.
The Policy provides that all requests or applications for proposed services to be provided by the independent auditor must be submitted to the Registrant’s Chief Financial Officer (“CFO”) and must include a detailed description of the services proposed to be rendered. The CFO will determine whether such services: (1) require specific pre-approval; (2) are included within the list of services that have received the general pre-approval of the Audit Committee pursuant to the Policy; or (3) have been previously pre-approved in connection with the independent auditor’s annual engagement letter for the applicable year or otherwise. In any instance where services require pre-approval, the Audit Committee will consider whether such services are consistent with SEC’s rules and whether the provision of such services would impair the auditor’s independence.
Requests or applications to provide services that require specific pre-approval by the Audit Committee will be submitted to the Audit Committee by the CFO. The Audit Committee will be informed by the CFO on a quarterly basis of all services rendered by the independent auditor. The Audit Committee has delegated specific pre-approval authority to either the Audit Committee Chair or financial experts, provided that the estimated fee for any such proposed pre-approved service does not exceed $100,000 and any pre-approval decisions are reported to the Audit Committee at its next regularly scheduled meeting.
Services that have received the general pre-approval of the Audit Committee are identified and described in the Policy. In addition, the Policy sets forth a maximum fee per engagement with respect to each identified service that has received general pre-approval.
All services to be provided by the independent auditor shall be provided pursuant to a signed written engagement letter with the Registrant, the investment advisor or applicable control affiliate (except that matters as to which an engagement letter would be impractical because of timing issues or because the matter is small may not be the subject of an engagement letter) that sets forth both the services to be provided by the independent auditor and the total fees to be paid to the independent auditor for those services.
In addition, the Audit Committee has determined to take additional measures on an annual basis to meet its responsibility to oversee the work of the independent auditor and to assure the auditor’s independence from the Registrant, such as reviewing a formal written statement from the independent auditor delineating all relationships between the independent auditor and the Registrant, and discussing with the independent auditor its methods and procedures for ensuring independence.
(e)(2) Percentage of fees billed applicable to non-audit services pursuant to waiver of pre-approval requirement were as follows:
| Fiscal 2016 | ||||
Audit-Related Fees | 0 | % | ||
Tax Fees | 0 | % | ||
All Other Fees | 0 | % | ||
(f) Not Applicable.
(g)(1) The aggregate non-audit fees and services billed by KPMG for the fiscal year 2016 was $240,350. Non-audit fees consist of SSAE No. 16 review of fund accounting and administration operations, attestation report in accordance with Rule 17 Ad-13, and agreed upon procedures report over certain internal controls related to compliance with federal securities laws and regulations.
(h) During the past fiscal year, Registrant’s principal accountant provided certain non-audit services to Registrant’s investment adviser or to entities controlling, controlled by, or under common control with Registrant’s investment adviser that provide ongoing services to Registrant that were not subject to pre-approval pursuant to paragraph (c)(7)(ii) of Rule 2-01 of Regulation S-X. The Audit Committee of Registrant’s Board of Trustees reviewed and considered these non-audit services provided by Registrant’s principal accountant to Registrant’s affiliates, including whether the provision of these non-audit services is compatible with maintaining the principal accountant’s independence
Item 5. Audit Committee of Listed Registrants.
Not applicable.
Item 6. Schedule of Investments.
The Schedules of Investments in securities of unaffiliated issuers as of the close of the reporting period for the Catholic Values Equity Fund and the Catholic Values Fixed Income Fund are included as part of the report to shareholders filed under Item 1 of this form.
Item 7. Disclosure of Proxy Voting Policies and Procedures for Closed-End Management Investment Companies.
Not applicable.
Item 8. Portfolio Managers of Closed-End Management Investment Companies.
Not applicable.
Item 9. Purchases of Equity Securities by Closed-End Management Company and Affiliated Purchasers.
Not applicable.
Item 10. Submission of Matters to a Vote of Security Holders.
The Registrant has a standing Governance Committee (the “Committee”) currently consisting of the independent trustees. The Committee is responsible for evaluating and recommending nominees for election to the Registrant’s Board of Trustees (the “Board”). Pursuant to the Committee’s Charter, adopted on June 18, 2004, the Committee will review all shareholder recommendations for nominations to fill vacancies on the Board if such recommendations are submitted in writing and addressed to the Committee at the Registrant’s office.
Item 11. Controls and Procedures.
(a) The Registrant’s principal executive and principal financial officers, or persons performing similar functions, have concluded that the Registrant’s disclosure controls and procedures (as defined in Rule 30a-3(c) under the Act (17 CFR 270.30a-3(c))) are effective, based on the evaluation of these controls and procedures required by Rule 30a-3(b) under the Act (17 CFR 270.30a-3(b)) and Rules 13a-15(b) or 15d-15(b) under the Exchange Act (17 CFR 240.13a-15(b) or 240.15d-15(b)) as of a date within 90 days of the filing date of this report.
(b) There were no changes in the Registrant’s internal control over financial reporting (as defined in Rule 30a-3(d) under the Act (17 CFR 274.130)) that occurred during the second fiscal quarter of the period covered by this report that have materially affected, or are reasonably likely to materially affect, the Registrant’s internal control over financial reporting.
Items 12. Exhibits.
(a)(1) Code of Ethics attached hereto.
(a)(2) A separate certification for the principal executive officer and the principal financial officer of the Registrant as required by Rule 30a-2(a) under the Act (17 CFR 270.30a-2(a)), as amended, are filed herewith.
(b) Officer certifications as required by Rule 30a-2(b) under the Investment Company Act of 1940, as amended (17 CFR 270.30a-2(b)), also accompany this filing as an exhibit.
SIGNATURES
Pursuant to the requirements of the Securities Exchange Act of 1934 and the Investment Company Act of 1940, the registrant has duly caused this report to be signed on its behalf by the undersigned, thereunto duly authorized.
| SEI Catholic Values Trust | ||||||
| By | /s/ Robert A. Nesher | |||||
| Robert A. Nesher, President & CEO | ||||||
Date: May 9, 2016
Pursuant to the requirements of the Securities Exchange Act of 1934 and the Investment Company Act of 1940, this report has been signed below by the following persons on behalf of the registrant and in the capacities and on the dates indicated.
| By | /s/ Robert A. Nesher | |||||
| Robert A. Nesher, President & CEO | ||||||
| Date: May 9, 2016 | ||||||
| By | /s/ Arthur Ramanjulu | |||||
| Arthur Ramanjulu, Controller & CFO | ||||||
| Date: May 9, 2016 | ||||||