UNITED STATES
SECURITIES AND EXCHANGE COMMISSION
Washington, D.C. 20549
FORM N-CSR
CERTIFIED SHAREHOLDER REPORT OF REGISTERED
MANAGEMENT INVESTMENT COMPANIES
Investment Company Act File Number 811-23015
SEI Catholic Values Trust
(Exact name of registrant as specified in charter)
SEI Investments
One Freedom Valley Drive
Oaks, Pennsylvania 19456
(Address of principal executive offices) (Zip code)
c/o CT Corporation
155 Federal Street
Boston, MA 02110
(Name and address of agent for service)
Registrant’s telephone number, including area code: 1-800-342-5734
Date of fiscal year end: February 28, 2018
Date of reporting period: February 28, 2018
| Item 1. | Reports to Stockholders. |

| February | 28, 2018 |
ANNUAL REPORT
SEI Catholic Values Trust
➤ Catholic Values Equity Fund
➤ Catholic Values Fixed Income Fund

| 1 | ||||
| 6 | ||||
| 12 | ||||
| 35 | ||||
| 36 | ||||
| 37 | ||||
| 38 | ||||
| 39 | ||||
| 53 | ||||
| 54 | ||||
| 57 | ||||
Board of Trustees Considerations in Approving the Advisory and Sub-Advisory Agreements | 58 | |||
| 64 | ||||
The Trust files its complete schedule of portfolio holdings with the Securities and Exchange Commission for the first and third quarter of each fiscal year on Form N-Q within sixty days after the end of the period. The Trust’s Forms N-Q are available on the Commission’s website at http://www.sec.gov, and may be reviewed and copied at the Commission’s Public Reference Room in Washington, DC. Information on the operation of the Public Reference Room may be obtained by calling 1-800-SEC-0330.
A description of the policies and procedures that the Trust uses to determine how to vote proxies relating to portfolio securities, as well as information relating to how a Fund voted proxies relating to portfolio securities during the most recent 12-month period ended June 30, is available (i) without charge, upon request, by calling 1-800-DIAL-SEI; and (ii) on the Commission’s website at http://www.sec.gov.
February 28, 2018 (Unaudited)
To our Shareholders:
Financial markets completed 2017 without any enduring missteps in an environment defined by strong investor appetite for higher-risk market segments. Fixed-income performance was positive across markets but ran the gamut in terms of strength — with emerging-market debt at the top end and U.S. Treasurys at the bottom, in keeping with the risk-on sentiment. However, the end of the fiscal year saw the sudden return of volatility to the markets. The VIX index rose to a three-year high, and risk-asset prices fell sharply in February, with the S&P 500 Index touching down 10% from its earlier highs. Robust economic data and consumer confidence in a healthy economy likely prevented a more sizeable market correction. By the end of the reporting period, equity markets had recovered a significant amount of the loss and looked to gain support from robust macro data and earnings momentum.
Looking back, the projections we shared for the Funds’ most recently completed fiscal year, from the start of March 2017 through the end of February 2018, mostly came to pass. The pace of interest-rate increases by the Federal Reserve (Fed) mostly followed the market’s expectations. Strength in the euro relative to the U.S. dollar through the year prevented a quick end to the European Central Bank’s (ECB) commitment to stimulus; the Japanese yen remained mostly range-bound while the Bank of Japan (BOJ) held monetary policy stable through the fiscal year. China continued to guide its currency lower, hitting a low near the end of the fiscal period.
We suggested that market sentiment would remain attuned to geopolitical developments; these accounted for the only significant exceptions to the global tranquility trend. Also, a fixation on tax reform and continued yield-curve flattening drove market movements throughout the latter part of the fiscal year.
The global oil supply-demand imbalance persisted throughout the first half of the period, before a strong rebound in oil during the second half of the fiscal year, supported by rising demand, geopolitical tensions and news that Saudi Arabia and Russia would extend an agreement to curb output.
Geopolitical Events
Geopolitical threats and an assortment of other noneconomic influences continued in various regions: civil war and domestic struggle in parts of the Middle East and Africa, the suffering of refugees and migrants in bordering countries and Europe, and acts of global terror. Severe unrest continued in some regions of the Middle East, driven by the conflicting and overlapping regional interests of extremist groups, nationalist fighters and state actors.
The lasting effect of the Syrian migrant crisis on the European Union (EU) remains unknown. Immigration served as one of the critical points of contention leading up to Great Britain’s Brexit vote to leave the European Union before the reporting year. Prime Minister May triggered Article 50 during the fiscal period and began the formal withdrawal process.
In the U.S., President Trump’s early actions following his inauguration just before the start of the fiscal year demonstrated a commitment to follow through on tighter U.S. immigration policy. President Trump stated that aggression from North Korea would be met with “fire and fury” while controversy over Trump’s response to violent clashes between protesters in Charlottesville, Virginia briefly drove market sentiment after the president dissolved two advisory councils. Setbacks in the Trump administration’s efforts to repeal and replace Obamacare initially sparked volatility, as investors assumed that tax and budget resolutions would have to wait until healthcare legislation was resolved. However, longer-term market reactions to geopolitical events were surprisingly muted.
A raft of political surprises unfolded during the fiscal period, but most played only a minor role in market movements. Centrism prevailed in elections for Europe’s most economically significant states, although not across the continent. Brexit negotiations were less critical to investors globally than was Europe’s sustained economic expansion; while the euro’s appreciation versus sterling may offer a clue about the market’s perception of post-divorce relative advantages, both currencies gained against the U.S. dollar. The U.K. Conservative party relinquished its parliamentary majority and was forced to seek a partner to form a minority government. Emmanuel Macron’s early-May victory in the French presidential election amounted to a significant win for the establishment.
In the U.S., a high-profile special prosecutor was appointed to investigate the possibility of collusion between Donald Trump’s presidential campaign and Russia. In Brazil, an ongoing top-level corruption scandal was blown wide open in mid-May as potential evidence emerged from a taped conversation featuring President Michel Temer approving a sizeable hush-money bribe.
| SEI Catholic Values Trust / Annual Report / February 28, 2018 | 1 |
LETTER TO SHAREHOLDERS (Continued)
February 28, 2018 (Unaudited)
Economic Performance
U.S. economic growth slumped early in 2017 and then rebounded solidly in the second quarter as consumer and spending boosted the economy. Third-quarter GDP grew at the fastest annual rate in three years, supported by a rebound in government investment and business spending on equipment. However, fourth-quarter growth unexpectedly slowed to a 2.6% yearly rate as strong consumer spending drove a surge in imports. The labor market remained historically strong throughout the year: the unemployment rate fell, finishing the period at 4.1%, while the labor-force participation rate ended at 63.0%, marginally higher than a year ago. Average hourly earnings gained, bouncing around a mean of about 0.2% growth per month over the year; although a modest increase in price pressures weighed on real personal income growth as the period progressed. The Fed raised its target interest rate in March 2017, and again in both June and December, with three additional rate increases projected in 2018. The Fed also began to unwind its balance sheet starting in October, reversing some of the quantitative easing that has been so supportive of bond prices in recent years.
The ECB held its benchmark interest rate unchanged at a historic low through the fiscal period, while the Bank of England raised its official bank rate for the first time in ten years, by 0.25%. Quarterly growth in the eurozone expanded at its quickest pace since 2011, emphasizing the area’s notable economic performance at a time that many thought would be plagued by political uncertainty. Year-on-year growth was 2.6% at the end of the fourth quarter of 2017, buoyed by acceleration in France and better-than-expected figures in Italy. The U.K. economy grew just 1.4% year-on-year through the fourth quarter of 2017 as Brexit uncertainty continued to hurt the economy and a weakened pound dampened consumer spending to its lowest level in five years.
Japanese GDP grew 2.0% year-on-year at the end of the fourth quarter of 2017; the BOJ maintained monetary stimulus, despite signs of economic improvement, in an attempt to drive higher inflation. Meanwhile, economic growth in China expanded by 6.8% year-on-year in the fourth quarter of 2017 after China’s government provided substantial fiscal stimulus early in the period to support the government’s growth goals, targeted at 6.5%.
Market Developments
For the fiscal year ending February 28, 2018, the period started with the U.S. equity market focused on President Trump’s pro-business policies. The “reflation trade” saw markets move in reaction to coordinated global expansion and normalizing monetary policy. However, the first few months saw setbacks for the Trump administration after Washington failed to pass a replacement for the Affordable Care Act and controversies involving Russian election meddling plagued the new administration. There was a realization that the growth expected from promised regulatory changes would take a while to play out, and markets began to unwind the reflation trade. At the same time, assets such as defensive sectors and technology stocks that lagged during the reflation trade rallied. Over the last four months of the year, the “reflation” trade rebounded strongly, amid steady global economic growth and the prospects of U.S. tax reform. Cyclically-oriented equity sectors benefited.
Growth stocks in general and the technology sector, in particular, outperformed during the full fiscal period, while high-dividend-yield segments of the market, such as utilities, lagged as they were seen as less attractive in a rising interest-rate environment. Stocks corrected toward the end of the fiscal year, with the S&P 500 Index falling close to 10% from its all-time high, precipitated by indications of accelerating U.S. inflation and corresponding concerns that future interest-rate increases by the Fed could come quicker than anticipated. Still, the current bull market is now the second-longest on record.
Energy stocks lagged globally, finishing the year with a modest absolute loss in the U.S. despite mounting an earnest rebound there starting in August. Telecommunications also ended in the red, presumably weakened by the repeal of net-neutrality regulations in the U.S. Both sectors were positive on a global scale but lagged the double-digit performance of their peers.
Growth typically outperformed value, as internet-commerce and information-technology stocks were the best-performing sectors for the full fiscal year. The final fiscal quarter rally propelled the FTSE/Russell 1000 Growth Index to 26.11% for the reporting year, while the FTSE/Russell 1000 Value Index returned 7.75% over the same period.
Large-cap stocks outperformed as well. U.S. large caps (FTSE/Russell 1000 Index) outpaced small caps (FTSE/Russell 2000 Index), delivering 16.70% and 10.51%, respectively.
| 2 | SEI Catholic Values Trust / Annual Report / February 28, 2018 |
Strong economic growth in Europe and positive political developments supported the European equity markets. Pro-euro French presidential candidate Emmanuel Macron was elected in May, although unpredictability in German and Spanish elections tested the markets later in the period.
European growth and inflation accelerated in 2017, and unemployment fell. Equities remained bolstered by accommodative monetary policy by the ECB, which only slightly began to remove stimulus; the euro finished up 15.3% versus the U.S. dollar for the year.
Looking back on market performance for the full period, the FTSE UK Series All Share Index was up 15.59% in U.S. dollar terms, but only 4.40% in sterling, as Brexit continued to overshadow the outlook for businesses. The MSCI ACWI Index, a proxy for global equities in both developed and emerging markets, rose 18.79% in U.S. dollar terms. U.S. markets marginally lagged, as the S&P 500 Index returned 17.10%.
For the first time in several years, emerging markets handily outpaced the developed world across asset classes in 2017 amid a synchronized global economic expansion. The MSCI Emerging Markets Index finished the year up 30.51% in U.S. dollar terms.
Asia, particularly Korea and China, was the top-performing region for equity markets; Latin America had an astonishing rally during the third quarter before partially retreating into year-end; Europe and Japan were strong performers among developed markets.
The risk-on sentiment that pushed equities higher was also visible in fixed-income markets, with credit outperforming government bonds. A continuing theme for U.S. fixed-income markets was the flattening yield curve. Yields for 10-year government bonds rose and ended the period about 50 basis points higher at 2.87%, while 2-year yields climbed over 100 basis points during the year to 2.25%. The U.S. Treasury yield curve flattened to a 10-year low, with short-term yields rising more than long-term yields. The Fed hiked rates three times in 2017 and pushed short-term yields higher, while longer-term bond yields remained flat as inflationary and future economic growth expectations remained subdued.
Front-end Treasury yields moved higher in response to the Fed increasing the fed-funds target rate to 1.25%-1.50%, marking the fifth rate hike during this tightening cycle. The Fed’s interest-rate projections, known as the dot plot, still suggest three rate hikes in 2018, subject to inflation moving toward the Federal Open Market Committee’s 2% target. The first of those hikes occurred just after the end of the fiscal period. Jerome Powell was nominated to succeed Janet Yellen as Fed Chair, Randal Quarles was named vice chair for bank supervision and Marvin Goodfriend, the former Fed economist, was chosen to fill one of three open governor seats. President Trump signed the Tax Cuts and Jobs Act into law, introducing several new policies, including a cap on state and local tax deductions, a one-time repatriation tax on overseas cash, a move to a territorial tax system and a permanent drop in the corporate tax rate from 35% to 21%.
Inflation-sensitive assets, such as commodities and Treasury Inflation-Protected Securities, were mixed. The Bloomberg Commodity Total Return Index (which represents the broad commodity market) rose 1.58% during the period, as agriculture sector weakness mitigated gains in the metals sector, while the Bloomberg Barclays 1-10 Year US TIPS Index (USD) eased 0.32% lower.
The price of oil ended the year up 13.8%, after entering bear-market territory in June and then rallying as much as 50% from its lows during the last six months.
Global fixed income, as measured by the Bloomberg Barclays Global Aggregate Index, climbed 6.01% in U.S. dollar terms during the reporting period, while the high-yield market was also positive, with the ICE BofAML US High Yield Constrained Index up 4.12%.
U.S. investment-grade corporate debt was higher, as the Bloomberg Barclays Investment Grade US Corporate Index returned 2.20%. U.S. asset- and mortgage-backed securities both managed marginal gains during the fiscal year and faced headwinds from rising interest rates and expectations for further rate increases.
Emerging-market debt delivered strong performance. The J.P. Morgan GBI Emerging Markets Global Diversified Index, which tracks local-currency-denominated emerging-market bonds, gained 14.43% in U.S. dollar terms during the reporting period thanks to an impressive rally in the first half of the period. The J.P. Morgan EMBI Global
| SEI Catholic Values Trust / Annual Report / February 28, 2018 | 3 |
LETTER TO SHAREHOLDERS (Concluded)
February 28, 2018 (Unaudited)
Diversified Index, which tracks emerging-market debt denominated in external currencies (such as the U.S. dollar), advanced by 4.39%.
Our View
We suspect the bull market in U.S. equities is somewhere around the beginning of the end, while it may be at a somewhat earlier stage for other countries. To be clear, we are not saying that the bull market in U.S. stocks is ending. Instead, we are noting that the fundamental, technical and psychological factors driving equity market performance appear to be consistent with the latter stages of an up-cycle. This particular phase can last a few years if all goes well, but the ride will likely be bumpier than in recent years. SEI still does not see many severe signs of overvaluation or economic imbalances that would suggest the imminent danger of a sharp correction, much less a devastating bear market on par with the 2008-09 experience.
Although equity markets experienced their first real correction in some 20 months during February and March, the pullback does not look to us as the start of a more severe decline. SEI sees two fundamental drivers behind the correction in equities and the return to more volatile price action. The first is the upward shift in investors’ interest-rate expectations as the global economy kicks into a higher gear. The second is concern that the Trump Administration’s recent actions on the trade front will lead to a broader trade war that could hurt upend global growth and push inflation higher sooner.
There indeed are cyclical pressures pushing yields up from their historic lows. The long bull market in equities and other risk-oriented assets has been sustained by the extraordinarily expansive monetary policies of the world’s most important central banks. The subsequent decline in yields across the maturity spectrum reached levels never seen before. In our view, this 37-year tailwind is turning into a headwind.
However, the U.S. Treasury yield curve remains upward sloping and, in our opinion, still can narrow further without causing too many problems. Interest-rate spreads for investment-grade, high-yield and emerging-market debt also remain near cycle lows. High-yield bonds, in particular, should be considered the canary in the coal mine. Spreads tend to widen well before the stock market tops out. Even during the recent turbulence in the stock market, the option-adjusted spread on high-yield bonds held surprisingly steady.
As we have pointed out on several occasions in the past, the U.S. equity market historically has withstood the depressive impact of rising interest rates until the 10-year bond reaches a level of 4%-to-5%. Owing to the structural decline in bond yields and the elevated equity valuations that have resulted, we now think it prudent to assume that the stock market will begin to struggle if the 10-year Treasury rate were to approach 4%, the lower end of the traditional “danger zone.”
While we maintain a favorable view of equities and other risk assets, we must admit that our optimism is being tested as the Trump Administration uses protectionism as a bargaining tool against friend and foe alike. Impediments to trade — tariffs, quotas and non-tariff barriers — raise prices and reduce demand, leading to a dead-weight loss for society. More jobs are lost by consuming industries than are gained by the beneficiaries of protection. A trade war of consequence could add to the inflation pressures that already are emerging as a result of the pick-up in economic activity and the tightening employment situation.
We are in the watchful-waiting mode when it comes to trade, but we think it is premature to expect a catastrophe. SEI prefers to see what trade sanctions are levied, and how target countries respond, instead of assuming the worst from the get-go. Until there is more clarity on the extent of the protectionist measures being put into place, we think it is best to focus on the healthy fundamental backdrop. Profits growth remains vibrant, inflation is still well-contained, and the Federal Reserve’s decision-makers would prefer to normalize monetary policy in a steady, predictable fashion. For now, we believe it is proper to maintain a risk-on investment orientation.
We have been disappointed by the poor relative performance of eurozone equities since the middle of last year. The eurozone economy has been gaining increasing traction since early 2016, and the potential for future growth was judged to be much higher in the eurozone than in the U.S. given their respective points in the economic cycle. We also looked for a jump in earnings, given the fact that European companies have a high degree of operational leverage, while valuation considerations also provided support to our bullish rationale.
| 4 | SEI Catholic Values Trust / Annual Report / February 28, 2018 |
On a fundamental basis, we think investors remain somewhat skeptical about the staying power of the European expansion. The ECB is moving away from supporting the eurozone’s economic recovery and credit markets via its asset purchases. Moreover, by mid-year 2019, if not sooner, we should see the first steps toward normalizing policy rates — although negative yields are an absurdly low starting point.
While the outlook for the eurozone is quite mixed, it seems bright and sunny compared to that of the United Kingdom. As we have mentioned in previous reports, Brexit has become the overwhelming obsession of investors and policymakers. Consumers in the U.K. are particularly perturbed. Consumer confidence in the eurozone, by contrast, has marched steadily higher since last summer, climbing to its highest level in nearly 18 years.
Businesses seem to be doing well owing to the Brexit-related decline in the value of the pound and buoyant demand arising from the global economic recovery. However, the uncertainties associated with Brexit are depressing investment in the U.K. and will likely continue to do so until there is far more clarity on the country’s future relationship with its biggest trading partner.
The latest wrinkle in the Brexit saga is the backing that the Labor Party leader, Jeremy Corbyn, has given to a customs union that would keep the U.K. closely tied to the European Union. This is a shrewd political move since it capitalizes both on the rifts within the Conservative Party as well as Prime Minister May’s current low popularity. She has managed to hang on precisely because the prospect of a government headed by Jeremy Corbyn is beyond the pale for most Conservatives and political moderates. If Mr. Corbyn managed to gain the keys to 10 Downing Street, we would expect a radical policy shift to the left, both economically and socially.
Italian politics also retain the potential to depress European equity markets if Five-Star and Lega (formerly known as the Northern League) manage to cobble together a coalition government. At best, this will cause the usual kind of Italian political dysfunction; at worst it could lead to additional worries about the solvency of the country and its commitment to the euro and the European project.
In the U.S., Congressional elections will be taking place in November, potentially putting Republican control of the House of Representatives in jeopardy. Legislating in the U.S. has been tough enough under a “unified” government; it will become next to impossible under split governance. Of course, we can also expect a Democratic House to engage in a variety of investigations of the President and his staff and Cabinet.
The past nine years have been full of challenges and uncertainties. The years ahead don’t seem to promise anything different in that regard. The bull market has managed through it all. Let’s give it the benefit of the doubt for a while longer. Although the ride has turned bumpier, SEI believes that economic fundamentals justify further gains in U.S. and global equity prices. The synchronized global expansion is still alive and well. Earnings continue to climb briskly around the world. U.S. companies’ cash flows and earnings, meanwhile, are benefiting mightily from tax reform. There are few signs that a recession will rear its ugly head anytime in the next 12-to-18 months.
On behalf of SEI Investments, I want to thank you for your continued confidence. We are working every day to maintain that trust, and we look forward to serving your investment needs in the future.
Sincerely,

Bill Lawrence
Head and Chief Investment Officer of Traditional Asset Management
| SEI Catholic Values Trust / Annual Report / February 28, 2018 | 5 |
MANAGEMENT’S DISCUSSION AND ANALYSIS OF FUND PERFORMANCE
FEBRUARY 28, 2018 (Unaudited)
Catholic Values Equity Fund
I. Objective
The Catholic Values Equity Fund (the “Fund”) seeks long-term capital appreciation.
II. Investment Approach
The Fund uses a multi-manager approach, relying on a number of sub-advisers with differing investment approaches to manage portions of the Fund’s portfolio, under the general supervision of SEI Investments Management Corporation (SIMC). The Fund utilized the following sub-advisers as of February 28, 2018: BlackRock Investment Management, LLC; Brandywine Global Investment Management, LLC; Coho Partners, Ltd.; EAM Investors, LLC; EARNEST Partners LLC; Parametric Portfolio Associates LLC; and Snow Capital Management, L.P. During the fiscal year, Ivy Investments (formerly Waddell & Reed Investments Management Company) was terminated on May 10, 2017.
III. Returns
For the period from March 1, 2017, through February 28, 2018, the Fund’s F class shares returned 18.93%. The Fund’s primary benchmark — the Russell 3000 Index (USD) — returned 16.22%.
IV. Performance Discussion
Market volatility was low for most of the year as investor response remained muted whenever potential macro or geopolitical concerns surfaced. Although short-term interest rates rose, longer-term rates were relatively stable. Better-than-expected corporate earnings and a continued global economic expansion partially drove the positive sentiment toward U.S. equities. At the end of the calendar year, the passage of U.S. tax reform provided an additional stimulus for the market.
Growth stocks led the market higher, with information technology producing the best returns among the Fund’s benchmark sectors. The so-called “FANG” stocks — Facebook, Amazon, Netflix and Google — generated outsized returns and drove broader market performance. The underperformance of the energy sector was one reason that value stocks lagged relative to growth stocks. As short-term interest rates increased, high dividend-yield stocks such as utilities, telecommunication services, and real-estate investment trusts fell out of favor.
At the beginning of February however, the market sold off as noted in the shareholder letter, and most major equity indices dropped at least 10% over the span of two weeks. Higher bond rates that began to price in
inflationary fears drove the increased volatility. Investors consequently expected the Federal Reserve to raise rates more aggressively to calm an overheated market. Combined with the stretched valuations that emerged after January’s impressive gains, the market moved into correction territory.
Stocks began to recover toward the end of the fiscal period, but equities remained expensive relative to historical norms, and there continued to be some notable stretched valuations among the most popular growth stocks. Although the linkage between valuation and subsequent short-term stock market returns is not reliable, the historical risk of mediocre or negative returns for cap-weighted market indexes over the long-run has increased when valuations have risen to above-average levels.
Blackrock was the leading contributor to excess return thanks to a sizable overweight to information technology and strong security selection within the sector. Earnest Partners also contributed with good selection in financials and industrials. Despite small-cap stocks largely trailing larger-cap stocks for the entire period, EAM was able to contribute due to the prevalence of momentum as a successful style. Coho, the Fund’s stability manager, detracted from performance due to style headwinds.
| 6 | SEI Catholic Values Trust / Annual Report / February 28, 2018 |
Catholic Values Equity Fund:
| AVERAGE ANNUAL TOTAL RETURN 1 | ||||||||
| One Year Return | Annualized to Date | |||||||
| Class F | 18.93% | 9.22% | ||||||
| Class Y | 19.05% | 9.43% | ||||||
| Russell 3000 Index | 16.22% | 11.26% | ||||||
Comparison of Change in the Value of a $10,000 Investment in the Catholic Values Equity Fund, Class F, versus the Russell 3000 Index
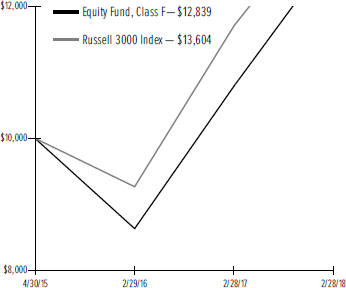
| 1 | For the year ended 2/28/2018. Past performance is no indication of future performance. Class F shares were offered beginning on 4/30/2015 and Class Y share were offered beginning 5/31/2015. The graph is based on only the Class F; performance for Class Y would be different due to differences in fee structures. Returns shown do not reflect the deduction of taxes that a shareholder would pay on Fund distributions or the redemption of Fund shares. The returns for certain periods reflect fee waivers and/or reimbursements in effect for that period; absent fee waivers and reimbursements, performance would have been lower. |
| * | Annualized inception to date performance is measured from 04/30/2015. |
SEI Catholic Values Trust / Annual Report / February 28, 2018 | 7 |
MANAGEMENT’S DISCUSSION AND ANALYSIS OF FUND PERFORMANCE
FEBRUARY 28, 2018 (Unaudited)
Catholic Values Equity Fund (Concluded)
Comparison of Change in the Value of a $10,000 Investment in the Catholic Values Equity Fund, Class Y, versus the Russell 3000 Index
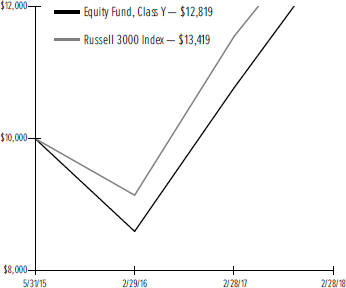
| 1 | For the year ended 2/28/2018. Past performance is no indication of future performance. Class Y shares were offered beginning on 5/31/2015 and Class F share were offered beginning 4/30/2015. The graph is based on only the Class Y; performance for Class F would be different due to differences in fee structures. Returns shown do not reflect the deduction of taxes that a shareholder would pay on Fund distributions or the redemption of Fund shares. The returns for certain periods reflect fee waivers and/or reimbursements in effect for that period; absent fee waivers and reimbursements, performance would have been lower. |
8 | SEI Catholic Values Trust / Annual Report / February 28, 2018 |
MANAGEMENT’S DISCUSSION AND ANALYSIS OF FUND PERFORMANCE
FEBRUARY 28, 2018 (Unaudited)
Catholic Values Fixed Income Fund
I. Objective
The Catholic Values Fixed Income Fund (the “Fund”) seeks a high level of current income with preservation of capital.
II. Investment Approach
The Fund uses a multi-manager approach, relying on a number of sub-advisers with differing investment approaches to manage portions of the Fund’s portfolio, under the general supervision of SEI Investments Management Corporation (SIMC). The Fund utilized the following sub-advisers as of February 28, 2018: Income Research & Management; Western Asset Management Company; and Western Asset Management Company Limited. There were no manager changes during the period.
III. Returns
For the period from March 1, 2017, through February 28, 2018, the Fund’s F class shares returned 0.87%. The Fund’s benchmark — the Bloomberg Barclays US Aggregate Bond Index (USD) — returned 0.51%.
IV. Performance Discussion
The fiscal year began with optimism that tax reform and budgetary spending would drive economic growth and support higher interest rates, but that optimism faded until late in the year. As a result, long-term U.S. Treasury yields declined from March 2017 peaks until tax reform passed at the end of 2017; yields then climbed to post-crisis highs, and inflationary expectations increased. As noted in the shareholder letter, 2-year Treasury yields moved nearly 100 basis points higher during the fiscal period as the Federal Reserve (Fed) raised the federal-funds rate in three separate 25 basis-point hikes. 10-year U.S. Treasury yields rose 47 basis points for the year and ended at 2.86%, from a low of 2.04% in early September. Economic growth expanded with 2017 GDP at 2.5% growth that was supportive for all spread sectors.
A slightly longer-duration posture subtracted from performance but was more than offset by the Fund’s yield-curve-flattening bias. During the fiscal year, corporate-bond spreads narrowed as confidence grew in the durability of U.S. economic growth. The Fund’s corporate bond overweight enhanced performance; an overweight to financials benefited from potential regulatory relief with new Fed chairman Jerome “Jay” Powell, and industrials benefited from robust economic growth. As housing prices continued to advance
and wages slowly improved, housing fundamentals remained firm, and combined with limited new issuance to provide support for non-agency mortgages, the Fund’s overweight was additive. The Fund’s overweight in the securitized sectors of asset-backed securities and commercial mortgage-backed securities was also additive as both the U.S. consumer and commercial properties benefited from improving wages and an expanding economy. Subtracting from relative returns was an underweight to agency mortgage-backed securities (MBS), which generated small outperformance relative to comparable Treasurys despite the rise in yields.
For Western Asset Management, a slightly longer-duration posture subtracted but was more than offset by its yield-curve-flattening bias. An overweight to corporate credit, particularly financials and industrials, along with a small allocation to high-yield and emerging-market debt enhanced returns, as credit-quality spreads narrowed in all these markets. An allocation to nonagency MBS was positive, while an underweight to agency mortgages subtracted. Income Research & Management benefited from an overweight to corporate credit while an underweight to agency MBS detracted from relative performance.
The Fund used Treasury futures, eurodollar futures and to-be-announced (TBA) forward contracts to efficiently manage duration, yield-curve and market exposures. (TBA contracts confer the obligation to buy or sell future debt obligations of the three U.S. government-sponsored agencies that issue or guarantee MBS — Fannie Mae, Freddie Mac and Ginnie Mae.) None of these had a meaningful impact on performance.
| SEI Catholic Values Trust / Annual Report / February 28, 2018 | 9 |
MANAGEMENT’S DISCUSSION AND ANALYSIS OF FUND PERFORMANCE
FEBRUARY 28, 2018 (Unaudited)
Catholic Values Fixed Income Fund (Concluded)
Catholic Values Fixed Income Fund:
| AVERAGE ANNUAL TOTAL RETURN 1 | ||||||||
One Year Return | Annualized Inception to Date | |||||||
| Class F | 0.87% | 1.59% | ||||||
| Class Y | 1.07% | 1.95% | ||||||
| Bloomberg Barclays U.S. Aggregate Bond Index | 0.51% | 1.29% | ||||||
Comparison of Change in the Value of a $10,000 Investment in the Fixed Income Fund, Class F, versus the Bloomberg Barclays U.S. Aggregate Bond Index
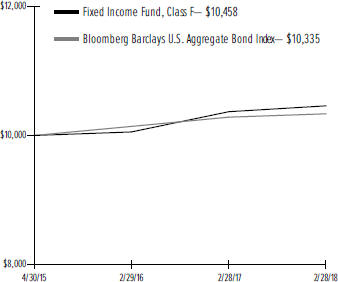
| 1 | For the year ended 2/28/2018. Past performance is no indication of future performance. Class F shares were offered beginning on 4/30/2015 and Class Y share were offered beginning 5/31/2015. The graph is based on only the Class F; performance for Class Y would be different due to differences in fee structures. Returns shown do not reflect the deduction of taxes that a shareholder would pay on Fund distributions or the redemption of Fund shares. The returns for certain periods reflect fee waivers and/or reimbursements in effect for that period; absent fee waivers and reimbursements, performance would have been lower. |
| * | Annualized inception to date performance is measured from 04/30/2015. |
| 10 | SEI Catholic Values Trust / Annual Report / February 28, 2018 |
Comparison of Change in the Value of a $10,000 Investment in the Fixed Income Fund, Class Y, versus the Bloomberg Barclays U.S. Aggregate Bond Index
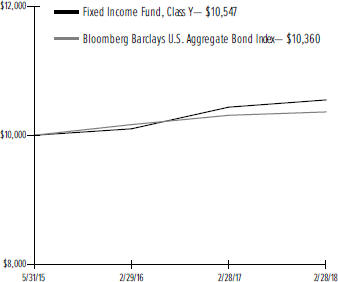
| 1 | For the year ended 2/28/2018. Past performance is no indication of future performance. Class Y shares were offered beginning on 5/31/2015 and Class F share were offered beginning 4/30/2015. The graph is based on only the Class Y; performance for Class F would be different due to differences in fee structures. Returns shown do not reflect the deduction of taxes that a shareholder would pay on Fund distributions or the redemption of Fund shares. The returns for certain periods reflect fee waivers and/or reimbursements in effect for that period; absent fee waivers and reimbursements, performance would have been lower. |
SEI Catholic Values Trust / Annual Report / February 28, 2018 | 11 |
February 28, 2018
Catholic Values Equity Fund
Sector Weightings (Unaudited)†:
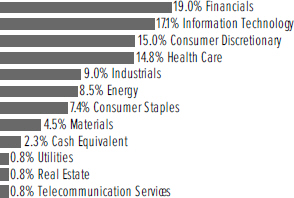
†Percentages based on total investments.
| Description | Shares | Market Value ($ Thousands) | ||||||||||
COMMON STOCK — 72.1% | ||||||||||||
Consumer Discretionary — 11.9% | ||||||||||||
Advance Auto Parts | 4,950 | $ | 566 | |||||||||
Amazon.com * | 2,448 | 3,702 | ||||||||||
At Home Group * | 3,523 | 104 | ||||||||||
Bed Bath & Beyond | 24,736 | 530 | ||||||||||
Big Lots | 8,073 | 454 | ||||||||||
Bloomin’ Brands | 4,180 | 97 | ||||||||||
Booking Holdings * | 525 | 1,068 | ||||||||||
Boot Barn Holdings * | 6,950 | 122 | ||||||||||
BorgWarner | 2,210 | 108 | ||||||||||
Carnival | 19,835 | 1,327 | ||||||||||
Cheesecake Factory | 9,922 | 461 | ||||||||||
Cinemark Holdings | 6,975 | 297 | ||||||||||
Comcast, Cl A | 8,448 | 306 | ||||||||||
Conn’s * | 2,822 | 92 | ||||||||||
Delphi Automotive * | 1,794 | 164 | ||||||||||
Dick’s Sporting Goods | 8,713 | 279 | ||||||||||
Dollar General | 29,904 | 2,829 | ||||||||||
Domino’s Pizza | 1,608 | 358 | ||||||||||
DR Horton | 1,552 | 65 | ||||||||||
Gap | 2,620 | 83 | ||||||||||
General Motors | 32,351 | 1,273 | ||||||||||
Gentherm * | 9,616 | 296 | ||||||||||
Goodyear Tire & Rubber | 22,138 | 641 | ||||||||||
Hanesbrands | 13,250 | 257 | ||||||||||
Hasbro | 931 | 89 | ||||||||||
Hilton Worldwide Holdings | 3,041 | 246 | ||||||||||
Home Depot | 7,001 | 1,276 | ||||||||||
John Wiley & Sons, Cl A | 1,163 | 75 | ||||||||||
Kohl’s | 1,544 | 102 | ||||||||||
L Brands | 1,996 | 98 | ||||||||||
Lowe’s | 33,743 | 3,023 | ||||||||||
Macy’s | 4,125 | 121 | ||||||||||
Marriott International, Cl A | 679 | 96 | ||||||||||
McDonald’s | 1,103 | 174 | ||||||||||
| Description | Shares | Market Value ($ Thousands) | ||||||||||
COMMON STOCK (continued) | ||||||||||||
Modine Manufacturing * | 4,790 | $ | 110 | |||||||||
Netflix * | 3,822 | 1,114 | ||||||||||
NIKE, Cl B | 12,142 | 814 | ||||||||||
Nordstrom | 1,516 | 78 | ||||||||||
Norwegian Cruise Line Holdings * | 1,804 | 103 | ||||||||||
Omnicom Group | 23,196 | 1,768 | ||||||||||
PVH | 565 | 82 | ||||||||||
Roku, Cl A * | 2,292 | 93 | ||||||||||
Ross Stores | 16,886 | 1,319 | ||||||||||
Royal Caribbean Cruises | 1,913 | 242 | ||||||||||
Signet Jewelers | 3,302 | 166 | ||||||||||
Skechers U.S.A., Cl A * | 9,216 | 377 | ||||||||||
Starbucks | 8,801 | 503 | ||||||||||
Target | 2,374 | 179 | ||||||||||
Tesla * | 416 | 143 | ||||||||||
Time Warner | 1,977 | 184 | ||||||||||
TJX | 3,493 | 289 | ||||||||||
Tractor Supply | 2,144 | 139 | ||||||||||
Tupperware Brands | 4,520 | 222 | ||||||||||
Ulta Beauty * | 2,814 | 572 | ||||||||||
Visteon * | 1,591 | 197 | ||||||||||
Walt Disney | 7,465 | 770 | ||||||||||
Weight Watchers International * | 1,451 | 98 | ||||||||||
Williams-Sonoma | 1,979 | 102 | ||||||||||
Wyndham Worldwide | 1,185 | 137 | ||||||||||
Yum China Holdings | 7,728 | 335 | ||||||||||
| 30,915 | ||||||||||||
Consumer Staples — 6.1% | ||||||||||||
Altria Group | 1,706 | 107 | ||||||||||
Campbell Soup | 5,416 | 233 | ||||||||||
Clorox | 2,666 | 344 | ||||||||||
Colgate-Palmolive | 7,862 | 542 | ||||||||||
Constellation Brands, Cl A | 2,625 | 566 | ||||||||||
CVS Health | 47,467 | 3,215 | ||||||||||
Dr Pepper Snapple Group | 2,773 | 322 | ||||||||||
General Mills | 5,126 | 259 | ||||||||||
Hershey | 1,957 | 192 | ||||||||||
JM Smucker | 19,457 | 2,457 | ||||||||||
Kellogg | 3,231 | 214 | ||||||||||
Kimberly-Clark | 6,280 | 697 | ||||||||||
Kroger | 82,024 | 2,224 | ||||||||||
Molson Coors Brewing, Cl B | 8,246 | 629 | ||||||||||
Mondelez International, Cl A | 3,900 | 171 | ||||||||||
PepsiCo | 8,186 | 898 | ||||||||||
Philip Morris International | 23,992 | 2,484 | ||||||||||
Sysco | 2,856 | 170 | ||||||||||
| 15,724 | ||||||||||||
Energy — 4.5% | ||||||||||||
Anadarko Petroleum | 4,092 | 233 | ||||||||||
Baker Hughes a GE | 2,612 | 69 | ||||||||||
Chevron | 14,188 | 1,588 | ||||||||||
| 12 | SEI Catholic Values Trust / Annual Report / February 28, 2018 |
| Description | Shares | Market Value ($ Thousands) | ||||||||||
COMMON STOCK (continued) | ||||||||||||
ConocoPhillips | 10,010 | $ | 544 | |||||||||
Core Laboratories | 11,533 | 1,187 | ||||||||||
Devon Energy | 29,085 | 892 | ||||||||||
ExxonMobil | 6,869 | 520 | ||||||||||
Gulfport Energy * | 61,052 | 592 | ||||||||||
Halliburton | 1,550 | 72 | ||||||||||
Helmerich & Payne | 11,750 | 758 | ||||||||||
Hess | 4,719 | 214 | ||||||||||
Kinder Morgan | 22,716 | 368 | ||||||||||
Marathon Oil | 6,542 | 95 | ||||||||||
Newfield Exploration * | 5,376 | 125 | ||||||||||
Noble Energy | 2,467 | 74 | ||||||||||
Occidental Petroleum | 30,461 | 1,998 | ||||||||||
Oceaneering International * | 9,927 | 182 | ||||||||||
PBF Energy, Cl A | 10,058 | 295 | ||||||||||
ProPetro Holding * | 6,049 | 98 | ||||||||||
Range Resources | 5,224 | 69 | ||||||||||
Schlumberger | 16,141 | 1,059 | ||||||||||
Solaris Oilfield Infrastructure, Cl A * | 9,772 | 164 | ||||||||||
Southwestern Energy * | 48,198 | 172 | ||||||||||
Whiting Petroleum * | 7,922 | 216 | ||||||||||
WildHorse Resource Development * | 5,327 | 90 | ||||||||||
| 11,674 | ||||||||||||
Financials — 11.9% | ||||||||||||
Aflac | 25,686 | 2,283 | ||||||||||
American Equity Investment Life Holding | 14,688 | 450 | ||||||||||
American Express | 1,031 | 101 | ||||||||||
American International Group | 1,158 | 66 | ||||||||||
Bancorp * | 11,891 | 126 | ||||||||||
Bank of America | 76,933 | 2,470 | ||||||||||
Bank of New York Mellon | 6,349 | 362 | ||||||||||
BankUnited | 4,910 | 197 | ||||||||||
Blackstone Group (A) | 29,443 | 1,001 | ||||||||||
Brighthouse Financial * | 1,441 | 78 | ||||||||||
Citigroup | 48,103 | 3,631 | ||||||||||
CNA Financial | 15,348 | 784 | ||||||||||
CNO Financial Group | 4,204 | 95 | ||||||||||
Cowen, Cl A * | 8,439 | 121 | ||||||||||
Cullen | 5,774 | 600 | ||||||||||
Everest Re Group | 3,800 | 913 | ||||||||||
First Republic Bank | 1,934 | 179 | ||||||||||
FNB | 7,003 | 98 | ||||||||||
Goldman Sachs Group | 2,228 | 586 | ||||||||||
Great Western Bancorp | 24,630 | 1,007 | ||||||||||
Invesco | 5,468 | 178 | ||||||||||
JPMorgan Chase | 21,897 | 2,529 | ||||||||||
KKR | 65,011 | 1,395 | ||||||||||
Legg Mason | 1,747 | 70 | ||||||||||
Marsh & McLennan | 24,009 | 1,993 | ||||||||||
MetLife | 4,026 | 186 | ||||||||||
Morningstar | 1,265 | 118 | ||||||||||
National General Holdings | 4,973 | 114 | ||||||||||
| Description | Shares | Market Value ($ Thousands) | ||||||||||
COMMON STOCK (continued) | ||||||||||||
Northern Trust | 2,684 | $ | 284 | |||||||||
OneMain Holdings, Cl A * | 9,999 | 307 | ||||||||||
PNC Financial Services Group | 1,879 | 296 | ||||||||||
Prudential Financial | 7,197 | 765 | ||||||||||
Radian Group | 4,700 | 96 | ||||||||||
Regions Financial | 12,350 | 240 | ||||||||||
S&P Global | 5,779 | 1,108 | ||||||||||
Santander Consumer USA Holdings | 29,788 | 487 | ||||||||||
SLM * | 53,624 | 585 | ||||||||||
State Street | 36,430 | 3,867 | ||||||||||
Synchrony Financial | 9,357 | 341 | ||||||||||
T Rowe Price Group | 1,349 | 151 | ||||||||||
US Bancorp | 2,210 | 120 | ||||||||||
Voya Financial | 2,096 | 107 | ||||||||||
Wells Fargo | 5,553 | 324 | ||||||||||
| 30,809 | ||||||||||||
Health Care — 12.6% | ||||||||||||
Abaxis | 1,321 | 88 | ||||||||||
Abbott Laboratories | 53,451 | 3,225 | ||||||||||
Aetna | 1,231 | 218 | ||||||||||
Agios Pharmaceuticals * | 1,120 | 90 | ||||||||||
Akorn * | 8,725 | 148 | ||||||||||
Alexion Pharmaceuticals * | 5,077 | 596 | ||||||||||
Align Technology * | 436 | 114 | ||||||||||
Alkermes * | 1,569 | 90 | ||||||||||
AmerisourceBergen, Cl A | 25,100 | 2,389 | ||||||||||
Amgen | 21,064 | 3,871 | ||||||||||
Anthem | 1,653 | 389 | ||||||||||
Array BioPharma* | 10,629 | 184 | ||||||||||
Avexis * | 992 | 123 | ||||||||||
AxoGen * | 4,956 | 145 | ||||||||||
Baxter International | 13,312 | 902 | ||||||||||
BioMarin Pharmaceutical * | 3,082 | 250 | ||||||||||
Bluebird Bio * | 798 | 160 | ||||||||||
Blueprint Medicines * | 1,190 | 103 | ||||||||||
Boston Scientific * | 39,184 | 1,068 | ||||||||||
Brookdale Senior Living * | 6,159 | 40 | ||||||||||
Bruker | 19,399 | 595 | ||||||||||
Cardinal Health | 1,388 | 96 | ||||||||||
Catalyst Pharmaceuticals * | 30,833 | 98 | ||||||||||
Cerner * | 1,418 | 91 | ||||||||||
Cigna | 3,093 | 606 | ||||||||||
Collegium Pharmaceutical * | 5,263 | 126 | ||||||||||
CONMED | 1,665 | 101 | ||||||||||
Cutera * | 2,907 | 131 | ||||||||||
Cymabay Therapeutics * | 17,791 | 265 | ||||||||||
DaVita * | 1,288 | 93 | ||||||||||
DENTSPLY SIRONA | 2,784 | 156 | ||||||||||
Edwards Lifesciences * | 3,244 | 434 | ||||||||||
Envision Healthcare * | 1,431 | 55 | ||||||||||
Esperion Therapeutics * | 2,069 | 166 | ||||||||||
Exelixis * | 2,597 | 67 | ||||||||||
| SEI Catholic Values Trust /Annual Report / February 28, 2018 | 13 |
SCHEDULE OF INVESTMENTS
February 28, 2018
Catholic Values Equity Fund (Continued)
| Description | Shares | Market Value ($ Thousands) | ||||||||||
COMMON STOCK (continued) | ||||||||||||
Express Scripts Holding * | 1,931 | $ | 146 | |||||||||
Gilead Sciences | 11,322 | 891 | ||||||||||
Global Blood Therapeutics * | 1,924 | 113 | ||||||||||
Globus Medical, Cl A * | 2,271 | 108 | ||||||||||
GlycoMimetics * | 8,335 | 192 | ||||||||||
Haemonetics * | 1,547 | 110 | ||||||||||
Henry Schein * | 4,418 | 292 | ||||||||||
Heron Therapeutics * | 4,264 | 87 | ||||||||||
Hill-Rom Holdings | 1,390 | 116 | ||||||||||
Horizon Pharma * | 40,030 | 584 | ||||||||||
Humana | 1,039 | 282 | ||||||||||
IDEXX Laboratories * | 489 | 92 | ||||||||||
ImmunoGen * | 10,219 | 114 | ||||||||||
Incyte * | 1,419 | 121 | ||||||||||
Inogen * | 1,472 | 178 | ||||||||||
Insulet * | 1,701 | 128 | ||||||||||
Intercept Pharmaceuticals * | 737 | 44 | ||||||||||
Intersect ENT * | 6,475 | 239 | ||||||||||
Iovance Biotherapeutics * | 7,300 | 127 | ||||||||||
IQVIA Holdings * | 8,439 | 830 | ||||||||||
iRhythm Technologies * | 2,626 | 163 | ||||||||||
Laboratory Corp of America Holdings * | 513 | 89 | ||||||||||
Lannett * | 33,284 | 533 | ||||||||||
Lantheus Holdings * | 1,108 | 17 | ||||||||||
Madrigal Pharmaceuticals * | 1,411 | 178 | ||||||||||
Magellan Health * | 1,017 | 103 | ||||||||||
Mallinckrodt * | 19,191 | 320 | ||||||||||
McKesson | 998 | 149 | ||||||||||
Merit Medical Systems * | 2,551 | 116 | ||||||||||
Mettler-Toledo International * | 1,525 | 940 | ||||||||||
Molina Healthcare * | 2,612 | 189 | ||||||||||
Nektar Therapeutics, Cl A * | 2,946 | 255 | ||||||||||
Neurocrine Biosciences * | 1,611 | 136 | ||||||||||
Novocure * | 4,901 | 101 | ||||||||||
Pieris Pharmaceuticals * | 13,576 | 116 | ||||||||||
PRA Health Sciences * | 8,463 | 711 | ||||||||||
Quest Diagnostics | 3,247 | 335 | ||||||||||
Quidel * | 3,151 | 137 | ||||||||||
Regeneron Pharmaceuticals * | 1,037 | 332 | ||||||||||
ResMed | 4,027 | 384 | ||||||||||
Revance Therapeutics * | 5,963 | 185 | ||||||||||
Sage Therapeutics * | 639 | 103 | ||||||||||
Sarepta Therapeutics * | 2,627 | 165 | ||||||||||
Seattle Genetics * | 1,264 | 68 | ||||||||||
Stryker | 640 | 104 | ||||||||||
Tabula Rasa HealthCare * | 2,870 | 93 | ||||||||||
Teladoc * | 3,233 | 130 | ||||||||||
Teleflex | 473 | 118 | ||||||||||
TESARO * | 567 | 31 | ||||||||||
United Therapeutics * | 1,032 | 120 | ||||||||||
Varian Medical Systems * | 3,135 | 374 | ||||||||||
Vertex Pharmaceuticals * | 3,413 | 567 | ||||||||||
| Description | Shares | Market Value ($ Thousands) | ||||||||||
| COMMON STOCK (continued) | ||||||||||||
ViewRay * | 10,594 | $ | 88 | |||||||||
Waters * | 4,493 | 919 | ||||||||||
WaVe Life Sciences * | 2,665 | 136 | ||||||||||
WellCare Health Plans * | 480 | 93 | ||||||||||
West Pharmaceutical Services | 999 | 87 | ||||||||||
Zimmer Biomet Holdings | 3,543 | 412 | ||||||||||
Zoetis, Cl A | 18,258 | 1,476 | ||||||||||
Zogenix * | 5,072 | 215 | ||||||||||
| 32,855 | ||||||||||||
Industrials — 7.9% | ||||||||||||
3M | 8,524 | 2,007 | ||||||||||
ACCO Brands | 11,823 | 150 | ||||||||||
AGCO | 1,432 | 95 | ||||||||||
American Airlines Group | 13,627 | 739 | ||||||||||
Apogee Enterprises | 2,945 | 127 | ||||||||||
Atlas Air Worldwide Holdings * | 7,814 | 475 | ||||||||||
Caterpillar | 2,969 | 459 | ||||||||||
Clean Harbors * | 9,378 | 468 | ||||||||||
CoStar Group * | 288 | 99 | ||||||||||
CSX | 1,508 | 81 | ||||||||||
Cummins | 2,003 | 337 | ||||||||||
Deere | 2,107 | 339 | ||||||||||
Delta Air Lines | 16,527 | 891 | ||||||||||
Dover | 1,366 | 137 | ||||||||||
Dun & Bradstreet | 3,358 | 420 | ||||||||||
Eaton | 12,203 | 985 | ||||||||||
Equifax | 3,663 | 414 | ||||||||||
FedEx | 1,376 | 339 | ||||||||||
Flowserve | 1,306 | 55 | ||||||||||
H&E Equipment Services | 2,945 | 111 | ||||||||||
Illinois Tool Works | 13,107 | 2,116 | ||||||||||
Ingersoll-Rand | 3,915 | 348 | ||||||||||
Insteel Industries | 6,943 | 196 | ||||||||||
JetBlue Airways * | 9,720 | 205 | ||||||||||
Johnson Controls International | 10,516 | 388 | ||||||||||
LB Foster, Cl A * | 3,821 | 100 | ||||||||||
Macquarie Infrastructure | 3,460 | 140 | ||||||||||
Magna International | 11,098 | 610 | ||||||||||
ManpowerGroup | 3,245 | 384 | ||||||||||
Nielsen Holdings | 2,443 | 80 | ||||||||||
On Assignment * | 1,528 | 117 | ||||||||||
Owens Corning | 3,226 | 262 | ||||||||||
Parker-Hannifin | 356 | 64 | ||||||||||
Rockwell Automation | 1,703 | 308 | ||||||||||
Rockwell Collins | 813 | 112 | ||||||||||
Southwest Airlines | 1,122 | 65 | ||||||||||
Spirit AeroSystems Holdings, Cl A | 2,040 | 186 | ||||||||||
Stanley Black & Decker | 440 | 70 | ||||||||||
TransDigm Group * | 830 | 239 | ||||||||||
Trinity Industries | 13,640 | 445 | ||||||||||
Triumph Group | 2,475 | 69 | ||||||||||
Union Pacific | 5,474 | 713 | ||||||||||
| 14 | SEI Catholic Values Trust / Annual Report / February 28, 2018 |
| Description | Shares | Market Value ($ Thousands) | ||||||||||
COMMON STOCK (continued) | ||||||||||||
United Continental Holdings * | 11,161 | $ | 757 | |||||||||
United Parcel Service, Cl B | 967 | 101 | ||||||||||
Univar * | 18,115 | 522 | ||||||||||
Waste Management | 1,893 | 163 | ||||||||||
WESCO International * | 1,999 | 124 | ||||||||||
WW Grainger | 9,156 | 2,395 | ||||||||||
Xylem | 7,036 | 525 | ||||||||||
| 20,532 | ||||||||||||
Information Technology — 12.8% | ||||||||||||
Accenture, Cl A | 4,838 | 779 | ||||||||||
Adobe Systems * | 6,453 | 1,350 | ||||||||||
Alliance Data Systems | 1,272 | 307 | ||||||||||
Alphabet, Cl A * | 2,076 | 2,292 | ||||||||||
Alphabet, Cl C * | 600 | 663 | ||||||||||
Analog Devices | 1,648 | 149 | ||||||||||
Apple | 8,115 | 1,445 | ||||||||||
Applied Materials | 4,556 | 262 | ||||||||||
Autodesk * | 6,051 | 711 | ||||||||||
Automatic Data Processing | 22,260 | 2,567 | ||||||||||
Broadcom | 1,465 | 361 | ||||||||||
CA | 3,448 | 121 | ||||||||||
Cisco Systems | 55,099 | 2,467 | ||||||||||
Dell Technologies, Cl V * | 3,974 | 295 | ||||||||||
DXC Technology | 691 | 71 | ||||||||||
eBay * | 5,606 | 240 | ||||||||||
Electronic Arts * | 3,256 | 403 | ||||||||||
Facebook, Cl A * | 8,040 | 1,434 | ||||||||||
Finisar * | 14,386 | 259 | ||||||||||
First Data, Cl A * | 12,430 | 194 | ||||||||||
Flex * | 13,491 | 244 | ||||||||||
Genpact | 7,091 | 222 | ||||||||||
GTT Communications * | 2,137 | 110 | ||||||||||
Hewlett Packard Enterprise | 19,033 | 354 | ||||||||||
HP | 14,223 | 333 | ||||||||||
Integrated Device Technology * | 11,861 | 360 | ||||||||||
Intel | 13,087 | 645 | ||||||||||
International Business Machines | 4,171 | 650 | ||||||||||
Intuit | 1,960 | 327 | ||||||||||
Keysight Technologies * | 4,982 | 234 | ||||||||||
Lam Research | 883 | 169 | ||||||||||
MasterCard, Cl A | 2,594 | 456 | ||||||||||
Microchip Technology | 16,396 | 1,458 | ||||||||||
Micron Technology * | 21,162 | 1,033 | ||||||||||
Microsoft | 41,011 | 3,846 | ||||||||||
MINDBODY, Cl A * | 3,101 | 111 | ||||||||||
NetApp | 2,221 | 134 | ||||||||||
NVIDIA | 3,801 | 920 | ||||||||||
ON Semiconductor * | 5,777 | 138 | ||||||||||
Oracle | 11,105 | 563 | ||||||||||
PayPal Holdings * | 4,874 | 387 | ||||||||||
QUALCOMM | 2,930 | 190 | ||||||||||
Rogers * | 657 | 90 | ||||||||||
| Description | Shares | Market Value ($ Thousands) | ||||||||||
COMMON STOCK (continued) | ||||||||||||
Salesforce.com * | 3,263 | $ | 379 | |||||||||
Super Micro Computer * | 11,131 | 201 | ||||||||||
Switch, Cl A | 6,166 | 85 | ||||||||||
Symantec | 5,916 | 156 | ||||||||||
Synaptics * | 2,693 | 125 | ||||||||||
Texas Instruments | 5,145 | 557 | ||||||||||
USA Technologies * | 11,235 | 92 | ||||||||||
VeriFone Systems * | 22,019 | 366 | ||||||||||
Visa, Cl A | 14,069 | 1,730 | ||||||||||
Workday, Cl A * | 1,708 | 216 | ||||||||||
Xerox | 1,412 | 43 | ||||||||||
| 33,294 | ||||||||||||
Materials — 2.2% | ||||||||||||
Air Products & Chemicals | 2,798 | 450 | ||||||||||
Alcoa * | 1,923 | 86 | ||||||||||
Avery Dennison | 2,207 | 261 | ||||||||||
Ball | 10,463 | 418 | ||||||||||
Cabot | 2,572 | 155 | ||||||||||
Crown Holdings * | 1,957 | 98 | ||||||||||
DowDuPont | 9,487 | 667 | ||||||||||
Eastman Chemical | 4,922 | 498 | ||||||||||
Ecolab | 466 | 61 | ||||||||||
FMC | 1,027 | 81 | ||||||||||
KMG Chemicals | 1,796 | 108 | ||||||||||
LSB Industries * | 14,146 | 106 | ||||||||||
Owens-Illinois * | 8,498 | 183 | ||||||||||
Praxair | 6,554 | 981 | ||||||||||
Reliance Steel & Aluminum | 1,205 | 109 | ||||||||||
Sherwin-Williams | 865 | 347 | ||||||||||
Sonoco Products | 6,077 | 292 | ||||||||||
United States Steel | 9,431 | 410 | ||||||||||
Vulcan Materials | 2,699 | 318 | ||||||||||
| 5,629 | ||||||||||||
Real Estate — 0.8% | ||||||||||||
American Campus Communities ‡ | 5,010 | 183 | ||||||||||
AvalonBay Communities ‡ | 909 | 142 | ||||||||||
Corporate Office Properties Trust ‡ | 6,430 | 160 | ||||||||||
Forest City Realty Trust, Cl A ‡ | 4,178 | 89 | ||||||||||
Host Hotels & Resorts ‡ | 13,708 | 254 | ||||||||||
Prologis ‡ | 9,818 | 596 | ||||||||||
VEREIT ‡ | 38,194 | 262 | ||||||||||
Welltower ‡ | 775 | 41 | ||||||||||
Weyerhaeuser ‡ | 7,943 | 278 | ||||||||||
| 2,005 | ||||||||||||
Telecommunication Services — 0.6% | ||||||||||||
AT&T | 32,812 | 1,191 | ||||||||||
Verizon Communications | 9,955 | 475 | ||||||||||
| 1,666 | ||||||||||||
Utilities — 0.8% | ||||||||||||
American Water Works | 950 | 75 | ||||||||||
SEI Catholic Values Trust / Annual Report / February 28, 2018 | 15 |
SCHEDULE OF INVESTMENTS
February 28, 2018
Catholic Values Equity Fund (Concluded)
| Description | Shares | Market Value ($ Thousands) | ||||||||||
COMMON STOCK (continued) | ||||||||||||
CMS Energy | 11,029 | $ | 468 | |||||||||
DTE Energy | 8,693 | 876 | ||||||||||
Eversource Energy | 2,451 | 140 | ||||||||||
Exelon | 3,510 | 130 | ||||||||||
PG&E * | 1,952 | 80 | ||||||||||
Xcel Energy | 6,735 | 291 | ||||||||||
| 2,060 | ||||||||||||
Total Common Stock (Cost $154,290) ($ Thousands) | 187,163 | |||||||||||
FOREIGN COMMON STOCK — 23.9% | ||||||||||||
Argentina — 0.1% | ||||||||||||
MercadoLibre * | 687 | 267 | ||||||||||
Australia — 0.3% | ||||||||||||
BHP Billiton ADR | 17,372 | 808 | ||||||||||
Austria — 1.1% | ||||||||||||
Erste Group Bank | 26,614 | 1,360 | ||||||||||
Schoeller-Bleckmann Oilfield Equipment | 6,391 | 662 | ||||||||||
voestalpine | 15,971 | 927 | ||||||||||
| 2,949 | ||||||||||||
Bermuda — 0.0% | ||||||||||||
Aspen Insurance Holdings | 1,021 | 37 | ||||||||||
Brazil — 0.6% | ||||||||||||
Banco Bradesco ADR * | 93,866 | 1,121 | ||||||||||
JBS | 157,400 | 477 | ||||||||||
| 1,598 | ||||||||||||
Canada — 1.7% | ||||||||||||
Canadian Natural Resources | 40,941 | 1,288 | ||||||||||
Magna International | 15,741 | 867 | ||||||||||
Rogers Communications, Cl B | 9,788 | 442 | ||||||||||
Tencent Holdings ADR | 30,700 | 1,685 | ||||||||||
| 4,282 | ||||||||||||
China — 0.6% | ||||||||||||
Anhui Conch Cement, Cl H | 176,500 | 946 | ||||||||||
BYD, Cl H * | 77,000 | 713 | ||||||||||
| 1,659 | ||||||||||||
Colombia — 0.4% | ||||||||||||
Bancolombia ADR | 23,707 | 1,000 | ||||||||||
Czech Republic — 0.1% | ||||||||||||
Komercni banka as | 5,503 | 245 | ||||||||||
France — 1.5% | ||||||||||||
BNP Paribas ADR | 16,580 | 656 | ||||||||||
Publicis Groupe | 13,941 | 1,055 | ||||||||||
Societe Generale | 16,949 | 974 | ||||||||||
| Description | Shares | Market Value ($ Thousands) | ||||||||||
FOREIGN COMMON STOCK (continued) | ||||||||||||
Sodexo | 9,067 | $ | 1,118 | |||||||||
| 3,803 | ||||||||||||
Germany — 0.8% | ||||||||||||
BASF | 4,687 | 494 | ||||||||||
Continental | 5,660 | 1,558 | ||||||||||
| 2,052 | ||||||||||||
Ghana — 0.0% | ||||||||||||
Kosmos Energy * | 12,111 | 65 | ||||||||||
Hong Kong — 0.4% | ||||||||||||
China Life Insurance, Cl H | 362,000 | 1,076 | ||||||||||
India — 0.8% | ||||||||||||
HDFC Bank ADR | 12,805 | 1,244 | ||||||||||
ICICI Bank ADR | 95,378 | 906 | ||||||||||
| 2,150 | ||||||||||||
Indonesia — 0.1% | ||||||||||||
Indofood Sukses Makmur | 200,800 | 111 | ||||||||||
Ireland — 1.5% | ||||||||||||
AerCap Holdings * | 7,480 | 371 | ||||||||||
ICON * | 19,041 | 2,158 | ||||||||||
Jazz Pharmaceuticals * | 5,086 | 736 | ||||||||||
Medtronic | 9,136 | 730 | ||||||||||
| 3,995 | ||||||||||||
Israel — 0.2% | ||||||||||||
Check Point Software Technologies * | 5,467 | 568 | ||||||||||
Italy — 0.5% | ||||||||||||
Prysmian | 36,900 | 1,166 | ||||||||||
Japan — 1.5% | ||||||||||||
Denso | 27,000 | 1,590 | ||||||||||
Hitachi | 138,000 | 1,058 | ||||||||||
Toray Industries | 117,800 | 1,199 | ||||||||||
| 3,847 | ||||||||||||
Mexico — 0.3% | ||||||||||||
Grupo Financiero Banorte, Cl O | 132,200 | 792 | ||||||||||
Netherlands — 2.9% | ||||||||||||
ASML Holding, Cl G | 4,656 | 910 | ||||||||||
Heineken | 11,378 | 1,187 | ||||||||||
QIAGEN * | 16,627 | 560 | ||||||||||
RELX | 73,001 | 1,500 | ||||||||||
Royal Dutch Shell, Cl A | 40,775 | 1,304 | ||||||||||
Royal Dutch Shell ADR, Cl A | 33,083 | 2,093 | ||||||||||
| 7,554 | ||||||||||||
Norway — 1.5% | ||||||||||||
DNB | 98,227 | 1,952 | ||||||||||
Norsk Hydro | 148,406 | 1,009 | ||||||||||
Statoil ADR | 40,132 | 908 | ||||||||||
| 3,869 | ||||||||||||
| 16 | SEI Catholic Values Trust / Annual Report / February 28, 2018 |
| Description | Shares | Market Value ($ Thousands) | ||||||||||
FOREIGN COMMON STOCK (continued) | ||||||||||||
Puerto Rico — 0.2% | ||||||||||||
OFG Bancorp | 57,127 | $ | 614 | |||||||||
Singapore — 0.4% | ||||||||||||
DBS Group Holdings | 44,800 | 972 | ||||||||||
South Korea — 0.7% | ||||||||||||
Hyundai Mobis | 3,218 | 678 | ||||||||||
Samsung Electronics | 515 | 1,119 | ||||||||||
| 1,797 | ||||||||||||
Spain — 0.5% | ||||||||||||
Amadeus IT Group, Cl A | 16,282 | 1,203 | ||||||||||
Sweden — 0.3% | ||||||||||||
Getinge, Cl B | 54,897 | 693 | ||||||||||
Switzerland — 0.7% | ||||||||||||
Credit Suisse Group ADR | 100,347 | 1,842 | ||||||||||
Taiwan — 1.3% | ||||||||||||
Advanced Semiconductor Engineering | 645,400 | 879 | ||||||||||
Hon Hai Precision Industry | 301,200 | 909 | ||||||||||
Taiwan Semiconductor Manufacturing | 200,000 | 1,685 | ||||||||||
| 3,473 | ||||||||||||
Turkey — 0.2% | ||||||||||||
Akbank Turk | 221,493 | 619 | ||||||||||
United Kingdom — 2.7% | ||||||||||||
Barclays | 365,754 | 1,076 | ||||||||||
BP ADR | 45,056 | 1,751 | ||||||||||
Diageo | 42,762 | 1,449 | ||||||||||
HSBC Holdings | 108,808 | 1,075 | ||||||||||
ITV | 312,469 | 689 | ||||||||||
Rio Tinto ADR | 15,465 | 846 | ||||||||||
| Description | Shares | Market Value ($ Thousands) | ||||||||||
FOREIGN COMMON STOCK (continued) | ||||||||||||
STERIS | 1,076 | $ | 98 | |||||||||
| 6,984 | ||||||||||||
Total Foreign Common Stock | 62,090 | |||||||||||
CASH EQUIVALENT — 2.2% | ||||||||||||
SEI Daily Income Trust, Government Fund, Cl F | ||||||||||||
1.180%**† | 5,747,756 | 5,748 | ||||||||||
Total Cash Equivalent | 5,748 | |||||||||||
Total Investments in Securities — 98.2% | $ | 255,001 | ||||||||||
Percentages are based on Net Assets of $259,687 ($ Thousands).
| * | Non-income producing security. |
| ** | Rate shown is the 7-day effective yield as of February 28, 2018. |
| † | Investment in Affiliated Security (see Note 2). |
| ‡ | Real Estate Investment Trust. |
| (A) | Security is a Master Limited Partnership. At February 28, 2018, such securities amounted to $1,001 ($ Thousands), or 0.4 of the net assets of the Fund (See Note 2). |
ADR — American Depositary Receipt
Cl — Class
S&P — Standard & Poor’s
As of February 28, 2018, all of the Fund’s investments were considered level 1, in accordance with the authoritative guidance on fair value measurements and disclosure under U.S. GAAP.
For the year ended February 28, 2018, there were no transfers between Level 1 and Level 2 assets and liabilities. For the year ended February 28, 2018, there were no transfers between Level 2 and Level 3 assets and liabilities. For the year ended February 28, 2018, there were no Level 3 securities.
The following is a summary of the Fund’s transactions with affiliates for the year ended February 28, 2018 ($ Thousands):
| Security Description | Value 2/28/17 | Purchases at Cost | Proceeds from Sales | Value 2/28/2018 | Dividend Income | |||||||||||||||
SEI Daily Income Trust, Government Fund, Cl F | $ | 8,097 | $ | 54,901 | $ | (57,250 | ) | $ | 5,748 | $ | 58 | |||||||||
|
|
|
|
|
|
|
|
|
| |||||||||||
The accompanying notes are an integral part of the financial statements.
| SEI Catholic Values Trust / Annual Report / February 28, 2018 | 17 |
SCHEDULE OF INVESTMENTS
February 28, 2018
Catholic Values Fixed Income Fund
Sector Weightings (Unaudited)†:
†Percentages based on total investments.
| Description | Face Amount (Thousands) | Market Value ($ Thousands) | ||||||||||
MORTGAGE-BACKED SECURITIES — 31.4% |
| |||||||||||
Agency Mortgage-Backed Obligations — 24.2% |
| |||||||||||
FHLMC | ||||||||||||
5.500%, 12/01/2028 to 04/01/2030 | $ | 933 | $ | 1,011 | ||||||||
5.000%, 06/01/2041 to 12/01/2044 | 946 | 1,024 | ||||||||||
4.500%, 06/01/2038 to 07/01/2047 | 1,299 | 1,365 | ||||||||||
4.000%, 07/01/2037 to 07/01/2047 | 2,187 | 2,254 | ||||||||||
3.500%, 03/01/2043 to 03/01/2045 | 565 | 568 | ||||||||||
3.000%, 09/01/2036 to 01/01/2047 | 3,160 | 3,075 | ||||||||||
FHLMC CMO, Ser 2012-4057, Cl CS, IO | ||||||||||||
4.463%, VAR LIBOR USD 1 Month+6.050%, 04/15/2039 | 36 | 3 | ||||||||||
FHLMC CMO, Ser 2014-328, Cl S4, IO | ||||||||||||
1.714%, 02/15/2038 (A) | 85 | 6 | ||||||||||
FHLMC CMO, Ser 2014-4415, Cl IO, IO | ||||||||||||
1.618%, 04/15/2041 (A) | 489 | 20 | ||||||||||
FHLMC CMO, Ser 2015-4494, Cl AI, IO | ||||||||||||
1.695%, 11/15/2038 (A) | 573 | 26 | ||||||||||
FHLMC TBA | ||||||||||||
4.000%, 03/15/2041 | 100 | 102 | ||||||||||
3.500%, 03/01/2041 | 200 | 200 | ||||||||||
3.000%, 03/15/2043 | 200 | 194 | ||||||||||
FNMA | ||||||||||||
5.000%, 10/01/2033 to 12/01/2047 | 2,648 | 2,862 | ||||||||||
4.500%, 07/01/2033 to 11/01/2047 | 3,647 | 3,831 | ||||||||||
4.000%, 04/01/2036 to 08/01/2056 | 2,594 | 2,682 | ||||||||||
3.500%, 10/01/2037 to 03/01/2057 | 3,977 | 3,992 | ||||||||||
3.000%, 04/01/2043 to 02/01/2047 | 1,367 | 1,332 | ||||||||||
2.940%, 07/01/2027 | 100 | 97 | ||||||||||
2.810%, 04/01/2025 | 40 | 39 | ||||||||||
FNMA CMO, Ser 2015-55, Cl IO, IO | ||||||||||||
1.321%, 08/25/2055 (A) | 374 | 20 | ||||||||||
FNMA CMO, Ser 2015-56, Cl AS, IO | ||||||||||||
4.529%, VAR LIBOR USD 1 Month+6.150%, 08/25/2045 | 301 | 60 | ||||||||||
| Description | Face Amount (Thousands) | Market Value ($ Thousands) | ||||||||||
MORTGAGE-BACKED SECURITIES (continued) |
| |||||||||||
FNMA TBA | ||||||||||||
5.000%, 03/15/2045 | $ | 500 | $ | 534 | ||||||||
4.500%, 03/1/2045 | 1,700 | 1,779 | ||||||||||
4.000%, 03/01/2042 to 04/15/2045 | 500 | 512 | ||||||||||
3.500%, 03/01/2041 | 400 | 407 | ||||||||||
3.000%, 03/25/2030 to 03/15/2045 | 3,300 | 3,247 | ||||||||||
GNMA | ||||||||||||
4.000%, 08/15/2045 to 08/20/2047 | 900 | 928 | ||||||||||
3.500%, 01/20/2047 to 10/20/2047 | 392 | 395 | ||||||||||
3.000%, 11/20/2047 | 496 | 485 | ||||||||||
GNMA CMO, Ser 2007-51, Cl SG, IO | ||||||||||||
4.986%, VAR LIBOR USD 1 Month+6.580%, 08/20/2037 | 18 | 3 | ||||||||||
GNMA CMO, Ser 2012-34, Cl SA, IO | ||||||||||||
4.456%, VAR LIBOR USD 1 Month+6.050%, 03/20/2042 | 184 | 27 | ||||||||||
GNMA CMO, Ser 2012-43, Cl SN, IO | ||||||||||||
5.012%, VAR LIBOR USD 1 Month+6.600%, 04/16/2042 | 160 | 33 | ||||||||||
GNMA CMO, Ser 2012-H27, Cl AI, IO | ||||||||||||
1.725%, VAR ICE LIBOR USD 1 Month+0.000%, 10/20/2062 | 123 | 8 | ||||||||||
GNMA CMO, Ser 2014-118, Cl HS, IO | ||||||||||||
4.606%, VAR LIBOR USD 1 Month+6.200%, 08/20/2044 | 330 | 64 | ||||||||||
GNMA CMO, Ser 2015-30, Cl IO, IO | 1,363 | 79 | ||||||||||
1.028%, 07/16/2056 (A) | ||||||||||||
GNMA TBA | ||||||||||||
4.500%, 03/01/2045 | 880 | 915 | ||||||||||
4.000%, 03/15/2045 to 04/15/2045 | 700 | 717 | ||||||||||
3.500%, 03/15/2041 to 04/15/2041 | 300 | 301 | ||||||||||
3.000%, 03/15/2045 to 04/15/2045 | 1,100 | 1,075 | ||||||||||
| 36,579 | ||||||||||||
Non-Agency Mortgage-Backed Obligations — 7.1% |
| |||||||||||
BAMLL Commercial Mortgage Securities Trust, Ser 2014-FL1, Cl E | ||||||||||||
3.833%, VAR LIBOR USD 1 Month+5.500%, 12/15/2031 (B) | 260 | 249 | ||||||||||
BANK, Ser 2017-BNK8, Cl XA, IO | ||||||||||||
0.754%, 11/15/2050 (A) | 1,659 | 97 | ||||||||||
BBCCRE Trust, Ser 2015-GTP, Cl D | ||||||||||||
4.563%, 08/10/2033 (A)(B) | 140 | 129 | ||||||||||
Chevy Chase Funding Mortgage-Backed Certificates, Ser 2004-2A, Cl B1 | ||||||||||||
2.064%, 05/25/2035 (A)(B) | 321 | 240 | ||||||||||
Chevy Chase Funding Mortgage-Backed Certificates, Ser 2004-2A, Cl A1 | ||||||||||||
1.891%, VAR ICE LIBOR USD 1 Month+0.270%, 05/25/2035 (B) | 186 | 179 | ||||||||||
COMM Mortgage Trust, Ser 2013-CR6, Cl B | ||||||||||||
3.397%, 03/10/2046 (B) | 100 | 98 | ||||||||||
18 | SEI Catholic Values Trust / Annual Report / February 28, 2018 |
| Description | Face Amount (Thousands) | Market Value ($ Thousands) | ||||||||||
MORTGAGE-BACKED SECURITIES (continued) |
| |||||||||||
COMM Mortgage Trust, Ser 2013-CR8, Cl A4 | $ | 605 | $ | 607 | ||||||||
3.334%, 06/10/2046 | ||||||||||||
COMM Mortgage Trust, Ser 2014-CR18, Cl D | ||||||||||||
4.735%, 07/15/2047 (A)(B) | 240 | 209 | ||||||||||
CSAIL Commercial Mortgage Trust, Ser 2015-C2, Cl AS | ||||||||||||
3.849%, 06/15/2057 (A) | 210 | 212 | ||||||||||
CSMC Trust, Ser 2017-HL1, Cl A3 | ||||||||||||
3.500%, 06/25/2047 (A)(B) | 290 | 289 | ||||||||||
FHLMC Structured Agency Credit Risk Debt Notes, Ser 2016-DNA2, Cl M3 | ||||||||||||
6.271%, VAR ICE LIBOR USD 1 Month+4.650%, 10/25/2028 | 340 | 391 | ||||||||||
FHLMC Structured Agency Credit Risk Debt Notes, Ser 2016-DNA4, Cl M2 | ||||||||||||
2.921%, VAR ICE LIBOR USD 1 Month+1.300%, 03/25/2029 | 250 | 253 | ||||||||||
FHLMC Structured Agency Credit Risk Debt Notes, Ser 2017-DNA1, Cl M2 | ||||||||||||
4.871%, VAR ICE LIBOR USD 1 Month+3.250%, 07/25/2029 | 300 | 325 | ||||||||||
First Horizon Mortgage Pass-Through Trust, Ser 2005-AR1, Cl B1 | ||||||||||||
3.492%, 04/25/2035 (A) | 390 | 319 | ||||||||||
FNMA Connecticut Avenue Securities, Ser 2016-C04, Cl 1M2 | ||||||||||||
5.871%, VAR ICE LIBOR USD 1 Month+4.250%, 01/25/2029 | 50 | 57 | ||||||||||
GS Mortgage Securities II, Ser GS8, Cl A4 | ||||||||||||
3.469%, 11/10/2050 | 60 | 59 | ||||||||||
GS Mortgage Securities Trust, Ser 2006-GG8, Cl AJ | ||||||||||||
5.622%, 11/10/2039 | 138 | 129 | ||||||||||
GS Mortgage Securities Trust, Ser 2010-C1, Cl A2 | ||||||||||||
4.592%, 08/10/2043 (B) | 474 | 490 | ||||||||||
GS Mortgage Securities Trust, Ser 2012-GC6, Cl AS | ||||||||||||
4.948%, 01/10/2045 (B) | 200 | 211 | ||||||||||
GS Mortgage Securities Trust, Ser 2012-GCJ7, Cl A4 | ||||||||||||
3.377%, 05/10/2045 | 442 | 446 | ||||||||||
GS Mortgage Securities Trust, Ser 2017-485L, Cl A | ||||||||||||
3.721%, 02/10/2037 (B) | 100 | 101 | ||||||||||
GS Mortgage Securities Trust, Ser 2018-CHILL, Cl A | ||||||||||||
2.338%, VAR LIBOR USD 1 Month+0.750%, 02/15/2037 (B) | 250 | 250 | ||||||||||
Homestar Mortgage Acceptance, Ser 2004-4, Cl M3 | ||||||||||||
3.796%, VAR ICE LIBOR USD 1 Month+2.175%, 09/25/2034 | 291 | 269 | ||||||||||
| Description | Face Amount (Thousands) | Market Value ($ Thousands) | ||||||||||
MORTGAGE-BACKED SECURITIES (continued) |
| |||||||||||
Homestar Mortgage Acceptance, Ser 2004-5, Cl M2 | ||||||||||||
2.626%, VAR ICE LIBOR USD 1 Month+1.005%, 10/25/2034 | $ | 367 | $ | 368 | ||||||||
Impac Secured Assets Trust, Ser 2006-2, Cl 2M3 | ||||||||||||
2.721%, VAR ICE LIBOR USD 1 Month+1.100%, 08/25/2036 | 190 | 183 | ||||||||||
JPMBB Commercial Mortgage Securities Trust, Ser 2015-C29, Cl C | ||||||||||||
4.202%, 05/15/2048 (A) | 110 | 106 | ||||||||||
JPMDB Commercial Mortgage Securities Trust, Ser 2017-C5, Cl C | ||||||||||||
4.512%, 03/15/2050 (A) | 110 | 111 | ||||||||||
JPMDB Commercial Mortgage Securities Trust, Ser 2017-C7, Cl XA, IO | ||||||||||||
0.917%, 10/15/2050 (A) | 1,478 | 96 | ||||||||||
JPMorgan Chase Commercial Mortgage Securities Trust, Ser 2012-C6, Cl A3 | ||||||||||||
3.507%, 05/15/2045 | 200 | 203 | ||||||||||
JPMorgan Chase Commercial Mortgage Securities Trust, Ser 2012-CIBX, Cl A4 | ||||||||||||
3.483%, 06/15/2045 | 450 | 455 | ||||||||||
JPMorgan Mortgage Trust, Ser 2016-1, Cl A5 | ||||||||||||
3.500%, 05/25/2046 (A)(B) | 184 | 184 | ||||||||||
JPMorgan Mortgage Trust, Ser 2016-4, Cl A5 | ||||||||||||
3.500%, 10/25/2046 (A)(B) | 106 | 105 | ||||||||||
Morgan Stanley Bank of America Merrill Lynch Trust, Ser 2015-C23, Cl B | ||||||||||||
4.134%, 07/15/2050 (A) | 100 | 100 | ||||||||||
Morgan Stanley Bank of America Merrill Lynch Trust, Ser 2016-C32, Cl ASB | ||||||||||||
3.514%, 12/15/2049 | 283 | 285 | ||||||||||
Morgan Stanley Capital I Trust, Ser 2007-IQ16, Cl AJ | ||||||||||||
6.171%, 12/12/2049 (A) | 233 | 209 | ||||||||||
MSCG Trust, Ser 2015-ALDR, Cl A2 | ||||||||||||
3.462%, 06/07/2035 (A)(B) | 110 | 105 | ||||||||||
Reperforming Loan REMIC Trust, Ser 2005-R2, Cl 2A3 | ||||||||||||
8.000%, 06/25/2035 (B) | 109 | 114 | ||||||||||
Sequoia Mortgage Trust, Ser 2017-1, Cl A4 | ||||||||||||
3.500%, 02/25/2047 (A)(B) | 336 | 336 | ||||||||||
Sequoia Mortgage Trust, Ser 2017-4, Cl A4 | ||||||||||||
3.500%, 07/25/2047 (A)(B) | 190 | 190 | ||||||||||
Sequoia Mortgage Trust, Ser 2017-6, Cl A4 | ||||||||||||
3.500%, 09/25/2047 (A)(B) | 201 | 199 | ||||||||||
UBS Commercial Mortgage Trust, Ser 2012-C1, Cl A3 | ||||||||||||
3.400%, 05/10/2045 | 630 | 636 | ||||||||||
Wells Fargo Commercial Mortgage Trust, Ser 2015-C28, Cl A4 | ||||||||||||
3.540%, 05/15/2048 | 180 | 181 | ||||||||||
| SEI Catholic Values Trust / Annual Report / February 28, 2018 | 19 |
SCHEDULE OF INVESTMENTS
February 28, 2018
Catholic Values Fixed Income Fund (Continued)
| Description | Face Amount (Thousands) | Market Value ($ Thousands) | ||||||||||
MORTGAGE-BACKED SECURITIES (continued) |
| |||||||||||
Wells Fargo Commercial Mortgage Trust, Ser 2015-C28, Cl A5 | ||||||||||||
3.872%, 05/15/2048 (A) | $ | 120 | $ | 120 | ||||||||
WFRBS Commercial Mortgage Trust, Ser 2013-C17, Cl A2 | ||||||||||||
2.921%,12/15/2046 | 498 | 499 | ||||||||||
WFRBS Commercial Mortgage Trust, Ser 2013-UBSS1, Cl A2 | ||||||||||||
2.927%, 03/15/2046 | 425 | 426 | ||||||||||
| 10,820 | ||||||||||||
Other Asset-Backed Securities — 0.1% |
| |||||||||||
Rosslyn Portfolio Trust, Ser 2017-R17, Cl A | ||||||||||||
2.510%, VAR LIBOR USD 1 Month+0.950%, 06/15/2033 (B) | 100 | 100 | ||||||||||
Total Mortgage-Backed Securities (Cost $48,335) ($ Thousands) | 47,499 | |||||||||||
CORPORATE OBLIGATIONS — 28.7% |
| |||||||||||
Consumer Discretionary — 2.7% |
| |||||||||||
1011778 BC ULC / New Red Finance | ||||||||||||
5.000%, 10/15/2025 (B) | 20 | 19 | ||||||||||
Amazon.com | ||||||||||||
4.950%, 12/05/2044 | 30 | 34 | ||||||||||
4.050%, 08/22/2047 (B) | 30 | 30 | ||||||||||
3.875%, 08/22/2037 (B) | 68 | 68 | ||||||||||
3.150%, 08/22/2027 (B) | 50 | 48 | ||||||||||
American Axle & Manufacturing | ||||||||||||
6.625%, 10/15/2022 | 10 | 10 | ||||||||||
CCO Holdings | ||||||||||||
5.125%, 05/01/2027 (B) | 20 | 19 | ||||||||||
Charter Communications Operating | ||||||||||||
6.484%, 10/23/2045 | 20 | 22 | ||||||||||
6.384%, 10/23/2035 | 390 | 440 | ||||||||||
4.200%, 03/15/2028 | 110 | 106 | ||||||||||
Comcast | ||||||||||||
6.400%, 05/15/2038 | 170 | 216 | ||||||||||
4.049%, 11/01/2052 | 210 | 196 | ||||||||||
3.900%, 03/01/2038 | 40 | 38 | ||||||||||
3.375%, 08/15/2025 | 140 | 138 | ||||||||||
Comcast Cable Communications Holdings | ||||||||||||
9.455%, 11/15/2022 | 270 | 343 | ||||||||||
Cox Communications | ||||||||||||
3.350%, 09/15/2026 (B) | 231 | 220 | ||||||||||
3.250%, 12/15/2022 (B) | 265 | 264 | ||||||||||
Daimler Finance North America | ||||||||||||
2.700%, 08/03/2020 (B) | 180 | 179 | ||||||||||
2.200%, 10/30/2021 (B) | 251 | 242 | ||||||||||
| Description | Face Amount (Thousands) | Market Value ($ Thousands) | ||||||||||
CORPORATE OBLIGATIONS (continued) |
| |||||||||||
Dollar Tree | ||||||||||||
5.750%, 03/01/2023 | $ | 180 | $ | 187 | ||||||||
Ford Motor | ||||||||||||
4.750%, 01/15/2043 | 40 | 37 | ||||||||||
General Motors | ||||||||||||
6.250%, 10/02/2043 | 120 | 134 | ||||||||||
5.150%, 04/01/2038 | 20 | 20 | ||||||||||
General Motors Financial | ||||||||||||
4.200%, 03/01/2021 | 479 | 490 | ||||||||||
3.450%, 04/10/2022 | 10 | 10 | ||||||||||
Goodyear Tire & Rubber | ||||||||||||
5.000%, 05/31/2026 | 20 | 20 | ||||||||||
Hilton Worldwide Finance | ||||||||||||
4.875%, 04/01/2027 | 30 | 30 | ||||||||||
Lennar | ||||||||||||
4.500%, 04/30/2024 | 20 | 20 | ||||||||||
McDonald’s MTN | ||||||||||||
3.500%, 03/01/2027 | 100 | 98 | ||||||||||
Netflix | ||||||||||||
5.875%, 02/15/2025 | 20 | 21 | ||||||||||
Time Warner | ||||||||||||
4.750%, 03/29/2021 | 80 | 84 | ||||||||||
3.600%, 07/15/2025 | 135 | 131 | ||||||||||
Time Warner Cable | ||||||||||||
7.300%, 07/01/2038 | 90 | 108 | ||||||||||
5.875%, 11/15/2040 | 30 | 32 | ||||||||||
| 4,054 | ||||||||||||
Consumer Staples — 2.1% |
| |||||||||||
Altria Group | ||||||||||||
4.750%, 05/05/2021 | 50 | 52 | ||||||||||
2.850%, 08/09/2022 | 20 | 20 | ||||||||||
Anheuser-Busch InBev Finance | ||||||||||||
4.900%, 02/01/2046 | 429 | 458 | ||||||||||
3.650%, 02/01/2026 | 60 | 59 | ||||||||||
3.300%, 02/01/2023 | 40 | 40 | ||||||||||
2.650%, 02/01/2021 | 30 | 30 | ||||||||||
Anheuser-Busch InBev Worldwide | ||||||||||||
2.500%, 07/15/2022 | 150 | 146 | ||||||||||
BAT Capital | ||||||||||||
4.540%, 08/15/2047 (B) | 110 | 107 | ||||||||||
3.557%, 08/15/2027 (B) | 250 | 238 | ||||||||||
Constellation Brands | ||||||||||||
4.750%, 11/15/2024 | 80 | 85 | ||||||||||
Cott Holdings | ||||||||||||
5.500%, 04/01/2025 (B) | 20 | 20 | ||||||||||
CVS Health | ||||||||||||
5.125%, 07/20/2045 | 60 | 63 | ||||||||||
3.875%, 07/20/2025 | 18 | 18 | ||||||||||
CVS Pass-Through Trust | ||||||||||||
7.507%, 01/10/2032 (B) | 440 | 523 | ||||||||||
6.036%, 12/10/2028 | 249 | 270 | ||||||||||
| 20 | SEI Catholic Values Trust / Annual Report / February 28, 2018 |
| Description | Face Amount (Thousands) | Market Value ($ Thousands) | ||||||||||
CORPORATE OBLIGATIONS (continued) |
| |||||||||||
Danone | ||||||||||||
2.077%, 11/02/2021 (B) | $ | 200 | $ | 193 | ||||||||
Diageo Capital | ||||||||||||
4.828%, 07/15/2020 | 110 | 115 | ||||||||||
Kraft Heinz Foods | ||||||||||||
5.375%, 02/10/2020 | 30 | 32 | ||||||||||
4.375%, 06/01/2046 | 20 | 18 | ||||||||||
3.950%, 07/15/2025 | 340 | 336 | ||||||||||
Lamb Weston Holdings | ||||||||||||
4.875%, 11/01/2026 (B) | 20 | 20 | ||||||||||
PepsiCo | ||||||||||||
4.600%, 07/17/2045 | 40 | 43 | ||||||||||
Philip Morris International | ||||||||||||
2.900%, 11/15/2021 | 10 | 10 | ||||||||||
2.500%, 08/22/2022 | 50 | 49 | ||||||||||
2.500%, 11/02/2022 | 50 | 48 | ||||||||||
1.875%, 11/01/2019 | 70 | 69 | ||||||||||
Reynolds American | ||||||||||||
5.850%, 08/15/2045 | 20 | 23 | ||||||||||
3.250%, 06/12/2020 | 11 | 11 | ||||||||||
Spectrum Brands | ||||||||||||
6.625%, 11/15/2022 | 20 | 21 | ||||||||||
Walgreens Boots Alliance | ||||||||||||
3.450%, 06/01/2026 | 40 | 38 | ||||||||||
Wm Wrigley Jr | ||||||||||||
3.375%, 10/21/2020 (B) | 30 | 30 | ||||||||||
| 3,185 | ||||||||||||
Corporate Obligation — 0.2% |
| |||||||||||
Credit Agricole MTN | ||||||||||||
4.000%, VAR USD Swap Semi 30/360 | 250 | 240 | ||||||||||
Energy — 4.1% |
| |||||||||||
Anadarko Finance | ||||||||||||
7.500%, 05/01/2031 | 60 | 76 | ||||||||||
Anadarko Petroleum | ||||||||||||
6.200%, 03/15/2040 | 75 | 88 | ||||||||||
4.850%, 03/15/2021 | 20 | 21 | ||||||||||
4.280%, 10/10/2036 (C) | 1,000 | �� | 418 | |||||||||
Apache | ||||||||||||
4.250%, 01/15/2044 | 150 | 138 | ||||||||||
BP Capital Markets | ||||||||||||
3.588%, 04/14/2027 | 10 | 10 | ||||||||||
3.506%, 03/17/2025 | 110 | 110 | ||||||||||
3.216%, 11/28/2023 | 200 | 199 | ||||||||||
Canadian Natural Resources | ||||||||||||
2.950%, 01/15/2023 | 313 | 306 | ||||||||||
Cheniere Corpus Christi Holdings | ||||||||||||
5.125%, 06/30/2027 | 20 | 20 | ||||||||||
Chesapeake Energy | ||||||||||||
8.000%, 12/15/2022 (B) | 8 | 9 | ||||||||||
| Description | Face Amount (Thousands) | Market Value ($ Thousands) | ||||||||||
CORPORATE OBLIGATIONS (continued) |
| |||||||||||
5.750%, 03/15/2023 | $ | 10 | $ | 9 | ||||||||
Chevron | ||||||||||||
2.954%, 05/16/2026 | 60 | 58 | ||||||||||
Cimarex Energy | ||||||||||||
3.900%, 05/15/2027 | 50 | 49 | ||||||||||
ConocoPhillips | ||||||||||||
3.350%, 05/15/2025 | 200 | 200 | ||||||||||
Continental Resources | ||||||||||||
4.375%, 01/15/2028 (B) | 10 | 10 | ||||||||||
Devon Energy | ||||||||||||
5.850%, 12/15/2025 | 30 | 34 | ||||||||||
5.600%, 07/15/2041 | 50 | 56 | ||||||||||
5.000%, 06/15/2045 | 50 | 52 | ||||||||||
3.250%, 05/15/2022 | 20 | 20 | ||||||||||
Devon Financing | ||||||||||||
7.875%, 09/30/2031 | 50 | 67 | ||||||||||
Ecopetrol | ||||||||||||
5.875%, 05/28/2045 | 100 | 100 | ||||||||||
Ensco | ||||||||||||
8.000%, 01/31/2024 | 14 | 14 | ||||||||||
Enterprise Products Operating | ||||||||||||
4.050%, 02/15/2022 | 123 | 126 | ||||||||||
EOG Resources | ||||||||||||
4.150%, 01/15/2026 | 20 | 21 | ||||||||||
ExxonMobil | ||||||||||||
4.114%, 03/01/2046 | 70 | 73 | ||||||||||
3.043%, 03/01/2026 | 40 | 39 | ||||||||||
Halliburton | ||||||||||||
5.000%, 11/15/2045 | 40 | 43 | ||||||||||
3.800%, 11/15/2025 | 50 | 50 | ||||||||||
Kerr-McGee | ||||||||||||
7.875%, 09/15/2031 | 10 | 13 | ||||||||||
6.950%, 07/01/2024 | 10 | 12 | ||||||||||
Kinder Morgan | ||||||||||||
5.300%, 12/01/2034 | 20 | 21 | ||||||||||
4.300%, 03/01/2028 | 20 | 20 | ||||||||||
Kinder Morgan Energy Partners | ||||||||||||
4.250%, 09/01/2024 | 40 | 40 | ||||||||||
4.150%, 02/01/2024 | 400 | 403 | ||||||||||
3.500%, 09/01/2023 | 30 | 30 | ||||||||||
MPLX | ||||||||||||
4.875%, 06/01/2025 | 110 | 115 | ||||||||||
4.700%, 04/15/2048 | 60 | 58 | ||||||||||
Noble Energy | ||||||||||||
5.250%, 11/15/2043 | 10 | 11 | ||||||||||
4.950%, 08/15/2047 | 10 | 10 | ||||||||||
4.150%, 12/15/2021 | 50 | 51 | ||||||||||
3.850%, 01/15/2028 | 30 | 30 | ||||||||||
Oasis Petroleum | ||||||||||||
6.875%, 03/15/2022 | 20 | 20 | ||||||||||
Occidental Petroleum | ||||||||||||
4.625%, 06/15/2045 | 20 | 21 | ||||||||||
SEI Catholic Values Trust / Annual Report / February 28, 2018 | 21 |
SCHEDULE OF INVESTMENTS
February 28, 2018
Catholic Values Fixed Income Fund (Continued)
| Description | Face Amount (Thousands) | Market Value ($ Thousands) | ||||||||||
CORPORATE OBLIGATIONS (continued) |
| |||||||||||
4.400%, 04/15/2046 | $ | 10 | $ | 10 | ||||||||
4.100%, 02/15/2047 | 60 | 59 | ||||||||||
3.400%, 04/15/2026 | 20 | 20 | ||||||||||
3.125%, 02/15/2022 | 19 | 19 | ||||||||||
3.000%, 02/15/2027 | 20 | 19 | ||||||||||
Petrobras Global Finance BV | ||||||||||||
7.375%, 01/17/2027 | 210 | 228 | ||||||||||
6.850%, 06/05/2115 | 50 | 47 | ||||||||||
5.750%, 02/01/2029 | 50 | 48 | ||||||||||
5.299%, 01/27/2025 (B) | 305 | 299 | ||||||||||
Petroleos Mexicanos | ||||||||||||
6.625%, 06/15/2035 | 100 | 103 | ||||||||||
Petroleos Mexicanos MTN | ||||||||||||
6.875%, 08/04/2026 | 20 | 22 | ||||||||||
Phillips 66 Partners | ||||||||||||
3.605%, 02/15/2025 | 300 | 295 | ||||||||||
3.550%, 10/01/2026 | 232 | 222 | ||||||||||
Range Resources | ||||||||||||
5.875%, 07/01/2022 | 10 | 10 | ||||||||||
4.875%, 05/15/2025 | 30 | 29 | ||||||||||
Schlumberger Holdings | ||||||||||||
4.000%, 12/21/2025 (B) | 30 | 30 | ||||||||||
3.000%, 12/21/2020 (B) | 468 | 469 | ||||||||||
Shell International Finance BV | ||||||||||||
4.375%, 05/11/2045 | 50 | 53 | ||||||||||
4.000%, 05/10/2046 | 50 | 49 | ||||||||||
2.875%, 05/10/2026 | 80 | 77 | ||||||||||
Sinopec Group Overseas Development | ||||||||||||
4.375%, 04/10/2024 (B) | 200 | 206 | ||||||||||
Sunoco Logistics Partners Operations | ||||||||||||
3.450%, 01/15/2023 | 381 | 373 | ||||||||||
Valero Energy | ||||||||||||
6.125%, 02/01/2020 | 74 | 78 | ||||||||||
Williams | ||||||||||||
7.875%, 09/01/2021 | 50 | 56 | ||||||||||
WPX Energy | ||||||||||||
8.250%, 08/01/2023 | 30 | 34 | ||||||||||
| 6,126 | ||||||||||||
Financials — 9.3% | ||||||||||||
AIA Group MTN | ||||||||||||
3.200%, 03/11/2025 (B) | 200 | 193 | ||||||||||
Ally Financial | ||||||||||||
8.000%, 11/01/2031 | 50 | 62 | ||||||||||
Ambac Assurance | ||||||||||||
5.100%, 06/07/2020 (B) | 0 | 1 | ||||||||||
Ambac LSNI | ||||||||||||
6.811%, VAR ICE LIBOR USD 3 Month+5.000%, 02/12/2023 (B) | 2 | 2 | ||||||||||
American Express | ||||||||||||
2.650%, 12/02/2022 | 140 | 136 | ||||||||||
| Description | Face Amount (Thousands) | Market Value ($ Thousands) | ||||||||||
CORPORATE OBLIGATIONS (continued) |
| |||||||||||
American Express Credit MTN | ||||||||||||
1.875%, 05/03/2019 | $ | 209 | $ | 207 | ||||||||
American International Group | ||||||||||||
4.800%, 07/10/2045 | 183 | 190 | ||||||||||
3.750%, 07/10/2025 | 40 | 40 | ||||||||||
Bank of America | ||||||||||||
3.946%, VAR ICE LIBOR USD 3 Month+1.190%, 01/23/2049 | 10 | 10 | ||||||||||
3.419%, VAR ICE LIBOR USD 3 Month+1.040%, 12/20/2028 (B) | 42 | 40 | ||||||||||
3.004%, VAR ICE LIBOR USD 3 Month+0.790%, 12/20/2023 (B) | 419 | 410 | ||||||||||
Bank of America MTN | ||||||||||||
5.000%, 01/21/2044 | 70 | 79 | ||||||||||
4.450%, 03/03/2026 | 10 | 10 | ||||||||||
4.000%, 01/22/2025 | 300 | 301 | ||||||||||
3.593%, VAR ICE LIBOR USD 3 Month+1.370%, 07/21/2028 | 160 | 156 | ||||||||||
3.550%, VAR ICE LIBOR USD 3 Month+0.780%, 03/05/2024 | 70 | 70 | ||||||||||
3.500%, 04/19/2026 | 661 | 651 | ||||||||||
2.600%, 01/15/2019 | 44 | 44 | ||||||||||
1.950%, 05/12/2018 | 229 | 229 | ||||||||||
Brighthouse Financial | ||||||||||||
4.700%, 06/22/2047 (B) | 50 | 47 | ||||||||||
Capital One Financial | ||||||||||||
3.200%, 01/30/2023 | 203 | 199 | ||||||||||
Chubb INA Holdings | ||||||||||||
2.300%, 11/03/2020 | 10 | 10 | ||||||||||
Citigroup | ||||||||||||
4.450%, 09/29/2027 | 270 | 276 | ||||||||||
4.400%, 06/10/2025 | 137 | 140 | ||||||||||
4.125%, 07/25/2028 | 90 | 89 | ||||||||||
3.700%, 01/12/2026 | 170 | 169 | ||||||||||
3.400%, 05/01/2026 | 547 | 531 | ||||||||||
Commonwealth Bank of Australia MTN | ||||||||||||
3.900%, 07/12/2047 (B) | 50 | 48 | ||||||||||
Credit Agricole | ||||||||||||
8.125%, VAR USD Swap Semi 30/360 5 Year Curr+6.185%, 12/31/2049 (B) | 260 | 304 | ||||||||||
Credit Suisse Group Funding Guernsey | ||||||||||||
4.875%, 05/15/2045 | 250 | 264 | ||||||||||
4.550%, 04/17/2026 | 250 | 259 | ||||||||||
Five Corners Funding Trust | ||||||||||||
4.419%, 11/15/2023 (B) | 200 | 210 | ||||||||||
Goldman Sachs Group | ||||||||||||
6.750%, 10/01/2037 | 100 | 126 | ||||||||||
5.750%, 01/24/2022 | 445 | 483 | ||||||||||
5.150%, 05/22/2045 | 160 | 173 | ||||||||||
4.750%, 10/21/2045 | 30 | 32 | ||||||||||
4.250%, 10/21/2025 | 40 | 40 | ||||||||||
3.814%, VAR ICE LIBOR USD 3 Month+1.158%, 04/23/2029 | 60 | 59 | ||||||||||
| 22 | SEI Catholic Values Trust / Annual Report / February 28, 2018 |
| Description | Face Amount (Thousands) | Market Value ($ Thousands) | ||||||||||
CORPORATE OBLIGATIONS (continued) |
| |||||||||||
3.691%, VAR ICE LIBOR USD 3 Month+1.510%, 06/05/2028 | $ | 100 | $ | 97 | ||||||||
3.500%, 11/16/2026 | 175 | 168 | ||||||||||
2.875%, 02/25/2021 | 131 | 130 | ||||||||||
Goldman Sachs Group MTN | ||||||||||||
5.375%, 03/15/2020 | 100 | 105 | ||||||||||
3.850%, 07/08/2024 | 190 | 191 | ||||||||||
HSBC Holdings | ||||||||||||
4.250%, 03/14/2024 | 200 | 202 | ||||||||||
4.041%, VAR ICE LIBOR USD 3 Month+1.546%, 03/13/2028 | 200 | 201 | ||||||||||
Intesa Sanpaolo | ||||||||||||
3.125%, 07/14/2022 (B) | 200 | 194 | ||||||||||
Intesa Sanpaolo MTN | ||||||||||||
5.017%, 06/26/2024 (B) | 200 | 200 | ||||||||||
JPMorgan Chase | ||||||||||||
4.250%, 10/01/2027 | 10 | 10 | ||||||||||
4.125%, 12/15/2026 | 150 | 152 | ||||||||||
3.509%, VAR ICE LIBOR USD 3 Month+0.945%, 01/23/2029 | 160 | 155 | ||||||||||
3.200%, 01/25/2023 | 607 | 604 | ||||||||||
3.125%, 01/23/2025 | 150 | 146 | ||||||||||
KKR Group Finance II | ||||||||||||
5.500%, 02/01/2043 (B) | 73 | 80 | ||||||||||
KKR Group Finance III | ||||||||||||
5.125%, 06/01/2044 (B) | 215 | 224 | ||||||||||
Liberty Mutual Group | ||||||||||||
4.250%, 06/15/2023 (B) | 64 | 66 | ||||||||||
Mitsubishi UFJ Financial Group | ||||||||||||
2.998%, 02/22/2022 | 20 | 20 | ||||||||||
Morgan Stanley MTN | ||||||||||||
6.625%, 04/01/2018 | 200 | 201 | ||||||||||
3.875%, 04/29/2024 | 346 | 350 | ||||||||||
2.625%, 11/17/2021 | 414 | 405 | ||||||||||
Navient MTN | ||||||||||||
8.000%, 03/25/2020 | 40 | 43 | ||||||||||
Peachtree Corners Funding Trust | ||||||||||||
3.976%, 02/15/2025 (B) | 225 | 227 | ||||||||||
Prudential Financial MTN | ||||||||||||
7.375%, 06/15/2019 | 385 | 408 | ||||||||||
Quicken Loans | ||||||||||||
5.750%, 05/01/2025 (B) | 20 | 20 | ||||||||||
Royal Bank of Scotland Group | ||||||||||||
5.125%, 05/28/2024 | 200 | 205 | ||||||||||
Santander Holdings USA | ||||||||||||
4.500%, 07/17/2025 | 10 | 10 | ||||||||||
Sumitomo Mitsui Financial Group | ||||||||||||
2.058%, 07/14/2021 | 30 | 29 | ||||||||||
Teachers Insurance & Annuity Association of America | ||||||||||||
4.900%, 09/15/2044 (B) | 150 | 163 | ||||||||||
| Description | Face Amount (Thousands) | Market Value ($ Thousands) | ||||||||||
CORPORATE OBLIGATIONS (continued) |
| |||||||||||
UBS Group Funding Jersey | ||||||||||||
4.125%, 04/15/2026 (B) | $ | 449 | $ | 454 | ||||||||
UBS Group Funding Switzerland | ||||||||||||
4.253%, 03/23/2028 (B) | 200 | 203 | ||||||||||
Voya Financial | ||||||||||||
3.125%, 07/15/2024 | 258 | 251 | ||||||||||
WEA Finance | ||||||||||||
3.750%, 09/17/2024 (B) | 200 | 201 | ||||||||||
2.700%, 09/17/2019 (B) | 430 | 429 | ||||||||||
Wells Fargo | ||||||||||||
4.480%, 01/16/2024 | 200 | 209 | ||||||||||
3.069%, 01/24/2023 | 337 | 332 | ||||||||||
3.000%, 10/23/2026 | 50 | 47 | ||||||||||
Wells Fargo MTN | ||||||||||||
4.900%, 11/17/2045 | 50 | 52 | ||||||||||
4.750%, 12/07/2046 | 30 | 31 | ||||||||||
4.650%, 11/04/2044 | 100 | 102 | ||||||||||
4.400%, 06/14/2046 | 10 | 10 | ||||||||||
4.300%, 07/22/2027 | 300 | 304 | ||||||||||
3.450%, 02/13/2023 | 160 | 159 | ||||||||||
| 14,080 | ||||||||||||
Health Care — 0.8% | ||||||||||||
Abbott Laboratories | ||||||||||||
4.900%, 11/30/2046 | 40 | 43 | ||||||||||
4.750%, 11/30/2036 | 10 | 11 | ||||||||||
3.750%, 11/30/2026 | 40 | 39 | ||||||||||
Aetna | ||||||||||||
2.800%, 06/15/2023 | 10 | 10 | ||||||||||
Amgen | ||||||||||||
3.625%, 05/22/2024 | 60 | 60 | ||||||||||
Anthem | ||||||||||||
3.650%, 12/01/2027 | 30 | 29 | ||||||||||
3.350%, 12/01/2024 | 20 | 19 | ||||||||||
2.950%, 12/01/2022 | 50 | 49 | ||||||||||
Cardinal Health | ||||||||||||
3.079%, 06/15/2024 | 20 | 19 | ||||||||||
2.616%, 06/15/2022 | 20 | 20 | ||||||||||
Centene | ||||||||||||
6.125%, 02/15/2024 | 10 | 10 | ||||||||||
4.750%, 05/15/2022 | 40 | 41 | ||||||||||
Express Scripts Holding | ||||||||||||
3.400%, 03/01/2027 | 441 | 418 | ||||||||||
Fresenius Medical Care US Finance II | ||||||||||||
4.750%, 10/15/2024 (B) | 50 | 52 | ||||||||||
Gilead Sciences | ||||||||||||
3.650%, 03/01/2026 | 30 | 30 | ||||||||||
3.500%, 02/01/2025 | 50 | 50 | �� | |||||||||
Humana | ||||||||||||
4.950%, 10/01/2044 | 10 | 11 | ||||||||||
3.950%, 03/15/2027 | 150 | 149 | ||||||||||
| SEI Catholic Values Trust /Annual Report / February 28, 2018 | 23 |
SCHEDULE OF INVESTMENTS
February 28, 2018
Catholic Values Fixed Income Fund (Continued)
| Description | Face Amount (Thousands) | Market Value ($ Thousands) | ||||||||||
CORPORATE OBLIGATIONS (continued) |
| |||||||||||
Mallinckrodt International Finance | ||||||||||||
4.750%, 04/15/2023 | $ | 30 | $ | 24 | ||||||||
Medtronic | ||||||||||||
3.500%, 03/15/2025 | 70 | 70 | ||||||||||
Medtronic Global Holdings SCA | ||||||||||||
3.350%, 04/01/2027 | 50 | 49 | ||||||||||
| 1,203 | ||||||||||||
Industrials — 2.6% | ||||||||||||
AerCap Ireland Capital DAC | ||||||||||||
4.625%, 10/30/2020 | 278 | 287 | ||||||||||
Air Canada Pass-Through Trust, Ser 2015-1, Cl A | ||||||||||||
3.600%, 03/15/2027 (B) | 281 | 282 | ||||||||||
Air Lease | ||||||||||||
3.250%, 03/01/2025 | 418 | 401 | ||||||||||
American Airlines Pass-Through Trust, Ser 2013-1, Cl B | ||||||||||||
5.625%, 01/15/2021 (B) | 152 | 157 | ||||||||||
American Airlines Pass-Through Trust, | ||||||||||||
4.950%, 01/15/2023 | 642 | 673 | ||||||||||
Beacon Escrow | ||||||||||||
4.875%, 11/01/2025 (B) | 10 | 10 | ||||||||||
Canadian Pacific Railway | ||||||||||||
6.125%, 09/15/2115 | 127 | 156 | ||||||||||
Cintas No. 2 | ||||||||||||
3.700%, 04/01/2027 | 30 | 30 | ||||||||||
2.900%, 04/01/2022 | 20 | 20 | ||||||||||
Continental Airlines Pass-Through Trust, Ser 2012-2, Cl A | ||||||||||||
4.000%, 10/29/2024 | 190 | 194 | ||||||||||
DAE Funding | ||||||||||||
5.000%, 08/01/2024 (B) | 10 | 10 | ||||||||||
4.500%, 08/01/2022 (B) | 10 | 10 | ||||||||||
Delta Air Lines Pass-Through Trust, Ser 2012-2, Cl A | ||||||||||||
4.950%, 05/23/2019 | 221 | 225 | ||||||||||
Eaton | ||||||||||||
4.150%, 11/02/2042 | 70 | 69 | ||||||||||
International Lease Finance | ||||||||||||
8.625%, 01/15/2022 | 20 | 24 | ||||||||||
6.250%, 05/15/2019 | 10 | 10 | ||||||||||
5.875%, 08/15/2022 | 50 | 55 | ||||||||||
Norfolk Southern | ||||||||||||
4.837%, 10/01/2041 | 200 | 219 | ||||||||||
Park Aerospace Holdings | ||||||||||||
5.250%, 08/15/2022 (B) | 30 | 30 | ||||||||||
Spirit Airlines Pass-Through Trust, Ser 2017-1AA | ||||||||||||
3.375%, 02/15/2030 | 206 | 202 | ||||||||||
| Description | Face Amount (Thousands) | Market Value ($ Thousands) | ||||||||||
CORPORATE OBLIGATIONS (continued) |
| |||||||||||
United Airlines Pass-Through Trust, Ser 2014-1, Cl A | ||||||||||||
4.000%, 04/11/2026 | $ | 720 | $ | 733 | ||||||||
United Parcel Service | ||||||||||||
3.050%, 11/15/2027 | 10 | 9 | ||||||||||
2.500%, 04/01/2023 | 10 | 10 | ||||||||||
United Rentals North America | ||||||||||||
5.875%, 09/15/2026 | 30 | 31 | ||||||||||
Waste Management | ||||||||||||
3.500%, 05/15/2024 | 60 | 60 | ||||||||||
| 3,907 | ||||||||||||
Information Technology — 1.5% |
| |||||||||||
Apple | ||||||||||||
3.200%, 05/13/2025 | 80 | 79 | ||||||||||
2.000%, 11/13/2020 | 30 | 30 | ||||||||||
Broadcom | ||||||||||||
3.125%, 01/15/2025 | 30 | 28 | ||||||||||
2.650%, 01/15/2023 | 315 | 298 | ||||||||||
Diamond 1 Finance | ||||||||||||
4.420%, 06/15/2021 (B) | 110 | 112 | ||||||||||
3.480%, 06/01/2019 (B) | 100 | 101 | ||||||||||
Hewlett Packard Enterprise | ||||||||||||
4.400%, 10/15/2022 | 69 | 71 | ||||||||||
Intel | ||||||||||||
3.700%, 07/29/2025 | 60 | 61 | ||||||||||
Juniper Networks | ||||||||||||
4.500%, 03/15/2024 | 253 | 260 | ||||||||||
3.300%, 06/15/2020 | 101 | 102 | ||||||||||
3.125%, 02/26/2019 | 159 | 159 | ||||||||||
Microsoft | ||||||||||||
4.450%, 11/03/2045 | 40 | 44 | ||||||||||
4.250%, 02/06/2047 | 278 | 297 | ||||||||||
4.100%, 02/06/2037 | 10 | 10 | ||||||||||
3.300%, 02/06/2027 | 130 | 129 | ||||||||||
2.875%, 02/06/2024 | 60 | 59 | ||||||||||
2.700%, 02/12/2025 | 20 | 19 | ||||||||||
2.400%, 08/08/2026 | 160 | 149 | ||||||||||
Telefonaktiebolaget LM Ericsson | ||||||||||||
4.125%, 05/15/2022 | 211 | 209 | ||||||||||
Visa | ||||||||||||
4.300%, 12/14/2045 | 50 | 53 | ||||||||||
3.150%, 12/14/2025 | 70 | 69 | ||||||||||
| 2,339 | ||||||||||||
Materials — 0.7% | ||||||||||||
Anglo American Capital | ||||||||||||
3.625%, 09/11/2024 (B) | 200 | 195 | ||||||||||
BHP Billiton Finance USA | ||||||||||||
6.750%, VAR USD Swap Semi 30/360 5 Year Curr+5.093%, 10/19/2075 (B) | 200 | 227 | ||||||||||
5.000%, 09/30/2043 | 100 | 115 | ||||||||||
| 24 | SEI Catholic Values Trust / Annual Report / February 28, 2018 |
| Description | Face Amount (Thousands) | Market Value ($ Thousands) | ||||||||||
CORPORATE OBLIGATIONS (continued) |
| |||||||||||
2.875%, 02/24/2022 | $ | 205 | $ | 204 | ||||||||
Freeport-McMoRan | ||||||||||||
5.450%, 03/15/2043 | 20 | 19 | ||||||||||
4.000%, 11/14/2021 | 40 | 40 | ||||||||||
Glencore Funding | ||||||||||||
4.125%, 05/30/2023 (B) | 70 | 71 | ||||||||||
4.000%, 03/27/2027 (B) | 150 | 146 | ||||||||||
Reynolds Group Issuer | ||||||||||||
5.125%, 07/15/2023 (B) | 20 | 20 | ||||||||||
Vale Overseas | ||||||||||||
6.875%, 11/21/2036 | 20 | 24 | ||||||||||
4.375%, 01/11/2022 | 20 | 21 | ||||||||||
WestRock RKT | ||||||||||||
4.000%, 03/01/2023 | 10 | 11 | ||||||||||
3.500%, 03/01/2020 | 20 | 20 | ||||||||||
| 1,113 | ||||||||||||
Real Estate — 1.4% | ||||||||||||
Boston Properties | ||||||||||||
3.850%, 02/01/2023 | 200 | 205 | ||||||||||
2.750%, 10/01/2026 | 270 | 250 | ||||||||||
Digital Realty Trust | ||||||||||||
3.700%, 08/15/2027 | 317 | 309 | ||||||||||
GLP Capital | ||||||||||||
4.875%, 11/01/2020 | 30 | 31 | ||||||||||
HCP | ||||||||||||
4.000%, 06/01/2025 | 150 | 150 | ||||||||||
Realty Income | ||||||||||||
4.125%, 10/15/2026 | 207 | 210 | ||||||||||
Simon Property Group | ||||||||||||
2.625%, 06/15/2022 | 160 | 156 | ||||||||||
2.350%, 01/30/2022 | 299 | 291 | ||||||||||
Ventas Realty | ||||||||||||
4.125%, 01/15/2026 | 136 | 137 | ||||||||||
2.700%, 04/01/2020 | 215 | 214 | ||||||||||
Welltower | ||||||||||||
4.500%, 01/15/2024 | 144 | 150 | ||||||||||
| 2,103 | ||||||||||||
Telecommunication Services — 1.3% |
| |||||||||||
AT&T | ||||||||||||
5.350%, 09/01/2040 | 1 | 1 | ||||||||||
4.900%, 08/14/2037 | 20 | 20 | ||||||||||
3.900%, 08/14/2027 | 330 | 328 | ||||||||||
3.400%, 05/15/2025 | 438 | 420 | ||||||||||
Rogers Communications | ||||||||||||
6.800%, 08/15/2018 | 185 | 188 | ||||||||||
5.000%, 03/15/2044 | 217 | 238 | ||||||||||
Verizon Communications | ||||||||||||
5.500%, 03/16/2047 | 6 | 7 | ||||||||||
5.250%, 03/16/2037 | 20 | 21 | ||||||||||
4.862%, 08/21/2046 | 20 | 20 | ||||||||||
| Description | Face Amount (Thousands) | Market Value ($ Thousands) | ||||||||||
CORPORATE OBLIGATIONS (continued) |
| |||||||||||
4.522%, 09/15/2048 | $ | 447 | $ | 422 | ||||||||
4.500%, 08/10/2033 | 160 | 161 | ||||||||||
4.125%, 03/16/2027 | 90 | 91 | ||||||||||
3.500%, 11/01/2024 | 20 | 20 | ||||||||||
3.376%, 02/15/2025 | 19 | 19 | ||||||||||
2.625%, 08/15/2026 | 10 | 9 | ||||||||||
| 1,965 | ||||||||||||
Utilities — 2.0% | ||||||||||||
AES | ||||||||||||
5.500%, 04/15/2025 | 20 | 20 | ||||||||||
Duke Energy | ||||||||||||
3.950%, 08/15/2047 | 10 | 9 | ||||||||||
3.750%, 04/15/2024 | 331 | 335 | ||||||||||
Eversource Energy | ||||||||||||
3.150%, 01/15/2025 | 111 | 108 | ||||||||||
2.500%, 03/15/2021 | 305 | 301 | ||||||||||
Exelon | ||||||||||||
5.625%, 06/15/2035 | 60 | 71 | ||||||||||
5.100%, 06/15/2045 | 240 | 268 | ||||||||||
FirstEnergy | ||||||||||||
7.375%, 11/15/2031 | 220 | 290 | ||||||||||
4.850%, 07/15/2047 | 100 | 105 | ||||||||||
3.900%, 07/15/2027 | 50 | 50 | ||||||||||
NextEra Energy Capital Holdings | ||||||||||||
3.550%, 05/01/2027 | 292 | 286 | ||||||||||
Pacific Gas & Electric | ||||||||||||
6.050%, 03/01/2034 | 330 | 387 | ||||||||||
Sempra Energy | ||||||||||||
9.800%, 02/15/2019 | 74 | 79 | ||||||||||
1.625%, 10/07/2019 | 239 | 234 | ||||||||||
Southern | ||||||||||||
3.250%, 07/01/2026 | 415 | 395 | ||||||||||
Virginia Electric & Power | ||||||||||||
3.150%, 01/15/2026 | 124 | 121 | ||||||||||
| 3,059 | ||||||||||||
Total Corporate Obligations | ||||||||||||
(Cost $43,570) ($ Thousands) | 43,374 | |||||||||||
U.S. TREASURY OBLIGATIONS — 26.4% |
| |||||||||||
U.S. Treasury Bill | ||||||||||||
1.421%, 03/01/2018 (C) | 320 | 320 | ||||||||||
U.S. Treasury Bonds | ||||||||||||
4.500%, 02/15/2036 | 1,613 | 1,954 | ||||||||||
4.500%, 05/15/2038 | 1,679 | 2,055 | ||||||||||
3.750%, 11/15/2043 | 4,650 | 5,169 | ||||||||||
3.000%, 02/15/2047 | 590 | 575 | ||||||||||
3.000%, 05/15/2047 | 1,880 | 1,832 | ||||||||||
3.000%, 02/15/2048 | 200 | 195 | ||||||||||
2.750%, 08/15/2047 | 960 | 889 | ||||||||||
| SEI Catholic Values Trust / Annual Report / February 28, 2018 | 25 |
SCHEDULE OF INVESTMENTS
February 28, 2018
Catholic Values Fixed Income Fund (Continued)
Description | Face Amount (Thousands) | Market Value ($ Thousands) | ||||||||||
U.S. TREASURY OBLIGATIONS (continued) |
| |||||||||||
2.750%, 11/15/2047 | $ | 1,836 | $ | 1,701 | ||||||||
2.500%, 02/15/2045 | 90 | 80 | ||||||||||
2.500%, 05/15/2046 | 2,734 | 2,410 | ||||||||||
U.S. Treasury Inflation Protected Securities | ||||||||||||
1.375%, 02/15/2044 | 243 | 265 | ||||||||||
0.750%, 02/15/2042 | 44 | 42 | ||||||||||
0.375%, 07/15/2023 | 297 | 295 | ||||||||||
0.375%, 07/15/2027 | 605 | 586 | ||||||||||
U.S. Treasury Notes | ||||||||||||
2.375%, 01/31/2023 | 5,107 | 5,042 | ||||||||||
2.250%, 11/15/2024 | 430 | 416 | ||||||||||
2.250%, 12/31/2024 | 150 | 145 | ||||||||||
2.250%, 11/15/2027 | 1,773 | 1,677 | ||||||||||
2.125%, 12/31/2022 | 410 | 400 | ||||||||||
2.125%, 03/31/2024 | 610 | 589 | ||||||||||
2.000%, 05/31/2024 | 70 | 67 | ||||||||||
2.000%, 06/30/2024 | 1,420 | 1,357 | ||||||||||
2.000%, 02/15/2025 | 5,970 | 5,664 | ||||||||||
1.875%, 01/31/2022 | 20 | 19 | ||||||||||
1.875%, 04/30/2022 | 320 | 311 | ||||||||||
1.750%, 05/31/2022 | 274 | 265 | ||||||||||
1.625%, 05/31/2023 | 1,320 | 1,252 | ||||||||||
1.375%, 05/31/2020 | 2,545 | 2,491 | ||||||||||
1.250%, 07/31/2023 | 40 | 37 | ||||||||||
0.750%, 08/15/2019 | 1,891 | 1,852 | ||||||||||
Total U.S. Treasury Obligations (Cost $40,764) ($ Thousands) | 39,952 | |||||||||||
ASSET-BACKED SECURITIES — 8.3% | ||||||||||||
Automotive — 0.4% | ||||||||||||
Hertz Vehicle Financing II, Ser 2017-1A, Cl B | ||||||||||||
3.560%, 10/25/2021 (B) | 160 | 160 | ||||||||||
NextGear Floorplan Master Owner Trust, | ||||||||||||
2.380%, 10/15/2020 (B) | 293 | 293 | ||||||||||
NextGear Floorplan Master Owner Trust, | ||||||||||||
2.740%, 04/15/2021 (B) | 159 | 159 | ||||||||||
| 612 | ||||||||||||
Credit Cards — 0.2% | ||||||||||||
Citibank Credit Card Issuance Trust, Ser 2017-A2, Cl A2 | ||||||||||||
1.740%, 01/19/2021 | 312 | 310 | ||||||||||
| Description | Face Amount (Thousands) | Market Value ($ Thousands) | ||||||||||
ASSET-BACKED SECURITIES (continued) |
| |||||||||||
Mortgage Related Securities — 0.8% |
| |||||||||||
Bayview Financial Asset Trust, Ser 2007-SR1A, Cl M3 | ||||||||||||
2.771%, VAR LIBOR USD 1 Month+1.150%, 03/25/2037 (B) | $ | 300 | $ | 282 | ||||||||
Master Asset Backed Securities Trust, Ser 2006-FRE1, Cl A4 | ||||||||||||
2.201%, VAR ICE LIBOR USD 1 Month+0.580%, 12/25/2035 | 239 | 235 | ||||||||||
Morgan Stanley ABS Capital I Trust, Ser 2004-NC1, Cl M1 | ||||||||||||
2.671%, VAR ICE LIBOR USD 1 Month+1.050%, 12/27/2033 | 153 | 153 | ||||||||||
Morgan Stanley ABS Capital I Trust, Ser 2007-HE7, Cl M1 | ||||||||||||
3.621%, VAR ICE LIBOR USD 1 Month+2.000%, 07/25/2037 | 190 | 158 | ||||||||||
Option One Mortgage Loan Trust, Ser 2005-2, Cl M1 | ||||||||||||
2.281%, VAR ICE LIBOR USD 1 Month+0.660%, 05/25/2035 | 214 | 214 | ||||||||||
Option One Mortgage Loan Trust, Ser 2007-FXD1, Cl 3A4 | ||||||||||||
5.860%, 01/25/2037 | 150 | 145 | ||||||||||
| 1,187 | ||||||||||||
Non-Agency Mortgage-Backed Obligations — 0.3% |
| |||||||||||
Cold Storage Trust, Ser 2017-ICE3, Cl A | ||||||||||||
2.588%, VAR LIBOR USD 1 Month+1.000%, 04/15/2036 (B) | 130 | 131 | ||||||||||
CSMC, Ser 2017-TIME, Cl A | ||||||||||||
3.646%, 11/13/2039 (B) | 100 | 99 | ||||||||||
EverBank Mortgage Loan Trust, Ser 2018-1, Cl A22, | ||||||||||||
3.500%, 02/25/2048 (A)(B) | 250 | 247 | ||||||||||
| 477 | ||||||||||||
Other Asset-Backed Securities — 6.5% | ||||||||||||
AccessLex Institute, Ser 2007-1, Cl A4 | ||||||||||||
1.427%, VAR ICE LIBOR USD 3 Month+0.060%, 01/25/2023 | 96 | 94 | ||||||||||
Airspeed, Ser 2007-1A, Cl G1 | ||||||||||||
1.858%, VAR LIBOR USD 1 Month+0.270%, 06/15/2032 (B) | 256 | 225 | ||||||||||
Applebee’s Funding, Ser 2014-1, Cl A2 | ||||||||||||
4.277%, 09/05/2044 (B) | 100 | 97 | ||||||||||
CCG Receivable Trust, Ser 2017-1, Cl A2 | ||||||||||||
1.840%, 11/14/2023 (B) | 307 | 305 | ||||||||||
CCG Receivables Trust, Ser 2018-1, Cl A2 | ||||||||||||
2.500%, 06/16/2025 (B) | 719 | 717 | ||||||||||
| 26 | SEI Catholic Values Trust / Annual Report / February 28, 2018 |
| Description | Face Amount (Thousands) | Market Value ($ Thousands) | ||||||||||
ASSET-BACKED SECURITIES (continued) |
| |||||||||||
CIT Mortgage Loan Trust, Ser 2007-1, Cl 1M1 | ||||||||||||
3.121%, VAR LIBOR USD 1 Month+1.500%, 10/25/2037 (B) | $ | 120 | $ | 122 | ||||||||
Conseco Finance, Ser 1997-7, Cl M1 | ||||||||||||
7.030%, 07/15/2028 (A) | 219 | 218 | ||||||||||
DB Master Finance, Ser 2017-1A, Cl A2I | ||||||||||||
3.629%, 11/20/2047 (B) | 183 | 180 | ||||||||||
DRB Prime Student Loan Trust, Ser 2015-B, Cl A2 | ||||||||||||
3.170%, 07/25/2031 (B) | 93 | 92 | ||||||||||
First Franklin Mortgage Loan Trust, Ser 2003-FF4, Cl M1 | ||||||||||||
3.375%, VAR ICE LIBOR USD 1 Month+1.800%, 10/25/2033 | 152 | 152 | ||||||||||
Ford Credit Floorplan Master Owner Trust, Ser 2015-2, Cl A1 | ||||||||||||
1.980%, 01/15/2022 | 825 | 815 | ||||||||||
John Deere Owner Trust, Ser 2015-A, Cl A4 | ||||||||||||
1.650%, 12/15/2021 | 205 | 205 | ||||||||||
JPMorgan Mortgage Acquisition Trust, Ser 2006-HE2, Cl M1 | ||||||||||||
1.921%, VAR ICE LIBOR USD 1 Month+0.300%, 07/25/2036 | 658 | 573 | ||||||||||
Nelnet Student Loan Trust, Ser 2008-3, Cl A4 | ||||||||||||
3.594%, VAR ICE LIBOR USD 3 Month+1.650%, 11/25/2024 | 93 | 95 | ||||||||||
RAMP Trust, Ser 2006-RZ3, Cl M1 | ||||||||||||
1.971%, VAR ICE LIBOR USD 1 Month+0.350%, 08/25/2036 | 470 | 459 | ||||||||||
SLC Student Loan Trust, Ser 2006-2, Cl A6 | ||||||||||||
1.749%, VAR ICE LIBOR USD 3 Month+0.160%, 09/15/2039 | 110 | 106 | ||||||||||
SLM Private Credit Student Loan Trust, Ser 2005-A, Cl A4 | ||||||||||||
1.899%, VAR ICE LIBOR USD 3 Month+0.310%, 12/15/2038 | 160 | 151 | ||||||||||
SLM Student Loan Trust, Ser 2006-1, Cl A5 | ||||||||||||
1.855%, VAR ICE LIBOR USD 3 Month+0.110%, 07/26/2021 | 113 | 112 | ||||||||||
SLM Student Loan Trust, Ser 2006-10, Cl A6 | ||||||||||||
1.895%, VAR ICE LIBOR USD 3 Month+0.150%, 03/25/2044 | 380 | 369 | ||||||||||
SLM Student Loan Trust, Ser 2008-5, Cl A4 | ||||||||||||
3.445%, VAR ICE LIBOR USD 3 Month+1.700%, 07/25/2023 | 78 | 80 | ||||||||||
SLM Student Loan Trust, Ser 2008-6, Cl A4 | ||||||||||||
2.845%, VAR ICE LIBOR USD 3 Month+1.100%, 07/25/2023 | 97 | 98 | ||||||||||
Small Business Administration, Ser 2010-20B, Cl 1 | ||||||||||||
4.140%, 02/01/2030 | 131 | 136 | ||||||||||
| Description | Face Amount (Thousands) | Market Value ($ Thousands) | ||||||||||
ASSET-BACKED SECURITIES (continued) |
| |||||||||||
Small Business Administration, Ser 2011-20H, Cl 1 | ||||||||||||
3.290%, 08/01/2031 | $ | 227 | $ | 230 | ||||||||
Small Business Administration, Ser 2013-20G, Cl 1 | ||||||||||||
3.150%, 07/01/2033 | 921 | 928 | ||||||||||
Small Business Administration, Ser 2014-20C, Cl 1 | ||||||||||||
3.210%, 03/01/2034 | 817 | 826 | ||||||||||
Small Business Administration, Ser 2015-20F, Cl 1 | ||||||||||||
2.980%, 06/01/2035 | 214 | 212 | ||||||||||
Small Business Administration, Ser 2017-20G, Cl 1 | ||||||||||||
2.980%, 07/01/2037 | 49 | 48 | ||||||||||
Store Master Funding I, Ser 2015-1A, Cl A1 | ||||||||||||
3.750%, 04/20/2045 (B) | 331 | 327 | ||||||||||
United States Small Business Administration, Ser 2018-20A, Cl 1 | ||||||||||||
2.920%, 01/01/2038 | 303 | 297 | ||||||||||
United States Small Business Administration, Ser 2018-20B, Cl 1 | ||||||||||||
3.220%, 02/01/2038 | 482 | 482 | ||||||||||
Verizon Owner Trust, Ser 2016-1A, Cl A | ||||||||||||
1.420%, 01/20/2021 (B) | 282 | 279 | ||||||||||
Verizon Owner Trust, Ser 2017-2A, Cl A | ||||||||||||
1.920%, 12/20/2021 (B) | 305 | 301 | ||||||||||
Verizon Owner Trust, Ser 2017-3A, Cl A1A | ||||||||||||
2.060%, 04/20/2022 (B) | 325 | 320 | ||||||||||
Volvo Financial Equipment LLC, Ser 2017-1A, Cl A3 | ||||||||||||
1.920%, 03/15/2021 (B) | 251 | 249 | ||||||||||
| 9,900 | ||||||||||||
Other Diversified Financial Services — 0.1% |
| |||||||||||
Navient Student Loan Trust, Ser 2017-3A, Cl A3 | ||||||||||||
2.671%, VAR ICE LIBOR USD 1 Month+1.050%, 07/26/2066 (B) | 100 | 103 | ||||||||||
Total Asset-Backed Securities (Cost $12,519) ($ Thousands) | 12,589 | |||||||||||
LOAN PARTICIPATIONS — 2.8% | ||||||||||||
1011778 B.C. Unlimited Liability Company (New Red Finance, Inc.) (aka Burger King/ Tim Hortons), Term B-3 Loan, | ||||||||||||
3.943%, VAR LIBOR+0.023%, 02/16/2024 | 35 | 35 | ||||||||||
SEI Catholic Values Trust / Annual Report / February 28, 2018 | 27 |
SCHEDULE OF INVESTMENTS
February 28, 2018
Catholic Values Fixed Income Fund (Continued)
| Description | Face Amount (Thousands) | Market Value ($ Thousands) | ||||||||||
LOAN PARTICIPATIONS (continued) |
| |||||||||||
1011778 B.C. Unlimited Liability Company (New Red Finance, Inc.) (aka Burger King/ Tim Hortons), Term B-3 Loan, 1st Lien | ||||||||||||
3.898%, VAR LIBOR+0.023%, 02/16/2024 | $ | 55 | $ | 55 | ||||||||
American Airlines, Inc., 2017 Class B Term Loan | ||||||||||||
3.588%, 12/14/2023 | 45 | 45 | ||||||||||
American Airlines, Inc., 2017 Replacement Term Loan | ||||||||||||
3.631%, VAR LIBOR+0.060%, 06/27/2020 | 45 | 45 | ||||||||||
American Axle & Manufacturing, Inc., Tranche B Term Loan, 1st Lien | ||||||||||||
3.880%, VAR LIBOR+0.045%, 04/06/2024 | 49 | 49 | ||||||||||
American Builders & Contractors Supply Co.,Inc., Additional Term B-1 Loan, 1st Lien | ||||||||||||
4.148%, VAR LIBOR+0.033%, 10/31/2023 | 90 | 90 | ||||||||||
Aramark Intermediate HoldCo Corporation, U.S. Term B-1 Loan, 1st Lien | ||||||||||||
3.648%, VAR LIBOR+0.028%, 03/11/2025 | 100 | 101 | ||||||||||
Aristocrat (Video Gaming Tech), Term Loan B | ||||||||||||
3.745%, VAR LIBOR+0.105%, 10/19/2024 | 10 | 10 | ||||||||||
Avolon TLB Borrower 1 (US) LLC, Initial Term B-2 Loan | ||||||||||||
3.840%, VAR LIBOR+0.033%, 03/21/2022 | 130 | 129 | ||||||||||
Beacon Roofing Supply, Inc., Initial Term Loan, 1st Lien | ||||||||||||
3.830%, VAR LIBOR+0.075%, 01/02/2025 (D) | 93 | 93 | ||||||||||
Berry Global, Inc. (fka Berry Plastics Corporation), Term Q Loan, 1st Lien | ||||||||||||
3.648%, VAR LIBOR+0.050%, 10/01/2022 | 51 | 51 | ||||||||||
3.581%, VAR LIBOR+0.050%, 10/01/2022 | 26 | 27 | ||||||||||
Berry Global, Term R Loan | ||||||||||||
3.581%, 01/19/2024 | 22 | 23 | ||||||||||
Caesars Resort Collection, LLC (fka Caesars Growth Properties Holdings, LLC), Term B Loan, 1st Lien | ||||||||||||
4.398%, VAR LIBOR+0.043%, 12/23/2024 | 87 | 87 | ||||||||||
CBS Radio Inc., Term Loan B (2017) | ||||||||||||
4.620%, VAR LIBOR+0.038%, 11/18/2024 | 100 | 100 | ||||||||||
| Description | Face Amount (Thousands) | Market Value ($ Thousands) | ||||||||||
LOAN PARTICIPATIONS (continued) |
| |||||||||||
CenturyLink, Inc., Initial Term B Loan, 1st Lien | ||||||||||||
4.398%, 01/31/2025 | $ | 45 | $ | 44 | ||||||||
Change Healthcare Holdings, Inc. (fka Emdeon Inc.), Closing Date Term Loan, 1st Lien | ||||||||||||
4.398%, VAR LIBOR+0.053%, 03/01/2024 | 112 | 112 | ||||||||||
Charter Communications Operating, LLC (aka CCO Safari LLC), Term B Loan, 1st Lien | ||||||||||||
3.650%, VAR LIBOR+0.090%, 04/30/2025 | 104 | 104 | ||||||||||
CityCenter Holdings, LLC, Term B Loan, 1st Lien | ||||||||||||
4.148%, VAR LIBOR+0.030%, 04/18/2024 | 8 | 8 | ||||||||||
Dell International L.L.C. (EMC Corporation), Refinancing Term B Loan | ||||||||||||
3.650%, 09/07/2023 | 100 | 100 | ||||||||||
First Data Corporation, 2024A New Dollar Term Loan | ||||||||||||
3.871%, VAR LIBOR+0.060%, 04/26/2024 | 98 | 98 | ||||||||||
Golden Nugget, Inc., Initial B Term Loan, 1st Lien | ||||||||||||
5.039%, VAR LIBOR+0.070%, 10/04/2023 | 53 | 53 | ||||||||||
4.900%, VAR LIBOR+0.070%, 10/04/2023 | 40 | 41 | ||||||||||
4.898%, VAR LIBOR+0.070%, 10/04/2023 | — | — | ||||||||||
Hilton Worldwide Finance LLC, Series B-2 Term Loan, 1st Lien | ||||||||||||
3.621%, VAR LIBOR+0.025%, 10/25/2023 | 100 | 100 | ||||||||||
Jaguar Holding Company I, LLC (fka Jaguar Holding Company I), 2017 Term Loan, 1st Lien | ||||||||||||
4.443%, VAR LIBOR+0.028%, 08/18/2022 | 47 | 47 | ||||||||||
4.398%, VAR LIBOR+0.028%, 08/18/2022 | 43 | 43 | ||||||||||
Level 3 Financing, Inc., Tranche B 2024 Term Loan | ||||||||||||
3.846%, VAR LIBOR+0.030%, 02/22/2024 | 96 | 96 | ||||||||||
MA Financeco, LLC, Tranche B-3 Term Loan | ||||||||||||
4.398%, 06/21/2024 | 1 | 1 | ||||||||||
MGM Growth Properties Operating Partnership LP, Term B Loan, 1st Lien | ||||||||||||
3.898%, VAR LIBOR+0.038%, 03/24/2025 | 98 | 98 | ||||||||||
| 28 | SEI Catholic Values Trust / Annual Report / February 28, 2018 |
| Description | Face Amount (Thousands) | Market Value ($ Thousands) | ||||||||||
LOAN PARTICIPATIONS (continued) |
| |||||||||||
Michaels Stores, Inc., 2016 New Replacement Term B-1 Loan | ||||||||||||
4.398%, VAR LIBOR+0.048%, 01/30/2023 | $ | 202 | $ | 203 | ||||||||
4.340%, VAR LIBOR+0.048%, 01/30/2023 | 13 | 13 | ||||||||||
4.331%, VAR LIBOR+0.048%, 01/30/2023 | 76 | 76 | ||||||||||
MPH Acquisition Holdings LLC, Initial Term Loan, 1st Lien | ||||||||||||
4.693%, VAR LIBOR+0.088%, 06/07/2023 | 94 | 95 | ||||||||||
Numericable U.S. LLC, USD TLB-[12] Term Loan | ||||||||||||
4.720%, VAR LIBOR+0.038%, 01/31/2026 | 101 | 97 | ||||||||||
ON Semiconductor Corporation, 2017 New Replacement Term B-2 Loan | ||||||||||||
3.648%, VAR LIBOR+0.058%, 03/31/2023 | 68 | 68 | ||||||||||
Parexel International Corporation, Initial Term Loan, 1st Lien | ||||||||||||
4.398%, VAR LIBOR+0.023%, 09/27/2024 (D) | 88 | 88 | ||||||||||
Post Holdings, Inc., Series A Incremental Term Loan | ||||||||||||
3.900%, VAR LIBOR+0.058%, 05/24/2024 | 104 | 104 | ||||||||||
Prime Security Services Borrower, LLC (aka Protection 1 Security Solutions) , 2016-2 Refinancing Term B-1 Loan | ||||||||||||
4.398%, VAR LIBOR+0.053%, 05/02/2022 | 90 | 90 | ||||||||||
Quikrete Holdings, Inc., Initial Loan | ||||||||||||
4.398%, VAR Euribor+0.063%, 11/15/2023 | 101 | 102 | ||||||||||
Reynolds Group Holdings Inc., Incremental U.S. Term Loan | ||||||||||||
4.398%, VAR LIBOR+0.040%, 02/05/2023 | 104 | 104 | ||||||||||
RPI Finance Trust, Initial Term Loan B-6 3.693%, VAR Prime Rate by Country+0.025%, 03/27/2023 | 99 | 100 | ||||||||||
Scientific Games International, Inc., Initial Term B-5 Loan | ||||||||||||
4.449%, VAR LIBOR+0.055%, 08/14/2024 | 145 | 145 | ||||||||||
Seattle SpinCo, Inc., Initial Term Loan, 1st Lien | ||||||||||||
4.398%, VAR LIBOR+0.080%, 06/21/2024 | 10 | 10 | ||||||||||
Sinclair Television, 1st Lien | ||||||||||||
0.000%, 12/12/2024 (D) | 100 | 100 | ||||||||||
| Description | Face Amount (Thousands) | Market Value ($ Thousands) | ||||||||||
LOAN PARTICIPATIONS (continued) |
| |||||||||||
Sprint Communications, Inc., Initial Term Loan, 1st Lien | ||||||||||||
4.188%, VAR LIBOR+0.065%, 02/02/2024 | $ | 19 | $ | 19 | ||||||||
Station Casinos LLC, Term B Facility Loan, 1st Lien | ||||||||||||
4.150%, VAR LIBOR+0.075%, 06/08/2023 | 13 | 13 | ||||||||||
Trans Union LLC, 2017 Replacement Term B-3 Loan | ||||||||||||
3.648%, 04/10/2023 | 93 | 93 | ||||||||||
Unitymedia Finance LLC, Facility D Loan, 1st Lien | ||||||||||||
3.838%, VAR LIBOR+0.085%, 01/15/2026 (D) | 70 | 70 | ||||||||||
Unitymedia, Term Loan B (2017) | ||||||||||||
3.838%, VAR LIBOR+0.085%, 09/30/2025 | 103 | 103 | ||||||||||
Univision Communications Inc., 2017 Replacement Repriced First-Lien Term Loan | ||||||||||||
4.398%, VAR Add FIXED to Reference Rate+0.000%, 03/15/2024 | 100 | 98 | ||||||||||
UPC Financing Partnership , Facility AR, 1st Lien | ||||||||||||
4.088%, VAR Add FIXED to Reference Rate+0.000%, 01/15/2026 | 88 | 88 | ||||||||||
VICI Properties 1 LLC, Term B Loan, 1st Lien | ||||||||||||
3.596%, 12/20/2024 (D) | 38 | 38 | ||||||||||
Virgin Media Bristol LLC, K Facility, 1st Lien | ||||||||||||
4.088%, VAR LIBOR+0.085%, 01/15/2026 | 30 | 30 | ||||||||||
Vistra Operations Company LLC (fka Tex Operations Company LLC), Initial Term C Loan, 1st Lien | ||||||||||||
4.148%, VAR LIBOR+0.050%, 08/04/2023 | 2 | 2 | ||||||||||
Vistra Operations Company LLC (fka Tex Operations Company LLC), Initial Term Loan, 1st Lien | ||||||||||||
4.148%, VAR LIBOR+0.060%, 08/04/2023 | 8 | 9 | ||||||||||
Western Digital Corporation, U.S. Term B-3 Loan, 1st Lien | ||||||||||||
3.603%, VAR LIBOR+0.068%, 04/29/2023 | 61 | 61 | ||||||||||
XPO Logistics, Inc., Refinancing Term Loan (2018) | ||||||||||||
3.920%, VAR LIBOR+0.053%, 02/24/2025 | 142 | 142 | ||||||||||
| SEI Catholic Values Trust / Annual Report / February 28, 2018 | 29 |
SCHEDULE OF INVESTMENTS
February 28, 2018
Catholic Values Fixed Income Fund (Continued)
| Description | Face Amount (Thousands) | Market Value ($ Thousands) | ||||||||||
LOAN PARTICIPATIONS (continued) |
| |||||||||||
Ziggo Secured Finance Partnership, Term Loan E Facility, 1st Lien | ||||||||||||
4.088%, VAR LIBOR+0.038%, 04/15/2025 | $ | 140 | $ | 139 | ||||||||
Total Loan Participations (Cost $4,201) ($ Thousands) | 4,185 | |||||||||||
U.S. GOVERNMENT AGENCY OBLIGATIONS — 1.8% |
| |||||||||||
FHLB | ||||||||||||
2.125%, 02/11/2020 | 30 | 30 | ||||||||||
FHLB DN | ||||||||||||
1.510%, 05/09/2018 (C) | 430 | 429 | ||||||||||
1.507%, 06/14/2018 (C) | 160 | 159 | ||||||||||
1.465%, 05/15/2018 (C) | 250 | 249 | ||||||||||
1.436%, 04/30/2018 (C) | 450 | 449 | ||||||||||
1.382%, 04/27/2018 (C) | 190 | 189 | ||||||||||
1.372%, 04/25/2018 (C) | 720 | 718 | ||||||||||
1.342%, 03/27/2018 (C) | 320 | 320 | ||||||||||
1.329%, 03/21/2018 (C) | 210 | 210 | ||||||||||
Total U.S. Government Agency Obligations (Cost $2,754) ($ Thousands) |
| 2,753 | ||||||||||
SOVEREIGN DEBT — 1.0% | ||||||||||||
Argentine Republic Government | ||||||||||||
6.875%, 01/11/2048 | 160 | 146 | ||||||||||
5.625%, 01/26/2022 | 210 | 214 | ||||||||||
Brazilian Government International Bond | ||||||||||||
5.625%, 01/07/2041 | 120 | 116 | ||||||||||
Indonesia Government International Bond | ||||||||||||
4.350%, 01/11/2048 | 400 | 380 | ||||||||||
3.750%, 04/25/2022 | 200 | 201 | ||||||||||
Mexico Government International Bond | ||||||||||||
4.600%, 02/10/2048 | 230 | 216 | ||||||||||
Peruvian Government International Bond | ||||||||||||
6.550%, 03/14/2037 | 10 | 13 | ||||||||||
5.625%, 11/18/2050 | 40 | 48 | ||||||||||
Poland Government International Bond | ||||||||||||
4.000%, 01/22/2024 | 110 | 114 | ||||||||||
Russian Foreign Bond — Eurobond | ||||||||||||
7.500%, 03/31/2030 | 71 | 81 | ||||||||||
Total Sovereign Debt | ||||||||||||
(Cost $1,559) ($ Thousands) | 1,529 | |||||||||||
| Description | Face Amount (Thousands) | Market Value ($ Thousands) | ||||||||||
MUNICIPAL BONDS — 0.8% | ||||||||||||
California — 0.2% | ||||||||||||
State of California, GO | ||||||||||||
7.500%, 04/01/2034 | $ | 215 | $ | 307 | ||||||||
Florida — 0.1% | ||||||||||||
Florida State, Board of Administration Finance, Ser A, RB | ||||||||||||
2.638%, 07/01/2021 | 100 | 99 | ||||||||||
Illinois — 0.2% | ||||||||||||
Metropolitan Water Reclamation District of Greater Chicago, GO | ||||||||||||
5.720%, 12/01/2038 | 250 | 311 | ||||||||||
New Jersey — 0.2% | ||||||||||||
New Jersey State, Economic Development Authority, Ser YY, RB, ST APPROP | ||||||||||||
4.197%, 06/15/2019 | 350 | �� | 355 | |||||||||
Wisconsin — 0.1% | ||||||||||||
Wisconsin State, Ser A, RB, AGM | ||||||||||||
5.200%, 05/01/2018 | 120 | 121 | ||||||||||
Total Municipal Bonds (Cost $1,189) ($ Thousands) | 1,193 | |||||||||||
| Shares | ||||||||||||
CASH EQUIVALENT — 5.7% | ||||||||||||
SEI Daily Income Trust, Government Fund, Cl F | ||||||||||||
1.180%**† | 8,683,388 | 8,683 | ||||||||||
Total Cash Equivalent (Cost $8,683) ($ Thousands) | 8,683 | |||||||||||
Total Investments in Securities — 106.9% |
| $ | 161,757 | |||||||||
| Contracts | ||||||||||||
PURCHASED OPTIONS* — 0.0% | ||||||||||||
Total Purchased Options (E) (Cost $30) ($ Thousands) | 1,275,086 | $ | 45 | |||||||||
WRITTEN OPTIONS* — 0.0% | ||||||||||||
Total Written Options(E) (Premiums Received $38) ($ Thousands) | (1,814,486 | ) | $ | (17 | ) | |||||||
| 30 | SEI Catholic Values Trust / Annual Report / February 28, 2018 |
A list of the exchange traded options held by the Fund at February 28, 2018, is as follows:
| Description | Number of Contracts | Notional Amount (Thousands) | Exercise Price | Expiration Date | Value (Thousands) | |||||||||||||||
PURCHASED OPTIONS — 0.0% | ||||||||||||||||||||
Put Options | ||||||||||||||||||||
March 2018, Eurodollar 1 Year Mid-Curve* | 16 | $ | 3,896 | $ | 97.75 | 03/17/18 | $ | 14 | ||||||||||||
|
|
|
| |||||||||||||||||
Call Options | ||||||||||||||||||||
April 2018, U.S. 10-Year Future* | 16 | 1,921 | 121.00 | 03/17/18 | 4 | |||||||||||||||
April 2018, U.S. 10-Year Future* | 54 | 6,482 | 121.25 | 03/17/18 | 8 | |||||||||||||||
|
|
|
| |||||||||||||||||
| 8,403 | 12 | |||||||||||||||||||
|
|
|
| |||||||||||||||||
Total Purchased Options | 12,299 | 26 | ||||||||||||||||||
|
|
|
| |||||||||||||||||
WRITTEN OPTIONS — 0.0% | ||||||||||||||||||||
Put Options | ||||||||||||||||||||
April 2018, U.S. 10-Year Future* | (6 | ) | (720 | ) | 119.50 | 03/17/18 | (2 | ) | ||||||||||||
April 2018, U.S. 10-Year Future* | (5 | ) | (600 | ) | 119.00 | 03/17/18 | (1 | ) | ||||||||||||
April 2018, U.S. 5-Year Future* | (7 | ) | (798 | ) | 114.00 | 03/17/18 | (2 | ) | ||||||||||||
|
|
|
| |||||||||||||||||
| (2,118 | ) | (5 | ) | |||||||||||||||||
|
|
|
| |||||||||||||||||
Call Options | ||||||||||||||||||||
April 2018, U.S. 10-Year Future* | (6 | ) | (720 | ) | 122.50 | 03/17/18 | — | |||||||||||||
April 2018, U.S. 10-Year Future* | (4 | ) | (480 | ) | 122.00 | 03/17/18 | — | |||||||||||||
April 2018, U.S. 5-Year Future* | (11 | ) | (1,253 | ) | 114.75 | 03/17/18 | (1 | ) | ||||||||||||
April 2018, U.S. 5-Year Future* | (17 | ) | (1,937 | ) | 114.50 | 03/17/18 | (3 | ) | ||||||||||||
April 2018, U.S. 5-Year Future* | (10 | ) | (1,139 | ) | 115.00 | 03/17/18 | (1 | ) | ||||||||||||
April 2018, U.S. 5-Year Future* | (7 | ) | (798 | ) | 116.00 | 03/17/18 | — | |||||||||||||
April 2018, U.S. 5-Year Future* | (6 | ) | (684 | ) | 115.25 | 03/17/18 | — | |||||||||||||
June 2018, U.S. 10-Year Future* | (6 | ) | (720 | ) | 123.00 | 05/19/18 | (1 | ) | ||||||||||||
June 2018, U.S. Bond Future* | (1 | ) | (144 | ) | 150.00 | 05/19/18 | (1 | ) | ||||||||||||
|
|
|
| |||||||||||||||||
| (7,875 | ) | (7 | ) | |||||||||||||||||
|
|
|
| |||||||||||||||||
Total Written Options | $ | (9,993 | ) | $ | (12 | ) | ||||||||||||||
|
|
|
| |||||||||||||||||
| SEI Catholic Values Trust / Annual Report / February 28, 2018 | 31 |
SCHEDULE OF INVESTMENTS
February 28, 2018
Catholic Values Fixed Income Fund (Continued)
A list of the over-the-counter options held by the Fund at February 28, 2018, is as follows:
| Description | Counterparty | Number of Contracts | Notional Amount ($ Thousands) | Exercise Price | Expiration Date | Value (Thousands) | ||||||||||||||||||
PURCHASED OPTIONS — 0.0% | ||||||||||||||||||||||||
Call Options | ||||||||||||||||||||||||
April 2018, USD Call EUR Put* | Citigroup | 645,000 | 787 | $ | 1.23 | 04/21/18 | $ | 11 | ||||||||||||||||
May 2018, USD Call EUR Put* | Citigroup | 630,000 | 768 | 1.23 | 05/19/18 | 8 | ||||||||||||||||||
|
|
|
| |||||||||||||||||||||
Total Purchased Option | 1,555 | 19 | ||||||||||||||||||||||
|
|
|
| |||||||||||||||||||||
WRITTEN OPTIONS — 0.0% | ||||||||||||||||||||||||
Put Options | ||||||||||||||||||||||||
April 2018, USD Put EUR Call* | Citigroup | (645,000 | ) | (787 | ) | 1.27 | 04/21/18 | (2 | ) | |||||||||||||||
March 2018, USD Put GBP Call* | Citigroup | (539,400 | ) | (743 | ) | 1.45 | 03/17/18 | — | ||||||||||||||||
May 2018, USD Put EUR Call* | Citigroup | (630,000 | ) | (768 | ) | 1.26 | 05/19/18 | (3 | ) | |||||||||||||||
|
|
|
| |||||||||||||||||||||
Total Written Option | (2,298 | ) | $ | (5 | ) | |||||||||||||||||||
|
|
|
| |||||||||||||||||||||
A list of the open futures contracts held by the Fund at February 28, 2018, is as follows:
| Type of Contract | Number of Contracts Long (Short) | Expiration Date | Notional Amount (Thousands) | Value (Thousands) | Unrealized Appreciation/ (Depreciation) (Thousands) | |||||||||||||||
90-Day Euro$ | (15 | ) | Dec-2018 | $ | (3,684 | ) | $ | (3,655 | ) | $ | 29 | |||||||||
90-Day Euro$ | 47 | Dec-2019 | 11,431 | 11,415 | (16 | ) | ||||||||||||||
90-Day Euro$ | 5 | Mar-2021 | 1,218 | 1,213 | (5 | ) | ||||||||||||||
90-Day Euro$ | (4 | ) | Jun-2018 | (984 | ) | (977 | ) | 7 | ||||||||||||
90-Day Euro$ | (4 | ) | Sep-2018 | (984 | ) | (976 | ) | 8 | ||||||||||||
U.S. 2-Year Treasury Note | 58 | Jun-2018 | 12,326 | 12,323 | (3 | ) | ||||||||||||||
U.S. 5-Year Treasury Note | 48 | Jun-2018 | 5,477 | 5,469 | (8 | ) | ||||||||||||||
U.S. 10-Year Treasury Note | (10 | ) | Jun-2018 | (1,200 | ) | (1,200 | ) | — | ||||||||||||
U.S. Long Treasury Bond | (37 | ) | Jun-2018 | (5,306 | ) | (5,307 | ) | (1 | ) | |||||||||||
U.S. Ultra Long Treasury Bond | 33 | Jun-2018 | 5,120 | 5,144 | 24 | |||||||||||||||
Ultra 10-Year U.S. Treasury Note | (16 | ) | Jun-2018 | (2,048 | ) | (2,049 | ) | (1 | ) | |||||||||||
|
|
|
|
|
| |||||||||||||||
| $ | 21,366 | $ | 21,400 | $ | 34 | |||||||||||||||
|
|
|
|
|
| |||||||||||||||
| 32 | SEI Catholic Values Trust / Annual Report / February 28, 2018 |
A list of the open forward foreign currency contracts held by the Fund at February 28, 2018, is as follows:
| Counterparty | Settlement Date | Currency to Deliver (Thousands) | Currency to Receive (Thousands) | Unrealized (Depreciation) | ||||||||||||||||||||
Citigroup | 04/19/18 | GBP | 110 | USD | 157 | $ | 5 | |||||||||||||||||
Citigroup | 04/19/18 | USD | 152 | GBP | 110 | — | ||||||||||||||||||
Citigroup | 04/19/18 | USD | 244 | BRL | 796 | (1 | ) | |||||||||||||||||
Citigroup | 04/19/18 | EUR | 270 | USD | 336 | 6 | ||||||||||||||||||
Citigroup | 04/19/18 | USD | 454 | IDR | 6,068,320 | (15 | ) | |||||||||||||||||
Citigroup | 04/19/18 | USD | 492 | EUR | 400 | (2 | ) | |||||||||||||||||
Citigroup | 04/19/18 | USD | 565 | INR | 36,380 | (11 | ) | |||||||||||||||||
Citigroup | 04/19/18 | CNH | 850 | USD | 130 | (4 | ) | |||||||||||||||||
Citigroup | 04/19/18 | CNY | 4,383 | USD | 673 | (18 | ) | |||||||||||||||||
Citigroup | 04/19/18 | PHP | 32,016 | USD | 632 | 22 | ||||||||||||||||||
Citigroup | 04/19/18 | JPY | 70,917 | USD | 652 | (15 | ) | |||||||||||||||||
|
| |||||||||||||||||||||||
| $ | (33 | ) | ||||||||||||||||||||||
|
| |||||||||||||||||||||||
A list of open centrally cleared swap agreements held by the Fund at February 28, 2018, is as follows:
| Credit Default Swap | ||||||||||||||||||||||||||||||||
Reference Entity/ Obligation | Buy/Sell Protection | (Pays)/Receives Rate | Payment Frequency | Termination Date | Notional Amount (Thousands) | Value (Thousands) | Upfront Payments/ Receipts (Thousands) | Net Unrealized (Depreciation) (Thousands) | ||||||||||||||||||||||||
CDX.NA.IG.29 | Sell | 1.00% | Quarterly | 12/20/2022 | $ | (2,950 | ) | $ | 59 | $ | 66 | $ | (8 | ) | ||||||||||||||||||
|
|
|
|
|
| |||||||||||||||||||||||||||
| $ | 59 | $ | 66 | $ | (8 | ) | ||||||||||||||||||||||||||
|
|
|
|
|
| |||||||||||||||||||||||||||
| Interest Rate Swaps | ||||||||||||||||||||||||
| Fund Pays | Fund Receives | Payment Frequency | Termination Date | Currency | Notional Amount (Thousands) | Value (Thousands) | Upfront Payments/ Receipts (Thousands) | Net Unrealized Appreciation (Depreciation) (Thousands) | ||||||||||||||||
2.4744% | 3-MONTH USD - LIBOR | Quarterly | 11/15/2043 | USD | 852 | $ | 84 | $ | 13 | $ | (71 | ) | ||||||||||||
2.95% | 3-MONTH USD - LIBOR | Quarterly | 11/15/2043 | USD | 1,430 | 16 | 29 | (13 | ) | |||||||||||||||
2.73353% | 3-MONTH USD - LIBOR | Quarterly | 11/15/2043 | USD | 700 | 35 | (19 | ) | 54 | |||||||||||||||
|
|
|
|
|
| |||||||||||||||||||
| $ | 135 | $ | 23 | $ | 112 | |||||||||||||||||||
|
|
|
|
|
| |||||||||||||||||||
For the year ended February 28, 2018, the total amount of all swap agreements, as presented in the tables above, are representative of the volume of activity for this derivative type during the period.
For the year ended February 28, 2018, there were no transfers between Level 1 and Level 2 assets and liabilities. For the year ended February 28, 2018, there were no transfers between Level 2 and Level 3 assets and liabilities. For the year ended February 28, 2018, there were no Level 3 securities.
| Percentages | are based on Net Assets of $151,315 ($ Thousands). |
| * | Non-income producing security. |
| ** | Rate shown is the 7-day effective yield as of February 28, 2018. |
| † | Investment in Affiliated Security (see Note 6). |
| (A) | Variable or floating rate security, the interest rate of which adjusts periodically based on changes in current interest rates and prepayments on the underlying pool of assets. |
| (B) | Security exempt from registration under Rule 144A of the Securities Act of 1933. These securities may be resold in transactions exempt from registration normally to qualified institutions. On February 28, 2018, the value of these securities amounted to $17,088 ($ Thousands), representing 11.29% of the Net Assets of the Fund. |
| (C) | Zero coupon security. The rate shown on the Schedule of Investments is the security’s effective yield at the time of purchase. |
| (D) | Unsettled bank loan. Interest rate may not be available. |
| (E) | Refer to table below for details on Options Contracts. |
ABS — Asset-Backed Security
AGM— Assured Guaranty Municipal
BRL — Brazilian Real
Cl — Class
CMO — Collateralized Mortgage Obligation
CNH — Chinese Yuan Offshore
CNY — Chinese Yuan Onshore
DN — Discount Note
EUR — Euro
FHLB — Federal Home Loan Bank
FHLMC — Federal Home Loan Mortgage Corporation
| SEI Catholic Values Trust / Annual Report / February 28, 2018 | 33 |
SCHEDULE OF INVESTMENTS
February 28, 2018
Catholic Values Fixed Income Fund (Concluded)
FNMA — Federal National Mortgage Association
GBP — British Pound Sterling
GNMA — Government National Mortgage Association
GO — General Obligation
ICE— Intercontinental Exchange
IDR — Indonesian Rupiah
INR — Indian Rupee
IO — Interest Only - face amount represents notional amount.
JPY — Japanese Yen
LLC — Limited Liability Company
MTN — Medium Term Note
RB — Revenue Bond
REMIC — Real Estate Mortgage Investment Conduit
Ser — Series
TBA — To Be Announced
ULC — Unlimited Liability Company
USD — United States Dollar
VAR — Variable Rate
The following is a list of the inputs used as of February 28, 2018, in valuing the Fund’s investments and other financial instruments carried at value ($ Thousands):
| Investments in Securities | Level 1 | Level 2 | Level 3 | Total | ||||||||||||
Mortgage-Backed Securities | $ | — | $ | 47,499 | $ | — | $ | 47,499 | ||||||||
Corporate Obligations | — | 43,374 | — | 43,374 | ||||||||||||
U.S. Treasury Obligations | — | 39,952 | — | 39,952 | ||||||||||||
Asset-Backed Securities | — | 12,589 | — | 12,589 | ||||||||||||
Loan Participations | — | 4,185 | — | 4,185 | ||||||||||||
U.S. Government Agency Obligations | — | 2,753 | — | 2,753 | ||||||||||||
Sovereign Debt | — | 1,529 | — | 1,529 | ||||||||||||
Municipal Bonds | — | 1,193 | — | 1,193 | ||||||||||||
Cash Equivalent | 8,683 | — | — | 8,683 | ||||||||||||
|
|
|
|
|
|
|
| |||||||||
Total Investments in Securities | $ | 8,683 | $ | 153,074 | $ | — | $ | 161,757 | ||||||||
|
|
|
|
|
|
|
| |||||||||
| Other Financial Instruments | Level 1 | Level 2 | Level 3 | Total | ||||||||||||
Written Options | $ | (17 | ) | $ | — | $ | — | $ | (17 | ) | ||||||
Purchased Options | 45 | — | — | 45 | ||||||||||||
Futures Contracts * | ||||||||||||||||
Unrealized Appreciation | 68 | — | — | 68 | ||||||||||||
Unrealized Depreciation | (34 | ) | — | — | (34 | ) | ||||||||||
Forwards Contracts * | ||||||||||||||||
Unrealized Appreciation | — | 33 | — | 33 | ||||||||||||
Unrealized Depreciation | — | (66 | ) | — | (66 | ) | ||||||||||
Centrally Cleared Swaps | ||||||||||||||||
Credit Default Swaps * | ||||||||||||||||
Unrealized Appreciation | — | — | — | — | ||||||||||||
Unrealized Depreciation | — | (8 | ) | — | (8 | ) | ||||||||||
Interest Rate Swaps * | ||||||||||||||||
Unrealized Appreciation | — | 125 | — | 125 | ||||||||||||
Unrealized Depreciation | — | (13 | ) | — | (13 | ) | ||||||||||
|
|
|
|
|
|
|
| |||||||||
Total Other Financial Instruments | $ | 62 | $ | 71 | $ | — | $ | 133 | ||||||||
|
|
|
|
|
|
|
| |||||||||
| * | Futures contracts, forward contracts and swap contracts are valued at the unrealized appreciation (depreciation) on the instrument. |
The following is a summary of the Fund’s transactions with affiliates for the year ended February 28, 2018 ($ Thousands):
| Security Description | Value 2/28/17 | Purchases at Cost | Proceeds from Sales | Value 2/28/2018 | Dividend Income | |||||||||||||||
SEI Daily Income Trust, Government Fund, Cl F | $ | 9,457 | $ | 97,971 | $ | (98,745 | ) | $ | 8,683 | $ | 79 | |||||||||
|
|
|
|
|
|
|
|
|
| |||||||||||
Amounts designated as “—” are $0.
The accompanying notes are an integral part of the financial statements.
| 34 | SEI Catholic Values Trust / Annual Report / February 28, 2018 |
STATEMENTS OF ASSETS AND LIABILITIES ($ THOUSANDS)
February 28, 2018
Catholic Values Equity Fund | Catholic Values Fixed Income Fund | |||||||
Assets: | ||||||||
Investments, at value† | $ | 249,253 | $ | 153,074 | ||||
Affiliated investments, at value†† | 5,748 | 8,683 | ||||||
Cash | 4,225 | 102 | ||||||
Cash collateral on futures | — | 104 | ||||||
Cash collateral on swap contracts | — | 246 | ||||||
Foreign currency, at value††† | 54 | — | ||||||
Receivable for fund shares sold | 19 | — | ||||||
Receivable for investment securities sold | 50 | 3,120 | ||||||
Dividends and Interest receivable | 485 | 828 | ||||||
Unrealized appreciation on forward foreign currency contracts | — | 33 | ||||||
Options purchased, at value†††† | — | 45 | ||||||
Receivable for variation margin on futures contracts | — | 45 | ||||||
Prepaid expenses | 43 | 23 | ||||||
Total Assets | 259,877 | 166,303 | ||||||
Liabilities: | ||||||||
Payable for investment securities purchased | — | 14,707 | ||||||
Payable for fund shares redeemed | — | 19 | ||||||
Income distribution payable | — | 1 | ||||||
Options written, at value# | — | 17 | ||||||
Payable to custodian | 4 | — | ||||||
Payable for variation margin on futures contracts | — | 79 | ||||||
Administration fees payable | 55 | 16 | ||||||
Shareholder servicing fees payable, Class F | 16 | 8 | ||||||
Unrealized depreciation on forward foreign currency contracts | — | 66 | ||||||
Trustees fees payable | 1 | — | ||||||
Chief Compliance Officer fees payable | 1 | — | ||||||
Investment advisory fees payable | 78 | 30 | ||||||
Accrued expense payable | 35 | 45 | ||||||
Total Liabilities | 190 | 14,988 | ||||||
Net Assets | $ | 259,687 | $ | 151,315 | ||||
† Cost of investments | $ | 204,429 | $ | 154,891 | ||||
†† Cost of affiliated investments | 5,748 | 8,683 | ||||||
††† Cost of foreign currency | 55 | — | ||||||
†††† Cost of purchased options | — | 30 | ||||||
# Premiums received on written options | — | 38 | ||||||
Net Assets: | ||||||||
Paid-in Capital — (unlimited authorization — no par value) | $ | 211,067 | $ | 154,158 | ||||
Undistributed net investment income | 334 | 21 | ||||||
Accumulated net realized gain (loss) on investments, securities sold short, option contracts, futures, swap contracts and foreign currency | 3,463 | (1,190 | ) | |||||
Net unrealized appreciation (depreciation) on investments and securities sold short | 44,824 | (1,817 | ) | |||||
Net unrealized appreciation on options | — | 36 | ||||||
Net unrealized appreciation on futures contracts | — | 34 | ||||||
Net unrealized appreciation on swap contracts | — | 104 | ||||||
Net unrealized (depreciation) on forward foreign currency contracts, foreign currencies and translation of other assets and liabilities denominated in foreign currencies | (1 | ) | (32 | ) | ||||
Net Assets | $ | 259,687 | $ | 151,315 | ||||
Net Asset Value, Offering and Redemption Price Per Share — Class F | $ | 12.53 | $ | 9.79 | ||||
| ($225,145,789 ÷ | ($116,124,067 ÷ | |||||||
| 17,973,641 shares | ) | 11,857,287 shares | ) | |||||
Net Asset Value, Offering and Redemption Price Per Share — Class Y | $ | 12.51 | $ | 9.81 | ||||
| ($34,540,727 ÷ | ($35,190,504 ÷ | |||||||
| 2,761,681 shares | ) | 3,588,797 shares | ) | |||||
Amounts designated as “—” are $0 or have been rounded to $0.
| ||||||||
The accompanying notes are an integral part of the financial statements. | ||||||||
SEI Catholic Values Trust / Annual Report / February 28, 2018 | 35 |
STATEMENTS OF OPERATIONS ($ THOUSANDS)
For the year ended February 28, 2018
| Catholic Values Equity Fund | Catholic Values Fixed Income Fund | |||||||
Investment Income: | ||||||||
Dividends | $ | 4,064 | $ | — | ||||
Interest Income | 86 | 3,374 | ||||||
Dividends from Affiliated Registered Investment Company(1) | 58 | 79 | ||||||
Less: Foreign Taxes Withheld | (143 | ) | — | |||||
Total Investment Income | 4,065 | 3,453 | ||||||
Expenses: | ||||||||
Investment Advisory Fees | 1,351 | 434 | ||||||
Administration Fees | 676 | 248 | ||||||
Shareholder Servicing Fees, Class F Shares | 523 | 294 | ||||||
Professional Fees | 61 | 33 | ||||||
Registration Fees | 52 | 30 | ||||||
Printing Fees | 31 | 18 | ||||||
Custodian/Wire Agent Fees | 14 | 32 | ||||||
Trustees’ Fees | 3 | 2 | ||||||
Chief Compliance Officer Fees | 1 | — | ||||||
Other Expenses | 43 | 85 | ||||||
Total Expenses | 2,755 | 1,176 | ||||||
Less: | ||||||||
Waiver of investment advisory fees | (511 | ) | (116 | ) | ||||
Waiver of shareholder servicing fees, Class F Shares | (314 | ) | (176 | ) | ||||
Waiver of administration fees | (6 | ) | (8 | ) | ||||
Net Expenses | 1,924 | 876 | ||||||
Net Investment Income | 2,141 | 2,577 | ||||||
Net Realized and Unrealized Gain (Loss) on Investments: | ||||||||
Net Realized Gain (Loss) on: | ||||||||
Investments | 17,010 | (130 | ) | |||||
Futures Contracts | (51 | ) | 163 | |||||
Foreign Currency Transactions | 13 | (12 | ) | |||||
Purchased and Written Options | — | (96 | ) | |||||
Swap Contracts | — | 33 | ||||||
Net Change in Unrealized Appreciation (Depreciation) on: | ||||||||
Investments | 19,124 | (1,845 | ) | |||||
Futures Contracts | (63 | ) | 29 | |||||
Purchased and Written Options | — | 33 | ||||||
Swap Contracts | — | (43 | ) | |||||
Foreign Currency and Translation of Other Assets and Liabilities Denominated in Foreign Currencies | (1 | ) | (11 | ) | ||||
Net Increase in Net Assets Resulting from Operations | $ | 38,173 | $ | 698 | ||||
(1) See Note 3 in the Notes to the Financial Statements.
Amounts designated as “—” are $0 or have been rounded to $0.
The accompanying notes are an integral part of the financial statements.
| 36 | SEI Catholic Values Trust / Annual Report / February 28, 2018 |
STATEMENTS OF CHANGES IN NET ASSETS ($ THOUSANDS)
For the years ended February,
| Catholic Values Equity Fund | Catholic Values Fixed Income Fund | |||||||||||||||
| 2/28/2018 | 2/28/2017 | 2/28/2018 | 2/28/2017 | |||||||||||||
Operations: | ||||||||||||||||
Net Investment Income | $ | 2,141 | $ | 1,590 | $ | 2,577 | $ | 1,783 | ||||||||
Net Realized Gain (Loss) on Investments, Futures Contracts, Options and Swap Contracts | 16,959 | (3,000 | ) | (30 | ) | 421 | ||||||||||
Net Realized Gain (Loss) on Foreign Currency Transactions | 13 | 7 | (12 | ) | 58 | |||||||||||
Net Change in Unrealized Appreciation (Depreciation) on Investments, Futures Contracts, Options and Swap Contracts | 19,061 | 40,644 | (1,826 | ) | 565 | |||||||||||
Net Change in Unrealized Appreciation (Depreciation) on Foreign Currency and Translation of Other Assets and Liabilities Denominated in Foreign Currencies | (1 | ) | 1 | (11 | ) | 5 | ||||||||||
Net Increase in Net Assets Resulting from Operations | 38,173 | 39,242 | 698 | 2,832 | ||||||||||||
Dividends and Distributions to Shareholders: | ||||||||||||||||
Net Investment Income: | ||||||||||||||||
Class F | (1,620 | ) | (1,691 | ) | (2,688 | ) | (2,200 | ) | ||||||||
Class Y | (156 | ) | (137 | ) | (159 | ) | (29 | ) | ||||||||
Net realized gains: | ||||||||||||||||
Class F | — | — | — | (310 | ) | |||||||||||
Class Y | — | — | — | (4 | ) | |||||||||||
Total Dividends and Distributions | (1,776 | ) | (1,828 | ) | (2,847 | ) | (2,543 | ) | ||||||||
Capital Share Transactions: | ||||||||||||||||
Class F: | ||||||||||||||||
Proceeds from Shares Issued | 26,795 | 39,639 | 22,755 | 37,471 | ||||||||||||
Reinvestment of Dividends & Distributions | 1,620 | 1,690 | 2,679 | 2,497 | ||||||||||||
Cost of Shares Redeemed | (23,901 | ) | (33,114 | ) | (19,166 | ) | (15,191 | ) | ||||||||
Net Increase in Net Assets from Class F Transactions | 4,514 | 8,215 | 6,268 | 24,777 | ||||||||||||
Class Y: | ||||||||||||||||
Proceeds from Shares Issued | 22,399 | 1,204 | 34,495 | 63 | ||||||||||||
Reinvestment of Dividends & Distributions | 156 | 137 | 159 | 32 | ||||||||||||
Cost of Shares Redeemed | (1,203 | ) | (1,418 | ) | (93 | ) | (117 | ) | ||||||||
Net Increase (Decrease) in Net Assets from Class Y Transactions | 21,352 | (77 | ) | 34,561 | (22 | ) | ||||||||||
Net Increase in Net Assets Derived from Capital Share Transactions | 25,866 | 8,138 | 40,829 | 24,755 | ||||||||||||
Net Increase in Net Assets | 62,263 | 45,552 | 38,680 | 25,044 | ||||||||||||
NET ASSETS: | ||||||||||||||||
Beginning of Year | 197,424 | 151,872 | 112,635 | 87,591 | ||||||||||||
End of Year | $ | 259,687 | $ | 197,424 | $ | 151,315 | $ | 112,635 | ||||||||
Undistributed (Distributions in Excess of) Net Investment Income | $ | 334 | $ | (24 | ) | $ | 21 | $ | 57 | |||||||
Capital Share Transactions: | ||||||||||||||||
Class F: | ||||||||||||||||
Shares Issued | 2,363 | 4,079 | 2,275 | 3,740 | ||||||||||||
Shares Issued in Lieu of Dividends & Distributions | 131 | 168 | 268 | 249 | ||||||||||||
Shares Redeemed | (2,040 | ) | (3,371 | ) | (1,910 | ) | (1,506 | ) | ||||||||
Net Increase in Shares Outstanding from Share Transactions | 454 | 876 | 633 | 2,483 | ||||||||||||
Capital Share Transactions: | ||||||||||||||||
Class Y: | ||||||||||||||||
Shares Issued | 1,763 | 128 | 3,464 | 6 | ||||||||||||
Shares Issued in Lieu of Dividends & Distributions | 13 | 14 | 16 | 3 | ||||||||||||
Shares Redeemed | (100 | ) | (143 | ) | (9 | ) | (11 | ) | ||||||||
Net Increase (Decrease) in Shares Outstanding from Share Transactions | 1,676 | (1 | ) | 3,471 | (2 | ) | ||||||||||
Amounts designated as “—” are $0 or have been rounded to $0.
The accompanying notes are an integral part of the financial statements.
SEI Catholic Values Trust / Annual Report / February 28, 2018 | 37 |
For the years ended February 28,
For a Share Outstanding Throughout the Period
Net Asset Value, Beginning of Year | Net Investment | Net Realized Gains (Losses) on Investments(1) | Total from | Dividends from Net Investment Income | Distributions from Net Realized Gains | Total Dividends and Distributions | Net Asset Value, End of Year | Total Return† | Net Assets End of Year($ Thousands) | Ratio of Net Expenses to Average Net Assets | Ratio of Expenses to Average Net Assets (Excluding Fees Paid Indirectly and Waivers) | Ratio of Net to Average | Portfolio Turnover | |||||||||||||||||||||||||||||||||||||||||||
Catholic Values Equity Fund |
| |||||||||||||||||||||||||||||||||||||||||||||||||||||||
Class F | ||||||||||||||||||||||||||||||||||||||||||||||||||||||||
2018 | $10.61 | $0.11 | $1.90 | $2.01 | $(0.09) | $— | $(0.09) | $12.53 | 18.93% | $225,146 | 0.86% | 1.24% | 0.94% | 56% | ||||||||||||||||||||||||||||||||||||||||||
2017 | 8.57 | 0.09 | 2.05 | 2.14 | (0.10) | — | (0.10) | 10.61 | 25.03 | 185,908 | 0.86 | 1.25 | 0.88 | 63 | ||||||||||||||||||||||||||||||||||||||||||
2016(2) | 10.00 | 0.08 | (1.44) | (1.36) | (0.07) | — | (0.07) | 8.57 | (13.66) | 142,564 | 0.86 | 1.32 | 0.96 | 84 | ||||||||||||||||||||||||||||||||||||||||||
Class Y | ||||||||||||||||||||||||||||||||||||||||||||||||||||||||
2018 | $10.60 | $0.12 | $1.90 | $2.02 | $(0.11) | $— | $(0.11) | $12.51 | 19.05% | $34,541 | 0.76% | 0.99% | 1.06% | 56% | ||||||||||||||||||||||||||||||||||||||||||
2017 | 8.56 | 0.10 | 2.06 | 2.16 | (0.12) | — | (0.12) | 10.60 | 25.28 | 11,516 | 0.76 | 1.00 | 0.98 | 63 | ||||||||||||||||||||||||||||||||||||||||||
2016(3) | 10.04 | 0.07 | (1.47) | (1.40) | (0.08) | — | (0.08) | 8.56 | (14.05) | 9,308 | 0.76 | 1.07 | 1.01 | 84 | ||||||||||||||||||||||||||||||||||||||||||
Catholic Values Fixed Income Fund |
| |||||||||||||||||||||||||||||||||||||||||||||||||||||||
Class F | ||||||||||||||||||||||||||||||||||||||||||||||||||||||||
2018 | $9.93 | $0.20 | $(0.11) | $0.09 | $(0.23) | $— | $(0.23) | $9.79 | 0.87% | $116,124 | 0.71% | 0.96% | 2.06% | 194% | ||||||||||||||||||||||||||||||||||||||||||
2017 | 9.89 | 0.19 | 0.11 | 0.30 | (0.23) | (0.03) | (0.26) | 9.93 | 3.11 | 111,465 | 0.71 | 1.04 | 1.87 | 124 | ||||||||||||||||||||||||||||||||||||||||||
2016(2) | 10.00 | 0.14 | (0.09) | 0.05 | (0.16) | — | (0.16) | 9.89 | 0.54 | 86,406 | 0.71 | 1.09 | 1.77 | 216 | ||||||||||||||||||||||||||||||||||||||||||
Class Y | ||||||||||||||||||||||||||||||||||||||||||||||||||||||||
2018 | $9.94 | $0.23 | $(0.12) | $0.11 | $(0.24) | $— | $(0.24) | $9.81 | 1.07% | $35,191 | 0.61% | 0.74% | 2.35% | 194% | ||||||||||||||||||||||||||||||||||||||||||
2017 | 9.89 | 0.20 | 0.15 | 0.35 | (0.24) | (0.03) | (0.27) | 9.94 | 3.32 | 1,170 | 0.61 | 0.79 | 1.97 | 124 | ||||||||||||||||||||||||||||||||||||||||||
2016(3) | 9.95 | 0.14 | (0.04) | 0.10 | (0.16) | — | (0.16) | 9.89 | 1.00 | 1,185 | 0.61 | 0.84 | 1.97 | 216 | ||||||||||||||||||||||||||||||||||||||||||
| † | Returns and portfolio turnover rates are for the period indicated and have not been annualized. Returns do not reflect the deduction of taxes the shareholder would pay on fund distributions or redemption of fund shares. |
| (1) | Per share net investment income and net realized and unrealized gains (losses) calculated using average shares. |
| (2) | Commenced operations on April 30, 2015. All ratios for the period have been annualized. |
| (3) | Commenced operations on May 31, 2015. All ratios for the period have been annualized. |
Amounts designated as “—” are either $0 or have been rounded to $0.
The accompanying notes are an integral part of the financial statements.
| 38 | SEI Catholic Values Trust / Annual Report / February 28, 2018 |
February 28, 2018
1. ORGANIZATION
SEI Catholic Values Trust (the “Trust”) is organized as a Delaware statutory trust under a Declaration of Trust dated December 8, 2014.
The Trust is registered under the Investment Company Act of 1940, as amended, as a diversified, open-end investment company with two operational Funds: Catholic Values Equity Fund (“Equity Fund”) and Catholic Values Fixed Income Fund (“Fixed Income Fund”) (each a “Fund,” collectively, the “Funds”), both of which are diversified Funds. The Trust is registered to offer: Class F (Formerly Class A shares) and Class Y shares of the Funds. The assets of each Fund are segregated, and a shareholder’s interest is limited to the Fund in which shares are held. The Funds’ prospectuses provide a description of each Fund’s investment objective and strategies.
In addition to its objective and strategies, each of the Funds makes investment decisions consistent with Catholic values on a range of social and moral concerns that may include: protecting human life; promoting human dignity; reducing arms production; pursuing economic justice; protecting the environment, and encouraging corporate responsibility. Potential investments for the Funds are first selected for financial soundness and then evaluated according to the Funds’ social criteria. The Adviser has engaged an independent compliance support organization that has identified a list of issuers that do not align with Catholic values. The Funds will not invest in issuers identified through this process. The Adviser reserves the right to modify the criteria from time to time to maintain alignment with evolving Catholic social and moral positions.
Effective January 31, 2017, the SEI Catholic Values Equity Fund, Class A and the SEI Catholic Values Fixed Income Fund, Class A were each re-designated as Class F. This share class name change had no impact on either Fund’s operations or investment policies.
2. SIGNIFICANT POLICIES
The following is a summary of significant accounting policies consistently followed by the Funds. The Funds are investment companies in conformity with accounting principles generally accepted in the United States of America (“U.S. GAAP”). Therefore, the Funds follow the accounting and reporting guidelines for investment companies.
Use of Estimates — The preparation of financial statements, in conformity with U.S. GAAP requires management to make estimates and assumptions that affect the reported amount of assets and liabilities and disclosure of contingent assets and liabilities at the date
of the financial statements and the reported amounts of increases and decreases in net assets from operations during the reporting period. Actual results could differ from those estimates.
Security Valuation — Securities listed on a securities exchange, market or automated quotation system for which quotations are readily available (other than securities traded on National Association of Securities Dealers Automated Quotations (“NASDAQ”) or as otherwise noted below) at the last quoted sale price on an exchange or market (foreign or domestic) on which the securities are traded, or, if there is no such reported sale, at the most recent quoted bid price. The Funds value securities traded on NASDAQ at the NASDAQ Official Closing Price. If available, debt securities, swaps (which are not centrally cleared), bank loans or collateralized debt obligations (including collateralized loan obligations), such as those held by the Funds, are priced based upon valuations provided by independent, third-party pricing agents. Such values generally reflect the last reported sales price if the security is actively traded. The third-party pricing agents may also value debt securities at an evaluated bid price by employing methodologies that utilize actual market transactions, broker-supplied valuations or other methodologies designed to identify the market value for such securities. Redeemable securities issued by open-end investment companies are valued at the investment company’s applicable net asset value, with the exception of ETFs, which are priced as equity securities. The prices of foreign securities are reported in local currency and converted to U.S. dollars using currency exchange rates. If a security’s price cannot be obtained, as noted above, the Funds will value the securities using a bid price from at least one independent broker. If such prices are not readily available or cannot be valued using the methodologies described above, the Funds will value the security using the Funds’ Fair Value Pricing Policies and Procedures (“Fair Value Procedures”), as described below.
On the first day a new debt security purchase is recorded, if a price is not available from a third-party pricing agent or an independent broker, the security may be valued at its purchase price. Each day thereafter, the debt security will be valued according to the Funds’ Fair Value Procedures until a price from an independent source can be secured. Securities held by a Fund with remaining maturities of 60 days or less may be valued by the amortized cost method, which involves valuing a security at its cost on the date of purchase and thereafter (absent unusual circumstances) assuming a constant amortization to maturity of any discount or premium, regardless of the impact of fluctuations in general market rates of interest on the value of the
SEI Catholic Values Trust / Annual Report / February 28, 2018 | 39 |
NOTES TO FINANCIAL STATEMENTS (Continued)
February 28, 2018
instrument. While this method provides certainty in valuation, it may result in periods during which value, as determined by this method, is higher or lower than the price a Fund would receive if it sold the instrument. Further, the value of securities in the Fund can be expected to vary inversely with changes in prevailing interest rates. Should existing credit, liquidity or interest rate conditions in the relevant markets and issuer-specific circumstances suggest that amortized cost does not approximate fair value, then the amortized cost method may not be used.
Options and warrants are valued at the last quoted sales price. If there is no such reported sale on the valuation date, long positions are valued at the most recent bid price, and short positions are valued at the most recent ask price.
Futures and swaps cleared through a central clearing house (“Centrally Cleared swaps”) are valued at the settlement price established each day by the board of exchange on which they are traded. The daily settlement prices for financial futures and centrally cleared swaps are provided by an independent source. On days when there is excessive volume, market volatility or the future or centrally cleared swap does not end trading by the time a Fund calculates its NAV, the settlement price may not be available at the time at which the Fund calculates its NAV. On such days, the best available price (which is typically the last sales price) may be used to value a Fund’s futures or centrally cleared swaps position.
Foreign currency forward contracts are valued at the current day’s interpolated foreign exchange rate, as calculated using the current day’s spot rate, and the thirty, sixty, ninety and one-hundred eighty day forward rates provided by an independent source.
Prices for most securities held by a Fund are provided daily by third-party independent pricing agents. SEI Investments Management Corporation (“SIMC”) or a Sub-Adviser (“Sub-Adviser”), as applicable, reasonably believes that prices provided by independent pricing agents are reliable. However, there can be no assurance that such pricing service’s prices will be reliable. SIMC or a Sub-Adviser, as applicable, monitors the reliability of prices obtained from any pricing service and shall promptly notify the Funds’ administrator if it believes that a particular pricing service is no longer a reliable source of prices. The Funds’ administrator, in turn, notifies the Fair Value Pricing Committee (the “Committee”) if it receives such notification from SIMC or a Sub-Adviser, as applicable, or if the Funds’ administrator reasonably believes that a particular pricing service is no longer a reliable source for prices.
The Funds’ Fair Value Procedures provide that any change in a primary pricing agent or a pricing methodology requires prior approval by the Board of Trustees (“Board”) or its designated sub-committee. However, when the change would not materially affect valuation of a Fund’s net assets or involve a material departure in pricing methodology from that of the Fund’s existing pricing agent or pricing methodology, approval may be obtained at the next regularly scheduled meeting of the Board.
Securities for which market prices are not readily available, for which market prices are determined to be unreliable, or which cannot be valued using the methodologies described above are valued in accordance with the Fair Value Procedures established by the Board. The Funds’ Fair Value Procedures are implemented through the Committee designated by the Board. The Committee is currently composed of two members of the Board, as well as representatives from SIMC and its affiliates. Some of the more common reasons that may necessitate that a security be valued using Fair Value Procedures include: (i) the security’s trading has been halted or suspended, (ii) the security has been delisted from a national exchange, (iii) the security’s primary trading market is temporarily closed at a time when under normal conditions it would be open, or (iv) the security’s primary pricing source is not able or willing to provide a price. When a security is valued in accordance with the Fair Value Procedures, the Committee will determine the value after taking into consideration relevant information reasonably available to the Committee. Examples of factors the Committee may consider include: (i) the facts giving rise to the need to fair value, (ii) the last trade price, (iii) the performance of the market or the issuer’s industry, (iv) the liquidity of the security, (v) the size of the holding in a Fund, or (vi) any other appropriate information.
The determination of a security’s fair value price often involves the consideration of a number of subjective factors, and is therefore subject to the unavoidable risk that the value assigned to a security may be higher or lower than the security’s value would be if a reliable market quotation for the security was readily available.
For securities that principally trade on a foreign market or exchange, a significant gap in time can exist between the time of a particular security’s last trade and the time at which a Fund calculates its Net Asset Value (“NAV”). The closing prices of such securities may no longer reflect their market value at the time a Fund calculates NAV if an event that could materially affect the value of those securities (a “Significant Event”), including substantial fluctuations in domestic or foreign markets or occurrences not tied directly to the securities markets,
| 40 | SEI Catholic Values Trust / Annual Report / February 28, 2018 |
such as natural disasters, armed conflicts or significant governmental actions, has occurred between the time of the security’s last close and the time that the Fund calculates NAV. A Fund may invest in securities that are primarily listed on foreign exchanges that trade on weekends or other days when the Fund does not price its shares. As a result, the NAV of the Fund’s shares may change on days when shareholders will not be able to purchase or redeem Fund shares.
A Significant Event may relate to a single issuer or to an entire market sector. If SIMC or a Sub-Adviser becomes aware of a Significant Event that has occurred with respect to a security or group of securities after the closing of the exchange or market on which the security or securities principally trade, but before the time at which the Funds calculate NAV, it may request that a Committee meeting be called. In addition, the Funds use several processes, with respect to certain securities to monitor the pricing data supplied by various sources, including price comparisons and price movements. Any identified discrepancies are researched and subject to the procedures described above.
The Equity Fund and Fixed Income Fund, which may hold international securities, use a third-party fair valuation vendor. The vendor provides a fair value for foreign securities held by the Funds based on certain factors and methodologies (involving, generally, tracking valuation correlations between the U.S. market and each non-U.S. security). Values from the fair value vendor are applied in the event that there is a movement in the U.S. market that exceeds a specific threshold that has been established by the Committee. The Committee has also established a “confidence interval” which is used to determine the level of historical correlation between the value of a specific foreign security and movements in the U.S. market before a particular security will be fair valued when the threshold is exceeded. In the event that the threshold established by the Committee is exceeded on a specific day, these Funds will value the non-U.S. securities in their portfolios that exceed the applicable “confidence interval” based upon the adjusted prices provided by the fair valuation vendor.
In accordance with U.S. GAAP, fair value is defined as the price that a Fund would receive upon selling an investment in an orderly transaction to an independent buyer in the principal or most advantageous market of the investment. A three tier hierarchy has been established to maximize the use of observable and minimize the use of unobservable inputs and to establish classification of fair value measurements for disclosure purposes. Inputs refer broadly to the assumptions that market participants would use in pricing an asset. Inputs may be observable or unobservable. Observable
inputs are inputs that reflect the assumptions market participants would use in pricing the asset or liability based on market data obtained from sources independent of the reporting entity. Unobservable inputs are inputs that reflect the reporting entity’s own assumptions about the assumptions market participants would use in pricing the asset or liability based on the best information available in the circumstances.
The three-tier hierarchy of inputs is summarized in the three broad Levels listed below:
Level 1 — Unadjusted quoted prices in active markets for identical, unrestricted assets or liabilities that the Fund has the ability to access at the measurement date;
Level 2 — Quoted prices which are not active, or inputs that are observable (either directly or indirectly) for substantially the full term of the asset or liability; and
Level 3 — Prices, inputs or exotic modeling techniques which are both significant to the fair value measurement and unobservable (supported by little or no market activity).
Investments are classified within the level of the lowest significant input considered in determining fair value. Investments classified within Level 3 whose fair value measurement considers several inputs may include Level 1 or Level 2 inputs as components of the overall fair value measurement.
Debt securities are valued in accordance with the evaluated bid price supplied by the pricing service and generally categorized as Level 2 in the hierarchy. Other securities that are categorized as Level 2 in the hierarchy include, but are not limited to, preferred stocks, bank loans, warrants, swaps and forward contracts.
The valuation techniques used by the Funds to measure fair value during the year ended February 28, 2018 maximized the use of observable inputs and minimized the use of unobservable inputs.
For the year ended February 28, 2018, there have been no significant changes to the Trust’s fair valuation methodologies. For details of the investment classifications reference the Schedules of Investments.
Security Transactions and Investment Income — Security transactions are recorded on the trade date. Costs used in determining net realized capital gains and losses on the sale of securities are on the basis of specific identification. Dividend income is recognized on the ex-dividend date, and interest income is recognized using the accrual basis of accounting. Income from
| SEI Catholic Values Trust / Annual Report / February 28, 2018 | 41 |
NOTES TO FINANCIAL STATEMENTS (Continued)
February 28, 2018
payment-in-kind securities is recorded daily based on the effective interest method of accrual.
Distributions received on securities that represent a return of capital or capital gains are recorded as a reduction of cost of investments and/or as a realized gain. The Trust estimates the components of distributions received that may be considered nontaxable distributions or capital gain distributions.
Amortization and accretion is calculated using the scientific interest method, which approximates the effective interest method over the holding period of the security, which is not materially different from the effective interest method. Amortization of premiums and discounts is included in interest income.
Foreign Currency Translation — The books and records of the Funds investing in international securities are maintained in U.S. dollars on the following basis:
(i)market value of investment securities, assets and liabilities at the current rate of exchange; and
(ii)purchases and sales of investment securities, income and expenses at the relevant rates of exchange prevailing on the respective dates of such transactions.
The Funds do not isolate that portion of gains and losses on investments in equity securities that is due to changes in the foreign exchange rates from that which is due to changes in market prices of equity securities.
The Funds report certain foreign-currency-related transactions as components of realized gains for financial reporting purposes, whereas such components are treated as ordinary income for Federal income tax purposes.
Futures Contracts — To the extent consistent with its Investment Objective and Strategies, a Fund may use futures contracts for tactical hedging purposes as well as to enhance the Fund’s returns. In addition, fixed income funds will utilize futures contracts to help manage duration and yield curve exposure. These Funds’ investments in futures contracts are designed to enable the Funds to more closely approximate the performance of their benchmark indices. Initial margin deposits of cash or securities are made upon entering into futures contracts. The contracts are market-to-market daily and the resulting changes in value are accounted for as unrealized gains and losses. Variation margin payments are paid or received, depending upon whether unrealized gains or losses are incurred. When contracts are closed, the Funds record a realized gain or loss equal to the difference between the proceeds
from (or cost of) the closing transaction and the amount invested in the contract.
Risks of entering into futures contracts include the possibility that there will be an imperfect price correlation between the futures and the underlying securities. Second, it is possible that a lack of liquidity for futures contracts could exist in the secondary market, resulting in an inability to close a position prior to its maturity date. Third, futures contracts involve the risk that a Fund could lose more than the original margin deposit required to initiate a futures transaction.
Finally, the risk exists that losses could exceed amounts disclosed on the Statements of Assets and Liabilities.
It is the Funds’ policy to present the gross variation margin payable and the gross variation margin receivable of the future contracts separately on the Statement of Assets and Liabilities as the Funds do not have a master netting agreement with the counter party to the future contracts.
Refer to each Fund’s Schedule of Investments for details regarding open futures contracts as of February 28, 2018, if applicable.
Inflation-Indexed Bonds — Inflation-indexed bonds are fixed income securities whose principal value is periodically adjusted according to the rate of inflation. If the index measuring inflation rises or falls, the principal value of inflation-indexed bonds will be adjusted upward or downward, and consequently the interest payable on these securities (calculated with respect to a larger or smaller principal amount) will be increased or reduced, respectively. Any upward or downward adjustment in the principal amount of an inflation-indexed bond will be included in interest income in the Statement of Operations, even though investors do not receive their principal until maturity. Repayment of the original bond principal upon maturity (as adjusted for inflation) is guaranteed in the case of U.S. Treasury inflation-indexed bonds. For bonds that do not provide a similar guarantee, the adjusted principal value of the bond repaid at maturity may be less than the original principal.
Options Written/Purchased — To the extent consistent with its investment objective and strategies, a Fund may invest in financial options contracts to add return or to hedge their existing portfolio securities. When the Fund writes or purchases an option, an amount equal to the premium received or paid by the Fund is recorded as a liability or an asset and is subsequently adjusted to the current market value of the option written or purchased. Premiums received or paid from purchasing or writing options which expire unexercised are treated by the Fund on the expiration date as realized gains or losses. The difference between the premium and the amount
| 42 | SEI Catholic Values Trust / Annual Report / February 28, 2018 |
paid or received on effecting a closing purchase or sale transaction, including brokerage commissions, is also treated as a realized gain or loss. If an option is exercised, the premium paid or received is added to the cost of the purchase or proceeds from the sale in determining whether the Fund has realized a gain or a loss. The risk in writing a call option is that the Fund gives up the opportunity for profit if the market price of the security increases. The risk in writing a put option is that the Fund may incur a loss if the market price of the security decreases and the option is exercised. The risk in purchasing an option is that the Fund pays a premium whether or not the option is exercised. The Fund also has the additional risk of being unable to enter into a closing transaction at an acceptable price if a liquid secondary market does not exist. Option contracts also involve the risk that they may not work as intended due to unanticipated developments in market conditions or other causes. In connection with option agreement securities may be set aside as collateral by a Fund’s custodian.
The cost of purchased options and the premiums received for written options that are presented in the Schedule of Investments are representative of the volume of activity during the year ended February 28, 2018.
Finally, the risk exists that losses on written options could exceed amounts disclosed on the Statements of Assets and Liabilities. Refer to each Fund’s Schedule of Investments for details regarding open options contracts as of February 28, 2018, if applicable.
Securities Sold Short — To the extent consistent with its Investment Objective and Strategies, a Fund may engage in short sales. Short sales are transactions under which a Fund sells a security it does not own. To complete such a transaction, the Fund must borrow the security to make delivery to the buyer. A Fund then is obligated to replace the security borrowed by purchasing the security at the market price at the time of the replacement. The price at such time may be more or less than the price at which the security was sold by a Fund. Until the security is replaced, a Fund is required to pay the lender amounts equal to any dividends or interest that accrue during the period of the loan. Dividends and interest are shown as an expense for financial reporting purposes. To borrow the security, a Fund also may be required to pay a premium, which would decrease proceeds of the security sold. The proceeds of the short sale are retained by the broker, to the extent necessary to meet margin requirements, until the short position is closed out. A gain, limited to the price at which a Fund sold the security short, or a loss,
unlimited in size, will be recognized upon the close of a short sale.
Refer to each Fund’s Schedule of Investments for details regarding securities sold short as of February 28, 2018, if applicable.
Swap Agreements — To the extent consistent with its Investment Objective and Strategies, a Fund may invest in swap contracts as an efficient means to synthetically obtain exposure to securities or baskets of securities and to manage a Fund’s interest rate duration and yield curve exposure. Swap contracts may also be used to mitigate a Fund’s overall level of risk and/or a Fund’s risk to particular types of securities, currencies or market segments. Interest rate swaps may further be used to manage a Fund’s yield spread sensitivity. A Fund may buy credit default swaps in an attempt to manage credit risk where a Fund has credit exposure to an issuer, and a Fund may sell credit default swaps to more efficiently gain credit exposure to a security or basket of securities. A swap agreement is a two-party contract under which an agreement is made to exchange returns from predetermined investments or instruments, including a particular interest rate, foreign currency, or “Basket” of securities representing a particular index. Swap agreements are privately negotiated in the over-the-counter market (“OTC swaps”) or may be executed in a multilateral or other trade facility platform, such as a registered commodities exchange (“Centrally Cleared swaps”). Interest rate swaps involve the exchange by a Fund with another party of their respective commitments to pay or receive interest (e.g., an exchange of floating rate payments for fixed rate payments) with respect to a notional amount of principal. Credit default swaps involve periodic payments by a Fund or counterparty based on a specified rate multiplied by a notional amount assigned to an underlying debt instrument or group of debt instruments in exchange for the assumption of credit risk on the same instruments. In the event of a credit event, usually in the form of a credit rating downgrade, the party receiving periodic payments (i.e. floating rate payer) must pay the other party (i.e. fixed rate payer) an amount equal to the recovery rate used to settle the contracts. The recovery rate is a function of how many credit default swap investors wish to deliver the security or receive the security. The recovery rate is determined through an auction process. Total return swaps allow an investor to benefit from the cash flow without ever actually owning the underlying security. The receiver must pay any decline in value to the payer at the end of the total return swap. However, the investor does not need to make a payment if there is no decline in price. Payments can be made on various indices, bonds (i.e. mortgage backed securities, bank debt and corporate), loans or commodities. The value
| SEI Catholic Values Trust / Annual Report / February 28, 2018 | 43 |
NOTES TO FINANCIAL STATEMENTS (Continued)
February 28, 2018
of a total return swap is equal to the change in value of the underlying asset versus the accrued income payment based on LIBOR or some other form of indices on the notional amount. Payments received or made are recorded as realized gains or loss. A Fund could be exposed to credit or market risk due to unfavorable changes in the fluctuation of interest rates or if the counterparty defaults on its obligation to perform. Risk of loss may exceed amounts recognized on the statement of assets and liabilities. Interest rate swap contracts outstanding at period end, if any, are listed after a Fund’s portfolio. In connection with swap agreements securities may be set aside as collateral by a Fund’s custodian.
Swaps are “marked-to-market” daily based upon quotations from market makers and the resulting changes in market values, if any, are recorded as an unrealized gain or loss in the Statement of Operations. Centrally Cleared swaps are valued at the settlement price established each day by the board on exchange on which they are traded. The daily settlement prices for centrally cleared swaps are provided by an independent source. Net payments of interest are recorded as realized gains or losses. Daily changes in valuation of Centrally Cleared swaps, if any, are recorded as a receivable or payable for the change in value as appropriate (“Variation Margin”) on the Statements of Assets and Liabilities.
Entering into swap agreements involves, to varying degrees, elements of credit and market risk in excess of the amounts recognized on the Statement of Assets and Liabilities. Such risks involve the possibility that there will be no liquid market for these agreements, that the counterparty to the agreement may default on its obligation to perform and that there may be unfavorable changes in the fluctuation of interest rates. Risks also arise from potential losses from adverse market movements.
It is the Funds’ policy to present the gross variation margin payable and the gross variation margin receivable of the swap contracts separately on the Statement of Assets and Liabilities as the Funds do not have a master netting agreement with the counter party to the swap contracts. See Note 3 for further details. Refer to each Fund’s Schedule of Investments, for details regarding open swap agreements as of February 28, 2018, if applicable.
Delayed Delivery Transactions — To the extent consistent with its Investment Objective and Strategies, a Fund may purchase or sell securities on a when-issued or delayed delivery basis. These transactions involve a commitment by the Fund to purchase or sell securities for a predetermined price or yield, with payment and delivery taking place beyond the customary
settlement period. When delayed delivery purchases are outstanding, the Fund will set aside liquid assets in an amount sufficient to meet the purchase price. When purchasing a security on a delayed delivery basis, the Fund assumes the rights and risks of ownership of the security, including the risk of price and yield fluctuations, and takes such fluctuations into account when determining its net asset value. The Fund may dispose of or renegotiate a delayed delivery transaction after it is entered into, and may sell when-issued securities before they are delivered, which may result in a capital gain or loss. When the Fund has sold a security on a delayed delivery basis, the Fund does not participate in future gains and losses with respect to the security.
Collateralized Debt Obligations — To the extent consistent with its Investment Objective and Strategies, a Fund may invest in collateralized debt obligations (“CDOs”), which include collateralized loan obligations (“CLOs”) and other similarly structured securities. CLOs are a type of asset-backed securities. A CLO is a trust typically collateralized by a pool of loans, which may include, among others, domestic and foreign senior secured loans, senior unsecured loans, and subordinate corporate loans, including loans that may be rated below investment grade or equivalent unrated loans. CDOs may charge management fees and administrative expenses.
For CDOs, the cash flows from the trust are split into two or more portions, called tranches, varying in risk and yield. The riskiest portion is the “Equity” tranche which bears the bulk of defaults from the bonds or loans in the trust and serves to protect the other, more senior tranches from default in all but the most severe circumstances. Since it is partially protected from defaults, a senior tranche from a CDO trust typically has a higher rating and lower yield than its underlying securities, and can be rated investment grade. Despite the protection from the equity tranche, CDO tranches can experience substantial losses due to actual defaults, increased sensitivity to defaults due to collateral default and disappearance of protecting tranches, market anticipation of defaults, as well as aversion to CDO securities as a class.
The risks of an investment in a CDO depend largely on its Class and its collateral securities. Normally, CLOs and other CDOs are privately offered and sold, and thus, are not registered under the securities laws. As a result, investments in CDOs may be characterized by the Funds as illiquid securities; however, an active dealer market may exist for CDOs, allowing a CDO to qualify for Rule 144A transactions. In addition to the normal risks associated with fixed income securities (e.g., interest rate risk and default risk), CDOs carry additional risks including, but not limited to: (i) the possibility
| 44 | SEI Catholic Values Trust / Annual Report / February 28, 2018 |
that distributions from collateral securities will not be adequate to make interest or other payments; (ii) the quality of the collateral may decline in value or default; (iii) the Funds may invest in CDOs that are subordinate to other classes; and (iv) the complex structure of the security may not be fully understood at the time of investment and may produce disputes with the issuer or unexpected investment results.
Illiquid Securities — A security is considered illiquid if it cannot be sold or disposed of in the ordinary course of business within seven days or less for its approximate carrying value on the books of a Fund. Valuations of illiquid securities may differ significantly from the values that would have been used had an active market value for these securities existed.
Restricted Securities — Throughout the period, the Funds may own private placement investments that were purchased through private offerings or acquired through initial public offerings that could not be sold without prior registration under the Securities Act of 1933 or pursuant to an exemption there from. In addition, the Funds had generally agreed to further restrictions on the disposition of certain holdings as set forth in various agreements entered into in connection with the purchase of those investments. These investments were valued at amortized cost, which approximates fair value, as determined in accordance with the procedures approved by the Board of Trustees. At February 28, 2018, the Funds did not own any restricted securities.
Classes — Class-specific expenses are borne by that class of shares. Income, expenses, and realized and unrealized gains/losses and non- class-specific expenses are allocated to the respective class on the basis of relative daily net assets.
Expenses — Expenses that are directly related to one of the Funds are charged directly to that Fund. Other operating expenses of the Funds are prorated to the Funds on the basis of relative net assets.
Cash and Cash Equivalents — Idle cash and currency balances may be swept into various overnight sweep accounts and are classified as cash equivalents on the Statement of Assets and Liabilities. These amounts, at times, may exceed United States federally insured limits. Amounts swept are available on the next business day.
Dividends and Distributions to Shareholders — The Equity Fund will distribute its net investment income annually. The Fixed Income Fund declares its net investment income daily and distributes monthly. The Funds make distributions of capital gains, if any, at least annually.
Investments in Real Estate Investment Trusts (“REITs”) — Dividend income is recorded based on
the income included in distributions received from the REIT investments using published REIT reclassifications including management estimates when actual amounts are not available. Distributions received in excess of this estimated amount are recorded as a reduction of the cost of investments or reclassified to capital gains. The actual amounts of income, return of capital, and capital gains are only determined by each REIT after its fiscal year-end, and may differ from the estimated amounts.
3. CREDIT DERIVATIVES
A Fund may use credit default swaps to reduce risk where a Fund has exposure to the issuer, or to take an active long or short position with respect to the likelihood of an event of default. The reference obligation of the swap can be a single issuer, a “basket” of issuers, or an index. The underlying referenced assets are corporate debt, sovereign debt and asset backed securities.
The buyer of a credit default swap is generally obligated to pay the seller a periodic stream of payments over the term of the contract in return for a contingent payment upon the occurrence of a credit event with respect to an underlying reference obligation. Generally, a credit event for corporate or sovereign reference obligations means bankruptcy, failure to pay, obligation acceleration, repudiation/moratorium or restructuring. For credit default swaps on asset-backed securities, credit event may be triggered by events such as failure to pay principal, maturity extension, rating downgrade or write-down.
If a Fund is a seller of protection, and a credit event occurs, as defined under the terms of that particular swap agreement, a Fund will generally either (i) pay to the buyer an amount equal to the notional amount of the swap and take delivery of the referenced obligation, other deliverable obligations, or underlying securities comprising a referenced index or (ii) pay a net settlement amount in the form of cash or securities equal to the notional amount of the swap less the recovery value of the referenced obligation or underlying securities comprising a referenced index.
If a Fund is a buyer of protection and a credit event occurs, as defined under the terms of that particular swap agreement, a Fund will either (i) receive from the seller of protection an amount equal to the notional amount of the swap and deliver the referenced obligation, other deliverable obligations or underlying securities comprising the referenced index or (ii) receive a net settlement amount in the form of cash or securities equal to the notional amount of the swap less the recovery value of the referenced obligation or underlying securities comprising the referenced
SEI Catholic Values Trust / Annual Report / February 28, 2018 | 45 |
NOTES TO FINANCIAL STATEMENTS (Continued)
February 28, 2018
index. Recovery values are assumed by market makers considering either industry standard recovery rates or entity specific factors and considerations until a credit event occurs. If a credit event has occurred, the recovery value is determined by a facilitated auction whereby a minimum number of allowable broker bids, together with a specified valuation method, are used to calculate the settlement value.
As of February 28, 2018, the Fixed Income Fund is the seller (“Providing Protection”) on a total notional amount of $2.9 million. The notional amounts of the swaps are not recorded in the financial statements. The notional amounts approximate the maximum potential amount of future payments that the Fund could be required to make if the Fund were the seller of protection and a credit event were to occur. Those credit default swaps (“CDS”) for which the Fund is providing protection at balance sheet date are summarized as follows:
FIXED INCOME FUND WRITTEN CREDIT DERIVATIVE CONTRACTS | SINGLE NAME CREDIT DEFAULT SWAPS | CREDIT DEFAULT SWAP INDEX | ||||||||||||||||||
| REFERENCE ASSET | CORPORATE DEBT | SOVERIGN DEBT | ASSET BACKED SECURITIES | CORPORATE DEBT | Total | |||||||||||||||
Fair value of written credit derivatives | $ | — | $ | — | $ | — | $ | 58,946 | $ | 58,946 | ||||||||||
Maximum potential amount of future payments | — | — | — | 2,950,000 | 2,950,000 | |||||||||||||||
Recourse provisions with third parties to recover any amounts paid under the credit derivative (including any purchased credit protection)1 | — | — | — | — | — | |||||||||||||||
Collateral held by the Fund can obtain upon occurrence of triggering event | — | — | — | — | — | |||||||||||||||
| 1 | Potential recoveries would include purchased credit derivatives to the extent they offset written credit derivatives which have an identical underlying, or a netting arrangement or credit support annex with the counterparty. There may be other potential recoveries from recourse provisions where agreements cover multiple derivative arrangements but those amounts have not been included. |
| MAXIMUM POTENTIAL AMOUNT OF FUTURE PAYMENTS BY CONTRACT TERM | ||||||||||||||||||||||||
| FIXED INCOME FUND | 0-6 MONTHS | 6-12 MONTHS | 1-5 YEARS | 5-10 YEARS | > 10 YEARS | Total | ||||||||||||||||||
Current credit spread* on underlying (in basis points) | ||||||||||||||||||||||||
0-100 | $ | — | $ | — | $ | — | $ | — | $ | — | $ | — | ||||||||||||
> than 100 | — | — | 2,950,000 | — | — | 2,950,000 | ||||||||||||||||||
Total | $ | — | $ | — | $ | 2,950,000 | $ | — | $ | — | $ | 2,950,000 | ||||||||||||
| * | The credit spread on the underlying asset is generally indicative of the current status of the underlying risk of the Fund having to perform. The spread also reflects the cost of buying/selling protection and may include upfront payments required to be made to enter into a contract. Higher credit spreads with a shorter contract term is indicative of a higher likelihood of performance by the Fund. |
The credit spread disclosed above for each reference obligation where the Fund is the seller of protection is a representation of the current payment/performance risk of the swap.
4. DERIVATIVE TRANSACTIONS
The following tables include only Funds that had exposure to more than one type of risk on derivatives held
throughout the period. For Funds that held derivatives throughout the period with only one type of risk exposure, additional information can be found on the Schedule of Investments and the Statement of Operations.
| 46 | SEI Catholic Values Trust / Annual Report / February 28, 2018 |
The fair value of derivative instruments as of February 28, 2018 was as follows ($ Thousands):
| Asset Derivatives | Liability Derivatives | |||||||||||
| Statement of Assets and Liabilities Location | Fair Value | Statement of Assets and Liabilities Location | Fair Value | |||||||||
Derivatives not accounted for as hedging instruments: |
| |||||||||||
Fixed Income Fund | ||||||||||||
Interest rate contracts | Net Assets — Unrealized appreciation on futures contracts | $ | 68 | * | Net Assets — Unrealized appreciation on futures contracts | $ | 34 | * | ||||
Net Assets — Unrealized appreciation on swap contracts | 125 | † | Net Assets — Unrealized appreciation on swap contracts | 13 | ||||||||
Exchange traded options purchased, at value | 26 | Exchange traded options written, at value | 12 | |||||||||
Foreign exchange contracts | Unrealized gain on forward foreign currency contracts | 33 | Unrealized loss on forward foreign currency contracts | 66 | ||||||||
Over-the-counter options purchased, at value | 19 | Over-the-counter options written, at value | 5 | |||||||||
Credit Contracts | Net Assets — Unrealized appreciation on swap contracts | — | Net Assets — Unrealized appreciation on swap contracts | 8 | † | |||||||
|
|
|
| |||||||||
Total Derivatives not accounted for as hedging instruments | $ | 271 | $ | 138 | ||||||||
|
|
|
| |||||||||
| * | Includes cumulative appreciation/depreciation of futures contracts as reported in the Schedules of Investments. Only current day’s variation margin is reported within the Statements of Assets & Liabilities. |
| † | Includes cumulative appreciation/depreciation of swap contracts as reported in the Schedules of Investments. Market Value is reported within the Statements of Assets & Liabilities for swap contracts that have paid premiums. |
The effect of derivative instruments on the Statements of Operations for the year ended February 28, 2018.
Amount of realized gain or (loss) on derivatives recognized in income ($ Thousands):
| Derivatives Not Accounted for as Hedging Instruments | Options | Futures | Forward Currency Contracts | Swaps | Total | |||||||||||||||
Equity Fund | ||||||||||||||||||||
Equity Contracts | $ | — | $ | (51 | ) | $ | — | $ | — | $ | (51 | ) | ||||||||
Foreign Exchange Contracts | — | — | 13 | — | 13 | |||||||||||||||
Total | $ | — | $ | (51 | ) | $ | 13 | $ | — | $ | (38 | ) | ||||||||
Fixed Income Fund | ||||||||||||||||||||
Interest Rates | $ | (74 | ) | $ | 163 | $ | — | $ | — | $ | 89 | |||||||||
Foreign exchange contracts | (22 | ) | — | (12 | ) | — | (34 | ) | ||||||||||||
Credit contracts | — | — | — | 33 | 33 | |||||||||||||||
Total | $ | (96 | ) | $ | 163 | $ | (12 | ) | $ | 33 | $ | 88 | ||||||||
Change in unrealized appreciation or (depreciation) on derivatives recognized in income ($ Thousands):
| Derivatives Not Accounted for as Hedging Instruments | Options | Futures | Forward Currency Contracts | Swaps | Total | |||||||||||||||
Equity Fund | ||||||||||||||||||||
Equity Contracts | $ | — | $ | (63 | ) | $ | (1 | ) | $ | — | $ | (64 | ) | |||||||
Total | $ | — | $ | (63 | ) | $ | (1 | ) | $ | — | $ | (64 | ) | |||||||
Fixed Income Fund | ||||||||||||||||||||
Interest Rates | $ | 33 | $ | 29 | $ | — | $ | — | $ | 62 | ||||||||||
Foreign exchange contracts | — | — | (11 | ) | — | (11 | ) | |||||||||||||
Credit contracts | — | — | — | (43 | ) | (43 | ) | |||||||||||||
Total | $ | 33 | $ | 29 | $ | (11 | ) | $ | (43 | ) | $ | 8 | ||||||||
5. INVESTMENT ADVISORY, ADMINISTRATION
AND DISTRIBUTION AGREEMENTS, INVESTMENT SUB-ADVISORY AGREEMENTS AND OTHER TRANSACTIONS WITH AFFILIATES
Investment Advisory, Administration, Distribution and Custodian Agreements — SIMC serves as each Fund’s investment adviser (the “Adviser”) and “Manager of
Managers” under an investment advisory agreement approved by the shareholders of each Fund. In connection with serving as Adviser, SIMC is entitled to a fee, which is calculated daily and paid monthly, based on the average daily net assets of each Fund.
SEI Investments Global Funds Services (the “Administrator”) provides the Trust with administrative
| SEI Catholic Values Trust / Annual Report / February 28, 2018 | 47 |
NOTES TO FINANCIAL STATEMENTS (Continued)
February 28, 2018
and transfer agency services. For its services, the Administrator is entitled to a fee, which is calculated daily and paid monthly, based on the average daily net assets of each Fund.
The Fund has adopted a shareholder servicing plan (the “Shareholder Servicing Plan”) under which a shareholder servicing fee of up to 0.25% of the average daily net assets of Class F shares of the Funds will be paid to other service providers. Under the Shareholder Servicing Plan, other service providers may perform, or may compensate other service providers for performing, certain shareholder and administrative services.
The Adviser, Administrator and/or Distributor have voluntarily agreed to waive a portion of their fees in order to keep total direct operating expenses (exclusive of interest from borrowings, brokerage commissions, taxes, Trustee fees, prime broker fees, interest and dividend expenses related to short sales and extraordinary expenses not incurred in the ordinary course of the Funds’ business) at a specified level.
The waivers by the Funds’ Adviser, Administrator and/ or Distributor are limited to the Funds’ direct operating expenses and, therefore, do not apply to indirect expenses incurred by the Funds, such as acquired fund fees and expenses. The waivers are voluntary and the Funds’ Adviser, Administrator and/or Distributor may discontinue all or part of any of these waivers at any time. In addition, some Funds may participate in a commission recapture program where the Funds’ trades may be executed through the Funds’ distributor, and a portion of the commissions paid on those trades are then used to pay the Funds’ expenses.
The following is a summary of annual fees payable to the Adviser, Administrator and Distributor and the voluntary expense limitations for each Fund:
| Advisory Fee | Shareholder Servicing Fee | Voluntary Expense Limitation | ||||||||||
Equity Fund | ||||||||||||
Class F (Formerly Class A shares) | 0.60 | % | 0.25 | % | 0.86 | % | ||||||
Class Y | 0.60 | % | 0.00 | % | 0.76 | % | ||||||
Fixed Income Fund | ||||||||||||
Class F (Formerly Class A shares) | 0.35 | % | 0.25 | % | 0.71 | % | ||||||
Class Y | 0.35 | % | 0.00 | % | 0.61 | % | ||||||
| 48 | SEI Catholic Values Trust / Annual Report / February 28, 2018 |
Effective January 1, 2017, the Trust will pay the Administrator the following fees, at the annual rate set forth below
calculated based upon the aggregate average daily net assets of the Trust:
| Previous Contractual Fees | Contractual Fees as of January 1, 2016 | |||||||||||||||||||||||
| 3/1/16-12/31/16 | First $1.5 Billion | Next $500 Million | Next $500 Million | Next $500 Million | Over $3 Billion | |||||||||||||||||||
Equity Fund | 0.300 | % | 0.300 | % | 0.260 | % | 0.210 | % | 0.1700 | % | 0.120 | % | ||||||||||||
Fixed Income Fund | 0.300 | % | 0.200 | % | 0.1775 | % | 0.1550 | % | 0.1325 | % | 0.110 | % | ||||||||||||
Investment Sub-Advisory Agreements — As of February 28, 2018, SIMC has entered into Investment Sub-Advisory Agreements with the following parties:
| Investment Sub-Adviser |
Equity Fund
BlackRock Investment Management, LLC
Brandywine Global Investment Management, LLC Coho Partners, Ltd.
EAM Investors, LLC
EARNEST Partners, LLC
Parametric Portfolio Associates LLC Snow Capital Management, L.P.
Fixed Income Fund
Income Research & Management
Western Asset Management Company
Western Asset Management Company Limited
Under the investment sub-advisory agreements, each sub-adviser receives an annual fee, paid by SIMC.
The Administrator and Distributor have voluntarily agreed to waive a portion of their fee for each fund. The following table lists the waivers for the year ended February 28, 2018 ($ Thousands):
Administration Waiver | Shareholder Waiver (Class F) | |||||||
Equity Fund | $ | 6 | $ | 314 | ||||
Fixed Income Fund | 8 | 176 | ||||||
U.S. Bank, N.A. serves as the custodian of the Fixed Income Fund. Brown Brothers Harriman & Co. serves as the custodian of the Equity Fund. The custodian plays no role in determining the investment policies of the Funds or which securities are to be purchased or sold in the Funds.
Investment in Affiliated Securities — The Funds may invest in the SEI Daily Income Trust Government Fund, an affiliated money market fund to manage excess cash or to serve as margin or collateral for derivative positions. Refer to the Fund’s Schedule of Investments for details regarding transactions with affiliates for the year ended February 28, 2018, if applicable.
Payment to Affiliates — Certain officers and Trustees of the Trust are also officers and/or Trustees of the Administrator, Adviser, or the Distributor. The Trust pays
each unaffiliated Trustee an annual fee for attendance at quarterly, interim, and committee meetings. The Administrator, Adviser and/or the Distributor pays compensation of Officers and affiliated Trustees. A portion of the services provided by the Chief Compliance Officer (“CCO”) and his staff, whom are employees of the administrator, are paid for by the Trust as incurred.
6. INVESTMENT TRANSACTIONS
The cost of security purchases and the proceeds from the sale and maturities of securities other than temporary cash investments, during the year ended February 28, 2018, were as follows:
| U.S. Gov’t ($ Thousands) | Other ($ Thousands) | Total ($ Thousands) | ||||||||||||||
Equity Fund | ||||||||||||||||
Purchases | $ | — | $ | 147,680 | | $ | 147,680 | |||||||||
Sales | — | 120,087 | 120,087 | |||||||||||||
Fixed Income Fund | ||||||||||||||||
Purchases | 236,386 | 29,845 | 266,231 | |||||||||||||
Sales | 213,265 | 15,778 | 229,043 | |||||||||||||
7. FEDERAL TAX INFORMATION
It is each Fund’s intention to continue to qualify as a regulated investment company for Federal income tax purposes and distribute all of its taxable income (including net capital gains). Accordingly, no provision for Federal income taxes is required.
Dividends from net investment income and distributions from net realized capital gains are determined in accordance with U.S. Federal income tax regulations, which may differ from those amounts determined under U.S. GAAP. These book/tax differences are either temporary or permanent in nature. To the extent these differences are permanent, they are charged or credited to paid-in capital, undistributed net investment income or accumulated net realized gain, as appropriate, in the period that the differences arise.
Accordingly, the following permanent differences, primarily attributable to different treatment for gains and losses on paydowns of mortgage and asset-backed
SEI Catholic Values Trust / Annual Report / February 28, 2018 | 49 |
NOTES TO FINANCIAL STATEMENTS (Continued)
February 28, 2018
| securities for tax purposes, investments in swaps, and foreign currency translations, reclassification of long term capital gain distributions on REIT securities, basis adjustments for investments in partnerships, and mark to market adjustment on PFICS, have been reclassified to/ (from) the following accounts as of February 28, 2018 ($ Thousands): | ||||||||
| Undistributed | Accumulated | Paid-in- | ||||||||
| Net Investment | Realized | Capital | ||||||||
| Income | Gain/(Loss) | ($Thousands) | ||||||||
| ($ Thousands) | ($Thousands) | |||||||||
Equity Fund | $ | (7 | ) | $ | 7 | $ — | ||||
Fixed Income Fund | 234 | (234 | ) | — | ||||||
These reclassifications have no impact on net assets or net asset value per share.
The tax character of dividends and distributions paid during the period ended February 28, 2018 was as follows:
| Tax-Exempt Income ($ Thousands) | Ordinary ($ Thousands) | Long-term Capital Gain ($ Thousands) | Total ($ Thousands) | |||||||||||||
Equity Fund | ||||||||||||||||
2018 | $ | — | $ | 1,776 | $ | — | $ | 1,776 | ||||||||
2017 | — | 1,828 | — | 1,828 | ||||||||||||
Fixed Income Fund | ||||||||||||||||
2018 | — | 2,847 | — | $ | 2,847 | |||||||||||
2017 | — | 2,543 | — | 2,543 | ||||||||||||
As of February 28, 2018, the components of distributable earnings (accumulated losses) were as follows:
Undistributed ($ Thousands) | Undistributed Long-Term Capital Gain ($ Thousands) | Capital Loss | Post- October Losses | Late Year ($ Thousands) | Unrealized Appreciation (Depreciation) ($ Thousands) | Other Temporary Differences ($ Thousands) | Total Distributable Losses) ($ Thousands) | |||||||||||||||||||||||||
Catholic Values Equity Fund | $ | 428 | $ | 4,678 | $ | — | $ | — | $ | — | $ | 43,543 | $ | (31 | ) | $ | 48,618 | |||||||||||||||
Catholic Values Fixed Income Fund | 275 | — | (837 | ) | — | — | (1,975 | ) | (305 | ) | (2,842 | ) | ||||||||||||||||||||
Post October losses represent losses realized on investment transactions from November 1, 2017 through February 28, 2018 that, in accordance with Federal income tax regulations, the Funds may defer and treat as having arisen in the following fiscal year. Deferred Late-Year Losses represent ordinary losses realized on investment transactions from January 1, 2018 through February 28, 2018 and specified losses realized on investment transactions from November 1, 2017 through February 28, 2018, that, in accordance with Federal income tax regulations, the Fund defers and treats as having arisen in the following fiscal year.
Under the Regulated Investment Company
Modernization Act of 2010, the Funds are permitted to carry forward capital losses incurred in taxable years beginning after December 22, 2010 for an unlimited period. However, any losses incurred during those future taxable years will be required to be utilized prior to the losses incurred in pre-enactment taxable years. As a result of this ordering rule, pre-enactment capital loss carryforwards may be more likely to expire unused. Additionally, post-enactment capital losses that are carried forward will retain their character as either short-term or long-term capital losses rather than being considered all short-term as under previous law. Losses
carried forward under these new provisions are as follows:
| Short-Term | Long-Term | |||||||||||
| Loss | Gain (Loss) | Total* | ||||||||||
| ($ Thousands) | ($ Thousands) | ($ Thousands) | ||||||||||
Fixed Income Fund | $ | (7 | ) | (830 | ) | (837 | ) | |||||
| * | This table should be used in conjunction with the capital loss carryforwards table. |
During the fiscal year ended February 28, 2018, the following Funds utilized capital loss carryforward to
offset capital gains:
| Amount Utilized | ||||
| ($ Thousands) | ||||
Equity Fund | $ | 11,837 | ||
For Federal income tax purposes, the cost of securities owned at February 28, 2018, and net realized gains or losses on securities sold for the period, were different from amounts reported for financial reporting purposes, primarily due to wash sales, QPTP basis, and PFIC MTM, which cannot be used for Federal income tax purposes in the current year and have been deferred for use in future years.
The Federal tax cost and aggregate gross unrealized appreciation and depreciation on investments held by the Funds at February 28, 2018, were as follows:
| 50 | SEI Catholic Values Trust / Annual Report / February 28, 2018 |
| Federal Tax Cost ($ Thousands) | Aggregate Gross Unrealized Appreciation ($ Thousands) | Aggregate Gross Unrealized Depreciation ($ Thousands) | Net Unrealized Appreciation/ (Depreciation) ($ Thousands) | |||||||||||||||||
Equity Fund | $ | 211,458 | $ | 50,034 | $ | (6,491 | ) | $ | 43,543 | |||||||||||
Fixed Income Fund | 185,321 | 720 | (2,695 | ) | (1,975 | ) | ||||||||||||||
Management has analyzed the Funds’ tax positions taken on Federal income tax returns for all open tax years and has concluded that as of February 28, 2018, no provision for income tax would be required in the Funds’ financial statements. The Funds’ Federal and state income and Federal excise tax returns for tax years for which the applicable statutes of limitations have not expired are subject to examination by the Internal Revenue Service and state departments of revenue.
8. CONCENTRATION/RISKS
In the normal course of business, a Fund may enter into contracts that provide general indemnifications by a Fund to the counterparty to the contract. A Fund’s maximum exposure under these arrangements is dependent on future claims that may be made against a Fund and, therefore, cannot be established; however, based on experience, management believes the risk of loss from such claim is considered remote.
The market values of the Fixed Income Fund’s investments will change in response to interest rate changes and other factors. During periods of falling interest rates, the values of fixed income securities generally rise. Conversely, during periods of rising interest rates, the values of such securities generally decline. Changes by recognized rating agencies in the ratings of any fixed income security and in the ability of an issuer to make payments of interest and principal may also affect the value of these investments.
The following descriptions provide additional information about some of the risks of investing in the Funds:
Asset-Backed Securities Risk — Payment of principal and interest on asset-backed securities is dependent largely on the cash flows generated by the assets backing the securities, and asset-backed securities may not have the benefit of any security interest in the related assets.
Catholic Values Investing Risk — The Funds consider the United States Conference of Catholic Bishops’ Socially Responsible Investing Guidelines (“Guidelines”) in its investment process and may choose not to purchase, or may sell, otherwise profitable investments in companies which have been identified as being in conflict with the Guidelines. This means that the Funds may underperform other similar mutual funds that do
not consider the Guidelines when making investment decisions.
Currency Risk — To the extent a Fund takes positions in currencies, it will be subject to the risk that currency exchange rates may fluctuate in response to, among other things, changes in interest rates, intervention (or failure to intervene) by U.S. or foreign governments, central banks or supranational entities, or by the imposition of currency controls or other political developments in the United States or abroad.
Credit Risk — The risk that the issuer of a security or the counterparty to a contract will default or otherwise become unable to honor a financial obligation.
Fixed Income Market Risk — The prices of a Fund’s fixed income securities respond to economic developments, particularly interest rate changes, as well as to perceptions about the creditworthiness of individual issuers, including governments and their agencies. Generally, the Fund’s fixed income securities will decrease in value if interest rates rise and vice versa. In the case of foreign securities, price fluctuations will reflect international economic and political events, as well as changes in currency valuations relative to the U.S. dollar.
Foreign Investment/Emerging Markets Risk — The risk that non-U.S. securities may be subject to additional risks due to, among other things, political, social and economic developments abroad, currency movements, and different legal, regulatory and tax environments. These additional risks may be heightened with respect to emerging market countries since political turmoil and rapid changes in economic conditions are more likely to occur in these countries.
Interest Rate Risk — The risk that a rise in interest rates will cause a fall in the value of fixed income securities, including U.S. Government Securities, in which the Fund invests. Although U.S. Government securities are considered to be among the safest investments, they are not guaranteed against price movements due to changing interest rates. A low interest rate environment may present greater interest rate risk, because there may be a greater likelihood of rates increasing and rates may increase more rapidly.
Mortgage-Backed Securities Risk — Mortgage-backed securities are affected by, among other things, interest rate changes and the possibility of prepayment of the underlying mortgage loans. Mortgage-backed securities
| SEI Catholic Values Trust / Annual Report / February 28, 2018 | 51 |
NOTES TO FINANCIAL STATEMENTS (Concluded)
February 28, 2018
are also subject to the risk that underlying borrowers will be unable to meet their obligations.
Please refer to each Fund’s current prospectus for additional disclosure regarding the risks associated with investing in the Funds. The foregoing is not intended to be a complete discussion of the risks associated with the investment strategies of the Funds.
9. CONCENTRATION OF SHAREHOLDERS
SEI Private Trust Company (“SPTC”) and SIMC are subsidiaries of SEI Investments Company. As of February 28, 2018, SPTC held of record the following:
Equity Fund | ||||
Class F | 99.34 | % | ||
Class Y | 85.13 | % | ||
Fixed Income Fund | ||||
Class F | 99.79 | % | ||
Class Y | 76.49 | % |
SPTC is not a direct service provider to the Funds. However, SPTC performs a key role in the comprehensive investment solution that SEI provides to investors. SPTC holds the vast majority of shares in the Funds as custodian for shareholders that are clients of the advisors and financial planners. SPTC maintains accounts at SEI Institutional Transfer Agency (“SITA”), and operates in an omnibus fund account environment.
10. REGULATORY MATTERS
In October 2016, the SEC adopted new rules and amended existing rules (together, final rules) intended to modernize the reporting and disclosure of information by registered investment companies. In part, the final rules amended Regulation S-X and require standardized, enhanced disclosures about derivatives in investment company financial statements, as well as other amendments. As of August 1, 2017, management has implemented the amendments to Regulation S-X, which did not have a material impact on the Fund’s financial statements and related disclosures or impact the Fund’s net assets or results of operations.
11. SUBSEQUENT EVENTS
Management has evaluated the need for disclosures and/or adjustments resulting from subsequent events through the date the financial statements were issued. Based on this evaluation, no disclosures and/or adjustments were required to the financial statements as of February 28, 2018.
| 52 | SEI Catholic Values Trust / Annual Report / February 28, 2018 |
REPORT OF INDEPENDENT REGISTERED ACCOUNTING FIRM
To the Shareholders and Board of Trustees
SEI Catholic Values Trust:
Opinion on the Financial Statements
We have audited the accompanying statements of assets and liabilities of SEI Catholic Values Trust, comprised of the Catholic Values Equity Fund and Catholic Values Fixed Income Fund (collectively, the “Funds”), including the schedules of investments, as of February 28, 2018, the related statements of operations for the year then ended, the statements of changes in net assets for each of the years in the two year period then ended, and the related notes (collectively, the “financial statements”) and the financial highlights for each of the years or periods in the three year period then ended. In our opinion, the financial statements and financial highlights present fairly, in all material respects, the financial position of the Funds as of February 28, 2018, the results of their operations for the year then ended, the changes in their net assets for each of the years in the two year period then ended, and the financial highlights for each of the years or periods in the three year period then ended, in conformity with U.S. generally accepted accounting principles.
Basis for Opinion
These financial statements and financial highlights are the responsibility of the Funds’ management. Our responsibility is to express an opinion on these financial statements and financial highlights based on our audits. We are a public accounting firm registered with the Public Company Accounting Oversight Board (United States) (“PCAOB”) and are required to be independent with respect to the Funds in accordance with the U.S. federal securities laws and the applicable rules and regulations of the Securities and Exchange Commission and the PCAOB.
We conducted our audits in accordance with the standards of the PCAOB. Those standards require that we plan and perform the audits to obtain reasonable assurance about whether the financial statements and financial highlights are free of material misstatement, whether due to error or fraud. Our audits included performing procedures to assess the risks of material misstatement of the financial statements and financial highlights, whether due to error or fraud, and performing procedures that respond to those risks. Such procedures included examining, on a test basis, evidence regarding the amounts and disclosures in the financial statements and financial highlights. Such procedures also included confirmation of securities owned as of February 28, 2018, by correspondence with the custodian, transfer agent, and brokers or by other appropriate auditing procedures when replies from brokers were not received. Our audits also included evaluating the accounting principles used and significant estimates made by management, as well as evaluating the overall presentation of the financial statements and financial highlights. We believe that our audits provide a reasonable basis for our opinion.

We have served as the auditor of one or more SEI Funds investment companies since 2005.
Philadelphia, Pennsylvania
April 26, 2018
| SEI Catholic Values Trust / Annual Report / February 28, 2018 | 53 |
TRUSTEES AND OFFICERS OF THE TRUST (Unaudited)
The following chart lists Trustees and Officers as of March 28, 2017.
Set forth below are the names, addresses, ages, position with the Trust, Term of Office and Length of Time Served, the principal occupations for the last five years, number of positions in fund complex overseen by trustee, and other directorships outside the fund complex of each of the persons currently serving as Trustees and Officers of the Trust. The Trust’s Statement of Additional Information (“SAI”) includes additional information about the Trustees and Officers. The SAI may be obtained without charge by calling 1-800-342-5734.
Name, Address, and Age | Position(s) Held with Trusts | Term of Office and Length of Time Served 1 | Principal Occupation(s) During Past Five Years | Number of Portfolios in | Other Directorships Held by Trustee | |||||
INTERESTED TRUSTEES | ||||||||||
| Robert A. Nesher One Freedom Valley Drive Oaks, PA 19456 70 yrs. old | Chairman of the Board of Trustees* | since 1995 | Currently performs various services on behalf of SEI for which Mr. Nesher is compensated. | 104 | Vice Chairman of The Advisors’ Inner Circle Fund III, Winton Series Trust and Winton Diversified Opportunities Fund since 2014. Vice Chairman of Gallery Trust since 2015. President and Director of SEI Structured Credit Fund, LP. Director of SEI Global Master Fund plc, SEI Global Assets Fund plc, SEI Global Investments Fund plc, SEI Investments—Global Funds Services, Limited, SEI Investments Global, Limited, SEI Investments (Europe) Ltd., SEI Multi-Strategy Funds PLC, SEI Global Nominee Ltd and SEI Investments—Unit Trust Management (UK) Limited. Director and President of SEI Opportunity Fund, L.P. to 2010. President, Director and Chief Executive Officer of SEI Alpha Strategy Portfolios, LP from 2007 to 2013. Trustee of SEI Liquid Asset Trust from 1989 to 2016. Vice Chairman of O’Connor EQUUS (closed-end investment company) from 2014 to 2016. Vice Chairman of The Advisors’ Inner Circle Fund III, Winton Series Trust, Winton Diversified Opportunities Fund (closed-end investment company) and Gallery Trust. Trustee of The Advisors’ Inner Circle Fund, The Advisors’ Inner Circle Fund II, Bishop Street Funds, and the KP Funds. President, Chief Executive Officer and Trustee of SEI Asset Allocation Trust, SEI Daily Income Trust, SEI Institutional Managed Trust, SEI Institutional International Trust, SEI Institutional Investments Trust, SEI Tax Exempt Trust, SEI Insurance Products Trust, Adviser Managed Trust, The New Covenant Funds and SEI Catholic Values Trust. | |||||
| William M. Doran One Freedom Valley Drive Oaks, PA 19456 76 yrs. old | Trustee* | since 1995 | Self-employed consultant since 2003. Partner, Morgan, Lewis & Bockius LLP (law firm) from 1976 to 2003, counsel to the Trust, SEI, SIMC, the Administrator and the Distributor. | 104 | Director of SEI since 1974; Secretary of SEI since 1978. Director of SEI Investments Distribution Co. since 2003. Director of SEI Investments—Global Funds Services, Limited, SEI Investments Global, Limited, SEI Investments (Europe), Limited, SEI Investments (Asia) Limited, SEI Global Nominee Ltd. and SEI Investments—Unit Trust Management (UK) Limited. Trustee of SEI Liquid Asset Trust from 1982 to 2016. Trustee of O’Connor EQUUS from 2014 to 2016. Director of SEI Alpha Strategy Portfolios, LP from 2007 to 2013. Trustee of The Advisors’ Inner Circle Fund, The Advisors’ Inner Circle Fund II, The Advisors’ Inner Circle Fund III, Winton Series Trust, Winton Diversified Opportunities Fund, Gallery Trust, Bishop Street Funds, SEI Asset Allocation Trust, SEI Daily Income Trust, SEI Institutional Managed Trust, SEI Institutional International Trust, SEI Institutional Investments Trust, SEI Tax Exempt Trust, SEI Insurance Products Trust, Adviser Managed Trust, New Covenant Funds, The KP Funds and SEI Catholic Values Trust. | |||||
TRUSTEES | ||||||||||
| George J. Sullivan Jr. One Freedom Valley Drive, Oaks, PA 19456 74 yrs. old | Trustee | since 1996 | Retired since January 2012. Self-Employed Consultant, Newfound Consultants Inc. April 1997-December 2011. | 104 | Member of the independent review committee for SEI’s Canadian-registered mutual funds. Director of SEI Opportunity Fund, L.P. to 2010. Director of SEI Alpha Strategy Portfolios, LP from 2007 to 2013. Trustee of SEI Liquid Asset Trust from 1996 to 2016. Trustee/Director of State Street Navigator Securities Lending Trust, The Advisors’ Inner Circle Fund, The Advisors’ Inner Circle Fund II, Bishop Street Funds, SEI Structured Credit Fund, LP, SEI Asset Allocation Trust, SEI Daily Income Trust, SEI Institutional Managed Trust, SEI Institutional International Trust, SEI Institutional Investments Trust, SEI Tax Exempt Trust, SEI Insurance Products Trust, Adviser Managed Trust, New Covenant Funds, The KP Funds and SEI Catholic Values Trust. | |||||
| * | Messrs. Nesher and Doran are Trustees who may be deemed as “interested” persons of the Trust as that term is defined in the 1940 Act by virtue of their affiliation with SIMC and the Trust’s Distributor. |
| 1 | Each trustee shall hold office during the lifetime of this Trust until the election and qualification of his or her successor, or until he or she sooner dies, resigns or is removed in accordance with the Trust’s Declaration of Trust |
| 2 | The Fund Complex includes the following Trusts: SEI Asset Allocation Trust, SEI Daily Income Trust, SEI Institutional Investments Trust, Adviser Managed Trust, SEI Institutional International Trust, SEI Institutional Managed Trust, SEI Liquid Asset Trust, SEI Tax Exempt Trust, SEI Insurance Products Trust and New Covenant Funds. |
| 54 | SEI Catholic Values Trust / Annual Report / February 28, 2018 |
| Name Address, and Age | Position(s) Held with Trusts | Term of Office and Length of Time Served 1 | Principal Occupation(s) During Past Five Years | Number of Portfolios in Fund Complex Overseen by Trustee 2 | Other Directorships Held by Trustee | |||||
TRUSTEES (continued) | ||||||||||
| Nina Lesavoy One Freedom Valley Drive, Oaks, PA 19456 57 yrs. old | Trustee | since 2003 | Founder and Managing Director, Avec Capital (strategic fundraising firm) since 2008. Managing Director, Cue Capital (strategic fundraising firm) from March 2002-March 2008. | 104 | Director of SEI Opportunity Fund, L.P. to 2010. Director of SEI Alpha Strategy Portfolios, LP from 2007 to 2013. Trustee of SEI Liquid Asset Trust from 2003 to 2016. Trustee/Director of SEI Structured Credit Fund, L.P., SEI Asset Allocation Trust, SEI Daily Income Trust, SEI Institutional Managed Trust, SEI Institutional International Trust, SEI Institutional Investments Trust, SEI Tax Exempt Trust, SEI Insurance Products Trust, Adviser Managed Trust and SEI Catholic Values Trust. | |||||
| James M. Williams One Freedom Valley Drive, Oaks, PA 19456 69 yrs. old | Trustee | since 2004 | Vice President and Chief Investment Officer, J. Paul Getty Trust, Non-Profit Foundation for Visual Arts, since December 2002. President, Harbor Capital Advisors and Harbor Mutual Funds, 2000-2002. Director of SEI Alpha Strategy Portfolios, L.P. from 2007 to 2013. Manager, Pension Asset Management, Ford Motor Company, 1997-1999. | 104 | Director of SEI Opportunity Fund, L.P. to 2010. Director of SEI Alpha Strategy Portfolios, LP from 2007 to 2013, Trustee of SEI Liquid Asset Trust from 2004 to 2016. Trustee/Director of Ariel Mutual Funds, SEI Structured Credit Fund, LP, SEI Asset Allocation Trust, SEI Daily Income Trust, SEI Institutional Managed Trust, SEI Institutional International Trust, SEI Institutional Investments Trust, SEI Tax Exempt Trust, SEI Insurance Products Trust, Adviser Managed Trust and SEI Catholic Values Trust. | |||||
| Mitchell A. Johnson One Freedom Valley Drive, Oaks, PA 19456 74 yrs. old | Trustee | since 2007 | Private Investor since 1994. | 104 | Director, Federal Agricultural Mortgage Corporation (Farmer Mac) since 1997. Director of SEI Alpha Strategy Portfolios, LP from 2007 to 2013. Trustee of SEI Liquid Asset Trust from 2007 to 2016. Trustee of the Advisors’ Inner Circle Fund, The Advisors’ Inner Circle Fund II, SEI Asset Allocation Trust, SEI Daily Income Trust, SEI Institutional Managed Trust, SEI Institutional International Trust, SEI Institutional Investments Trust, SEI Tax Exempt Trust, SEI Insurance Products Trust, Adviser Managed Trust, The KP Funds and SEI Catholic Values Trust. | |||||
| Hubert L. Harris, Jr. One Freedom Valley Drive, Oaks, PA 19456 73 yrs. old | Trustee | since 2008 | Retired since December 2005. Owner of Harris Plantation, Inc. since 1995. Chief Executive Officer of Harris CAPM, a consulting asset and property management entity. Chief Executive Officer, INVESCO North America, August 2003-December 2005. Chief Executive Officer and Chair of the Board of Directors, AMVESCAP Retirement, Inc., January 1998- August 2003. | 104 | Director of AMVESCAP PLC from 1993-2004. Served as a director of a bank holding company, 2003-2009. Director, Aaron’s Inc., 2012-present. Chair of the Board of Trustees, Georgia Tech Foundation, Inc. (nonprofit corporation), 2007-2009, and member of the Executive Committee, 2003-2011; currently emeritus trustee. Member of the advisory board of the Georgia Tech Ivan Allen School of Liberal Arts and the Sam Nunn School of International Affairs, 2009-present. Member of the Board of Councilors of the Carter Center (nonprofit corporation). Director of SEI Alpha Strategy Portfolios, LP from 2008 to 2013. Trustee of SEI Asset Allocation Trust, SEI Daily Income Trust, SEI Institutional Managed Trust, SEI Institutional International Trust, SEI Institutional Investments Trust, SEI Tax Exempt Trust, SEI Insurance Products Trust, Adviser Managed Trust and SEI Catholic Values Trust. | |||||
| Susan C. Cote One Freedom Valley Drive Oaks, PA 19456 61 years old | Trustee | since 2016 | Retired since July 2015. Americas Director of Asset Management, Ernst & Young LLP from 2006-2013. Global Asset Management Assurance Leader, Ernst & Young LLP from 2006-2015. Partner Ernst & Young LLP from 1997-2015. Prudential, 1983-1997. Retirement Investment Committee-Treasurer and Chair of Finance, Investment and Audit Committee of the New York Women’s Foundation. Independent Consultant to SEI Liquid Asset Allocation Trust. | 104 | Trustee of SEI Tax Exempt Trust, SEI Daily Income Trust, SEI Institutional International Trust, SEI Institutional Managed Trust, SEI Asset Allocation Trust, SEI Institutional Investments Trust, SEI Insurance Products Trust, Adviser Managed Trust and SEI Catholic Values Trust. | |||||
OFFICERS | ||||||||||
| Robert A. Nesher One Freedom Valley Drive, Oaks, PA 19456 70 yrs. Old | President and CEO | since 2005 | Currently performs various services on behalf of SEI for which Mr. Nesher is compensated. | N/A | N/A | |||||
| James J. Hoffmayer One Freedom Valley Drive Oaks, PA 19456 43 yrs. old | Controller and Chief Financial Officer | since 2016 | Senior Director, Funds Accounting and Fund Administration, SEI Investments Global Funds Services (since September 2016); Senior Director of Fund Administration, SEI Investments Global Funds Services (since October 2014). Director of Financial Reporting, SEI Investments Global Funds Services (November 2004-October 2014). | N/A | N/A |
| 1 | Each trustee shall hold office during the lifetime of this Trust until the election and qualification of his or her successor, or until he or she sooner dies, resigns or is removed in accordance with the Trust’s Declaration of Trust. |
| 2 | The Fund Complex includes the following Trusts: SEI Asset Allocation Trust, SEI Daily Income Trust, SEI Institutional Investments Trust, Adviser Managed Trust, SEI Institutional International Trust, SEI Institutional Managed Trust, SEI Liquid Asset Trust, SEI Tax Exempt Trust, SEI Insurance Products Trust and New Covenant Funds. |
| SEI Catholic Values Trust / Annual Report / February 28, 2018 | 55 |
TRUSTEES AND OFFICERS OF THE TRUST (Unaudited) (Concluded)
Name Address, and Age | Position(s) Held with Trusts | Term of Office and Length of Time Served1 | Principal Occupation(s) During Past Five Years | Number of Portfolios in Fund Complex Overseen by Trustee2 | Other Directorships Held by Trustee | |||||
OFFICERS (continued) | ||||||||||
| Glenn R. Kurdziel One Freedom Valley Drive Oaks, PA 19456 43 yrs. old | Assistant Controller | since 2017 | Assistant Controller, Funds Accounting, SEI Investments Global Funds Services (March 2017); Senior Manager, Funds Accounting, SEI Investments Global Funds Services since 2005. | N/A | N/A | |||||
Russell Emery | Chief Compliance Officer | since 2006 | Chief Compliance Officer of SEI Daily Income Trust, SEI Institutional Investments Trust, SEI Institutional Managed Trust, SEI Asset Allocation Trust, SEI Institutional International Trust, SEI Tax Exempt Trust, The Advisors’ Inner Circle Fund, The Advisors’ Inner Circle Fund II and Bishop Street Funds since March 2006. Chief Compliance Officer of SEI Liquid Asset Trust from 2006 to 2016. Chief Compliance Officer of SEI Structured Credit Fund, LP June 2007. Chief Compliance Officer of Adviser Managed Trust since December 2010. Chief Compliance Officer of SEI Alpha Strategy Portfolios, LP from 2007 to 2013. Chief Compliance Officer of New Covenant Funds since February 2012. Chief Compliance Officer of SEI Insurance Products Trust and The KP Funds since 2013. Chief Compliance Officer of New Covenant Funds since February 2012. Chief Compliance Officer of O’Connor EQUUS from 2014 to 2016. Chief Compliance Officer of The Advisors’ Inner Circle Fund III, Winton Series Trust and Winton Diversified Opportunities Fund since 2014. Chief Compliance Officer of SEI Catholic Values Trust and Gallery Trust since 2015. | N/A | N/A | |||||
| Timothy D Barto One Freedom Valley Drive Oaks, PA 19456 48 yrs. old | Vice President and Secretary | since 2002 | Vice President and Secretary of SEI Institutional Transfer Agent, Inc. since 2009. General Counsel and Secretary of SIMC and the Administrator since 2004. Vice President of SIMC and the Administrator since 1999. Vice President and Assistant Secretary of SEI since 2001. | N/A | N/A | |||||
| Aaron Buser One Freedom Valley Drive, Oaks, PA 19456 46 yrs. old | Vice President and Assistant Secretary | since 2008 | Vice President and Assistant Secretary of SEI Institutional Transfer Agent, Inc. since 2009. Vice President and Assistant Secretary of SIMC since 2007. Attorney Stark & Stark (law firm), March 2004-July 2007. | N/A | N/A | |||||
| David F. McCann One Freedom Valley Drive, Oaks, PA 19456 40 yrs. old | Vice President and Assistant Secretary | since 2009 | Vice President and Assistant Secretary of SEI Institutional Transfer Agent, Inc. since 2009. Vice President and Assistant Secretary of SIMC since 2008. Attorney, Drinker Biddle & Reath, LLP (law firm), May 2005-October 2008. | N/A | N/A | |||||
| Stephen G. MacRae One Freedom Valley Drive, Oaks, PA 19456 49 yrs. old | Vice President | since 2012 | Director of Global Investment Product Management January 2004-to present. | N/A | N/A | |||||
| Bridget E. Sudall One Freedom Valley Drive Oaks, PA 19456 36 yrs. old | Anti-Money Laundering Compliance Officer and Privacy Officer | since 2015 | Anti-Money Laundering Compliance Officer and Privacy Officer (since 2015), Senior Associate and AML Officer, Morgan Stanley Alternative Investment Partners, April 2011-March 2015, Investor Services Team Lead, Morgan Stanley Alternative Investment Partners, July 2007-April 2011. | N/A | N/A | |||||
| 1 | Each trustee shall hold office during the lifetime of this Trust until the election and qualification of his or her successor, or until he or she sooner dies, resigns or is removed in accordance with the Trust’s Declaration of Trust. |
| 2 | The Fund Complex includes the following Trusts: SEI Asset Allocation Trust, SEI Daily Income Trust, SEI Institutional Investments Trust, Adviser Managed Trust, SEI Institutional International Trust, SEI Institutional Managed Trust, SEI Liquid Asset Trust, SEI Tax Exempt Trust, SEI Insurance Products Trust and New Covenant Funds. |
| 56 | SEI Catholic Values Trust / Annual Report / February 28, 2018 |
DISCLOSURE OF FUND EXPENSES (UNAUDITED)
February 28, 2018
All mutual funds have operating expenses. As a shareholder of a fund, your investment is affected by these ongoing costs, which include (among others) costs for portfolio management, administrative services, and shareholder reports like this one. It is important for you to understand the impact of these costs on your investment returns.
Operating expenses such as these are deducted from the fund’s gross income and directly reduce your final investment return. These expenses are expressed as a percentage of the fund’s average net assets; this percentage is known as the fund’s expense ratio.
The following examples use the expense ratio and are intended to help you understand the ongoing costs (in dollars) of investing in your fund and to compare these costs with those of other mutual funds. The examples are based on an investment of $1,000 made at the beginning of the period shown and held for the entire period (September 1, 2017 through February 28, 2018).
The table on this page illustrates your fund’s costs in two ways:
Actual fund return: This section helps you to estimate the actual expenses after fee waivers that your Fund incurred over the period. The “Expenses Paid During Period” column shows the actual dollar expense cost incurred by a $1,000 investment in the Fund, and the “Ending Account Value” number is derived from deducting that expense cost from the Fund’s gross investment return.
You can use this information, together with the actual amount you invested in the Fund, to estimate the expenses you paid over that period. Simply divide your actual account value by $1,000 to arrive at a ratio (for example, an $8,600 account value divided by $1,000 = 8.6), then multiply that ratio by the number shown for your Fund under “Expenses Paid During Period.”
Hypothetical 5% return: This section helps you compare your Fund’s costs with those of other mutual funds. It assumes that the fund had an annual 5% return before expenses during the year, but that the expense ratio (Column 3) for the period is unchanged. This example is useful in making comparisons because the Securities and Exchange Commission requires all mutual funds to make this 5% calculation. You can assess your Fund’s comparative cost by comparing the hypothetical result for your Fund in the “Expense Paid During Period” column with those that appear in the same charts in the shareholder reports for other funds.
NOTE: Because the return is set at 5% for comparison purposes — NOT your Fund’s actual return — the account values shown may not apply to your specific investment.
| Beginning Account Value 9/1/17 | Ending Account Value 2/28/18 | Annualized Expense Ratios | Expenses Paid During Period* | |||||||||||||
Catholic Values Equity Fund |
| |||||||||||||||
Actual Fund Return | ||||||||||||||||
Class F | $1,000.00 | $ | 1,103.10 | 0.86 | % | $4.49 | ||||||||||
Class Y | 1,000.00 | 1,103.10 | 0.76 | % | 3.95 | |||||||||||
Hypothetical 5% Return |
| |||||||||||||||
Class F | $1,000.00 | $ | 1,020.52 | 0.86 | % | $4.31 | ||||||||||
Class Y | 1,000.00 | 1,021.03 | 0.76 | % | 3.80 | |||||||||||
| Beginning Account Value 9/1/17 | Ending Account Value 2/28/18 | Annualized Expense Ratios | Expenses Paid During Period* | |||||||||||||
Catholic Values Fixed Income Fund |
| |||||||||||||||
Actual Fund Return | ||||||||||||||||
Class F | $1,000.00 | $981.40 | 0.71 | % | $3.49 | |||||||||||
Class Y | 1,000.00 | 981.90 | 0.61 | % | 2.98 | |||||||||||
Hypothetical 5% Return |
| |||||||||||||||
Class F | $1,000.00 | $ | 1,021.27 | 0.71 | % | $3.56 | ||||||||||
Class Y | 1,000.00 | 1,021.79 | 0.61 | % | 3.04 | |||||||||||
| * | Expenses are equal to the Fund’s annualized expense ratio multiplied by the average account value over the period, multiplied by 181/365 (to reflect the one-half year period shown). |
| SEI Catholic Values Trust / Annual Report / February 28, 2018 | 57 |
BOARD OF TRUSTEES CONSIDERATIONS IN APPROVING THE ADVISORY AND SUB-ADVISORY AGREEMENTS (UNAUDITED)
SEI Catholic Values Trust (the “Trust”) and SEI Investments Management Corporation (“SIMC”) have entered into an investment advisory agreement (the “Advisory Agreement”). Pursuant to the Advisory Agreement, SIMC is responsible for the investment advisory services provided to the series of the Trust (the “Funds”). Pursuant to separate sub-advisory agreements with SIMC (the “Sub-Advisory Agreements” and, together with the Advisory Agreement, the “Investment Advisory Agreements”), and under the supervision of SIMC and the Trust’s Board of Trustees (the “Board”), the sub-advisers (each, a “Sub-Adviser” and collectively, the “Sub-Advisers”) provide security selection and certain other advisory services with respect to all or a discrete portion of the assets of the Funds. The Sub-Advisers are also responsible for managing their employees who provide services to the Funds. The Sub-Advisers are selected based primarily upon the research and recommendations of SIMC, which evaluates quantitatively and qualitatively the Sub-Advisers’ skills and investment results in managing assets for specific asset classes, investment styles and strategies.
The Investment Company Act of 1940, as amended (the “1940 Act”), requires that the initial approval of, as well as the continuation of, the Funds’ Investment Advisory Agreements be specifically approved: (i) by the vote of the Board or by a vote of the shareholders of the Funds; and (ii) by the vote of a majority of the Trustees who are not parties to the Investment Advisory Agreements or “interested persons” of any party (the “Independent Trustees”), cast in person at a meeting called for the purpose of voting on such approval(s). In connection with their consideration of such approval(s), the Funds’ Trustees must request and evaluate, and SIMC and the Sub-Advisers are required to furnish, such information as may be reasonably necessary to evaluate the terms of the Investment Advisory Agreements. In addition, the Securities and Exchange Commission takes the position that, as part of their fiduciary duties with respect to a mutual fund’s fees, mutual fund boards are required to evaluate the material factors applicable to a decision to approve an Investment Advisory Agreement.
Consistent with these responsibilities, the Board calls and holds meetings each year to consider whether to approve new and/or renew existing Investment Advisory Agreements between the Trust and SIMC and SIMC and the Sub-Advisers with respect to the Funds of the Trust. In preparation for these meetings, the Board requests and reviews a wide variety of materials provided by SIMC and the Sub-Advisers, including information about SIMC’s and the Sub-Advisers’ affiliates, personnel and operations and the services provided pursuant to the Investment Advisory Agreements. The Board also receives data from third parties. This information is provided in addition to the detailed information about the Funds that the Board reviews during the course of each year, including information that relates to Fund operations and Fund performance. The Trustees also receive a memorandum from counsel regarding the responsibilities of Trustees in connection with their consideration of whether to approve the Trust’s Investment Advisory Agreements. Finally, the Independent Trustees receive advice from independent counsel to the Independent Trustees, meet in executive sessions outside the presence of Fund management and participate in question and answer sessions with representatives of SIMC and the Sub-Advisers.
Specifically, during the course of the Trust’s fiscal year, the Board requested and received written materials from SIMC and the Sub-Advisers regarding: (i) the quality of SIMC’s and the Sub-Advisers’ investment management and other services; (ii) SIMC’s and the Sub-Advisers’ investment management personnel; (iii) SIMC’s and the Sub-Advisers’ operations and financial condition; (iv) SIMC’s and the Sub-Advisers’ brokerage practices (including any soft dollar arrangements) and investment strategies; (v) the level of the advisory fees that SIMC charges the Funds and the level of the sub-advisory fees that SIMC pays the Sub-Advisers, compared with fees each charge to comparable accounts; (vi) the advisory fees charged by SIMC and the Funds’ overall fees and operating expenses compared with peer groups of mutual funds prepared by Broadridge, an independent provider of investment company data; (vii) the level of SIMC’s and the Sub-Advisers’ profitability from their Fund-related operations; (viii) SIMC’s and the Sub-Advisers’ compliance program, including a description of material compliance matters and material compliance violations; (ix) SIMC’s potential economies of scale; (x) SIMC’s and the Sub-Advisers’ policies on and compliance procedures for personal securities transactions; (xi) SIMC’s and the Sub-Advisers’ expertise and resources in domestic and/or international financial markets; and (xii) the Funds’ performance over various periods of time compared with peer groups of mutual funds prepared by Broadridge and the Funds’ benchmark indexes.
At the March 28–29, 2017 meeting of the Board, the Trustees, including a majority of the Independent Trustees, approved the renewal of the Advisory Agreement. Also, each Sub-Advisory Agreement was either initially approved or, if the Sub-Advisory Agreement was already in effect (unless operating under an initial two-year term), renewed at meetings of the Board held during the course of the Trust’s fiscal year on June 27–28, 2017, September 11–13, 2017 and December 5–6, 2017. In each case, the Board’s approval (or renewal) was based on its consideration
| 58 | SEI Catholic Values Trust / Annual Report / February 28, 2018 |
and evaluation of the factors described above, as discussed at the meetings and at prior meetings. The following discusses some, but not all, of the factors that were considered by the Board in connection with its assessment of the Investment Advisory Agreements.
Nature, Extent and Quality of Services. The Board considered the nature, extent and quality of the services provided by SIMC and the Sub-Advisers to the Funds and the resources of SIMC and the Sub-Advisers and their affiliates dedicated to the Funds. In this regard, the Trustees evaluated, among other things, SIMC’s and each Sub-Adviser’s personnel, experience, track record and compliance program. Following evaluation, the Board concluded that, within the context of its full deliberations, the nature, extent and quality of services provided by SIMC and the Sub-Advisers to the Funds and the resources of SIMC and the Sub-Advisers and their affiliates dedicated to the Funds were sufficient to support the renewal of the Investment Advisory Agreements. In addition to advisory services, the Board considered the nature and quality of certain administrative, transfer agency and other non-investment advisory services provided to the Funds by SIMC and/or its affiliates.
Performance. In determining whether to renew SIMC’s Advisory Agreement, the Trustees considered the Funds’ performance relative to their peer groups and appropriate indexes/benchmarks. The Trustees reviewed performance information for each Fund, noting that they receive performance reports that permit them to monitor each Fund’s performance at board meetings throughout the year. As part of this review, the Trustees considered the composition of each peer group and selection criteria. In assessing Fund performance, the Trustees considered a report compiled by Broadridge, an independent third-party that was engaged to prepare an assessment of the Funds in connection with the renewal of the Advisory Agreement (the “Broadridge Report”). The Broadridge Report included metrics on net total return and performance consistency for the Funds and a universe of comparable funds. Based on the materials considered and discussed at the meetings, the Trustees found Fund performance satisfactory, or, where performance was materially below the benchmark and/or peer group, the Trustees were satisfied with the reasons provided to explain such performance. In connection with the approval or renewal of Sub-Advisory Agreements, the Board considered the performance of the Sub-Adviser relative to appropriate indexes/benchmarks. Following evaluation, the Board concluded that, within the context of its full deliberations, the performance of the Funds was sufficient to support renewal of SIMC’s Advisory Agreement, and the performance of each Sub-Adviser was sufficient to support approval or renewal of the Sub-Advisory Agreement.
Fees. With respect to the Funds’ expenses under the Investment Advisory Agreements, the Trustees considered the rate of compensation called for by the Investment Advisory Agreements and the Funds’ net operating expense ratio in comparison to those of the Funds’ respective peer groups. In assessing Fund expenses, the Trustees considered the information in the Broadridge Report, which included various metrics related to fund expenses, including, but not limited to, contractual management fees at various asset levels, actual management fees (including transfer agent expenses), and actual total expenses for the Funds and a universe of comparable funds. Based on the materials considered and discussion at the meetings, the Trustees further determined that fees were either shown to be below the peer average in the comparative fee analysis, or that there was a reasonable basis for the fee level. The Trustees also considered the effects of SIMC’s voluntary waiver of management and other fees to prevent total Fund operating expenses from exceeding a specified cap and concluded that SIMC, through waivers, has maintained the Funds’ net operating expenses at competitive levels for its distribution channels. In determining the appropriateness of fees, the Board also took into consideration the impact of fees incurred indirectly by the Funds as a result of investments into underlying funds, including funds from which SIMC or its affiliates earn fees. The Board also took into consideration compensation earned from the Funds by SIMC or its affiliates for non-advisory services, such as administration, transfer agency, shareholder services or brokerage, and considered whether SIMC and its affiliates may have realized other benefits from their relationship with the Funds, such as any research and brokerage services received under soft dollar arrangements. When considering fees paid to Sub-Advisers, the Board took into account the fact that the Sub-Advisers are compensated by SIMC and not by the Funds directly, and that such compensation with respect to any unaffiliated Sub-Adviser reflects an arms-length negotiation between the Sub-Adviser and SIMC. Following evaluation, the Board concluded that, within the context of its full deliberations, the expenses of the Funds are reasonable and supported renewal of the Investment Advisory Agreements. The Board also considered whether the Sub-Advisers and their affiliates may have realized other benefits from their relationship with the Funds, such as any research and brokerage services received under soft dollar arrangements.
Profitability. With regard to profitability, the Trustees considered compensation flowing to SIMC and the Sub-Advisers and their affiliates, directly or indirectly. The Trustees considered whether the levels of compensation and
| SEI Catholic Values Trust / Annual Report / February 28, 2018 | 59 |
BOARD OF TRUSTEES CONSIDERATIONS IN APPROVING THE ADVISORY AND SUB-ADVISORY AGREEMENTS (UNAUDITED) (Concluded)
profitability were reasonable. As with the fee levels, when considering the profitability of the Sub-Advisers, the Board took into account the fact that compensation with respect to any unaffiliated Sub-Adviser reflects an arms-length negotiation between the Sub-Adviser and SIMC. In connection with the approval or renewal of each Sub-Advisory Agreement, the Board also took into consideration the impact that the fees paid to the Sub-Adviser have on SIMC’s advisory fee margin and profitability. Based on this evaluation, the Board concluded that, within the context of its full deliberations, the profitability of each of SIMC and the Sub-Advisers is reasonable and supported renewal of the Investment Advisory Agreements.
Economies of Scale. With respect to the Advisory Agreement, the Trustees considered whether any economies of scale were being realized by SIMC and its affiliates and, if so, whether the benefits of such economies of scale were passed along to the Funds’ shareholders through a graduated investment advisory fee schedule or other means, including any fee waivers by SIMC and its affiliates. The Trustees recognized that economies of scale are difficult to identify and quantify and are rarely identifiable on a fund-by-fund basis. Based on this evaluation, the Board determined that the fees were reasonable in light of the information that was provided by SIMC with respect to economies of scale.
Based on the Trustees’ deliberation and their evaluation of the information described above, the Board, including all of the Independent Trustees, with the assistance of Fund counsel and Independent Trustees’ counsel, approved the approval or renewal, as applicable, of the Investment Advisory Agreements and concluded that the compensation under the Investment Advisory Agreements is fair and reasonable in light of such services and expenses and such other matters as the Trustees considered to be relevant in the exercise of their reasonable judgment. In the course of its deliberations, the Board did not identify any particular factor (or conclusion with respect thereto) or single piece of information that was all-important, controlling or determinative of its decision, but considered all of the factors together, and each Trustee may have attributed different weights to the various factors (and conclusions with respect thereto) and information.
60 | SEI Catholic Values Trust / Annual Report / February 28, 2018 |
(This page intentionally left blank)
(This page intentionally left blank)
(This page intentionally left blank)
NOTICE TO SHAREHOLDERS (Unaudited)
For shareholders who do not have a February 28, 2018, taxable year end, this notice is for informational purposes only. For shareholders with a February 28, 2018, taxable year end, please consult your tax adviser as to the pertinence of this notice.
For the fiscal year ended February 28, 2018, the Funds are designating long term and qualifying dividend income with regard to distributions paid during the year as follows:
| (A) Return of Capital | (B) Long Term | (C) Ordinary | (D) Total | (E) Dividends | (F) Qualifying | (G) U.S. | (H) Interest | (I) Short-Term | ||||||||||||||||||||||||||||
| Equity Fund | 0.00 | % | 0.00 | % | 100.00 | % | 100.00 | % | 100.00 | % | 100.00 | % | 0.00 | % | 0.65 | % | 0.00 | % | ||||||||||||||||||
| Fixed Income Fund | 0.00 | % | 0.00 | % | 100.00 | % | 100.00 | % | 0.00 | % | 0.00 | % | 21.74 | % | 97.61 | % | 0.00 | % | ||||||||||||||||||
| (1) | “Dividends Received Deduction” represent dividends which qualify for the corporate dividends received deduction and is reflected as a percentage of ordinary Income distributions (the total of short term capital gain and net investment income distributions). |
| (2) | “Qualifying Dividend Income” represent qualifying dividends as created by the Jobs and Growth Tax Relief Reconciliation Act of 2003. It is the intention of the Fund to designate the max amount permitted by law. |
| (3) | “U.S. Government Interest” represent the amount of interest that was derived from direct U.S. Government obligations and distributed during the fiscal year. Generally, interest from direct U.S. Government obligations is exempt from state income tax. However, for shareholders who are residents of California, Connecticut or New York, the statutory threshold requirements were not satisfied to permit exemption of these amounts from state income. |
| (4) | The percentage in this column represents the amount of “Interest Related Dividend” and is reflected as a percentage of ordinary income distribution. Interest related dividends are exempted from U.S. withholding tax when paid to foreign investors. |
| (5) | The percentage of this column represents the amount of “Short Term Capital Gain Dividend” and is reflected as a percentage of short term capital gain distribution that is exempted from U.S. withholding tax when paid to foreign investors. |
Items (A), (B), (C) and (D) are based on the percentage of each fund’s total distribution.
Items (E) and (F) are based on the percentage of “Ordinary Income Distributions.”
Item (G) is based on the percentage of gross income of each Fund.
Item (H) is based on the percentage of net investment income distributions.
Item (I) is based on the percentage of short-term capital gains distributions.
Please consult your tax adviser for proper treatment of this information. This notification should be kept with your permanent tax records.
| 64 | SEI Catholic Values Trust / Annual Report / February 28, 2018 |
SEI CATHOLIC VALUES TRUST February 28, 2018
Robert A. Nesher, Chairman
Trustees
William M. Doran
George J. Sullivan, Jr.
Nina Lesavoy
James M. Williams
Mitchell A. Johnson
Hubert L. Harris, Jr.
Susan C. Cote
Officers
Robert A. Nesher
President and Chief Executive Officer
James J. Hoffmayer
Controller and Chief Financial Officer
Glenn R. Kurdziel
Assistant Controller
Russell Emery
Chief Compliance Officer
Timothy D. Barto
Vice President, Secretary
Aaron Buser
Vice President, Assistant Secretary
David F. McCann
Vice President, Assistant Secretary
Stephen G. MacRae
Vice President
Bridget E. Sudall
Anti-Money Laundering Compliance Officer
Privacy Officer
Investment Adviser
SEI Investments Management Corporation
Administrator
SEI Investments Global Funds Services
Distributor
SEI Investments Distribution Co.
Legal Counsel
Morgan, Lewis & Bockius LLP
Independent Registered Public Accounting Firm
KPMG LLP
This report and the financial statements contained herein are submitted for the general information of the shareholders of the Trust and must be preceded or accompanied by a current prospectus. Shares of the Funds are not deposits or obligations of, or guaranteed or endorsed by, any bank. The shares are not federally insured by the Federal Deposit Insurance Corporation (FDIC), the Federal Reserve Board, or any other government agency. Investment in the shares involves risk, including the possible loss of principal.
For more information call
1 800 DIAL SEI
(1 800 342 5734)

1 Freedom Valley Drive, P.O. Box 1100, Oaks, PA 19456
SEI-F-198 (2/18)
| Item 2. | Code of Ethics. |
The Registrant has adopted a code of ethics that applies to the Registrant’s principal executive officer, principal financial officer, principal accounting officer or controller, or persons performing similar functions.
| Item 3. | Audit Committee Financial Expert. |
(a) (1) The Registrant’s Board of Trustees has determined that the Registrant has at least two audit committee financial experts serving on the audit committee.
(a) (2) The audit committee financial experts are Susan Cote, George J. Sullivan, Jr., Hubert L. Harris, Joan Binstock, and Jim Taylor. Cote, Jr. Messrs. Sullivan, Harris, Binstock, and Taylor are independent as defined in Form N-CSR Item 3 (a) (2).
| Item 4. | Principal Accountant Fees and Services. |
Fees billed by KPMG LLP (“KPMG”) related to the Registrant.
KPMG billed the Registrant aggregate fees for services rendered to the Registrant for the fiscal years 2018, and 2017 as follows:
| Fiscal Year 2018 | Fiscal Year 2017 | |||||||||||||||||||||||||
| All fees and services to the Registrant that were pre-approved | All fees and services to service affiliates that were pre-approved | All other fees and services to service affiliates that did not require pre-approval | All fees and services to the Registrant that were pre-approved | All fees and services to service affiliates that were pre-approved | All other fees and services to service affiliates that did not require pre-approval | |||||||||||||||||||||
(a) | Audit Fees(1) | $ | 55,000 | $ | 0 | N/A | $ | 55,000 | $ | 0 | N/A | |||||||||||||||
(b) | Audit-Related Fees | $ | 0 | $ | 0 | $ | 0 | $ | 0 | $ | 0 | $ | 0 | |||||||||||||
(c) | Tax Fees | $ | 0 | $ | 0 | $ | 0 | $ | 0 | $ | 0 | $ | 0 | |||||||||||||
(d) | All Other Fees(2) | $ | 0 | $ | 326,979 | $ | 0 | $ | 0 | $ | 240,350 | $ | 0 | |||||||||||||
Notes:
| (1) | Audit fees include amounts related to the audit of the Registrant’s annual financial statements and services normally provided by the accountant in connection with statutory and regulatory filings. |
| (2) | See Item 4(g) for a description of the services comprising the fees disclosed in this category. |
(e)(1) The Registrant’s Audit Committee has adopted and the Board of Trustees has ratified an Audit and Non-Audit Services Pre-Approval Policy (the “Policy”), which sets forth the procedures and the conditions pursuant to which services proposed to be performed by the independent auditor of the Registrant may be pre-approved.
The Policy provides that all requests or applications for proposed services to be provided by the independent auditor must be submitted to the Registrant’s Chief Financial Officer (“CFO”) and must include a detailed description of the services proposed to be rendered. The CFO will determine whether such services: (1) require specific pre-approval; (2) are included within the list of services that have received the general pre-approval of the Audit Committee pursuant to the Policy; or (3) have been previously pre-approved in connection with the independent auditor’s annual engagement letter for the applicable year or otherwise. In any instance where services require pre-approval, the Audit Committee will consider whether such services are consistent with SEC’s rules and whether the provision of such services would impair the auditor’s independence.
Requests or applications to provide services that require specific pre-approval by the Audit Committee will be submitted to the Audit Committee by the CFO. The Audit Committee will be informed by the CFO on a quarterly basis of all services rendered by the independent auditor. The Audit Committee has delegated specific pre-approval authority to either the Audit Committee Chair or financial experts, provided that the estimated fee for any such proposed pre-approved service does not exceed $100,000 and any pre-approval decisions are reported to the Audit Committee at its next regularly scheduled meeting.
Services that have received the general pre-approval of the Audit Committee are identified and described in the Policy. In addition, the Policy sets forth a maximum fee per engagement with respect to each identified service that has received general pre-approval.
All services to be provided by the independent auditor shall be provided pursuant to a signed written engagement letter with the Registrant, the investment advisor or applicable control affiliate (except that matters as to which an engagement letter would be impractical because of timing issues or because the matter is small may not be the subject of an engagement letter) that sets forth both the services to be provided by the independent auditor and the total fees to be paid to the independent auditor for those services.
In addition, the Audit Committee has determined to take additional measures on an annual basis to meet its responsibility to oversee the work of the independent auditor and to assure the auditor’s independence from the Registrant, such as reviewing a formal written statement from the independent auditor delineating all relationships between the independent auditor and the Registrant, and discussing with the independent auditor its methods and procedures for ensuring independence.
(e)(2) Percentage of fees billed applicable to non-audit services pursuant to waiver of pre-approval requirement were as follows:
| Fiscal 2018 | Fiscal 2017 | |||||||
Audit-Related Fees | 0 | % | 0 | % | ||||
Tax Fees | 0 | % | 0 | % | ||||
All Other Fees | 0 | % | 0 | % | ||||
(f) Not Applicable.
(g)(1) The aggregate non-audit fees and services billed by KPMG for the fiscal year 2018 and 2017 were $326,979 and $240,350, respectively. Non-audit fees consist of SSAE No. 16 review of fund accounting and administration operations and an attestation report in accordance with Rule 17 Ad-13.
(h) During the past fiscal year, Registrant’s principal accountant provided certain non-audit services to Registrant’s investment adviser or to entities controlling, controlled by, or under common control with Registrant’s investment adviser that provide ongoing services to Registrant that were not subject to pre-approval pursuant to paragraph (c)(7)(ii) of Rule 2-01 of Regulation S-X. The Audit Committee of Registrant’s Board of Trustees reviewed and considered these non-audit services provided by Registrant’s principal accountant to Registrant’s affiliates, including whether the provision of these non-audit services is compatible with maintaining the principal accountant’s independence
| Item 5. | Audit Committee of Listed Registrants. |
Not applicable.
| Item 6. | Schedule of Investments. |
The Schedules of Investments in securities of unaffiliated issuers as of the close of the reporting period for the Catholic Values Equity Fund and the Catholic Values Fixed Income Fund are included as part of the report to shareholders filed under Item 1 of this form.
| Item 7. | Disclosure of Proxy Voting Policies and Procedures for Closed-End Management Investment Companies. |
Not applicable.
| Item 8. | Portfolio Managers of Closed-End Management Investment Companies. |
Not applicable.
| Item 9. | Purchases of Equity Securities by Closed-End Management Company and Affiliated Purchasers. |
Not applicable.
| Item 10. | Submission of Matters to a Vote of Security Holders. |
The Registrant has a standing Governance Committee (the “Committee”) currently consisting of the independent trustees. The Committee is responsible for evaluating and recommending nominees for election to the Registrant’s Board of Trustees (the “Board”). Pursuant to the Committee’s Charter, adopted on June 18, 2004, the Committee will review all shareholder recommendations for nominations to fill vacancies on the Board if such recommendations are submitted in writing and addressed to the Committee at the Registrant’s office.
| Item 11. | Controls and Procedures. |
(a) The Registrant’s principal executive and principal financial officers, or persons performing similar functions, have concluded that the Registrant’s disclosure controls and procedures (as defined in Rule 30a-3(c) under the Investment Company Act of 1940 (the “1940 Act”) (17 CFR
270.30a-3(c))) are effective based on the evaluation of these controls and procedures required by Rule 30a-3(b) under the Act (17 CFR 270.30a-3(b)) and Rules 13a-15(b) or 15d-15(b) under the Securities Exchange Act of 1934 (17 CFR 240.13a-15(b) or 240.15d-15(b)) as of a date within 90 days of the filing date of this report.
(b) There were no changes in the Registrant’s internal control over financial reporting (as defined in Rule 30a-3(d) under the 1940 Act (17 CFR 270.30a-3d(d)) that occurred during the second fiscal quarter of the period covered by this report that have materially affected, or are reasonably likely to materially affect, the Registrant’s internal control over financial reporting.
| Items 12. | Exhibits. |
(a)(1) Code of Ethics attached hereto.
(a)(2) A separate certification for the principal executive officer and the principal financial officer of the Registrant as required by Rule 30a-2(a) under the Act (17 CFR 270.30a-2(a)), as amended, are filed herewith.
(b) Officer certifications as required by Rule 30a-2(b) under the Investment Company Act of 1940, as amended (17 CFR 270.30a-2(b)), also accompany this filing as an exhibit.
SIGNATURES
Pursuant to the requirements of the Securities Exchange Act of 1934 and the Investment Company Act of 1940, the registrant has duly caused this report to be signed on its behalf by the undersigned, thereunto duly authorized.
| SEI Catholic Values Trust | ||||||
| By | /s/ Robert A. Nesher | |||||
| Robert A. Nesher, President & CEO | ||||||
| Date: May 9, 2018 | ||||||
Pursuant to the requirements of the Securities Exchange Act of 1934 and the Investment Company Act of 1940, this report has been signed below by the following persons on behalf of the registrant and in the capacities and on the dates indicated.
| By | /s/ Robert A. Nesher | |||||
| Robert A. Nesher, President & CEO | ||||||
| Date: May 9, 2018 | ||||||
| By | /s/ James J. Hoffmayer | |||||
| James J. Hoffmayer, Controller & CFO | ||||||
Date: May 9, 2018 | ||||||