UNITED STATES
SECURITIES AND EXCHANGE COMMISSION
Washington, D.C. 20549
FORMN-CSR
CERTIFIED SHAREHOLDER REPORT OF REGISTERED MANAGEMENT
INVESTMENT COMPANIES
Investment Company Act File Number811-23015
SEI Catholic Values Trust
(Exact name of registrant as specified in charter)
SEI Investments
One Freedom Valley Drive
Oaks, Pennsylvania 19456
(Address of principal executive offices) (Zip code)
Timothy D. Barto, Esq.
SEI Investments
One Freedom Valley Drive
Oaks, PA 19456
(Name and address of agent for service)
Registrant’s telephone number, including area code:1-610-676-1000
Date of fiscal year end: February 28, 2019
Date of reporting period: February 28, 2019
| Item 1. | Reports to Stockholders. |
| 1 | ||||
| 6 | ||||
| 10 | ||||
| 34 | ||||
| 35 | ||||
| 36 | ||||
| 37 | ||||
| 38 | ||||
| 54 | ||||
| 55 | ||||
| 58 | ||||
Board of Trustees Considerations in Approving the Advisory andSub-Advisory Agreements | 59 | |||
| 62 | ||||
The Trust files its complete schedule of portfolio holdings with the Securities and Exchange Commission for the first and third quarter of each fiscal year on FormN-Q within sixty days after the end of the period. The Trust’s FormsN-Q are available on the Commission’s website at http://www.sec.gov, and may be reviewed and copied at the Commission’s Public Reference Room in Washington, DC. Information on the operation of the Public Reference Room may be obtained by calling1-800-SEC-0330.
A description of the policies and procedures that the Trust uses to determine how to vote proxies relating to portfolio securities, as well as information relating to how a Fund voted proxies relating to portfolio securities during the most recent12-month period ended June 30, is available (i) without charge, upon request, by calling1-800-DIAL-SEI; and (ii) on the Commission’s website at http://www.sec.gov.
February 28, 2019 (Unaudited)
To our Shareholders:
After an extended period of historical calm and steady gains, volatility returned to financial markets during the fiscal year ending February 28, 2019, with a selloff toward the end of the reporting period that sent most global indexes into or near bear market territory. Trade war fears, Italian budget negotiations, ongoing Brexit discussions, and a flattening U.S. yield curve all weighed on investor expectations. The ongoing U.S. and China trade dispute hit a boiling point in the second half of 2018, resulting in atit-for-tat strategy that saw various threats of tariffs from both parties.
Many of the expectations we had at the start of the Funds’ most recently completed fiscal year, from the start of March 2018 through the end of February 2019, were actualized. The pace of interest-rate increases by the Federal Reserve (Fed) largely followed the market’s projections. Short-term rates rose by a greater magnitude than long-term rates after the Federal Reserve raised rates four times during the reporting period, and the yield-curve flattened to a post-recession low.
The European Central Bank ended its bond-buying program at the end of 2018 but made assurances that it would reinvest maturing securities for some time to help keep rates low. Although the currency was viewed as a safe-haven asset during equity-market selloffs both early and later in the fiscal year, the Japanese yen finished the period lower against the U.S. dollar as the Bank of Japan (BOJ) held monetary policy stable. Driven by trade-related tensions, China’s currency slid to a10-year low against the U.S. dollar in the second half of the fiscal period before a slight recovery late in the year.
Oil prices rose for the first half of the reporting period to a four-year high, supported by geopolitical tensions and news that Saudi Arabia and Russia would extend an agreement to curb output. However, growing concerns over falling demand and increasing global supply, along with a broad selloff in risk assets, helped drive a correction during the last three months of 2018 that sent the commodity down as much as 40% from its earlier highs, before gaining support at the start of the new year that saw a 25% recovery.
Geopolitical Events
U.S. elections in early November 2018 produced a partial shift in power away from Republicans and toward Democrats in Congress and statehouses across the country. The new balance of authority in Congress should substantially limit the ability of President Donald Trump and Republicans to pass meaningful legislation; it also enhances the investigatory powers available to Democrats, thereby adding to political risk for the Trump administration.
The partial shutdown of the U.S. government lasted over a month due to an impasse between Congress and President Trump’s administration about whether to fund a multi-billion dollar wall on the U.S.-Mexico border championed by the president. Trump ultimately relented, enabling federal workers to receive pay again and setting up a three-week negotiation window.
A second meeting between Trump and North Korean Supreme Leader KimJong-Un garnered headlines, but ended early after Trump concluded that North Korea was not making adequate denuclearization concessions that warranted the removal of sanctions. President Trump backed out of a multi-party nuclear disarmament agreement with the Iranian Republic andre-imposed sanctions on Iran despite the International Atomic Energy Agency’s assurance that Iran remained compliant with the terms of the accord; all other original signatories to the deal remained committed.
The U.S. escalated its trade fight with China during the fiscal year, enacting tariffs of 10% on $200 billion of Chinese products and promising to increase them to 25% in the New Year. President Trump pointed to an additional prospective $267 billion in Chinese products that could also be subjected to tariffs if China were to retaliate—which it did, although on a significantly smaller scale. U.S. trade negotiators ultimately expressed optimism about progress with their Chinese counterparts during February, although concrete developments remained limited to assurances from China to boost U.S. agricultural imports.
NAFTA’s successor came into focus during the year—first when the U.S. and Mexico came to an agreement in August, and then when the U.S. and Canada finally ironed out their differences in the last few hours of September. Now called the United States-Mexico-Canada Agreement, the revised deal is expected to strengthen its
SEI Catholic Values Trust / Annual Report / February 28, 2019 | 1 |
LETTER TO SHAREHOLDERS (Continued)
February 28, 2019 (Unaudited)
predecessor’s provisions and improve labor standards. The U.S. is projected to offer Canada and Mexico relief from automobile-related trade barriers as a result of the new agreement, although aluminum and steel tariffs will remain.
A raft of overseas political surprises unfolded during the reporting period. Theanti-EU implications of a new Italian government taking shape rattled financial markets in May, then again as a rejection of the coalition’s first choice for economy minister seemed to set the stage for another round of elections and associated delays. Spain’s government also experienced turnover as center-right Prime Minister Mariano Rajoy suffered ano-confidence vote and was replaced by socialist leader Pedro Sanchez at the beginning of June. U.K. Prime Minister Theresa May informed European Council President Donald Tusk in late February that she may need to delay Brexit even if her deal earned parliamentary approval; there’s evidence that EU leaders would prefer one large postponement—likely by converting the transition period through 2020 into a delayed divorce—rather than an open-ended number of multi-month extensions.
Economic Performance
U.S. economic growth grew 4.2% at the start of the fiscal period, its highest annualized growth rate since 2014, primarily on strong business expenditures and a jump in exports ahead of expected retaliatory tariffs. Consumer spending also accelerated, by 3.8%, after growing by the slowest rate in five years during the previous quarter. Third-quarter GDP was a still-solid 3.4%, pointing to a slight drop in consumer spending and a broader decline in exports. Economic growth slowed to 2.6% in the fourth quarter according to preliminary data that was only modestly affected by the partial government shutdown.
The labor market remained robust throughout the year: the unemployment rate fell, finishing the period at 3.8%, after touching 3.7% earlier in the year, a49-year low; the labor-force participation rate ended at 63.2%, up slightly from a year ago. Average hourly earnings gained 3.4% over the year, although a modest increase in price pressures weighed on real personal income growth as the period progressed. The historically strong labor market and improving wage growth helped boost the debt profile of the U.S. consumer. The Fed raised its target interest rate four times during the period and continued to unwind its balance sheet, with the pace accelerating to $40 billion per month by the end of the year, a reversal of the quantitative easing that has been supportive of bond prices in recent years. Just after the end of the reporting period, the Fed announced it would end its balance sheet reduction program by September 2019.
The European Central Bank (ECB) held its benchmark interest rate unchanged at a historic low through the fiscal year, while the Bank of England raised its official bank rate for only the second time since the global financial crisis, by 0.25%, in the second half of the year. Broad economic growth in the eurozone slowed to its weakest pace in four years during the period, after growing at its quickest pace since 2011 during the fourth quarter of 2017, as tightening auto emission standards in Germany and a stagnating Italian economy hampered expansion.Year-on-year growth was just 1.2% at the end of the fourth quarter of 2018, likely supporting the case for continued accommodative policy by the ECB for some time. The U.K. economy grew just 1.3%year-on-year through the fourth quarter of 2018, asix-year low, as Brexit uncertainty continued to hurt the economy and a weakened pound dampened consumer spending, which remained near its lowest level in almost six years.
Japanese GDP grew 0.3%year-on-year at the end of the fourth quarter of 2018; the BOJ maintained monetary stimulus in an attempt to drive higher inflation. Meanwhile, GDP in China expanded by 6.4%year-on-year in the fourth quarter of 2018, slowing to its weakest pace in 28 years, as a lack of consumer confidence due to the U.S. trade war continued to put pressure on economic growth.
Market Developments
For the fiscal year ending February 28, 2019, growth stocks, in general, outperformed value stocks. The U.S. equity market experienced a significant decline during the second half of the fiscal year as concerns about rising interest rates, trade issues, and softening global economic growth weighed on investor sentiment. The highly-cyclical materials and energy sectors experienced significant selloffs, while the healthcare and utilities sectors, in particular, outperformed and helped mitigate some damage in the falling market. However, the fiscal year closed on a strong note, as January marked the best start for equities in thirty years and the recovery rally continued through February.
| 2 | SEI Catholic Values Trust / Annual Report / February 28, 2019 |
The start of the period’s final quarter saw most major index gains for the year erased before the sharp rebound over the last two months pushed returns back ahead; the Russell 1000 Growth Index finished up 6.62%, while the Russell 1000 Value Index lagged, gaining 3.16% over the same period.
Small-cap stocks (Russell 2000 Index) outpaced large-caps (Russell 1000 Index), climbing 5.58% and 4.99%, respectively.
Looking back on market performance for the full period, the FTSE UK SeriesAll-Share Index was down 1.82% in U.S. dollar terms but up a modest 1.70% in sterling, as Brexit concerns continued to overshadow the outlook for businesses. The MSCI ACWI Index, a proxy for global equities in both developed and emerging markets, declined 0.84% in U.S. dollar terms; U.S. markets did better, with the S&P 500 Index up 4.68%.
Emerging markets failed to keep pace with the developed world across asset classes amid a synchronized global economic expansion. The MSCI Emerging Markets Index finished the fiscal year down 9.89% in U.S. dollar terms, despite halving itsyear-to-date losses over the final two months. Latin America also finished down for the year, although a robust second half erased approximately three-quarters of itsyear-to-date loss. Asian markets also ended the period lower as trade-related concerns drove market weakness.
Driven by the dovish tone of global central banks and better-than-expected earnings toward the end of the reporting period, global high-yield bonds outperformed government bonds. A continuing theme for U.S. fixed-income markets was the flattening yield curve, as short-term yields rose more than long-term yields. In early December, the spread between2-year and10-year Treasury bonds compressed to 11 basis points, its narrowest point in more than 11 years. At the same time, the spread between2-year and5-year Treasurys inverted, as did the spread between3-year and5-year Treasurys. The Federal Open Market Committee increased the federal-funds rate inmid-December—the fourth time in 2018—while softening its projections for future rate increases. The rate hike pushed short-term yields higher, while increases in longer-term bond yields were more muted as inflation and long-term economic growth expectations remained subdued. Yields for10-year government bonds declined and ended the period 14 basis points lower at 2.73%, while2-year yields climbed 27 basis points during the year, to 2.52%.
Front-end Treasury yields moved higher in response to the Fed increasing thefed-funds target rate to2.25%-2.50%, marking the fourth rate hike during the reporting period and ninth during this tightening cycle. Jerome Powell succeeded Janet Yellen as Fed Chair, and Randal Quarles was named vice chair for bank supervision. Marvin Goodfriend, a former Fed economist, was chosen to fill one of three open governor seats just before the start of the fiscal period; however, his nomination appeared in limbo during the year without a Senate confirmation or renomination with the current Congress. President Trump signed the Tax Cuts and Jobs Act into law prior to the start of the reporting period, introducing several new policies, including a cap on state and local tax deductions, aone-time repatriation tax on overseas cash, a move to a territorial tax system and a permanent drop in the corporate tax rate from 35% to 21%.
Inflation-sensitive assets, such as commodities and Treasury inflation-protected securities, were mixed. The Bloomberg Commodity Total Return Index (which represents the broad commodity market) sunk 5.67% during the period, driven by declines in oil prices and trade concerns in the metals sector; the Bloomberg Barclays US TIPS Index (USD) edged 1.91% higher.
Global fixed income, as measured by the Bloomberg Barclays Global Aggregate Index, slipped 0.57% in U.S. dollar terms during the reporting period; the high-yield market did better, with the ICE BofAML US High Yield Constrained Index up 4.26%.
U.S. investment-grade corporate debt was slightly higher, as the Bloomberg Barclays US Corporate Investment Grade Index returned 2.63%. Despite headwinds from rising interest rates, both U.S. asset-backed securities and mortgage-backed securities also managed gains during the fiscal year.
Our View
As painful as 2018 was for risk assets, their gyrations were not outside the norm. Instead, given our views that the global economy will continue to grow and that market participants are overreacting to the concerns of the day, we see another criticalrisk-on opportunity developing in equities and other risk assets. We believe a rebalancing of assets back toward undervalued equity classes is an appropriate and timely response.
SEI Catholic Values Trust / Annual Report / February 28, 2019 | 3 |
LETTER TO SHAREHOLDERS (Concluded)
February 28, 2019 (Unaudited)
We still view the U.S. economic position as reasonably solid. Points of strength include the improving economic status of U.S. households as labor markets tighten and real wage growth accelerates, while increased government spending has also helped. With Democrats controlling the House of Representatives and Republicans holding power in the Senate, any fiscal-policy agreement made during a period of political gridlock will likely mean slightly more federal-government spending—not less.
The decline in energy prices is especially good news for the broader economy since it reduces concerns about inflation accelerating beyond the Fed’s comfort zone anytime soon. It also lowers costs for consumers and businesses on a broad range of petroleum-based products.
Some Fed officials, including Chairman Powell himself, explicitly acknowledge that the federal-funds rate now is near a level that can be considered neither stimulative nor deflationary. We are penciling in just one rate increase in 2020—but this is just a guess. The critical thing to remember is that the central bank is adopting await-and-see approach to monetary policy and has ended the nearly automatic quarterly rate increases of 2017 and 2018.
We think the odds favor a rebound in U.S. equity prices for the following reasons:
The U.S. economy should continue to grow, and corporate earnings per share are expected to post amid-to-high single-digit gain in 2019.
Valuations for the S&P 500 Index have declined from almost 19 timesone-year forward earnings per share to an attractive level of nearly 14 times following the decline in share prices.
U.S. bond yields remain rather low and have moved down again in late 2018, bolstering the case for riskier assets.
Investor risk aversion has increased, and we think much of the bad news of recent months is reflected in current stock prices—creating space for potential upside surprises on trade wars, the Fed’s policy path, Brexit, corporate profits and elsewhere.
Fiscal policy will not be the active catalyst for growth in the U.S. that it was in 2018, but the impact of political gridlock should still be mildly expansionary.
As for Brexit, we believe it’s unlikely that the U.K. will fall out of the EU without some deal in place. Ano-deal divorce would deliver a mighty blow to the economy. In our view, the real choice now is between Prime Minister May’s Brexit deal or no Brexit at all. Ano-Brexit-at-all scenario could take one of two forms. The U.K. government could unilaterally revoke Article 50, basically calling off the divorce from the EU. The second alternative is to go back to voters and hold a second referendum. Although the legality would be disputed, we think this is the far more likely scenario. The financial markets probably would respond quite positively to this decision, yet the next few months could still be volatile as the late-March Brexit date nears.
Although the European banking system is in better shape than it was in the immediate aftermath of the global financial crisis, it is still vulnerable at a time when the ECB is in a holding pattern, policy-wise, and possesses only a few options in the event of a financial emergency. Equity-market valuations reflect a lack of enthusiasm for Europe’s economic prospects: the MSCI European Economic and Monetary Union Indexprice-to-earnings ratio has sunk to less than 12 times from nearly 15 times at the start of the year. Note that European equities outperformed U.S. equities in the fourth quarter of 2018.
We are leaning on the optimistic side for emerging markets in 2019. The valuation piece is already in place, in our opinion, with theprice-to-forward-earnings ratio collapsing from 13 times at the end of January to 10.5 byyear-end. But what could be the catalyst for a turnaround? Significant debt expansions in China typically lead to big gains in emerging-market equities. The question is whether the Chinese government has the will to go back to the debt well one more time.
It surely would be a big positive for the country if the threat of tariffs was negotiated away, but we’re not holding our breath. On the contrary, the U.S.-China economic relationship will likely continue to deteriorate as the Trump administration seeks to level the playing field—even if it means a less efficient global trading system. When push comes to shove, the Chinese government will probably get even more aggressive in easing lending constraints if the situation warrants.
| 4 | SEI Catholic Values Trust / Annual Report / February 28, 2019 |
Commodity prices and the earnings of emerging-market companies are closely correlated inversely with the movements of the U.S. dollar. For most of 2018, the dollar gained against other currencies, putting downward pressure on commodity prices and the earnings of energy and materials companies that are a large part of the MSCI Emerging Markets Index. In 2017, the opposite conditions held.
We are looking for another change in the dollar’s trend in 2019. In our view, U.S. economic and corporate-earnings performance will move toward that of other developed countries. If there are positive developments in some of the pressure-point issues that have roiled markets, investment capital could flow away from the U.S. and back into the world—thereby removing an important source of support for the U.S. currency and a significant headwind from the rest of the world. This potential for a reversal in investment flows could accelerate if Fed policy becomes more dovish than currently projected by the central bank.
The awful performance of risk assets in the fourth quarter of 2018 can undoubtedly prey on investors’ emotions. But the global economy is not exactly in dire straits. Yes, there are an unusually large number of uncertainties and concerns, some of which could have a material impact on growth if the worst comes to pass. However, even in an extraordinarily unfavorable economic scenario in which the tariff wars with China and other countries deepen and the Fed raises interest rates too far and too fast, we doubt that the U.S. economy would experience anything worse than a garden-variety recession by 2021. The economic and credit excesses that usually precede a deeper recession aren’t to be found.
During periods of market volatility like the one we’ve been going through, we make sure to remind investors about the importance of sticking with a strategic and disciplined approach to investing that is consistent with personal goals and risk tolerances. Diversification is the key to that approach, and the construction of portfolios is consistent with our long-term capital market assumptions.
Ultimately, the value of our assumptions is not in their accuracy as point estimates, but in their ability to capture relevant relationships—as well as changes in those relationships as a function of economic and market influences.
On behalf of SEI Investments, I want to thank you for your continued confidence. We are working every day to maintain that trust, and we look forward to serving your investment needs in the future.
Sincerely,

Bill Lawrence, CFA
Head and Chief Investment Officer of Traditional Asset Management
SEI Catholic Values Trust / Annual Report / February 28, 2019 | 5 |
MANAGEMENT’S DISCUSSION AND ANALYSIS OF FUND PERFORMANCE
February 28, 2019 (Unaudited)
Catholic Values Equity Fund
I. Objective
The Catholic Values Equity Fund (the “Fund”) seeks long-term capital appreciation.
II. Investment Approach
The Fund uses a multi-manager approach, relying on a number ofsub-advisors with differing investment approaches to manage portions of the Fund’s portfolio, under the general supervision of SEI Investments Management Corporation (SIMC). The Fund utilized the followingsub-advisors as of February 28, 2019: Brandywine Global Investment Management, LLC; Coho Partners, Ltd.; EAM Investors, LLC; EARNEST Partners, LLC; Fred Alger Management, Inc.; Parametric Portfolio Associates LLC; and Snow Capital Management L.P. During the fiscal year, effective January 2, 2019, BlackRock Investment Management, LLC, was terminated from the Fund.
III. Returns
For the period from March 1, 2018, through February 28, 2019, the Fund’s F class shares returned 0.62%. The Fund’s primary benchmark—the Russell 3000 Index (USD)—returned 5.05%.
IV. Performance Discussion
Although the U.S. equity market finished modestly positive during the fiscal year, a portion of the reporting period included a significantsell-off, andnon-U.S. developed- and emerging-market stocks ended with cumulative declines. The broad market’s gains were concentrated in U.S.large-cap growth stocks for most of the year; interest-rate-sensitive bond proxies, such as utilities and real-estate investment trusts, also participated when the upward trend in interest rates reversed course later in the year. As noted in the shareholder letter, continued concerns surrounding the ongoing Brexit saga and U.S.-China trade negotiations weighed on investor sentiment in many segments of the equity market.
Among the Fund’s benchmark sectors, utilities, real estate, health care and information technology performed relatively well during the fiscal year. Negative performance from the financials sector was one reason that value stocks lagged growth stocks. As the shareholder letter addressed, weak commodity prices created a headwind for the energy and materials sectors, further contributing to underperformance for value stocks.
Overall, the Fund’s holdings amongnon-U.S. equities, along with positioning in the less-expensive sectors of the market, held back returns in the reporting period. Overweights to stocks of companies domiciled in Norway, Austria, Netherlands, Taiwan and the United Kingdom detracted. Additionally, overweights to the financials, energy and materials sectors weakened the Fund’s relative performance.
Despite the selloff in the middle of the fiscal year, equities rose during the period’s final two months. The U.S. equity market remained expensive relative to historical norms, and there were some notably stretched valuations among the most popular growth stocks and those within traditional high-yielding sectors, notably real estate and utilities. Conversely, cyclical-value stocks were relatively inexpensive, andnon-U.S. equities traded at a discount to their U.S. counterparts.
The top contributors during the year from an excess return perspective were the Fund’s U.S. growth managers, EAM, Blackrock and Alger. Each benefited from holdings within the information technology sector. Earnest Partners lagged the Fund’s benchmark due to itsnon-U.S. equity focus. The Fund’s deeper-value managers, Brandywine and Snow, lagged as fundamentally cheap cyclical value stocks underperformed. Coho, the Fund’s stability manager, produced performance that was similar to the benchmark for the year.
| AVERAGE ANNUAL TOTAL RETURN1 | ||||||
| One-Year Return | Three-Year Return | Annualized Inception to Date | ||||
| Class F | 0.62% | 14.38% | 6.91% | |||
| Class Y | 0.71% | 14.53% | 7.04% | |||
| Russell 3000 Index | 5.05% | 10.50% | 9.76% |
| 6 | SEI Catholic Values Trust / Annual Report / February 28, 2019 |
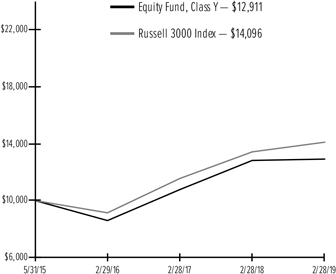
Comparison of Change in the Value of a $10,000 Investment in the Catholic Values Equity Fund, Class F, versus the Russell 3000 Index

| ¹ | For the year ended 2/28/2019. Past performance is no indication of future performance. Class F shares were offered beginning on 4/30/2015 and Class Y share were offered beginning 5/31/2015. The graph is based on only the Class F; performance for Class Y would be different due to differences in fee structures. Returns shown do not reflect the deduction of taxes that a shareholder would pay on Fund distributions or the redemption of Fund shares. The returns for certain periods reflect fee waivers and/or reimbursements in effect for that period; absent fee waivers and reimbursements, performance would have been lower. |
Comparison of Change in the Value of a $10,000 Investment in the Catholic Values Equity Fund, Class Y, versus the Russell 3000 Index
| ¹ | For the year ended 2/28/2019. Past performance is no indication of future performance. Class Y shares were offered beginning on 5/31/2015 and Class F share were offered beginning 4/30/2015. The graph is based on only the Class Y; performance for Class F would be different due to differences in fee structures. Returns shown do not reflect the deduction of taxes that a shareholder would pay on Fund distributions or the redemption of Fund shares. The returns for certain periods reflect fee waivers and/or reimbursements in effect for that period; absent fee waivers and reimbursements, performance would have been lower. |
SEI Catholic Values Trust / Annual Report / February 28, 2019 | 7 |
MANAGEMENT’S DISCUSSION AND ANALYSIS OF FUND PERFORMANCE
February 28, 2019 (Unaudited)
Catholic Values Fixed Income Fund
I. Objective
The Catholic Values Fixed Income Fund (the “Fund”) seeks a high level of current income with preservation of capital.
II. Investment Approach
The Fund uses a multi-manager approach, relying on a number ofsub-advisors with differing investment approaches to manage portions of the Fund’s portfolio, under the general supervision of SEI Investments Management Corporation (SIMC). The Fund utilized the followingsub-advisors as of February 28, 2019: Income Research & Management; Western Asset Management Company; and Western Asset Management Company Limited. There were no manager changes during the period.
III. Returns
For the period from March 1, 2018, through February 28, 2019, the Fund’s F class shares returned 3.29%. The Fund’s benchmark—the Bloomberg Barclays US Aggregate Bond Index (USD)—returned 3.17%.
IV. Performance Discussion
Driven by tax reform and increased fiscal spending, U.S. growth accelerated during the fiscal year, enabling the U.S. to outpace other developed nations. Concerns over Italy’s budget issues with the EU, Brexit and U.S. trade relations with China, along with slowing growth in the country, changed the narrative from synchronized global growth to unease over a possible recession. As noted in the shareholder letter, the Federal Reserve (Fed) raised rates four times during the fiscal year but made a dovish pivot in January 2019, indicating patience and a possible end to its balance sheet reduction earlier than projected. Equity markets rallied early before a selloff in the fourth quarter of 2018 brought most major indexes close to bear-market territory. A strong rally to start 2019 ended the reporting period.
2-year Treasury yields climbed 26 basis points to 2.51% at the end of the fiscal year after peaking at 2.97% in November 2018. While inflation ticked higher, it still did not exceed the Fed’s 2% target, and as a result,10-year Treasury yields declined 15 basis points over the period to 2.72%. As the shareholder letter addressed, corporate bonds generated positive returns but underperformed comparable Treasurys. The securitized sectors enjoyed both positive and relative outperformance against comparable Treasury bonds.
A slightly longer duration posture subtracted from performance, but was offset by the Fund’s yield-curve-flattening bias. Corporate bond spreads began the year near narrow relative to historical levels, but widened, especially during the fourth quarter of 2018, before stabilizing. As a result, corporates underperformed, and the Fund’s overweight subtracted. An overweight to financials helped offset corporate weakness, with performance in the sector more in line with Treasurys. As housing prices continued to advance and wages gradually improved, housing fundamentals remained firm; combined with limited new issuance that provided support fornon-agency mortgages, the Fund’s overweight was additive. The Fund’s overweight in the securitized sectors of asset-backed securities (ABS) and commercial mortgage-backed securities (CMBS) was also beneficial, as both U.S. consumer and commercial properties were supported by improving wages and an expanding economy. A slight underweight to agency mortgage-backed securities (MBS), which generated small outperformance given the decline in10-year Treasury yields, detracted from relative performance.
Western’s longer duration posture subtracted, but was offset to a degree by its yield-curve-flattening bias. An overweight to investment-grade corporate credit also detracted, while security selection within financials was additive. A small allocation to high-yield and emerging-markets debt contributed despite volatility in those markets. Income Research benefited from overweights to CMBS and ABS, while an underweight to agency MBS detracted from relative performance.
The Fund used Treasury futures, eurodollar futures andto-be-announced (TBA) forward contracts to efficiently manage duration, yield-curve and market exposures. (TBA contracts confer the obligation to buy or sell future debt obligations of the three U.S. government-sponsored agencies that issue or guarantee MBS—Fannie Mae, Freddie Mac and Ginnie Mae.) None of these had a meaningful impact on performance.
| AVERAGE ANNUAL TOTAL RETURN1 | ||||||
| One-Year Return | Three-Year Return | Annualized Inception to Date | ||||
| Class F | 3.29% | 2.42% | 2.03% | |||
| Class Y | 3.29% | 2.55% | 2.31% | |||
| Bloomberg Barclays U.S. Aggregate Bond Index | 3.17% | 1.69% | 1.69% |
| 8 | SEI Catholic Values Trust / Annual Report / February 28, 2019 |
Comparison of Change in the Value of a $10,000 Investment in the Fixed Income Fund, Class F, versus the Bloomberg Barclays U.S. Aggregate Bond Index
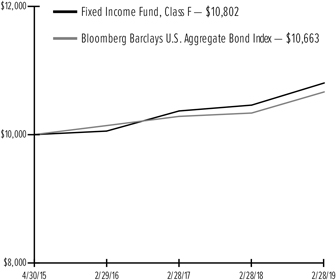
| 1 | For the year ended 2/28/2019. Past performance is no indication of future performance. Class F shares were offered beginning on 4/30/2015 and Class Y share were offered beginning 5/31/2015. The graph is based on only the Class F; performance for Class Y would be different due to differences in fee structures. Returns shown do not reflect the deduction of taxes that a shareholder would pay on Fund distributions or the redemption of Fund shares. The returns for certain periods reflect fee waivers and/or reimbursements in effect for that period; absent fee waivers and reimbursements, performance would have been lower. |
Comparison of Change in the Value of a $10,000 Investment in the Fixed Income Fund, Class Y, versus the Bloomberg Barclays U.S. Aggregate Bond Index
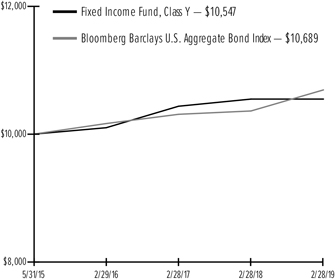
| 1 | For the year ended 2/28/2019. Past performance is no indication of future performance. Class Y shares were offered beginning on 5/31/2015 and Class F share were offered beginning 4/30/2015. The graph is based on only the Class Y; performance for Class F would be different due to differences in fee structures. Returns shown do not reflect the deduction of taxes that a shareholder would pay on Fund distributions or the redemption of Fund shares. The returns for certain periods reflect fee waivers and/or reimbursements in effect for that period; absent fee waivers and reimbursements, performance would have been lower. |
SEI Catholic Values Trust / Annual Report / February 28, 2019 | 9 |
February 28, 2019
Catholic Values Equity Fund
Sector Weightings (Unaudited)†: |
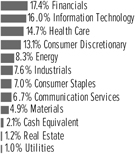 |
†Percentages based on total investments.
| Description | Shares | Market Value ($ Thousands) | ||||||
COMMON STOCK — 73.6% | ||||||||
Communication Services — 5.7% | ||||||||
Activision Blizzard Inc | 2,682 | $ | 113 | |||||
Alphabet Inc, Cl A * | 2,513 | 2,831 | ||||||
Alphabet Inc, Cl C * | 600 | 672 | ||||||
AT&T Inc | 68,661 | 2,137 | ||||||
Charter Communications, Cl A * | 818 | 282 | ||||||
Comcast Corp, Cl A | 14,311 | 553 | ||||||
Electronic Arts Inc * | 1,255 | 120 | ||||||
Facebook Inc, Cl A * | 18,876 | 3,048 | ||||||
Glu Mobile Inc * | 10,693 | 96 | ||||||
IAC/InterActiveCorp * | 305 | 65 | ||||||
Intelsat SA * | 1,757 | 42 | ||||||
Interpublic Group of | 2,450 | 56 | ||||||
John Wiley & Sons Inc, Cl A | 1,163 | 60 | ||||||
Live Nation Entertainment * | 2,712 | 153 | ||||||
Madison Square Garden * | 191 | 55 | ||||||
Marcus | 1,268 | 54 | ||||||
Netflix Inc * | 2,555 | 915 | ||||||
New York Times, Cl A | 2,337 | 77 | ||||||
Omnicom Group Inc | 21,567 | 1,633 | ||||||
pdvWireless * | 1,334 | 52 | ||||||
Sprint * | 8,319 | 53 | ||||||
Take-Two Interactive Software * | 1,527 | 133 | ||||||
T-Mobile US * | 5,393 | 389 | ||||||
Twitter Inc * | 1,144 | 35 | ||||||
Verizon Communications Inc | 12,249 | 697 | ||||||
Viacom Inc, Cl B | 1,657 | 48 | ||||||
Walt Disney Co/The | 6,703 | 756 | ||||||
|
| |||||||
| 15,125 | ||||||||
|
| |||||||
Consumer Discretionary — 10.9% | ||||||||
Amazon.com Inc * | 2,917 | 4,783 | ||||||
Best Buy Co Inc | 1,325 | 91 | ||||||
Big Lots Inc | 20,616 | 650 | ||||||
Bloomin’ Brands Inc | 9,169 | 190 | ||||||
Booking Holdings Inc * | 197 | 334 | ||||||
Capri Holdings * | 1,346 | 61 | ||||||
Carnival Corp | 25,197 | 1,455 | ||||||
| Description | Shares | Market Value ($ Thousands) | ||||||
COMMON STOCK (continued) |
| |||||||
Cheesecake Factory Inc/The | 6,040 | $ | 286 | |||||
Chegg Inc * | 1,978 | 78 | ||||||
Cooper Tire & Rubber Co | 5,758 | 184 | ||||||
Crocs * | 1,848 | 47 | ||||||
Deckers Outdoor Corp * | 374 | 55 | ||||||
Delphi Automotive PLC * | 2,850 | 237 | ||||||
Denny’s * | 3,031 | 53 | ||||||
Dine Brands Global Inc | 512 | 51 | ||||||
Dollar General Corp | 17,928 | 2,124 | ||||||
Dollar Tree * | 4,269 | 411 | ||||||
Domino’s Pizza Inc | 247 | 62 | ||||||
DR Horton Inc | 17,492 | 680 | ||||||
Dunkin’ Brands Group | 777 | 56 | ||||||
eBay Inc | 10,309 | 383 | ||||||
El Pollo Loco Holdings Inc * | 3,085 | 47 | ||||||
Etsy Inc * | 1,701 | 121 | ||||||
Ford Motor | 6,427 | 56 | ||||||
frontdoor * | 1,962 | 63 | ||||||
Gap Inc/The | 2,620 | 67 | ||||||
Garmin | 814 | 68 | ||||||
General Motors Co | 46,347 | 1,830 | ||||||
Gentherm Inc * | 1,199 | 49 | ||||||
Goodyear Tire & Rubber Co/The | 3,742 | 74 | ||||||
Hilton Worldwide Holdings Inc | 3,041 | 253 | ||||||
Home Depot Inc/The | 5,374 | 995 | ||||||
Hyatt Hotels, Cl A | 774 | 56 | ||||||
K12 Inc * | 2,171 | 70 | ||||||
Kohl’s Corp | 839 | 57 | ||||||
Las Vegas Sands | 958 | 59 | ||||||
Lear | 411 | 63 | ||||||
Lowe’s Cos Inc | 21,948 | 2,307 | ||||||
Macy’s Inc | 1,472 | 37 | ||||||
Magna International Inc | 19,554 | 1,031 | ||||||
Marriott International Inc/MD, Cl A | 679 | 85 | ||||||
McDonald’s Corp | 1,953 | 359 | ||||||
Modine Manufacturing Co * | 26,416 | 397 | ||||||
Mohawk Industries Inc * | 4,755 | 647 | ||||||
Monro | 732 | 56 | ||||||
NIKE Inc, Cl B | 8,269 | 709 | ||||||
Nordstrom Inc | 1,516 | 72 | ||||||
Norwegian Cruise Line Holdings Ltd * | 11,298 | 627 | ||||||
O’Reilly Automotive * | 141 | 52 | ||||||
PulteGroup Inc | 18,091 | 488 | ||||||
Ross Stores Inc | 20,089 | 1,905 | ||||||
Royal Caribbean Cruises Ltd | 5,576 | 661 | ||||||
Skechers U.S.A. Inc, Cl A * | 19,788 | 666 | ||||||
Starbucks Corp | 5,909 | 415 | ||||||
Tesla Inc * | 364 | 116 | ||||||
TJX Cos Inc/The | 6,986 | 358 | ||||||
Tupperware Brands Corp | 13,524 | 407 | ||||||
Ulta Beauty Inc * | 235 | 73 | ||||||
Vail Resorts | 2,362 | 492 | ||||||
| 10 | SEI Catholic Values Trust / Annual Report / February 28, 2019 |
| Description | Shares | Market Value ($ Thousands) | ||||||
COMMON STOCK (continued) | ||||||||
VF Corp | 1,652 | $ | 144 | |||||
Williams-Sonoma Inc | 1,003 | 58 | ||||||
Wingstop Inc | 967 | 64 | ||||||
Wyndham Destinations Inc | 1,185 | 53 | ||||||
Wyndham Hotels & Resorts Inc | 1,185 | 62 | ||||||
YETI Holdings * | 2,157 | 52 | ||||||
Yum China Holdings Inc | 3,981 | 166 | ||||||
Yum! Brands | 560 | 53 | ||||||
|
| |||||||
| 28,811 | ||||||||
|
| |||||||
Consumer Staples — 5.5% | ||||||||
Altria Group Inc | 29,445 | 1,543 | ||||||
Andersons Inc/The | 3,336 | 123 | ||||||
Brown-Forman, Cl B | 1,103 | 55 | ||||||
Campbell Soup Co | 3,192 | 115 | ||||||
Clorox Co/The | 2,350 | 371 | ||||||
Coca-Cola Co/The | 17,527 | 795 | ||||||
Colgate-Palmolive Co | 7,862 | 518 | ||||||
Conagra Brands Inc | 45,979 | 1,075 | ||||||
Constellation Brands Inc, Cl A | 1,408 | 238 | ||||||
Costco Wholesale Corp | 1,572 | 344 | ||||||
Flowers Foods | 2,694 | 55 | ||||||
Freshpet Inc * | 1,565 | 65 | ||||||
Hain Celestial Group Inc/The * | 22,520 | 443 | ||||||
Hershey Co/The | 1,957 | 217 | ||||||
Hormel Foods | 1,199 | 52 | ||||||
Ingredion Inc | 2,181 | 202 | ||||||
JM Smucker Co/The | 16,891 | 1,789 | ||||||
Kellogg Co | 3,231 | 182 | ||||||
Keurig Dr Pepper Inc | 2,773 | 70 | ||||||
Kimberly-Clark Corp | 3,984 | 465 | ||||||
Kraft Heinz | 1,549 | 51 | ||||||
McCormick & Co Inc/MD | 941 | 128 | ||||||
Molson Coors Brewing Co, Cl B | 14,106 | 870 | ||||||
Mondelez International Inc, Cl A | 3,900 | 184 | ||||||
PepsiCo Inc | 7,764 | 898 | ||||||
Philip Morris International Inc | 24,389 | 2,120 | ||||||
Pilgrim’s Pride Corp * | 23,313 | 459 | ||||||
Simply Good Foods Co/The * | 2,945 | 60 | ||||||
Sprouts Farmers Market Inc * | 1,919 | 45 | ||||||
Sysco Corp | 3,544 | 239 | ||||||
TreeHouse Foods * | 838 | 51 | ||||||
Tyson Foods Inc, Cl A | 9,423 | 581 | ||||||
Walgreens Boots Alliance Inc | 1,906 | 136 | ||||||
|
| |||||||
| 14,539 | ||||||||
|
| |||||||
Energy — 4.2% | ||||||||
Anadarko Petroleum Corp | 1,282 | 56 | ||||||
Apache | 1,840 | 61 | ||||||
Apergy Corp * | 1,881 | 79 | ||||||
Baker Hughes a GE Co, Cl A | 1,514 | 40 | ||||||
Chevron Corp | 20,218 | 2,418 | ||||||
ConocoPhillips | 15,397 | 1,045 | ||||||
| Description | Shares | Market Value ($ Thousands) | ||||||
COMMON STOCK (continued) | ||||||||
Core Laboratories NV | 10,918 | $ | 708 | |||||
Devon Energy Corp | 22,050 | 651 | ||||||
EOG Resources | 556 | 52 | ||||||
Exxon Mobil Corp | 7,972 | 630 | ||||||
Gulfport Energy Corp * | 43,595 | 334 | ||||||
Helmerich & Payne Inc | 1,311 | 71 | ||||||
Hess Corp | 1,534 | 89 | ||||||
Kinder Morgan Inc/DE | 33,057 | 633 | ||||||
Marathon Petroleum | 850 | 53 | ||||||
Occidental Petroleum Corp | 24,833 | 1,643 | ||||||
Oceaneering International Inc * | 14,003 | 216 | ||||||
ONEOK | 921 | 59 | ||||||
PBF Energy Inc, Cl A | 4,622 | 144 | ||||||
Range Resources Corp | 25,749 | 276 | ||||||
Schlumberger Ltd | 40,131 | 1,768 | ||||||
|
| |||||||
| 11,026 | ||||||||
|
| |||||||
Financials — 11.4% | ||||||||
Aflac Inc | 51,075 | 2,510 | ||||||
Allstate | 539 | 51 | ||||||
American Equity Investment Life Holding Co | 21,170 | 670 | ||||||
American Express Co | 1,499 | 162 | ||||||
American International Group Inc | 1,158 | 50 | ||||||
Annaly Capital Management Inc ‡ | 4,860 | 49 | ||||||
Aon | 352 | 60 | ||||||
AXA Equitable Holdings Inc | 11,310 | 216 | ||||||
Bancorp Inc/The * | 10,795 | 98 | ||||||
Bank of America Corp | 67,106 | 1,951 | ||||||
Bank of New York Mellon Corp/The | 6,349 | 333 | ||||||
BankUnited Inc | 11,232 | 410 | ||||||
BB&T | 1,008 | 51 | ||||||
BlackRock, Cl A | 117 | 52 | ||||||
Blackstone Group LP/The (A) | 30,855 | 1,030 | ||||||
Capital One Financial | 657 | 55 | ||||||
Charles Schwab | 1,227 | 56 | ||||||
Chubb Ltd | 818 | 110 | ||||||
Citigroup Inc | 46,543 | 2,978 | ||||||
CME Group Inc, Cl A | 2,621 | 477 | ||||||
CNA Financial Corp | 4,132 | 179 | ||||||
CNO Financial Group Inc | 23,998 | 409 | ||||||
Cowen Inc, Cl A * | 13,454 | 208 | ||||||
Cullen/Frost Bankers Inc | 1,417 | 147 | ||||||
Discover Financial Services | 857 | 61 | ||||||
E*TRADE Financial Corp | 5,613 | 275 | ||||||
eHealth Inc * | 970 | 52 �� | ||||||
Everest Re Group Ltd | 3,800 | 859 | ||||||
First Commonwealth Financial Corp | 17,417 | 245 | ||||||
First Republic Bank/CA | 1,934 | 203 | ||||||
FNB Corp/PA | 24,890 | 305 | ||||||
Franklin Resources | 1,707 | 56 | ||||||
Great Western Bancorp Inc | 16,510 | 620 | ||||||
Hartford Financial Services Group | 2,328 | 115 | ||||||
Intercontinental Exchange | 675 | 52 | ||||||
SEI Catholic Values Trust / Annual Report / February 28, 2019 | 11 |
SCHEDULE OF INVESTMENTS
February 28, 2019
Catholic Values Equity Fund(Continued)
| Description | Shares | Market Value ($ Thousands) | ||||||
COMMON STOCK (continued) | ||||||||
Invesco Ltd | 29,256 | $ | 566 | |||||
JPMorgan Chase & Co | 21,897 | 2,285 | ||||||
KeyCorp | 3,317 | 59 | ||||||
KKR & Co Inc, Cl A | 60,804 | 1,352 | ||||||
Legg Mason Inc | 1,747 | 51 | ||||||
Lincoln National | 983 | 61 | ||||||
Marsh & McLennan Cos Inc | 24,009 | 2,233 | ||||||
MetLife Inc | 4,026 | 182 | ||||||
Moody’s Corp | 599 | 104 | ||||||
Morgan Stanley | 2,504 | 105 | ||||||
Morningstar Inc | 695 | 88 | ||||||
MSCI, Cl A | 353 | 65 | ||||||
National General Holdings Corp | 22,522 | 581 | ||||||
Northern Trust Corp | 2,684 | 250 | ||||||
PNC Financial Services Group Inc/The | 1,879 | 237 | ||||||
Principal Financial Group | 1,152 | 61 | ||||||
Progressive | 15,086 | 1,100 | ||||||
Prudential Financial Inc | 3,895 | 373 | ||||||
Regions Financial Corp | 6,455 | 106 | ||||||
S&P Global Inc | 5,452 | 1,092 | ||||||
Santander Consumer USA Holdings Inc | 4,402 | 90 | ||||||
SLM Corp | 33,402 | 369 | ||||||
State Street Corp | 30,393 | 2,184 | ||||||
Synchrony Financial | 2,528 | 82 | ||||||
T Rowe Price Group Inc | 1,349 | 136 | ||||||
Travelers | 433 | 58 | ||||||
Umpqua Holdings Corp | 19,773 | 360 | ||||||
US Bancorp | 2,210 | 114 | ||||||
Voya Financial Inc | 1,088 | 55 | ||||||
Wells Fargo & Co | 9,842 | 491 | ||||||
Zions Bancorp | 1,209 | 62 | ||||||
|
|
| ||||||
| 30,107 | ||||||||
|
|
| ||||||
Health Care — 12.0% | ||||||||
Abbott Laboratories | 52,730 | 4,093 | ||||||
Agios Pharmaceuticals Inc * | 2,251 | 146 | ||||||
Alexion Pharmaceuticals Inc * | 2,316 | 313 | ||||||
Align Technology Inc * | 368 | 95 | ||||||
Alkermes PLC * | 2,924 | 97 | ||||||
Alnylam Pharmaceuticals Inc * | 2,139 | 182 | ||||||
Amedisys Inc * | 806 | 100 | ||||||
Amphastar Pharmaceuticals * | 26,904 | 669 | ||||||
Anthem Inc | 1,653 | 497 | ||||||
Array BioPharma * | 6,977 | 160 | ||||||
Axsome Therapeutics * | 18,346 | 146 | ||||||
Baxter International Inc | 10,461 | 782 | ||||||
BioCryst Pharmaceuticals Inc * | 17,883 | 148 | ||||||
BioDelivery Sciences International * | 39,482 | 192 | ||||||
BioMarin Pharmaceutical Inc * | 5,008 | 467 | ||||||
BioTelemetry Inc * | 1,226 | 92 | ||||||
Bluebird Bio Inc * | 829 | 129 | ||||||
Boston Scientific Corp * | 38,711 | 1,553 | ||||||
Bruker Corp | 17,211 | 658 | ||||||
| Description | Shares | Market Value ($ Thousands) | ||||||
COMMON STOCK (continued) | ||||||||
Cantel Medical | 702 | $ | 52 | |||||
Cardinal Health Inc | 1,388 | 75 | ||||||
Centene Corp * | 5,186 | 316 | ||||||
Cerner * | 987 | 55 | ||||||
Cigna | 4,506 | 786 | ||||||
Codexis * | 9,449 | 204 | ||||||
Covetrus * | 987 | 35 | ||||||
CVS Health Corp | 45,481 | 2,630 | ||||||
DaVita Inc * | 1,288 | 73 | ||||||
DENTSPLY SIRONA Inc | 1,719 | 72 | ||||||
DexCom * | 1,924 | 268 | ||||||
Edwards Lifesciences Corp * | 1,725 | 292 | ||||||
Elanco Animal Health * | 28,370 | 858 | ||||||
Encompass Health Corp | 831 | 52 | ||||||
Ensign Group Inc/The | 1,109 | 55 | ||||||
Evolus * | 4,963 | 131 | ||||||
Exact Sciences Corp * | 856 | 78 | ||||||
Exelixis Inc * | 5,971 | 134 | ||||||
Genomic Health Inc * | 2,730 | 207 | ||||||
Guardant Health * | 1,537 | 102 | ||||||
Henry Schein Inc * | 2,467 | 146 | ||||||
Hill-Rom Holdings Inc | 1,390 | 147 | ||||||
HMS Holdings Corp * | 1,337 | 46 | ||||||
Hologic * | 1,306 | 62 | ||||||
Horizon Pharma PLC * | 35,063 | 1,017 | ||||||
Humana Inc | 723 | 206 | ||||||
ICU Medical Inc * | 171 | 42 | ||||||
IDEXX Laboratories Inc * | 489 | 103 | ||||||
Incyte Corp * | 2,587 | 223 | ||||||
Inspire Medical Systems Inc * | 1,883 | 117 | ||||||
Insulet Corp * | 584 | 55 | ||||||
Integer Holdings Corp * | 774 | 70 | ||||||
Integra LifeSciences Holdings * | 1,163 | 64 | ||||||
Intuitive Surgical Inc * | 786 | 430 | ||||||
Invitae * | 5,040 | 101 | ||||||
Ionis Pharmaceuticals Inc * | 1,893 | 134 | ||||||
IQVIA Holdings Inc * | 6,352 | 890 | ||||||
iRhythm Technologies Inc * | 788 | 76 | ||||||
Laboratory Corp of America Holdings * | 513 | 76 | ||||||
LHC Group Inc * | 1,502 | 165 | ||||||
Magellan Health Inc * | 6,992 | 476 | ||||||
Masimo * | 874 | 115 | ||||||
McKesson Corp | 998 | 127 | ||||||
Mettler-Toledo International Inc * | 1,367 | 931 | ||||||
Molina Healthcare Inc * | 616 | 83 | ||||||
NanoString Technologies * | 8,673 | 221 | ||||||
Nektar Therapeutics, Cl A * | 3,301 | 134 | ||||||
NeoGenomics Inc * | 13,163 | 258 | ||||||
Neurocrine Biosciences Inc * | 1,611 | 124 | ||||||
Novocure Ltd * | 1,011 | 54 | ||||||
Omnicell Inc * | 681 | 58 | ||||||
Penumbra Inc * | 579 | 77 | ||||||
| 12 | SEI Catholic Values Trust / Annual Report / February 28, 2019 |
| Description | Shares | Market Value ($ Thousands) | ||||||
COMMON STOCK (continued) | ||||||||
PRA Health Sciences Inc * | 6,916 | $ | 740 | |||||
Premier Inc, Cl A * | 1,272 | 47 | ||||||
Quest Diagnostics Inc | 2,735 | 237 | ||||||
Ra Pharmaceuticals * | 4,519 | 87 | ||||||
Reata Pharmaceuticals Inc, Cl A * | 2,195 | 207 | ||||||
ResMed Inc | 3,431 | 351 | ||||||
Sage Therapeutics Inc * | 901 | 144 | ||||||
Sarepta Therapeutics Inc * | 3,380 | 488 | ||||||
Seattle Genetics Inc * | 1,982 | 147 | ||||||
Stryker Corp | 2,405 | 453 | ||||||
Tactile Systems Technology Inc * | 1,081 | 82 | ||||||
Tandem Diabetes Care Inc * | 1,299 | 85 | ||||||
Teleflex Inc | 473 | 137 | ||||||
Tivity Health * | 2,705 | 58 | ||||||
United Therapeutics Corp * | 2,109 | 266 | ||||||
Varian Medical Systems Inc * | 2,254 | 303 | ||||||
Veracyte Inc * | 9,024 | 182 | ||||||
Vericel Corp * | 6,520 | 122 | ||||||
Vertex Pharmaceuticals Inc * | 5,680 | 1,072 | ||||||
Waters Corp * | 3,406 | 825 | ||||||
WellCare Health Plans Inc * | 480 | 122 | ||||||
West Pharmaceutical Services Inc | 999 | 105 | ||||||
Wright Medical Group * | 2,568 | 80 | ||||||
Zimmer Biomet Holdings Inc | 4,403 | 547 | ||||||
Zoetis Inc, Cl A | 10,412 | 981 | ||||||
|
| |||||||
| 31,690 | ||||||||
|
| |||||||
Industrials — 6.6% | ||||||||
3M Co | 9,547 | 1,980 | ||||||
ACCO Brands Corp | 15,434 | 144 | ||||||
AGCO Corp | 1,432 | 97 | ||||||
Alaska Air Group | 775 | 48 | ||||||
American Airlines Group Inc | 28,082 | 1,001 | ||||||
American Superconductor * | 4,204 | 62 | ||||||
Apogee Enterprises Inc | 13,968 | 499 | ||||||
Arcosa Inc | 1,758 | 59 | ||||||
ASGN Inc * | 1,076 | 69 | ||||||
Astec Industries | 1,554 | 59 | ||||||
Atlas Air Worldwide Holdings Inc * | 10,269 | 552 | ||||||
Casella Waste Systems, Cl A * | 1,827 | 64 | ||||||
Caterpillar Inc | 1,301 | 179 | ||||||
Cintas | 5,974 | 1,234 | ||||||
Clean Harbors Inc * | 1,128 | 77 | ||||||
CoStar Group Inc * | 374 | 171 | ||||||
CSX Corp | 1,508 | 110 | ||||||
Cummins Inc | 1,667 | 257 | ||||||
Deere & Co | 1,422 | 233 | ||||||
Delta Air Lines Inc | 16,527 | 819 | ||||||
Dover Corp | 1,366 | 124 | ||||||
Eaton Corp PLC | 8,261 | 659 | ||||||
Emerson Electric | 856 | 58 | ||||||
Equifax Inc | 476 | 52 | ||||||
FedEx Corp | 1,376 | 249 | ||||||
| Description | Shares | Market Value ($ Thousands) | ||||||
COMMON STOCK (continued) | ||||||||
Flowserve Corp | 1,306 | $ | 58 | |||||
Hexcel | 889 | 64 | ||||||
IHS Markit * | 1,072 | 57 | ||||||
Illinois Tool Works Inc | 15,407 | 2,220 | ||||||
Ingersoll-Rand PLC | 3,308 | 349 | ||||||
Johnson Controls International PLC | 8,766 | 309 | ||||||
Kratos Defense & Security Solutions Inc * | 3,613 | 62 | ||||||
LB Foster Co, Cl A * | 3,821 | 66 | ||||||
Lydall Inc * | 6,735 | 190 | ||||||
Macquarie Infrastructure Corp | 1,159 | 47 | ||||||
ManpowerGroup Inc | 1,548 | 130 | ||||||
Masco | 1,719 | 65 | ||||||
MSC Industrial Direct, Cl A | 598 | 51 | ||||||
Nielsen Holdings PLC | 2,443 | 64 | ||||||
Oshkosh Corp | 837 | 65 | ||||||
Owens Corning | 2,456 | 123 | ||||||
PACCAR | 771 | 52 | ||||||
Parker-Hannifin Corp | 356 | 63 | ||||||
Pentair | 1,364 | 58 | ||||||
Regal Beloit | 733 | 61 | ||||||
Republic Services, Cl A | 700 | 55 | ||||||
Resideo Technologies * | 2,553 | 66 | ||||||
REV Group Inc | 18,346 | 162 | ||||||
Rockwell Automation Inc | 1,053 | 188 | ||||||
Roper Technologies Inc | 173 | 56 | ||||||
Sensata Technologies Holding * | 1,149 | 58 | ||||||
Southwest Airlines Co | 1,122 | 63 | ||||||
Spirit AeroSystems Holdings Inc, Cl A | 1,276 | 126 | ||||||
Stanley Black & Decker Inc | 440 | 58 | ||||||
Trinity Industries Inc | 4,400 | 103 | ||||||
Union Pacific Corp | 4,716 | 791 | ||||||
United Continental Holdings Inc * | 1,139 | 100 | ||||||
United Parcel Service Inc, Cl B | 1,392 | 153 | ||||||
United Rentals * | 402 | 54 | ||||||
Univar Inc * | 2,330 | 53 | ||||||
USG * | 1,179 | 51 | ||||||
Verisk Analytics, Cl A | 474 | 60 | ||||||
Waste Management Inc | 2,437 | 247 | ||||||
WESCO International Inc * | 1,999 | 109 | ||||||
WW Grainger Inc | 5,535 | 1,687 | ||||||
Xylem Inc/NY | 4,064 | 307 | ||||||
|
| |||||||
| 17,557 | ||||||||
|
| |||||||
Information Technology — 12.4% | ||||||||
Accenture PLC, Cl A | 4,534 | 732 | ||||||
Adobe Inc * | 8,497 | 2,230 | ||||||
Advanced Micro Devices * | 2,933 | 69 | ||||||
Analog Devices Inc | 1,648 | 176 | ||||||
Apple Inc | 13,924 | 2,411 | ||||||
Applied Materials Inc | 1,271 | 49 | ||||||
ARRIS International * | 1,652 | 52 | ||||||
Autodesk Inc * | 1,468 | 239 | ||||||
Automatic Data Processing Inc | 10,516 | 1,609 | ||||||
SEI Catholic Values Trust / Annual Report / February 28, 2019 | 13 |
SCHEDULE OF INVESTMENTS
February 28, 2019
Catholic Values Equity Fund (Continued)
| Description | Shares | Market Value ($ Thousands) | ||||||
COMMON STOCK (continued) | ||||||||
Avalara * | 5,654 | $ | 295 | |||||
Broadcom Inc | 2,967 | 817 | ||||||
Cisco Systems Inc | 32,853 | 1,701 | ||||||
Cognizant Technology Solutions Corp, Cl A | 621 | 44 | ||||||
Dell Technologies, Cl C * | 1,116 | 62 | ||||||
DXC Technology Co | 691 | 46 | ||||||
First Data Corp, Cl A * | 4,094 | 103 | ||||||
Global Payments | 5,189 | 677 | ||||||
Hewlett Packard Enterprise Co | 9,157 | 150 | ||||||
HP Inc | 18,466 | 364 | ||||||
Intel Corp | 14,089 | 746 | ||||||
Intuit Inc | 2,780 | 687 | ||||||
IPG Photonics Corp * | 2,873 | 445 | ||||||
Keysight Technologies Inc * | 1,487 | 126 | ||||||
Lam Research Corp | 3,954 | 696 | ||||||
Mastercard Inc, Cl A | 4,715 | 1,060 | ||||||
Microchip Technology Inc | 15,904 | 1,382 | ||||||
Micron Technology Inc * | 16,901 | 691 | ||||||
Microsoft Corp | 49,617 | 5,559 | ||||||
MongoDB Inc, Cl A * | 576 | 59 | ||||||
NCR Corp * | 6,852 | 192 | ||||||
NetApp Inc | 980 | 64 | ||||||
NVIDIA Corp | 3,924 | 605 | ||||||
Oracle Corp | 11,105 | 579 | ||||||
PayPal Holdings Inc * | 9,233 | 906 | ||||||
QUALCOMM Inc | 2,930 | 156 | ||||||
Red Hat * | 1,961 | 358 | ||||||
salesforce.com Inc * | 11,235 | 1,839 | ||||||
ServiceNow Inc * | 572 | 137 | ||||||
Super Micro Computer Inc * | 40,238 | 769 | ||||||
Symantec Corp | 3,404 | 77 | ||||||
Teradata * | 1,351 | 65 | ||||||
Texas Instruments Inc | 4,365 | 462 | ||||||
Visa Inc, Cl A | 18,378 | 2,722 | ||||||
VMware, Cl A * | 382 | 66 | ||||||
Workday Inc, Cl A * | 795 | 157 | ||||||
Worldpay, Cl A * | 2,133 | 204 | ||||||
Xilinx | 598 | 75 | ||||||
Zscaler * | 1,271 | 63 | ||||||
|
| |||||||
| 32,773 | ||||||||
|
| |||||||
Materials — 2.9% | ||||||||
Air Products & Chemicals Inc | 2,798 | 507 | ||||||
AptarGroup | 687 | 70 | ||||||
Avery Dennison Corp | 1,234 | 133 | ||||||
B2Gold Corp * | 19,608 | 62 | ||||||
Ball Corp | 5,536 | 303 | ||||||
Berry Global Group * | 1,067 | 56 | ||||||
Cabot Corp | 883 | 41 | ||||||
Century Aluminum Co * | 9,125 | 79 | ||||||
Commercial Metals Co | 15,526 | 257 | ||||||
Crown Holdings Inc * | 12,110 | 657 | ||||||
Domtar | 1,435 | 73 | ||||||
| Description | Shares | Market Value ($ Thousands) | ||||||
COMMON STOCK (continued) | ||||||||
DowDuPont Inc | 17,471 | $ | 930 | |||||
Eastman Chemical Co | 6,389 | 528 | ||||||
Ecolab Inc | 466 | 79 | ||||||
FMC Corp | 1,027 | 92 | ||||||
Freeport-McMoRan Inc | 33,241 | 429 | ||||||
Huntsman | 13,246 | 328 | ||||||
International Flavors & Fragrances Inc | 1,080 | 138 | ||||||
International Paper | 1,238 | 57 | ||||||
Linde PLC | 3,645 | 631 | ||||||
LyondellBasell Industries, Cl A | 607 | 52 | ||||||
Newmont Mining Corp | 2,829 | 97 | ||||||
Owens-Illinois Inc | 27,394 | 546 | ||||||
PPG Industries | 510 | 57 | ||||||
Sherwin-Williams Co/The | 1,001 | 434 | ||||||
Sonoco Products Co | 4,357 | 252 | ||||||
United States Steel Corp | 15,292 | 343 | ||||||
Venator Materials PLC * | 17,393 | 102 | ||||||
Vulcan Materials Co | 2,713 | 302 | ||||||
|
| |||||||
| 7,635 | ||||||||
|
| |||||||
Real Estate — 1.0% | ||||||||
American Campus Communities Inc ‡ | 2,372 | 107 | ||||||
American Tower ‡ | 611 | 108 | ||||||
Americold Realty Trust ‡ | 1,994 | 57 | ||||||
AvalonBay Communities Inc ‡ | 909 | 177 | ||||||
Brandywine Realty Trust ‡ | 3,873 | 61 | ||||||
CBRE Group, Cl A * | 1,320 | 66 | ||||||
Corporate Office Properties Trust ‡ | 2,505 | 65 | ||||||
Crown Castle International ‡ | 2,095 | 249 | ||||||
Equinix ‡ | 145 | 61 | ||||||
Equity Residential ‡ | 780 | 58 | ||||||
HCP ‡ | 1,868 | 58 | ||||||
Host Hotels & Resorts Inc ‡ | 11,361 | 223 | ||||||
Iron Mountain ‡ | 1,533 | 54 | ||||||
Jones Lang LaSalle | 410 | 68 | ||||||
Kilroy Realty ‡ | 811 | 60 | ||||||
Prologis Inc ‡ | 8,506 | 596 | ||||||
Public Storage ‡ | 252 | 53 | ||||||
Retail Value ‡ | 1,931 | 60 | ||||||
Simon Property Group ‡ | 279 | 51 | ||||||
Ventas Inc ‡ | 1,890 | 119 | ||||||
VEREIT Inc ‡ | 6,295 | 50 | ||||||
Welltower Inc ‡ | 1,829 | 136 | ||||||
Weyerhaeuser Co ‡ | 7,943 | 198 | ||||||
|
| |||||||
| 2,735 | ||||||||
|
| |||||||
Utilities — 1.0% | ||||||||
Ameren | 786 | 56 | ||||||
American Electric Power Co Inc | 675 | 55 | ||||||
American Water Works Co Inc | 950 | 97 | ||||||
CMS Energy Corp | 7,687 | 418 | ||||||
Consolidated Edison | 664 | 55 | ||||||
Dominion Energy | 694 | 51 | ||||||
| 14 | SEI Catholic Values Trust / Annual Report / February 28, 2019 |
| Description | Shares | Market Value ($ Thousands) | ||||||
COMMON STOCK (continued) | ||||||||
DTE Energy Co | 4,961 | $ | 613 | |||||
Duke Energy Corp | 1,264 | 113 | ||||||
Entergy | 595 | 56 | ||||||
Eversource Energy | 2,451 | 171 | ||||||
Exelon Corp | 3,510 | 171 | ||||||
NextEra Energy Inc | 862 | 162 | ||||||
NiSource | 2,008 | 54 | ||||||
Pinnacle West Capital | 590 | 55 | ||||||
Public Service Enterprise Group Inc | 939 | 55 | ||||||
Sempra Energy | 466 | 56 | ||||||
Southern | 1,127 | 56 | ||||||
WEC Energy Group | 737 | 56 | ||||||
Xcel Energy Inc | 6,735 | 370 | ||||||
|
| |||||||
| 2,720 | ||||||||
|
| |||||||
Total Common Stock (Cost $162,233) ($ Thousands) | 194,718 | |||||||
|
| |||||||
FOREIGN COMMON STOCK — 23.0% | ||||||||
Australia — 0.5% | ||||||||
BHP Billiton Ltd ADR | 22,006 | 1,164 | ||||||
South32 Ltd ADR | 7,863 | 110 | ||||||
|
| |||||||
| 1,274 | ||||||||
|
| |||||||
Austria — 0.9% | ||||||||
Erste Group Bank AG | 26,888 | 1,018 | ||||||
Schoeller-Bleckmann Oilfield Equipment AG | 8,357 | 648 | ||||||
voestalpine AG | 19,515 | 605 | ||||||
|
| |||||||
| 2,271 | ||||||||
|
| |||||||
Brazil — 0.8% | ||||||||
Banco Bradesco SA ADR * | 105,711 | 1,214 | ||||||
JBS SA | 231,300 | 834 | ||||||
|
| |||||||
| 2,048 | ||||||||
|
| |||||||
Canada — 1.2% | ||||||||
Canadian Natural Resources Ltd | 60,895 | 1,730 | ||||||
Magna International Inc | 17,257 | 910 | ||||||
Rogers Communications Inc, Cl B | 9,788 | 541 | ||||||
|
| |||||||
| 3,181 | ||||||||
|
| |||||||
Chile — 0.1% | ||||||||
Sociedad Quimica y Minera de Chile SA ADR | 5,090 | 210 | ||||||
|
| |||||||
China — 1.3% | ||||||||
Alibaba Group Holding ADR * | 8,215 | 1,504 | ||||||
Anhui Conch Cement Co Ltd, Cl H | 176,500 | 1,009 | ||||||
Baidu Inc ADR * | 2,280 | 371 | ||||||
BYD Co Ltd, Cl H | 102,000 | 652 | ||||||
|
| |||||||
| 3,536 | ||||||||
|
| |||||||
Colombia — 0.4% | ||||||||
Bancolombia SA ADR | 21,447 | 1,037 | ||||||
|
| |||||||
| Description | Shares | Market Value ($ Thousands) | ||||||
FOREIGN COMMON STOCK (continued) | ||||||||
Czech Republic — 0.2% | ||||||||
Komercni banka as | 14,103 | $ | 593 | |||||
|
| |||||||
France — 1.3% | ||||||||
BNP Paribas SA ADR | 26,408 | 676 | ||||||
Capgemini SE | 8,918 | 1,068 | ||||||
Societe Generale SA | 23,306 | 717 | ||||||
Sodexo SA | 9,550 | 1,050 | ||||||
|
| |||||||
| 3,511 | ||||||||
|
| |||||||
Germany — 0.9% | ||||||||
BASF SE | 10,397 | 793 | ||||||
Continental AG | 5,814 | 953 | ||||||
Vonovia SE | 10,209 | 496 | ||||||
|
| |||||||
| 2,242 | ||||||||
|
| |||||||
Hong Kong — 0.6% | ||||||||
China Life Insurance Co Ltd, Cl H | 362,000 | 996 | ||||||
Sinopharm Group Co Ltd, Cl H | 135,200 | 601 | ||||||
|
| |||||||
| 1,597 | ||||||||
|
| |||||||
India — 0.7% | ||||||||
HDFC Bank Ltd ADR | 9,560 | 967 | ||||||
ICICI Bank Ltd ADR | 87,214 | 860 | ||||||
|
| |||||||
| 1,827 | ||||||||
|
| |||||||
Indonesia — 0.1% | ||||||||
Indofood Sukses Makmur Tbk PT | 714,400 | 359 | ||||||
|
| |||||||
Ireland — 2.1% | ||||||||
AerCap Holdings NV * | 12,168 | 549 | ||||||
ICON PLC * | 19,399 | 2,716 | ||||||
Jazz Pharmaceuticals PLC * | 9,239 | 1,294 | ||||||
Medtronic PLC | 11,308 | �� | 1,023 | |||||
|
| |||||||
| 5,582 | ||||||||
|
| |||||||
Israel — 0.4% | ||||||||
Check Point Software Technologies Ltd * | 8,759 | 1,071 | ||||||
|
| |||||||
Italy — 0.3% | ||||||||
Prysmian SpA | 36,774 | 752 | ||||||
|
| |||||||
Japan — 1.6% | ||||||||
Denso Corp | 31,000 | 1,332 | ||||||
Hitachi Ltd | 31,000 | 929 | ||||||
SoftBank Group Corp | 10,600 | 979 | ||||||
Toray Industries Inc | 146,500 | 1,020 | ||||||
|
| |||||||
| 4,260 | ||||||||
|
| |||||||
Mexico — 0.3% | ||||||||
Grupo Financiero Banorte SAB de CV, Cl O | 140,300 | 764 | ||||||
|
| |||||||
Netherlands — 2.3% | ||||||||
Heineken NV | 12,527 | 1,264 | ||||||
NXP Semiconductors NV | 662 | 60 | ||||||
QIAGEN NV * | 21,754 | 836 | ||||||
RELX PLC | 51,732 | 1,189 | ||||||
Royal Dutch Shell PLC, Cl A | 26,915 | 841 | ||||||
SEI Catholic Values Trust / Annual Report / February 28, 2019 | 15 |
SCHEDULE OF INVESTMENTS
February 28, 2019
Catholic Values Equity Fund (Concluded)
| Description | Shares | Market Value ($ Thousands) | ||||||
FOREIGN COMMON STOCK (continued) | ||||||||
Royal Dutch Shell PLC ADR, Cl A | 32,241 | $ | 2,006 | |||||
|
|
| ||||||
| 6,196 | ||||||||
|
|
| ||||||
Norway — 1.4% | ||||||||
DNB ASA | 98,006 | 1,881 | ||||||
Equinor ASA ADR | 79,086 | 1,776 | ||||||
|
|
| ||||||
| 3,657 | ||||||||
|
|
| ||||||
Puerto Rico — 0.1% | ||||||||
OFG Bancorp | 8,910 | 184 | ||||||
Popular | 1,050 | 59 | ||||||
|
|
| ||||||
| 243 | ||||||||
|
|
| ||||||
Singapore — 0.4% | ||||||||
DBS Group Holdings Ltd | 64,300 | 1,182 | ||||||
|
|
| ||||||
South Korea — 0.4% | ||||||||
Samsung Electronics Co Ltd | 26,925 | 1,080 | ||||||
|
|
| ||||||
Spain — 0.7% | ||||||||
Amadeus IT Group SA, Cl A | 23,403 | 1,764 | ||||||
|
|
| ||||||
Switzerland — 0.5% | ||||||||
Credit Suisse Group AG ADR | 113,222 | 1,394 | ||||||
|
|
| ||||||
Taiwan — 1.1% | ||||||||
ASE Technology Holding Co Ltd | 310,700 | 635 | ||||||
Hon Hai Precision Industry Co Ltd | 312,960 | 739 | ||||||
| Description | Shares | Market Value ($ Thousands) | ||||||
FOREIGN COMMON STOCK (continued) | ||||||||
Taiwan Semiconductor Manufacturing Co Ltd | 201,000 | $ | 1,561 | |||||
|
|
| ||||||
| 2,935 | ||||||||
|
|
| ||||||
United Kingdom — 2.4% | ||||||||
Barclays PLC | 371,460 | 811 | ||||||
BP PLC ADR | 37,662 | 1,606 | ||||||
Diageo PLC | 35,712 | 1,384 | ||||||
HSBC Holdings PLC | 109,220 | 890 | ||||||
ITV PLC | 259,567 | 453 | ||||||
Rio Tinto PLC ADR | 19,393 | 1,129 | ||||||
STERIS PLC | 1,076 | 130 | ||||||
|
|
| ||||||
| 6,403 | ||||||||
|
|
| ||||||
Total Foreign Common Stock | 60,969 | |||||||
|
|
| ||||||
CASH EQUIVALENT — 2.0% | ||||||||
SEI Daily Income Trust, Government Fund, Cl F 2.230%**† | 5,352,043 | 5,352 | ||||||
|
|
| ||||||
Total Cash Equivalent | 5,352 | |||||||
|
|
| ||||||
Total Investments in Securities — 98.6% | $ | 261,039 | ||||||
|
|
| ||||||
A list of the open futures contracts held by the Fund at February, 2019, is as follows:
Type of Contract | Number of Contracts Long | Expiration Date | Notional Amount (Thousands) | Value (Thousands) | Unrealized Appreciation (Thousands) | |||||||||||||||
Russell 2000 IndexE-MINI | 9 | Mar-2019 | $ | 623 | $ | 709 | $ | 86 | ||||||||||||
S&P 500 IndexE-MINI | 35 | Mar-2019 | 4,389 | 4,873 | 484 | |||||||||||||||
|
|
|
|
|
| |||||||||||||||
| $ | 5,012 | $ | 5,582 | $ | 570 | |||||||||||||||
|
|
|
|
|
| |||||||||||||||
For the year-ended February 28, 2019, the total amount of futures contracts, as presented in the table above, are representative of the volume of activity for this derivative type during the year.
Percentages are based on Net Assets of $264,756 ($ Thousands). |
| * | Non-income producing security. |
| ** | Rate shown is the7-day effective yield as of February 28, 2019. |
| † | Investment in Affiliated Security (see Note 5). |
| ‡ | Real Estate Investment Trust. |
| (A) | Security is a Master Limited Partnership. At February 28, 2019, such securities amounted to $1,030 ($ Thousands), or 0.4% of the Net Assets of the Fund (See Note 2). |
| ADR — American | Depositary Receipt |
| Cl — Class |
LP — Limited Partnership
PLC — Public Limited Company
S&P — Standard & Poor’s
As of February 28, 2019, all of the Fund’s investments and other financial instruments were considered Level 1, in accordance with the authoritative guidance on fair value measurements and disclosure under U.S. GAAP.
For the year ended February 28, 2019, there were no transfers between Level 1 and Level 2 assets and liabilities. For the year ended February 28, 2019, there were no transfers between Level 2 and Level 3 assets and liabilities. For the year ended February 28, 2019, there were no Level 3 securities.
The following is a summary of the Fund’s transactions with affiliates for the year ended February 28, 2019 ($ Thousands):
| Security Description | Value 2/28/2018 | Purchases at Cost | Proceeds from Sales | Value 2/28/2019 | Dividend Income | |||||||||||||||
SEI Daily Income Trust, Government Fund, Cl F | $5,748 | $43,975 | $(44,371) | $5,352 | $139 | |||||||||||||||
|
|
|
|
|
|
|
|
|
| |||||||||||
The accompanying notes are an integral part of the financial statements.
| 16 | SEI Catholic Values Trust / Annual Report / February 28, 2019 |
SCHEDULE OF INVESTMENTS
February 28, 2019
Catholic Values Fixed Income Fund
| Sector Weightings (Unaudited)†: |
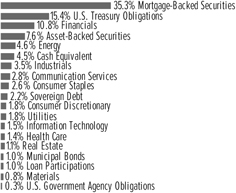
†Percentages based on total investments.
| Description | Face Amount (Thousands) | Market Value ($ Thousands) | ||||||
MORTGAGE-BACKED SECURITIES — 37.1% |
| |||||||
Agency Mortgage-Backed Obligations — 28.1% |
| |||||||
FHLMC | ||||||||
6.000%, 03/01/2035 | $ | 388 | $ | 429 | ||||
5.500%, 04/01/2030 | 254 | 270 | ||||||
5.000%, 06/01/2041 to 01/01/2049 | 620 | 658 | ||||||
4.500%, 06/01/2038 to 07/01/2047 | 1,024 | 1,071 | ||||||
4.000%, 07/01/2037 to 11/01/2048 | 3,043 | 3,116 | ||||||
3.500%, 03/01/2043 to 03/01/2045 | 492 | 495 | ||||||
3.000%, 09/01/2036 to 09/01/2047 | 3,965 | 3,894 | ||||||
FHLMC CMO, Ser 2012-4057, Cl CS, IO | ||||||||
3.561%, VAR LIBOR USD | 25 | 2 | ||||||
FHLMC CMO,Ser 2014-328, Cl S4, IO | ||||||||
1.588%, 02/15/2038 (A) | 63 | 4 | ||||||
FHLMC CMO, Ser 2014-4415, Cl IO, IO | ||||||||
1.457%, 04/15/2041 (A) | 342 | 17 | ||||||
FHLMC CMO, Ser 2015-4494, Cl AI, IO | ||||||||
1.512%, 11/15/2038 (A) | 331 | 16 | ||||||
FHLMC CMO, Ser 2018-4813, Cl CJ | ||||||||
3.000%, 08/15/2048 | 188 | 183 | ||||||
FHLMC TBA | ||||||||
3.500%, 03/15/2045 | 200 | 200 | ||||||
3.000%, 03/15/2045 | 100 | 98 | ||||||
FNMA | ||||||||
5.000%, 10/01/2033 to 11/01/2048 | 3,242 | 3,459 | ||||||
4.500%, 07/01/2033 to 09/01/2057 | 2,055 | 2,139 | ||||||
4.000%, 04/01/2036 to 06/01/2057 | 3,775 | 3,877 | ||||||
3.525%, 02/01/2029 | 300 | 306 | ||||||
3.500%, 10/01/2037 to 03/01/2057 | 3,529 | 3,556 | ||||||
3.000%, 12/01/2037 to 04/01/2047 | 2,229 | 2,185 | ||||||
2.810%, 04/01/2025 | 40 | 40 | ||||||
FNMA CMO,Ser 2015-55, Cl IO, IO | ||||||||
1.353%, 08/25/2055 (A) | 261 | 13 | ||||||
| Description | Face Amount (Thousands) | Market Value ($ Thousands) | ||||||
MORTGAGE-BACKED SECURITIES (continued) |
| |||||||
FNMA CMO,Ser 2015-56, Cl AS, IO | ||||||||
3.660%, VAR LIBOR USD 1 Month+6.150%, 08/25/2045 | $ | 270 | $ | 53 | ||||
FNMA TBA | ||||||||
5.000%, 03/15/2045 | 100 | 105 | ||||||
3.500%, 03/15/2030 to 03/15/2045 | 4,850 | 4,885 | ||||||
3.000%, 03/15/2045 | 250 | 244 | ||||||
FNMA, Ser M1, Cl A2 | ||||||||
3.550%, 09/25/2028 (A) | 190 | 194 | ||||||
GNMA | ||||||||
5.000%, 08/20/2048 to 01/20/2049 | 844 | 882 | ||||||
4.500%, 01/15/2042 to 01/20/2049 | 2,944 | 3,067 | ||||||
4.000%, 08/15/2045 to 08/20/2047 | 763 | 787 | ||||||
3.500%, 01/20/2047 to 10/20/2047 | 360 | 364 | ||||||
3.000%, 01/20/2047 to 04/20/2048 | 1,662 | 1,642 | ||||||
GNMA CMO,Ser 2007-51, Cl SG, IO | ||||||||
Month+6.580%, 08/20/2037 | 14 | 2 | ||||||
GNMA CMO,Ser 2012-34, Cl SA, IO | ||||||||
3.565%, VAR LIBOR USD 1 Month+6.050%, 03/20/2042 | 159 | 22 | ||||||
GNMA CMO,Ser 2012-43, Cl SN, IO | ||||||||
4.119%, VAR LIBOR USD 1 Month+6.600%, 04/16/2042 | 136 | 27 | ||||||
GNMA CMO,Ser 2012-H27, Cl AI, IO | ||||||||
1.733%, VAR ICE LIBOR USD 1 Month+0.000%, 10/20/2062 | 106 | 5 | ||||||
GNMA CMO,Ser 2014-118, Cl HS, IO | ||||||||
3.715%, VAR LIBOR USD 1 Month+6.200%, 08/20/2044 | 287 | 51 | ||||||
GNMA TBA | ||||||||
4.500%, 03/15/2045 | 680 | 704 | ||||||
4.000%, 03/15/2045 | 300 | 308 | ||||||
3.500%, 03/15/2045 | 700 | 706 | ||||||
3.000%, 03/15/2045 | 100 | 99 | ||||||
GNMA, Ser 108, Cl A | ||||||||
3.250%, 05/16/2059 (A) | 50 | 49 | ||||||
GNMA, Ser 123, Cl AH | ||||||||
3.250%, 09/16/2052 | 10 | 10 | ||||||
GNMA,Ser 2018-130, Cl A | ||||||||
3.250%, 05/16/2059 | 100 | 99 | ||||||
|
| |||||||
| 40,333 | ||||||||
|
| |||||||
Non-Agency Mortgage-Backed Obligations — 9.0% |
| |||||||
BAMLL Commercial Mortgage Securities | ||||||||
Trust,Ser 2014-FL1, Cl E | ||||||||
4.348%, VAR LIBOR USD 1 Month+5.500%, 12/15/2031 (B) | 260 | 255 | ||||||
BANK, Ser 2017-BNK8, Cl XA, IO | ||||||||
0.748%, 11/15/2050 (A) | 1,652 | 86 | ||||||
BBCCRE Trust,Ser 2015-GTP, Cl D | ||||||||
4.563%, 08/10/2033 (A)(B) | 140 | 133 | ||||||
SEI Catholic Values Trust / Annual Report / February 28, 2019 | 17 |
SCHEDULE OF INVESTMENTS
February 28, 2019
Catholic Values Fixed Income Fund (Continued)
| Description | Face Amount (Thousands) | Market Value ($ Thousands) | ||||||
MORTGAGE-BACKED SECURITIES (continued) |
| |||||||
BX Commercial Mortgage Trust, Ser 2018- BIOA, Cl A | ||||||||
3.160%, VAR LIBOR USD 1 Month+0.671%, 03/15/2037 (B) | $ | 100 | $ | 99 | ||||
Chevy Chase Funding Mortgage-Backed Certificates,Ser 2004-2A, Cl B1 | ||||||||
2.969%, 05/25/2035 (A)(B) | 250 | 193 | ||||||
Chevy Chase Funding Mortgage-Backed Certificates,Ser 2004-2A, Cl A1 | ||||||||
2.760%, VAR ICE LIBOR USD 1 Month+0.270%, 05/25/2035 (B) | 145 | 142 | ||||||
CIT Mortgage Loan Trust,Ser 2007-1, Cl 1M1 | ||||||||
3.990%, VAR ICE LIBOR USD 1 Month+1.500%, 10/25/2037 (B) | 120 | 119 | ||||||
COMM Mortgage Trust,Ser 2013-CR6, Cl B | ||||||||
3.397%, 03/10/2046 (B) | 100 | 98 | ||||||
COMM Mortgage Trust,Ser 2013-CR8, Cl A4 | ||||||||
3.334%, 06/10/2046 | 404 | 407 | ||||||
COMM Mortgage Trust, Ser 2015-CR24, Cl AM | ||||||||
4.028%, 08/10/2048 (A) | 90 | 92 | ||||||
COMM Mortgage Trust, Ser 2018-COR3, Cl A3 | ||||||||
4.228%, 05/10/2051 | 343 | 359 | ||||||
CSAIL Commercial Mortgage Trust, Ser 2015-C2, Cl AS | ||||||||
3.849%, 06/15/2057 (A) | 210 | 213 | ||||||
CSMC Trust,Ser 2017-HL1, Cl A3 | ||||||||
3.500%, 06/25/2047 (A)(B) | 257 | 256 | ||||||
CSMC Trust, Ser 2017-TIME, Cl A | ||||||||
3.646%, 11/13/2039 (B) | 100 | 99 | ||||||
CSMC Trust,Ser 2018-J1, Cl A2 | ||||||||
3.500%, 02/25/2048 (A)(B) | 663 | 641 | ||||||
EverBank Mortgage Loan Trust,Ser 2018-1, Cl A22 | ||||||||
3.500%, 02/25/2048 (A)(B) | 233 | 230 | ||||||
FHLMC Structured Agency Credit Risk Debt Notes, Ser 2016-DNA2, Cl M3 | ||||||||
7.140%, VAR ICE LIBOR USD 1 Month+4.650%, 10/25/2028 | 340 | 383 | ||||||
FHLMC Structured Agency Credit Risk Debt Notes, Ser 2016-DNA4, Cl M2 | ||||||||
3.790%, VAR ICE LIBOR USD 1 Month+1.300%, 03/25/2029 | 236 | 237 | ||||||
First Franklin Mortgage Loan Trust, Ser 2006-FF15, Cl A5 | ||||||||
2.650%, VAR ICE LIBOR USD 1 Month+0.160%, 11/25/2036 | 244 | 236 | ||||||
FNMA Connecticut Avenue Securities,Ser 2016-C04, Cl 1M2 | ||||||||
6.740%, VAR ICE LIBOR USD 1 Month+4.250%, 01/25/2029 | 50 | 56 | ||||||
| Description | Face Amount (Thousands) | Market Value ($ Thousands) | ||||||
MORTGAGE-BACKED SECURITIES (continued) |
| |||||||
FNMA Connecticut Avenue Securities,Ser 2018-C05, Cl 1M2 | ||||||||
4.840%, VAR ICE LIBOR USD 1 Month+2.350%, 01/25/2031 | $ | 250 | $ | 252 | ||||
GS Mortgage Securities Trust,Ser 2006-GG8, Cl AJ | ||||||||
5.622%, 11/10/2039 | 134 | 114 | ||||||
GS Mortgage Securities Trust,Ser 2010-C1, Cl A2 | ||||||||
4.592%, 08/10/2043 (B) | 735 | 746 | ||||||
GS Mortgage Securities Trust,Ser 2012-GC6, Cl AS | ||||||||
4.948%, 01/10/2045 (B) | 200 | 208 | ||||||
GS Mortgage Securities Trust, Ser 2012-GCJ7, Cl A4 | ||||||||
3.377%, 05/10/2045 | 394 | 397 | ||||||
GS Mortgage Securities Trust, Ser 2018-CHILL, Cl A | ||||||||
3.239%, VAR LIBOR USD 1 Month+0.750%, 02/15/2037 (B) | 250 | 247 | ||||||
GS Mortgage Securities Trust, Ser 2018-SRP5, Cl A | ||||||||
3.281%, 06/09/2021 | 190 | 187 | ||||||
GS Mortgage Securities Trust, Ser 2018- SRP5, Cl B | ||||||||
4.481%, 06/09/2021 | 190 | 187 | ||||||
Impac CMB Trust,Ser 2005-4, Cl 1M1 | ||||||||
3.135%, VAR ICE LIBOR USD 1 Month+0.645%, 05/25/2035 | 65 | 62 | ||||||
Impac Secured Assets Trust,Ser 2006-2, Cl 2M3 | ||||||||
3.590%, VAR ICE LIBOR USD 1 Month+1.100%, 08/25/2036 | 173 | 170 | ||||||
JPMDB Commercial Mortgage Securities Trust,Ser 2017-C7, Cl XA, IO | ||||||||
0.910%, 10/15/2050 (A) | 1,470 | 85 | ||||||
JPMorgan Chase Commercial Mortgage Securities Trust,Ser 2012-C6, Cl A3 | ||||||||
3.507%, 05/15/2045 | 178 | 181 | ||||||
JPMorgan Chase Commercial Mortgage Securities Trust, Ser 2012-CIBX, Cl A4 | ||||||||
3.483%, 06/15/2045 | 450 | 454 | ||||||
JPMorgan Mortgage Trust,Ser 2005-S2, Cl 2A15 | ||||||||
6.000%, 09/25/2035 | 171 | 161 | ||||||
JPMorgan Mortgage Trust,Ser 2016-1, Cl A5 | ||||||||
3.500%, 05/25/2046 (A)(B) | 235 | 234 | ||||||
JPMorgan Mortgage Trust,Ser 2016-4, Cl A5 | ||||||||
3.500%, 10/25/2046 (A) | 90 | 89 | ||||||
JPMorgan Mortgage Trust,Ser 2018-3, Cl A1 | ||||||||
3.500%, 09/25/2048 (A)(B) | 280 | 277 | ||||||
JPMorgan Mortgage Trust,Ser 2018-4, Cl A1 | ||||||||
3.500%, 10/25/2048 (A)(B) | 140 | 137 | ||||||
| 18 | SEI Catholic Values Trust / Annual Report / February 28, 2019 |
| Description | Face Amount (Thousands) | Market Value ($ Thousands) | ||||||
MORTGAGE-BACKED SECURITIES (continued) |
| |||||||
JPMorgan Mortgage Trust, Ser 2018-5, Cl A1 | ||||||||
3.500%, 10/25/2048 (A)(B) | $ | 479 | $ | 471 | ||||
JPMorgan Mortgage Trust, Ser 2018-6, Cl 1A4 | ||||||||
3.500%, 12/25/2048 (A)(B) | 442 | 441 | ||||||
Morgan Stanley Bank of America Merrill Lynch Trust, Ser 2015-C23, Cl B | ||||||||
4.131%, 07/15/2050 (A) | 100 | 101 | ||||||
Morgan Stanley Bank of America Merrill Lynch Trust, Ser 2016-C32, Cl ASB | ||||||||
3.514%, 12/15/2049 | 283 | 288 | ||||||
Morgan Stanley Capital I Trust, Ser 2007- IQ16, Cl AJ | ||||||||
6.173%, 12/12/2049 (A) | 198 | 150 | ||||||
MSCG Trust, Ser 2015-ALDR, Cl A2 | ||||||||
3.462%, 06/07/2035 (A)(B) | 110 | 108 | ||||||
Option One Mortgage Loan Trust, Ser 2007-FXD1, Cl 3A4 | ||||||||
5.860%, 01/25/2037 | 138 | 135 | ||||||
Reperforming Loan REMIC Trust, Ser 2005-R2, Cl 2A3 | ||||||||
8.000%, 06/25/2035 (B) | 83 | 85 | ||||||
Rosslyn Portfolio Trust, Ser 2017-R17, Cl A | ||||||||
Month+0.950%, 06/15/2033 (B) | 100 | 100 | ||||||
Sequoia Mortgage Trust, Ser 2017-1, Cl A4 | ||||||||
3.500%, 02/25/2047 (A) | 301 | 299 | ||||||
Sequoia Mortgage Trust, Ser 2017-4, Cl A4 | ||||||||
3.500%, 07/25/2047 (A)(B) | 171 | 170 | ||||||
Sequoia Mortgage Trust, Ser 2017-6, Cl A4 | ||||||||
3.500%, 09/25/2047 (A) | 179 | 178 | ||||||
UBS Commercial Mortgage Trust, Ser 2012-C1, Cl A3 | ||||||||
3.400%, 05/10/2045 | 630 | 636 | ||||||
UBS Commercial Mortgage Trust, Ser 2018-C13, Cl ASB | ||||||||
4.241%, 10/15/2051 | 532 | 558 | ||||||
Wells Fargo Commercial Mortgage Trust, Ser 2015-C28, Cl AS | ||||||||
3.872%, 05/15/2048 (A) | 270 | 274 | ||||||
WFRBS Commercial Mortgage Trust, Ser 2011-C4, Cl A4 | ||||||||
4.902%, 06/15/2044 (A)(B) | 359 | 371 | ||||||
WFRBS Commercial Mortgage Trust, Ser 2013-UBSS1, Cl A2 | ||||||||
2.927%, 03/15/2046 | 10 | 10 | ||||||
|
| |||||||
| 12,897 | ||||||||
|
| |||||||
Total Mortgage-Backed Securities (Cost $53,791) ($ Thousands) | 53,230 | |||||||
|
| |||||||
| Description | Face Amount (Thousands) | Market Value ($ Thousands) | ||||||
CORPORATE OBLIGATIONS — 34.7% |
| |||||||
Communication Services — 3.0% |
| |||||||
AT&T | ||||||||
5.350%, 09/01/2040 | $ | 1 | $ | 1 | ||||
4.750%, 05/15/2046 | 10 | 9 | ||||||
4.500%, 03/09/2048 | 130 | 116 | ||||||
4.350%, 06/15/2045 | 20 | 17 | ||||||
3.956%, VAR ICE LIBOR USD 3 Month+1.180%, 06/12/2024 | 462 | 457 | ||||||
3.400%, 05/15/2025 | 438 | 427 | ||||||
CCO Holdings | ||||||||
5.125%, 05/01/2027 (B) | 70 | 69 | ||||||
5.000%, 02/01/2028 (B) | 10 | 10 | ||||||
Charter Communications Operating | ||||||||
6.484%, 10/23/2045 | 102 | 110 | ||||||
6.384%, 10/23/2035 | 390 | 418 | ||||||
5.750%, 04/01/2048 | 70 | 70 | ||||||
5.375%, 04/01/2038 | 20 | 19 | ||||||
5.050%, 03/30/2029 | 20 | 20 | ||||||
4.200%, 03/15/2028 | 110 | 106 | ||||||
3.579%, 07/23/2020 | 50 | 50 | ||||||
Comcast | ||||||||
6.400%, 05/15/2038 | 170 | 208 | ||||||
4.700%, 10/15/2048 | 40 | 42 | ||||||
4.250%, 10/15/2030 | 60 | 62 | ||||||
4.150%, 10/15/2028 | 160 | 165 | ||||||
3.950%, 10/15/2025 | 70 | 72 | ||||||
3.900%, 03/01/2038 | 40 | 37 | ||||||
3.375%, 08/15/2025 | 140 | 140 | ||||||
3.150%, 03/01/2026 | 20 | 20 | ||||||
Comcast Cable Communications Holdings | ||||||||
9.455%, 11/15/2022 | 270 | 329 | ||||||
Netflix | ||||||||
5.375%, 02/01/2021 | 10 | 10 | ||||||
Sprint | ||||||||
7.250%, 09/15/2021 | 20 | 21 | ||||||
Sprint Spectrum | ||||||||
4.738%, 03/20/2025 (B) | 230 | 230 | ||||||
Telefonica Emisiones | ||||||||
4.103%, 03/08/2027 | 150 | 148 | ||||||
Telefonica Emisiones SAU | ||||||||
5.213%, 03/08/2047 | 150 | 144 | ||||||
Verizon Communications | ||||||||
5.500%, 03/16/2047 | 6 | 7 | ||||||
5.250%, 03/16/2037 | 20 | 22 | ||||||
4.862%, 08/21/2046 | 20 | 21 | ||||||
4.522%, 09/15/2048 | 261 | 255 | ||||||
4.500%, 08/10/2033 | 170 | 173 | ||||||
4.329%, 09/21/2028 | 50 | 52 | ||||||
3.500%, 11/01/2024 | 20 | 20 | ||||||
3.376%, 02/15/2025 | 19 | 19 | ||||||
2.625%, 08/15/2026 | 10 | 9 | ||||||
SEI Catholic Values Trust / Annual Report / February 28, 2019 | 19 |
SCHEDULE OF INVESTMENTS
February 28, 2019
Catholic Values Fixed Income Fund(Continued)
| Description | Face Amount (Thousands) | Market Value ($ Thousands) | ||||||
CORPORATE OBLIGATIONS (continued) |
| |||||||
Vodafone Group | ||||||||
5.250%, 05/30/2048 | $ | 40 | $ | 38 | ||||
4.375%, 05/30/2028 | 150 | 149 | ||||||
|
| |||||||
| 4,292 | ||||||||
|
| |||||||
Consumer Discretionary — 1.9% | ||||||||
1011778 BC ULC / New Red Finance | ||||||||
5.000%, 10/15/2025 (B) | 10 | 10 | ||||||
Amazon.com | ||||||||
4.950%, 12/05/2044 | 30 | 34 | ||||||
4.050%, 08/22/2047 | 30 | 30 | ||||||
3.875%, 08/22/2037 | 20 | 20 | ||||||
3.150%, 08/22/2027 | 50 | 49 | ||||||
American Axle & Manufacturing | ||||||||
6.625%, 10/15/2022 | 8 | 8 | ||||||
BMW US Capital | ||||||||
1.850%, 09/15/2021 (B) | 10 | 10 | ||||||
Cox Communications | ||||||||
3.350%, 09/15/2026 (B) | 231 | 218 | ||||||
3.250%, 12/15/2022 (B) | 385 | 381 | ||||||
Daimler Finance North America | ||||||||
2.700%, 08/03/2020 (B) | 180 | 179 | ||||||
Ford Motor | ||||||||
4.750%, 01/15/2043 | 30 | 23 | ||||||
General Motors | ||||||||
6.250%, 10/02/2043 | 50 | 49 | ||||||
5.150%, 04/01/2038 | 20 | 18 | ||||||
General Motors Financial | ||||||||
4.150%, 06/19/2023 | 545 | 547 | ||||||
3.450%, 04/10/2022 | 10 | 10 | ||||||
2.450%, 11/06/2020 | 20 | 19 | ||||||
Hanesbrands | ||||||||
4.875%, 05/15/2026 (B) | 20 | 20 | ||||||
Hilton Domestic Operating | ||||||||
5.125%, 05/01/2026 (B) | 10 | 10 | ||||||
Hilton Worldwide Finance | ||||||||
4.875%, 04/01/2027 | 20 | 20 | ||||||
Lennar | ||||||||
5.000%, 06/15/2027 | 10 | 10 | ||||||
4.750%, 11/29/2027 | 20 | 19 | ||||||
4.500%, 04/30/2024 | 20 | 20 | ||||||
McDonald’s MTN | ||||||||
3.800%, 04/01/2028 | 10 | 10 | ||||||
3.500%, 03/01/2027 | 90 | 89 | ||||||
Myriad International Holdings BV | ||||||||
4.850%, 07/06/2027 (B) | 200 | 201 | ||||||
Sands China | ||||||||
5.125%, 08/08/2025 | 200 | 205 | ||||||
Time Warner | ||||||||
4.750%, 03/29/2021 | 80 | 83 | ||||||
3.600%, 07/15/2025 | 135 | 133 | ||||||
| Description | Face Amount (Thousands) | Market Value ($ Thousands) | ||||||
CORPORATE OBLIGATIONS (continued) |
| |||||||
Time Warner Cable | ||||||||
7.300%, 07/01/2038 | $ | 90 | $ | 101 | ||||
5.875%, 11/15/2040 | 30 | 29 | ||||||
Time Warner Entertainment | ||||||||
8.375%, 07/15/2033 | 120 | 152 | ||||||
Toll Brothers Finance | ||||||||
4.375%, 04/15/2023 | 20 | 20 | ||||||
VOC Escrow | ||||||||
5.000%, 02/15/2028 (B) | 30 | 29 | ||||||
|
| |||||||
| 2,756 | ||||||||
|
| |||||||
Consumer Staples — 2.8% | ||||||||
Altria Group | ||||||||
6.200%, 02/14/2059 | 10 | 10 | ||||||
5.800%, 02/14/2039 | 130 | 129 | ||||||
5.375%, 01/31/2044 | 10 | 9 | ||||||
4.800%, 02/14/2029 | 50 | 50 | ||||||
4.750%, 05/05/2021 | 50 | 52 | ||||||
4.400%, 02/14/2026 | 70 | 71 | ||||||
3.800%, 02/14/2024 | 20 | 20 | ||||||
3.490%, 02/14/2022 | 20 | 20 | ||||||
2.850%, 08/09/2022 | 20 | 20 | ||||||
Anheuser-Busch | ||||||||
4.900%, 02/01/2046 (B) | 638 | 612 | ||||||
3.650%, 02/01/2026 (B) | 60 | 59 | ||||||
Anheuser-Busch InBev Finance | ||||||||
3.300%, 02/01/2023 | 130 | 131 | ||||||
2.650%, 02/01/2021 | 15 | 15 | ||||||
Anheuser-Busch InBev Worldwide | ||||||||
5.550%, 01/23/2049 | 50 | 52 | ||||||
4.750%, 01/23/2029 | 150 | 157 | ||||||
4.150%, 01/23/2025 | 40 | 41 | ||||||
4.000%, 04/13/2028 | 20 | 20 | ||||||
3.500%, 01/12/2024 | 100 | 101 | ||||||
2.500%, 07/15/2022 | 60 | 59 | ||||||
BAT Capital | ||||||||
4.540%, 08/15/2047 | 110 | 89 | ||||||
3.557%, 08/15/2027 | 140 | 128 | ||||||
Constellation Brands | ||||||||
4.750%, 11/15/2024 | 80 | 84 | ||||||
Cott Holdings | ||||||||
5.500%, 04/01/2025 (B) | 20 | 20 | ||||||
CVS Health | ||||||||
5.125%, 07/20/2045 | 60 | 59 | ||||||
3.875%, 07/20/2025 | 18 | 18 | ||||||
CVS Pass-Through Trust | ||||||||
7.507%, 01/10/2032 (B) | 421 | 493 | ||||||
6.036%, 12/10/2028 | 232 | 250 | ||||||
Danone | ||||||||
2.077%, 11/02/2021 (B) | 200 | 194 | ||||||
Diageo Capital | ||||||||
4.828%, 07/15/2020 | 110 | 113 | ||||||
| 20 | SEI Catholic Values Trust / Annual Report / February 28, 2019 |
| Description | Face Amount (Thousands) | Market Value ($ Thousands) | ||||||
CORPORATE OBLIGATIONS (continued) |
| |||||||
Kraft Heinz Foods | ||||||||
5.375%, 02/10/2020 | $ | 30 | $ | 30 |
| |||
3.950%, 07/15/2025 | 120 | 119 | ||||||
Kroger | ||||||||
4.000%, 02/01/2024 | 407 | 413 | ||||||
Lamb Weston Holdings | ||||||||
4.875%, 11/01/2026 (B) | 20 | 20 | ||||||
PepsiCo | ||||||||
4.600%, 07/17/2045 | 40 | 44 | ||||||
Philip Morris International | ||||||||
2.900%, 11/15/2021 | 10 | 10 | ||||||
2.500%, 08/22/2022 | 50 | 49 | ||||||
2.500%, 11/02/2022 | 50 | 49 | ||||||
1.875%, 11/01/2019 | 70 | 70 | ||||||
Reynolds American | ||||||||
5.850%, 08/15/2045 | 20 | 19 | ||||||
3.250%, 06/12/2020 | 11 | 11 | ||||||
Spectrum Brands | ||||||||
6.625%, 11/15/2022 | 20 | 21 | ||||||
Walgreens Boots Alliance | ||||||||
3.450%, 06/01/2026 | 40 | 38 | ||||||
Wm Wrigley Jr | ||||||||
3.375%, 10/21/2020 (B) | 30 | 30 | ||||||
|
| |||||||
| 3,999 | ||||||||
|
| |||||||
Energy — 4.9% | ||||||||
Anadarko Finance | ||||||||
7.500%, 05/01/2031 | 60 | 73 | ||||||
Anadarko Petroleum | ||||||||
6.200%, 03/15/2040 | 75 | 82 | ||||||
5.550%, 03/15/2026 | 60 | 64 | ||||||
4.850%, 03/15/2021 | 16 | 17 | ||||||
4.280%, 10/10/2036 (C) | 1,000 | 428 | ||||||
Antero Resources | ||||||||
5.375%, 11/01/2021 | 10 | 10 | ||||||
Apache | ||||||||
4.375%, 10/15/2028 | 90 | 89 | ||||||
4.250%, 01/15/2044 | 150 | 128 | ||||||
Blue Racer Midstream | ||||||||
6.125%, 11/15/2022 (B) | 20 | 20 | ||||||
BP Capital Markets | ||||||||
3.535%, 11/04/2024 | 10 | 10 | ||||||
3.506%, 03/17/2025 | 100 | 101 | ||||||
BP Capital Markets America | ||||||||
3.588%, 04/14/2027 | 10 | 10 | ||||||
3.216%, 11/28/2023 | 200 | 200 | ||||||
Cheniere Corpus Christi Holdings | ||||||||
5.125%, 06/30/2027 | 10 | 10 | ||||||
Chesapeake Energy | ||||||||
8.000%, 06/15/2027 | 10 | 10 | ||||||
6.125%, 02/15/2021 | 10 | 10 | ||||||
| Description | Face Amount (Thousands) | Market Value ($ Thousands) | ||||||
CORPORATE OBLIGATIONS (continued) |
| |||||||
Chevron | ||||||||
2.954%, 05/16/2026 | $ | 30 | $ | 30 | ||||
Cimarex Energy | ||||||||
3.900%, 05/15/2027 | 50 | 48 | ||||||
Concho Resources | ||||||||
4.300%, 08/15/2028 | 325 | 327 | ||||||
3.750%, 10/01/2027 | 10 | 10 | ||||||
Continental Resources | ||||||||
4.500%, 04/15/2023 | 70 | 71 | ||||||
4.375%, 01/15/2028 | 20 | 20 | ||||||
3.800%, 06/01/2024 | 10 | 10 | ||||||
Devon Energy | ||||||||
5.850%, 12/15/2025 | 30 | 33 | ||||||
5.600%, 07/15/2041 | 50 | 54 | ||||||
5.000%, 06/15/2045 | 50 | 51 | ||||||
3.250%, 05/15/2022 | 20 | 20 | ||||||
Diamondback Energy | ||||||||
5.375%, 05/31/2025 | 10 | 10 | ||||||
Ecopetrol | ||||||||
5.875%, 05/28/2045 | 100 | 101 | ||||||
Energy Transfer Operating | ||||||||
6.250%, 04/15/2049 | 10 | 11 | ||||||
5.250%, 04/15/2029 | 20 | 21 | ||||||
4.950%, 06/15/2028 | 10 | 10 | ||||||
4.500%, 04/15/2024 | 50 | 51 | ||||||
Enterprise Products Operating | ||||||||
4.150%, 10/16/2028 | 290 | 298 | ||||||
4.050%, 02/15/2022 | 123 | 126 | ||||||
EOG Resources | ||||||||
4.150%, 01/15/2026 | 20 | 21 | ||||||
ExxonMobil | ||||||||
4.114%, 03/01/2046 | 70 | 73 | ||||||
3.043%, 03/01/2026 | 40 | 40 | ||||||
Halliburton | ||||||||
5.000%, 11/15/2045 | 40 | 41 | ||||||
3.800%, 11/15/2025 | 50 | 50 | ||||||
Kerr-McGee | ||||||||
7.875%, 09/15/2031 | 10 | 13 | ||||||
6.950%, 07/01/2024 | 10 | 11 | ||||||
Kinder Morgan | ||||||||
5.300%, 12/01/2034 | 20 | 21 | ||||||
4.300%, 03/01/2028 | 20 | 20 | ||||||
Kinder Morgan Energy Partners | ||||||||
4.250%, 09/01/2024 | 40 | 41 | ||||||
4.150%, 02/01/2024 | 400 | 409 | ||||||
3.500%, 03/01/2021 | 20 | 20 | ||||||
3.500%, 09/01/2023 | 30 | 30 | ||||||
MPLX | ||||||||
5.500%, 02/15/2049 | 30 | 31 | ||||||
4.875%, 06/01/2025 | 110 | 114 | ||||||
4.800%, 02/15/2029 | 60 | 62 | ||||||
4.700%, 04/15/2048 | 60 | 55 | ||||||
SEI Catholic Values Trust / Annual Report / February 28, 2019 | 21 |
SCHEDULE OF INVESTMENTS
February 28, 2019
Catholic Values Fixed Income Fund (Continued)
| Description | Face Amount (Thousands) | Market Value ($ Thousands) | ||||||
| CORPORATE OBLIGATIONS (continued) | ||||||||
4.500%, 04/15/2038 | $ | 10 | $ | 9 | ||||
Noble Energy | ||||||||
5.250%, 11/15/2043 | 10 | 9 | ||||||
4.950%, 08/15/2047 | 10 | 9 | ||||||
4.150%, 12/15/2021 | 50 | 51 | ||||||
3.850%, 01/15/2028 | 30 | 29 | ||||||
Oasis Petroleum | ||||||||
6.875%, 01/15/2023 | 19 | 19 | ||||||
Occidental Petroleum | ||||||||
4.625%, 06/15/2045 | 20 | 21 | ||||||
4.400%, 04/15/2046 | 10 | 10 | ||||||
4.100%, 02/15/2047 | 70 | 69 | ||||||
3.400%, 04/15/2026 | 20 | 20 | ||||||
3.125%, 02/15/2022 | 19 | 19 | ||||||
3.000%, 02/15/2027 | 20 | 19 | ||||||
Pertamina Persero | ||||||||
6.000%, 05/03/2042 (B) | 200 | 211 | ||||||
Petrobras Global Finance BV | ||||||||
7.375%, 01/17/2027 | 210 | 231 | ||||||
6.850%, 06/05/2115 | 50 | 49 | ||||||
5.750%, 02/01/2029 | 50 | 50 | ||||||
5.299%, 01/27/2025 | 155 | 156 | ||||||
Petroleos Mexicanos | ||||||||
6.625%, 06/15/2035 | 100 | 90 | ||||||
Petroleos Mexicanos MTN | ||||||||
6.875%, 08/04/2026 | 20 | 20 | ||||||
Phillips 66 Partners | ||||||||
3.605%, 02/15/2025 | 300 | 294 | ||||||
3.550%, 10/01/2026 | 232 | 222 | ||||||
Range Resources | ||||||||
5.875%, 07/01/2022 | 10 | 10 | ||||||
4.875%, 05/15/2025 | 30 | 28 | ||||||
Schlumberger Holdings | ||||||||
4.000%, 12/21/2025 (B) | 30 | 30 | ||||||
3.000%, 12/21/2020 | 468 | 467 | ||||||
Shell International Finance BV | ||||||||
4.375%, 05/11/2045 | 50 | 52 | ||||||
4.000%, 05/10/2046 | 50 | 50 | ||||||
2.875%, 05/10/2026 | 80 | 78 | ||||||
Sinopec Group Overseas Development | ||||||||
4.375%, 04/10/2024 (B) | 200 | 207 | ||||||
Sunoco Logistics Partners Operations | ||||||||
3.450%, 01/15/2023 | 381 | 376 | ||||||
Targa Resources Partners | ||||||||
6.875%, 01/15/2029 (B) | 20 | 21 | ||||||
6.500%, 07/15/2027 (B) | 10 | 11 | ||||||
5.875%, 04/15/2026 (B) | 10 | 10 | ||||||
5.375%, 02/01/2027 | 10 | 10 | ||||||
4.250%, 11/15/2023 | 10 | 10 | ||||||
Transocean Pontus | ||||||||
6.125%, 08/01/2025 (B) | 13 | 13 | ||||||
| Description | Face Amount (Thousands) | Market Value ($ Thousands) | ||||||
| CORPORATE OBLIGATIONS (continued) | ||||||||
Valero Energy | ||||||||
6.125%, 02/01/2020 | $ | 74 | $ | 76 | ||||
Whiting Petroleum | ||||||||
6.625%, 01/15/2026 | 10 | 10 | ||||||
5.750%, 03/15/2021 | 10 | 10 | ||||||
Williams | ||||||||
7.875%, 09/01/2021 | 30 | 33 | ||||||
7.750%, 06/15/2031 | 140 | 168 | ||||||
7.500%, 01/15/2031 | 10 | 12 | ||||||
3.700%, 01/15/2023 | 20 | 20 | ||||||
Williams Partners | ||||||||
5.250%, 03/15/2020 | 20 | 20 | ||||||
WPX Energy | ||||||||
8.250%, 08/01/2023 | 30 | 34 | ||||||
|
|
| ||||||
| 6,979 | ||||||||
|
|
| ||||||
Financials — 11.5% | ||||||||
Ally Financial | ||||||||
8.000%, 11/01/2031 | 50 | 62 | ||||||
Ambac Assurance | ||||||||
5.100%, 06/07/2020 (B) | – | – | ||||||
Ambac LSNI | ||||||||
7.803%, VAR ICE LIBOR USD 3 Month+5.000%, 02/12/2023 (B) | 1 | 1 | ||||||
American Express | ||||||||
3.400%, 02/27/2023 | 412 | 415 | ||||||
2.650%, 12/02/2022 | 140 | 138 | ||||||
American Express Credit MTN | ||||||||
2.375%, 05/26/2020 | 40 | 40 | ||||||
American International Group | ||||||||
4.800%, 07/10/2045 | 183 | 176 | ||||||
3.750%, 07/10/2025 | 40 | 39 | ||||||
Banco Santander | ||||||||
4.379%, 04/12/2028 | 200 | 197 | ||||||
Bank of America | ||||||||
3.946%, VAR ICE LIBOR USD 3 Month+1.190%, 01/23/2049 | 10 | 9 | ||||||
3.419%, VAR ICE LIBOR USD 3 Month+1.040%, 12/20/2028 | 42 | 41 | ||||||
3.004%, VAR ICE LIBOR USD 3 Month+0.790%, 12/20/2023 | 419 | 413 | ||||||
Bank of America MTN | ||||||||
5.000%, 01/21/2044 | 70 | 77 | ||||||
4.450%, 03/03/2026 | 10 | 10 | ||||||
4.000%, 01/22/2025 | 300 | 301 | ||||||
3.970%, VAR ICE LIBOR USD 3 Month+1.070%, 03/05/2029 | 50 | 50 | ||||||
3.593%, VAR ICE LIBOR USD 3 Month+1.370%, 07/21/2028 | 160 | 157 | ||||||
3.550%, VAR ICE LIBOR USD 3 Month+0.780%, 03/05/2024 | 70 | 70 | ||||||
3.500%, 04/19/2026 | 402 | 399 | ||||||
| 22 | SEI Catholic Values Trust / Annual Report / February 28, 2019 |
| Description | Face Amount (Thousands) | Market Value ($ Thousands) | ||||||
CORPORATE OBLIGATIONS (continued) | ||||||||
Barclays MTN | ||||||||
4.972%, VAR ICE LIBOR USD 3 Month+1.902%, 05/16/2029 | $ | 200 | $ | 203 | ||||
BNP Paribas | ||||||||
4.705%, VAR ICE LIBOR USD 3 Month+2.235%, 01/10/2025 (B) | 200 | 206 | ||||||
4.400%, 08/14/2028 (B) | 200 | 201 | ||||||
Brighthouse Financial | ||||||||
4.700%, 06/22/2047 | 50 | 40 | ||||||
Capital One Financial | ||||||||
3.200%, 01/30/2023 | 203 | 200 | ||||||
Chubb INA Holdings | ||||||||
2.300%, 11/03/2020 | 10 | 10 | ||||||
CIT Group | ||||||||
5.250%, 03/07/2025 | 20 | 21 | ||||||
4.750%, 02/16/2024 | 30 | 30 | ||||||
Citigroup | ||||||||
8.125%, 07/15/2039 | 110 | 160 | ||||||
4.650%, 07/23/2048 | 241 | 251 | ||||||
4.450%, 09/29/2027 | 270 | 271 | ||||||
4.125%, 07/25/2028 | 90 | 88 | ||||||
3.700%, 01/12/2026 | 170 | 170 | ||||||
3.400%, 05/01/2026 | 442 | 431 | ||||||
Commonwealth Bank of Australia MTN | ||||||||
3.900%, 07/12/2047 (B) | 20 | 19 | ||||||
Cooperatieve Rabobank UA | ||||||||
4.375%, 08/04/2025 | 250 | 254 | ||||||
3.875%, 09/26/2023 (B) | 392 | 398 | ||||||
3.125%, 04/26/2021 | 250 | 251 | ||||||
Credit Agricole | ||||||||
8.125%, VAR USD Swap Semi 30/360 5 Yr Curr+6.185%, 12/31/2049 (B) | 260 | 290 | ||||||
Credit Agricole MTN | ||||||||
4.000%, VAR USD Swap Semi 30/360 5 Yr Curr+1.644%, 01/10/2033 (B) | 250 | 235 | ||||||
Credit Suisse Group Funding Guernsey | ||||||||
4.875%, 05/15/2045 | 250 | 257 | ||||||
4.550%, 04/17/2026 | 250 | 256 | ||||||
Danske Bank | ||||||||
5.000%, 01/12/2022 (B) | 200 | 204 | ||||||
Five Corners Funding Trust | ||||||||
4.419%, 11/15/2023 (B) | 200 | 208 | ||||||
HSBC Holdings | ||||||||
4.583%, VAR ICE LIBOR USD 3 Month+1.535%, 06/19/2029 | 600 | 615 | ||||||
4.250%, 03/14/2024 | 200 | 203 | ||||||
4.041%, VAR ICE LIBOR USD 3 Month+1.546%, 03/13/2028 | 200 | 197 | ||||||
Intesa Sanpaolo | ||||||||
3.125%, 07/14/2022 (B) | 200 | 190 | ||||||
Intesa Sanpaolo MTN | ||||||||
5.017%, 06/26/2024 (B) | 200 | 185 | ||||||
| Description | Face Amount (Thousands) | Market Value ($ Thousands) | ||||||
CORPORATE OBLIGATIONS (continued) | ||||||||
JPMorgan Chase | ||||||||
4.452%, VAR ICE LIBOR USD 3 Month+1.330%, 12/05/2029 | $ | 20 | $ | 21 | ||||
4.250%, 10/01/2027 | 10 | 10 | ||||||
4.203%, VAR ICE LIBOR USD 3 Month+1.260%, 07/23/2029 | 170 | 174 | ||||||
4.125%, 12/15/2026 | 150 | 152 | ||||||
4.023%, VAR ICE LIBOR USD 3 Month+1.000%, 12/05/2024 | 120 | 123 | ||||||
3.509%, VAR ICE LIBOR USD 3 Month+0.945%, 01/23/2029 | 160 | 156 | ||||||
3.200%, 01/25/2023 | 407 | 407 | ||||||
3.125%, 01/23/2025 | 150 | 148 | ||||||
KKR Group Finance II | ||||||||
5.500%, 02/01/2043 (B) | 208 | 213 | ||||||
KKR Group Finance III | ||||||||
5.125%, 06/01/2044 (B) | 215 | 212 | ||||||
Liberty Mutual Group | ||||||||
4.569%, 02/01/2029 (B) | 49 | 50 | ||||||
4.250%, 06/15/2023 (B) | 15 | 15 | ||||||
Lloyds Banking Group | ||||||||
4.375%, 03/22/2028 | 200 | 200 | ||||||
Macquarie Group MTN | ||||||||
4.150%, VAR ICE LIBOR USD 3 Month+1.330%, 03/27/2024 (B) | 374 | 376 | ||||||
Metropolitan Life Insurance | ||||||||
7.800%, 11/01/2025 (B) | 267 | 327 | ||||||
Mitsubishi UFJ Financial Group | ||||||||
2.998%, 02/22/2022 | 20 | 20 | ||||||
Morgan Stanley | ||||||||
3.737%, VAR ICE LIBOR USD 3 Month+0.847%, 04/24/2024 | 120 | 121 | ||||||
Morgan Stanley MTN | ||||||||
4.300%, 01/27/2045 | 237 | 233 | ||||||
3.875%, 04/29/2024 | 346 | 351 | ||||||
3.772%, VAR ICE LIBOR USD 3 Month+1.140%, 01/24/2029 | 170 | 167 | ||||||
Navient MTN | ||||||||
8.000%, 03/25/2020 | 40 | 42 | ||||||
Peachtree Corners Funding Trust | ||||||||
3.976%, 02/15/2025 (B) | 225 | 224 | ||||||
Prudential Financial MTN | ||||||||
7.375%, 06/15/2019 | 385 | 390 | ||||||
Reliance Standard Life Global Funding II MTN | ||||||||
2.500%, 01/15/2020 (B) | 10 | 10 | ||||||
Royal Bank of Canada MTN | ||||||||
3.200%, 04/30/2021 | 40 | 40 | ||||||
2.150%, 10/26/2020 | 30 | 30 | ||||||
Royal Bank of Scotland Group | ||||||||
5.125%, 05/28/2024 | 200 | 203 | ||||||
4.519%, VAR ICE LIBOR USD 3 Month+1.550%, 06/25/2024 | 200 | 201 | ||||||
SEI Catholic Values Trust / Annual Report / February 28, 2019 | 23 |
SCHEDULE OF INVESTMENTS
February 28, 2019
Catholic Values Fixed Income Fund (Continued)
| Description | Face Amount (Thousands) | Market Value ($ Thousands) | ||||||
CORPORATE OBLIGATIONS (continued) | ||||||||
Santander Holdings USA | ||||||||
4.500%, 07/17/2025 | $ | 10 | $ | 10 | ||||
Santander UK | ||||||||
2.375%, 03/16/2020 | 20 | 20 | ||||||
Sumitomo Mitsui Financial Group | ||||||||
2.058%, 07/14/2021 | 30 | 29 | ||||||
Teachers Insurance & Annuity Association of America | ||||||||
4.900%, 09/15/2044 (B) | 150 | 160 | ||||||
Toronto-Dominion Bank MTN | ||||||||
3.250%, 06/11/2021 | 50 | 50 | ||||||
UBS MTN | ||||||||
4.500%, 06/26/2048 (B) | 200 | 216 | ||||||
UBS Group Funding Jersey | ||||||||
4.125%, 04/15/2026 (B) | 449 | 456 | ||||||
UBS Group Funding Switzerland | ||||||||
4.253%, 03/23/2028 (B) | 200 | 203 | ||||||
US Bank | ||||||||
3.150%, 04/26/2021 | 250 | 251 | ||||||
Voya Financial | ||||||||
3.125%, 07/15/2024 | 258 | 250 | ||||||
WEA Finance | ||||||||
3.750%, 09/17/2024 (B) | 200 | 200 | ||||||
2.700%, 09/17/2019 (B) | 430 | 430 | ||||||
Wells Fargo | ||||||||
4.480%, 01/16/2024 | 200 | 207 | ||||||
3.000%, 10/23/2026 | 50 | 48 | ||||||
Wells Fargo MTN | ||||||||
4.900%, 11/17/2045 | 50 | 51 | ||||||
4.750%, 12/07/2046 | 30 | 30 | ||||||
4.650%, 11/04/2044 | 100 | 99 | ||||||
4.400%, 06/14/2046 | 10 | 10 | ||||||
4.300%, 07/22/2027 | 300 | 306 | ||||||
3.450%, 02/13/2023 | 160 | 160 | ||||||
Westpac Banking | ||||||||
2.600%, 11/23/2020 | 40 | 40 | ||||||
2.300%, 05/26/2020 | 10 | 10 | ||||||
|
| |||||||
| 16,491 | ||||||||
|
| |||||||
Health Care — 1.5% | ||||||||
Abbott Laboratories | ||||||||
4.900%, 11/30/2046 | 40 | 44 | ||||||
4.750%, 11/30/2036 | 10 | 11 | ||||||
3.750%, 11/30/2026 | 23 | 23 | ||||||
Aetna | ||||||||
2.800%, 06/15/2023 | 10 | 10 | ||||||
Anthem | ||||||||
3.650%, 12/01/2027 | 70 | 69 | ||||||
3.350%, 12/01/2024 | 20 | 20 | ||||||
2.950%, 12/01/2022 | 50 | 49 | ||||||
Cardinal Health | ||||||||
3.079%, 06/15/2024 | 20 | 19 | ||||||
| Description | Face Amount (Thousands) | Market Value ($ Thousands) | ||||||
CORPORATE OBLIGATIONS (continued) | ||||||||
2.616%, 06/15/2022 | $ | 20 | $ | 20 | ||||
Centene | ||||||||
6.125%, 02/15/2024 | 20 | 21 | ||||||
5.625%, 02/15/2021 | 10 | 10 | ||||||
5.375%, 06/01/2026 (B) | 30 | 31 | ||||||
4.750%, 05/15/2022 | 20 | 21 | ||||||
Cigna | ||||||||
4.375%, 10/15/2028 (B) | 120 | 122 | ||||||
4.125%, 11/15/2025 (B) | 347 | 352 | ||||||
3.750%, 07/15/2023 (B) | 80 | 81 | ||||||
3.400%, 09/17/2021 (B) | 30 | 30 | ||||||
CVS Health | ||||||||
5.050%, 03/25/2048 | 20 | 20 | ||||||
4.300%, 03/25/2028 | 310 | 310 | ||||||
4.100%, 03/25/2025 | 40 | 40 | ||||||
3.700%, 03/09/2023 | 180 | 181 | ||||||
3.350%, 03/09/2021 | 30 | 30 | ||||||
Express Scripts Holding | ||||||||
3.400%, 03/01/2027 | 441 | 420 | ||||||
Fresenius Medical Care US Finance II | ||||||||
4.750%, 10/15/2024 (B) | 50 | 51 | ||||||
Medtronic | ||||||||
3.500%, 03/15/2025 | 70 | 71 | ||||||
Medtronic Global Holdings SCA | ||||||||
3.350%, 04/01/2027 | 50 | 50 | ||||||
Teva Pharmaceutical Finance Netherlands | ||||||||
2.200%, 07/21/2021 | 30 | 28 | ||||||
|
| |||||||
| 2,134 | ||||||||
|
| |||||||
Industrials — 3.7% | ||||||||
AerCap Ireland Capital DAC | ||||||||
4.625%, 10/30/2020 | 278 | 282 | ||||||
Air Canada Pass-Through Trust,Ser 2015-1, Cl A | ||||||||
3.600%, 03/15/2027 (B) | 266 | 260 | ||||||
Air Lease | ||||||||
3.250%, 03/01/2025 | 545 | 516 | ||||||
American Airlines Pass-Through Trust,Ser 2013-1, Cl B | ||||||||
5.625%, 01/15/2021 (B) | 106 | 108 | ||||||
American Airlines Pass-Through Trust,Ser 2013-2, Cl A | ||||||||
4.950%, 01/15/2023 | 572 | 588 | ||||||
Beacon Escrow | ||||||||
4.875%, 11/01/2025 (B) | 10 | 9 | ||||||
Cie de Chemin de Fer Canadien Pacifique | ||||||||
6.125%, 09/15/2115 | 127 | 148 | ||||||
Cintas No. 2 | ||||||||
3.700%, 04/01/2027 | 30 | 30 | ||||||
2.900%, 04/01/2022 | 20 | 20 | ||||||
| 24 | SEI Catholic Values Trust / Annual Report / February 28, 2019 |
| Description | Face Amount (Thousands) | Market Value ($ Thousands) | ||||||
CORPORATE OBLIGATIONS (continued) | ||||||||
Continental Airlines Pass-Through Trust,Ser 2012-2, Cl A | ||||||||
4.000%, 10/29/2024 | $ | 178 | $ | 179 | ||||
DAE Funding | ||||||||
5.750%, 11/15/2023 (B) | 20 | 20 | ||||||
Delta Air Lines Pass-Through Trust, Ser 2012-2, Cl A | ||||||||
4.950%, 05/23/2019 | 90 | 91 | ||||||
Eaton | ||||||||
4.150%, 11/02/2042 | 70 | 68 | ||||||
FedEx | ||||||||
4.050%, 02/15/2048 | 237 | 205 | ||||||
Ferguson Finance | ||||||||
4.500%, 10/24/2028 (B) | 394 | 389 | ||||||
International Lease Finance | ||||||||
8.625%, 01/15/2022 | 20 | 23 | ||||||
6.250%, 05/15/2019 | 10 | 10 | ||||||
5.875%, 08/15/2022 | 50 | 53 | ||||||
Norfolk Southern | ||||||||
4.837%, 10/01/2041 | 200 | 210 | ||||||
Park Aerospace Holdings | ||||||||
5.250%, 08/15/2022 (B) | 50 | 51 | ||||||
Penske Truck Leasing LP | ||||||||
3.900%, 02/01/2024 (B) | 457 | 454 | ||||||
Ryder System MTN | ||||||||
3.875%, 12/01/2023 | 432 | 437 | ||||||
Spirit Airlines Pass-ThroughTrust, Ser 2017-1AA | ||||||||
3.375%, 02/15/2030 | 196 | 190 | ||||||
Union Pacific | ||||||||
4.500%, 09/10/2048 | 80 | 80 | ||||||
3.950%, 09/10/2028 | 90 | 92 | ||||||
3.750%, 07/15/2025 | 20 | 21 | ||||||
United Airlines Pass-Through Trust, Ser 2014-1, Cl A | ||||||||
4.000%, 04/11/2026 | 674 | 675 | ||||||
United Parcel Service | ||||||||
3.050%, 11/15/2027 | 10 | 10 | ||||||
2.500%, 04/01/2023 | 10 | 10 | ||||||
United Rentals North America | ||||||||
6.500%, 12/15/2026 | 10 | 10 | ||||||
5.875%, 09/15/2026 | 30 | 31 | ||||||
4.875%, 01/15/2028 | 20 | 19 | ||||||
Waste Management | ||||||||
3.500%, 05/15/2024 | 60 | 60 | ||||||
|
|
| ||||||
| 5,349 | ||||||||
|
|
| ||||||
Information Technology — 1.6% | ||||||||
Apple | ||||||||
3.200%, 05/13/2025 | 80 | 80 | ||||||
2.000%, 11/13/2020 | 30 | 30 | ||||||
1.550%, 08/04/2021 | 150 | 146 | ||||||
| Description | Face Amount (Thousands) | Market Value ($ Thousands) | ||||||
CORPORATE OBLIGATIONS (continued) | ||||||||
Broadcom | ||||||||
3.125%, 01/15/2025 | $ | 30 | $ | 28 | ||||
2.650%, 01/15/2023 | 315 | 300 | ||||||
Diamond 1 Finance | ||||||||
4.420%, 06/15/2021 (B) | 140 | 143 | ||||||
3.480%, 06/01/2019 (B) | 100 | 100 | ||||||
First Data | ||||||||
5.000%, 01/15/2024 (B) | 10 | 10 | ||||||
Hewlett Packard Enterprise | ||||||||
4.400%, 10/15/2022 | 69 | 71 | ||||||
Intel | ||||||||
3.700%, 07/29/2025 | 60 | 62 | ||||||
Juniper Networks | ||||||||
4.500%, 03/15/2024 | 253 | 259 | ||||||
3.300%, 06/15/2020 | 101 | 101 | ||||||
Microsoft | ||||||||
4.450%, 11/03/2045 | 40 | 43 | ||||||
4.100%, 02/06/2037 | 10 | 10 | ||||||
3.300%, 02/06/2027 | 130 | 131 | ||||||
2.875%, 02/06/2024 | 60 | 60 | ||||||
2.700%, 02/12/2025 | 20 | 20 | ||||||
2.400%, 02/06/2022 | 70 | 69 | ||||||
2.400%, 08/08/2026 | 160 | 152 | ||||||
1.550%, 08/08/2021 | 50 | 49 | ||||||
salesforce.com | ||||||||
3.700%, 04/11/2028 | 10 | 10 | ||||||
3.250%, 04/11/2023 | 40 | 41 | ||||||
Telefonaktiebolaget LM Ericsson | ||||||||
4.125%, 05/15/2022 | 211 | 213 | ||||||
Visa | ||||||||
4.300%, 12/14/2045 | 50 | 53 | ||||||
3.150%, 12/14/2025 | 70 | 70 | ||||||
|
|
| ||||||
| 2,251 | ||||||||
|
|
| ||||||
Materials — 0.8% | ||||||||
Anglo American Capital | ||||||||
3.625%, 09/11/2024 (B) | 200 | 194 | ||||||
Barrick North America Finance | ||||||||
5.700%, 05/30/2041 | 60 | 66 | ||||||
Berry Global | ||||||||
4.500%, 02/15/2026 (B) | 10 | 10 | ||||||
BHP Billiton Finance USA | ||||||||
Yr Curr+5.093%, 10/19/2075 (B) | 200 | 219 | ||||||
Equate Petrochemical BV MTN | ||||||||
4.250%, 11/03/2026 (B) | 200 | 200 | ||||||
Freeport-McMoRan | ||||||||
5.450%, 03/15/2043 | 20 | 17 | ||||||
4.550%, 11/14/2024 | 10 | 10 | ||||||
4.000%, 11/14/2021 | 40 | 40 | ||||||
Glencore Funding | ||||||||
4.125%, 05/30/2023 (B) | 70 | 70 | ||||||
SEI Catholic Values Trust / Annual Report / February 28, 2019 | 25 |
SCHEDULE OF INVESTMENTS
February 28, 2019
Catholic Values Fixed Income Fund (Continued)
| Description | Face Amount (Thousands) | Market Value ($ Thousands) | ||||||
CORPORATE OBLIGATIONS (continued) | ||||||||
4.000%, 03/27/2027 (B) | $ | 150 | $ | 143 | ||||
2.875%, 04/16/2020 (B) | 10 | 10 | ||||||
Resolute Forest Products | ||||||||
5.875%, 05/15/2023 | 40 | 40 | ||||||
Reynolds Group Issuer | ||||||||
5.125%, 07/15/2023 (B) | 20 | 20 | ||||||
Southern Copper | ||||||||
5.250%, 11/08/2042 | 80 | 79 | ||||||
Vale Overseas | ||||||||
6.875%, 11/21/2036 | 10 | 11 | ||||||
4.375%, 01/11/2022 | 3 | 3 | ||||||
WestRock RKT | ||||||||
4.000%, 03/01/2023 | 10 | 10 | ||||||
3.500%, 03/01/2020 | 20 | 20 | ||||||
|
| |||||||
| 1,162 | ||||||||
|
| |||||||
Real Estate — 1.1% | ||||||||
Boston Properties | ||||||||
3.850%, 02/01/2023 | 200 | 204 | ||||||
Digital Realty Trust | ||||||||
3.700%, 08/15/2027 | 317 | 306 | ||||||
HCP | ||||||||
4.000%, 06/01/2025 | 150 | 150 | ||||||
Realty Income | ||||||||
4.125%, 10/15/2026 | 207 | 212 | ||||||
Ventas Realty | ||||||||
4.125%, 01/15/2026 | 136 | 137 | ||||||
2.700%, 04/01/2020 | 215 | 214 | ||||||
Welltower | ||||||||
4.500%, 01/15/2024 | 144 | 149 | ||||||
4.000%, 06/01/2025 | 231 | 233 | ||||||
|
| |||||||
| 1,605 | ||||||||
|
| |||||||
Utilities — 1.9% | ||||||||
Aquarion | ||||||||
4.000%, 08/15/2024 (B) | 103 | 104 | ||||||
Duke Energy | ||||||||
3.950%, 08/15/2047 | 10 | 9 | ||||||
3.750%, 04/15/2024 | 331 | 337 | ||||||
Duke Energy Ohio | ||||||||
3.650%, 02/01/2029 | 50 | 51 | ||||||
Eversource Energy | ||||||||
3.150%, 01/15/2025 | 111 | 109 | ||||||
2.500%, 03/15/2021 | 305 | 301 | ||||||
Exelon | ||||||||
5.625%, 06/15/2035 | 60 | 66 | ||||||
5.100%, 06/15/2045 | 240 | 255 | ||||||
FirstEnergy | ||||||||
7.375%, 11/15/2031 | 220 | 284 | ||||||
4.850%, 07/15/2047 | 100 | 103 | ||||||
3.900%, 07/15/2027 | 50 | 49 | ||||||
| Description | Face Amount (Thousands) | Market Value ($ Thousands) | ||||||
CORPORATE OBLIGATIONS (continued) | ||||||||
NextEra Energy Capital Holdings | ||||||||
3.550%, 05/01/2027 | $ | 292 | $ | 284 | ||||
Pacific Gas & Electric | ||||||||
6.050%, 03/01/2034 (D) | 20 | 19 | ||||||
3.500%, 10/01/2020 (D) | 30 | 26 | ||||||
Sempra Energy | ||||||||
1.625%, 10/07/2019 | 239 | 237 | ||||||
Southern | ||||||||
3.250%, 07/01/2026 | 415 | 396 | ||||||
Virginia Electric & Power | ||||||||
3.150%, 01/15/2026 | 124 | 122 | ||||||
|
| |||||||
| 2,752 | ||||||||
|
| |||||||
Total Corporate Obligations | 49,770 | |||||||
|
| |||||||
U.S. TREASURY OBLIGATIONS — 16.4% | ||||||||
U.S. Treasury Bonds | ||||||||
4.500%, 02/15/2036 | 466 | 571 | ||||||
4.500%, 05/15/2038 | 2,438 | 3,017 | ||||||
3.750%, 11/15/2043 | 1,830 | 2,044 | ||||||
3.375%, 11/15/2048 | 1,070 | 1,131 | ||||||
3.000%, 05/15/2047 | 1,410 | 1,388 | ||||||
3.000%, 02/15/2048 | 441 | 433 | ||||||
3.000%, 08/15/2048 | 1,348 | 1,325 | ||||||
3.000%, 02/15/2049 | 60 | 59 | ||||||
2.875%, 08/15/2045 | 550 | 529 | ||||||
2.750%, 08/15/2047 | 880 | 823 | ||||||
2.750%, 11/15/2047 | 2,249 | 2,102 | ||||||
2.500%, 02/15/2045 | 230 | 206 | ||||||
2.500%, 05/15/2046 | 1,175 | 1,047 | ||||||
U.S. Treasury Inflation Protected Securities | ||||||||
1.750%, 01/15/2028 | 144 | 156 | ||||||
1.375%, 02/15/2044 | 345 | 364 | ||||||
1.000%, 02/15/2049 | 280 | 273 | ||||||
0.750%, 02/15/2042 | 44 | 41 | ||||||
U.S. Treasury Notes | ||||||||
3.625%, 02/15/2020 | 750 | 757 | ||||||
3.125%, 11/15/2028 | 120 | 124 | ||||||
2.875%, 09/30/2023 | 872 | 885 | ||||||
2.875%, 11/30/2023 | 30 | 30 | ||||||
2.875%, 05/15/2028 | 1 | 1 | ||||||
2.875%, 08/15/2028 | 802 | 813 | ||||||
2.750%, 02/15/2028 | 373 | 375 | ||||||
2.625%, 07/31/2020 | 30 | 30 | ||||||
2.625%, 05/15/2021 | 2,649 | 2,655 | ||||||
2.625%, 02/15/2029 | 10 | 10 | ||||||
2.500%, 01/31/2021 | 630 | 630 | ||||||
2.500%, 01/31/2024 | 240 | 240 | ||||||
2.250%, 11/15/2024 | 430 | 423 | ||||||
2.000%, 05/31/2024 | 70 | 68 | ||||||
| 26 | SEI Catholic Values Trust / Annual Report / February 28, 2019 |
| Description | Face Amount (Thousands) | Market Value ($ Thousands) | ||||||
U.S. TREASURY OBLIGATIONS (continued) | ||||||||
2.000%, 06/30/2024 | $ | 940 | $ | 914 | ||||
|
| |||||||
Total U.S. Treasury Obligations | 23,464 | |||||||
|
| |||||||
ASSET-BACKED SECURITIES — 8.1% |
| |||||||
Automotive — 1.9% | ||||||||
Avis Budget Rental Car Funding AESOP,Ser 2019-1A, Cl A | ||||||||
3.450%, 03/20/2023 (B) | 210 | 211 | ||||||
Ford Credit Floorplan Master Owner Trust,Ser 2015-2, Cl A1 | ||||||||
1.980%, 01/15/2022 | 825 | 819 | ||||||
Ford Credit Floorplan Master Owner Trust,Ser 2018-3, Cl A1 | ||||||||
3.520%, 10/15/2023 | 585 | 592 | ||||||
Ford Credit Floorplan Master Owner Trust,Ser 2018-4, Cl A | ||||||||
4.060%, 11/15/2030 | 150 | 152 | ||||||
NextGear Floorplan Master Owner Trust,Ser 2016-1A, Cl A2 | ||||||||
2.740%, 04/15/2021 (B) | 159 | 159 | ||||||
NextGear Floorplan Master Owner Trust,Ser 2018-1A, Cl A2 | ||||||||
3.220%, 02/15/2023 (B) | 354 | 354 | ||||||
NextGear Floorplan Master Owner Trust,Ser 2018-2A, Cl A2 | ||||||||
3.690%, 10/16/2023 (B) | 377 | 380 | ||||||
|
| |||||||
| 2,667 | ||||||||
|
| |||||||
Mortgage Related Securities — 0.2% | ||||||||
Morgan Stanley ABS Capital I Trust,Ser 2004-OP1, Cl M1 | ||||||||
3.360%, VAR ICE LIBOR USD 1 Month+0.870%, 11/25/2034 | 250 | 248 | ||||||
|
| |||||||
Other Asset-Backed Securities — 6.0% | ||||||||
Airspeed,Ser 2007-1A, Cl G1 | ||||||||
2.759%, VAR LIBOR USD 1 Month+0.270%, 06/15/2032 (B) | 57 | 55 | ||||||
Applebee’s Funding,Ser 2014-1, Cl A2 | ||||||||
4.277%, 09/05/2044 (B) | 99 | 99 | ||||||
Ascentium Equipment Receivables Trust,Ser 2018-2A, Cl A2 | ||||||||
3.270%, 10/12/2021 (B) | 411 | 413 | ||||||
BankAmerica Manufactured Housing Contract Trust,Ser 1996-1, Cl B1 | ||||||||
7.875%, 10/10/2026 | 510 | 138 | ||||||
Bear Stearns Asset Backed Securities I Trust,Ser 2004-AC6, Cl A1 | ||||||||
5.750%, 11/25/2034 | 92 | 90 | ||||||
| Description | Face Amount (Thousands) | Market Value ($ Thousands) | ||||||
ASSET-BACKED SECURITIES (continued) | ||||||||
CCG Receivables Trust,Ser 2017-1, Cl A2 | ||||||||
1.840%, 11/14/2023 (B) | $ | 147 | $ | 146 | ||||
CCG Receivables Trust,Ser 2018-1, Cl A2 | ||||||||
2.500%, 06/16/2025 (B) | 615 | 613 | ||||||
Cold Storage Trust, Ser 2017-ICE3, Cl A | ||||||||
3.489%, VAR LIBOR USD 1 Month+1.000%, 04/15/2036 (B) | 130 | 130 | ||||||
DB Master Finance,Ser 2017-1A, Cl A2I | ||||||||
3.629%, 11/20/2047 (B) | 250 | 246 | ||||||
Domino’s Pizza Master Issuer,Ser 2017-1A, Cl A2I | ||||||||
4.021%, VAR ICE LIBOR USD 3 Month+1.250%, 07/25/2047 (B) | 223 | 222 | ||||||
Domino’s Pizza Master Issuer,Ser 2018-1A, Cl A2I | ||||||||
4.116%, 07/25/2048 (B) | 149 | 148 | ||||||
Lone Star Portfolio Trust,Ser 2015-LSP, Cl E | ||||||||
8.339%, VAR LIBOR USD 1 Month+5.850%, 09/15/2028 (B) | 137 | 137 | ||||||
Nelnet Student Loan Trust,Ser 2008-3, Cl A4 | ||||||||
4.301%, VAR ICE LIBOR USD 3 Month+1.650%, 11/25/2024 | 79 | 79 | ||||||
Nomura Asset Acceptance Alternative Loan Trust,Ser 2007-1, Cl 1A4 | ||||||||
6.138%, 03/25/2047 | 187 | 190 | ||||||
Progress Residential Trust, Ser 2018-SFR3, Cl A | ||||||||
3.880%, 10/17/2035 (B) | 408 | 416 | ||||||
RAMP Trust,Ser 2006-RZ3, Cl M1 | ||||||||
2.840%, VAR ICE LIBOR USD 1 Month+0.350%, 08/25/2036 | 470 | 463 | ||||||
Store Master Funding I,Ser 2015-1A, Cl A1 | ||||||||
3.750%, 04/20/2045 (B) | 330 | 329 | ||||||
Structured Asset Investment Loan Trust, Ser 2003-BC12, Cl 2A | ||||||||
3.210%, VAR ICE LIBOR USD 1 Month+0.720%, 11/25/2033 | 247 | 246 | ||||||
U.S. Small Business Administration,Ser 2010-20B, Cl 1 | ||||||||
4.140%, 02/01/2030 | 112 | 117 | ||||||
U.S. Small Business Administration, Ser 2011-20H, Cl 1 | ||||||||
3.290%, 08/01/2031 | 184 | 185 | ||||||
U.S. Small Business Administration,Ser 2013-20G, Cl 1 | ||||||||
3.150%, 07/01/2033 | 808 | 810 | ||||||
U.S. Small Business Administration,Ser 2014-20C, Cl 1 | ||||||||
3.210%, 03/01/2034 | 701 | 708 | ||||||
U.S. Small Business Administration,Ser 2015-20F, Cl 1 | ||||||||
2.980%, 06/01/2035 | 190 | 188 | ||||||
SEI Catholic Values Trust / Annual Report / February 28, 2019 | 27 |
SCHEDULE OF INVESTMENTS
February 28, 2019
Catholic Values Fixed Income Fund (Continued)
| Description | Face Amount (Thousands) | Market Value ($Thousands) | ||||||
ASSET-BACKED SECURITIES (continued) |
| |||||||
U.S. Small Business Administration, | ||||||||
2.590%, 09/01/2037 | $ | 581 | $ | 559 | ||||
U.S. Small Business Administration, | ||||||||
2.920%, 01/01/2038 | 289 | 283 | ||||||
U.S. Small Business Administration, | ||||||||
3.220%, 02/01/2038 | 448 | 447 | ||||||
U.S. Small Business Administration, | ||||||||
3.500%, 05/01/2038 | 292 | 296 | ||||||
Verizon Owner Trust,Ser 2016-1A, Cl A | ||||||||
1.420%, 01/20/2021 (B) | 94 | 94 | ||||||
Verizon Owner Trust,Ser 2017-2A, Cl A | ||||||||
1.920%, 12/20/2021 (B) | 305 | 303 | ||||||
Verizon Owner Trust,Ser 2017-3A, Cl A1A | ||||||||
2.060%, 04/20/2022 (B) | 325 | 322 | ||||||
Volvo Financial Equipment LLC,Ser 2017-1A, Cl A3 | ||||||||
1.920%, 03/15/2021 (B) | 217 | 216 | ||||||
|
| |||||||
| 8,688 | ||||||||
|
| |||||||
Total Asset-Backed Securities |
| 11,603 |
| |||||
|
| |||||||
SOVEREIGN DEBT — 2.3% | ||||||||
Abu Dhabi Government International Bond | ||||||||
2.500%, 10/11/2022 (B) | 200 | 196 | ||||||
Argentine Republic Government International Bond | ||||||||
6.875%, 01/11/2048 | 160 | 120 | ||||||
5.625%, 01/26/2022 | 210 | 188 | ||||||
Brazilian Government International Bond | ||||||||
5.625%, 01/07/2041 | 120 | 120 | ||||||
4.625%, 01/13/2028 | 290 | 288 | ||||||
Colombia Government International Bond | ||||||||
5.625%, 02/26/2044 | 200 | 215 | ||||||
Ecuador Government International Bond | ||||||||
7.875%, 01/23/2028 (B) | 200 | 190 | ||||||
Egypt Government International Bond | ||||||||
5.577%, 02/21/2023 (B) | 200 | 199 | ||||||
Indonesia Government International Bond | ||||||||
4.350%, 01/11/2048 | 400 | 380 | ||||||
Mexico Government International Bond | ||||||||
4.600%, 02/10/2048 | 230 | 214 | ||||||
Nigeria Government International Bond MTN | ||||||||
6.500%, 11/28/2027 (B) | 200 | 197 | ||||||
Peruvian Government International Bond | ||||||||
6.550%, 03/14/2037 | 10 | 13 | ||||||
5.625%, 11/18/2050 | 240 | 294 | ||||||
| Description | Face Amount (Thousands) | Market Value ($Thousands) | ||||||
SOVEREIGN DEBT (continued) | ||||||||
Poland Government International Bond | ||||||||
4.000%, 01/22/2024 | $ | 110 | $ | 114 | ||||
Provincia de Buenos Aires | ||||||||
6.500%, 02/15/2023 (B) | 200 | 171 | ||||||
Republic of South Africa Government International Bond | ||||||||
4.300%, 10/12/2028 | 200 | 186 | ||||||
Uruguay Government International Bond | ||||||||
4.375%, 01/23/2031 | 200 | 204 | ||||||
|
| |||||||
Total Sovereign Debt | 3,289 | |||||||
|
| |||||||
MUNICIPAL BONDS — 1.1% | ||||||||
California — 0.3% |
| |||||||
California State, GO | ||||||||
7.500%, 04/01/2034 | 280 | 394 | ||||||
|
| |||||||
Florida — 0.1% |
| |||||||
Florida State, Board of Administration Finance, Ser A, RB | ||||||||
2.638%, 07/01/2021 | 100 | 100 | ||||||
|
| |||||||
Illinois — 0.3% |
| |||||||
Chicago, Metropolitan Water Reclamation | ||||||||
5.720%, 12/01/2038 | 345 | 414 | ||||||
|
| |||||||
New Jersey — 0.2% |
| |||||||
New Jersey State, Economic Development | ||||||||
4.197%, 06/15/2019 | 350 | 351 | ||||||
|
| |||||||
New York — 0.2% |
| |||||||
New York State, Urban Development, RB | ||||||||
5.770%, 03/15/2039 | 275 | 318 | ||||||
|
| |||||||
Total Municipal Bonds | 1,577 | |||||||
|
| |||||||
LOAN PARTICIPATIONS — 1.1% |
| |||||||
1011778 B.C. Unlimited Liability Company (New Red Finance, Inc.) (aka Burger King/ Tim Hortons), TermB-3 Loan | ||||||||
4.743%, VAR LIBOR+0.023%, 02/16/2024 | 10 | 10 | ||||||
| 28 | SEI Catholic Values Trust / Annual Report / February 28, 2019 |
| Description | Face Amount (Thousands) | Market Value ($ Thousands) | ||||||
LOAN PARTICIPATIONS (continued) | ||||||||
1011778 B.C. Unlimited Liability Company (New Red Finance, Inc.) (aka Burger King/ Tim Hortons), TermB-3 Loan, 1st Lien | ||||||||
4.743%, VAR LIBOR+0.023%, 02/16/2024 | $ | 13 | $ | 13 | ||||
ABC Supply, Term LoanB-3 | ||||||||
4.493%, 10/31/2023 | 34 | 34 | ||||||
Air Medical Group Holdings, 2018 Term Loan | ||||||||
5.744%, 04/28/2022 | 69 | 67 | ||||||
American Axle & Manufacturing, Inc., Tranche B Term Loan, 1st Lien | ||||||||
4.740%, VAR LIBOR+0.045%, 04/06/2024 | 28 | 28 | ||||||
Asurion, LLC, Term Loan | ||||||||
5.493%, 11/03/2024 | 10 | 10 | ||||||
Athenahealth, Inc., Term Loan B, 1st Lien | ||||||||
7.197%, 02/11/2026 | 40 | 40 | ||||||
Atlantic Aviation, Term Loan B, 1st Lien | ||||||||
6.270%, 12/06/2025 | 10 | 10 | ||||||
Avalon, Term Loan B, 1st Lien | ||||||||
4.480%, 01/15/2025 | 5 | 5 | ||||||
Beacon Roofing Supply, Inc., Initial Term Loan, 1st Lien | ||||||||
4.767%, VAR LIBOR+0.075%, 01/02/2025 | 62 | 62 | ||||||
Berry Global, Inc. (fka Berry Plastics Corporation), Term Q Loan, 1st Lien | ||||||||
4.610%, VAR LIBOR+0.050%, 10/01/2022 | 23 | 23 | ||||||
Brickman Group/Brightview Landscapes, 1st Lien | ||||||||
5.000%, 08/15/2025 | 11 | 11 | ||||||
Brightview Landscapes, LLC, Initial Term Loan, 1st Lien | ||||||||
5.000%, 08/15/2025 | 9 | 9 | ||||||
Caesars Resort Collection, LLC (fka Caesars Growth Properties Holdings, LLC), Term B Loan, 1st Lien | ||||||||
5.243%, VAR LIBOR+0.043%, 12/23/2024 | 38 | 38 | ||||||
CBS Radio Inc. Term Loan B (2017) | ||||||||
5.243%, VAR LIBOR+0.038%, 11/18/2024 | 58 | 58 | ||||||
Change Healthcare Holdings, Inc. (fka Emdeon Inc.), Closing Date Term Loan, 1st Lien | ||||||||
5.243%, VAR LIBOR+0.053%, 03/01/2024 | 17 | 16 | ||||||
Charter Communications Operating LLC, Term Loan B | ||||||||
4.500%, VAR LIBOR+0.090%, 04/30/2025 | 18 | 18 | ||||||
| Description | Face Amount (Thousands) | Market Value ($ Thousands) | ||||||
LOAN PARTICIPATIONS (continued) | ||||||||
CityCenter Holdings, LLC, Term B Loan, 1st Lien | ||||||||
4.743%, VAR LIBOR+0.030%, 04/18/2024 | $ | 8 | $ | 8 | ||||
Dell International L.L.C. (EMC Corporation), Refinancing Term B Loan | ||||||||
4.500%, 09/07/2023 | 39 | 39 | ||||||
Envision Healthcare Corp., Initial Term Loan | ||||||||
6.243%, 10/10/2025 | 20 | 19 | ||||||
First Data Corporation, New Dollar Term Loan, Ser 2022D | ||||||||
4.490%, 07/08/2022 | 10 | 10 | ||||||
First Data Corporation, New Dollar Term Loan, Ser 2024A | ||||||||
4.490%, VAR LIBOR+0.060%, 04/26/2024 | 9 | 9 | ||||||
Four Seasons, 1st Lien | ||||||||
4.493%, 11/30/2023 | 20 | 20 | ||||||
Golden Nugget, Inc., Initial Term Loan B | ||||||||
5.239%, VAR LIBOR+0.070%, 10/04/2023 | 13 | 13 | ||||||
Golden Nugget, Inc., Initial Term Loan B, 1st Lien | ||||||||
5.249%, VAR LIBOR+0.070%, 10/04/2023 | 17 | 17 | ||||||
Hilton Worldwide Finance, Term Loan, 1st Lien,Ser B-2 | ||||||||
4.240%, VAR LIBOR+0.025%, 10/25/2023 | 42 | 42 | ||||||
Jaguar Holding, Inital Term Loan | ||||||||
4.993%, 08/18/2022 | 32 | 32 | ||||||
Level 3 Financing, Inc., Tranche B, Term Loan | ||||||||
4.731%, VAR LIBOR+0.030%, 02/22/2024 | 46 | 46 | ||||||
LifePoint Health, Term Loan, 1st Lien | ||||||||
6.981%, 11/16/2025 | 40 | 40 | ||||||
MA Financeco., LLC, TrancheB-3 Term Loan | ||||||||
4.993%, 06/21/2024 | 1 | 1 | ||||||
McAfee, LLC, Term B USD Loan | ||||||||
6.243%, 09/30/2024 | 20 | 20 | ||||||
MGM Growth Properties Operating Partnership, Term B Loan, 1st Lien | ||||||||
4.493%, VAR US LIBOR+0.038%, 04/25/2023 | 43 | 42 | ||||||
Michaels Stores, Inc., 2018 New Replacement Term B Loan | ||||||||
4.993%, 01/30/2023 | 22 | 22 | ||||||
4.981%, 01/30/2023 | 8 | 8 | ||||||
MPH Acquisition Holdings LLC, Initial Term Loan, 1st Lien | ||||||||
5.553%, VAR LIBOR+0.088%, 06/07/2023 | 48 | 48 | ||||||
SEI Catholic Values Trust / Annual Report / February 28, 2019 | 29 |
SCHEDULE OF INVESTMENTS
February 28, 2019
Catholic Values Fixed Income Fund(Continued)
| Description | Face Amount (Thousands) | Market Value ($ Thousands) | ||||||
LOAN PARTICIPATIONS (continued) | ||||||||
Numericable U.S. LLC, Term Loan B | ||||||||
6.176%, VAR LIBOR+0.038%, 01/31/2026 | $ | 50 | $ | 48 | ||||
ON Semiconductor, 2018 New Replacement Term LoanB-3 | ||||||||
4.243%, 03/31/2023 | 25 | 25 | ||||||
Party City Holdings Inc., 2018 Replacement Term Loan | ||||||||
5.000%, 08/19/2022 | 13 | 13 | ||||||
Post Holdings, Inc., Series A Incremental Term Loan | ||||||||
4.490%, VAR LIBOR+0.058%, 05/24/2024 | 24 | 24 | ||||||
Prime Security Services Borrower, LLC, Refinancing Term LoanB-1,Ser 2016-2 | ||||||||
5.243%, 05/02/2022 | 19 | 19 | ||||||
Quikrete Holdings, Inc., Initial Loan | ||||||||
5.243%, VAR Euribor+0.063%, 11/15/2023 | 8 | 8 | ||||||
Realogy Group, 1st Lien | ||||||||
4.739%, 02/08/2025 | 29 | 29 | ||||||
Reynolds Group Holdings Inc., Incremental U.S. Term Loan | ||||||||
5.243%, VAR LIBOR+0.040%, 02/05/2023 | 12 | 12 | ||||||
RPI Finance Trust, Initial Term LoanB-6 | ||||||||
4.493%, VAR Prime Rate by Country+0.025%, 03/27/2023 | 27 | 27 | ||||||
Scientific Games International, Inc., Initial Term LoanB-5 | ||||||||
5.329%, VAR LIBOR+0.055%, 08/14/2024 | 51 | 51 | ||||||
5.243%, VAR LIBOR+0.055%, 08/14/2024 | 12 | 12 | ||||||
Seattle SpinCo, Inc., Initial Term Loan, 1st Lien | ||||||||
4.993%, VAR LIBOR+0.080%, 06/21/2024 | 9 | 9 | ||||||
Sprint Communications, Inc., Initial Term Loan, 1st Lien | ||||||||
5.000%, VAR LIBOR+0.065%, 02/02/2024 | 19 | 18 | ||||||
Station Casinos LLC, Term B Facility Loan, 1st Lien | ||||||||
5.000%, VAR LIBOR+0.075%, 06/08/2023 | 13 | 13 | ||||||
The Servicemaster Company, 1st Lien | ||||||||
4.993%, 11/08/2023 | 17 | 17 | ||||||
Trans Union LLC, 2017 Replacement Term LoanB-3 | ||||||||
4.493%, 04/10/2023 | 31 | 31 | ||||||
| Description | Face Amount (Thousands) | Market Value ($ Thousands) | ||||||
LOAN PARTICIPATIONS (continued) | ||||||||
Unitymedia Finance LLC, Facility D Loan, 1st Lien | ||||||||
4.739%, VAR LIBOR+0.085%, 01/15/2026 | $ | 40 | $ | 40 | ||||
Unitymedia, Term Loan B (2017) | ||||||||
4.739%, VAR LIBOR+0.085%, 09/30/2025 | 13 | 13 | ||||||
Univision Communications Inc., 2017 Replacement Repriced First-Lien Term Loan | ||||||||
5.243%, VAR FIXED+0.000%, 03/15/2024 | 52 | 49 | ||||||
UPC Financing Partnership, Facility AR, 1st Lien | ||||||||
4.989%, VAR FIXED+0.000%, 01/15/2026 | 37 | 37 | ||||||
VICI Properties 1 LLC, Term B Loan, 1st Lien | ||||||||
4.481%, 12/20/2024 | 8 | 8 | ||||||
Virgin Media, Term Loan, 1st Lien | ||||||||
4.989%, VAR LIBOR+0.085%, 01/15/2026 | 15 | 15 | ||||||
Western Digital | ||||||||
4.231%, 04/29/2023 | 32 | 32 | ||||||
XPO Logistics, Inc., Refinancing Term Loan (2018) | ||||||||
4.493%, VAR LIBOR+0.053%, 02/24/2025 | 42 | 41 | ||||||
Ziggo Secured Finance Partnership, Term Loan E Facility, 1st Lien | ||||||||
4.989%, VAR LIBOR+0.038%, 04/15/2025 | 90 | 89 | ||||||
|
| |||||||
Total Loan Participations | 1,568 | |||||||
|
| |||||||
U.S. GOVERNMENT AGENCY OBLIGATIONS — 0.6% |
| |||||||
FHLB | ||||||||
2.125%, 02/11/2020 | 30 | 30 | ||||||
FHLB DN | ||||||||
2.442%, 05/31/2019 (C) | 680 | 676 | ||||||
2.441%, 04/22/2019 (C) | 180 | 179 | ||||||
|
| |||||||
Total U.S. Government Agency Obligations | 885 | |||||||
|
| |||||||
| 30 | SEI Catholic Values Trust / Annual Report / February 28, 2019 |
| Description | Shares | Market Value ($ Thousands) | ||||||
CASH EQUIVALENT — 4.7% | ||||||||
SEI Daily Income Trust, Government Fund, Cl F | 6,772,167 | $ | 6,772 | |||||
|
|
| ||||||
Total Cash Equivalent (Cost $6,772) ($ Thousands) | 6,772 | |||||||
|
|
| ||||||
Total Investments in Securities — 106.1% (Cost $153,043) ($ Thousands) | $ | 152,158 | ||||||
|
|
| ||||||
| Description | Contracts | Market Value ($ Thousands) | ||||||
PURCHASED OPTION*(E) — 0.0% | ||||||||
Total Purchased Option | 1,182,611 | $ | 19 | |||||
|
|
| ||||||
WRITTEN OPTION*(E) — 0.0% | ||||||||
Total Written Option | (11 | ) | $ | (1 | ) | |||
|
|
| ||||||
A list of the open options held by the Fund at February 28, 2019, is as follows:
| Description | Counterparty | Number of Contracts | Notional Amount (Thousands) | Exercise Price | Expiration Date | Value (Thousands) | ||||||||||||||||
PURCHASED OPTION — 0.0% |
| |||||||||||||||||||||
Call Options |
| |||||||||||||||||||||
November 2019, USD Call EUR Put* | Citigroup | 1,182,611 | $ | 1,348 | $ | 1.14 | 11/16/19 | $ | 19 | |||||||||||||
|
|
|
| |||||||||||||||||||
Total Purchased Options | $ | 1,348 | $ | 19 | ||||||||||||||||||
|
|
|
| |||||||||||||||||||
| Description | Number of Contracts | Notional Amount (Thousands) | Exercise Price | Expiration Date | Value (Thousands) | |||||||||||||||
WRITTEN OPTION — 0.0% |
| |||||||||||||||||||
Call Options |
| |||||||||||||||||||
April 2019, U.S.10-Year Future Option* | (11 | ) | $ | (1,342) | $ | 123.00 | 03/16/19 | $ | (1) | |||||||||||
|
|
|
| |||||||||||||||||
Total Written Option | $ | (1,342) | $ | (1) | ||||||||||||||||
|
|
|
| |||||||||||||||||
A list of the open futures contracts held by the Fund at February 28, 2019, is as follows:
| Type of Contract | Number of Contracts Long/(Short) | Expiration Date | Notional Amount (Thousands) | Value (Thousands) | Unrealized Appreciation (Depreciation) (Thousands) | |||||||||||||||
90-Day Euro$ | 98 | Dec-2019 | $ | 23,821 | $ | 23,853 | $ | 32 | ||||||||||||
90-Day Euro$ | (16 | ) | Mar-2019 | (3,910 | ) | (3,896 | ) | 14 | ||||||||||||
90-Day Euro$ | 5 | Mar-2021 | 1,218 | 1,219 | 1 | |||||||||||||||
U.S.10-Year Treasury Note | 3 | Jun-2019 | 366 | 366 | – | |||||||||||||||
U.S.2-Year Treasury Note | 15 | Jul-2019 | 3,185 | 3,183 | (2) | |||||||||||||||
U.S.5-Year Treasury Note | (42 | ) | Jul-2019 | (4,813 | ) | (4,812 | ) | 1 | ||||||||||||
U.S. Long Treasury Bond | (3 | ) | Jun-2019 | (435 | ) | (433 | ) | 2 | ||||||||||||
U.S. Ultra Long Treasury Bond | 11 | Jun-2019 | 1,781 | 1,756 | (25) | |||||||||||||||
Ultra10-Year U.S. Treasury Note | (16 | ) | Jun-2019 | (2,077 | ) | (2,071 | ) | 6 | ||||||||||||
|
| |||||||||||||||||||
| $ | 19,136 | $ | 19,165 | $ | 29 | |||||||||||||||
|
| |||||||||||||||||||
SEI Catholic Values Trust / Annual Report / February 28, 2019 | 31 |
SCHEDULE OF INVESTMENTS
February 28, 2019
Catholic Values Fixed Income Fund (Concluded)
A list of the open forward foreign currency contracts held by the Fund at February 28, 2019, is as follows:
| ||||||||||||||||||||||||
| Counterparty | Settlement Date | Currency to Deliver (Thousands) | Currency to Receive (Thousands) | Unrealized Appreciation (Depreciation) (Thousands) | ||||||||||||||||||||
| ||||||||||||||||||||||||
Citigroup | 04/16/19 | USD | 516 | INR | 36,380 | $ | (7) | |||||||||||||||||
Citigroup | 04/17/19 | USD | 169 | ZAR | 2,370 | (1) | ||||||||||||||||||
Citigroup | 04/17/19 | USD | 190 | GBP | 148 | 7 | ||||||||||||||||||
Citigroup | 04/17/19 | USD | 390 | EUR | 336 | (6) | ||||||||||||||||||
Citigroup | 04/17/19 | USD | 417 | IDR | 6,068,320 | 10 | ||||||||||||||||||
Citigroup | 04/17/19 | AUD | 500 | USD | 358 | 2 | ||||||||||||||||||
Citigroup | 04/17/19 | USD | 541 | AUD | 754 | (4) | ||||||||||||||||||
Citigroup | 04/17/19 | USD | 589 | KRW | 660,871 | (1) | ||||||||||||||||||
Citigroup | 04/17/19 | USD | 865 | RUB | 58,693 | 19 | ||||||||||||||||||
Citigroup | 04/17/19 | USD | 1,022 | JPY | 109,766 | (32) | ||||||||||||||||||
Citigroup | 04/17/19 | USD | 1,782 | BRL | 6,654 | (13) | ||||||||||||||||||
Citigroup | 04/17/19 | CNY | 2,862 | USD | 417 | (10) | ||||||||||||||||||
Citigroup | 04/17/19 | USD | 3,176 | CAD | 4,207 | 23 | ||||||||||||||||||
Citigroup | 04/17/19 | PHP | 32,016 | USD | 606 | (10) | ||||||||||||||||||
Citigroup | 04/17/19 | JPY | 109,766 | USD | 1,022 | 32 | ||||||||||||||||||
Citigroup | 04/17/19 | KRW | 660,871 | USD | 593 | 5 | ||||||||||||||||||
|
| |||||||||||||||||||||||
| $ | 14 | |||||||||||||||||||||||
|
| |||||||||||||||||||||||
A list of open centrally cleared swap agreements held by the Fund at February 28, 2019, is as follows:
| ||||||||||||||||||||||||||||||||
| Credit Default Swaps | ||||||||||||||||||||||||||||||||
| ||||||||||||||||||||||||||||||||
| Reference Entity/Obligation | Buy/Sell Protection | (Pays)/ Receives Rate | Payment Frequency | Termination Date | Notional Amount (Thousands) | Value (Thousands) | Upfront Payments/ Receipts (Thousands) | Net Unrealized Appreciation (Thousands) | ||||||||||||||||||||||||
| ||||||||||||||||||||||||||||||||
CDSCDX.NA.HY.31 | Sell | 5.00% | Quarterly | 12/20/2023 | $(1,303) | $ | 80 | $ | 62 | $ | 18 | |||||||||||||||||||||
CDSCDX.NA.IG.31 | Sell | 1.00% | Quarterly | 12/20/2023 | (6,400 | ) | 117 | 75 | 42 | |||||||||||||||||||||||
|
|
|
|
|
| |||||||||||||||||||||||||||
| $ | 197 | $ | 137 | $ | 60 | |||||||||||||||||||||||||||
|
|
|
|
|
| |||||||||||||||||||||||||||
| ||||||||||||||||
| Interest Rate Swaps | ||||||||||||||||||||||||
| ||||||||||||||||||||||||
| Fund Pays | Fund Receives | Payment Frequency | Termination Date | Currency | Notional Amount (Thousands) | Value (Thousands) | Upfront Payments/ Receipts (Thousands) | Net Unrealized Appreciation (Depreciation) (Thousands) | ||||||||||||||||
| ||||||||||||||||||||||||
1.271% | 6-MONTH GBP - LIBOR | Semi-Annually | 10/26/2021 | GBP | 836 | $ | (1) | $ | – | $ | (1) | |||||||||||||
1.385% | 6-MONTH GBP - LIBOR | Annually | 10/30/2021 | GBP | 1,026 | (2) | – | (2) | ||||||||||||||||
3-MONTH USD - LIBOR | 2.85% | Semi-Annually | 08/31/2022 | USD | 3,234 | 32 | (11) | 43 | ||||||||||||||||
3-MONTH USD - LIBOR | ICAP US FEDERAL FUNDS RATE | Quarterly | 03/20/2024 | USD | 3,013 | 8 | – | 8 | ||||||||||||||||
2.875% | 3-MONTH USD - LIBOR | Quarterly | 05/15/2044 | USD | 1,924 | 11 | 24 | (13) | ||||||||||||||||
|
|
|
|
|
| |||||||||||||||||||
| $ | 48 | $ | 13 | $ | 35 | |||||||||||||||||||
|
|
|
|
|
| |||||||||||||||||||
Percentages are based on Net Assets of $143,401 ($ Thousands). |
| * | Non-income producing security. |
| ** | Rate shown is the7-day effective yield as of February 28, 2019. |
| † | Investment in Affiliated Security (see Note 5). |
| (A) | Variable or floating rate security, the interest rate of which adjusts periodically based on changes in current interest rates and prepayments on the underlying pool of assets. |
| (B) | Security exempt from registration under Rule 144A of the Securities Act of 1933. These securities may be resold in transactions exempt from registration normally to qualified institutions. On February 28, 2019, the value of these securities amounted to $23,534 ($ Thousands), representing 16.4% of the Net Assets of the Fund. |
| (C) | Zero coupon security. The rate shown on the Schedule of Investments is the security’s effective yield at the time of purchase. |
| (D) | Security is in default on interest payment. |
| (E) | Refer to table below for details on Options Contracts. |
| 32 | SEI Catholic Values Trust / Annual Report / February 28, 2019 |
ABS — Asset-Backed Security
AUD — Australian Dollar
BRL — Brazilian Real
CAD — Canadian Dollar
Cl — Class
CMO — Collateralized Mortgage Obligation
CNY — Chinese Yuan Onshore
EUR — Euro
FHLB — Federal Home Loan Bank
FHLMC — Federal Home Loan Mortgage Corporation
FNMA — Federal National Mortgage Association
GBP — British Pound Sterling
GNMA — Government National Mortgage Association
GO — General Obligation
ICE— Intercontinental Exchange
IDR — Indonesian Rupiah
INR — Indian Rupee
IO — Interest Only — face amount represents notional amount.
JPY — Japanese Yen
KRW — Korean Won
LIBOR— London Interbank Offered Rate
LLC — Limited Liability Company
LP — Limited Partnership
MTN — Medium Term Note
PHP – Philippine Peso
RB — Revenue Bond
REMIC — Real Estate Mortgage Investment Conduit
RUB — Russian Ruble
Ser — Series
TBA — To Be Announced
ULC — Unlimited Liability Company
USD — United States Dollar
VAR — Variable Rate
ZAR — South African Rand
The following is a list of the inputs used as of February 28, 2019, in valuing the Fund’s investments and other financial instruments carried at value ($ Thousands):
| Investments in Securities | Level 1 | Level 2 | Level 3 | Total | ||||||||
Mortgage-Backed Securities | $ | – | $ 53,230 | $ | – | $ 53,230 | ||||||
Corporate Obligations | – | 49,770 | – | 49,770 | ||||||||
U.S. Treasury Obligations | – | 23,464 | – | 23,464 | ||||||||
Asset-Backed Securities | – | 11,603 | – | 11,603 | ||||||||
Sovereign Debt | – | 3,289 | – | 3,289 | ||||||||
Municipal Bonds | – | 1,577 | – | 1,577 | ||||||||
Loan Participations | – | 1,568 | – | 1,568 | ||||||||
U.S. Government Agency Obligations | – | 885 | – | 885 | ||||||||
Cash Equivalent | 6,772 | – | – | 6,772 | ||||||||
|
|
|
|
|
| |||||||
Total Investments in Securities | $ | 6,772 | $ 145,386 | $ | – | $ 152,158 | ||||||
|
|
|
|
|
| |||||||
| Other Financial Instruments | Level 1 | Level 2 | Level 3 | Total | ||||||||
Purchased Options | $ | 19 | $ – | $ | – | $ 19 | ||||||
Written Options | (1 | ) | – | – | (1) | |||||||
Futures Contracts* | ||||||||||||
Unrealized Appreciation | 56 | – | – | 56 | ||||||||
Unrealized Depreciation | (27 | ) | – | – | (27) | |||||||
Forwards Contracts* | ||||||||||||
Unrealized Appreciation | – | 98 | – | 98 | ||||||||
Unrealized Depreciation | – | (84) | – | (84) | ||||||||
Centrally Cleared Swaps | ||||||||||||
Credit Default Swaps* | ||||||||||||
Unrealized Appreciation | – | 60 | – | 60 | ||||||||
Interest Rate Swaps* | ||||||||||||
Unrealized Appreciation | – | 51 | – | 51 | ||||||||
Unrealized Depreciation | – | (16) | – | (16) | ||||||||
|
|
|
|
|
| |||||||
Total Other Financial Instruments | $ | 47 | $ 109 | $ | – | $ 156 | ||||||
|
|
|
|
|
| |||||||
*Futures contracts, forward contracts and swap contracts are valued at the unrealized appreciation (depreciation) on the instrument.
For the year ended February 28, 2019, there were no transfers between Level 1 and Level 2 assets and liabilities. For the year ended February 28, 2019, there were no transfers from Level 2 into Level 3 assets and liabilities. For the year ended February 28, 2019, there were no Level 3 investments.
The following is a summary of the transactions with affiliates for the year ended February 28, 2019 ($ Thousands):
| Security Description | Value 2/28/2018 | Purchases at Cost | Proceeds from Sales | Value 2/28/2019 | Dividend Income | |||||||||||||||
SEI Daily Income Trust, Government Fund, Cl F | $8,683 | $82,794 | $(84,705) | $6,772 | $90 | |||||||||||||||
|
|
|
|
|
|
|
|
|
| |||||||||||
Amounts designated as “—” are $0.
The accompanying notes are an integral part of the financial statements.
SEI Catholic Values Trust / Annual Report / February 28, 2019 | 33 |
STATEMENTS OF ASSETS AND LIABILITIES ($ Thousands)
February 28, 2019
Catholic Values Equity Fund | Catholic Values Fixed Income Fund | |||||||
Assets: | ||||||||
Investments, at value† | $ | 255,687 | $ | 145,386 | ||||
Affiliated investments, at value†† | 5,352 | 6,772 | ||||||
Cash | 3,242 | 176 | ||||||
Cash collateral on futures | 242 | 101 | ||||||
Cash collateral on swap contracts | – | 311 | ||||||
Foreign currency, at value††† | 46 | 16 | ||||||
Receivable for fund shares sold | 3 | 2 | ||||||
Receivable for investment securities sold | 4,677 | 3,544 | ||||||
Dividends and Interest receivable | 443 | 902 | ||||||
Unrealized appreciation on forward foreign currency contracts | – | 98 | ||||||
Options purchased, at value†††† | – | 19 | ||||||
Receivable for variation margin on futures contracts | – | 12 | ||||||
Receivable for variation margin on swap contracts | – | 5 | ||||||
Prepaid expenses | 31 | 20 | ||||||
Total Assets | 269,723 | 157,364 | ||||||
Liabilities: | ||||||||
Payable for investment securities purchased | 4,763 | 13,741 | ||||||
Income distribution payable | – | 1 | ||||||
Options written, at value # | – | 1 | ||||||
Payable to custodian | 3 | – | ||||||
Payable for variation margin on futures contracts | 21 | 20 | ||||||
Payable for variation margin on swap contracts | – | 4 | ||||||
Administration fees payable | 39 | 22 | ||||||
Shareholder servicing fees payable, Class F | 16 | 8 | ||||||
Unrealized depreciation on forward foreign currency contracts | – | 84 | ||||||
Trustees fees payable | 1 | 1 | ||||||
Chief Compliance Officer fees payable | 1 | – | ||||||
Investment advisory fees payable | 84 | 33 | ||||||
Accrued expense payable | 39 | 48 | ||||||
Total Liabilities | 4,967 | 13,963 | ||||||
Net Assets | $ | 264,756 | $ | 143,401 | ||||
† Cost of investments | $ | 217,793 | $ | 146,271 | ||||
†† Cost of affiliated investments | 5,352 | 6,772 | ||||||
††† Cost of foreign currency | 47 | 16 | ||||||
†††† Cost of purchased options | – | 22 | ||||||
# Premiums received on written options | – | 4 | ||||||
Net Assets: | ||||||||
Paid-in Capital — (unlimited authorization — no par value) | $ | 225,875 | $ | 145,866 | ||||
Total distributable earnings/(loss) | 38,881 | (2,465 | ) | |||||
Net Assets | $ | 264,756 | $ | 143,401 | ||||
Net Asset Value, Offering and Redemption Price Per Share — Class F | $ | 11.93 | $ | 9.83 | ||||
| ($229,548,582 | ÷ | ($107,714,390 | ÷ | |||||
| 19,246,040 share | s) | 10,956,369 share | s) | |||||
Net Asset Value, Offering and Redemption Price Per Share — Class Y | $ | 11.90 | $ | 9.84 | ||||
| ($35,207,288 | ÷ | ($35,686,294 | ÷ | |||||
| 2,959,822 share | s) | 3,627,202 share | s) | |||||
Amounts designated as “—” are $0 or have been rounded to $0.
The accompanying notes are an integral part of the financial statements.
| 34 | SEI Catholic Values Trust / Annual Report / February 28, 2019 |
STATEMENTS OF OPERATIONS ($ Thousands)
For the year ended February 28, 2019
| Catholic Values Equity Fund | Catholic Values Fixed Income Fund | |||||||
Investment Income: | ||||||||
Dividends | $ | 5,322 | $ | – | ||||
Dividends from Affiliated Registered Investment Company(1) | 139 | 90 | ||||||
Interest Income | 73 | 4,990 | ||||||
Less: Foreign Taxes Withheld | (185 | ) | (2 | ) | ||||
Total Investment Income | 5,349 | 5,078 | ||||||
Expenses: | ||||||||
Investment Advisory Fees | 1,548 | 534 | ||||||
Administration Fees | 774 | 305 | ||||||
Shareholder Servicing Fees, Class F Shares | 557 | 293 | ||||||
Registration Fees | 69 | 39 | ||||||
Professional Fees | 61 | 33 | ||||||
Printing Fees | 25 | 15 | ||||||
Custodian/Wire Agent Fees | 21 | 53 | ||||||
Pricing Fees | 20 | 80 | ||||||
Trustees’ Fees | 4 | 2 | ||||||
Other Expenses | 34 | 24 | ||||||
Total Expenses | 3,113 | 1,378 | ||||||
Less: | ||||||||
Waiver of investment advisory fees | (489 | ) | (87 | ) | ||||
Waiver of shareholder servicing fees, Class F Shares | (431 | ) | (225 | ) | ||||
Waiver of administration fees | (101 | ) | (65 | ) | ||||
Net Expenses | 2,092 | 1,001 | ||||||
Net Investment Income | 3,257 | 4,077 | ||||||
Net Realized and Unrealized Gain (Loss) on Investments: | ||||||||
Net Realized Gain (Loss) on: | ||||||||
Investments | 6,293 | (597 | ) | |||||
Futures Contracts | (237 | ) | 71 | |||||
Forward Foreign Currency Contracts | 39 | (65 | ) | |||||
Foreign Currency Transactions | (44 | ) | 66 | |||||
Purchased and Written Options | – | (16 | ) | |||||
Swap Contracts | – | 280 | ||||||
Net Change in Unrealized Appreciation (Depreciation) on: | ||||||||
Investments | (6,930 | ) | 932 | |||||
Futures Contracts | 570 | (5 | ) | |||||
Purchased and Written Options | – | (36 | ) | |||||
Forward Foreign Currency Contracts | – | 47 | ||||||
Foreign Currency and Translation of Other Assets and Liabilities Denominated in Foreign Currencies | 1 | – | ||||||
Swap Contracts | – | (9 | ) | |||||
Net Increase in Net Assets Resulting from Operations | $ | 2,949 | $ | 4,745 | ||||
| (1) | See Note 5 in the Notes to the Financial Statements. |
Amounts designated as “—” are $0 or have been rounded to $0.
The accompanying notes are an integral part of the financial statements.
SEI Catholic Values Trust / Annual Report / February 28, 2019 | 35 |
STATEMENTS OF CHANGES IN NET ASSETS ($ Thousands)
For the years ended February
| Catholic Values Equity Fund | Catholic Values Fixed Income Fund | |||||||||||||||
| 2/28/2019 | 2/28/2018 | 2/28/2019 | 2/28/2018 | |||||||||||||
Operations: | ||||||||||||||||
Net Investment Income | $ | 3,257 | $ | 2,141 | $ | 4,077 | $ | 2,577 | ||||||||
Net Realized Gain (Loss) on Investments, Futures Contracts, Options and Swap Contracts | 6,056 | 16,959 | (262 | ) | (30) | |||||||||||
Net Realized Gain (Loss) on Foreign Currency Transactions and Forward Foreign Currency Contracts | (5 | ) | 13 | 1 | (12) | |||||||||||
Net Change in Unrealized Appreciation (Depreciation) on Investments, Futures Contracts, Options and Swap Contracts | (6,360 | ) | 19,061 | 929 | (1,826) | |||||||||||
Net Change in Unrealized Appreciation (Depreciation) on Foreign Currency Transactions and Forward Foreign Currency Contracts | 1 | (1 | ) | — | (11) | |||||||||||
Net Increase in Net Assets Resulting from Operations | 2,949 | 38,173 | 4,745 | 698 | ||||||||||||
Distributions: (1) | ||||||||||||||||
Class F | (10,898 | ) | (1,620 | ) | (3,328 | ) | (2,688) | |||||||||
Class Y | (1,790 | ) | (156 | ) | (1,039 | ) | (159) | |||||||||
Total Dividends and Distributions | (12,688 | ) | (1,776 | ) | (4,367 | ) | (2,847) | |||||||||
Capital Share Transactions: | ||||||||||||||||
Class F: | ||||||||||||||||
Proceeds from Shares Issued | 23,862 | 26,795 | 14,015 | 22,755 | ||||||||||||
Reinvestment of Dividends & Distributions | 10,878 | 1,620 | 3,317 | 2,679 | ||||||||||||
Cost of Shares Redeemed | (22,076 | ) | (23,901 | ) | (25,977 | ) | (19,166) | |||||||||
Net Increase (Decrease) in Net Assets from Class F Transactions | 12,664 | 4,514 | (8,645 | ) | 6,268 | |||||||||||
Class Y: | ||||||||||||||||
Proceeds from Shares Issued | 10,927 | 22,399 | 10,078 | 34,495 | ||||||||||||
Reinvestment of Dividends & Distributions | 1,790 | 156 | 1,037 | 159 | ||||||||||||
Cost of Shares Redeemed | (10,573 | ) | (1,203 | ) | (10,762 | ) | (93) | |||||||||
Net Increase in Net Assets from Class Y Transactions | 2,144 | 21,352 | 353 | 34,561 | ||||||||||||
Net Increase (Decrease) in Net Assets Derived from Capital Share Transactions | 14,808 | 25,866 | (8,292 | ) | 40,829 | |||||||||||
Net Increase (Decrease) in Net Assets | 5,069 | 62,263 | (7,914 | ) | 38,680 | |||||||||||
NET ASSETS: | ||||||||||||||||
Beginning of Year | 259,687 | 197,424 | 151,315 | 112,635 | ||||||||||||
End of Year (2) | $ | 264,756 | $ | 259,687 | $ | 143,401 | $ | 151,315 | ||||||||
Capital Share Transactions: | ||||||||||||||||
Class F: | ||||||||||||||||
Shares Issued | 2,057 | 2,363 | 1,445 | 2,275 | ||||||||||||
Shares Issued in Lieu of Dividends & Distributions | 994 | 131 | 341 | 268 | ||||||||||||
Shares Redeemed | (1,779 | ) | (2,040 | ) | (2,687 | ) | (1,910) | |||||||||
Net Increase (Decrease) in Shares Outstanding from Share Transactions | 1,272 | 454 | (901 | ) | 633 | |||||||||||
Capital Share Transactions: | ||||||||||||||||
Class Y: | ||||||||||||||||
Shares Issued | 879 | 1,763 | 1,036 | 3,464 | ||||||||||||
Shares Issued in Lieu of Dividends & Distributions | 164 | 13 | 106 | 16 | ||||||||||||
Shares Redeemed | (845 | ) | (100 | ) | (1,104 | ) | (9) | |||||||||
Net Increase in Shares Outstanding from Share Transactions | 198 | 1,676 | 38 | 3,471 | ||||||||||||
| (1) | Current year presentation of distributions conform withS-X Disclosure Simplification. Prior year distributions have been consolidated to conform withS-X Disclosure Simplification (see Note 10). |
| (2) | Includes undistributed net investment income of $334 and $21, respectively, in 2018. The SEC eliminated the requirement to disclose undistributed net investment income in 2018. |
Amounts designated as “–” are $0 or have been rounded to $0.
The accompanying notes are an integral part of the financial statements.
| 36 | SEI Catholic Values Trust / Annual Report / February 28, 2019 |
For the years or periods ended February 28,
For a share outstanding throughout the year or period
| Net Asset Value, Beginning of Year | Net Investment Income(1) | Net Realized and Unrealized Gains (Losses) on Investments(1) | Total from | Dividends from Net Investment Income | Distributions from Net Realized Gains | Total Dividends and Distributions | Net Asset Value, End of Year | Total Return† | Net Assets Year ($ Thousands) | Ratio of Net Expenses to Average Net Assets | Ratio of Expenses Net Assets | Ratio of Net to Average | Portfolio Turnover Rate† | |||||||||||||||||||||||||||||||||||||||||||
Catholic Values Equity Fund |
| |||||||||||||||||||||||||||||||||||||||||||||||||||||||
Class F | ||||||||||||||||||||||||||||||||||||||||||||||||||||||||
2019 | $ | 12.53 | $ | 0.15 | $ | (0.13 | ) | $ | 0.02 | $ | (0.15 | ) | $ | (0.47 | ) | $ | (0.62 | ) | $ | 11.93 | 0.62% | $ | 229,548 | 0.82% | 1.24% | 1.26% | 49% | |||||||||||||||||||||||||||||
2018 | 10.61 | 0.11 | 1.90 | 2.01 | (0.09 | ) | — | (0.09 | ) | 12.53 | 18.93 | 225,146 | 0.86 | 1.24 | 0.94 | 56 | ||||||||||||||||||||||||||||||||||||||||
2017 | 8.57 | 0.09 | 2.05 | 2.14 | (0.10 | ) | — | (0.10 | ) | 10.61 | 25.03 | 185,908 | 0.86 | 1.25 | 0.88 | 63 | ||||||||||||||||||||||||||||||||||||||||
2016(2) | 10.00 | 0.08 | (1.44 | ) | (1.36 | ) | (0.07 | ) | — | (0.07 | ) | 8.57 | (13.66) | 142,564 | 0.86 | 1.32 | 0.96 | 84 | ||||||||||||||||||||||||||||||||||||||
Class Y | ||||||||||||||||||||||||||||||||||||||||||||||||||||||||
2019 | $ | 12.51 | $ | 0.16 | $ | (0.13 | ) | $ | 0.03 | $ | (0.17 | ) | $ | (0.47 | ) | $ | (0.64 | ) | $ | 11.90 | 0.71% | $ | 35,207 | 0.76% | 0.99% | 1.31% | 49% | |||||||||||||||||||||||||||||
2018 | 10.60 | 0.12 | 1.90 | 2.02 | (0.11 | ) | — | (0.11 | ) | 12.51 | 19.05 | 34,541 | 0.76 | 0.99 | 1.06 | 56 | ||||||||||||||||||||||||||||||||||||||||
2017 | 8.56 | 0.10 | 2.06 | 2.16 | (0.12 | ) | — | (0.12 | ) | 10.60 | 25.28 | 11,516 | 0.76 | 1.00 | 0.98 | 63 | ||||||||||||||||||||||||||||||||||||||||
2016(3) | 10.04 | 0.07 | (1.47 | ) | (1.40 | ) | (0.08 | ) | — | (0.08 | ) | 8.56 | (14.05) | 9,308 | 0.76 | 1.07 | 1.01 | 84 | ||||||||||||||||||||||||||||||||||||||
Catholic Values Fixed Income Fund |
| |||||||||||||||||||||||||||||||||||||||||||||||||||||||
Class F | ||||||||||||||||||||||||||||||||||||||||||||||||||||||||
2019 | $ | 9.79 | $ | 0.25 | $ | 0.07 | $ | 0.32 | $ | (0.28 | ) | $ | — | $ | (0.28 | ) | $ | 9.83 | 3.29% | $ | 107,715 | 0.67% | 0.96% | 2.66% | 159% | |||||||||||||||||||||||||||||||
2018 | 9.93 | 0.20 | (0.11 | ) | 0.09 | (0.23 | ) | — | (0.23 | ) | 9.79 | 0.87 | 116,124 | 0.71 | 0.96 | 2.06 | 194 | |||||||||||||||||||||||||||||||||||||||
2017 | 9.89 | 0.19 | 0.11 | 0.30 | (0.23 | ) | (0.03 | ) | (0.26 | ) | 9.93 | 3.11 | 111,465 | 0.71 | 1.04 | 1.87 | 124 | |||||||||||||||||||||||||||||||||||||||
2016(2) | 10.00 | 0.14 | (0.09 | ) | 0.05 | (0.16 | ) | — | (0.16 | ) | 9.89 | 0.54 | 86,406 | 0.71 | 1.09 | 1.77 | 216 | |||||||||||||||||||||||||||||||||||||||
Class Y | ||||||||||||||||||||||||||||||||||||||||||||||||||||||||
2019 | $ | 9.81 | $ | 0.26 | $ | 0.06 | $ | 0.32 | $ | (0.29 | ) | $ | — | $ | (0.29 | ) | $ | 9.84 | 3.29% | $ | 35,686 | 0.61% | 0.71% | 2.72% | 159% | |||||||||||||||||||||||||||||||
2018 | 9.94 | 0.23 | (0.12 | ) | 0.11 | (0.24 | ) | — | (0.24 | ) | 9.81 | 1.07 | 35,191 | 0.61 | 0.74 | 2.35 | 194 | |||||||||||||||||||||||||||||||||||||||
2017 | 9.89 | 0.20 | 0.15 | 0.35 | (0.24 | ) | (0.03 | ) | (0.27 | ) | 9.94 | 3.32 | 1,170 | 0.61 | 0.79 | 1.97 | 124 | |||||||||||||||||||||||||||||||||||||||
2016(3) | 9.95 | 0.14 | (0.04 | ) | 0.10 | (0.16 | ) | — | (0.16 | ) | 9.89 | 1.00 | 1,185 | 0.61 | 0.84 | 1.97 | 216 | |||||||||||||||||||||||||||||||||||||||
| † | Returns and portfolio turnover rates are for the period indicated and have not been annualized. Returns do not reflect the deduction of taxes the shareholder would pay on fund distributions or redemption of fund shares. |
| (1) | Per share net investment income and net realized and unrealized gains (losses) calculated using average shares. |
| (2) | Commenced operations on April 30, 2015. All ratios for the period have been annualized. |
| (3) | Commenced operations on May 31, 2015. All ratios for the period have been annualized. |
The accompanying notes are an integral part of the financial statements. |
Amounts designated as “—” are either $0 or have been rounded to $0. |
SEI Catholic Values Trust / Annual Report / February 28, 2019 | 37 |
February 28, 2019
1. ORGANIZATION
SEI Catholic Values Trust (the “Trust”) is organized as a Delaware statutory trust under a Declaration of Trust dated December 8, 2014.
The Trust is registered under the Investment Company Act of 1940, as amended, as a diversified,open-end investment company with two operational Funds: Catholic Values Equity Fund (“Equity Fund”) and Catholic Values Fixed Income Fund (“Fixed Income Fund”) (each a “Fund,” collectively, the “Funds”), both of which are diversified Funds. The Trust is registered to offer: Class F and Class Y shares of the Funds. The assets of each Fund are segregated, and a shareholder’s interest is limited to the Fund in which shares are held. The Funds’ prospectuses provide a description of each Fund’s investment objective and strategies.
In addition to its objective and strategies, each of the Funds makes investment decisions consistent with Catholic values on a range of social and moral concerns that may include: protecting human life; promoting human dignity; reducing arms production; pursuing economic justice; protecting the environment, and encouraging corporate responsibility. Potential investments for the Funds are first selected for financial soundness and then evaluated according to the Funds’ social criteria. The Adviser has engaged an independent compliance support organization that has identified a list of issuers that do not align with Catholic values. The Funds will not invest in issuers identified through this process. The Adviser reserves the right to modify the criteria from time to time to maintain alignment with evolving Catholic social and moral positions.
2. SIGNIFICANT POLICIES
The following are significant accounting policies, which are consistently followed in the preparation of its financial statements by the Funds. The Funds are investment companies that apply the accounting and reporting guidance issued in Topic 946 by the U.S. Financial Accounting Standards Board (“FASB”).
Use of Estimates— The preparation of financial statements, in conformity with accounting principles generally accepted in the United States of America (“U.S. GAAP”) requires management to make estimates and assumptions that affect the reported amount of assets and liabilities and disclosure of contingent assets and liabilities at the date of the financial statements and the reported amounts of increases and decreases in net assets from operations during the reporting period. Actual results could differ from those estimates.
Security Valuation— Securities listed on a securities exchange, market or automated quotation system
for which quotations are readily available (other than securities traded on National Association of Securities Dealers Automated Quotations (“NASDAQ”) or as otherwise noted below) at the last quoted sale price on an exchange or market (foreign or domestic) on which the securities are traded, or, if there is no such reported sale, at the most recent quoted bid price. The Funds value securities traded on NASDAQ at the NASDAQ Official Closing Price. If available, debt securities, swaps (which are not centrally cleared), bank loans or collateralized debt obligations (including collateralized loan obligations), such as those held by the Funds, are priced based upon valuations provided by independent, third-party pricing agents. Such values generally reflect the last reported sales price if the security is actively traded. The third-party pricing agents may also value debt securities at an evaluated bid price by employing methodologies that utilize actual market transactions, broker-supplied valuations or other methodologies designed to identify the market value for such securities. Redeemable securities issued byopen-end investment companies are valued at the investment company’s applicable net asset value, with the exception of ETFs, which are priced as equity securities. The prices of foreign securities are reported in local currency and converted to U.S. dollars using currency exchange rates. If a security’s price cannot be obtained, as noted above, the Funds will value the securities using a bid price from at least one independent broker. If such prices are not readily available or cannot be valued using the methodologies described above, the Funds will value the security using the Funds’ Fair Value Pricing Policies and Procedures (“Fair Value Procedures”), as described below.
On the first day a new debt security purchase is recorded, if a price is not available from a third-party pricing agent or an independent broker, the security may be valued at its purchase price. Each day thereafter, the debt security will be valued according to the Funds’ Fair Value Procedures until a price from an independent source can be secured. Securities held by a Fund with remaining maturities of 60 days or less may be valued by the amortized cost method, which involves valuing a security at its cost on the date of purchase and thereafter (absent unusual circumstances) assuming a constant amortization to maturity of any discount or premium, regardless of the impact of fluctuations in general market rates of interest on the value of the instrument. While this method provides certainty in valuation, it may result in periods during which value, as determined by this method, is higher or lower than the price a Fund would receive if it sold the instrument. Further, the value of securities in the Fund can be expected to vary inversely with changes in prevailing
| 38 | SEI Catholic Values Trust / Annual Report / February 28, 2019 |
interest rates. Should existing credit, liquidity or interest rate conditions in the relevant markets and issuer-specific circumstances suggest that amortized cost does not approximate fair value, then the amortized cost method may not be used.
Options and warrants are valued at the last quoted sales price. If there is no such reported sale on the valuation date, long positions are valued at the most recent bid price, and short positions are valued at the most recent ask price.
Futures and swaps cleared through a central clearing house (“Centrally Cleared swaps”) are valued at the settlement price established each day by the board of exchange on which they are traded. The daily settlement prices for financial futures and centrally cleared swaps are provided by an independent source. On days when there is excessive volume, market volatility or the future or centrally cleared swap does not end trading by the time a Fund calculates its NAV, the settlement price may not be available at the time at which the Fund calculates its NAV. On such days, the best available price (which is typically the last sales price) may be used to value a Fund’s futures or centrally cleared swaps position.
Foreign currency forward contracts are valued at the current day’s interpolated foreign exchange rate, as calculated using the current day’s spot rate, and the thirty, sixty, ninety andone-hundred eighty day forward rates provided by an independent source.
Prices for most securities held by a Fund are provided daily by third-party independent pricing agents. SEI Investments Management Corporation (“SIMC”) or aSub-Adviser(“Sub-Adviser”), as applicable, reasonably believes that prices provided by independent pricing agents are reliable. However, there can be no assurance that such pricing service’s prices will be reliable. SIMC or aSub-Adviser, as applicable, monitors the reliability of prices obtained from any pricing service and shall promptly notify the Funds’ administrator if it believes that a particular pricing service is no longer a reliable source of prices. The Funds’ administrator, in turn, notifies the Fair Value Pricing Committee (the “Committee”) if it receives such notification from SIMC or aSub-Adviser, as applicable, or if the Funds’ administrator reasonably believes that a particular pricing service is no longer a reliable source for prices.
The Funds’ Fair Value Procedures provide that any change in a primary pricing agent or a pricing methodology requires prior approval by the Board of Trustees (“Board”) or its designatedsub-committee. However, when the change would not materially affect valuation of a Fund’s net assets or involve a material departure in pricing methodology from that of the Fund’s
existing pricing agent or pricing methodology, approval may be obtained at the next regularly scheduled meeting of the Board.
Securities for which market prices are not readily available, for which market prices are determined to be unreliable, or which cannot be valued using the methodologies described above are valued in accordance with the Fair Value Procedures established by the Board. The Funds’ Fair Value Procedures are implemented through the Committee designated by the Board. The Committee is currently composed of two members of the Board, as well as representatives from SIMC and its affiliates. Some of the more common reasons that may necessitate that a security be valued using Fair Value Procedures include: (i) the security’s trading has been halted or suspended, (ii) the security has been delisted from a national exchange, (iii) the security’s primary trading market is temporarily closed at a time when under normal conditions it would be open, or (iv) the security’s primary pricing source is not able or willing to provide a price. When a security is valued in accordance with the Fair Value Procedures, the Committee will determine the value after taking into consideration relevant information reasonably available to the Committee. Examples of factors the Committee may consider include: (i) the facts giving rise to the need to fair value, (ii) the last trade price, (iii) the performance of the market or the issuer’s industry, (iv) the liquidity of the security, (v) the size of the holding in a Fund, or (vi) any other appropriate information.
The determination of a security’s fair value price often involves the consideration of a number of subjective factors, and is therefore subject to the unavoidable risk that the value assigned to a security may be higher or lower than the security’s value would be if a reliable market quotation for the security was readily available.
For securities that principally trade on a foreign market or exchange, a significant gap in time can exist between the time of a particular security’s last trade and the time at which a Fund calculates its Net Asset Value (“NAV”). The closing prices of such securities may no longer reflect their market value at the time a Fund calculates NAV if an event that could materially affect the value of those securities (a “Significant Event”), including substantial fluctuations in domestic or foreign markets or occurrences not tied directly to the securities markets, such as natural disasters, armed conflicts or significant governmental actions, has occurred between the time of the security’s last close and the time that the Fund calculates NAV. A Fund may invest in securities that are primarily listed on foreign exchanges that trade on weekends or other days when the Fund does not price its shares. As a result, the NAV of the Fund’s shares may
SEI Catholic Values Trust / Annual Report / February 28, 2019 | 39 |
NOTES TO FINANCIAL STATEMENTS (Continued)
February 28, 2019
change on days when shareholders will not be able to purchase or redeem Fund shares.
A Significant Event may relate to a single issuer or to an entire market sector. If SIMC or aSub-Adviser becomes aware of a Significant Event that has occurred with respect to a security or group of securities after the closing of the exchange or market on which the security or securities principally trade, but before the time at which the Funds calculate NAV, it may request that a Committee meeting be called. In addition, the Funds use several processes, with respect to certain securities to monitor the pricing data supplied by various sources, including price comparisons and price movements. Any identified discrepancies are researched and subject to the procedures described above.
The Equity Fund and Fixed Income Fund, which may hold international securities, use a third-party fair valuation vendor. The vendor provides a fair value for foreign securities held by the Funds based on certain factors and methodologies (involving, generally, tracking valuation correlations between the U.S. market and eachnon-U.S. security). Values from the fair value vendor are applied in the event that there is a movement in the U.S. market that exceeds a specific threshold that has been established by the Committee. The Committee has also established a “confidence interval” which is used to determine the level of historical correlation between the value of a specific foreign security and movements in the U.S. market before a particular security will be fair valued when the threshold is exceeded. In the event that the threshold established by the Committee is exceeded on a specific day, these Funds will value thenon-U.S. securities in their portfolios that exceed the applicable “confidence interval” based upon the adjusted prices provided by the fair valuation vendor.
In accordance with U.S. GAAP, fair value is defined as the price that a Fund would receive upon selling an investment in an orderly transaction to an independent buyer in the principal or most advantageous market of the investment. A three tier hierarchy has been established to maximize the use of observable and minimize the use of unobservable inputs and to establish classification of fair value measurements for disclosure purposes. Inputs refer broadly to the assumptions that market participants would use in pricing an asset. Inputs may be observable or unobservable. Observable inputs are inputs that reflect the assumptions market participants would use in pricing the asset or liability based on market data obtained from sources independent of the reporting entity. Unobservable inputs are inputs that reflect the reporting entity’s own assumptions about the assumptions market participants
would use in pricing the asset or liability based on the best information available in the circumstances.
The three-tier hierarchy of inputs is summarized in the three broad Levels listed below:
Level 1 — Unadjusted quoted prices in active markets for identical, unrestricted assets or liabilities that the Fund has the ability to access at the measurement date;
Level 2 — Quoted prices which are not active, or inputs that are observable (either directly or indirectly) for substantially the full term of the asset or liability; and
Level 3 — Prices, inputs or exotic modeling techniques which are both significant to the fair value measurement and unobservable (supported by little or no market activity).
Investments are classified within the level of the lowest significant input considered in determining fair value. Investments classified within Level 3 whose fair value measurement considers several inputs may include Level 1 or Level 2 inputs as components of the overall fair value measurement.
Debt securities are valued in accordance with the evaluated bid price supplied by the pricing service and generally categorized as Level 2 in the hierarchy. Other securities that are categorized as Level 2 in the hierarchy include, but are not limited to, preferred stocks, bank loans, warrants, swaps and forward contracts.
The valuation techniques used by the Funds to measure fair value during the year ended February 28, 2019 maximized the use of observable inputs and minimized the use of unobservable inputs.
For the year ended February 28, 2019, there have been no significant changes to the Trust’s fair valuation methodologies. For details of the investment classifications reference the Schedules of Investments.
Security Transactions and Investment Income— Security transactions are recorded on the trade date. Costs used in determining net realized capital gains and losses on the sale of securities are on the basis of specific identification. Dividend income is recognized on theex-dividend date, and interest income is recognized using the accrual basis of accounting. Income frompayment-in-kind securities is recorded daily based on the effective interest method of accrual.
Distributions received on securities that represent a return of capital or capital gains are recorded as a reduction of cost of investments and/or as a realized gain. The Trust estimates the components of distributions received that may be considered nontaxable distributions or capital gain distributions.
| 40 | SEI Catholic Values Trust / Annual Report / February 28, 2019 |
Amortization and accretion is calculated using the scientific interest method, which approximates the effective interest method over the holding period of the security, which is not materially different from the effective interest method. Amortization of premiums and discounts is included in interest income.
Foreign Currency Translation— The books and records of the Funds investing in international securities are maintained in U.S. dollars on the following basis:
(i) market value of investment securities, assets and liabilities at the current rate of exchange; and
(ii) purchases and sales of investment securities, income and expenses at the relevant rates of exchange prevailing on the respective dates of such transactions.
The Funds do not isolate that portion of gains and losses on investments in equity securities that is due to changes in the foreign exchange rates from that which is due to changes in market prices of equity securities.
The Funds report certain foreign-currency-related transactions as components of realized gains for financial reporting purposes, whereas such components are treated as ordinary income for Federal income tax purposes.
Futures Contracts— To the extent consistent with its Investment Objective and Strategies, a Fund may use futures contracts for tactical hedging purposes as well as to enhance the Fund’s returns. In addition, fixed income funds will utilize futures contracts to help manage duration and yield curve exposure. These Funds’ investments in futures contracts are designed to enable the Funds to more closely approximate the performance of their benchmark indices. Initial margin deposits of cash or securities are made upon entering into futures contracts. The contracts aremarket-to-market daily and the resulting changes in value are accounted for as unrealized gains and losses. Variation margin payments are paid or received, depending upon whether unrealized gains or losses are incurred. When contracts are closed, the Funds record a realized gain or loss equal to the difference between the proceeds from (or cost of) the closing transaction and the amount invested in the contract.
Risks of entering into futures contracts include the possibility that there will be an imperfect price correlation between the futures and the underlying securities. Second, it is possible that a lack of liquidity for futures contracts could exist in the secondary market, resulting in an inability to close a position prior to its maturity date. Third, futures contracts involve the risk that a Fund could lose more than the original margin deposit required to initiate a futures transaction.
Finally, the risk exists that losses could exceed amounts disclosed on the Statements of Assets and Liabilities.
It is the Funds’ policy to present the gross variation margin payable and the gross variation margin receivable of the future contracts separately on the Statement of Assets and Liabilities as the Funds do not have a master netting agreement with the counter party to the future contracts.
Refer to each Fund’s Schedule of Investments for details regarding open futures contracts as of February 28, 2019, if applicable.
Master Limited Partnerships— Investments in units of master limited partnerships (“MLPs”) involve risks that differ from an investment in common stock. Holders of the units of master limited partnerships have more limited control and limited rights to vote on matters affecting the partnership. There are also certain tax risks associated with an investment in units of master limited partnerships. In addition, conflicts of interest may exist between common unit holders, subordinated unit holders and the general partner of a master limited partnership, including a conflict arising as a result of incentive distribution payments. The benefit a Fund derives from investment in MLP units is largely dependent on the MLPs being treated as partnerships and not as corporations for federal income tax purposes. If an MLP were classified as a corporation for federal income tax purposes, there would be reduction in theafter-tax return to a Fund of distributions from the MLP, likely causing a reduction in the value of a Fund’s shares. MLP entities are typically focused in the energy, natural resources and real estate sectors of the economy. A downturn in the energy, natural resources or real estate sectors of the economy could have an adverse impact on a Fund. At times, the performance of securities of companies in the energy, natural resources and real estate sectors of the economy may lag the performance of other sectors or the broader market as a whole.
Inflation-Indexed Bonds— Inflation-indexed bonds are fixed income securities whose principal value is periodically adjusted according to the rate of inflation. If the index measuring inflation rises or falls, the principal value of inflation-indexed bonds will be adjusted upward or downward, and consequently the interest payable on these securities (calculated with respect to a larger or smaller principal amount) will be increased or reduced, respectively. Any upward or downward adjustment in the principal amount of an inflation-indexed bond will be included in interest income in the Statement of Operations, even though investors do not receive their principal until maturity. Repayment of the original bond principal upon maturity (as adjusted for inflation) is guaranteed in the case of U.S. Treasury inflation-
SEI Catholic Values Trust / Annual Report / February 28, 2019 | 41 |
NOTES TO FINANCIAL STATEMENTS (Continued)
February 28, 2019
indexed bonds. For bonds that do not provide a similar guarantee, the adjusted principal value of the bond repaid at maturity may be less than the original principal.
Options Written/Purchased— To the extent consistent with its investment objective and strategies, a Fund may invest in financial options contracts to add return or to hedge their existing portfolio securities. When the Fund writes or purchases an option, an amount equal to the premium received or paid by the Fund is recorded as a liability or an asset and is subsequently adjusted to the current market value of the option written or purchased. Premiums received or paid from purchasing or writing options which expire unexercised are treated by the Fund on the expiration date as realized gains or losses. The difference between the premium and the amount paid or received on effecting a closing purchase or sale transaction, including brokerage commissions, is also treated as a realized gain or loss. If an option is exercised, the premium paid or received is added to the cost of the purchase or proceeds from the sale in determining whether the Fund has realized a gain or a loss. The risk in writing a call option is that the Fund gives up the opportunity for profit if the market price of the security increases. The risk in writing a put option is that the Fund may incur a loss if the market price of the security decreases and the option is exercised. The risk in purchasing an option is that the Fund pays a premium whether or not the option is exercised. The Fund also has the additional risk of being unable to enter into a closing transaction at an acceptable price if a liquid secondary market does not exist. Option contracts also involve the risk that they may not work as intended due to unanticipated developments in market conditions or other causes. In connection with option agreement securities may be set aside as collateral by a Fund’s custodian.
The cost of purchased options and the premiums received for written options that are presented in the Schedule of Investments are representative of the volume of activity during the year ended February 28, 2019.
Finally, the risk exists that losses on written options could exceed amounts disclosed on the Statements of Assets and Liabilities. Refer to each Fund’s Schedule of Investments for details regarding open options contracts as of February 28, 2019, if applicable.
Securities Sold Short— To the extent consistent with its Investment Objective and Strategies, a Fund may engage in short sales. Short sales are transactions under which a Fund sells a security it does not own. To complete such a transaction, the Fund must borrow the security to make delivery to the buyer. A Fund then is obligated to replace the security borrowed by
purchasing the security at the market price at the time of the replacement. The price at such time may be more or less than the price at which the security was sold by a Fund. Until the security is replaced, a Fund is required to pay the lender amounts equal to any dividends or interest that accrue during the period of the loan. Dividends and interest are shown as an expense for financial reporting purposes. To borrow the security, a Fund also may be required to pay a premium, which would decrease proceeds of the security sold. The proceeds of the short sale are retained by the broker, to the extent necessary to meet margin requirements, until the short position is closed out. A gain, limited to the price at which a Fund sold the security short, or a loss, unlimited in size, will be recognized upon the close of a short sale.
Refer to each Fund’s Schedule of Investments for details regarding securities sold short as of February 28, 2019, if applicable.
Swap Agreements— To the extent consistent with its Investment Objective and Strategies, a Fund may invest in swap contracts as an efficient means to synthetically obtain exposure to securities or baskets of securities and to manage a Fund’s interest rate duration and yield curve exposure. Swap contracts may also be used to mitigate a Fund’s overall level of risk and/or a Fund’s risk to particular types of securities, currencies or market segments. Interest rate swaps may further be used to manage a Fund’s yield spread sensitivity. A Fund may buy credit default swaps in an attempt to manage credit risk where a Fund has credit exposure to an issuer, and a Fund may sell credit default swaps to more efficiently gain credit exposure to a security or basket of securities. A swap agreement is atwo-party contract under which an agreement is made to exchange returns from predetermined investments or instruments, including a particular interest rate, foreign currency, or “Basket” of securities representing a particular index. Swap agreements are privately negotiated in theover-the-counter market (“OTC swaps”) or may be executed in a multilateral or other trade facility platform, such as a registered commodities exchange (“Centrally Cleared swaps”). Interest rate swaps involve the exchange by a Fund with another party of their respective commitments to pay or receive interest (e.g., an exchange of floating rate payments for fixed rate payments) with respect to a notional amount of principal. Credit default swaps involve periodic payments by a Fund or counterparty based on a specified rate multiplied by a notional amount assigned to an underlying debt instrument or group of debt instruments in exchange for the assumption of credit risk on the same instruments. In the event of a credit event, usually in the form of a credit rating downgrade, the party receiving periodic payments
| 42 | SEI Catholic Values Trust / Annual Report / February 28, 2019 |
(i.e. floating rate payer) must pay the other party (i.e. fixed rate payer) an amount equal to the recovery rate used to settle the contracts. The recovery rate is a function of how many credit default swap investors wish to deliver the security or receive the security. The recovery rate is determined through an auction process. Total return swaps allow an investor to benefit from the cash flow without ever actually owning the underlying security. The receiver must pay any decline in value to the payer at the end of the total return swap. However, the investor does not need to make a payment if there is no decline in price. Payments can be made on various indices, bonds (i.e. mortgage backed securities, bank debt and corporate), loans or commodities. The value of a total return swap is equal to the change in value of the underlying asset versus the accrued income payment based on LIBOR or some other form of indices on the notional amount. Payments received or made are recorded as realized gains or loss. A Fund could be exposed to credit or market risk due to unfavorable changes in the fluctuation of interest rates or if the counterparty defaults on its obligation to perform. Risk of loss may exceed amounts recognized on the statement of assets and liabilities. Interest rate swap contracts outstanding at period end, if any, are listed after a Fund’s portfolio. In connection with swap agreements securities may be set aside as collateral by a Fund’s custodian.
Swaps are“marked-to-market” daily based upon quotations from market makers and the resulting changes in market values, if any, are recorded as an unrealized gain or loss in the Statement of Operations. Centrally Cleared swaps are valued at the settlement price established each day by the board on exchange on which they are traded. The daily settlement prices for centrally cleared swaps are provided by an independent source. Net payments of interest are recorded as realized gains or losses. Daily changes in valuation of Centrally Cleared swaps, if any, are recorded as a receivable or payable for the change in value as appropriate (“Variation Margin”) on the Statements of Assets and Liabilities.
Entering into swap agreements involves, to varying degrees, elements of credit and market risk in excess of the amounts recognized on the Statement of Assets and Liabilities. Such risks involve the possibility that there will be no liquid market for these agreements, that the counterparty to the agreement may default on its obligation to perform and that there may be unfavorable changes in the fluctuation of interest rates. Risks also arise from potential losses from adverse market movements.
It is the Funds’ policy to present the gross variation margin payable and the gross variation margin
receivable of the swap contracts separately on the Statement of Assets and Liabilities as the Funds do not have a master netting agreement with the counter party to the swap contracts. See Note 3 for further details. Refer to each Fund’s Schedule of Investments, for details regarding open swap agreements as of February 28, 2019, if applicable.
Delayed Delivery Transactions— To the extent consistent with its Investment Objective and Strategies, a Fund may purchase or sell securities on a when-issued or delayed delivery basis. These transactions involve a commitment by the Fund to purchase or sell securities for a predetermined price or yield, with payment and delivery taking place beyond the customary settlement period. When delayed delivery purchases are outstanding, the Fund will set aside liquid assets in an amount sufficient to meet the purchase price. When purchasing a security on a delayed delivery basis, the Fund assumes the rights and risks of ownership of the security, including the risk of price and yield fluctuations, and takes such fluctuations into account when determining its net asset value. The Fund may dispose of or renegotiate a delayed delivery transaction after it is entered into, and may sell when-issued securities before they are delivered, which may result in a capital gain or loss. When the Fund has sold a security on a delayed delivery basis, the Fund does not participate in future gains and losses with respect to the security.
Collateralized Debt Obligations— To the extent consistent with its Investment Objective and Strategies, a Fund may invest in collateralized debt obligations (“CDOs”), which include collateralized loan obligations (“CLOs”) and other similarly structured securities. CLOs are a type of asset-backed securities. A CLO is a trust typically collateralized by a pool of loans, which may include, among others, domestic and foreign senior secured loans, senior unsecured loans, and subordinate corporate loans, including loans that may be rated below investment grade or equivalent unrated loans. CDOs may charge management fees and administrative expenses.
For CDOs, the cash flows from the trust are split into two or more portions, called tranches, varying in risk and yield. The riskiest portion is the “Equity” tranche which bears the bulk of defaults from the bonds or loans in the trust and serves to protect the other, more senior tranches from default in all but the most severe circumstances. Since it is partially protected from defaults, a senior tranche from a CDO trust typically has a higher rating and lower yield than its underlying securities, and can be rated investment grade. Despite the protection from the equity tranche, CDO tranches can experience substantial losses due to actual defaults, increased sensitivity to defaults due to collateral default
SEI Catholic Values Trust / Annual Report / February 28, 2019 | 43 |
NOTES TO FINANCIAL STATEMENTS (Continued)
February 28, 2019
and disappearance of protecting tranches, market anticipation of defaults, as well as aversion to CDO securities as a class.
The risks of an investment in a CDO depend largely on its Class and its collateral securities. Normally, CLOs and other CDOs are privately offered and sold, and thus, are not registered under the securities laws. As a result, investments in CDOs may be characterized by the Funds as illiquid securities; however, an active dealer market may exist for CDOs, allowing a CDO to qualify for Rule 144A transactions. In addition to the normal risks associated with fixed income securities (e.g., interest rate risk and default risk), CDOs carry additional risks including, but not limited to: (i) the possibility that distributions from collateral securities will not be adequate to make interest or other payments; (ii) the quality of the collateral may decline in value or default; (iii) the Funds may invest in CDOs that are subordinate to other classes; and (iv) the complex structure of the security may not be fully understood at the time of investment and may produce disputes with the issuer or unexpected investment results.
Illiquid Securities— A security is considered illiquid if it cannot be sold or disposed of in the ordinary course of business within seven days or less for its approximate carrying value on the books of a Fund. Valuations of illiquid securities may differ significantly from the values that would have been used had an active market value for these securities existed.
Restricted Securities— Throughout the period, the Funds may own private placement investments that were purchased through private offerings or acquired through initial public offerings that could not be sold without prior registration under the Securities Act of 1933 or pursuant to an exemption there from. In addition, the Funds had generally agreed to further restrictions on the disposition of certain holdings as set forth in various agreements entered into in connection with the purchase of those investments. These investments were valued at amortized cost, which approximates fair value, as determined in accordance with the procedures approved by the Board of Trustees. At February 28, 2019, the Funds did not own any restricted securities.
Classes— Class-specific expenses are borne by that class of shares. Income, expenses, and realized and unrealized gains/losses andnon- class-specific expenses are allocated to the respective class on the basis of relative daily net assets.
Expenses— Expenses that are directly related to one of the Funds are charged directly to that Fund. Other
operating expenses of the Funds are prorated to the Funds on the basis of relative net assets.
Cash and Cash Equivalents— Idle cash and currency balances may be swept into various overnight sweep accounts and are classified as cash equivalents on the Statement of Assets and Liabilities. These amounts, at times, may exceed United States federally insured limits. Amounts swept are available on the next business day.
Dividends and Distributions to Shareholders— The Equity Fund will distribute its net investment income annually. The Fixed Income Fund declares its net investment income daily and distributes monthly. The Funds make distributions of capital gains, if any, at least annually.
Investments in Real Estate Investment Trusts (“REITs”)— Dividend income is recorded based on the income included in distributions received from the REIT investments using published REIT reclassifications including management estimates when actual amounts are not available. Distributions received in excess of this estimated amount are recorded as a reduction of the cost of investments or reclassified to capital gains. The actual amounts of income, return of capital, and capital gains are only determined by each REIT after its fiscalyear-end, and may differ from the estimated amounts.
3. CREDIT DERIVATIVES
A Fund may use credit default swaps to reduce risk where a Fund has exposure to the issuer, or to take an active long or short position with respect to the likelihood of an event of default. The reference obligation of the swap can be a single issuer, a “basket” of issuers, or an index. The underlying referenced assets are corporate debt, sovereign debt and asset backed securities.
The buyer of a credit default swap is generally obligated to pay the seller a periodic stream of payments over the term of the contract in return for a contingent payment upon the occurrence of a credit event with respect to an underlying reference obligation. Generally, a credit event for corporate or sovereign reference obligations means bankruptcy, failure to pay, obligation acceleration, repudiation/moratorium or restructuring. For credit default swaps on asset-backed securities, credit event may be triggered by events such as failure to pay principal, maturity extension, rating downgrade or write-down.
If a Fund is a seller of protection, and a credit event occurs, as defined under the terms of that particular swap agreement, a Fund will generally either (i) pay to the buyer an amount equal to the notional amount of the swap and take delivery of the referenced obligation, other deliverable obligations, or underlying
| 44 | SEI Catholic Values Trust / Annual Report / February 28, 2019 |
securities comprising a referenced index or (ii) pay a net settlement amount in the form of cash or securities equal to the notional amount of the swap less the recovery value of the referenced obligation or underlying securities comprising a referenced index.
If a Fund is a buyer of protection and a credit event occurs, as defined under the terms of that particular swap agreement, a Fund will either (i) receive from the seller of protection an amount equal to the notional amount of the swap and deliver the referenced obligation, other deliverable obligations or underlying securities comprising the referenced index or (ii)
receive a net settlement amount in the form of cash or securities equal to the notional amount of the swap less the recovery value of the referenced obligation or underlying securities comprising the referenced index. Recovery values are assumed by market makers considering either industry standard recovery rates or entity specific factors and considerations until a credit event occurs. If a credit event has occurred, the recovery value is determined by a facilitated auction whereby a minimum number of allowable broker bids, together with a specified valuation method, are used to calculate the settlement value.
As of February 28, 2019, the Fixed Income Fund is the seller (“Providing Protection”) on a total notional amount of $7.7 million. The notional amounts of the swaps are not recorded in the financial statements. The notional amounts approximate the maximum potential amount of future payments that the Fund could be required to make if the Fund were the seller of protection and a credit event were to occur. Those credit default swaps (“CDS”) for which the Fund is providing protection at balance sheet date are summarized as follows:
FIXED INCOME FUND | ||||||||||||||||||||
WRITTEN CREDIT DERIVATIVE CONTRACTS | SINGLE NAME CREDIT DEFAULT SWAPS | CREDIT DEFAULT SWAP INDEX | ||||||||||||||||||
| ASSET | ||||||||||||||||||||
| CORPORATE | SOVERIGN | BACKED | CORPORATE | |||||||||||||||||
REFERENCE ASSET | DEBT | DEBT | SECURITIES | DEBT | Total | |||||||||||||||
Fair value of written credit derivatives | $— | $— | $— | $196,874 | $196,874 | |||||||||||||||
Maximum potential amount of future payments | — | — | — | 7,703,400 | 7,703,400 | |||||||||||||||
Recourse provisions with third parties to recover any amounts paid under the credit derivative (including any purchased credit protection)1 | — | — | — | — | — | |||||||||||||||
Collateral held by the Fund can obtain upon occurrence of triggering event | — | — | — | — | — | |||||||||||||||
| 1 | Potential recoveries would include purchased credit derivatives to the extent they offset written credit derivatives which have an identical underlying, or a netting arrangement or credit support annex with the counterparty. There may be other potential recoveries from recourse provisions where agreements cover multiple derivative arrangements but those amounts have not been included. |
MAXIMUM POTENTIAL AMOUNT OF FUTURE PAYMENTS BY CONTRACT TERM |
| |||||||||||||||||||||||
FIXED INCOME FUND | 0-6 MONTHS | 6-12 MONTHS | 1-5 YEARS | 5-10 YEARS | > 10 YEARS | Total | ||||||||||||||||||
Current credit spread* on underlying (in basis points) | ||||||||||||||||||||||||
0-100 | $— | $— | $6,400,000 | $— | $— | $6,400,000 | ||||||||||||||||||
> than 100 | — | — | 1,303,400 | — | — | 1,303,400 | ||||||||||||||||||
Total | $— | $— | $7,703,400 | $— | $— | $7,703,400 | ||||||||||||||||||
| * | The credit spread on the underlying asset is generally indicative of the current status of the underlying risk of the Fund having to perform. The spread also reflects the cost of buying/selling protection and may include upfront payments required to be made to enter into a contract. Higher credit spreads with a shorter contract term is indicative of a higher likelihood of performance by the Fund. |
The credit spread disclosed above for each reference obligation where the Fund is the seller of protection is a representation of the current payment/performance risk of the swap.
4. DERIVATIVE TRANSACTIONS
The following tables include only Funds that had exposure to more than one type of risk on derivatives held throughout the period. For Funds that held derivatives throughout the period with only one type of risk exposure, additional information can be found on the Schedule of Investments and the Statement of Operations.
SEI Catholic Values Trust / Annual Report / February 28, 2019 | 45 |
NOTES TO FINANCIAL STATEMENTS (Continued)
February 28, 2019
The fair value of derivative instruments as of February 28, 2019 was as follows ($ Thousands):
| Asset Derivatives | Liability Derivatives | |||||||||||
| Statement of Assets and Liabilities Location | Fair Value | Statement of Assets and Liabilities Location | Fair Value | |||||||||
Derivatives not accounted for as hedging instruments: | ||||||||||||
Fixed Income Fund | ||||||||||||
Interest rate contracts | Net Assets — Unrealized appreciation on futures contracts | $ 56* | Net Assets — Unrealized depreciation on futures contracts | $ 27* | ||||||||
Net Assets — Unrealized appreciation on swap contracts | 51† | Net Assets — Unrealized depreciation on swap contracts | 16† | |||||||||
| Options purchased, at value | — | Options written, at value | 1 | |||||||||
Foreign exchange contracts | Unrealized gain on forward foreign currency contracts | 98 | Unrealized loss on forward foreign currency contracts | 84 | ||||||||
| Options purchased, at value | 19 | Options written, at value | — | |||||||||
Credit Contracts | Net Assets — Unrealized appreciation on swap contracts | 60† | Net Assets — Unrealized depreciation on swap contracts | —† | ||||||||
|
|
|
| |||||||||
Total Derivatives not accounted for as hedging instruments | $284 | $128 | ||||||||||
|
|
|
| |||||||||
| * | Includes cumulative appreciation/depreciation of futures contracts as reported in the Schedules of Investments. Only current day’s variation margin is reported within the Statements of Assets & Liabilities. |
| † | Includes cumulative appreciation/depreciation of swap contracts as reported in the Schedules of Investments. Market Value is reported within the Statements of Assets & Liabilities for swap contracts that have paid premiums. |
The effect of derivative instruments on the Statements of Operations for the year ended February 28, 2019.
Amount of realized gain or (loss) on derivatives recognized in income ($ Thousands):
| Derivatives Not Accounted for as Hedging Instruments | Options | Futures | Forward Currency Contracts | Swaps | Total | |||||||||||||||
Equity Fund | ||||||||||||||||||||
Equity Contracts | $— | $ (237) | $ — | $— | $(237) | |||||||||||||||
Foreign Exchange Contracts | — | — | 39 | — | 39 | |||||||||||||||
Total | $ — | $ (237) | $ 39 | $— | $(198) | |||||||||||||||
Fixed Income Fund | ||||||||||||||||||||
Interest Rates | $ (3) | $ 71 | $ — | $ 235 | $ 303 | |||||||||||||||
Foreign exchange contracts | (13) | — | (65) | — | (78) | |||||||||||||||
Credit contracts | — | — | — | 45 | 45 | |||||||||||||||
Total | $ (16) | $ 71 | $ (65) | $ 280 | $ 270 | |||||||||||||||
Change in unrealized appreciation or (depreciation) on derivatives recognized in income ($ Thousands):
| Derivatives Not Accounted for as Hedging Instruments | Options | Futures | Forward Currency Contracts | Swaps | Total | |||||||||||||||
Equity Fund | ||||||||||||||||||||
Equity Contracts | $ — | $ 570 | $ — | $ — | $ 570 | |||||||||||||||
Total | $ — | $ 570 | $ — | $ — | $ 570 | |||||||||||||||
Fixed Income Fund | ||||||||||||||||||||
Interest Rates | $ (36) | $ (5) | $ — | $ (77) | $ (118) | |||||||||||||||
Foreign exchange contracts | — | — | 47 | — | 47 | |||||||||||||||
Credit contracts | — | — | — | 68 | 68 | |||||||||||||||
Total | $ (36) | $ (5) | $ 47 | $ (9) | $ (3) | |||||||||||||||
| 46 | SEI Catholic Values Trust / Annual Report / February 28, 2019 |
The following table discloses the volume of the Fund’s futures contracts, forward foreign currency contracts and swap activity during the year ended February 28, 2019
($ Thousands):
| Catholic Values Fixed Income Fund | ||||
Futures Contracts: | ||||
Interest Contracts | ||||
Average Notional Balance Long | $ | 33,304 | ||
Average Notional Balance Short | 12,964 | |||
Ending Notional Balance Long | 30,371 | |||
Ending Notional Balance Short | 11,235 | |||
Forward Foreign Currency Contracts: |
| |||
Average Notional Balance Long | 9,601 | |||
Average Notional Balance Short | 9,567 | |||
Ending Notional Balance Long | 12,636 | |||
Ending Notional Balance Short | 12,649 | |||
Swaps: | ||||
Credit Contracts | ||||
Average Notional Balance Short | 5,664 | |||
Ending Notional Balance Short | 7,703 | |||
Interest Contracts | ||||
Average Notional Balance Long | 13,984 | |||
Average Notional Balance Short | 13,984 | |||
Ending Notional Balance Long | 10,648 | |||
Ending Notional Balance Short | 10,648 | |||
Options: | ||||
Interest | ||||
Average Notional Balance Long† | 8 | |||
Average Notional Balance Short† | 11 | |||
Ending Notional Balance Short† | 4 | |||
Currency | ||||
Average Notional Balance Long† | 17 | |||
Average Notional Balance Short† | 6 | |||
Ending Notional Balance Long† | 22 | |||
† Represents cost. | ||||
5. INVESTMENT ADVISORY, ADMINISTRATION AND DISTRIBUTION AGREEMENTS, INVESTMENTSUB-ADVISORY AGREEMENTS AND OTHER TRANSACTIONS WITH AFFILIATES
Investment Advisory, Administration, Distribution and Custodian Agreements—SIMC serves as each Fund’s investment adviser (the “Adviser”) and “Manager of Managers” under an investment advisory agreement approved by the shareholders of each Fund. In connection with serving as Adviser, SIMC is entitled to a
fee, which is calculated daily and paid monthly, based on the average daily net assets of each Fund.
SEI Investments Global Funds Services (the “Administrator”) provides the Trust with administrative and transfer agency services. For its services, the Administrator is entitled to a fee, which is calculated daily and paid monthly, based on the average daily net assets of each Fund.
The Fund has adopted a shareholder servicing plan (the “Shareholder Servicing Plan”) under which a shareholder servicing fee of up to 0.25% of the average daily net assets of Class F shares of the Funds will be paid to other service providers. Under the Shareholder Servicing Plan, other service providers may perform, or may compensate other service providers for performing, certain shareholder and administrative services.
The Adviser, Administrator and/or Distributor have voluntarily agreed to waive a portion of their fees in order to keep total direct operating expenses (exclusive of interest from borrowings, brokerage commissions, taxes, Trustee fees, prime broker fees, interest and dividend expenses related to short sales and extraordinary expenses not incurred in the ordinary course of the Funds’ business) at a specified level.
The waivers by the Funds’ Adviser, Administrator and/or Distributor are limited to the Funds’ direct operating expenses and, therefore, do not apply to indirect expenses incurred by the Funds, such as acquired fund fees and expenses. The waivers are voluntary and the Funds’ Adviser, Administrator and/or Distributor may discontinue all or part of any of these waivers at any time. In addition, some Funds may participate in a commission recapture program where the Funds’ trades may be executed through the Funds’ distributor, and a portion of the commissions paid on those trades are then used to pay the Funds’ expenses.
The following is a summary of annual fees payable to the Adviser and Distributor and the voluntary expense limitations for each Fund:
| Advisory Fee | Shareholder Servicing Fee | Voluntary Expense Limitation | ||||
Equity Fund | ||||||
Class F | 0.60% | 0.25% | 0.86% | |||
Class Y | 0.60% | 0.00% | 0.76% | |||
Fixed Income Fund | ||||||
Class F | 0.35% | 0.25% | 0.71% | |||
Class Y | 0.35% | 0.00% | 0.61% |
SEI Catholic Values Trust / Annual Report / February 28, 2019 | 47 |
NOTES TO FINANCIAL STATEMENTS (Continued)
February 28, 2019
The following is a summary of annual fees payable to the Administrator:
| First $1.5 Billion | Next $500 Million | Next $500 Million | Next $500 Million | Over $3 Billion | ||||||||||||||||
Equity Fund | 0.300 | % | 0.260 | % | 0.210 | % | 0.1700 | % | 0.120 | % | ||||||||||
Fixed Income Fund | 0.200 | % | 0.1775 | % | 0.1550 | % | 0.1325 | % | 0.110 | % | ||||||||||
InvestmentSub-Advisory Agreements— As of February 28, 2019, SIMC has entered into InvestmentSub-Advisory Agreements with the following parties:
InvestmentSub-Adviser
Equity Fund
Brandywine Global Investment Management, LLC
Coho Partners, Ltd.
EAM Investors, LLC
EARNEST Partners, LLC
Fred Alger Management, Inc
Parametric Portfolio Associates LLC
Snow Capital Management, L.P.
Fixed Income Fund
Income Research & Management
Western Asset Management Company
Western Asset Management Company Limited
Under the investmentsub-advisory agreements, eachsub-adviser receives an annual fee, paid by SIMC.
The Administrator and Distributor have voluntarily agreed to waive a portion of their fee for each fund. The following table lists the waivers for the year ended February 28, 2019 ($ Thousands):
| Administration Fee Waiver | Shareholder Servicing Fee Waiver (Class F) | |||||||
Equity Fund | $ 101 | $ 431 | ||||||
Fixed Income Fund | 65 | 225 | ||||||
U.S. Bank, N.A. serves as the custodian of the Fixed Income Fund. Brown Brothers Harriman & Co. serves as the custodian of the Equity Fund. The custodian plays no role in determining the investment policies of the Funds or which securities are to be purchased or sold in the Funds.
Investment in Affiliated Securities— The Funds may invest in the SEI Daily Income Trust Government Fund, an affiliated money market fund to manage excess cash or to serve as margin or collateral for derivative positions. Refer to the Fund’s Schedule of Investments for details regarding transactions with affiliates for the year ended February 28, 2019, if applicable.
Payment to Affiliates— Certain officers and Trustees of the Trust are also officers and/or Trustees of the Administrator, Adviser, or the Distributor. The Trust pays each unaffiliated Trustee an annual fee for attendance at quarterly, interim, and committee meetings. The
Administrator, Adviser and/or the Distributor pays compensation of Officers and affiliated Trustees.
A portion of the services provided by the Chief Compliance Officer (“CCO”) and his staff, whom are employees of the administrator, are paid for by the Trust as incurred.
Interfund Lending— The SEC has granted an exemption that permits the Trust to participate in an interfund lending program (the “Program”) with existing or future investment companies registered under the 1940 Act that are advised by SIMC (the “SEI Funds”). The Program allows the SEI Funds to lend money to and borrow money from each other for temporary or emergency purposes.
Participation in the Program is voluntary for both borrowing and lending funds.
Interfund loans may be made only when the rate of interest to be charged is more favorable to the lending fund than an investment in overnight repurchase agreements (“Repo Rate”), and more favorable to the borrowing fund than the rate of interest that would be charged by a bank for short-term borrowings (“Bank Loan Rate”). The Bank Loan Rate will be determined using a formula reviewed annually by the Trust’s Board of Trustees. The interest rate imposed on interfund loans is the average of the Repo Rate and the Bank Loan Rate. As of February 28, 2019 and for the year then ended, the Trust has not participated in the Program.
6. INVESTMENT TRANSACTIONS
The cost of security purchases and the proceeds from the sale and maturities of securities other than temporary cash investments, during the year ended February 28, 2019, were as follows:
| U.S. Gov’t ($ Thousands) | Other ($ Thousands) | Total ($ Thousands) | ||||||||||||||||||||||
Equity Fund | ||||||||||||||||||||||||
Purchases | $ | — | $ | 127,684 | $ | 127,684 | ||||||||||||||||||
Sales | — | 120,580 | 120,580 | |||||||||||||||||||||
Fixed Income Fund | ||||||||||||||||||||||||
Purchases | 198,744 | 30,034 | 228,778 | |||||||||||||||||||||
Sales | 211,400 | 21,626 | 233,026 | |||||||||||||||||||||
| 48 | SEI Catholic Values Trust / Annual Report / February 28, 2019 |
7. FEDERAL TAX INFORMATION
It is each Fund’s intention to continue to qualify as a regulated investment company for Federal income tax purposes and distribute all of its taxable income (including net capital gains). Accordingly, no provision for Federal income taxes is required.
Reclassification of Components of Net Assets— The timing and characterization of certain income and capital gain distributions are determined annually in accordance with Federal tax regulations which may differ from
accounting principles generally accepted in the United States. As a result, net investment income (loss) and net realized gain (loss) on investment transactions for the reporting period may differ from distributions during such period. These book/tax differences may be temporary or permanent in nature.
To the extent these differences are permanent, they are charged or credited toPaid-in Capital and Distributable Earnings, as appropriate, in the periods that the differences arise.
The tax character of dividends and distributions during the last two fiscal years was as follows:
| Ordinary Income ($ Thousands) | Long-term ($ Thousands) | Total ($ Thousands) | ||||||||||
Equity Fund | ||||||||||||
2019 | $ | 4,437 | $ | 8,251 | $ | 12,688 | ||||||
2018 | 1,776 | — | 1,776 | |||||||||
Fixed Income Fund | ||||||||||||
2019 | 4,367 | — | 4,367 | |||||||||
2018 | 2,847 | — | 2,847 | |||||||||
As of February 28, 2019, the components of Distributable Earnings/(Accumulated Losses) on a tax basis were as follows:
Undistributed Ordinary Income ($ Thousands) | Undistributed Long-Term Capital Gain ($ Thousands) | Capital Loss | Post- October Losses ($ Thousands) | Late Year Ordinary Losses ($ Thousands) | Unrealized Appreciation (Depreciation) ($ Thousands) | Other Temporary Differences ($ Thousands) | Total Distributable Earnings/ (Accumulated Losses) ($ Thousands) | |||||||||||||||
Equity Fund | $ | 405 | $ | 3,039 | $ | — | $ (1,287) | $ — | $ 36,752 | $ (28) | $ 38,881 | |||||||||||
Fixed Income Fund | 389 | — | (1,406 | ) | — | — | (889) | (559) | (2,465) | |||||||||||||
Post October losses represent losses realized on investment transactions from November 1, 2018 through February 28, 2019 that, in accordance with Federal income tax regulations, the Funds may defer and treat as having arisen in the following fiscal year. Deferred Late-Year Losses represent ordinary losses realized on investment transactions from January 1, 2019 through February 28, 2019 and specified losses realized on investment transactions from November 1, 2018 through February 28, 2019, that, in accordance with Federal income tax regulations, the Fund defers and treats as having arisen in the following fiscal year.
Under the Regulated Investment Company Modernization Act of 2010, the Funds are permitted to carry forward capital losses incurred in taxable years beginning after December 22, 2010 for an unlimited period. However, any losses incurred during those future taxable years will be required to be utilized prior to the losses incurred inpre-enactment taxable years. As a result of this ordering rule,pre-enactment
capital loss carryforwards may be more likely to expire unused. Additionally, post-enactment capital losses that are carried forward will retain their character as either short-term or long-term capital losses rather than being considered all short-term as under previous law. Losses carried forward under these new provisions are as follows:
Short-Term ($ Thousands) | Long-Term ($ Thousands) | Total * ($ Thousands) | ||||||||||
Fixed Income Fund | $ | 76 | 1,330 | 1,406 | ||||||||
| * | This table should be used in conjunction with the capital loss carryforwards table. |
For Federal income tax purposes, the cost of securities owned at February 28, 2019, and net realized gains or losses on securities sold for the period, were different from amounts reported for financial reporting purposes, primarily due to wash sales, PFIC MTM, and MLP basis adjustments, which cannot be used for Federal income tax purposes in the current year and have been deferred for use in future years.
SEI Catholic Values Trust / Annual Report / February 28, 2019 | 49 |
NOTES TO FINANCIAL STATEMENTS (Continued)
February 28, 2019
The Federal tax cost and aggregate gross unrealized appreciation and depreciation on investments held by the Funds at February 28, 2019, were as follows:
Federal Tax Cost ($ Thousands) | Aggregate Gross Appreciation | Aggregate Gross Unrealized Depreciation ($ Thousands) | Net Unrealized Appreciation/ (Depreciation) ($ Thousands) | |||||||||
Equity Fund | $ | 224,287 | $ 48,023 | $ (11,271) | $ 36,752 | |||||||
Fixed Income Fund | 153,138 | 1,130 | (2,019) | (889) | ||||||||
Management has analyzed the Funds’ tax positions taken on Federal income tax returns for all open tax years and has concluded that as of February 28, 2019, no provision for income tax would be required in the Funds’ financial statements. The Funds’ Federal and state income and Federal excise tax returns for tax years for which the applicable statutes of limitations have not expired are subject to examination by the Internal Revenue Service and state departments of revenue.
8. CONCENTRATION/RISKS
In the normal course of business, a Fund may enter into contracts that provide general indemnifications by a Fund to the counterparty to the contract. A Fund’s maximum exposure under these arrangements is dependent on future claims that may be made against a Fund and, therefore, cannot be established; however, based on experience, management believes the risk of loss from such claim is considered remote.
The market values of the Fixed Income Fund’s investments will change in response to interest rate changes and other factors. During periods of falling interest rates, the values of fixed income securities generally rise. Conversely, during periods of rising interest rates, the values of such securities generally decline. Changes by recognized rating agencies in the ratings of any fixed income security and in the ability of an issuer to make payments of interest and principal may also affect the value of these investments.
The following descriptions provide additional information about some of the risks of investing in the Funds:
Asset-Backed Securities Risk— Payment of principal and interest on asset-backed securities is dependent largely on the cash flows generated by the assets backing the securities, and asset-backed securities may not have the benefit of any security interest in the related assets.
Bank Loans Risk— With respect to bank loans, the Fund will assume the credit risk of both the borrower and the lender that is selling the participation in the loan. The Fund may also have difficulty disposing of bank
loans because, in certain cases, the market for such instruments is not highly liquid.
Below Investment Grade Securities (Junk Bonds) Risk— Fixed income securities rated below investment grade ( junk bonds) involve greater risks of default or downgrade and are generally more volatile than investment grade securities because the prospect for repayment of principal and interest of many of these securities is speculative. Because these securities typically offer a higher rate of return to compensate investors for these risks, they are sometimes referred to as “high yield bonds,” but there is no guarantee that an investment in these securities will result in a high rate of return. These risks may be increased in foreign and emerging markets.
Commercial Paper Risk— Commercial paper is a short-term obligation with a maturity generally ranging from one to 270 days and is issued by U.S. or foreign companies or other entities in order to finance their current operations. Such investments are unsecured and usually discounted from their value at maturity. The value of commercial paper may be affected by changes in the credit rating or financial condition of the issuing entities and will tend to fall when interest rates rise and rise when interest rates fall. Asset-backed commercial paper may be issued by structured investment vehicles or other conduits that are organized to issue the commercial paper and to purchase trade receivables or other financial assets. The repayment of asset-backed commercial paper depends primarily on the cash collections received from such issuer’s underlying asset portfolio and the issuer’s ability to issue new asset-backed commercial paper.
Corporate Fixed Income Securities Risk— Corporate fixed income securities respond to economic developments, especially changes in interest rates, as well as perceptions of the creditworthiness and business prospects of individual issuers.
Catholic Values Investing Risk— The Funds consider the United States Conference of Catholic Bishops’ Socially Responsible Investing Guidelines (“Guidelines”) in its investment process and may choose not to purchase, or may sell, otherwise profitable investments in companies which have been identified as being in conflict with the Guidelines. This means that the Funds
| 50 | SEI Catholic Values Trust / Annual Report / February 28, 2019 |
may underperform other similar mutual funds that do not consider the Guidelines when making investment decisions.
Currency Risk— To the extent a Fund takes positions in currencies, it will be subject to the risk that currency exchange rates may fluctuate in response to, among other things, changes in interest rates, intervention (or failure to intervene) by U.S. or foreign governments, central banks or supranational entities, or by the imposition of currency controls or other political developments in the United States or abroad.
Credit Risk— The risk that the issuer of a security or the counterparty to a contract will default or otherwise become unable to honor a financial obligation.
Depositary Receipts Risk— Depositary receipts, such as American Depositary Receipts (ADRs), are certificates evidencing ownership of shares of a foreign issuer that are issued by depositary banks and generally trade on an established market. Depositary receipts are subject to many of the risks associated with investing directly in foreign securities, including, among other things, political, social and economic developments abroad, currency movements and different legal, regulatory and tax environments.
Derivatives Risk— The Fund’s use of swaps is subject to market risk, leverage risk, correlation risk, credit risk, valuation risk and liquidity risk. Credit risk is described above. Leverage risk and liquidity risk are described below. Manyover-the-counter (OTC) derivative instruments will not have liquidity beyond the counterparty to the investment. Market risk is the risk that the market value of an investment may move up and down, sometimes rapidly and unpredictably. Correlation risk is the risk that changes in the value of the derivative may not correlate perfectly with the underlying asset, rate or index. Valuation risk is the risk that the derivative may be difficult to value and/or valued incorrectly. Each of these risks could cause the Fund to lose more than the principal amount invested in a swap. Some derivatives have the potential for unlimited loss, regardless of the size of the Fund’s initial investment. The other parties to certain derivative contracts present the same types of credit risk as issuers of fixed income securities. The Fund’s use of derivatives may also increase the amount of taxes payable by some shareholders. Both U.S. andnon-U.S. regulators are in the process of adopting and implementing regulations governing derivatives markets, the ultimate impact of which remains unclear.
Duration Risk— The longer-term securities in which the Fund may invest are more volatile. A portfolio with a longer average portfolio duration is more sensitive to
changes in interest rates than a portfolio with a shorter average portfolio duration.
Equity Securities Risk— The risk that stock prices (including preferred stocks, common stocks and warrants) will fall over short or extended periods of time.
Exchange-Traded Funds Risk— The risks of owning shares of an ETF generally reflect the risks of owning the underlying securities the ETF is designed to track, although lack of liquidity in an ETF could result in its value being more volatile than the underlying portfolio securities. When the Fund invests in an ETF, in addition to directly bearing the expenses associated with its own operations, it will bear a pro rata portion of the ETF’s expenses.
Extension Risk— The risk that rising interest rates may extend the duration of a fixed income security, typically reducing the security’s value.
Fixed Income Market Risk— The prices of a Fund’s fixed income securities respond to economic developments, particularly interest rate changes, as well as to perceptions about the creditworthiness of individual issuers, including governments and their agencies. Generally, the Fund’s fixed income securities will decrease in value if interest rates rise and vice versa. In the case of foreign securities, price fluctuations will reflect international economic and political events, as well as changes in currency valuations relative to the U.S. dollar.
Foreign Investment/Emerging Markets Risk— The risk thatnon-U.S. securities may be subject to additional risks due to, among other things, political, social and economic developments abroad, currency movements, and different legal, regulatory and tax environments. These additional risks may be heightened with respect to emerging market countries since political turmoil and rapid changes in economic conditions are more likely to occur in these countries.
Foreign Sovereign Debt Securities Risk— The risk that (i) the governmental entity that controls the repayment of sovereign debt may not be willing or able to repay the principal and/or interest when it becomes due, because of factors such as debt service burden, political constraints, cash flow problems and other national economic factors; (ii) governments may default on their debt securities, which may require holders of such securities to participate in debt rescheduling or additional lending to defaulting governments; and (iii) there is no bankruptcy proceeding by which defaulted sovereign debt may be collected in whole or in part.
Interest Rate Risk— The risk that a rise in interest rates will cause a fall in the value of fixed income securities, including U.S. Government Securities, in which the
SEI Catholic Values Trust / Annual Report / February 28, 2019 | 51 |
NOTES TO FINANCIAL STATEMENTS (Concluded)
February 28, 2019
Fund invests. Although U.S. Government securities are considered to be among the safest investments, they are not guaranteed against price movements due to changing interest rates. A low interest rate environment may present greater interest rate risk, because there may be a greater likelihood of rates increasing and rates may increase more rapidly.
Investment Style Risk— The risk that the equity securities in which the Fund invests may underperform other segments of the equity markets or the equity markets as a whole.
Leverage Risk— The Fund’s use of equity swaps may result in the Fund’s total investment exposure substantially exceeding the value of its portfolio securities and the Fund’s investment returns depending substantially on the performance of securities that the Fund may not directly own. The use of leverage can amplify the effects of market volatility on the Fund’s share price and may also cause the Fund to liquidate portfolio positions when it would not be advantageous to do so in order to satisfy its obligations. The Fund’s use of leverage may result in a heightened risk of investment loss.
Liquidity Risk— The risk that certain securities may be difficult or impossible to sell at the time and the price that the Fund would like. The Fund may have to lower the price of the security, sell other securities instead or forego an investment opportunity, any of which could have a negative effect on Fund management or performance.
Manager Risk— The success of the Fund’s investment strategy depends both on SIMC’s selection of theSub-Advisers and allocating assets to suchSub-Advisers, as well as theSub-Advisers’ success or failure in implementing the Fund’s investment strategies. SIMC or aSub-Adviser may be incorrect in assessing market trends, the value or growth capability of particular securities or asset classes.
Mortgage-Backed Securities Risk— Mortgage-backed securities are affected by, among other things, interest rate changes and the possibility of prepayment of the underlying mortgage loans. Mortgage-backed securities are also subject to the risk that underlying borrowers will be unable to meet their obligations.
Participation Notes(P-Notes) Risk— Participation notes(P-Notes) are participation interest notes that are issued by banks or broker-dealers and are designed to offer a return linked to a particular underlying equity, debt, currency or market. Investments inP-Notes involve the same risks associated with a direct investment in the underlying foreign companies or foreign securities markets that they seek to replicate. However, there can be no assurance that the trading price ofP-Notes will
equal the underlying value of the foreign companies or foreign securities markets that they seek to replicate.
Portfolio Turnover Risk— Due to its investment strategy, the Fund may buy and sell securities frequently. This may result in higher transaction costs and additional capital gains tax liabilities, which may affect the Fund’s performance.
Prepayment Risk— The risk that, in a declining interest rate environment, fixed income securities with stated interest rates may have the principal paid earlier than expected, requiring the Fund to invest the proceeds at generally lower interest rates.
Small and Medium Capitalization Risk— The risk that small and medium capitalization companies in which the Fund may invest may be more vulnerable to adverse business or economic events than larger, more established companies. In particular, small and medium capitalization companies may have limited product lines, markets and financial resources and may depend upon a relatively small management group. Therefore, small capitalization and medium capitalization stocks may be more volatile than those of larger companies. Small capitalization and medium capitalization stocks may be tradedover-the-counter or listed on an exchange.
U.S. Government Securities Risk— Although U.S. Government securities are considered to be among the safest investments, they are not guaranteed against price movements due to changing interest rates. Obligations issued by some U.S. Government agencies are backed by the U.S. Treasury, while others are backed solely by the ability of the agency to borrow from the U.S. Treasury or by the agency’s own resources.
Warrants Risk— Warrants are instruments that entitle the holder to buy an equity security at a specific price for a specific period of time. Warrants may be more speculative than other types of investments. The price of a warrant may be more volatile than the price of its underlying security, and a warrant may offer greater potential for capital appreciation as well as capital loss. A warrant ceases to have value if it is not exercised prior to its expiration date.
Please refer to each Fund’s current prospectus for additional disclosure regarding the risks associated with investing in the Funds. The foregoing is not intended to be a complete discussion of the risks associated with the investment strategies of the Funds.
| 52 | SEI Catholic Values Trust / Annual Report / February 28, 2019 |
9. CONCENTRATION OF SHAREHOLDERS
SEI Private Trust Company (“SPTC”) and SIMC are subsidiaries of SEI Investments Company. As of February 28, 2019, SPTC held of record the following:
Equity Fund | ||||
Class F | 99.24 | % | ||
Class Y | 75.75 | % | ||
Fixed Income Fund | ||||
Class F | 99.77 | % | ||
Class Y | 66.98 | % |
SPTC is not a direct service provider to the Funds. However, SPTC performs a key role in the comprehensive investment solution that SEI provides to investors. SPTC holds the vast majority of shares in the Funds as custodian for shareholders that are clients of the advisors and financial planners. SPTC maintains accounts at SEI Institutional Transfer Agency (“SITA”), and operates in an omnibus fund account environment.
10. REGULATORY MATTERS
On August 17, 2018, the SEC adopted amendments to RegulationS-X. These changes are effective for periods after November 5, 2018. The updates to Registered Investment Companies were mainly focused on simplifying the presentation of distributable earnings by eliminating the need to present the components of distributable earnings on a book basis in the Statements of Assets and Liabilities. The update also impacted the presentation of undistributed net investment income and distribution to shareholders on the Statements of Changes in Net Assets. The amounts presented in the current Statements of Changes in Net Assets represent the aggregated total distributions of net investment income and realized capital gains, except for distributions classified as return of capital which are still presented separately. The disaggregated amounts from the prior fiscal year are broken out below if there were both distributions from net investment income and realized capital gains. Otherwise, the amount on the current Statement of Changes for the prior fiscal year end represents distributions of net investment income.
11. NEW ACCOUNTING PRONOUNCEMENT
In August 2018, The FASB issued Accounting Standards Update2018-13, Fair Value Measurement (Topic 820). The new guidance includes additions and modifications to disclosures requirements for fair value measurements. For public entities, the amendments are effective for financial statements issued for fiscal years beginning after December 15, 2019, and interim periods within those fiscal years. At this time, management is currently evaluating the impact of this new guidance on the financial statements and disclosures.
12. SUBSEQUENT EVENTS
Management has evaluated the need for disclosures and/or adjustments resulting from subsequent events through the date the financial statements were issued. Based on this evaluation, no disclosures and/or adjustments were required to the financial statements as of February 28, 2019.
SEI Catholic Values Trust / Annual Report / February 28, 2019 | 53 |
REPORT OF INDEPENDENT REGISTERED ACCOUNTING FIRM
To the Shareholders of the Funds and Board of Trustees
SEI Catholic Values Trust:
Opinion on the Financial Statements
We have audited the accompanying statements of assets and liabilities of Catholic Values Equity Fund and Catholic Values Fixed Income Fund (collectively, the “Funds”), including the schedules of investments, as of February 28, 2019, the related statements of operations for the year then ended, the statements of changes in net assets for each of the years in thetwo-year period then ended, and the related notes (collectively, the “financial statements”) and the financial highlights for each of the years or periods in the four-year period then ended. In our opinion, the financial statements and financial highlights present fairly, in all material respects, the financial position of the Funds as of February 28, 2019, the results of their operations for the year then ended, the changes in their net assets for each of the years in thetwo-year period then ended, and the financial highlights for each of the years or periods in the four-year period then ended, in conformity with U.S. generally accepted accounting principles.
Basis for Opinion
These financial statements and financial highlights are the responsibility of the Funds’ management. Our responsibility is to express an opinion on these financial statements and financial highlights based on our audits. We are a public accounting firm registered with the Public Company Accounting Oversight Board (United States) (“PCAOB”) and are required to be independent with respect to the Fund in accordance with the U.S. federal securities laws and the applicable rules and regulations of the Securities and Exchange Commission and the PCAOB.
We conducted our audits in accordance with the standards of the PCAOB. Those standards require that we plan and perform the audit to obtain reasonable assurance about whether the financial statements and financial highlights are free of material misstatement, whether due to error or fraud. Our audits included performing procedures to assess the risks of material misstatement of the financial statements and financial highlights, whether due to error or fraud, and performing procedures that respond to those risks. Such procedures included examining, on a test basis, evidence regarding the amounts and disclosures in the financial statements and financial highlights. Such procedures also included confirmation of securities owned as of February 28, 2019, by correspondence with the custodians, transfer agents and brokers or by other appropriate auditing procedures when replies from brokers were not received. Our audits also included evaluating the accounting principles used and significant estimates made by management, as well as evaluating the overall presentation of the financial statements and financial highlights. We believe that our audits provide a reasonable basis for our opinion.

We have served as the auditor of one or more SEI Funds Investment Companies since 2005.
Philadelphia, Pennsylvania
April 29, 2019
| 54 | SEI Catholic Values Trust / Annual Report / February 28, 2019 |
TRUSTEES AND OFFICERS OF THE TRUST (Unaudited)
The following chart lists Trustees and Officers as of February 28, 2019.
Set forth below are the names, addresses, ages, position with the Trust, Term of Office and Length of Time Served, the principal occupations for the last five years, number of positions in fund complex overseen by trustee, and other directorships outside the fund complex of each of the persons currently serving as Trustees and Officers of the Trust. The Trust’s Statement of Additional Information (“SAI”) includes additional information about the Trustees and Officers. The SAI may be obtained without charge by calling1-800-342-5734.
Name, Address, and Age | Position(s) Held with Trusts | Term of Office and Length of Time Served1 | Principal Occupation(s) During Past Five Years | Number of Portfolios in Fund Complex Overseen by Trustee2 | Other Directorships Held by Trustee | |||||
| INTERESTED TRUSTEES | ||||||||||
Robert A. Nesher One Freedom Valley Drive Oaks, PA 19456 | Chairman of the Board of Trustees* | since 1995 | Currently performs various services on behalf of SEI for which Mr. Nesher is compensated. | 101 | Vice Chairman of The Advisors’ Inner Circle Fund III, Winton Series Trust and Winton Diversified Opportunities Fund since 2014. Vice Chairman of Gallery Trust since 2015. President and Director of SEI Structured Credit Fund, LP. Director of SEI Global Master Fund plc, SEI Global Assets Fund plc, SEI Global Investments Fund plc, SEI Investments—Global Funds Services, Limited, SEI Investments Global, Limited, SEI Investments (Europe) Ltd., SEI Multi-Strategy Funds PLC, SEI Global Nominee Ltd and SEI Investments—Unit Trust Management (UK) Limited. Director and President of SEI Opportunity Fund, L.P. to 2010. President, Director and Chief Executive Officer of SEI Alpha Strategy Portfolios, LP from 2007 to 2013. Trustee of SEI Liquid Asset Trust from 1989 to 2016. Vice Chairman of O’Connor EQUUS(closed-end investment company) from 2014 to 2016. Vice Chairman of The Advisors’ Inner Circle Fund III, Winton Series Trust, Winton Diversified Opportunities Fund(closed-end investment company) and Gallery Trust. Trustee of The Advisors’ Inner Circle Fund, The Advisors’ Inner Circle Fund II, Bishop Street Funds, and the KP Funds. President, Chief Executive Officer and Trustee of SEI Asset Allocation Trust, SEI Daily Income Trust, SEI Institutional Managed Trust, SEI Institutional International Trust, SEI Institutional Investments Trust, SEI Tax Exempt Trust, SEI Insurance Products Trust, Adviser Managed Trust, The New Covenant Funds and SEI Catholic Values Trust. | |||||
William M. Doran One Freedom Valley Drive Oaks, PA 19456 | Trustee* | since 1995 | Self-employed consultant since 2003. Partner, Morgan, Lewis & Bockius LLP (law firm) from 1976 to 2003, counsel to the Trust, SEI, SIMC, the Administrator and the Distributor. | 101 | Director of SEI since 1974; Secretary of SEI since 1978. Director of SEI Investments Distribution Co. since 2003. Director of SEI Investments—Global Funds Services, Limited, SEI Investments Global, Limited, SEI Investments (Europe), Limited, SEI Investments (Asia) Limited, SEI Global Nominee Ltd. and SEI Investments—Unit Trust Management (UK) Limited. Trustee of SEI Liquid Asset Trust from 1982 to 2016. Trustee of O’Connor EQUUS from 2014 to 2016. Director of SEI Alpha Strategy Portfolios, LP from 2007 to 2013. Trustee of The Advisors’ Inner Circle Fund, The Advisors’ Inner Circle Fund II, The Advisors’ Inner Circle Fund III, Winton Series Trust, Winton Diversified Opportunities Fund, Gallery Trust, Bishop Street Funds, SEI Asset Allocation Trust, SEI Daily Income Trust, SEI Institutional Managed Trust, SEI Institutional International Trust, SEI Institutional Investments Trust, SEI Tax Exempt Trust, SEI Insurance Products Trust, Adviser Managed Trust, New Covenant Funds, The KP Funds and SEI Catholic Values Trust. | |||||
| TRUSTEES | ||||||||||
George J. Sullivan Jr. One Freedom Valley Drive, Oaks, PA 19456 | Trustee | since 1996 | Retired since January 2012. Self-Employed Consultant, Newfound Consultants Inc. April 1997-December 2011. | 101 | Member of the independent review committee for SEI’s Canadian-registered mutual funds. Director of SEI Opportunity Fund, L.P. to 2010. Director of SEI Alpha Strategy Portfolios, LP from 2007 to 2013. Trustee of SEI Liquid Asset Trust from 1996 to 2016. Trustee/Director of State Street Navigator Securities Lending Trust, The Advisors’ Inner Circle Fund, The Advisors’ Inner Circle Fund II, Bishop Street Funds, SEI Structured Credit Fund, LP, SEI Asset Allocation Trust, SEI Daily Income Trust, SEI Institutional Managed Trust, SEI Institutional International Trust, SEI Institutional Investments Trust, SEI Tax Exempt Trust, SEI Insurance Products Trust, Adviser Managed Trust, New Covenant Funds, The KP Funds and SEI Catholic Values Trust. |
| * | Messrs. Nesher and Doran are Trustees who may be deemed as “interested” persons of the Trust as that term is defined in the 1940 Act by virtue of their affiliation with SIMC and the Trust’s Distributor. |
| 1 | Each trustee shall hold office during the lifetime of this Trust until the election and qualification of his or her successor, or until he or she sooner dies, resigns or is removed in accordance with the Trust’s Declaration of Trust. |
| 2 | The Fund Complex includes the following Trusts: SEI Asset Allocation Trust, SEI Daily Income Trust, SEI Institutional Investments Trust, Adviser Managed Trust, SEI Institutional International Trust, SEI Institutional Managed Trust, SEI Catholic Values Trust, SEI Tax Exempt Trust, SEI Insurance Products Trust and New Covenant Funds. |
SEI Catholic Values Trust / Annual Report / February 28, 2019 | 55 |
TRUSTEES AND OFFICERS OF THE TRUST (Unaudited) (Concluded)
| Name Address, and Age | Position(s) Held with Trusts | Term of Office and Length of Time Served1 | Principal Occupation(s) During Past Five Years | Number of Portfolios in Fund Complex Overseen by Trustee2 | Other Directorships Held by Trustee | |||||
TRUSTEES (continued) | ||||||||||
Nina Lesavoy One Freedom Valley Drive, Oaks, PA 19456 61 yrs. old | Trustee | since 2003 | Founder and Managing Director, Avec Capital (strategic fundraising firm) since 2008. Managing Director, Cue Capital (strategic fundraising firm) from March 2002-March 2008. | 101 | Director of SEI Alpha Strategy Portfolios, LP from 2007 to 2013. Trustee of SEI Liquid Asset Trust from 2003 to 2016. Trustee/Director of SEI Structured Credit Fund, L.P., SEI Asset Allocation Trust, SEI Daily Income Trust, SEI Institutional Managed Trust, SEI Institutional International Trust, SEI Institutional Investments Trust, SEI Tax Exempt Trust, SEI Insurance Products Trust, New Covenant Funds, Adviser Managed Trust and SEI Catholic Values Trust. | |||||
James M. Williams One Freedom Valley Drive, Oaks, PA 19456 71 yrs. old | Trustee | since 2004 | Vice President and Chief Investment Officer, J. Paul Getty Trust,Non-Profit Foundation for Visual Arts, since December 2002. President, Harbor Capital Advisors and Harbor Mutual Funds, 2000-2002. Director of SEI Alpha Strategy Portfolios, L.P. from 2007 to 2013. Manager, Pension Asset Management, Ford Motor Company, 1997-1999. | 101 | Director of SEI Alpha Strategy Portfolios, LP from 2007 to 2013, Trustee of SEI Liquid Asset Trust from 2004 to 2016. Trustee/Director of Ariel Mutual Funds, SEI Structured Credit Fund, LP, SEI Asset Allocation Trust, SEI Daily Income Trust, SEI Institutional Managed Trust, SEI Institutional International Trust, SEI Institutional Investments Trust, SEI Tax Exempt Trust, New Covenant Funds, SEI Insurance Products Trust, Adviser Managed Trust and SEI Catholic Values Trust. | |||||
Mitchell A. Johnson One Freedom Valley Drive, Oaks, PA 19456 76 yrs. old | Trustee | since 2007 | Private Investor since 1994. | 101 | Director, Federal Agricultural Mortgage Corporation (Farmer Mac) since 1997. Director of SEI Alpha Strategy Portfolios, LP from 2007 to 2013. Trustee of SEI Liquid Asset Trust from 2007 to 2016. Trustee of the Advisors’ Inner Circle Fund, The Advisors’ Inner Circle Fund II, Bishop Street Funds, SEI Asset Allocation Trust, SEI Daily Income Trust, SEI Institutional Managed Trust, SEI Institutional International Trust, SEI Institutional Investments Trust, SEI Tax Exempt Trust, New Covenant Funds, SEI Insurance Products Trust, Adviser Managed Trust, The KP Funds and SEI Catholic Values Trust. | |||||
Hubert L. Harris, Jr. One Freedom Valley Drive, Oaks, PA 19456 75 yrs. old | Trustee | since 2008 | Retired since December 2005. Owner of Harris Plantation, Inc. since 1995. Chief Executive Officer of Harris CAPM, a consulting asset and property management entity. Chief Executive Officer, INVESCO North America, August 2003-December 2005. Chief Executive Officer and Chair of the Board of Directors, AMVESCAP Retirement, Inc., January 1998- August 2003. | 101 | Director of AMVESCAP PLC from 1993-2004. Served as a director of a bank holding company, 2003-2009. Director, Aaron’s Inc., 2012-present. President and CEO of Oasis Ornamentals LLC since 2011. Member of the Board of Councilors of the Carter Center (nonprofit corporation) and served on the board of othernon-profit organizations. Director of SEI Alpha Strategy Portfolios, LP from 2008 to 2013. Trustee of Liquid Asset Trust from 2008 to 2016. Trustee of SEI Asset Allocation Trust, SEI Daily Income Trust, SEI Institutional Managed Trust, SEI Institutional International Trust, SEI Institutional Investments Trust, SEI Tax Exempt Trust, SEI Insurance Products Trust, New Covenant Funds, Adviser Managed Trust and SEI Catholic Values Trust. | |||||
Susan C. Cote One Freedom Valley Drive Oaks, PA 19456 64 yrs. old | Trustee | since 2016 | Retired since July 2015. Americas Director of Asset Management, Ernst & Young LLP from 2006-2013. Global Asset Management Assurance Leader, Ernest & Young LLP from 2006-2015. Partner Ernest & Young LLP from 1997-2015. Prudential, 1983-1997.Member of the Ernst & Young LLP Retirement Investment Committee, Treasurer and Chair of Finance, Investment and Audit Committee of the New York Women’s Foundation. | 101 | Trustee of SEI Tax Exempt Trust, SEI Daily Income Trust, SEI Institutional International Trust, SEI Institutional Managed Trust, SEI Asset Allocation Trust, SEI Institutional Investments Trust, SEI Insurance Products Trust, New Covenant Funds, Adviser Managed Trust and SEI Catholic Values Trust. | |||||
James B. Taylor One Freedom Valley Drive Oaks, PA 19456 68 yrs. old | Trustee | since 2018 | Retired since December 2017. Chief Investment Officer at Georgia Teach Foundation from 2008 to 2017. Chief Investment Officer at Delta Air Lines from 1983 to 2007. Member of the Investment Committee at the Institute of Electrical and Electronic Engineers from 1999 to 2004. President, Vice President and Treasurer at Southern Benefits Conference from 1998 to 2000. | 101 | Trustee of SEI Daily Income Trust, SEI Tax Exempt Trust, SEI Institutional Managed Trust, SEI Institutional International Trust, SEI Institutional Investments Trust, SEI Asset Allocation Trust, Adviser Managed Trust, New Covenant Funds, SEI Insurance Products Trust and SEI Catholic Values Trust. | |||||
| 1 | Each trustee shall hold office during the lifetime of this Trust until the election and qualification of his or her successor, or until he or she sooner dies, resigns or is removed in accordance with the Trust’s Declaration of Trust. |
| 2 | The Fund Complex includes the following Trusts: SEI Asset Allocation Trust, SEI Daily Income Trust, SEI Institutional Investments Trust, Adviser Managed Trust, SEI Institutional International Trust, SEI Institutional Managed Trust, SEI Catholic Values Trust, SEI Tax Exempt Trust, SEI Insurance Products Trust and New Covenant Funds. |
| 56 | SEI Catholic Values Trust / Annual Report / February 28, 2019 |
| Name Address, and Age | Position(s) Held with Trusts | Term of Office and Length of Time Served1 | Principal Occupation(s) During Past Five Years | Number of Portfolios in Fund Complex Overseen by Trustee2 | Other Directorships Held by Trustee | |||||||
OFFICERS | ||||||||||||
Robert A. Nesher One Freedom Valley Drive, Oaks, PA 19456 72 yrs. Old | �� | | President and CEO | since 2005 | Currently performs various services on behalf of SEI for which Mr. Nesher is compensated. | N/A | N/A | |||||
James J. Hoffmayer One Freedom Valley Drive Oaks, PA 19456 45 yrs. old | | Controller and CFO | since 2016 | Senior Director, Funds Accounting and Fund Administration, SEI Investments Global Funds Services (since September 2016); Senior Director of Fund Administration, SEI Investments Global Funds Services (since October 2014). Director of Financial Reporting, SEI Investments Global Funds Services (November 2004 – October 2014). | N/A | N/A | ||||||
Glenn R. Kurdziel One Freedom Valley Drive Oaks, PA 19456 44 yrs. old | | Assistant Controller | | since 2017 | Assistant Controller, Funds Accounting, SEI Investments Global Funds Services (March 2017); Senior Manager, Funds Accounting, SEI Investments Global Funds Services since 2005. | N/A | N/A | |||||
Russell Emery One Freedom Valley Drive Oaks, PA 19456 56 yrs. old | | Chief Compliance Officer | | since 2006 | Chief Compliance Officer of SEI Daily Income Trust, SEI Institutional Investments Trust, SEI Institutional Managed Trust, SEI Asset Allocation Trust, SEI Institutional International Trust, SEI Tax Exempt Trust, The Advisors’ Inner Circle Fund, The Advisors’ Inner Circle Fund II and Bishop Street Funds since March 2006. Chief Compliance Officer of SEI Liquid Asset Trust from 2006 to 2016. Chief Compliance Officer of SEI Structured Credit Fund, LP since June 2007. Chief Compliance Officer of Adviser Managed Trust since December 2010. Chief Compliance Officer of SEI Alpha Strategy Portfolios, LP from 2007 to 2013. Chief Compliance Officer of New Covenant Funds since February 2012. Chief Compliance Officer of SEI Insurance Products Trust and The KP Funds since 2013. Chief Compliance Officer of O’Connor EQUUS from 2014 to 2016. Chief Compliance Officer of The Advisors’ Inner Circle Fund III and Winton Diversified Opportunities Fund since 2014. Chief Compliance Officer of Winton Series Trust from 2014 to 2017. Chief Compliance Officer of SEI Catholic Values Trust and Gallery Trust since 2015. Chief Compliance Officer of Schroder Series Trust and Schroder Global Series Trust since 2017. | N/A | N/A | |||||
Timothy D. Barto One Freedom Valley Drive Oaks, PA 19456 50 yrs. old | | Vice President and Secretary | | since 2002 | Vice President and Secretary of SEI Institutional Transfer Agent, Inc. since 2009. General Counsel and Secretary of SIMC and the Administrator since 2004. Vice President of SIMC and the Administrator since 1999. Vice President and Assistant Secretary of SEI since 2001. | N/A | N/A | |||||
Aaron Buser One Freedom Valley Drive, Oaks, PA 19456 48 yrs. old | | Vice President and Assistant Secretary | | since 2008 | Vice President and Assistant Secretary of SEI Institutional Transfer Agent, Inc. since 2009. Vice President and Assistant Secretary of SIMC since 2007. Attorney Stark & Stark (law firm), March 2004-July 2007. | N/A | N/A | |||||
David F. McCann One Freedom Valley Drive, Oaks, PA 19456 42 yrs. old | | Vice President and Assistant Secretary | | since 2009 | Vice President and Assistant Secretary of SEI Institutional Transfer Agent, Inc. since 2009. Vice President and Assistant Secretary of SIMC since 2008. Attorney, Drinker Biddle & Reath, LLP (law firm), May 2005 - October 2008. | N/A | N/A | |||||
Stephen G. MacRae One Freedom Valley Drive, Oaks, PA 19456 51 yrs. old | Vice President | since 2012 | Director of Global Investment Product Management, January 2004 - to present. | N/A | N/A | |||||||
Bridget E. Sudall One Freedom Valley Drive Oaks, PA 19456 38 yrs. old | | Anti-Money Laundering Compliance Officer and Privacy Officer | | since 2015 | Anti-Money Laundering Compliance Officer and Privacy Officer (since 2015), Senior Associate and AML Officer, Morgan Stanley Alternative Investment Partners, April 2011-March 2015, Investor Services Team Lead, Morgan Stanley Alternative Investment Partners, July 2007-April 2011. | N/A | N/A | |||||
| 1 | Each trustee shall hold office during the lifetime of this Trust until the election and qualification of his or her successor, or until he or she sooner dies, resigns or is removed in accordance with the Trust’s Declaration of Trust. |
| 2 | The Fund Complex includes the following Trusts: SEI Asset Allocation Trust, SEI Daily Income Trust, SEI Institutional Investments Trust, Adviser Managed Trust, SEI Institutional International Trust, SEI Institutional Managed Trust, SEI Catholic Values Trust, SEI Tax Exempt Trust, SEI Insurance Products Trust and New Covenant Funds. |
SEI Catholic Values Trust / Annual Report / February 28, 2019 | 57 |
DISCLOSURE OF FUND EXPENSES (Unaudited)
February 28, 2019
All mutual funds have operating expenses. As a shareholder of a fund, your investment is affected by these ongoing costs, which include (among others) costs for portfolio management, administrative services, and shareholder reports like this one. It is important for you to understand the impact of these costs on your investment returns.
Operating expenses such as these are deducted from the fund’s gross income and directly reduce your final investment return. These expenses are expressed as a percentage of the fund’s average net assets; this percentage is known as the fund’s expense ratio.
The following examples use the expense ratio and are intended to help you understand the ongoing costs (in dollars) of investing in your fund and to compare these costs with those of other mutual funds. The examples are based on an investment of $1,000 made at the beginning of the period shown and held for the entire period (September 1, 2018 through February 28, 2019).
The table on this page illustrates your fund’s costs in two ways:
Actual fund return: This section helps you to estimate the actual expenses after fee waivers that your Fund incurred over the period. The “Expenses Paid During Period” column shows the actual dollar expense cost incurred by a $1,000 investment in the Fund, and the “Ending Account Value” number is derived from deducting that expense cost from the Fund’s gross investment return.
You can use this information, together with the actual amount you invested in the Fund, to estimate the expenses you paid over that period. Simply divide your actual account value by $1,000 to arrive at a ratio (for example, an $8,600 account value divided by $1,000 = 8.6), then multiply that ratio by the number shown for your Fund under “Expenses Paid During Period.”
Hypothetical 5% return: This section helps you compare your Fund’s costs with those of other mutual funds. It assumes that the fund had an annual 5% return before expenses during the year, but that the expense ratio (Column 3) for the period is unchanged. This example is useful in making comparisons because the Securities and Exchange Commission requires all mutual funds to make this 5% calculation. You can assess your Fund’s comparative cost by comparing the hypothetical result for your Fund in the “Expense Paid During Period” column with those that appear in the same charts in the shareholder reports for other funds.
NOTE: Because the return is set at 5% for comparison purposes — NOT your Fund’s actual return — the account values shown may not apply to your specific investment.
| Beginning Account Value 9/1/18 | Ending Account Value 2/28/19 | Annualized Expense Ratios | Expenses Paid During Period * | |||||||||||
Catholic Values Equity Fund |
| |||||||||||||
Actual Fund Return | ||||||||||||||
Class F | $1,000.00 | $960.30 | 0.77% | $3.74 | ||||||||||
Class Y | 1,000.00 | 961.10 | 0.76 | 3.70 | ||||||||||
Hypothetical 5% Return |
| |||||||||||||
Class F | $1,000.00 | $1,020.98 | 0.77% | $3.86 | ||||||||||
Class Y | 1,000.00 | 1,021.03 | 0.76 | 3.81 | ||||||||||
| Beginning Account Value 9/1/18 | Ending Account Value 2/28/19 | Annualized Expense Ratios | Expenses Paid During Period * | |||||||||||
Catholic Values Fixed Income Fund |
| |||||||||||||
Actual Fund Return | ||||||||||||||
Class F | $1,000.00 | $1,022.20 | 0.62% | $3.11 | ||||||||||
Class Y | 1,000.00 | 1,022.70 | 0.61 | 3.06 | ||||||||||
Hypothetical 5% Return |
| |||||||||||||
Class F | $1,000.00 | $1,021.72 | 0.62% | $3.11 | ||||||||||
Class Y | 1,000.00 | 1,021.77 | 0.61 | 3.06 | ||||||||||
| * | Expenses are equal to the Fund’s annualized expense ratio multiplied by the average account value over the period, multiplied by 181/365 (to reflect theone-half year period shown). |
| 58 | SEI Catholic Values Trust / Annual Report / February 28, 2019 |
BOARD OF TRUSTEES CONSIDERATIONS IN APPROVING THE ADVISORY ANDSUB-ADVISORY AGREEMENTS (Unaudited)
SEI Catholic Values Trust (the “Trust”) and SEI Investments Management Corporation (“SIMC”) have entered into an investment advisory agreement (the “Advisory Agreement”). Pursuant to the Advisory Agreement, SIMC is responsible for the investment advisory services provided to the series of the Trust (the “Funds”). Pursuant to separatesub-advisory agreements with SIMC (the“Sub-Advisory Agreements” and, together with the Advisory Agreement, the “Investment Advisory Agreements”), and under the supervision of SIMC and the Trust’s Board of Trustees (the “Board”), thesub-advisers (each, a“Sub-Adviser” and collectively, the“Sub-Advisers”) provide security selection and certain other advisory services with respect to all or a discrete portion of the assets of the Funds. TheSub-Advisers are also responsible for managing their employees who provide services to the Funds. TheSub-Advisers are selected based primarily upon the research and recommendations of SIMC, which evaluates quantitatively and qualitatively theSub-Advisers’ skills and investment results in managing assets for specific asset classes, investment styles and strategies.
The Investment Company Act of 1940, as amended (the “1940 Act”), requires that the initial approval of, as well as the continuation of, the Funds’ Investment Advisory Agreements be specifically approved: (i) by the vote of the Board or by a vote of the shareholders of the Funds; and (ii) by the vote of a majority of the Trustees who are not parties to the Investment Advisory Agreements or “interested persons” of any party (the “Independent Trustees”), cast in person at a meeting called for the purpose of voting on such approval(s). In connection with their consideration of such approval(s), the Funds’ Trustees must request and evaluate, and SIMC and theSub-Advisers are required to furnish, such information as may be reasonably necessary to evaluate the terms of the Investment Advisory Agreements. In addition, the Securities and Exchange Commission takes the position that, as part of their fiduciary duties with respect to a mutual fund’s fees, mutual fund boards are required to evaluate the material factors applicable to a decision to approve an investment advisory agreement.
Consistent with these responsibilities, the Board calls and holds meetings each year to consider whether to approve new and/or renew existing Investment Advisory Agreements between the Trust and SIMC and SIMC and theSub-Advisers with respect to the Funds of the Trust. In preparation for these meetings, the Board requests and reviews a wide variety of materials provided by SIMC and theSub-Advisers, including information about SIMC’s and theSub-Advisers’ affiliates, personnel and operations and the services provided pursuant to the Investment Advisory Agreements. The Board also receives data from third parties. This information is provided in addition to the detailed information about the Funds that the Board reviews during the course of each year, including information that relates to Fund operations and Fund performance. The Trustees also receive a memorandum from counsel regarding the responsibilities of Trustees in connection with their consideration of whether to approve the Trust’s Investment Advisory Agreements. Finally, the Independent Trustees receive advice from independent counsel to the Independent Trustees, meet in executive sessions outside the presence of Fund management and participate in question and answer sessions with representatives of SIMC and theSub-Advisers.
Specifically, during the course of the Trust’s fiscal year, the Board requested and received written materials from SIMC and theSub-Advisers regarding: (i) the quality of SIMC’s and theSub-Advisers’ investment management and other services; (ii) SIMC’s and theSub-Advisers’ investment management personnel; (iii) SIMC’s and theSub-Advisers’ operations and financial condition; (iv) SIMC’s and theSub-Advisers’ brokerage practices (including any soft dollar arrangements) and investment strategies; (v) the level of the advisory fees that SIMC charges the Funds and the level of thesub-advisory fees that SIMC pays theSub-Advisers, compared with fees each charge to comparable accounts; (vi) the advisory fees charged by SIMC and the Funds’ overall fees and operating expenses compared with peer groups of mutual funds prepared by Broadridge, an independent provider of investment company data; (vii) the level of SIMC’s and theSub-Advisers’ profitability from their Fund-related operations; (viii) SIMC’s and theSub-Advisers’ compliance program, including a description of material compliance matters and material compliance violations; (ix) SIMC’s potential economies of scale; (x) SIMC’s and theSub-Advisers’ policies on and compliance procedures for personal securities transactions; (xi) SIMC’s and theSub-Advisers’ expertise and resources in domestic and/or international financial markets; and (xii) the Funds’ performance over various periods of time compared with peer groups of mutual funds prepared by Broadridge and the Funds’ benchmark indexes.
At the March 27–28, 2018 meeting of the Board, the Trustees, including a majority of the Independent Trustees, approved the renewal of the Advisory Agreement. Also, eachSub-Advisory Agreement was either initially approved or, if theSub-Advisory Agreement was already in effect (unless operating under an initialtwo-year term), renewed at meetings of the Board held during the course of the Trust’s fiscal year on June 26–27, 2018, September 10–12, 2018 and December 4–5, 2018. In each case, the Board’s approval (or renewal) was based on its consideration
SEI Catholic Values Trust / Annual Report / February 28, 2019 | 59 |
BOARD OF TRUSTEES CONSIDERATIONS IN APPROVING THE ADVISORY ANDSUB-ADVISORY AGREEMENTS (Unaudited) (Concluded)
and evaluation of the factors described above, as discussed at the meetings and at prior meetings. The following discusses some, but not all, of the factors that were considered by the Board in connection with its assessment of the Investment Advisory Agreements.
Nature, Extent and Quality of Services. The Board considered the nature, extent and quality of the services provided by SIMC and theSub-Advisers to the Funds and the resources of SIMC and theSub-Advisers and their affiliates dedicated to the Funds. In this regard, the Trustees evaluated, among other things, SIMC’s and eachSub-Adviser’s personnel, experience, track record and compliance program. Following evaluation, the Board concluded that, within the context of its full deliberations, the nature, extent and quality of services provided by SIMC and theSub-Advisers to the Funds and the resources of SIMC and theSub-Advisers and their affiliates dedicated to the Funds were sufficient to support the renewal of the Investment Advisory Agreements. In addition to advisory services, the Board considered the nature and quality of certain administrative, transfer agency and othernon-investment advisory services provided to the Funds by SIMC and/or its affiliates.
Performance. In determining whether to renew SIMC’s Advisory Agreement, the Trustees considered the Funds’ performance relative to their peer groups and appropriate indexes/benchmarks. The Trustees reviewed performance information for each Fund, noting that they receive performance reports that permit them to monitor each Fund’s performance at board meetings throughout the year. As part of this review, the Trustees considered the composition of each peer group and selection criteria. In assessing Fund performance, the Trustees considered a report compiled by Broadridge, an independent third-party that was engaged to prepare an assessment of the Funds in connection with the renewal of the Advisory Agreement (the “Broadridge Report”). The Broadridge Report included metrics on net total return and performance consistency for the Funds and a universe of comparable funds. Based on the materials considered and discussed at the meetings, the Trustees found Fund performance satisfactory, or, where performance was materially below the benchmark and/or peer group, the Trustees were satisfied with the reasons provided to explain such performance. In connection with the approval or renewal ofSub-Advisory Agreements, the Board considered the performance of theSub-Adviser relative to appropriate indexes/benchmarks. Following evaluation, the Board concluded that, within the context of its full deliberations, the performance of the Funds was sufficient to support renewal of SIMC’s Advisory Agreement, and the performance of eachSub-Adviser was sufficient to support approval or renewal of theSub-Advisory Agreement.
Fees. With respect to the Funds’ expenses under the Investment Advisory Agreements, the Trustees considered the rate of compensation called for by the Investment Advisory Agreements and the Funds’ net operating expense ratio in comparison to those of the Funds’ respective peer groups. In assessing Fund expenses, the Trustees considered the information in the Broadridge Report, which included various metrics related to fund expenses, including, but not limited to, contractual management fees at various asset levels, actual management fees (including transfer agent expenses), and actual total expenses for the Funds and a universe of comparable funds. Based on the materials considered and discussion at the meetings, the Trustees further determined that fees were either shown to be below the peer average in the comparative fee analysis, or that there was a reasonable basis for the fee level. The Trustees also considered the effects of SIMC’s voluntary waiver of management and other fees to prevent total Fund operating expenses from exceeding a specified cap and concluded that SIMC, through waivers, has maintained the Funds’ net operating expenses at competitive levels for its distribution channels. In determining the appropriateness of fees, the Board also took into consideration the impact of fees incurred indirectly by the Funds as a result of investments into underlying funds, including funds from which SIMC or its affiliates earn fees. The Board also took into consideration compensation earned from the Funds by SIMC or its affiliates fornon-advisory services, such as administration, transfer agency, shareholder services or brokerage, and considered whether SIMC and its affiliates may have realized other benefits from their relationship with the Funds, such as any research and brokerage services received under soft dollar arrangements. When considering fees paid toSub-Advisers, the Board took into account the fact that theSub-Advisers are compensated by SIMC and not by the Funds directly, and that such compensation with respect to any unaffiliatedSub-Adviser reflects an arms-length negotiation between theSub-Adviser and SIMC. Following evaluation, the Board concluded that, within the context of its full deliberations, the expenses of the Funds are reasonable and supported renewal of the Investment Advisory Agreements. The Board also considered whether theSub-Advisers and their affiliates may have realized other benefits from their relationship with the Funds, such as any research and brokerage services received under soft dollar arrangements.
Profitability. With regard to profitability, the Trustees considered compensation flowing to SIMC and theSub-Advisers and their affiliates, directly or indirectly. The Trustees considered whether the levels of compensation and
| 60 | SEI Catholic Values Trust / Annual Report / February 28, 2019 |
profitability were reasonable. As with the fee levels, when considering the profitability of theSub-Advisers, the Board took into account the fact that compensation with respect to any unaffiliatedSub-Adviser reflects an arms-length negotiation between theSub-Adviser and SIMC. In connection with the approval or renewal of eachSub-Advisory Agreement, the Board also took into consideration the impact that the fees paid to theSub-Adviser have on SIMC’s advisory fee margin and profitability. Based on this evaluation, the Board concluded that, within the context of its full deliberations, the profitability of each of SIMC and theSub-Advisers is reasonable and supported renewal of the Investment Advisory Agreements.
Economies of Scale. With respect to the Advisory Agreement, the Trustees considered whether any economies of scale were being realized by SIMC and its affiliates and, if so, whether the benefits of such economies of scale were passed along to the Funds’ shareholders through a graduated investment advisory fee schedule or other means, including any fee waivers by SIMC and its affiliates. The Trustees recognized that economies of scale are difficult to identify and quantify and are rarely identifiable on afund-by-fund basis. Based on this evaluation, the Board determined that the fees were reasonable in light of the information that was provided by SIMC with respect to economies of scale.
Based on the Trustees’ deliberation and their evaluation of the information described above, the Board, including all of the Independent Trustees, with the assistance of Fund counsel and Independent Trustees’ counsel, approved the approval or renewal, as applicable, of the Investment Advisory Agreements and concluded that the compensation under the Investment Advisory Agreements is fair and reasonable in light of such services and expenses and such other matters as the Trustees considered to be relevant in the exercise of their reasonable judgment. In the course of its deliberations, the Board did not identify any particular factor (or conclusion with respect thereto) or single piece of information that wasall-important, controlling or determinative of its decision, but considered all of the factors together, and each Trustee may have attributed different weights to the various factors (and conclusions with respect thereto) and information.
SEI Catholic Values Trust / Annual Report / February 28, 2019 | 61 |
NOTICE TO SHAREHOLDERS (Unaudited)
For shareholders who do not have a February 28, 2019, taxable year end, this notice is for informational purposes only. For shareholders with a February 28, 2019, taxable year end, please consult your tax adviser as to the pertinence of this notice.
For the fiscal year ended February 28, 2019, the Funds are designating long term and qualifying dividend income with regard to distributions paid during the year as follows:
| (A) Return of Capital | (B) Long Term | (C) Ordinary | (D) Total | (E) Dividends Qualifying for Corporate Dividends Rec. Deduction (1) | (F) Qualifying Dividend Income (15% Tax Rate for QDI) (2) | Qualifying Business Income (3) | (G) U.S. | (H) Interest | (I) Short-Term | |||||||||||
Equity Fund* | 0.00% | 65.04% | 34.96% | 100.00% | 75.35% | 100.00% | 0.00% | 0.00% | 1.05% | 100.00% | ||||||||||
Fixed Income Fund* | 0.00% | 0.00% | 100.00% | 100.00% | 0.00% | 0.00% | 0.12% | 19.31% | 85.14% | 0.00% | ||||||||||
| (1) | “Dividends Received Deduction” represent dividends which qualify for the corporate dividends received deduction and is reflected as a percentage of ordinary Income distributions (the total of short term capital gain and net investment income distributions). |
| (2) | “Qualifying Dividend Income” represent qualifying dividends as created by the Jobs and Growth Tax Relief Reconciliation Act of 2003. It is the intention of the Fund to designate the max amount permitted by law. |
| (3) | The percentage of this column represents that amount of ordinary dividend income that qualified for 20% Business Income Deduction. |
| (4) | “U.S. Government Interest” represent the amount of interest that was derived from direct U.S. Government obligations and distributed during the fiscal year. This amount is reflected as a percentage of ordinary income. Generally, interest from direct U.S. Government obligations is exempt from state income tax. |
| (5) | The percentage in this column represents the amount of “Interest Related Dividend” and is reflected as a percentage of ordinary income distribution. Interest related dividends are exempted from U.S. withholding tax when paid to foreign investors. |
| (6) | The percentage of this column represents the amount of “Short Term Capital Gain Dividend” and is reflected as a percentage of short term capital gain distribution that is exempted from U.S. withholding tax when paid to foreign investors. |
* Shareholders who are residents of California, Connecticut and New York, these funds have not met the statutory threshold requirements to permit exemption of these amounts from state income tax.
Items (A), (B), (C) and (D) are based on the percentage of each fund’s total distribution.
Items (E) and (F) are based on the percentage of “Ordinary Income Distributions”.
Item (G) is based on the percentage of gross income of each Fund.
Item (H) is based on the percentage of net investment income distributions.
Item (I) is based on the percentage of short-term capital gains distributions.
Please consult your tax adviser for proper treatment of this information. This notification should be kept with your permanent tax records.
| 62 | SEI Catholic Values Trust / Annual Report / February 28, 2019 |
(This page intentionally left blank)
(This page intentionally left blank)
SEI CATHOLIC VALUES TRUST / ANNUAL REPORT / FEBRUARY 28, 2019
Robert A. Nesher,Chairman
Trustees
William M. Doran
George J. Sullivan, Jr.
Nina Lesavoy
James M. Williams
Mitchell A. Johnson
Hubert L. Harris, Jr.
Susan C. Cote
James B. Taylor
Officers
Robert A. Nesher
President and Chief Executive Officer
James J. Hoffmayer
Controller and Chief Financial Officer
Glenn R. Kurdziel
Assistant Controller
Russell Emery
Chief Compliance Officer
Timothy D. Barto
Vice President, Secretary
Aaron Buser
Vice President, Assistant Secretary
David F. McCann
Vice President, Assistant Secretary
Stephen G. MacRae
Vice President
Bridget E. Sudall
Anti-Money Laundering Compliance Officer
Privacy Officer
Investment Adviser
SEI Investments Management Corporation
Administrator
SEI Investments Global Funds Services
Distributor
SEI Investments Distribution Co.
Legal Counsel
Morgan, Lewis & Bockius LLP
Independent Registered Public Accounting Firm
KPMG LLP
This report and the financial statements contained herein are submitted for the general information of the shareholders of the Trust and must be preceded or accompanied by a current prospectus. Shares of the Funds are not deposits or obligations of, or guaranteed or endorsed by, any bank. The shares are not federally insured by the Federal Deposit Insurance Corporation (FDIC), the Federal Reserve Board, or any other government agency. Investment in the shares involves risk, including the possible loss of principal.
For more information call
1 800 DIAL SEI
(1 800 342 5734)

SEI-F-198 (2/19)
| Item 2. | Code of Ethics. |
The Registrant has adopted a code of ethics that applies to the Registrant’s principal executive officer, principal financial officer, principal accounting officer or controller, or persons performing similar functions.
| Item 3. | Audit Committee Financial Expert. |
(a) (1) The Registrant’s Board of Trustees has determined that the Registrant has three audit committee financial experts serving on the audit committee.
(a) (2) The audit committee financial experts are Susan Cote, George J. Sullivan, Jr. and Hubert L. Harris, Jr. Ms. Cote and Messrs. Sullivan and Harris are independent as defined in FormN-CSR Item 3 (a) (2).
| Item 4. | Principal Accountant Fees and Services. |
Fees billed by KPMG LLP (“KPMG”) related to the Registrant.
KPMG billed the Registrant aggregate fees for services rendered to the Registrant for the fiscal years 2019 and 2018 as follows:
| Fiscal Year 2019 | Fiscal Year 2018 | |||||||||||||
| All fees and services to the Registrant that were pre-approved | All fees and services to service affiliates that were pre-approved | All other fees and services to service affiliates that did not require pre-approval | All fees and services to the Registrant that were pre-approved | All fees and services to service affiliates that were pre-approved | All other fees and services to service affiliates that did not require pre-approval | |||||||||
(a) | Audit Fees(1) | $56,535 | $0 | N/A | $55,000 | $0 | N/A | |||||||
(b) | Audit-Related Fees | $0 | $0 | $0 | $0 | $0 | $0 | |||||||
(c) | Tax Fees | $0 | $0 | $0 | $0 | $0 | $0 | |||||||
(d) | All Other Fees(2) | $0 | $408,741 | $0 | $0 | $326,979 | $0 | |||||||
Notes:
| (1) | Audit fees include amounts related to the audit of the Registrant’s annual financial statements and services normally provided by the accountant in connection with statutory and regulatory filings. |
| (2) | See Item 4(g) for a description of the services comprising the fees disclosed in this category. |
(e)(1) The Registrant’s Audit Committee has adopted and the Board of Trustees has ratified an Audit andNon-Audit ServicesPre-Approval Policy (the “Policy”), which sets forth the procedures and the conditions pursuant to which services proposed to be performed by the independent auditor of the Registrant may bepre-approved. In any instance where services requirepre-approval, the Audit Committee will consider whether such services are consistent with SEC’s rules on auditor independence and whether the provision of such services would compromise the auditor’s independence.
The Policy provides that all requests or applications for proposed services to be provided by the independent auditor must be submitted to the Registrant’s Chief Financial Officer (“CFO”) and must include a detailed description of the services proposed to be rendered. The CFO will determine whether such services: (1) require specificpre-approval; (2) are included within the list of services that have received the generalpre-approval of the Audit Committee pursuant to the Policy; or (3) have been previouslypre-approved in connection with the independent auditor’s annual engagement letter for the applicable year or otherwise.
Requests or applications to provide services that require specificpre-approval by the Audit Committee will be submitted to the Audit Committee by the CFO. The Audit Committee has delegated specificpre-approval authority to either the Audit Committee Chair or financial experts, provided that the estimated fee for any such proposedpre-approved service does not exceed $100,000 and anypre-approval decisions are reported to the Audit Committee at its next regularly scheduled meeting.
Services that have received the generalpre-approval of the Audit Committee are identified and described in the Policy. In addition, the Policy sets forth a maximum fee per engagement with respect to each identified service that has received generalpre-approval. The audit committee will annually review andpre-approve the services that may be provided by the independent auditor during the following twelve months without obtaining specificpre-approval from the Audit Committee.
The Audit Committee will be informed by the CFO on a quarterly basis of all services rendered by the independent auditor.
All services to be provided by the independent auditor shall be provided pursuant to a signed written engagement letter with the Registrant, the investment advisor or applicable control affiliate (except that matters as to which an engagement letter would be impractical because of timing issues or because the matter is small may not be the subject of an engagement letter) that sets forth both the services to be provided by the independent auditor and the total fees (or the manner of their determination) to be paid to the independent auditor for those services.
In addition, the Audit Committee has determined to take additional measures on an annual basis to meet its responsibility to oversee the work of the independent auditor and to assure the auditor’s independence from the Registrant, such as reviewing a formal written statement from the independent auditor delineating all relationships between the independent auditor and the Registrant, and discussing with the independent auditor its methods and procedures for ensuring independence.
(e)(2) Percentage of fees billed applicable tonon-audit services pursuant to waiver ofpre-approval requirement were as follows:
| Fiscal 2019 | Fiscal 2018 | |||
Audit-Related Fees | 0% | 0% | ||
Tax Fees | 0% | 0% | ||
All Other Fees | 0% | 0% |
(f) Not Applicable.
(g)(1) The aggregatenon-audit fees billed by KPMG for the fiscal years 2019 and 2018 were $408,741 and $326,979, respectively. Non-audit fees consist of a service organization controls report review of fund accounting and administration operations and an attestation report in accordance with Rule 17 Ad-13.
(h) During the past fiscal year, Registrant’s principal accountant provided certainnon-audit services to Registrant’s investment adviser or to entities controlling, controlled by, or under common control with Registrant’s investment adviser that provide ongoing services to Registrant that were not subject topre-approval pursuant to paragraph (c)(7)(ii) of Rule2-01 of RegulationS-X. The Audit Committee of Registrant’s Board of Trustees reviewed and considered thesenon-audit services provided by Registrant’s principal accountant to Registrant’s affiliates, including whether the provision of thesenon-audit services is compatible with maintaining the principal accountant’s independence.
| Item 5. | Audit Committee of Listed Registrants. |
Not applicable.
| Item 6. | Schedule of Investments. |
The Schedules of Investments in securities of unaffiliated issuers as of the close of the reporting period for the Catholic Values Equity Fund and the Catholic Values Fixed Income Fund are included as part of the report to shareholders filed under Item 1 of this form.
| Item 7. | Disclosure of Proxy Voting Policies and Procedures forClosed-End Management Investment Companies. |
Not applicable.
| Item 8. | Portfolio Managers ofClosed-End Management Investment Companies. |
Not applicable.
| Item 9. | Purchases of Equity Securities byClosed-End Management Company and Affiliated Purchasers. |
Not applicable.
| Item 10. | Submission of Matters to a Vote of Security Holders. |
There have been no material changes to the procedures by which shareholders may recommend nominees to the Registrant’s Board of Trustees (the “Board”). The Registrant has a standing Governance Committee (the “Committee”) currently consisting of the independent trustees. The Committee is responsible for evaluating and recommending nominees for election to the Board.
Pursuant to the Committee’s Charter, adopted on June 18, 2004, the Committee will review all shareholder recommendations for nominations to fill vacancies on the Board if such recommendations are submitted in writing and addressed to the Committee at the Registrant’s office.
| Item 11. | Controls and Procedures. |
(a) The Registrant’s principal executive and principal financial officers, or persons performing similar functions, have concluded that the Registrant’s disclosure controls and procedures (as defined in Rule30a-3(c) under the Investment Company Act of 1940 (the “1940 Act”) (17 CFR270.30a-3(c))) are effective based on the evaluation of these controls and procedures required by Rule30a-3(b) under the Act (17 CFR270.30a-3(b)) and Rules13a-15(b) or15d-15(b) under the Securities Exchange Act of 1934 (17 CFR240.13a-15(b) or240.15d-15(b)) as of a date within 90 days of the filing date of this report.
(b) There were no changes in the Registrant’s internal control over financial reporting (as defined in Rule30a-3(d) under the 1940 Act (17 CFR270.30a-3d(d)) that occurred during the last fiscal quarter of the period covered by this report that have materially affected, or are reasonably likely to materially affect, the Registrant’s internal control over financial reporting.
| Item 12. | Disclosure of Securities Lending Activities forClosed-End Management Investment Companies. |
Not applicable.
| Items 13. | Exhibits. |
(a)(1) Code of Ethics attached hereto.
(a)(2) A separate certification for the principal executive officer and the principal financial officer of the Registrant as required by Rule30a-2(a) under the Investment Company Act of 1940, are filed herewith.
(b) Officer certifications as required by Rule30a-2(b) under the Investment Company Act of 1940, as amended also accompany this filing as exhibits.
SIGNATURES
Pursuant to the requirements of the Securities Exchange Act of 1934 and the Investment Company Act of 1940, the registrant has duly caused this report to be signed on its behalf by the undersigned, thereunto duly authorized.
| SEI Catholic Values Trust | ||||||
| By | /s/ Robert A. Nesher | |||||
| Robert A. Nesher, | ||||||
| President & CEO | ||||||
Date: May 8, 2019
Pursuant to the requirements of the Securities Exchange Act of 1934 and the Investment Company Act of 1940, this report has been signed below by the following persons on behalf of the registrant and in the capacities and on the dates indicated.
| By | /s/ Robert A. Nesher | |||||
| Robert A. Nesher, | ||||||
| President & CEO |
Date: May 8, 2019
/s/ James J. Hoffmayer | ||||||
| By | James J. Hoffmayer, | |||||
| Controller & CFO |
Date: May 8, 2019