TABLE OF CONTENTS
| Shareholder Letter | 1 |
| Portfolio Update | 3 |
| Portfolio of Investments | 5 |
| Statement of Assets and Liabilities | 7 |
| Statement of Operations | 9 |
| Statements of Changes in Net Assets | 10 |
| Financial Highlights | |
| Class A | 12 |
| Class C | 13 |
| Class W | 14 |
| Class I | 15 |
| Class U | 16 |
| Class T | 17 |
| Class D | 18 |
| Notes to Financial Statements | 19 |
| Additional Information | 25 |
| Resource Credit Income Fund | Shareholder Letter |
March 31, 2017 (Unaudited)
Dear Shareholders:
We are pleased to present the Semi-annual Report for the Resource Credit Income Fund (“the Fund”), for the period ending March 31, 2017. The Fund has continued to successfully deploy capital and deliver on its key investment objectives of providing current income while preserving capital with moderate volatility.
The Fund’s investments remain focused on four broad strategies within the fixed-income universe: publicly traded credit-linked equities (e.g. primarily public Business Development Companies commonly known as BDCs); structured credit instruments, with a focus on Collateralized Loan Obligations (CLOs); private credit funds; and traded loans and bonds. Our target allocations within these strategies are as follows:
| | • | 20% Publicly traded BDCs and other credit-linked securities |
| • | 20% Private credit funds |
These allocation targets seek to balance the characteristics of our key strategies in support of our investment objectives. However, we will diverge from the target allocations when warranted by market conditions to maximize risk-adjusted returns.
We have implemented a proprietary investment process, rooted in thorough due diligence and credit analysis, to identify opportunities in our investment universe. More specifically, we have developed the Resource America Liquid Alternatives Score (RALAS) to identify business, capital structure and industry risks as well as quantify return potential for each investment opportunity. We believe our scoring system will help drive yield for investors while mitigating principal losses by reducing credit risk.
Fund Performance
The Fund posted strong relative performance for the six-month period ending March 31, 2017. The Fund’s total return for the period was 12.20% of which 3.51% was paid in dividends1 and the remaining amount was realized in Net Asset Value appreciation. All four of our key strategies and more than 95% of our individual holdings generated positive total returns for the period. Furthermore, more than 25% of our individual holdings generated double-digit total returns over the six-month period—an objectively noteworthy accomplishment for any fund, let alone one focused on credit and one that highlights the effectiveness of RALAS.
By way of comparison, the S&P/LSTA Leveraged Loan Index posted a total return of 3.43% and the Merrill Lynch US High Yield Index posted a total return of 4.64% during the same period. As a further indication of the success of our strategy, the Fund even outperformed broad based equity indices such as the S&P 500 which had a total return of 10.12% during the period.
On the basis of these results, the Fund increased the dividend on the A share class to 18.5 cents (corresponding to an annualized fund distribution2 of 6.56%) from 17.5 cents in the prior quarter. Dividends on other share classes were increased commensurately to achieve a consistent yield across all share classes.
Investment Positioning
The Fund began investing in late 2015 under the premise that investors needed to position their portfolios in anticipation of a rising interest rate environment. The Fund, therefore, has over-weighted its portfolio towards floating rate obligations within its four main strategies.
This strategy proved prescient as the 10 Year Treasury rate has moved from 1.59% on September 30, 2016 to 2.40% on March 31, 2017. Recall that the loans owned by the Fund pay interest linked to the base-rate of three month LIBOR3, with a floor set at 1.0%. When this LIBOR benchmark moves above 1.0%, the Fund may generate incremental income from its existing positions; three month LIBOR was 1.15% on March 31st, 2017.
Geopolitical concerns, US tax policy, the Chinese economy and a host of other issues may result in volatility for long term rates. However, we see little evidence of factors that would dislodge the Federal Reserve from its proscribed path towards “normalized” rates at the short end of the curve. This dynamic will continue to provide a favorable backdrop for the Fund and its weighting towards floating rate obligations.
And while we believe that rates will continue to be a catalyst for the Fund, security selection—anchored by thorough credit analysis—remains the Fund’s cornerstone and the key driver of returns. The Fund’s innovative Interval Fund structure enables us to take a longer-term perspective and adhere to a value-based approach. As an example, the Retail sector has suffered significant selling pressure in recent months due to the encroaching threat of online shopping and is currently the highest yielding segment of the U.S. High Yield Market. We take advantage of this broad based sell-off by investing in loans issued by companies that have demonstrated their ability to thrive in the current environment through differentiated product, location and customer loyalty strategies. We believe this contrarian approach allows us to generate incremental returns for our shareholders without diminishing credit quality throughout the portfolio.
| Semi-Annual Report | March 31, 2017 | 1 |
| Resource Credit Income Fund | Shareholder Letter |
March 31, 2017 (Unaudited)
With elevated global uncertainly and a murky policy backdrop from the new Administration, the Fund is conservatively positioned with no leverage and broad diversification among sectors. Thank you for being a shareholder of the Resource Credit Income Fund and we look forward to a long-term partnership.
Sincerely,
Michael Terwilliger, CFA
Global Portfolio Manager
Resource Credit Income Fund
| 1 | Please note that Resource is not quoting a 30-day SEC yield. |
| 2 | To calculate the annualized distribution, the Fund’s management will take the income received from the Fund’s portfolio, subtract expenses, and divide the result by the total number of shares the Fund’s investors own. The annualized distribution represents a single distribution from the Fund and does not represent the total returns of the Fund. Distribution includes a return of capital. Distributions are not guaranteed. |
| 3 | London Interbank Offered Rate (LIBOR) is the average of interest rates, estimated by each of the leading banks in London, that would be charged on interbank borrowings. |
| 2 | www.resourcecreditincome.com |
| Resource Credit Income Fund | Portfolio Update |
March 31, 2017 (Unaudited)
The Fund’s performance figures for the period ended March 31, 2017, compared to its benchmark:
| Resource Credit Income Fund | 1 Month | Quarter | 6 Month | YTD | 1 Year | Since Inception* | Inception |
| Class A Shares | 1.21% | 7.35% | 12.32% | 7.35% | 25.85% | 9.44% | 4/17/2015 |
| Class A Shares w/ Sales Charge | -4.58% | 0.41% | 5.05% | 0.41% | 17.66% | 5.72% | 4/17/2015 |
| Class C Shares | 1.29% | 7.27% | 12.10% | 7.27% | 26.75% | 9.67% | 4/17/2015 |
| Class D Shares | 1.27% | 7.32% | 12.15% | 7.32% | 25.35% | 9.10% | 4/17/2015 |
| Class I Shares | 1.28% | 7.50% | 12.54% | 7.50% | 26.21% | 9.66% | 4/17/2015 |
| Class T Shares | 1.20% | 7.16% | 11.92% | 7.16% | 24.95% | 8.87% | 4/17/2015 |
| Class T Shares w/ Sales Charge | -0.32% | 5.56% | 10.19% | 5.56% | 23.13% | 8.04% | 4/17/2015 |
| Class U Shares | 1.31% | 7.44% | 12.42% | 7.44% | 25.96% | 9.49% | 4/17/2015 |
| Class U Shares w/ Sales Charge | -5.29% | 0.50% | 5.14% | 0.50% | 17.76% | 5.77% | 4/17/2015 |
| Class W Shares | 1.21% | 7.46% | 12.29% | 7.46% | 25.52% | 9.18% | 4/17/2015 |
| S&P/LSTA Leverage Loan Index | 0.08% | 1.15% | 3.43% | 1.15% | 9.72% | 3.85% | 4/17/2015 |
The S&P/LSTA Leveraged Loan Index (LLI) covers the U.S. market back to 1997 and currently calculates on a daily basis. This index is run in partnership between S&P and the Loan Syndications & Trading Association, the loan market’s trade group.
Diversification does not prevent losses or guarantee returns.
Past performance is not predictive of future results. The investment return and principal value of an investment will fluctuate. An investor’s shares when redeemed, may be worth more or less than the original cost. Total return is calculated assuming reinvestment of all dividends and distributions. Performance figures for periods less than one year are not annualized. The Fund’s total annual operating expense, including underlying funds before fee waivers is 20.65% for Class A, 21.40% for Class C, 20.65% for Class W, 20.40% for Class I, 20.65% for Class U, 21.40% for Class T and 21.15% for Class D shares per the most recent Class specific prospectus filings. After fee waivers, the Fund’s total annual operating expense is 3.64% for Class A, 4.39% for Class C, 3.64% for Class W, 3.39% for Class I, 3.64% for Class U, 4.39% for Class T and 4.14% for Class D shares. Class A shares are subject to a maximum sales load of 5.75% imposed on purchases. Class U shares are subject to a maximum sales load of 6.50% imposed on purchases. Class T shares are subject to a maximum sales load of 1.50% imposed on purchases. For performance information current to the most recent month-end, please call toll-free 1-855-747-9559.
| Semi-Annual Report | March 31, 2017 | 3 |
| Resource Credit Income Fund | Portfolio Update |
March 31, 2017 (Unaudited)
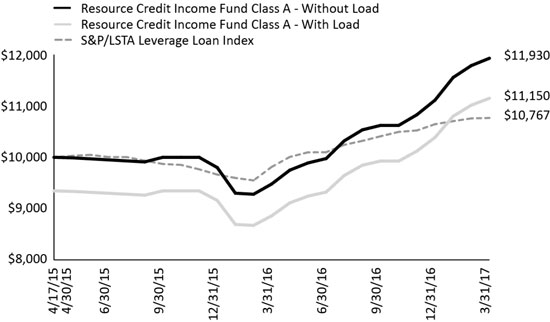
Comparison of the Change in Value of a $10,000 Investment
Portfolio Composition as of March 31, 2017
| Asset Type | Percent of Net Assets |
| Bonds & Notes | 29.51% |
| Bank Loans | 25.18% |
| Short Term Investments | 20.68% |
| Common Stock | 17.34% |
| Private Investment Funds | 5.92% |
Real Estate Investment Trusts - Preferred Stocks | 1.98% |
Real Estate Investment Trusts - Common Stocks | 1.21% |
| Total Investments | 101.82% |
| Liabilities in Excess of Other Assets | -1.82% |
| Net Assets | 100.00% |
| 4 | www.resourcecreditincome.com |
See Notes to Financial Statements.
Security determined to be illiquid under the procedures approved by the Fund’s Board of Trustees.
See Notes to Financial Statements.
See Notes to Financial Statements.
See Notes to Financial Statements.
See Notes to Financial Statements.
See Notes to Financial Statements.
See Notes to Financial Statements.
| Resource Credit Income Fund | Notes to Financial Statements |
| | March 31, 2017 (Unaudited) |
Resource Credit Income Fund (the “Trust” or the “Fund”) was organized as a Delaware statutory trust on December 11, 2014 and is registered under the Investment Company Act of 1940, as amended, (the “1940 Act”), closed-end management investment company that operates as an interval fund with a continuous offering of Fund shares. The Fund’s investment adviser at March 31, 2017 was Resource Financial Fund Management, Inc. (the “Adviser”). Effective April 11, 2017 the fund’s investment advisory agreement was transferred from Resource Financial Fund Management, Inc. to Resource Alternative Advisor, LLC. The investment objectives are to produce current income and to achieve capital preservation with moderate volatility and low to moderate correlation to the broader equity markets. The Fund is non-diversified and pursues its investment objectives by investing, under normal circumstances, at least 80% of its assets (defined as net assets plus the amount of any borrowing for investment purposes) in fixed-income and fixed-income related securities.
The Fund currently offers Class A, Class C, Class W, Class I, Class U, Class T and Class D shares; all classes of shares commenced operations on April 20, 2015. Class C, Class W, Class I and Class D shares are offered at net asset value. Class A shares are offered at net asset value plus a maximum sales charge of 5.75% and may also be subject to a 0.50% early withdrawal charge, which will be deducted from repurchase proceeds, for shareholders tendering shares fewer than 365 days after the original purchase date, if (i) the original purchase was for amounts of $1 million or more and (ii) the selling broker received the reallowance of the dealer-manager fee. Class U shares are offered at net asset value plus a maximum sales charge of 6.50% and may also be subject to a 0.50% early withdrawal charge, which will be deducted from repurchase proceeds, for shareholders tendering shares fewer than 365 days after the original purchase date, if (i) the original purchase was for amounts of $1 million or more and (ii) the selling broker received the reallowance of the dealer-manager fee. Class T shares are offered at net asset value plus a maximum sales charge of 1.50% and may also be subject to a 1.00% early withdrawal charge, which will be deducted from repurchase proceeds, for shareholders tendering shares fewer than 365 days after the original purchase date. Each class represents an interest in the same assets of the Fund and classes are identical except for differences in their sales charge structures and ongoing service and distribution charges. All classes of shares have equal voting privileges except that each class has exclusive voting rights with respect to its service and/or distribution plans. The Fund’s income, expenses (other than class specific distribution fees) and realized and unrealized gains and losses are allocated proportionately each day based upon the relative net assets of each class.
| 2. | SIGNIFICANT ACCOUNTING POLICIES |
The following is a summary of significant accounting policies followed by the Fund in preparation of its financial statements. These policies are in conformity with accounting principles generally accepted in the United States of America (“GAAP”). The Fund is considered an investment company for financial reporting purposes under GAAP. The preparation of financial statements requires management to make estimates and assumptions that affect the reported amounts of assets and liabilities and disclosure of contingent assets and liabilities at the date of the financial statements and the reported amounts of income and expenses for the period. Actual results could differ from those estimates. The Fund is an investment company and accordingly follows the investment company accounting and reporting guidance of the Financial Accounting Standards Board (FASB) Accounting Standard Codification Topic 946 “Financial Services – Investment Companies” including FASB Accounting Standard Update ASU 2013-08.
Security Valuation – Securities listed on an exchange are valued at the last reported sale price at the close of the regular trading session of the exchange on the business day the value is being determined, or in the case of securities listed on NASDAQ, at the NASDAQ Official Closing Price (“NOCP”). Short-term investments that mature in 60 days or less may be valued at amortized cost, provided such valuations represent fair value.
Structured credit and other similar debt securities including, but not limited to collateralized debt obligation debt and equity securities, asset-backed securities, commercial mortgage-backed securities, and other securitized investments backed by certain debt other receivables (collectively “Structured Credit Securities”) are valued on the basis of valuations provided by dealers in those instruments and/or independent pricing services recommended by the Adviser and approved by the Trust’s Board of Trustees (the “Board”). In determining value, dealers and pricing services will generally use information with respect to transactions in the securities being valued; quotations from other dealers; market transactions in comparable securities; analyses and evaluations of various relationships between securities; and yield to maturity information. The Adviser will, based on its reasonable judgment, select the dealer or pricing service quotation that most accurately reflects the fair market value of the Structured Credit Security while taking into account the information utilized by the dealer or pricing service to formulate the quotation in addition to any other relevant factors. In the event that there is a material discrepancies between quotations received from third party dealers or the pricing services the Adviser may (i) use an average of the quotations received or (ii) select an individual quotation that the Adviser, based up its reasonable judgment, determines to be accurate. In any instance in which the Adviser selects a single bid pursuant to section (e)(ii), the Adviser will provide to the Fair Value Committee an analysis of the factors relied upon in the selection of the relevant quotation.
When price quotations for certain securities are not readily available, or if the available quotations are not believed to be reflective of market value by the Adviser, those securities will be valued at “fair value” as determined in good faith by the Fair Value Committee using procedures adopted by and under the supervision of the Board. There can be no assurance that the Fund could purchase or sell a portfolio security at the price used to calculate the Fund’s net asset value (“NAV”).
| Semi-Annual Report | March 31, 2017 | 19 |
| Resource Credit Income Fund | Notes to Financial Statements |
| | March 31, 2017 (Unaudited) |
Fair valuation procedures may be used to value a substantial portion of the assets of the Fund. The Fund may use the fair value of a security to calculate its NAV when, for example, (1) a portfolio security is not traded in a public market or the principal market in which the security trades is closed, (2) trading in a portfolio security is suspended and not resumed prior to the normal market close, (3) a portfolio security is not traded in significant volume for a substantial period, or (4) the Adviser determines that the quotation or price for a portfolio security provided by a broker-dealer or independent pricing service is inaccurate.
The “fair value” of securities may be difficult to determine and thus judgment plays a greater role in the valuation process. The fair valuation methodology may include or consider the following guidelines, as appropriate: (1) evaluation of all relevant factors, including but not limited to, pricing history, current market level, supply and demand of the respective security; (2) comparison to the values and current pricing of securities that have comparable characteristics; (3) knowledge of historical market information with respect to the security; (4) other factors relevant to the security which would include, but not be limited to, duration, yield, fundamental analytical data, the Treasury yield curve and credit quality.
Valuation of Private Investment Funds – The Fund invests a portion of its assets in Private Investment Funds. Private Investment Funds measure their investment assets at fair value, and report a NAV per share on a calendar quarter basis. In accordance with Accounting Standards Codification (“ASC”) 820, the Fund has elected to apply the practical expedient and to value its investments in Private Investment Funds at their respective NAVs at each quarter. For non-calendar quarter days, the Fair Value Committee estimates the fair value of each Investment Fund by adjusting the most recent NAV for each Private Investment Fund, as necessary, by the change in a relevant benchmark that the Fair Value Committee has deemed to be representative of the market.
Loan Participation and Assignments – The Fund may invest in direct debt instruments which are interests in amounts owed to lenders or lending syndicates by corporate, governmental, or other borrowers. The Fund’s investments in loans may be in the form of participations in loans or assignments of all or a portion of the loans from third parties. A loan is often administered by a bank or other financial institution (the “lender”) that acts as agent for all holders. The agent administers the terms of the loan, as specified in the loan agreement. The Fund may invest in multiple series or tranches of a loan, which may have varying terms and carry different associated risks. The Fund generally has no right to enforce compliance with the terms of the loan agreement with the borrower. As a result, the Fund may be subject to the credit risk of both the borrower and the lender that is selling the loan agreement. When the Fund purchases assignments from lenders they acquire direct rights against the borrower of the loan. The Fund may enter into unfunded loan commitments, which are contractual obligations for future funding. Unfunded loan commitments represent a future obligation in full, even though a percentage of the notional loan amounts may not be utilized by the borrower. When investing in a loan participation, the Fund has the right to receive payments of principal, interest and any fees to which it is entitled only from the lender selling the loan agreement and only upon receipt of payments by the lender from the borrower. The Fund may receive a commitment fee based on the undrawn portion of the underlying line of credit portion of a floating rate loan. In certain circumstances, the Fund may receive a penalty fee upon the prepayment of a floating rate loan by a borrower. Fees earned or paid are recorded as a component of interest income or interest expense, respectively, on the Statement of Operations.
Fair Value Measurements – A three-tier hierarchy has been established to classify fair value measurements for disclosure purposes. Inputs refer broadly to the assumptions that market participants would use in pricing the asset or liability, including assumptions about risk. Inputs may be observable or unobservable. Observable inputs are inputs that reflect the assumptions market participants would use in pricing the asset or liability that are developed based on market data obtained from sources independent of the reporting entity. Unobservable inputs are inputs that reflect the reporting entity’s own assumptions about the assumptions market participants would use in pricing the asset or liability that are developed based on the best information available. In accordance with the authoritative guidance on fair value measurements and disclosure under GAAP, the Fund discloses the fair value of its investments in a hierarchy that prioritizes the inputs to valuation techniques used to measure the fair value.
Various inputs are used in determining the value of the Fund’s investments as of the reporting period end. These inputs are categorized in the following hierarchy under applicable financial accounting standards:
| Level 1 – | Unadjusted quoted prices in active markets for identical, unrestricted assets or liabilities that the Fund has the ability to access at the measurement date; |
| Level 2 – | Quoted prices which are not active, quoted prices for similar assets or liabilities in active markets or inputs other than quoted prices that are observable (either directly or indirectly) for substantially the full term of the asset or liability at the measurement date; and |
| Level 3 – | Significant unobservable prices or inputs (including the Fund’s own assumptions in determining the fair value of investments) where there is little or no market activity for the asset or liability at the measurement date. |
| 20 | www.resourcecreditincome.com |
| Resource Credit Income Fund | Notes to Financial Statements |
| | March 31, 2017 (Unaudited) |
The availability of observable inputs can vary from security to security and is affected by a wide variety of factors, including, for example, the type of security, whether the security is new and not yet established in the marketplace, the liquidity of markets and other characteristics particular to the security. To the extent that valuation is based on models or inputs that are less observable or unobservable in the market, the determination of fair value requires more judgment. Accordingly, the degree of judgment exercised in determining fair value is greatest for instruments categorized in Level 3.
An investment level within the fair value hierarchy is based on the lowest level input, individually or in the aggregate, that is significant to fair value measurement. The valuation techniques used by the Fund to measure fair value during the period ended March 31, 2017 maximized the use of observable inputs and minimized the use of unobservable inputs.
The inputs or methodologies used for valuing securities are not necessarily an indication of the risk or liquidity associated with investing in those securities. The following is a summary of the inputs used in valuing the Fund’s investments as of March 31, 2017:
| Investments in Securities at Value | | Level 1 | | | Level 2 | | | Level 3 | | | Total | |
| Bank Loans | | $ | – | | | $ | 5,472,298 | | | $ | – | | | $ | 5,472,298 | |
Bonds & Notes(a) | | | – | | | | 6,411,774 | | | | – | | | | 6,411,774 | |
Common Stocks(a) | | | 3,767,892 | | | | – | | | | – | | | | 3,767,892 | |
Preferred Stocks(a) | | | 430,208 | | | | – | | | | – | | | | 430,208 | |
| Real Estate Investment Trusts - Common Stocks | | | 262,318 | | | | – | | | | – | | | | 262,318 | |
| Private Investment Funds | | | | | | | | | | | | | | | | |
(Measured at net asset value)(b) | | | – | | | | – | | | | – | | | | 1,286,165 | |
| Short Term Investments | | | 4,494,273 | | | | – | | | | – | | | | 4,494,273 | |
| TOTAL | | $ | 8,954,691 | | | $ | 11,884,072 | | | $ | – | | | $ | 22,124,928 | |
(a) | For detailed descriptions, see the accompanying Portfolio of Investments. |
(b) | In accordance with Subtopic 820-10, certain investments that are measured at fair value using the net asset value per share (or its equivalent) practical expedient have not been classified in the fair value hierarchy. The fair value amounts presented in this table are intended to permit reconciliation of the fair value hierarchy to the amounts presented in the Statement of Assets and Liabilities. |
There were no transfers between Levels 1, 2 and 3 during the period ended March 31, 2017. It is the Fund’s policy to recognize transfers between levels at the end of the reporting period.
Security Transactions and Investment Income – Investment security transactions are accounted for on a trade date basis. Cost is determined and gains and losses are based upon the specific identification method for both financial statement and federal income tax purposes. Dividend income is recorded on the ex-dividend date and interest income is recorded on the accrual basis. Purchase discounts and premiums on securities are accreted and amortized over the life of the respective securities.
Federal and Other Taxes – No provision for income taxes is included in the accompanying financial statements, as the Fund intends to distribute to shareholders all taxable investment income and realized gains and otherwise comply with Subchapter M of the Internal Revenue Code of 1986, as amended, applicable to regulated investment companies.
The Fund evaluates tax positions taken (or expected to be taken) in the course of preparing the Fund’s tax provisions to determine whether these positions meet a “more-likely-than-not” standard that, based on the technical merits, have a more than fifty percent likelihood of being sustained by a taxing authority upon examination. A tax position that meets the “more-likely-than-not” recognition threshold is measured to determine the amount of benefit to recognize in the financial statements.
As of and during the period ended March 31, 2017, the Fund did not have a liability for any unrecognized tax benefits. The Fund files U.S. federal, state and local tax returns as required. The Fund’s tax returns are subject to examination by the relevant tax authorities until expiration of the applicable statute of limitations which is generally three years after the filing of the tax return for federal purposes and four years for most state returns. Tax returns for open years have incorporated no uncertain tax positions that require a provision for income taxes.
Foreign Currency – The accounting records of the Fund are maintained in U.S. dollars. Investment securities and other assets and liabilities denominated in a foreign currency and income receipts and expense payments are translated into U.S. dollars using the prevailing exchange rate at the London market close. Purchases and sales of securities are translated into U.S. dollars at the contractual currency rates established at the approximate time of the trade. Net realized gains and losses on foreign currency transactions represent net gains and losses from currency realized between the trade and settlement dates on securities transactions and the difference between income accrued versus income received. The effects of changes in foreign currency exchange rates on investments in securities are included with the net realized and unrealized gain or loss on investment securities.
| Semi-Annual Report | March 31, 2017 | 21 |
| Resource Credit Income Fund | Notes to Financial Statements |
| | March 31, 2017 (Unaudited) |
Distributions to Shareholders – Distributions from investment income are declared and paid quarterly. Distributions from net realized capital gains, if any, are declared and paid annually and are recorded on the ex-dividend date. The character of income and gains to be distributed is determined in accordance with income tax regulations, which may differ from GAAP.
Concentration of Credit Risk – The Fund places its cash with one banking institution, which is insured by Federal Deposit Insurance Corporation (FDIC). The FDIC limit is $250,000. At various times throughout the year, the amount on deposit may exceed the FDIC limit and subject the Fund to a credit risk. The Fund does not believe that such deposits are subject to any unusual risk associated with investment activities.
Indemnification – The Trust indemnifies its officers and Trustees for certain liabilities that may arise from the performance of their duties to the Trust. Additionally, in the normal course of business, the Fund enters into contracts that contain a variety of representations and warranties and which provide general indemnities. The Fund’s maximum exposure under these arrangements is unknown, as this would involve future claims that may be made against the Fund that have not yet occurred. However, based on industry experience, the Trust expects the risk of loss due to these warranties and indemnities to be remote.
| 3. | ADVISORY FEES AND OTHER TRANSACTIONS WITH SERVICE PROVIDERS |
Advisory Fees – Pursuant to an investment advisory agreement (the “Advisory Agreement”), investment advisory services are provided to the Fund by the Adviser. Under the terms of the Advisory Agreement, the Adviser receives a monthly base management fee calculated at an annual rate of 1.85% of the average daily net assets of the Fund. For the period ended March 31, 2017, the Fund incurred $107,248 in base management fees, all of which were waived.
The Adviser has contractually agreed to waive all or part of its management fees (excluding any incentive fee) and/or make payments to limit Fund expenses, (including all organization and offering expenses, but excluding interest, brokerage commissions, acquired fund fees and expenses and extraordinary expenses) at least until September 9, 2018, so that the total annual operating expenses of the Fund do not exceed 2.59% per annum of Class A average daily net assets, 3.34% per annum of Class C average daily net assets, 2.59% per annum of Class W average daily net assets, 2.34% per annum of Class I average daily net assets, 2.59% per annum of Class U average daily net assets, 3.34% per annum of Class T average daily net assets and 3.09% per annum of Class D average daily net assets. Fee waivers and expense payments may be recouped by the Adviser from the Fund, to the extent that overall expenses fall below the expense limitation, within three years of when the amounts were waived or reimbursed. During the period ended March 31, 2017, the Adviser waived fees and reimbursed expenses of $219,952.
As of March 31, 2017, the balance of recoupable expenses for the Fund was as follows:
| Fund | | Expires February 20, 2018 | | | Expires September 30, 2018 | | | Expires September 30, 2019 | |
| Resource Credit Income Fund | | $ | 36,870 | * | | $ | 398,666 | | | $ | 829,791 | |
| * | Organizational Expenses were reduced from $37,338 to $36,870 subsequent to the February 20, 2015 Audit of the Seed Financial Statements. |
An incentive fee is also payable to the Adviser. The incentive fee is calculated and payable quarterly in arrears based upon the Fund’s “pre-incentive fee net investment income” for the immediately preceding quarter and is subject to a hurdle rate, expressed as a rate of return on the Fund’s “adjusted capital,” equal to 2.25% per quarter (or an annualized hurdle rate of 9.0%), subject to a “catch-up” feature. For this purpose, “pre-incentive fee net investment income” means interest income, dividend income and any other income accrued during the calendar quarter, minus the Fund’s operating expenses for the quarter (including the management fee, expenses reimbursed to the Adviser and any interest expenses and distributions paid on any issued and outstanding preferred shares, but excluding the incentive fee). “Adjusted capital” means the cumulative gross proceeds received by the Fund from the sale of shares (including pursuant to the Fund’s distribution reinvestment plan), reduced by amounts paid in connection with purchases of shares pursuant to the Fund’s share repurchase program.
No incentive fee is payable in any calendar quarter in which the Fund’s pre-incentive fee net investment income does not exceed the quarterly hurdle rate of 2.25%. For any calendar quarter in which the Fund’s pre-incentive fee net investment income is greater than the hurdle rate, but less than or equal to 2.8125%, the incentive fee will equal the amount of the Fund’s pre-incentive fee net investment income in excess of the hurdle rate. This portion of the Fund’s pre-incentive fee net investment income which exceeds the hurdle rate but is less than or equal to 2.8125% is referred to as the “catch-up.” The “catch-up” provision is intended to provide the Adviser with an incentive fee of 20.0% on all of the Fund’s pre-incentive fee net investment income when the Fund’s pre-incentive fee net investment income reaches 2.8125% in any calendar quarter. For any calendar quarter in which the Fund’s pre-incentive fee net investment income exceeds 2.8125% of adjusted capital, the incentive fee will equal 20.0% of pre-incentive fee net investment income. For the period ended March 31, 2017, there was no incentive fee incurred.
| 22 | www.resourcecreditincome.com |
| Resource Credit Income Fund | Notes to Financial Statements |
| | March 31, 2017 (Unaudited) |
Fund Accounting Fees and Expenses – ALPS Fund Services, Inc. (“ALPS”) serves as the Fund’s Administrator and Accounting Agent (the “Administrator”) and receives customary fees from the Fund for such services.
Transfer Agent – DST Systems Inc., an affiliate of ALPS, serves as transfer, dividend paying and shareholder servicing agent for the Fund (“Transfer Agent”).
Distributor – The Fund has entered into a Distribution Agreement with ALPS Distributors, Inc. (the “Distributor”) to provide distribution services to the Fund. There are no fees paid to the Distributor pursuant to the Distribution Agreement. The Board has adopted, on behalf of the Fund, a Shareholder Servicing Plan under which the Fund may compensate financial industry professionals for providing ongoing services in respect of clients with whom they have distributed shares of the Fund. Under the Shareholder Servicing Plan, the Fund’s Class A, Class C, Class W, Class U, Class T and Class D shares are subject to a shareholder servicing fee at an annual rate of 0.25% of the average daily net assets attributable to that share class. For the period ended March 31, 2017, the Fund incurred shareholder servicing fees of $14,079. The Class C and Class T shares also pay to the Distributor a distribution fee, pursuant to a distribution plan adopted by the Board, that accrues at an annual rate equal to 0.75% of the Fund’s average daily net assets attributable to Class C and Class T shares and is payable on a quarterly basis. In addition, Class D shares pay to Resource Securities, Inc. (the “Dealer Manager”), an affiliate of the Adviser, a dealer manager fee, pursuant to a distribution plan adopted by the Board, that accrues at an annual rate equal to 0.50% of the Fund’s average daily net assets attributable to Class W and Class D shares and is payable on a quarterly basis. Class A, Class I, and Class U shares are not currently subject to a distribution fee. For the period ended March 31, 2017, the Fund accrued $6,489 in distribution fees and $1,973 in dealer manager fees.
The Distributor acts as the Fund’s principal underwriter in a continuous public offering of the Fund’s shares. The Distributor is an affiliate of ALPS. During the period ended March 31, 2017, no fees were retained by the Distributor.
Trustees – Each Trustee who is not affiliated with the Trust or the Adviser will receive an annual fee of $10,000, plus $2,000 for attending the annual in-person meeting of the Board of Trustees, plus $500 for attending each of the remaining telephonic meetings, as well as reimbursement for any reasonable expenses incurred attending the meetings. None of the executive officers receives compensation from the Trust.
| 4. | INVESTMENT TRANSACTIONS |
The cost of purchases and proceeds from the sale of securities, other than short-term securities, for the period ended March 31, 2017 amounted to $16,558,724 and $3,814,840, respectively.
The tax characteristics of distributions paid for the year ended September 30, 2016 were as follows:
| | | Ordinary Income | | | Long-Term Capital Gain | | | Return of Capital | |
| | $ | 106,763 | | | $ | – | | | $ | 27,206 | |
The following information is computed on a tax basis for each item as of March 31, 2017:
| | | Gross Appreciation (excess of value over tax cost) | | | Gross Depreciation (excess of tax cost over value) | | | Net Unrealized Appreciation | | | Cost of Investments for Income Tax Purposes | |
| | $ | 967,383 | | | $ | (107,041 | ) | | $ | 860,342 | | | $ | 21,264,586 | |
The difference between book basis and tax basis distributable earnings and unrealized appreciation/(depreciation) is primarily attributable to the tax deferral of losses on wash sales, investments in partnerships and certain other investments.
| Semi-Annual Report | March 31, 2017 | 23 |
| Resource Credit Income Fund | Notes to Financial Statements |
| | March 31, 2017 (Unaudited) |
Pursuant to Rule 23c-3 under the 1940 Act, the Fund offers shareholders on a quarterly basis the option of redeeming shares, at net asset value, of up to 5% of its issued and outstanding shares as of the close of regular business hours on the New York Stock Exchange on the Repurchase Pricing Date. If shareholders tender for repurchase more than 5% of the outstanding shares of the Fund, the Fund may, but is not required to, repurchase up to an additional 2%. If the Fund determines not to repurchase an additional 2%, or if more than 7% of the shares are tendered, then the Fund will repurchase shares on a pro rata basis based upon the number of shares tendered by each shareholder. There can be no assurance that the Fund will be able to repurchase all shares that each shareholder has tendered, even if all the shares in a shareholder’s account are tendered. In the event of an oversubscribed offer, you may not be able to tender all shares that you wish to tender and may have to wait until the next quarterly repurchase offer to tender the remaining shares. Subsequent repurchase requests will not be given priority over other shareholder requests.
During the period ended March 31, 2017, the Fund completed two quarterly repurchase offers. In these offers, the Fund offered to repurchase up to 5% of the number of its outstanding shares as of the Repurchase Pricing Dates. The result of those repurchase offers were as follows:
| | Repurchase Offer #1 | Repurchase Offer #2 |
| Commencement Date | September 19, 2016 | December 12, 2016 |
| Repurchase Request Deadline | October 19, 2016 | January 11, 2017 |
| Repurchase Pricing Date | October 19, 2016 | January 11, 2017 |
| Amount Repurchased | $54,269 | $238,883 |
| Shares Repurchased | 5,218 | 22,346 |
The Fund has a secured revolving bank line of credit through BNP Paribas Prime Brokerage International, Ltd. (the “Bank”) for purpose of investment purchases subject to the limitations of the 1940 Act for borrowings.
Borrowings under this arrangement bear interest at the Bank’s 3 month LIBOR plus 95 basis points at the time of borrowing. During the period ended March 31, 2017, the Fund incurred $42 of interest expense related to the borrowings. Average borrowings and the average interest rate during the period ended March 31, 2017 were $4,383 and 1.94%, respectively. The largest outstanding borrowing during the period ended March 31, 2017 was $5,076. As of March 31, 2017, the Fund had no outstanding borrowings.
Subsequent events after the date of the Statement of Assets and Liabilities have been evaluated through the date the financial statements were issued.
The Fund completed a quarterly repurchase offer on April 20, 2017 which resulted in 7,470 of Fund shares being repurchased for $83,406.
Effective April 11, 2017 the fund’s investment advisory agreement was transferred from Resource Financial Fund Management, Inc. to Resource Alternative Advisor, LLC.
Management has determined that there were no other subsequent events to report through the issuance of these financial statements.
| 9. | RECENT ACCOUNTING PRONOUNCEMENTS |
On October 13, 2016, the Securities and Exchange Commission amended Regulation S-X, which will require standardized, enhanced disclosure about derivatives in investment company financial statements, as well as other amendments. The compliance date for the amendments to Regulation S-X is August 1, 2017. Management is evaluating the impact to the financial statements and disclosures.
| 24 | www.resourcecreditincome.com |
| Resource Credit Income Fund | Additional Information |
| | March 31, 2017 (Unaudited) |
| 1. | PROXY VOTING POLICIES AND VOTING RECORD |
A description of the policies and procedures that the Fund uses to vote proxies relating to portfolio securities is available without charge upon request by calling toll-free 855-747-9559, or on the Securities and Exchange Commission’s (“SEC”) website at http://www.sec.gov. Information regarding how the Fund voted proxies relating to portfolio securities during the most recent 12-month period ended June 30th is available without charge upon request by calling toll-free 855-747-9559, or on the SEC’s website at http://www.sec.gov.
| 2. | QUARTERLY PORTFOLIO HOLDINGS |
The Fund files a complete listing of portfolio holdings for the Fund with the SEC as of the first and third quarters of each fiscal year on Form N-Q. The filings are available upon request by calling 855-747-9559. Furthermore, you may obtain a copy of the filing on the SEC’s website at http://www.sec.gov. The Fund’s Form N-Q may also be reviewed and copied at the SEC’s Public Reference Room in Washington, D.C., and information on the operation of the Public Reference Room may be obtained by calling 1-800-SEC-0330.
| Semi-Annual Report | March 31, 2017 | 25 |
INVESTMENT ADVISER
Resource Financial Fund Management, Inc.
One Crescent Drive, Suite 203
Philadelphia, Pennsylvania 19112
DISTRIBUTOR
ALPS Distributors, Inc.
1290 Broadway, Suite 1100
Denver, Colorado 80203
LEGAL COUNSEL
Thompson Hine LLP
41 South High Street, Suite 1700
Columbus, Ohio 43215
INDEPENDENT REGISTERED
PUBLIC ACCOUNTING FIRM
BBD, LLP
1835 Market Street, 26th Floor
Philadelphia, Pennsylvania 19103
Must be accompanied or preceded by a Prospectus.
ALPS Distributors, Inc. is the Distributor for Resource Credit Income Fund.