UNITED STATES
SECURITIES AND EXCHANGE COMMISSION
WASHINGTON, D.C. 20549
FORM N-CSR
CERTIFIED SHAREHOLDER REPORT OF REGISTERED
MANAGEMENT INVESTMENT COMPANIES
811-23016
(Investment Company Act file number)
Resource Credit Income Fund
(Exact name of registrant as specified in charter)
712 Fifth Avenue, 12th Floor
New York, NY 10019
(Address of principal executive offices) (Zip code)
The Corporation Trust Company
Corporation Trust Center, 1209 Orange Street
Wilmington, DE 19801
(Name and address of agent for service)
Copy to:
JoAnn M. Strasser Thompson Hine LLP 41 South High Street, 17th Floor Columbus, OH 43215 (614) 469-3265 | Lawrence S. Block Resource Credit Income Fund 717 Fifth Avenue, 18th Floor New York, NY 10022 (212) 705-5090 |
Registrant's telephone number, including area code: (212) 506-3899
Date of fiscal year end: September 30
Date of reporting period: October 1, 2017 - March 31, 2018
Item 1. Reports to Stockholders.

| Shareholder Letter | 1 |
| Portfolio Update | 3 |
| Portfolio of Investments | 5 |
| Statement of Assets and Liabilities | 8 |
| Statement of Operations | 9 |
| Statements of Changes in Net Assets | 10 |
| Financial Highlights | |
| Class A | 13 |
| Class C | 14 |
| Class W | 15 |
| Class I | 16 |
| Class L | 17 |
| Notes to Financial Statements | 18 |
| Additional Information | 25 |
| Resource Credit Income Fund | Shareholder Letter |
March 31, 2018 (Unaudited)
Dear Shareholders:
We are pleased to present you with the Resource Credit Income Fund (the “Fund” or “CIF”) Semi-Annual Report for the six months ended March 31, 2018. As evidenced by its track record, the Fund again delivered on its core objectives of protecting investors’ principal and limiting market volatility while generating current income through investing in a range of credit assets.
The Fund seeks investments within the following segments of the fixed income universe: publicly traded credit-linked equities (e.g. primarily public business development companies, commonly known as BDCs); private credit funds; and direct investment in traded loans and bonds (which encompasses structured credit).
The Fund’s current target allocations within these strategies are as follows:
| ● | 15% Publicly traded BDCs and other credit-linked securities |
| ● | 25% Private credit funds |
| ● | 60% Direct loans and bonds |
We would highlight two developments in the portfolio since our last shareholder letter.
First, the Fund has lowered its target allocation to publicly traded BDCs from 20% to 15%. We continue to believe BDCs represent an attractively priced yield-based asset class, but we are mindful of their contribution to the Fund’s overall volatility. A modest reduction in target exposure should lower the Fund’s volatility without sacrificing the attractive yield and liquidity provided by the strategy.
Second, we are pleased to announce our fourth private credit investment, BlackRock Global Credit Opportunities Fund, LP. This investment furthers the Fund’s objective of providing investors with access to what we believe are the world’s preeminent credit managers, as well as a range of differentiated credit strategies. With four funded private credit investments and three unfunded commitments, we are pleased by the increased diversification within our portfolio.
Amid a backdrop that we believe is signaling additional interest rate pressures, the Fund remains roughly 75% invested in floating-rate instruments. We would again emphasize that the Fund does not rely upon interest rates to drive returns and the Fund does not “bet” on the direction of rates. Furthermore, we continue to rely upon our proprietary investment process, the Resource America Liquid Alternatives Score, to assist in the Fund’s investment process. By taking a disciplined and regimented approach to credit analysis - attempting to quantify key fundamental, industry and capital structure factors - we attempt to identify attractive risk-adjusted return opportunities for the Fund while seeking to minimize subjective investment biases.
Fund Performance
In a period punctuated by a dramatic increase in market volatility, the Fund posted a gain of 2.08% during the semi-annual period. By way of comparison, the S&P/LSTA Leveraged Loan Total Return Index1 and the ICE of BAML US High Yield Index2 posted total returns of 2.58% and -0.51%, respectively, over that same period.
Investment Positioning
In late 2015, the Fund began investing with the perspective that investors needed to adjust their portfolios to guard against the looming threat of rising interest rates - a decision that has proven prescient as U.S. 10-Year Treasury yields troughed at 1.37% in July 2016 and have migrated to just below 3.00% at the end of March 2018.
Although interest rates have increased dramatically, we believe a confluence of global macro and U.S. fiscal policy factors will continue to push rates higher. In our view, the U.S. Federal Reserve (the “Fed”) is rapidly attempting to “normalize” interest rates before the next downturn, particularly given the firm economic environment. Barring a notable slowdown, we believe the Fed’s default position for the coming quarter will be to increase rates even further. The Fed has signaled three interest rate increases in 2018 (two following the 25bps increase at the March meeting), but we see increasing risks for a fourth interest rate increase.
On the fiscal policy front, the recent tax cut will contribute roughly $1.3 trillion of deficit spending over the next ten years3. The price for ending the government shutdown in early 2018 included more than $300 billion of additional unfunded outlays. Deficit spending will further pressure interest rates as the Fed must attract buyers of this paper with higher yields.
| Semi-Annual Report | March 31, 2018 | 1 |
| Resource Credit Income Fund | Shareholder Letter |
March 31, 2018 (Unaudited)
The Fund’s strategy is designed to provide investors with a fixed income strategy that minimizes interest rate risk through active management and “value-based” security selection within the corporate loan and bond universe. We feel that the Fund’s track-record demonstrates our ability to deliver on this principle.
Thank you for being a shareholder of Resource Credit Income Fund.
Sincerely,
Michael Terwilliger, CFA
Portfolio Manager
Resource Credit Income Fund
| 1 | S&P/LSTA Leveraged Loan Total Return Index - The S&P/LSTA Leveraged Loan Index (the Index) is a market value-weighted index designed to measure the performance of the U.S. leveraged loan market based upon market weightings, spreads and interest payments. |
| 2 | ICE BofAML US High Yield Index - The BofAML US High Yield Index tracks the performance of US dollar denominated below investment grade corporate debt publicly issued in the US domestic market. |
| 3 | “Tax Cuts Spending Raise Deficit 1 Trillion”, NBC News 4/09/2018. |
| 2 | www.resourcecreditincome.com |
| Resource Credit Income Fund | Portfolio Update |
March 31, 2018 (Unaudited)
The Fund’s performance figures for the period ended March 31, 2018, compared to its benchmark:
| Resource Credit Income Fund | 1 Month | Quarter | 6 Month | YTD | 1 Year | Since Inception* | Inception |
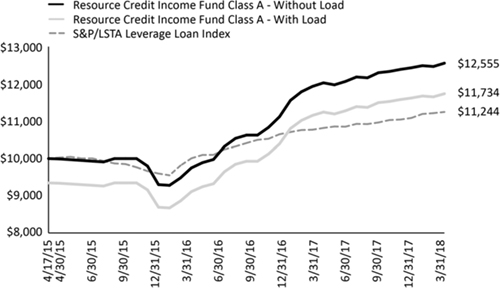
| Class A Shares | 0.67% | 0.95% | 2.08% | 0.95% | 5.24% | 8.00% | 4/17/2015 |
| Class A Shares w/ Sales Charge | -5.13% | -4.89% | -3.80% | -4.89% | -0.81% | 5.56% | 4/17/2015 |
| Class C Shares | 0.58% | 0.76% | 1.71% | 0.76% | 4.36% | 7.84% | 4/17/2015 |
| Class C Shares w/ Sales Charge(a) | -1.90% | -1.72% | -0.78% | -1.72% | 1.84% | 7.30% | 4/17/2015 |
| Class I Shares | 0.65% | 1.01% | 2.21% | 1.01% | 5.41% | 8.21% | 4/17/2015 |
| Class L Shares | 0.61% | 0.88% | 1.95% | 0.88% | 0.00% | 2.85% | 7/28/2017 |
| Class L Shares w/ Sales Charge | -3.64% | -3.39% | -2.35% | -3.39% | 0.00% | -1.55% | 7/28/2017 |
| Class W Shares | 0.67% | 0.86% | 2.08% | 0.86% | 5.24% | 7.83% | 4/17/2015 |
| S&P/LSTA Leverage Loan Index | 0.28% | 1.45% | 2.58% | 1.45% | 4.43% | 4.05% | 4/17/2015 |
| (a) | Effective as of December 23, 2016, Class C shares no longer have a sales charge. |
The S&P/LSTA Leveraged Loan Index is a market value-weighted index designed to measure the performance of the U.S. leveraged loan market based upon market weightings, spreads and interest payments.
Past performance is not predictive of future results. The investment return and principal value of an investment will fluctuate. An investor’s shares when redeemed, may be worth more or less than the original cost. Total return is calculated assuming reinvestment of all dividends and distributions. Performance figures for periods less than one year are not annualized. The Fund’s total annual operating expenses, including acquired fund fees and expenses, before fee waivers is 6.25% for Class A, 6.63% for Class C, 5.70% for Class W, 5.80% for Class I and 5.74% for Class L shares per the most recent Class specific prospectus filings. After fee waivers, the Fund’s total annual operating expense is 3.94% for Class A, 4.69% for Class C, 3.94% for Class W, 3.69% for Class I and 4.19% for Class L shares. Class A shares are subject to maximum sales loads of 5.75% imposed on purchases. Class L shares are subject to a maximum sales load of 4.25% imposed on purchases. Share repurchases within 365 days may be subject to an early withdrawal charge of 0.50% for Class A and 1.00% for Class C shares. For performance information current to the most recent month- end, please call toll-free 1-855-747-9559.
| Semi-Annual Report | March 31, 2018 | 3 |
| Resource Credit Income Fund | Portfolio Update |
March 31, 2018 (Unaudited)
Comparison of the Change in Value of a $10,000 Investment
Portfolio Composition as of March 31, 2018
| Asset Type | Percent of Net Assets |
| Bonds & Notes | 32.93% |
| Bank Loan | 23.79% |
| Common Stock | 21.33% |
| Private Investment Funds | 16.65% |
| Real Estate Investment Trusts - Common Stocks | 1.34% |
| Short Term Security | 0.40% |
| Total Investments | 96.44% |
| Other Assets in Excess of Liabilities | 3.56% |
| Net Assets | 100.00% |
| 4 | www.resourcecreditincome.com |
| Resource Credit Income Fund | Portfolio of Investments |
March 31, 2018 (Unaudited)
| | | Interest | | Maturity | | Principal | | Value |
| BANK LOANS (23.79%) | | | | | | | | | | | | |
| ABG Intermediate Holdings 2 LLC, Second Lien Initial Term Loan(a) | | 3M US L + 7.75% | | 09/29/2025 | | $ | 1,000,000 | | | $ | 1,016,250 | |
| Advantage Sales & Marketing, Inc., Second Lien Term Loan(a) | | 3M US L + 6.50%, 1% Floor | | 07/25/2022 | | | 2,425,000 | | | | 2,335,796 | |
| BJ's Wholesale Club, Inc., Second Lien Initial Term Loan(a) | | 1M US L + 7.50%, 1% Floor | | 02/03/2025 | | | 1,300,000 | | | | 1,307,514 | |
| CIBT Global, Inc., Second Lien Initial Term Loan(a) | | 3M US L + 7.75% | | 06/01/2025 | | | 1,000,000 | | | | 1,010,000 | |
| Coinamatic Canada, Inc., Second Lien Initial Canadian Term Loan(a) | | 1M US L + 7.00%, 1% Floor | | 05/12/2023 | | | 18,630 | | | | 18,537 | |
| Equinox Holdings, Inc., Second Lien Initial Term Loan(a) | | 1M US L + 7.00%, 1% Floor | | 09/06/2024 | | | 1,250,000 | | | | 1,284,375 | |
| Genoa, a QoL Healthcare Co. LLC, Second Lien Initial Term Loan(a) | | 1M US L + 8.00%, 1% Floor | | 10/28/2024 | | | 400,000 | | | | 406,000 | |
| Institutional Shareholder Services, Inc., Second Lien Initial Term Loan(a) | | 3M US L + 7.75% | | 10/16/2025 | | | 2,000,000 | | | | 2,020,001 | |
| OEConnection LLC, Second Lien Term Loan(a) | | 3M US L + 8.00% | | 11/22/2025 | | | 1,500,000 | | | | 1,500,000 | |
| Paradigm Acquisition Corp., First Lien Initial Term Loan(a) | | 3M US L + 4.25% | | 10/11/2024 | | | 997,500 | | | | 1,007,475 | |
| Paradigm Acquisition Corp., Second Lien Initial Term Loan(a) | | 3M US L + 8.50% | | 10/10/2025 | | | 2,000,000 | | | | 2,010,000 | |
| Renaissance Learning, Inc., Second Lien Initial Term Loan(a) | | 3M US L + 7.00%, 1% Floor | | 04/11/2022 | | | 4,803,208 | | | | 4,833,228 | |
| UFC Holdings LLC, Second Lien Term Loan(a) | | 1M US L + 7.50%, 1% Floor | | 08/18/2024 | | | 250,000 | | | | 255,375 | |
| USS Ultimate Holdings, Inc., Second Lien Initial Term Loan(a) | | 1M US L + 7.75%, 1% Floor | | 08/25/2025 | | | 2,000,000 | | | | 2,027,910 | |
| VIP Cinema Holdings, Inc., First Lien Initial Term Loan(a) | | 3M US L + 6.00% | | 03/01/2023 | | | 712,500 | | | | 720,740 | |
| Wash MultiFamily Acquisition, Inc., Second Lien Initial Term Loan(a) | | 1M US L + 7.00%, 1% Floor | | 05/15/2023 | | | 106,370 | | | | 105,838 | |
| Winebow Holdings, Inc. (Vinter Group, Inc.), Second Lien Term Loan(a) | | 1M US L + 7.50%, 1% Floor | | 01/02/2022 | | | 2,775,000 | | | | 2,594,625 | |
| | | | | | | | | | | | | |
| TOTAL BANK LOANS | | | | | | | | | | | | |
| (Cost $24,152,303) | | | | | | | | | | | 24,453,664 | |
| | | | | | | | | | | | | |
| BONDS & NOTES (32.93%) | | | | | | | | | | | | |
| ASSET BACKED SECURITIES (18.59%) | | | | | | | | | | | | |
| Apex Credit CLO 2015-II, Ltd., Class E(a)(b)(c) | | 3M US L + 7.00% | | 10/19/2026 | | | 500,000 | | | | 500,528 | |
| Apidos CLO XXII, Class E(a)(b) | | 3M US L + 7.25% | | 10/20/2027 | | | 1,000,000 | | | | 1,004,909 | |
| Battalion CLO VI, Ltd., Class E(a)(b)(c) | | 3M US L + 5.20% | | 10/17/2026 | | | 1,131,000 | | | | 997,159 | |
| Bowman Park CLO, Ltd., Class F(a)(b)(c) | | 3M US L + 7.00% | | 11/23/2025 | | | 1,000,000 | | | | 1,003,283 | |
| Canyon Capital CLO 2014-1, Ltd., Class ER(a)(b) | | 3M US L + 7.70% | | 01/30/2031 | | | 1,000,000 | | | | 939,799 | |
| Dryden 37 Senior Loan Fund, Class FR(a)(b) | | 3M US L + 7.48% | | 01/15/2031 | | | 2,312,500 | | | | 2,226,016 | |
| Jamestown CLO V, Ltd., Class F(a)(b)(c) | | 3M US L + 5.85% | | 01/17/2027 | | | 1,400,000 | | | | 1,173,435 | |
| Marathon CLO VI, Ltd., Class E(a)(b)(c) | | 3M US L + 5.80% | | 05/13/2025 | | | 1,100,000 | | | | 1,007,972 | |
| Midocean Credit CLO V, Class E(a)(b)(c) | | 3M US L + 6.95% | | 10/19/2028 | | | 750,000 | | | | 755,246 | |
| OCP CLO 2013-4, Ltd., Class DR(a)(b)(c) | | 3M US L + 6.77% | | 04/24/2029 | | | 1,000,000 | | | | 1,007,462 | |
| Octagon Investment Partners XIV, Ltd., Class ER(a)(b)(c) | | 3M US L + 8.35% | | 07/15/2029 | | | 2,132,000 | | | | 2,103,902 | |
| Saranac CLO II, Ltd., Class ER(a)(b) | | 3M US L + 6.72% | | 11/20/2029 | | | 500,000 | | | | 489,175 | |
| Tralee CLO II, Ltd., Class FR(a)(b)(c) | | 3M US L + 8.85% | | 07/20/2029 | | | 1,000,000 | | | | 950,698 | |
| Tralee CLO II, Ltd., Class ER(a)(b)(c) | | 3M US L + 7.85% | | 07/20/2029 | | | 1,000,000 | | | | 1,023,299 | |
| Trinitas CLO III, Ltd., Class F(a)(b)(c) | | 3M US L + 6.50% | | 07/15/2027 | | | 550,000 | | | | 523,252 | |
| Venture XV CLO, Ltd., Class ER(a)(b)(c) | | 3M US L + 7.11% | | 07/15/2028 | | | 1,500,000 | | | | 1,511,865 | |
| Voya CLO 2014-2, Ltd., Class ER(a)(b) | | 3M US L + 7.70% | | 04/17/2030 | | | 1,000,000 | | | | 955,141 | |
| York CLO-2, Ltd., Class F(a)(b) | | 3M US L + 7.25% | | 01/22/2031 | | | 1,000,000 | | | | 939,041 | |
| | | | | | | | | | | | 19,112,182 | |
| COMMERCIAL MORTGAGE BACKED SECURITIES (0.07%) | | | | | | | | | |
| Hypo Real Estate Bank International AG, Class A2(a)(d)(e) | | 3M GBP L + 0.22% | | 03/20/2022 | | | 200,000 | | | | 73,658 | |
| | | | | | | | | | | | | |
| CORPORATE BONDS (14.27%) | | | | | | | | | | | | |
| Artesyn Embedded Technologies, Inc.(b)(c) | | 9.750% | | 10/15/2020 | | | 3,500,000 | | | | 3,430,000 | |
| Blueline Rental Corp.(b)(c) | | 9.250% | | 03/15/2024 | | | 2,000,000 | | | | 2,149,360 | |
| Jo-Ann Stores Holdings, Inc.(b)(c) | | 9.750% (or 10.500% PIK)% | | 10/15/2019 | | | 4,755,000 | | | | 4,766,887 | |
| Monitronics International, Inc. | | 9.125% | | 04/01/2020 | | | 2,650,000 | | | | 2,045,005 | |
| New Enterprise Stone & Lime Co., Inc.(b) | | 6.250% | | 03/15/2026 | | | 1,475,000 | | | | 1,480,531 | |
| New Enterprise Stone & Lime Co., Inc.(b) | | 10.125% | | 04/01/2022 | | | 500,000 | | | | 538,750 | |
See Notes to Financial Statements.
| Semi-Annual Report | March 31, 2018 | 5 |
| Resource Credit Income Fund | Portfolio of Investments |
March 31, 2018 (Unaudited)
| | Interest | | Maturity | | Principal | | Value |
| CORPORATE BONDS (continued) | | | | | | | | | | |
| | | | | | | | | | | |
| Pioneer Holdings LLC / Pioneer Finance Corp.(b)(c) | 9.000 | % | | 11/01/2022 | $ | 250,000 | | $ | 261,250 | |
| | | | | | | | | | 14,671,783 | |
| TOTAL BONDS & NOTES | | | | | | | | | | |
| (Cost $33,627,308) | | | | | | | | | 33,857,623 | |
| | | Shares | | Value |
| COMMON STOCKS (21.33%) | | | | | | | | |
| BUSINESS DEVELOPMENT COMPANIES (19.95%) | | | | | | | | |
| Ares Capital Corp.(c) | | | 346,793 | | | | 5,503,605 | |
| BlackRock Capital Investment Corp.(c) | | | 344,738 | | | | 2,078,770 | |
| Monroe Capital Corp. | | | 80,000 | | | | 984,000 | |
| OFS Capital Corp.(c) | | | 84,510 | | | | 948,202 | |
| PennantPark Floating Rate Capital Ltd.(c) | | | 164,748 | | | | 2,156,551 | |
| PennantPark Investment Corp.(c) | | | 256,764 | | | | 1,715,184 | |
| Solar Capital Ltd.(c) | | | 132,051 | | | | 2,681,956 | |
| Solar Senior Capital Ltd.(c) | | | 83,094 | | | | 1,395,979 | |
| WhiteHorse Finance, Inc.(c) | | | 246,213 | | | | 3,057,965 | |
| | | | | | | | | |
| INVESTMENT COMPANIES (1.38%) | | | | | | | | |
| Corporate Capital Trust, Inc. | | | 36,171 | | | | 611,290 | |
| TPG Specialty Lending, Inc. | | | 45,000 | | | | 803,700 | |
| | | | | | | | | |
| TOTAL COMMON STOCKS | | | | | | | | |
| (Cost $22,724,990) | | | | | | | 21,937,202 | |
| | | | | | | | | |
| REAL ESTATE INVESTMENT TRUSTS - COMMON STOCKS (1.34%) | | | | | | | | |
| TRADED REAL ESTATE INVESTMENT TRUSTS (1.34%) | | | 101,573 | | | | 1,376,314 | |
| Great Ajax Corp.(c) | | | | | | | | |
| | | | | | | | | |
| TOTAL REAL ESTATE INVESTMENT TRUSTS - | | | | | | | | |
| COMMON STOCKS | | | | | | | | |
| (Cost $1,381,952) | | | | | | | 1,376,314 | |
| | | | | | | | | |
| PRIVATE INVESTMENT FUNDS (16.65%) | | | | | | | | |
| BlackRock Global Credit Opportunities Fund, LP(d) | | | | | | | 254,053 | |
| CVC European Midmarket Solutions Fund(d) | | | | | | | 4,831,720 | |
| GoldenTree Credit Opportunities Fund(d) | | | | | | | 6,129,580 | |
| Tree Line Credit Strategies LP(d) | | | | | | | 5,910,714 | |
| | | | | | | | | |
| TOTAL PRIVATE INVESTMENT FUNDS | | | | | | | | |
| (Cost $17,061,309) | | | | | | | 17,126,067 | |
| | | | | | | | | |
| SHORT TERM INVESTMENTS (0.40%) | | | | | | | | |
| Dreyfus Treasury Cash Management, Institutional Class, 1.48%(f) | | | 413,707 | | | | 413,707 | |
| | | | | | | | | |
| TOTAL SHORT TERM INVESTMENTS | | | | | | | | |
| (Cost $413,707) | | | | | | | 413,707 | |
See Notes to Financial Statements.
| 6 | www.resourcecreditincome.com |
| Resource Credit Income Fund | Portfolio of Investments |
| | March 31, 2018 (Unaudited) |
| TOTAL INVESTMENTS (96.44%) | | Value | |
| (Cost $99,361,569) | | $ | 99,164,577 | |
| | | | | |
| Other Assets In Excess Of Liabilities (3.56%) | | | 3,664,778 | |
| | | | | |
| NET ASSETS (100.00%) | | $ | 102,829,355 | |
Investment Abbreviations:
LIBOR - London Interbank Offered Rate
Libor Rates:
1M US L - 1 Month LIBOR as of March 31, 2018 was 1.88%
3M US L - 3 Month LIBOR as of March 31, 2018 was 2.31%
3M GBP L - 3 Month POUND LIBOR as of March 31, 2018 was 0.71%
| (a) | Variable rate investment. Interest rates reset periodically. Interest rate shown reflects the rate in effect at March 31, 2018. For securities based on a published reference rate and spread, the reference rate and spread are indicated in the description above. Certain variable rate securities are not based on a published reference rate and spread but are determined by the issuer or agent and are based on current market conditions. These securities do not indicate a reference rate and spread in their description above. |
| (b) | Securities exempt from registration under Rule 144A of the Securities Act of 1933. These securities may be sold in the ordinary course of business in transactions exempt from registration, normally to qualified institutional buyers. As of March 31, 2018, the aggregate market value of those securities was $31,738,960, representing 30.87% of net assets. |
| (c) | All or a portion of each of these securities may be segregated as collateral for the Fund's line of credit. The aggregate market value of those securities was $27,153,677. |
| (d) | Illiquid security. See below. |
| (e) | Fair value estimated using fair valuation procedures adopted by the Board of Trustees. Total value of such securities is $73,658, representing 0.07% of net assets. |
| (f) | Money market fund; interest rate reflects seven-day effective yield on March 31, 2018. |
Securities determined to be illiquid under the procedures approved by the Fund's Board of Trustees is as follows:
| Date(s) of Purchase | | | Security | | Cost | | | Value | | | % of Net Assets | |
| | 3/31/2018 | | | BlackRock Global Credit Opportunities Fund, LP | | $ | 254,009 | | | $ | 254,053 | | | | 0.25 | % |
| | 09/30/2017- 12/31/2018 | | | CVC European Midmarket Solutions Fund | | | 4,807,300 | | | | 4,831,720 | | | | 4.70 | % |
| | 10/30/2015- 03/31/2018 | | | GoldenTree Credit Opportunities Fund | | | 6,000,000 | | | | 6,129,580 | | | | 5.95 | % |
| | 10/30/2015 | | | Hypo Real Estate Bank International AG, Class A2 | | | 139,587 | | | | 73,658 | | | | 0.07 | % |
| | 12/31/2017- 03/31/2018 | | | Tree Line Credit Strategies LP | | | 6,000,000 | | | | 5,910,714 | | | | 5.75 | % |
| | | | | Total | | $ | 17,200,896 | | | $ | 17,199,725 | | | | 16.72 | % |
Additional information on investments in private investment trusts:
| Value | | | Security | | Redemption Frequency | | | Redemption
Notice (Days) | | | Unfunded Commitments as of March 31, 2018 | |
| $ | 254,053 | | | BlackRock Global Credit Opportunities Fund, LP | | | N/A | | | | N/A | | | $ | 14,745,991 | |
| | 4,831,720 | | | CVC European Midmarket Solutions Fund | | | N/A | | | | N/A | | | | 5,221,342 | |
| | 6,129,580 | | | GoldenTree Credit Opportunities Fund(a) | | | Semi-Annual | | | | 90 | | | | – | |
| | 5,910,714 | | | Tree Line Credit Strategies LP | | | Quarterly | | | | 90 | | | | – | |
| (a) | Redemptions are subject to a two-year holding period, and may be limited to 10% per redemption date, or 20% during any 12 month period, past which redemptions would be processed on a pro rata basis. |
| See Notes to Financial Statements. | |
| Semi-Annual Report | March 31, 2018 | 7 |
| Resource Credit Income Fund | Statement of Assets and Liabilities |
March 31, 2018 (Unaudited)
| ASSETS | | | |
| Investments, at value (Cost $99,361,569) | | $ | 99,164,577 | |
| Cash | | | 99,726 | |
| Dividends and interest receivable | | | 1,724,597 | |
| Receivable for securities sold | | | 972,433 | |
| Receivable for Fund shares sold | | | 812,451 | |
| Capital contributed in advance | | | 5,000,000 | |
| Prepaid expenses and other assets | | | 68,220 | |
| Total assets | | | 107,842,004 | |
| | | | | |
| LIABILITIES | | | | |
| Payable for investments purchased | | | 4,815,216 | |
| Payable due to adviser | | | 124,290 | |
| Administration fees payable | | | 19,152 | |
| Custody fees payable | | | 798 | |
| Payable for compliance services fees | | | 7,304 | |
| Distribution fees payable | | | 10,270 | |
| Shareholder servicing fees payable | | | 28,889 | |
| Payable for transfer agency fees | | | 1,308 | |
| Accrued expenses and other liabilities | | | 5,422 | |
| Total liabilities | | | 5,012,649 | |
| NET ASSETS | | $ | 102,829,355 | |
| | | | | |
| NET ASSETS CONSISTS OF | | | | |
| Paid-in capital | | $ | 102,889,245 | |
| Accumulated net investment loss | | | (57,628 | ) |
| Accumulated net realized gain | | | 194,730 | |
| Net unrealized depreciation | | | (196,992 | ) |
| NET ASSETS | | $ | 102,829,355 | |
| Commitments (Note 8) | | | | |
| PRICING OF SHARES | | | | |
| Class A | | | | |
| Net Assets | | $ | 20,913,982 | |
| Shares of beneficial interest outstanding (unlimited number of shares, no par value common stock authorized) | | | 1,900,243 | |
| Net Asset Value and redemption price per share(a) | | $ | 11.01 | |
| Maximum Offering Price Per Share (Maximum Sales Charge of 5.75%) | | $ | 11.68 | |
| Class C | | | | |
| Net Assets | | $ | 14,850,683 | |
| Shares of beneficial interest outstanding (unlimited number of shares, no par value common stock authorized) | | | 1,334,351 | |
| Net Asset Value, offering and redemption price per share(a) | | $ | 11.13 | |
| Class W | | | | |
| Net Assets | | $ | 48,177,658 | |
| Shares of beneficial interest outstanding (unlimited number of shares, no par value common stock authorized) | | | 4,379,033 | |
| Net Asset Value, offering and redemption price per share | | $ | 11.00 | |
| Class I | | | | |
| Net Assets | | $ | 13,505,412 | |
| Shares of beneficial interest outstanding (unlimited number of shares, no par value common stock authorized) | | | 1,224,382 | |
| Net Asset Value, offering and redemption price per share | | $ | 11.03 | |
| Class L | | | | |
| Net Assets | | $ | 5,381,620 | |
| Shares of beneficial interest outstanding (unlimited number of shares, no par value common stock authorized) | | | 489,265 | |
| Net Asset Value and redemption price per share | | $ | 11.00 | |
| Maximum Offering Price Per Share (Maximum Sales Charge of 4.25%) | | $ | 11.49 | |
| (a) | Redemption price varies based on length of time held (Note 1). |
| See Notes to Financial Statements. | |
| 8 | www.resourcecreditincome.com |
| Resource Credit Income Fund | Statement of Operations |
| | | | |
| | For the Six Months Ended March 31, 2018 (Unaudited) |
| INVESTMENT INCOME | | | | |
| Dividends | | $ | 1,305,067 | |
| Interest | | | 2,423,975 | |
| Total investment income | | | 3,729,042 | |
| | | | | |
| EXPENSES | | | | |
| Investment advisory fees (Note 3) | | | 713,086 | |
| Administrative fees (Note 3) | | | 90,269 | |
| Distribution fees (Note 3): | | | | |
| Class C | | | 43,004 | |
| Class L | | | 5,136 | |
| Shareholder servicing fees (Note 3): | | | | |
| Class A | | | 16,002 | |
| Class C | | | 14,335 | |
| Class W | | | 44,809 | |
| Class L | | | 5,136 | |
| Interest expense | | | 350 | |
| Transfer agent fees (Note 3) | | | 59,318 | |
| Audit fees | | | 9,995 | |
| Legal fees | | | 29,532 | |
| Printing expense | | | 33,748 | |
| Registration fees | | | 43,083 | |
| Custody fees | | | 7,647 | |
| Trustee fees and expenses (Note 3) | | | 22,196 | |
| Compliance services fees (Note 3) | | | 7,304 | |
| Networking Fees: | | | | |
| Class A | | | 1,104 | |
| Class C | | | 1,151 | |
| Class W | | | 2,164 | |
| Class I | | | 654 | |
| Class L | | | 12 | |
| Other expenses | | | 14,773 | |
| Total expenses | | | 1,164,808 | |
| Less fees waived/expenses reimbursed by investment adviser (Note 3) | | | (123,797 | ) |
| Total net expenses | | | 1,041,011 | |
| NET INVESTMENT INCOME | | | 2,688,031 | |
| Net realized gain on investments | | | 90,057 | |
| Net change in unrealized depreciation on investments | | | (1,219,739 | ) |
| NET REALIZED AND UNREALIZED LOSS ON INVESTMENTS | | | (1,129,682 | ) |
| NET INCREASE IN NET ASSETS RESULTING FROM OPERATIONS | | $ | 1,558,349 | |
| See Notes to Financial Statements. | |
| Semi-Annual Report | March 31, 2018 | 9 |
| Resource Credit Income Fund | Statements of Changes in Net Assets |
| | | For the Six
Months Ended
March 31, 2018 (Unaudited) | | | For the
Year Ended
September 30, 2017 | |
| OPERATIONS | | | | | | |
| Net investment income | | $ | 2,688,031 | | | $ | 1,218,166 | |
| Net realized gain | | | 90,057 | | | | 422,275 | |
| Net change in unrealized appreciation | | | (1,219,739 | ) | | | 927,548 | |
| Net increase in net assets resulting from operations | | | 1,558,349 | | | | 2,567,989 | |
| | | | | | | | | |
| DISTRIBUTIONS TO SHAREHOLDERS | | | | | | | | |
| From investment income: | | | | | | | | |
| Class A | | | (607,883 | ) | | | (411,703 | ) |
| Class C | | | (353,352 | ) | | | (164,532 | ) |
| Class W | | | (1,314,721 | ) | | | (496,562 | ) |
| Class I | | | (325,665 | ) | | | (40,189 | ) |
| Class U(a) | | | – | | | | (86 | ) |
| Class T(a) | | | – | | | | (76 | ) |
| Class D(a) | | | – | | | | (80 | ) |
| Class L(b) | | | (144,836 | ) | | | (16,778 | ) |
| From realized gains on investments: | | | | | | | | |
| Class A | | | – | | | | (167,150 | ) |
| Class C | | | – | | | | (66,800 | ) |
| Class W | | | – | | | | (201,602 | ) |
| Class I | | | – | | | | (16,317 | ) |
| Class U(a) | | | – | | | | (35 | ) |
| Class T(a) | | | – | | | | (31 | ) |
| Class D(a) | | | – | | | | (32 | ) |
| Class L(b) | | | – | | | | (6,812 | ) |
| From return of capital: | | | | | | | | |
| Class A | | | – | | | | (102,433 | ) |
| Class C | | | – | | | | (40,936 | ) |
| Class W | | | – | | | | (123,546 | ) |
| Class I | | | – | | | | (9,999 | ) |
| Class U(a) | | | – | | | | (22 | ) |
| Class T(a) | | | – | | | | (19 | ) |
| Class D(a) | | | – | | | | (20 | ) |
| Class L(b) | | | – | | | | (4,175 | ) |
| Net decrease in net assets from distributions | | | (2,746,457 | ) | | | (1,869,935 | ) |
| | | | | | | | | |
| CAPITAL SHARE TRANSACTIONS | | | | | | | | |
| Class A | | | | | | | | |
| Proceeds from sales of shares | | | 5,332,670 | | | | 11,200,870 | |
| Distributions reinvested | | | 327,281 | | | | 402,321 | |
| Cost of shares redeemed | | | (568,382 | ) | | | (68,781 | ) |
| Net increase from capital shares transactions | | | 5,091,569 | | | | 11,534,410 | |
| | | | | | | | | |
| Class C | | | | | | | | |
| Proceeds from sales of shares | | | 5,994,314 | | | | 8,328,902 | |
| Distributions reinvested | | | 240,847 | | | | 166,087 | |
| Cost of shares redeemed | | | (192,353 | ) | | | (63,743 | ) |
| Net increase from capital shares transactions | | | 6,042,808 | | | | 8,431,246 | |
| | | | | | | | | |
| Class W | | | | | | | | |
| Proceeds from sales of shares | | | 21,843,034 | | | | 26,610,726 | |
| Distributions reinvested | | | 608,682 | | | | 303,286 | |
| Cost of shares redeemed | | | (453,379 | ) | | | (765,910 | ) |
| Net increase from capital shares transactions | | | 21,998,337 | | | | 26,148,102 | |
| See Notes to Financial Statements. | |
| 10 | www.resourcecreditincome.com |
| Resource Credit Income Fund | Statements of Changes in Net Assets |
| | | For the Six
Months Ended
March 31, 2018 (Unaudited) | | | For the
Year Ended
September 30, 2017 | |
| Class I | | | | | | | | |
| Proceeds from sales of shares | | $ | 10,592,268 | | | $ | 2,710,332 | |
| Distributions reinvested | | | 193,074 | | | | 41,972 | |
| Cost of shares redeemed | | | (101,596 | ) | | | – | |
| Net increase from capital shares transactions | | | 10,683,746 | | | | 2,752,304 | |
| | | | | | | | | |
| Class U(a) | | | | | | | | |
| Distributions reinvested | | | – | | | | 143 | |
| Cost of shares redeemed | | | – | | | | (3,017 | ) |
| Net decrease from capital shares transactions | | | – | | | | (2,874 | ) |
| | | | | | | | | |
| Class T(a) | | | | | | | | |
| Distributions reinvested | | | – | | | | 126 | |
| Cost of shares redeemed | | | – | | | | (2,980 | ) |
| Net decrease from capital shares transactions | | | – | | | | (2,854 | ) |
| | | | | | | | | |
| Class D(a) | | | | | | | | |
| Distributions reinvested | | | – | | | | 132 | |
| Cost of shares redeemed | | | – | | | | (2,992 | ) |
| Net decrease from capital shares transactions | | | – | | | | (2,860 | ) |
| | | | | | | | | |
| Class L(b) | | | | | | | | |
| Proceeds from sales of shares | | | 2,936,002 | | | | 2,441,155 | |
| Distributions reinvested | | | 71,935 | | | | 9,026 | |
| Cost of shares redeemed | | | (5,062 | ) | | | – | |
| Net increase from capital shares transactions | | | 3,002,875 | | | | 2,450,181 | |
| | | | | | | | | |
| Net increase in net assets | | | 45,631,227 | | | | 52,005,709 | |
| | | | | | | | | |
| NET ASSETS | | | | | | | | |
| Beginning of period | | | 57,198,128 | | | | 5,192,419 | |
| End of period* | | $ | 102,829,355 | | | $ | 57,198,128 | |
| | | | | | | | | |
| *Including accumulated net investment income/(loss) of: | | $ | (57,628 | ) | | $ | 798 | |
| See Notes to Financial Statements. | |
| Semi-Annual Report | March 31, 2018 | 11 |
| Resource Credit Income Fund | Statements of Changes in Net Assets |
| | | For the Six
Months Ended
March 31, 2018 (Unaudited) | | | For the
Year Ended
September 30, 2017 | |
| OTHER INFORMATION | | | | | | | | |
| Capital Shares Transactions | | | | | | | | |
| Class A | | | | | | | | |
| Issued | | | 479,506 | | | | 1,017,674 | |
| Distributions reinvested | | | 29,635 | | | | 36,600 | |
| Redeemed | | | (51,245 | ) | | | (6,155 | ) |
| Net increase in capital shares | | | 457,896 | | | | 1,048,119 | |
| | | | | | | | | |
| Class C | | | | | | | | |
| Issued | | | 533,060 | | | | 746,104 | |
| Distributions reinvested | | | 21,570 | | | | 14,896 | |
| Redeemed | | | (17,143 | ) | | | (6,057 | ) |
| Net increase in capital shares | | | 537,487 | | | | 754,943 | |
| | | | | | | | | |
| Class W | | | | | | | | |
| Issued | | | 1,959,087 | | | | 2,399,426 | |
| Distributions reinvested | | | 55,155 | | | | 27,427 | |
| Redeemed | | | (40,818 | ) | | | (69,494 | ) |
| Net increase in capital shares | | | 1,973,424 | | | | 2,357,359 | |
| | | | | | | | | |
| Class I | | | | | | | | |
| Issued | | | 948,519 | | | | 243,024 | |
| Distributions reinvested | | | 17,465 | | | | 3,801 | |
| Redeemed | | | (9,132 | ) | | | – | |
| Net increase in capital shares | | | 956,852 | | | | 246,825 | |
| | | | | | | | | |
| Class U(a) | | | | | | | | |
| Distributions reinvested | | | – | | | | 13 | |
| Redeemed | | | – | | | | (272 | ) |
| Net decrease in capital shares | | | – | | | | (259 | ) |
| | | | | | | | | |
| Class T(a) | | | | | | | | |
| Distributions reinvested | | | – | | | | 12 | |
| Redeemed | | | – | | | | (270 | ) |
| Net decrease in capital shares | | | – | | | | (258 | ) |
| | | | | | | | | |
| Class D(a) | | | | | | | | |
| Distributions reinvested | | | – | | | | 12 | |
| Redeemed | | | – | | | | (270 | ) |
| Net decrease in capital shares | | | – | | | | (258 | ) |
| | | | | | | | | |
| Class L(b) | | | | | | | | |
| Issued | | | 263,347 | | | | 219,042 | |
| Distributions reinvested | | | 6,516 | | | | 817 | |
| Redeemed | | | (457 | ) | | | – | |
| Net increase in capital shares | | | 269,406 | | | | 219,859 | |
| (a) | Effective as of July 7, 2017, the Fund has suspended the offering of its Class U, Class T, and Class D shares. |
| (b) | The Fund's Class L commenced operations on July 28, 2017. |
| See Notes to Financial Statements. | |
| 12 | www.resourcecreditincome.com |
| Resource Credit Income Fund – Class A | Financial Highlights |
For a Share Outstanding Throughout the Periods Presented
| | | For the Six
Months Ended
March 31, 2018 (Unaudited) | | | Year Ended
September 30, 2017 | | | Year Ended
September 30, 2016 | | | For the
Period Ended
September 30, 2015(a) | |
| NET ASSET VALUE, BEGINNING OF PERIOD | | $ | 11.13 | | | $ | 10.26 | | | $ | 10.00 | | | $ | 10.00 | |
| | | | | | | | | | | | | | | | | |
| INCOME FROM INVESTMENT OPERATIONS | | | | | | | | | | | | | | | | |
| Net investment income(b) | | | 0.38 | | | | 0.57 | | | | 0.43 | | | | – | |
| Net realized and unrealized gain/(loss) on investments | | | (0.15 | ) | | | 1.02 | | | | 0.18 | | | | – | |
| Total income from investment operations | | | 0.23 | | | | 1.59 | | | | 0.61 | | | | – | |
| | | | | | | | | | | | | | | | | |
| DISTRIBUTIONS TO SHAREHOLDERS | | | | | | | | | | | | | | | | |
| From net investment income | | | (0.34 | ) | | | (0.47 | ) | | | (0.27 | ) | | | – | |
| From net realized gain on investments | | | (0.01 | ) | | | (0.16 | ) | | | – | | | | – | |
| From return of capital | | | – | | | | (0.09 | ) | | | (0.08 | ) | | | – | |
| Total distributions | | | (0.35 | ) | | | (0.72 | ) | | | (0.35 | ) | | | – | |
| INCREASE/DECREASE IN NET ASSET VALUE | | | (0.12 | ) | | | 0.87 | | | | 0.26 | | | | – | |
| NET ASSET VALUE, END OF PERIOD | | $ | 11.01 | | | $ | 11.13 | | | $ | 10.26 | | | $ | 10.00 | |
| | | | | | | | | | | | | | | | | |
| TOTAL RETURN(c) | | | 2.08 | % | | | 15.79 | % | | | 6.22 | % | | | – | % |
| | | | | | | | | | | | | | | | | |
| RATIOS AND SUPPLEMENTAL DATA | | | | | | | | | | | | | | | | |
| Net assets, end of period (in 000s) | | $ | 20,914 | | | $ | 16,049 | | | $ | 4,043 | | | $ | 3 | |
| | | | | | | | | | | | | | | | | |
| RATIOS TO AVERAGE NET ASSETS | | | | | | | | | | | | | | | | |
| Including interest expense:(d) | | | | | | | | | | | | | | | | |
| Expenses, gross | | | 2.85 | %(e) | | | 4.90 | % | | | 31.46 | % | | | 472.13 | %(e) |
| Expenses, net of fees waived/expenses reimbursed by investment adviser | | | 2.59 | %(e) | | | 2.59 | % | | | 2.59 | % | | | 0.02 | %(e) |
| Excluding interest expense:(d) | | | | | | | | | | | | | | | | |
| Expenses, gross | | | 2.85 | %(e) | | | 4.90 | % | | | 34.54 | % | | | N/A | |
| Expenses, net of fees waived/expenses reimbursed by investment adviser | | | 2.59 | %(e) | | | 2.59 | % | | | 2.59 | % | | | N/A | |
| Net investment income | | | 6.91 | %(e) | | | 5.20 | % | | | 4.43 | % | | | 0.00 | %(e) |
| | | | | | | | | | | | | | | | | |
| PORTFOLIO TURNOVER RATE | | | 36 | %(f) | | | 39 | % | | | 22 | % | | | 0 | %(f) |
| | | | | | | | | | | | | | | | | |
| BORROWINGS AT END OF PERIOD | | | | | | | | | | | | | | | | |
| Aggregate amount outstanding (000s) | | $ | – | | | $ | – | | | $ | 5 | | | $ | – | |
| Asset coverage per $1,000 (000s) | | $ | – | | | $ | – | | | $ | 1,032,060 | | | $ | – | |
| (a) | The Fund's Class A commenced operations on April 20, 2015. |
| (b) | Per share numbers have been calculated using the average shares method. |
| (c) | Total returns shown are historical in nature and assume changes in share price, reinvestment of dividends and capital gains distribution, if any. Had the adviser not absorbed a portion of Fund expenses, total returns would have been lower. Total returns for periods less than one year are not annualized. Returns shown exclude applicable sales charges. |
| (d) | Ratios do not include expenses of underlying investment companies in which the Fund invests. |
| (e) | Annualized. |
| (f) | Not annualized. |
See Notes to Financial Statements.
| Semi-Annual Report | March 31, 2018 | 13 |
| Resource Credit Income Fund – Class C | Financial Highlights |
For a Share Outstanding Throughout the Periods Presented
| | | For the Six
Months Ended
March 31, 2018 (Unaudited) | | | Year Ended
September 30, 2017 | | | Year Ended
September 30, 2016 | | | For the
Period Ended
September 30, 2015(a) | |
| NET ASSET VALUE, BEGINNING OF PERIOD | | $ | 11.25 | | | $ | 10.36 | | | $ | 10.00 | | | $ | 10.00 | |
| | | | | | | | | | | | | | | | | |
| INCOME FROM INVESTMENT OPERATIONS | | | | | | | | | | | | | | | | |
| Net investment income(b) | | | 0.35 | | | | 0.50 | | | | 0.59 | | | | – | |
| Net realized and unrealized gain/(loss) on investments | | | (0.16 | ) | | | 1.03 | | | | 0.08 | | | | – | |
| Total income from investment operations | | | 0.19 | | | | 1.53 | | | | 0.67 | | | | – | |
| | | | | | | | | | | | | | | | | |
| DISTRIBUTIONS TO SHAREHOLDERS | | | | | | | | | | | | | | | | |
| From net investment income | | | (0.30 | ) | | | (0.40 | ) | | | (0.24 | ) | | | – | |
| From net realized gain on investments | | | (0.01 | ) | | | (0.16 | ) | | | – | | | | – | |
| From return of capital | | | – | | | | (0.08 | ) | | | (0.07 | ) | | | – | |
| Total distributions | | | (0.31 | ) | | | (0.64 | ) | | | (0.31 | ) | | | – | |
| INCREASE/DECREASE IN NET ASSET VALUE | | | (0.12 | ) | | | 0.89 | | | | 0.36 | | | | – | |
| NET ASSET VALUE, END OF PERIOD | | $ | 11.13 | | | $ | 11.25 | | | $ | 10.36 | | | $ | 10.00 | |
| | | | | | | | | | | | | | | | | |
| TOTAL RETURN(c) | | | 1.71 | % | | | 15.03 | % | | | 6.85 | % | | | –% | |
| | | | | | | | | | | | | | | | | |
| RATIOS AND SUPPLEMENTAL DATA | | | | | | | | | | | | | | | | |
| Net assets, end of period (in 000s) | | $ | 14,851 | | | $ | 8,965 | | | $ | 434 | | | $ | 3 | |
| | | | | | | | | | | | | | | | | |
| RATIOS TO AVERAGE NET ASSETS | | | | | | | | | | | | | | | | |
| Including interest expense:(d) | | | | | | | | | | | | | | | | |
| Expenses, gross | | | 3.68 | %(e) | | | 5.28 | % | | | 18.42 | % | | | 473.06 | %(e) |
| Expenses, net of fees waived/expenses reimbursed by investment adviser | | | 3.34 | %(e) | | | 3.34 | % | | | 3.34 | % | | | 0.02 | %(e) |
| Excluding interest expense:(d) | | | | | | | | | | | | | | | | |
| Expenses, gross | | | 3.68 | %(e) | | | 5.28 | % | | | 18.42 | % | | | N/A | |
| Expenses, net of fees waived/expenses reimbursed by investment adviser | | | 3.34 | %(e) | | | 3.34 | % | | | 3.34 | % | | | N/A | |
| Net investment income | | | 6.28 | %(e) | | | 4.46 | % | | | 5.85 | % | | | 0.00 | %(e) |
| | | | | | | | | | | | | | | | | |
| PORTFOLIO TURNOVER RATE | | | 36 | %(f) | | | 39 | % | | | 22 | % | | | 0 | %(f) |
| | | | | | | | | | | | | | | | | |
| BORROWINGS AT END OF PERIOD | | | | | | | | | | | | | | | | |
| Aggregate amount outstanding (000s) | | $ | – | | | $ | – | | | $ | 5 | | | $ | – | |
| Asset coverage per $1,000 (000s) | | $ | – | | | $ | – | | | $ | 1,032,060 | | | $ | – | |
| (a) | The Fund's Class C commenced operations on April 20, 2015. |
| (b) | Per share numbers have been calculated using the average shares method. |
| (c) | Total returns shown are historical in nature and assume changes in share price, reinvestment of dividends and capital gains distribution, if any. Had the adviser not absorbed a portion of Fund expenses, total returns would have been lower. Total returns for periods less than one year are not annualized. |
| (d) | Ratios do not include expenses of underlying investment companies in which the Fund invests. |
| (e) | Annualized. |
| (f) | Not annualized. |
See Notes to Financial Statements.
| 14 | www.resourcecreditincome.com |
| Resource Credit Income Fund – Class W | Financial Highlights |
For a Share Outstanding Throughout the Periods Presented
| | | For the Six
Months Ended
March 31, 2018 (Unaudited) | | | Year Ended
September 30, 2017 | | | Year Ended
September 30, 2016 | | | For the
Period Ended
September 30, 2015(a) | |
| NET ASSET VALUE, BEGINNING OF PERIOD | | $ | 11.12 | | | $ | 10.24 | | | $ | 10.00 | | | $ | 10.00 | |
| | | | | | | | | | | | | | | | | |
| INCOME FROM INVESTMENT OPERATIONS | | | | | | | | | | | | | | | | |
| Net investment income(b) | | | 0.39 | | | | 0.58 | | | | 0.63 | | | | – | |
| Net realized and unrealized gain/(loss) on investments | | | (0.16 | ) | | | 1.01 | | | | (0.07 | )(c) | | | – | |
| Total income from investment operations | | | 0.23 | | | | 1.59 | | | | 0.56 | | | | – | |
| | | | | | | | | | | | | | | | | |
| DISTRIBUTIONS TO SHAREHOLDERS | | | | | | | | | | | | | | | | |
| From net investment income | | | (0.34 | ) | | | (0.46 | ) | | | (0.25 | ) | | | – | |
| From net realized gain on investments | | | (0.01 | ) | | | (0.16 | ) | | | – | | | | – | |
| From return of capital | | | – | | | | (0.09 | ) | | | (0.07 | ) | | | – | |
| Total distributions | | | (0.35 | ) | | | (0.71 | ) | | | (0.32 | ) | | | – | |
| INCREASE/DECREASE IN NET ASSET VALUE | | | (0.12 | ) | | | 0.88 | | | | 0.24 | | | | – | |
| NET ASSET VALUE, END OF PERIOD | | $ | 11.00 | | | $ | 11.12 | | | $ | 10.24 | | | $ | 10.00 | |
| | | | | | | | | | | | | | | | | |
| TOTAL RETURN(d) | | | 2.08 | % | | | 15.77 | % | | | 5.74 | % | | | –% | |
| | | | | | | | | | | | | | | | | |
| RATIOS AND SUPPLEMENTAL DATA | | | | | | | | | | | | | | | | |
| Net assets, end of period (in 000s) | | $ | 48,178 | | | $ | 26,757 | | | $ | 494 | | | $ | 3 | |
| | | | | | | | | | | | | | | | | |
| RATIOS TO AVERAGE NET ASSETS | | | | | | | | | | | | | | | | |
| Including interest expense:(e) | | | | | | | | | | | | | | | | |
| Expenses, gross | | | 2.93 | %(f) | | | 4.35 | % | | | 17.52 | % | | | 472.69 | %(f) |
| Expenses, net of fees waived/expenses reimbursed by investment adviser | | | 2.59 | %(f) | | | 2.61 | %(g) | | | 3.09 | % | | | 0.04 | %(f) |
| Excluding interest expense:(e) | | | | | | | | | | | | | | | | |
| Expenses, gross | | | 2.93 | %(f) | | | 4.35 | % | | | 17.52 | % | | | N/A | |
| Expenses, net of fees waived/expenses reimbursed by investment adviser | | | 2.59 | %(f) | | | 2.61 | %(g) | | | 3.09 | % | | | N/A | |
| Net investment income | | | 7.05 | %(f) | | | 5.22 | %(g) | | | 6.24 | % | | | 0.00 | %(f) |
| PORTFOLIO TURNOVER RATE | | | 36 | %(h) | | | 39 | % | | | 22 | % | | | 0 | %(h) |
| BORROWINGS AT END OF PERIOD | | | | | | | | | | | | | | | | |
| Aggregate amount outstanding (000s) | | $ | – | | | $ | – | | | $ | 5 | | | $ | – | |
| Asset coverage per $1,000 (000s) | | $ | – | | | $ | – | | | $ | 1,032,060 | | | $ | – | |
| (a) | The Fund's Class W commenced operations on April 20, 2015. |
| (b) | Per share numbers have been calculated using the average shares method. |
| (c) | Realized and unrealized losses per share do not correlate to the aggregate of the net realized and unrealized gains on the Statement of Operations for the period ended September 30, 2016, primarily due to the timing of sales and repurchases of the Fund's shares in relation to fluctuating market values for the Fund's portfolio. |
| (d) | Total returns shown are historical in nature and assume changes in share price, reinvestment of dividends and capital gains distribution, if any. Had the adviser not absorbed a portion of Fund expenses, total returns would have been lower. Total returns for periods less than one year are not annualized. |
| (e) | Ratios do not include expenses of underlying investment companies in which the Fund invests. |
| (f) | Annualized. |
| (g) | Effective January 5, 2017, the annual expense limitation changed from 2.49% to 1.99%. |
| (h) | Not annualized. |
| See Notes to Financial Statements. | |
| Semi-Annual Report | March 31, 2018 | 15 |
| Resource Credit Income Fund – Class I | Financial Highlights |
For a Share Outstanding Throughout the Periods Presented
| | | For the Six
Months Ended
March 31, 2018 (Unaudited) | | |
Year Ended September 30, 2017 | | | Year Ended
September 30, 2016 | | | For the
Period Ended
September 30, 2015(a) | |
| NET ASSET VALUE, BEGINNING OF PERIOD | | $ | 11.15 | | | $ | 10.28 | | | $ | 10.00 | | | $ | 10.00 | |
| | | | | | | | | | | | | | | | | |
| INCOME FROM INVESTMENT OPERATIONS | | | | | | | | | | | | | | | | |
| Net investment income(b) | | | 0.43 | | | | 0.63 | | | | 0.35 | | | | – | |
| Net realized and unrealized gain/(loss) on investments | | | (0.19 | ) | | | 0.99 | | | | 0.28 | | | | – | |
| Total income from investment operations | | | 0.24 | | | | 1.62 | | | | 0.63 | | | | – | |
| | | | | | | | | | | | | | | | | |
| DISTRIBUTIONS TO SHAREHOLDERS | | | | | | | | | | | | | | | | |
| From net investment income | | | (0.35 | ) | | | (0.50 | ) | | | (0.27 | ) | | | – | |
| From net realized gain on investments | | | (0.01 | ) | | | (0.16 | ) | | | – | | | | – | |
| From return of capital | | | – | | | | (0.09 | ) | | | (0.08 | ) | | | – | |
| Total distributions | | | (0.36 | ) | | | (0.75 | ) | | | (0.35 | ) | | | – | |
| INCREASE/DECREASE IN NET ASSET VALUE | | | (0.12 | ) | | | 0.87 | | | | 0.28 | | | | – | |
| NET ASSET VALUE, END OF PERIOD | | $ | 11.03 | | | $ | 11.15 | | | $ | 10.28 | | | $ | 10.00 | |
| | | | | | | | | | | | | | | | | |
| TOTAL RETURN(c) | | | 2.21 | % | | | 16.07 | % | | | 6.42 | % | | | –% | |
| | | | | | | | | | | | | | | | | |
| RATIOS AND SUPPLEMENTAL DATA | | | | | | | | | | | | | | | | |
| Net assets, end of period (in 000s) | | $ | 13,505 | | | $ | 2,982 | | | $ | 213 | | | $ | 200 | |
| | | | | | | | | | | | | | | | | |
| RATIOS TO AVERAGE NET ASSETS | | | | | | | | | | | | | | | | |
| Including interest expense:(d) | | | | | | | | | | | | | | | | |
| Expenses, gross | | | 2.68 | %(e) | | | 4.45 | % | | | 72.33 | % | | | 430.52 | %(e) |
| Expenses, net of fees waived/expenses reimbursed by investment adviser | | | 2.34 | %(e) | | | 2.34 | % | | | 2.34 | % | | | 0.03 | %(e) |
| Excluding interest expense:(d) | | | | | | | | | | | | | | | | |
| Expenses, gross | | | 2.68 | %(e) | | | 4.45 | % | | | 72.33 | % | | | N/A | |
| Expenses, net of fees waived/expenses reimbursed by investment adviser | | | 2.34 | %(e) | | | 2.34 | % | | | 2.34 | % | | | N/A | |
| Net investment income | | | 7.67 | %(e) | | | 5.71 | % | | | 3.53 | % | | | 0.00 | %(e) |
| PORTFOLIO TURNOVER RATE | | | 36 | %(f) | | | 39 | % | | | 22 | % | | | 0 | %(f) |
| | | | | | | | | | | | | | | | | |
| BORROWINGS AT END OF PERIOD | | | | | | | | | | | | | | | | |
| Aggregate amount outstanding (000s) | | $ | – | | | $ | – | | | $ | 5 | | | $ | – | |
| Asset coverage per $1,000 (000s) | | $ | – | | | $ | – | | | $ | 1,032,060 | | | $ | – | |
| (a) | The Fund's Class I commenced operations on April 20, 2015. |
| (b) | Per share numbers have been calculated using the average shares method. |
| (c) | Total returns shown are historical in nature and assume changes in share price, reinvestment of dividends and capital gains distribution, if any. Had the adviser not absorbed a portion of Fund expenses, total returns would have been lower. Total returns for periods less than one year are not annualized. |
| (d) | Ratios do not include expenses of underlying investment companies in which the Fund invests. |
| (e) | Annualized. |
| (f) | Not annualized. |
See Notes to Financial Statements.
| 16 | www.resourcecreditincome.com |
| Resource Credit Income Fund – Class L | Financial Highlights |
For a Share Outstanding Throughout the Periods Presented
| | | For the Six
Months Ended
March 31, 2018 (Unaudited) | | | For the
Period Ended
September 30, 2017(a) | |
| NET ASSET VALUE, BEGINNING OF PERIOD | | $ | 11.12 | | | $ | 11.19 | |
| | | | | | | | | |
| INCOME/(LOSS) FROM INVESTMENT OPERATIONS | | | | | | | | |
| Net investment income(b) | | | 0.38 | | | | 0.13 | |
| Net realized and unrealized loss on investments | | | (0.17 | ) | | | (0.03 | )(c) |
| Total income from investment operations | | | 0.21 | | | | 0.10 | |
| | | | | | | | | |
| DISTRIBUTIONS TO SHAREHOLDERS | | | | | | | | |
| From net investment income | | | (0.32 | ) | | | (0.10 | ) |
| From net realized gain on investments | | | (0.01 | ) | | | (0.04 | ) |
| From return of capital | | | 0.00 | | | | (0.03 | ) |
| Total distributions | | | (0.33 | ) | | | (0.17 | ) |
| INCREASE/(DECREASE) IN NET ASSET VALUE | | | (0.12 | ) | | | (0.07 | ) |
| NET ASSET VALUE, END OF PERIOD | | $ | 11.00 | | | $ | 11.12 | |
| | | | | | | | | |
| TOTAL RETURN(d) | | | 1.95 | % | | | 0.88 | % |
| RATIOS AND SUPPLEMENTAL DATA | | | | | | | | |
| Net assets, end of period (in 000s) | | $ | 5,382 | | | $ | 2,445 | |
| | | | | | | | | |
| RATIOS TO AVERAGE NET ASSETS | | | | | | | | |
| Including interest expense:(e) | | | | | | | | |
| Expenses, gross | | | 3.16 | %(f) | | | 4.39 | %(f) |
| Expenses, net of fees waived/expenses reimbursed by investment advisor and administrator | | | 2.84 | %(f) | | | 2.84 | %(f) |
| Excluding interest expense:(e) | | | | | | | | |
| Expenses, gross | | | 3.16 | %(f) | | | 4.39 | %(f) |
| Expenses, net of fees waived/expenses reimbursed by investment advisor | | | 2.84 | %(f) | | | 2.84 | %(f) |
| Net investment income (e) | | | 6.84 | %(f) | | | 6.67 | %(f) |
| PORTFOLIO TURNOVER RATE | | | 36 | %(g) | | | 39 | %(g)(h) |
| (a) | The Fund's Class L commenced operations on July 28, 2017. |
| (b) | Per share numbers have been calculated using the average shares method. |
| (c) | Realized and unrealized losses per share do not correlate to the aggregate of the net realized and unrealized gains on the Statement of Operations for the period ended September 30, 2017, primarily due to the timing of sales and repurchases of the Fund's shares in relation to fluctuating market values for the Fund's portfolio. |
| (d) | Total returns shown are historical in nature and assume changes in share price, reinvestment of dividends and capital gains distribution, if any. Had the adviser not absorbed a portion of Fund expenses, total returns would have been lower. Total returns for periods less than one year are not annualized. Returns shown exclude applicable sales charges. |
| (e) | Ratios do not include expenses of underlying investment companies in which the Fund invests. |
| (f) | Annualized. |
| (g) | Not annualized. |
| (h) | Portfolio turnover rate is calculated at the Fund level and represents the year ended September 30, 2017. |
See Notes to Financial Statements.
| Semi-Annual Report | March 31, 2018 | 17 |
| Resource Credit Income Fund | Notes to Financial Statements |
March 31, 2018 (Unaudited)
1. ORGANIZATION
Resource Credit Income Fund (the “Trust” or the “Fund”) was organized as a Delaware statutory trust on December 11, 2014 and is registered under the Investment Company Act of 1940, as amended, (the “1940 Act”), as a closed-end management investment company that operates as an interval fund with a continuous offering of Fund shares. Effective April 11, 2017 the Fund’s investment advisory agreement was transferred from Resource Financial Fund Management, Inc. to Resource Alternative Advisor, LLC (the “Adviser”). The investment objectives are to produce current income and to achieve capital preservation with moderate volatility and low to moderate correlation to the broader equity markets. The Fund is non-diversified and pursues its investment objectives by investing, under normal circumstances, at least 80% of its assets (defined as net assets plus the amount of any borrowing for investment purposes) in fixed-income and fixed-income related securities.
The Fund currently offers Class A, Class C, Class W, Class I, and Class L shares; all classes of shares except Class L commenced operations on April 20, 2015. Class L shares commenced operations on July 28, 2017. Effective as of July 7, 2017, the Fund suspended the offering and operation of its Class U, Class T, and Class D shares. Class C, Class W, and Class I shares are offered at net asset value. Class A shares are offered at net asset value plus a maximum sales charge of 5.75% and may also be subject to a 0.50% early withdrawal charge, which will be deducted from repurchase proceeds, for shareholders tendering shares fewer than 365 days after the original purchase date, if (i) the original purchase was for amounts of $1 million or more and (ii) the selling broker received the reallowance of the dealer-manager fee. Class C shares are subject to a 1.00% early withdrawal charge. Class L shares are offered at net asset value plus a maximum sales charge of 4.25%. Each class represents an interest in the same assets of the Fund and classes are identical except for differences in their sales charge structures and ongoing service and distribution charges. All classes of shares have equal voting privileges except that each class has exclusive voting rights with respect to its service and/or distribution plans. The Fund’s income, expenses (other than class specific distribution fees) and realized and unrealized gains and losses are allocated proportionately each day based upon the relative net assets of each class.
2. SIGNIFICANT ACCOUNTING POLICIES
The following is a summary of significant accounting policies followed by the Fund in preparation of its financial statements. These policies are in conformity with accounting principles generally accepted in the United States of America (“GAAP”). The Fund is considered an investment company for financial reporting purposes under GAAP. The preparation of financial statements requires management to make estimates and assumptions that affect the reported amounts of assets and liabilities and disclosure of contingent assets and liabilities at the date of the financial statements and the reported amounts of income and expenses for the period. Actual results could differ from those estimates. The Fund is an investment company and accordingly follows the investment company accounting and reporting guidance of the Financial Accounting Standards Board (FASB) Accounting Standard Codification (“ASC”) Topic 946 “Financial Services – Investment Companies” including FASB Accounting Standard Update ASU 2013-08.
Securities Valuation – Securities listed on an exchange are valued at the last reported sale price at the close of the regular trading session of the exchange on the business day the value is being determined, or in the case of securities listed on NASDAQ, at the NASDAQ Official Closing Price. Short-term investments that mature in 60 days or less may be valued at amortized cost, provided such valuations represent fair value.
Structured credit and other similar debt securities including, but not limited to collateralized debt obligation debt and equity securities, asset- backed securities, commercial mortgage-backed securities, and other securitized investments backed by certain debt other receivables (collectively “Structured Credit Securities”) are valued on the basis of valuations provided by dealers in those instruments and/or independent pricing services recommended by the Adviser and approved by the Trust’s Board of Trustees (the “Board”). In determining value, dealers and pricing services will generally use information with respect to transactions in the securities being valued; quotations from other dealers; market transactions in comparable securities; analyses and evaluations of various relationships between securities; and yield to maturity information. The Adviser will, based on its reasonable judgment, select the dealer or pricing service quotation that most accurately reflects the fair market value of the Structured Credit Security while taking into account the information utilized by the dealer or pricing service to formulate the quotation in addition to any other relevant factors. In the event that there is a material discrepancies between quotations received from third party dealers or the pricing services the Adviser may (i) use an average of the quotations received or (ii) select an individual quotation that the Adviser, based upon its reasonable judgment, determines to be accurate. In any instance in which the Adviser selects a single bid pursuant to section (e)(ii), the Adviser will provide to the fair value committee an analysis of the factors relied upon in the selection of the relevant quotation.
When price quotations for certain securities are not readily available, or if the available quotations are not believed to be reflective of market value by the Adviser, those securities will be valued at “fair value” as determined in good faith by the fair value committee using procedures adopted by and under the supervision of the Board. There can be no assurance that the Fund could purchase or sell a portfolio security at the price used to calculate the Fund’s net asset value (“NAV”).
| 18 | www.resourcecreditincome.com |
| Resource Credit Income Fund | Notes to Financial Statements |
March 31, 2018 (Unaudited)
Fair valuation procedures may be used to value a substantial portion of the assets of the Fund. The Fund may use the fair value of a security to calculate its NAV when, for example, (1) a portfolio security is not traded in a public market or the principal market in which the security trades is closed, (2) trading in a portfolio security is suspended and not resumed prior to the normal market close, (3) a portfolio security is not traded in significant volume for a substantial period, or (4) the Adviser determines that the quotation or price for a portfolio security provided by a broker-dealer or independent pricing service is inaccurate.
The “fair value” of securities may be difficult to determine and thus judgment plays a greater role in the valuation process. The fair valuation methodology may include or consider the following guidelines, as appropriate: (1) evaluation of all relevant factors, including but not limited to, pricing history, current market level, supply and demand of the respective security; (2) comparison to the values and current pricing of securities that have comparable characteristics; (3) knowledge of historical market information with respect to the security; (4) other factors relevant to the security which would include, but not be limited to, duration, yield, fundamental analytical data, the Treasury yield curve and credit quality.
Valuation of Private Investment Funds – The Fund invests a portion of its assets in private investment funds. Private investment funds measure their investment assets at fair value, and report a NAV per share when a NAV is not provided. In accordance with ASC 820, the Fund has elected to apply the practical expedient and to value its investments in private investment funds at their respective NAVs at each date a NAV is provided. For days when a NAV is not provided, the fair value committee estimates the fair value of each investment fund by adjusting the most recent NAV for each private investment fund, as necessary, by the change in a relevant benchmark that the fair value committee has deemed to be representative of the market.
Loan Participation and Assignments – The Fund may invest in direct debt instruments which are interests in amounts owed to lenders or lending syndicates by corporate, governmental, or other borrowers. The Fund’s investments in loans may be in the form of participations in loans or assignments of all or a portion of the loans from third parties. A loan is often administered by a bank or other financial institution (the “lender”) that acts as agent for all holders. The agent administers the terms of the loan, as specified in the loan agreement. The Fund may invest in multiple series or tranches of a loan, which may have varying terms and carry different associated risks. The Fund generally has no right to enforce compliance with the terms of the loan agreement with the borrower. As a result, the Fund may be subject to the credit risk of both the borrower and the lender that is selling the loan agreement. When the Fund purchases assignments from lenders, they acquire direct rights against the borrower of the loan. The Fund may enter into unfunded loan commitments, which are contractual obligations for future funding. Unfunded loan commitments represent a future obligation in full, even though a percentage of the notional loan amounts may not be utilized by the borrower. When investing in a loan participation, the Fund has the right to receive payments of principal, interest and any fees to which it is entitled only from the lender selling the loan agreement and only upon receipt of payments by the lender from the borrower. The Fund may receive a commitment fee based on the undrawn portion of the underlying line of credit portion of a floating rate loan. In certain circumstances, the Fund may receive a penalty fee upon the prepayment of a floating rate loan by a borrower. Fees earned or paid are recorded as a component of interest income or interest expense, respectively, on the Statement of Operations.
Fair Value Measurements – A three-tier hierarchy has been established to classify fair value measurements for disclosure purposes. Inputs refer broadly to the assumptions that market participants would use in pricing the asset or liability, including assumptions about risk. Inputs may be observable or unobservable. Observable inputs are inputs that reflect the assumptions market participants would use in pricing the asset or liability that are developed based on market data obtained from sources independent of the reporting entity. Unobservable inputs are inputs that reflect the reporting entity’s own assumptions about the assumptions market participants would use in pricing the asset or liability that are developed based on the best information available. In accordance with the authoritative guidance on fair value measurements and disclosure under GAAP, the Fund discloses the fair value of its investments in a hierarchy that prioritizes the inputs to valuation techniques used to measure the fair value.
Various inputs are used in determining the value of the Fund’s investments as of the reporting period end. These inputs are categorized in the following hierarchy under applicable financial accounting standards:
| Level 1 – | Unadjusted quoted prices in active markets for identical, unrestricted assets or liabilities that the Fund has the ability to access at the measurement date; |
| Level 2 – | Quoted prices which are not active, quoted prices for similar assets or liabilities in active markets or inputs other than quoted prices that are observable (either directly or indirectly) for substantially the full term of the asset or liability at the measurement date; and |
| Level 3 – | Significant unobservable prices or inputs (including the Fund’s own assumptions in determining the fair value of investments) where there is little or no market activity for the asset or liability at the measurement date. |
| Semi-Annual Report | March 31, 2018 | 19 |
| Resource Credit Income Fund | Notes to Financial Statements |
March 31, 2018 (Unaudited)
The availability of observable inputs can vary from security to security and is affected by a wide variety of factors, including, for example, the type of security, whether the security is new and not yet established in the marketplace, the liquidity of markets and other characteristics particular to the security. To the extent that valuation is based on models or inputs that are less observable or unobservable in the market, the determination of fair value requires more judgment. Accordingly, the degree of judgment exercised in determining fair value is greatest for instruments categorized in Level 3.
An investment level within the fair value hierarchy is based on the lowest level input, individually or in the aggregate, that is significant to fair value measurement. The valuation techniques used by the Fund to measure fair value during the six months ended March 31, 2018 maximized the use of observable inputs and minimized the use of unobservable inputs.
The inputs or methodologies used for valuing securities are not necessarily an indication of the risk or liquidity associated with investing in those securities. The following is a summary of the inputs used in valuing the Fund’s investments as of March 31, 2018:
Resource Credit Income Fund
| Investments in Securities at Value | | Level 1 | | | Level 2 | | | Level 3 | | | Total | |
| Bank Loan | | $ | – | | | $ | 24,453,664 | | | $ | – | | | $ | 24,453,664 | |
| Bonds & Notes(a) | | | – | | | | 33,857,623 | | | | – | | | | 33,857,623 | |
| Common Stocks(a) | | | 21,937,202 | | | | – | | | | – | | | | 21,937,202 | |
| Real Estate Investment Trusts - Common Stocks | | | 1,376,314 | | | | – | | | | – | | | | 1,376,314 | |
| Private Investment Funds | | | | | | | | | | | | | | | | |
| (Measured at net asset value)(b) | | | – | | | | – | | | | – | | | | 17,126,067 | |
| Short Term Investments | | | 413,707 | | | | – | | | | – | | | | 413,707 | |
| TOTAL | | $ | 23,727,223 | | | $ | 58,311,287 | | | $ | – | | | $ | 99,164,577 | |
| (a) | For detailed descriptions, see the accompanying Portfolio of Investments. |
| (b) | In accordance with ASC 820-10, certain investments that are measured at fair value using the net asset value per share (or its equivalent) practical expedient have not been classified in the fair value hierarchy. The fair value amounts presented in this table are intended to permit reconciliation of the fair value hierarchy to the amounts presented in the Statement of Assets and Liabilities. |
There were no transfers between Levels 1, 2 and 3 during the six months ended March 31, 2018. It is the Fund’s policy to recognize transfers between levels at the end of the reporting period.
Securities Transactions and Investment Income – Investment security transactions are accounted for on a trade date basis. Cost is determined and gains and losses are based upon the specific identification method for both financial statement and federal income tax purposes. Dividend income is recorded on the ex-dividend date and interest income is recorded on the accrual basis. Purchase discounts and premiums on securities are accreted and amortized over the life of the respective securities.
Federal and Other Taxes – No provision for income taxes is included in the accompanying financial statements, as the Fund intends to distribute to shareholders all taxable investment income and realized gains and otherwise comply with Subchapter M of the Internal Revenue Code of 1986, as amended, applicable to regulated investment companies.
The Fund evaluates tax positions taken (or expected to be taken) in the course of preparing the Fund’s tax provisions to determine whether these positions meet a “more-likely-than-not” standard that, based on the technical merits, have a more than fifty percent likelihood of being sustained by a taxing authority upon examination. A tax position that meets the “more-likely-than-not” recognition threshold is measured to determine the amount of benefit to recognize in the financial statements.
As of and during the six months ended March 31, 2018, the Fund did not have a liability for any unrecognized tax benefits. The Fund files U.S. federal, state and local tax returns as required. The Fund’s tax returns are subject to examination by the relevant tax authorities until expiration of the applicable statute of limitations which is generally three years after the filing of the tax return for federal purposes and four years for most state returns. Tax returns for open years have incorporated no uncertain tax positions that require a provision for income taxes.
Foreign Currency – The accounting records of the Fund are maintained in U.S. dollars. Investment securities and other assets and liabilities denominated in a foreign currency and income receipts and expense payments are translated into U.S. dollars using the prevailing exchange rate at the London market close. Purchases and sales of securities are translated into U.S. dollars at the contractual currency rates established at the approximate time of the trade. Net realized gains and losses on foreign currency transactions represent net gains and losses from currency realized between the trade and settlement dates on securities transactions and the difference between income accrued versus income received. The effects of changes in foreign currency exchange rates on investments in securities are included with the net realized and unrealized gain or loss on investment securities.
| 20 | www.resourcecreditincome.com |
| Resource Credit Income Fund | Notes to Financial Statements |
March 31, 2018 (Unaudited)
Distributions to Shareholders – Distributions from investment income are declared and paid quarterly. Distributions from net realized capital gains, if any, are declared and paid annually and are recorded on the ex-dividend date. The character of income and gains to be distributed is determined in accordance with income tax regulations, which may differ from GAAP.
Concentration of Credit Risk – The Fund places its cash with one banking institution, which is insured by Federal Deposit Insurance Corporation (“FDIC”). The FDIC limit is $250,000. At various times throughout the year, the amount on deposit may exceed the FDIC limit and subject the Fund to a credit risk. The Fund does not believe that such deposits are subject to any unusual risk associated with investment activities.
Early Withdrawal Charge – Selling brokers, or other financial intermediaries that have entered into distribution agreements with the Distributor, may receive a commission of up to 1.00% of the purchase price of Class C shares and up to 0.50% on the purchase of Class A shares of $1 million or more. Shareholders who tender for repurchase of such shareholder's Class C shares within 365 days of purchase will be subject to an early withdrawal charge of 1.00% of the original purchase price. Shareholders tendering Class A shares fewer than 365 days after the original purchase date may be subject to an early withdrawal charge of 0.50%, which will be deducted from repurchase proceeds, if (i) the original purchase was for amounts of $1 million or more and (ii) the selling broker received the reallowance of the dealer-manager fee. The Distributor may waive the imposition of the early withdrawal charge in the following situations: (1) shareholder death or (2) shareholder disability. Any such waiver does not imply that the early withdrawal charge will be waived at any time in the future or that such early withdrawal charge will be waived for any other shareholder. Class A (with respect to purchases of under $1 million) shares will not be subject to an early withdrawal charge. For the six months ended March 31, 2018, the Fund did not have any early withdrawal charges.
Indemnification – The Trust indemnifies its officers and Trustees for certain liabilities that may arise from the performance of their duties to the Trust. Additionally, in the normal course of business, the Fund enters into contracts that contain a variety of representations and warranties and which provide general indemnities. The Fund’s maximum exposure under these arrangements is unknown, as this would involve future claims that may be made against the Fund that have not yet occurred. However, based on industry experience, the Trust expects the risk of loss due to these warranties and indemnities to be remote.
3. ADVISORY FEES AND OTHER TRANSACTIONS WITH SERVICE PROVIDERS
Advisory Fees – Pursuant to an investment advisory agreement (the “Advisory Agreement”), investment advisory services are provided to the Fund by the Adviser. Under the terms of the Advisory Agreement, the Adviser receives a monthly base management fee calculated at an annual rate of 1.85% of the average daily net assets of the Fund. For the six months ended March 31, 2018, the Fund incurred $713,086 in base management fees.
The Adviser has contractually agreed to waive all or part of its management fees (excluding any incentive fee) and/or make payments to limit Fund expenses, (including all organization and offering expenses, but excluding interest, brokerage commissions, acquired fund fees and expenses and extraordinary expenses) at least until September 9, 2018, so that the total annual operating expenses of the Fund do not exceed 2.59% per annum of Class A average daily net assets, 3.34% per annum of Class C average daily net assets, 2.59% per annum of Class W average daily net assets, 2.34% per annum of Class I average daily net assets, and 2.84% per annum of Class L average daily net assets. Fee waivers and expense payments may be recouped by the Adviser from the Fund, to the extent that overall expenses fall below the expense limitation, within three years of when the amounts were waived or reimbursed. During the six months ended March 31, 2018, the Adviser waived fees and reimbursed expenses of $123,797.
As of March 31, 2018 the following amounts were available for recoupment by the advisor based upon their potential expiration dates:
| Fund | 2018 | 2019 | 2020 | 2021 |
| Resource Credit Income Fund | $435,536* | $765,490 | $476,713 | $123,797 |
| * | Organizational Expenses were reduced from $37,338 to $36,870 subsequent to the February 20, 2015 Audit of the Seed Financial Statements. |
An incentive fee is also payable to the Adviser. The incentive fee is calculated and payable quarterly in arrears based upon the Fund’s “pre-incentive fee net investment income” for the immediately preceding quarter and is subject to a hurdle rate, expressed as a rate of return on the Fund’s “adjusted capital,” equal to 2.25% per quarter (or an annualized hurdle rate of 9.0%), subject to a “catch-up” feature. For this purpose, “pre-incentive fee net investment income” means interest income, dividend income and any other income accrued during the calendar quarter, minus the Fund’s operating expenses for the quarter (including the management fee, expenses reimbursed to the Adviser and any interest expenses and distributions paid on any issued and outstanding preferred shares, but excluding the incentive fee). “Adjusted capital” means the cumulative gross proceeds received by the Fund from the sale of shares (including pursuant to the Fund’s distribution reinvestment plan), reduced by amounts paid in connection with purchases of shares pursuant to the Fund’s share repurchase program.
| Semi-Annual Report | March 31, 2018 | 21 |
| Resource Credit Income Fund | Notes to Financial Statements |
March 31, 2018 (Unaudited)
No incentive fee is payable in any calendar quarter in which the Fund’s pre-incentive fee net investment income does not exceed the quarterly hurdle rate of 2.25%. For any calendar quarter in which the Fund’s pre-incentive fee net investment income is greater than the hurdle rate, but less than or equal to 2.8125%, the incentive fee will equal the amount of the Fund’s pre-incentive fee net investment income in excess of the hurdle rate. This portion of the Fund’s pre-incentive fee net investment income which exceeds the hurdle rate but is less than or equal to 2.8125% is referred to as the “catch-up.” The “catch-up” provision is intended to provide the Adviser with an incentive fee of 20.0% on all of the Fund’s pre-incentive fee net investment income when the Fund’s pre-incentive fee net investment income reaches 2.8125% in any calendar quarter. For any calendar quarter in which the Fund’s pre-incentive fee net investment income exceeds 2.8125% of adjusted capital, the incentive fee will equal 20.0% of pre-incentive fee net investment income. For the six months ended March 31, 2018, there was no incentive fee incurred.
CCO/Compliance Services – Pursuant to a Compliance Services Agreement between the Fund and Resource America (acting together with the Fund’s adviser and certain other affiliates of Resource America, Inc. (collectively, “Resource”)), dated March 1, 2018 (the “CSA”), Resource provides compliance services to the Fund. The services under the CSA are designed to ensure compliance by the Fund with its investment objectives, policies and restrictions, as disclosed in the Fund’s Prospectuses and Statement of Additional Information.
The CSA also covers, among other items, services associated with monitoring the Fund’s compliance with its policies and procedures and applicable federal, state and foreign securities laws and the rules and regulations thereunder. The initial term of the CSA is two years and will remain in full force from year to year thereafter, subject to annual approval by Resource and the Board.
In return for the services provided under the CSA, the Fund pays a flat, annual fee of $200,000, payable monthly in twelve (12) equal installments (the “Flat Fee”), provided that each such monthly installment of the Flat Fee shall not exceed a monthly fee calculated at an annual rate of 0.10% of the Fund’s average daily net assets (the “Asset-Based Fee”). For purposes of determining whether the Fund will pay the Asset-Based Fee in any given month, Resource compares the amount of the Flat Fee and Asset-Based Fee that would be due for the given month and charges the Fund the applicable Asset-Based Fee only if such Asset-Based Fee is lower than the monthly installment of the Flat Fee, which is $16,666.66 (1/12 of $200,000). For the six months ended March 31, 2018, the Fund incurred $7,304 in CCO/Compliance services fees.
Fund Accounting Fees and Expenses – ALPS Fund Services, Inc. (“ALPS”) serves as the Fund’s administrator and accounting agent (the “Administrator”) and receives customary fees from the Fund for such services.
Transfer Agent – DST Systems Inc., an affiliate of ALPS, serves as transfer, dividend paying and shareholder servicing agent for the Fund (“Transfer Agent”).
Distributor – The Fund has entered into a distribution agreement with ALPS Distributors, Inc. (the “Distributor”) to provide distribution services to the Fund. There are no fees paid to the Distributor pursuant to the distribution agreement. The Board has adopted, on behalf of the Fund, a shareholder servicing plan under which the Fund may compensate financial industry professionals for providing ongoing services in respect of clients with whom they have distributed shares of the Fund. Under the shareholder servicing plan, the Fund’s Class A, Class C, Class W and Class L shares are subject to a shareholder servicing fee at an annual rate of 0.25% of the average daily net assets attributable to that share class. For the six months ended March 31, 2018, the Fund incurred shareholder servicing fees of $80,282. The Class C and Class L shares also pay to the Distributor a distribution fee, pursuant to a distribution plan adopted by the Board, that accrues at an annual rate equal to 0.75% and 0.25% of the Fund’s average daily net assets attributable to Class C and Class L shares and is payable on a quarterly basis. Class A, Class I, and Class U shares are not currently subject to a distribution fee. For the six months ended March 31, 2018, the Fund accrued $48,140 in distribution fees.
The Distributor acts as the Fund’s principal underwriter in a continuous public offering of the Fund’s shares. The Distributor is an affiliate of ALPS. During the six months ended March 31, 2018, no fees were retained by the Distributor.
Trustees – Each trustee who is not affiliated with the Trust or the Adviser will receive an annual fee of $10,000, plus $2,000 for attending the annual in-person meeting of the Board, plus $500 for attending each of the remaining telephonic meetings, as well as reimbursement for any reasonable expenses incurred attending the meetings. None of the executive officers or interested trustees receives compensation from the Trust.
| 22 | www.resourcecreditincome.com |
| Resource Credit Income Fund | Notes to Financial Statements |
March 31, 2018 (Unaudited)
4. INVESTMENT TRANSACTIONS
The cost of purchases and proceeds from the sale of securities, other than short-term securities, for the six months ended March 31, 2018 amounted to $74,610,756 and $26,618,398, respectively.
5. TAX BASIS INFORMATION
The tax characteristics of distributions paid for the year ended September 30, 2017 were as follows:
| September 30, 2017 | | Ordinary
Income | | | Long-Term Capital Gain | | | Return
of Capital | |
| Resource Credit Income Fund | | $ | 1,526,138 | | | $ | 62,647 | | | $ | 281,150 | |
The following information is computed on a tax basis for each item as of March 31, 2018:
| | | Gross
Appreciation
(excess of value
over tax cost) | | | Gross
Depreciation
(excess of tax
cost over value) | | | Net
Unrealized
Appreciation | | | Cost of
Investments for
Income Tax
Purposes | |
| Resource Credit Income Fund | | $ | 1,938,199 | | | $ | (1,464,470 | ) | | $ | 473,729 | | | $ | 98,690,847 | |
The difference between book basis and tax basis distributable earnings and unrealized appreciation/(depreciation) is primarily attributable to the tax deferral of losses on wash sales, investments in partnerships and certain other investments.
6. REPURCHASE OFFERS
Pursuant to Rule 23c-3 under the 1940 Act, the Fund offers shareholders on a quarterly basis the option of redeeming shares, at NAV, of up to 5% of its issued and outstanding shares as of the close of regular business hours on the New York Stock Exchange on the Repurchase Pricing Date. If shareholders tender for repurchase more than 5% of the outstanding shares of the Fund, the Fund may, but is not required to, repurchase up to an additional 2%. If the Fund determines not to repurchase an additional 2%, or if more than 7% of the shares are tendered, then the Fund will repurchase shares on a pro rata basis based upon the number of shares tendered by each shareholder. There can be no assurance that the Fund will be able to repurchase all shares that each shareholder has tendered, even if all the shares in a shareholder's account are tendered. In the event of an oversubscribed offer, you may not be able to tender all shares that you wish to tender and may have to wait until the next quarterly repurchase offer to tender the remaining shares. Subsequent repurchase requests will not be given priority over other shareholder requests.
During the six months ended March 31, 2018, the Fund completed two quarterly repurchase offers. In these offers, the Fund offered to repurchase up to 5% of the number of its outstanding shares as of the Repurchase Pricing Dates. For the six months ended March 31, 2018, none of the quarterly repurchase offers were oversubscribed. The result of those repurchase offers were as follows:
| | Repurchase Offer #1 | Repurchase Offer #2 |
| Commencement Date | September 18, 2017 | December 11, 2017 |
| Repurchase Request Deadline | October 18, 2017 | January 10, 2018 |
| Repurchase Pricing Date | October 18, 2017 | January 10, 2018 |
| Amount Repurchased | $249,845 | $1,070,927 |
| Shares Repurchased | 22,372 | 96,424 |
7. BANK LINE OF CREDIT
The Fund has a secured revolving bank line of credit through BNP Paribas Prime Brokerage International, Ltd. (the “Bank”) for purpose of investment purchases subject to the limitations of the 1940 Act for borrowings.
Borrowings under this arrangement bear interest at the Bank’s 3 month LIBOR plus 95 basis points at the time of borrowing. As of March 31, 2018, the Fund had no outstanding borrowings.
| Semi-Annual Report | March 31, 2018 | 23 |
| Resource Credit Income Fund | Notes to Financial Statements |
March 31, 2018 (Unaudited)
8. UNFUNDED COMMITMENTS
As of March 31, 2018, in addition to the unfunded commitments for investments currently held as of the reporting date (Refer to Portfolio of Investments footnote disclosures), the Fund had $10,000,000 of unfunded commitments relating to potential future investments not currently held as reported below. The value of unfunded commitments reported as of March 31, 2018 approximates fair value.
| Security | Unfunded Commitments as of March 31, 2018 |
| Monroe Capital Private Credit Fund III | $10,000,000 |
9. RECENT ACCOUNTING PRONOUNCEMENT
In March 2017, the FASB issued ASU “Premium Amortization on Purchased Callable Debt Securities” which amends the amortization period for a callable debt security held at a premium from the maturity date to the earliest call date. The guidance is effective for annual periods beginning after December 15, 2018, and interim periods within those annual periods. At this time, management is evaluating the implications of these changes on the Fund.
10. SUBSEQUENT EVENTS
Subsequent events after the date of the Statement of Assets and Liabilities have been evaluated through the date the financial statements were issued.
The Fund completed a quarterly repurchase offer on April 18, 2018 which resulted in 275,425 shares of the Fund being repurchased for $3,059,170.
Management has determined that there were no other subsequent events to report through the issuance of these financial statements.
| 24 | www.resourcecreditincome.com |
| Resource Credit Income Fund | Additional Information |
March 31, 2018 (Unaudited)
1. PROXY VOTING POLICIES AND VOTING RECORD
A description of the policies and procedures that the Fund uses to vote proxies relating to portfolio securities is available without charge upon request by calling toll-free 855-747-9559, or on the Securities and Exchange Commission’s (“SEC”) website at http://www.sec.gov. Information regarding how the Fund voted proxies relating to portfolio securities during the most recent 12-month period ended June 30th is available without charge upon request by calling toll-free 855-747-9559, or on the SEC’s website at http://www.sec.gov.
2. QUARTERLY PORTFOLIO HOLDINGS
The Fund files a complete listing of portfolio holdings for the Fund with the SEC as of the first and third quarters of each fiscal year on Form N-Q. The filings are available upon request by calling 855-747-9559. Furthermore, you may obtain a copy of the filing on the SEC’s website at http://www.sec.gov. The Fund’s Form N-Q may also be reviewed and copied at the SEC’s Public Reference Room in Washington, D.C., and information on the operation of the Public Reference Room may be obtained by calling 1-800-SEC-0330.
3. ANNUAL RENEWAL OF INVESTMENT ADVISORY AGREEMENT
At a meeting on November 10, 2017, the Board (the “Board” or “Trustees”) of Resource Credit Income Fund (the “Fund” or the “Trust”), including a majority of the independent Trustees, approved the continuance of the investment advisory agreement (the “Advisory Agreement”) between the Trust and Resource Alternative Advisor, LLC (“Resource Alternative” or the “Adviser”). In considering the approval of the Advisory Agreement, the Trustees received materials specifically relating to the Adviser and the Advisory Agreement.
The Trustees considered the following material factors during their deliberations: (1) the nature, extent and quality of services to be provided by the Adviser; (2) the investment performance of the Fund and the Adviser; (3) the cost of services to be provided and the profits to be realized by the Adviser and its affiliates; (4) the extent to which economies of scale will be realized as the Fund grows; and (5) whether the fee levels reflect these economies of scale for the benefit of investors. The Trustees relied upon the advice of counsel and their own business judgment in determining the before-mentioned material factors to be considered in evaluating the Advisory Agreement and the weight to be given to each factor considered. The conclusions reached by the Trustees were based on a comprehensive evaluation of all of the information provided and were not the result of any one factor. Moreover, each Trustee may have afforded different weight to the various factors in reaching his conclusions with respect to the approval of the Advisory Agreement.
Nature, Extent and Quality of Service. The Board examined the nature, extent and quality of the services provided by Resource Alternative to the Fund. They noted that the Board receives a significant level of input and quality materials from Resource Alternative and provides professional managerial and operational teams to run and support the Fund. They further noted that Resource Alternative continues to invest in high quality professional personnel to support the Fund. Resource Alternative reported that its parent company has extensive experience sponsoring investment funds. The Trustees discussed the nature of Resource Alternative’s operations, the quality of Resource Alternative’s compliance infrastructure and the experience and background of all key personnel of its fund management team. The Trustees further considered the key risks associated with the Fund’s investment strategy and the policies and procedures adopted by Resource Alternative to mitigate those risks. They also discussed Resource Alternative’s practices for monitoring compliance with the Fund’s investment limitations as well as Resource Alternative’s broker-dealer selection practices. The Trustees concluded that Resource Alternative had sufficient quality and depth of personnel, resources, investment methods and compliance policies and procedures essential to the continued performance of its duties under the Advisory Agreement and that the nature, overall quality and extent of the management services provided by Resource Alternative to the Fund were satisfactory.
Performance. The Trustees considered the performance of the Fund. They noted that the Fund significantly outperformed its peer group average, Morningstar category average, and the S&P/LSTA Leveraged Loan Total Return Index over both the preceding once year-period and since inception. The Trustees expressed their appreciation for the performance and the careful, thoughtful and professional manner in which Resource Alternative implemented the strategy. They reasoned that Resource Alternative was managing the Fund’s portfolio in accordance with prospectus guidelines and concluded that the Fund’s performance was satisfactory.
Fees and Expenses. The Board noted that Resource Alternative charges a 1.85% annual advisory fee based on the average net assets of the Fund, and that the fee was above the average of the Fund’s Morningstar category, but well within the range of the category, and slightly higher, but reasonably within the range, of the Fund’s peer group. However, the Trustees noted that the expense ratio was higher than both the Morningstar category and peer group averages, but within the ranges of each. The Trustees further noted the expense cap in place, considered that expenses were likely to decline as the Fund grew materially in size, and after further discussion, agreed that the Fund’s fees and expenses were not unreasonable.
| Semi-Annual Report | March 31, 2018 | 25 |
| Resource Credit Income Fund | Additional Information |
March 31, 2018 (Unaudited)
Economies of Scale. The Trustees considered whether there will be economies of scale with respect to the management of the Fund. They considered that Resource Alternative reported that it had not yet received materials benefits related to economies of scale, but that such economies may be realized as the Fund grows. After further discussion, the Trustees concluded that the absence of breakpoints at this time was acceptable, but that economies of scale would be revisited in the future if the Fund grows materially in size.
Profitability. The Trustees reviewed the profitability analysis provided by Resource Alternative and noted that Resource Alternative had estimated that it incurred a loss over the past fiscal year from its work with the Fund, due in part to its participation in the Fund’s fee waiver and expense limitation arrangement. The Trustees concluded excessive profitability was not a concern.
Conclusion. Having requested and received such information from Resource Alternative as the Board of the Fund believed to be reasonably necessary to evaluate the terms of the Advisory Agreement, and as assisted by the advice of counsel, the Board concluded that the advisory fee is reasonable and that renewal of the Advisory Agreement is in the best interests of the shareholders of the Fund.
| 26 | www.resourcecreditincome.com |
This Page Intentionally Left Blank

INVESTMENT ADVISER
Resource Alternative Advisor, LLC
712 Fifth Avenue, 12th Floor
New York, NY 10019
DISTRIBUTOR
ALPS Distributors, Inc.
1290 Broadway, Suite 1100
Denver, Colorado 80203
LEGAL COUNSEL
Thompson Hine LLP
41 South High Street, Suite 1700
Columbus, Ohio 43215
INDEPENDENT REGISTERED
PUBLIC ACCOUNTING FIRM
BBD, LLP
1835 Market Street, 3rd Floor
Philadelphia, Pennsylvania 19103
Must be accompanied or preceded by a Prospectus.
ALPS Distributors, Inc. is the Distributor for Resource Credit Income Fund.
Item 2. Code of Ethics.
Not applicable to this report.
Item 3. Audit Committee Financial Expert.
Not applicable to this report.
Item 4. Principal Accountant Fees and Services.
Not applicable to this report.
Item 5. Audit Committee of Listed Registrants.
Not applicable to the Registrant.
Item 6. Investments.
| (a) | The schedule of investments is included as part of the Reports to Shareholders filed under Item 1 of this report. |
| (b) | Not applicable to the Registrant. |
Item 7. Disclosure of Proxy Voting Policies and Procedures for Closed-End Management Investment Companies.
Not applicable to this report.
Item 8. Portfolio Managers of Closed-End Management Investment Companies.
| (a) | Not applicable to this report. |
| (b) | Not applicable to this report. |
Item 9. Purchases of Equity Securities by Closed-End Management Investment Company and Affiliates Purchasers.
None.
Item 10. Submission of Matters to a Vote of Security Holders.
None.
Item 11. Controls and Procedures.
| (a) | Based on an evaluation of the Registrant’s disclosure controls and procedures as of a date within 90 days of the filing date of this report, the Registrant’s principal executive officer and principal financial officer have concluded that the disclosure controls and procedures are reasonably designed to ensure that the information required in filings on Form N-CSR is recorded, processed, summarized and reported by the filing date, including that information required to be disclosed is accumulated and communicated to the Registrant’s management, including the Registrant’s principal executive officer and principal financial officer, as appropriate to allow timely decisions regarding required disclosure. |
| (b) | There were no significant changes in the Registrant’s internal control over financial reporting that occurred during the Registrant’s last fiscal half-year that have materially affected, or are reasonably likely to materially affect, the Registrant’s internal control over financial reporting. |
Item 12. Disclosure of Securities Lending Activities for Closed-End Management Investment Companies.
None
Item 13. Exhibits.
| (a)(2) | Certifications required by Item 12(a)(2) of Form N-CSR are filed herewith as Exhibit 99.CERT. |
SIGNATURES
Pursuant to the requirements of the Securities Exchange Act of 1934 and the Investment Company Act of 1940, the Registrant has duly caused this report to be signed on its behalf by the undersigned, thereunto duly authorized.
RESOURCE CREDIT INCOME FUND
| By: | /s/ Alan Feldman | |
| | Alan Feldman | |
| | Chief Executive Officer (Principal Executive Officer) | |
Date: June 7, 2018
Pursuant to the requirements of the Securities Exchange Act of 1934 and the Investment Company Act of 1940, this report has been signed below by the following persons on behalf of the Registrant and in the capacities and on the dates indicated.
| By: | /s/ Alan Feldman | |
| | Alan Feldman | |
| | Chief Executive Officer (Principal Executive Officer) | |
Date: June 7, 2018
| By: | /s/ Brian Hawkins | |
| | Brian Hawkins | |
| | Treasurer (Principal Financial Officer) | |
Date: June 7, 2018