Exhibit (c)(4)
Preliminary Draft – Subject to Change The Conflicts Committee of the Board of Directors of Tallgrass Energy GP, LLC Discussion Materials December 5, 2019
Preliminary Draft – Subject to Change These materials have been prepared by Evercore Group L.L.C. (“Evercore”) for the Conflicts Committee of the Board of Directors (the “Conflicts Committee”) of Tallgrass Energy GP, LLC, the general partner of Tallgrass Energy, LP (“TGE” or the “Partnership”), to whom such materials are directly addressed and delivered and may not be used or relied upon for any purpose other than as specifically contemplated by a written agreement with Evercore. These materials are based on information provided by or on behalf of the Partnership and/or other potential transaction participants, from public sources or otherwise reviewed by Evercore. Evercore assumes no responsibility for independent investigation or verification of such information and has relied on such information being complete and accurate in all material respects. To the extent such information includes estimates and forecasts of future financial performance prepared by or reviewed with the management of the Partnership and/or other potential transaction participants or obtained from public sources, Evercore has assumed that such estimates and forecasts have been reasonably prepared on bases reflecting the best currently available estimates and judgments of such management (or, with respect to estimates and forecasts obtained from public sources, represent reasonable estimates). No representation or warranty, express or implied, is made as to the accuracy or completeness of such information and nothing contained herein is, or shall be relied upon as, a representation, whether as to the past, the present or the future. These materials were designed for use by specific persons familiar with the business and affairs of the Partnership . These materials are not intended to provide the sole basis for evaluating, and should not be considered a recommendation with respect to, any transaction or other matter. These materials have been developed by and are proprietary to Evercore and were prepared exclusively for the benefit and internal use of the Conflicts Committee of the Partnership. These materials were compiled on a confidential basis for use by the Conflicts Committee of the Partnership in evaluating the potential transaction described herein and not with a view to public disclosure or filing thereof under state or federal securities laws, and may not be reproduced, disseminated, quoted or referred to, in whole or in part, without the prior written consent of Evercore. These materials do not constitute an offer or solicitation to sell or purchase any securities and are not a commitment by Evercore (or any affiliate) to provide or arrange any financing for any transaction or to purchase any security in connection therewith. Evercore assumes no obligation to update or otherwise revise these materials. These materials may not reflect information known to other professionals in other business areas of Evercore and its affiliates. Evercore and its affiliates do not provide legal, accounting or tax advice. Accordingly, any statements contained herein as to tax matters were neither written nor intended by Evercore or its affiliates to be used and cannot be used by any taxpayer for the purpose of avoiding tax penalties that may be imposed on such taxpayer. Each person should seek legal, accounting and tax advice based on his, her or its particular circumstances from independent advisors regarding the impact of the transactions or matters described herein.
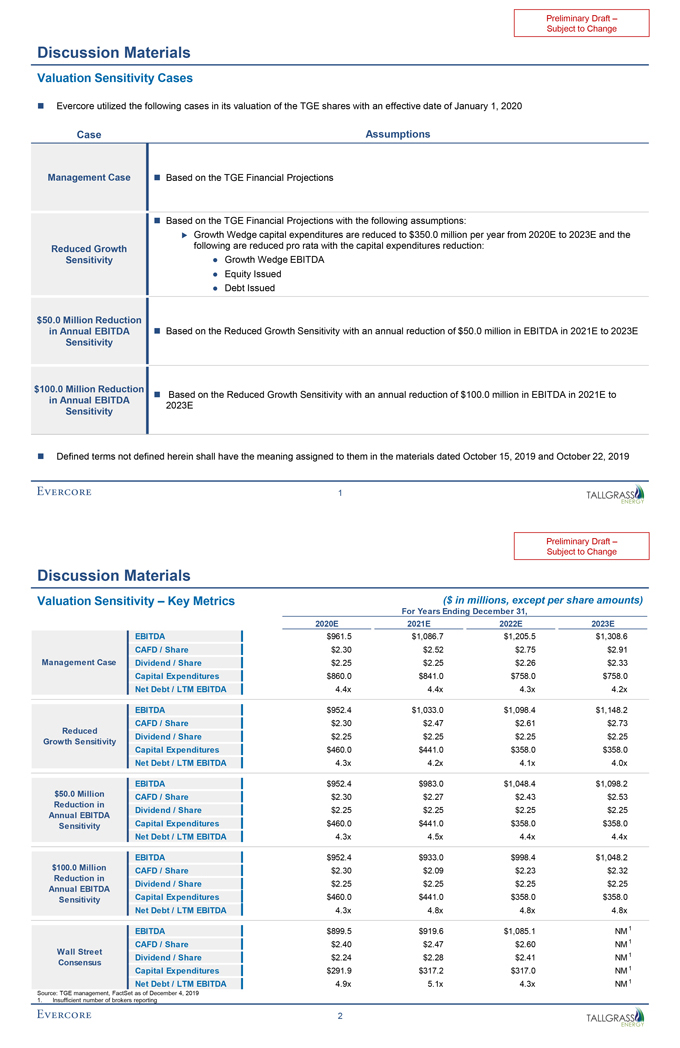
Preliminary Draft – Subject to Change Discussion Materials Valuation Sensitivity Cases ï® Evercore utilized the following cases in its valuation of the TGE shares with an effective date of January 1, 2020 Case Assumptions Management Case ï® Based on the TGE Financial Projections ï® Based on the TGE Financial Projections with the following assumptions: ïµ Growth Wedge capital expenditures are reduced to $350.0 million per year from 2020E to 2023E and the Reduced Growth following are reduced pro rata with the capital expenditures reduction: Sensitivity • Growth Wedge EBITDA • Equity Issued • Debt Issued $50.0 Million Reduction in Annual EBITDA ï® Based on the Reduced Growth Sensitivity with an annual reduction of $50.0 million in EBITDA in 2021E to 2023E Sensitivity $100.0 Million Reduction ï® Based on the Reduced Growth Sensitivity with an annual reduction of $100.0 million in EBITDA in 2021E to in Annual EBITDA 2023E Sensitivity ï® Defined terms not defined herein shall have the meaning assigned to them in the materials dated October 15, 2019 and October 22, 2019 1
Preliminary Draft – Subject to Change Discussion Materials Valuation Sensitivity – Key Metrics ($ in millions, except per share amounts) For Years Ending December 31, 2020E 2021E 2022E 2023E EBITDA $961.5 $1,086.7 $1,205.5 $1,308.6 CAFD / Share $2.30 $2.52 $2.75 $2.91 Management Case Dividend / Share $2.25 $2.25 $2.26 $2.33 Capital Expenditures $860.0 $841.0 $758.0 $758.0 Net Debt / LTM EBITDA 4.4x 4.4x 4.3x 4.2x EBITDA $952.4 $1,033.0 $1,098.4 $1,148.2 Reduced CAFD / Share $2.30 $2.47 $2.61 $2.73 Dividend / Share $2.25 $2.25 $2.25 $2.25 Growth Sensitivity Capital Expenditures $460.0 $441.0 $358.0 $358.0 Net Debt / LTM EBITDA 4.3x 4.2x 4.1x 4.0x EBITDA $952.4 $983.0 $1,048.4 $1,098.2 $50.0 Million CAFD / Share $2.30 $2.27 $2.43 $2.53 Reduction in Dividend / Share $2.25 $2.25 $2.25 $2.25 Annual EBITDA Sensitivity Capital Expenditures $460.0 $441.0 $358.0 $358.0 Net Debt / LTM EBITDA 4.3x 4.5x 4.4x 4.4x EBITDA $952.4 $933.0 $998.4 $1,048.2 $100.0 Million CAFD / Share $2.30 $2.09 $2.23 $2.32 Reduction in Dividend / Share $2.25 $2.25 $2.25 $2.25 Annual EBITDA Sensitivity Capital Expenditures $460.0 $441.0 $358.0 $358.0 Net Debt / LTM EBITDA 4.3x 4.8x 4.8x 4.8x EBITDA $899.5 $919.6 $1,085.1 NM 1 CAFD / Share $2.40 $2.47 $2.60 NM 1 Wall Street 1 Dividend / Share $2.24 $2.28 $2.41 NM Consensus Capital Expenditures $291.9 $317.2 $317.0 NM 1 Net Debt / LTM EBITDA 4.9x 5.1x 4.3x NM 1 Source: TGE management, FactSet as of December 4, 2019 1. Insufficient number of brokers reporting 2
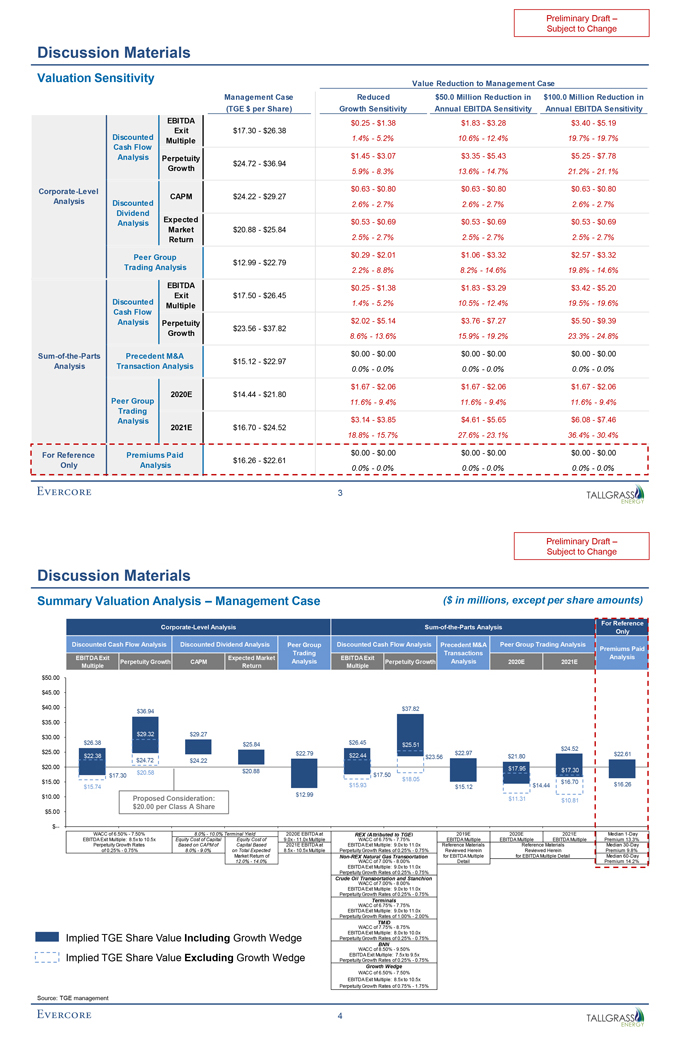
Preliminary Draft – Subject to Change Discussion Materials Valuation Sensitivity Value Reduction to Management Case Management Case Reduced $50.0 Million Reduction in $100.0 Million Reduction in (TGE $ per Share) Growth Sensitivity Annual EBITDA Sensitivity Annual EBITDA Sensitivity EBITDA $0.25—$1.38 $1.83—$3.28 $3.40—$5.19 Discounted Exit $17.30—$26.38 Multiple 1.4%—5.2% 10.6%—12.4% 19.7%—19.7% Cash Flow Analysis Perpetuity $1.45—$3.07 $3.35—$5.43 $5.25—$7.78 $24.72—$36.94 Growth 5.9%—8.3% 13.6%—14.7% 21.2%—21.1% Corporate-Level $0.63—$0.80 $0.63—$0.80 $0.63—$0.80 CAPM $24.22—$29.27 Analysis Discounted 2.6%—2.7% 2.6%—2.7% 2.6%—2.7% Dividend Expected Analysis $0.53—$0.69 $0.53—$0.69 $0.53—$0.69 Market $20.88—$25.84 Return 2.5%—2.7% 2.5%—2.7% 2.5%—2.7% Peer Group $0.29—$2.01 $1.06—$3.32 $2.57—$3.32 $12.99—$22.79 Trading Analysis 2.2%—8.8% 8.2%—14.6% 19.8%—14.6% EBITDA $0.25—$1.38 $1.83—$3.29 $3.42—$5.20 Discounted Exit $17.50—$26.45 Multiple 1.4%—5.2% 10.5%—12.4% 19.5%—19.6% Cash Flow Analysis Perpetuity $2.02—$5.14 $3.76—$7.27 $5.50—$9.39 $23.56—$37.82 Growth 8.6%—13.6% 15.9%—19.2% 23.3%—24.8%Sum-of-the-Parts Precedent M&A $0.00—$0.00 $0.00—$0.00 $0.00—$0.00 $15.12—$22.97 Analysis Transaction Analysis 0.0%—0.0% 0.0%—0.0% 0.0%—0.0% $1.67—$2.06 $1.67—$2.06 $1.67—$2.06 Peer Group 2020E $14.44—$21.80 11.6%—9.4% 11.6%—9.4% 11.6%—9.4% Trading Analysis $3.14—$3.85 $4.61—$5.65 $6.08—$7.46 2021E $16.70—$24.52 18.8%—15.7% 27.6%—23.1% 36.4%—30.4% For Reference Premiums Paid $0.00—$0.00 $0.00—$0.00 $0.00—$0.00 $16.26—$22.61 Only Analysis 0.0%—0.0% 0.0%—0.0% 0.0%—0.0% 3
Preliminary Draft – Subject to Change Discussion Materials Summary Valuation Analysis – Management Case ($ in millions, except per share amounts) For Reference Corporate-Level AnalysisSum-of-the-Parts Analysis Only Discounted Cash Flow Analysis Discounted Dividend Analysis Peer Group Discounted Cash Flow Analysis Precedent M&A Peer Group Trading Analysis Premiums Paid Trading Transactions EBITDA Exit Expected Market EBITDA Exit Analysis Perpetuity Growth CAPM Analysis Perpetuity Growth Analysis 2020E 2021E Multiple Return Multiple $50.00 $45.00 $40.00 $37.82 $36.94 $35.00 $29.32 $29.27 $30.00 $26.45 $26.38 $25.84 $25.51 $24.52 $25.00 $22.79 $22.97 $22.61 $22.38 $24.72 $24.22 $22.44 $23.56 $21.80 $20.00 $17.95 $20.58 $20.88 $17.30 $17.30 $17.50 $18.05 $15.00 $16.70 $16.26 $15.74 $15.93 $15.12 $14.44 $10.00 $12.99 Proposed Consideration: $11.31 $10.81 $5.00 $20.00 per Class A Share $— WACC of 6.50%—7.50% 8.0%—10.0% Terminal Yield 2020E EBITDA at REX (Attributed to TGE) 2019E 2020E 2021E Median1-Day EBITDA Exit Multiple: 8.5x to 10.5x Equity Cost of Capital Equity Cost of 9.0x—11.0x Multiple WACC of 6.75%—7.75% EBITDA Multiple EBITDA Multiple EBITDA Multiple Premium 13.3% Perpetuity Growth Rates Based on CAPM of Capital Based 2021E EBITDA at EBITDA Exit Multiple: 9.0x to 11.0x Reference Materials Reference Materials Median30-Day of 0.25%—0.75% 8.0%—9.0% on Total Expected 8.5x—10.5x Multiple Perpetuity Growth Rates of 0.25%—0.75% Reviewed Herein Reviewed Herein Premium 9.8% Market Return ofNon-REX Natural Gas Transportation for EBITDA Multiple for EBITDA Multiple Detail Median60-Day 12.0%—14.0% WACC of 7.00%—8.00% Detail Premium 14.2% EBITDA Exit Multiple: 9.0x to 11.0x Perpetuity Growth Rates of 0.25%—0.75% Crude Oil Transportation and Stanchion WACC of 7.00%—8.00% EBITDA Exit Multiple: 9.0x to 11.0x Perpetuity Growth Rates of 0.25%—0.75% Terminals WACC of 6.75%—7.75% EBITDA Exit Multiple: 9.0x to 11.0x Perpetuity Growth Rates of 1.00%—2.00% TMID WACC of 7.75%—8.75% EBITDA Exit Multiple: 8.0x to 10.0x Implied TGE Share Value Including Growth Wedge Perpetuity Growth Rates of 0.25%—0.75% BNN WACC of 8.50%—9.50% Implied TGE Share Value Excluding Growth Wedge EBITDA Exit Multiple: 7.5x to 9.5x Perpetuity Growth Rates of 0.25%—0.75% Growth Wedge WACC of 6.50%—7.50% EBITDA Exit Multiple: 8.5x to 10.5x Perpetuity Growth Rates of 0.75%—1.75% Source: TGE management 4
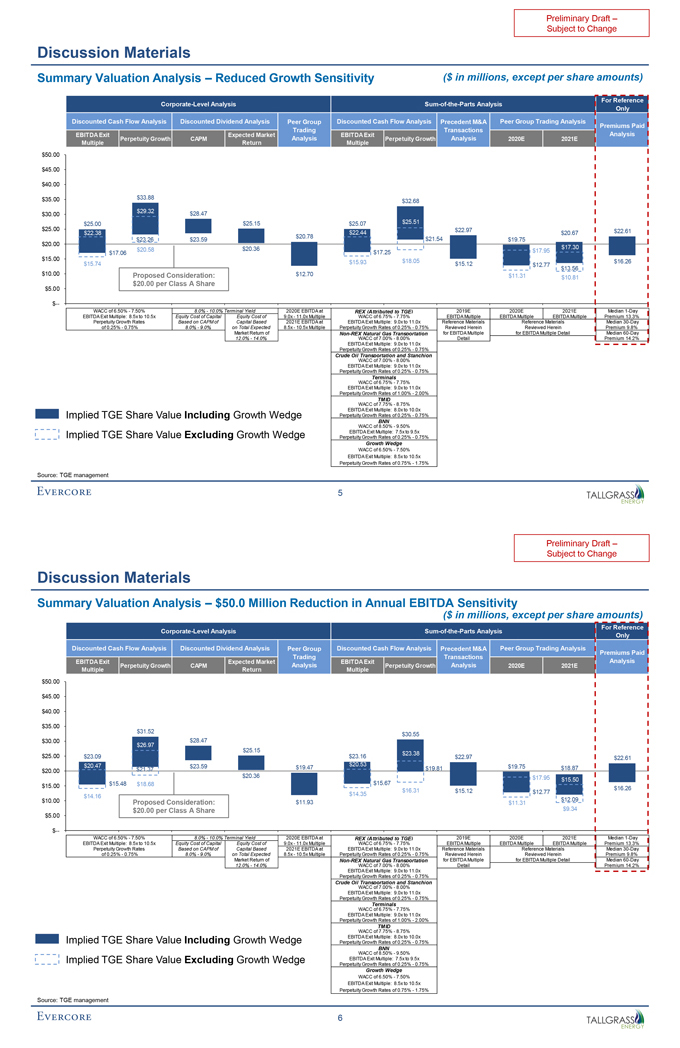
Preliminary Draft – Subject to Change Discussion Materials Summary Valuation Analysis – Reduced Growth Sensitivity ($ in millions, except per share amounts) For Reference Corporate-Level AnalysisSum-of-the-Parts Analysis Only Discounted Cash Flow Analysis Discounted Dividend Analysis Peer Group Discounted Cash Flow Analysis Precedent M&A Peer Group Trading Analysis Premiums Paid Trading Transactions EBITDA Exit Expected Market EBITDA Exit Analysis Perpetuity Growth CAPM Analysis Perpetuity Growth Analysis 2020E 2021E Multiple Return Multiple $50.00 $45.00 $40.00 $35.00 $33.88 $32.68 $29.32 $28.47 $30.00 $25.00 $25.15 $25.07 $25.51 $25.00 $22.97 $22.61 $22.38 $22.44 $20.67 $20.78 $21.54 $23.26 $23.59 $19.75 $20.00 $20.58 $20.36 $17.30 $17.06 $17.25 $17.95 $15.00 $18.05 $16.26 $15.74 $15.93 $15.12 $12.77 $10.00 $13.56 Proposed Consideration: $12.70 $11.31 $10.81 $5.00 $20.00 per Class A Share $— WACC of 6.50%—7.50% 8.0%—10.0% Terminal Yield 2020E EBITDA at REX (Attributed to TGE) 2019E 2020E 2021E Median1-Day EBITDA Exit Multiple: 8.5x to 10.5x Equity Cost of Capital Equity Cost of 9.0x—11.0x Multiple WACC of 6.75%—7.75% EBITDA Multiple EBITDA Multiple EBITDA Multiple Premium 13.3% Perpetuity Growth Rates Based on CAPM of Capital Based 2021E EBITDA at EBITDA Exit Multiple: 9.0x to 11.0x Reference Materials Reference Materials Median30-Day of 0.25%—0.75% 8.0%—9.0% on Total Expected 8.5x—10.5x Multiple Perpetuity Growth Rates of 0.25%—0.75% Reviewed Herein Reviewed Herein Premium 9.8% Market Return ofNon-REX Natural Gas Transportation for EBITDA Multiple for EBITDA Multiple Detail Median60-Day 12.0%—14.0% WACC of 7.00%—8.00% Detail Premium 14.2% EBITDA Exit Multiple: 9.0x to 11.0x Perpetuity Growth Rates of 0.25%—0.75% Crude Oil Transportation and Stanchion WACC of 7.00%—8.00% EBITDA Exit Multiple: 9.0x to 11.0x Perpetuity Growth Rates of 0.25%—0.75% Terminals WACC of 6.75%—7.75% EBITDA Exit Multiple: 9.0x to 11.0x Perpetuity Growth Rates of 1.00%—2.00% TMID WACC of 7.75%—8.75% EBITDA Exit Multiple: 8.0x to 10.0x Implied TGE Share Value Including Growth Wedge Perpetuity Growth Rates of 0.25%—0.75% BNN WACC of 8.50%—9.50% Implied TGE Share Value Excluding Growth Wedge EBITDA Exit Multiple: 7.5x to 9.5x Perpetuity Growth Rates of 0.25%—0.75% Growth Wedge WACC of 6.50%—7.50% EBITDA Exit Multiple: 8.5x to 10.5x Perpetuity Growth Rates of 0.75%—1.75% Source: TGE management 5
Preliminary Draft – Subject to Change Discussion Materials Summary Valuation Analysis – $50.0 Million Reduction in Annual EBITDA Sensitivity ($ in millions, except per share amounts) For Reference Corporate-Level AnalysisSum-of-the-Parts Analysis Only Discounted Cash Flow Analysis Discounted Dividend Analysis Peer Group Discounted Cash Flow Analysis Precedent M&A Peer Group Trading Analysis Premiums Paid Trading Transactions EBITDA Exit Expected Market EBITDA Exit Analysis Perpetuity Growth CAPM Analysis Perpetuity Growth Analysis 2020E 2021E Multiple Return Multiple $50.00 $45.00 $40.00 $35.00 $31.52 $30.55 $30.00 $28.47 $26.97 $25.15 $25.00 $23.38 $23.09 $23.16 $22.97 $22.61 $20.47 $23.59 $20.53 $19.75 $21.37 $19.47 $19.81 $18.87 $20.00 $20.36 $15.67 $17.95 $15.50 $15.00 $15.48 $18.68 $16.31 $16.26 $15.12 $12.77 $14.16 $14.35 $10.00 $12.09 Proposed Consideration: $11.93 $11.31 $20.00 per Class A Share $9.34 $5.00 $— WACC of 6.50%—7.50% 8.0%—10.0% Terminal Yield 2020E EBITDA at REX (Attributed to TGE) 2019E 2020E 2021E Median1-Day EBITDA Exit Multiple: 8.5x to 10.5x Equity Cost of Capital Equity Cost of 9.0x—11.0x Multiple WACC of 6.75%—7.75% EBITDA Multiple EBITDA Multiple EBITDA Multiple Premium 13.3% Perpetuity Growth Rates Based on CAPM of Capital Based 2021E EBITDA at EBITDA Exit Multiple: 9.0x to 11.0x Reference Materials Reference Materials Median30-Day of 0.25%—0.75% 8.0%—9.0% on Total Expected 8.5x—10.5x Multiple Perpetuity Growth Rates of 0.25%—0.75% Reviewed Herein Reviewed Herein Premium 9.8% Market Return ofNon-REX Natural Gas Transportation for EBITDA Multiple for EBITDA Multiple Detail Median60-Day 12.0%—14.0% WACC of 7.00%—8.00% Detail Premium 14.2% EBITDA Exit Multiple: 9.0x to 11.0x Perpetuity Growth Rates of 0.25%—0.75% Crude Oil Transportation and Stanchion WACC of 7.00%—8.00% EBITDA Exit Multiple: 9.0x to 11.0x Perpetuity Growth Rates of 0.25%—0.75% Terminals WACC of 6.75%—7.75% EBITDA Exit Multiple: 9.0x to 11.0x Perpetuity Growth Rates of 1.00%—2.00% TMID WACC of 7.75%—8.75% Implied TGE Share Value Including Growth Wedge EBITDA Exit Multiple: 8.0x to 10.0x Perpetuity Growth Rates of 0.25%—0.75% BNN WACC of 8.50%—9.50% Implied TGE Share Value Excluding Growth Wedge EBITDA Exit Multiple: 7.5x to 9.5x Perpetuity Growth Rates of 0.25%—0.75% Growth Wedge WACC of 6.50%—7.50% EBITDA Exit Multiple: 8.5x to 10.5x Perpetuity Growth Rates of 0.75%—1.75% Source: TGE management 6
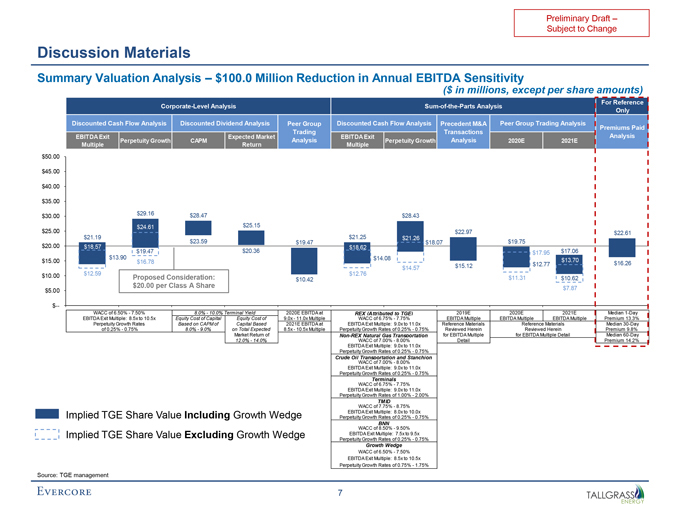
Preliminary Draft – Subject to Change Discussion Materials Summary Valuation Analysis – $100.0 Million Reduction in Annual EBITDA Sensitivity ($ in millions, except per share amounts) For Reference Corporate-Level AnalysisSum-of-the-Parts Analysis Only Discounted Cash Flow Analysis Discounted Dividend Analysis Peer Group Discounted Cash Flow Analysis Precedent M&A Peer Group Trading Analysis Premiums Paid Trading Transactions EBITDA Exit Expected Market EBITDA Exit Analysis Perpetuity Growth CAPM Analysis Perpetuity Growth Analysis 2020E 2021E Multiple Return Multiple $50.00 $45.00 $40.00 $35.00 $29.16 $28.47 $28.43 $30.00 $24.61 $25.15 $25.00 $22.97 $22.61 $21.19 $21.25 $21.26 $23.59 $19.47 $18.07 $19.75 $20.00 $18.57 $19.47 $20.36 $18.62 $17.06 $13.90 $17.95 $15.00 $14.08 $13.70 $16.78 $12.77 $16.26 $14.57 $15.12 $10.00 $12.59 $12.76 Proposed Consideration: $10.42 $11.31 $10.62 $5.00 $20.00 per Class A Share $7.87 $— WACC of 6.50%—7.50% 8.0%—10.0% Terminal Yield 2020E EBITDA at REX (Attributed to TGE) 2019E 2020E 2021E Median1-Day EBITDA Exit Multiple: 8.5x to 10.5x Equity Cost of Capital Equity Cost of 9.0x—11.0x Multiple WACC of 6.75%—7.75% EBITDA Multiple EBITDA Multiple EBITDA Multiple Premium 13.3% Perpetuity Growth Rates Based on CAPM of Capital Based 2021E EBITDA at EBITDA Exit Multiple: 9.0x to 11.0x Reference Materials Reference Materials Median30-Day of 0.25%—0.75% 8.0%—9.0% on Total Expected 8.5x—10.5x Multiple Perpetuity Growth Rates of 0.25%—0.75% Reviewed Herein Reviewed Herein Premium 9.8% Market Return ofNon-REX Natural Gas Transportation for EBITDA Multiple for EBITDA Multiple Detail Median60-Day 12.0%—14.0% WACC of 7.00%—8.00% Detail Premium 14.2% EBITDA Exit Multiple: 9.0x to 11.0x Perpetuity Growth Rates of 0.25%—0.75% Crude Oil Transportation and Stanchion WACC of 7.00%—8.00% EBITDA Exit Multiple: 9.0x to 11.0x Perpetuity Growth Rates of 0.25%—0.75% Terminals WACC of 6.75%—7.75% EBITDA Exit Multiple: 9.0x to 11.0x Perpetuity Growth Rates of 1.00%—2.00% TMID WACC of 7.75%—8.75% Implied TGE Share Value Including Growth Wedge EBITDA Exit Multiple: 8.0x to 10.0x Perpetuity Growth Rates of 0.25%—0.75% BNN WACC of 8.50%—9.50% Implied TGE Share Value Excluding Growth Wedge EBITDA Exit Multiple: 7.5x to 9.5x Perpetuity Growth Rates of 0.25%—0.75% Growth Wedge WACC of 6.50%—7.50% EBITDA Exit Multiple: 8.5x to 10.5x Perpetuity Growth Rates of 0.75%—1.75% Source: TGE management 7