Exhibit (c)(6)
Preliminary Draft –Subject to Change The Conflicts Committee of the Board of Directors of Tallgrass Energy GP, LLC Discussion Materials December 16, 2019
Preliminary Draft –Subject to Change Table of Contents Section Executive Summary I TGE Situation Analysis II Overview of TGE III Valuation of TGE Shares IV A. Historical Growth Capital Expenditure Case B. TGE Financial Projections Appendix A. Weighted Average Cost of Capital B. TGE Shareholder Tax Impact C. Overview of TGE by Business Segment
Preliminary Draft –Subject to Change These materials have been prepared by Evercore Group L.L.C. (“Evercore”) for the Conflicts Committee of the Board of Directors (the “Conflicts Committee”) of Tallgrass Energy GP, LLC, the general partner of Tallgrass Energy, LP (“TGE” or the “Partnership”), to whom such materials are directly addressed and delivered and may not be used or relied upon for any purpose other than as specifically contemplated by a written agreement with Evercore. These materials are based on information provided by or on behalf of the Partnership and/or other potential transaction participants, from public sources or otherwise reviewed by Evercore. Evercore assumes no responsibility for independent investigation or verification of such information and has relied on such information being complete and accurate in all material respects. To the extent such information includes estimates and forecasts of future financial performance prepared by or reviewed with the management of the Partnership and/or other potential transaction participants or obtained from public sources, Evercore has assumed that such estimates and forecasts have been reasonably prepared on bases reflecting the best currently available estimates and judgments of such management (or, with respect to estimates and forecasts obtained from public sources, represent reasonable estimates). No representation or warranty, express or implied, is made as to the accuracy or completeness of such information and nothing contained herein is, or shall be relied upon as, a representation, whether as to the past, the present or the future. These materials were designed for use by specific persons familiar with the business and affairs of the Partnership . These materials are not intended to provide the sole basis for evaluating, and should not be considered a recommendation with respect to, any transaction or other matter. These materials have been developed by and are proprietary to Evercore and were prepared exclusively for the benefit and internal use of the Conflicts Committee of the Partnership. These materials were compiled on a confidential basis for use by the Conflicts Committee of the Partnership in evaluating the potential transaction described herein and not with a view to public disclosure or filing thereof under state or federal securities laws, and may not be reproduced, disseminated, quoted or referred to, in whole or in part, without the prior written consent of Evercore. These materials do not constitute an offer or solicitation to sell or purchase any securities and are not a commitment by Evercore (or any affiliate) to provide or arrange any financing for any transaction or to purchase any security in connection therewith. Evercore assumes no obligation to update or otherwise revise these materials. These materials may not reflect information known to other professionals in other business areas of Evercore and its affiliates. Evercore and its affiliates do not provide legal, accounting or tax advice. Accordingly, any statements contained herein as to tax matters were neither written nor intended by Evercore or its affiliates to be used and cannot be used by any taxpayer for the purpose of avoiding tax penalties that may be imposed on such taxpayer. Each person should seek legal, accounting and tax advice based on his, her or its particular circumstances from independent advisors regarding the impact of the transactions or matters described herein.
Preliminary Draft –Subject to Change I. Executive Summary
Preliminary Draft –Subject to Change Executive Summary Overview of the Materials ï® Evercore Group L.L.C. (“Evercore”) is pleased to provide the materials herein to the Conflicts Committee of the Board of Directors (the “Conflicts Committee”) of Tallgrass Energy GP, LLC (“TGE GP” or the “General Partner”), the general partner of Tallgrass Energy, LP (“Tallgrass”, “TGE” or the “Partnership”), regarding the proposed acquisition by Blackstone Infrastructure Partners (“Blackstone” or “BIP”), its partners and respective affiliates (collectively, the “Blackstone Consortium”) of all Class A shares representing limited partner interests in the Partnership (each, a “Class A Share”) from the current holders of such shares other than Class A Shares held by the Blackstone Consortium, the General Partner or their respective affiliates (the “Proposed Transaction”), in exchange for $22.45 in cash per Class A Share (the “Proposed Consideration”) ï,„ The Proposed Consideration represents a 56.4% premium to the closing price of $14.35 per Class A Share on August 27, 2019, the day of the Blackstone Consortium’s original offer of $19.50 per Class A Share (the “Initial Offer”), a 22.7% premium to TGE’s30-day volume-weighted average price (“VWAP”), a 13.4% premium to TGE’s60-day VWAP and an 8.2% premium to TGE’s90-day VWAP as of August 27, 2019 • The Proposed Consideration represents a 15.1% increase from the Initial Offer ï® The materials herein review the Proposed Transaction, including the following: ï,„ An executive summary, including an overview of the Proposed Transaction detailing summary proposed terms, an overview of the Partnership’s current summary organizational structure and ownership and certain agreements with TGE management, an analysis of financial metrics implied by the Proposed Transaction, changes since the December 8, 2019 materials presented to the Conflicts Committee and a review of Evercore’s evaluation process ï,„ An overview of TGE’s current market situation ï,„ An overview of TGE including: (i) a review of the financial projections for TGE as provided by TGE management (the “TGE Financial Projections”) and (ii) a review of financial projections for TGE based on the TGE Financial Projections assuming $350.0 million of annual growth capital expenditures (the “Historical Growth Capital Expenditure Case”) ï,„ A valuation of the TGE shares ï,„ In the Appendix, a review of TGE’s weighted average cost of capital, the potential tax impact of the Proposed Transaction to TGE shareholders and a review of TGE’s assets by segment 1
Preliminary Draft –Subject to Change Executive Summary Overview of Proposed Transaction Evercore has been asked by the Conflicts Committee, whether, in Evercore’s opinion, as of the date of the Opinion opinion, the Proposed Consideration is fair, from a financial point of view, to the unaffiliated holders of Requested: Class A Shares ï® Tallgrass Energy, LP Counterparties ï® Blackstone Infrastructure Partners, its partners and respective affiliates ï® The Blackstone Consortium proposes to acquire all publicly owned Class A Shares from the holders of Proposed such shares other than the Blackstone Consortium, the General Partner or their respective affiliates Transaction ï® TGE will cease to be publicly traded Summary be suspended and will not ï® The dividend with respect to the quarter ending December 31, 2019 will be paid if the Proposed Transaction closes ï® Holders of Class A Shares other than the Blackstone Consortium, the General Partner and their Consideration respective affiliates (the “Unaffiliated Class A Shareholders”) will receive $22.45 in cash for each Class A Share held ï® Requires approval of the Conflicts Committee ï® Requires approval from over 50.0% of TGE shareholders, including both Class A Shares and the Class B shares, which hold 100% of the voting power of Tallgrass Energy Holdings, LLC and are exchangeable, together with an equivalent number of Tallgrass Equity, LLC (“Tallgrass Equity”) units, Timing and Approvals for Class A Shares (the “Class B Shares”), owned by the Blackstone Consortium, TGE management and their respective affiliatesï® The Blackstone Consortium owns 100% of the membership interest in Tallgrass Energy Holdings, LLC ï® Requires a minimum of 7.6% of the Unaffiliated Class A Shareholders to approve Otherï® The Proposed Transaction is structured to be taxable to the Unaffiliated Class A Shareholders Source: TGE management and company filings 2
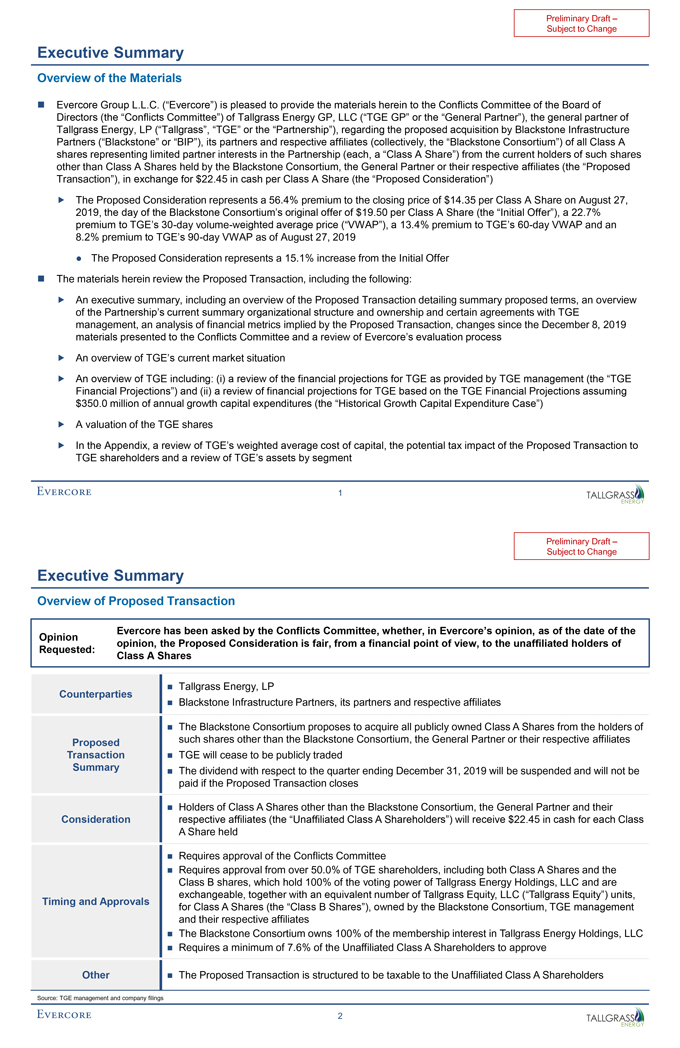
Preliminary Draft –Subject to Change Executive Summary Summary TGE Organizational Structure Blackstone 100% Tallgrass Energy Holdings, LLC 2 Membership Consortium Interest (“Holdings”) TGE Public Investors 100% Membership Interest Tallgrass Energy GP, LLC 23,652,463 Class A Shares 100,655,121 Class B Shares TGE Management General Partner Interest: 152,334,868 Class A Shares 124,307,584 Total Shares (“Management Not entitled to distributions from TGE 54.15% TGE interest 44.19% TGE interest Member”)2,3 Tallgrass Energy, LP (“TGE”) Market Cap1: $5,145.6 million 3,210,085 Class A Shares 1 1,481,754 Class B Shares Net Debt : $3,435.3 million Credit Rating: BB+ / Ba2 4,691,839 Total Shares 1.67% TGE interest 179,197,416 Tallgrass Equity Units Proposed Target Entity 63.70% controlling and economic interest 102,136,875 Tallgrass Equity Units 36.30%non-controlling and Tallgrass Equity, LLC economic interest (“Tallgrass Equity”) 100% Limited Partner Interest Tallgrass Energy Partners, LP (“TEP”) Tallgrass Energy Finance Corp. Tallgrass MLP Operations, LLC Natural Gas Transportation Crude Oil Transportation Gathering, Processing and Terminalling 100% 100% 75% 100% 100% 100% 100% 100% 100% 100% 100% TIGT TPC REX Tallgrass Tallgrass PXP PRG TMID Tallgrass BNN Stanchion Trailblazer Rockies NatGas Operations, Terminals Stanchion Tallgrass Tallgrass Pony Powder River Tallgrass BNN Water Interstate Gas Pipeline Express Tallgrass LLC Express Gateway, LLC Midstream, Solutions, LLC Energy, LLC Tallgrass Transmission, Company LLC Pipeline, LLC NatGas LLC Pipeline, LLC Terminals, LLC LLC Operator, LLC Source: FactSet and company filings 1. Market data as of December 16, 2019 2. Limited Voting Rights, Exchange Right: One Tallgrass Equity unit and one Class B Share exchangeable for one Class A Share 3. Class B Shares redeemed from Tallgrass KC, LLC by TGE management following Blackstone’s acquisition of TGE interest held by Kelso & Co., The Energy & Minerals Group and Tallgrass KC, LLC announced on January 31, 2019 3
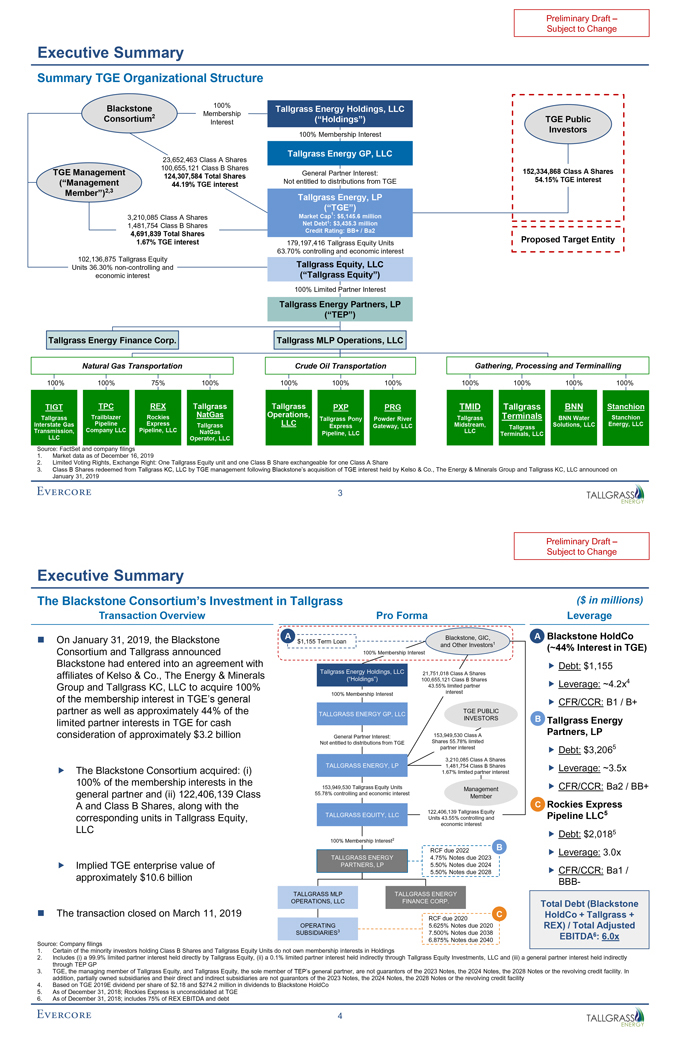
Preliminary Draft –Subject to Change Executive Summary The Blackstone Consortium’s Investment in Tallgrass ($ in millions) Transaction Overview Pro Forma Leverage ï® On January 31, 2019, the Blackstone A Blackstone, GIC, Aï® Blackstone HoldCo $1,155 Term Loan 1 and Other Investors (~44% Interest in TGE) Consortium and Tallgrass announced 100% Membership Interest Blackstone had entered into an agreement with ï,„ Debt: $1,155 affiliates of Kelso & Co., The Energy & Minerals Tallgrass Energy Holdings, LLC 21,751,018 Class A Shares (“Holdings”) 100,655,121 Class B Shares 4 Group and Tallgrass KC, LLC to acquire 100% 43.55% limited partner ï,„ Leverage: ~4.2x of the membership interest in TGE’s general 100% Membership Interest interest ï,„ CFR/CCR: B1 / B+ partner as well as approximately 44% of the TGE PUBLIC TALLGRASS ENERGY GP, LLC limited partner interests in TGE for cash INVESTORS Bï® Tallgrass Energy consideration of approximately $3.2 billion 153,949,530 Class A Partners, LP General Partner Interest: Shares 55.78% limited Not entitled to distributions from TGE partner interestï,„ Debt: $3,2065 3,210,085 Class A Shares ï,„ The Blackstone Consortium acquired: (i) TALLGRASS ENERGY, LP 1,481,754 Class B Sharesï,„ Leverage: ~3.5x 1.67% limited partner interest 100% of the membership interests in the 153,949,530 Tallgrass Equity Units Managementï,„ CFR/CCR: Ba2 / BB+ general partner and (ii) 122,406,139 Class 55.78% controlling and economic interest Member A and Class B Shares, along with the Cï® Rockies Express 122,406,139 Tallgrass Equity 5 TALLGRASS EQUITY, LLC Pipeline LLC corresponding units in Tallgrass Equity, Units 43.55% controlling and economic interest LLC 5 2ï,„ Debt: $2,018 100% Membership Interest B RCF due 2022ï,„ Leverage: 3.0x TALLGRASS ENERGY 4.75% Notes due 2023ï,„ Implied TGE enterprise value of PARTNERS, LP 5.50% Notes due 2024 5.50% Notes due 2028ï,„ CFR/CCR: Ba1 / approximately $10.6 billionBBB- TALLGRASS MLP TALLGRASS ENERGY OPERATIONS, LLC FINANCE CORP. Total Debt (Blackstone ï® The transaction closed on March 11, 2019 C HoldCo + Tallgrass + RCF due 2020 OPERATING 5.625% Notes due 2020 REX) / Total Adjusted SUBSIDIARIES3 7.500% Notes due 2038 6.875% Notes due 2040 EBITDA6: 6.0x Source: Company filings 1. Certain of the minority investors holding Class B Shares and Tallgrass Equity Units do not own membership interests in Holdings 2. Includes (i) a 99.9% limited partner interest held directly by Tallgrass Equity, (ii) a 0.1% limited partner interest held indirectly through Tallgrass Equity Investments, LLC and (iii) a general partner interest held indirectly through TEP GP 3. TGE, the managing member of Tallgrass Equity, and Tallgrass Equity, the sole member of TEP’s general partner, are not guarantors of the 2023 Notes, the 2024 Notes, the 2028 Notes or the revolving credit facility. In addition, partially owned subsidiaries and their direct and indirect subsidiaries are not guarantors of the 2023 Notes, the 2024 Notes, the 2028 Notes or the revolving credit facility 4. Based on TGE 2019E dividend per share of $2.18 and $274.2 million in dividends to Blackstone HoldCo 5. As of December 31, 2018; Rockies Express is unconsolidated at TGE 6. As of December 31, 2018; includes 75% of REX EBITDA and debt 4
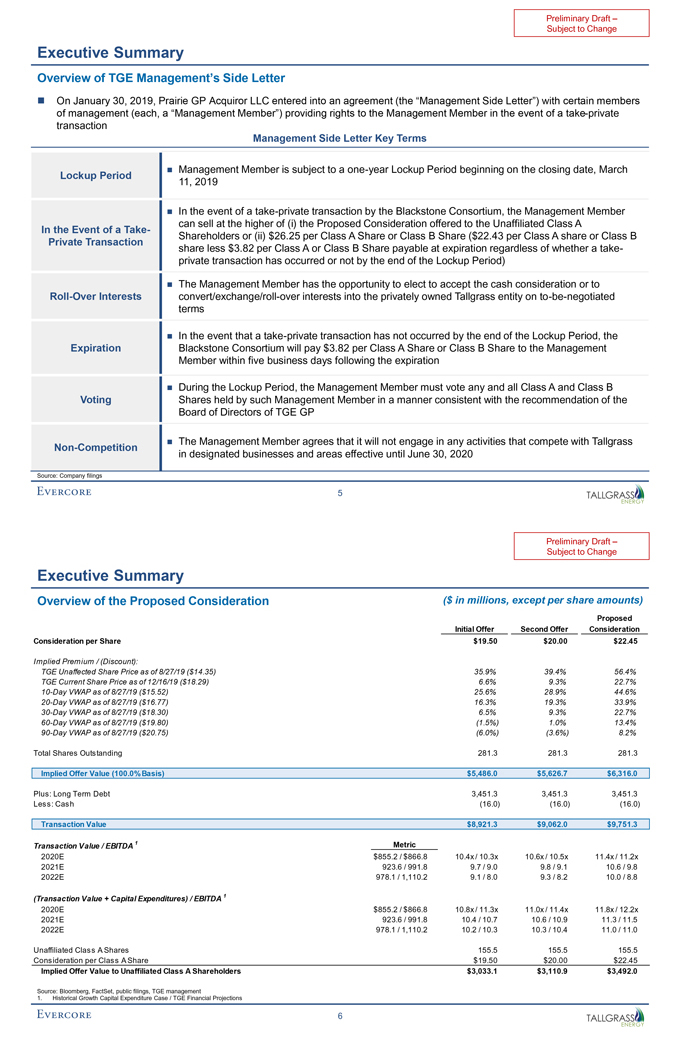
Preliminary Draft –Subject to Change Executive Summary Overview of TGE Management’s Side Letter ï® On January 30, 2019, Prairie GP Acquiror LLC entered into an agreement (the “Management Side Letter”) with certain members of management (each, a “Management Member”) providing rights to the Management Member in the event of a take-private transaction Management Side Letter Key Terms ï® Management Member is subject to aone-year Lockup Period beginning on the closing date, March Lockup Period 11, 2019 ï® In the event of a take-private transaction by the Blackstone Consortium, the Management Member can sell at the higher of (i) the Proposed Consideration offered to the Unaffiliated Class A In the Event of a Take- Shareholders or (ii) $26.25 per Class A Share or Class B Share ($22.43 per Class A share or Class B Private Transaction share less $3.82 per Class A or Class B Share payable at expiration regardless of whether a take-private transaction has occurred or not by the end of the Lockup Period) ï® The Management Member has the opportunity to elect to accept the cash consideration or to Roll-Over Interests convert/exchange/roll-over interests into the privately owned Tallgrass entity onto-be-negotiated terms ï® In the event that a take-private transaction has not occurred by the end of the Lockup Period, the Expiration Blackstone Consortium will pay $3.82 per Class A Share or Class B Share to the Management Member within five business days following the expiration ï® During the Lockup Period, the Management Member must vote any and all Class A and Class B Voting Shares held by such Management Member in a manner consistent with the recommendation of the Board of Directors of TGE GP ï® The Management Member agrees that it will not engage in any activities that compete with TallgrassNon-Competition in designated businesses and areas effective until June 30, 2020 Source: Company filings 5
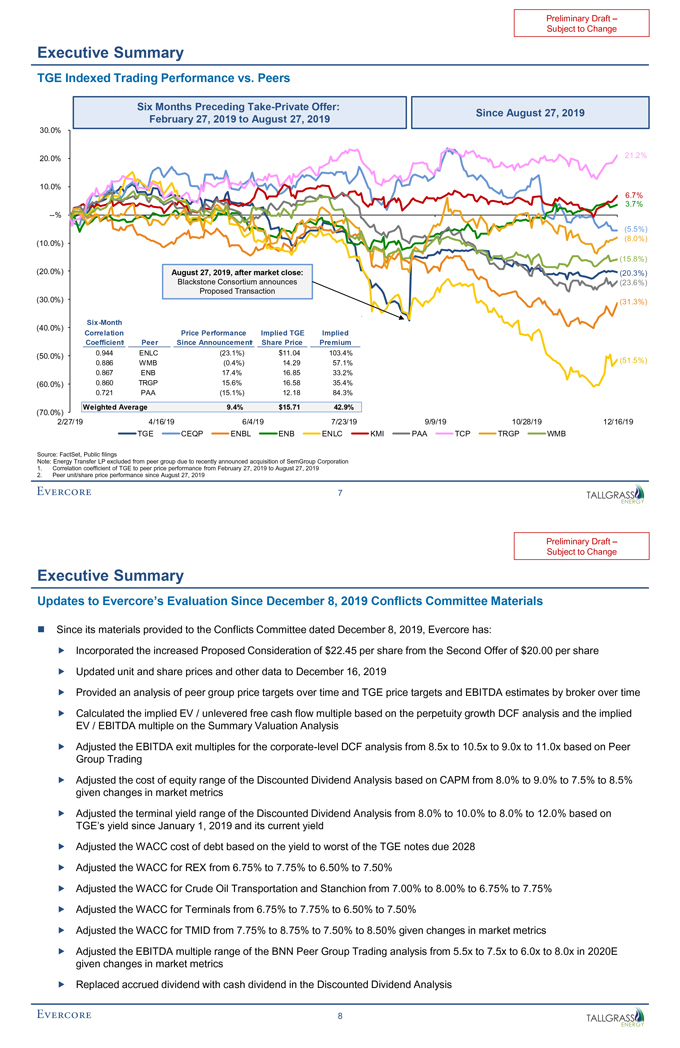
Preliminary Draft –Subject to Change Executive Summary Overview of the Proposed Consideration ($ in millions, except per share amounts) Proposed Initial Offer Second Offer Consideration Consideration per Share $19.50 $20.00 $22.45 Implied Premium / (Discount): TGE Unaffected Share Price as of 8/27/19 ($14.35) 35.9% 39.4% 56.4% TGE Current Share Price as of 12/16/19 ($18.29) 6.6% 9.3% 22.7%10-Day VWAP as of 8/27/19 ($15.52) 25.6% 28.9% 44.6%20-Day VWAP as of 8/27/19 ($16.77) 16.3% 19.3% 33.9%30-Day VWAP as of 8/27/19 ($18.30) 6.5% 9.3% 22.7%60-Day VWAP as of 8/27/19 ($19.80) (1.5%) 1.0% 13.4%90-Day VWAP as of 8/27/19 ($20.75) (6.0%) (3.6%) 8.2% Total Shares Outstanding 281.3 281.3 281.3 Implied Offer Value (100.0% Basis) $5,486.0 $5,626.7 $6,316.0 Plus: Long Term Debt 3,451.3 3,451.3 3,451.3 Less: Cash (16.0) (16.0) (16.0) Transaction Value $8,921.3 $9,062.0 $9,751.3 Transaction Value / EBITDA 1 Metric 2020E $855.2 / $866.8 10.4x / 10.3x 10.6x / 10.5x 11.4x / 11.2x 2021E 923.6 / 991.8 9.7 / 9.0 9.8 / 9.1 10.6 / 9.8 2022E 978.1 / 1,110.2 9.1 / 8.0 9.3 / 8.2 10.0 / 8.8 (Transaction Value + Capital Expenditures) / EBITDA 1 2020E $855.2 / $866.8 10.8x / 11.3x 11.0x / 11.4x 11.8x / 12.2x 2021E 923.6 / 991.8 10.4 / 10.7 10.6 / 10.9 11.3 / 11.5 2022E 978.1 / 1,110.2 10.2 / 10.3 10.3 / 10.4 11.0 / 11.0 Unaffiliated Class A Shares 155.5 155.5 155.5 Consideration per Class A Share $19.50 $20.00 $22.45 Implied Offer Value to Unaffiliated Class A Shareholders $3,033.1 $3,110.9 $3,492.0 Source: Bloomberg, FactSet, public filings, TGE management 1. Historical Growth Capital Expenditure Case / TGE Financial Projections 6
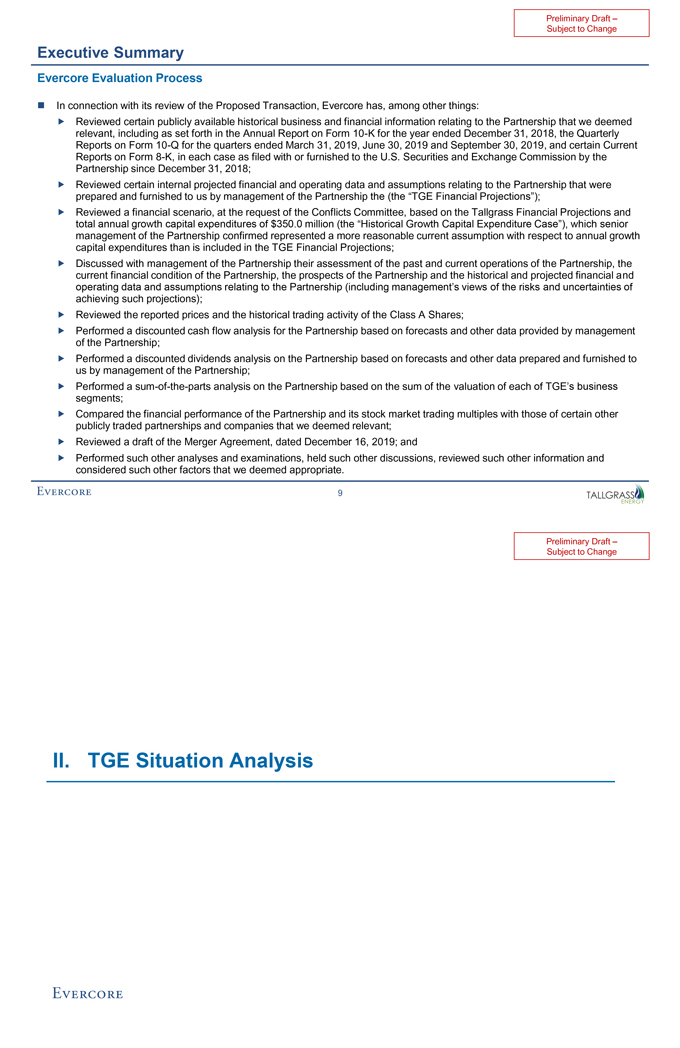
Preliminary Draft –Subject to Change Executive Summary TGE Indexed Trading Performance vs. Peers Six Months Preceding Take-Private Offer: Since August 27, 2019 February 27, 2019 to August 27, 2019 30.0% 20.0% 21.2% 10.0% 6.7% 3.7% —% (5.5%) (8.0%) (10.0%) (15.8%) (20.0%) August 27, 2019, after market close: (20.3%) Blackstone Consortium announces (23.6%) Proposed Transaction (30.0%) (31.3%)Six-Month (40.0%) Correlation Price Performance Implied TGE Implied Coefficient1 Peer Since Announcement2 Share Price Premium (50.0%) 0.944 ENLC (23.1%) $11.04 103.4% 0.886 WMB (0.4%) 14.29 57.1% (51.5%) 0.867 ENB 17.4% 16.85 33.2% (60.0%) 0.860 TRGP 15.6% 16.58 35.4% 0.721 PAA (15.1%) 12.18 84.3% Weighted Average 9.4% $15.71 42.9% (70.0%) 2/27/19 4/16/19 6/4/19 7/23/19 9/9/19 10/28/19 12/16/19 TGE CEQP ENBL ENB ENLC KMI PAA TCP TRGP WMB Source: FactSet, Public filings Note: Energy Transfer LP excluded from peer group due to recently announced acquisition of SemGroup Corporation 1. Correlation coefficient of TGE to peer price performance from February 27, 2019 to August 27, 2019 2. Peer unit/share price performance since August 27, 2019 7
Preliminary Draft –Subject to Change Executive Summary Updates to Evercore’s Evaluation Since December 8, 2019 Conflicts Committee Materials ï® Since its materials provided to the Conflicts Committee dated December 8, 2019, Evercore has: ï,„ Incorporated the increased Proposed Consideration of $22.45 per share from the Second Offer of $20.00 per shareï,„ Updated unit and share prices and other data to December 16, 2019 ï,„ Provided an analysis of peer group price targets over time and TGE price targets and EBITDA estimates by broker over timeï,„ Calculated the implied EV / unlevered free cash flow multiple based on the perpetuity growth DCF analysis and the implied EV / EBITDA multiple on the Summary Valuation Analysis ï,„ Adjusted the EBITDA exit multiples for the corporate-level DCF analysis from 8.5x to 10.5x to 9.0x to 11.0x based on Peer Group Trading ï,„ Adjusted the cost of equity range of the Discounted Dividend Analysis based on CAPM from 8.0% to 9.0% to 7.5% to 8.5% given changes in market metrics ï,„ Adjusted the terminal yield range of the Discounted Dividend Analysis from 8.0% to 10.0% to 8.0% to 12.0% based on TGE’s yield since January 1, 2019 and its current yield ï,„ Adjusted the WACC cost of debt based on the yield to worst of the TGE notes due 2028ï,„ Adjusted the WACC for REX from 6.75% to 7.75% to 6.50% to 7.50% ï,„ Adjusted the WACC for Crude Oil Transportation and Stanchion from 7.00% to 8.00% to 6.75% to 7.75%ï,„ Adjusted the WACC for Terminals from 6.75% to 7.75% to 6.50% to 7.50%ï,„ Adjusted the WACC for TMID from 7.75% to 8.75% to 7.50% to 8.50% given changes in market metrics ï,„ Adjusted the EBITDA multiple range of the BNN Peer Group Trading analysis from 5.5x to 7.5x to 6.0x to 8.0x in 2020E given changes in market metrics ï,„ Replaced accrued dividend with cash dividend in the Discounted Dividend Analysis 8
Preliminary Draft –Subject to Change Executive Summary Evercore Evaluation Process ï® In connection with its review of the Proposed Transaction, Evercore has, among other things: ï,„ Reviewed certain publicly available historical business and financial information relating to the Partnership that we deemed relevant, including as set forth in the Annual Report on Form10-K for the year ended December 31, 2018, the Quarterly Reports on Form10-Q for the quarters ended March 31, 2019, June 30, 2019 and September 30, 2019, and certain Current Reports on Form8-K, in each case as filed with or furnished to the U.S. Securities and Exchange Commission by the Partnership since December 31, 2018; ï,„ Reviewed certain internal projected financial and operating data and assumptions relating to the Partnership that were prepared and furnished to us by management of the Partnership the (the “TGE Financial Projections”);ï,„ Reviewed a financial scenario, at the request of the Conflicts Committee, based on the Tallgrass Financial Projections and total annual growth capital expenditures of $350.0 million (the “Historical Growth Capital Expenditure Case”), which senior management of the Partnership confirmed represented a more reasonable current assumption with respect to annual growth capital expenditures than is included in the TGE Financial Projections; ï,„ Discussed with management of the Partnership their assessment of the past and current operations of the Partnership, the current financial condition of the Partnership, the prospects of the Partnership and the historical and projected financial and operating data and assumptions relating to the Partnership (including management’s views of the risks and uncertainties of achieving such projections); ï,„ Reviewed the reported prices and the historical trading activity of the Class A Shares; ï,„ Performed a discounted cash flow analysis for the Partnership based on forecasts and other data provided by management of the Partnership; ï,„ Performed a discounted dividends analysis on the Partnership based on forecasts and other data prepared and furnished to us by management of the Partnership; ï,„ Performed asum-of-the-parts analysis on the Partnership based on the sum of the valuation of each of TGE’s business segments; ï,„ Compared the financial performance of the Partnership and its stock market trading multiples with those of certain other publicly traded partnerships and companies that we deemed relevant; ï,„ Reviewed a draft of the Merger Agreement, dated December 16, 2019; and ï,„ Performed such other analyses and examinations, held such other discussions, reviewed such other information and considered such other factors that we deemed appropriate. 9
Preliminary Draft –Subject to Change II. TGE Situation Analysis

Preliminary Draft –Subject to Change TGE Situation Analysis Summary Market Data ($ in millions, except per share amounts) Market Capitalization Balance Sheet and Credit Data As of December 16, 2019 As of September 30, 2019 Total Shares Outstanding1 281.3 Cash and Marketable Securities $16.0 Share Price $18.29 Short-Term Debt —Total Equity Value $5,145.6 Long-Term Debt 3,451.3 Plus: Net Debt 3,435.3 Total Debt $3,451.3 Enterprise Value $8,580.9 Net Debt $3,435.3 Historical Growth Capital Plus: Shareholders’ Equity 1,848.9 Expenditure Case / Net Book Capitalization $5,284.2 TGE Financial Projections Consensus Data Revolver Availability / Total Revolver Capacity $782.9 / $2,250.0 Metric Yield/Multiple Metric Yield/Multiple Net Debt / Net Book Cap 65.0% Dividend Yield 2 3 Net Debt / 2020E EBITDA 4.0x2 / 4.0x3 Current $2.20 / $2.20 12.0% / 12.0% $2.20 12.0% Net Debt / 2021E EBITDA 3.7x / 3.5x 2020E 2.25 / 2.25 12.3% / 12.3% 2.20 12.0% 2021E 2.25 / 2.25 12.3% / 12.3% 2.20 12.0% Current Ratings (Senior Unsecured): 2022E 2.25 / 2.26 12.3% / 12.3% NM Moody’s Ba2 (Stable) EV/EBITDA S&P BB+ (Positive) 2020E $855.2 / $866.8 10.0x / 9.9x $867.2 9.9x FitchBBB- (Stable) 2021E 923.6 / 991.8 9.3 / 8.7 892.7 9.6 2022E 978.1 / 1,110.2 8.8 / 7.7 947.5 9.1 Share Price and Dividend Information $30.00 $2.50 Di $25.00 $2.25 vi ic e r $20.00 $2.00 dend P e har $15.00 $1.75per S S $10.00 $1.50 e har $5.00 $1.25 $— $1.00 6/30/18 9/27/18 12/25/18 3/24/19 6/21/19 9/18/19 12/16/19 Source: FactSet and Partnership filings Dividend per Share Share Price 1. Includes 179.2 million Class A Shares and 102.1 million Class B Shares 2. Based on Historical Growth Capital Expenditure Case 3. Based on TGE Financial Projections 10
Preliminary Draft –Subject to Change TGE Situation Analysis TGE Trading Performance Since the MLPBuy-In 6/30/18: 8/1/18: 11/13/18: 11/26/18: 6/28/19: 8/27/19: TEGPstock-for-unit Announces plans to develop Announces expansion of Announces commercial TGE and Kinder Morgan, Inc. TGE announces merger with TEP closes, Seahorse Pipeline and PXP’s mainline capacity and agreement with (“KMI”) announce joint tariff receipt of take-private forming TGE Plaquemines Liquids associated binding open unaffiliated third-party open season to increase crude proposal from the Terminal season shipper for Seahorse oil capacity out of the Bakken Blackstone Pipeline Formation Consortium for 7/10/18: 8/15/18: 10/15/18: $19.50 per share Announces Announces binding TGE and Silver Creek 1/31/19: 3/11/19: 6/20/19: binding open open season for Midstream, LLC agree BIP enters into a BIP closes Energy Transfer 11/25/2019: season for the Seahorse Pipeline to expand the Powder definitive agreement to purchase of announces the DAPL CEO David Dehaemers Iron Horse River Gateway JV acquire a controlling controlling expansion Jr. retires and steps Pipeline interest in TGE from interest in down as CEO 9/11/18: Kelso & Co., the Energy TGE for 6/10/19: Announces Investment Grade & Minerals Group and approximately Phillips 66 and Bridger credit ratings upgrade from Fitch Tallgrass KC, LLC $3.2 billion announce Liberty Pipeline for TGE and REX $30.00 5/1/19: 25,000 Announces open season for further $27.50 22,500 PXP expansion $25.00 20,000 $22.50 17,500 V l o e $20.00 15,000 umes Shar i( n t Per $17.50 12,500 ous h rice P $15.00 10,000 and ) s $12.50 7,500 $10.00 5,000 $7.50 2,500 $5.00--6/30/2018 10/14/2018 1/29/2019 5/16/2019 8/31/2019 12/16/2019 TGE Volume TGE Price Source: FactSet, TGE public filings 11
Preliminary Draft –Subject to Change TGE Situation Analysis Ratings Agency Commentary Current Ratings Credit Opinion February 25, 2019: Senior Ba2ï® Benefits include its predominantly interstate pipeline asset base with consistent Unsecured: cash flow from long-term transportation contracts and moderate leverageï® PXP is positioned as a competitive crude oil transportation option with access Outlook: Stable to multiple basins, downstream refineries and the Cushing, OK crude oil storage hubï® The contract extension of Continental Resources, Inc. and the development of Iron Horse Pipeline significantly improves PXP’s post-2020 recontractibility Analyst: Sreedhar Konaï® Vulnerabilities include predominately “supply-push” customers, average credit quality of customers is speculative-grade, recontracting risk and cash flow uncertainty for PXP and REXWest-to-East February 21, 2019: Senior BB+ï® Excellent business risk profile reflected by the partnership’sfee-based multi- Unsecured: year contracts with over 90% of EBITDA consisting oftake-or-pay contractsï® Expectation that the TGE financial policy stays the same, since Blackstone Outlook: Positive Infrastructure Partners is a long-term investor in the partnership ï® Susceptible to a large percentage of PXP’s contracts rolling off within the next 12 to 18 months Analyst: Mike Llanosï® Vulnerability to poor commodity pricing resulting in volumetric decline and contracted customers inability to meet their contractual obligations September 3, 2019: Senior BBB-ï® Expectation that Tallgrass exhibits near-term cash flow and earnings stability Unsecured: with most of its revenue being volume- and commodity price-insensitiveï® Significant steps towards mitigating near-term recontracting risk for REX and Outlook: Stable PXP in 2019 and 2020 through recent projects and contractual extensionsï® Potential events leading to a negative ratings impact include:ï,„ Inability to recontract expiring REX or PXP capacity at rates supportive of maintaining consolidated leverage of4.8x-5.2x Analyst: Peter Molica ï,„ Negative ratings at REX, or a decline in cash flow up to TEP from REX Source: Moody’s, S&P Global Ratings, Fitch Ratings 12
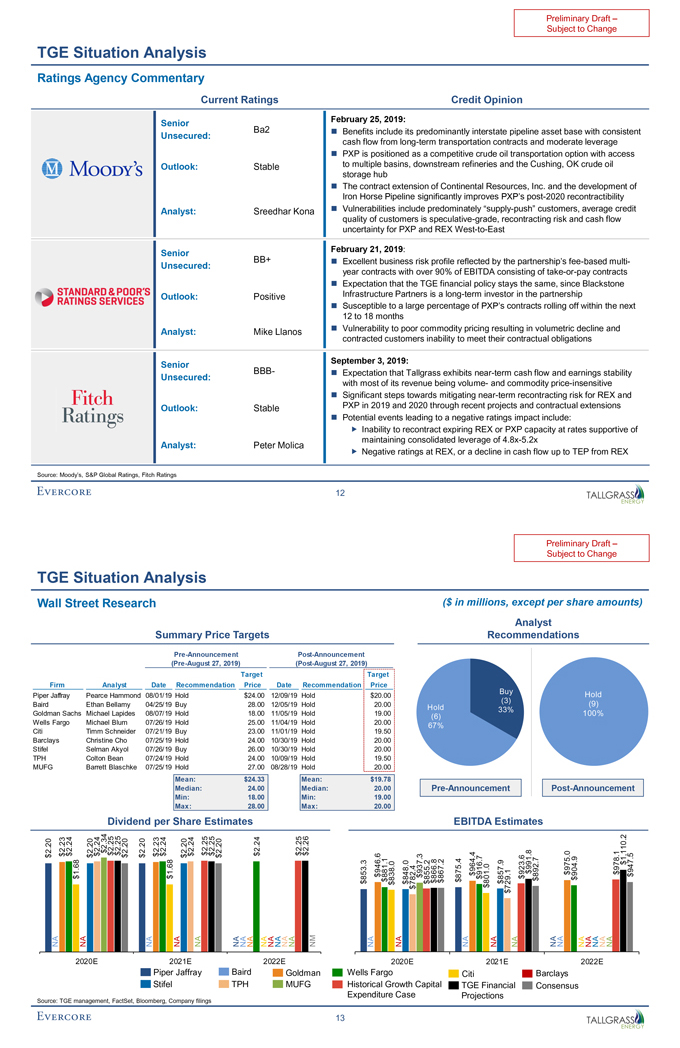
Preliminary Draft –Subject to Change TGE Situation Analysis Wall Street Research ($ in millions, except per share amounts) Analyst Summary Price Targets RecommendationsPre-Announcement Post-Announcement(Pre-August 27, 2019) (Post-August 27, 2019) Target Target Firm Analyst Date Recommendation Price Date Recommendation Price Buy Piper Jaffray Pearce Hammond 08/01/19 Hold $24.00 12/09/19 Hold $20.00 Hold (3) (9) Baird Ethan Bellamy 04/25/19 Buy 28.00 12/05/19 Hold 20.00 Hold 33% Goldman Sachs Michael Lapides 08/07/19 Hold 18.00 11/05/19 Hold 19.00 (6) 100% Wells Fargo Michael Blum 07/26/19 Hold 25.00 11/04/19 Hold 20.00 67% Citi Timm Schneider 07/21/19 Buy 23.00 11/01/19 Hold 19.50 Barclays Christine Cho 07/25/19 Hold 24.00 10/30/19 Hold 20.00 Stifel Selman Akyol 07/26/19 Buy 26.00 10/30/19 Hold 20.00 TPH Colton Bean 07/24/19 Hold 24.00 10/09/19 Hold 19.50 MUFG Barrett Blaschke 07/25/19 Hold 27.00 08/28/19 Hold 20.00 Mean: $24.33 Mean: $19.78 Median: 24.00 Median: 20.00Pre-Announcement Post-Announcement Min: 18.00 Min: 19.00 Max: 28.00 Max: 20.00 Dividend per Share Estimates EBITDA Estimates 2.34 2.232.24 2.24$2.252.25 2.232.24 2.24 2.252.25 2.24 2.252.26 2.20 2.20 2.20 2.20 2.20 2.20 $$ $ $$ $$ $ $$ $ $$ $ $ $ $ $ $ 1,110.2 $ 946.6 937.3 964.4 991.8 975.0 978.1 947.5 1.68 1.68 $916.7 923.6$892.7 $904.9 $ $ $ $881.1 $ 866.8867.2 875.4 857.9 $ $ 853.3 838.0 848.0 855.2 $ $ $ $ $ $$$ $ 801.0 $ $ $782.4 $ $ 729.1 $ NA NA NA NA N A NANANA NANANANANA NM NA NA NA NA NA NANA NANANANANA 2020E 2021E 2022E 2020E 2021E 2022E Piper Jaffray Baird Goldman Wells Fargo Citi Barclays Stifel TPH MUFG Historical Growth Capital TGE Financial Consensus Source: TGE management, FactSet, Bloomberg, Company filings Expenditure Case Projections 13
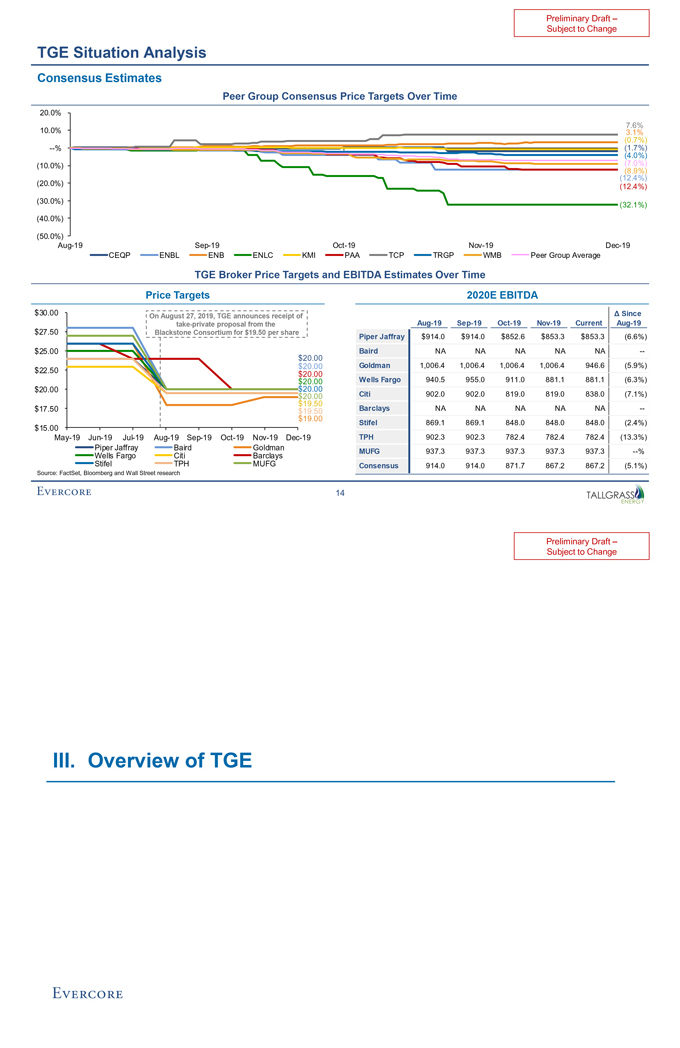
Preliminary Draft –Subject to Change TGE Situation Analysis Consensus Estimates Peer Group Consensus Price Targets Over Time 20.0% 7.6% 10.0% 3.1% (0.7%) —% (1.7%) (4.0%) (10.0%) (7.0%) (8.9%) (12.4%) (20.0%) (12.4%) (30.0%) (32.1%) (40.0%) (50.0%)Aug-19Sep-19Oct-19Nov-19Dec-19 CEQP ENBL ENB ENLC KMI PAA TCP TRGP WMB Peer Group Average TGE Broker Price Targets and EBITDA Estimates Over Time Price Targets 2020E EBITDA $30.00 On August 27, 2019, TGE announces receipt of Ä Since take-private proposal from theAug-19Sep-19Oct-19Nov-19 CurrentAug-19 $27.50 Blackstone Consortium for $19.50 per share Piper Jaffray $914.0 $914.0 $852.6 $853.3 $853.3 (6.6%) $25.00 $20.00 Baird NA NA NA NA NA —$20.00 Goldman 1,006.4 1,006.4 1,006.4 1,006.4 946.6 (5.9%) $22.50 $20.00 $20.00 Wells Fargo 940.5 955.0 911.0 881.1 881.1 (6.3%) $20.00 $20.00 $20.00 Citi 902.0 902.0 819.0 819.0 838.0 (7.1%) $19.50 $17.50 $19.50 Barclays NA NA NA NA NA —$19.00 Stifel 869.1 869.1 848.0 848.0 848.0 (2.4%) $15.00May-19Jun-19Jul-19Aug-19Sep-19Oct-19Nov-19Dec-19 TPH 902.3 902.3 782.4 782.4 782.4 (13.3%) Piper Jaffray Baird Goldman MUFG 937.3 937.3 937.3 937.3 937.3 —% Wells Fargo Citi Barclays Stifel TPH MUFG Consensus 914.0 914.0 871.7 867.2 867.2 (5.1%) Source: FactSet, Bloomberg and Wall Street research 14
Preliminary Draft –Subject to Change III. Overview of TGE
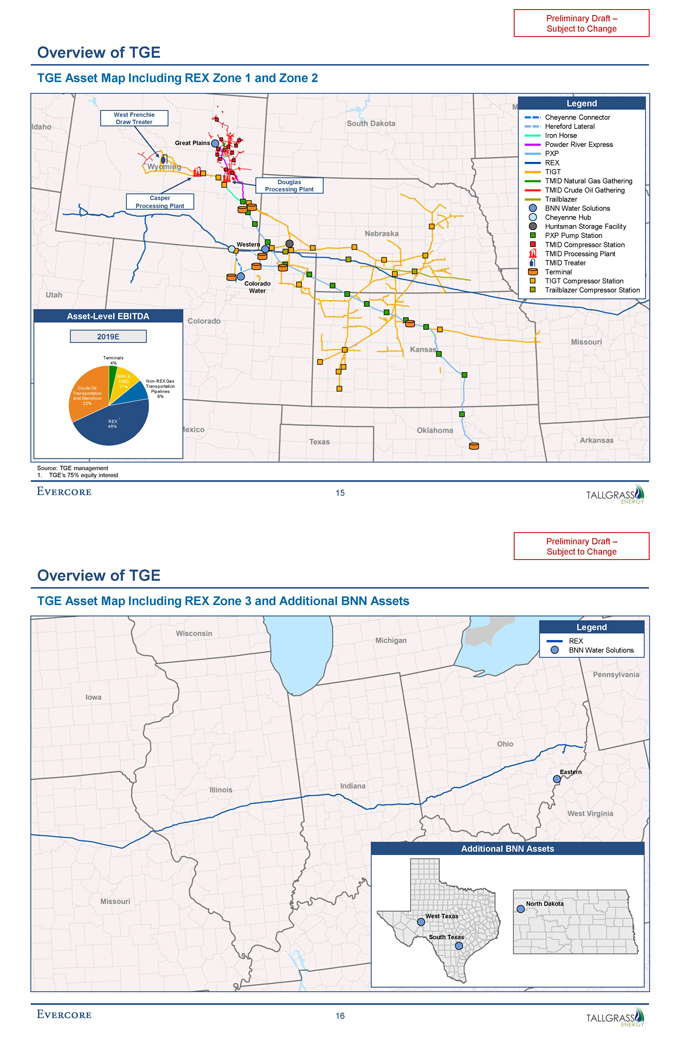
Preliminary Draft –Subject to Change Overview of TGE TGE Asset Map Including REX Zone 1 and Zone 2 Legend West Frenchie Cheyenne Connector Draw Treater Hereford Lateral Iron Horse Great Plains Powder River Express PXP REX TIGT Douglas TMID Natural Gas Gathering Processing Plant TMID Crude Oil Gathering Casper Trailblazer Processing Plant BNN Water Solutions Cheyenne Hub Huntsman Storage Facility PXP Pump Station Western TMID Compressor Station TMID Processing Plant TMID Treater Terminal Colorado TIGT Compressor Station Water Trailblazer Compressor Station Asset-Level EBITDA 2019E Terminals 4% BNN & TMIDNon-REX Gas Crude Oil 11% Transportation Transportation Pipelines and Stanchion 8% 32% 1 1 REX 46% Source: TGE management 1. TGE’s 75% equity interest 15
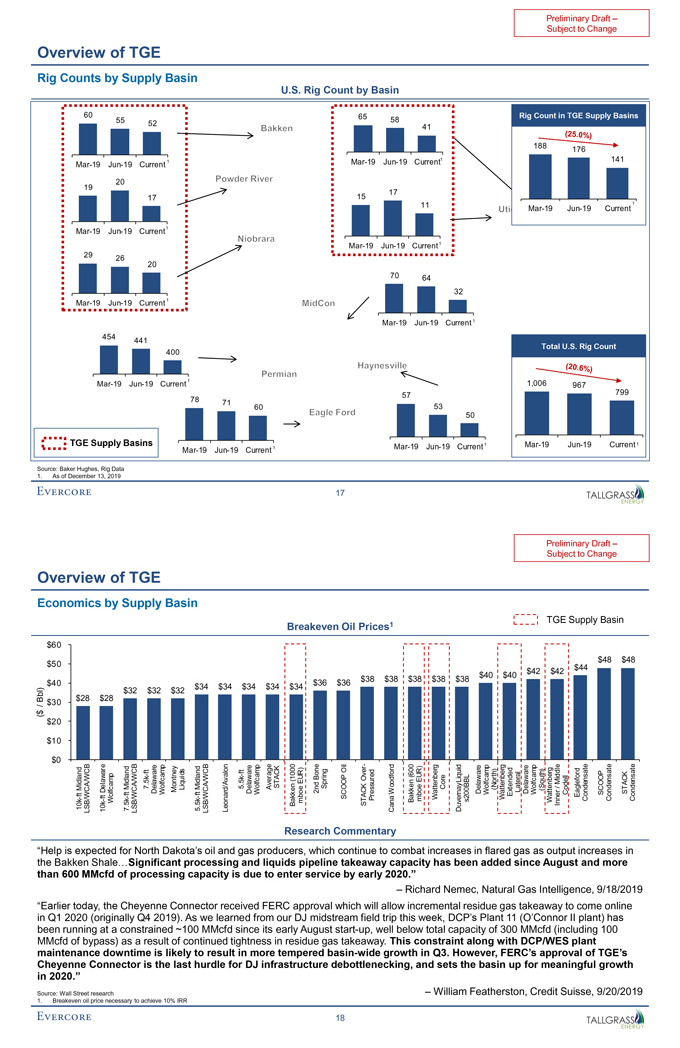
Overview of TGE TGE Asset Map Including REX Zone 3 and Additional BNN Assets Legend REX BNN Water Solutions Eastern Additional BNN Assets North Dakota West Texas South Texas 16
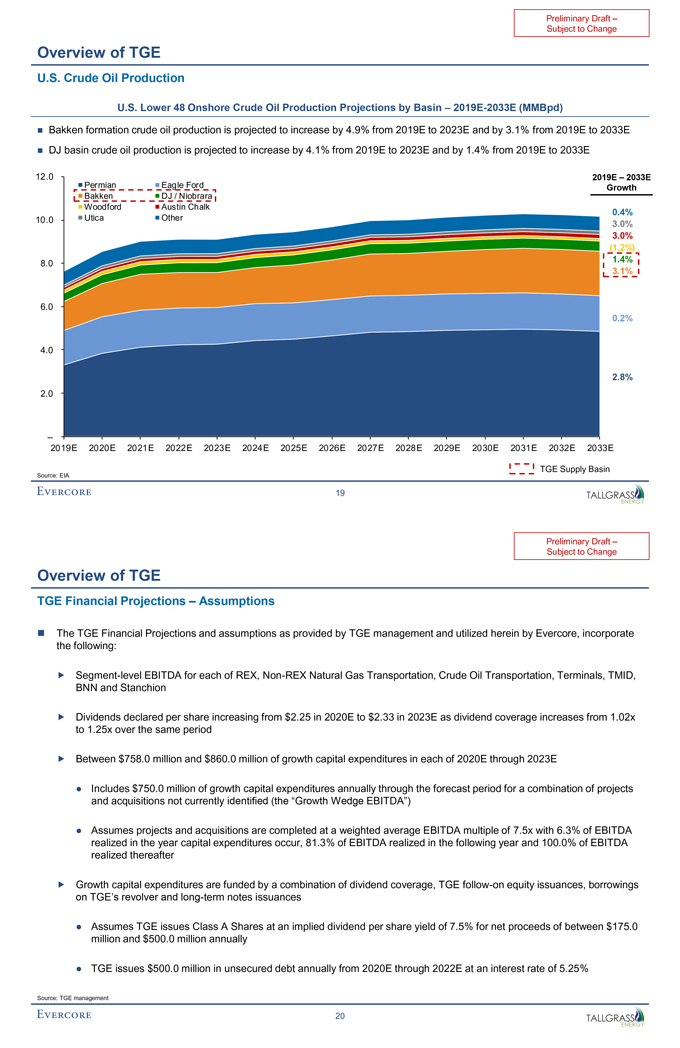
Preliminary Draft –Subject to Change Overview of TGE Rig Counts by Supply Basin U.S. Rig Count by Basin 60 65 Rig Count in TGE Supply Basins 55 58 52 41 188 176Mar-19Jun-19 Current 1Mar-19Jun-19 Current1 141 20 19 17 17 15 11Mar-19Jun-19 Current 1Mar-19Jun-19 Current1Mar-19Jun-19 Current1 29 26 20 70 64 32Mar-19Jun-19 Current 1Mar-19Jun-19 Current 1 454 441 Total U.S. Rig Count 400Mar-19Jun-19 Current 1 1,006 967 57 799 78 71 53 60 50 TGE Supply Basins 1Mar-19Jun-19 Current 1Mar-19Jun-19 Current 1Mar-19Jun-19 Current Source: Baker Hughes, Rig Data 1. As of December 13, 2019 17
Preliminary Draft –Subject to Change Overview of TGE Economics by Supply Basin TGE Supply Basin Breakeven Oil Prices1 $60 $48 $48 $50 $42 $42 $44 $40 $40 $38 $38 $38 $38 $38 $40 $36 $36 $34 $34 $34 $34 $34 l) b $32 $32 $32 B $28 $28 / $30 $ ( $20 $10 $0 e r—e r ne Oil e r mp are ft ft p and — o ng (600 iquid al WCB w l WCB k 1000 ( UR) B P Ov ded / m / EUR) L er E Middle 7.5k elawa 5.5 STACK Spri K tenberg Core tenberg ten elawa/ Midland Mid Liquids Midland Average t (North) t (South) Montney Lat Dela lfca D Wolfcamp Delaware Wolfcamp oe 2nd COO Woodford Delaware Wolfcamp D Wolfca Codell SCOOP STACK ft o—ft ft—Ex attenberg Eagleford — ft S Pressured mboe Wa Wa Condensate Condensate Condensate W k mb Bakken s200BBL W 10k LSB/WCA k 10 7.5 LSB/WCA 5.5k LSB/WCA/WCB Leonard/Avalon Bakken STAC Cana Duvernay Inner Research Commentary “Help is expected for North Dakota’s oil and gas producers, which continue to combat increases in flared gas as output increases in the Bakken Shale…Significant processing and liquids pipeline takeaway capacity has been added since August and more than 600 MMcfd of processing capacity is due to enter service by early 2020.” – Richard Nemec, Natural Gas Intelligence, 9/18/2019 “Earlier today, the Cheyenne Connector received FERC approval which will allow incremental residue gas takeaway to come online in Q1 2020 (originally Q4 2019). As we learned from our DJ midstream field trip this week, DCP’s Plant 11 (O’Connor II plant) has been running at a constrained ~100 MMcfd since its early Auguststart-up, well below total capacity of 300 MMcfd (including 100 MMcfd of bypass) as a result of continued tightness in residue gas takeaway. This constraint along with DCP/WES plant maintenance downtime is likely to result in more tempered basin-wide growth in Q3. However, FERC’s approval of TGE’s Cheyenne Connector is the last hurdle for DJ infrastructure debottlenecking, and sets the basin up for meaningful growth in 2020.” Source: Wall Street research – William Featherston, Credit Suisse, 9/20/2019 1. Breakeven oil price necessary to achieve 10% IRR 18
Preliminary Draft –Subject to Change Overview of TGE U.S. Crude Oil Production U.S. Lower 48 Onshore Crude Oil Production Projections by Basin – 2019E-2033E (MMBpd) ï® Bakken formation crude oil production is projected to increase by 4.9% from 2019E to 2023E and by 3.1% from 2019E to 2033Eï® DJ basin crude oil production is projected to increase by 4.1% from 2019E to 2023E and by 1.4% from 2019E to 2033E 12.0 2019E – 2033E Permian Eagle Ford Growth Bakken DJ / Niobrara Woodford Austin Chalk 0.4% 10.0 Utica Other 3.0% 3.0% (1.2%) 1.4% 8.0 3.1% 6.0 0.2% 4.0 2.8% 2.0 — 2019E 2020E 2021E 2022E 2023E 2024E 2025E 2026E 2027E 2028E 2029E 2030E 2031E 2032E 2033E Source: EIA TGE Supply Basin 19
Subject to Change Overview of TGE TGE Financial Projections – Assumptions ï® The TGE Financial Projections and assumptions as provided by TGE management and utilized herein by Evercore, incorporate the following: ï,„ Segment-level EBITDA for each of REX,Non-REX Natural Gas Transportation, Crude Oil Transportation, Terminals, TMID, BNN and Stanchion ï,„ Dividends declared per share increasing from $2.25 in 2020E to $2.33 in 2023E as dividend coverage increases from 1.02x to 1.25x over the same period ï,„ Between $758.0 million and $860.0 million of growth capital expenditures in each of 2020E through 2023E • Includes $750.0 million of growth capital expenditures annually through the forecast period for a combination of projects and acquisitions not currently identified (the “Growth Wedge EBITDA”) • Assumes projects and acquisitions are completed at a weighted average EBITDA multiple of 7.5x with 6.3% of EBITDA realized in the year capital expenditures occur, 81.3% of EBITDA realized in the following year and 100.0% of EBITDA realized thereafter ï,„ Growth capital expenditures are funded by a combination of dividend coverage, TGEfollow-on equity issuances, borrowings on TGE’s revolver and long-term notes issuances • Assumes TGE issues Class A Shares at an implied dividend per share yield of 7.5% for net proceeds of between $175.0 million and $500.0 million annually • TGE issues $500.0 million in unsecured debt annually from 2020E through 2022E at an interest rate of 5.25% Source: TGE management 20
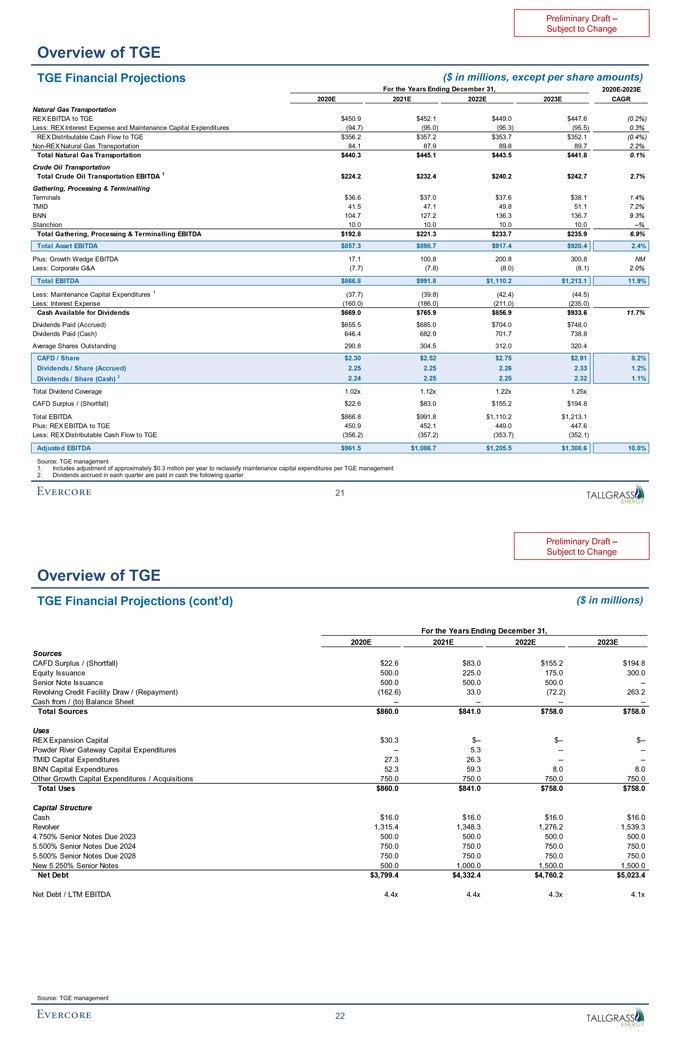
Preliminary Draft –Subject to Change Overview of TGE TGE Financial Projections ($ in millions, except per share amounts) For the Years Ending December 31, 2020E-2023E 2020E 2021E 2022E 2023E CAGR Natural Gas Transportation REX EBITDA to TGE $450.9 $452.1 $449.0 $447.6 (0.2%) Less: REX Interest Expense and Maintenance Capital Expenditures (94.7) (95.0) (95.3) (95.5) 0.3% REX Distributable Cash Flow to TGE $356.2 $357.2 $353.7 $352.1 (0.4%)Non-REX Natural Gas Transportation 84.1 87.9 89.8 89.7 2.2% Total Natural Gas Transportation $440.3 $445.1 $443.5 $441.8 0.1% Crude Oil Transportation Total Crude Oil Transportation EBITDA 1 $224.2 $232.4 $240.2 $242.7 2.7% Gathering, Processing & Terminalling Terminals $36.6 $37.0 $37.6 $38.1 1.4% TMID 41.5 47.1 49.8 51.1 7.2% BNN 104.7 127.2 136.3 136.7 9.3% Stanchion 10.0 10.0 10.0 10.0 —% Total Gathering, Processing & Terminalling EBITDA $192.8 $221.3 $233.7 $235.9 6.9% Total Asset EBITDA $857.3 $898.7 $917.4 $920.4 2.4% Plus: Growth Wedge EBITDA 17.1 100.8 200.8 300.8 NM Less: Corporate G&A (7.7) (7.8) (8.0) (8.1) 2.0% Total EBITDA $866.8 $991.8 $1,110.2 $1,213.1 11.9% Less: Maintenance Capital Expenditures 1 (37.7) (39.8) (42.4) (44.5) Less: Interest Expense (160.0) (186.0) (211.0) (235.0) Cash Available for Dividends $669.0 $765.9 $856.9 $933.6 11.7% Dividends Paid (Accrued) $655.5 $685.0 $704.0 $748.0 Dividends Paid (Cash) 646.4 682.9 701.7 738.8 Average Shares Outstanding 290.8 304.5 312.0 320.4 CAFD / Share $2.30 $2.52 $2.75 $2.91 8.2% Dividends / Share (Accrued) 2.25 2.25 2.26 2.33 1.2% Dividends / Share (Cash) 2 2.24 2.25 2.25 2.32 1.1% Total Dividend Coverage 1.02x 1.12x 1.22x 1.25x CAFD Surplus / (Shortfall) $22.6 $83.0 $155.2 $194.8 Total EBITDA $866.8 $991.8 $1,110.2 $1,213.1 Plus: REX EBITDA to TGE 450.9 452.1 449.0 447.6 Less: REX Distributable Cash Flow to TGE (356.2) (357.2) (353.7) (352.1) Adjusted EBITDA $961.5 $1,086.7 $1,205.5 $1,308.6 10.8% Source: TGE management 1. Includes adjustment of approximately $0.3 million per year to reclassify maintenance capital expenditures per TGE management 2. Dividends accrued in each quarter are paid in cash the following quarter 21
Preliminary Draft –Subject to Change Overview of TGE TGE Financial Projections (cont’d) ($ in millions) For the Years Ending December 31, 2020E 2021E 2022E 2023E Sources CAFD Surplus / (Shortfall) $22.6 $83.0 $155.2 $194.8 Equity Issuance 500.0 225.0 175.0 300.0 Senior Note Issuance 500.0 500.0 500.0 —Revolving Credit Facility Draw / (Repayment) (162.6) 33.0 (72.2) 263.2 Cash from / (to) Balance Sheet -———- Total Sources $860.0 $841.0 $758.0 $758.0 Uses REX Expansion Capital $30.3 $— $— $—Powder River Gateway Capital Expenditures — 5.3 -—-TMID Capital Expenditures 27.3 26.3-—-BNN Capital Expenditures 52.3 59.3 8.0 8.0 Other Growth Capital Expenditures / Acquisitions 750.0 750.0 750.0 750.0 Total Uses $860.0 $841.0 $758.0 $758.0 Capital Structure Cash $16.0 $16.0 $16.0 $16.0 Revolver 1,315.4 1,348.3 1,276.2 1,539.3 4.750% Senior Notes Due 2023 500.0 500.0 500.0 500.0 5.500% Senior Notes Due 2024 750.0 750.0 750.0 750.0 5.500% Senior Notes Due 2028 750.0 750.0 750.0 750.0 New 5.250% Senior Notes 500.0 1,000.0 1,500.0 1,500.0 Net Debt $3,799.4 $4,332.4 $4,760.2 $5,023.4 Net Debt / LTM EBITDA 4.4x 4.4x 4.3x 4.1x Source: TGE management 22
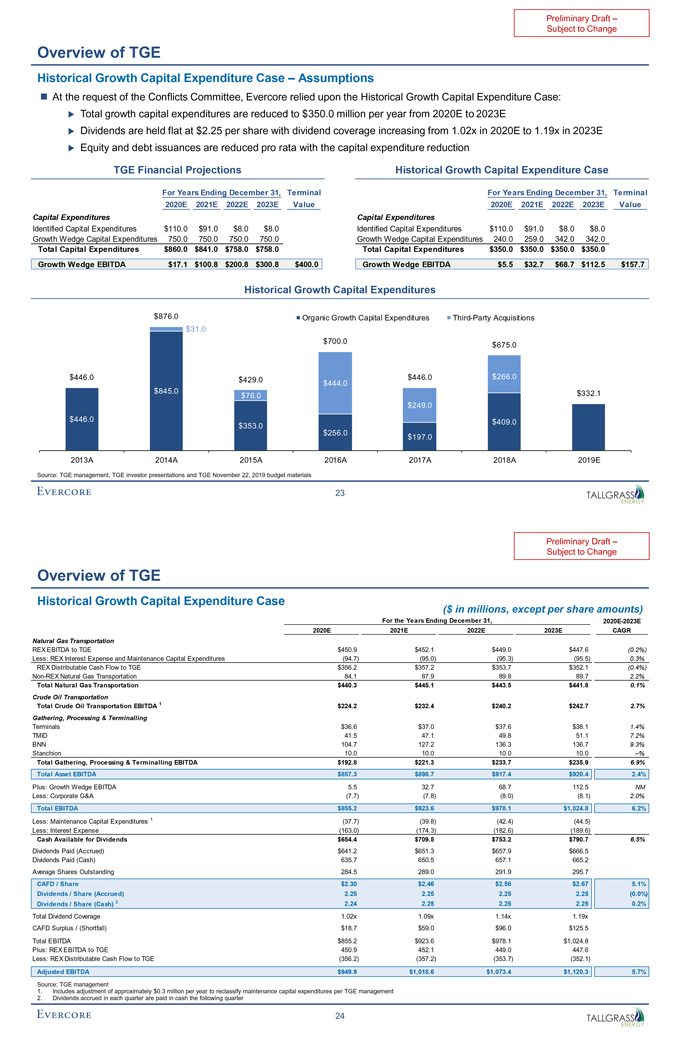
Preliminary Draft –Subject to Change Overview of TGE Historical Growth Capital Expenditure Case – Assumptions ï® At the request of the Conflicts Committee, Evercore relied upon the Historical Growth Capital Expenditure Case:ïµ Total growth capital expenditures are reduced to $350.0 million per year from 2020E to 2023E ïµ Dividends are held flat at $2.25 per share with dividend coverage increasing from 1.02x in 2020E to 1.19x in 2023Eïµ Equity and debt issuances are reduced pro rata with the capital expenditure reduction TGE Financial Projections Historical Growth Capital Expenditure Case For Years Ending December 31, Terminal For Years Ending December 31, Terminal 2020E 2021E 2022E 2023E Value 2020E 2021E 2022E 2023E Value Capital Expenditures Capital Expenditures Identified Capital Expenditures $110.0 $91.0 $8.0 $8.0 Identified Capital Expenditures $110.0 $91.0 $8.0 $8.0 Growth Wedge Capital Expenditures 750.0 750.0 750.0 750.0 Growth Wedge Capital Expenditures 240.0 259.0 342.0 342.0 Total Capital Expenditures $860.0 $841.0 $758.0 $758.0 Total Capital Expenditures $350.0 $350.0 $350.0 $350.0 Growth Wedge EBITDA $17.1 $100.8 $200.8 $300.8 $400.0 Growth Wedge EBITDA $5.5 $32.7 $68.7 $112.5 $157.7 Historical Growth Capital Expenditures $876.0 Organic Growth Capital Expenditures Third-Party Acquisitions $31.0 $700.0 $675.0 $446.0 $429.0 $444.0 $446.0 $266.0 $845.0 $332.1 $76.0 $249.0 $446.0 $353.0 $409.0 $256.0 $197.0 2013A 2014A 2015A 2016A 2017A 2018A 2019E Source: TGE management, TGE investor presentations and TGE November 22, 2019 budget materials 23
Preliminary Draft –Subject to Change Overview of TGE Historical Growth Capital Expenditure Case ($ in millions, except per share amounts) For the Years Ending December 31, 2020E-2023E 2020E 2021E 2022E 2023E CAGR Natural Gas Transportation REX EBITDA to TGE $450.9 $452.1 $449.0 $447.6 (0.2%) Less: REX Interest Expense and Maintenance Capital Expenditures (94.7) (95.0) (95.3) (95.5) 0.3% REX Distributable Cash Flow to TGE $356.2 $357.2 $353.7 $352.1 (0.4%)Non-REX Natural Gas Transportation 84.1 87.9 89.8 89.7 2.2% Total Natural Gas Transportation $440.3 $445.1 $443.5 $441.8 0.1% Crude Oil Transportation Total Crude Oil Transportation EBITDA 1 $224.2 $232.4 $240.2 $242.7 2.7% Gathering, Processing & Terminalling Terminals $36.6 $37.0 $37.6 $38.1 1.4% TMID 41.5 47.1 49.8 51.1 7.2% BNN 104.7 127.2 136.3 136.7 9.3% Stanchion 10.0 10.0 10.0 10.0 —% Total Gathering, Processing & Terminalling EBITDA $192.8 $221.3 $233.7 $235.9 6.9% Total Asset EBITDA $857.3 $898.7 $917.4 $920.4 2.4% Plus: Growth Wedge EBITDA 5.5 32.7 68.7 112.5 NM Less: Corporate G&A (7.7) (7.8) (8.0) (8.1) 2.0% Total EBITDA $855.2 $923.6 $978.1 $1,024.8 6.2% Less: Maintenance Capital Expenditures 1 (37.7) (39.8) (42.4) (44.5) Less: Interest Expense (163.0) (174.3) (182.6) (189.6) Cash Available for Dividends $654.4 $709.5 $753.2 $790.7 6.5% Dividends Paid (Accrued) $641.2 $651.3 $657.9 $666.5 Dividends Paid (Cash) 635.7 650.5 657.1 665.2 Average Shares Outstanding 284.5 289.0 291.9 295.7 CAFD / Share $2.30 $2.46 $2.58 $2.67 5.1% Dividends / Share (Accrued) 2.25 2.25 2.25 2.25 (0.0%) Dividends / Share (Cash) 2 2.24 2.25 2.25 2.25 0.2% Total Dividend Coverage 1.02x 1.09x 1.14x 1.19x CAFD Surplus / (Shortfall) $18.7 $59.0 $96.0 $125.5 Total EBITDA $855.2 $923.6 $978.1 $1,024.8 Plus: REX EBITDA to TGE 450.9 452.1 449.0 447.6 Less: REX Distributable Cash Flow to TGE (356.2) (357.2) (353.7) (352.1) Adjusted EBITDA $949.9 $1,018.6 $1,073.4 $1,120.3 5.7% Source: TGE management 1. Includes adjustment of approximately $0.3 million per year to reclassify maintenance capital expenditures per TGE management 2. Dividends accrued in each quarter are paid in cash the following quarter 24
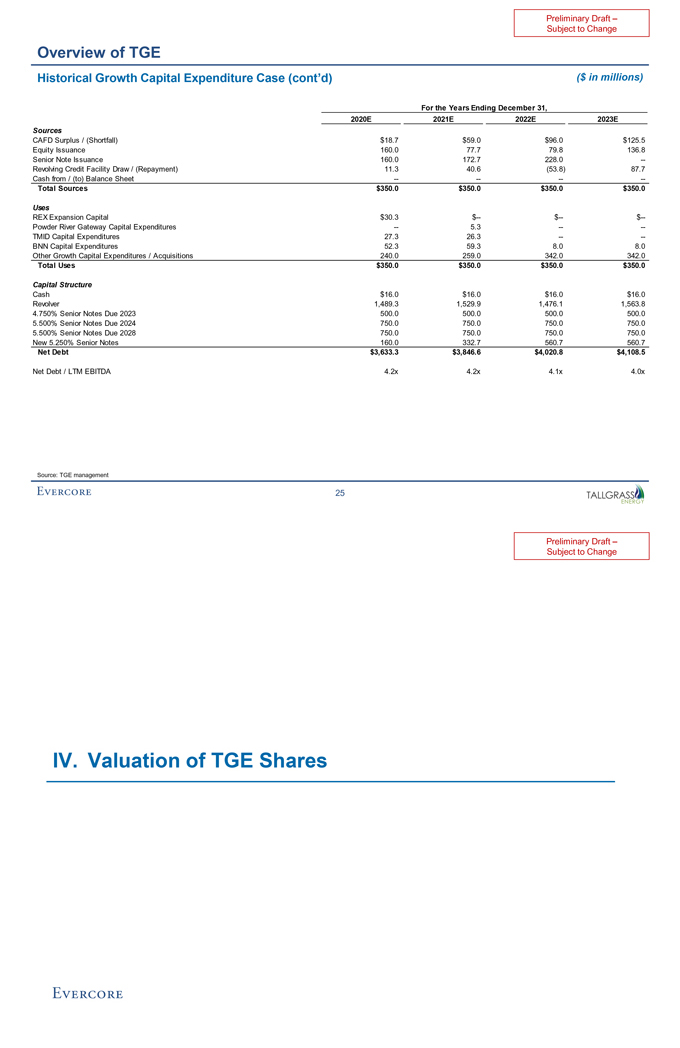
Preliminary Draft –Subject to Change Overview of TGE Historical Growth Capital Expenditure Case (cont’d) ($ in millions) For the Years Ending December 31, 2020E 2021E 2022E 2023E Sources CAFD Surplus / (Shortfall) $18.7 $59.0 $96.0 $125.5 Equity Issuance 160.0 77.7 79.8 136.8 Senior Note Issuance 160.0 172.7 228.0 —Revolving Credit Facility Draw / (Repayment) 11.3 40.6 (53.8) 87.7 Cash from / (to) Balance Sheet -———- Total Sources $350.0 $350.0 $350.0 $350.0 Uses REX Expansion Capital $30.3 $— $— $—Powder River Gateway Capital Expenditures — 5.3 -—-TMID Capital Expenditures 27.3 26.3-—-BNN Capital Expenditures 52.3 59.3 8.0 8.0 Other Growth Capital Expenditures / Acquisitions 240.0 259.0 342.0 342.0 Total Uses $350.0 $350.0 $350.0 $350.0 Capital Structure Cash $16.0 $16.0 $16.0 $16.0 Revolver 1,489.3 1,529.9 1,476.1 1,563.8 4.750% Senior Notes Due 2023 500.0 500.0 500.0 500.0 5.500% Senior Notes Due 2024 750.0 750.0 750.0 750.0 5.500% Senior Notes Due 2028 750.0 750.0 750.0 750.0 New 5.250% Senior Notes 160.0 332.7 560.7 560.7 Net Debt $3,633.3 $3,846.6 $4,020.8 $4,108.5 Net Debt / LTM EBITDA 4.2x 4.2x 4.1x 4.0x Source: TGE management 25
Preliminary Draft –Subject to Change IV. Valuation of TGE Shares
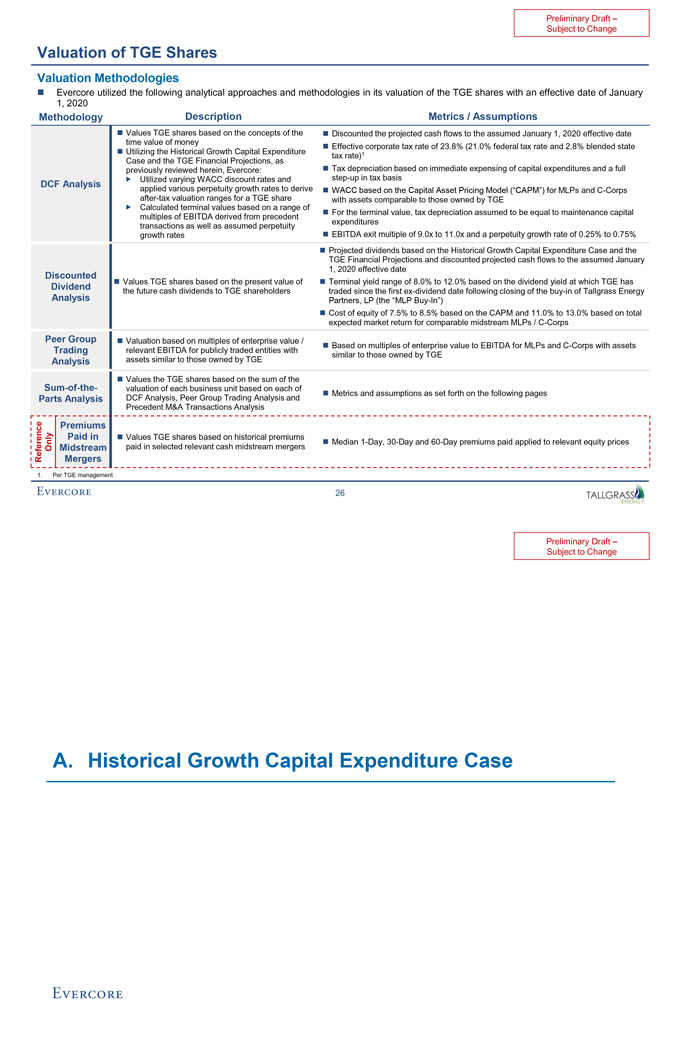
Preliminary Draft –Subject to Change Valuation of TGE Shares Valuation Methodologies ï® Evercore utilized the following analytical approaches and methodologies in its valuation of the TGE shares with an effective date of January 1, 2020 Methodology Description Metrics / Assumptions ï® Values TGE shares based on the concepts of theï® Discounted the projected cash flows to the assumed January 1, 2020 effective date time value of moneyï® Effective corporate tax rate of 23.8% (21.0% federal tax rate and 2.8% blended state ï® Utilizing the Historical Growth Capital Expenditure 1 tax rate) Case and the TGE Financial Projections, as previously reviewed herein, Evercore:ï® Tax depreciation based on immediate expensing of capital expenditures and a full ï,„ Utilized varying WACC discount rates andstep-up in tax basis DCF Analysis applied various perpetuity growth rates to derive ï® WACC based on the Capital Asset Pricing Model (“CAPM”) for MLPs andC-Corpsafter-tax valuation ranges for a TGE share with assets comparable to those owned by TGE ï,„ Calculated terminal values based on a range of ï® For the terminal value, tax depreciation assumed to be equal to maintenance capital multiples of EBITDA derived from precedent expenditures transactions as well as assumed perpetuity growth ratesï® EBITDA exit multiple of 9.0x to 11.0x and a perpetuity growth rate of 0.25% to 0.75%ï® Projected dividends based on the Historical Growth Capital Expenditure Case and the TGE Financial Projections and discounted projected cash flows to the assumed January 1, 2020 effective date Discounted ï® Values TGE shares based on the present value of ï® Terminal yield range of 8.0% to 12.0% based on the dividend yield at which TGE has Dividend the future cash dividends to TGE shareholders traded since the firstex-dividend date following closing of thebuy-in of Tallgrass Energy Analysis Partners, LP (the “MLPBuy-In”) ï® Cost of equity of 7.5% to 8.5% based on the CAPM and 11.0% to 13.0% based on total expected market return for comparable midstream MLPs /C-Corps Peer Group ï® Valuation based on multiples of enterprise value / ï® Based on multiples of enterprise value to EBITDA for MLPs andC-Corps with assets Trading relevant EBITDA for publicly traded entities with similar to those owned by TGE Analysis assets similar to those owned by TGE ï® Values the TGE shares based on the sum of theSum-of-the- valuation of each business unit based on each of ï® Metrics and assumptions as set forth on the following pages Parts Analysis DCF Analysis, Peer Group Trading Analysis and Precedent M&A Transactions Analysis Premiums Paid in ï® Values TGE shares based on historical premiums ï® Median1-Day,30-Day and60-Day premiums paid applied to relevant equity prices Only Midstream paid in selected relevant cash midstream mergers Reference Mergers 1. Per TGE management 26
Preliminary Draft –Subject to Change A. Historical Growth Capital Expenditure Case
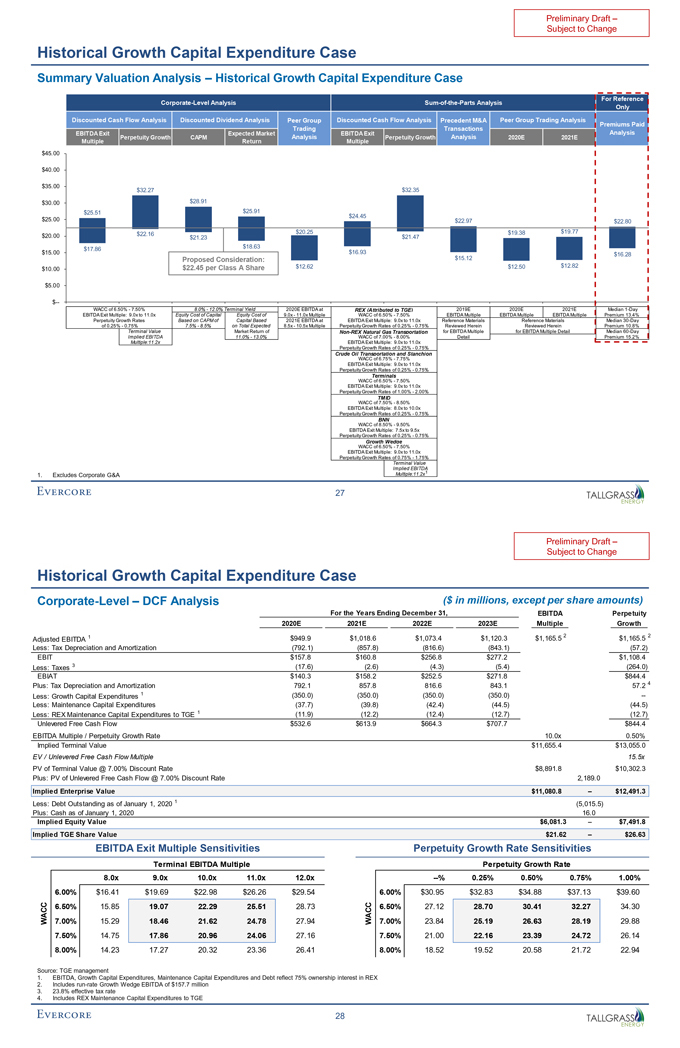
Preliminary Draft –Subject to Change Historical Growth Capital Expenditure Case Summary Valuation Analysis – Historical Growth Capital Expenditure Case For Reference Corporate-Level AnalysisSum-of-the-Parts Analysis Only Discounted Cash Flow Analysis Discounted Dividend Analysis Peer Group Discounted Cash Flow Analysis Precedent M&A Peer Group Trading Analysis Premiums Paid Trading Transactions EBITDA Exit Expected Market EBITDA Exit Analysis Perpetuity Growth CAPM Analysis Perpetuity Growth Analysis 2020E 2021E Multiple Return Multiple $45.00 $40.00 $35.00 $32.27 $32.35 $30.00 $28.91 $25.51 $25.91 $24.45 $25.00 $22.97 $22.80 $22.16 $20.25 $19.38 $19.77 $20.00 $21.23 $21.47 $18.63 $17.86 $15.00 $16.93 $16.28 Proposed Consideration: $15.12 $22.45 per Class A Share $12.62 $12.50 $12.82 $10.00 $5.00 $— WACC of 6.50%—7.50% 8.0%—12.0% Terminal Yield 2020E EBITDA at REX (Attributed to TGE) 2019E 2020E 2021E Median1-Day EBITDA Exit Multiple: 9.0x to 11.0x Equity Cost of Capital Equity Cost of 9.0x—11.0x Multiple WACC of 6.50%—7.50% EBITDA Multiple EBITDA Multiple EBITDA Multiple Premium 13.4% Perpetuity Growth Rates Based on CAPM of Capital Based 2021E EBITDA at EBITDA Exit Multiple: 9.0x to 11.0x Reference Materials Reference Materials Median30-Day of 0.25%—0.75% 7.5%—8.5% on Total Expected 8.5x—10.5x Multiple Perpetuity Growth Rates of 0.25%—0.75% Reviewed Herein Reviewed Herein Premium 10.8% Terminal Value Market Return ofNon-REX Natural Gas Transportation for EBITDA Multiple for EBITDA Multiple Detail Median60-Day Implied EBITDA 11.0%—13.0% WACC of 7.00%—8.00% Detail Premium 15.2% Multiple:11.2x EBITDA Exit Multiple: 9.0x to 11.0x Perpetuity Growth Rates of 0.25%—0.75% Crude Oil Transportation and Stanchion WACC of 6.75%—7.75% EBITDA Exit Multiple: 9.0x to 11.0x Perpetuity Growth Rates of 0.25%—0.75% Terminals WACC of 6.50%—7.50% EBITDA Exit Multiple: 9.0x to 11.0x Perpetuity Growth Rates of 1.00%—2.00% TMID WACC of 7.50%—8.50% EBITDA Exit Multiple: 8.0x to 10.0x Perpetuity Growth Rates of 0.25%—0.75% BNN WACC of 8.50%—9.50% EBITDA Exit Multiple: 7.5x to 9.5x Perpetuity Growth Rates of 0.25%—0.75% Growth Wedge WACC of 6.50%—7.50% EBITDA Exit Multiple: 9.0x to 11.0x Perpetuity Growth Rates of 0.75%—1.75% Terminal Value Implied EBITDA 1 1. Excludes Corporate G&A Multiple:11.2x 27
Preliminary Draft –Subject to Change Historical Growth Capital Expenditure Case Corporate-Level – DCF Analysis ($ in millions, except per share amounts) For the Years Ending December 31, EBITDA Perpetuity 2020E 2021E 2022E 2023E Multiple Growth 1 $949.9 $1,018.6 $1,073.4 $1,120.3 $1,165.5 2 $1,165.5 2 Adjusted EBITDA Less: Tax Depreciation and Amortization (792.1) (857.8) (816.6) (843.1) (57.2) EBIT $157.8 $160.8 $256.8 $277.2 $1,108.4 Less: Taxes 3 (17.6) (2.6) (4.3) (5.4) (264.0) EBIAT $140.3 $158.2 $252.5 $271.8 $844.4 Plus: Tax Depreciation and Amortization 792.1 857.8 816.6 843.1 57.2 4 Less: Growth Capital Expenditures 1 (350.0) (350.0) (350.0) (350.0) —Less: Maintenance Capital Expenditures (37.7) (39.8) (42.4) (44.5) (44.5) Less: REX Maintenance Capital Expenditures to TGE 1 (11.9) (12.2) (12.4) (12.7) (12.7) Unlevered Free Cash Flow $532.6 $613.9 $664.3 $707.7 $844.4 EBITDA Multiple / Perpetuity Growth Rate 10.0x 0.50% Implied Terminal Value $11,655.4 $13,055.0 EV / Unlevered Free Cash Flow Multiple 15.5x PV of Terminal Value @ 7.00% Discount Rate $8,891.8 $10,302.3 Plus: PV of Unlevered Free Cash Flow @ 7.00% Discount Rate 2,189.0 Implied Enterprise Value $11,080.8 – $12,491.3 Less: Debt Outstanding as of January 1, 2020 1 (5,015.5) Plus: Cash as of January 1, 2020 16.0 Implied Equity Value $6,081.3 – $7,491.8 Implied TGE Share Value $21.62 – $26.63 EBITDA Exit Multiple Sensitivities Perpetuity Growth Rate Sensitivities Terminal EBITDA Multiple Perpetuity Growth Rate 8.0x 9.0x 10.0x 11.0x 12.0x —% 0.25% 0.50% 0.75% 1.00% 6.00% $16.41 $19.69 $22.98 $26.26 $29.54 6.00% $30.95 $32.83 $34.88 $37.13 $39.60 ACC 6.50% 15.85 19.07 22.29 25.51 28.73 ACC 6.50% 27.12 28.70 30.41 32.27 34.30 W 7.00% 15.29 18.46 21.62 24.78 27.94 W 7.00% 23.84 25.19 26.63 28.19 29.88 7.50% 14.75 17.86 20.96 24.06 27.16 7.50% 21.00 22.16 23.39 24.72 26.14 8.00% 14.23 17.27 20.32 23.36 26.41 8.00% 18.52 19.52 20.58 21.72 22.94 Source: TGE management 1. EBITDA, Growth Capital Expenditures, Maintenance Capital Expenditures and Debt reflect 75% ownership interest in REX 2. Includesrun-rate Growth Wedge EBITDA of $157.7 million 3. 23.8% effective tax rate 4. Includes REX Maintenance Capital Expenditures to TGE 28
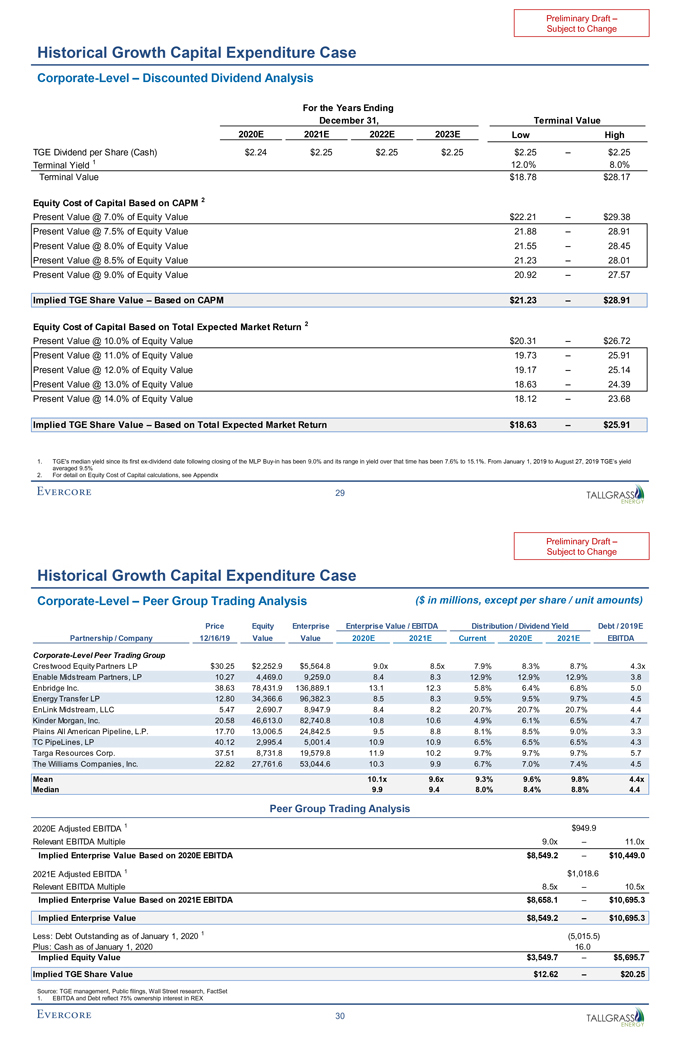
Preliminary Draft –Subject to Change Historical Growth Capital Expenditure Case Corporate-Level – Discounted Dividend Analysis For the Years Ending December 31, Terminal Value 2020E 2021E 2022E 2023E Low High TGE Dividend per Share (Cash) $2.24 $2.25 $2.25 $2.25 $2.25 – $2.25 Terminal Yield 1 12.0% 8.0% Terminal Value $18.78 $28.17 Equity Cost of Capital Based on CAPM 2 Present Value @ 7.0% of Equity Value $22.21 – $29.38 Present Value @ 7.5% of Equity Value 21.88 – 28.91 Present Value @ 8.0% of Equity Value 21.55 – 28.45 Present Value @ 8.5% of Equity Value 21.23 – 28.01 Present Value @ 9.0% of Equity Value 20.92 – 27.57 Implied TGE Share Value – Based on CAPM $21.23 – $28.91 Equity Cost of Capital Based on Total Expected Market Return 2 Present Value @ 10.0% of Equity Value $20.31 – $26.72 Present Value @ 11.0% of Equity Value 19.73 – 25.91 Present Value @ 12.0% of Equity Value 19.17 – 25.14 Present Value @ 13.0% of Equity Value 18.63 – 24.39 Present Value @ 14.0% of Equity Value 18.12 – 23.68 Implied TGE Share Value – Based on Total Expected Market Return $18.63 – $25.91 1. TGE’s median yield since its firstex-dividend date following closing of the MLPBuy-in has been 9.0% and its range in yield over that time has been 7.6% to 15.1%. From January 1, 2019 to August 27, 2019 TGE’s yield averaged 9.5% 2. For detail on Equity Cost of Capital calculations, see Appendix 29
Preliminary Draft –Subject to Change Historical Growth Capital Expenditure Case Corporate-Level – Peer Group Trading Analysis ($ in millions, except per share / unit amounts) Price Equity Enterprise Enterprise Value / EBITDA Distribution / Dividend Yield Debt / 2019E Partnership / Company 12/16/19 Value Value 2020E 2021E Current 2020E 2021E EBITDA Corporate-Level Peer Trading Group Crestwood Equity Partners LP $30.25 $2,252.9 $5,564.8 9.0x 8.5x 7.9% 8.3% 8.7% 4.3x Enable Midstream Partners, LP 10.27 4,469.0 9,259.0 8.4 8.3 12.9% 12.9% 12.9% 3.8 Enbridge Inc. 38.63 78,431.9 136,889.1 13.1 12.3 5.8% 6.4% 6.8% 5.0 Energy Transfer LP 12.80 34,366.6 96,382.3 8.5 8.3 9.5% 9.5% 9.7% 4.5 EnLink Midstream, LLC 5.47 2,690.7 8,947.9 8.4 8.2 20.7% 20.7% 20.7% 4.4 Kinder Morgan, Inc. 20.58 46,613.0 82,740.8 10.8 10.6 4.9% 6.1% 6.5% 4.7 Plains All American Pipeline, L.P. 17.70 13,006.5 24,842.5 9.5 8.8 8.1% 8.5% 9.0% 3.3 TC PipeLines, LP 40.12 2,995.4 5,001.4 10.9 10.9 6.5% 6.5% 6.5% 4.3 Targa Resources Corp. 37.51 8,731.8 19,579.8 11.9 10.2 9.7% 9.7% 9.7% 5.7 The Williams Companies, Inc. 22.82 27,761.6 53,044.6 10.3 9.9 6.7% 7.0% 7.4% 4.5 Mean 10.1x 9.6x 9.3% 9.6% 9.8% 4.4x Median 9.9 9.4 8.0% 8.4% 8.8% 4.4 Peer Group Trading Analysis 2020E Adjusted EBITDA 1 $949.9 Relevant EBITDA Multiple 9.0x – 11.0x Implied Enterprise Value Based on 2020E EBITDA $8,549.2 – $10,449.0 2021E Adjusted EBITDA 1 $1,018.6 Relevant EBITDA Multiple 8.5x – 10.5x Implied Enterprise Value Based on 2021E EBITDA $8,658.1 – $10,695.3 Implied Enterprise Value $8,549.2 – $10,695.3 Less: Debt Outstanding as of January 1, 2020 1 (5,015.5) Plus: Cash as of January 1, 2020 16.0 Implied Equity Value $3,549.7 – $5,695.7 Implied TGE Share Value $12.62 – $20.25 Source: TGE management, Public filings, Wall Street research, FactSet 1. EBITDA and Debt reflect 75% ownership interest in REX 30
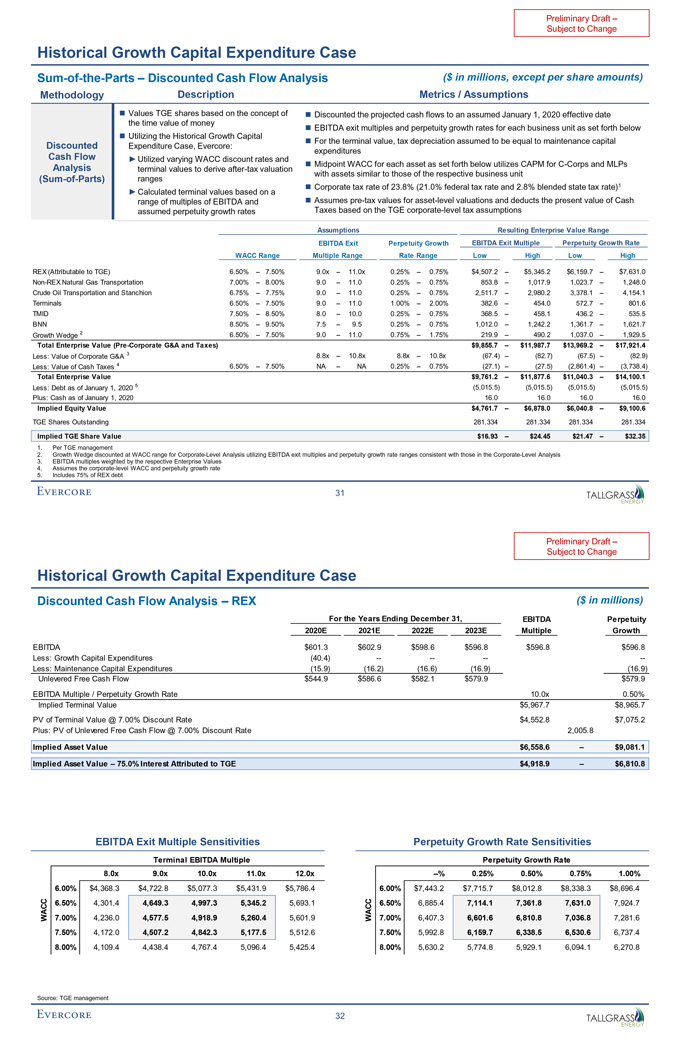
Preliminary Draft –Subject to Change Historical Growth Capital Expenditure CaseSum-of-the-Parts – Discounted Cash Flow Analysis ($ in millions, except per share amounts) Methodology Description Metrics / Assumptions ï® Values TGE shares based on the concept of ï® Discounted the projected cash flows to an assumed January 1, 2020 effective date the time value of money ï® EBITDA exit multiples and perpetuity growth rates for each business unit as set forth belowï® Utilizing the Historical Growth Capital ï® For the terminal value, tax depreciation assumed to be equal to maintenance capital Discounted Expenditure Case, Evercore: expenditures Cash Flow â–º Utilized varying WACC discount rates and below utilizes CAPM forC-Corps and MLPs Analysisï® Midpoint WACC for each asset as set forth terminal values to deriveafter-tax valuation with assets similar to those of the respective business unit(Sum-of-Parts) ranges â–º Calculated terminal values based on a ï® Corporate tax rate of 23.8% (21.0% federal tax rate and 2.8% blended state tax rate)1 range of multiples of EBITDA andï® Assumespre-tax values for asset-level valuations and deducts the present value of Cash assumed perpetuity growth rates Taxes based on the TGE corporate-level tax assumptions Assumptions Resulting Enterprise Value Range EBITDA Exit Perpetuity Growth EBITDA Exit Multiple Perpetuity Growth Rate WACC Range Multiple Range Rate Range Low High Low High REX (Attributable to TGE) 6.50% – 7.50% 9.0x – 11.0x 0.25% – 0.75% $4,507.2 – $5,345.2 $6,159.7 – $7,631.0Non-REX Natural Gas Transportation 7.00% – 8.00% 9.0 – 11.0 0.25% – 0.75% 853.8 – 1,017.9 1,023.7 – 1,248.0 Crude Oil Transportation and Stanchion 6.75% – 7.75% 9.0 – 11.0 0.25% – 0.75% 2,511.7 – 2,980.2 3,378.1 – 4,154.1 Terminals 6.50% – 7.50% 9.0 – 11.0 1.00% – 2.00% 382.6 – 454.0 572.7 – 801.6 TMID 7.50% – 8.50% 8.0 – 10.0 0.25% – 0.75% 368.5 – 458.1 436.2 – 535.5 BNN 8.50% – 9.50% 7.5 – 9.5 0.25% – 0.75% 1,012.0 – 1,242.2 1,361.7 – 1,621.7 Growth Wedge 2 6.50% – 7.50% 9.0 – 11.0 0.75% – 1.75% 219.9 – 490.2 1,037.0 – 1,929.5 Total Enterprise Value(Pre-Corporate G&A and Taxes) $9,855.7 – $11,987.7 $13,969.2 – $17,921.4 Less: Value of Corporate G&A 3 8.8x – 10.8x 8.8x – 10.8x (67.4) – (82.7) (67.5) – (82.9) Less: Value of Cash Taxes 4 6.50% – 7.50% NA – NA 0.25% – 0.75% (27.1) – (27.5) (2,861.4) – (3,738.4) Total Enterprise Value $9,761.2 – $11,877.6 $11,040.3 – $14,100.1 Less: Debt as of January 1, 2020 5 (5,015.5) (5,015.5) (5,015.5) (5,015.5) Plus: Cash as of January 1, 2020 16.0 16.0 16.0 16.0 Implied Equity Value $4,761.7 – $6,878.0 $6,040.8 – $9,100.6 TGE Shares Outstanding 281.334 281.334 281.334 281.334 Implied TGE Share Value $16.93 – $24.45 $21.47 – $32.35 1. Per TGE management 2. Growth Wedge discounted at WACC range for Corporate-Level Analysis utilizing EBITDA exit multiples and perpetuity growth rate ranges consistent with those in the Corporate-Level Analysis 3. EBITDA multiples weighted by the respective Enterprise Values 4. Assumes the corporate-level WACC and perpetuity growth rate 5. Includes 75% of REX debt 31
Subject to Change Historical Growth Capital Expenditure Case Discounted Cash Flow Analysis – REX ($ in millions) For the Years Ending December 31, EBITDA Perpetuity 2020E 2021E 2022E 2023E Multiple Growth EBITDA $601.3 $602.9 $598.6 $596.8 $596.8 $596.8 Less: Growth Capital Expenditures (40.4) -———-Less: Maintenance Capital Expenditures (15.9) (16.2) (16.6) (16.9) (16.9) Unlevered Free Cash Flow $544.9 $586.6 $582.1 $579.9 $579.9 EBITDA Multiple / Perpetuity Growth Rate 10.0x 0.50% Implied Terminal Value $5,967.7 $8,965.7 PV of Terminal Value @ 7.00% Discount Rate $4,552.8 $7,075.2 Plus: PV of Unlevered Free Cash Flow @ 7.00% Discount Rate 2,005.8 Implied Asset Value $6,558.6 – $9,081.1 Implied Asset Value – 75.0% Interest Attributed to TGE $4,918.9 – $6,810.8 EBITDA Exit Multiple Sensitivities Perpetuity Growth Rate Sensitivities Terminal EBITDA Multiple Perpetuity Growth Rate 8.0x 9.0x 10.0x 11.0x 12.0x —% 0.25% 0.50% 0.75% 1.00% 6.00% $4,368.3 $4,722.8 $5,077.3 $5,431.9 $5,786.4 6.00% $7,443.2 $7,715.7 $8,012.8 $8,338.3 $8,696.4 6.50% 4,301.4 4,649.3 4,997.3 5,345.2 5,693.1 6.50% 6,885.4 7,114.1 7,361.8 7,631.0 7,924.7 WACC 7.00% 4,236.0 4,577.5 4,918.9 5,260.4 5,601.9 WACC 7.00% 6,407.3 6,601.6 6,810.8 7,036.8 7,281.6 7.50% 4,172.0 4,507.2 4,842.3 5,177.5 5,512.6 7.50% 5,992.8 6,159.7 6,338.5 6,530.6 6,737.4 8.00% 4,109.4 4,438.4 4,767.4 5,096.4 5,425.4 8.00% 5,630.2 5,774.8 5,929.1 6,094.1 6,270.8 Source: TGE management 32
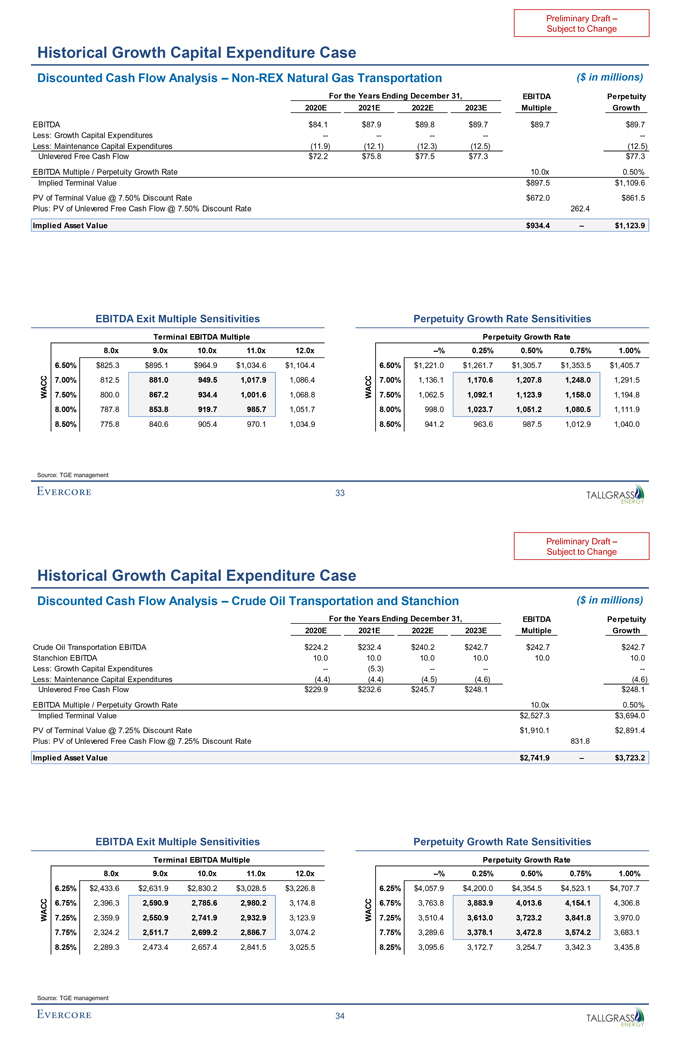
Preliminary Draft –Subject to Change Historical Growth Capital Expenditure Case Discounted Cash Flow Analysis –Non-REX Natural Gas Transportation ($ in millions) For the Years Ending December 31, EBITDA Perpetuity 2020E 2021E 2022E 2023E Multiple Growth EBITDA $84.1 $87.9 $89.8 $89.7 $89.7 $89.7 Less: Growth Capital Expenditures -————-Less: Maintenance Capital Expenditures (11.9) (12.1) (12.3) (12.5) (12.5) Unlevered Free Cash Flow $72.2 $75.8 $77.5 $77.3 $77.3 EBITDA Multiple / Perpetuity Growth Rate 10.0x 0.50% Implied Terminal Value $897.5 $1,109.6 PV of Terminal Value @ 7.50% Discount Rate $672.0 $861.5 Plus: PV of Unlevered Free Cash Flow @ 7.50% Discount Rate 262.4 Implied Asset Value $934.4 – $1,123.9 EBITDA Exit Multiple Sensitivities Perpetuity Growth Rate Sensitivities Terminal EBITDA Multiple Perpetuity Growth Rate 8.0x 9.0x 10.0x 11.0x 12.0x —% 0.25% 0.50% 0.75% 1.00% 6.50% $825.3 $895.1 $964.9 $1,034.6 $1,104.4 6.50% $1,221.0 $1,261.7 $1,305.7 $1,353.5 $1,405.7 7.00% 812.5 881.0 949.5 1,017.9 1,086.4 7.00% 1,136.1 1,170.6 1,207.8 1,248.0 1,291.5 WACC 7.50% 800.0 867.2 934.4 1,001.6 1,068.8 WACC 7.50% 1,062.5 1,092.1 1,123.9 1,158.0 1,194.8 8.00% 787.8 853.8 919.7 985.7 1,051.7 8.00% 998.0 1,023.7 1,051.2 1,080.5 1,111.9 8.50% 775.8 840.6 905.4 970.1 1,034.9 8.50% 941.2 963.6 987.5 1,012.9 1,040.0 Source: TGE management 33
Preliminary Draft –Subject to Change Historical Growth Capital Expenditure Case Discounted Cash Flow Analysis – Crude Oil Transportation and Stanchion ($ in millions) For the Years Ending December 31, EBITDA Perpetuity 2020E 2021E 2022E 2023E Multiple Growth Crude Oil Transportation EBITDA $224.2 $232.4 $240.2 $242.7 $242.7 $242.7 Stanchion EBITDA 10.0 10.0 10.0 10.0 10.0 10.0 Less: Growth Capital Expenditures — (5.3) -——-Less: Maintenance Capital Expenditures (4.4) (4.4) (4.5) (4.6) (4.6) Unlevered Free Cash Flow $229.9 $232.6 $245.7 $248.1 $248.1 EBITDA Multiple / Perpetuity Growth Rate 10.0x 0.50% Implied Terminal Value $2,527.3 $3,694.0 PV of Terminal Value @ 7.25% Discount Rate $1,910.1 $2,891.4 Plus: PV of Unlevered Free Cash Flow @ 7.25% Discount Rate 831.8 Implied Asset Value $2,741.9 – $3,723.2 EBITDA Exit Multiple Sensitivities Perpetuity Growth Rate Sensitivities Terminal EBITDA Multiple Perpetuity Growth Rate 8.0x 9.0x 10.0x 11.0x 12.0x —% 0.25% 0.50% 0.75% 1.00% 6.25% $2,433.6 $2,631.9 $2,830.2 $3,028.5 $3,226.8 6.25% $4,057.9 $4,200.0 $4,354.5 $4,523.1 $4,707.7 6.75% 2,396.3 2,590.9 2,785.6 2,980.2 3,174.8 6.75% 3,763.8 3,883.9 4,013.6 4,154.1 4,306.8 WACC 7.25% 2,359.9 2,550.9 2,741.9 2,932.9 3,123.9 WACC 7.25% 3,510.4 3,613.0 3,723.2 3,841.8 3,970.0 7.75% 2,324.2 2,511.7 2,699.2 2,886.7 3,074.2 7.75% 3,289.6 3,378.1 3,472.8 3,574.2 3,683.1 8.25% 2,289.3 2,473.4 2,657.4 2,841.5 3,025.5 8.25% 3,095.6 3,172.7 3,254.7 3,342.3 3,435.8 Source: TGE management 34
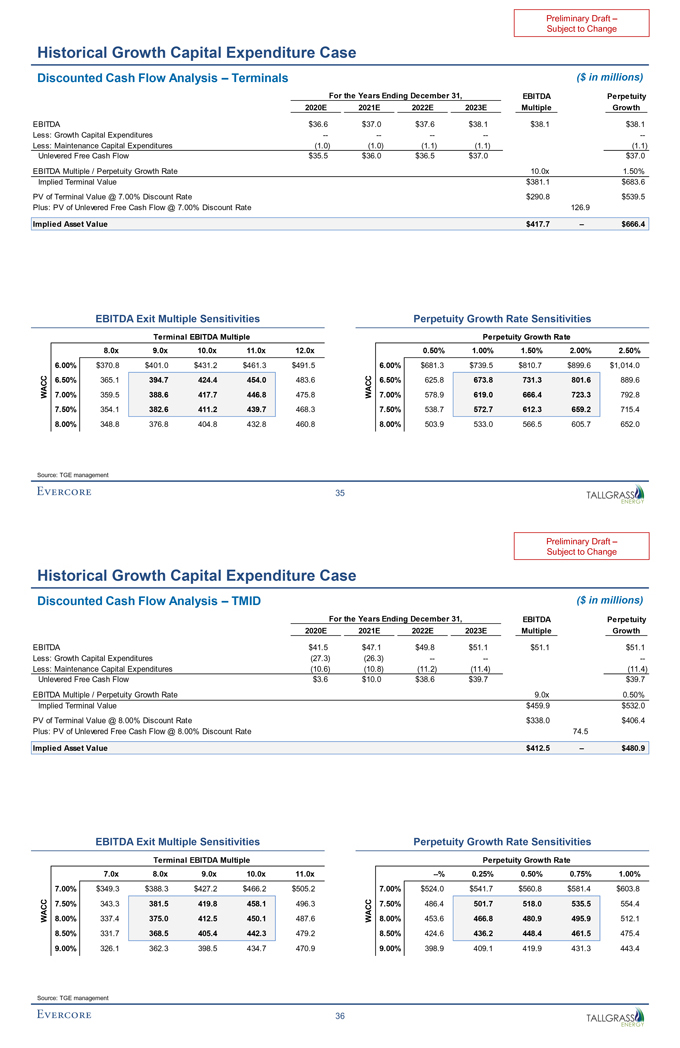
Preliminary Draft –Subject to Change Historical Growth Capital Expenditure Case Discounted Cash Flow Analysis – Terminals ($ in millions) For the Years Ending December 31, EBITDA Perpetuity 2020E 2021E 2022E 2023E Multiple Growth EBITDA $36.6 $37.0 $37.6 $38.1 $38.1 $38.1 Less: Growth Capital Expenditures -————-Less: Maintenance Capital Expenditures (1.0) (1.0) (1.1) (1.1) (1.1) Unlevered Free Cash Flow $35.5 $36.0 $36.5 $37.0 $37.0 EBITDA Multiple / Perpetuity Growth Rate 10.0x 1.50% Implied Terminal Value $381.1 $683.6 PV of Terminal Value @ 7.00% Discount Rate $290.8 $539.5 Plus: PV of Unlevered Free Cash Flow @ 7.00% Discount Rate 126.9 Implied Asset Value $417.7 – $666.4 EBITDA Exit Multiple Sensitivities Perpetuity Growth Rate Sensitivities Terminal EBITDA Multiple Perpetuity Growth Rate 8.0x 9.0x 10.0x 11.0x 12.0x 0.50% 1.00% 1.50% 2.00% 2.50% 6.00% $370.8 $401.0 $431.2 $461.3 $491.5 6.00% $681.3 $739.5 $810.7 $899.6 $1,014.0 6.50% 365.1 394.7 424.4 454.0 483.6 6.50% 625.8 673.8 731.3 801.6 889.6 WACC 7.00% 359.5 388.6 417.7 446.8 475.8 WACC 7.00% 578.9 619.0 666.4 723.3 792.8 7.50% 354.1 382.6 411.2 439.7 468.3 7.50% 538.7 572.7 612.3 659.2 715.4 8.00% 348.8 376.8 404.8 432.8 460.8 8.00% 503.9 533.0 566.5 605.7 652.0 Source: TGE management 35
Preliminary Draft –Subject to Change Historical Growth Capital Expenditure Case Discounted Cash Flow Analysis – TMID ($ in millions) For the Years Ending December 31, EBITDA Perpetuity 2020E 2021E 2022E 2023E Multiple Growth EBITDA $41.5 $47.1 $49.8 $51.1 $51.1 $51.1 Less: Growth Capital Expenditures (27.3) (26.3) -——-Less: Maintenance Capital Expenditures (10.6) (10.8) (11.2) (11.4) (11.4) Unlevered Free Cash Flow $3.6 $10.0 $38.6 $39.7 $39.7 EBITDA Multiple / Perpetuity Growth Rate 9.0x 0.50% Implied Terminal Value $459.9 $532.0 PV of Terminal Value @ 8.00% Discount Rate $338.0 $406.4 Plus: PV of Unlevered Free Cash Flow @ 8.00% Discount Rate 74.5 Implied Asset Value $412.5 – $480.9 EBITDA Exit Multiple Sensitivities Perpetuity Growth Rate Sensitivities Terminal EBITDA Multiple Perpetuity Growth Rate 7.0x 8.0x 9.0x 10.0x 11.0x —% 0.25% 0.50% 0.75% 1.00% 7.00% $349.3 $388.3 $427.2 $466.2 $505.2 7.00% $524.0 $541.7 $560.8 $581.4 $603.8 C AC 7.50% 343.3 381.5 419.8 458.1 496.3 C AC 7.50% 486.4 501.7 518.0 535.5 554.4 W 8.00% 337.4 375.0 412.5 450.1 487.6 W 8.00% 453.6 466.8 480.9 495.9 512.1 8.50% 331.7 368.5 405.4 442.3 479.2 8.50% 424.6 436.2 448.4 461.5 475.4 9.00% 326.1 362.3 398.5 434.7 470.9 9.00% 398.9 409.1 419.9 431.3 443.4 Source: TGE management 36
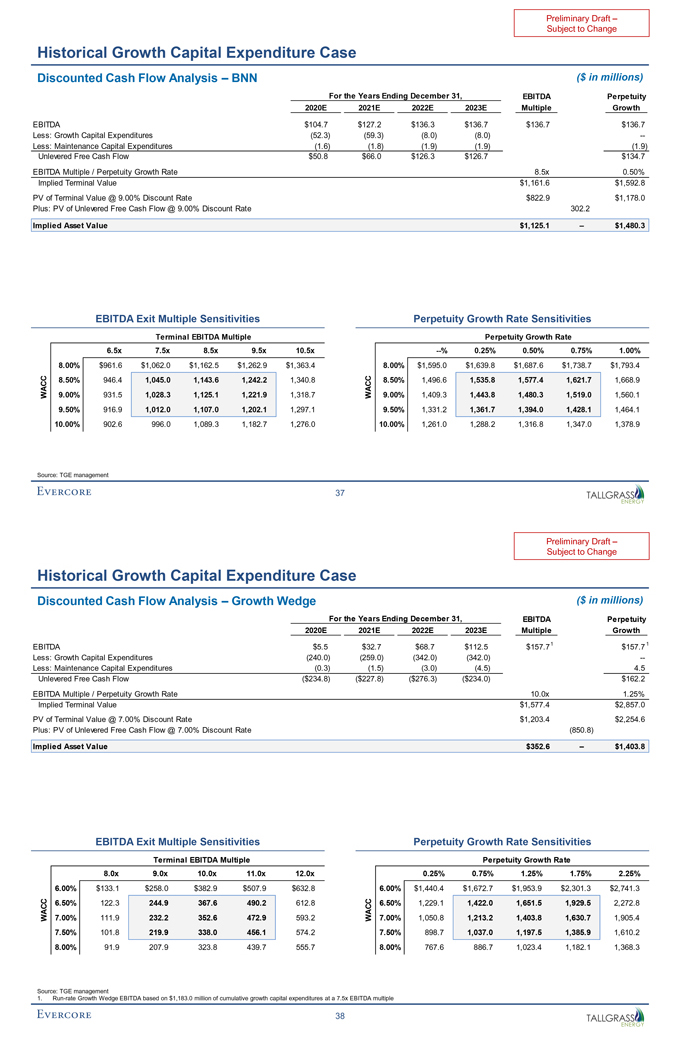
Preliminary Draft –Subject to Change Historical Growth Capital Expenditure Case Discounted Cash Flow Analysis – BNN ($ in millions) For the Years Ending December 31, EBITDA Perpetuity 2020E 2021E 2022E 2023E Multiple Growth EBITDA $104.7 $127.2 $136.3 $136.7 $136.7 $136.7 Less: Growth Capital Expenditures (52.3) (59.3) (8.0) (8.0) —Less: Maintenance Capital Expenditures (1.6) (1.8) (1.9) (1.9) (1.9) Unlevered Free Cash Flow $50.8 $66.0 $126.3 $126.7 $134.7 EBITDA Multiple / Perpetuity Growth Rate 8.5x 0.50% Implied Terminal Value $1,161.6 $1,592.8 PV of Terminal Value @ 9.00% Discount Rate $822.9 $1,178.0 Plus: PV of Unlevered Free Cash Flow @ 9.00% Discount Rate 302.2 Implied Asset Value $1,125.1 – $1,480.3 EBITDA Exit Multiple Sensitivities Perpetuity Growth Rate Sensitivities Terminal EBITDA Multiple Perpetuity Growth Rate 6.5x 7.5x 8.5x 9.5x 10.5x —% 0.25% 0.50% 0.75% 1.00% 8.00% $961.6 $1,062.0 $1,162.5 $1,262.9 $1,363.4 8.00% $1,595.0 $1,639.8 $1,687.6 $1,738.7 $1,793.4 C 8.50% 946.4 1,045.0 1,143.6 1,242.2 1,340.8 C 8.50% 1,496.6 1,535.8 1,577.4 1,621.7 1,668.9 WAC 9.00% 931.5 1,028.3 1,125.1 1,221.9 1,318.7 WAC 9.00% 1,409.3 1,443.8 1,480.3 1,519.0 1,560.1 9.50% 916.9 1,012.0 1,107.0 1,202.1 1,297.1 9.50% 1,331.2 1,361.7 1,394.0 1,428.1 1,464.1 10.00% 902.6 996.0 1,089.3 1,182.7 1,276.0 10.00% 1,261.0 1,288.2 1,316.8 1,347.0 1,378.9 Source: TGE management 37
Preliminary Draft –Subject to Change Historical Growth Capital Expenditure Case Discounted Cash Flow Analysis – Growth Wedge ($ in millions) For the Years Ending December 31, EBITDA Perpetuity 2020E 2021E 2022E 2023E Multiple Growth EBITDA $5.5 $32.7 $68.7 $112.5 $157.71 $157.7 1 Less: Growth Capital Expenditures (240.0) (259.0) (342.0) (342.0) —Less: Maintenance Capital Expenditures (0.3) (1.5) (3.0) (4.5) 4.5 Unlevered Free Cash Flow ($234.8) ($227.8) ($276.3) ($234.0) $162.2 EBITDA Multiple / Perpetuity Growth Rate 10.0x 1.25% Implied Terminal Value $1,577.4 $2,857.0 PV of Terminal Value @ 7.00% Discount Rate $1,203.4 $2,254.6 Plus: PV of Unlevered Free Cash Flow @ 7.00% Discount Rate (850.8) Implied Asset Value $352.6 – $1,403.8 EBITDA Exit Multiple Sensitivities Perpetuity Growth Rate Sensitivities Terminal EBITDA Multiple Perpetuity Growth Rate 8.0x 9.0x 10.0x 11.0x 12.0x 0.25% 0.75% 1.25% 1.75% 2.25% 6.00% $133.1 $258.0 $382.9 $507.9 $632.8 6.00% $1,440.4 $1,672.7 $1,953.9 $2,301.3 $2,741.3 6.50% 122.3 244.9 367.6 490.2 612.8 6.50% 1,229.1 1,422.0 1,651.5 1,929.5 2,272.8 WACC 7.00% 111.9 232.2 352.6 472.9 593.2 WACC 7.00% 1,050.8 1,213.2 1,403.8 1,630.7 1,905.4 7.50% 101.8 219.9 338.0 456.1 574.2 7.50% 898.7 1,037.0 1,197.5 1,385.9 1,610.2 8.00% 91.9 207.9 323.8 439.7 555.7 8.00% 767.6 886.7 1,023.4 1,182.1 1,368.3 Source: TGE management 1.Run-rate Growth Wedge EBITDA based on $1,183.0 million of cumulative growth capital expenditures at a 7.5x EBITDA multiple 38
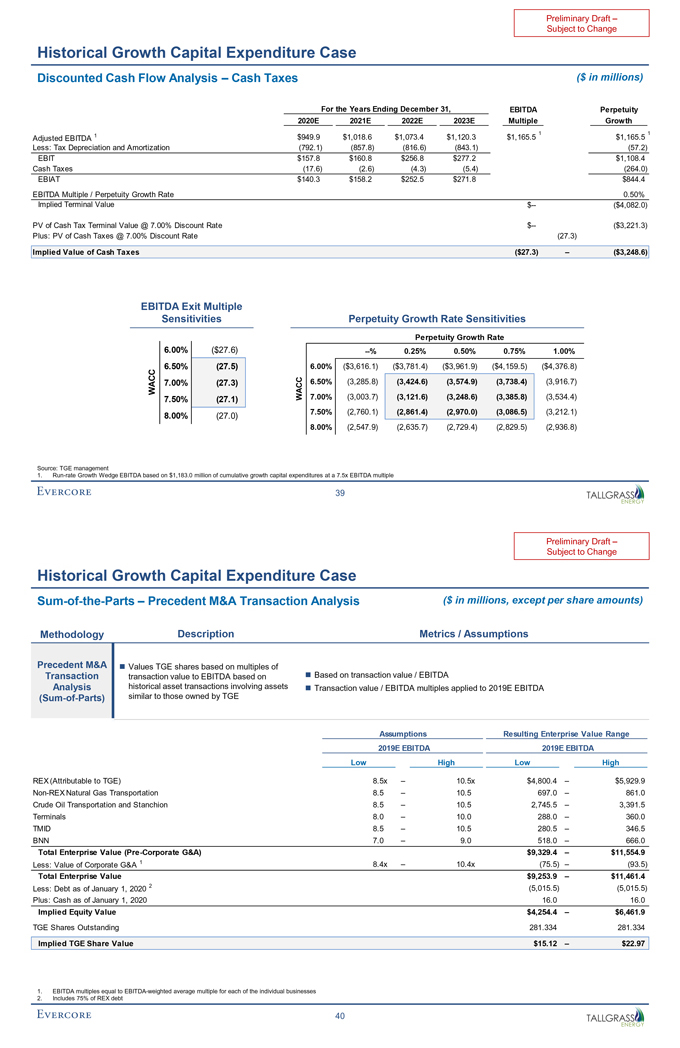
Preliminary Draft –Subject to Change Historical Growth Capital Expenditure Case Discounted Cash Flow Analysis – Cash Taxes ($ in millions) For the Years Ending December 31, EBITDA Perpetuity 2020E 2021E 2022E 2023E Multiple Growth 1 1 Adjusted EBITDA 1 $949.9 $1,018.6 $1,073.4 $1,120.3 $1,165.5 $1,165.5 Less: Tax Depreciation and Amortization (792.1) (857.8) (816.6) (843.1) (57.2) EBIT $157.8 $160.8 $256.8 $277.2 $1,108.4 Cash Taxes (17.6) (2.6) (4.3) (5.4) (264.0) EBIAT $140.3 $158.2 $252.5 $271.8 $844.4 EBITDA Multiple / Perpetuity Growth Rate 0.50% Implied Terminal Value $— ($4,082.0) PV of Cash Tax Terminal Value @ 7.00% Discount Rate $— ($3,221.3) Plus: PV of Cash Taxes @ 7.00% Discount Rate (27.3) Implied Value of Cash Taxes ($27.3) – ($3,248.6) EBITDA Exit Multiple Sensitivities Perpetuity Growth Rate Sensitivities Perpetuity Growth Rate 6.00% ($27.6) —% 0.25% 0.50% 0.75% 1.00% C 6.50% (27.5) 6.00% ($3,616.1) ($3,781.4) ($3,961.9) ($4,159.5) ($4,376.8) C 6.50% (3,285.8) (3,424.6) (3,574.9) (3,738.4) (3,916.7) WA 7.00% (27.3) 7.50% (27.1) WACC 7.00% (3,003.7) (3,121.6) (3,248.6) (3,385.8) (3,534.4) 7.50% (2,760.1) (2,861.4) (2,970.0) (3,086.5) (3,212.1) 8.00% (27.0) 8.00% (2,547.9) (2,635.7) (2,729.4) (2,829.5) (2,936.8) Source: TGE management 1.Run-rate Growth Wedge EBITDA based on $1,183.0 million of cumulative growth capital expenditures at a 7.5x EBITDA multiple 39
Preliminary Draft –Subject to Change Historical Growth Capital Expenditure CaseSum-of-the-Parts – Precedent M&A Transaction Analysis ($ in millions, except per share amounts) Methodology Description Metrics / Assumptions Precedent M&A ï® Values TGE shares based on multiples of Transaction transaction value to EBITDA based on ï® Based on transaction value / EBITDA Analysis historical asset transactions involving assetsï® Transaction value / EBITDA multiples applied to 2019E EBITDA(Sum-of-Parts) similar to those owned by TGE Assumptions Resulting Enterprise Value Range 2019E EBITDA 2019E EBITDA Low High Low High REX (Attributable to TGE) 8.5x – 10.5x $4,800.4 – $5,929.9Non-REX Natural Gas Transportation 8.5 – 10.5 697.0 – 861.0 Crude Oil Transportation and Stanchion 8.5 – 10.5 2,745.5 – 3,391.5 Terminals 8.0 – 10.0 288.0 – 360.0 TMID 8.5 – 10.5 280.5 – 346.5 BNN 7.0 – 9.0 518.0 – 666.0 Total Enterprise Value(Pre-Corporate G&A) $9,329.4 – $11,554.9 Less: Value of Corporate G&A 1 8.4x – 10.4x (75.5) – (93.5) Total Enterprise Value $9,253.9 – $11,461.4 Less: Debt as of January 1, 2020 2 (5,015.5) (5,015.5) Plus: Cash as of January 1, 2020 16.0 16.0 Implied Equity Value $4,254.4 – $6,461.9 TGE Shares Outstanding 281.334 281.334 Implied TGE Share Value $15.12 – $22.97 1. EBITDA multiples equal to EBITDA-weighted average multiple for each of the individual businesses 2. Includes 75% of REX debt 40
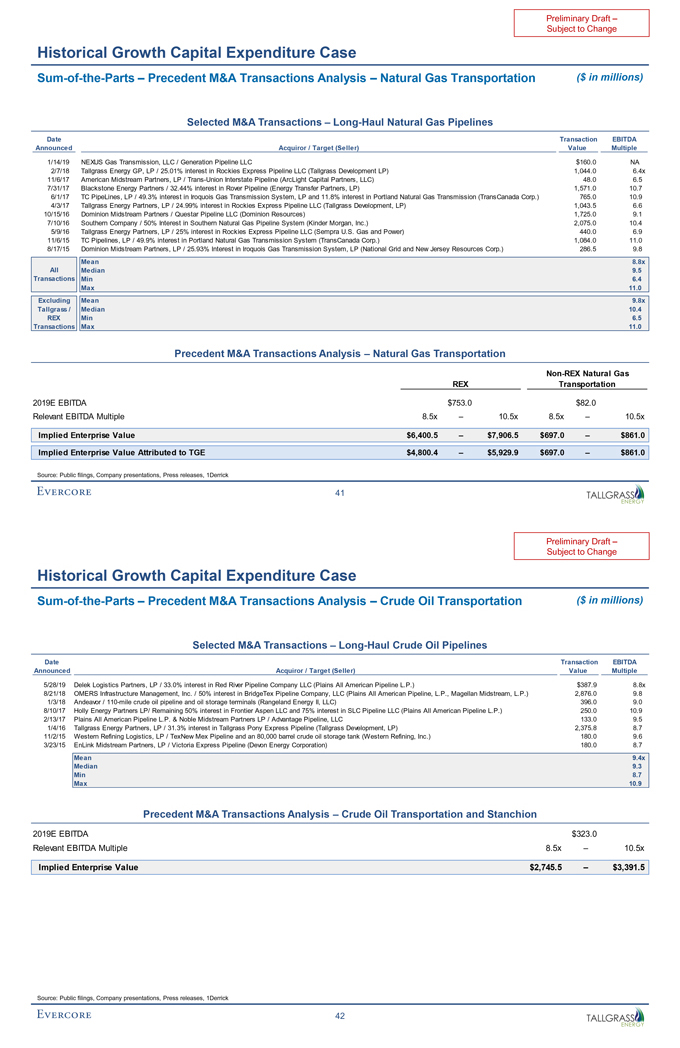
Preliminary Draft –Subject to Change Historical Growth Capital Expenditure CaseSum-of-the-Parts – Precedent M&A Transactions Analysis – Natural Gas Transportation ($ in millions) Selected M&A Transactions – Long-Haul Natural Gas Pipelines Date Transaction EBITDA Announced Acquiror / Target (Seller) Value Multiple 1/14/19 NEXUS Gas Transmission, LLC / Generation Pipeline LLC $160.0 NA 2/7/18 Tallgrass Energy GP, LP / 25.01% interest in Rockies Express Pipeline LLC (Tallgrass Development LP) 1,044.0 6.4x 11/6/17 American Midstream Partners, LP / Trans-Union Interstate Pipeline (ArcLight Capital Partners, LLC) 48.0 6.5 7/31/17 Blackstone Energy Partners / 32.44% interest in Rover Pipeline (Energy Transfer Partners, LP) 1,571.0 10.7 6/1/17 TC PipeLines, LP / 49.3% interest in Iroquois Gas Transmission System, LP and 11.8% interest in Portland Natural Gas Transmission (TransCanada Corp.) 765.0 10.9 4/3/17 Tallgrass Energy Partners, LP / 24.99% interest in Rockies Express Pipeline LLC (Tallgrass Development, LP) 1,043.5 6.6 10/15/16 Dominion Midstream Partners / Questar Pipeline LLC (Dominion Resources) 1,725.0 9.1 7/10/16 Southern Company / 50% Interest in Southern Natural Gas Pipeline System (Kinder Morgan, Inc.) 2,075.0 10.4 5/9/16 Tallgrass Energy Partners, LP / 25% interest in Rockies Express Pipeline LLC (Sempra U.S. Gas and Power) 440.0 6.9 11/6/15 TC Pipelines, LP / 49.9% interest in Portland Natural Gas Transmission System (TransCanada Corp.) 1,084.0 11.0 8/17/15 Dominion Midstream Partners, LP / 25.93% Interest in Iroquois Gas Transmission System, LP (National Grid and New Jersey Resources Corp.) 286.5 9.8 Mean 8.8x All Median 9.5 Transactions Min 6.4 Max 11.0 Excluding Mean 9.8x Tallgrass / Median 10.4 REX Min 6.5 Transactions Max 11.0 Precedent M&A Transactions Analysis – Natural Gas TransportationNon-REX Natural Gas REX Transportation 2019E EBITDA $753.0 $82.0 Relevant EBITDA Multiple 8.5x – 10.5x 8.5x – 10.5x Implied Enterprise Value $6,400.5 – $7,906.5 $697.0 – $861.0 Implied Enterprise Value Attributed to TGE $4,800.4 – $5,929.9 $697.0 – $861.0 Source: Public filings, Company presentations, Press releases, 1Derrick 41
Preliminary Draft –Subject to Change Historical Growth Capital Expenditure CaseSum-of-the-Parts – Precedent M&A Transactions Analysis – Crude Oil Transportation ($ in millions) Selected M&A Transactions – Long-Haul Crude Oil Pipelines Date Transaction EBITDA Announced Acquiror / Target (Seller) Value Multiple 5/28/19 Delek Logistics Partners, LP / 33.0% interest in Red River Pipeline Company LLC (Plains All American Pipeline L.P.) $387.9 8.8x 8/21/18 OMERS Infrastructure Management, Inc. / 50% interest in BridgeTex Pipeline Company, LLC (Plains All American Pipeline, L.P., Magellan Midstream, L.P.) 2,876.0 9.8 1/3/18 Andeavor /110-mile crude oil pipeline and oil storage terminals (Rangeland Energy II, LLC) 396.0 9.0 8/10/17 Holly Energy Partners LP/ Remaining 50% interest in Frontier Aspen LLC and 75% interest in SLC Pipeline LLC (Plains All American Pipeline L.P.) 250.0 10.9 2/13/17 Plains All American Pipeline L.P. & Noble Midstream Partners LP / Advantage Pipeline, LLC 133.0 9.5 1/4/16 Tallgrass Energy Partners, LP / 31.3% interest in Tallgrass Pony Express Pipeline (Tallgrass Development, LP) 2,375.8 8.7 11/2/15 Western Refining Logistics, LP / TexNew Mex Pipeline and an 80,000 barrel crude oil storage tank (Western Refining, Inc.) 180.0 9.6 3/23/15 EnLink Midstream Partners, LP / Victoria Express Pipeline (Devon Energy Corporation) 180.0 8.7 Mean 9.4x Median 9.3 Min 8.7 Max 10.9 Precedent M&A Transactions Analysis – Crude Oil Transportation and Stanchion 2019E EBITDA $323.0 Relevant EBITDA Multiple 8.5x – 10.5x Implied Enterprise Value $2,745.5 – $3,391.5 Source: Public filings, Company presentations, Press releases, 1Derrick 42
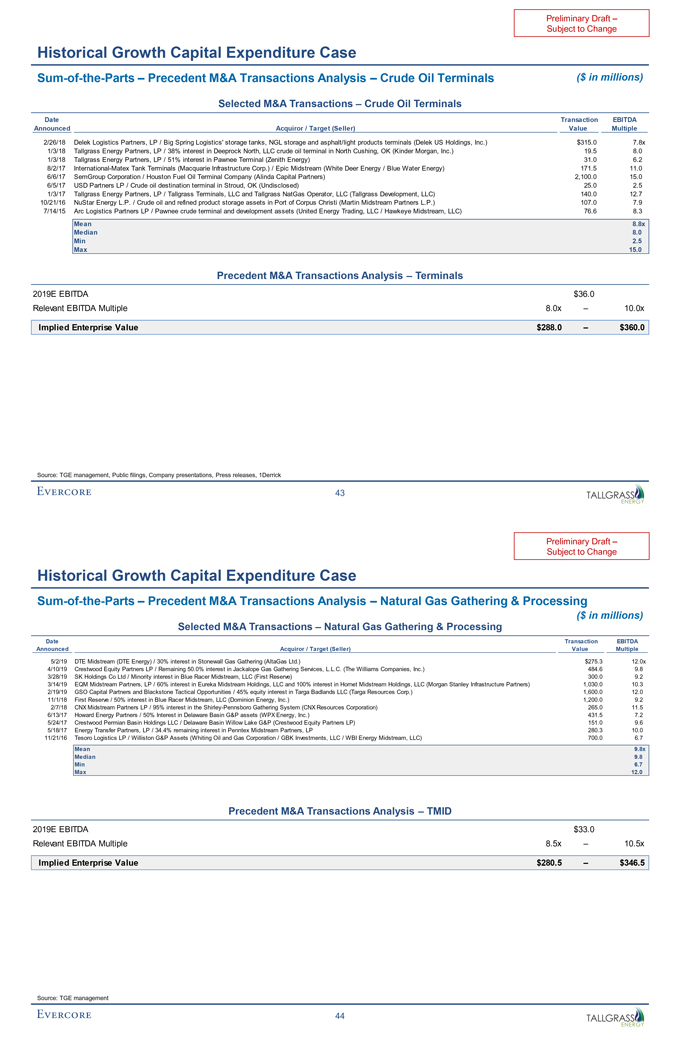
Preliminary Draft –Subject to Change Historical Growth Capital Expenditure CaseSum-of-the-Parts – Precedent M&A Transactions Analysis – Crude Oil Terminals ($ in millions) Selected M&A Transactions – Crude Oil Terminals Date Transaction EBITDA Announced Acquiror / Target (Seller) Value Multiple 2/26/18 Delek Logistics Partners, LP / Big Spring Logistics’ storage tanks, NGL storage and asphalt/light products terminals (Delek US Holdings, Inc.) $315.0 7.8x 1/3/18 Tallgrass Energy Partners, LP / 38% interest in Deeprock North, LLC crude oil terminal in North Cushing, OK (Kinder Morgan, Inc.) 19.5 8.0 1/3/18 Tallgrass Energy Partners, LP / 51% interest in Pawnee Terminal (Zenith Energy) 31.0 6.2 8/2/17 International-Matex Tank Terminals (Macquarie Infrastructure Corp.) / Epic Midstream (White Deer Energy / Blue Water Energy) 171.5 11.0 6/6/17 SemGroup Corporation / Houston Fuel Oil Terminal Company (Alinda Capital Partners) 2,100.0 15.0 6/5/17 USD Partners LP / Crude oil destination terminal in Stroud, OK (Undisclosed) 25.0 2.5 1/3/17 Tallgrass Energy Partners, LP / Tallgrass Terminals, LLC and Tallgrass NatGas Operator, LLC (Tallgrass Development, LLC) 140.0 12.7 10/21/16 NuStar Energy L.P. / Crude oil and refined product storage assets in Port of Corpus Christi (Martin Midstream Partners L.P.) 107.0 7.9 7/14/15 Arc Logistics Partners LP / Pawnee crude terminal and development assets (United Energy Trading, LLC / Hawkeye Midstream, LLC) 76.6 8.3 Mean 8.8x Median 8.0 Min 2.5 Max 15.0 Precedent M&A Transactions Analysis – Terminals 2019E EBITDA $36.0 Relevant EBITDA Multiple 8.0x – 10.0x Implied Enterprise Value $288.0 – $360.0 Source: TGE management, Public filings, Company presentations, Press releases, 1Derrick 43
Preliminary Draft –Subject to Change Historical Growth Capital Expenditure CaseSum-of-the-Parts – Precedent M&A Transactions Analysis – Natural Gas Gathering & Processing ($ in millions) Selected M&A Transactions – Natural Gas Gathering & Processing Date Transaction EBITDA Announced Acquiror / Target (Seller) Value Multiple 5/2/19 DTE Midstream (DTE Energy) / 30% interest in Stonewall Gas Gathering (AltaGas Ltd.) $275.3 12.0x 4/10/19 Crestwood Equity Partners LP / Remaining 50.0% interest in Jackalope Gas Gathering Services, L.L.C. (The Williams Companies, Inc.) 484.6 9.8 3/28/19 SK Holdings Co Ltd / Minority interest in Blue Racer Midstream, LLC (First Reserve) 300.0 9.2 3/14/19 EQM Midstream Partners, LP / 60% interest in Eureka Midstream Holdings, LLC and 100% interest in Hornet Midstream Holdings, LLC (Morgan Stanley Infrastructure Partners) 1,030.0 10.3 2/19/19 GSO Capital Partners and Blackstone Tactical Opportunities / 45% equity interest in Targa Badlands LLC (Targa Resources Corp.) 1,600.0 12.0 11/1/18 First Reserve / 50% interest in Blue Racer Midstream, LLC (Dominion Energy, Inc.) 1,200.0 9.2 2/7/18 CNX Midstream Partners LP / 95% interest in the Shirley-Pennsboro Gathering System (CNX Resources Corporation) 265.0 11.5 6/13/17 Howard Energy Partners / 50% Interest in Delaware Basin G&P assets (WPX Energy, Inc.) 431.5 7.2 5/24/17 Crestwood Permian Basin Holdings LLC / Delaware Basin Willow Lake G&P (Crestwood Equity Partners LP) 151.0 9.6 5/18/17 Energy Transfer Partners, LP / 34.4% remaining interest in Penntex Midstream Partners, LP 280.3 10.0 11/21/16 Tesoro Logistics LP / Williston G&P Assets (Whiting Oil and Gas Corporation / GBK Investments, LLC / WBI Energy Midstream, LLC) 700.0 6.7 Mean 9.8x Median 9.8 Min 6.7 Max 12.0 Precedent M&A Transactions Analysis – TMID 2019E EBITDA $33.0 Relevant EBITDA Multiple 8.5x – 10.5x Implied Enterprise Value $280.5 – $346.5 Source: TGE management 44

Preliminary Draft –Subject to Change Historical Growth Capital Expenditure CaseSum-of-the-Parts – Precedent M&A Transactions Analysis – Water Logistics ($ in millions) Selected M&A Transactions – Water Logistics Date Transaction EBITDA Announced Acquiror / Target (Seller) Value Multiple 9/26/19 NGL Energy Partners LP / Hillstone Environmental Partners, LLC $600.0 7.0x 5/14/19 NGL Energy Partners LP / Mesquite Disposals Unlimited, LLC 890.0 8.3 12/20/18 WaterBridge Resources LLC / 9 SWD wells and additional permits (NGL Energy Partners LP) 238.8 9.6 10/31/18 WaterBridge Resources LLC / Delaware Basin water infrastructure assets (Halcón Resources Corporation) 200.0 9.1 10/5/18 Nuverra Environmental Solutions, Inc. / Clearwater Solutions 41.9 5.2 2/7/18 Tallgrass Energy Partners, LP / Buckhorn SWD Solutions, LLC and Buckhorn Energy Services, LLC 95.0 5.0 12/16/15 Tallgrass Energy Partners, LP / BNN Western, LLC (Whiting Oil and Gas Corporation) 75.0 9.0 9/18/15 Antero Midstream Partners LP / Appalachia freshwater delivery and produced water treatment & disposal (Antero Resources Corp.) 1,050.0 8.8 9/2/14 Ferrellgas Partners LP / Two saltwater disposal wells in Eagle Ford, an option to acquire an additional SWD well (C&E Production, LLC) 65.0 6.0 7/9/14 NGL Energy Partners LP / 5 SWD wells in the Eagle Ford and the Permian 83.0 5.2 Mean 7.3x Median 7.7 Min 5.0 Max 9.6 Precedent M&A Transactions Analysis – BNN 2019E EBITDA $74.0 Relevant EBITDA Multiple 7.0x – 9.0x Implied Enterprise Value $518.0 – $666.0 Source: TGE management 45
Preliminary Draft –Subject to Change Historical Growth Capital Expenditure CaseSum-of-the-Parts – Peer Group Trading Analysis ($ in millions, except per share amounts) Methodology Description Metrics / Assumptions Peer Group ï® Valuation based on multiples of enterprise Trading value / relevant EBITDA for publicly traded ï® Based on enterprise value / EBITDA Analysis entities with assets similar to those owned by ï® Enterprise value / EBITDA multiples applied to 2020E and 2021E EBITDA(Sum-of-Parts) TGE Assumptions Resulting Enterprise Value Range 2020E EBITDA 2021E EBITDA 2020E EBITDA 2021E EBITDA Low High Low High Low High Low High REX (Attributable to TGE) 9.5x – 11.5x 9.0x – 11.0x $4,283.9 – $5,185.8 $4,069.2 – $4,973.5Non-REX Natural Gas Transportation 9.5 – 11.5 9.0 – 11.0 799.1 – 967.4 791.2 – 967.1 Crude Oil Transportation and Stanchion 9.0 – 11.0 8.5 – 10.5 2,017.9 – 2,466.4 1,975.2 – 2,440.0 Terminals 7.0 – 9.0 6.5 – 8.5 255.9 – 329.1 240.7 – 314.7 TMID 7.5 – 9.5 7.0 – 9.0 311.4 – 394.5 329.7 – 423.8 BNN 6.0 – 8.0 5.5 – 6.5 628.4 – 837.9 699.3 – 826.5 Growth Wedge 1 8.8 – 10.8 8.2 – 10.1 288.1 – 353.5 566.4 – 695.0 Total Enterprise Value(Pre-Corporate G&A) $8,584.8 – $10,534.4 $8,671.7 – $10,640.6 Less: Value of Corporate G&A 1 8.8x – 10.8x 8.2x – 10.1x (67.4) – (82.7) (64.3) – (78.9) Total Enterprise Value $8,517.4 – $10,451.7 $8,607.4 – $10,561.6 Less: Debt as of January 1, 2020 2 (5,015.5) (5,015.5) (5,015.5) (5,015.5) Plus: Cash as of January 1, 2020 16.0 16.0 16.0 16.0 Implied Equity Value $3,517.9 – $5,452.2 $3,607.8 – $5,562.1 TGE Shares Outstanding 281.334 281.334 281.334 281.334 Implied TGE Share Value $12.50 – $19.38 $12.82 – $19.77 1. EBITDA multiples equal to EBITDA-weighted average multiple for each of the individual businesses 2. Includes 75% of REX debt 46
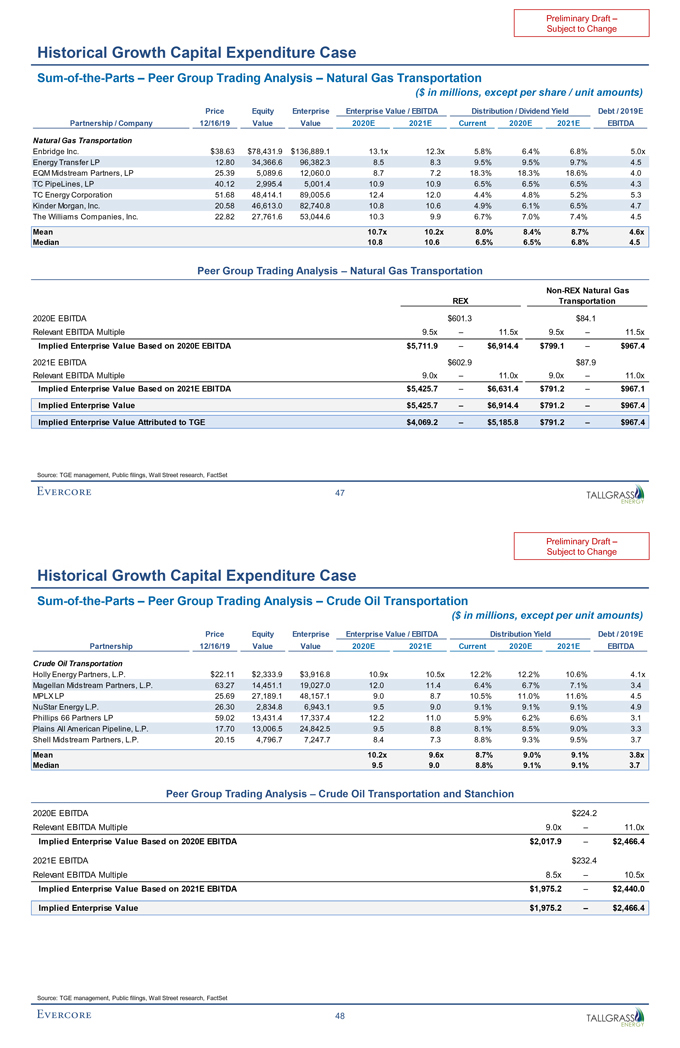
Preliminary Draft –Subject to Change Historical Growth Capital Expenditure CaseSum-of-the-Parts – Peer Group Trading Analysis – Natural Gas Transportation ($ in millions, except per share / unit amounts) Price Equity Enterprise Enterprise Value / EBITDA Distribution / Dividend Yield Debt / 2019E Partnership / Company 12/16/19 Value Value 2020E 2021E Current 2020E 2021E EBITDA Natural Gas Transportation Enbridge Inc. $38.63 $78,431.9 $136,889.1 13.1x 12.3x 5.8% 6.4% 6.8% 5.0x Energy Transfer LP 12.80 34,366.6 96,382.3 8.5 8.3 9.5% 9.5% 9.7% 4.5 EQM Midstream Partners, LP 25.39 5,089.6 12,060.0 8.7 7.2 18.3% 18.3% 18.6% 4.0 TC PipeLines, LP 40.12 2,995.4 5,001.4 10.9 10.9 6.5% 6.5% 6.5% 4.3 TC Energy Corporation 51.68 48,414.1 89,005.6 12.4 12.0 4.4% 4.8% 5.2% 5.3 Kinder Morgan, Inc. 20.58 46,613.0 82,740.8 10.8 10.6 4.9% 6.1% 6.5% 4.7 The Williams Companies, Inc. 22.82 27,761.6 53,044.6 10.3 9.9 6.7% 7.0% 7.4% 4.5 Mean 10.7x 10.2x 8.0% 8.4% 8.7% 4.6x Median 10.8 10.6 6.5% 6.5% 6.8% 4.5 Peer Group Trading Analysis – Natural Gas TransportationNon-REX Natural Gas REX Transportation 2020E EBITDA $601.3 $84.1 Relevant EBITDA Multiple 9.5x – 11.5x 9.5x – 11.5x Implied Enterprise Value Based on 2020E EBITDA $5,711.9 – $6,914.4 $799.1 – $967.4 2021E EBITDA $602.9 $87.9 Relevant EBITDA Multiple 9.0x – 11.0x 9.0x – 11.0x Implied Enterprise Value Based on 2021E EBITDA $5,425.7 – $6,631.4 $791.2 – $967.1 Implied Enterprise Value $5,425.7 – $6,914.4 $791.2 – $967.4 Implied Enterprise Value Attributed to TGE $4,069.2 – $5,185.8 $791.2 – $967.4 Source: TGE management, Public filings, Wall Street research, FactSet 47
Preliminary Draft –Subject to Change Historical Growth Capital Expenditure CaseSum-of-the-Parts – Peer Group Trading Analysis – Crude Oil Transportation ($ in millions, except per unit amounts) Price Equity Enterprise Enterprise Value / EBITDA Distribution Yield Debt / 2019E Partnership 12/16/19 Value Value 2020E 2021E Current 2020E 2021E EBITDA Crude Oil Transportation Holly Energy Partners, L.P. $22.11 $2,333.9 $3,916.8 10.9x 10.5x 12.2% 12.2% 10.6% 4.1x Magellan Midstream Partners, L.P. 63.27 14,451.1 19,027.0 12.0 11.4 6.4% 6.7% 7.1% 3.4 MPLX LP 25.69 27,189.1 48,157.1 9.0 8.7 10.5% 11.0% 11.6% 4.5 NuStar Energy L.P. 26.30 2,834.8 6,943.1 9.5 9.0 9.1% 9.1% 9.1% 4.9 Phillips 66 Partners LP 59.02 13,431.4 17,337.4 12.2 11.0 5.9% 6.2% 6.6% 3.1 Plains All American Pipeline, L.P. 17.70 13,006.5 24,842.5 9.5 8.8 8.1% 8.5% 9.0% 3.3 Shell Midstream Partners, L.P. 20.15 4,796.7 7,247.7 8.4 7.3 8.8% 9.3% 9.5% 3.7 Mean 10.2x 9.6x 8.7% 9.0% 9.1% 3.8x Median 9.5 9.0 8.8% 9.1% 9.1% 3.7 Peer Group Trading Analysis – Crude Oil Transportation and Stanchion 2020E EBITDA $224.2 Relevant EBITDA Multiple 9.0x – 11.0x Implied Enterprise Value Based on 2020E EBITDA $2,017.9 – $2,466.4 2021E EBITDA $232.4 Relevant EBITDA Multiple 8.5x – 10.5x Implied Enterprise Value Based on 2021E EBITDA $1,975.2 – $2,440.0 Implied Enterprise Value $1,975.2 – $2,466.4 Source: TGE management, Public filings, Wall Street research, FactSet 48
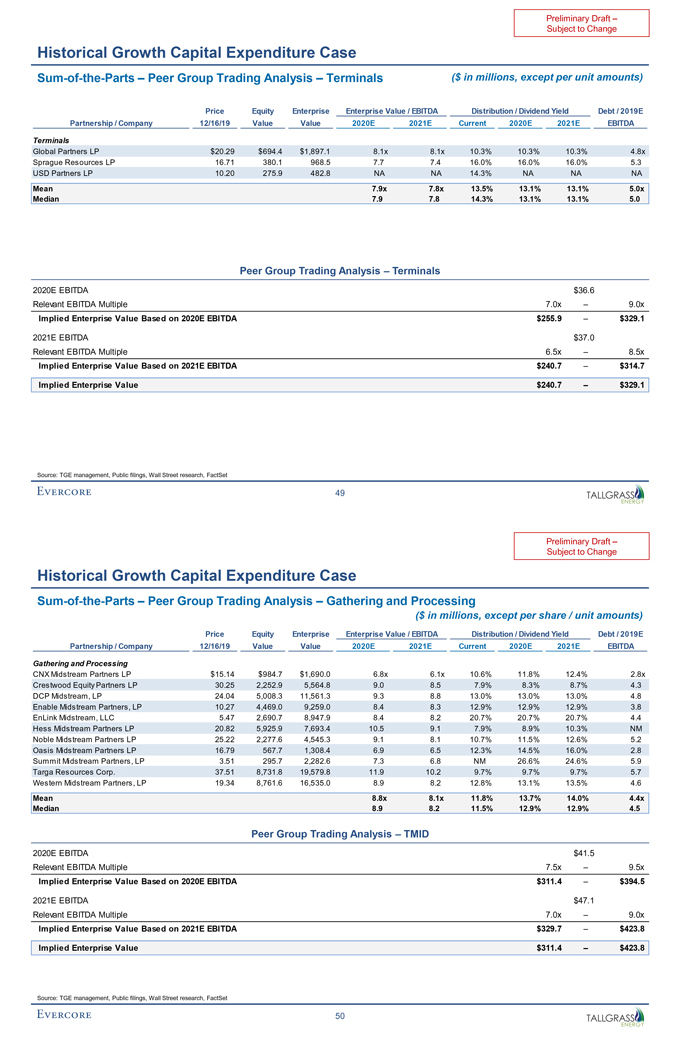
Preliminary Draft –Subject to Change Historical Growth Capital Expenditure CaseSum-of-the-Parts – Peer Group Trading Analysis – Terminals ($ in millions, except per unit amounts) Price Equity Enterprise Enterprise Value / EBITDA Distribution / Dividend Yield Debt / 2019E Partnership / Company 12/16/19 Value Value 2020E 2021E Current 2020E 2021E EBITDA Terminals Global Partners LP $20.29 $694.4 $1,897.1 8.1x 8.1x 10.3% 10.3% 10.3% 4.8x Sprague Resources LP 16.71 380.1 968.5 7.7 7.4 16.0% 16.0% 16.0% 5.3 USD Partners LP 10.20 275.9 482.8 NA NA 14.3% NA NA NA Mean 7.9x 7.8x 13.5% 13.1% 13.1% 5.0x Median 7.9 7.8 14.3% 13.1% 13.1% 5.0 Peer Group Trading Analysis – Terminals 2020E EBITDA $36.6 Relevant EBITDA Multiple 7.0x – 9.0x Implied Enterprise Value Based on 2020E EBITDA $255.9 – $329.1 2021E EBITDA $37.0 Relevant EBITDA Multiple 6.5x – 8.5x Implied Enterprise Value Based on 2021E EBITDA $240.7 – $314.7 Implied Enterprise Value $240.7 – $329.1 Source: TGE management, Public filings, Wall Street research, FactSet 49
Preliminary Draft –Subject to Change Historical Growth Capital Expenditure CaseSum-of-the-Parts – Peer Group Trading Analysis – Gathering and Processing ($ in millions, except per share / unit amounts) Price Equity Enterprise Enterprise Value / EBITDA Distribution / Dividend Yield Debt / 2019E Partnership / Company 12/16/19 Value Value 2020E 2021E Current 2020E 2021E EBITDA Gathering and Processing CNX Midstream Partners LP $15.14 $984.7 $1,690.0 6.8x 6.1x 10.6% 11.8% 12.4% 2.8x Crestwood Equity Partners LP 30.25 2,252.9 5,564.8 9.0 8.5 7.9% 8.3% 8.7% 4.3 DCP Midstream, LP 24.04 5,008.3 11,561.3 9.3 8.8 13.0% 13.0% 13.0% 4.8 Enable Midstream Partners, LP 10.27 4,469.0 9,259.0 8.4 8.3 12.9% 12.9% 12.9% 3.8 EnLink Midstream, LLC 5.47 2,690.7 8,947.9 8.4 8.2 20.7% 20.7% 20.7% 4.4 Hess Midstream Partners LP 20.82 5,925.9 7,693.4 10.5 9.1 7.9% 8.9% 10.3% NM Noble Midstream Partners LP 25.22 2,277.6 4,545.3 9.1 8.1 10.7% 11.5% 12.6% 5.2 Oasis Midstream Partners LP 16.79 567.7 1,308.4 6.9 6.5 12.3% 14.5% 16.0% 2.8 Summit Midstream Partners, LP 3.51 295.7 2,282.6 7.3 6.8 NM 26.6% 24.6% 5.9 Targa Resources Corp. 37.51 8,731.8 19,579.8 11.9 10.2 9.7% 9.7% 9.7% 5.7 Western Midstream Partners, LP 19.34 8,761.6 16,535.0 8.9 8.2 12.8% 13.1% 13.5% 4.6 Mean 8.8x 8.1x 11.8% 13.7% 14.0% 4.4x Median 8.9 8.2 11.5% 12.9% 12.9% 4.5 Peer Group Trading Analysis – TMID 2020E EBITDA $41.5 Relevant EBITDA Multiple 7.5x – 9.5x Implied Enterprise Value Based on 2020E EBITDA $311.4 – $394.5 2021E EBITDA $47.1 Relevant EBITDA Multiple 7.0x – 9.0x Implied Enterprise Value Based on 2021E EBITDA $329.7 – $423.8 Implied Enterprise Value $311.4 – $423.8 Source: TGE management, Public filings, Wall Street research, FactSet 50
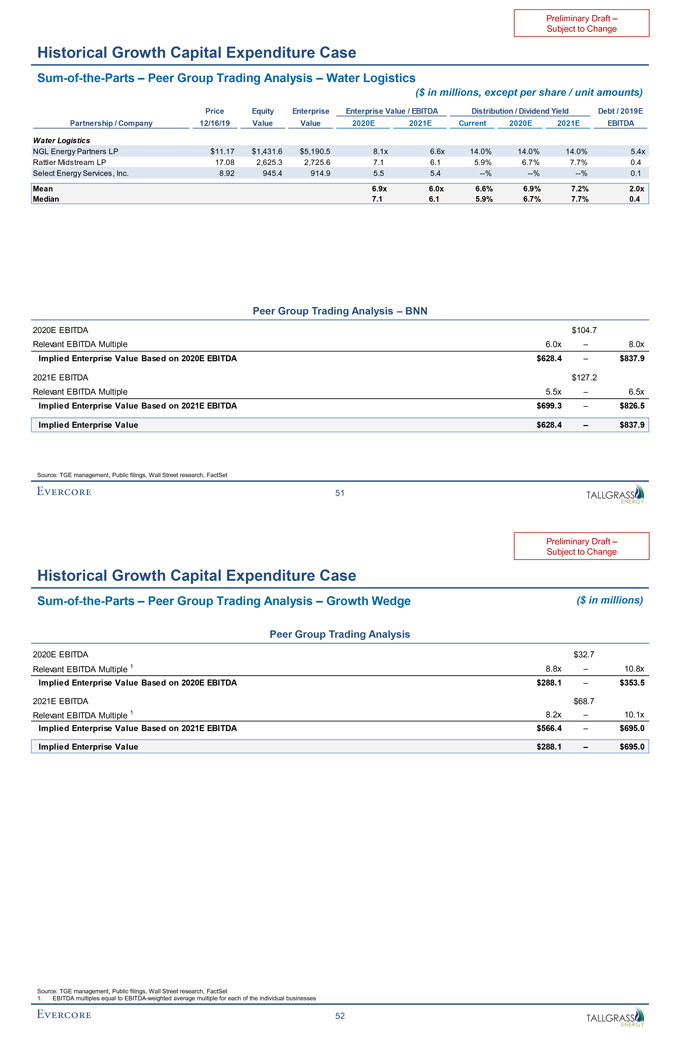
Preliminary Draft –Subject to Change Historical Growth Capital Expenditure CaseSum-of-the-Parts – Peer Group Trading Analysis – Water Logistics ($ in millions, except per share / unit amounts) Price Equity Enterprise Enterprise Value / EBITDA Distribution / Dividend Yield Debt / 2019E Partnership / Company 12/16/19 Value Value 2020E 2021E Current 2020E 2021E EBITDA Water Logistics NGL Energy Partners LP $11.17 $1,431.6 $5,190.5 8.1x 6.6x 14.0% 14.0% 14.0% 5.4x Rattler Midstream LP 17.08 2,625.3 2,725.6 7.1 6.1 5.9% 6.7% 7.7% 0.4 Select Energy Services, Inc. 8.92 945.4 914.9 5.5 5.4 —% —% —% 0.1 Mean 6.9x 6.0x 6.6% 6.9% 7.2% 2.0x Median 7.1 6.1 5.9% 6.7% 7.7% 0.4 Peer Group Trading Analysis – BNN 2020E EBITDA $104.7 Relevant EBITDA Multiple 6.0x – 8.0x Implied Enterprise Value Based on 2020E EBITDA $628.4 – $837.9 2021E EBITDA $127.2 Relevant EBITDA Multiple 5.5x – 6.5x Implied Enterprise Value Based on 2021E EBITDA $699.3 – $826.5 Implied Enterprise Value $628.4 – $837.9 Source: TGE management, Public filings, Wall Street research, FactSet 51
Preliminary Draft –Subject to Change Historical Growth Capital Expenditure CaseSum-of-the-Parts – Peer Group Trading Analysis – Growth Wedge ($ in millions) Peer Group Trading Analysis 2020E EBITDA $32.7 Relevant EBITDA Multiple 1 8.8x – 10.8x Implied Enterprise Value Based on 2020E EBITDA $288.1 – $353.5 2021E EBITDA $68.7 Relevant EBITDA Multiple 1 8.2x – 10.1x Implied Enterprise Value Based on 2021E EBITDA $566.4 – $695.0 Implied Enterprise Value $288.1 – $695.0 Source: TGE management, Public filings, Wall Street research, FactSet 1. EBITDA multiples equal to EBITDA-weighted average multiple for each of the individual businesses 52
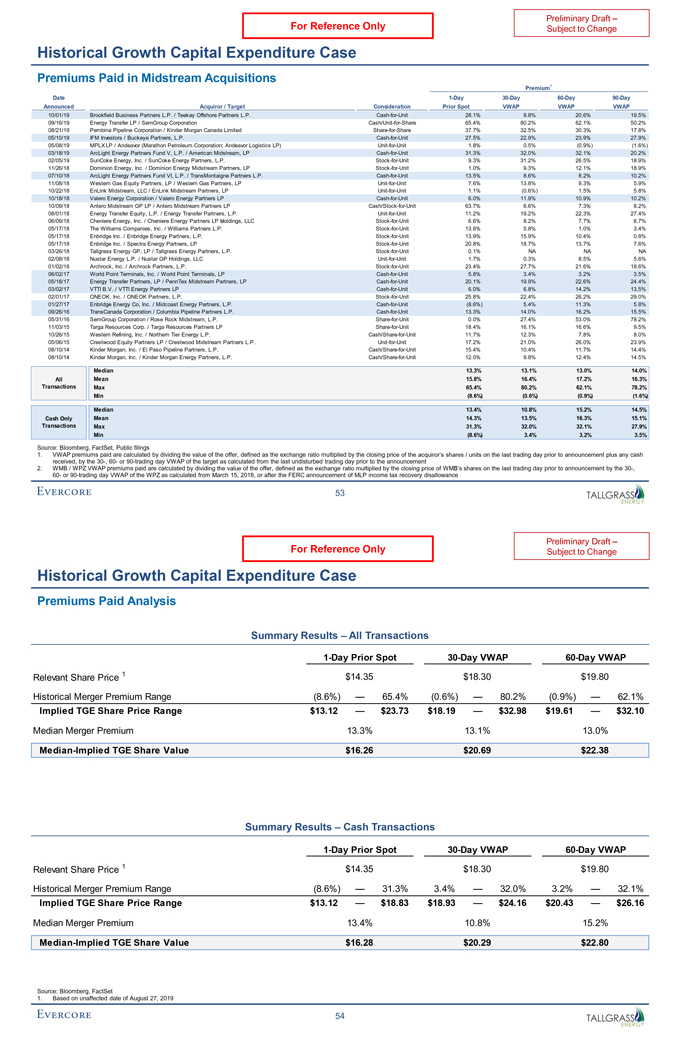
Preliminary Draft – For Reference Only Subject to Change Historical Growth Capital Expenditure Case Premiums Paid in Midstream Acquisitions Premium1 Date1-Day30-Day60-Day90-Day Announced Acquiror / Target Consideration Prior Spot VWAP VWAP VWAP 10/01/19 Brookfield Business Partners L.P. / Teekay Offshore Partners L.P.Cash-for-Unit 28.1% 9.8% 20.6% 19.5% 09/16/19 Energy Transfer LP / SemGroup CorporationCash/Unit-for-Share 65.4% 80.2% 62.1% 50.2% 08/21/19 Pembina Pipeline Corporation / Kinder Morgan Canada LimitedShare-for-Share 37.7% 32.5% 30.3% 17.8% 05/10/19 IFM Investors / Buckeye Partners, L.P.Cash-for-Unit 27.5% 22.9% 23.9% 27.9% 05/08/19 MPLX LP / Andeavor (Marathon Petroleum Corporation; Andeavor Logistics LP)Unit-for-Unit 1.8% 0.5% (0.9%) (1.6%) 03/18/19 ArcLight Energy Partners Fund V, L.P. / American Midstream, LPCash-for-Unit 31.3% 32.0% 32.1% 20.2% 02/05/19 SunCoke Energy, Inc. / SunCoke Energy Partners, L.P.Stock-for-Unit 9.3% 31.2% 26.5% 18.9% 11/26/18 Dominion Energy, Inc. / Dominion Energy Midstream Partners, LPStock-for-Unit 1.0% 9.3% 12.1% 18.9% 07/10/18 ArcLight Energy Partners Fund VI, L.P. / TransMontaigne Partners L.P.Cash-for-Unit 13.5% 8.6% 8.2% 10.2% 11/08/18 Western Gas Equity Partners, LP / Western Gas Partners, LPUnit-for-Unit 7.6% 13.8% 9.3% 5.9% 10/22/18 EnLink Midstream, LLC / EnLink Midstream Partners, LPUnit-for-Unit 1.1% (0.6%) 1.5% 5.8% 10/18/18 Valero Energy Corporation / Valero Energy Partners LPCash-for-Unit 6.0% 11.9% 10.9% 10.2% 10/09/18 Antero Midstream GP LP / Antero Midstream Partners LPCash/Stock-for-Unit 63.7% 6.6% 7.3% 8.2% 08/01/18 Energy Transfer Equity, L.P. / Energy Transfer Partners, L.P.Unit-for-Unit 11.2% 19.2% 22.3% 27.4% 06/09/18 Cheniere Energy, Inc. / Cheniere Energy Partners LP Holdings, 2 LLCStock-for-Unit 6.6% 8.2% 7.7% 6.7% 05/17/18 The Williams Companies, Inc. / Williams Partners L.P.Stock-for-Unit 13.6% 5.8% 1.0% 3.4% 05/17/18 Enbridge Inc. / Enbridge Energy Partners, L.P.Stock-for-Unit 13.9% 15.9% 10.4% 0.8% 05/17/18 Enbridge Inc. / Spectra Energy Partners, LPStock-for-Unit 20.8% 18.7% 13.7% 7.6% 03/26/18 Tallgrass Energy GP, LP / Tallgrass Energy Partners, L.P.Stock-for-Unit 0.1% NA NA NA 02/08/18 Nustar Energy L.P. / Nustar GP Holdings, LLCUnit-for-Unit 1.7% 0.3% 8.5% 5.6% 01/02/18 Archrock, Inc. / Archrock Partners, L.P.Stock-for-Unit 23.4% 27.7% 21.6% 18.6% 06/02/17 World Point Terminals, Inc. / World Point Terminals, LPCash-for-Unit 5.8% 3.4% 3.2% 3.5% 05/18/17 Energy Transfer Partners, LP / PennTex Midstream Partners, LPCash-for-Unit 20.1% 19.9% 22.6% 24.4% 03/02/17 VTTI B.V. / VTTI Energy Partners LPCash-for-Unit 6.0% 6.8% 14.2% 13.5% 02/01/17 ONEOK, Inc. / ONEOK Partners, L.P.Stock-for-Unit 25.8% 22.4% 26.2% 29.0% 01/27/17 Enbridge Energy Co, Inc. / Midcoast Energy Partners, L.P.Cash-for-Unit (8.6%) 5.4% 11.3% 5.8% 09/26/16 TransCanada Corporation / Columbia Pipeline Partners L.P.Cash-for-Unit 13.3% 14.0% 16.2% 15.5% 05/31/16 SemGroup Corporation / Rose Rock Midstream, L.P.Share-for-Unit 0.0% 27.4% 53.0% 78.2% 11/03/15 Targa Resources Corp. / Targa Resources Partners LPShare-for-Unit 18.4% 16.1% 16.6% 9.5% 10/26/15 Western Refining, Inc. / Northern Tier Energy L.P.Cash/Share-for-Unit 11.7% 12.3% 7.8% 8.0% 05/06/15 Crestwood Equity Partners LP / Crestwood Midstream Partners L.P.Unit-for-Unit 17.2% 21.0% 26.0% 23.9% 08/10/14 Kinder Morgan, Inc. / El Paso Pipeline Partners, L.P.Cash/Share-for-Unit 15.4% 10.4% 11.7% 14.4% 08/10/14 Kinder Morgan, Inc. / Kinder Morgan Energy Partners, L.P.Cash/Share-for-Unit 12.0% 9.8% 12.4% 14.5% Median 13.3% 13.1% 13.0% 14.0% All Mean 15.8% 16.4% 17.2% 16.3% Transactions Max 65.4% 80.2% 62.1% 78.2% Min (8.6%) (0.6%) (0.9%) (1.6%) Median 13.4% 10.8% 15.2% 14.5% Cash Only Mean 14.3% 13.5% 16.3% 15.1% Transactions Max 31.3% 32.0% 32.1% 27.9% Min (8.6%) 3.4% 3.2% 3.5% Source: Bloomberg, FactSet, Public filings 1. VWAP premiums paid are calculated by dividing the value of the offer, defined as the exchange ratio multiplied by the closing price of the acquiror’s shares / units on the last trading day prior to announcement plus any cash received, by the30-,60- or90-trading day VWAP of the target as calculated from the last undisturbed trading day prior to the announcement 2. WMB / WPZ VWAP premiums paid are calculated by dividing the value of the offer, defined as the exchange ratio multiplied by the closing price of WMB’s shares on the last trading day prior to announcement by the30-,60- or90-trading day VWAP of the WPZ as calculated from March 15, 2018, or after the FERC announcement of MLP income tax recovery disallowance 53
Preliminary Draft – For Reference Only Subject to Change Historical Growth Capital Expenditure Case Premiums Paid Analysis Summary Results – All Transactions1-Day Prior Spot30-Day VWAP60-Day VWAP Relevant Share Price 1 $14.35 $18.30 $19.80 Historical Merger Premium Range (8.6%) — 65.4% (0.6%) — 80.2% (0.9%) — 62.1% Implied TGE Share Price Range $13.12 — $23.73 $18.19 — $32.98 $19.61 — $32.10 Median Merger Premium 13.3% 13.1% 13.0% Median-Implied TGE Share Value $16.26 $20.69 $22.38 Summary Results – Cash Transactions1-Day Prior Spot30-Day VWAP60-Day VWAP Relevant Share Price 1 $14.35 $18.30 $19.80 Historical Merger Premium Range (8.6%) — 31.3% 3.4% — 32.0% 3.2% — 32.1% Implied TGE Share Price Range $13.12 — $18.83 $18.93 — $24.16 $20.43 — $26.16 Median Merger Premium 13.4% 10.8% 15.2% Median-Implied TGE Share Value $16.28 $20.29 $22.80 Source: Bloomberg, FactSet 1. Based on unaffected date of August 27, 2019 54
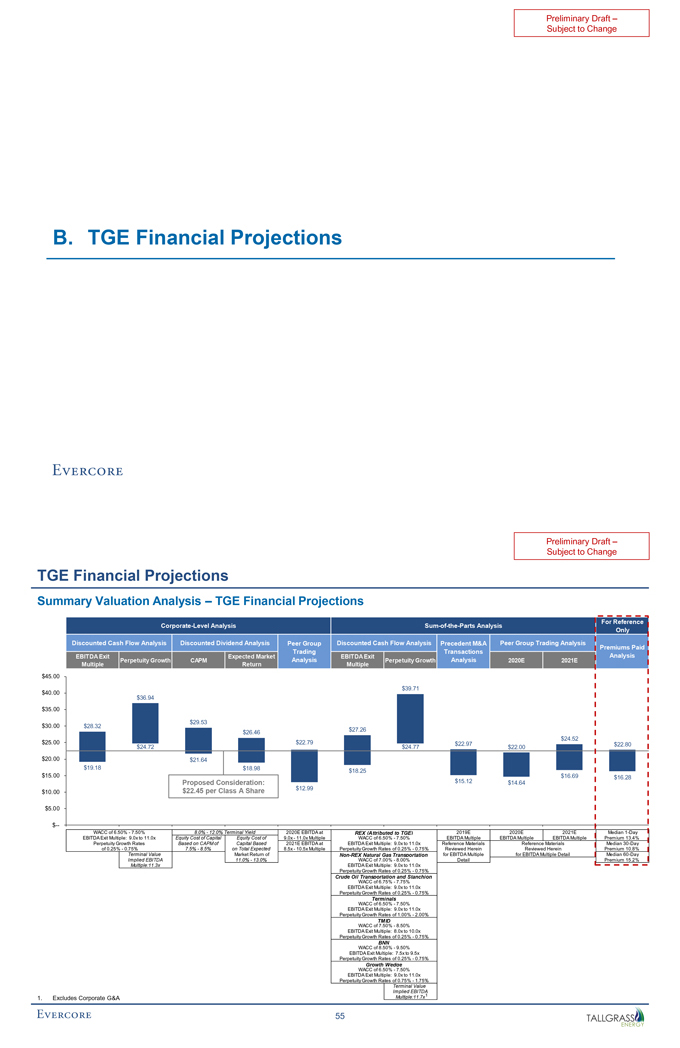
Preliminary Draft –Subject to Change B. TGE Financial Projections
Preliminary Draft –Subject to Change TGE Financial Projections Summary Valuation Analysis – TGE Financial Projections For Reference Corporate-Level AnalysisSum-of-the-Parts Analysis Only Discounted Cash Flow Analysis Discounted Dividend Analysis Peer Group Discounted Cash Flow Analysis Precedent M&A Peer Group Trading Analysis Premiums Paid Trading Transactions EBITDA Exit Expected Market EBITDA Exit Analysis Perpetuity Growth CAPM Analysis Perpetuity Growth Analysis 2020E 2021E Multiple Return Multiple $45.00 $39.71 $40.00 $36.94 $35.00 $29.53 $30.00 $28.32 $27.26 $26.46 $24.52 $25.00 $22.79 $22.97 $22.80 $24.72 $24.77 $22.00 $20.00 $21.64 $19.18 $18.98 $18.25 $15.00 $16.69 $16.28 Proposed Consideration: $15.12 $14.64 $22.45 per Class A Share $12.99 $10.00 $5.00 $— WACC of 6.50%—7.50% 8.0%—12.0% Terminal Yield 2020E EBITDA at REX (Attributed to TGE) 2019E 2020E 2021E Median1-Day EBITDA Exit Multiple: 9.0x to 11.0x Equity Cost of Capital Equity Cost of 9.0x—11.0x Multiple WACC of 6.50%—7.50% EBITDA Multiple EBITDA Multiple EBITDA Multiple Premium 13.4% Perpetuity Growth Rates Based on CAPM of Capital Based 2021E EBITDA at EBITDA Exit Multiple: 9.0x to 11.0x Reference Materials Reference Materials Median30-Day of 0.25%—0.75% 7.5%—8.5% on Total Expected 8.5x—10.5x Multiple Perpetuity Growth Rates of 0.25%—0.75% Reviewed Herein Reviewed Herein Premium 10.8% Terminal Value Market Return ofNon-REX Natural Gas Transportation for EBITDA Multiple for EBITDA Multiple Detail Median60-Day Implied EBITDA 11.0%—13.0% WACC of 7.00%—8.00% Detail Premium 15.2% Multiple:11.3x EBITDA Exit Multiple: 9.0x to 11.0x Perpetuity Growth Rates of 0.25%—0.75% Crude Oil Transportation and Stanchion WACC of 6.75%—7.75% EBITDA Exit Multiple: 9.0x to 11.0x Perpetuity Growth Rates of 0.25%—0.75% Terminals WACC of 6.50%—7.50% EBITDA Exit Multiple: 9.0x to 11.0x Perpetuity Growth Rates of 1.00%—2.00% TMID WACC of 7.50%—8.50% EBITDA Exit Multiple: 8.0x to 10.0x Perpetuity Growth Rates of 0.25%—0.75% BNN WACC of 8.50%—9.50% EBITDA Exit Multiple: 7.5x to 9.5x Perpetuity Growth Rates of 0.25%—0.75% Growth Wedge WACC of 6.50%—7.50% EBITDA Exit Multiple: 9.0x to 11.0x Perpetuity Growth Rates of 0.75%—1.75% Terminal Value Implied EBITDA 1 1. Excludes Corporate G&A Multiple:11.7x 55

Preliminary Draft –Subject to Change TGE Financial Projections Corporate-Level – DCF Analysis ($ in millions, except per share amounts) For the Years Ending December 31, EBITDA Perpetuity 2020E 2021E 2022E 2023E Multiple Growth 1 2 2 Adjusted EBITDA $961.5 $1,086.7 $1,205.5 $1,308.6 $1,407.8 $1,407.8 Less: Tax Depreciation and Amortization (792.1) (857.8) (816.6) (843.1) (57.2) EBIT $169.5 $228.9 $388.9 $465.6 $1,350.6 Less: Taxes 3 (17.6) (2.6) (4.3) (5.4) (321.7) EBIAT $151.9 $226.3 $384.6 $460.1 $1,028.9 4 Plus: Tax Depreciation and Amortization 792.1 857.8 816.6 843.1 57.2 Less: Growth Capital Expenditures 1 (860.0) (841.0) (758.0) (758.0) —Less: Maintenance Capital Expenditures (37.7) (39.8) (42.4) (44.5) (44.5) Less: REX Maintenance Capital Expenditures to TGE 1 (11.9) (12.2) (12.4) (12.7) (12.7) Unlevered Free Cash Flow $34.3 $191.1 $388.4 $488.0 $1,028.9 EBITDA Multiple / Perpetuity Growth Rate 10.0x 0.50% Implied Terminal Value $14,078.0 $15,908.5 EV / Unlevered Free Cash Flow Multiple 15.5x PV of Terminal Value @ 7.00% Discount Rate $10,740.1 $12,554.1 Plus: PV of Unlevered Free Cash Flow @ 7.00% Discount Rate 918.8 Implied Enterprise Value $11,658.9 – $13,473.0 Less: Debt Outstanding as of January 1, 2020 1 (5,015.5) Plus: Cash as of January 1, 2020 16.0 Implied Equity Value $6,659.4 – $8,473.5 Implied TGE Share Value $23.67 – $30.12 EBITDA Exit Multiple Sensitivities Perpetuity Growth Rate Sensitivities Terminal EBITDA Multiple Perpetuity Growth Rate 8.0x 9.0x 10.0x 11.0x 12.0x —% 0.25% 0.50% 0.75% 1.00% 6.00% $17.29 $21.25 $25.21 $29.18 $33.14 6.00% $35.29 $37.58 $40.08 $42.81 $45.82 C C 6.50% 16.65 20.54 24.43 28.32 32.21 C C 6.50% 30.67 32.59 34.68 36.94 39.41 A A W 7.00% 16.04 19.85 23.67 27.49 31.31 W 7.00% 26.73 28.36 30.12 32.02 34.08 7.50% 15.43 19.18 22.93 26.67 30.42 7.50% 23.31 24.72 26.22 27.84 29.57 8.00% 14.84 18.52 22.20 25.87 29.55 8.00% 20.34 21.55 22.85 24.24 25.72 Source: TGE management 1. EBITDA, Growth Capital Expenditures, Maintenance Capital Expenditures and Debt reflect 75% ownership interest in REX 2. Includesrun-rate Growth Wedge EBITDA of $400.0 million 3. 23.8% effective tax rate 4. Includes REX Maintenance Capital Expenditures to TGE 56
Preliminary Draft –Subject to Change TGE Financial Projections Corporate-Level – Discounted Dividend Analysis For the Years Ending December 31, Terminal Value 2020E 2021E 2022E 2023E Low High TGE Dividend per Share (Cash) $2.24 $2.25 $2.25 $2.32 $2.32 – $2.32 Terminal Yield 1 12.0% 8.0% Terminal Value $19.29 $28.94 Equity Cost of Capital Based on CAPM 2 Present Value @ 7.0% of Equity Value $22.65 – $30.01 Present Value @ 7.5% of Equity Value 22.31 – 29.53 Present Value @ 8.0% of Equity Value 21.97 – 29.06 Present Value @ 8.5% of Equity Value 21.64 – 28.60 Present Value @ 9.0% of Equity Value 21.32 – 28.15 Implied TGE Share Value – Based on CAPM $21.64 – $29.53 Equity Cost of Capital Based on Total Expected Market Return 2 Present Value @ 10.0% of Equity Value $20.70 – $27.29 Present Value @ 11.0% of Equity Value 20.10 – 26.46 Present Value @ 12.0% of Equity Value 19.53 – 25.66 Present Value @ 13.0% of Equity Value 18.98 – 24.90 Present Value @ 14.0% of Equity Value 18.46 – 24.17 Implied TGE Share Value – Based on Total Expected Market Return $18.98 – $26.46 1. TGE’s median yield since its firstex-dividend date following closing of the MLPBuy-in has been 9.0% and its range in yield over that time has been 7.6% to 15.1%. From January 1, 2019 to August 27, 2019 TGE’s yield averaged 9.5% 2. For detail on Equity Cost of Capital calculations, see Appendix 57
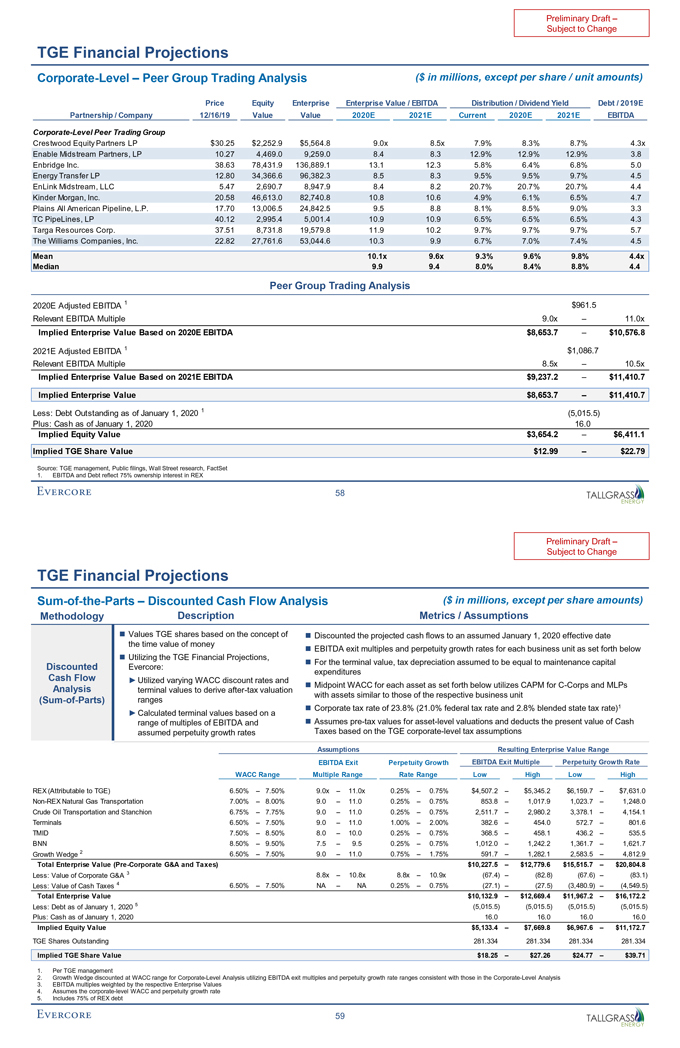
Preliminary Draft –Subject to Change TGE Financial Projections Corporate-Level – Peer Group Trading Analysis ($ in millions, except per share / unit amounts) Price Equity Enterprise Enterprise Value / EBITDA Distribution / Dividend Yield Debt / 2019E Partnership / Company 12/16/19 Value Value 2020E 2021E Current 2020E 2021E EBITDA Corporate-Level Peer Trading Group Crestwood Equity Partners LP $30.25 $2,252.9 $5,564.8 9.0x 8.5x 7.9% 8.3% 8.7% 4.3x Enable Midstream Partners, LP 10.27 4,469.0 9,259.0 8.4 8.3 12.9% 12.9% 12.9% 3.8 Enbridge Inc. 38.63 78,431.9 136,889.1 13.1 12.3 5.8% 6.4% 6.8% 5.0 Energy Transfer LP 12.80 34,366.6 96,382.3 8.5 8.3 9.5% 9.5% 9.7% 4.5 EnLink Midstream, LLC 5.47 2,690.7 8,947.9 8.4 8.2 20.7% 20.7% 20.7% 4.4 Kinder Morgan, Inc. 20.58 46,613.0 82,740.8 10.8 10.6 4.9% 6.1% 6.5% 4.7 Plains All American Pipeline, L.P. 17.70 13,006.5 24,842.5 9.5 8.8 8.1% 8.5% 9.0% 3.3 TC PipeLines, LP 40.12 2,995.4 5,001.4 10.9 10.9 6.5% 6.5% 6.5% 4.3 Targa Resources Corp. 37.51 8,731.8 19,579.8 11.9 10.2 9.7% 9.7% 9.7% 5.7 The Williams Companies, Inc. 22.82 27,761.6 53,044.6 10.3 9.9 6.7% 7.0% 7.4% 4.5 Mean 10.1x 9.6x 9.3% 9.6% 9.8% 4.4x Median 9.9 9.4 8.0% 8.4% 8.8% 4.4 Peer Group Trading Analysis 2020E Adjusted EBITDA 1 $961.5 Relevant EBITDA Multiple 9.0x – 11.0x Implied Enterprise Value Based on 2020E EBITDA $8,653.7 – $10,576.8 2021E Adjusted EBITDA 1 $1,086.7 Relevant EBITDA Multiple 8.5x – 10.5x Implied Enterprise Value Based on 2021E EBITDA $9,237.2 – $11,410.7 Implied Enterprise Value $8,653.7 – $11,410.7 Less: Debt Outstanding as of January 1, 2020 1 (5,015.5) Plus: Cash as of January 1, 2020 16.0 Implied Equity Value $3,654.2 – $6,411.1 Implied TGE Share Value $12.99 – $22.79 Source: TGE management, Public filings, Wall Street research, FactSet 1. EBITDA and Debt reflect 75% ownership interest in REX 58
Preliminary Draft –Subject to Change TGE Financial ProjectionsSum-of-the-Parts – Discounted Cash Flow Analysis ($ in millions, except per share amounts) Methodology Description Metrics / Assumptions ï® Values TGE shares based on the concept of ï® Discounted the projected cash flows to an assumed January 1, 2020 effective date the time value of money ï® EBITDA exit multiples and perpetuity growth rates for each business unit as set forth belowï® Utilizing the TGE Financial Projections, ï® For the terminal value, tax depreciation assumed to be equal to maintenance capital Discounted Evercore: expenditures Cash Flow â–º Utilized varying WACC discount rates and set forth below utilizes CAPM forC-Corps and MLPs Analysisï® Midpoint WACC for each asset as terminal values to deriveafter-tax valuation with assets similar to those of the respective business unit(Sum-of-Parts) ranges â–º Calculated terminal values based on a ï® Corporate tax rate of 23.8% (21.0% federal tax rate and 2.8% blended state tax rate)1 range of multiples of EBITDA andï® Assumespre-tax values for asset-level valuations and deducts the present value of Cash assumed perpetuity growth rates Taxes based on the TGE corporate-level tax assumptions Assumptions Resulting Enterprise Value Range EBITDA Exit Perpetuity Growth EBITDA Exit Multiple Perpetuity Growth Rate WACC Range Multiple Range Rate Range Low High Low High REX (Attributable to TGE) 6.50% – 7.50% 9.0x – 11.0x 0.25% – 0.75% $4,507.2 – $5,345.2 $6,159.7 – $7,631.0Non-REX Natural Gas Transportation 7.00% – 8.00% 9.0 – 11.0 0.25% – 0.75% 853.8 – 1,017.9 1,023.7 – 1,248.0 Crude Oil Transportation and Stanchion 6.75% – 7.75% 9.0 – 11.0 0.25% – 0.75% 2,511.7 – 2,980.2 3,378.1 – 4,154.1 Terminals 6.50% – 7.50% 9.0 – 11.0 1.00% – 2.00% 382.6 – 454.0 572.7 – 801.6 TMID 7.50% – 8.50% 8.0 – 10.0 0.25% – 0.75% 368.5 – 458.1 436.2 – 535.5 BNN 8.50% – 9.50% 7.5 – 9.5 0.25% – 0.75% 1,012.0 – 1,242.2 1,361.7 – 1,621.7 Growth Wedge 2 6.50% – 7.50% 9.0 – 11.0 0.75% – 1.75% 591.7 – 1,282.1 2,583.5 – 4,812.9 Total Enterprise Value(Pre-Corporate G&A and Taxes) $10,227.5 – $12,779.6 $15,515.7 – $20,804.8 Less: Value of Corporate G&A 3 8.8x – 10.8x 8.8x – 10.9x (67.4) – (82.8) (67.6) – (83.1) Less: Value of Cash Taxes 4 6.50% – 7.50% NA – NA 0.25% – 0.75% (27.1) – (27.5) (3,480.9) – (4,549.5) Total Enterprise Value $10,132.9 – $12,669.4 $11,967.2 – $16,172.2 Less: Debt as of January 1, 2020 5 (5,015.5) (5,015.5) (5,015.5) (5,015.5) Plus: Cash as of January 1, 2020 16.0 16.0 16.0 16.0 Implied Equity Value $5,133.4 – $7,669.8 $6,967.6 – $11,172.7 TGE Shares Outstanding 281.334 281.334 281.334 281.334 Implied TGE Share Value $18.25 – $27.26 $24.77 – $39.71 1. Per TGE management 2. Growth Wedge discounted at WACC range for Corporate-Level Analysis utilizing EBITDA exit multiples and perpetuity growth rate ranges consistent with those in the Corporate-Level Analysis 3. EBITDA multiples weighted by the respective Enterprise Values 4. Assumes the corporate-level WACC and perpetuity growth rate 5. Includes 75% of REX debt 59
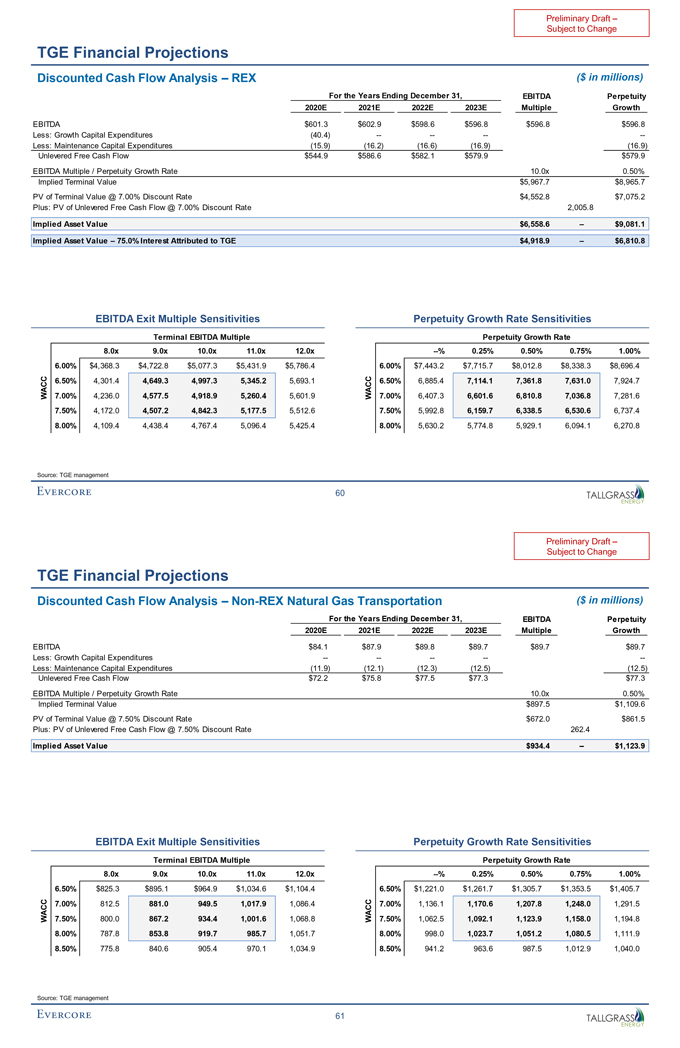
Subject to Change TGE Financial Projections Discounted Cash Flow Analysis – REX ($ in millions) For the Years Ending December 31, EBITDA Perpetuity 2020E 2021E 2022E 2023E Multiple Growth EBITDA $601.3 $602.9 $598.6 $596.8 $596.8 $596.8 Less: Growth Capital Expenditures (40.4) -———-Less: Maintenance Capital Expenditures (15.9) (16.2) (16.6) (16.9) (16.9) Unlevered Free Cash Flow $544.9 $586.6 $582.1 $579.9 $579.9 EBITDA Multiple / Perpetuity Growth Rate 10.0x 0.50% Implied Terminal Value $5,967.7 $8,965.7 PV of Terminal Value @ 7.00% Discount Rate $4,552.8 $7,075.2 Plus: PV of Unlevered Free Cash Flow @ 7.00% Discount Rate 2,005.8 Implied Asset Value $6,558.6 – $9,081.1 Implied Asset Value – 75.0% Interest Attributed to TGE $4,918.9 – $6,810.8 EBITDA Exit Multiple Sensitivities Perpetuity Growth Rate Sensitivities Terminal EBITDA Multiple Perpetuity Growth Rate 8.0x 9.0x 10.0x 11.0x 12.0x —% 0.25% 0.50% 0.75% 1.00% 6.00% $4,368.3 $4,722.8 $5,077.3 $5,431.9 $5,786.4 6.00% $7,443.2 $7,715.7 $8,012.8 $8,338.3 $8,696.4 6.50% 4,301.4 4,649.3 4,997.3 5,345.2 5,693.1 6.50% 6,885.4 7,114.1 7,361.8 7,631.0 7,924.7 WACC 7.00% 4,236.0 4,577.5 4,918.9 5,260.4 5,601.9 WACC 7.00% 6,407.3 6,601.6 6,810.8 7,036.8 7,281.6 7.50% 4,172.0 4,507.2 4,842.3 5,177.5 5,512.6 7.50% 5,992.8 6,159.7 6,338.5 6,530.6 6,737.4 8.00% 4,109.4 4,438.4 4,767.4 5,096.4 5,425.4 8.00% 5,630.2 5,774.8 5,929.1 6,094.1 6,270.8 Source: TGE management 60
Preliminary Draft –Subject to Change TGE Financial Projections Discounted Cash Flow Analysis –Non-REX Natural Gas Transportation ($ in millions) For the Years Ending December 31, EBITDA Perpetuity 2020E 2021E 2022E 2023E Multiple Growth EBITDA $84.1 $87.9 $89.8 $89.7 $89.7 $89.7 Less: Growth Capital Expenditures -————-Less: Maintenance Capital Expenditures (11.9) (12.1) (12.3) (12.5) (12.5) Unlevered Free Cash Flow $72.2 $75.8 $77.5 $77.3 $77.3 EBITDA Multiple / Perpetuity Growth Rate 10.0x 0.50% Implied Terminal Value $897.5 $1,109.6 PV of Terminal Value @ 7.50% Discount Rate $672.0 $861.5 Plus: PV of Unlevered Free Cash Flow @ 7.50% Discount Rate 262.4 Implied Asset Value $934.4 – $1,123.9 EBITDA Exit Multiple Sensitivities Perpetuity Growth Rate Sensitivities Terminal EBITDA Multiple Perpetuity Growth Rate 8.0x 9.0x 10.0x 11.0x 12.0x —% 0.25% 0.50% 0.75% 1.00% 6.50% $825.3 $895.1 $964.9 $1,034.6 $1,104.4 6.50% $1,221.0 $1,261.7 $1,305.7 $1,353.5 $1,405.7 7.00% 812.5 881.0 949.5 1,017.9 1,086.4 7.00% 1,136.1 1,170.6 1,207.8 1,248.0 1,291.5 WACC 7.50% 800.0 867.2 934.4 1,001.6 1,068.8 WACC 7.50% 1,062.5 1,092.1 1,123.9 1,158.0 1,194.8 8.00% 787.8 853.8 919.7 985.7 1,051.7 8.00% 998.0 1,023.7 1,051.2 1,080.5 1,111.9 8.50% 775.8 840.6 905.4 970.1 1,034.9 8.50% 941.2 963.6 987.5 1,012.9 1,040.0 Source: TGE management 61
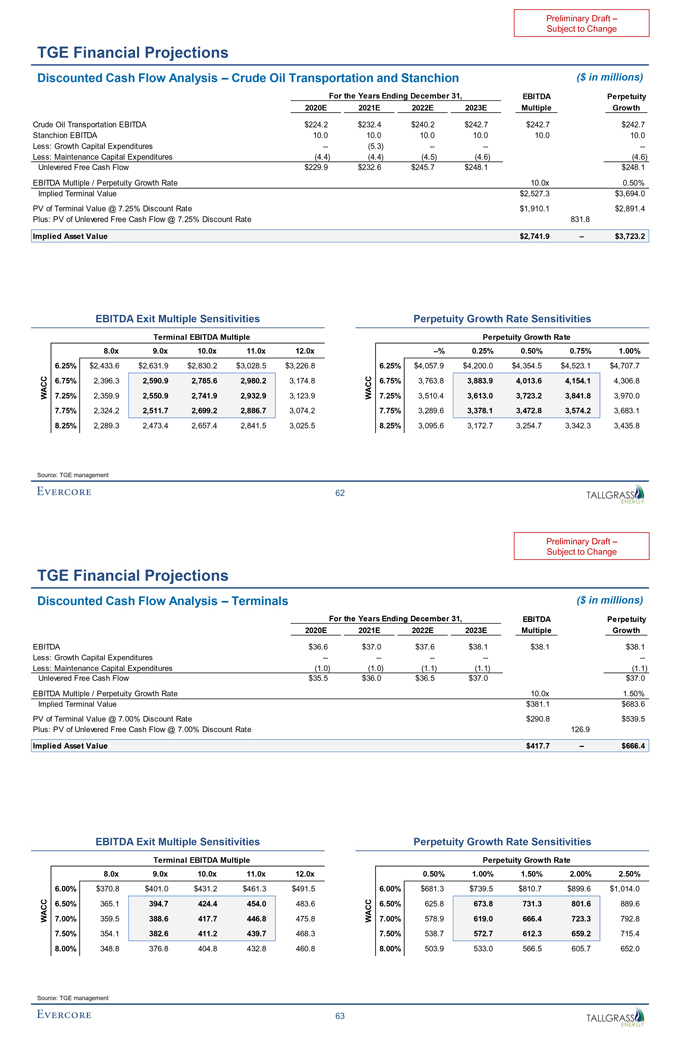
Preliminary Draft –Subject to Change TGE Financial Projections Discounted Cash Flow Analysis – Crude Oil Transportation and Stanchion ($ in millions) For the Years Ending December 31, EBITDA Perpetuity 2020E 2021E 2022E 2023E Multiple Growth Crude Oil Transportation EBITDA $224.2 $232.4 $240.2 $242.7 $242.7 $242.7 Stanchion EBITDA 10.0 10.0 10.0 10.0 10.0 10.0 Less: Growth Capital Expenditures — (5.3) -——-Less: Maintenance Capital Expenditures (4.4) (4.4) (4.5) (4.6) (4.6) Unlevered Free Cash Flow $229.9 $232.6 $245.7 $248.1 $248.1 EBITDA Multiple / Perpetuity Growth Rate 10.0x 0.50% Implied Terminal Value $2,527.3 $3,694.0 PV of Terminal Value @ 7.25% Discount Rate $1,910.1 $2,891.4 Plus: PV of Unlevered Free Cash Flow @ 7.25% Discount Rate 831.8 Implied Asset Value $2,741.9 – $3,723.2 EBITDA Exit Multiple Sensitivities Perpetuity Growth Rate Sensitivities Terminal EBITDA Multiple Perpetuity Growth Rate 8.0x 9.0x 10.0x 11.0x 12.0x —% 0.25% 0.50% 0.75% 1.00% 6.25% $2,433.6 $2,631.9 $2,830.2 $3,028.5 $3,226.8 6.25% $4,057.9 $4,200.0 $4,354.5 $4,523.1 $4,707.7 6.75% 2,396.3 2,590.9 2,785.6 2,980.2 3,174.8 6.75% 3,763.8 3,883.9 4,013.6 4,154.1 4,306.8 WACC 7.25% 2,359.9 2,550.9 2,741.9 2,932.9 3,123.9 WACC 7.25% 3,510.4 3,613.0 3,723.2 3,841.8 3,970.0 7.75% 2,324.2 2,511.7 2,699.2 2,886.7 3,074.2 7.75% 3,289.6 3,378.1 3,472.8 3,574.2 3,683.1 8.25% 2,289.3 2,473.4 2,657.4 2,841.5 3,025.5 8.25% 3,095.6 3,172.7 3,254.7 3,342.3 3,435.8 Source: TGE management 62
Preliminary Draft –Subject to Change TGE Financial Projections Discounted Cash Flow Analysis – Terminals ($ in millions) For the Years Ending December 31, EBITDA Perpetuity 2020E 2021E 2022E 2023E Multiple Growth EBITDA $36.6 $37.0 $37.6 $38.1 $38.1 $38.1 Less: Growth Capital Expenditures -————-Less: Maintenance Capital Expenditures (1.0) (1.0) (1.1) (1.1) (1.1) Unlevered Free Cash Flow $35.5 $36.0 $36.5 $37.0 $37.0 EBITDA Multiple / Perpetuity Growth Rate 10.0x 1.50% Implied Terminal Value $381.1 $683.6 PV of Terminal Value @ 7.00% Discount Rate $290.8 $539.5 Plus: PV of Unlevered Free Cash Flow @ 7.00% Discount Rate 126.9 Implied Asset Value $417.7 – $666.4 EBITDA Exit Multiple Sensitivities Perpetuity Growth Rate Sensitivities Terminal EBITDA Multiple Perpetuity Growth Rate 8.0x 9.0x 10.0x 11.0x 12.0x 0.50% 1.00% 1.50% 2.00% 2.50% 6.00% $370.8 $401.0 $431.2 $461.3 $491.5 6.00% $681.3 $739.5 $810.7 $899.6 $1,014.0 6.50% 365.1 394.7 424.4 454.0 483.6 6.50% 625.8 673.8 731.3 801.6 889.6 WACC 7.00% 359.5 388.6 417.7 446.8 475.8 WACC 7.00% 578.9 619.0 666.4 723.3 792.8 7.50% 354.1 382.6 411.2 439.7 468.3 7.50% 538.7 572.7 612.3 659.2 715.4 8.00% 348.8 376.8 404.8 432.8 460.8 8.00% 503.9 533.0 566.5 605.7 652.0 Source: TGE management 63
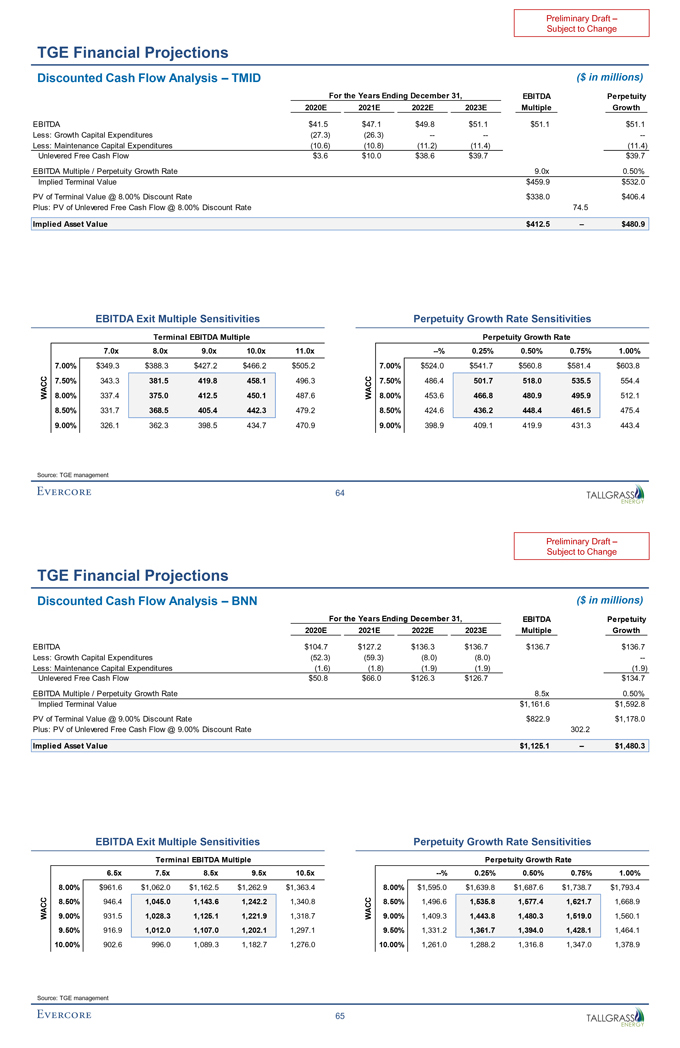
Preliminary Draft –Subject to Change TGE Financial Projections Discounted Cash Flow Analysis – TMID ($ in millions) For the Years Ending December 31, EBITDA Perpetuity 2020E 2021E 2022E 2023E Multiple Growth EBITDA $41.5 $47.1 $49.8 $51.1 $51.1 $51.1 Less: Growth Capital Expenditures (27.3) (26.3) -——-Less: Maintenance Capital Expenditures (10.6) (10.8) (11.2) (11.4) (11.4) Unlevered Free Cash Flow $3.6 $10.0 $38.6 $39.7 $39.7 EBITDA Multiple / Perpetuity Growth Rate 9.0x 0.50% Implied Terminal Value $459.9 $532.0 PV of Terminal Value @ 8.00% Discount Rate $338.0 $406.4 Plus: PV of Unlevered Free Cash Flow @ 8.00% Discount Rate 74.5 Implied Asset Value $412.5 – $480.9 EBITDA Exit Multiple Sensitivities Perpetuity Growth Rate Sensitivities Terminal EBITDA Multiple Perpetuity Growth Rate 7.0x 8.0x 9.0x 10.0x 11.0x —% 0.25% 0.50% 0.75% 1.00% 7.00% $349.3 $388.3 $427.2 $466.2 $505.2 7.00% $524.0 $541.7 $560.8 $581.4 $603.8 C AC 7.50% 343.3 381.5 419.8 458.1 496.3 C AC 7.50% 486.4 501.7 518.0 535.5 554.4 W 8.00% 337.4 375.0 412.5 450.1 487.6 W 8.00% 453.6 466.8 480.9 495.9 512.1 8.50% 331.7 368.5 405.4 442.3 479.2 8.50% 424.6 436.2 448.4 461.5 475.4 9.00% 326.1 362.3 398.5 434.7 470.9 9.00% 398.9 409.1 419.9 431.3 443.4 Source: TGE management 64
Preliminary Draft –Subject to Change TGE Financial Projections Discounted Cash Flow Analysis – BNN ($ in millions) For the Years Ending December 31, EBITDA Perpetuity 2020E 2021E 2022E 2023E Multiple Growth EBITDA $104.7 $127.2 $136.3 $136.7 $136.7 $136.7 Less: Growth Capital Expenditures (52.3) (59.3) (8.0) (8.0) —Less: Maintenance Capital Expenditures (1.6) (1.8) (1.9) (1.9) (1.9) Unlevered Free Cash Flow $50.8 $66.0 $126.3 $126.7 $134.7 EBITDA Multiple / Perpetuity Growth Rate 8.5x 0.50% Implied Terminal Value $1,161.6 $1,592.8 PV of Terminal Value @ 9.00% Discount Rate $822.9 $1,178.0 Plus: PV of Unlevered Free Cash Flow @ 9.00% Discount Rate 302.2 Implied Asset Value $1,125.1 – $1,480.3 EBITDA Exit Multiple Sensitivities Perpetuity Growth Rate Sensitivities Terminal EBITDA Multiple Perpetuity Growth Rate 6.5x 7.5x 8.5x 9.5x 10.5x —% 0.25% 0.50% 0.75% 1.00% 8.00% $961.6 $1,062.0 $1,162.5 $1,262.9 $1,363.4 8.00% $1,595.0 $1,639.8 $1,687.6 $1,738.7 $1,793.4 C C 8.50% 946.4 1,045.0 1,143.6 1,242.2 1,340.8 C C 8.50% 1,496.6 1,535.8 1,577.4 1,621.7 1,668.9 A A W 9.00% 931.5 1,028.3 1,125.1 1,221.9 1,318.7 W 9.00% 1,409.3 1,443.8 1,480.3 1,519.0 1,560.1 9.50% 916.9 1,012.0 1,107.0 1,202.1 1,297.1 9.50% 1,331.2 1,361.7 1,394.0 1,428.1 1,464.1 10.00% 902.6 996.0 1,089.3 1,182.7 1,276.0 10.00% 1,261.0 1,288.2 1,316.8 1,347.0 1,378.9 Source: TGE management 65
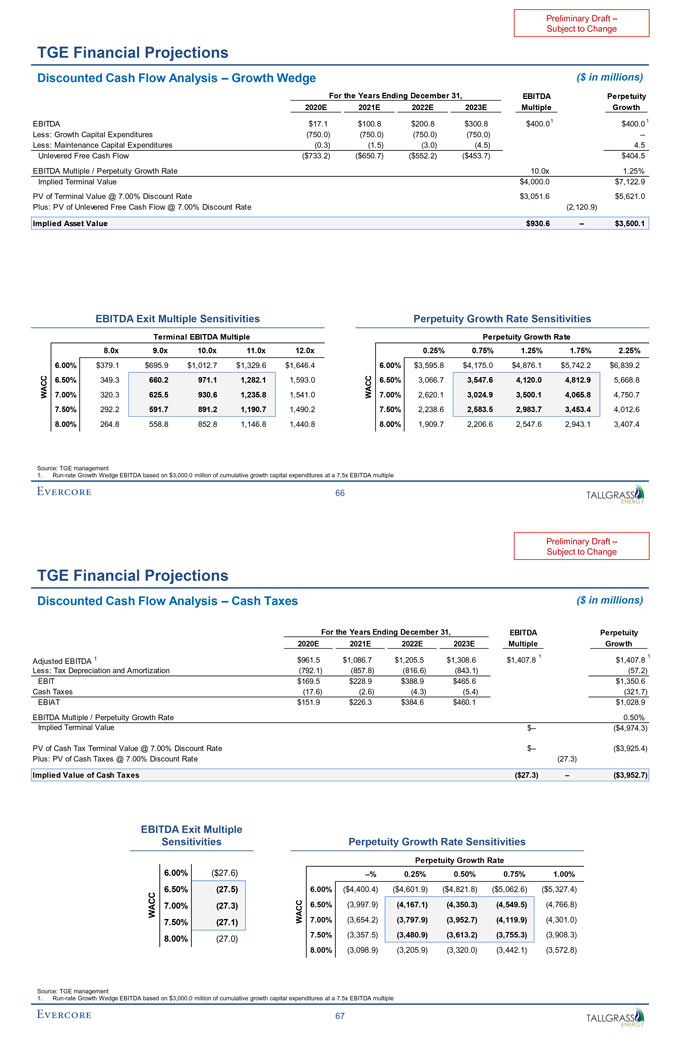
Preliminary Draft –Subject to Change TGE Financial Projections Discounted Cash Flow Analysis – Growth Wedge ($ in millions) For the Years Ending December 31, EBITDA Perpetuity 2020E 2021E 2022E 2023E Multiple Growth EBITDA $17.1 $100.8 $200.8 $300.8 $400.01 $400.0 1 Less: Growth Capital Expenditures (750.0) (750.0) (750.0) (750.0) —Less: Maintenance Capital Expenditures (0.3) (1.5) (3.0) (4.5) 4.5 Unlevered Free Cash Flow ($733.2) ($650.7) ($552.2) ($453.7) $404.5 EBITDA Multiple / Perpetuity Growth Rate 10.0x 1.25% Implied Terminal Value $4,000.0 $7,122.9 PV of Terminal Value @ 7.00% Discount Rate $3,051.6 $5,621.0 Plus: PV of Unlevered Free Cash Flow @ 7.00% Discount Rate (2,120.9) Implied Asset Value $930.6 – $3,500.1 EBITDA Exit Multiple Sensitivities Perpetuity Growth Rate Sensitivities Terminal EBITDA Multiple Perpetuity Growth Rate 8.0x 9.0x 10.0x 11.0x 12.0x 0.25% 0.75% 1.25% 1.75% 2.25% 6.00% $379.1 $695.9 $1,012.7 $1,329.6 $1,646.4 6.00% $3,595.8 $4,175.0 $4,876.1 $5,742.2 $6,839.2 6.50% 349.3 660.2 971.1 1,282.1 1,593.0 6.50% 3,066.7 3,547.6 4,120.0 4,812.9 5,668.8 WACC 7.00% 320.3 625.5 930.6 1,235.8 1,541.0 WACC 7.00% 2,620.1 3,024.9 3,500.1 4,065.8 4,750.7 7.50% 292.2 591.7 891.2 1,190.7 1,490.2 7.50% 2,238.6 2,583.5 2,983.7 3,453.4 4,012.6 8.00% 264.8 558.8 852.8 1,146.8 1,440.8 8.00% 1,909.7 2,206.6 2,547.6 2,943.1 3,407.4 Source: TGE management 1.Run-rate Growth Wedge EBITDA based on $3,000.0 million of cumulative growth capital expenditures at a 7.5x EBITDA multiple 66
Subject to Change TGE Financial Projections Discounted Cash Flow Analysis – Cash Taxes ($ in millions) For the Years Ending December 31, EBITDA Perpetuity 2020E 2021E 2022E 2023E Multiple Growth 1 1 Adjusted EBITDA 1 $961.5 $1,086.7 $1,205.5 $1,308.6 $1,407.8 $1,407.8 Less: Tax Depreciation and Amortization (792.1) (857.8) (816.6) (843.1) (57.2) EBIT $169.5 $228.9 $388.9 $465.6 $1,350.6 Cash Taxes (17.6) (2.6) (4.3) (5.4) (321.7) EBIAT $151.9 $226.3 $384.6 $460.1 $1,028.9 EBITDA Multiple / Perpetuity Growth Rate 0.50% Implied Terminal Value $— ($4,974.3) PV of Cash Tax Terminal Value @ 7.00% Discount Rate $— ($3,925.4) Plus: PV of Cash Taxes @ 7.00% Discount Rate (27.3) Implied Value of Cash Taxes ($27.3) – ($3,952.7) EBITDA Exit Multiple Sensitivities Perpetuity Growth Rate Sensitivities Perpetuity Growth Rate 6.00% ($27.6) —% 0.25% 0.50% 0.75% 1.00% C 6.50% (27.5) 6.00% ($4,400.4) ($4,601.9) ($4,821.8) ($5,062.6) ($5,327.4) C 6.50% (3,997.9) (4,167.1) (4,350.3) (4,549.5) (4,766.8) WA 7.00% (27.3) 7.50% (27.1) WACC 7.00% (3,654.2) (3,797.9) (3,952.7) (4,119.9) (4,301.0) 7.50% (3,357.5) (3,480.9) (3,613.2) (3,755.3) (3,908.3) 8.00% (27.0) 8.00% (3,098.9) (3,205.9) (3,320.0) (3,442.1) (3,572.8) Source: TGE management 1.Run-rate Growth Wedge EBITDA based on $3,000.0 million of cumulative growth capital expenditures at a 7.5x EBITDA multiple 67
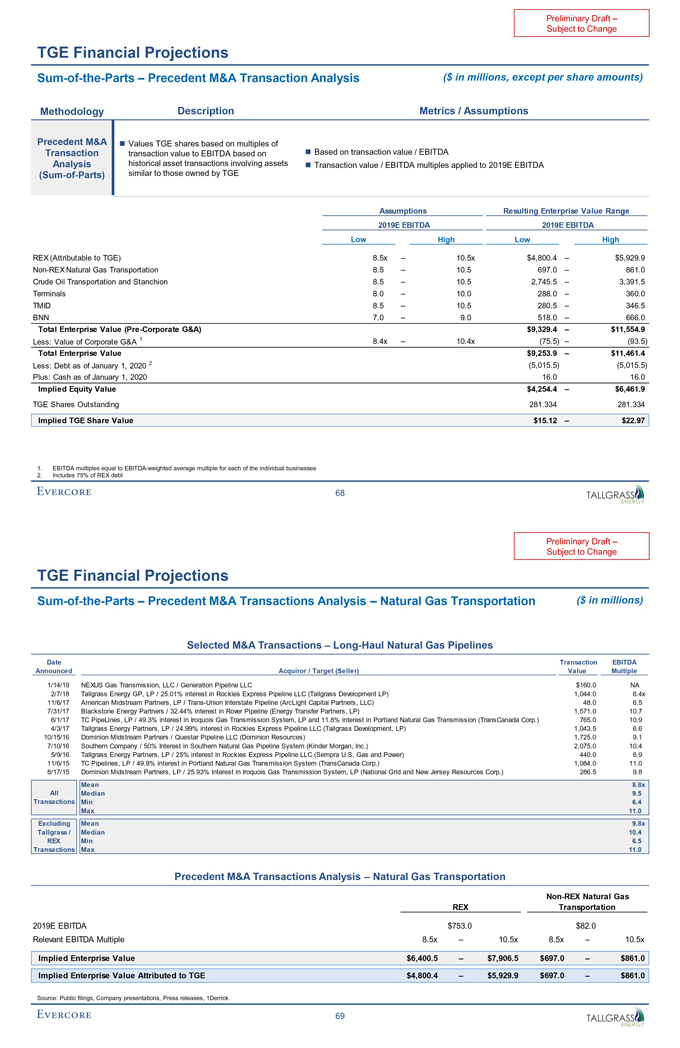
Subject to Change TGE Financial ProjectionsSum-of-the-Parts – Precedent M&A Transaction Analysis ($ in millions, except per share amounts) Methodology Description Metrics / Assumptions Precedent M&A ï® Values TGE shares based on multiples of Transaction transaction value to EBITDA based on ï® Based on transaction value / EBITDA Analysis historical asset transactions involving assetsï® Transaction value / EBITDA multiples applied to 2019E EBITDA(Sum-of-Parts) similar to those owned by TGE Assumptions Resulting Enterprise Value Range 2019E EBITDA 2019E EBITDA Low High Low High REX (Attributable to TGE) 8.5x – 10.5x $4,800.4 – $5,929.9Non-REX Natural Gas Transportation 8.5 – 10.5 697.0 – 861.0 Crude Oil Transportation and Stanchion 8.5 – 10.5 2,745.5 – 3,391.5 Terminals 8.0 – 10.0 288.0 – 360.0 TMID 8.5 – 10.5 280.5 – 346.5 BNN 7.0 – 9.0 518.0 – 666.0 Total Enterprise Value(Pre-Corporate G&A) $9,329.4 – $11,554.9 Less: Value of Corporate G&A 1 8.4x – 10.4x (75.5) – (93.5) Total Enterprise Value $9,253.9 – $11,461.4 Less: Debt as of January 1, 2020 2 (5,015.5) (5,015.5) Plus: Cash as of January 1, 2020 16.0 16.0 Implied Equity Value $4,254.4 – $6,461.9 TGE Shares Outstanding 281.334 281.334 Implied TGE Share Value $15.12 – $22.97 1. EBITDA multiples equal to EBITDA-weighted average multiple for each of the individual businesses 2. Includes 75% of REX debt 68
Preliminary Draft –Subject to Change TGE Financial ProjectionsSum-of-the-Parts – Precedent M&A Transactions Analysis – Natural Gas Transportation ($ in millions) Selected M&A Transactions – Long-Haul Natural Gas Pipelines Date Transaction EBITDA Announced Acquiror / Target (Seller) Value Multiple 1/14/19 NEXUS Gas Transmission, LLC / Generation Pipeline LLC $160.0 NA 2/7/18 Tallgrass Energy GP, LP / 25.01% interest in Rockies Express Pipeline LLC (Tallgrass Development LP) 1,044.0 6.4x 11/6/17 American Midstream Partners, LP / Trans-Union Interstate Pipeline (ArcLight Capital Partners, LLC) 48.0 6.5 7/31/17 Blackstone Energy Partners / 32.44% interest in Rover Pipeline (Energy Transfer Partners, LP) 1,571.0 10.7 6/1/17 TC PipeLines, LP / 49.3% interest in Iroquois Gas Transmission System, LP and 11.8% interest in Portland Natural Gas Transmission (TransCanada Corp.) 765.0 10.9 4/3/17 Tallgrass Energy Partners, LP / 24.99% interest in Rockies Express Pipeline LLC (Tallgrass Development, LP) 1,043.5 6.6 10/15/16 Dominion Midstream Partners / Questar Pipeline LLC (Dominion Resources) 1,725.0 9.1 7/10/16 Southern Company / 50% Interest in Southern Natural Gas Pipeline System (Kinder Morgan, Inc.) 2,075.0 10.4 5/9/16 Tallgrass Energy Partners, LP / 25% interest in Rockies Express Pipeline LLC (Sempra U.S. Gas and Power) 440.0 6.9 11/6/15 TC Pipelines, LP / 49.9% interest in Portland Natural Gas Transmission System (TransCanada Corp.) 1,084.0 11.0 8/17/15 Dominion Midstream Partners, LP / 25.93% Interest in Iroquois Gas Transmission System, LP (National Grid and New Jersey Resources Corp.) 286.5 9.8 Mean 8.8x All Median 9.5 Transactions Min 6.4 Max 11.0 Excluding Mean 9.8x Tallgrass / Median 10.4 REX Min 6.5 Transactions Max 11.0 Precedent M&A Transactions Analysis – Natural Gas TransportationNon-REX Natural Gas REX Transportation 2019E EBITDA $753.0 $82.0 Relevant EBITDA Multiple 8.5x – 10.5x 8.5x – 10.5x Implied Enterprise Value $6,400.5 – $7,906.5 $697.0 – $861.0 Implied Enterprise Value Attributed to TGE $4,800.4 – $5,929.9 $697.0 – $861.0 Source: Public filings, Company presentations, Press releases, 1Derrick 69
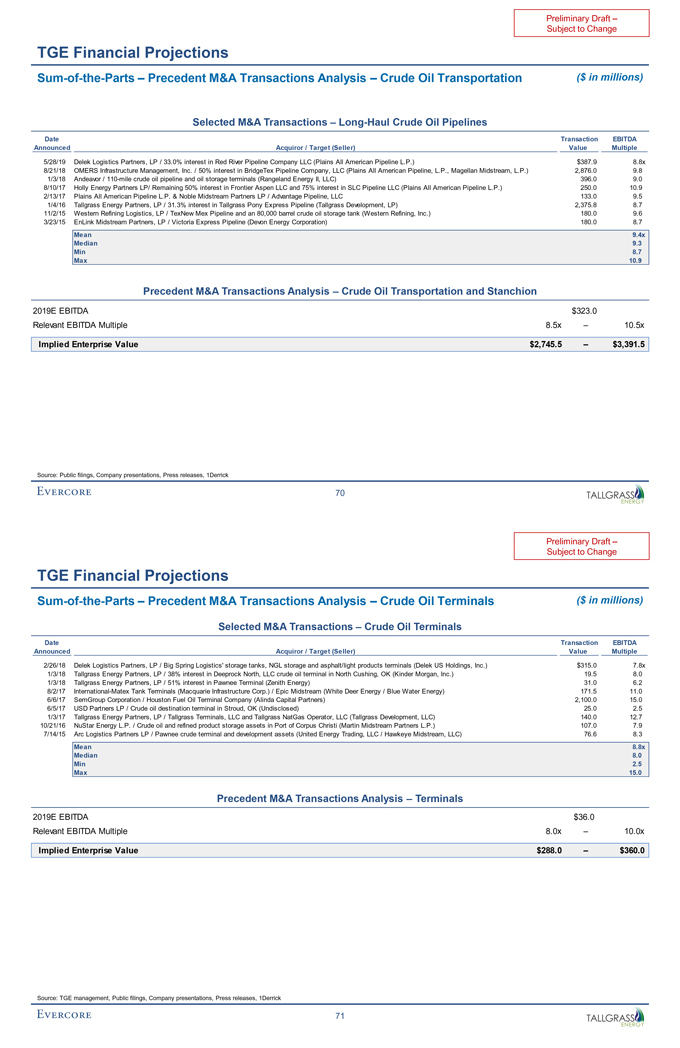
Preliminary Draft –Subject to Change TGE Financial ProjectionsSum-of-the-Parts – Precedent M&A Transactions Analysis – Crude Oil Transportation ($ in millions) Selected M&A Transactions – Long-Haul Crude Oil Pipelines Date Transaction EBITDA Announced Acquiror / Target (Seller) Value Multiple 5/28/19 Delek Logistics Partners, LP / 33.0% interest in Red River Pipeline Company LLC (Plains All American Pipeline L.P.) $387.9 8.8x 8/21/18 OMERS Infrastructure Management, Inc. / 50% interest in BridgeTex Pipeline Company, LLC (Plains All American Pipeline, L.P., Magellan Midstream, L.P.) 2,876.0 9.8 1/3/18 Andeavor /110-mile crude oil pipeline and oil storage terminals (Rangeland Energy II, LLC) 396.0 9.0 8/10/17 Holly Energy Partners LP/ Remaining 50% interest in Frontier Aspen LLC and 75% interest in SLC Pipeline LLC (Plains All American Pipeline L.P.) 250.0 10.9 2/13/17 Plains All American Pipeline L.P. & Noble Midstream Partners LP / Advantage Pipeline, LLC 133.0 9.5 1/4/16 Tallgrass Energy Partners, LP / 31.3% interest in Tallgrass Pony Express Pipeline (Tallgrass Development, LP) 2,375.8 8.7 11/2/15 Western Refining Logistics, LP / TexNew Mex Pipeline and an 80,000 barrel crude oil storage tank (Western Refining, Inc.) 180.0 9.6 3/23/15 EnLink Midstream Partners, LP / Victoria Express Pipeline (Devon Energy Corporation) 180.0 8.7 Mean 9.4x Median 9.3 Min 8.7 Max 10.9 Precedent M&A Transactions Analysis – Crude Oil Transportation and Stanchion 2019E EBITDA $323.0 Relevant EBITDA Multiple 8.5x – 10.5x Implied Enterprise Value $2,745.5 – $3,391.5 Source: Public filings, Company presentations, Press releases, 1Derrick 70
Preliminary Draft –Subject to Change TGE Financial ProjectionsSum-of-the-Parts – Precedent M&A Transactions Analysis – Crude Oil Terminals ($ in millions) Selected M&A Transactions – Crude Oil Terminals Date Transaction EBITDA Announced Acquiror / Target (Seller) Value Multiple 2/26/18 Delek Logistics Partners, LP / Big Spring Logistics’ storage tanks, NGL storage and asphalt/light products terminals (Delek US Holdings, Inc.) $315.0 7.8x 1/3/18 Tallgrass Energy Partners, LP / 38% interest in Deeprock North, LLC crude oil terminal in North Cushing, OK (Kinder Morgan, Inc.) 19.5 8.0 1/3/18 Tallgrass Energy Partners, LP / 51% interest in Pawnee Terminal (Zenith Energy) 31.0 6.2 8/2/17 International-Matex Tank Terminals (Macquarie Infrastructure Corp.) / Epic Midstream (White Deer Energy / Blue Water Energy) 171.5 11.0 6/6/17 SemGroup Corporation / Houston Fuel Oil Terminal Company (Alinda Capital Partners) 2,100.0 15.0 6/5/17 USD Partners LP / Crude oil destination terminal in Stroud, OK (Undisclosed) 25.0 2.5 1/3/17 Tallgrass Energy Partners, LP / Tallgrass Terminals, LLC and Tallgrass NatGas Operator, LLC (Tallgrass Development, LLC) 140.0 12.7 10/21/16 NuStar Energy L.P. / Crude oil and refined product storage assets in Port of Corpus Christi (Martin Midstream Partners L.P.) 107.0 7.9 7/14/15 Arc Logistics Partners LP / Pawnee crude terminal and development assets (United Energy Trading, LLC / Hawkeye Midstream, LLC) 76.6 8.3 Mean 8.8x Median 8.0 Min 2.5 Max 15.0 Precedent M&A Transactions Analysis – Terminals 2019E EBITDA $36.0 Relevant EBITDA Multiple 8.0x – 10.0x Implied Enterprise Value $288.0 – $360.0 Source: TGE management, Public filings, Company presentations, Press releases, 1Derrick 71
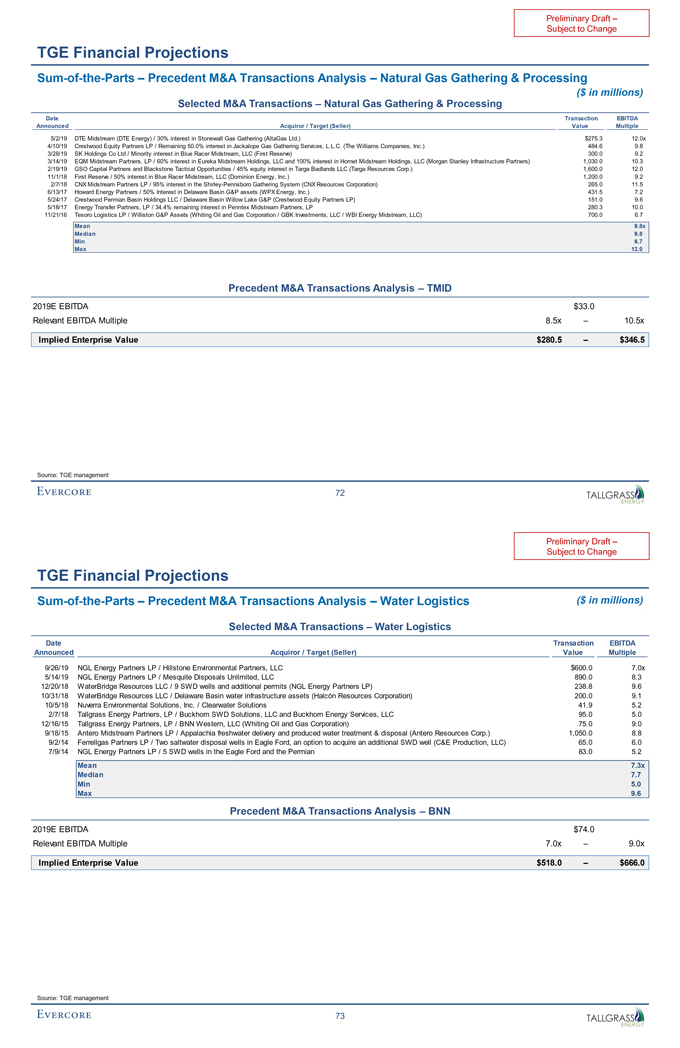
Preliminary Draft –Subject to Change TGE Financial ProjectionsSum-of-the-Parts – Precedent M&A Transactions Analysis – Natural Gas Gathering & Processing ($ in millions) Selected M&A Transactions – Natural Gas Gathering & Processing Date Transaction EBITDA Announced Acquiror / Target (Seller) Value Multiple 5/2/19 DTE Midstream (DTE Energy) / 30% interest in Stonewall Gas Gathering (AltaGas Ltd.) $275.3 12.0x 4/10/19 Crestwood Equity Partners LP / Remaining 50.0% interest in Jackalope Gas Gathering Services, L.L.C. (The Williams Companies, Inc.) 484.6 9.8 3/28/19 SK Holdings Co Ltd / Minority interest in Blue Racer Midstream, LLC (First Reserve) 300.0 9.2 3/14/19 EQM Midstream Partners, LP / 60% interest in Eureka Midstream Holdings, LLC and 100% interest in Hornet Midstream Holdings, LLC (Morgan Stanley Infrastructure Partners) 1,030.0 10.3 2/19/19 GSO Capital Partners and Blackstone Tactical Opportunities / 45% equity interest in Targa Badlands LLC (Targa Resources Corp.) 1,600.0 12.0 11/1/18 First Reserve / 50% interest in Blue Racer Midstream, LLC (Dominion Energy, Inc.) 1,200.0 9.2 2/7/18 CNX Midstream Partners LP / 95% interest in the Shirley-Pennsboro Gathering System (CNX Resources Corporation) 265.0 11.5 6/13/17 Howard Energy Partners / 50% Interest in Delaware Basin G&P assets (WPX Energy, Inc.) 431.5 7.2 5/24/17 Crestwood Permian Basin Holdings LLC / Delaware Basin Willow Lake G&P (Crestwood Equity Partners LP) 151.0 9.6 5/18/17 Energy Transfer Partners, LP / 34.4% remaining interest in Penntex Midstream Partners, LP 280.3 10.0 11/21/16 Tesoro Logistics LP / Williston G&P Assets (Whiting Oil and Gas Corporation / GBK Investments, LLC / WBI Energy Midstream, LLC) 700.0 6.7 Mean 9.8x Median 9.8 Min 6.7 Max 12.0 Precedent M&A Transactions Analysis – TMID 2019E EBITDA $33.0 Relevant EBITDA Multiple 8.5x – 10.5x Implied Enterprise Value $280.5 – $346.5 Source: TGE management 72
Preliminary Draft –Subject to Change TGE Financial ProjectionsSum-of-the-Parts – Precedent M&A Transactions Analysis – Water Logistics ($ in millions) Selected M&A Transactions – Water Logistics Date Transaction EBITDA Announced Acquiror / Target (Seller) Value Multiple 9/26/19 NGL Energy Partners LP / Hillstone Environmental Partners, LLC $600.0 7.0x 5/14/19 NGL Energy Partners LP / Mesquite Disposals Unlimited, LLC 890.0 8.3 12/20/18 WaterBridge Resources LLC / 9 SWD wells and additional permits (NGL Energy Partners LP) 238.8 9.6 10/31/18 WaterBridge Resources LLC / Delaware Basin water infrastructure assets (Halcón Resources Corporation) 200.0 9.1 10/5/18 Nuverra Environmental Solutions, Inc. / Clearwater Solutions 41.9 5.2 2/7/18 Tallgrass Energy Partners, LP / Buckhorn SWD Solutions, LLC and Buckhorn Energy Services, LLC 95.0 5.0 12/16/15 Tallgrass Energy Partners, LP / BNN Western, LLC (Whiting Oil and Gas Corporation) 75.0 9.0 9/18/15 Antero Midstream Partners LP / Appalachia freshwater delivery and produced water treatment & disposal (Antero Resources Corp.) 1,050.0 8.8 9/2/14 Ferrellgas Partners LP / Two saltwater disposal wells in Eagle Ford, an option to acquire an additional SWD well (C&E Production, LLC) 65.0 6.0 7/9/14 NGL Energy Partners LP / 5 SWD wells in the Eagle Ford and the Permian 83.0 5.2 Mean 7.3x Median 7.7 Min 5.0 Max 9.6 Precedent M&A Transactions Analysis – BNN 2019E EBITDA $74.0 Relevant EBITDA Multiple 7.0x – 9.0x Implied Enterprise Value $518.0 – $666.0 Source: TGE management 73
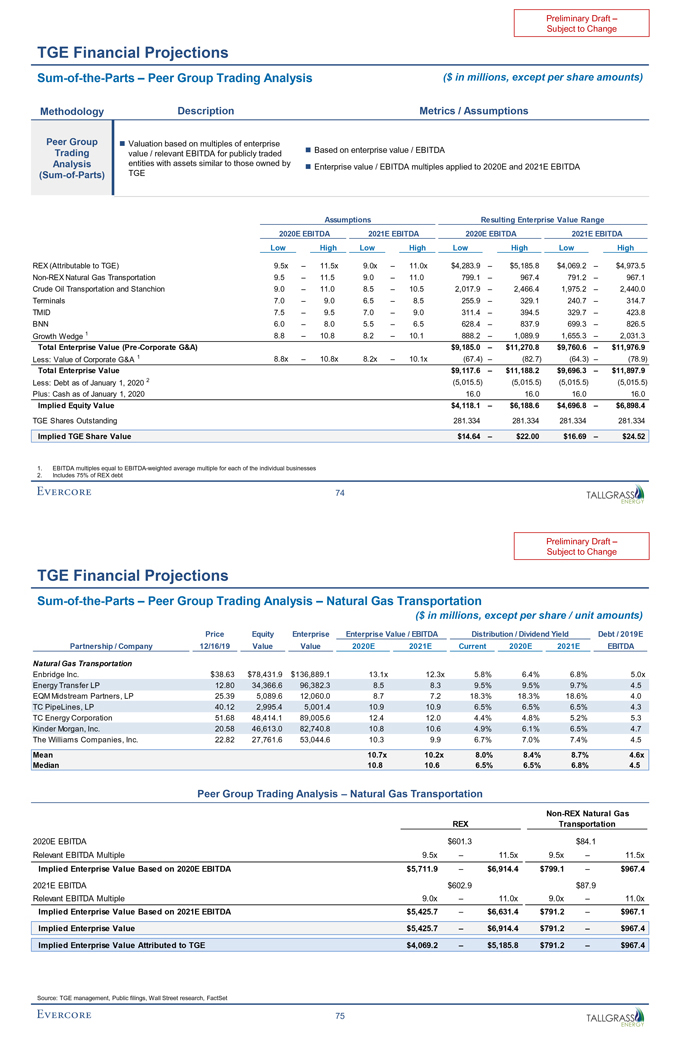
Preliminary Draft –Subject to Change TGE Financial ProjectionsSum-of-the-Parts – Peer Group Trading Analysis ($ in millions, except per share amounts) Methodology Description Metrics / Assumptions Peer Group ï® Valuation based on multiples of enterprise Trading value / relevant EBITDA for publicly traded ï® Based on enterprise value / EBITDA Analysis entities with assets similar to those owned by ï® Enterprise value / EBITDA multiples applied to 2020E and 2021E EBITDA(Sum-of-Parts) TGE Assumptions Resulting Enterprise Value Range 2020E EBITDA 2021E EBITDA 2020E EBITDA 2021E EBITDA Low High Low High Low High Low High REX (Attributable to TGE) 9.5x – 11.5x 9.0x – 11.0x $4,283.9 – $5,185.8 $4,069.2 – $4,973.5Non-REX Natural Gas Transportation 9.5 – 11.5 9.0 – 11.0 799.1 – 967.4 791.2 – 967.1 Crude Oil Transportation and Stanchion 9.0 – 11.0 8.5 – 10.5 2,017.9 – 2,466.4 1,975.2 – 2,440.0 Terminals 7.0 – 9.0 6.5 – 8.5 255.9 – 329.1 240.7 – 314.7 TMID 7.5 – 9.5 7.0 – 9.0 311.4 – 394.5 329.7 – 423.8 BNN 6.0 – 8.0 5.5 – 6.5 628.4 – 837.9 699.3 – 826.5 Growth Wedge 1 8.8 – 10.8 8.2 – 10.1 888.2 – 1,089.9 1,655.3 – 2,031.3 Total Enterprise Value(Pre-Corporate G&A) $9,185.0 – $11,270.8 $9,760.6 – $11,976.9 Less: Value of Corporate G&A 1 8.8x – 10.8x 8.2x – 10.1x (67.4) – (82.7) (64.3) – (78.9) Total Enterprise Value $9,117.6 – $11,188.2 $9,696.3 – $11,897.9 Less: Debt as of January 1, 2020 2 (5,015.5) (5,015.5) (5,015.5) (5,015.5) Plus: Cash as of January 1, 2020 16.0 16.0 16.0 16.0 Implied Equity Value $4,118.1 – $6,188.6 $4,696.8 – $6,898.4 TGE Shares Outstanding 281.334 281.334 281.334 281.334 Implied TGE Share Value $14.64 – $22.00 $16.69 – $24.52 1. EBITDA multiples equal to EBITDA-weighted average multiple for each of the individual businesses 2. Includes 75% of REX debt 74
Preliminary Draft –Subject to Change TGE Financial ProjectionsSum-of-the-Parts – Peer Group Trading Analysis – Natural Gas Transportation ($ in millions, except per share / unit amounts) Price Equity Enterprise Enterprise Value / EBITDA Distribution / Dividend Yield Debt / 2019E Partnership / Company 12/16/19 Value Value 2020E 2021E Current 2020E 2021E EBITDA Natural Gas Transportation Enbridge Inc. $38.63 $78,431.9 $136,889.1 13.1x 12.3x 5.8% 6.4% 6.8% 5.0x Energy Transfer LP 12.80 34,366.6 96,382.3 8.5 8.3 9.5% 9.5% 9.7% 4.5 EQM Midstream Partners, LP 25.39 5,089.6 12,060.0 8.7 7.2 18.3% 18.3% 18.6% 4.0 TC PipeLines, LP 40.12 2,995.4 5,001.4 10.9 10.9 6.5% 6.5% 6.5% 4.3 TC Energy Corporation 51.68 48,414.1 89,005.6 12.4 12.0 4.4% 4.8% 5.2% 5.3 Kinder Morgan, Inc. 20.58 46,613.0 82,740.8 10.8 10.6 4.9% 6.1% 6.5% 4.7 The Williams Companies, Inc. 22.82 27,761.6 53,044.6 10.3 9.9 6.7% 7.0% 7.4% 4.5 Mean 10.7x 10.2x 8.0% 8.4% 8.7% 4.6x Median 10.8 10.6 6.5% 6.5% 6.8% 4.5 Peer Group Trading Analysis – Natural Gas TransportationNon-REX Natural Gas REX Transportation 2020E EBITDA $601.3 $84.1 Relevant EBITDA Multiple 9.5x – 11.5x 9.5x – 11.5x Implied Enterprise Value Based on 2020E EBITDA $5,711.9 – $6,914.4 $799.1 – $967.4 2021E EBITDA $602.9 $87.9 Relevant EBITDA Multiple 9.0x – 11.0x 9.0x – 11.0x Implied Enterprise Value Based on 2021E EBITDA $5,425.7 – $6,631.4 $791.2 – $967.1 Implied Enterprise Value $5,425.7 – $6,914.4 $791.2 – $967.4 Implied Enterprise Value Attributed to TGE $4,069.2 – $5,185.8 $791.2 – $967.4 Source: TGE management, Public filings, Wall Street research, FactSet 75
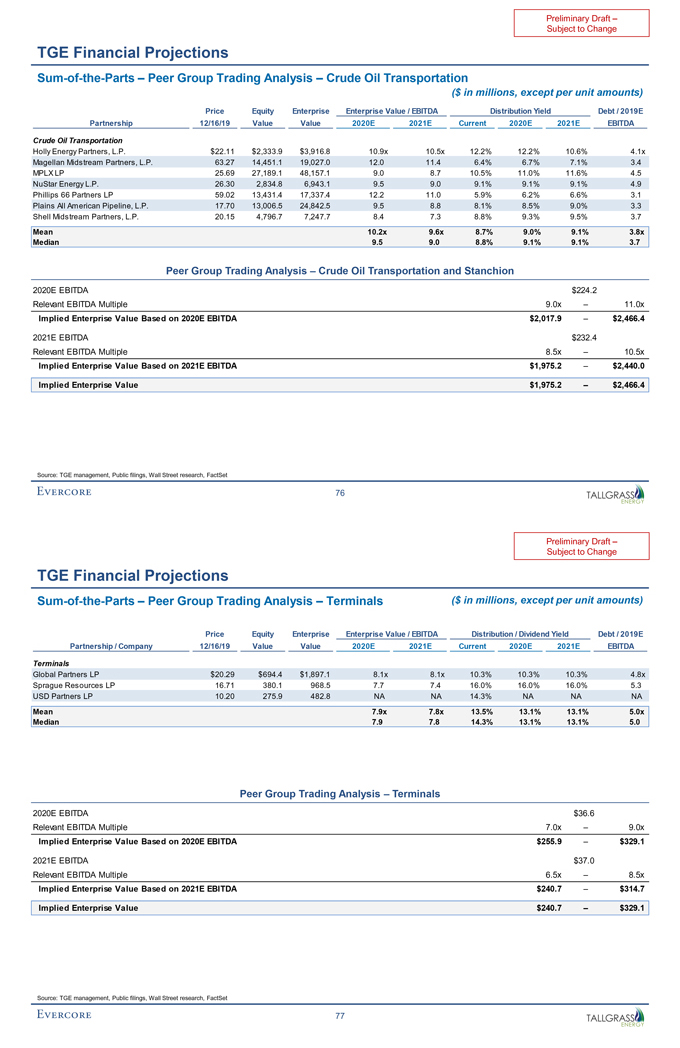
Preliminary Draft –Subject to Change TGE Financial ProjectionsSum-of-the-Parts – Peer Group Trading Analysis – Crude Oil Transportation ($ in millions, except per unit amounts) Price Equity Enterprise Enterprise Value / EBITDA Distribution Yield Debt / 2019E Partnership 12/16/19 Value Value 2020E 2021E Current 2020E 2021E EBITDA Crude Oil Transportation Holly Energy Partners, L.P. $22.11 $2,333.9 $3,916.8 10.9x 10.5x 12.2% 12.2% 10.6% 4.1x Magellan Midstream Partners, L.P. 63.27 14,451.1 19,027.0 12.0 11.4 6.4% 6.7% 7.1% 3.4 MPLX LP 25.69 27,189.1 48,157.1 9.0 8.7 10.5% 11.0% 11.6% 4.5 NuStar Energy L.P. 26.30 2,834.8 6,943.1 9.5 9.0 9.1% 9.1% 9.1% 4.9 Phillips 66 Partners LP 59.02 13,431.4 17,337.4 12.2 11.0 5.9% 6.2% 6.6% 3.1 Plains All American Pipeline, L.P. 17.70 13,006.5 24,842.5 9.5 8.8 8.1% 8.5% 9.0% 3.3 Shell Midstream Partners, L.P. 20.15 4,796.7 7,247.7 8.4 7.3 8.8% 9.3% 9.5% 3.7 Mean 10.2x 9.6x 8.7% 9.0% 9.1% 3.8x Median 9.5 9.0 8.8% 9.1% 9.1% 3.7 Peer Group Trading Analysis – Crude Oil Transportation and Stanchion 2020E EBITDA $224.2 Relevant EBITDA Multiple 9.0x – 11.0x Implied Enterprise Value Based on 2020E EBITDA $2,017.9 – $2,466.4 2021E EBITDA $232.4 Relevant EBITDA Multiple 8.5x – 10.5x Implied Enterprise Value Based on 2021E EBITDA $1,975.2 – $2,440.0 Implied Enterprise Value $1,975.2 – $2,466.4 Source: TGE management, Public filings, Wall Street research, FactSet 76
Preliminary Draft –Subject to Change TGE Financial ProjectionsSum-of-the-Parts – Peer Group Trading Analysis – Terminals ($ in millions, except per unit amounts) Price Equity Enterprise Enterprise Value / EBITDA Distribution / Dividend Yield Debt / 2019E Partnership / Company 12/16/19 Value Value 2020E 2021E Current 2020E 2021E EBITDA Terminals Global Partners LP $20.29 $694.4 $1,897.1 8.1x 8.1x 10.3% 10.3% 10.3% 4.8x Sprague Resources LP 16.71 380.1 968.5 7.7 7.4 16.0% 16.0% 16.0% 5.3 USD Partners LP 10.20 275.9 482.8 NA NA 14.3% NA NA NA Mean 7.9x 7.8x 13.5% 13.1% 13.1% 5.0x Median 7.9 7.8 14.3% 13.1% 13.1% 5.0 Peer Group Trading Analysis – Terminals 2020E EBITDA $36.6 Relevant EBITDA Multiple 7.0x – 9.0x Implied Enterprise Value Based on 2020E EBITDA $255.9 – $329.1 2021E EBITDA $37.0 Relevant EBITDA Multiple 6.5x – 8.5x Implied Enterprise Value Based on 2021E EBITDA $240.7 – $314.7 Implied Enterprise Value $240.7 – $329.1 Source: TGE management, Public filings, Wall Street research, FactSet 77
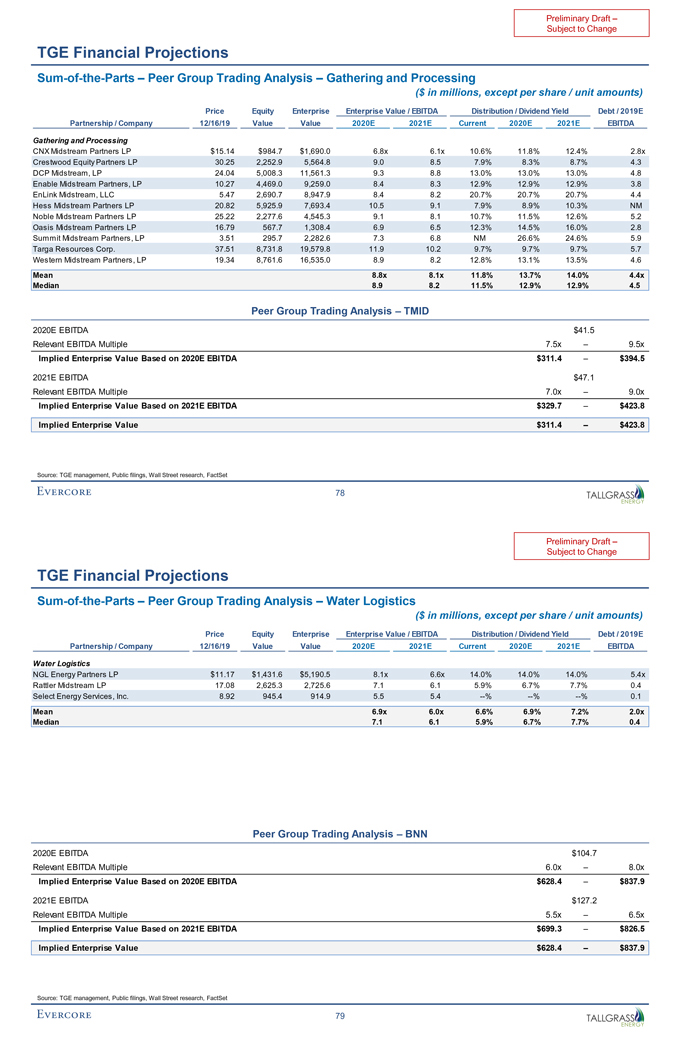
Preliminary Draft –Subject to Change TGE Financial ProjectionsSum-of-the-Parts – Peer Group Trading Analysis – Gathering and Processing ($ in millions, except per share / unit amounts) Price Equity Enterprise Enterprise Value / EBITDA Distribution / Dividend Yield Debt / 2019E Partnership / Company 12/16/19 Value Value 2020E 2021E Current 2020E 2021E EBITDA Gathering and Processing CNX Midstream Partners LP $15.14 $984.7 $1,690.0 6.8x 6.1x 10.6% 11.8% 12.4% 2.8x Crestwood Equity Partners LP 30.25 2,252.9 5,564.8 9.0 8.5 7.9% 8.3% 8.7% 4.3 DCP Midstream, LP 24.04 5,008.3 11,561.3 9.3 8.8 13.0% 13.0% 13.0% 4.8 Enable Midstream Partners, LP 10.27 4,469.0 9,259.0 8.4 8.3 12.9% 12.9% 12.9% 3.8 EnLink Midstream, LLC 5.47 2,690.7 8,947.9 8.4 8.2 20.7% 20.7% 20.7% 4.4 Hess Midstream Partners LP 20.82 5,925.9 7,693.4 10.5 9.1 7.9% 8.9% 10.3% NM Noble Midstream Partners LP 25.22 2,277.6 4,545.3 9.1 8.1 10.7% 11.5% 12.6% 5.2 Oasis Midstream Partners LP 16.79 567.7 1,308.4 6.9 6.5 12.3% 14.5% 16.0% 2.8 Summit Midstream Partners, LP 3.51 295.7 2,282.6 7.3 6.8 NM 26.6% 24.6% 5.9 Targa Resources Corp. 37.51 8,731.8 19,579.8 11.9 10.2 9.7% 9.7% 9.7% 5.7 Western Midstream Partners, LP 19.34 8,761.6 16,535.0 8.9 8.2 12.8% 13.1% 13.5% 4.6 Mean 8.8x 8.1x 11.8% 13.7% 14.0% 4.4x Median 8.9 8.2 11.5% 12.9% 12.9% 4.5 Peer Group Trading Analysis – TMID 2020E EBITDA $41.5 Relevant EBITDA Multiple 7.5x – 9.5x Implied Enterprise Value Based on 2020E EBITDA $311.4 – $394.5 2021E EBITDA $47.1 Relevant EBITDA Multiple 7.0x – 9.0x Implied Enterprise Value Based on 2021E EBITDA $329.7 – $423.8 Implied Enterprise Value $311.4 – $423.8 Source: TGE management, Public filings, Wall Street research, FactSet 78
Preliminary Draft –Subject to Change TGE Financial ProjectionsSum-of-the-Parts – Peer Group Trading Analysis – Water Logistics ($ in millions, except per share / unit amounts) Price Equity Enterprise Enterprise Value / EBITDA Distribution / Dividend Yield Debt / 2019E Partnership / Company 12/16/19 Value Value 2020E 2021E Current 2020E 2021E EBITDA Water Logistics NGL Energy Partners LP $11.17 $1,431.6 $5,190.5 8.1x 6.6x 14.0% 14.0% 14.0% 5.4x Rattler Midstream LP 17.08 2,625.3 2,725.6 7.1 6.1 5.9% 6.7% 7.7% 0.4 Select Energy Services, Inc. 8.92 945.4 914.9 5.5 5.4 —% —% —% 0.1 Mean 6.9x 6.0x 6.6% 6.9% 7.2% 2.0x Median 7.1 6.1 5.9% 6.7% 7.7% 0.4 Peer Group Trading Analysis – BNN 2020E EBITDA $104.7 Relevant EBITDA Multiple 6.0x – 8.0x Implied Enterprise Value Based on 2020E EBITDA $628.4 – $837.9 2021E EBITDA $127.2 Relevant EBITDA Multiple 5.5x – 6.5x Implied Enterprise Value Based on 2021E EBITDA $699.3 – $826.5 Implied Enterprise Value $628.4 – $837.9 Source: TGE management, Public filings, Wall Street research, FactSet 79
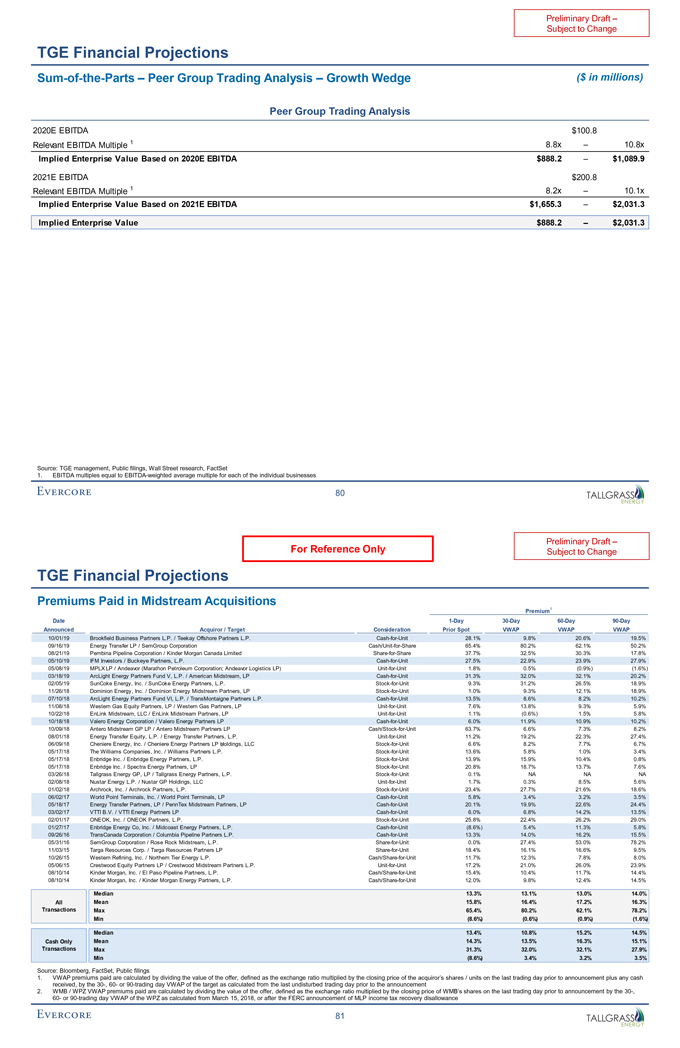
Preliminary Draft –Subject to Change TGE Financial ProjectionsSum-of-the-Parts – Peer Group Trading Analysis – Growth Wedge ($ in millions) Peer Group Trading Analysis 2020E EBITDA $100.8 Relevant EBITDA Multiple 1 8.8x – 10.8x Implied Enterprise Value Based on 2020E EBITDA $888.2 – $1,089.9 2021E EBITDA $200.8 Relevant EBITDA Multiple 1 8.2x – 10.1x Implied Enterprise Value Based on 2021E EBITDA $1,655.3 – $2,031.3 Implied Enterprise Value $888.2 – $2,031.3 Source: TGE management, Public filings, Wall Street research, FactSet 1. EBITDA multiples equal to EBITDA-weighted average multiple for each of the individual businesses 80
Preliminary Draft – For Reference Only Subject to Change TGE Financial Projections Premiums Paid in Midstream Acquisitions Premium1 Date1-Day30-Day60-Day90-Day Announced Acquiror / Target Consideration Prior Spot VWAP VWAP VWAP 10/01/19 Brookfield Business Partners L.P. / Teekay Offshore Partners L.P.Cash-for-Unit 28.1% 9.8% 20.6% 19.5% 09/16/19 Energy Transfer LP / SemGroup CorporationCash/Unit-for-Share 65.4% 80.2% 62.1% 50.2% 08/21/19 Pembina Pipeline Corporation / Kinder Morgan Canada LimitedShare-for-Share 37.7% 32.5% 30.3% 17.8% 05/10/19 IFM Investors / Buckeye Partners, L.P.Cash-for-Unit 27.5% 22.9% 23.9% 27.9% 05/08/19 MPLX LP / Andeavor (Marathon Petroleum Corporation; Andeavor Logistics LP)Unit-for-Unit 1.8% 0.5% (0.9%) (1.6%) 03/18/19 ArcLight Energy Partners Fund V, L.P. / American Midstream, LPCash-for-Unit 31.3% 32.0% 32.1% 20.2% 02/05/19 SunCoke Energy, Inc. / SunCoke Energy Partners, L.P.Stock-for-Unit 9.3% 31.2% 26.5% 18.9% 11/26/18 Dominion Energy, Inc. / Dominion Energy Midstream Partners, LPStock-for-Unit 1.0% 9.3% 12.1% 18.9% 07/10/18 ArcLight Energy Partners Fund VI, L.P. / TransMontaigne Partners L.P.Cash-for-Unit 13.5% 8.6% 8.2% 10.2% 11/08/18 Western Gas Equity Partners, LP / Western Gas Partners, LPUnit-for-Unit 7.6% 13.8% 9.3% 5.9% 10/22/18 EnLink Midstream, LLC / EnLink Midstream Partners, LPUnit-for-Unit 1.1% (0.6%) 1.5% 5.8% 10/18/18 Valero Energy Corporation / Valero Energy Partners LPCash-for-Unit 6.0% 11.9% 10.9% 10.2% 10/09/18 Antero Midstream GP LP / Antero Midstream Partners LPCash/Stock-for-Unit 63.7% 6.6% 7.3% 8.2% 08/01/18 Energy Transfer Equity, L.P. / Energy Transfer Partners, L.P.Unit-for-Unit 11.2% 19.2% 22.3% 27.4% 06/09/18 Cheniere Energy, Inc. / Cheniere Energy Partners LP Holdings, 2 LLCStock-for-Unit 6.6% 8.2% 7.7% 6.7% 05/17/18 The Williams Companies, Inc. / Williams Partners L.P.Stock-for-Unit 13.6% 5.8% 1.0% 3.4% 05/17/18 Enbridge Inc. / Enbridge Energy Partners, L.P.Stock-for-Unit 13.9% 15.9% 10.4% 0.8% 05/17/18 Enbridge Inc. / Spectra Energy Partners, LPStock-for-Unit 20.8% 18.7% 13.7% 7.6% 03/26/18 Tallgrass Energy GP, LP / Tallgrass Energy Partners, L.P.Stock-for-Unit 0.1% NA NA NA 02/08/18 Nustar Energy L.P. / Nustar GP Holdings, LLCUnit-for-Unit 1.7% 0.3% 8.5% 5.6% 01/02/18 Archrock, Inc. / Archrock Partners, L.P.Stock-for-Unit 23.4% 27.7% 21.6% 18.6% 06/02/17 World Point Terminals, Inc. / World Point Terminals, LPCash-for-Unit 5.8% 3.4% 3.2% 3.5% 05/18/17 Energy Transfer Partners, LP / PennTex Midstream Partners, LPCash-for-Unit 20.1% 19.9% 22.6% 24.4% 03/02/17 VTTI B.V. / VTTI Energy Partners LPCash-for-Unit 6.0% 6.8% 14.2% 13.5% 02/01/17 ONEOK, Inc. / ONEOK Partners, L.P.Stock-for-Unit 25.8% 22.4% 26.2% 29.0% 01/27/17 Enbridge Energy Co, Inc. / Midcoast Energy Partners, L.P.Cash-for-Unit (8.6%) 5.4% 11.3% 5.8% 09/26/16 TransCanada Corporation / Columbia Pipeline Partners L.P.Cash-for-Unit 13.3% 14.0% 16.2% 15.5% 05/31/16 SemGroup Corporation / Rose Rock Midstream, L.P.Share-for-Unit 0.0% 27.4% 53.0% 78.2% 11/03/15 Targa Resources Corp. / Targa Resources Partners LPShare-for-Unit 18.4% 16.1% 16.6% 9.5% 10/26/15 Western Refining, Inc. / Northern Tier Energy L.P.Cash/Share-for-Unit 11.7% 12.3% 7.8% 8.0% 05/06/15 Crestwood Equity Partners LP / Crestwood Midstream Partners L.P.Unit-for-Unit 17.2% 21.0% 26.0% 23.9% 08/10/14 Kinder Morgan, Inc. / El Paso Pipeline Partners, L.P.Cash/Share-for-Unit 15.4% 10.4% 11.7% 14.4% 08/10/14 Kinder Morgan, Inc. / Kinder Morgan Energy Partners, L.P.Cash/Share-for-Unit 12.0% 9.8% 12.4% 14.5% Median 13.3% 13.1% 13.0% 14.0% All Mean 15.8% 16.4% 17.2% 16.3% Transactions Max 65.4% 80.2% 62.1% 78.2% Min (8.6%) (0.6%) (0.9%) (1.6%) Median 13.4% 10.8% 15.2% 14.5% Cash Only Mean 14.3% 13.5% 16.3% 15.1% Transactions Max 31.3% 32.0% 32.1% 27.9% Min (8.6%) 3.4% 3.2% 3.5% Source: Bloomberg, FactSet, Public filings 1. VWAP premiums paid are calculated by dividing the value of the offer, defined as the exchange ratio multiplied by the closing price of the acquiror’s shares / units on the last trading day prior to announcement plus any cash received, by the30-,60- or90-trading day VWAP of the target as calculated from the last undisturbed trading day prior to the announcement 2. WMB / WPZ VWAP premiums paid are calculated by dividing the value of the offer, defined as the exchange ratio multiplied by the closing price of WMB’s shares on the last trading day prior to announcement by the30-,60- or90-trading day VWAP of the WPZ as calculated from March 15, 2018, or after the FERC announcement of MLP income tax recovery disallowance 81
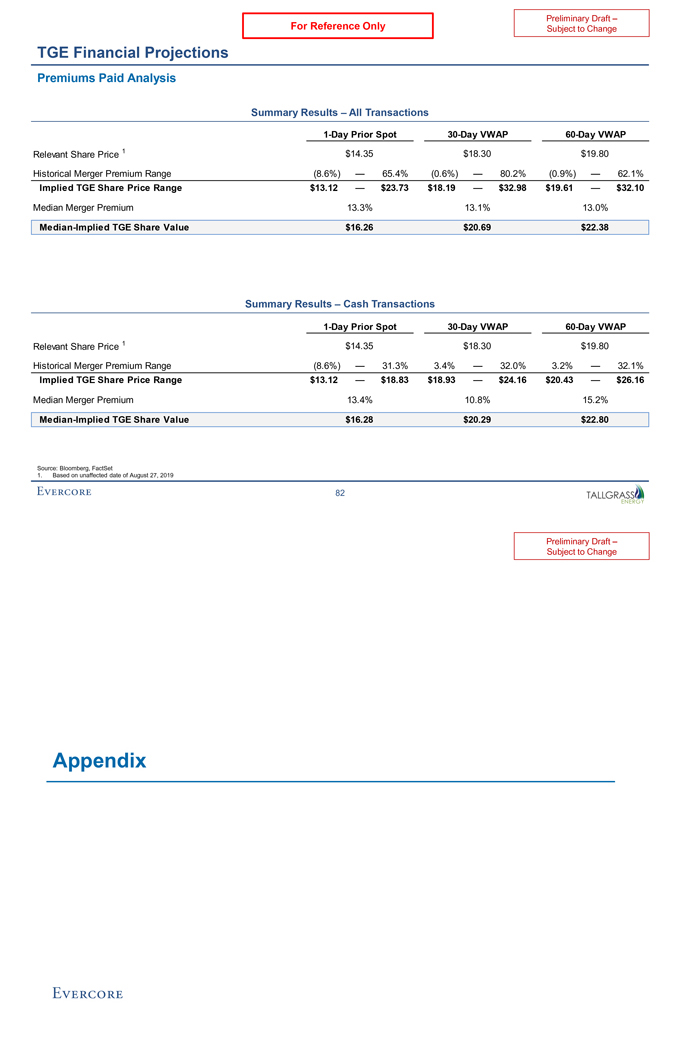
Preliminary Draft – For Reference Only Subject to Change TGE Financial Projections Premiums Paid Analysis Summary Results – All Transactions1-Day Prior Spot30-Day VWAP60-Day VWAP Relevant Share Price 1 $14.35 $18.30 $19.80 Historical Merger Premium Range (8.6%) — 65.4% (0.6%) — 80.2% (0.9%) — 62.1% Implied TGE Share Price Range $13.12 — $23.73 $18.19 — $32.98 $19.61 — $32.10 Median Merger Premium 13.3% 13.1% 13.0% Median-Implied TGE Share Value $16.26 $20.69 $22.38 Summary Results – Cash Transactions1-Day Prior Spot30-Day VWAP60-Day VWAP Relevant Share Price 1 $14.35 $18.30 $19.80 Historical Merger Premium Range (8.6%) — 31.3% 3.4% — 32.0% 3.2% — 32.1% Implied TGE Share Price Range $13.12 — $18.83 $18.93 — $24.16 $20.43 — $26.16 Median Merger Premium 13.4% 10.8% 15.2% Median-Implied TGE Share Value $16.28 $20.29 $22.80 Source: Bloomberg, FactSet 1. Based on unaffected date of August 27, 2019 82
Preliminary Draft –Subject to Change Appendix
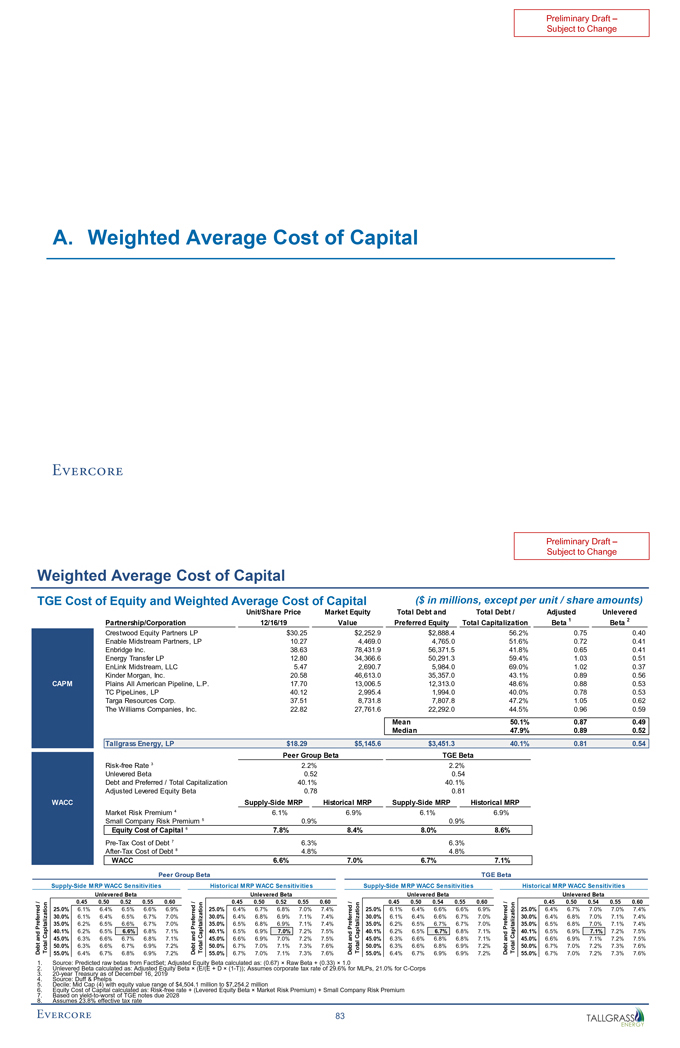
Preliminary Draft –Subject to Change A. Weighted Average Cost of Capital
Preliminary Draft –Subject to Change Weighted Average Cost of Capital TGE Cost of Equity and Weighted Average Cost of Capital ($ in millions, except per unit / share amounts) Unit/Share Price Market Equity Total Debt and Total Debt / Adjusted Unlevered Partnership/Corporation 12/16/19 Value Preferred Total Capitalization Beta 1 2 Equity Beta Crestwood Equity Partners LP $30.25 $2,252.9 $2,888.4 56.2% 0.75 0.40 Enable Midstream Partners, LP 10.27 4,469.0 4,765.0 51.6% 0.72 0.41 Enbridge Inc. 38.63 78,431.9 56,371.5 41.8% 0.65 0.41 Energy Transfer LP 12.80 34,366.6 50,291.3 59.4% 1.03 0.51 EnLink Midstream, LLC 5.47 2,690.7 5,984.0 69.0% 1.02 0.37 Kinder Morgan, Inc. 20.58 46,613.0 35,357.0 43.1% 0.89 0.56 CAPM Plains All American Pipeline, L.P. 17.70 13,006.5 12,313.0 48.6% 0.88 0.53 TC PipeLines, LP 40.12 2,995.4 1,994.0 40.0% 0.78 0.53 Targa Resources Corp. 37.51 8,731.8 7,807.8 47.2% 1.05 0.62 The Williams Companies, Inc. 22.82 27,761.6 22,292.0 44.5% 0.96 0.59 Mean 50.1% 0.87 0.49 Median 47.9% 0.89 0.52 Tallgrass Energy, LP $18.29 $5,145.6 $3,451.3 40.1% 0.81 0.54 Peer Group Beta TGE Beta Risk-free Rate 3 2.2% 2.2% Unlevered Beta 0.52 0.54 Debt and Preferred / Total Capitalization 40.1% 40.1% Adjusted Levered Equity Beta 0.78 0.81 WACC Supply-Side MRP Historical MRP Supply-Side MRP Historical MRP Market Risk Premium 4 6.1% 6.9% 6.1% 6.9% Small Company Risk Premium 5 0.9% 0.9% Equity Cost of Capital 6 7.8% 8.4% 8.0% 8.6%Pre-Tax Cost of Debt 7 6.3% 6.3%After-Tax Cost of Debt 8 4.8% 4.8% WACC 6.6% 7.0% 6.7% 7.1% Peer Group Beta TGE Beta Supply-Side MRP WACC Sensitivities Historical MRP WACC Sensitivities Supply-Side MRP WACC Sensitivities Historical MRP WACC Sensitivities Unlevered Beta Unlevered Beta Unlevered Beta Unlevered Beta / 0.45 0.50 0.52 0.55 0.60 / 0.45 0.50 0.52 0.55 0.60 / 0.45 0.50 0.54 0.55 0.60/ 0.45 0.50 0.54 0.55 0.60 on on on on red i t 25.0% 6.1% 6.4% 6.5% 6.6% 6.9% red i t 25.0% 6.4% 6.7% 6.8% 7.0% 7.4% red t i 25.0% 6.1% 6.4% 6.6% 6.6% 6.9% red i t 25.0% 6.4% 6.7% 7.0% 7.0% 7.4% fer liza 30.0% 6.1% 6.4% 6.5% 6.7% 7.0% fer liza 30.0% 6.4% 6.8% 6.9% 7.1% 7.4% fer liza 30.0% 6.1% 6.4% 6.6% 6.7% 7.0% fer liza 30.0% 6.4% 6.8% 7.0% 7.1% 7.4% Pre a 35.0% 6.2% 6.5% 6.6% 6.7% 7.0% Pre a 35.0% 6.5% 6.8% 6.9% 7.1% 7.4% Pre a 35.0% 6.2% 6.5% 6.7% 6.7% 7.0% Pre a 35.0% 6.5% 6.8% 7.0% 7.1% 7.4% pit Ca 40.1% 6.2% 6.5% 6.6% 6.8% 7.1% pit Ca 40.1% 6.5% 6.9% 7.0% 7.2% 7.5% Ca pit 40.1% 6.2% 6.5% 6.7% 6.8% 7.1% Ca pit 40.1% 6.5% 6.9% 7.1% 7.2% 7.5% and 45.0% 6.3% 6.6% 6.7% 6.8% 7.1% and 45.0% 6.6% 6.9% 7.0% 7.2% 7.5% and 45.0% 6.3% 6.6% 6.8% 6.8% 7.1% and 45.0% 6.6% 6.9% 7.1% 7.2% 7.5% ebt al 50.0% 6.3% 6.6% 6.7% 6.9% 7.2% ebt al 50.0% 6.7% 7.0% 7.1% 7.3% 7.6% ebt al 50.0% 6.3% 6.6% 6.8% 6.9% 7.2%ebt al 50.0% 6.7% 7.0% 7.2% 7.3% 7.6% D Tot 55.0% 6.4% 6.7% 6.8% 6.9% 7.2% D Tot 55.0% 6.7% 7.0% 7.1% 7.3% 7.6% D Tot 55.0% 6.4% 6.7% 6.9% 6.9% 7.2% D Tot 55.0% 6.7% 7.0% 7.2% 7.3% 7.6% 2. 1. Unlevered Source: Predicted Beta calculated raw betas as: from Adjusted FactSet; Equity Adjusted Beta × Equity (E/(E Beta + D × calculated(1-T)); Assumes as: (0.67) corporate × Raw Beta tax rate + (0.33) of 29.6% × 1.0 for MLPs, 21.0% forC-Corps 3. 4.20-year Source: Treasury Duff & Phelps as of December 16, 2019 5. 6. Decile: Equity Cost Mid Cap of Capital (4) with calculated equity value as: Risk-free range of $ rate 4,504.1 + (Levered million Equity to $7,254.2 Beta million × Market Risk Premium) + Small Company Risk Premium 8. 7. Based Assumes on 23.8%yield-to-worst effective of tax TGE rate notes due 2028 83
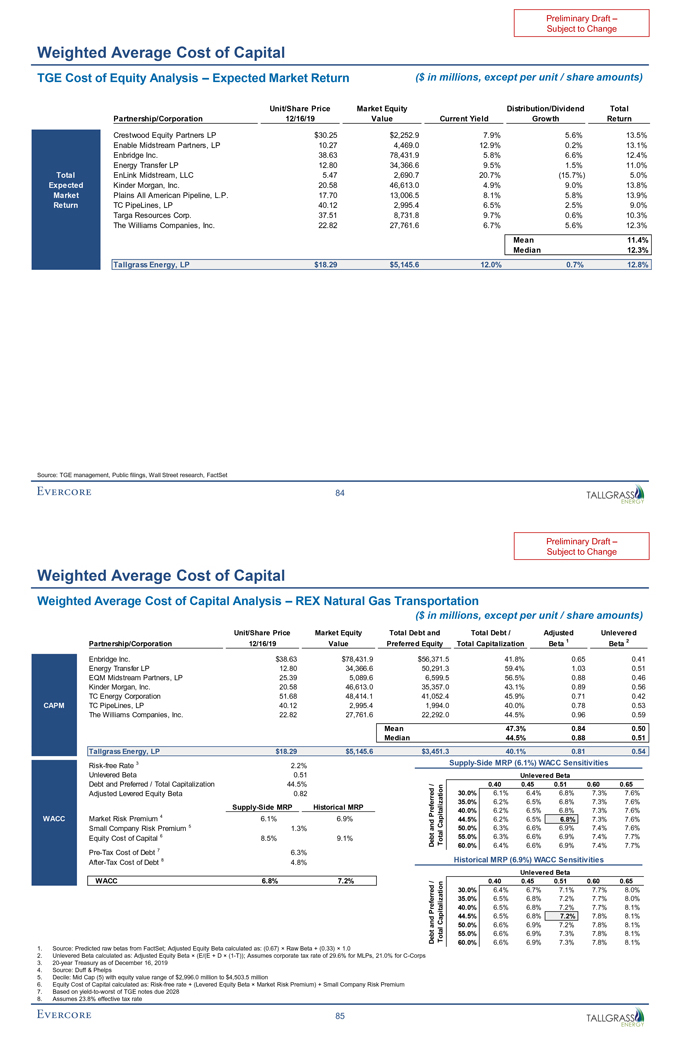
Preliminary Draft –Subject to Change Weighted Average Cost of Capital TGE Cost of Equity Analysis – Expected Market Return ($ in millions, except per unit / share amounts) Unit/Share Price Market Equity Distribution/Dividend Total Partnership/Corporation 12/16/19 Value Current Yield Growth Return Crestwood Equity Partners LP $30.25 $2,252.9 7.9% 5.6% 13.5% Enable Midstream Partners, LP 10.27 4,469.0 12.9% 0.2% 13.1% Enbridge Inc. 38.63 78,431.9 5.8% 6.6% 12.4% Energy Transfer LP 12.80 34,366.6 9.5% 1.5% 11.0% Total EnLink Midstream, LLC 5.47 2,690.7 20.7% (15.7%) 5.0% Expected Kinder Morgan, Inc. 20.58 46,613.0 4.9% 9.0% 13.8% Market Plains All American Pipeline, L.P. 17.70 13,006.5 8.1% 5.8% 13.9% Return TC PipeLines, LP 40.12 2,995.4 6.5% 2.5% 9.0% Targa Resources Corp. 37.51 8,731.8 9.7% 0.6% 10.3% The Williams Companies, Inc. 22.82 27,761.6 6.7% 5.6% 12.3% Mean 11.4% Median 12.3% Tallgrass Energy, LP $18.29 $5,145.6 12.0% 0.7% 12.8% Source: TGE management, Public filings, Wall Street research, FactSet 84
Preliminary Draft –Subject to Change Weighted Average Cost of Capital Weighted Average Cost of Capital Analysis – REX Natural Gas Transportation ($ in millions, except per unit / share amounts) Unit/Share Price Market Equity Total Debt and Total Debt / Adjusted Unlevered 1 Beta 2 Partnership/Corporation 12/16/19 Value Preferred Equity Total Capitalization Beta Enbridge Inc. $38.63 $78,431.9 $56,371.5 41.8% 0.65 0.41 Energy Transfer LP 12.80 34,366.6 50,291.3 59.4% 1.03 0.51 EQM Midstream Partners, LP 25.39 5,089.6 6,599.5 56.5% 0.88 0.46 Kinder Morgan, Inc. 20.58 46,613.0 35,357.0 43.1% 0.89 0.56 TC Energy Corporation 51.68 48,414.1 41,052.4 45.9% 0.71 0.42 CAPM TC PipeLines, LP 40.12 2,995.4 1,994.0 40.0% 0.78 0.53 The Williams Companies, Inc. 22.82 27,761.6 22,292.0 44.5% 0.96 0.59 Mean 47.3% 0.84 0.50 Median 44.5% 0.88 0.51 Tallgrass Energy, LP $18.29 $5,145.6 $3,451.3 40.1% 0.81 0.54 Risk-free Rate 3 2.2% Supply-Side MRP (6.1%) WACC Sensitivities Unlevered Beta 0.51 Unlevered Beta Debt and Preferred / Total Capitalization 44.5%/ 0.40 0.45 0.51 0.60 0.65 Adjusted Levered Equity Beta 0.82 30.0% 6.1% 6.4% 6.8% 7.3% 7.6% erred 35.0% 6.2% 6.5% 6.8% 7.3% 7.6% Supply-Side MRP Historical MRP Pref 40.0% 6.2% 6.5% 6.8% 7.3% 7.6% 4 WACC Market Risk Premium 6.1% 6.9%nd 44.5% 6.2% 6.5% 6.8% 7.3% 7.6% 5Capitalization 50.0% 6.3% 6.6% 6.9% 7.4% 7.6% Small Company Risk Premium 1.3% a Equity Cost of Capital 6 8.5% 9.1% t Deb Total 55.0% 6.3% 6.6% 6.9% 7.4% 7.7% 7 60.0% 6.4% 6.6% 6.9% 7.4% 7.7%Pre-Tax Cost of Debt 6.3%After-Tax Cost of Debt 8 4.8% Historical MRP (6.9%) WACC Sensitivities Unlevered Beta WACC 6.8% 7.2% / 0.40 0.45 0.51 0.60 0.65 tion 30.0% 6.4% 6.7% 7.1% 7.7% 8.0% erred ef za 35.0% 6.5% 6.8% 7.2% 7.7% 8.0% r P itali 40.0% 6.5% 6.8% 7.2% 7.7% 8.1% nd p Ca 44.5% 6.5% 6.8% 7.2% 7.8% 8.1% al 50.0% 6.6% 6.9% 7.2% 7.8% 8.1% t 55.0% 6.6% 6.9% 7.3% 7.8% 8.1% De b Tota 60.0% 6.6% 6.9% 7.3% 7.8% 8.1% 1. Source: Predicted raw betas from FactSet; Adjusted Equity Beta calculated as: (0.67) × Raw Beta + (0.33) × 1.0 2. Unlevered Beta calculated as: Adjusted Equity Beta × (E/(E + D ×(1-T)); Assumes corporate tax rate of 29.6% for MLPs, 21.0% forC-Corps 3.20-year Treasury as of December 16, 2019 4. Source: Duff & Phelps 5. Decile: Mid Cap (5) with equity value range of $2,996.0 million to $4,503.5 million 6. Equity Cost of Capital calculated as: Risk-free rate + (Levered Equity Beta × Market Risk Premium) + Small Company Risk Premium 7. Based onyield-to-worst of TGE notes due 2028 8. Assumes 23.8% effective tax rate 85
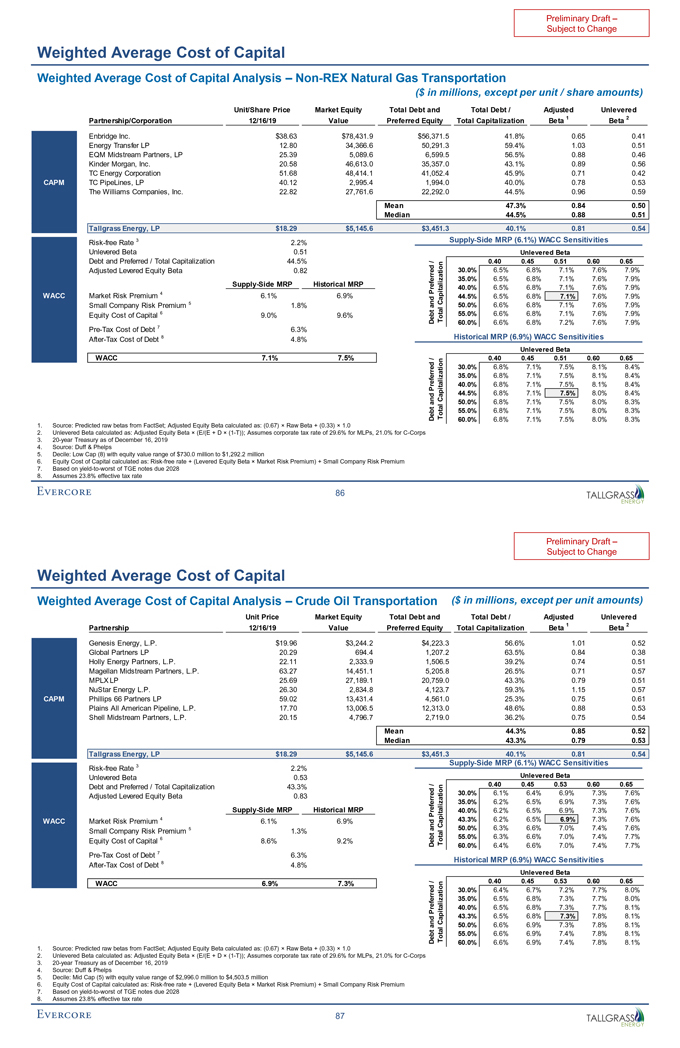
Preliminary Draft –Subject to Change Weighted Average Cost of Capital Weighted Average Cost of Capital Analysis –Non-REX Natural Gas Transportation ($ in millions, except per unit / share amounts) Unit/Share Price Market Equity Total Debt and Total Debt / Adjusted Unlevered 1 Beta 2 Partnership/Corporation 12/16/19 Value Preferred Equity Total Capitalization Beta Enbridge Inc. $38.63 $78,431.9 $56,371.5 41.8% 0.65 0.41 Energy Transfer LP 12.80 34,366.6 50,291.3 59.4% 1.03 0.51 EQM Midstream Partners, LP 25.39 5,089.6 6,599.5 56.5% 0.88 0.46 Kinder Morgan, Inc. 20.58 46,613.0 35,357.0 43.1% 0.89 0.56 TC Energy Corporation 51.68 48,414.1 41,052.4 45.9% 0.71 0.42 CAPM TC PipeLines, LP 40.12 2,995.4 1,994.0 40.0% 0.78 0.53 The Williams Companies, Inc. 22.82 27,761.6 22,292.0 44.5% 0.96 0.59 Mean 47.3% 0.84 0.50 Median 44.5% 0.88 0.51 Tallgrass Energy, LP $18.29 $5,145.6 $3,451.3 40.1% 0.81 0.54 Risk-free Rate 3 2.2% Supply-Side MRP (6.1%) WACC Sensitivities Unlevered Beta 0.51 Unlevered Beta Debt and Preferred / Total Capitalization 44.5%/ 0.40 0.45 0.51 0.60 0.65 Adjusted Levered Equity Beta 0.82 30.0% 6.5% 6.8% 7.1% 7.6% 7.9% erred 35.0% 6.5% 6.8% 7.1% 7.6% 7.9% Supply-Side MRP Historical MRP Pref 40.0% 6.5% 6.8% 7.1% 7.6% 7.9% 4 WACC Market Risk Premium 6.1% 6.9%nd 44.5% 6.5% 6.8% 7.1% 7.6% 7.9% 5Capitalization 50.0% 6.6% 6.8% 7.1% 7.6% 7.9% Small Company Risk Premium 1.8% a Equity Cost of Capital 6 9.0% 9.6% t Deb Total 55.0% 6.6% 6.8% 7.1% 7.6% 7.9% 7 60.0% 6.6% 6.8% 7.2% 7.6% 7.9%Pre-Tax Cost of Debt 6.3%After-Tax Cost of Debt 8 4.8% Historical MRP (6.9%) WACC Sensitivities Unlevered Beta WACC 7.1% 7.5% / 0.40 0.45 0.51 0.60 0.65 tion 30.0% 6.8% 7.1% 7.5% 8.1% 8.4% erred ef za 35.0% 6.8% 7.1% 7.5% 8.1% 8.4% r P itali 40.0% 6.8% 7.1% 7.5% 8.1% 8.4% nd p Ca 44.5% 6.8% 7.1% 7.5% 8.0% 8.4% al 50.0% 6.8% 7.1% 7.5% 8.0% 8.3% t 55.0% 6.8% 7.1% 7.5% 8.0% 8.3% De b Tota 60.0% 6.8% 7.1% 7.5% 8.0% 8.3% 1. Source: Predicted raw betas from FactSet; Adjusted Equity Beta calculated as: (0.67) × Raw Beta + (0.33) × 1.0 2. Unlevered Beta calculated as: Adjusted Equity Beta × (E/(E + D ×(1-T)); Assumes corporate tax rate of 29.6% for MLPs, 21.0% forC-Corps 3.20-year Treasury as of December 16, 2019 4. Source: Duff & Phelps 5. Decile: Low Cap (8) with equity value range of $730.0 million to $1,292.2 million 6. Equity Cost of Capital calculated as: Risk-free rate + (Levered Equity Beta × Market Risk Premium) + Small Company Risk Premium 7. Based onyield-to-worst of TGE notes due 2028 8. Assumes 23.8% effective tax rate 86
Preliminary Draft –Subject to Change Weighted Average Cost of Capital Weighted Average Cost of Capital Analysis – Crude Oil Transportation ($ in millions, except per unit amounts) Unit Price Market Equity Total Debt and Total Debt / Adjusted Unlevered 12/16/19 Value Preferred Total Capitalization Beta 1 2 Partnership Equity Beta Genesis Energy, L.P. $19.96 $3,244.2 $4,223.3 56.6% 1.01 0.52 Global Partners LP 20.29 694.4 1,207.2 63.5% 0.84 0.38 Holly Energy Partners, L.P. 22.11 2,333.9 1,506.5 39.2% 0.74 0.51 Magellan Midstream Partners, L.P. 63.27 14,451.1 5,205.8 26.5% 0.71 0.57 MPLX LP 25.69 27,189.1 20,759.0 43.3% 0.79 0.51 NuStar Energy L.P. 26.30 2,834.8 4,123.7 59.3% 1.15 0.57 CAPM Phillips 66 Partners LP 59.02 13,431.4 4,561.0 25.3% 0.75 0.61 Plains All American Pipeline, L.P. 17.70 13,006.5 12,313.0 48.6% 0.88 0.53 Shell Midstream Partners, L.P. 20.15 4,796.7 2,719.0 36.2% 0.75 0.54 Mean 44.3% 0.85 0.52 Median 43.3% 0.79 0.53 Tallgrass Energy, LP $18.29 $5,145.6 $3,451.3 40.1% 0.81 0.54 Supply-Side MRP (6.1%) WACC Sensitivities Risk-free Rate 3 2.2% Unlevered Beta 0.53 Unlevered Beta / 0.40 0.45 0.53 0.60 0.65 Debt and Preferred / Total Capitalization 43.3% 30.0% 6.1% 6.4% 6.9% 7.3% 7.6% Adjusted Levered Equity Beta 0.83 erred 35.0% 6.2% 6.5% 6.9% 7.3% 7.6% Supply-Side MRP Historical MRP Pref 40.0% 6.2% 6.5% 6.9% 7.3% 7.6% WACC Market Risk Premium 4 6.1% 6.9%nd Capitalization 43.3% 6.2% 6.5% 6.9% 7.3% 7.6% 5 a 50.0% 6.3% 6.6% 7.0% 7.4% 7.6% Small Company Risk Premium 1.3%t 55.0% 6.3% 6.6% 7.0% 7.4% 7.7% Equity Cost of Capital 6 8.6% 9.2% Deb Total 60.0% 6.4% 6.6% 7.0% 7.4% 7.7%Pre-Tax Cost of Debt 7 6.3% 8 Historical MRP (6.9%) WACC SensitivitiesAfter-Tax Cost of Debt 4.8% Unlevered Beta / 0.40 0.45 0.53 0.60 0.65 WACC 6.9% 7.3% tion 30.0% 6.4% 6.7% 7.2% 7.7% 8.0% erred ef za 35.0% 6.5% 6.8% 7.3% 7.7% 8.0% r P itali 40.0% 6.5% 6.8% 7.3% 7.7% 8.1% nd p Ca 43.3% 6.5% 6.8% 7.3% 7.8% 8.1% al 50.0% 6.6% 6.9% 7.3% 7.8% 8.1% t 55.0% 6.6% 6.9% 7.4% 7.8% 8.1% De b Tota 60.0% 6.6% 6.9% 7.4% 7.8% 8.1% 1. Source: Predicted raw betas from FactSet; Adjusted Equity Beta calculated as: (0.67) × Raw Beta + (0.33) × 1.0 2. Unlevered Beta calculated as: Adjusted Equity Beta × (E/(E + D ×(1-T)); Assumes corporate tax rate of 29.6% for MLPs, 21.0% forC-Corps 3.20-year Treasury as of December 16, 2019 4. Source: Duff & Phelps 5. Decile: Mid Cap (5) with equity value range of $2,996.0 million to $4,503.5 million 6. Equity Cost of Capital calculated as: Risk-free rate + (Levered Equity Beta × Market Risk Premium) + Small Company Risk Premium 7. Based onyield-to-worst of TGE notes due 2028 8. Assumes 23.8% effective tax rate 87
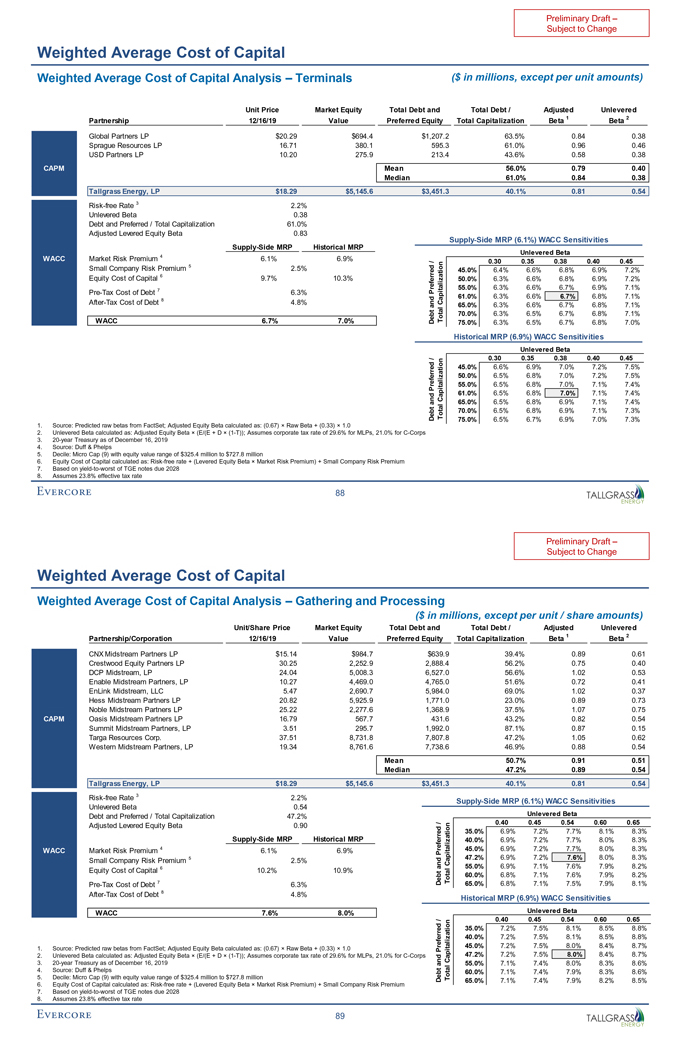
Preliminary Draft –Subject to Change Weighted Average Cost of Capital Weighted Average Cost of Capital Analysis – Terminals ($ in millions, except per unit amounts) Unit Price Market Equity Total Debt and Total Debt / Adjusted Unlevered Partnership 12/16/19 Value Preferred Equity Total Capitalization Beta 1 2 Beta Global Partners LP $20.29 $694.4 $1,207.2 63.5% 0.84 0.38 Sprague Resources LP 16.71 380.1 595.3 61.0% 0.96 0.46 USD Partners LP 10.20 275.9 213.4 43.6% 0.58 0.38 CAPM Mean 56.0% 0.79 0.40 Median 61.0% 0.84 0.38 Tallgrass Energy, LP $18.29 $5,145.6 $3,451.3 40.1% 0.81 0.54 Risk-free Rate 3 2.2% Unlevered Beta 0.38 Debt and Preferred / Total Capitalization 61.0% Adjusted Levered Equity Beta 0.83 Supply-Side MRP (6.1%) WACC Sensitivities Supply-Side MRP Historical MRP Unlevered Beta 4 WACC Market Risk Premium 6.1% 6.9%/ 0.30 0.35 0.38 0.40 0.45 Small Company Risk Premium 5 2.5% 45.0% 6.4% 6.6% 6.8% 6.9% 7.2% Equity Cost of Capital 6 9.7% 10.3% erred 50.0% 6.3% 6.6% 6.8% 6.9% 7.2% 7 Pref 55.0% 6.3% 6.6% 6.7% 6.9% 7.1%Pre-Tax Cost of Debt 6.3% 61.0% 6.3% 6.6% 6.7% 6.8% 7.1%After-Tax Cost of Debt 8 4.8% nd Capitalization a 65.0% 6.3% 6.6% 6.7% 6.8% 7.1% t Total 70.0% 6.3% 6.5% 6.7% 6.8% 7.1% WACC 6.7% 7.0% Deb 75.0% 6.3% 6.5% 6.7% 6.8% 7.0% Historical MRP (6.9%) WACC Sensitivities Unlevered Beta / 0.30 0.35 0.38 0.40 0.45 tion 45.0% 6.6% 6.9% 7.0% 7.2% 7.5% erred ef za 50.0% 6.5% 6.8% 7.0% 7.2% 7.5% r P itali 55.0% 6.5% 6.8% 7.0% 7.1% 7.4% nd p Ca 61.0% 6.5% 6.8% 7.0% 7.1% 7.4% al 65.0% 6.5% 6.8% 6.9% 7.1% 7.4% t 70.0% 6.5% 6.8% 6.9% 7.1% 7.3% De b Tota 75.0% 6.5% 6.7% 6.9% 7.0% 7.3% 1. Source: Predicted raw betas from FactSet; Adjusted Equity Beta calculated as: (0.67) × Raw Beta + (0.33) × 1.0 2. Unlevered Beta calculated as: Adjusted Equity Beta × (E/(E + D ×(1-T)); Assumes corporate tax rate of 29.6% for MLPs, 21.0% forC-Corps 3.20-year Treasury as of December 16, 2019 4. Source: Duff & Phelps 5. Decile: Micro Cap (9) with equity value range of $325.4 million to $727.8 million 6. Equity Cost of Capital calculated as: Risk-free rate + (Levered Equity Beta × Market Risk Premium) + Small Company Risk Premium 7. Based onyield-to-worst of TGE notes due 2028 8. Assumes 23.8% effective tax rate 88
Preliminary Draft –Subject to Change Weighted Average Cost of Capital Weighted Average Cost of Capital Analysis – Gathering and Processing ($ in millions, except per unit / share amounts) Unit/Share Price Market Equity Total Debt and Total Debt / Adjusted Unlevered 12/16/19 Value Preferred Capitalization Beta 1 2 Partnership/Corporation Equity Total Beta CNX Midstream Partners LP $15.14 $984.7 $639.9 39.4% 0.89 0.61 Crestwood Equity Partners LP 30.25 2,252.9 2,888.4 56.2% 0.75 0.40 DCP Midstream, LP 24.04 5,008.3 6,527.0 56.6% 1.02 0.53 Enable Midstream Partners, LP 10.27 4,469.0 4,765.0 51.6% 0.72 0.41 EnLink Midstream, LLC 5.47 2,690.7 5,984.0 69.0% 1.02 0.37 Hess Midstream Partners LP 20.82 5,925.9 1,771.0 23.0% 0.89 0.73 Noble Midstream Partners LP 25.22 2,277.6 1,368.9 37.5% 1.07 0.75 CAPM Oasis Midstream Partners LP 16.79 567.7 431.6 43.2% 0.82 0.54 Summit Midstream Partners, LP 3.51 295.7 1,992.0 87.1% 0.87 0.15 Targa Resources Corp. 37.51 8,731.8 7,807.8 47.2% 1.05 0.62 Western Midstream Partners, LP 19.34 8,761.6 7,738.6 46.9% 0.88 0.54 Mean 50.7% 0.91 0.51 Median 47.2% 0.89 0.54 Tallgrass Energy, LP $18.29 $5,145.6 $3,451.3 40.1% 0.81 0.54 Risk-free Rate 3 2.2% Supply-Side MRP (6.1%) WACC Sensitivities Unlevered Beta 0.54 Debt and Preferred / Total Capitalization 47.2% Unlevered Beta / 0.40 0.45 0.54 0.60 0.65 Adjusted Levered Equity Beta 0.90d on ti 35.0% 6.9% 7.2% 7.7% 8.1% 8.3% Supply-Side MRP Historical MRP 40.0% 6.9% 7.2% 7.7% 8.0% 8.3% WACC Market Risk Premium 4 6.1% 6.9% Preferre 45.0% 6.9% 7.2% 7.7% 8.0% 8.3% 5 47.2% 6.9% 7.2% 7.6% 8.0% 8.3% Small Company Risk Premium 2.5% Capitaliza 6 and 55.0% 6.9% 7.1% 7.6% 7.9% 8.2% Equity Cost of Capital 10.2% 10.9% 60.0% 6.8% 7.1% 7.6% 7.9% 8.2%Pre-Tax Cost of Debt 7 6.3% Debt Total 65.0% 6.8% 7.1% 7.5% 7.9% 8.1%After-Tax Cost of Debt 8 4.8% Historical MRP (6.9%) WACC Sensitivities WACC 7.6% 8.0% Unlevered Beta / 0.40 0.45 0.54 0.60 0.65 35.0% 7.2% 7.5% 8.1% 8.5% 8.8% 40.0% 7.2% 7.5% 8.1% 8.5% 8.8% 1. Source: Predicted raw betas from FactSet; Adjusted Equity Beta calculated as: (0.67) × Raw Beta + (0.33) × 1.0 Preferred 45.0% 7.2% 7.5% 8.0% 8.4% 8.7% 2. Unlevered Beta calculated as: Adjusted Equity Beta × (E/(E + D ×(1-T)); Assumes corporate tax rate of 29.6% for MLPs, 21.0% forC-Corps Capitalization 47.2% 7.2% 7.5% 8.0% 8.4% 8.7% 3.20-year Treasury as of December 16, 2019 and 55.0% 7.1% 7.4% 8.0% 8.3% 8.6% 4. Source: Duff & Phelps 60.0% 7.1% 7.4% 7.9% 8.3% 8.6% 5. Decile: Micro Cap (9) with equity value range of $325.4 million to $727.8 million Debt Total 65.0% 7.1% 7.4% 7.9% 8.2% 8.5% 6. Equity Cost of Capital calculated as: Risk-free rate + (Levered Equity Beta × Market Risk Premium) + Small Company Risk Premium 7. Based onyield-to-worst of TGE notes due 2028 8. Assumes 23.8% effective tax rate 89
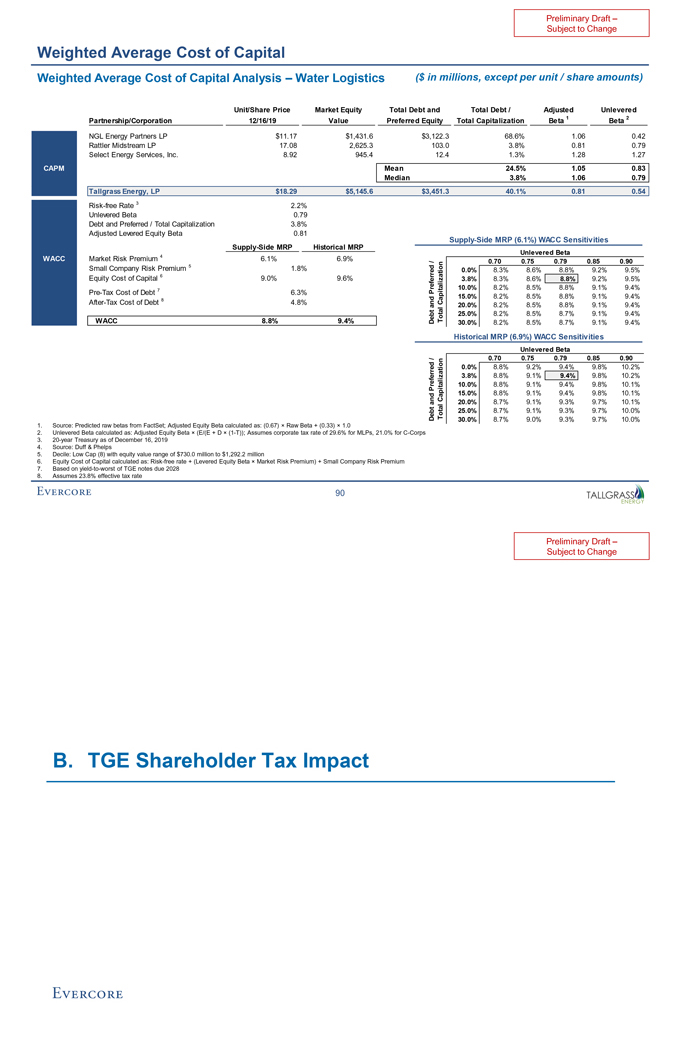
Preliminary Draft –Subject to Change Weighted Average Cost of Capital Weighted Average Cost of Capital Analysis – Water Logistics ($ in millions, except per unit / share amounts) Unit/Share Price Market Equity Total Debt and Total Debt / Adjusted Unlevered Partnership/Corporation 12/16/19 Value Preferred Equity Total Capitalization Beta 1 2 Beta NGL Energy Partners LP $11.17 $1,431.6 $3,122.3 68.6% 1.06 0.42 Rattler Midstream LP 17.08 2,625.3 103.0 3.8% 0.81 0.79 Select Energy Services, Inc. 8.92 945.4 12.4 1.3% 1.28 1.27 CAPM Mean 24.5% 1.05 0.83 Median 3.8% 1.06 0.79 Tallgrass Energy, LP $18.29 $5,145.6 $3,451.3 40.1% 0.81 0.54 Risk-free Rate 3 2.2% Unlevered Beta 0.79 Debt and Preferred / Total Capitalization 3.8% Adjusted Levered Equity Beta 0.81 Supply-Side MRP (6.1%) WACC Sensitivities Supply-Side MRP Historical MRP Unlevered Beta 4 WACC Market Risk Premium 6.1% 6.9%/ 0.70 0.75 0.79 0.85 0.90 Small Company Risk Premium 5 1.8% 0.0% 8.3% 8.6% 8.8% 9.2% 9.5% Equity Cost of Capital 6 9.0% 9.6% erred 3.8% 8.3% 8.6% 8.8% 9.2% 9.5% 7 Pref 10.0% 8.2% 8.5% 8.8% 9.1% 9.4%Pre-Tax Cost of Debt 6.3% 15.0% 8.2% 8.5% 8.8% 9.1% 9.4%After-Tax Cost of Debt 8 4.8% nd Capitalization a 20.0% 8.2% 8.5% 8.8% 9.1% 9.4% t Total 25.0% 8.2% 8.5% 8.7% 9.1% 9.4% WACC 8.8% 9.4% Deb 30.0% 8.2% 8.5% 8.7% 9.1% 9.4% Historical MRP (6.9%) WACC Sensitivities Unlevered Beta / 0.70 0.75 0.79 0.85 0.90 tion 0.0% 8.8% 9.2% 9.4% 9.8% 10.2% erred ef za 3.8% 8.8% 9.1% 9.4% 9.8% 10.2% r P itali 10.0% 8.8% 9.1% 9.4% 9.8% 10.1% nd p Ca 15.0% 8.8% 9.1% 9.4% 9.8% 10.1% al 20.0% 8.7% 9.1% 9.3% 9.7% 10.1% t 25.0% 8.7% 9.1% 9.3% 9.7% 10.0% De b Tota 30.0% 8.7% 9.0% 9.3% 9.7% 10.0% 1. Source: Predicted raw betas from FactSet; Adjusted Equity Beta calculated as: (0.67) × Raw Beta + (0.33) × 1.0 2. Unlevered Beta calculated as: Adjusted Equity Beta × (E/(E + D ×(1-T)); Assumes corporate tax rate of 29.6% for MLPs, 21.0% forC-Corps 3.20-year Treasury as of December 16, 2019 4. Source: Duff & Phelps 5. Decile: Low Cap (8) with equity value range of $730.0 million to $1,292.2 million 6. Equity Cost of Capital calculated as: Risk-free rate + (Levered Equity Beta × Market Risk Premium) + Small Company Risk Premium 7. Based onyield-to-worst of TGE notes due 2028 8. Assumes 23.8% effective tax rate 90
Preliminary Draft –Subject to Change B. TGE Shareholder Tax Impact
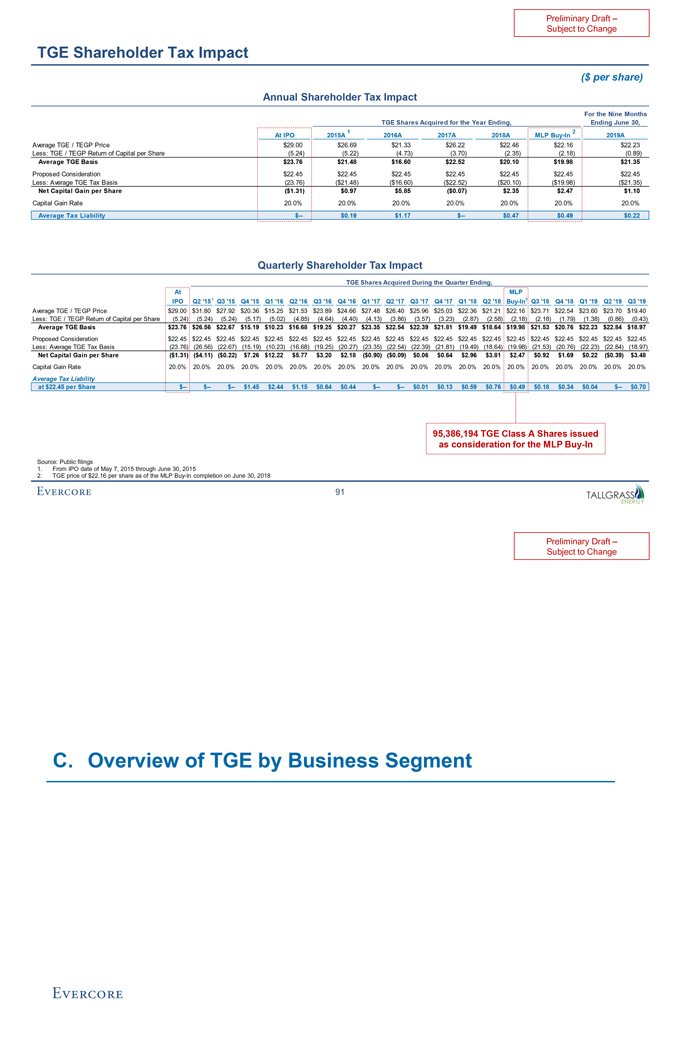
Preliminary Draft –Subject to Change TGE Shareholder Tax Impact ($ per share) Annual Shareholder Tax Impact For the Nine Months TGE Shares Acquired for the Year Ending, Ending June 30, 1 2 At IPO 2015A 2016A 2017A 2018A MLPBuy-In 2019A Average TGE / TEGP Price $29.00 $26.69 $21.33 $26.22 $22.46 $22.16 $22.23 Less: TGE / TEGP Return of Capital per Share (5.24) (5.22) (4.73) (3.70) (2.35) (2.18) (0.89) Average TGE Basis $23.76 $21.48 $16.60 $22.52 $20.10 $19.98 $21.35 Proposed Consideration $22.45 $22.45 $22.45 $22.45 $22.45 $22.45 $22.45 Less: Average TGE Tax Basis (23.76) ($21.48) ($16.60) ($22.52) ($20.10) ($19.98) ($21.35) Net Capital Gain per Share ($1.31) $0.97 $5.85 ($0.07) $2.35 $2.47 $1.10 Capital Gain Rate 20.0% 20.0% 20.0% 20.0% 20.0% 20.0% 20.0% Average Tax Liability $— $0.19 $1.17 $— $0.47 $0.49 $0.22 Quarterly Shareholder Tax Impact TGE Shares Acquired During the Quarter Ending, At MLP IPO Q2 ‘15 1 Q3 ‘15 Q4 ‘15 Q1 ‘16 Q2 ‘16 Q3 ‘16 Q4 ‘16 Q1 ‘17 Q2 ‘17 Q3 ‘17 Q4 ‘17 Q1 ‘18 Q2 ‘18Buy-In2 Q3 ‘18 Q4 ‘18 Q1 ‘19 Q2 ‘19 Q3 ‘19 Average TGE / TEGP Price $29.00 $31.80 $27.92 $20.36 $15.25 $21.53 $23.89 $24.66 $27.48 $26.40 $25.96 $25.03 $22.36 $21.21 $22.16 $23.71 $22.54 $23.60 $23.70 $19.40 Less: TGE / TEGP Return of Capital per Share (5.24) (5.24) (5.24) (5.17) (5.02) (4.85) (4.64) (4.40) (4.13) (3.86) (3.57) (3.23) (2.87) (2.58) (2.18) (2.18) (1.79) (1.38) (0.86) (0.43) Average TGE Basis $23.76 $26.56 $22.67 $15.19 $10.23 $16.68 $19.25 $20.27 $23.35 $22.54 $22.39 $21.81 $19.49 $18.64 $19.98 $21.53 $20.76 $22.23 $22.84 $18.97 Proposed Consideration $22.45 $22.45 $22.45 $22.45 $22.45 $22.45 $22.45 $22.45 $22.45 $22.45 $22.45 $22.45 $22.45 $22.45 $22.45 $22.45 $22.45 $22.45 $22.45 $22.45 Less: Average TGE Tax Basis (23.76) (26.56) (22.67) (15.19) (10.23) (16.68) (19.25) (20.27) (23.35) (22.54) (22.39) (21.81) (19.49) (18.64) (19.98) (21.53) (20.76) (22.23) (22.84) (18.97) Net Capital Gain per Share ($1.31) ($4.11) ($0.22) $7.26 $12.22 $5.77 $3.20 $2.18 ($0.90) ($0.09) $0.06 $0.64 $2.96 $3.81 $2.47 $0.92 $1.69 $0.22 ($0.39) $3.48 Capital Gain Rate 20.0% 20.0% 20.0% 20.0% 20.0% 20.0% 20.0% 20.0% 20.0% 20.0% 20.0% 20.0% 20.0% 20.0% 20.0% 20.0% 20.0% 20.0% 20.0% 20.0% Average Tax Liability at $22.45 per Share $— $— $— $1.45 $2.44 $1.15 $0.64 $0.44 $— $— $0.01 $0.13 $0.59 $0.76 $0.49 $0.18 $0.34 $0.04 $— $0.70 95,386,194 TGE Class A Shares issued as consideration for the MLPBuy-In Source: Public filings 1. From IPO date of May 7, 2015 through June 30, 2015 2. TGE price of $22.16 per share as of the MLPBuy-In completion on June 30, 2018 91
Preliminary Draft –Subject to Change C. Overview of TGE by Business Segment
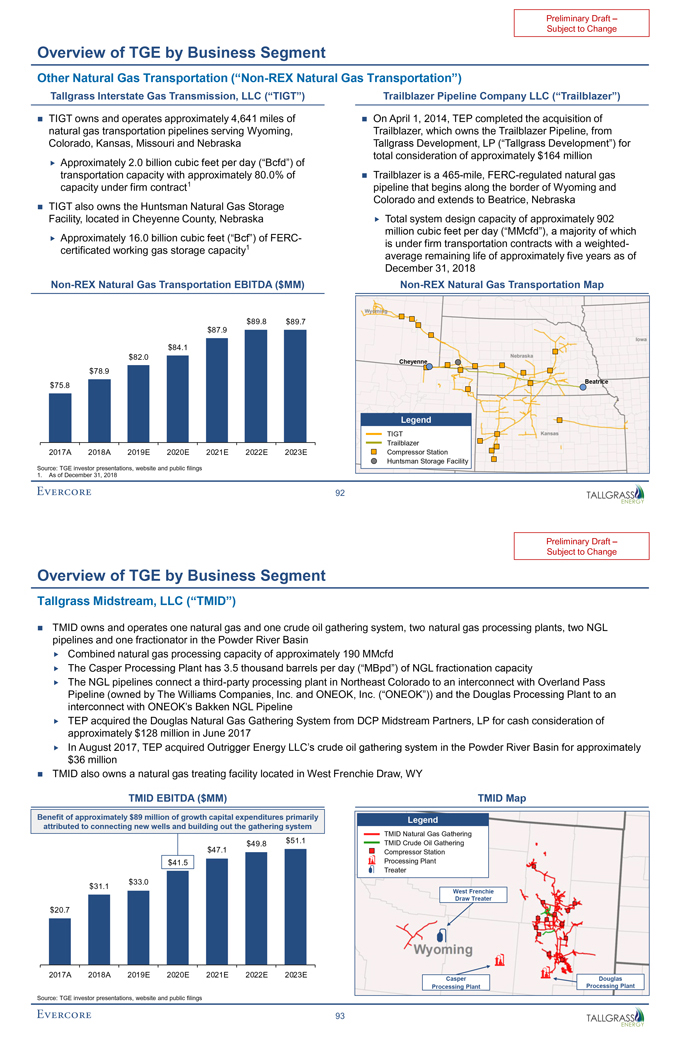
Preliminary Draft –Subject to Change Overview of TGE by Business Segment Other Natural Gas Transportation(“Non-REX Natural Gas Transportation”) Tallgrass Interstate Gas Transmission, LLC (“TIGT”) Trailblazer Pipeline Company LLC (“Trailblazer”) ï® TIGT owns and operates approximately 4,641 miles of ï® On April 1, 2014, TEP completed the acquisition of natural gas transportation pipelines serving Wyoming, Trailblazer, which owns the Trailblazer Pipeline, from Colorado, Kansas, Missouri and Nebraska Tallgrass Development, LP (“Tallgrass Development”) for total consideration of approximately $164 million ï,„ Approximately 2.0 billion cubic feet per day (“Bcfd”) of transportation capacity with approximately 80.0% of ï® Trailblazer is a465-mile, FERC-regulated natural gas capacity under firm contract1 pipeline that begins along the border of Wyoming and Colorado and extends to Beatrice, Nebraska ï® TIGT also owns the Huntsman Natural Gas Storage Facility, located in Cheyenne County, Nebraskaï,„ Total system design capacity of approximately 902 million cubic feet per day (“MMcfd”), a majority of whichï,„ Approximately 16.0 billion cubic feet (“Bcf”) of FERC- 1 is under firm transportation contracts with a weighted-certificated working gas storage capacity average remaining life of approximately five years as of December 31, 2018Non-REX Natural Gas Transportation EBITDA ($MM)Non-REX Natural Gas Transportation Map $89.8 $89.7 $87.9 $84.1 $82.0 Cheyenne $78.9 Beatrice $75.8 Legend TIGT Trailblazer 2017A 2018A 2019E 2020E 2021E 2022E 2023E Compressor Station Huntsman Storage Facility Source: TGE investor presentations, website and public filings 1. As of December 31, 2018 92
Preliminary Draft –Subject to Change Overview of TGE by Business Segment Tallgrass Midstream, LLC (“TMID”) ï® TMID owns and operates one natural gas and one crude oil gathering system, two natural gas processing plants, two NGL pipelines and one fractionator in the Powder River Basinï,„ Combined natural gas processing capacity of approximately 190 MMcfd ï,„ The Casper Processing Plant has 3.5 thousand barrels per day (“MBpd”) of NGL fractionation capacity ï,„ The NGL pipelines connect a third-party processing plant in Northeast Colorado to an interconnect with Overland Pass Pipeline (owned by The Williams Companies, Inc. and ONEOK, Inc. (“ONEOK”)) and the Douglas Processing Plant to an interconnect with ONEOK’s Bakken NGL Pipeline ï,„ TEP acquired the Douglas Natural Gas Gathering System from DCP Midstream Partners, LP for cash consideration of approximately $128 million in June 2017 ï,„ In August 2017, TEP acquired Outrigger Energy LLC’s crude oil gathering system in the Powder River Basin for approximately $36 millionï® TMID also owns a natural gas treating facility located in West Frenchie Draw, WY TMID EBITDA ($MM) TMID Map Benefit of approximately $89 million of growth capital expenditures primarily Legend attributed to connecting new wells and building out the gathering system $51.1 TMID Natural Gas Gathering $49.8 TMID Crude Oil Gathering $47.1 Compressor Station $41.5 Processing Plant Treater $33.0 $31.1 West Frenchie Draw Treater $20.7 2017A 2018A 2019E 2020E 2021E 2022E 2023E Casper Douglas Processing Plant Processing Plant Source: TGE investor presentations, website and public filings 93
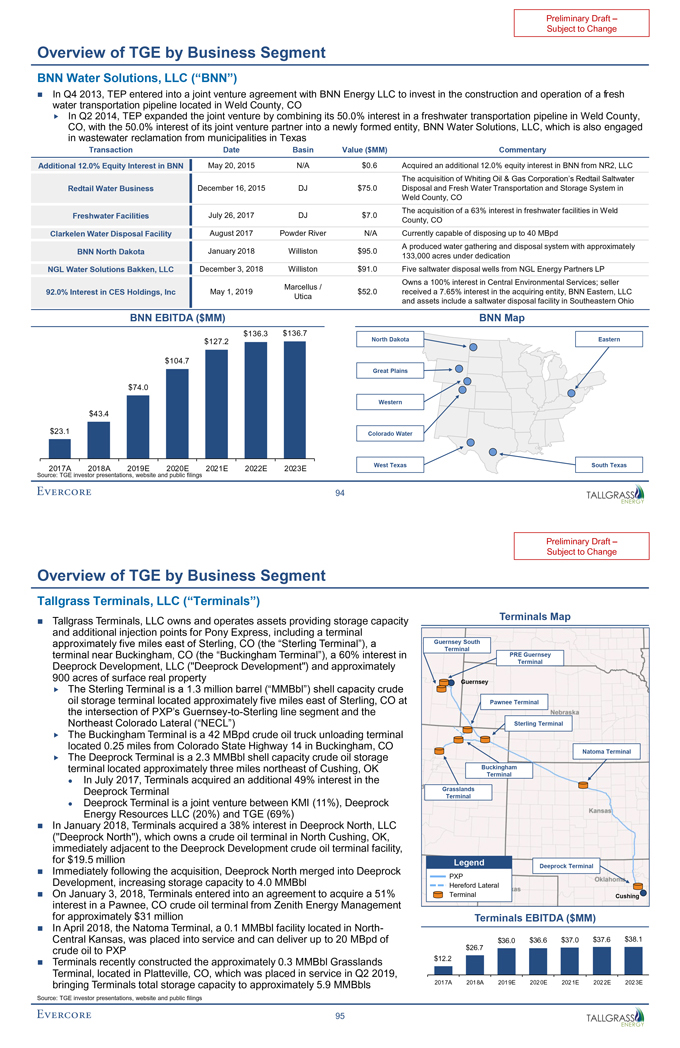
Preliminary Draft –Subject to Change Overview of TGE by Business Segment BNN Water Solutions, LLC (“BNN”) ï® In Q4 2013, TEP entered into a joint venture agreement with BNN Energy LLC to invest in the construction and operation of a fresh water transportation pipeline located in Weld County, CO ï,„ In Q2 2014, TEP expanded the joint venture by combining its 50.0% interest in a freshwater transportation pipeline in Weld County, CO, with the 50.0% interest of its joint venture partner into a newly formed entity, BNN Water Solutions, LLC, which is also engaged in wastewater reclamation from municipalities in Texas Transaction Date Basin Value ($MM) Commentary Additional 12.0% Equity Interest in BNN May 20, 2015 N/A $0.6 Acquired an additional 12.0% equity interest in BNN from NR2, LLC The acquisition of Whiting Oil & Gas Corporation’s Redtail Saltwater Redtail Water Business December 16, 2015 DJ $75.0 Disposal and Fresh Water Transportation and Storage System in Weld County, CO The acquisition of a 63% interest in freshwater facilities in Weld Freshwater Facilities July 26, 2017 DJ $7.0 County, CO Clarkelen Water Disposal Facility August 2017 Powder River N/A Currently capable of disposing up to 40 MBpd A produced water gathering and disposal system with approximately BNN North Dakota January 2018 Williston $95.0 133,000 acres under dedication NGL Water Solutions Bakken, LLC December 3, 2018 Williston $91.0 Five saltwater disposal wells from NGL Energy Partners LP Owns a 100% interest in Central Environmental Services; seller Marcellus / 92.0% Interest in CES Holdings, Inc May 1, 2019 $52.0 received a 7.65% interest in the acquiring entity, BNN Eastern, LLC Utica and assets include a saltwater disposal facility in Southeastern Ohio BNN EBITDA ($MM) BNN Map $136.3 $136.7 North Dakota Eastern $127.2 $104.7 Great Plains $74.0 Western $43.4 $23.1 Colorado Water 2017A 2018A 2019E 2020E 2021E 2022E 2023E West Texas South Texas Source: TGE investor presentations, website and public filings 94
Preliminary Draft –Subject to Change Overview of TGE by Business Segment Tallgrass Terminals, LLC (“Terminals”) Tallgrass Terminals, LLC and operates assets capacity Terminals Mapï® owns providing storage and additional injection points for Pony Express, including a terminal approximately five miles east of Sterling, CO (the “Sterling Terminal”), a Guernsey South Terminal PRE Guernsey terminal near Buckingham, CO (the “Buckingham Terminal”), a 60% interest in Terminal Deeprock Development, LLC (“Deeprock Development”) and approximately 900 acres of surface real property Guernsey ï,„ The Sterling Terminal is a 1.3 million barrel (“MMBbl”) shell capacity crude oil storage terminal located approximately five miles east of Sterling, CO at Pawnee Terminal the intersection of PXP’sGuernsey-to-Sterling line segment and the Northeast Colorado Lateral (“NECL”) Sterling Terminal ï,„ The Buckingham Terminal is a 42 MBpd crude oil truck unloading terminal located 0.25 miles from Colorado State Highway 14 in Buckingham, CO Natoma Terminal ï,„ The Deeprock Terminal is a 2.3 MMBbl shell capacity crude oil storage terminal located approximately three miles northeast of Cushing, OK Buckingham Terminal • In July 2017, Terminals acquired an additional 49% interest in the Deeprock Terminal Grasslands Terminal • Deeprock Terminal is a joint venture between KMI (11%), Deeprock Energy Resources LLC (20%) and TGE (69%)ï® In January 2018, Terminals acquired a 38% interest in Deeprock North, LLC (“Deeprock North”), which owns a crude oil terminal in North Cushing, OK, immediately adjacent to the Deeprock Development crude oil terminal facility, for $19.5 million Legend Deeprock Terminalï® Immediately following the acquisition, Deeprock North merged into Deeprock PXP Development, increasing storage capacity to 4.0 MMBbl Hereford Lateral ï® On January 3, 2018, Terminals entered into an agreement to acquire a 51% Terminal Cushing interest in a Pawnee, CO crude oil terminal from Zenith Energy Management for approximately $31 million Terminals EBITDA ($MM)ï® In April 2018, the Natoma Terminal, a 0.1 MMBbl facility located in North-Central Kansas, was placed into service and can deliver up to 20 MBpd of $36.0 $36.6 $37.0 $37.6 $38.1 crude oil to PXP $26.7 Terminals recently constructed the approximately MMBbl Grasslands $12.2 ï® 0.3 Terminal, located in Platteville, CO, which was placed in service in Q2 2019, bringing Terminals total storage capacity to approximately 5.9 MMBbls 2017A 2018A 2019E 2020E 2021E 2022E 2023E Source: TGE investor presentations, website and public filings 95
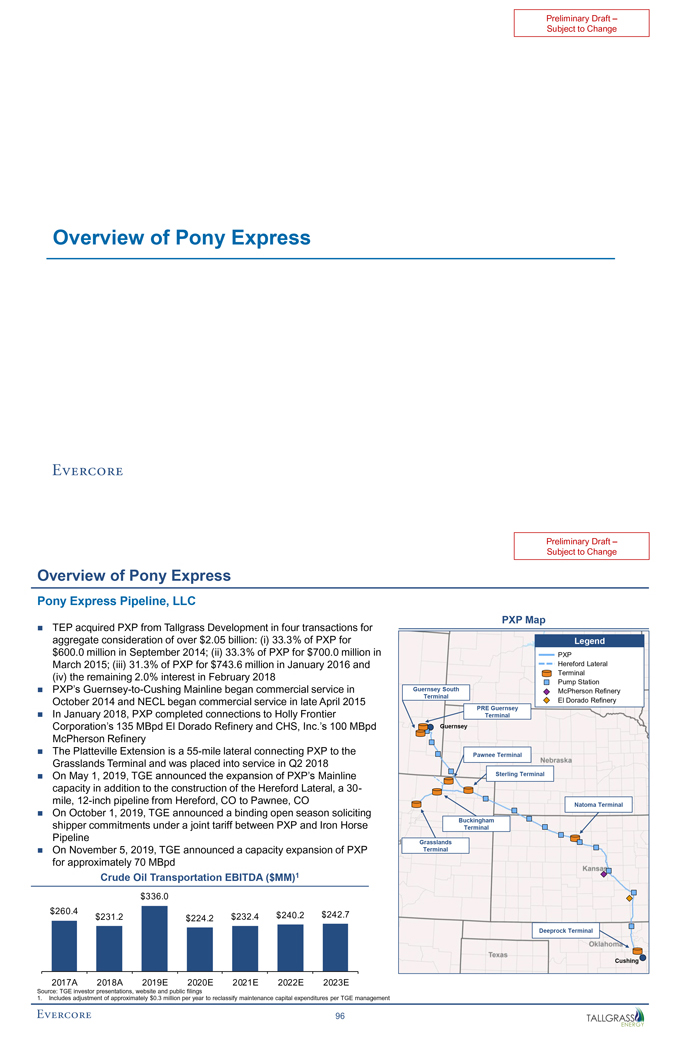
Preliminary Draft –Subject to Change Overview of Pony Express
Preliminary Draft –Subject to Change Overview of Pony Express Pony Express Pipeline, LLC PXP Map ï® TEP acquired PXP from Tallgrass Development in four transactions for aggregate consideration of over $2.05 billion: (i) 33.3% of PXP for Legend $600.0 million in September 2014; (ii) 33.3% of PXP for $700.0 million in PXP March 2015; (iii) 31.3% of PXP for $743.6 million in January 2016 and Hereford Lateral (iv) the remaining 2.0% interest in February 2018 Terminal Pump Station ï® PXP’sGuernsey-to-Cushing Mainline began commercial service in Guernsey South McPherson Refinery Terminal October 2014 and NECL began commercial service in late April 2015 El Dorado Refinery PRE Guernsey ï® In January 2018, PXP completed connections to Holly Frontier Terminal Corporation’s 135 MBpd El Dorado Refinery and CHS, Inc.’s 100 MBpd Guernsey McPherson Refinery ï® The Platteville Extension is a55-mile lateral connecting PXP to the Pawnee Terminal Grasslands Terminal and was placed into service in Q2 2018 ï® On May 1, 2019, TGE announced the expansion of PXP’s Mainline Sterling Terminal capacity in addition to the construction of the Hereford Lateral, a30-mile,12-inch pipeline from Hereford, CO to Pawnee, CO October 1, TGE announced a binding open season soliciting Natoma Terminalï® On 2019, shipper commitments under a joint tariff between PXP and Iron Horse Buckingham Terminal Pipeline Grasslands ï® On November 5, 2019, TGE announced a capacity expansion of PXP Terminal for approximately 70 MBpd Crude Oil Transportation EBITDA ($MM)1 $336.0 $260.4 $242.7 $231.2 $224.2 $232.4 $240.2 Deeprock Terminal Cushing 2017A 2018A 2019E 2020E 2021E 2022E 2023E Source: TGE investor presentations, website and public filings 1. Includes adjustment of approximately $0.3 million per year to reclassify maintenance capital expenditures per TGE management 96
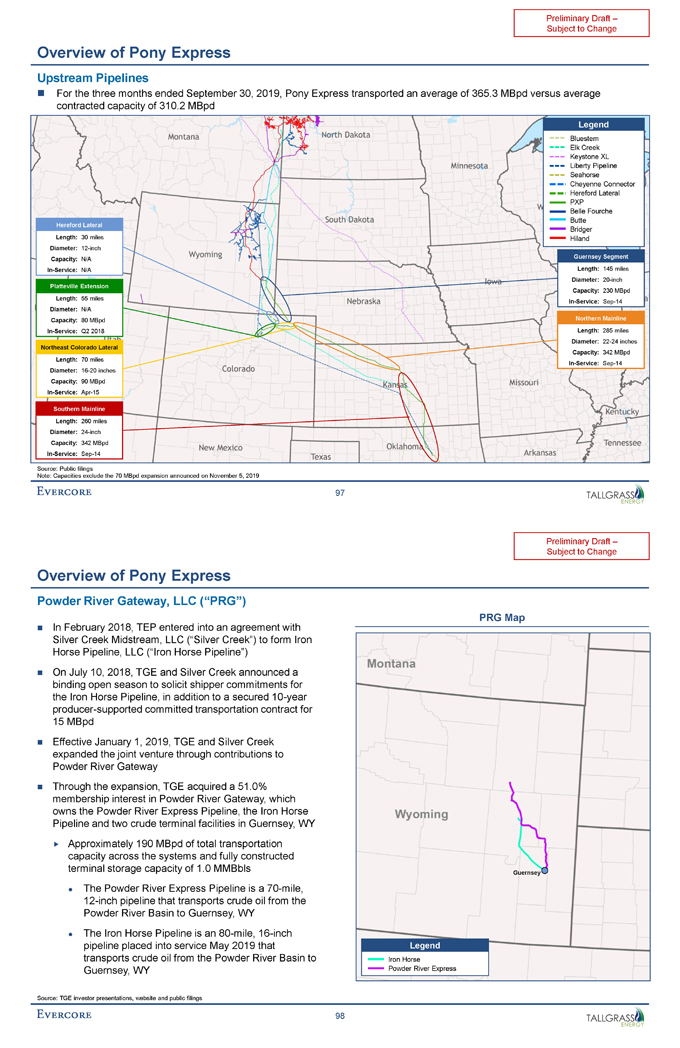
Preliminary Draft –Subject to Change Overview of Pony Express Upstream Pipelines ï® For the three months ended September 30, 2019, Pony Express transported an average of 365.3 MBpd versus average contracted capacity of 310.2 MBpd Legend Bluestem Elk Creek Keystone XL Liberty Pipeline Seahorse Cheyenne Connector Hereford Lateral PXP Belle Fourche Butte Hereford Lateral Bridger Length: 30 miles Hiland Diameter:12-inch Capacity: N/A Guernsey SegmentIn-Service: N/A Length: 145 miles Diameter:20-inch Platteville Extension Capacity: 230 MBpd Length: 55 milesIn-Service:Sep-14 Diameter: N/A Capacity: 80 MBpd Northern MainlineIn-Service: Q2 2018 Length: 285 miles Diameter:22-24 inches Northeast Colorado Lateral Capacity: 342 MBpd Length: 70 milesIn-Service:Sep-14 Diameter:16-20 inches Capacity: 90 MBpdIn-Service:Apr-15 Southern Mainline Length: 260 miles Diameter:24-inch Capacity: 342 MBpdIn-Service:Sep-14 Source: Public filings Note: Capacities exclude the 70 MBpd expansion announced on November 5, 2019 97
Preliminary Draft –Subject to Change Overview of Pony Express Powder River Gateway, LLC (“PRG”) PRG Map ï® In February 2018, TEP entered into an agreement with Silver Creek Midstream, LLC (“Silver Creek”) to form Iron Horse Pipeline, LLC (“Iron Horse Pipeline”) ï® On July 10, 2018, TGE and Silver Creek announced a binding open season to solicit shipper commitments for the Iron Horse Pipeline, in addition to a secured10-year producer-supported committed transportation contract for 15 MBpd ï® Effective January 1, 2019, TGE and Silver Creek expanded the joint venture through contributions to Powder River Gatewayï® Through the expansion, TGE acquired a 51.0% membership interest in Powder River Gateway, which owns the Powder River Express Pipeline, the Iron Horse Pipeline and two crude terminal facilities in Guernsey, WY ï,„ Approximately 190 MBpd of total transportation capacity across the systems and fully constructed terminal storage capacity of 1.0 MMBbls Guernsey • The Powder River Express Pipeline is a70-mile,12-inch pipeline that transports crude oil from the Powder River Basin to Guernsey, WY • The Iron Horse Pipeline is an80-mile,16-inch pipeline placed into service May 2019 that Legend transports crude oil from the Powder River Basin to Iron Horse Guernsey, WY Powder River Express Source: TGE investor presentations, website and public filings 98
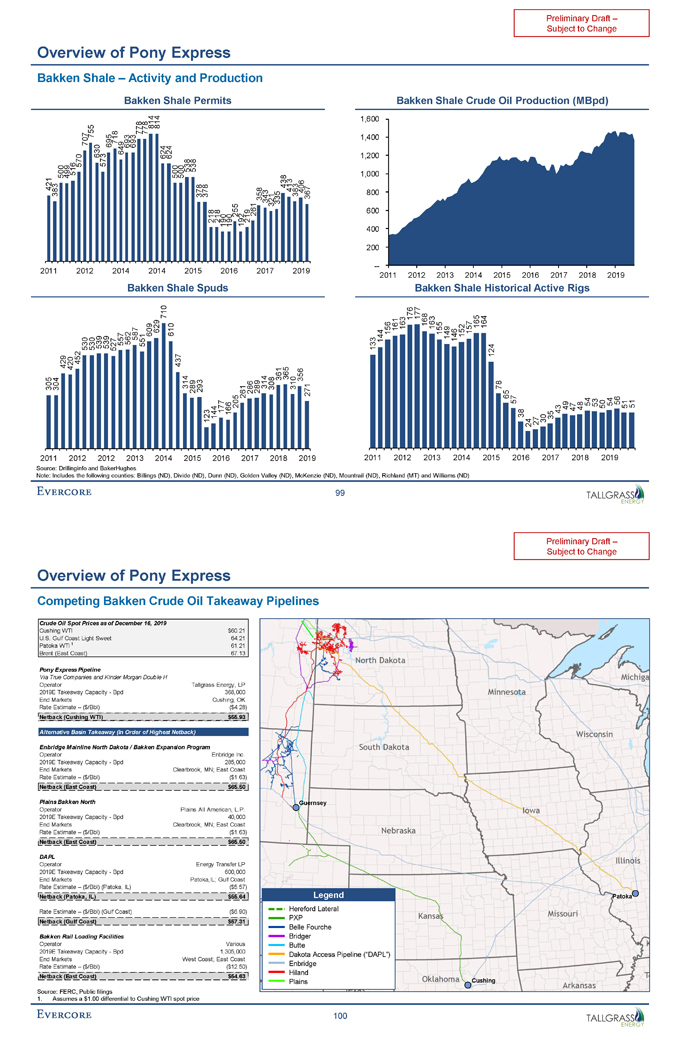
Note: Source: 2011 305 2011 383 421 304 500 429 499 Includes 420 516 452 570 Bakken the 2012 Drillinginfo 530 2012 707 and 530 755 539 630 Overview following 539 573 2012 527 695 718 Shale 557 649 – of counties: BakerHughes 562 2014 693 693 2013 587 778 551 609 778 Billings 814 629 814 Bakken 710 Bakken 2014 624 Pony (ND), 2014 624 Activity 610 500 437 500 Divide 314 538 Shale 289 Shale 538 and (ND), 2015 293 2015 378 123 378 144 218 Dunn 218 2016 177 Spuds 190 (ND), 166 205 2016 190 255 Permits Express 261 192 286 219 Golden 2017 261 289 358 Production 314 2017 321 343 Valley 308 2018 361 335 438 365 (ND), 413 310 383 356 2019 367 406 McKenzie 2019 271 (ND), 99 Mountrail 133 200 400 600 800 1,000 1,200 1,400 1,600 (ND), 2011 144 — 156 2011 Richland 161 2012 163 (MT) 176 177 and 168 2012 2013 163 Bakken 155 149 Bakken 2013 Williams 146 Shale 152 (ND) 2014 157 165 Shale 2014 164 124 Crude 2015 78 65 2015 Oil 57 2016 38 24 Historical 27 2016 30 2017 35 43 Active 49 2017 Production 47 Subject 48 to 2018 54 Rigs Preliminary 53 2018 50 (MBpd) Draft 2019 54 Change – 56 2019 51 51
Preliminary Draft – Subject to Change Crude Oil Spot Prices as of December 16, 2019 Cushing WTI $60.21 U.S. Gulf Coast Light Sweet 64.21 Patoka WTI 1 61.21 Brent (East Coast) 67.13 Pony Express Pipeline Via True Companies and Kinder Morgan Double H Operator Tallgrass Energy, LP 2019E Takeaway Capacity—Bpd 368,000 End Markets Cushing, OK Rate Estimate – ($/Bbl) ($4.28) Netback (Cushing WTI) $55.93 Alternative Basin Takeaway (In Order of Highest Netback) Enbridge Mainline North Dakota / Bakken Expansion Program Operator Enbridge Inc. 2019E Takeaway Capacity—Bpd 285,000 End Markets Clearbrook, MN; East Coast Rate Estimate – ($/Bbl) ($1.63) Netback (East Coast) $65.50 Plains Bakken North Operator Plains All American, L.P. 2019E Takeaway Capacity—Bpd 40,000 End Markets Clearbrook, MN; East Coast Rate Estimate – ($/Bbl) ($1.63) Netback (East Coast) $65.50 DAPL Operator Energy Transfer LP 2019E Takeaway Capacity—Bpd 600,000 End Markets Patoka,IL; Gulf Coast Rate Estimate – ($/Bbl) (Patoka, IL) ($5.57) Netback (Patoka, IL) $55.64 Rate Estimate – ($/Bbl) (Gulf Coast) ($6.90) Netback (Gulf Coast) $57.31 Bakken Rail Loading Facilities Operator Various 2019E Takeaway Capacity—Bpd 1,305,000 End Markets West Coast; East Coast Rate Estimate – ($/Bbl) ($12.50) Netback (East Coast) $54.63 Competing Bakken Crude Oil Takeaway Pipelines Source: FERC, Public filings 1. Assumes a $1.00 differential to Cushing WTI spot price Overview of Pony Express 100 Guernsey Patoka Cushing Legend Hereford Lateral PXP Belle Fourche Bridger Butte Dakota Access Pipeline (“DAPL”) Enbridge Hiland Plains
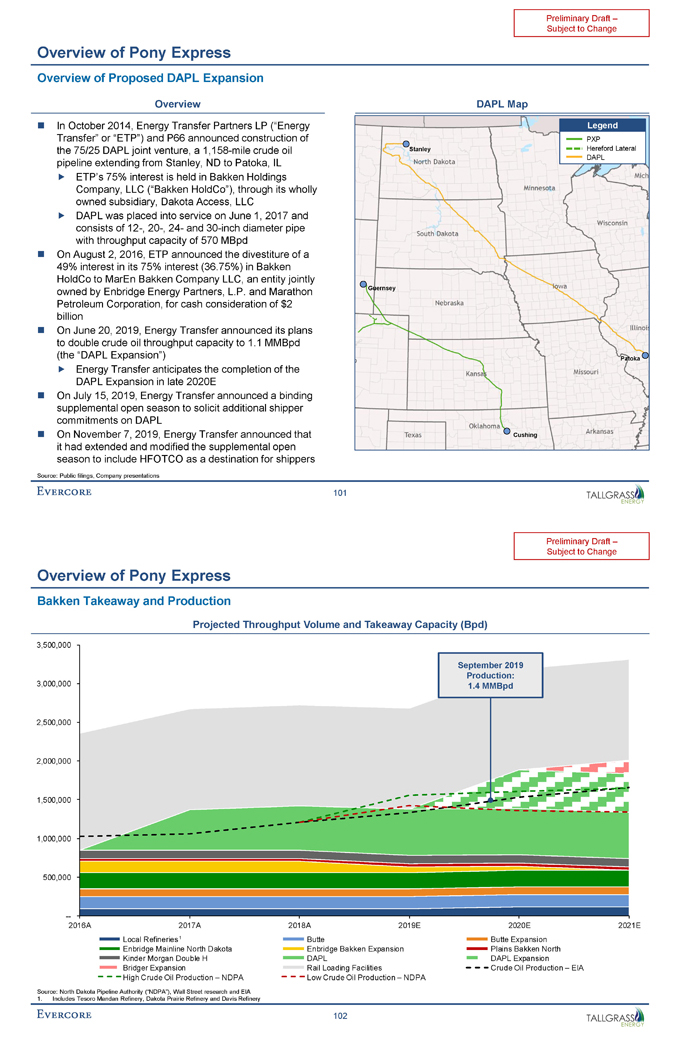
Preliminary Draft – Subject to Change Overview of Pony Express Overview of Proposed DAPL Expansion Overview DAPL Map ï® In October 2014, Energy Transfer Partners LP (“Energy Transfer” or “ETP”) and P66 announced construction of the 75/25 DAPL joint venture, a1,158-mile crude oil pipeline extending from Stanley, ND to Patoka, IL ï,„ ETP’s 75% interest is held in Bakken Holdings Company, LLC (“Bakken HoldCo”), through its wholly owned subsidiary, Dakota Access, LLC ï,„ DAPL was placed into service on June 1, 2017 and consists of12-,20-,24- and30-inch diameter pipe with throughput capacity of 570 MBpd ï® On August 2, 2016, ETP announced the divestiture of a 49% interest in its 75% interest (36.75%) in Bakken HoldCo to MarEn Bakken Company LLC, an entity jointly owned by Enbridge Energy Partners, L.P. and Marathon Petroleum Corporation, for cash consideration of $2 billion ï® On June 20, 2019, Energy Transfer announced its plans to double crude oil throughput capacity to 1.1 MMBpd (the “DAPL Expansion”) ï,„ Energy Transfer anticipates the completion of the DAPL Expansion in late 2020E ï® On July 15, 2019, Energy Transfer announced a binding supplemental open season to solicit additional shipper commitments on DAPL ï® On November 7, 2019, Energy Transfer announced that it had extended and modified the supplemental open season to include HFOTCO as a destination for shippers 101 Patoka Stanley Guernsey Cushing Legend PXP Hereford Lateral DAPL Source: Public filings, Company presentations
Preliminary Draft –Subject to Change Overview of Pony Express Bakken Takeaway and Production Projected Throughput Volume and Takeaway Capacity (Bpd) 3,500,000 September 2019 Production: 3,000,000 1.4 MMBpd 2,500,000 2,000,000 1,500,000 1,000,000 500,000 — 2016A 2017A 2018A 2019E 2020E 2021E Local Refineries1 Butte Butte Expansion Enbridge Mainline North Dakota Enbridge Bakken Expansion Plains Bakken North Kinder Morgan Double H DAPL DAPL Expansion Bridger Expansion Rail Loading Facilities Crude Oil Production – EIA High Crude Oil Production – NDPA Low Crude Oil Production – NDPA Source: North Dakota Pipeline Authority (“NDPA”), Wall Street research and EIA 1. Includes Tesoro Mandan Refinery, Dakota Prairie Refinery and Davis Refinery 102
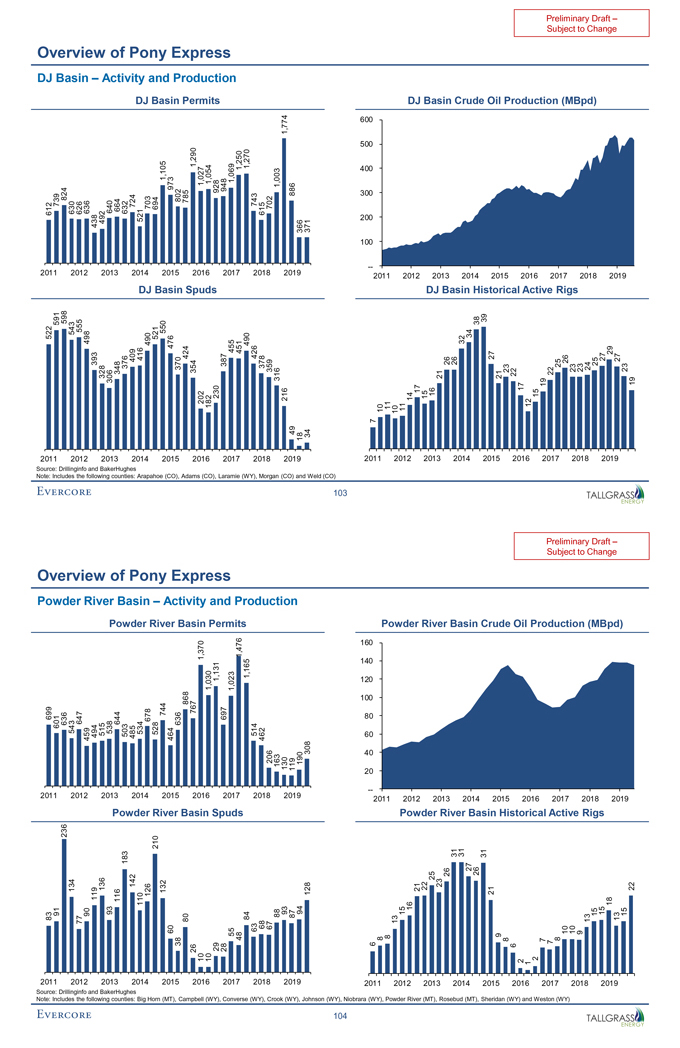
Note: 522 612 DJ Source: 2011 2011 591 739 598 824 Includes 543 630 the 555 626 Drillinginfo 2012 498 2012 636 Basin and 393 438 – following 328 492 Overview 2013 306 2013 640 348 664 of 376 632 counties: BakerHughes 409 724 416 521 Activity 2014 490 2014 703 DJ Arapahoe 521 DJ 694 550 1,105 and Pony (CO), 2015 476 2015 973 Basin 370 Basin 802 424 785 Adams 354 1,290 2016 202 2016 1,027 (CO), 182 Spuds 1,054 230 928 Permits 387 948 Express Laramie 2017 455 2017 1,069 Production 451 1,250 490 1,270 (WY), 426 743 2018 378 2018 615 Morgan 359 702 316 1,003 (CO) 216 1,774 2019 49 2019 886 and 18 366 Weld 34 371 (CO) 103 2011 7 — 100 200 300 400 500 600 10 11 2011 10 2012 11 14 2012 17 DJ 15 2013 16 DJ 21 2013 26 Basin 26 2014 32 Basin 34 2014 38 Crude 39 2015 27 Oil 21 2015 23 22 Historical 2016 17 12 2016 15 19 Active 22 2017 25 Production 26 2017 Subject 23 Rigs 23 to 2018 24 Preliminary 25 2018 (MBpd) 27 Draft 2019 29 Change – 27 2019 23 19
Note: Source: 2011 83 2011 699 91 601 236 636 Includes 134 543 Powder 77 647 the Drillinginfo 2012 90 2012 459 and 119 494 following 136 515 Overview 93 538 River 2013 116 2013 644 of 183 503 counties: BakerHughes 142 485 Big 110 534 Powder 2014 126 Powder 2014 678 Basin Horn 210 528 – 132 744 Pony (MT), 60 464 River 2015 38 River 2015 636 80 868 26 767 Campbell 10 Basin 1,370 Basin Activity 2016 10 2016 1,030 (WY), 29 1,131 28 697 and Express 2017 55 2017 1,023 Converse 48 Spuds 1,476 Permits 84 1,165 63 514 (WY), 68 462 2018 67 2018 206 Crook 88 163 93 130 (WY), 2019 87 2019 119 Production 94 190 Johnson 128 308 (WY), 104 Niobrara — 20 40 60 80 100 120 140 160 2011 6 (WY), 8 8 2011 13 Powder 15 2012 16 Powder River 21 2012 22 (MT), 25 Powder 2013 23 River 26 2013 Rosebud 31 31 River 2014 27 Basin (MT), 26 2014 31 21 Basin Sheridan 2015 9 8 2015 Crude (WY) 6 2016 2 Oil and 1 2 2016 7 Historical Weston 2017 7 8 (WY) 10 2017 10 ActiveSubject 9 Production to 2018 13 Preliminary 15 Rigs 2018 15 Draft 18 Change 2019 13 (MBpd) – 15 2019 22
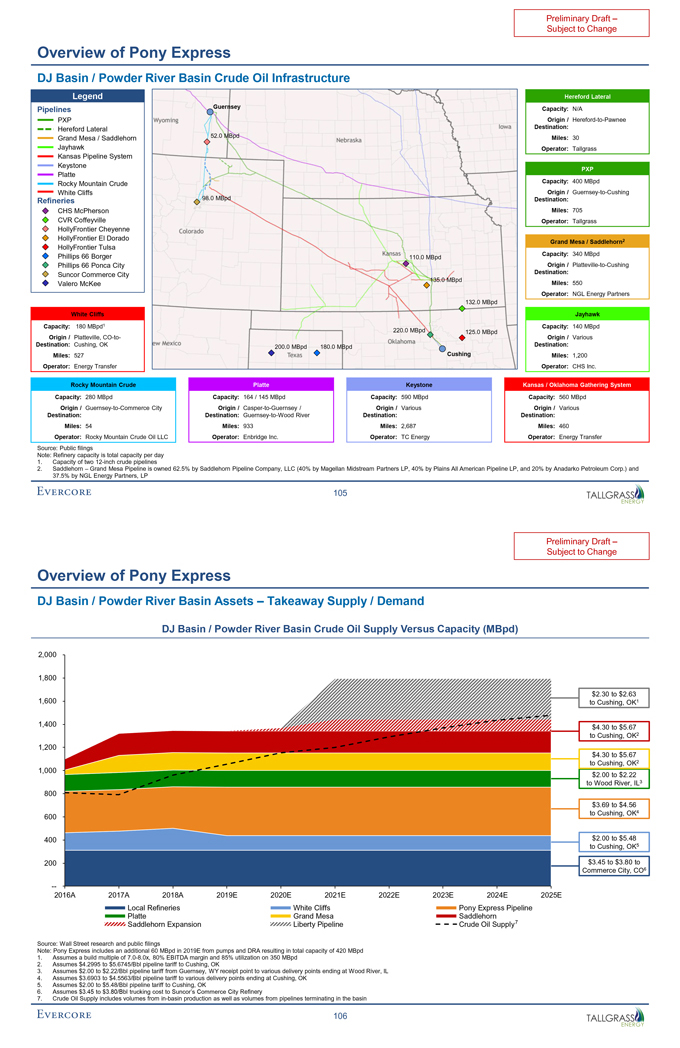
Preliminary Draft –Subject to Change Overview of Pony Express DJ Basin / Powder River Basin Crude Oil Infrastructure Legend Hereford Lateral Pipelines Guernsey Capacity: N/A PXP Origin /Hereford-to-Pawnee Hereford Lateral Destination: Grand Mesa / Saddlehorn 52.0 MBpd Miles: 30 Jayhawk Operator: Tallgrass Kansas Pipeline System Keystone Platte PXP Rocky Mountain Crude Capacity: 400 MBpd White Cliffs Origin /Guernsey-to-Cushing Refineries 98.0 MBpd Destination: CHS McPherson Miles: 705 CVR Coffeyville Operator: Tallgrass HollyFrontier Cheyenne HollyFrontier El Dorado 2 HollyFrontier Tulsa Grand Mesa / Saddlehorn Phillips 66 Borger Capacity: 340 MBpd 110.0 MBpd Phillips 66 Ponca City Origin /Platteville-to-Cushing Suncor Commerce City Destination: 135.0 MBpd Valero McKee Miles: 550 Operator: NGL Energy Partners 132.0 MBpd White Cliffs Jayhawk Capacity: 180 MBpd1 Capacity: 140 MBpd 220.0 MBpd 125.0 MBpd Origin / Platteville,CO-to- Origin / Various Destination: Cushing, OK 200.0 MBpd 180.0 MBpd Destination: Miles: 527 Cushing Miles: 1,200 Operator: Energy Transfer Operator: CHS Inc. Rocky Mountain Crude Platte Keystone Kansas / Oklahoma Gathering System Capacity: 280 MBpd Capacity: 164 / 145 MBpd Capacity: 590 MBpd Capacity: 560 MBpd Origin /Guernsey-to-Commerce City Origin /Casper-to-Guernsey / Origin / Various Origin / Various Destination: Destination:Guernsey-to-Wood River Destination: Destination: Miles: 54 Miles: 933 Miles: 2,687 Miles: 460 Operator: Rocky Mountain Crude Oil LLC Operator: Enbridge Inc. Operator: TC Energy Operator: Energy Transfer Source: Public filings Note: Refinery capacity is total capacity per day 1. Capacity of two12-inch crude pipelines 2. Saddlehorn – Grand Mesa Pipeline is owned 62.5% by Saddlehorn Pipeline Company, LLC (40% by Magellan Midstream Partners LP, 40% by Plains All American Pipeline LP, and 20% by Anadarko Petroleum Corp.) and 37.5% by NGL Energy Partners, LP 105
Preliminary Draft –Subject to Change Overview of Pony Express DJ Basin / Powder River Basin Assets – Takeaway Supply / Demand DJ Basin / Powder River Basin Crude Oil Supply Versus Capacity (MBpd) 2,000 1,800 $2.30 to $2.63 1,600 to Cushing, OK1 1,400 $4.30 to $5.67 to Cushing, OK2 1,200 $4.30 to $5.67 to Cushing, OK2 1,000 $2.00 to $2.22 to Wood River, IL3 800 $3.69 to $4.56 to Cushing, OK4 600 400 $2.00 to $5.48 to Cushing, OK5 200 $3.45 to $3.80 to Commerce City, CO6 — 2016A 2017A 2018A 2019E 2020E 2021E 2022E 2023E 2024E 2025E Local Refineries White Cliffs Pony Express Pipeline Platte Grand Mesa Saddlehorn Saddlehorn Expansion Liberty Pipeline Crude Oil Supply7 Source: Wall Street research and public filings Note: Pony Express includes an additional 60 MBpd in 2019E from pumps and DRA resulting in total capacity of 420 MBpd 1. Assumes a build multiple of7.0-8.0x, 80% EBITDA margin and 85% utilization on 350 MBpd 2. Assumes $4.2995 to $5.6745/Bbl pipeline tariff to Cushing, OK 3. Assumes $2.00 to $2.22/Bbl pipeline tariff from Guernsey, WY receipt point to various delivery points ending at Wood River, IL 4. Assumes $3.6903 to $4.5563/Bbl pipeline tariff to various delivery points ending at Cushing, OK 5. Assumes $2.00 to $5.48/Bbl pipeline tariff to Cushing, OK 6. Assumes $3.45 to $3.80/Bbl trucking cost to Suncor’s Commerce City Refinery 7. Crude Oil Supply includes volumes fromin-basin production as well as volumes from pipelines terminating in the basin 106
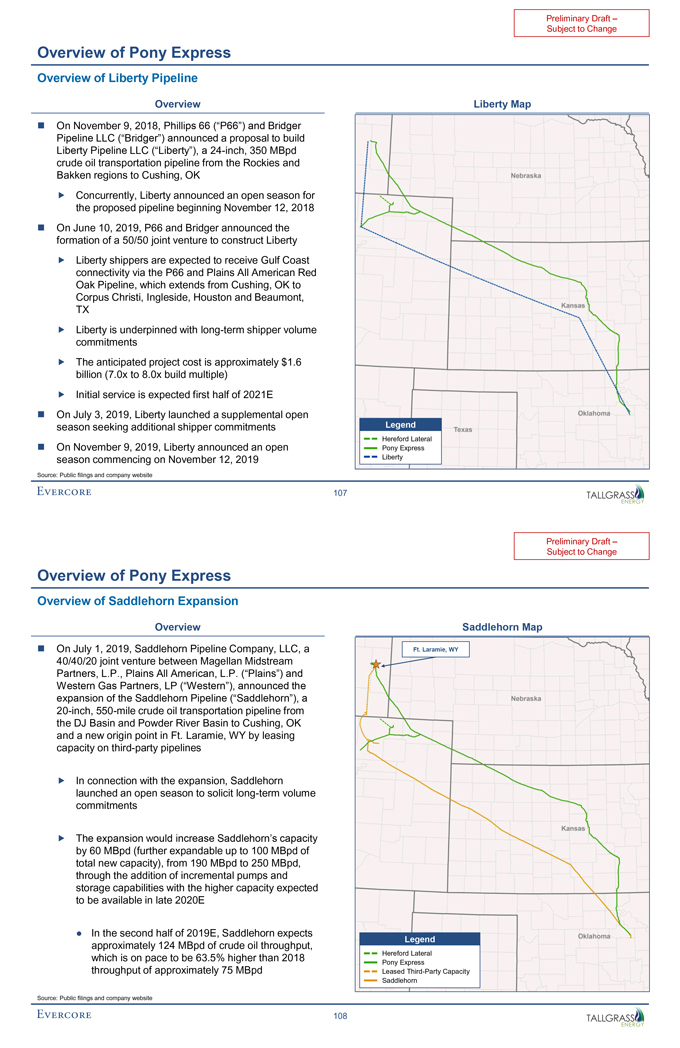
Preliminary Draft –Subject to Change Overview of Pony Express Overview of Liberty Pipeline Overview Liberty Map ï® On November 9, 2018, Phillips 66 (“P66”) and Bridger Pipeline LLC (“Bridger”) announced a proposal to build Liberty Pipeline LLC (“Liberty”), a24-inch, 350 MBpd crude oil transportation pipeline from the Rockies and Bakken regions to Cushing, OK ï,„ Concurrently, Liberty announced an open season for the proposed pipeline beginning November 12, 2018ï® On June 10, 2019, P66 and Bridger announced the formation of a 50/50 joint venture to construct Libertyï,„ Liberty shippers are expected to receive Gulf Coast connectivity via the P66 and Plains All American Red Oak Pipeline, which extends from Cushing, OK to Corpus Christi, Ingleside, Houston and Beaumont, TX ï,„ Liberty is underpinned with long-term shipper volume commitmentsï,„ The anticipated project cost is approximately $1.6 billion (7.0x to 8.0x build multiple)ï,„ Initial service is expected first half of 2021E ï® On July 3, 2019, Liberty launched a supplemental open season seeking additional shipper commitments Legend Hereford Lateral ï® On November 9, 2019, Liberty announced an open Pony Express season commencing on November 12, 2019 Liberty Source: Public filings and company website 107
Preliminary Draft –Subject to Change Overview of Pony Express Overview of Saddlehorn Expansion Overview Saddlehorn Map ï® On July 1, 2019, Saddlehorn Pipeline Company, LLC, a Ft. Laramie, WY 40/40/20 joint venture between Magellan Midstream Partners, L.P., Plains All American, L.P. (“Plains”) and Western Gas Partners, LP (“Western”), announced the expansion of the Saddlehorn Pipeline (“Saddlehorn”), a20-inch,550-mile crude oil transportation pipeline from the DJ Basin and Powder River Basin to Cushing, OK and a new origin point in Ft. Laramie, WY by leasing capacity on third-party pipelines ï,„ In connection with the expansion, Saddlehorn launched an open season to solicit long-term volume commitments ï,„ The expansion would increase Saddlehorn’s capacity by 60 MBpd (further expandable up to 100 MBpd of total new capacity), from 190 MBpd to 250 MBpd, through the addition of incremental pumps and storage capabilities with the higher capacity expected to be available in late 2020E • In the second half of 2019E, Saddlehorn expects Legend approximately 124 MBpd of crude oil throughput, which is on pace to be 63.5% higher than 2018 Hereford Lateral throughput of approximately 75 MBpd Pony Express Leased Third-Party Capacity Saddlehorn Source: Public filings and company website 108
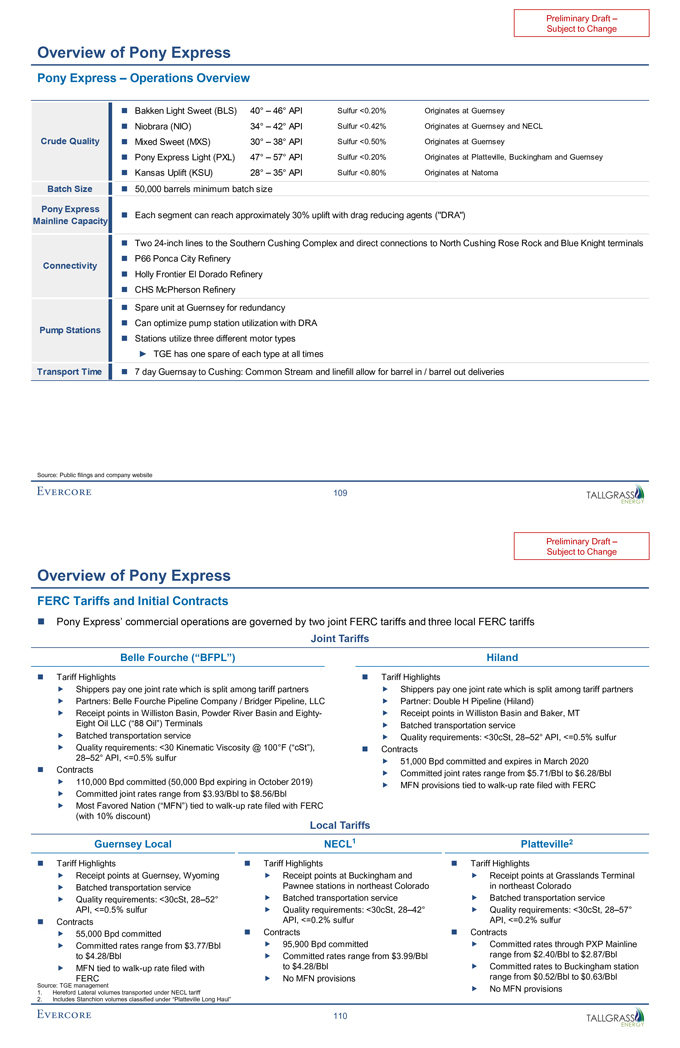
Preliminary Draft –Subject to Change Overview of Pony Express Pony Express – Operations Overview ï® Bakken Light Sweet (BLS) 40° – 46° API Sulfur <0.20% Originates at Guernsey ï® Niobrara (NIO) 34° – 42° API Sulfur <0.42% Originates at Guernsey and NECL Crude Qualityï® Mixed Sweet (MXS) 30° – 38° API Sulfur <0.50% Originates at Guernsey ï® Pony Express Light (PXL) 47° – 57° API Sulfur <0.20% Originates at Platteville, Buckingham and Guernseyï® Kansas Uplift (KSU) 28° – 35° API Sulfur <0.80% Originates at Natoma Batch Sizeï® 50,000 barrels minimum batch size Pony Express ï® Each segment can reach approximately 30% uplift with drag reducing agents (“DRA”) Mainline Capacity ï® Two24-inch lines to the Southern Cushing Complex and direct connections to North Cushing Rose Rock and Blue Knight terminalsï® P66 Ponca City Refinery Connectivity ï® Holly Frontier El Dorado Refineryï® CHS McPherson Refineryï® Spare unit at Guernsey for redundancy ï® Can optimize pump station utilization with DRA Pump Stations ï® Stations utilize three different motor types â–º TGE has one spare of each type at all times Transport Timeï® 7 day Guernsay to Cushing: Common Stream and linefill allow for barrel in / barrel out deliveries Source: Public filings and company website 109
Preliminary Draft –Subject to Change Overview of Pony Express FERC Tariffs and Initial Contracts ï® Pony Express’ commercial operations are governed by two joint FERC tariffs and three local FERC tariffs Joint Tariffs Belle Fourche (“BFPL”) Hiland ï® Tariff Highlightsï® Tariff Highlights ï,„ Shippers pay one joint rate which is split among tariff partnersï,„ Shippers pay one joint rate which is split among tariff partnersï,„ Partners: Belle Fourche Pipeline Company / Bridger Pipeline, LLCï,„ Partner: Double H Pipeline (Hiland)ï,„ Receipt points in Williston Basin, Powder River Basin and Eighty-ï,„ Receipt points in Williston Basin and Baker, MT Eight Oil LLC (“88 Oil”) Terminalsï,„ Batched transportation service ï,„ Batched transportation serviceï,„ Quality requirements: <30cSt, 28–52° API, <=0.5% sulfurï,„ Quality requirements: <30 Kinematic Viscosity @ 100°F (“cSt”),ï® Contracts 28–52° API, <=0.5% sulfur ï,„ 51,000 Bpd committed and expires in March 2020ï® Contracts ï,„ Committed joint rates range from $5.71/Bbl to $6.28/Bblï,„ 110,000 Bpd committed (50,000 Bpd expiring in October 2019)ï,„ MFN provisions tied towalk-up rate filed with FERC ï,„ Committed joint rates range from $3.93/Bbl to $8.56/Bbl ï,„ Most Favored Nation (“MFN”) tied towalk-up rate filed with FERC (with 10% discount) Local Tariffs Guernsey Local NECL1 Platteville2 ï® Tariff Highlightsï® Tariff Highlightsï® Tariff Highlights ï,„ Receipt points at Guernsey, Wyomingï,„ Receipt points at Buckingham and ï,„ Receipt points at Grasslands Terminal ï,„ Batched transportation service Pawnee stations in northeast Colorado in northeast Colorado ï,„ Quality requirements: <30cSt, 28–52°ï,„ Batched transportation serviceï,„ Batched transportation service API, <=0.5% sulfur ï,„ Quality requirements: <30cSt, 28–42°ï,„ Quality requirements: <30cSt, 28–57°ï® Contracts API, <=0.2% sulfur API, <=0.2% sulfur ï,„ 55,000 Bpd committedï® Contracts ï® Contracts ï,„ Committed rates range from $3.77/Bbl ï,„ 95,900 Bpd committedï,„ Committed rates through PXP Mainline to $4.28/Bblï,„ Committed rates range from $3.99/Bbl range from $2.40/Bbl to $2.87/Bblï,„ MFN tied towalk-up rate filed with to $4.28/Bblï,„ Committed rates to Buckingham station FERCï,„ No MFN provisions range from $0.52/Bbl to $0.63/Bbl Source: TGE managementï,„ No MFN provisions 1. Hereford Lateral volumes transported under NECL tariff 2. Includes Stanchion volumes classified under “Platteville Long Haul” 110
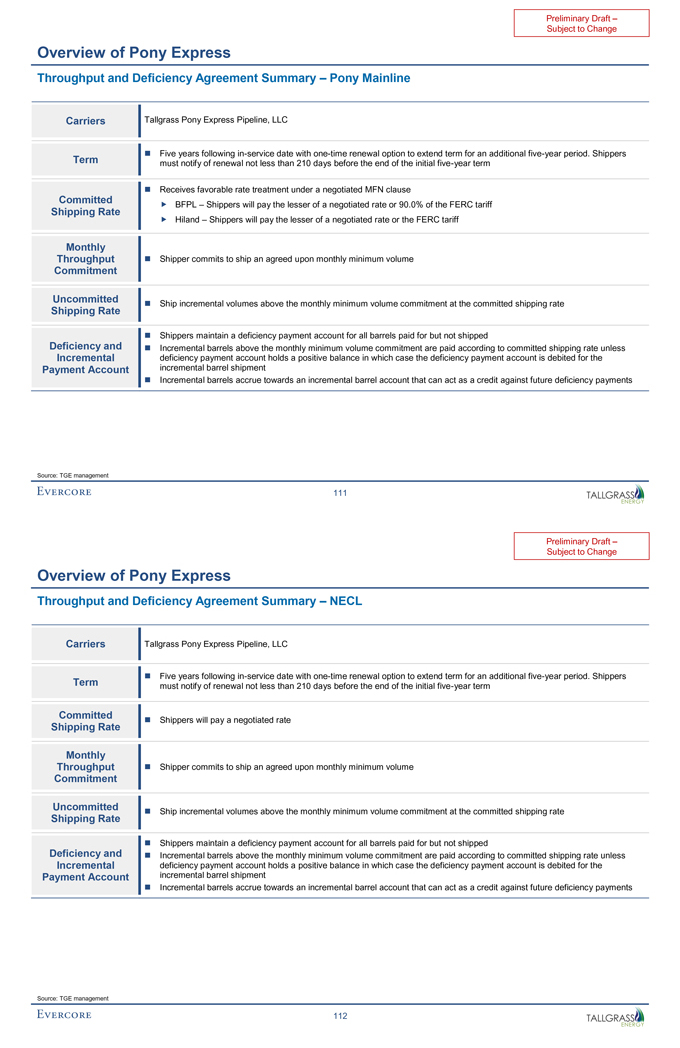
Preliminary Draft –Subject to Change Overview of Pony Express Throughput and Deficiency Agreement Summary – Pony Mainline Carriers Tallgrass Pony Express Pipeline, LLC ï® Five years followingin-service date withone-time renewal option to extend term for an additional five-year period. Shippers Term must notify of renewal not less than 210 days before the end of the initial five-year term ï® Receives favorable rate treatment under a negotiated MFN clause Committed ï,„ BFPL – Shippers will pay the lesser of a negotiated rate or 90.0% of the FERC tariff Shipping Rate ï,„ Hiland – Shippers will pay the lesser of a negotiated rate or the FERC tariff Monthly Throughput ï® Shipper commits to ship an agreed upon monthly minimum volume Commitment Uncommitted ï® Ship incremental volumes above the monthly minimum volume commitment at the committed shipping rate Shipping Rate ï® Shippers maintain a deficiency payment account for all barrels paid for but not shipped Deficiency and ï® Incremental barrels above the monthly minimum volume commitment are paid according to committed shipping rate unless Incremental deficiency payment account holds a positive balance in which case the deficiency payment account is debited for the Payment Account incremental barrel shipment ï® Incremental barrels accrue towards an incremental barrel account that can act as a credit against future deficiency payments Source: TGE management 111
Preliminary Draft –Subject to Change Overview of Pony Express Throughput and Deficiency Agreement Summary – NECL Carriers Tallgrass Pony Express Pipeline, LLC ï® Five years followingin-service date withone-time renewal option to extend term for an additional five-year period. Shippers Term must notify of renewal not less than 210 days before the end of the initial five-year term Committed ï® Shippers will pay a negotiated rate Shipping Rate Monthly Throughput ï® Shipper commits to ship an agreed upon monthly minimum volume Commitment Uncommitted ï® Ship incremental volumes above the monthly minimum volume commitment at the committed shipping rate Shipping Rate ï® Shippers maintain a deficiency payment account for all barrels paid for but not shipped Deficiency and ï® Incremental barrels above the monthly minimum volume commitment are paid according to committed shipping rate unless Incremental deficiency payment account holds a positive balance in which case the deficiency payment account is debited for the Payment Account incremental barrel shipment ï® Incremental barrels accrue towards an incremental barrel account that can act as a credit against future deficiency payments Source: TGE management 112
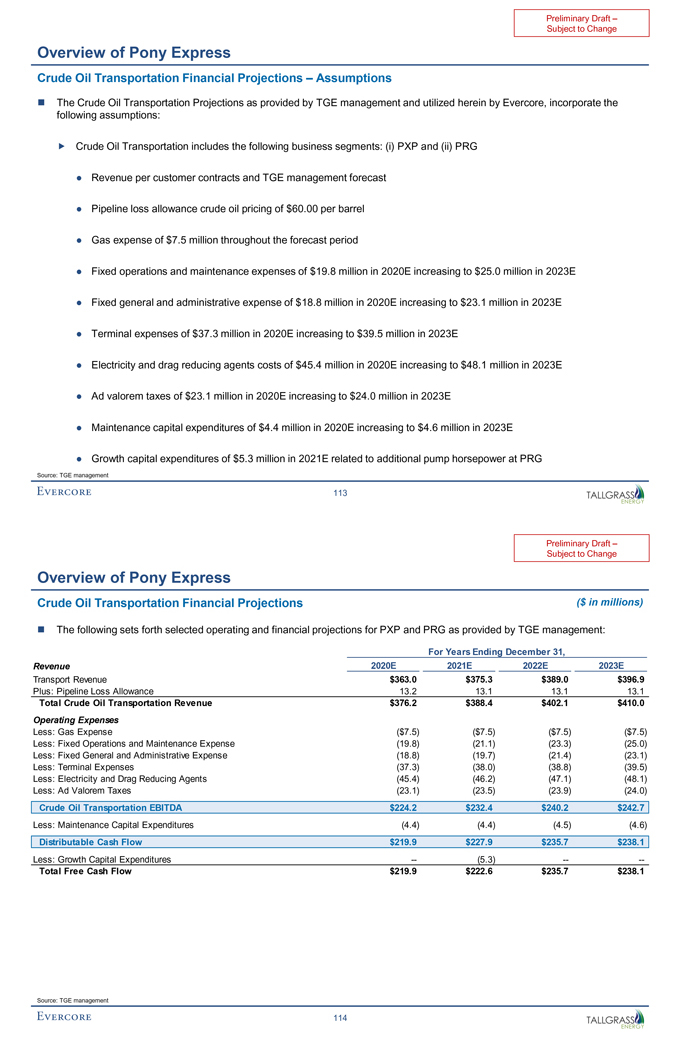
Preliminary Draft –Subject to Change Overview of Pony Express Crude Oil Transportation Financial Projections – Assumptions ï® The Crude Oil Transportation Projections as provided by TGE management and utilized herein by Evercore, incorporate the following assumptions: ï,„ Crude Oil Transportation includes the following business segments: (i) PXP and (ii) PRG • Revenue per customer contracts and TGE management forecast • Pipeline loss allowance crude oil pricing of $60.00 per barrel • Gas expense of $7.5 million throughout the forecast period • Fixed operations and maintenance expenses of $19.8 million in 2020E increasing to $25.0 million in 2023E • Fixed general and administrative expense of $18.8 million in 2020E increasing to $23.1 million in 2023E • Terminal expenses of $37.3 million in 2020E increasing to $39.5 million in 2023E • Electricity and drag reducing agents costs of $45.4 million in 2020E increasing to $48.1 million in 2023E • Ad valorem taxes of $23.1 million in 2020E increasing to $24.0 million in 2023E • Maintenance capital expenditures of $4.4 million in 2020E increasing to $4.6 million in 2023E • Growth capital expenditures of $5.3 million in 2021E related to additional pump horsepower at PRG Source: TGE management 113
Preliminary Draft –Subject to Change Overview of Pony Express Crude Oil Transportation Financial Projections ($ in millions) ï® The following sets forth selected operating and financial projections for PXP and PRG as provided by TGE management: For Years Ending December 31, Revenue 2020E 2021E 2022E 2023E Transport Revenue $363.0 $375.3 $389.0 $396.9 Plus: Pipeline Loss Allowance 13.2 13.1 13.1 13.1 Total Crude Oil Transportation Revenue $376.2 $388.4 $402.1 $410.0 Operating Expenses Less: Gas Expense ($7.5) ($7.5) ($7.5) ($7.5) Less: Fixed Operations and Maintenance Expense (19.8) (21.1) (23.3) (25.0) Less: Fixed General and Administrative Expense (18.8) (19.7) (21.4) (23.1) Less: Terminal Expenses (37.3) (38.0) (38.8) (39.5) Less: Electricity and Drag Reducing Agents (45.4) (46.2) (47.1) (48.1) Less: Ad Valorem Taxes (23.1) (23.5) (23.9) (24.0) Crude Oil Transportation EBITDA $224.2 $232.4 $240.2 $242.7 Less: Maintenance Capital Expenditures (4.4) (4.4) (4.5) (4.6) Distributable Cash Flow $219.9 $227.9 $235.7 $238.1 Less: Growth Capital Expenditures — (5.3) -—- Total Free Cash Flow $219.9 $222.6 $235.7 $238.1 Source: TGE management 114
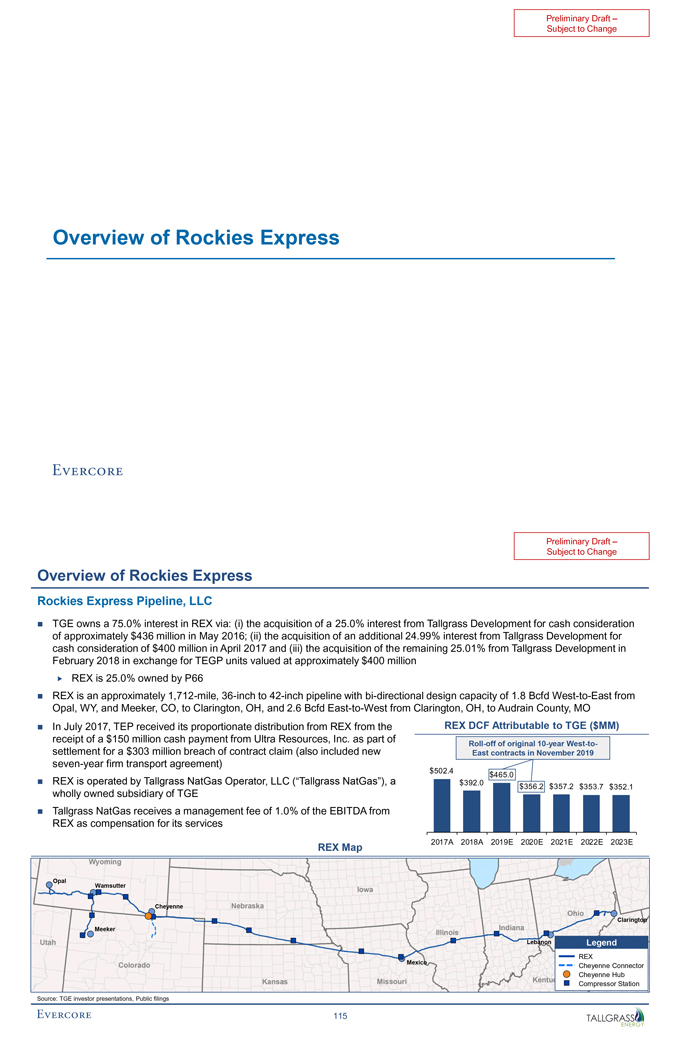
Preliminary Draft –Subject to Change Overview of Rockies Express
Overview of Rockies Express Rockies Express Pipeline, LLC ï® TGE owns a 75.0% interest in REX via: (i) the acquisition of a 25.0% interest from Tallgrass Development for cash consideration of approximately $436 million in May 2016; (ii) the acquisition of an additional 24.99% interest from Tallgrass Development for cash consideration of $400 million in April 2017 and (iii) the acquisition of the remaining 25.01% from Tallgrass Development in February 2018 in exchange for TEGP units valued at approximately $400 millionï,„ REX is 25.0% owned by P66ï® REX is an approximately1,712-mile,36-inch to42-inch pipeline withbi-directional design capacity of 1.8 BcfdWest-to-East from Opal, WY, and Meeker, CO, to Clarington, OH, and 2.6 BcfdEast-to-West from Clarington, OH, to Audrain County, MO ï® In July 2017, TEP received its proportionate distribution from REX from the REX DCF Attributable to TGE ($MM) receipt of a $150 million cash payment from Ultra Resources, Inc. as part ofRoll-off of original10-yearWest-to- settlement for a $303 million breach of contract claim (also included new East contracts in November 2019 seven-year firm transport agreement) $502.4 $465.0 ï® REX is operated by Tallgrass NatGas Operator, LLC (“Tallgrass NatGas”), a $392.0 $356.2 $357.2 $353.7 $352.1 wholly owned subsidiary of TGE ï® Tallgrass NatGas receives a management fee of 1.0% of the EBITDA from REX as compensation for its services 2017A 2018A 2019E 2020E 2021E 2022E 2023E REX Map Opal Wamsutter Cheyenne Clarington Meeker Lebanon Legend REX Mexico Cheyenne Connector Cheyenne Hub Compressor Station Source: TGE investor presentations, Public filings 115
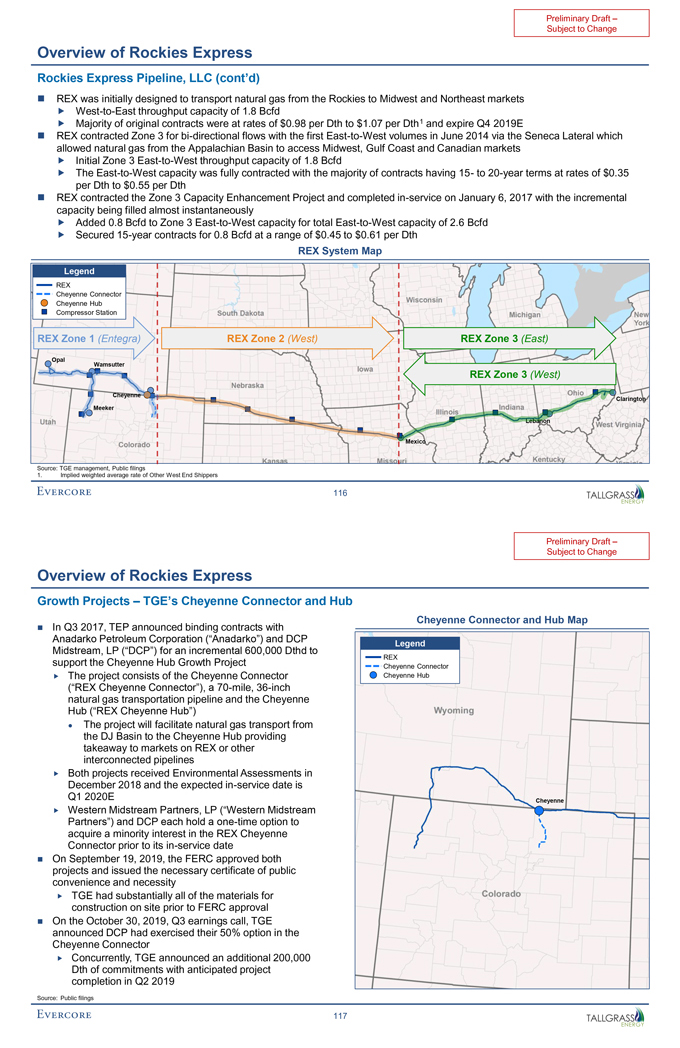
ï® REX was initially designed to transport natural gas from the Rockies to Midwest and Northeast marketsï,„West-to-East throughput capacity of 1.8 Bcfdï,„ Majority of original contracts were at rates of $0.98 per Dth to $1.07 per Dth1 and expire Q4 2019E ï® REX contracted Zone 3 forbi-directional flows with the firstEast-to-West volumes in June 2014 via the Seneca Lateral which allowed natural gas from the Appalachian Basin to access Midwest, Gulf Coast and Canadian marketsï,„ Initial Zone 3East-to-West throughput capacity of 1.8 Bcfdï,„ TheEast-to-West capacity was fully contracted with the majority of contracts having15- to20-year terms at rates of $0.35 per Dth to $0.55 per Dthï® REX contracted the Zone 3 Capacity Enhancement Project and completedin-service on January 6, 2017 with the incremental capacity being filled almost instantaneously ï,„ Added 0.8 Bcfd to Zone 3East-to-West capacity for totalEast-to-West capacity of 2.6 Bcfdï,„ Secured15-year contracts for 0.8 Bcfd at a range of $0.45 to $0.61 per Dth Legend REX Cheyenne Connector Cheyenne Hub Compressor Station REX Zone 1 (Entegra) REX Zone 2 (West) REX Zone 3 (East) Opal Wamsutter REX Zone 3 (West) Cheyenne Clarington Meeker Lebanon Mexico Source: TGE management, Public filings 1. Implied weighted average rate of Other West End Shippers 116
Preliminary Draft –Subject to Change Overview of Rockies Express Growth Projects – TGE’s Cheyenne Connector and Hub ï® Cheyenne Connector and Hub Map In Q3 2017, TEP announced binding contracts with Anadarko Petroleum Corporation (“Anadarko”) and DCP Legend Midstream, LP (“DCP”) for an incremental 600,000 Dthd to REX support the Cheyenne Hub Growth Project Cheyenne Connectorï,„ The project consists of the Cheyenne Connector Cheyenne Hub (“REX Cheyenne Connector”), a70-mile,36-inch natural gas transportation pipeline and the Cheyenne Hub (“REX Cheyenne Hub”) • The project will facilitate natural gas transport from the DJ Basin to the Cheyenne Hub providing takeaway to markets on REX or other interconnected pipelinesï,„ Both projects received Environmental Assessments in December 2018 and the expectedin-service date is Q1 2020E Cheyenne ï,„ Western Midstream Partners, LP (“Western Midstream Partners”) and DCP each hold aone-time option to acquire a minority interest in the REX Cheyenne Connector prior to itsin-service dateï® On September 19, 2019, the FERC approved both projects and issued the necessary certificate of public convenience and necessityï,„ TGE had substantially all of the materials for construction on site prior to FERC approvalï® On the October 30, 2019, Q3 earnings call, TGE announced DCP had exercised their 50% option in the Cheyenne Connectorï,„ Concurrently, TGE announced an additional 200,000 Dth of commitments with anticipated project completion in Q2 2019 Source: Public filings 117
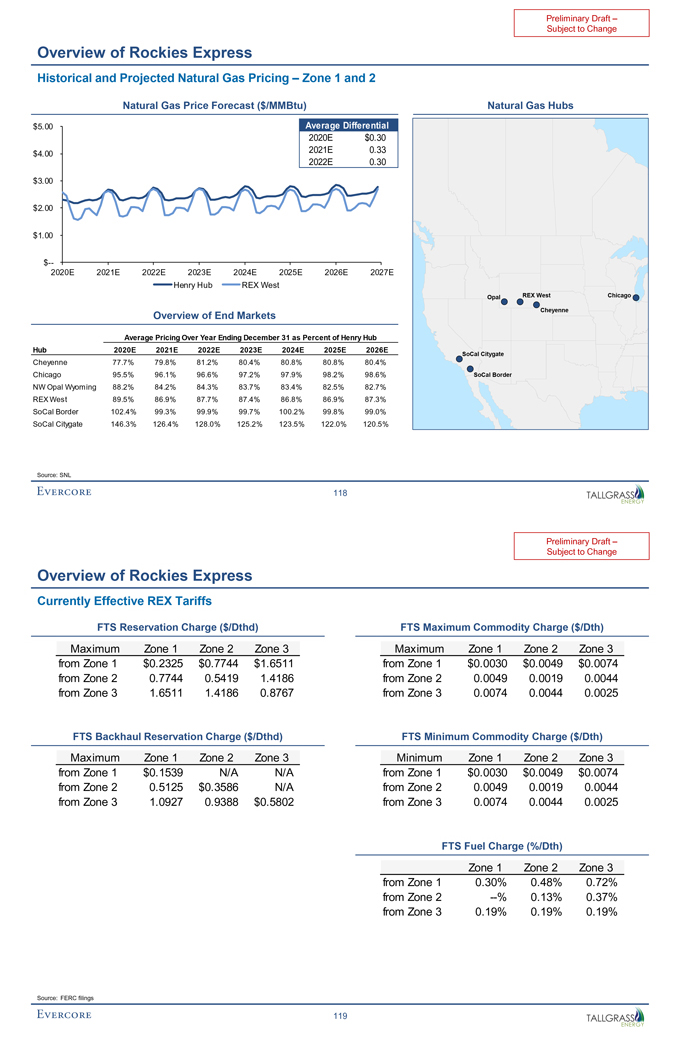
Preliminary Draft –Subject to Change Overview of Rockies Express Historical and Projected Natural Gas Pricing – Zone 1 and 2 Natural Gas Price Forecast ($/MMBtu) Natural Gas Hubs $5.00 Average Differential 2020E $0.30 2021E 0.33 $4.00 2022E 0.30 $3.00 $2.00 $1.00 $— 2020E 2021E 2022E 2023E 2024E 2025E 2026E 2027E Henry Hub REX West Opal REX West Chicago Cheyenne Overview of End Markets Average Pricing Over Year Ending December 31 as Percent of Henry Hub Hub 2020E 2021E 2022E 2023E 2024E 2025E 2026E SoCal Citygate Cheyenne 77.7% 79.8% 81.2% 80.4% 80.8% 80.8% 80.4% Chicago 95.5% 96.1% 96.6% 97.2% 97.9% 98.2% 98.6% SoCal Border NW Opal Wyoming 88.2% 84.2% 84.3% 83.7% 83.4% 82.5% 82.7% REX West 89.5% 86.9% 87.7% 87.4% 86.8% 86.9% 87.3% SoCal Border 102.4% 99.3% 99.9% 99.7% 100.2% 99.8% 99.0% SoCal Citygate 146.3% 126.4% 128.0% 125.2% 123.5% 122.0% 120.5% Source: SNL 118
Preliminary Draft –Subject to Change Overview of Rockies Express Currently Effective REX Tariffs FTS Reservation Charge ($/Dthd) FTS Maximum Commodity Charge ($/Dth) Maximum Zone 1 Zone 2 Zone 3 Maximum Zone 1 Zone 2 Zone 3 from Zone 1 $0.2325 $0.7744 $1.6511 from Zone 1 $0.0030 $0.0049 $0.0074 from Zone 2 0.7744 0.5419 1.4186 from Zone 2 0.0049 0.0019 0.0044 from Zone 3 1.6511 1.4186 0.8767 from Zone 3 0.0074 0.0044 0.0025 FTS Backhaul Reservation Charge ($/Dthd) FTS Minimum Commodity Charge ($/Dth) Maximum Zone 1 Zone 2 Zone 3 Minimum Zone 1 Zone 2 Zone 3 from Zone 1 $0.1539 N/A N/A from Zone 1 $0.0030 $0.0049 $0.0074 from Zone 2 0.5125 $0.3586 N/A from Zone 2 0.0049 0.0019 0.0044 from Zone 3 1.0927 0.9388 $0.5802 from Zone 3 0.0074 0.0044 0.0025 FTS Fuel Charge (%/Dth) Zone 1 Zone 2 Zone 3 from Zone 1 0.30% 0.48% 0.72% from Zone 2 —% 0.13% 0.37% from Zone 3 0.19% 0.19% 0.19% Source: FERC filings 119
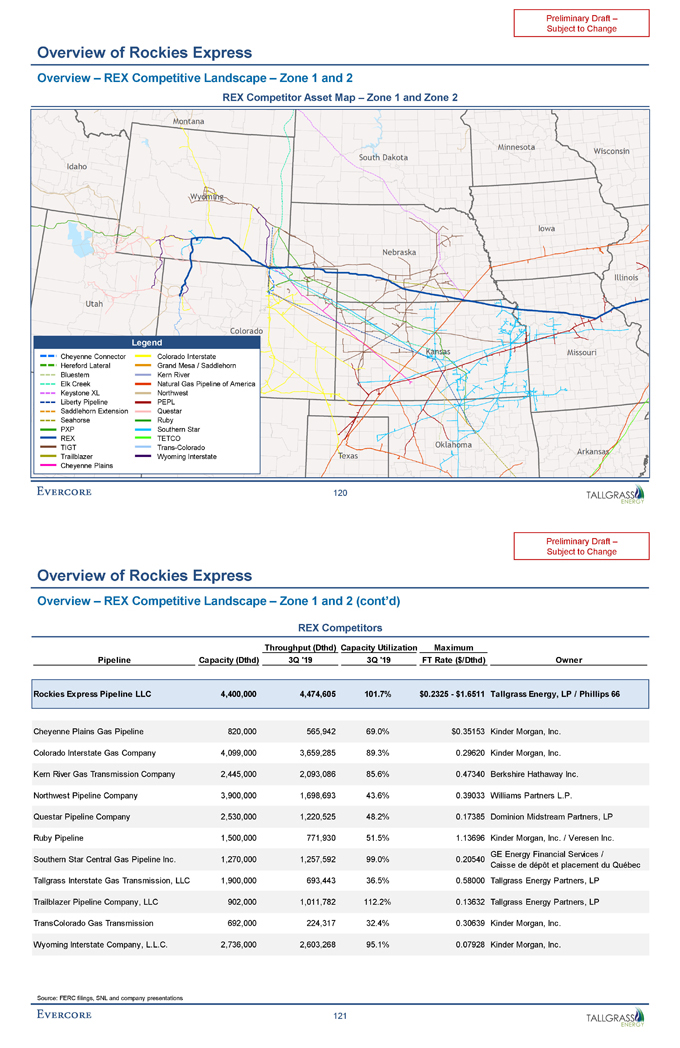
Preliminary Draft – Subject to Change Overview of Rockies Express Overview – REX Competitive Landscape – Zone 1 and 2 REX Competitor Asset Map – Zone 1 and Zone 2 Legend Cheyenne Connector Hereford Lateral Bluestem Elk Creek Keystone XL Liberty Pipeline Saddlehorn Extension Seahorse PXP REX TIGT Trailblazer Cheyenne Plains Colorado Interstate Grand Mesa / Saddlehorn Kern River Natural Gas Pipeline of America Northwest PEPL Questar Ruby Southern Star TETCO Trans-Colorado Wyoming Interstate 120
Preliminary Draft – Subject to Change Overview of Rockies Express Overview – REX Competitive Landscape – Zone 1 and 2 (cont’d) Source: FERC filings, SNL and company presentations REX Competitors Throughput (Dthd) Capacity Utilization Maximum Pipeline Capacity (Dthd) 3Q ‘19 3Q ‘19 FT Rate ($/Dthd) Owner Rockies Express Pipeline LLC 4,400,000 4,474,605 101.7% $0.2325—$1.6511 Tallgrass Energy, LP / Phillips 66 Cheyenne Plains Gas Pipeline 820,000 565,942 69.0% $0.35153 Kinder Morgan, Inc. Colorado Interstate Gas Company 4,099,000 3,659,285 89.3% 0.29620 Kinder Morgan, Inc. Kern River Gas Transmission Company 2,445,000 2,093,086 85.6% 0.47340 Berkshire Hathaway Inc. Northwest Pipeline Company 3,900,000 1,698,693 43.6% 0.39033 Williams Partners L.P. Questar Pipeline Company 2,530,000 1,220,525 48.2% 0.17385 Dominion Midstream Partners, LP Ruby Pipeline 1,500,000 771,930 51.5% 1.13696 Kinder Morgan, Inc. / Veresen Inc. Southern Star Central Gas Pipeline Inc. 1,270,000 1,257,592 99.0% 0.20540 GE Energy Financial Services / Caisse de dépôt et placement du Québec Tallgrass Interstate Gas Transmission, LLC 1,900,000 693,443 36.5% 0.58000 Tallgrass Energy Partners, LP Trailblazer Pipeline Company, LLC 902,000 1,011,782 112.2% 0.13632 Tallgrass Energy Partners, LP TransColorado Gas Transmission 692,000 224,317 32.4% 0.30639 Kinder Morgan, Inc. Wyoming Interstate Company, L.L.C. 2,736,000 2,603,268 95.1% 0.07928 Kinder Morgan, Inc. 121
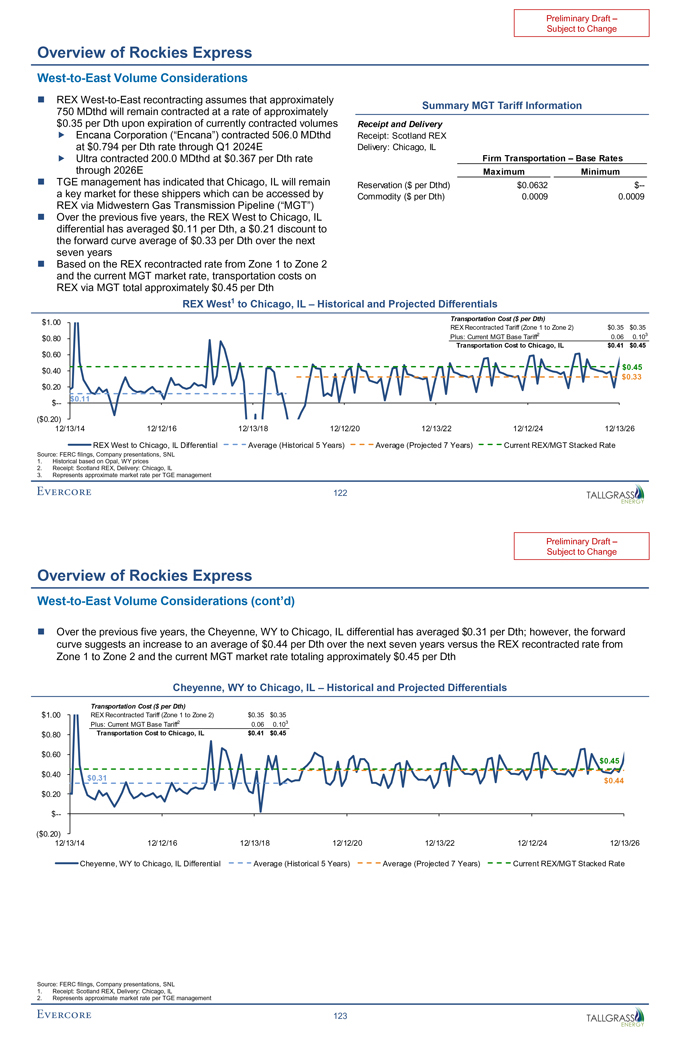
Preliminary Draft – Subject to Change $0.11 $0.33 ($0.20) $— $0.20 $0.40 $0.60 $0.80 $1.00 12/13/14 12/12/16 12/13/18 12/12/20 12/13/22 12/12/24 12/13/26 REX West to Chicago, IL Differential Average (Historical 5 Years) Average (Projected 7 Years) Current REX/MGT Stacked Rate $0.45 Overview of Rockies ExpressWest-to-East Volume Considerations Summary MGT Tariff Information REX West1 to Chicago, IL – Historical and Projected Differentials Receipt and Delivery Receipt: Scotland REX Delivery: Chicago, IL Firm Transportation – Base Rates Maximum Minimum Reservation ($ per Dthd) $0.0632 $— Commodity ($ per Dth) 0.0009 0.0009 ï® REXWest-to-East recontracting assumes that approximately 750 MDthd will remain contracted at a rate of approximately $0.35 per Dth upon expiration of currently contracted volumes ï,„ Encana Corporation (“Encana”) contracted 506.0 MDthd at $0.794 per Dth rate through Q1 2024E ï,„ Ultra contracted 200.0 MDthd at $0.367 per Dth rate through 2026E ï® TGE management has indicated that Chicago, IL will remain a key market for these shippers which can be accessed by REX via Midwestern Gas Transmission Pipeline (“MGT”) ï® Over the previous five years, the REX West to Chicago, IL differential has averaged $0.11 per Dth, a $0.21 discount to the forward curve average of $0.33 per Dth over the next seven years ï® Based on the REX recontracted rate from Zone 1 to Zone 2 and the current MGT market rate, transportation costs on REX via MGT total approximately $0.45 per Dth 122 Transportation Cost ($ per Dth) REX Recontracted Tariff (Zone 1 to Zone 2) $0.35 $0.35 Plus: Current MGT Base Tariff2 0.06 0.103 Transportation Cost to Chicago, IL $0.41 $0.45 Source: FERC filings, Company presentations, SNL 1. Historical based on Opal, WY prices 2. Receipt: Scotland REX, Delivery: Chicago, IL 3. Represents approximate market rate per TGE management
Preliminary Draft – Subject to Change Overview of Rockies Express ï® Over the previous five years, the Cheyenne, WY to Chicago, IL differential has averaged $0.31 per Dth; however, the forward curve suggests an increase to an average of $0.44 per Dth over the next seven years versus the REX recontracted rate from Zone 1 to Zone 2 and the current MGT market rate totaling approximately $0.45 per DthWest-to-East Volume Considerations (cont’d) Cheyenne, WY to Chicago, IL – Historical and Projected Differentials $0.31 $0.44 ($0.20) $— $0.20 $0.40 $0.60 $0.80 $1.00 12/13/14 12/12/16 12/13/18 12/12/20 12/13/22 12/12/24 12/13/26 Cheyenne, WY to Chicago, IL Differential Average (Historical 5 Years) Average (Projected 7 Years) Current REX/MGT Stacked Rate $0.45 123 Transportation Cost ($ per Dth) REX Recontracted Tariff (Zone 1 to Zone 2) $0.35 $0.35 Plus: Current MGT Base Tariff2 0.06 0.103 Transportation Cost to Chicago, IL $0.41 $0.45 Source: FERC filings, Company presentations, SNL 1. Receipt: Scotland REX, Delivery: Chicago, IL 2. Represents approximate market rate per TGE management
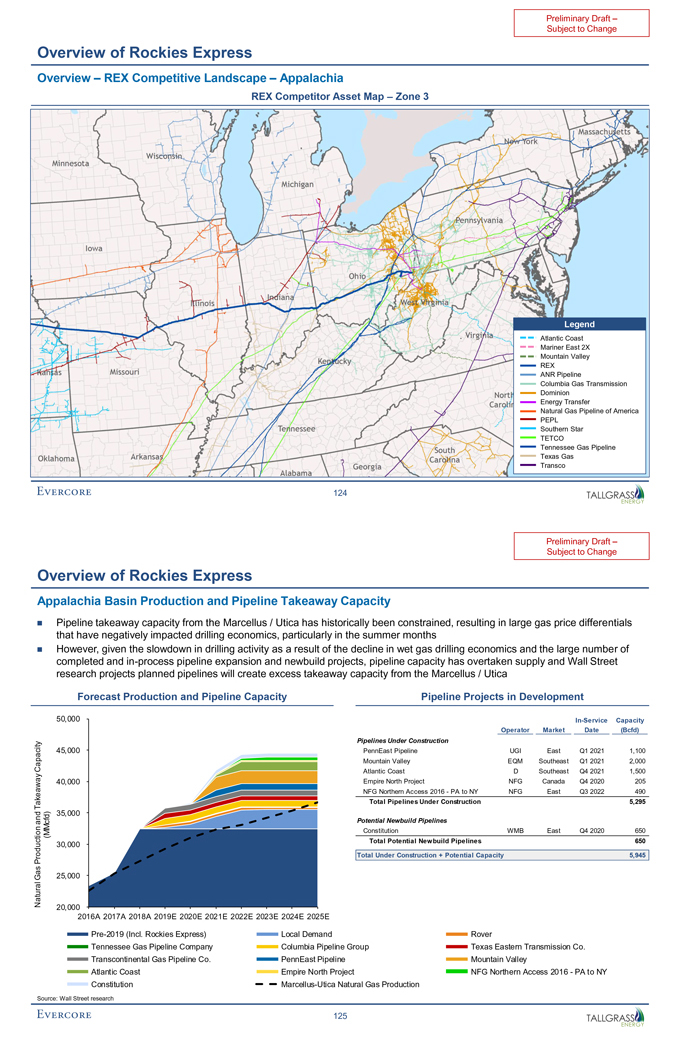
Preliminary Draft – Subject to Change Overview of Rockies Express Overview – REX Competitive Landscape – Appalachia REX Competitor Asset Map – Zone 3 Legend Atlantic Coast Mariner East 2X Mountain Valley REX ANR Pipeline Columbia Gas Transmission Dominion Energy Transfer Natural Gas Pipeline of America PEPL Southern Star TETCO Tennessee Gas Pipeline Texas Gas Transco 124
Preliminary Draft – Subject to Change ï® Pipeline takeaway capacity from the Marcellus / Utica has historically been constrained, resulting in large gas price differentials that have negatively impacted drilling economics, particularly in the summer months ï® However, given the slowdown in drilling activity as a result of the decline in wet gas drilling economics and the large number of completed andin-process pipeline expansion and newbuild projects, pipeline capacity has overtaken supply and Wall Street research projects planned pipelines will create excess takeaway capacity from the Marcellus / Utica Overview of Rockies Express Appalachia Basin Production and Pipeline Takeaway Capacity Source: Wall Street research Forecast Production and Pipeline Capacity Pipeline Projects in DevelopmentIn-Service Capacity Operator Market Date (Bcfd) Pipelines Under Construction PennEast Pipeline UGI East Q1 2021 1,100 Mountain Valley EQM Southeast Q1 2021 2,000 Atlantic Coast D Southeast Q4 2021 1,500 Empire North Project NFG Canada Q4 2020 205 NFG Northern Access 2016—PA to NY NFG East Q3 2022 490 Total Pipelines Under Construction 5,295 Potential Newbuild Pipelines Constitution WMB East Q4 2020 650 Total Potential Newbuild Pipelines 650 Total Under Construction + Potential Capacity 5,945 125 20,000 25,000 30,000 35,000 40,000 45,000 50,000 2016A 2017A 2018A 2019E 2020E 2021E 2022E 2023E 2024E 2025E Natural Gas Production and Takeaway Capacity (MMcfd)Pre-2019 (Incl. Rockies Express) Local Demand Rover Tennessee Gas Pipeline Company Columbia Pipeline Group Texas Eastern Transmission Co. Transcontinental Gas Pipeline Co. PennEast Pipeline Mountain Valley Atlantic Coast Empire North Project NFG Northern Access 2016—PA to NY Constitution Marcellus-Utica Natural Gas Production
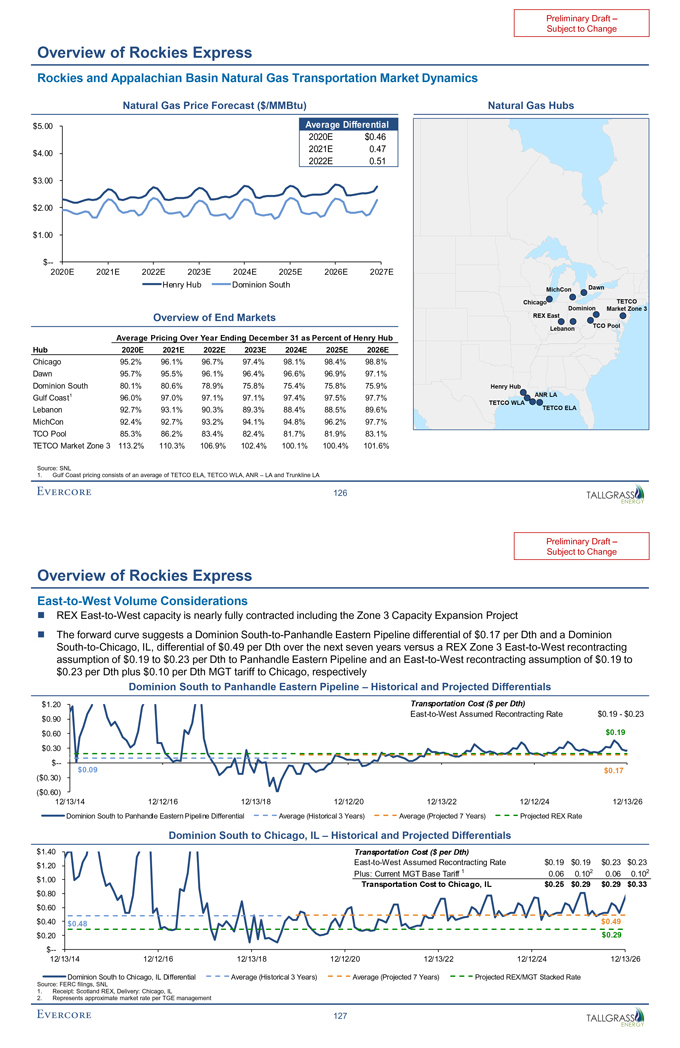
Preliminary Draft – Subject to Change Average Pricing Over Year Ending December 31 as Percent of Henry Hub Hub 2020E 2021E 2022E 2023E 2024E 2025E 2026E Chicago 95.2% 96.1% 96.7% 97.4% 98.1% 98.4% 98.8% Dawn 95.7% 95.5% 96.1% 96.4% 96.6% 96.9% 97.1% Dominion South 80.1% 80.6% 78.9% 75.8% 75.4% 75.8% 75.9% Gulf Coast1 96.0% 97.0% 97.1% 97.1% 97.4% 97.5% 97.7% Lebanon 92.7% 93.1% 90.3% 89.3% 88.4% 88.5% 89.6% MichCon 92.4% 92.7% 93.2% 94.1% 94.8% 96.2% 97.7% TCO Pool 85.3% 86.2% 83.4% 82.4% 81.7% 81.9% 83.1% TETCO Market Zone 3 113.2% 110.3% 106.9% 102.4% 100.1% 100.4% 101.6% Average Differential 2020E $0.46 2021E 0.47 2022E 0.51 $— $1.00 $2.00 $3.00 $4.00 $5.00 2020E 2021E 2022E 2023E 2024E 2025E 2026E 2027E Henry Hub Dominion South Overview of Rockies Express Rockies and Appalachian Basin Natural Gas Transportation Market Dynamics Natural Gas Price Forecast ($/MMBtu) Natural Gas Hubs Overview of End Markets Source: SNL 1. Gulf Coast pricing consists of an average of TETCO ELA, TETCO WLA, ANR – LA and Trunkline LA Chicago MichCon Dawn REX East TCO Pool Dominion TETCO Market Zone 3 Lebanon Henry Hub TETCO WLA ANR LA TETCO ELA 126
Preliminary Draft –Subject to Change Overview of Rockies ExpressEast-to-West Volume Considerations ï® REXEast-to-West capacity is nearly fully contracted including the Zone 3 Capacity Expansion Project ï® The forward curve suggests a DominionSouth-to-Panhandle Eastern Pipeline differential of $0.17 per Dth and a DominionSouth-to-Chicago, IL, differential of $0.49 per Dth over the next seven years versus a REX Zone 3East-to-West recontracting assumption of $0.19 to $0.23 per Dth to Panhandle Eastern Pipeline and anEast-to-West recontracting assumption of $0.19 to $0.23 per Dth plus $0.10 per Dth MGT tariff to Chicago, respectively Dominion South to Panhandle Eastern Pipeline – Historical and Projected Differentials $1.20 Transportation Cost ($ per Dth)East-to-West Assumed Recontracting Rate $0.19—$0.23 $0.90 $0.60 $0.19 $0.30 $— $0.09 ($0.30) $0.17 ($0.60) 12/13/14 12/12/16 12/13/18 12/12/20 12/13/22 12/12/24 12/13/26 Dominion South to Panhandle Eastern Pipeline Differential Average (Historical 3 Years) Average (Projected 7 Years) Projected REX Rate Dominion South to Chicago, IL – Historical and Projected Differentials $1.40 Transportation Cost ($ per Dth) $1.20East-to-West Assumed Recontracting Rate $0.19 $0.19 $0.23 $0.23 Plus: Current MGT Base Tariff 1 0.06 0.102 0.06 0.102 $1.00 Transportation Cost to Chicago, IL $0.25 $0.29 $0.29 $0.33 $0.80 $0.60 $0.40 $0.48 $0.49 $0.20 $0.29$--12/13/14 12/12/16 12/13/18 12/12/20 12/13/22 12/12/24 12/13/26 Dominion South to Chicago, IL Differential Average (Historical 3 Years) Average (Projected 7 Years) Projected REX/MGT Stacked Rate Source: FERC filings, SNL 1. Receipt: Scotland REX, Delivery: Chicago, IL 2. Represents approximate market rate per TGE management 127
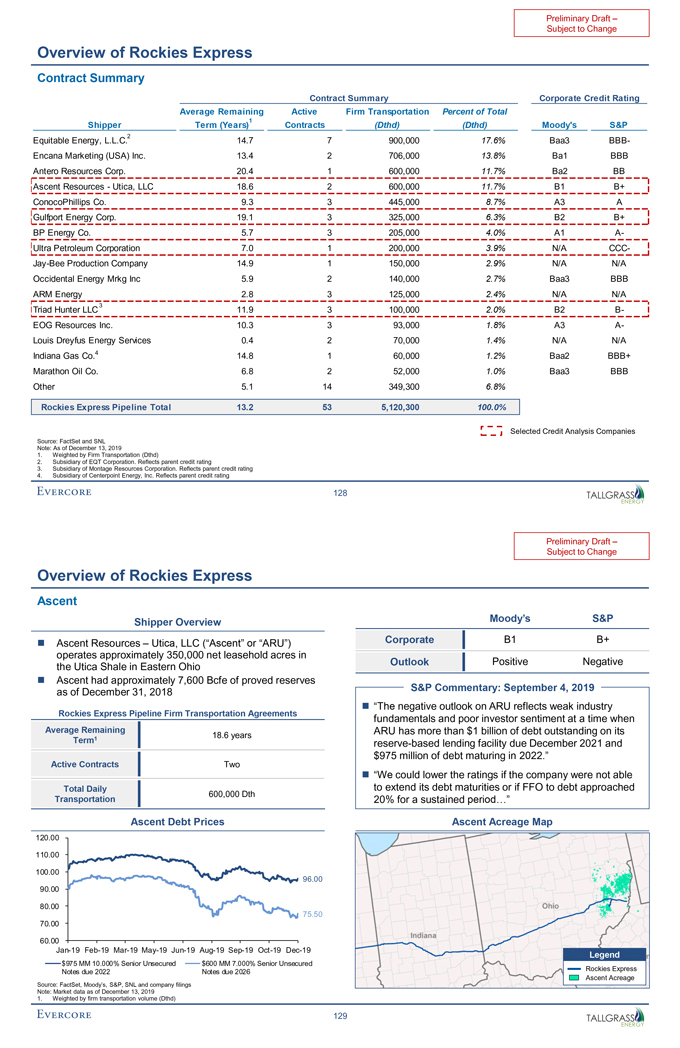
Preliminary Draft –Subject to Change Overview of Rockies Express Contract Summary Contract Summary Corporate Credit Rating Average Remaining Active Firm Transportation Percent of Total 1 Shipper Term (Years) Contracts (Dthd) (Dthd) Moody’s S&P 2 Equitable Energy, L.L.C. 14.7 7 900,000 17.6% Baa3BBB-Encana Marketing (USA) Inc. 13.4 2 706,000 13.8% Ba1 BBB Antero Resources Corp. 20.4 1 600,000 11.7% Ba2 BB Ascent Resources—Utica, LLC 18.6 2 600,000 11.7% B1 B+ ConocoPhillips Co. 9.3 3 445,000 8.7% A3 A Gulfport Energy Corp. 19.1 3 325,000 6.3% B2 B+ BP Energy Co. 5.7 3 205,000 4.0% A1A-Ultra Petroleum Corporation 7.0 1 200,000 3.9% N/ACCC-Jay-Bee Production Company 14.9 1 150,000 2.9% N/A N/A Occidental Energy Mrkg Inc 5.9 2 140,000 2.7% Baa3 BBB ARM Energy 2.8 3 125,000 2.4% N/A N/A 3 Triad Hunter LLC 11.9 3 100,000 2.0% B2B-EOG Resources Inc. 10.3 3 93,000 1.8% A3A-Louis Dreyfus Energy Services 0.4 2 70,000 1.4% N/A N/A Indiana Gas Co.4 14.8 1 60,000 1.2% Baa2 BBB+ Marathon Oil Co. 6.8 2 52,000 1.0% Baa3 BBB Other 5.1 14 349,300 6.8% Rockies Express Pipeline Total 13.2 53 5,120,300 100.0% Selected Credit Analysis Companies Source: FactSet and SNL Note: As of December 13, 2019 1. Weighted by Firm Transportation (Dthd) 2. Subsidiary of EQT Corporation. Reflects parent credit rating 3. Subsidiary of Montage Resources Corporation. Reflects parent credit rating 4. Subsidiary of Centerpoint Energy, Inc. Reflects parent credit rating 128
Preliminary Draft –Subject to Change Overview of Rockies Express Ascent Shipper Overview Moody’s S&P ï® Ascent Resources – Utica, LLC (“Ascent” or “ARU”) Corporate B1 B+ operates approximately 350,000 net leasehold acres in Outlook Positive Negative the Utica Shale in Eastern Ohioï® Ascent had approximately 7,600 Bcfe of proved reserves as of December 31, 2018 S&P Commentary: September 4, 2019 ï® “The negative outlook on ARU reflects weak industry Rockies Express Pipeline Firm Transportation Agreements fundamentals and poor investor sentiment at a time when Average Remaining ARU has more than $1 billion of debt outstanding on its 18.6 years Term1 reserve-based lending facility due December 2021 and $975 million of debt maturing in 2022.” Active Contracts Two ï® “We could lower the ratings if the company were not able Total Daily to extend its debt maturities or if FFO to debt approached 600,000 Dth Transportation 20% for a sustained period…” Ascent Debt Prices Ascent Acreage Map 120.00 110.00 100.00 96.00 90.00 80.00 75.50 70.00 60.00Jan-19Feb-19Mar-19May-19Jun-19Aug-19Sep-19Oct-19Dec-19 Legend $975 MM 10.000% Senior Unsecured $600 MM 7.000% Senior Unsecured Notes due 2022 Notes due 2026 Rockies Express Ascent Acreage Source: FactSet, Moody’s, S&P, SNL and company filings Note: Market data as of December 13, 2019 1. Weighted by firm transportation volume (Dthd) 129
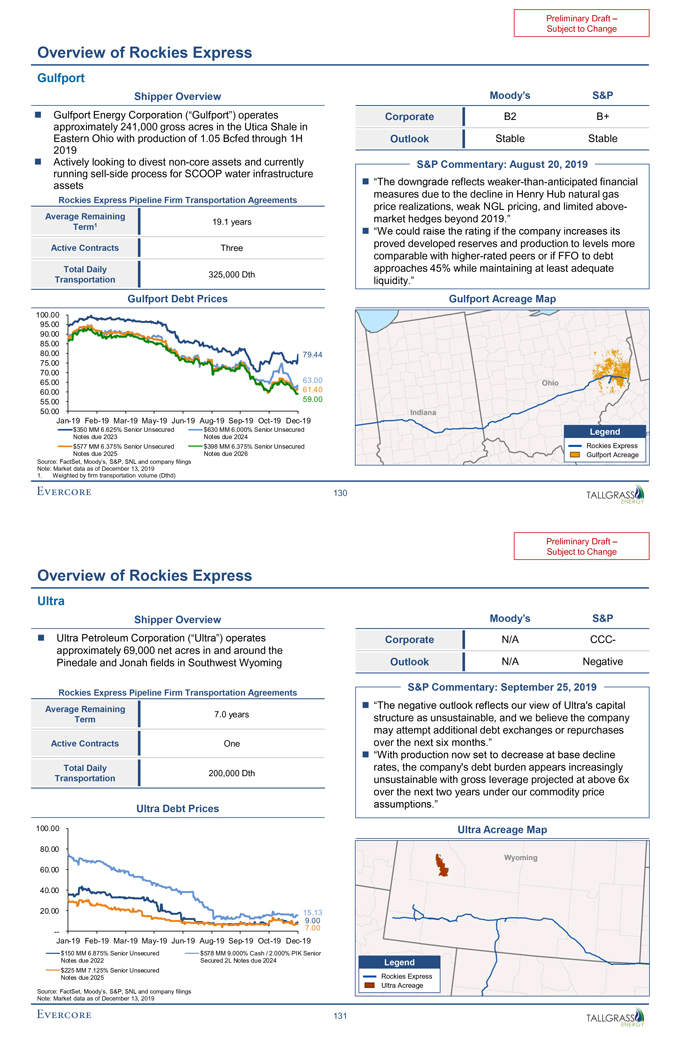
Preliminary Draft –Subject to Change Overview of Rockies Express Gulfport Shipper Overview Moody’s S&P ï® Gulfport Energy Corporation (“Gulfport”) operates Corporate B2 B+ approximately 241,000 gross acres in the Utica Shale in Eastern Ohio with production of 1.05 Bcfed through 1H Outlook Stable Stable 2019ï® Actively looking to divestnon-core assets and currently S&P Commentary: August 20, 2019 running sell-side process for SCOOP water infrastructure assetsï® “The downgrade reflects weaker-than-anticipated financial measures due to the decline in Henry Hub natural gas Rockies Express Pipeline Firm Transportation Agreements price realizations, weak NGL pricing, and limited above-Average Remaining market hedges beyond 2019.” 19.1 years Term1 ï® “We could raise the rating if the company increases its proved developed reserves and production to levels more Active Contracts Three comparable with higher-rated peers or if FFO to debt Total Daily approaches 45% while maintaining at least adequate 325,000 Dth Transportation liquidity.” Gulfport Debt Prices Gulfport Acreage Map 100.00 95.00 90.00 85.00 80.00 79.44 75.00 70.00 65.00 63.00 60.00 61.40 55.00 59.00 50.00Jan-19Feb-19Mar-19May-19Jun-19Aug-19Sep-19Oct-19Dec-19 $350 MM 6.625% Senior Unsecured $630 MM 6.000% Senior Unsecured Legend Notes due 2023 Notes due 2024 $577 MM 6.375% Senior Unsecured $398 MM 6.375% Senior Unsecured Rockies Express Notes due 2025 Notes due 2026 Gulfport Acreage Source: FactSet, Moody’s, S&P, SNL and company filings Note: Market data as of December 13, 2019 1. Weighted by firm transportation volume (Dthd) 130
Preliminary Draft –Subject to Change Overview of Rockies Express Ultra Shipper Overview Moody’s S&P ï® Ultra Petroleum Corporation (“Ultra”) operates Corporate N/ACCC-approximately 69,000 net acres in and around the Pinedale and Jonah fields in Southwest Wyoming Outlook N/A Negative S&P Commentary: September 25, 2019 Rockies Express Pipeline Firm Transportation Agreements Average Remaining ï® “The negative outlook reflects our view of Ultra’s capital 7.0 years structure as unsustainable, and we believe the company Term may attempt additional debt exchanges or repurchases Active Contracts One over the next six months.” ï® “With production now set to decrease at base decline Total Daily rates, the company’s debt burden appears increasingly 200,000 Dth Transportation unsustainable with gross leverage projected at above 6x over the next two years under our commodity price assumptions.” Ultra Debt Prices 100.00 Ultra Acreage Map 80.00 60.00 40.00 20.00 15.13 9.00 7.00--Jan-19Feb-19Mar-19May-19Jun-19Aug-19Sep-19Oct-19Dec-19 $150 MM 6.875% Senior Unsecured $578 MM 9.000% Cash / 2.000% PIK Senior Notes due 2022 Secured 2L Notes due 2024 Legend $225 MM 7.125% Senior Unsecured Rockies Express Notes due 2025 Ultra Acreage Source: FactSet, Moody’s, S&P, SNL and company filings Note: Market data as of December 13, 2019 131
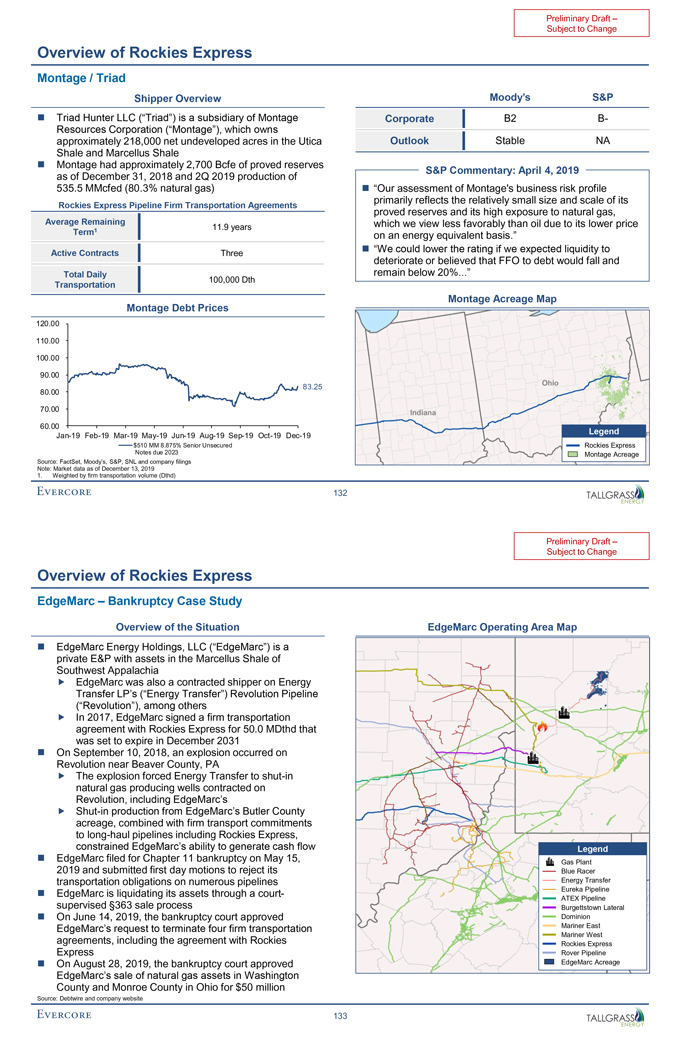
Preliminary Draft –Subject to Change Overview of Rockies Express Montage / Triad Shipper Overview Moody’s S&P ï® Triad Hunter LLC (“Triad”) is a subsidiary of Montage Corporate B2B-Resources Corporation (“Montage”), which owns approximately 218,000 net undeveloped acres in the Utica Outlook Stable NA Shale and Marcellus Shale ï® Montage had approximately 2,700 Bcfe of proved reserves S&P Commentary: April 4, 2019 as of December 31, 2018 and 2Q 2019 production of 535.5 MMcfed (80.3% natural gas)ï® “Our assessment of Montage’s business risk profile primarily reflects the relatively small size and scale of its Rockies Express Pipeline Firm Transportation Agreements proved reserves and its high exposure to natural gas, Average Remaining which we view less favorably than oil due to its lower price 11.9 years Term1 on an energy equivalent basis.” ï® “We could lower the rating if we expected liquidity to Active Contracts Three deteriorate or believed that FFO to debt would fall and Total Daily remain below 20%...” 100,000 Dth Transportation Montage Debt Prices Montage Acreage Map 120.00 110.00 100.00 90.00 83.25 80.00 70.00 60.00 LegendJan-19Feb-19Mar-19May-19Jun-19Aug-19Sep-19Oct-19Dec-19 $510 MM 8.875% Senior Unsecured Rockies Express Notes due 2023 Montage Acreage Source: FactSet, Moody’s, S&P, SNL and company filings Note: Market data as of December 13, 2019 1. Weighted by firm transportation volume (Dthd) 132
Preliminary Draft –Subject to Change Overview of Rockies Express EdgeMarc – Bankruptcy Case Study Overview of the Situation EdgeMarc Operating Area Map ï® EdgeMarc Energy Holdings, LLC (“EdgeMarc”) is a private E&P with assets in the Marcellus Shale of Southwest Appalachiaï,„ EdgeMarc was also a contracted shipper on Energy Transfer LP’s (“Energy Transfer”) Revolution Pipeline (“Revolution”), among others ï,„ In 2017, EdgeMarc signed a firm transportation agreement with Rockies Express for 50.0 MDthd that was set to expire in December 2031ï® On September 10, 2018, an explosion occurred on Revolution near Beaver County, PA ï,„ The explosion forced Energy Transfer toshut-in natural gas producing wells contracted on Revolution, including EdgeMarc’s ï,„Shut-in production from EdgeMarc’s Butler County acreage, combined with firm transport commitments to long-haul pipelines including Rockies Express, constrained EdgeMarc’s ability to generate cash flow Legend ï® EdgeMarc filed for Chapter 11 bankruptcy on May 15, Gas Plant 2019 and submitted first day motions to reject its Blue Racer transportation obligations on numerous pipelines Energy Transferï® EdgeMarc is liquidating its assets through a court- Eureka Pipeline ATEX Pipeline supervised §363 sale process Burgettstown Lateralï® On June 14, 2019, the bankruptcy court approved Dominion EdgeMarc’s request to terminate four firm transportation Mariner East Mariner West agreements, including the agreement with Rockies Rockies Express Express Rover Pipeline ï® On August 28, 2019, the bankruptcy court approved EdgeMarc Acreage EdgeMarc’s sale of natural gas assets in Washington County and Monroe County in Ohio for $50 million Source: Debtwire and company website 133

Preliminary Draft –Subject to Change Overview of Rockies Express REX Financial Projections – Assumptions ï® The REX Financial Projections as provided by TGE management and utilized herein by Evercore incorporate the following assumptions:ï,„ Contracted volumes and rates based on current and proposed customer contracts which include the following categories:(i) West-to-East and(ii) East-to-Westï,„West-to-East revenue includes the following assumptions: • ContractedWest-to-East transport volume totaling 944 MDthd at a weighted average tariff of $0.5595/Dth • Cheyenne Hub contracts totaling 600 MDthd at a weighted average tariff of $0.0410/Dth • Three five-month seasonal contracts with CenterPoint Energy, Inc. for 60 MDthd each year at a $0.4000/Dth tariff • Zone 1 short-haul transportation contracts totaling 80 MDthd at a weighted average tariff of $0.0500/Dth • Other contracted shippers transport volume totaling 133 MDthd at a $0.2928/Dth tariffï,„East-to-West revenue includes the following assumptions: • ContractedEast-to-West transport volume totaling 1,200 MDthd at a weighted average tariff of $0.5000/Dth • Contracted capacity enhancement projects totaling 750 MDthd at a weighted average tariff of $0.5028/Dth • Additional contracted capacity enhancement projects of 97 MDthd in 2020E at a weighted average tariff of $0.2913/Dth • Three successive Antero ResourcesEast-to-West contracts averaging from 400 to 600 MDthd at a $0.4167/Dth to $0.4500/Dth tariff beginning October 1, 2019 and ending January 19, 2035ï,„ Other revenue of $9.3 million in 2020E increasing to $9.9 million in 2023E ï,„ Operating leases of $29.1 million annually from 2020E through 2023E ï,„ Operating and maintenance expenses of $31.6 million in 2020E increasing to $33.5 million in 2023Eï,„ General and administrative expenses of $22.7 million annually from 2020E through 2023E ï,„ Tallgrass NatGas management fees of 1.0% of EBITDA before management fee decreasing from $6.1 million in 2020E and 2021E to $6.0 million in 2022E and 2023E ï,„ Ad valorem taxes of $85.9 million annually from 2020E through 2023Eï,„ Interest expense of $118.5 million annually from 2020E through 2023E ï,„ Maintenance capital expenditures of $15.9 million in 2020E increasing to $16.9 million in 2023E ï,„ Growth capital expenditures of approximately $40.0 million in 2020E related to additional compression horsepower at Cheyenne Hub Source: TGE management 134
Preliminary Draft –Subject to Change Overview of Rockies Express REX Financial Projections –West-to-East Volumes (MDthd) For the Years Ending December 31, 2020E 2021E 2022E 2023E ContractedWest-to-East Transport Volumes (MDthd) Encana Corporation 506 506 506 506 Ultra Petroleum Corporation 200 200 200 200 CenterPoint Energy, Inc. 15 -——-CenterPoint Energy, Inc. 10 15 -—-CenterPoint Energy, Inc. — 10 15 —Zone 1 Shorthaul Transport 80 80 80 80 Other Contracted Shippers 133 133 133 133 Subtotal 944 944 934 919 Cheyenne Hub Occidental Petroleum Corporation 300 300 300 300 DCP Midstream, LP 300 300 300 300 Subtotal 600 600 600 600 Source: TGE management 135
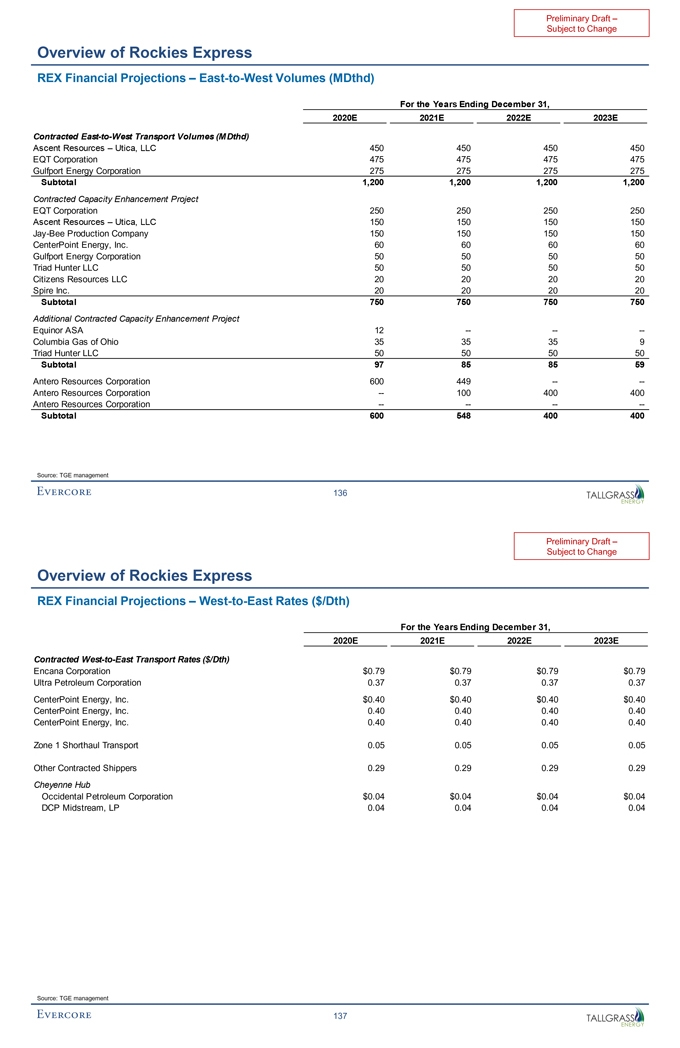
Preliminary Draft –Subject to Change Overview of Rockies Express REX Financial Projections –East-to-West Volumes (MDthd) For the Years Ending December 31, 2020E 2021E 2022E 2023E ContractedEast-to-West Transport Volumes (MDthd) Ascent Resources – Utica, LLC 450 450 450 450 EQT Corporation 475 475 475 475 Gulfport Energy Corporation 275 275 275 275 Subtotal 1,200 1,200 1,200 1,200 Contracted Capacity Enhancement Project EQT Corporation 250 250 250 250 Ascent Resources – Utica, LLC 150 150 150 150Jay-Bee Production Company 150 150 150 150 CenterPoint Energy, Inc. 60 60 60 60 Gulfport Energy Corporation 50 50 50 50 Triad Hunter LLC 50 50 50 50 Citizens Resources LLC 20 20 20 20 Spire Inc. 20 20 20 20 Subtotal 750 750 750 750 Additional Contracted Capacity Enhancement Project Equinor ASA 12 -——-Columbia Gas of Ohio 35 35 35 9 Triad Hunter LLC 50 50 50 50 Subtotal 97 85 85 59 Antero Resources Corporation 600 449 -—-Antero Resources Corporation — 100 400 400 Antero Resources Corporation -———- Subtotal 600 548 400 400 Source: TGE management 136
Preliminary Draft –Subject to Change Overview of Rockies Express REX Financial Projections –West-to-East Rates ($/Dth) For the Years Ending December 31, 2020E 2021E 2022E 2023E ContractedWest-to-East Transport Rates ($/Dth) Encana Corporation $0.79 $0.79 $0.79 $0.79 Ultra Petroleum Corporation 0.37 0.37 0.37 0.37 CenterPoint Energy, Inc. $0.40 $0.40 $0.40 $0.40 CenterPoint Energy, Inc. 0.40 0.40 0.40 0.40 CenterPoint Energy, Inc. 0.40 0.40 0.40 0.40 Zone 1 Shorthaul Transport 0.05 0.05 0.05 0.05 Other Contracted Shippers 0.29 0.29 0.29 0.29 Cheyenne Hub Occidental Petroleum Corporation $0.04 $0.04 $0.04 $0.04 DCP Midstream, LP 0.04 0.04 0.04 0.04 Source: TGE management 137
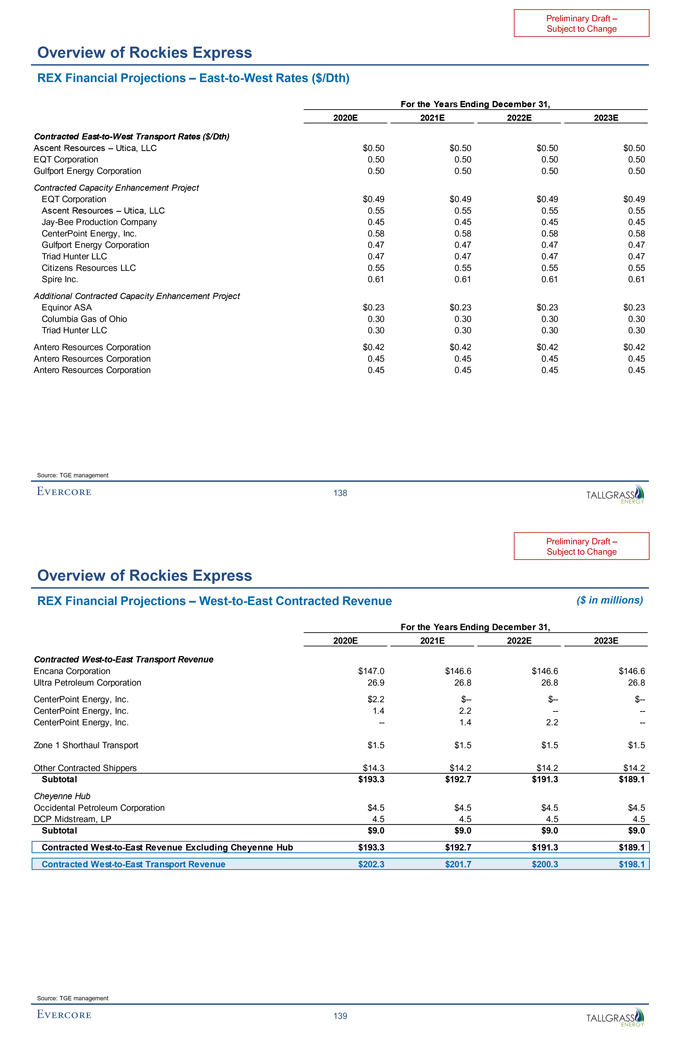
Preliminary Draft –Subject to Change Overview of Rockies Express REX Financial Projections –East-to-West Rates ($/Dth) For the Years Ending December 31, 2020E 2021E 2022E 2023E ContractedEast-to-West Transport Rates ($/Dth) Ascent Resources – Utica, LLC $0.50 $0.50 $0.50 $0.50 EQT Corporation 0.50 0.50 0.50 0.50 Gulfport Energy Corporation 0.50 0.50 0.50 0.50 Contracted Capacity Enhancement Project EQT Corporation $0.49 $0.49 $0.49 $0.49 Ascent Resources – Utica, LLC 0.55 0.55 0.55 0.55Jay-Bee Production Company 0.45 0.45 0.45 0.45 CenterPoint Energy, Inc. 0.58 0.58 0.58 0.58 Gulfport Energy Corporation 0.47 0.47 0.47 0.47 Triad Hunter LLC 0.47 0.47 0.47 0.47 Citizens Resources LLC 0.55 0.55 0.55 0.55 Spire Inc. 0.61 0.61 0.61 0.61 Additional Contracted Capacity Enhancement Project Equinor ASA $0.23 $0.23 $0.23 $0.23 Columbia Gas of Ohio 0.30 0.30 0.30 0.30 Triad Hunter LLC 0.30 0.30 0.30 0.30 Antero Resources Corporation $0.42 $0.42 $0.42 $0.42 Antero Resources Corporation 0.45 0.45 0.45 0.45 Antero Resources Corporation 0.45 0.45 0.45 0.45 Source: TGE management 138
Preliminary Draft –Subject to Change Overview of Rockies Express REX Financial Projections –West-to-East Contracted Revenue ($ in millions) For the Years Ending December 31, 2020E 2021E 2022E 2023E ContractedWest-to-East Transport Revenue Encana Corporation $147.0 $146.6 $146.6 $146.6 Ultra Petroleum Corporation 26.9 26.8 26.8 26.8 CenterPoint Energy, Inc. $2.2 $— $— $—CenterPoint Energy, Inc. 1.4 2.2 -—-CenterPoint Energy, Inc. — 1.4 2.2 — Zone 1 Shorthaul Transport $1.5 $1.5 $1.5 $1.5 Other Contracted Shippers $14.3 $14.2 $14.2 $14.2 Subtotal $193.3 $192.7 $191.3 $189.1 Cheyenne Hub Occidental Petroleum Corporation $4.5 $4.5 $4.5 $4.5 DCP Midstream, LP 4.5 4.5 4.5 4.5 Subtotal $9.0 $9.0 $9.0 $9.0 ContractedWest-to-East Revenue Excluding Cheyenne Hub $193.3 $192.7 $191.3 $189.1 ContractedWest-to-East Transport Revenue $202.3 $201.7 $200.3 $198.1 Source: TGE management 139
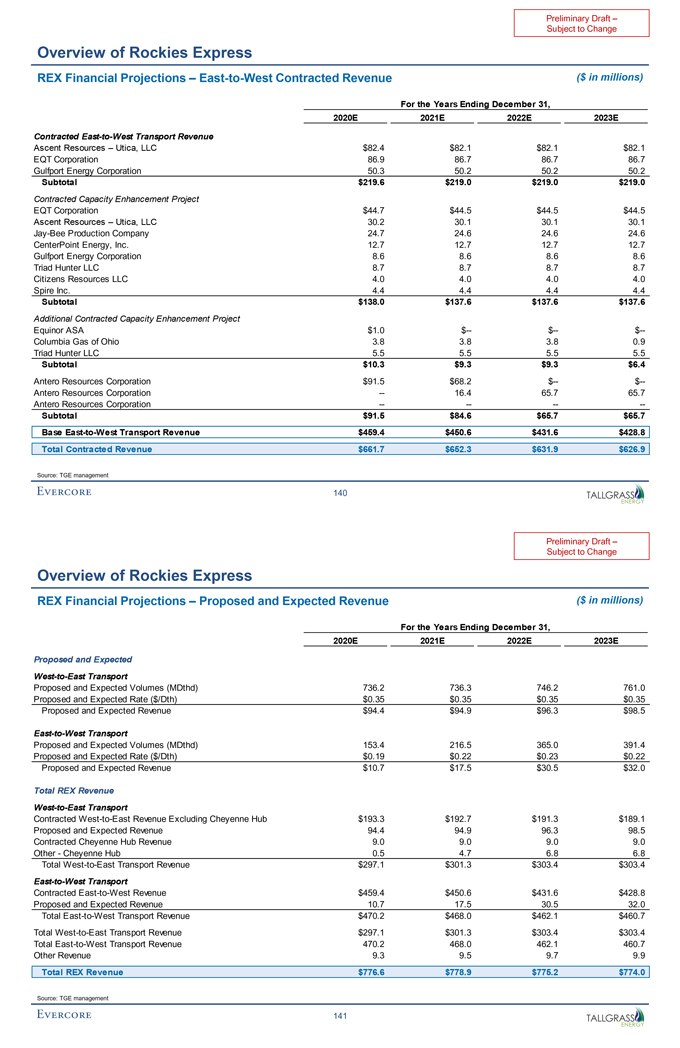
Preliminary Draft –Subject to Change Overview of Rockies Express REX Financial Projections –East-to-West Contracted Revenue ($ in millions) For the Years Ending December 31, 2020E 2021E 2022E 2023E ContractedEast-to-West Transport Revenue Ascent Resources – Utica, LLC $82.4 $82.1 $82.1 $82.1 EQT Corporation 86.9 86.7 86.7 86.7 Gulfport Energy Corporation 50.3 50.2 50.2 50.2 Subtotal $219.6 $219.0 $219.0 $219.0 Contracted Capacity Enhancement Project EQT Corporation $44.7 $44.5 $44.5 $44.5 Ascent Resources – Utica, LLC 30.2 30.1 30.1 30.1Jay-Bee Production Company 24.7 24.6 24.6 24.6 CenterPoint Energy, Inc. 12.7 12.7 12.7 12.7 Gulfport Energy Corporation 8.6 8.6 8.6 8.6 Triad Hunter LLC 8.7 8.7 8.7 8.7 Citizens Resources LLC 4.0 4.0 4.0 4.0 Spire Inc. 4.4 4.4 4.4 4.4 Subtotal $138.0 $137.6 $137.6 $137.6 Additional Contracted Capacity Enhancement Project Equinor ASA $1.0 $— $— $—Columbia Gas of Ohio 3.8 3.8 3.8 0.9 Triad Hunter LLC 5.5 5.5 5.5 5.5 Subtotal $10.3 $9.3 $9.3 $6.4 Antero Resources Corporation $91.5 $68.2 $— $—Antero Resources Corporation — 16.4 65.7 65.7 Antero Resources Corporation -———- Subtotal $91.5 $84.6 $65.7 $65.7 BaseEast-to-West Transport Revenue $459.4 $450.6 $431.6 $428.8 Total Contracted Revenue $661.7 $652.3 $631.9 $626.9 Source: TGE management 140
Subject to Change Overview of Rockies Express REX Financial Projections – Proposed and Expected Revenue ($ in millions) For the Years Ending December 31, 2020E 2021E 2022E 2023E Proposed and ExpectedWest-to-East Transport Proposed and Expected Volumes (MDthd) 736.2 736.3 746.2 761.0 Proposed and Expected Rate ($/Dth) $0.35 $0.35 $0.35 $0.35 Proposed and Expected Revenue $94.4 $94.9 $96.3 $98.5East-to-West Transport Proposed and Expected Volumes (MDthd) 153.4 216.5 365.0 391.4 Proposed and Expected Rate ($/Dth) $0.19 $0.22 $0.23 $0.22 Proposed and Expected Revenue $10.7 $17.5 $30.5 $32.0 Total REX RevenueWest-to-East Transport ContractedWest-to-East Revenue Excluding Cheyenne Hub $193.3 $192.7 $191.3 $189.1 Proposed and Expected Revenue 94.4 94.9 96.3 98.5 Contracted Cheyenne Hub Revenue 9.0 9.0 9.0 9.0 Other—Cheyenne Hub 0.5 4.7 6.8 6.8 TotalWest-to-East Transport Revenue $297.1 $301.3 $303.4 $303.4East-to-West Transport ContractedEast-to-West Revenue $459.4 $450.6 $431.6 $428.8 Proposed and Expected Revenue 10.7 17.5 30.5 32.0 TotalEast-to-West Transport Revenue $470.2 $468.0 $462.1 $460.7 TotalWest-to-East Transport Revenue $297.1 $301.3 $303.4 $303.4 TotalEast-to-West Transport Revenue 470.2 468.0 462.1 460.7 Other Revenue 9.3 9.5 9.7 9.9 Total REX Revenue $776.6 $778.9 $775.2 $774.0 Source: TGE management 141
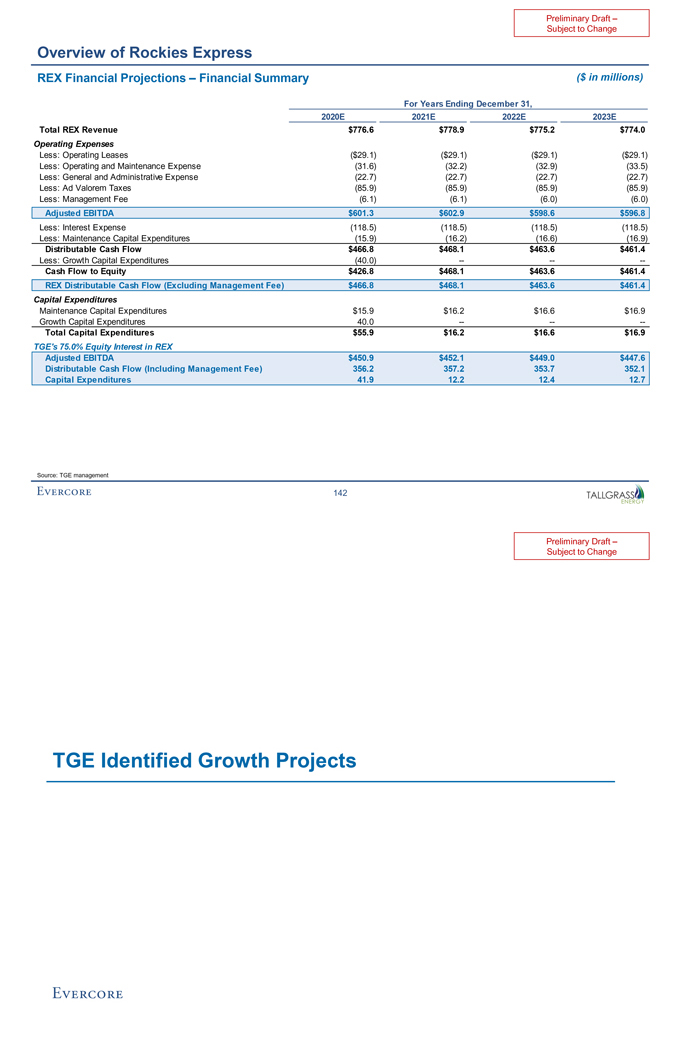
Preliminary Draft –Subject to Change Overview of Rockies Express REX Financial Projections – Financial Summary ($ in millions) For Years Ending December 31, 2020E 2021E 2022E 2023E Total REX Revenue $776.6 $778.9 $775.2 $774.0 Operating Expenses Less: Operating Leases ($29.1) ($29.1) ($29.1) ($29.1) Less: Operating and Maintenance Expense (31.6) (32.2) (32.9) (33.5) Less: General and Administrative Expense (22.7) (22.7) (22.7) (22.7) Less: Ad Valorem Taxes (85.9) (85.9) (85.9) (85.9) Less: Management Fee (6.1) (6.1) (6.0) (6.0) Adjusted EBITDA $601.3 $602.9 $598.6 $596.8 Less: Interest Expense (118.5) (118.5) (118.5) (118.5) Less: Maintenance Capital Expenditures (15.9) (16.2) (16.6) (16.9) Distributable Cash Flow $466.8 $468.1 $463.6 $461.4 Less: Growth Capital Expenditures (40.0) -——- Cash Flow to Equity $426.8 $468.1 $463.6 $461.4 REX Distributable Cash Flow (Excluding Management Fee) $466.8 $468.1 $463.6 $461.4 Capital Expenditures Maintenance Capital Expenditures $15.9 $16.2 $16.6 $16.9 Growth Capital Expenditures 40.0 -——- Total Capital Expenditures $55.9 $16.2 $16.6 $16.9 TGE’s 75.0% Equity Interest in REX Adjusted EBITDA $450.9 $452.1 $449.0 $447.6 Distributable Cash Flow (Including Management Fee) 356.2 357.2 353.7 352.1 Capital Expenditures 41.9 12.2 12.4 12.7 Source: TGE management 142
Preliminary Draft –Subject to Change TGE Identified Growth Projects
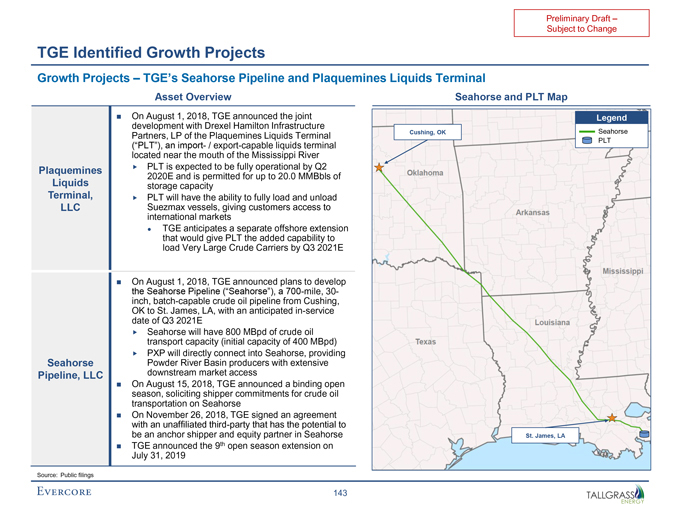
Preliminary Draft –Subject to Change TGE Identified Growth Projects Growth Projects – TGE’s Seahorse Pipeline and Plaquemines Liquids Terminal Asset Overview Seahorse and PLT Map ï® On August 1, 2018, TGE announced the joint Legend development with Drexel Hamilton Infrastructure Partners, LP of the Plaquemines Liquids Terminal Cushing, OK Seahorse PLT (“PLT”), an import- / export-capable liquids terminal located near the mouth of the Mississippi River Plaquemines ï,„ PLT is expected to be fully operational by Q2 2020E and is permitted for up to 20.0 MMBbls of Liquids storage capacity Terminal, ï,„ PLT will have the ability to fully load and unload LLC Suezmax vessels, giving customers access to international markets • TGE anticipates a separate offshore extension that would give PLT the added capability to load Very Large Crude Carriers by Q3 2021E ï® On August 1, 2018, TGE announced plans to develop the Seahorse Pipeline (“Seahorse”), a700-mile,30-inch, batch-capable crude oil pipeline from Cushing, OK to St. James, LA, with an anticipatedin-service date of Q3 2021E ï,„ Seahorse will have 800 MBpd of crude oil transport capacity (initial capacity of 400 MBpd)ï,„ PXP will directly connect into Seahorse, providing Seahorse Powder River Basin producers with extensive Pipeline, LLC downstream market accessï® On August 15, 2018, TGE announced a binding open season, soliciting shipper commitments for crude oil transportation on Seahorseï® On November 26, 2018, TGE signed an agreement with an unaffiliated third-party that has the potential to be an anchor shipper and equity partner in Seahorse St. James, LA ï® TGE announced the 9th open season extension on July 31, 2019 Source: Public filings 143