UNITED STATES
SECURITIES AND EXCHANGE COMMISSION
Washington, D.C. 20549
FORM N-CSR
CERTIFIED SHAREHOLDER REPORT OF REGISTERED
MANAGEMENT INVESTMENT COMPANIES
Investment Company Act file number: 811-23059
CLOUGH FUNDS TRUST
(Exact name of registrant as specified in charter)
1290 Broadway, Suite 1000, Denver, Colorado 80203
(Address of principal executive offices) (Zip code)
Sareena Khwaja-Dixon, Secretary
Clough Funds Trust
1290 Broadway, Suite 1000
Denver, CO 80203
(Name and address of agent for service)
Registrant’s telephone number, including area code: 855-425-6844
| Date of fiscal year end: | October 31 |
| | |
| Date of reporting period: | November 1, 2020 - October 31, 2021 |
| Item 1. | Report to Stockholders. |

| Clough Global Long/Short Fund | Table of Contents |
| Shareholder Letter | 2 |
| Portfolio Performance | 5 |
| Disclosure of Fund Expenses | 8 |
| Statement of Investments | 9 |
| Statement of Assets and Liabilities | 13 |
| Statement of Operations | 14 |
| Statements of Changes in Net Assets | 15 |
| Financial Highlights | 16 |
| Notes to Financial Statements | 20 |
| Report of Independent Registered Public Accounting Firm | 32 |
| Liquidity Risk Management Program | 33 |
| Additional Information | 34 |
| Trustees & Officers | 35 |
| Privacy Policy | 39 |
| Clough Global Long/Short Fund | Shareholder Letter |
| | October 31, 2021 (Unaudited) |
To Our Investors,
For the fiscal year ending October 31, 2021, the Clough Global Long/Short Fund (the “Fund”) had a total net return of 22.10% for Class I. The Fund’s benchmarks, the MSCI All Country World Index and the HFRI Equity Hedge (Total) Index, were up 37.88% and 29.25%, respectively, for the same period. See total returns chart for the performance of all other share classes.
The end of 2020 and the first ten months of 2021(fiscal year 2021) has seen the markets rally on economic re-opening momentum and then stall on fears of persistent inflation and rising interest rates all while dealing with multiple new COVID variants. Across the globe, government interference in the technology sector in China has raised investor concerns about the future of the world’s largest economy’s equity markets. We offer our thoughts on these two topics along with our view on the rise of the electronic vehicle sector below.
Information technology, financials and consumer sectors were the largest contributors to performance during fiscal 2021. Specifically, equity holdings in software, mortgage finance and electronic vehicles created positive returns for the Fund. Securities used to hedge the portfolio were the largest detractors to performance during the fiscal year. Short positions, index hedges, as well as longer duration U.S. Treasuries decreased returns the most during the year.
A Contrary View on Inflation
Supply interruptions, higher costs and slower demand as stimulus runs off are driving the consensus to expect a slower economy in 2022. And with private balance sheets so large, the recent rise in bond yields also points to slower growth in 2022. That begs the question whether the rise in prices is a one-time adjustment as we crawl out of pandemic-induced supply restrictions, or the beginning of a sustainable inflation pattern that continues in the years ahead?
If goods and labor shortages are pandemic-induced, that suggests the stagflation thesis, which calls for weak growth accompanied by uncontrollable price increases, is unlikely in our opinion. We have no historical economic precedent to make secular predictive judgments like this. Never before has the global economy been shut down for eighteen months, and no one has yet figured out how to get all of it back up.
Pricing power is usually temporary. Price increases in goods are coming from a scramble to build inventories in the face of bottlenecks on the production front which will ultimately be fixed. Durables spending is still running 30% above trend while income growth is slowing, and once spending slows and supplies become more available, price gains should be more difficult to sustain. The risk we see is that retailers may find themselves with excessive high-priced inventories in 2022 once deliveries pick up. That is possibly the reason the ten-year U.S. Treasury yield is struggling to get to 2%.
Capacity utilization is in the mid-70s and labor force participation is roughly in the 65-70% range, so the slack is there. Higher wages presumably will draw more workers back into the labor force. Meanwhile, China is restricting credit as real estate prices there are declining, likely bringing many globally traded commodities with them. COVID-19 cases are reportedly declining in Southeast Asia, perhaps easing the semiconductor supply crunch. The positive to all this is slower demand growth will give the U.S Federal Reserve (the “Fed”) room to slow the move to tapering. The sharp rise in deposits which translated into money growth did not come from credit creation but from income transfers, and that matters in our opinion. Meanwhile the dollar is strong and global savings continue to outpace investment, creating a sustainable flow of liquidity from the private sector in Japan, Europe, the U.S. and now China. This is a prescription for sustaining low interest rates over time and we believe is equity supportive.
We think the right strategy in current circumstances is to remain invested in equities and to balance the portfolio between growth, focused on technology and healthcare in 2022. We also see the shortages in housing as long lasting. The Fund continues to hold positions in home builders, mortgage finance and title insurers.
Electric Vehicles
We think one thing is certain about electric vehicles (“EVs”): production should increase substantially. Most estimates call for growth from about 2% of vehicles produced today to 25% by 2025 and 50% by 2030. That is 10x and 20x growth. It is likely vehicle models will proliferate, and charging stations will become more available and standardized. Virtually every developed country is incentivizing EV use and subsidizing investment.
While EV automobile manufacturers get the press coverage, we believe the investment opportunity may reside more along the supply chains. While the Fund holds Tesla Inc., largely because of the company’s scale and technology lead, our holdings also include two China-based companies, Contemporary Amperex Technology Co. Ltd. and BYD Co Ltd., both large battery manufacturers. Common estimates maintain that by 2030, perhaps 300-400 gigawatt hours of battery capacity will be required to support the EV fleet, but it is more likely that closer to 3 terawatts, or ten times that much battery power, will be required to power both the 30 million electric vehicles that will be on the road at that time plus the storage needs to support the part of the grid powered by solar. 75% of North American energy supply in the U.S. is scheduled to be provided by wind and solar by 2050, and the grid has to move wherever the power is produced.
| Clough Global Long/Short Fund | Shareholder Letter |
| | October 31, 2021 (Unaudited) |
Scale is everything and the power train is where the real intellectual property (“IP”) for EVs resides. Not only are Chinese manufacturers now dominant in the production of batteries used in Chinese built EVs but they are prepared to move into global markets. Scale determines not only unit costs, but also the miles per kilowatt hour the vehicles can produce. Should even 20 million EVs be produced by say 2025, and Tesla builds 20% of them, the number of vehicles produced by Tesla will be 4x its current capacity and it should be able to produce vehicles far below competitor costs. Even today, Tesla can price Model 3s in Singapore from its Shanghai plant at roughly the cost of a Toyota Corolla and can generate a more than 20% cash return on operating assets. Contemporary Amperex Technology is investing enough capital to reach sales capacity several times its current size by mid-decade. The company is also ensuring its supply chain to the point it has taken stakes in the critical mining companies which supply it and is building an integrated platform. The company grew revenues 131% and profits 130% year-over-year in the Q3 2021 and demand for the company’s lithium ion batteries could rise another 150% in the coming year.
While BYD Co. Ltd. has been manufacturing plug-in vehicles since 2012, and is the world’s largest producer of electric buses, its engineering leadership is in battery manufacturing. All of its vehicles are powered by the company’s homemade lithium-ion batteries. Lithium-ion batteries don’t go dead in cold weather and offer better mileage, and since these batteries are designed to use some of the most abundant materials in the world, like lithium, iron and phosphate rather than more limited materials like cobalt and nickel, the company should find it easier to scale. Wherever the materials are mined, they are shipped to China where 75% of lithium-ion batteries are made. That leaves most producers outside Asia far more limited in their ability to grow.
It is unclear to us what advantages legacy U.S. internal combustion automobile (“ICE”) manufacturers bring to the electric vehicle world and it is equally questionable how profitable their EVs will be. Ford Industries Inc. is expected to spend $11 billion along with SK Innovation Co Ltd. to build integrated complexes in Kentucky and Tennessee to build enough batteries to power one million EVs by 2025 according to an article in Barron’s. General Motors Co. is expected to spend $35 billion on EVs. But Tesla will have four automobile production plants in operation by late 2022 and is already producing 900,000 EVs annually today (Source: Company Reports). General Motors announced it will stop producing gasoline powered vehicles by 2035, so that suggests the company-owned IP related to the ICE world will lose value.
China
We have long had an interest in China, but American investors seem more perplexed about it than at any time in the past. Geopolitics between the two countries are tense and real estate activity, which generates about 20% of China’s output, is once again in turmoil led by the fallout from China Evergrande Group’s debt defaults. Evergrande is not a holding of the Fund. Overseas listings by Chinese companies have slowed to a crawl.
Yet trade between the two countries continues to grow and American financial firms are being welcomed. JPMorgan Chase & Co., Morgan Stanley and Goldman Sachs Group are all taking full ownership of what were once securities joint ventures with Chinese firms. BlackRock Inc. is now beginning the process of managing China’s vast and growing private wealth stock, something even the government realizes Chinese banks are ill-equipped to do. And the China internet stocks are cheap.
China’s policy has always aimed to reduce real estate leverage and the initiative that brought down Evergrande reflects the government’s desire for stability, even at the expense of profits. That suggests China’s housing market is too big to fail and government will intervene to avoid debt liquidation, and in our opinion the likelihood of any systemic collapse has a low probability. China’s 40% savings rate makes intervention and debt reduction quite doable. The government has already announced that Evergrande’s domestic investors will be paid off, including those customers who purchased unfinished apartments. That alone limits the likelihood of contagion. China has issued very few outstanding foreign bonds, and only huge global institutions like Blackrock Inc. own them.
But in all of this lays a larger question. Is China, under Xi Jinping’s nationalistic policy drives, taking the nation back to a Maoist socialistic economy? The policies he is pursuing seem heavy-handed and capricious. The search for a “common prosperity” can mean anything, including more than a reduction in social inequality to providing more support for workers and overstressed youngsters. Is the private economy in danger of being snuffed out? We don’t think so.
For one, we would argue China is more capitalistic than Europe. The private economy is responsible for its wealth and its jobs, and China could not reach its geopolitical targets without a vibrant private sector. Its local governments depend on private businesses, particularly developers, for almost all its revenues. For what it’s worth, China today has the lowest taxes in the developed world.
It is important the government continue to support development of the middle class, but that will be combined with attempts to promote self-reliance in technology and natural resources. It aims to reduce dependence on Western suppliers, which leave China vulnerable to trade restrictions.
| Annual Report | October 31, 2021 | 3 |
| Clough Global Long/Short Fund | Shareholder Letter |
| | October 31, 2021 (Unaudited) |
We expect a dramatic turn toward “buy China” in coming months and we think the breakout to new highs in the domestic Shanghai A-share market attest to that.
Our strategy is simple: go where the money goes. And it is now being used to bolster domestic Chinese companies. Two sectors stand out in our view: (1) as noted above, China will be responsible for building more than half the electric vehicles over the next decade and most of the supply chain will be developed there; China already accounts for 10% of new EV sales in Europe; and (2) we would argue China’s housing stock will always need investment, as much of China’s housing was built for a 20-year life and many of the cranes you see in city centers are to replace construction made 20-30 years ago.
The attack on American-listed initial public offerings (“IPOs”), particularly the Internet stocks, began when President Xi watched Twitter remove then-President Trump from its app, essentially cutting off the podium he used to address the American people. This was viewed by some as an unforgivable affront to an authoritative head of state and demonstrated how powerful the mega-cap technology platforms had become. China has resolved the matter and our sense is once whatever regulations China comes up with are resolved, the stocks will bottom. China is 100 years behind the U.S. in corporate regulatory efforts, but it will quickly catch up. That is the opportunity.
As always, please don’t hesitate to reach out to us with any questions or comments.
Sincerely,
 |  |
| Charles I. Clough, Jr. | Robert M. Zdunczyk |
| Clough Global Long/Short Fund | Portfolio Performance |
| | October 31, 2021 (Unaudited) |
Performance (as of October 31, 2021)
| | 6 Month | 1 Year | 3 Year | 5 Year | Since Inception(a) |
| Class I - NAV | 0.33% | 22.10% | 12.21% | 9.97% | 6.10% |
| Investor Class - NAV | 0.20% | 21.79% | 11.91% | 9.66% | 5.79% |
| Class A – NAV | 0.34% | 21.87% | 11.94% | 9.67% | 5.80% |
| Class A - MOP | -5.19% | 15.17% | 9.84% | 8.43% | 4.93% |
| Class C - NAV | -0.21% | 20.83% | 11.08% | 8.87% | 5.11% |
| Class C - CDSC | -1.21% | 19.83% | 11.08% | 8.87% | 5.11% |
| MSCI All Country World Index(b) | 7.24% | 37.86% | 18.06% | 15.31% | 11.52% |
| HFRI Equity Hedge (Total) Index(c) | 3.34% | 29.73% | 13.38% | 10.27% | 7.78% |
The performance data quoted represents past performance. Past performance does not guarantee future results and current performance may be lower or higher than the performance quoted. Investment return and principal value of an investment will fluctuate so that an investor's shares, when sold, may be worth more or less than the original cost. Performance reflects the deduction of management fees and other applicable expenses and includes reinvested distributions and capital gains. The Fund imposes a 2.00% redemption fee on shares held for less than 30 days. Performance shown does not reflect the redemption fee, which, if reflected, would reduce the performance quoted. For the most current month-end performance data please call 1-855-425-6844.
Maximum Offering Price (MOP) for Class A shares includes the Fund's maximum sales charge of 5.50%. Contingent Deferred Sales Charge (CDSC) performance for Class C shares includes a 1.00% CDSC on Class C shares redeemed within 12 months of purchase. Performance shown at Net Asset Value (NAV) does not include these sales charges.
| (a) | The performance data quoted for periods prior to October 1, 2015 is that of an unregistered investment fund (the “Predecessor Fund”) that was managed by Clough Capital Partners L.P. (the “Adviser” or “Clough Capital”) and was reorganized into the Fund as of the date the Fund commenced investment operations. The Predecessor Fund was not a registered mutual fund and therefore was not subject to the same investment and tax restrictions as the Fund. Performance information reflects all fees and expenses incurred by the Predecessor Fund and has not been adjusted to reflect Fund expenses. If it had been so adjusted, the Predecessor Fund's performance might have been higher or lower for a given period depending on the amount of such expenses incurred for any given period. Performance information for Investor Class, Class A and Class C have been adjusted to reflect 12b-1 fees and shareholder services fees, as applicable. The Predecessor Fund commenced operations on January 2, 2015. |
| (b) | The MSCI All Country World Index is a float-adjusted, capitalization weighted index that is designed to measure the equity market performance of the full opportunity set of large- and mid-cap stocks across 23 developed and 24 emerging markets. The index reflects the reinvestment of dividends. The MSCI information may only be used for your internal use, may not be reproduced or re-disseminated in any form and may not be used as a basis for or a component of any financial instruments or products or indices. None of the MSCI information is intended to constitute investment advice or a recommendation to make (or refrain from making) any kind of investment decision and may not be relied on as such. Historical data and analysis should not be taken as an indication or guarantee of any future performance analysis, forecast or prediction. The MSCI information is provided on an “as is” basis and the user of this information assumes the entire risk of any use made of this information. MSCI, each of its affiliates and each other person involved in or related to compiling, computing or creating any MSCI information (collectively, the “MSCI Parties”) expressly disclaim all warranties (including, without limitation, any warranties of originality, accuracy, completeness, timeliness, non-infringement, merchantability and fitness for a particular purpose) with respect to this information. Without limiting any of the foregoing, in no event shall any MSCI Party have any liability for any direct, indirect, special, incidental, punitive, consequential (including, without limitation, lost profits) or any other damages (www.msci.com). |
| (c) | The HFRI Equity Hedge (Total) Index is an index designed by Hedge Fund Research, Inc. to represent the performance of investment managers who maintain positions both long and short in primarily equity and equity derivative securities. The index reflects the reinvestment of dividends. A wide variety of investment processes can be employed by such managers to arrive at an investment decision, including both quantitative and fundamental techniques; strategies can be broadly diversified or narrowly focused on specific sectors and can range broadly in terms of levels of net exposure, leverage employed, holding period, concentrations of market capitalizations and valuation ranges of typical portfolios. The HFRI family of indices reserves the right to revise historical performance data for a period of up to four months following the as of date. The performance shown was calculated using current, available data at the time of publication, but is subject to change outside of the control of the Fund and its affiliates. |
Total returns for periods greater than one year are annualized.
The performance of the indices referenced herein is used for informational purposes only. One cannot invest directly in an index. Indices are not subject to any of the fees, allocations or expenses to which the Fund is subject, and there are significant differences between the Fund's investments and the components of the indices referenced herein.
| Annual Report | October 31, 2021 | 5 |
| Clough Global Long/Short Fund | Portfolio Allocation |
| | October 31, 2021 (Unaudited) |
Performance of $1,000,000 Initial Investment (as of October 31, 2021)
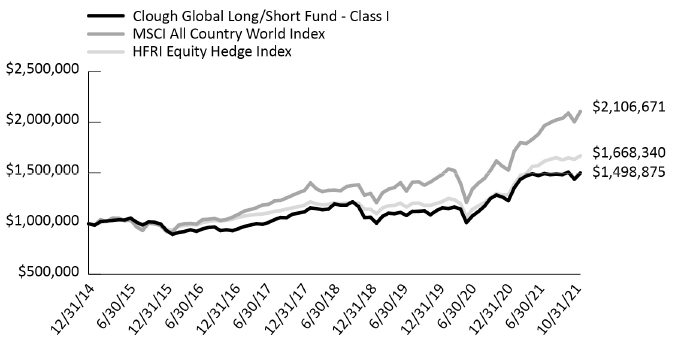
The graph shown above represents historical performance of a hypothetical investment of $1,000,000 in the Fund since inception. The historical performance prior to September 30, 2015 is that of the Predecessor Fund. Past performance does not guarantee future results. All returns reflect reinvested dividends, but do not reflect the deduction of taxes that a shareholder would pay on Fund distributions or the redemption of Fund shares.
| Top Ten Long Holdings (as a % of Net Assets)(a) | |
| Microsoft Corp. | 4.95% |
| Tesla, Inc. | 4.52% |
| Contemporary Amperex Technology Co., Ltd. | 3.99% |
| Amazon.com, Inc. | 3.83% |
| PennyMac Financial Services, Inc. | 3.04% |
| First American Financial Corp. | 2.81% |
| Fidelity National Financial, Inc. | 2.66% |
| BYD Co., Ltd. | 2.59% |
| Royal Caribbean Cruises Ltd. | 2.45% |
| TransDigm Group, Inc. | 2.41% |
| Top Ten Holdings | 33.25% |
| (a) | Holdings are subject to change without notice. Top Ten Long Holdings includes equity and equity-related securities only. The exposure figures include notional value of swaps. |
| Clough Global Long/Short Fund | Portfolio Allocation |
| | October 31, 2021 (Unaudited) |
| Sector Allocation (as a % of Net Assets)(a) | Long | Short | Gross | Net |
| Consumer Discretionary | 22.55% | -0.81% | 23.36% | 21.73% |
| Health Care | 16.14% | -2.35% | 18.49% | 13.79% |
| Financials | 14.46% | -1.95% | 16.41% | 12.52% |
| Fixed Income | 12.37% | 0.00% | 12.37% | 12.37% |
| Industrials | 9.91% | 0.00% | 9.91% | 9.91% |
| Information Technology | 15.26% | -5.47% | 20.73% | 9.79% |
| Communication Services | 3.99% | 0.00% | 3.99% | 3.99% |
| Energy | 1.78% | 0.00% | 1.78% | 1.78% |
| Hedges | 0.19% | 0.00% | 0.19% | 0.19% |
| Total Investments | 96.65% | -10.58% | 107.23% | 86.07% |
| Region Allocation (as a % of Net Assets)(a) | Long | Short | Gross | Net |
| United States | 58.14% | -1.34% | 59.48% | 56.80% |
| Multinational(b) | 22.93% | -5.15% | 28.08% | 17.78% |
| China | 7.44% | 0.00% | 7.44% | 7.44% |
| Europe | 4.88% | -1.95% | 6.83% | 2.93% |
| Other - Developed Markets | 2.11% | 0.00% | 2.11% | 2.11% |
| Other - Emerging Markets | 1.16% | -2.14% | 3.30% | -0.98% |
| Total Investments | 96.66% | -10.58% | 107.24% | 86.08% |
| (a) | Holdings are subject to change without notice. The exposure figures reported include the market value of futures, notional value of swaps and do not include cash holdings. |
| (b) | Multinational companies include those organized or located in the United States that have more than 50% of revenues derived outside of the United States. |
| Annual Report | October 31, 2021 | 7 |
| Clough Global Long/Short Fund | Disclosure of Fund Expenses |
| | October 31, 2021 (Unaudited) |
Examples. As a shareholder of the Clough Global Long/Short Fund (the “Fund”), you incur two types of costs: (1) transaction costs, including applicable redemption fees and sales charges (loads); and (2) ongoing costs, including management fees, distribution and service (12b-1) fees and other Fund expenses. The following examples are intended to help you understand your ongoing costs (in dollars) of investing in the Fund and to compare these costs with the ongoing costs of investing in other mutual funds. The examples are based on an investment of $1,000 invested on May 01, 2021 and held through October 31, 2021.
Actual Expenses. The first line of the table below provides information about actual account values and actual expenses. You may use the information in this line, together with the amount you invested, to estimate the expenses that you paid over the period. Simply divide your account value by $1,000 (for example, an $8,600 account value divided by $1,000 = 8.6), then multiply the result by the number in the first line under the heading “Expenses Paid During Period May 01, 2021 and held through October 31, 2021” to estimate the expenses you paid on your account during this period.
Hypothetical Example for Comparison Purposes. The second line of the table below provides information about hypothetical account values and hypothetical expenses based on the Fund’s actual expense ratio and an assumed rate of return of 5% per year before expenses, which is not the Fund’s actual return. The hypothetical account values and expenses may not be used to estimate the actual ending account balance or expenses you paid for the period. You may use this information to compare the ongoing costs of investing in the Fund and other mutual funds. To do so, compare this 5% hypothetical example with the 5% hypothetical examples that appear in the shareholder reports of the other mutual funds.
Please note that the expenses shown in the table are meant to highlight your ongoing Fund costs only and do not reflect any transactional costs, such as redemption fees. Therefore, the second line of the table below is useful in comparing ongoing costs only and may not help you determine the relative total costs of owning different funds. In addition, if these transactional costs were included, your costs would have been higher.
| | Beginning Account Value 05/01/21 | Ending Account Value 10/31/21 | Expense Ratio(a)(b) | Expenses Paid During period 05/01/21 - 10/31/21(c) |
| | | | | |
| Clough Global Long/Short Fund | | | | |
| Class I | | | | |
| Actual | $ 1,000.00 | $ 1,003.30 | 1.41% | $ 7.12 |
| Hypothetical (5% return before expenses) | $ 1,000.00 | $ 1,018.10 | 1.41% | $ 7.17 |
| Investor Class | | | | |
| Actual | $ 1,000.00 | $ 1,002.00 | 1.68% | $ 8.48 |
| Hypothetical (5% return before expenses) | $ 1,000.00 | $ 1,016.74 | 1.68% | $ 8.54 |
| Class A | | | | |
| Actual | $ 1,000.00 | $ 1,003.40 | 1.72% | $ 8.69 |
| Hypothetical (5% return before expenses) | $ 1,000.00 | $ 1,016.53 | 1.72% | $ 8.74 |
| Class C | | | | |
| Actual | $ 1,000.00 | $ 997.90 | 2.42% | $12.18 |
| Hypothetical (5% return before expenses) | $ 1,000.00 | $ 1,013.01 | 2.42% | $12.28 |
| (a) | Expense ratio excluding interest expense and dividends paid on borrowed securities for the Clough Global Long/Short Fund is 1.25%, 1.51%, 1.52%, and 2.25% for Class I, Investor Class, Class A, and Class C, respectively. |
| (b) | Annualized, based on the Fund's most recent fiscal half year expenses. |
| (c) | Expenses are equal to the Fund's annualized expense ratio multiplied by the average account value over the period, multiplied by the number of days in the most recent fiscal half-year 184/365 (to reflect the half-year period). |
| Clough Global Long/Short Fund | Statement of Investments |
| | October 31, 2021 |
| | | Shares | | | Value | |
| COMMON STOCKS 79.80% | | | | | | |
| Communication Services 3.99% | | | | | | |
| Alphabet, Inc. - Class C(a) | | | 293 | | | $ | 868,865 | |
| Sea, Ltd. - ADR(a) | | | 2,760 | | | | 948,253 | |
| ViacomCBS, Inc. - Class B | | | 28,100 | | | | 1,017,782 | |
| ZoomInfo Technologies, Inc.(a) | | | 6,300 | | | | 423,486 | |
| | | | | | | | 3,258,386 | |
| | | | | | | | | |
| Consumer Discretionary 22.55% | | | | | | | | |
| Amazon.com, Inc.(a)(b) | | | 927 | | | | 3,126,243 | |
| ANTA Sports Products, Ltd. | | | 45,000 | | | | 703,297 | |
| BYD Co., Ltd. - Class H | | | 55,500 | | | | 2,115,712 | |
| Carnival Corp.(a)(b) | | | 78,600 | | | | 1,741,776 | |
| Carvana Co.(a)(b) | | | 5,393 | | | | 1,635,050 | |
| DR Horton, Inc. | | | 20,600 | | | | 1,838,962 | |
| Lennar Corp. - Class A | | | 15,640 | | | | 1,562,905 | |
| Royal Caribbean Cruises Ltd.(a)(b) | | | 23,660 | | | | 1,997,614 | |
| Tesla, Inc.(a) | | | 3,310 | | | | 3,687,340 | |
| | | | | | | | 18,408,899 | |
| | | | | | | | | |
| Energy 1.78% | | | | | | | | |
| Exxon Mobil Corp. | | | 22,600 | | | | 1,457,022 | |
| | | | | | | | | |
| Financials 14.46% | | | | | | | | |
| Blackstone Secured Lending Fund(a) | | | 18,800 | | | | 545,200 | |
| Equitable Holdings, Inc.(b) | | | 42,200 | | | | 1,413,700 | |
| Fidelity National Financial, Inc. | | | 45,250 | | | | 2,167,928 | |
| First American Financial Corp.(b) | | | 31,330 | | | | 2,291,476 | |
| PennyMac Financial Services, Inc.(b) | | | 39,940 | | | | 2,478,676 | |
| Redwood Trust, Inc. | | | 121,200 | | | | 1,643,472 | |
| Walker & Dunlop, Inc. | | | 9,740 | | | | 1,266,882 | |
| | | | | | | | 11,807,334 | |
| | | | | | | | | |
| Health Care 16.06% | | | | | | | | |
| 1Life Healthcare, Inc.(a) | | | 16,100 | | | | 348,726 | |
| AbCellera Biologics, Inc.(a) | | | 35,500 | | | | 557,705 | |
| Acadia Healthcare Co., Inc.(a) | | | 7,280 | | | | 451,360 | |
| Apellis Pharmaceuticals, Inc.(a) | | | 6,000 | | | | 184,440 | |
| Arvinas, Inc.(a) | | | 3,800 | | | | 329,004 | |
| Brookdale Senior Living, Inc.(a)(b) | | | 79,800 | | | | 518,700 | |
| C4 Therapeutics, Inc.(a) | | | 14,400 | | | | 639,648 | |
| Checkmate Pharmaceuticals, Inc.(a) | | | 55,942 | | | | 210,901 | |
| Community Health Systems, Inc.(a) | | | 17,000 | | | | 222,700 | |
| CRISPR Therapeutics AG(a) | | | 4,721 | | | | 431,169 | |
| Hologic, Inc.(a) | | | 7,740 | | | | 567,419 | |
| iRhythm Technologies, Inc.(a) | | | 7,300 | | | | 512,022 | |
| Jazz Pharmaceuticals PLC(a) | | | 5,430 | | | | 722,407 | |
| Johnson & Johnson | | | 6,010 | | | | 978,909 | |
| Kymera Therapeutics, Inc.(a) | | | 10,687 | | | | 629,251 | |
| McKesson Corp. | | | 6,128 | | | | 1,273,889 | |
| Merck & Co., Inc. | | | 9,500 | | | | 836,475 | |
| Nurix Therapeutics, Inc.(a) | | | 19,300 | | | | 645,585 | |
| Pfizer, Inc. | | | 17,120 | | | | 748,829 | |
| Regeneron Pharmaceuticals, Inc.(a) | | | 920 | | | | 588,745 | |
| | | Shares | | | Value | |
| Health Care (continued) | | | | | | |
| Thermo Fisher Scientific, Inc. | | | 563 | | | $ | 356,418 | |
| Veracyte, Inc.(a) | | | 14,170 | | | | 678,460 | |
| Vertex Pharmaceuticals, Inc.(a) | | | 2,123 | | | | 392,606 | |
| Zoetis, Inc. | | | 1,314 | | | | 284,087 | |
| | | | | | | | 13,109,455 | |
| | | | | | | | | |
| Industrials 5.70% | | | | | | | | |
| Airbus SE(a) | | | 5,804 | | | | 742,064 | |
| The Boeing Co.(a) | | | 5,990 | | | | 1,240,109 | |
| Raytheon Technologies Corp. | | | 7,900 | | | | 701,994 | |
| TransDigm Group, Inc.(a)(b) | | | 3,157 | | | | 1,969,400 | |
| | | | | | | | 4,653,567 | |
| | | | | | | | | |
| Information Technology 15.26% | | | | | | | | |
| Bill.com Holdings, Inc.(a) | | | 2,800 | | | | 824,068 | |
| Cisco Systems, Inc. | | | 24,100 | | | | 1,348,877 | |
| Crowdstrike Holdings, Inc. - Class A(a) | | | 3,240 | | | | 913,032 | |
| Dynatrace, Inc.(a) | | | 10,300 | | | | 772,500 | |
| Five9, Inc.(a) | | | 4,960 | | | | 783,730 | |
| HubSpot, Inc.(a) | | | 1,020 | | | | 826,435 | |
| Microsoft Corp.(b) | | | 12,190 | | | | 4,042,448 | |
| Paycom Software, Inc.(a) | | | 1,650 | | | | 903,952 | |
| ServiceNow, Inc.(a) | | | 1,965 | | | | 1,371,098 | |
| Shopify, Inc. - Class A(a) | | | 460 | | | | 674,696 | |
| | | | | | | | 12,460,836 | |
| | | | | | | | | |
| TOTAL COMMON STOCKS | | | | | | | | |
| (Cost $55,634,809) | | | | | | | 65,155,499 | |
| | | | | | | | | |
| WARRANTS 0.23%(a) | | | | | | | | |
| | | | | | | | | |
| Hertz Global Holdings, Inc., Strike Price $13.80, Expires 6/30/2051 | | | 10,685 | | | | 183,568 | |
| | | | | | | | | |
| TOTAL WARRANTS | | | | | | | | |
| (Cost $169,261) | | | | | | | 183,568 | |
Underlying Security/Expiration Date/
Exercise Price/Notional Amount | | Contracts | | | Value | |
| PURCHASED OPTIONS 0.09% | | | | | | |
| Call Options Purchased 0.09% | | | | | | |
| Eurodollar Future Option | | | | | | |
| 12/14/21, $100, $116,011,688 | | | 465 | | | | 2,906 | |
| 12/14/21, $99.875, $174,641,250 | | | 700 | | | | 4,375 | |
| Jazz Pharmaceuticals PLC | | | | | | | | |
| 12/17/21, $125, $665,200 | | | 50 | | | | 65,750 | |
| | | | | | | | | |
| Total Call Options Purchased | | | | | | | | |
| (Cost $415,800) | | | | | | | 73,031 | |
| See Notes to the Financial Statements. | |
| Annual Report | October 31, 2021 | 9 |
| Clough Global Long/Short Fund | Statement of Investments |
| | October 31, 2021 |
| Description/Maturity Date/Rate | | Principal Amount | | | Value | |
| CORPORATE BONDS 10.81% | | | | | | |
| Communication Services | | | | | | |
| Alphabet, Inc. | | | | | | | | |
| 08/15/2060, 2.250% | | $ | 1,000,000 | | | $ | 899,611 | |
| British Telecommunications PLC | | | | | | | | |
| 11/08/2049, 4.250%(c) | | | 500,000 | | | | 557,176 | |
| Electronic Arts, Inc. | | | | | | | | |
| 02/15/2051, 2.950% | | | 1,100,000 | | | | 1,074,458 | |
| | | | | | | | 2,531,245 | |
| | | | | | | | | |
| Consumer Staples | | | | | | | | |
| Nestle Holdings, Inc. | | | | | | | | |
| 09/24/2048, 4.000%(c) | | | 750,000 | | | | 943,772 | |
| | | | | | | | | |
| Financials | | | | | | | | |
| JPMorgan Chase & Co. | | | | | | | | |
| 11/19/2041, 1D US SOFR + 1.510%(d) | | | 500,000 | | | | 475,529 | |
| Novartis Capital Corp. | | | | | | | | |
| 09/21/2042, 3.700% | | | 600,000 | | | | 695,414 | |
| Royal Bank of Canada | | | | | | | | |
| 04/27/2026, 1.200% | | | 500,000 | | | | 493,071 | |
| | | | | | | | 1,664,014 | |
| | | | | | | | | |
| Health Care | | | | | | | | |
| Johnson & Johnson | | | | | | | | |
| 09/01/2050, 2.250% | | | 1,000,000 | | | | 960,527 | |
| Roche Holdings, Inc. | | | | | | | | |
| 11/28/2044, 4.000%(c) | | | 500,000 | | | | 613,216 | |
| | | | | | | | 1,573,743 | |
| | | | | | | | | |
| Information Technology | | | | | | | | |
| Microsoft Corp. | | | | | | | | |
| 06/01/2050, 2.525% | | | 1,000,000 | | | | 985,450 | |
| Oracle Corp. | | | | | | | | |
| 04/01/2030, 2.950% | | | 600,000 | | | | 622,349 | |
| Texas Instruments, Inc. | | | | | | | | |
| 09/15/2051, 2.700% | | | 500,000 | | | | 508,498 | |
| | | | | | | | 2,116,297 | |
| | | | | | | | | |
| TOTAL CORPORATE BONDS | | | | | | | | |
| (Cost $8,905,106) | | | | | | | 8,829,071 | |
| | | | | | | | | |
| CONVERTIBLE CORPORATE BONDS 1.56% | | | | | | | | |
| Financials | | | | | | | | |
| Redwood Trust, Inc. | | | | | | | | |
| 08/15/2023, 4.750% | | | 278,000 | | | | 284,950 | |
| Description/Maturity Date/Rate | | Principal Amount | | | Value | |
| CONVERTIBLE CORPORATE BONDS (continued) | | | | | | |
| Starwood Property Trust, Inc. | | | | | | |
| 04/01/2023, 4.375% | | $ | 923,000 | | | $ | 989,364 | |
| | | | | | | | 1,274,314 | |
| | | | | | | | | |
| TOTAL CONVERTIBLE CORPORATE BONDS | | | | | | | | |
| (Cost $1,205,683) | | | | | | | 1,274,314 | |
| | | Shares | | | Value | |
| SHORT-TERM INVESTMENTS 7.59% | | | | | | |
| Money Market Funds 7.59% | | | | | | |
BlackRock Liquidity Funds, T-Fund Portfolio - Institutional Class
(0.010% 7-day yield) | | | 6,199,677 | | | | 6,199,677 | |
| | | | | | | | 6,199,677 | |
| | | | | | | | | |
| TOTAL SHORT-TERM INVESTMENTS | | | | | | | | |
| (Cost $6,199,677) | | | | | | | 6,199,677 | |
| | | | | | | | | |
| Total Investments - 100.08% | | | | | | | | |
| (Cost $72,530,336) | | | | | | | 81,715,160 | |
| | | | | | | | | |
| Liabilities in Excess of Other Assets - (0.08%)(e) | | | | | | | (65,118 | ) |
| | | | | | | | | |
| NET ASSETS - 100.00% | | | | | | $ | 81,650,042 | |
| SCHEDULE OF SECURITIES SOLD SHORT | | Shares | | | Value | |
| COMMON STOCKS (6.53%) | | | | | | |
| Consumer Discretionary (0.81%) | | | | | | |
| Wynn Resorts, Ltd.(a) | | | (7,400 | ) | | | (664,520 | ) |
| | | | | | | | | |
| Financials (1.50%) | | | | | | | | |
| Mediobanca Banca di Credito Finanziario SpA(a) | | | (32,270 | ) | | | (384,793 | ) |
| Societe Generale S.A.(a) | | | (12,786 | ) | | | (426,200 | ) |
| UniCredit SpA(a) | | | (31,107 | ) | | | (410,804 | ) |
| | | | | | | | (1,221,797 | ) |
| | | | | | | | | |
| Health Care (0.89%) | | | | | | | | |
| AbbVie, Inc.(a) | | | (6,370 | ) | | | (730,448 | ) |
| | | | | | | | | |
| Information Technology (3.33%) | | | | | | | | |
| Atlassian Corp. PLC(a) | | | (900 | ) | | | (412,317 | ) |
| International Business Machines Corp. | | | (12,200 | ) | | | (1,526,220 | ) |
| MongoDB, Inc.(a) | | | (700 | ) | | | (364,903 | ) |
| See Notes to the Financial Statements. | |
| 10 | www.cloughglobal.com |
| Clough Global Long/Short Fund | Statement of Investments |
| | October 31, 2021 |
| SCHEDULE OF SECURITIES SOLD SHORT (continued) | | Shares | | | Value | |
| Information Technology (continued) | | | | | | |
| Zscaler, Inc.(a) | | | (1,300 | ) | | $ | (414,518 | ) |
| | | | | | | | (2,717,958 | ) |
| | | | | | | | | |
| TOTAL COMMON STOCKS | | | | | | | | |
| (Proceeds $5,202,376) | | | | | | | (5,334,723 | ) |
| | | | | | | | | |
| EXCHANGE TRADED FUNDS (1.46%) | | | | | | | | |
| SPDR S&P® Biotech ETF(a) | | | (9,520 | ) | | | (1,188,191 | ) |
| | | | | | | | | |
| TOTAL EXCHANGE TRADED FUNDS | | | | | | | | |
| (Proceeds $1,257,004) | | | | | | | (1,188,191 | ) |
| | | | | | | | | |
| TOTAL SECURITIES SOLD SHORT | | | | | | | | |
| (Proceeds $6,459,380) | | | | | | $ | (6,522,914 | ) |
| (a) | Non-income producing security. |
| (b) | Pledged security; a portion or all of the security is pledged as collateral for securities sold short, total return swap contracts, future contracts or borrowings. As of October 31, 2021, the aggregate market value of those securities was $8,015,155, representing 9.82% of net assets. (See Note 1) |
| (c) | Security is exempt from registration of the Securities Act of 1933. These securities may be resold in transactions exempt from registration under Rule 144A, normally to qualified institutional buyers. As of October 31, 2021, these securities had an aggregate value of $2,114,164 or 2.59% of net assets. |
| (d) | Variable rate investment. Interest rates reset periodically. Interest rate shown reflects the rate in effect at October 31, 2021. For securities based on a published reference rate and spread, the reference rate and spread are indicated in the description above. |
| (e) | Includes cash which is being held as collateral for futures contracts, total return swap contracts and securities sold short. |
Investment Abbreviations:
SOFR - Secured Overnight Financing Rate
SOFR Rates:
1D US SOFR - 1 Day US SOFR as of October 31, 2021 was 0.05%
| See Notes to the Financial Statements. | |
| Annual Report | October 31, 2021 | 11 |
| Clough Global Long/Short Fund | Statement of Investments |
| | October 31, 2021 |
FUTURES CONTRACTS
| Description | | Counterparty | | Position | | Contracts | | | Expiration Date | | Notional Value | | | Value | | | Unrealized Appreciation/ (Depreciation) | |
| WTI CRUDE FUTURE | | Morgan Stanley | | Long | | | 12 | | | February 2022 | | $ | 959,760 | | | $ | 149,470 | | | $ | 149,470 | |
TOTAL RETURN SWAP CONTRACTS
| Counter Party | | Reference Entity/Obligation | | Notional Amount | | | Floating Rate Paid by the Fund* | | Floating Rate Index | | Termination Date | | Value | | | Net Unrealized Appreciation | |
| Morgan Stanley | | Contemporary Amperex Technology Co., Ltd. | | $ | 2,676,777 | | | 1D FEDEF - 250 bps | | 1D FEDEF | | 1/3/2022 | | $ | 3,256,383 | | | $ | 579,606 | |
| Morgan Stanley | | Innolux Corp. | | | (894,623 | ) | | 1D FEDEF - 1000 bps | | 1D FEDEF | | 8/17/2023 | | | (835,346 | ) | | | 59,277 | |
| Morgan Stanley | | Banco Santander SA | | | (374,952 | ) | | 1D FEDEF - 50 bps | | 1D FEDEF | | 6/22/2023 | | | (366,647 | ) | | | 8,305 | |
| | | | | $ | 1,407,202 | | | | | | | | | $ | 2,054,390 | | | $ | 647,188 | |
| Counter Party | | Reference Entity/Obligation | | Notional Amount | | | Floating Rate Paid by the Fund* | | Floating Rate Index | | Termination Date | | Value | | | Net Unrealized Depreciation | |
| Morgan Stanley | | Optronic Corp. | | $ | (840,607 | ) | | 1D FEDEF - 1275 bps | | 1D FEDEF | | 8/17/2023 | | $ | (911,375 | ) | | $ | (70,768 | ) |
| TOTAL | | | | $ | 566,595 | | | | | | | | | $ | 1,143,016 | | | $ | 576,420 | |
| * | Payment made when swap contract closes. |
Investment Abbreviations:
FEDEF - Federal Funds Effective Rate
FEDEF Rates:
1D FEDEF - 1 Day FEDEF as of October 31, 2021 was 0.07%
For Fund compliance purposes, the Fund’s sector classifications refer to any one of the sector sub-classifications used by one or more widely recognized market indexes, and/or as defined by Fund management. This definition may not apply for purposes of this report, which may combine sector sub-classifications for reporting ease. Sectors are shown as a percent of net assets. These sector classifications are unaudited.
| See Notes to the Financial Statements. | |
| 12 | www.cloughglobal.com |
| Clough Global Long/Short Fund | Statement of Assets and Liabilities |
| | October 31, 2021 |
| ASSETS: | | | |
| | | | |
| Investments, at value (Cost - see below) | | $ | 81,715,160 | |
| Variation margin receivable for futures contracts | | | 143,787 | |
| Deposit with broker for futures contracts | | | 149,525 | |
| Deposit with broker for securities sold short | | | 3,532,952 | |
| Deposit with broker for total return swap contracts | | | 3,267,294 | |
| Deposit with broker for written options | | | 237,914 | |
| Unrealized appreciation on total return swap contracts | | | 647,188 | |
| Dividends receivable | | | 1,385 | |
| Interest receivable | | | 60,817 | |
| Receivable for investments sold | | | 1,065,841 | |
| Receivable for shares sold | | | 188 | |
| Other assets | | | 30,174 | |
| Due from Adviser | | | 26,201 | |
| Total Assets | | | 90,878,426 | |
| | | | | |
| LIABILITIES: | | | | |
| | | | | |
| Foreign currency due to custodian (Cost $426,934) | | | 426,934 | |
| Securities sold short (Proceeds $6,459,380) | | | 6,522,914 | |
| Payable for investments purchased | | | 1,928,613 | |
| Payable for shares redeemed | | | 69,755 | |
| Unrealized depreciation on total return swap contracts | | | 70,768 | |
| Payable for total return swap contracts payments | | | 21,371 | |
| Dividends payable - short sales | | | 8,281 | |
| Accrued distribution and service fees | | | 3,771 | |
| Accrued legal expense | | | 48,064 | |
| Accrued administration fee | | | 26,769 | |
| Other payables and accrued expenses | | | 101,144 | |
| Total Liabilities | | | 9,228,384 | |
| Net Assets | | $ | 81,650,042 | |
| Cost of Investments | | $ | 72,530,336 | |
| | | | | |
| COMPOSITION OF NET ASSETS: | | | | |
| | | | | |
| Paid-in capital | | $ | 64,017,449 | |
| Distributable Earnings | | | 17,632,593 | |
| Net Assets | | $ | 81,650,042 | |
| PRICING OF CLASS I SHARES: | | | | |
| Net Assets | | $ | 77,266,682 | |
| Shares outstanding of no par value, unlimited shares authorized | | | 5,134,845 | |
| Net Asset Value, offering and redemption price per share | | $ | 15.05 | |
| PRICING OF INVESTOR CLASS SHARES: | | | | |
| Net Assets | | $ | 3,006,903 | |
| Shares outstanding of no par value, unlimited shares authorized | | | 203,159 | |
| Net Asset Value, offering and redemption price per share | | $ | 14.80 | |
| PRICING OF CLASS A SHARES: | | | | |
| Net Assets | | $ | 290,993 | |
| Shares outstanding of no par value, unlimited shares authorized | | | 19,652 | |
| Net Asset Value, offering and redemption price per share | | $ | 14.81 | |
| Maximum offering price per share (NAV/0.945), based on maximum sales charge of 5.50% of the offering price | | $ | 15.67 | |
| PRICING OF CLASS C SHARES: | | | | |
| Net Assets | | $ | 1,085,464 | |
| Shares outstanding of no par value, unlimited shares authorized | | | 76,211 | |
| Net Asset Value, offering and redemption price per share | | $ | 14.24 | |
| See Notes to the Financial Statements. | |
| Annual Report | October 31, 2021 | 13 |
| Clough Global Long/Short Fund | Statement of Operations |
| | For the year ended October 31, 2021 |
| INVESTMENT INCOME: | | | |
| | | | |
| Dividends (net of foreign withholding taxes of $20,177) | | $ | 654,415 | |
| Interest Income | | | 171,667 | |
| Total Income | | | 826,082 | |
| | | | | |
| EXPENSES: | | | | |
| | | | | |
| Investment advisory fees | | | 844,702 | |
| Distribution and shareholder service fees: | | | | |
| Investor Class | | | 7,697 | |
| Class A | | | 6,864 | |
| Class C | | | 12,705 | |
| Administration fees | | | 132,336 | |
| Trustees fees | | | 100,334 | |
| Registration fees | | | 72,026 | |
| Dividend expense - short sales | | | 91,650 | |
| Custodian fees | | | 58,904 | |
| Audit & Tax Services fees | | | 43,000 | |
| Legal fees | | | 163,040 | |
| Printing fees | | | 10,514 | |
| Insurance fees | | | 27,057 | |
| Transfer agent fees | | | 32,084 | |
| Delegated transfer agent fees: | | | | |
| Class I | | | 7,935 | |
| Investor Class | | | 3 | |
| Class C | | | 124 | |
| Other expenses | | | 23,868 | |
| Total Expenses Before Waivers and/or Reimbursements | | | 1,634,843 | |
| Less fees waived and/or reimbursed by Adviser: | | | | |
| Class I | | | (507,841 | ) |
| Investor Class | | | (21,197 | ) |
| Class A | | | (17,173 | ) |
| Class C | | | (9,021 | ) |
| Net Expenses | | | 1,079,611 | |
| Net Investment Loss | | | (253,529 | ) |
| | | | | |
| NET REALIZED GAIN/(LOSS) ON: | | | | |
| Investment securities | | | 10,719,433 | |
| Futures contracts | | | 818,795 | |
| Securities sold short | | | (2,222,562 | ) |
| Written options | | | 464,193 | |
| Total return swap contracts | | | 1,086,328 | |
| Foreign currency transactions | | | (16,639 | ) |
| Net realized gain | | | 10,849,548 | |
| NET CHANGE IN UNREALIZED APPRECIATION/(DEPRECIATION) ON: | | | | |
| Investment securities | | | 3,351,322 | |
| Futures contracts | | | (591,935 | ) |
| Securities sold short | | | (724,658 | ) |
| Total return swap contracts | | | 58,172 | |
| Translation of assets and liabilities denominated in foreign currencies | | | 238 | |
| Net change in unrealized appreciation | | | 2,093,139 | |
| Net realized and unrealized gain | | | 12,942,687 | |
| Net Increase in Net Assets from Operations | | $ | 12,689,158 | |
| See Notes to the Financial Statements. | |
| 14 | www.cloughglobal.com |
| Clough Global Long/Short Fund | Statements of Changes in Net Assets |
| | | For the Year Ended October 31, 2021 | | | For the Year Ended October 31, 2020 | |
| | | | | | | |
| OPERATIONS: | | | | | | |
| | | | | | | |
| Net investment income/(loss) | | $ | (253,529 | ) | | $ | 117,175 | |
| Net realized gain | | | 10,849,548 | | | | 2,442,649 | |
| Net change in unrealized appreciation/(depreciation) | | | 2,093,139 | | | | 1,180,905 | |
| Net Increase in Net Assets From Operations | | | 12,689,158 | | | | 3,740,729 | |
| | | | | | | | | |
| DISTRIBUTIONS TO COMMON SHAREHOLDERS: | | | | | | | | |
| From distributable earnings | | | | | | | | |
| Class I | | | (262,953 | ) | | | – | |
| Investor Class | | | (10,971 | ) | | | – | |
| Class A | | | (20,697 | ) | | | – | |
| Class C | | | (3,658 | ) | | | – | |
| Net Decrease in Net Assets from Distributions | | | (298,279 | ) | | | – | |
| | | | | | | | | |
| CAPITAL SHARE TRANSACTIONS: | | | | | | | | |
| Class I | | | | | | | | |
| Proceeds from shares sold | | | 41,686,463 | | | | 10,824,361 | |
| Reinvestment of distributions to shareholders | | | 132,610 | | | | – | |
| Payments for shares redeemed | | | (24,318,092 | ) | | | (9,378,901 | ) |
| Net Increase in Net Assets From Class I Capital Share Transactions | | | 17,500,981 | | | | 1,445,460 | |
| | | | | | | | | |
| Investor Class | | | | | | | | |
| Proceeds from shares sold | | | 943,017 | | | | 233,084 | |
| Reinvestment of distributions to shareholders | | | 10,971 | | | | – | |
| Payments for shares redeemed | | | (1,065,214 | ) | | | (238,615 | ) |
| Net Decrease in Net Assets From Investor Class Capital Share Transactions | | | (111,226 | ) | | | (5,531 | ) |
| | | | | | | | | |
| Class A | | | | | | | | |
| Proceeds from shares sold | | | 67,961 | | | | 1,530,240 | |
| Reinvestment of distributions to shareholders | | | 20,617 | | | | – | |
| Payments for shares redeemed, net of redemption fees | | | (5,196,635 | ) | | | – | |
| Net Increase/(Decrease) in Net Assets From Class A Capital Share Transactions | | | (5,108,057 | ) | | | 1,530,240 | |
| | | | | | | | | |
| Class C | | | | | | | | |
| Proceeds from shares sold | | | 114,132 | | | | 60,594 | |
| Reinvestment of distributions to shareholders | | | 3,658 | | | | – | |
| Payments for shares redeemed | | | (302,078 | ) | | | (864,535 | ) |
| Net Decrease in Net Assets From Class C Capital Share Transactions | | | (184,288 | ) | | | (803,941 | ) |
| | | | | | | | | |
| Total Increase in Net Assets | | $ | 24,488,289 | | | $ | 5,906,957 | |
| | | | | | | | | |
| NET ASSETS: | | | | | | | | |
| Beginning of period | | | 57,161,753 | | | | 51,254,796 | |
| End of period | | $ | 81,650,042 | | | $ | 57,161,753 | |
| See Notes to the Financial Statements. | |
| Annual Report | October 31, 2021 | 15 |
| Clough Global Long/Short Fund – Class I | Financial Highlights |
| For a share outstanding throughout the period indicated |
| | |
| | | For the Year Ended October 31, 2021 | | | For the Year Ended October 31, 2020 | | | For the Year Ended October 31, 2019 | | | For the Year Ended October 31, 2018 | | | For the Year Ended October 31, 2017 | |
| PER SHARE OPERATING PERFORMANCE: | | | | | | | | | | | | | | | |
| NET ASSET VALUE, BEGINNING OF PERIOD | | $ | 12.38 | | | $ | 11.38 | | | $ | 10.70 | | | $ | 11.03 | | | $ | 9.40 | |
| INCOME/(LOSS) FROM OPERATIONS: | | | | | | | | | | | | | | | | | | | | |
| Net investment income/(loss)(a) | | | (0.04 | ) | | | 0.03 | | | | (0.04 | ) | | | (0.07 | ) | | | (0.10 | ) |
| Net realized and unrealized gain/(loss) on investments | | | 2.77 | | | | 0.97 | | | | 0.72 | | | | (0.26 | ) | | | 1.73 | |
| Total from Investment Operations | | | 2.73 | | | | 1.00 | | | | 0.68 | | | | (0.33 | ) | | | 1.63 | |
| | | | | | | | | | | | | | | | | | | | | |
| DISTRIBUTIONS TO COMMON SHAREHOLDERS FROM: | | | | | | | | | | | | | | | | | | | | |
| Net investment income | | | (0.06 | ) | | | – | | | | – | | | | – | | | | – | |
| Total Distributions to Common Shareholders | | | (0.06 | ) | | | – | | | | – | | | | – | | | | – | |
| Net asset value - end of period | | $ | 15.05 | | | $ | 12.38 | | | $ | 11.38 | | | $ | 10.70 | | | $ | 11.03 | |
| | | | | | | | | | | | | | | | | | | | | |
| Total Investment Return - Net Asset Value(b) | | | 22.10 | % | | | 8.79 | % | | | 6.36 | % | | | (2.99 | )% | | | 17.34 | % |
| | | | | | | | | | | | | | | | | | | | | |
| RATIOS AND SUPPLEMENTAL DATA: | | | | | | | | | | | | | | | | | | | | |
| Net assets attributable to common shares, end | | | | | | | | | | | | | | | | | | | | |
| of period (in 000s) | | $ | 77,267 | | | $ | 48,932 | | | $ | 44,213 | | | $ | 52,684 | | | $ | 29,629 | |
| | | | | | | | | | | | | | | | | | | | | |
| RATIOS TO AVERAGE NET ASSETS (including interest expense and dividend expense on securities sold short) | | | | | | | | | | | | | | | | | | | | |
| Operating expenses excluding fee waivers/reimbursements | | | 2.09 | % | | | 2.39 | % | | | 3.09 | % | | | 2.85 | % | | | 3.21 | % |
| Operating expenses including fee waivers/reimbursements | | | 1.37 | % | | | 1.45 | % | | | 2.14 | % | | | 2.03 | % | | | 1.96 | % |
| Net investment income/(loss) including fee waivers/reimbursements | | | (0.30 | )% | | | 0.28 | % | | | (0.38 | )% | | | (0.64 | )% | | | (0.96 | )% |
| RATIOS TO AVERAGE NET ASSETS (excluding interest expense and dividend expense on securities sold short) | | | | | | | | | | | | | | | | | | | | |
| Operating expenses excluding fee waivers/reimbursements | | | 1.97 | % | | | 2.19 | % | | | 2.52 | % | | | 2.42 | % | | | 2.85 | % |
| Operating expenses including fee waivers/reimbursements | | | 1.25 | % | | | 1.25 | % | | | 1.57 | % | | | 1.60 | % | | | 1.60 | % |
| Net investment income/(loss) including fee waivers/reimbursements | | | (0.18 | )% | | | 0.48 | % | | | 0.19 | % | | | (0.21 | )% | | | (0.60 | )% |
| | | | | | | | | | | | | | | | | | | | | |
| PORTFOLIO TURNOVER RATE(c) | | | 210 | % | | | 253 | % | | | 269 | % | | | 156 | % | | | 237 | % |
| (a) | Per share amounts are based upon average shares outstanding. |
| (b) | The total investment return would have been lower had certain expenses not been waived / reimbursed during the period. The return shown does not reflect the deduction of taxes that a shareholder would pay on Fund distributions or the redemption of Fund shares. |
| (c) | Portfolio turnover rate for periods less than one full year have not been annualized and is calculated at the Fund level. |
| See Notes to the Financial Statements. | |
| 16 | www.cloughglobal.com |
| Clough Global Long/Short Fund – Investor Class | Financial Highlights |
| For a share outstanding throughout the period indicated |
| | | For the Year Ended October 31, 2021 | | | For the Year Ended October 31, 2020 | | | For the Year Ended October 31, 2019 | | | For the Year Ended October 31, 2018(a) | | | For the Year Ended October 31, 2017 | |
| PER SHARE OPERATING PERFORMANCE: | | | | | | | | | | | | | | | |
| NET ASSET VALUE, BEGINNING OF PERIOD | | $ | 12.20 | | | $ | 11.24 | | | $ | 10.60 | | | $ | 10.96 | | | $ | 9.37 | |
| INCOME/(LOSS) FROM OPERATIONS: | | | | | | | | | | | | | | | | | | | | |
| Net investment income/(loss)(b) | | | (0.08 | ) | | | 0.00 | (c) | | | (0.07 | ) | | | (0.11 | ) | | | (0.14 | ) |
| Net realized and unrealized gain/(loss) on investments | | | 2.74 | | | | 0.96 | | | | 0.71 | | | | (0.25 | ) | | | 1.73 | |
| Total from Investment Operations | | | 2.66 | | | | 0.96 | | | | 0.64 | | | | (0.36 | ) | | | 1.59 | |
| | | | | | | | | | | | | | | | | | | | | |
| DISTRIBUTIONS TO COMMON | | | | | | | | | | | | | | | | | | | | |
| SHAREHOLDERS FROM: | | | | | | | | | | | | | | | | | | | | |
| Net investment income | | | (0.06 | ) | | | – | | | | – | | | | – | | | | – | |
| Total Distributions to Common Shareholders | | | (0.06 | ) | | | – | | | | – | | | | – | | | | – | |
| Net asset value - end of period | | $ | 14.80 | | | $ | 12.20 | | | $ | 11.24 | | | $ | 10.60 | | | $ | 10.96 | |
| | | | | | | | | | | | | | | | | | | | | |
| Total Investment Return - Net Asset Value(d) | | | 21.79 | % | | | 8.54 | % | | | 6.04 | % | | | (3.28 | )% | | | 16.97 | %(e) |
| | | | | | | | | | | | | | | | | | | | | |
| RATIOS AND SUPPLEMENTAL DATA: | | | | | | | | | | | | | | | | | | | | |
| Net assets attributable to common shares, end of period (in 000s) | | $ | 3,007 | | | $ | 2,602 | | | $ | 2,407 | | | $ | 2,776 | | | $ | 210 | |
| | | | | | | | | | | | | | | | | | | | | |
| RATIOS TO AVERAGE NET ASSETS (including interest expense and dividend expense on securities sold short) | | | | | | | | | | | | | | | | | | | | |
| Operating expenses excluding fee waivers/reimbursements | | | 2.34 | % | | | 2.63 | % | | | 3.34 | % | | | 3.14 | % | | | 3.78 | % |
| Operating expenses including fee waivers/reimbursements | | | 1.63 | % | | | 1.70 | % | | | 2.40 | % | | | 2.33 | %(f) | | | 2.29 | %(f) |
| Net investment income/(loss) including fee waivers/reimbursements | | | (0.55 | )% | | | 0.04 | % | | | (0.64 | )% | | | (0.93 | )% | | | (1.36 | )% |
| RATIOS TO AVERAGE NET ASSETS (excluding interest expense and dividend expense on securities sold short) | | | | | | | | | | | | | | | | | | | | |
| Operating expenses excluding fee waivers/reimbursements | | | 2.22 | % | | | 2.43 | % | | | 2.77 | % | | | 2.71 | % | | | 3.38 | % |
| Operating expenses including fee waivers/reimbursements | | | 1.51 | % | | | 1.50 | % | | | 1.83 | % | | | 1.90 | %(f) | | | 1.89 | %(f) |
| Net investment income/(loss) including fee waivers/reimbursements | | | (0.43 | )% | | | 0.24 | % | | | (0.07 | )% | | | (0.50 | )% | | | (0.96 | )% |
| | | | | | | | | | | | | | | | | | | | | |
| PORTFOLIO TURNOVER RATE(g) | | | 210 | % | | | 253 | % | | | 269 | % | | | 156 | % | | | 237 | % |
| (a) | On December 1, 2017, Class A was renamed Investor Class. |
| (b) | Per share amounts are based upon average shares outstanding. |
| (c) | Less than $0.005 per share. |
| (d) | The total investment return would have been lower had certain expenses not been waived / reimbursed during the period. The return shown does not reflect the deduction of taxes that a shareholder would pay on Fund distributions or the redemption of Fund shares. Total investment return does not reflect the effect of sales charge. |
| (e) | Total investment return does not reflect the effect of sales charge. |
| (f) | According to the Fund's shareholder services plan, any amount of such payment not paid during the Fund's fiscal year for such services activities shall be reimbursed to the Fund as soon as practical after the end of the fiscal year. Fees were reimbursed to the Fund during the year ended October 31, 2018 and the year ended October 31, 2017, in the amounts of 0.05% and 0.06%, respectively of average net assets of the share class. |
| (g) | Portfolio turnover rate for periods less than one full year have not been annualized and is calculated at the Fund level. |
| See Notes to the Financial Statements. | |
| Annual Report | October 31, 2021 | 17 |
| Clough Global Long/Short Fund – Class A | Financial Highlights |
| For a share outstanding throughout the period indicated |
| | | For the Year Ended October 31, 2021 | | | For the Year Ended October 31, 2020 | | | For the Year Ended October 31, 2019 | | | For the Period June 29, 2018 (commencement) to October 31, 2018 | |
| PER SHARE OPERATING PERFORMANCE: | | | | | | | | | | | | |
| NET ASSET VALUE, BEGINNING OF PERIOD | | $ | 12.20 | | | $ | 11.24 | | | $ | 10.60 | | | $ | 11.84 | |
| INCOME/(LOSS) FROM OPERATIONS: | | | | | | | | | | | | | | | | |
| Net investment income/(loss)(a) | | | (0.07 | ) | | | 0.01 | | | | (0.04 | ) | | | (0.02 | ) |
| Net realized and unrealized gain/(loss) on investments | | | 2.74 | | | | 0.95 | | | | 0.68 | | | | (1.22 | )(b) |
| Total from Investment Operations | | | 2.67 | | | | 0.96 | | | | 0.64 | | | | (1.24 | ) |
| | | | | | | | | | | | | | | | | |
| DISTRIBUTIONS TO COMMON SHAREHOLDERS FROM: | | | | | | | | | | | | | | | | |
| Net investment income | | | (0.06 | ) | | | – | | | | – | | | | – | |
| Total Distributions to Common Shareholders | | | (0.06 | ) | | | – | | | | – | | | | – | |
| Net asset value - end of period | | $ | 14.81 | | | $ | 12.20 | | | $ | 11.24 | | | $ | 10.60 | |
| | | | | | | | | | | | | | | | | |
| Total Investment Return - Net Asset Value(c) | | | 21.87 | % | | | 8.54 | % | | | 6.04 | % | | | (10.47 | )% |
| | | | | | | | | | | | | | | | | |
| RATIOS AND SUPPLEMENTAL DATA: | | | | | | | | | | | | | | | | |
| Net assets attributable to common shares, end of period (in 000s) | | $ | 291 | | | $ | 4,567 | | | $ | 2,822 | | | $ | 209 | |
| | | | | | | | | | | | | | | | | |
| RATIOS TO AVERAGE NET ASSETS (including interest expense and dividend expense on securities sold short) | | | | | | | | | | | | | | | | |
| Operating expenses excluding fee waivers/reimbursements | | | 2.31 | % | | | 2.60 | % | | | 3.42 | % | | | 2.91 | %(d)(e) |
| Operating expenses including fee waivers/reimbursements | | | 1.65 | % | | | 1.68 | % | | | 2.30 | % | | | 2.32 | %(d)(e) |
| Net investment income/(loss) including fee waivers/reimbursements | | | (0.50 | )% | | | 0.04 | % | | | (0.32 | )% | | | (0.61 | )%(d)(e) |
| RATIOS TO AVERAGE NET ASSETS (excluding interest expense and dividend expense on securities sold short) | | | | | | | | | | | | | | | | |
| Operating expenses excluding fee waivers/reimbursements | | | 2.18 | % | | | 2.42 | % | | | 2.97 | % | | | 2.44 | %(d)(e) |
| Operating expenses including fee waivers/reimbursements | | | 1.52 | % | | | 1.50 | % | | | 1.85 | % | | | 1.85 | %(d)(e)(f) |
| Net investment income/(loss) including fee waivers/reimbursements | | | (0.37 | )% | | | 0.22 | % | | | 0.13 | % | | | (0.14 | )%(d)(e) |
| | | | | | | | | | | | | | | | | |
| PORTFOLIO TURNOVER RATE(g) | | | 210 | % | | | 253 | % | | | 269 | % | | | 156 | % |
| (a) | Per share amounts are based upon average shares outstanding. |
| (b) | The per share amount varies from the net realized and unrealized gain/loss for the whole period because of the timing of sales of fund shares and per share amount of realized and unrealized gains and losses at such time. |
| (c) | Total investment return is for the period indicated and has not been annualized. The total investment return would have been lower had certain expenses not been waived / reimbursed during the period. The return shown does not reflect the deduction of taxes that a shareholder would pay on Fund distributions or the redemption of Fund shares. Total investment return does not reflect the effect of sales charge. |
| (e) | Expense ratios before reductions for startup periods may not be representative of longer term operating periods. |
| (f) | According to the Fund's shareholder services plan, any amount of such payment not paid during the Fund's fiscal year for such services activities shall be reimbursed to the Fund as soon as practical after the end of the fiscal year. Fees were reimbursed to the Fund during the year ended October 31, 2018 in the amount of 0.10% of average net assets of the share class. |
| (g) | Portfolio turnover rate for periods less than one full year have not been annualized and is calculated at the Fund level. |
| See Notes to the Financial Statements. | |
| 18 | www.cloughglobal.com |
| Clough Global Long/Short Fund – Class C | Financial Highlights |
| | For a share outstanding throughout the period indicated |
| | | For the Year Ended October 31, 2021 | | | For the Year Ended October 31, 2020 | | | For the Year Ended October 31, 2019 | | | For the Year Ended October 31, 2018 | | | For the Year Ended October 31, 2017 | |
| PER SHARE OPERATING PERFORMANCE: | | | | | | | | | | | | | | | |
| NET ASSET VALUE, BEGINNING OF PERIOD | | $ | 11.82 | | | $ | 10.97 | | | $ | 10.42 | | | $ | 10.84 | | | $ | 9.34 | |
| INCOME/(LOSS) FROM OPERATIONS: | | | | | | | | | | | | | | | | | | | | |
| Net investment loss(a) | | | (0.18 | ) | | | (0.08 | ) | | | (0.15 | ) | | | (0.18 | ) | | | (0.20 | ) |
| Net realized and unrealized gain/(loss) on investments | | | 2.64 | | | | 0.93 | | | | 0.70 | | | | (0.24 | ) | | | 1.70 | |
| Total from Investment Operations | | | 2.46 | | | | 0.85 | | | | 0.55 | | | | (0.42 | ) | | | 1.50 | |
| | | | | | | | | | | | | | | | | | | | | |
| DISTRIBUTIONS TO COMMON SHAREHOLDERS FROM: | | | | | | | | | | | | | | | | | | | | |
| Net investment income | | | (0.04 | ) | | | – | | | | – | | | | – | | | | – | |
| Total Distributions to Common Shareholders | | | (0.04 | ) | | | – | | | | – | | | | – | | | | – | |
| Net asset value - end of period | | $ | 14.24 | | | $ | 11.82 | | | $ | 10.97 | | | $ | 10.42 | | | $ | 10.84 | |
| | | | | | | | | | | | | | | | | | | | | |
| Total Investment Return - Net Asset Value(b) | | | 20.83 | % | | | 7.75 | % | | | 5.28 | % | | | (3.87 | )% | | | 16.06 | % |
| | | | | | | | | | | | | | | | | | | | | |
| RATIOS AND SUPPLEMENTAL DATA: | | | | | | | | | | | | | | | | | | | | |
| Net assets attributable to common shares, end of period (in 000s) | | $ | 1,085 | | | $ | 1,061 | | | $ | 1,813 | | | $ | 3,562 | | | $ | 95 | |
| | | | | | | | | | | | | | | | | | | | | |
| RATIOS TO AVERAGE NET ASSETS (including interest expense and dividend expense on securities sold short) | | | | | | | | | | | | | | | | | | | | |
| Operating expenses excluding fee waivers/reimbursements | | | 3.08 | % | | | 3.42 | % | | | 4.07 | % | | | 3.79 | % | | | 4.33 | % |
| Operating expenses including fee waivers/reimbursements | | | 2.37 | % | | | 2.46 | % | | | 3.17 | % | | | 3.06 | % | | | 2.97 | % |
| Net investment loss including fee waivers/reimbursements | | | (1.28 | )% | | | (0.74 | )% | | | (1.44 | )% | | | (1.58 | )% | | | (2.03 | )% |
| RATIOS TO AVERAGE NET ASSETS (excluding interest expense and dividend expense on securities sold short) | | | | | | | | | | | | | | | | | | | | |
| Operating expenses excluding fee waivers/reimbursements | | | 2.96 | % | | | 3.21 | % | | | 3.48 | % | | | 3.32 | % | | | 3.96 | % |
| Operating expenses including fee waivers/reimbursements | | | 2.25 | % | | | 2.25 | % | | | 2.58 | % | | | 2.59 | % | | | 2.60 | % |
| Net investment loss including fee waivers/reimbursements | | | (1.16 | )% | | | (0.53 | )% | | | (0.85 | )% | | | (1.11 | )% | | | (1.66 | )% |
| | | | | | | | | | | | | | | | | | | | | |
| PORTFOLIO TURNOVER RATE(c) | | | 210 | % | | | 253 | % | | | 269 | % | | | 156 | % | | | 237 | % |
| (a) | Per share amounts are based upon average shares outstanding. |
| (b) | The total investment return would have been lower had certain expenses not been waived / reimbursed during the period. The return shown does not reflect the deduction of taxes that a shareholder would pay on Fund distributions or the redemption of Fund shares. Total investment return does not reflect the effect of sales charge. |
| (c) | Portfolio turnover rate for periods less than one full year have not been annualized and is calculated at the Fund level. |
| See Notes to the Financial Statements. | |
| Annual Report | October 31, 2021 | 19 |
| Clough Global Long/Short Fund | Notes to Financial Statements |
| | October 31, 2021 |
| 1. | ORGANIZATION AND SIGNIFICANT ACCOUNTING AND OPERATING POLICIES |
Clough Funds Trust (the “Trust”) is an open-end management investment company registered under the Investment Company Act of 1940, as amended (the “1940 Act”). The Trust was organized under the laws of the state of Delaware on March 17, 2015. The Trust currently offers shares of beneficial interest (“shares”) of the Clough Global Long/Short Fund (the “Fund”). The Fund’s commencement date is September 30, 2015. The Fund is a diversified investment company with an investment objective to seek to provide long-term capital appreciation. The Fund currently offers four Classes of shares: Class I, Investor Class, Class A and Class C. Prior to December 1, 2017, Investor Class shares were named Class A shares. On June 29, 2018, a new Class A commenced operations. Each share class of the Fund represents an investment in the same portfolio of securities, but each share class has its own expense structure. As of October 31, 2021, approximately 34% of the Fund is owned by affiliated parties. The Board of Trustees (the “Board”) may establish additional funds and classes of shares at any time in the future without shareholder approval.
The following is a summary of significant accounting policies followed by the Fund. These policies are in conformity with U.S. generally accepted accounting principles (“GAAP”). The preparation of financial statements in accordance with GAAP requires management to make estimates and assumptions that affect the reported amounts and disclosures in the financial statements during the reporting period. Management believes the estimates and security valuations are appropriate; however, actual results may differ from those estimates, and the security valuations reflected in the financial statements may differ from the value the Fund ultimately realizes upon sale of the securities. The Fund is considered an investment company for financial reporting purposes under GAAP and follows the accounting and reporting guidance applicable to investment companies as codified in Accounting Standards Codification (“ASC”) Topic 946 – Investment Companies.
The net asset value (“NAV”) per share of the Fund is determined no less frequently than daily, on each day that the New York Stock Exchange (“NYSE” or the “Exchange”) is open for trading, as of the close of regular trading on the Exchange (normally 4:00 p.m. New York time). Trading may take place in foreign issues held by the Fund at times when the Fund is not open for business. As a result, the Fund’s NAV may change at times when it is not possible to purchase or sell shares of the Fund.
Investment Valuation: Securities held by the Fund for which exchange quotations are readily available are valued at the last sale price, or if no sale price or if traded on the over-the-counter market, at the mean of the bid and asked prices on such day. Most securities listed on a foreign exchange are valued at the last sale price at the close of the exchange on which the security is primarily traded. In certain countries market maker prices are used since they are the most representative of the daily trading activity. Market maker prices are usually the mean between the bid and ask prices. Certain markets are not closed at the time that the Fund prices its portfolio securities. In these situations, snapshot prices are provided by the individual pricing services or other alternate sources at the close of the NYSE as appropriate. Securities not traded on a particular day are valued at the mean between the last reported bid and the asked quotes, or the last sale price when appropriate; otherwise fair value will be determined by the Board-appointed fair valuation committee. Debt securities for which the over-the-counter market is the primary market are normally valued on the basis of prices furnished by one or more pricing services or dealers at the mean between the latest available bid and asked prices. As authorized by the Board, debt securities (including short-term obligations that will mature in 60 days or less) may be valued on the basis of valuations furnished by a pricing service which determines valuations based upon market transactions for normal, institutional-size trading units of securities or a matrix method which considers yield or price of comparable bonds provided by a pricing service. Total return swaps are priced based on valuations provided by a Board approved independent third party pricing agent. If a total return swap price cannot be obtained from an independent third party pricing agent the Fund shall seek to obtain a bid price from at least one independent and/or executing broker.
If the price of a security is unavailable in accordance with the aforementioned pricing procedures, or the price of a security is unreliable, e.g., due to the occurrence of a significant event, the security may be valued at its fair value determined by management pursuant to procedures adopted by the Board. For this purpose, fair value is the price that the Fund reasonably expects to receive on a current sale of the security. Due to the number of variables affecting the price of a security, however; it is possible that the fair value of a security may not accurately reflect the price that the Fund could actually receive on a sale of the security.
A three-tier hierarchy has been established to classify fair value measurements for disclosure purposes. Inputs refer broadly to the assumptions that market participants would use in pricing the asset or liability, including assumptions about risk. Inputs may be observable or unobservable. Observable inputs are inputs that reflect the assumptions market participants would use in pricing the asset or liability that are developed based on market data obtained from sources independent of the reporting entity. Unobservable inputs are inputs that reflect the reporting entity’s own assumptions about the assumptions market participants would use in pricing the asset or liability that are developed based on the best information available.
| Clough Global Long/Short Fund | Notes to Financial Statements |
| | October 31, 2021 |
Various inputs are used in determining the value of the Fund’s investments as of the reporting period end. These inputs are categorized in the following hierarchy under applicable financial accounting standards:
| Level 1 – | Unadjusted quoted prices in active markets for identical, unrestricted assets or liabilities that the Fund has the ability to access at the measurement date; |
| Level 2 – | Quoted prices which are not active, quoted prices for similar assets or liabilities in active markets or inputs other than quoted prices that are observable (either directly or indirectly) for substantially the full term of the asset or liability; and |
| Level 3 – | Significant unobservable prices or inputs (including the Fund’s own assumptions in determining the fair value of investments) where there is little or no market activity for the asset or liability at the measurement date. |
The following is a summary of the inputs used as of October 31, 2021, in valuing the Fund’s investments carried at value.
Clough Global Long/Short Fund
| Investments in Securities at Value* | | Level 1 | | | Level 2 | | | Level 3 | | | Total | |
| Common Stocks | | $ | 65,155,499 | | | $ | – | | | $ | – | | | $ | 65,155,499 | |
| Warrants | | | 183,568 | | | | – | | | | – | | | | 183,568 | |
| Purchased Options | | | 73,031 | | | | – | | | | – | | | | 73,031 | |
| Corporate Bonds | | | – | | | | 8,829,071 | | | | – | | | | 8,829,071 | |
| Convertible Corporate Bonds | | | – | | | | 1,274,314 | | | | – | | | | 1,274,314 | |
| Short-Term Investments | | | 6,199,677 | | | | – | | | | – | | | | 6,199,677 | |
| TOTAL | | $ | 71,611,775 | | | $ | 10,103,385 | | | $ | – | | | $ | 81,715,160 | |
| | | | | | | | | | | | | | | | | |
| Other Financial Instruments | | | Level 1 | | | | Level 2 | | | | Level 3 | | | | Total | |
| Assets | | | | | | | | | | | | | | | | |
| Futures Contracts** | | $ | 149,470 | | | $ | – | | | $ | – | | | $ | 149,470 | |
| Total Return Swap Contracts** | | | – | | | | 647,188 | | | | – | | | | 647,188 | |
| Liabilities | | | | | | | | | | | | | | | | |
| Securities Sold Short | | | | | | | | | | | | | | | | |
| Common Stocks | | | (5,334,723 | ) | | | – | | | | – | | | | (5,334,723 | ) |
| Exchange Traded Funds | | | (1,188,191 | ) | | | – | | | | – | | | | (1,188,191 | ) |
| Total Return Swap Contracts** | | | – | | | | (70,768 | ) | | | – | | | | (70,768 | ) |
| TOTAL | | $ | (6,373,444 | ) | | $ | 576,420 | | | $ | – | | | $ | (5,797,024 | ) |
| * | For detailed sector descriptions, see the accompanying Statement of Investments. |
| ** | Futures contracts and swap contracts are reported at their unrealized appreciation/(depreciation) at measurement date, which represents the change in the contract's value from trade date. |
In the event a Board approved independent pricing service is unable to provide an evaluated price for a security or Clough Capital Partners L.P. (the “Adviser” or “Clough Capital”) believes the price provided is not reliable, securities of the Fund will be valued at fair value as described above. In these instances the Adviser may seek to find an alternative independent source, such as a broker/dealer to provide a price quote, or by using evaluated pricing models similar to the techniques and models used by the independent pricing service. These fair value measurement techniques may utilize unobservable inputs (Level 3).
On a monthly basis, the Fair Value Committee of the Fund meets and discusses securities that have been fair valued during the preceding month in accordance with the Fund’s Fair Value Procedures and reports quarterly to the Board on the results of those meetings.
For the year ended October 31, 2021, the Fund did not have significant unobservable inputs (Level 3) used in determining fair value. Therefore, a reconciliation of assets in which significant unobservable inputs (Level 3) were used in determining fair value is not applicable.
Restricted Securities: Although the Fund will invest primarily in publicly traded securities, it may invest a portion of its assets (up to 15% of its value) in restricted securities. Restricted securities are securities that may not be sold to the public without an effective registration statement under the Securities Act of 1933, as amended (the "Securities Act") or, if they are unregistered, may be sold only in a privately negotiated transaction or pursuant to an exemption from registration.
| Annual Report | October 31, 2021 | 21 |
| Clough Global Long/Short Fund | Notes to Financial Statements |
| | October 31, 2021 |
Restricted securities as of October 31, 2021 were as follows:
| Fund | | Security | | % of Net Assets | | | Acquisition Date | | Principal Amount | | | Cost | | | Value | |
| Clough Global Long/Short Fund | | | | | | | | | | | | | | | | |
| | | British Telecommunications PLC | | | 0.68 | % | | 9/2/2021 | | | 500,000 | | | $ | 562,459 | | | $ | 557,176 | |
| | | Nestle Holdings, Inc. | | | 1.16 | % | | 8/12/2021 | | | 750,000 | | | | 925,103 | | | | 943,772 | |
| | | Roche Holdings, Inc. | | | 0.75 | % | | 8/30/2021 | | | 500,000 | | | | 636,676 | | | | 613,216 | |
| Total | | | | | 2.59 | % | | | | | | | | $ | 2,124,238 | | | $ | 2,114,164 | |
Class Expenses: Expenses that are specific to a class of shares are charged directly to that share class. Fees provided under the distribution (Rule 12b-1) and/or shareholder service plans for a particular class of the Fund are charged to the operations of such class.
Income Taxes: The Fund’s policy is to comply with the provisions of the Internal Revenue Code applicable to regulated investment companies and to distribute all of its taxable income to its shareholders. Therefore, no federal income tax provision is required. As of and during the year ended October 31, 2021, the Fund did not have a liability for any unrecognized tax benefits. The Fund plans to file U.S. Federal and various state and local tax returns as required. The Fund’s tax returns are subject to examination by the relevant tax authorities until expiration of the applicable statute of limitations, which is generally three years after the filing of the tax return but which can be extended to six years in certain circumstances. Tax returns for open years have incorporated no uncertain tax positions that require a provision for income taxes.
Certain foreign countries impose a capital gains tax which is accrued by the Fund based on the unrealized appreciation, if any, on affected securities. Any accrual would reduce the Fund's NAV. The tax is paid when the gain is realized and is included in capital gains tax in the Statement of Operations.
Distributions to Shareholders: The Fund normally intends to pay dividends on an annual basis. Any net capital gains earned by the Fund are distributed annually. Distributions to shareholders are recorded by the Fund on the ex-dividend date.
Securities Transactions and Investment Income: Investment security transactions are accounted for on a trade date basis. Dividend income and dividend expense-short sales are recorded on the ex-dividend date. Certain dividend income from foreign securities will be recorded, in the exercise of reasonable diligence, as soon as a Fund is informed of the dividend if such information is obtained subsequent to the ex-dividend date and may be subject to withholding taxes in these jurisdictions. Interest income, which includes amortization of premium and accretion of discount, is recorded on the accrual basis. Realized gains and losses from securities transactions and unrealized appreciation and depreciation of securities are determined using the identified cost basis for both financial reporting and income tax purposes. All of the realized and unrealized gains and losses and net investment income, other than class specific expenses, are allocated daily to each class in proportion to its average daily net assets.
Foreign Securities: The Fund may invest a portion of its assets in foreign securities. In the event that the Fund executes a foreign security transaction, the Fund will generally enter into a foreign currency spot contract to settle the foreign security transaction. Foreign securities may carry more risk than U.S. securities, such as political, market and currency risks.
The accounting records of the Fund are maintained in U.S. dollars. Prices of securities denominated in foreign currencies are translated into U.S. dollars at the closing rates of exchange at period end. Amounts related to the purchase and sale of foreign securities and investment income are translated at the rates of exchange prevailing on the respective dates of such transactions.
The effect of changes in foreign currency exchange rates on investments is reported with investment securities realized and unrealized gains and losses in the Fund’s Statement of Operations.
A foreign currency spot contract is a commitment to purchase or sell a foreign currency at a future date, at a negotiated rate. The Fund may enter into foreign currency spot contracts to settle specific purchases or sales of securities denominated in a foreign currency and for protection from adverse exchange rate fluctuation. Risks to the Fund include the potential inability of the counterparty to meet the terms of the contract.
The net U.S. dollar value of foreign currency underlying all contractual commitments held by the Fund and the resulting unrealized appreciation or depreciation are determined using prevailing forward foreign currency exchange rates. Unrealized appreciation and depreciation on foreign currency spot contracts are reported in the Fund’s Statements of Assets and Liabilities as a receivable or a payable and in the Fund’s Statement of Operations with the change in unrealized appreciation or depreciation on translation of assets and liabilities denominated in foreign currencies.
These spot contracts are used by the broker to settle investments denominated in foreign currencies.
| Clough Global Long/Short Fund | Notes to Financial Statements |
| | October 31, 2021 |
The Fund may realize a gain or loss upon the closing or settlement of the foreign transaction, excluding investment securities. Such realized gains and losses are reported with all other foreign currency gains and losses in the Statement of Operations.
Exchange Traded Funds: The Fund may invest in exchange traded funds (“ETFs”), which are funds whose shares are traded on a national exchange. ETFs may be based on underlying equity or fixed income securities, as well as commodities or currencies. ETFs do not sell individual shares directly to investors, but rather only issue their shares in large blocks known as “creation units.” The investor purchasing a creation unit then sells the individual shares on a secondary market. Although similar diversification benefits may be achieved through an investment in another investment company, ETFs generally offer greater liquidity and lower expenses. Because an ETF incurs its own fees and expenses, shareholders of a fund investing in an ETF will indirectly bear those costs. Such funds will also incur brokerage commissions and related charges when purchasing or selling shares of an ETF. Unlike typical investment company shares, which are valued once daily, shares in an ETF may be purchased or sold on a securities exchange throughout the trading day at market prices that are generally close to the NAV of the ETF.
Short Sales: The Fund may sell a security it does not own in anticipation of a decline in the fair value of that security. When the Fund sells a security short, it must borrow the security sold short and deliver it to the broker-dealer through which it made the short sale. A gain, limited to the price at which the Fund sold the security short, or a loss, unlimited in size, will be recognized upon the termination of the short sale.
The Fund's obligation to replace the borrowed security will be secured by collateral deposited with the broker-dealer, usually cash, U.S. government securities or other liquid securities. The Fund will also be required to designate on its books and records similar collateral with its custodian to the extent, if any, necessary so that the aggregate collateral value is at all times at least equal to the current value of the security sold short. The cash amount is reported on the Statement of Assets and Liabilities as Deposit with broker for securities sold short which is held with one counterparty. The Fund is obligated to pay interest to the broker for any debit balance of the margin account relating to short sales. The interest incurred by the Fund, if any, is reported on the Statement of Operations as Interest expense – margin account. Interest amounts payable, if any, are reported on the Statement of Assets and Liabilities as Interest payable – margin account.
The Fund may also sell a security short if it owns at least an equal amount of the security sold short or another security convertible or exchangeable for an equal amount of the security sold short without payment of further compensation (a short sale against-the-box). In a short sale against-the-box, the short seller is exposed to the risk of being forced to deliver stock that it holds to close the position if the borrowed stock is called in by the lender, which would cause gain or loss to be recognized on the delivered stock. The Fund expects normally to close its short sales against-the-box by delivering newly acquired stock. Since the Fund intends to hold securities sold short for the short term, these securities are excluded from the purchases and sales of investment securities in Note 4 and the Fund’s Portfolio Turnover in the Financial Highlights.
Derivative Instruments and Hedging Activities: The following discloses the Fund’s use of derivative instruments and hedging activities.
The Fund’s investment objective not only permits the Fund to purchase investment securities, it also allows the Fund to enter into various types of derivative contracts, including, but not limited to, forward foreign currency contracts, futures, options and swaps. The Fund may use derivatives, among other reasons, as part of the Fund’s investment strategy, to attempt to employ its currency strategies, to seek to hedge against foreign exchange risk, and to gain access to foreign markets.
Risk of Investing in Derivatives: The Fund’s use of derivatives can result in losses due to unanticipated changes in the market risk factors and the overall market. In instances where the Fund is using derivatives to decrease or hedge exposures to market risk factors for securities held by the Fund, there are also risks that those derivatives may not perform as expected, resulting in losses for the combined or hedged positions.
Derivatives may have little or no initial cash investment relative to their market value exposure and therefore can produce significant gains or losses in excess of their cost. This use of embedded leverage allows the Fund to increase its market value exposure relative to its net assets and can substantially increase the volatility of the Fund’s performance.
Additional associated risks from investing in derivatives also exist and potentially could have significant effects on the valuation of the derivative and the Fund. Typically, the associated risks are not the risks that the Fund is attempting to increase or decrease exposure to its investment objective, but the additional risks from investing in derivatives. Associated risks can be different for each type of derivative and are discussed by each derivative type in the notes that follow.
| Annual Report | October 31, 2021 | 23 |
| Clough Global Long/Short Fund | Notes to Financial Statements |
| | October 31, 2021 |
Examples of these associated risks are liquidity risk, which is the risk that the Fund will not be able to sell the derivative in the open market in a timely manner, and counterparty credit risk, which is the risk that the counterparty will not fulfill its obligation to the Fund.
Market Risk Factors: In addition, in pursuit of its investment objectives, the Fund may seek to use derivatives, which may increase or decrease exposure to the following market risk factors:
Equity Risk: Equity risk relates to the change in value of equity securities as they relate to increases or decreases in the general market.
Foreign Exchange Rate Risk: Foreign exchange rate risk relates to the change in the U.S. dollar value of a security held that is denominated in a foreign currency. The value of a foreign currency denominated security will decrease as the dollar appreciates against the currency, while the value of the foreign currency denominated security will increase as the dollar depreciates against the currency.
Futures Contracts: The Fund may enter into futures contracts. A futures contract is an agreement to buy or sell a security or currency (or to deliver a final cash settlement price in the case of a contract relating to an index or otherwise not calling for physical delivery at the end of trading in the contract) for a set price at a future date. If the Fund buys a security futures contract, the Fund enters into a contract to purchase the underlying security and is said to be "long" under the contract. If the Fund sells a security futures contact, the Fund enters into a contract to sell the underlying security and is said to be "short" under the contract. The price at which the contract trades (the "contract price") is determined by relative buying and selling interest on a regulated exchange. Futures contracts are marked to market daily and an appropriate payable or receivable for the change in value (“variation margin”) is recorded by the Fund. Such payables or receivables are recorded for financial statement purposes as variation margin payable or variation margin receivable by the Fund. The Fund pledges cash or liquid assets as collateral to satisfy the current obligations with respect to futures contracts. The cash amount is reported on the Statement of Assets and Liabilities as Deposit with broker for futures contracts.
The Fund enters into such transactions for hedging and other appropriate risk-management purposes or to increase return. While the Fund may enter into futures contracts for hedging purposes, the use of futures contracts might result in a poorer overall performance for the Fund than if it had not engaged in any such transactions. If, for example, the Fund had insufficient cash, it might have to sell a portion of its underlying portfolio of securities in order to meet daily variation margin requirements on its futures contracts or options on futures contracts at a time when it might be disadvantageous to do so. There may be an imperfect correlation between the Fund’s portfolio holdings and futures contracts entered into by the Fund, which may prevent the Fund from achieving the intended hedge or expose the Fund to risk of loss.
Futures contract transactions may result in losses substantially in excess of the variation margin. There can be no guarantee that there will be a correlation between price movements in the hedging vehicle and in the portfolio securities being hedged. An incorrect correlation could result in a loss on both the hedged securities in the Fund and the hedging vehicle so that the portfolio return might have been greater had hedging not been attempted. There can be no assurance that a liquid market will exist at a time when the Fund seeks to close out a futures contract. Lack of a liquid market for any reason may prevent the Fund from liquidating an unfavorable position, and the Fund would remain obligated to meet margin requirements until the position is closed. In addition, the Fund could be exposed to risk if the counterparties to the contracts are unable to meet the terms of their contracts. With exchange-traded futures contracts, there is minimal counterparty credit risk to the Fund since futures contracts are exchange-traded and the exchange’s clearinghouse, as counterparty to all exchange-traded futures contracts, guarantees the futures contracts against default.
Option Writing/Purchasing: The Fund may purchase or write (sell) put and call options. One of the risks associated with purchasing an option among others, is that the Fund pays a premium whether or not the option is exercised. Additionally, the Fund bears the risk of loss of premium and change in value should the counterparty not perform under the contract. The cost of securities acquired through the exercise of call options is increased by premiums paid. The proceeds from securities sold through the exercise of put options are decreased by the premiums paid. The Fund is obligated to pay interest to the broker for any debit balance of the margin account relating to options. The Fund pledges cash or liquid assets as collateral to satisfy the current obligations with respect to written options. The interest incurred, if any, on the Fund is reported on the Statement of Operations as Interest expense – margin account. Interest amounts payable by the Fund, if any, are reported on the Statement of Assets and Liabilities as Interest payable – margin account.
When the Fund writes an option, an amount equal to the premium received by the Fund is recorded as a liability and is subsequently adjusted to the current value of the option written. Premiums received from writing options that expire unexercised are treated by the Fund on the expiration date as realized gains. The difference between the premium received and the amount paid on effecting a closing purchase transaction, including brokerage commissions, is recorded as a realized gain or loss. If a call option is exercised, the premium is added to the proceeds from the sale of the underlying security or currency in determining whether the Fund has realized a gain or loss. If a put option is exercised, the premium reduces the cost basis of the securities purchased by the Fund. The Fund, as writer of an option, bears the market risk of an unfavorable change in the price of the security underlying the written option. The Fund engaged in purchased and written options during the reporting year ended October 31, 2021.
| Clough Global Long/Short Fund | Notes to Financial Statements |
| | October 31, 2021 |
Swaps: A swap is an agreement that obligates two parties to exchange a series of cash flows at specified intervals based upon or calculated by reference to changes in specified prices or rates for a specified amount of an underlying asset. The Fund may utilize swap agreements as a means to gain exposure to certain assets and/or to “hedge” or protect the Fund from adverse movements in securities prices or interest rates. The Fund is subject to equity risk and interest rate risk in the normal course of pursuing its investment objective through investments in swap contracts. Swap agreements entail the risk that a party will default on its payment obligation to the Fund. If the other party to a swap defaults, the Fund would risk the loss of the net amount of the payments that it contractually is entitled to receive. If the Fund utilizes a swap at the wrong time or judges market conditions incorrectly, the swap may result in a loss to the Fund and reduce the Fund’s total return.
Total return swaps involve an exchange by two parties in which one party makes payments based on a set rate, either fixed or variable, while the other party makes payments based on the return of an underlying asset, which includes both the income it generates and any capital gains over the payment period. A Fund’s maximum risk of loss from counterparty risk or credit risk is the discounted value of the payments to be received from/paid to the counterparty over the contract’s remaining life, to the extent that the amount is positive. The risk is mitigated by having a netting arrangement between a Fund and the counterparty and by the posting of collateral to a Fund to cover the Fund’s exposure to the counterparty. The Fund pledges cash or liquid assets as collateral to satisfy the current obligations with respect to swap contracts. The cash amount is reported on the Statement of Assets and Liabilities as Deposit with broker for total return swap contracts which is held with one counterparty.
During the year ended October 31, 2021, the Fund invested in swap agreements consistent with the Fund’s investment strategies to seek to hedge against foreign exchange risk or to gain exposure to certain markets or indices.
The effect of derivatives instruments on the Fund’s Statement of Assets and Liabilities as of October 31, 2021:
| | | Asset Derivatives | | | |
| Risk Exposure | | Statements of Assets and Liabilities Location | | Value | |
| Foreign Currency Contracts (Futures Contracts) | | Unrealized appreciation on futures contracts(a) | | $ | 149,470 | |
| Equity Contracts (Total Return Swap Contracts) | | Unrealized appreciation on total return swap contracts | | $ | 647,188 | |
| Equity Contracts (Purchased Options) | | Investments, at value | | $ | 73,031 | |
| | | | | $ | 869,689 | |
| | | | | | | |
| | | Liability Derivatives | | | | |
| Risk Exposure | | Statements of Assets and Liabilities Location | | | Value | |
| Equity Contracts (Total Return Swap Contracts) | | Unrealized depreciation on total return swap contracts | | $ | (70,768 | ) |
| Total | | | | $ | (70,768 | ) |
| (a) | Represents cumulative appreciation (depreciation) of futures contracts as reported in the Statement of Investments. Only the current day's net variation margin is reported within the Statement of Assets and Liabilities. |
The effect of derivatives instruments on the Fund’s Statement of Operations for the year ended October 31, 2021:
| Risk Exposure | | Statements of Operations Location | | Realized Gain/(Loss) on Derivatives Recognized in Income | | | Change in Unrealized Appreciation/ (Depreciation) on Derivatives Recognized in Income | |
Foreign Currency Contracts
(Futures Contracts) | | Net realized gain/(loss) on futures contracts/Net change in unrealized appreciation/(depreciation) on futures contracts | | $ | 818,795 | | | $ | (591,935 | ) |
Equity Contracts
(Purchased Options) | | Net realized gain/(loss) on investment securities/Net change in unrealized appreciation/(depreciation) on investment securities | | | (1,536,014 | ) | | | (141,855 | ) |
Equity Contracts
(Written Options) | | Net realized gain/(loss) on written options/Net change in unrealized appreciation/(depreciation) on written options | | | 464,193 | | | | – | |
Equity Contracts
(Total Return Swap Contracts) | | Net realized gain/(loss) on total return swap contracts/Net change in unrealized appreciation/(depreciation) on total return swap contracts | | | 1,086,328 | | | | 58,172 | |
| Total | | | | $ | 833,302 | | | $ | (675,618 | ) |
| Annual Report | October 31, 2021 | 25 |
| Clough Global Long/Short Fund | Notes to Financial Statements |
| | October 31, 2021 |
The average futures contracts notional amount during the year ended October 31, 2021 is $42,764,758. The average total return swap contracts notional amount during the year ended October 31, 2021 is $986,522. The average purchased option contracts notional amount during the year ended October 31, 2021 is $303,851,325. The average written option contracts notional amount during the year ended October 31, 2021 is $(8,144,519).
Certain derivative contracts are executed under either standardized netting agreements or, for exchange-traded derivatives, the relevant contracts for a particular exchange which contain enforceable netting provisions. A derivative netting arrangement creates an enforceable right of set-off that becomes effective, and affects the realization of settlement on individual assets, liabilities and collateral amounts, only following a specified event of default or early termination. Default events may include the failure to make payments or deliver securities timely, material adverse changes in financial condition or insolvency, the breach of minimum regulatory capital requirements, or loss of license, charter or other legal authorization necessary to perform under the contract.
The following table presents derivative financial instruments that are subject to enforceable netting arrangements as of October 31, 2021.
| Offsetting of Derivatives Assets | | | |
| | | | | | | | | | | | Gross Amounts Not Offset in the Statements of Assets and Liabilities | |
| | | Gross Amounts of Recognized Assets | | | Gross Amounts Offset in the Statements of Assets and Liabilities | | | Net Amounts Presented in the Statements of Assets and Liabilities | | | Financial Instruments(a) | | | Cash Collateral Received(a) | | | Net Amount | |
| Total Return Swap Contracts | | $ | 647,188 | | | $ | – | | | $ | 647,188 | | | $ | (70,768 | ) | | $ | – | | | $ | 576,420 | |
| Total | | $ | 647,188 | | | $ | – | | | $ | 647,188 | | | $ | (70,768 | ) | | $ | – | | | $ | 576,420 | |
| Offsetting of Derivatives Liabilities | | | |
| | | | | | | | | | | | Gross Amounts Not Offset in the Statements of Assets and Liabilities | |
| | | Gross Amounts of Recognized Liabilities | | | Gross Amounts Offset in the Statements of Assets and Liabilities | | | Net Amounts Presented in the Statements of Assets and Liabilities | | | Financial Instruments(a) | | | Cash Collateral Pledged(a) | | | Net Amount | |
| Total Return Swap Contracts | | $ | 70,768 | | | $ | – | | | $ | 70,768 | | | $ | (70,768 | ) | | $ | – | | | $ | – | |
| Total | | $ | 70,768 | | | $ | – | | | $ | 70,768 | | | $ | (70,768 | ) | | $ | – | | | $ | – | |
| (a) | These amounts are limited to the derivative asset/liability balance and, accordingly, do not include excess collateral received/pledged which is disclosed in the Statement of Investments. |
Counterparty Risk: The Fund runs the risk that the issuer or guarantor of a fixed income security, the counterparty to an over-the-counter derivatives contract or the obligor of an obligation underlying an asset-backed security will be unable or unwilling to make timely principal, interest, or settlement payments or otherwise honor its obligations. In addition, to the extent that the Fund uses over-the-counter derivatives, and/or has significant exposure to a single counterparty, this risk will be particularly pronounced for the Fund.
| Clough Global Long/Short Fund | Notes to Financial Statements |
| | October 31, 2021 |
Other Risk Factors: Investing in the Fund may involve certain risks including, but not limited to, the following:
Unforeseen developments in market conditions may result in the decline of prices of, and the income generated by, the securities held by the Fund. These events may have adverse effects on the Fund such as a decline in the value and liquidity of many securities held by the Fund, and a decrease in NAV. Such unforeseen developments may limit or preclude the Fund’s ability to achieve its investment objective. Investing in stocks may involve larger price fluctuation and greater potential for loss than other types of investments. This may result in the securities held by the Fund being subject to larger short-term declines in value compared to other types of investments.
The Fund may have elements of risk due to the investments in foreign issuers located in various countries outside the U.S. Such investments may subject the Fund to additional risks resulting from future political or economic conditions and/or possible impositions of adverse governmental laws or currency exchange restrictions. Investments in securities of non-U.S. issuers have unique risks not present in securities of U.S. issuers, such as greater price volatility and less liquidity.
An outbreak of Covid-19 respiratory disease caused by a novel coronavirus was first detected in late 2019 and subsequently spread globally in early 2020. The impact of the outbreak has been rapidly evolving, and cases of the virus have continued to be identified in most developed and emerging countries throughout the world. Many local, state, and national governments, as well as businesses, have reacted by instituting quarantines, border closures, restrictions on travel, and other measures designed to arrest the spread of the virus. The outbreak and public and private sector responses thereto have led to large portions of the populations of many nations working from home for indefinite periods of time, temporary or permanent layoffs, disruptions in supply chains, lack of availability of certain goods, and adversely impacted many industries. These circumstances are evolving, and further developments could result in additional disruptions and uncertainty. The impact of the coronavirus outbreak may last for an extended period of time and result in a substantial economic downturn. Pandemics, including the coronavirus outbreak, have resulted in a general decline in the global economy and negative effects on the performance of individual countries, industries, or sectors. Such negative impacts can be significant in unforeseen ways. Deteriorating economic fundamentals may in turn increase the risk of default or insolvency of particular companies, negatively impact market value, increase market volatility, cause credit spreads to widen, and reduce liquidity. All of these risks may have a material adverse effect on the performance and financial condition of the Fund’s investments, and on the overall performance of the Fund.
Classification of Distributions: Net investment income/(loss) and net realized gain/(loss) may differ for financial statement and tax purposes. The character of distributions made during the year from net investment income or net realized gains may differ from its ultimate characterization for federal income tax purposes. Also, due to the timing of dividend distributions, the fiscal year in which amounts are distributed may differ from the fiscal year in which the income or realized gain was recorded by the Fund.
The tax character of the distributions paid by the Fund during the periods ended October 31, 2021 and October 31, 2020 were as follows:
| | | 2021 | | | 2020 | |
| Clough Global Long/Short Fund | | | | | | |
| | | | | | | |
| Distributions paid from: | | | | | | |
| Ordinary Income | | $ | 298,279 | | | $ | – | |
| Total | | $ | 298,279 | | | $ | – | |
| Annual Report | October 31, 2021 | 27 |
| Clough Global Long/Short Fund | Notes to Financial Statements |
| | October 31, 2021 |
Components of Earnings: Tax components of distributable earnings are determined in accordance with income tax regulations which may differ from composition of net assets reported under GAAP. Accordingly, for the year ended October 31, 2020, certain differences were reclassified. These differences relate to net operating losses.
The reclassifications were as follows:
| | Distributable earnings | | | Paid-in Capital | |
| | $ | 4,545 | | | $ | (4,545 | ) |
Ordinary and Capital Losses: Capital loss carryovers used during the period ended October 31, 2021 were $560,184.
Capital Losses arising in the post-October period of the current fiscal year may be deferred to the next fiscal year if the fund elects to defer the recognition of these losses. When this election is made, any losses recognized during the period are treated as having occurred on the first day of the next fiscal year separate from and in addition to the application of normal capital loss carry forwards as described above.
Tax Basis of Distributable Earnings: Tax components of distributable earnings are determined in accordance with income tax regulations which may differ from composition of net assets reported under GAAP.
As of October 31, 2021, the components of distributable earnings on a tax basis were as follows:
| Undistributed ordinary income | | $ | 3,870,936 | |
| Accumulated net realized gain on investments | | | 5,436,102 | |
| Net unrealized appreciation on investments | | | 8,325,555 | |
| Total | | $ | 17,632,593 | |
Tax Basis of Investments: Net unrealized appreciation/(depreciation) of investments based on federal tax costs as of October 31, 2021, was as follows:
| Gross appreciation (excess of value over tax cost) | | $ | 16,145,526 | |
| Gross depreciation (excess of tax cost over value) | | | (7,414,182 | ) |
| Net depreciation (excess of tax cost over value) of foreign currency and derivatives | | | (405,789 | ) |
| Net unrealized appreciation | | $ | 8,325,555 | |
| Cost of investments for income tax purposes | | $ | 74,051,961 | |
The difference between book and tax basis unrealized appreciation is primarily attributable to wash sales, passive foreign investment companies, notional principal contracts and accelerated recognition of unrealized gain or loss on certain futures and options.
Common Shares: There is an unlimited number of shares of beneficial interest with no par value per share. Shares redeemed within 30 days of purchase may incur a 2.00% redemption fee deducted from the redemption amount.
| Clough Global Long/Short Fund | Notes to Financial Statements |
| | October 31, 2021 |
| | | For the Year Ended October 31, 2021 | | | For the Year Ended October 31, 2020 | |
| Class I: | | | | | | |
| Beginning of period | | | 3,952,651 | | | | 3,886,012 | |
| Shares sold | | | 2,815,980 | | | | 890,105 | |
| Distributions reinvested | | | 9,293 | | | | – | |
| Shares redeemed | | | (1,643,079 | ) | | | (823,466 | ) |
| Net increase in shares outstanding | | | 1,182,194 | | | | 66,639 | |
| Shares outstanding, end of period | | | 5,134,845 | | | | 3,952,651 | |
| Investor Class: | | | | | | | | |
| Beginning of period | | | 213,246 | | | | 214,073 | |
| Shares sold | | | 63,467 | | | | 20,201 | |
| Distributions reinvested | | | 780 | | | | – | |
| Shares redeemed | | | (74,334 | ) | | | (21,028 | ) |
| Net decrease in shares outstanding | | | (10,087 | ) | | | (827 | ) |
| Shares outstanding, end of period | | | 203,159 | | | | 213,246 | |
| Class A: | | | | | | | | |
| Beginning of period | | | 374,366 | | | | 251,058 | |
| Shares sold | | | 4,906 | | | | 123,308 | |
| Distributions reinvested | | | 1,465 | | | | – | |
| Shares redeemed | | | (361,085 | ) | | | – | |
| Net increase (decrease) in shares outstanding | | | (354,714 | ) | | | 123,308 | |
| Shares outstanding, end of period | | | 19,652 | | | | 374,366 | |
| Class C: | | | | | | | | |
| Beginning of period | | | 89,793 | | | | 165,212 | |
| Shares sold | | | 7,712 | | | | 5,089 | |
| Distributions reinvested | | | 268 | | | | – | |
| Shares redeemed | | | (21,562 | ) | | | (80,508 | ) |
| Net decrease in shares outstanding | | | (13,582 | ) | | | (75,419 | ) |
| Shares outstanding, end of period | | | 76,211 | | | | 89,793 | |
Purchases and sales of investment securities, excluding securities sold short intended to be held for less than one year, short-term securities, and Long Term U.S. Government Obligations, for the year ended October 31, 2021, are listed in the table below.
| Fund | | Cost of Investments Purchased | | | Proceeds From Investments Sold | |
| Clough Global Long/Short Fund | | $ | 154,180,227 | | | $ | 142,380,643 | |
Investment transactions in U.S. Government Obligations during the year ended October 31, 2021 were as follows:
| Fund | | Cost of Investments Purchased | | | Proceeds From Investments Sold | |
| Clough Global Long/Short Fund | | $ | 4,074,648 | | | $ | 7,556,656 | |
| 5. | INVESTMENT ADVISORY AND OTHER AGREEMENTS |
Investment Advisory Agreement: Clough Capital serves as the Fund’s investment adviser pursuant to an Investment Advisory Agreement with the Fund. As compensation for its services to the Fund, the Adviser receives an annual investment advisory fee, based on the Fund’s average daily net assets, which is paid monthly. The annualized rate of this fee is 1.10%.The Adviser has agreed contractually to limit the operating expenses of each class of the Fund (excluding Rule 12b-1 Distribution and Service Fees, Shareholder Services Fees, acquired fund fees and expenses, interest, taxes, brokerage costs and commissions, dividend and interest expense on short sales, and litigation, indemnification and extraordinary expenses as determined under generally accepted accounting principles) to an annual rate of 1.25% through February 28, 2022. The Adviser is permitted to recover, on a class-by-class basis, any fees waived and/or expenses reimbursed pursuant to the waiver agreement described above to the extent that such recovery does not cause total annual operating expenses to exceed the expense limitation in effect (i) at the time the fees and/or expenses to be recovered were waived and/or reimbursed and (ii) at the time of such recovery. The Adviser will not be entitled to recover any such waived or reimbursed fees and expenses more than three years after the end of the fiscal year in which the fees were waived or expenses were reimbursed. The Adviser may not terminate this waiver arrangement without the approval of the Fund’s Board.
| Annual Report | October 31, 2021 | 29 |
| Clough Global Long/Short Fund | Notes to Financial Statements |
| | October 31, 2021 |
As of October 31, 2021, the balances of future recoupable expenses were as follows:
| | | Expires in 2022 | | | Expires in 2023 | | | Expires in 2024 | | | Total | |
| Class I | | $ | (432,912 | ) | | $ | (419,823 | ) | | $ | (507,841 | ) | | $ | (1,360,576 | ) |
| Investor Class | | $ | (24,344 | ) | | $ | (22,663 | ) | | $ | (21,197 | ) | | $ | (68,204 | ) |
| Class A | | $ | (12,710 | ) | | $ | (30,639 | ) | | $ | (17,173 | ) | | $ | (60,522 | ) |
| Class C | | $ | (26,750 | ) | | $ | (12,166 | ) | | $ | (9,021 | ) | | $ | (47,937 | ) |
Administration Agreement: The Fund currently employs ALPS Fund Services, Inc. (“ALPS”) under an administration agreement to provide certain administrative services to the Fund. As compensation for its services to the Fund, ALPS receives an annual administration fee accrued daily, paid monthly.
Transfer Agency and Service Agreement: ALPS, pursuant to a Transfer Agency and Service Agreement, serves as transfer agent for the Fund.
Distribution and Shareholder Services Plan: The Fund has adopted a separate plan of distribution for Investor Class, Class A and Class C shares, pursuant to Rule 12b-1 under the 1940 Act (each, a “Plan” and collectively, the “Plans”). ALPS Portfolio Solutions Distributor, Inc. (the “Distributor”) serves as the Fund’s distributor.
The Plans allow the Fund, as applicable, to use Investor Class, Class A and Class C assets to pay fees in connection with the distribution and marketing of Investor Class, Class A and Class C shares and/or the provision of ongoing servicing for the benefit of shareholders. Each Plan permits payment for services in connection with the administration of plans or programs that use Investor Class, Class A and/or Class C shares of the Fund as their funding medium and for related expenses.
The Plans permit the Fund to make total payments at an annual rate of up to 0.25% of the Fund’s average daily net assets attributable to its Investor Class and Class A shares, and 1.00% of the Fund’s average daily net assets attributable to its Class C shares. Because these fees are paid out of the Fund’s Investor Class, Class A and Class C shares, respectively, on an ongoing basis, over time they will increase the cost of an investment in Investor Class, Class A and Class C shares. For example, the Class C Plan fees may cost an investor more than the Investor Class and Class A Plan sales charges over time.
Under the terms of the Plans, the Trust is authorized to make payments to the Distributor for remittance to financial intermediaries, as compensation for distribution and/or the provision of on-going servicing for the benefit of shareholders performed by such financial intermediaries for their customers who are investors in the Fund. Financial intermediaries may from time to time be required to meet certain additional criteria in order to continue to receive 12b-1 fees. For Class C shares, the Distributor is entitled to retain all fees paid under the Plan for the first 12 months on any investment in Class C Shares to recoup the expenses with respect to the payment of commissions on sales of Class C Shares. Financial intermediaries will become eligible for Class C Plan compensation beginning in the 13th month following the purchase of Class C Shares, although the Distributor may, pursuant to a written agreement between the Distributor and a particular financial intermediary, pay such financial intermediary 12b-1 fees prior to the 13th month following the purchase of Class C Shares. The Distributor may retain some or all compensation payable pursuant to the Plans under certain circumstances, such as when a financial intermediary is removed as the broker of record or a financial intermediary fails to meet certain qualification standards to be eligible to continue to be the broker of record.
Shareholder Services Plan for Investor Class and Class A Shares: The Fund has adopted a non-12b-1 shareholder services plan (the “Services Plan”) with respect to the Fund’s Investor Class and Class A shares. Under the Services Plan, the Fund is authorized to pay financial intermediaries an aggregate fee in an amount not to exceed on an annual basis 0.10% of the average daily net asset value of the Investor Class and Class A shares of the Fund attributable to or held in the name of the financial intermediary for its clients as compensation for maintaining customer accounts that hold Fund shares. These activities may include, but are not limited to, establishing and maintaining Fund shareholder accounts on a transaction processing and record keeping system, providing Fund shareholders with the ability to access current Fund information, including without limitation, share balances, dividend information and transaction history, and permitting the Fund’s transfer agent to receive order instructions from or on behalf of Fund shareholders for the purchase or redemption of Shares. None of these activities include distribution services. Any amount of the Services Plan fees not paid during the Fund’s fiscal year for such servicing shall be reimbursed to the Fund.
| Clough Global Long/Short Fund | Notes to Financial Statements |
| | October 31, 2021 |
| 6. | AFFILIATED TRANSACTIONS |
The Fund may engage in cross trades with an affiliate pursuant to Rule 17a-7 under the 1940 Act. Cross trading is the buying or selling of portfolio securities between funds to which the Adviser serves as the investment adviser. The Board previously adopted procedures that apply to transactions from or to another registered investment company, or any account which is considered an affiliated account by reason of having a common investment adviser. At its regularly scheduled meetings, the Board reviews such transactions as of the most current calendar quarter for compliance with the requirements set forth in Rule 17a-7 and the Fund’s procedures. The procedures require that the transactions be a purchase or sale for no consideration other than cash payment or cash credit (to be used to purchase shares of the fund involved) against prompt delivery of a security for which market quotations are readily available, and be consistent with the investment policies of the Fund. During the year ended October 31, 2021 the Fund did not engage in cross trades.
Under the Trust’s organizational documents, its officers and trustees are indemnified against certain liabilities arising out of the performance of their duties to the Trust. Additionally, in the normal course of business, the Trust enters into contracts with service providers that contain general indemnification clauses. The Trust’s maximum exposure under these arrangements is unknown, as this would involve future claims that may be made against the Trust that have not yet occurred. However, based on experience, the Trust believes the risk of loss to be remote.
Distributions: Subsequent to October 31, 2021, the Fund paid the following distributions from ordinary income:
| Class | Ex-Date | Record Date | Payable Date | Rate (per share) |
| Investor Class | December 16, 2021 | December 15, 2021 | December 17, 2021 | $1.97667 |
| Class A | December 16, 2021 | December 15, 2021 | December 17, 2021 | $1.97671 |
| Class C | December 16, 2021 | December 15, 2021 | December 17, 2021 | $1.96102 |
| Class I | December 16, 2021 | December 15, 2021 | December 17, 2021 | $1.98863 |
| Annual Report | October 31, 2021 | 31 |
| Report of Independent Registered Public Accounting Firm |
To the Shareholders and Board of Trustees of
Clough Funds Trust
Opinion on the Financial Statements
We have audited the accompanying statement of assets and liabilities of Clough Global Long/Short Fund, constituting the Clough Funds Trust, (the “Trust”), including the statement of investments, as of October 31, 2021, and the related statement of operations for the year then ended, the statements of changes in net assets for each of the two years in the period then ended, the financial highlights for each of the five years in the period then ended and the related notes (collectively referred to as the “financial statements”). In our opinion, the financial statements present fairly, in all material respects, the financial position of the Trust at October 31, 2021, the results of its operations for the year then ended, the changes in its net assets for each of the two years in the period then ended and its financial highlights for each of the five years in the period then ended, in conformity with U.S. generally accepted accounting principles.
Basis for Opinion
These financial statements are the responsibility of the Trust’s management. Our responsibility is to express an opinion on the Trust’s financial statements based on our audits. We are a public accounting firm registered with the Public Company Accounting Oversight Board (United States) ("PCAOB") and are required to be independent with respect to the Trust in accordance with the U.S. federal securities laws and the applicable rules and regulations of the Securities and Exchange Commission and the PCAOB.
We conducted our audits in accordance with the standards of the PCAOB. Those standards require that we plan and perform the audit to obtain reasonable assurance about whether the financial statements are free of material misstatement, whether due to error or fraud. The Trust is not required to have, nor were we engaged to perform, an audit of the Trust’s internal control over financial reporting. As part of our audits we are required to obtain an understanding of internal control over financial reporting but not for the purpose of expressing an opinion on the effectiveness of the Trust’s internal control over financial reporting. Accordingly, we express no such opinion.
Our audits included performing procedures to assess the risks of material misstatement of the financial statements, whether due to error or fraud, and performing procedures that respond to those risks. Such procedures included examining, on a test basis, evidence regarding the amounts and disclosures in the financial statements. Our procedures included confirmation of securities owned as of October 31, 2021, by correspondence with the custodians and others or by other appropriate auditing procedures where replies from others were not received. Our audits also included evaluating the accounting principles used and significant estimates made by management, as well as evaluating the overall presentation of the financial statements. We believe that our audits provide a reasonable basis for our opinion.

We have served as the Trust’s auditor since 2015.
Boston, Massachusetts
December 23, 2021
| Clough Global Long/Short Fund | Liquidity Risk Management Program |
| | October 31, 2021 (Unaudited) |
The Trust has established a liquidity risk management program (the “Program”) to govern the Trust’s approach to managing liquidity risk for the Fund. The Program is overseen by the Liquidity Committee (the “Committee”), a committee comprised of representatives of the Trust. The Board has approved the designation of the Committee to oversee the Program.
The Program’s principal objectives include supporting the Fund’s compliance with limits on investments in illiquid assets and mitigating the risk that the Fund will be unable to meet its redemption obligations in a timely manner. The Program also includes a number of elements that support the management and assessment of liquidity risk, including, among others, an annual assessment of factors that influence the Fund’s liquidity, the periodic classification and re-classification of the Fund’s investments into groupings that reflect the Committee’s assessment of their relative liquidity under both current market conditions and reasonably foreseeable stressed conditions, as well as minimum levels of highly liquid investments.
At a meeting that occurred on October 13, 2021, the Board received a report from the Committee that addressed the operation of the Program and assessed its adequacy and effectiveness of the Program from August 1, 2020 through July 31, 2021. The report stated that, during the period covered by the report, there were no liquidity events that impacted the Fund or its ability to timely meet redemptions without dilution to existing shareholders. The report further discussed the liquidity classification methodology of the Fund, the effectiveness of the operation of the Fund’s Highly Liquid Investment Minimum (“HLIM”) where applicable, and the liquidity classification of the Fund’s investments over the period. The report further noted that no material changes have been made to the Program since its implementation. The report provided to the Board included a conclusion that the Program appeared to be reasonably designed and operated effectively during the review period.
.
| Annual Report | October 31, 2021 | 33 |
| Clough Global Long/Short Fund | Additional Information |
| | October 31, 2021 (Unaudited) |
FUND PROXY VOTING POLICIES & PROCEDURES
The Fund’s policies and procedures used in determining how to vote proxies relating to portfolio securities are available on the Fund’s website at http://www.cloughglobal.com. Information regarding how the Fund voted proxies relating to portfolio securities held by the Fund for the period ended June 30, are available without charge, upon request, by contacting the Fund at 1-855-425-6844 and on the Commission’s website at http://www.sec.gov.
PORTFOLIO HOLDINGS
The Fund files its complete schedule of portfolio holdings with the Commission for each fiscal quarter on Form N-PORT within 60 days after the end of the period. Copies of the Fund’s Form N-PORT are available without a charge, upon request, by contacting the Fund at 1-855-425-6844 and on the Commission’s website at http://www.sec.gov.
| Clough Global Long/Short Fund | Trustees & Officers |
| | October 31, 2021 (Unaudited) |
| Name, Address* & Year of Birth | Position(s) Held with Trust | Term of Office and Length of Time Served** | Principal Occupation(s) During Past 5 Years | Number of Funds in Fund Complex Overseen by Trustee*** | Other Directorships Held by Trustee |
| Independent Trustees | | | | | |
| Clifford J. Weber 1963 | Trustee and Chairman | Trustee since 2015 and Chairman since 2017 | Mr. Weber is the founder of Financial Products Consulting Group, LLC (a consulting firm). Prior to starting Financial Products Consulting Group, he was the Executive Vice President – Global Index and Exchange Traded Products of the NYSE, a subsidiary of Intercontinental Exchange, from 2013 to 2015. Previously, Mr. Weber was the Executive Vice President – Head of Strategy and Product Development of NYSE Liffe U.S., a division of NYSE Euronext, from 2008 to 2013, and held various positions with the American Stock Exchange from 1990 to 2008. | 4 | Janus Detroit Street Trust (6 funds); Clayton Street Trust (3 funds); Clough Global Equity Fund (1 fund); Clough Global Dividend and Income Fund (1 fund); Clough Global Opportunities Fund (1fund); Global X Funds (77 funds). |
| Jeremy W. Deems 1976 | Trustee | Since 2015 | Mr. Deems is the Co-Founder, Chief Compliance Officer and Chief Financial Officer of Green Alpha Advisors, LLC, a registered investment advisor, and Co-Portfolio Manager of the Shelton Green Alpha Fund. Prior to joining Green Alpha Advisors, Mr. Deems was CFO and Treasurer of Forward Management, LLC, ReFlow Management Co., LLC, ReFlow Fund, LLC, a private investment fund, and Sutton Place Management, LLC (an administrative services company) from 1998 to June 2007. From 2004 to 2005, Mr. Deems also served as Treasurer of the Forward Funds and the Sierra Club Funds. | 2 | Mr. Deems is a Trustee of ALPS ETF Trust (16 funds); ALPS Variable Investment Trust (7 funds); Financial Investors Trust (33 funds); and Reaves Utility Income Fund (1 fund). |
| James M. Maxwell 1954 | Trustee | Since 2015 | Mr. Maxwell is President of SPAD Associates (a private investigation and consulting company) and an Associate at Buckley Petersen Global (an investigative and security expertise firm). Prior to joining SPAD Associates and Buckley Petersen Global, he was the Vice President of Corporate Security for Credit Suisse from 2006 to 2008. Previously, he was a Special Agent with the Federal Bureau of Investigation from 1982 to 2006. | 1 | None |
| Annual Report | October 31, 2021 | 35 |
| Clough Global Long/Short Fund | Trustees & Officers |
| | October 31, 2021 (Unaudited) |
| Name, Address* & Year of Birth | Position(s) Held with Trust | Term of Office and Length of Time Served** | Principal Occupation(s) During Past 5 Years | Number of Funds in Fund Complex Overseen by Trustee*** | Other Directorships Held by Trustee |
| Interested Trustees | | | | | |
| Edmund J. Burke 1961 | Trustee | Since 2015 | Mr. Burke joined ALPS in 1991 and served as the President and Director of ALPS Holdings, Inc., and ALPS Advisors, Inc., and Director of ALPS Distributors, Inc., ALPS Fund Services, Inc., and ALPS Portfolio Solutions Distributor, Inc. Mr. Burke retired from ALPS in June 2019. Mr. Burke is an “interested person” as defined by the 1940 Act on account of his former positions with ALPS and its affiliates. | 5 | Mr. Burke is a Trustee/Director of Financial Investors Trust (33 funds); Liberty All-Star Equity Fund (1 fund); Liberty All-Star Growth Fund, Inc. (1 fund); Clough Global Equity Fund (1 fund); Clough Global Dividend and Income Fund (1 fund); Clough Global Opportunities Fund (1fund); ALPS ETF Trust (16 funds). |
| Kevin McNally 1969 | Trustee | Trustee since 2017 | Mr. McNally has over 28 years of industry experience focusing almost exclusively on closed-end funds. Mr. McNally is currently a Managing Director at Clough and serves as the portfolio manager for an investment fund advised by Clough that invests primarily in closed-end funds. Prior to joining Clough Capital Partners L.P. in 2014, he served as the Director of Closed-End Funds at ALPS Fund Services, Inc. from 2003 to 2014, was Director of Closed-End Fund and ETF Research at Smith Barney, a division of Citigroup Global Markets, Inc. from 1998 to 2003, and Director of Closed-End Fund and ETF Marketing at Morgan Stanley Dean Witter Discover & Co. from 1997 to 1998. Previously, he was an Analyst covering closed-end funds in the Mutual Fund Research Department at Merrill Lynch, Pierce, Fenner, & Smith, Inc. from 1994 to 1997, and also was Manager of the Closed- End Fund Marketing Department at Prudential Securities from 1992 to 1994. Mr. McNally received a B.A. degree from the University of Massachusetts at Amherst in 1991 and an MBA in Finance from New York University’s Stern School of Business in 1998. Mr. McNally is an “interested person” as defined by the 1940 Act on account of his current position with Clough. | 4 | Clough Global Dividend and Income Fund (1 fund); Clough Global Opportunities Fund (1 fund); and Clough Global Equity Fund (1 fund). |
| Clough Global Long/Short Fund | Trustees & Officers |
| | October 31, 2021 (Unaudited) |
| Name, Address* & Year of Birth | Position(s) Held with Trust | Term of Office and Length of Time Served** | Principal Occupation(s) During Past 5 Years |
| Officers | | | |
| Dawn Cotten 1977 | President | Since 2021 | Ms. Cotten joined ALPS in 2009 and is currently Senior Vice President of Fund Administration and Relationship Management of ALPS. She has served in that role since January 2020. Prior to that, Ms. Cotten served as Senior Vice President of Relationship Management (2017-2020). Ms. Cotten served as a VP in Relationship Management from 2013-2017. Ms. Cotten also serves as President of ALPS Series Trust, Clough Global Dividend and Income Fund, Clough Global Equity Fund, Clough Global Opportunities Fund, and Financial Investors Trust. |
| Ryan Johanson 1982 | Treasurer | Since 2021 | Mr. Johanson joined ALPS in 2014 is currently a Fund Controller of ALPS. He has served in that role since 2016. Prior to that, Mr. Johanson has served as a Financial Reporting Manager at ALPS (Jul. 2014 – Jul. 2016). Mr. Johanson also serves as Treasurer for Clough Global Dividend and Income Fund, Clough Global Equity Fund, and Clough Global Opportunities Fund, Cambria ETF Trust, and the Alpha Alternative Assets Fund. |
| Lucas Foss 1977 | Chief Compliance Officer and Anti-Money Laundering Chief Compliance Officer | Since 2018 | Mr. Foss has over 17 years of experience within the fund services industry and currently serves as Vice President and Deputy Chief Compliance Officer at ALPS Fund Services, Inc. (“ALPS”). Prior to rejoining ALPS in November 2017, Mr. Foss served as the Director of Compliance at Transamerica Asset Management (“TAM”) beginning in July 2015. Previous to TAM, Mr. Foss was Deputy Chief Compliance Officer at ALPS. Mr. Foss received a B.A. in Economics from the University of Vermont and holds the Certified Securities Compliance Professional (CSCP) designation. |
| Sareena Khwaja-Dixon 1980 | Secretary | Since 2019 | Ms. Khwaja-Dixon joined ALPS in August 2015 and is currently Principal Legal Counsel and Vice President of ALPS Fund Services, Inc. Ms. Khwaja-Dixon is also Secretary of Reaves Utility Income Fund, RiverNorth Opportunities Fund, Inc., Clough Dividend and Income Fund, Clough Global Opportunities Fund, Clough Global Equity Fund, Liberty All-Star Equity Fund and Liberty All- Star Growth Fund, Inc. and Assistant Secretary of WesMark Funds, RiverNorth Specialty Finance Corp, RiverNorth/DoubleLine Strategic Opportunity Fund, Inc., RiverNorth Flexible Municipal Income Fund, Inc., RiverNorth Managed Duration Municipal Income Fund, Inc., RiverNorth Funds and RiverNorth Opportunistic Municipal Income Fund, Inc. |
| Alex Marks 1974 | Assistant Secretary | Since 2021 | Mr. Marks joined ALPS in 2006 and is currently Senior Paralegal Manager of ALPS. Mr. Marks is also Assistant Secretary of the Alpha Alternative Assets Fund. |
| Annual Report | October 31, 2021 | 37 |
| Clough Global Long/Short Fund | Trustees & Officers |
| | October 31, 2021 (Unaudited) |
| * | All communications to Trustees and Officers may be directed to Clough Funds Trust, 1290 Broadway, Suite 1000, Denver, Colorado 80203, except for Mr. McNally. For Mr. McNally, all communications may be sent to Clough Capital Partners L.P., 53 State Street, 27th Floor, Boston, Massachusetts 02109. |
| ** | This is the period for which the Trustee or Officer began serving the Trust. Each Trustee and Officer serves an indefinite term, until his successor is elected or appointed, or until he or she sooner dies, resigns or is removed. |
| *** | The Fund Complex consists of the Fund, Clough Global Dividend and Income Fund, Clough Global Equity Fund, Clough Global Opportunities Fund and Clough China Fund, a series of the Financial Investors Trust. Mr. Burke is a member of the Board of each such fund. Mr. Weber and Mr. McNally are members of the Board of each such fund other than the Clough China Fund. Mr. Deems is a member of the Board of the Fund and Clough China Fund. |
The Statement of Additional Information includes additional information about the Fund’s Trustees and is available, without a charge, upon request, by contacting the Fund at 1-855-425-6844.
| Clough Global Long/Short Fund | Privacy Policy |
| | October 31, 2021 (Unaudited) |
| FACTS | WHAT DOES THE CLOUGH GLOBAL LONG/SHORT FUND (THE “FUND”) |
| | DO WITH YOUR PERSONAL INFORMATION? |
| WHY? | Financial companies choose how they share your personal information. Federal law gives consumers the right to limit some but not all sharing. Federal law also requires us to tell you how we collect, share, and protect your personal information. Please read this notice carefully to understand what we do. |
| WHAT? | The types of personal information we collect and share depend on the product or service you have with us. This information can include: |
| | · Social security number and income; |
| | · Account balances and transaction history; |
| | · Assets and investment experience. |
| HOW? | All financial companies need to share customers’ personal information to run their everyday business. In the section below, we list the reasons financial companies can share their customers’ personal information; the reasons the Fund chooses to share such information; and whether you can limit this sharing |
| Reasons we can share your personal information | Does the Fund Share? | Can you limit this sharing? |
| For our everyday business purposes—such as to process your transactions, maintain your account(s), respond to court orders and legal investigations, or report to credit bureaus | Yes | No |
| For our marketing purposes—to offer our products and services to you | No | We do not share. |
| For joint marketing with other financial companies | No | We do not share. |
For our affiliates’ everyday business purposes— information about your transactions and experiences | Yes | No |
For our affiliates’ everyday business purposes— information about your creditworthiness | No | We do not share. |
| For nonaffiliates to market to you | No | We do not share. |
| QUESTIONS? | Call 855.425.6844 or go to www.cloughglobalfunds.com. |
| WHO WE ARE | |
| Who is providing this notice? | Clough Global Long/Short Fund |
| WHAT WE DO | |
| How does the Fund protect my personal information? | To protect your personal information from unauthorized access and use, we use security measures that comply with federal law. These measures include computer safeguards and secured files and buildings. |
| How does the Fund collect my personal information? | We collect your personal information, for example, when you open an account, provide account information or give us your contact information, make a wire transfer or deposit money |
| Why can’t I limit all sharing? | Federal law gives you the right to limit only: · sharing for affiliates’ everyday business purposes — information about your creditworthiness · affiliates from using your information to market to you · sharing for non-affiliates to market to you State laws and individual companies may give you additional rights to limit sharing. |
| Annual Report | October 31, 2021 | 39 |
| Clough Global Long/Short Fund | Privacy Policy |
| | October 31, 2021 (Unaudited) |
| DEFINITIONS | |
| Affiliates | Companies related by common ownership or control. They can be financial and nonfinancial companies. |
| Non-affiliates | Companies not related by common ownership or control. They can be financial and nonfinancial companies. · The Fund does not share with non-affiliates so they can market to you. |
| Joint marketing | A formal agreement between non-affiliated financial companies that together market financial products or services to you. · The Fund does not jointly market. |
| Other Important Information | |
| California Residents | If your account has a California home address, your personal information will not be disclosed to nonaffiliated third parties except as permitted by applicable California law, and we will limit sharing such personal information with our affiliates to comply with California privacy laws that apply to us. |
| Vermont Residents | The State of Vermont requires financial institutions to obtain your consent prior to sharing personal information that they collect about you with affiliated companies and nonaffiliated third parties other than in certain limited circumstances. Except as permitted by law, we will not share personal information we collect about you with nonaffiliated third parties or other affiliated companies unless you provide us with your written consent to share such information. |

| (a) | The registrant, as of the end of the period covered by this report, has adopted a code of ethics that applies to the registrant’s principal executive officer, principal financial officer, principal accounting officer or controller or any persons performing similar functions on behalf of the registrant. |
| (c) | During the period covered by this report, no amendments to the provisions of the code of ethics referenced in Item 2(a) above were made. |
| (d) | During the period covered by this report, no implicit or explicit waivers to the provisions of the code of ethics referenced in Item 2(a) above were granted. |
| (f) | The registrant’s Code of Ethics is attached as an Exhibit to this report. |
| Item 3. | Audit Committee Financial Expert. |
The Board of Trustees of the registrant has determined that the registrant has at least one Audit Committee Financial Expert serving on its audit committee. The Board of Trustees of the registrant has designated Jeremy Deems, as the registrant’s “Audit Committee Financial Experts.” Mr. Deems is “independent” as defined in paragraph (a)(2) of Item 3 to Form N-CSR.
| Item 4. | Principal Accountant Fees and Services. |
| (a) | Audit Fees: For the registrant’s fiscal years ended October 31, 2021 and October 31, 2020, the aggregate fees billed for professional services rendered by the principal accountant for the audit of the registrant’s annual financial statements were $30,000 and $30,000, respectively. |
| (b) | Audit-Related Fees: For the registrant’s fiscal years ended October 31, 2021 and October 31, 2020, the aggregate fees billed for assurance and related services by the principal accountant that were reasonably related to the performance of the audit of the registrant’s financial statements and are not reported under paragraph (a) of this Item were $0 and $0, respectively. |
| (c) | Tax Fees: For the registrant’s fiscal years ended October 31, 2021 and October 31, 2020, the aggregate fees billed for professional services rendered by the principal accountant for tax compliance, tax advice and tax planning were $13,000 and $13,000, respectively. The fiscal year 2021 and 2020 tax fees were for services for dividend calculation, excise tax preparation and tax return preparation. |
| (d) | All Other Fees: For the registrant’s fiscal years ended October 31, 2021 and October 31, 2020, no fees were billed to registrant by the principal accountant for services rendered. |
| (e)(1) | Audit Committee Pre-Approval Policies and Procedures: All services to be performed by the registrant’s principal accountant must be pre-approved by the registrant’s audit committee or to its delegate as provided in the audit committee charter. |
| (e)(2) | No services described in paragraphs (b) through (d) of this Item were approved by the registrant’s audit committee pursuant to paragraph (c)(7)(i)(C) of Rule 2-01 of Regulation S-X. |
| (g) | The aggregate non-audit fees billed by the registrant’s accountant for services rendered to the registrant, and rendered to the registrant’s investment adviser (not including any sub-adviser whose role is primarily portfolio management and is subcontracted with or overseen by another investment adviser), and any entity controlling, controlled by, or under common control with the adviser that provides ongoing services to the registrant, were $[ ] and $0 in the fiscal years ended October 31, 2021 and October 31, 2020, respectively, other than those fees set forth in response to paragraph (c) of this Item. |
| (h) | The registrant’s audit committee has considered whether the provision of non-audit services that were rendered to the registrant’s investment adviser (not including any sub-adviser whose role is primarily portfolio management and is subcontracted with or overseen by another investment adviser), and any entity controlling, controlled by, or under common control with the investment adviser that provides ongoing services to the registrant that were not pre-approved pursuant to paragraph (c)(7)(ii) of Rule 2-01 of Regulation S-X, is compatible with maintaining the principal accountant’s independence and has determined that the provision of such non-audit services is compatible with maintaining the principal accountant’s independence. |
| Item 5. | Audit Committee of Listed Registrants. |
Not applicable to registrant.
| (a) | Schedule of Investments is included as part of the Report to Stockholders filed under Item 1 of this Form N-CSR. |
| Item 7. | Disclosure of Proxy Voting Policies and Procedures for Closed-End Management Investment Companies. |
Not applicable to the registrant.
| Item 8. | Portfolio Managers of Closed-End Management Investment Companies. |
Not applicable to the registrant.
| Item 9. | Purchases of Equity Securities by Closed-End Management Investment Company and Affiliated Purchasers. |
Not applicable to the registrant.
| Item 10. | Submission of Matters to a Vote of Security Holders. |
There have been no material changes by which shareholders may recommend nominees to the Board of Trustees.
| Item 11. | Controls and Procedures. |
| (a) | The registrant’s principal executive officer and principal financial officer have evaluated the registrant’s disclosure controls and procedures (as defined in Rule 30a-3(c) under the Investment Company Act of 1940, as amended) within 90 days of this report and have concluded that the registrant’s disclosure controls and procedures were effective as of that date. |
| (b) | There was no change in the registrant’s internal control over financial reporting (as defined in Rule 30a-3(d) under the Investment Company Act of 1940, as amended) during the period covered by this report that has materially affected, or is reasonably likely to materially affect, the registrant’s internal control over financial reporting. |
| Item 12. | Disclosure of Securities Lending Activities for Closed-End Management Investment Companies. |
Not applicable to registrant.
| (a)(4) | Not applicable to registrant. |
SIGNATURES
Pursuant to the requirements of the Securities Exchange Act of 1934 and the Investment Company Act of 1940, the Registrant has duly caused this report to be signed on its behalf by the undersigned, thereunto duly authorized.
| CLOUGH FUNDS TRUST | |
| | | |
| By: | /s/ Dawn Cotten | |
| | Dawn Cotten | |
| | President/Principal Executive Officer | |
| | | |
| Date: | January 7, 2022 | |
Pursuant to the requirements of the Securities Exchange Act of 1934 and the Investment Company Act of 1940, this report has been signed below by the following persons on behalf of the Registrant and in the capacities and on the dates indicated.
| CLOUGH FUNDS TRUST | |
| | | |
| By: | /s/ Dawn Cotten | |
| | Dawn Cotten | |
| | President/Principal Executive Officer | |
| | | |
| Date: | January 7, 2022 | |
| By: | /s/ Ryan Johanson | |
| | Ryan Johanson | |
| | Treasurer/Principal Financial Officer | |
| | | |
| Date: | January 7, 2022 | |