united states
securities and exchange commission
washington, d.c. 20549
form n-csr
certified shareholder report of registered management
investment companies
Investment Company Act file number 811-23066
Northern Lights Fund Trust IV
(Exact name of registrant as specified in charter)
225 Pictoria Drive , Suite 450,Cincinnati, Ohio 45246
(Address of principal executive offices) (Zip code)
Wendy Wang, Ultimus Fund Solutions, LLC.
4221 North 203rd Street, Suite 100 Elkhorn, Nebraska 68022-3474
(Name and address of agent for service)
Registrant's telephone number, including area code: 631-470-2600
Date of fiscal year end: 2/29
Date of reporting period: 2/29/2024
Item 1. Reports to Stockholders.
 |
| Monarch Ambassador Income ETF |
| MAMB |
| Monarch Blue Chips Core ETF |
| MBCC |
| Monarch ProCap ETF |
| MPRO |
| Annual Report |
| February 29, 2024 |
| 1-541-291-4405 |
| www.monarchfunds.com |
| Distributed by Northern Lights Distributors, LLC. |
| Member FINRA/SIPC |
| Letter to Shareholders |
| February 29, 2024 |
Dear Shareholders,
We are pleased to provide our Annual Letter to Shareholders of the Monarch Ambassador Income ETF, the Monarch Blue Chips Core ETF and the Monarch ProCap ETF (collectively, the “Monarch Funds” or the “Funds”).
The Monarch Funds are advised by Kingsview Wealth Management, LLC, an SEC-registered investment adviser comprised of experienced thought leaders and innovators within the financial industry. We are committed to a culture of excellence, providing services to serve a broad range of investors due to our diverse offerings.
Our dynamic approach to investment management creates a methodology that attempts to give investors robust exposure to traditional and non-traditional asset classes and allows our portfolio management team to be opportunistic in the process. Our Portfolio Investment Team has extensive experience developing a wide range of investment strategies and products that can help all types of investors meet their financial objectives.
Performance review
The fiscal year ended February 29, 2024, and especially the last three months of such year, proved to be a feel-good period for many investors and one that felt more comfortable and similar to what we have experienced in the market for much of the past decade and a half. Inflation data continued to fall, or at least stabilize, throughout the year and GDP growth continued to be positive as the Federal Reserve continues to strive for the “soft landing” during this recent economic transition.
The S&P 500 Total Return Index posted a gain of 30.45%, while the NASDAQ Index rose 40.47%, and the Russell 1000 Value Total Return Index increased 14.01% for the fiscal year ended February 29, 2024. Fixed income also saw increases across the board as treasuries rose with the ICE US Treasury 3-7 Year Bond Index up 3.54% over the same period, while the Bloomberg US Aggregate Bond Total Return Index increased 3.33%. High yield saw the iBoxx USD Liquid High Yield Index gain 10.40% for the fiscal year ended February 29, 2024. Not surprisingly, the recent increase in equity and fixed income performance was accompanied by reduced levels of market volatility. The CBOE Volatility Index, which began the fiscal period near 20 and peaked just above 26, finished the fiscal year below 14.
While mixed economic data points and general global turmoil persist, many market participants appear to be trying to decipher the Federal Reserve’s next move. The Federal Reserve still holds the key to any rate changes, but, as we start a new year, predictions of lower
1
| Letter to Shareholders |
forward rates seem to be gaining momentum. By indicating a period of less stringent policy may be ahead, the Federal Reserve has seemingly invited investors to introduce more risk taking via buying activity in stocks as well as enticing more borrowing/financing of projects which may be supported by an increased appetite for bonds.
The Monarch Funds employ fully objective and proprietary investment models. These models are continually subject to rigorous analysis of all relevant data in an effort to determine the current phase of the economic cycle and the optimal allocations for each strategy, seeking potential pockets for outperformance in an otherwise uncertain growth environment.
Monarch Ambassador Income ETF (MAMB)
The Monarch Ambassador Income ETF aims to provide investors conservative growth with reduced volatility due to investment choice flexibility and an attempt at low correlation. Fixed income investments span various durations as well as issuer and credit quality. Alternative allocations to traditional fixed income highlight a broad range from commodity ETFs, such as gold, to currency ETFs. The strategy employs the belief that one must look beyond traditional options when selecting their fixed income and total return exposure. Non-traditional options can be advantageous and complement, or in some cases offset, the risks that traditional fixed income markets encounter.
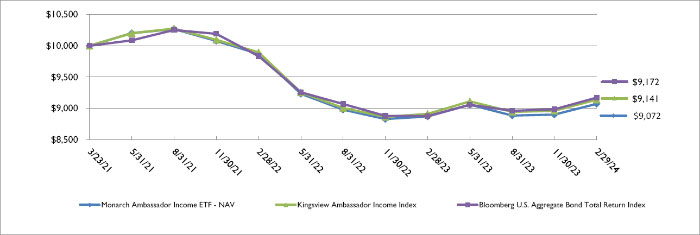
For the fiscal year ended February 29, 2024, the Monarch Ambassador Income ETF returned 2.28%. The Kingsview Ambassador Income Index, which the Fund sought to replicate before fees and expenses, returned 2.57% over the same period. This compares to a gain of 3.33% for the Bloomberg US Aggregate Bond Total Return Index (the “AGG”). With the Fed rate tightening continuing throughout much of the fiscal year and inflation slowing significantly since its peak in 2022, the interest rate yield curve varied widely between durations and credit qualities of debt. As the Fund attempted to navigate this volatility, some underlying components experienced a similar volatility profile to that of the AGG (or in some cases slightly more volatility). In addition, several of the Fund’s allocations negatively contributed to the Fund’s performance due to their higher sensitivity to the higher interest rate environment. As a result, the Fund underperformed the AGG for the fiscal year.
Monarch Blue Chips Core ETF (MBCC)
The Monarch Blue Chips Core ETF adheres to a strict set of portfolio mandates in an attempt to make prudent allocation decisions regardless of the market cycle. The result is continuous allocation to what the Fund believes are 24 high conviction companies. Portfolios that feature increased position exposure provide diversified stock selection that many fundamental investors have accepted as industry standard. In doing so, returns tend to track that of the Kingsview Blue Chips Core Index which represents the Fund’s benchmark. The Fund provides
2
| Letter to Shareholders |
for the investor searching for alpha, a fleet of what it believes are high quality names based on a proven, repeatable process.
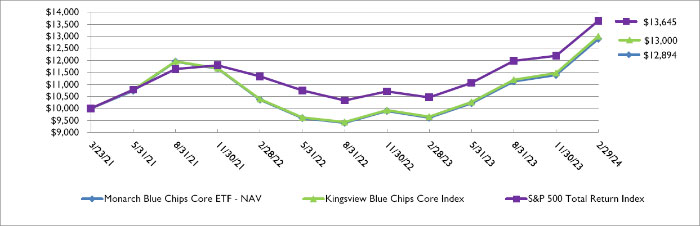
For the fiscal year ended February 29, 2024, the Monarch Blue Chips Core ETF returned 34.13%. The Kingsview Blue Chips Core Index, which MBCC sought to replicate before fees and expenses, returned 34.66% over the same period. This compares to a gain of 30.45% for the S&P 500 Total Return Index. The Fund’s holdings migrated to a more growth-oriented tone over the course of the fiscal year ended February 29, 2024, as valuations remained attractive. The Fund’s exposures to sectors like technology, healthcare and consumer staples were driven by key metrics like gross revenue delta, net income change percentage and profit margin factors. The net impact of the Fund’s active stock selections resulted in the Fund overperforming the S&P 500 Total Return Index during the fiscal year.
Monarch ProCap ETF (MPRO)
The Monarch ProCap ETF’s proprietary analysis of economic data results in the attempt to optimally position the Fund for the current economic outlook. As changes to the economic cycle occur, the Fund attempts to properly adjust equity, fixed income and alternative allocations to maximize returns. Equity investments feature specific sector selection while fixed income investments span various durations as well as issuer and credit quality. Alternative investments highlight a broad range from commodity ETFs, such as gold, to currency ETFs.
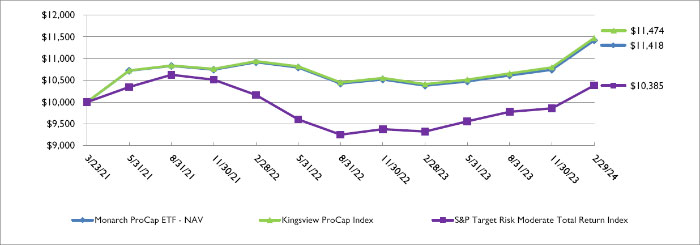
For the fiscal year ended February 29, 2024, the Monarch ProCap ETF returned 10.01%. The Kingsview ProCap Index, which the Fund sought to replicate before fees and expenses, returned 10.18% over the same period. This compares to a gain of 11.36% for the S&P Target Risk Moderate Total Return Index. In general, the Fund’s implementation of tactical positioning between fixed income instruments and equity instruments proved timely during the fiscal year, however the Fund still trailed the return of the S&P Target Risk Moderate Total Return Index. Tactical sector selections on the equity side of the portfolio’s ledger, namely consumer staples, real estate and utilities, detracted from the Fund’s overall performance, while the fixed income expressions kept solid pace with the overall aggregated bond market during the fiscal year.
Investment outlook
The fiscal year ended February 29, 2024, saw asset prices gain considerable ground back from the lows in the fall of 2022. We believe this can be attributed mostly to what appears to be predictable and measurably slowing inflation data aligning with expectations. The mythical Fed “soft landing” and pivot that many investors are holding onto tightly for may be near.
The new normal now appears to be here with higher rates and markets in general seem to have adapted to this reality and digested some if not all inflation concerns. In our opinion, it is likely that the full effects of this tightening cycle have yet to be seen, and this is partly a reason
3
| Letter to Shareholders |
that the markets may run even higher in 2024 if participants feel that more wrinkles are getting ironed out.
The macroeconomic landscape is showing signs of resilience and recovery. Economic indicators point towards sustained growth, driven by factors such as subdued inflation, robust jobs reports, and expanding earnings for companies. Higher interest rates have created opportunities for investors to rebalance their asset allocations accordingly, including re-entering what for the past few years has been a difficult fixed income market to navigate.
While challenges persist, including geopolitical uncertainties across the world, continuing supply chain issues, and a pivotal US election in November, we believe our proactive approach to risk management and operational efficiency helps prepare us to navigate uncertainties and seize opportunities.
With the market nearing all-time highs and the global economy expanding, we must stay the course on our time-tested and proven processes even when it feels like markets can only go higher. Given the Funds’ latest performance metrics and our strict adherence to our disciplined approach to the data, we are pleased with the results and positioning the Monarch Funds are currently demonstrating.
We thank you for your continued support and confidence in our management.
Sincerely,

Scott Martin, Chief Investment Officer
Kingsview Wealth Management, LLC
4
| Letter to Shareholders |
Portfolio Investment Team
Scott D. Martin, CIMA®, is Chief Investment Officer of Kingsview Wealth Management, a Registered Investment Advisor based in Chicago, Illinois. He also serves as a Contributor to the Fox News Channel and is a Contributor to The Futures Institute at the Chicago Mercantile Exchange (CME). Prior to Kingsview, Mr. Martin was Chief Market Strategist at United Advisors, LLC, a wealth management firm based in New York City, where he was co-chairman of the firm’s investment committee and was responsible for portfolio strategy utilized by both firm and third-party clients. Mr. Martin began his highly regarded career at Astor Asset Management in Chicago, where he was co-portfolio manager on all of Astor’s ETF-based separate account programs and Astor’s mutual fund complex, which launched in 2009.
Neil R. Peplinski, CFA®, is a portfolio manager at Kingsview. With over 20 years of professional experience, Neil is responsible for research, investment analysis and the development of new investment strategy models. Prior to Kingsview, he co-founded Cedar Capital, a partner company of Good Harbor Financial, where he served as Chief Investment Officer. He also served as portfolio manager and quantitative analyst for Allstate Investments. Neil earned an MBA with High Honors from The University of Chicago Booth School of Business, an MSEE from the University of Michigan and a BSEE from The Michigan Technological University, where he graduated summa cum laude.
Yash Patel , CFA®, is a portfolio manager at Kingsview and brings over 15 years of professional experience to the firm. Prior to Kingsview, Yash served as Cedar Capital’s Chief Operating Officer at Cedar Capital, where his responsibilities include the management and leadership of operations, technology, trading, and portfolio management. Yash was also a quantitative equity analyst for Allstate Investments, developing and implementing model-driven trading strategies. Previous to that, he worked and consulted for hedge funds, including Bridgewater Associates and Citadel Investment Group. Yash earned an MBA with Honors from The University of Chicago Booth School of Business and a BS CSE from The Ohio State University.
5
| Letter to Shareholders |
The S&P 500 Total Return Index is the total return version of the S&P 500 Index which includes the effects of reinvested dividends. The S&P 500 Index is a capitalization-weighted index of 500 stocks designed to measure the performance of the broad economy through changes in the aggregate market value representing all major industries.
The Bloomberg US Aggregate Bond Total Return Index is an index designed to provide a measure of the performance of the U.S. investment grade bond market, which includes investment grade U.S. Government bonds, investment grade corporate bonds, mortgage pass through securities and asset backed securities that are publicly offered for sale in the U.S. The securities in the index must have at least 1 year to maturity. In addition, the securities must be denominated is US dollars and must be fixed rate, nonconvertible, and taxable.
The S&P Target Risk Moderate Total Return Index is a multi-asset class index, corresponding to a moderate risk level. The asset class mix is determined once per year through a process designed to reflect the overall opportunity of the markets represented, adjusted for specific risk levels.
The NASDAQ Composite Index is a market-capitalization weighted index of the more than 3,000 common equities listed on the NASDAQ stock exchange.
The Russell 1000 Value Total Return Index measures the performance of those Russell 1000 companies with higher I/B/E/S forecast medium-term growth (2-year) and sales per share historical growth (5-year) measures.
The ICE U.S. Treasury 3-7 Year Bond Index measures the performance of public obligations of the U.S. Treasury that have a remaining maturity of greater than or equal to three years and less than seven years.
The iBoxx USD Liquid High Yield Index is a modified market-value weighted index designed to provide a balanced representation of U.S. dollar-denominated high yield corporate bonds for sale within the United States by means of including the most liquid high yield corporate bonds available as determined by the index provider.
The CBOE Volatility Index (the “VIX”) reflects a market estimate of future volatility, based on the weighted average of the implied volatilities for a wide range of S&P 500 index options.
Investments cannot be made directly in an index. Unmanaged index returns assume the reinvestment of any distributions and do not reflect fees, expenses, or sales charges. Index performance is not indicative of the performance of any investment.
This information is being provided for informational purposes only, is subject to change. The opinions expressed in this letter represent the current, good-faith views of the author at the time of publication. The information contained herein is based on internal research derived from various sources and does not purport to be statements of all material facts relating to the securities mentioned. The information contained herein, while not guaranteed as to accuracy or completeness, has been obtained from sources we believe to be reliable. Fund holdings are subject to change without notice.
8070-NLD-04/16/2024
6
| Monarch Ambassador Income ETF |
| PORTFOLIO REVIEW (Unaudited) |
| February 29, 2024 |
The Fund’s performance figures* for the year ended February 29, 2024, as compared to its benchmarks:
| One Year | Since Inception** | |
| Monarch Ambassador Income ETF - NAV | 2.28% | (3.26)% |
| Monarch Ambassador Income ETF - Market Price | 2.33% | (3.26)% |
| Kingsview Ambassador Income Index *** | 2.57% | (3.01)% |
| Bloomberg U.S. Aggregate Total Return Bond Index **** | 3.33% | (2.90)% |
| * | The Fund’s past performance does not guarantee future results. The investment return and principal value of an investment in the Fund will fluctuate so that an investor’s shares, when redeemed, may be worth more or less than their original cost. The returns shown do not reflect the deduction of taxes a shareholder would pay on Fund distributions, if any, or the redemption of Fund shares. Current performance of the Fund may be lower or higher than the performance quoted. Performance data current to the most recent month-end may be obtained by visiting www.monarchfunds.com or by calling 1-541-291-4405. |
The Fund’s per share net asset value or NAV is the value of one share of the Fund as calculated in accordance with the standard formula for valuing shares. The NAV return is based on the NAV of the Fund and the Market Price Return is based on the Market Price per share of the Fund. Market price returns are calculated using the closing price and account for distributions from the Fund. Market Price and NAV returns assume that dividends and capital gain distributions have been reinvested in the Fund at Market Price and NAV, respectively. The Fund’s adviser has contractually agreed to reduce its fees and/or absorb expenses of the Fund until at least June 30, 2024 to ensure that total annual fund operating expenses after fee waiver and/or reimbursement (exclusive of any front-end or contingent deferred loads, taxes, brokerage fees and commissions, borrowing costs (such as interest and dividend expense on securities sold short), acquired fund fees and expenses, fees and expenses associated with investments in other collective investment vehicles or derivative instruments (including for example option and swap fees and expenses), or extraordinary expenses such as litigation which may include indemnification of Fund Officers and Trustees, contractual indemnification of Fund service providers (other than the Advisor)) will not exceed 1.25% of average daily net assets. The fee waiver and expense reimbursements are subject to possible recoupment from the Fund by the adviser in future years (within the three years after the fees have been waived or reimbursed), if such recoupment can be achieved within the lesser of the foregoing expense limits or those in place at the time of recapture. This agreement may be terminated by the Trust’s Board of Trustees only on 60 days’ written notice to the Fund’s adviser. The Fund’s total annual operating expenses, before fee waivers and/or expense reimbursements, are 1.56% per the June 28, 2023 prospectus. After fee waivers and/or expense reimbursements, the Fund’s total annual expenses are 1.49% of net assets per the June 28, 2023 prospectus. The Fund’s total return would have been lower had the adviser not waived a portion of the Fund’s expenses. Please see the Financial Highlights for a more recent expense ratio.
| ** | As of the commencement of operations on March 23, 2021. |
| *** | The Kingsview Ambassador Income Index is designed to measure the performance of an investable universe of fixed income securities of varying credit quality and duration, including corporate bonds, lower-quality bonds, known as “high yield” or “junk” bonds, treasury bonds, municipal bonds, mortgage backed securities and convertible bonds, that provide broad exposure to the U.S. and global bond market. The Index has 12 ETF constituents which are weighted differently throughout the phases of the economic cycle (i.e., expansion, peak,, contraction, through) in an effort to maximize risk-adjusted returns. The Index may have up to 12.5% in an alternative sleeve of instruments that could range from currency ETFs to commodity ETFs. Investors cannot invest directly in an index. |
| **** | The Bloomberg U.S. Aggregate Total Return Bond Index is commonly used as a benchmark by both passive and active investors to measure portfolio performance relative to the U.S. dollar-denominated investment grade fixed-rate taxable bond market. It is also an informational measure of broad market returns commonly applied to fixed income instruments. The Index contains approximately 10,100 fixed income issues and is valued at around $20 trillion, representing 43% of the total U.S. bond market. The Index does not take into account charges, fees and other expenses, and investors cannot invest directly in an index. |
An index is a statistical measure of a specified financial market or sector. An index does not actually hold a portfolio of securities and therefore does not reflect deductions for fees or expenses. In comparison, the Fund’s performance is negatively impacted by these deductions. Index returns reflect all items of income, gain and loss and the reinvestment of dividends and other income.
Comparison of Change in Value of a $10,000 Investment
The Fund’s holdings by asset class as of February 29, 2024 are as follows:
| Asset Class | % of Net Assets | |||
| Exchange -Traded Funds | ||||
| Fixed Income | 93.4 | % | ||
| Commodity | 6.3 | % | ||
| Other Assets in Excess of Liabilities | 0.3 | % | ||
| 100.0 | % | |||
Please refer to the Schedule of Investments in this Annual Report for a detailed listing of the Fund’s holdings.
7
| Monarch Blue Chips Core ETF |
| PORTFOLIO REVIEW (Unaudited) |
| February 29, 2024 |
The Fund’s performance figures* for the year ended February 29, 2024, as compared to its benchmarks:
| One Year | Since Inception** | |
| Monarch Blue Chips Core ETF - NAV | 34.13% | 9.04% |
| Monarch Blue Chips Core ETF - Market Price | 34.39% | 9.10% |
| Kingsview Blue Chips Core Index *** | 34.66% | 9.34% |
| S&P 500 Total Return Index **** | 30.45% | 11.16% |
| * | The Fund’s past performance does not guarantee future results. The investment return and principal value of an investment in the Fund will fluctuate so that an investor’s shares, when redeemed, may be worth more or less than their original cost. The returns shown do not reflect the deduction of taxes a shareholder would pay on Fund distributions, if any, or the redemption of the Fund shares. Current performance of the Fund may be lower or higher than the performance quoted. Performance data current to the most recent month-end may be obtained by visiting www.monarchfunds.com or by calling 1-541-291-4405. |
The Fund’s per share net asset value or NAV is the value of one share of the Fund as calculated in accordance with the standard formula for valuing shares. The NAV return is based on the NAV of the Fund and the Market Price Return is based on the Market Price per share of the Fund. Market Price returns are calculated using the closing price and account for distributions from the Fund. Market Price and NAV returns assume that dividends and capital gain distributions have been reinvested in the Fund at Market Price and NAV, respectively. The Fund’s adviser has contractually agreed to reduce its fees and/or absorb expenses of the Fund until at least June 30, 2024 to ensure that total annual fund operating expenses after fee waiver and/or reimbursement (exclusive of any front-end or contingent deferred loads, taxes, brokerage fees and commissions, borrowing costs (such as interest and dividend expense on securities sold short), acquired fund fees and expenses, fees and expenses associated with investments in other collective investment vehicles or derivative instruments (including for example option and swap fees and expenses), or extraordinary expenses such as litigation which may include indemnification of Fund Officers and Trustees, contractual indemnification of Fund service providers (other than the Advisor)) will not exceed 1.25% of average daily net assets. The fee waiver and expense reimbursements are subject to possible recoupment from the Fund by the adviser in future years (within the three years after the fees have been waived or reimbursed), if such recoupment can be achieved within the lesser of the foregoing expense limits or those in place at the time of recapture. This agreement may be terminated by the Trust’s Board of Trustees only on 60 days’ written notice to the Fund’s adviser. The Fund’s total annual operating expenses, before fee waivers and/or expense reimbursements, are 1.41% per the June 28, 2023 prospectus. After fee waivers and/or expense reimbursements, the Fund’s total annual expenses are 1.25% of net assets per the June 28, 2023 prospectus. The Fund’s total return would have been lower had the adviser not waived a portion of the Fund’s expenses. Please see the Financial Highlights for a more recent expense ratio.
| ** | As of the commencement of operations on March 23, 2021. |
| *** | The Kingsview Blue Chips Core Index consists of established, well-recognized companies from a broad range of industries that demonstrate strength in the marketplace based on fundamental company data such as revenue, revenue growth, net income, and net income growth. Index constituents are determined by following a proprietary rules-based methodology that scores this fundamental company data of the companies listed on the S&P 500 to determine approximately 24 of the highest-ranking companies. These companies are typically equally weighted in the Index. Investors cannot invest directly in an index. |
| **** | The S&P 500 Total Return Index is an unmanaged market capitalization-weighted index which is comprised of 500 of the largest U.S. domiciled companies and includes the reinvestment of all dividends. Investors cannot invest directly in an index or benchmark. |
An index is a statistical measure of a specified financial market or sector. An index does not actually hold a portfolio of securities and therefore does not reflect deductions for fees or expenses. In comparison, the Fund’s performance is negatively impacted by these deductions. Index returns reflect all items of income, gain and loss and the reinvestment of dividends and other income.
Comparison of Change in Value of a $10,000 Investment
The Fund’s holdings by asset class as of February 29, 2024 are as follows:
| Asset Class | % of Net Assets | |||
| Common Stocks | ||||
| Software | 15.4 | % | ||
| Biotech & Pharma | 9.2 | % | ||
| Diversified Industrials | 9.1 | % | ||
| Retail - Consumer Staples | 8.7 | % | ||
| Internet Media & Services | 8.7 | % | ||
| Technology Services | 8.2 | % | ||
| Beverages | 7.4 | % | ||
| Leisure Facilities & Services | 7.3 | % | ||
| Semiconductors | 6.2 | % | ||
| E-Commerce Discretionary | 4.4 | % | ||
| Other Industries | 15.0 | % | ||
| Other Assets in Excess of Liabilities | 0.4 | % | ||
| 100.0 | % | |||
Please refer to the Schedule of Investments in this Annual Report for a detailed listing of the Fund’s holdings.
8
| Monarch ProCap ETF |
| PORTFOLIO REVIEW (Unaudited) |
| February 29, 2024 |
The Fund’s performance figures* for the year ended February 29, 2024, as compared to its benchmarks:
| One Year | Since Inception** | |
| Monarch ProCap ETF - NAV | 10.01% | 4.62% |
| Monarch ProCap ETF - Market Price | 10.04% | 4.66% |
| Kingsview ProCap Index *** | 10.18% | 4.79% |
| S&P Target Risk Moderate Total Return Index **** | 11.36% | 1.29% |
| * | The Fund’s past performance does not guarantee future results. The investment return and principal value of an investment in the Fund will fluctuate so that an investor’s shares, when redeemed, may be worth more or less than their original cost. The returns shown do not reflect the deduction of taxes a shareholder would pay on Fund distributions, if any, or the redemption of the Fund shares. Current performance of the Fund may be lower or higher than the performance quoted. Performance data current to the most recent month-end may be obtained by visiting www.monarchfunds.com or by calling 1-541-291-4405. |
The Fund’s per share net asset value or NAV is the value of one share of the Fund as calculated in accordance with the standard formula for valuing shares. The NAV return is based on the NAV of the Fund and the Market Price Return is based on the Market Price per share of the Fund. Market Price returns are calculated using the closing price and account for distributions from the Fund. Market Price and NAV returns assume that dividends and capital gain distributions have been reinvested in the Fund at Market Price and NAV, respectively. The Fund’s adviser has contractually agreed to reduce its fees and/or absorb expenses of the Fund until at least June 30, 2024 to ensure that total annual fund operating expenses after fee waiver and/or reimbursement (exclusive of any front-end or contingent deferred loads, taxes, brokerage fees and commissions, borrowing costs (such as interest and dividend expense on securities sold short), acquired fund fees and expenses, fees and expenses associated with investments in other collective investment vehicles or derivative instruments (including for example option and swap fees and expenses), or extraordinary expenses such as litigation which may include indemnification of Fund Officers and Trustees, contractual indemnification of Fund service providers (other than the Advisor)) will not exceed 1.25% of average daily net assets. The fee waiver and expense reimbursements are subject to possible recoupment from the Fund by the adviser in future years (within the three years after the fees have been waived or reimbursed), if such recoupment can be achieved within the lesser of the foregoing expense limits or those in place at the time of recapture. This agreement may be terminated by the Trust’s Board of Trustees only on 60 days’ written notice to the Fund’s adviser. The Fund’s total annual operating expenses are 1.17% per the June 28, 2023 prospectus. Please see the Financial Highlights for a more recent expense ratio.
| ** | As of the commencement of operations on March 23, 2021. |
| *** | The Kingsview ProCap Index consists of fixed income and equity ETFs that provide broad exposure to the U.S. and global bond markets and to the S&P Global Industry Classification Standard (“GICS”) sectors. The Index is comprised of 6-9 constituents, with fixed income ETFs and equity ETFs collectively comprising at least 90% of the Index, with each being no less than 15% and no more than 75% of the Index. The equity allocation of the Index is further divided into sector allocations that represent the GICS sectors. The Index may have up to 10% in an alternative sleeve of instruments that could range from currency ETFs to commodity ETFs, such as gold. Investors cannot invest directly in an index. |
| **** | The S&P Target Risk Moderate Total Return Index is designed to measure the performance of moderate stock-bond allocations to fixed income while seeking to increase opportunities for higher returns through equities. Investors cannot invest directly in an index or benchmark. |
An index is a statistical measure of a specified financial market or sector. An index does not actually hold a portfolio of securities and therefore does not reflect deductions for fees or expenses. In comparison, the Fund’s performance is negatively impacted by these deductions. Index returns reflect all items of income, gain and loss and the reinvestment of dividends and other income.
Comparison of Change in Value of a $10,000 Investment
The Fund’s holdings by asset class as of February 29, 2024 are as follows:
| Asset Class | % of Net Assets | |||
| Exchange - Traded Funds | ||||
| Equity | 51.2 | % | ||
| Fixed Income | 48.7 | % | ||
| Other Assets in Excess of Liabilities | 0.1 | % | ||
| 100.0 | % | |||
Please refer to the Schedule of Investments in this Annual Report for a detailed listing of the Fund’s holdings.
9
| Monarch Ambassador Income ETF |
| SCHEDULE OF INVESTMENTS |
| February 29, 2024 |
| Shares | Fair Value | |||||||
| EXCHANGE-TRADED FUNDS — 99.7% | ||||||||
| COMMODITY - 6.3% | ||||||||
| 111,049 | iShares Gold Trust(a) | $ | 4,292,044 | |||||
| FIXED INCOME - 93.4% | ||||||||
| 158,369 | Invesco Taxable Municipal Bond ETF | 4,196,779 | ||||||
| 94,591 | iShares 1-3 Year Treasury Bond ETF | 7,731,868 | ||||||
| 43,959 | iShares 20+ Year Treasury Bond ETF | 4,140,059 | ||||||
| 98,131 | iShares 7-10 Year Treasury Bond ETF | 9,245,903 | ||||||
| 86,919 | iShares Core U.S. Aggregate Bond ETF | 8,461,565 | ||||||
| 101,496 | iShares iBoxx $ Investment Grade Corporate Bond ETF | 10,927,059 | ||||||
| 137,903 | iShares MBS ETF | 12,674,664 | ||||||
| 60,382 | SPDR Bloomberg Convertible Securities ETF | 4,328,182 | ||||||
| 57,931 | SPDR Portfolio Short Term Corporate Bond ETF | 1,721,709 | ||||||
| 63,427,788 | ||||||||
| TOTAL EXCHANGE-TRADED FUNDS (Cost $66,221,744) | 67,719,832 | |||||||
| TOTAL INVESTMENTS - 99.7% (Cost $66,221,744) | $ | 67,719,832 | ||||||
| OTHER ASSETS IN EXCESS OF LIABILITIES - 0.3% | 208,399 | |||||||
| NET ASSETS - 100.0% | $ | 67,928,231 | ||||||
| ETF | - Exchange-Traded Fund |
| MBS | - Mortgage Backed Security |
| SPDR | - Standard & Poor’s Depositary Receipt |
| (a) | Non-income producing security. |
See accompanying notes to financial statements.
10
| Monarch Blue Chips Core ETF |
| SCHEDULE OF INVESTMENTS |
| February 29, 2024 |
| Shares | Fair Value | |||||||
| COMMON STOCKS — 99.6% | ||||||||
| APPAREL & TEXTILE PRODUCTS - 3.5% | ||||||||
| 25,500 | NIKE, Inc. | $ | 2,650,215 | |||||
| BEVERAGES - 7.4% | ||||||||
| 48,128 | Coca-Cola Company (The) | 2,888,643 | ||||||
| 16,713 | PepsiCo, Inc. | 2,763,327 | ||||||
| 5,651,970 | ||||||||
| BIOTECH & PHARMA - 9.2% | ||||||||
| 4,752 | Eli Lilly & Company | 3,581,488 | ||||||
| 27,436 | Merck & Company, Inc. | 3,488,487 | ||||||
| 7,069,975 | ||||||||
| DIVERSIFIED INDUSTRIALS - 9.1% | ||||||||
| 31,633 | Emerson Electric Company | 3,379,986 | ||||||
| 23,087 | General Electric Company | 3,622,119 | ||||||
| 7,002,105 | ||||||||
| E-COMMERCE DISCRETIONARY - 4.4% | ||||||||
| 19,247 | Amazon.com, Inc.(a) | 3,402,100 | ||||||
| HOUSEHOLD PRODUCTS - 3.8% | ||||||||
| 18,312 | Procter & Gamble Company (The) | 2,910,509 | ||||||
| INFRASTRUCTURE REIT - 3.5% | ||||||||
| 13,469 | American Tower Corporation | 2,678,445 | ||||||
| INTERNET MEDIA & SERVICES - 8.7% | ||||||||
| 895 | Booking Holdings, Inc.(a) | 3,104,603 | ||||||
| 5,924 | Netflix, Inc.(a) | 3,571,698 | ||||||
| 6,676,301 | ||||||||
| LEISURE FACILITIES & SERVICES - 7.3% | ||||||||
| 9,968 | McDonald’s Corporation | 2,913,447 | ||||||
| 28,326 | Starbucks Corporation | 2,688,137 | ||||||
| 5,601,584 | ||||||||
| MEDICAL EQUIPMENT & DEVICES - 4.2% | ||||||||
| 5,673 | Thermo Fisher Scientific, Inc. | 3,234,631 | ||||||
See accompanying notes to financial statements.
11
| Monarch Blue Chips Core ETF |
| SCHEDULE OF INVESTMENTS (Continued) |
| February 29, 2024 |
| Shares | Fair Value | |||||||
| COMMON STOCKS — 99.6% (Continued) | ||||||||
| RETAIL - CONSUMER STAPLES - 8.7% | ||||||||
| 4,740 | Costco Wholesale Corporation | $ | 3,526,039 | |||||
| 54,195 | Walmart, Inc. | 3,176,369 | ||||||
| 6,702,408 | ||||||||
| SEMICONDUCTORS - 6.2% | ||||||||
| 6,006 | NVIDIA Corporation | 4,751,467 | ||||||
| SOFTWARE - 15.4% | ||||||||
| 4,591 | Adobe, Inc.(a) | 2,572,245 | ||||||
| 7,419 | Microsoft Corporation | 3,068,795 | ||||||
| 24,204 | Oracle Corporation | 2,703,103 | ||||||
| 11,163 | Salesforce, Inc.(a) | 3,447,358 | ||||||
| 11,791,501 | ||||||||
| TECHNOLOGY SERVICES - 8.2% | ||||||||
| 6,787 | Mastercard, Inc. | 3,222,197 | ||||||
| 10,957 | Visa, Inc. | 3,096,886 | ||||||
| 6,319,083 | ||||||||
| TOTAL COMMON STOCKS (Cost $62,436,634) | 76,442,294 | |||||||
| TOTAL INVESTMENTS - 99.6% (Cost $62,436,634) | $ | 76,442,294 | ||||||
| OTHER ASSETS IN EXCESS OF LIABILITIES - 0.4% | 325,581 | |||||||
| NET ASSETS - 100.0% | $ | 76,767,875 | ||||||
| REIT | - Real Estate Investment Trust |
| (a) | Non-income producing security. |
See accompanying notes to financial statements.
12
| Monarch ProCap ETF |
| SCHEDULE OF INVESTMENTS |
| February 29, 2024 |
| Shares | Fair Value | |||||||
| EXCHANGE-TRADED FUNDS — 99.9% | ||||||||
| EQUITY - 51.2% | ||||||||
| 150,639 | Communication Services Select Sector SPDR Fund | $ | 11,954,711 | |||||
| 33,139 | Consumer Discretionary Select Sector SPDR Fund | 6,111,163 | ||||||
| 77,595 | Consumer Staples Select Sector SPDR Fund | 5,776,948 | ||||||
| 148,733 | Financial Select Sector SPDR Fund | 5,999,889 | ||||||
| 81,206 | Health Care Select Sector SPDR Fund | 11,760,253 | ||||||
| 50,288 | Industrial Select Sector SPDR Fund | 6,084,848 | ||||||
| 148,813 | Real Estate Select Sector SPDR Fund | 5,820,077 | ||||||
| 28,842 | Technology Select Sector SPDR Fund | 5,969,717 | ||||||
| 59,477,606 | ||||||||
| FIXED INCOME - 48.7% | ||||||||
| 581,061 | iShares Core U.S. Aggregate Bond ETF | 56,566,288 | ||||||
| TOTAL EXCHANGE-TRADED FUNDS (Cost $108,134,480) | 116,043,894 | |||||||
| TOTAL INVESTMENTS - 99.9% (Cost $108,134,480) | $ | 116,043,894 | ||||||
| OTHER ASSETS IN EXCESS OF LIABILITIES - 0.1% | 108,394 | |||||||
| NET ASSETS - 100.0% | $ | 116,152,288 | ||||||
| ETF | - Exchange-Traded Fund |
| SPDR | - Standard & Poor’s Depositary Receipt |
See accompanying notes to financial statements.
13
| The Monarch ETFs |
| STATEMENTS OF ASSETS AND LIABILITIES |
| February 29, 2024 |
| Monarch | ||||||||||||
| Ambassador Income | Monarch Blue Chips | Monarch ProCap | ||||||||||
| ETF | Core ETF | ETF | ||||||||||
| ASSETS | ||||||||||||
| Investment securities: | ||||||||||||
| Investments, At cost | $ | 66,221,744 | $ | 62,436,634 | $ | 108,134,480 | ||||||
| Investments, At value | $ | 67,719,832 | $ | 76,442,294 | $ | 116,043,894 | ||||||
| Cash | 311,624 | 344,919 | 214,345 | |||||||||
| Dividends and interest receivable | — | 72,021 | — | |||||||||
| Receivable for Fund shares sold | — | 799,930 | 1,366,722 | |||||||||
| Prepaid expenses | 464 | 621 | 700 | |||||||||
| TOTAL ASSETS | 68,031,920 | 77,659,785 | 117,625,661 | |||||||||
| LIABILITIES | ||||||||||||
| Payable for investments purchased | — | 791,646 | 1,364,024 | |||||||||
| Investment advisory fees payable | 73,292 | 69,273 | 76,007 | |||||||||
| Payable to related parties | 5,375 | 5,108 | 4,743 | |||||||||
| Accrued expenses and other liabilities | 25,022 | 25,883 | 28,599 | |||||||||
| TOTAL LIABILITIES | 103,689 | 891,910 | 1,473,373 | |||||||||
| NET ASSETS | $ | 67,928,231 | $ | 76,767,875 | $ | 116,152,288 | ||||||
| Net Assets Consist Of: | ||||||||||||
| Paid in capital | $ | 72,818,202 | $ | 65,848,680 | $ | 119,135,019 | ||||||
| Accumulated earnings (deficit) | (4,889,971 | ) | 10,919,195 | (2,982,731 | ) | |||||||
| NET ASSETS | $ | 67,928,231 | $ | 76,767,875 | $ | 116,152,288 | ||||||
| Net Asset Value Per Share: | ||||||||||||
| Net Assets | $ | 67,928,231 | $ | 76,767,875 | $ | 116,152,288 | ||||||
| Shares of beneficial interest outstanding ($0 par value, unlimited shares authorized) | 3,100,000 | 2,400,000 | 4,250,000 | |||||||||
| Net asset value, offering and redemption price per share (Net Assets ÷ Shares Outstanding) | $ | 21.91 | $ | 31.99 | $ | 27.33 | ||||||
See accompanying notes to financial statements.
14
| The Monarch ETFs |
| STATEMENTS OF OPERATIONS |
| For the Year Ended February 29, 2024 |
| Monarch | ||||||||||||
| Ambassador | Monarch Blue Chips | Monarch ProCap | ||||||||||
| Income ETF | Core ETF | ETF | ||||||||||
| INVESTMENT INCOME | ||||||||||||
| Dividends | $ | 1,567,747 | $ | 610,251 | $ | 2,249,698 | ||||||
| TOTAL INVESTMENT INCOME | 1,567,747 | 610,251 | 2,249,698 | |||||||||
| EXPENSES | ||||||||||||
| Investment advisory fees | 429,248 | 401,246 | 739,758 | |||||||||
| Administrative services | 67,249 | 67,549 | 67,797 | |||||||||
| Professional fees | 18,626 | 17,665 | 23,993 | |||||||||
| Legal fees | 17,030 | 17,037 | 18,551 | |||||||||
| Audit fees | 16,544 | 16,544 | 16,544 | |||||||||
| Trustees fees and expenses | 14,463 | 14,463 | 14,947 | |||||||||
| Transfer agent fees | 10,524 | 10,030 | 10,530 | |||||||||
| Printing and postage expenses | 8,512 | 8,026 | 11,047 | |||||||||
| Custodian fees | 7,137 | 9,196 | 11,123 | |||||||||
| Insurance expense | 2,819 | 2,419 | 8,452 | |||||||||
| Other Expenses | 10,900 | 9,400 | 11,900 | |||||||||
| TOTAL EXPENSES | 603,052 | 573,575 | 934,642 | |||||||||
| Fees (waived)/recaptured by the Adviser | 27,895 | 16,885 | — | |||||||||
| NET EXPENSES | 630,947 | 590,460 | 934,642 | |||||||||
| NET INVESTMENT INCOME | 936,800 | 19,791 | 1,315,056 | |||||||||
| REALIZED AND UNREALIZED GAIN (LOSS) ON INVESTMENTS | ||||||||||||
| Net realized gain (loss) on: | ||||||||||||
| In-kind redemptions | 251,761 | 1,162,043 | 1,478,540 | |||||||||
| Investments | (2,259,254 | ) | (457,789 | ) | (3,260,534 | ) | ||||||
| (2,007,493 | ) | 704,254 | (1,781,994 | ) | ||||||||
| Net change in unrealized appreciation: | ||||||||||||
| Investments | 2,829,415 | 15,126,708 | 10,056,750 | |||||||||
| NET REALIZED AND UNREALIZED GAIN ON INVESTMENTS | 821,922 | 15,830,962 | 8,274,756 | |||||||||
| NET INCREASE IN NET ASSETS RESULTING FROM OPERATIONS | $ | 1,758,722 | $ | 15,850,753 | $ | 9,589,812 | ||||||
See accompanying notes to financial statements.
15
| Monarch Ambassador Income ETF |
| STATEMENTS OF CHANGES IN NET ASSETS |
| Year Ended | Year Ended | |||||||
| February 29, 2024 | February 28, 2023 | |||||||
| FROM OPERATIONS | ||||||||
| Net investment income | $ | 936,800 | $ | 439,969 | ||||
| Net realized loss on investments | (2,007,493 | ) | (2,920,483 | ) | ||||
| Net change in unrealized appreciation (depreciation) on investments | 2,829,415 | (1,125,085 | ) | |||||
| Net increase (decrease) in net assets resulting from operations | 1,758,722 | (3,605,599 | ) | |||||
| DISTRIBUTIONS TO SHAREHOLDERS | ||||||||
| Total distributions paid | (933,030 | ) | (351,088 | ) | ||||
| Decrease in net assets resulting from distributions to shareholders | (933,030 | ) | (351,088 | ) | ||||
| FROM SHARES OF BENEFICIAL INTEREST | ||||||||
| Proceeds from shares sold | 29,943,034 | 23,140,315 | ||||||
| Cost of shares redeemed | (5,348,124 | ) | (7,889,237 | ) | ||||
| Net increase in net assets resulting from shares of beneficial interest | 24,594,910 | 15,251,078 | ||||||
| TOTAL INCREASE IN NET ASSETS | 25,420,602 | 11,294,391 | ||||||
| NET ASSETS | ||||||||
| Beginning of Year | 42,507,629 | 31,213,238 | ||||||
| End of Year | $ | 67,928,231 | $ | 42,507,629 | ||||
| SHARE ACTIVITY | ||||||||
| Shares Sold | 1,400,000 | 1,025,000 | ||||||
| Shares Redeemed | (250,000 | ) | (350,000 | ) | ||||
| Net increase in shares of beneficial interest outstanding | 1,150,000 | 675,000 | ||||||
See accompanying notes to financial statements.
16
| Monarch Blue Chips Core ETF |
| STATEMENTS OF CHANGES IN NET ASSETS |
| Year Ended | Year Ended | |||||||
| February 29, 2024 | February 28, 2023 | |||||||
| FROM OPERATIONS | ||||||||
| Net investment income | $ | 19,791 | $ | 14,533 | ||||
| Net realized gain (loss) on investments | 704,254 | (2,369,787 | ) | |||||
| Net change in unrealized appreciation on investments | 15,126,708 | 230,606 | ||||||
| Net increase (decrease) in net assets resulting from operations | 15,850,753 | (2,124,648 | ) | |||||
| DISTRIBUTIONS TO SHAREHOLDERS | ||||||||
| Total distributions paid: | (49,740 | ) | — | |||||
| Net decrease in net assets resulting from distributions to shareholders | (49,740 | ) | — | |||||
| FROM SHARES OF BENEFICIAL INTEREST | ||||||||
| Proceeds from shares sold | 34,455,812 | 9,520,431 | ||||||
| Cost of shares redeemed | (8,108,316 | ) | (2,375,354 | ) | ||||
| Net increase in net assets resulting from shares of beneficial interest | 26,347,496 | 7,145,077 | ||||||
| TOTAL INCREASE IN NET ASSETS | 42,148,509 | 5,020,429 | ||||||
| NET ASSETS | ||||||||
| Beginning of Year | 34,619,366 | 29,598,937 | ||||||
| End of Year | $ | 76,767,875 | $ | 34,619,366 | ||||
| SHARE ACTIVITY | ||||||||
| Shares Sold | 1,250,000 | 400,000 | ||||||
| Shares Redeemed | (300,000 | ) | (100,000 | ) | ||||
| Net increase in shares of beneficial interest outstanding | 950,000 | 300,000 | ||||||
See accompanying notes to financial statements.
17
| Monarch ProCap ETF |
| STATEMENTS OF CHANGES IN NET ASSETS |
| Year Ended | Year Ended | |||||||
| February 29, 2024 | February 28, 2023 | |||||||
| FROM OPERATIONS | ||||||||
| Net investment income | $ | 1,315,056 | $ | 1,083,530 | ||||
| Net realized loss on investments | (1,781,994 | ) | (3,302,263 | ) | ||||
| Net change in unrealized appreciation (depreciation) on investments | 10,056,750 | (1,704,373 | ) | |||||
| Net increase (decrease) in net assets resulting from operations | 9,589,812 | (3,923,106 | ) | |||||
| DISTRIBUTIONS TO SHAREHOLDERS | ||||||||
| Total distributions paid | (1,234,853 | ) | (909,143 | ) | ||||
| Decrease in net assets resulting from distributions to shareholders | (1,234,853 | ) | (909,143 | ) | ||||
| FROM SHARES OF BENEFICIAL INTEREST | ||||||||
| Proceeds from shares sold | 56,384,561 | 105,580,410 | ||||||
| Cost of shares redeemed | (48,160,389 | ) | (67,510,380 | ) | ||||
| Net increase in net assets resulting from shares of beneficial interest | 8,224,172 | 38,070,030 | ||||||
| TOTAL INCREASE IN NET ASSETS | 16,579,131 | 33,237,781 | ||||||
| NET ASSETS | ||||||||
| Beginning of Year | 99,573,157 | 66,335,376 | ||||||
| End of Year | $ | 116,152,288 | $ | 99,573,157 | ||||
| SHARE ACTIVITY | ||||||||
| Shares Sold | 2,200,000 | 4,025,000 | ||||||
| Shares Redeemed | (1,900,000 | ) | (2,550,000 | ) | ||||
| Net increase in shares of beneficial interest outstanding | 300,000 | 1,475,000 | ||||||
See accompanying notes to financial statements.
18
| Monarch Ambassador Income ETF |
| FINANCIAL HIGHLIGHTS |
| Per Share Data and Ratios for a Share of Beneficial Interest Outstanding Throughout Each Year/Period |
| Year Ended | Year Ended | Period Ended | ||||||||||
| February 29, 2024 | February 28, 2023 | February 28, 2022 (1) | ||||||||||
| Net asset value, beginning of year/period | $ | 21.80 | $ | 24.48 | $ | 25.00 | ||||||
| Activity from investment operations: | ||||||||||||
| Net investment income (2) | 0.41 | 0.26 | 0.12 | |||||||||
| Net realized and unrealized gain (loss) on investments | 0.09 | (2.74 | ) | (0.50 | ) | |||||||
| Total from investment operations | 0.50 | (2.48 | ) | (0.38 | ) | |||||||
| Less distributions from: | ||||||||||||
| Net investment income | (0.39 | ) | (0.20 | ) | (0.14 | ) | ||||||
| Total distributions | (0.39 | ) | (0.20 | ) | (0.14 | ) | ||||||
| Net asset value, end of year/period | $ | 21.91 | $ | 21.80 | $ | 24.48 | ||||||
| Market price, end of year/period | $ | 21.91 | $ | 21.79 | $ | 24.48 | ||||||
| Total return (3) | 2.28 | % | (10.14 | )% | (1.53 | )% (5) | ||||||
| Market price total return (4) | 2.33 | % | (10.18 | )% | (1.53 | )% | ||||||
| Net assets, at end of year/period (000s) | $ | 67,928 | $ | 42,508 | $ | 31,213 | ||||||
| Ratio of gross expenses to average net assets before waiver/recapture (7) | 1.19 | % | 1.32 | % | 1.44 | % (6) | ||||||
| Ratio of net expenses to average net assets after waiver/recapture (7) | 1.25 | % | 1.25 | % | 1.25 | % (6) | ||||||
| Ratio of net investment income to average net assets (8) | 1.86 | % | 1.18 | % | 0.51 | % (6) | ||||||
| Portfolio Turnover Rate (9) | 133 | % | 228 | % | 123 | % (5) | ||||||
| (1) | The Monarch Ambassador Income ETF commenced operations on March 23, 2021 |
| (2) | Per share amounts calculated using the average shares method, which more appropriately presents the per share data for the period. |
| (3) | Total return is calculated assuming a purchase of shares at net asset value on the first day and a sale at net asset value on the last day of the period. Distributions are assumed, for the purpose of this calculation, to be reinvested at the ex-dividend date net asset value per share on their respective payment dates. |
| (4) | Market price returns are calculated using the closing price and account for distributions from the Fund. Distributions are assumed, for the purpose of this calculation, to be reinvested at the ex-dividend date market price per share on their respective payment dates. |
| (5) | Not annualized for periods less than one year. |
| (6) | Annualized for periods less than one year. |
| (7) | Does not include the Fund’s share of the expenses of the underlying investment companies in which the Fund invests. |
| (8) | The recognition of investment income by the Fund is affected by the timing and declaration of dividends by the underlying investment companies in which the Fund invests. |
| (9) | Portfolio turnover rate excludes portfolio securities received or delivered as a result of processing capital share transactions in Creation Units. |
See accompanying notes to financial statements.
19
| Monarch Blue Chips Core ETF |
| FINANCIAL HIGHLIGHTS |
| Per Share Data and Ratios for a Share of Beneficial Interest Outstanding Throughout Each Year/Period |
| Year Ended | Year Ended | Period Ended | ||||||||||
| February 29, 2024 | February 28, 2023 | February 28, 2022 (1) | ||||||||||
| Net asset value, beginning of year/period | $ | 23.88 | $ | 25.74 | $ | 25.00 | ||||||
| Activity from investment operations: | ||||||||||||
| Net investment income (loss) (2) | 0.01 | 0.01 | (0.09 | ) | ||||||||
| Net realized and unrealized gain (loss) on investments | 8.13 | (1.87 | ) | 0.83 | (8) | |||||||
| Total from investment operations | 8.14 | (1.86 | ) | 0.74 | ||||||||
| Less distributions from: | ||||||||||||
| Net investment income | (0.03 | ) | — | — | ||||||||
| Total distributions | (0.03 | ) | — | — | ||||||||
| Net asset value, end of year/period | $ | 31.99 | $ | 23.88 | $ | 25.74 | ||||||
| Market price, end of year/period | $ | 32.04 | $ | 23.87 | $ | 25.71 | ||||||
| Total return (3) | 34.13 | % | (7.23 | )% | 2.96 | % (5) | ||||||
| Market price total return (4) | 34.39 | % | (7.16 | )% | 2.84 | % | ||||||
| Net assets, at end of year/period (000s) | $ | 76,768 | $ | 34,619 | $ | 29,599 | ||||||
| Ratio of gross expenses to average net assets before waiver/recapture | 1.21 | % | 1.41 | % | 1.46 | % (6) | ||||||
| Ratio of net expenses to average net assets after waiver/recapture | 1.25 | % | 1.25 | % | 1.25 | % (6) | ||||||
| Ratio of net investment income (loss) to average net assets | 0.04 | % | 0.05 | % | (0.33 | )% (6) | ||||||
| Portfolio Turnover Rate (7) | 86 | % | 126 | % | 39 | % (5) | ||||||
| (1) | The Monarch Blue Chips Core ETF commenced operations on March 23, 2021. |
| (2) | Per share amounts calculated using the average shares method, which more appropriately presents the per share data for the period. |
| (3) | Total return is calculated assuming a purchase of shares at net asset value on the first day and a sale at net asset value on the last day of the period. Distributions are assumed, for the purpose of this calculation, to be reinvested at the ex-dividend date net asset value per share on their respective payment dates. |
| (4) | Market price returns are calculated using the closing price and account for distributions from the Fund. Distributions are assumed, for the purpose of this calculation, to be reinvested at the ex-dividend date market price per share on their respective payment dates. |
| (5) | Not annualized for periods less than one year. |
| (6) | Annualized for periods less than one year. |
| (7) | Portfolio turnover rate excludes portfolio securities received or delivered as a result of processing capital share transactions in Creation Units. |
| (8) | Realized and unrealized gains and losses per share in this caption are balancing amounts necessary to reconcile the change in net asset value per share for the period, and may not reconcile with the aggregate gains and losses in the Statement of Operations due to share transactions for the period. |
See accompanying notes to financial statements.
20
| Monarch ProCap ETF |
| FINANCIAL HIGHLIGHTS |
| Per Share Data and Ratios for a Share of Beneficial Interest Outstanding Throughout Each Year/Period |
| Year Ended | Year Ended | Period Ended | ||||||||||
| February 29, 2024 | February 28, 2023 | February 28, 2022 (1) | ||||||||||
| Net asset value, beginning of year/period | $ | 25.21 | $ | 26.80 | $ | 25.00 | ||||||
| Activity from investment operations: | ||||||||||||
| Net investment income (2) | 0.39 | 0.32 | 0.17 | |||||||||
| Net realized and unrealized gain (loss) on investments | 2.11 | (1.64 | ) | 1.89 | ||||||||
| Total from investment operations | 2.50 | (1.32 | ) | 2.06 | ||||||||
| Less distributions from: | ||||||||||||
| Net investment income | (0.38 | ) | (0.27 | ) | (0.22 | ) | ||||||
| Net realized gains | — | — | (0.04 | ) | ||||||||
| Total distributions | (0.38 | ) | (0.27 | ) | (0.26 | ) | ||||||
| Net asset value, end of year/period | $ | 27.33 | $ | 25.21 | $ | 26.80 | ||||||
| Market price, end of year/period | $ | 27.36 | $ | 25.23 | $ | 26.80 | ||||||
| Total return (3) | 10.01 | % | (4.93 | )% | 8.26 | % (5) | ||||||
| Market price total return (4) | 10.04 | % | (4.85 | )% | 8.26 | % | ||||||
| Net assets, at end of year/period (000s) | $ | 116,152 | $ | 99,573 | $ | 66,335 | ||||||
| Ratio of net expenses to average net assets (7) | 1.08 | % | 1.06 | % | 1.17 | % (6) | ||||||
| Ratio of net investment income to average net assets (8) | 1.51 | % | 1.26 | % | 0.67 | % (6) | ||||||
| Portfolio Turnover Rate (9) | 215 | % | 396 | % | 291 | % (5) | ||||||
| (1) | The Monarch ProCap ETF commenced operations on March 23, 2021. |
| (2) | Per share amounts calculated using the average shares method, which more appropriately presents the per share data for the period. |
| (3) | Total return is calculated assuming a purchase of shares at net asset value on the first day and a sale at net asset value on the last day of the period. Distributions are assumed, for the purpose of this calculation, to be reinvested at the ex-dividend date net asset value per share on their respective payment dates. |
| (4) | Market price returns are calculated using the closing price and account for distributions from the Fund. Distributions are assumed, for the purpose of this calculation, to be reinvested at the ex-dividend date market price per share on their respective payment dates. |
| (5) | Not annualized for periods less than one year. |
| (6) | Annualized for periods less than one year. |
| (7) | Does not include the Fund’s share of the expenses of the underlying investment companies in which the Fund invests. |
| (8) | The recognition of investment income by the Fund is affected by the timing and declaration of dividends by the underlying investment companies in which the Fund invests. |
| (9) | Portfolio turnover rate excludes portfolio securities received or delivered as a result of processing capital share transactions in Creation Units. |
See accompanying notes to financial statements.
21
The Monarch ETFs
NOTES TO FINANCIAL STATEMENTS
February 29, 2024
1. ORGANIZATION
The Monarch Ambassador Income ETF (“MAMB”), Monarch Blue Chips Core ETF (“MBCC”), and Monarch ProCap ETF (“MPRO”) (each a “Fund” and collectively the “Funds”) are each diversified series of Northern Lights Fund Trust IV (the “Trust”), a statutory trust organized under the laws of the State of Delaware on June 2, 2015, which is registered under the Investment Company Act of 1940, as amended (the “1940 Act”), as an open-end management investment company. MAMB’s investment objective seeks to replicate investment results that generally correspond, before fees and expenses, to the performance of the Kingsview Ambassador Income Index. MBCC’s investment objective seeks to replicate investment results that generally correspond, before fees and expenses, to the performance of the Kingsview Blue Chips Core Index. MPRO’s investment objective seeks to replicate investment results that generally correspond, before fees and expenses, to the performance of the Kingsview ProCap Index. The investment objectives are non-fundamental. MAMB and MPRO are “fund of funds”, in that they will generally invest in other investment companies. The Funds commenced operations on March 23, 2021.
2. SIGNIFICANT ACCOUNTING POLICIES
The following is a summary of significant accounting policies followed by the Funds in preparation of their financial statements. These policies are in conformity with accounting principles generally accepted in the United States of America (“GAAP”). The preparation of financial statements requires management to make estimates and assumptions that affect the reported amounts of assets and liabilities and disclosure of contingent assets and liabilities at the date of the financial statements and the reported amounts of income and expenses for the period. Actual results could differ from those estimates. The Funds are each investment companies and accordingly follow the investment company accounting and reporting guidance of the Financial Accounting Standards Board (“FASB”) Accounting Standards Codification Topic 946 “Financial Services – Investment Companies”.
Securities valuation – Securities listed on an exchange, including exchange – traded funds, are valued at the last reported sale price at the close of the regular trading session of the primary exchange on the business day the value is being determined or, in the case of securities listed on NASDAQ, at the NASDAQ Official Closing Price (“NOCP”). In the absence of a sale, such securities shall be valued at the mean between the current bid and ask prices on the primary exchange on the day of valuation. Debt securities (other than short-term obligations) are valued each day by an independent pricing service approved by the Trust’s Board of Trustees (the “Board”) based on methods which include consideration of: yields or prices of securities of comparable quality, coupon, maturity and type, indications as to values from dealers, and general market conditions or market quotations from a major market maker in the securities. Investments valued in currencies other than the U.S. dollar are converted to U.S. dollars using exchange rates obtained from pricing services. Short-term debt obligations having 60 days or less remaining until maturity, at time of purchase, may be valued at amortized cost. Investments in open-end investment companies are valued at net asset value.
Each Fund may hold investments, such as private investments, interests in commodity pools, other non-traded securities or temporarily illiquid securities, for which market quotations are not readily available or are determined to be unreliable. These investments will be valued using the “fair value” procedures approved by the Board. The Board has delegated execution of these procedures to the Adviser as its valuation designee (the “Valuation Designee”). The Board may also enlist third party consultants such a valuation specialist at a public accounting firm, valuation consultant or financial officer of a security issuer on an as-needed basis to assist the Valuation Designee in determining a security-specific fair value. The Board is responsible for reviewing and approving fair value methodologies utilized by the Valuation Designee, which approval shall be based upon whether the Valuation Designee followed the valuation procedures established by the Board.
22
The Monarch ETFs
NOTES TO FINANCIAL STATEMENTS (Continued)
February 29, 2024
Fair Valuation Process – Applicable investments are valued by the Valuation Designee pursuant to valuation procedures established by the Board. For example, fair value determinations are required for the following securities: (i) securities for which market quotations are insufficient or not readily available on a particular business day (including securities for which there is a short and temporary lapse in the provision of a price by the regular pricing source); (ii) securities for which, in the judgment of the Valuation Designee, the prices or values available do not represent the fair value of the instrument; factors which may cause the Valuation Designee to make such a judgment include, but are not limited to, the following: only a bid price or an asked price is available; the spread between bid and asked prices is substantial; the frequency of sales; the thinness of the market; the size of reported trades; and actions of the securities markets, such as the suspension or limitation of trading; (iii) securities determined to be illiquid; and (iv) securities with respect to which an event that will affect the value thereof has occurred (a “significant event”) since the closing prices were established on the principal exchange on which they are traded, but prior to a Fund’s calculation of its net asset value. Specifically, interests in commodity pools or managed futures pools are valued on a daily basis by reference to the closing market prices of each futures contract or other asset held by a pool, as adjusted for pool expenses. Restricted or illiquid investments, such as private investments or non-traded securities are valued based upon the current bid for the security from two or more independent dealers or other parties reasonably familiar with the facts and circumstances of the security (who should take into consideration all relevant factors as may be appropriate under the circumstances). If a current bid from such independent dealers or other independent parties is unavailable, the Valuation Designee shall determine, the fair value of such security using the following factors: (i) the type of security; (ii) the cost at date of purchase; (iii) the size and nature of the Fund’s holdings; (iv) the discount from market value of unrestricted securities of the same class at the time of purchase and subsequent thereto; (v) information as to any transactions or offers with respect to the security; (vi) the nature and duration of restrictions on disposition of the security and the existence of any registration rights; (vii) how the yield of the security compares to similar securities of companies of similar or equal creditworthiness; (viii) the level of recent trades of similar or comparable securities; (ix) the liquidity characteristics of the security; (x) current market conditions; and (xi) the market value of any securities into which the security is convertible or exchangeable.
Exchange Traded Funds – Each Fund may invest in ETFs. An ETF is a type of open-end fund, however, unlike a mutual fund, its shares are bought and sold on a securities exchange at market price and only certain financial institutions called authorized participants may buy and redeem shares of the ETF at net asset value. ETF shares can trade at either a premium or discount to net asset value. An ETF, like a mutual fund, is subject to specific risks depending on the type of strategy (actively managed or passively tracking an index) and the composition of its underlying holdings. Investing in an ETF involves substantially the same risks as investing directly in the ETF’s underlying holdings. ETFs pay fees and incur operating expenses, which reduce the total return earned by the ETFs from their underlying holdings. An ETF may not achieve its investment objective or execute its investment strategy effectively, which may adversely affect a Fund’s performance.
The Funds utilize various methods to measure the fair value of all of their investments on a recurring basis. GAAP establishes a hierarchy that prioritizes inputs to valuation methods. The three levels of input are:
Level 1 – Unadjusted quoted prices in active markets for identical assets and liabilities that the Funds have the ability to access.
Level 2 – Observable inputs other than quoted prices included in Level 1 that are observable for the asset or liability, either directly or indirectly. These inputs may include quoted prices for the identical instrument in an inactive market, prices for similar instruments, interest rates, prepayment speeds, credit risk, yield curves, default rates and similar data.
23
The Monarch ETFs
NOTES TO FINANCIAL STATEMENTS (Continued)
February 29, 2024
Level 3 – Unobservable inputs for the asset or liability, to the extent relevant observable inputs are not available, representing the Funds’ own assumptions about the assumptions a market participant would use in valuing the asset or liability, and would be based on the best information available.
The availability of observable inputs can vary from security to security and is affected by a wide variety of factors, including, for example, the type of security, whether the security is new and not yet established in the marketplace, the liquidity of markets, and other characteristics particular to the security. To the extent that valuation is based on models or inputs that are less observable or unobservable in the market, the determination of value requires more judgment. Accordingly, the degree of judgment exercised in determining value is greatest for instruments categorized in Level 3.
The inputs used to measure value may fall into different levels of the fair value hierarchy. In such cases, for disclosure purposes, the level in the fair value hierarchy within which the fair value measurement falls in its entirety, is determined based on the lowest level input that is significant to the fair value measurement in its entirety.
The inputs or methodology used for valuing securities are not necessarily an indication of the risk associated with investing in those securities. The following tables summarize the inputs used as of February 29, 2024 for the Funds’ assets measured at value:
| MAMB | ||||||||||||||||
| Assets * | Level 1 | Level 2 | Level 3 | Total | ||||||||||||
| Exchange Traded Funds | $ | 67,719,832 | $ | — | $ | — | $ | 67,719,832 | ||||||||
| Total | $ | 67,719,832 | $ | — | $ | — | $ | 67,719,832 | ||||||||
| MBCC | ||||||||||||||||
| Assets * | Level 1 | Level 2 | Level 3 | Total | ||||||||||||
| Common Stocks | $ | 76,442,294 | $ | — | $ | — | $ | 76,442,294 | ||||||||
| Total | $ | 76,442,294 | $ | — | $ | — | $ | 76,442,294 | ||||||||
| MPRO | ||||||||||||||||
| Assets * | Level 1 | Level 2 | Level 3 | Total | ||||||||||||
| Exchange Traded Funds | $ | 116,043,894 | $ | — | $ | — | $ | 116,043,894 | ||||||||
| Total | $ | 116,043,894 | $ | — | $ | — | $ | 116,043,894 | ||||||||
The Funds did not hold any Level 3 securities during the period.
| * | See Schedule of Investments for industry classification. |
Security Transactions and Related Income – Security transactions are accounted for on the trade date. Interest income is recognized on an accrual basis. Discounts are accreted and premiums are amortized on securities purchased over the lives of the respective securities using the effective yield method. Dividend income is recorded on the ex-dividend date. Realized gains or losses from sales of securities are determined by comparing the identified cost of the security lot sold with the net sales proceeds.
Dividends and Distributions to Shareholders – Dividends from net investment income, if any, are declared and paid quarterly for the Funds. Dividends and distributions to shareholders are recorded on the ex-dividend date. Distributable net realized capital gains, if any, are declared and distributed annually no later than December 31 of each year. Dividends from net investment income and distributions from net realized gains are determined in accordance with federal income tax regulations, which may differ from GAAP. These “book/tax” differences are considered either temporary (e.g., deferred losses) or permanent in nature. To the extent these differences
24
The Monarch ETFs
NOTES TO FINANCIAL STATEMENTS (Continued)
February 29, 2024
are permanent in nature, such amounts are reclassified within the composition of net assets based on their federal tax-basis treatment; temporary differences do not require reclassification.
Federal Income Taxes – The Funds comply with the requirements of the Internal Revenue Code applicable to regulated investment companies and to distribute all of their taxable income to shareholders. Therefore, no provision for federal income tax is required.
The Funds recognize the tax benefits of uncertain tax positions only where the position is “more likely than not” to be sustained assuming examination by tax authorities. Management has analyzed the Funds’ tax positions and has concluded that no liability for unrecognized tax benefits should be recorded related to uncertain tax positions taken on returns filed for open tax year ended February 28, 2022 and February 28, 2023, or expected to be taken in the Funds’ February 29, 2024 year-end tax returns. Each Fund identifies its major tax jurisdictions as U.S. federal, Ohio and foreign jurisdictions where the Fund makes significant investments. Each Fund recognizes interest and penalties, if any, related to unrecognized tax benefits as income tax expenses, in the Statements of Operations. For the year ended February 29, 2024, the Funds did not incur any interest or penalties. The Funds are not aware of any tax positions for which it is reasonably possible that the total amounts of unrecognized tax benefits will change materially in the next twelve months.
Expenses – Expenses of the Trust that are directly identifiable to a specific Fund are charged to that Fund. Expenses, which are not readily identifiable to a specific Fund, are allocated in such a manner as deemed equitable (as determined by the Board), taking into consideration the nature and type of expense and the relative sizes of the Funds in the Trust.
Cash – The Funds consider their investments in an FDIC insured interest bearing savings account to be cash. The Funds maintain cash balances, which, at times, may exceed federally insured limits. The Funds maintain these balances with a high quality financial institution.
Foreign Currency – The accounting records of the Funds are maintained in U.S. dollars. Investment securities and other assets and liabilities denominated in a foreign currency, and income receipts and expense payments are translated into U.S. dollars using the prevailing exchange rate at the London market close. Purchases and sales of securities are translated into U.S. dollars at the contractual currency rates established at the approximate time of the trade. Net realized gains and losses on foreign currency transactions represent net gains and losses from currency realized between the trade and settlement dates on securities transactions, gains and losses on the purchase and sale of foreign currencies and the difference between income accrued versus income received. The effects of changes in foreign currency exchange rates on investments in securities are included with the net realized and unrealized gain or loss on investment securities.
Indemnification – The Trust indemnifies its Officers and Trustees for certain liabilities that may arise from the performance of their duties to the Trust. Additionally, in the normal course of business, the Funds enter into contracts that contain a variety of representations and warranties and which provide general indemnities. The Funds’ maximum exposure under these arrangements is unknown, as this would involve future claims that may be made against the Funds that have not yet occurred. However, based on experience, the risk of loss due to these warranties and indemnities appears to be remote.
25
The Monarch ETFs
NOTES TO FINANCIAL STATEMENTS (Continued)
February 29, 2024
3. INVESTMENT TRANSACTIONS
For the year ended February 29, 2024, cost of purchases and proceeds from sales of portfolio securities (excluding in-kind transactions and short-term investments) for the Funds were as follows:
| Purchases | Sales | |||||||
| MAMB | $ | 71,388,071 | $ | 67,728,796 | ||||
| MBCC | $ | 41,726,667 | $ | 41,314,276 | ||||
| MPRO | $ | 189,156,584 | $ | 188,621,638 | ||||
For the year ended February 29, 2024, cost of purchases and proceeds from sales of portfolio securities for in-kind transactions for the Funds were as follows:
| Purchases | Sales | |||||||
| MAMB | $ | 26,200,128 | $ | 5,380,901 | ||||
| MBCC | $ | 34,189,584 | $ | 8,088,646 | ||||
| MPRO | $ | 56,244,658 | $ | 48,035,932 | ||||
4. INVESTMENT ADVISORY AGREEMENT AND TRANSACTIONS WITH RELATED PARTIES
The business activities of the Funds are overseen by the Board. Kingsview Wealth Management LLC (the “Adviser”) serves as the Funds’ investment adviser pursuant to an Investment Advisory Agreement with the Trust (the “Advisory Agreement”). The Adviser has engaged Penserra Capital Management LLC, as the sub-adviser (the “Sub-Adviser”), to manage the assets of the Funds.
Pursuant to the Advisory Agreement, the Adviser, under the oversight of the Board, directs the daily operations of the Funds and supervises the performance of administrative and professional services provided by others. As compensation for its services and the related expenses borne by the Adviser, each Fund pays the Adviser a fee, computed and accrued daily and paid monthly, at an annual rate of 0.85% of it’s average daily net assets. For the year ended February 29, 2024, the Adviser earned $429,248, $401,246, and $739,758 in investment advisory fees for MAMB, MBCC, and MPRO, respectively.
Pursuant to a written contract (the “Waiver Agreement”), the Adviser has agreed, at least until June 30, 2024, to waive a portion of its advisory fee and has agreed to reimburse each Fund for other expenses to the extent necessary so that total expenses incurred (exclusive of any front-end or contingent deferred loads, taxes, brokerage fees and commissions, borrowing costs (such as interest and dividend expense on securities sold short), acquired fund fees and expenses, fees and expenses associated with investments in other collective investment vehicles or derivative instruments (including for example option and swap fees and expenses), or extraordinary expenses such as litigation (which may include indemnification of Fund Officers and Trustees, contractual indemnification of Fund service providers (other than the Advisor))) will not exceed 1.25% of average daily net assets for each Fund, herein referred to as the “Expense Limitation.”
If the Adviser waives any fee or reimburses any expenses pursuant to the Waiver Agreement, and a Fund’s operating expenses are subsequently lower than its Expense Limitation, the Adviser, on a rolling three-year period, shall be entitled to reimbursement by the Fund provided that such reimbursement does not cause that Fund’s operating expenses to exceed the Expense Limitation in place at the time of waiver and at the time of reimbursement. If a Fund’s operating expenses subsequently exceed the Expense Limitation, the reimbursements
26
The Monarch ETFs
NOTES TO FINANCIAL STATEMENTS (Continued)
February 29, 2024
for the Fund shall be suspended. For the year ended February 29, 2024, the Adviser recaptured previously waived fees in the amount of $27,895 and $16,885 for MAMB and MBCC, respectively.
The following amounts previously waived by the Adviser are subject to recapture by the Funds by the following dates:
| February 28, 2025 | February 28, 2026 | |||||||
| MAMB | $ | 19,661 | $ | 25,327 | ||||
| MBCC | $ | 34,354 | $ | 48,986 | ||||
The Adviser may seek reimbursement only for expenses waived or paid by it during the three years prior to such reimbursement; provided, however, that such expenses may only be reimbursed to the extent they were waived or paid after the effective date of the Waiver Agreement (or any similar agreement). The Board may terminate this expense reimbursement arrangement at any time.
The Trust has entered into a Global Custody Agreement with Brown Brothers Harriman & Co. (the “Custodian”) to serve as custodian and to act as transfer and shareholder services agent. The Trust has also entered into an Underwriting Agreement with Northern Lights Distributors, LLC, (the “Distributor”) to serve as the principal underwriter and distributor for the Funds.
No distribution or service fees are currently paid by the Funds and there are no current plans to impose these fees. In the event Rule 12b-1 fees were charged, over time they would increase the cost of an investment in the Funds.
Ultimus Fund Solutions, LLC (“UFS”) – UFS, an affiliate of the distributor, provides administration and fund accounting services to the Trust. Pursuant to separate servicing agreements with UFS, the Funds pay UFS customary fees for providing administration and fund accounting services to the Funds. Certain officers of the Trust are also officers of UFS, and are not paid any fees directly by the Funds for serving in such capacities.
Northern Lights Compliance Services, LLC (“NLCS”) – NLCS, an affiliate of UFS and the distributor, provides a Chief Compliance Officer to the Trust, as well as related compliance services, pursuant to a consulting agreement between NLCS and the Trust. Under the terms of such agreement, NLCS receives customary fees from each Fund.
Blu Giant, LLC (“Blu Giant”) – Blu Giant, an affiliate of UFS and the distributor, provides EDGAR conversion and filing services as well as print management services for the Funds on an ad-hoc basis. For the provision of these services, Blu Giant receives customary fees from the Funds.
5. CAPITAL SHARE TRANSACTIONS
Shares are not individually redeemable and may be redeemed by the Funds at net asset value (“NAV”) only in large blocks known as “Creation Units.” Shares are created and redeemed by each Fund only in Creation Unit size aggregations of 25,000 shares. Only Authorized Participants or transactions done through an Authorized Participant are permitted to purchase or redeem Creation Units from a Fund. An Authorized Participant is either (i) a broker-dealer or other participant in the clearing process through the Continuous Net Settlement System of the National Securities Clearing Corporation or (ii) a DTC participant and, in each case, must have executed a Participant Agreement with the Distributor. Such transactions are generally permitted on an in-kind basis, with a balancing cash component to equate the transaction to the NAV per share of a Fund on the transaction date. Cash may be substituted equivalent to the value of certain securities generally when they are not available in sufficient
27
The Monarch ETFs
NOTES TO FINANCIAL STATEMENTS (Continued)
February 29, 2024
quantity for delivery, not eligible for trading by the Authorized Participant or as a result of other market circumstances. In addition, each Fund may impose transaction fees on purchases and redemptions of Fund shares to cover the custodial and other costs incurred by the Fund in effecting trades. A fixed fee may be imposed on each creation and redemption transaction regardless of the number of Creation Units involved in the transaction (“Fixed Fee”). Purchases and redemptions of Creation Units for cash or involving cash-in-lieu are required to pay an additional variable charge to compensate the Funds and their its ongoing shareholders for brokerage and market impact expenses relating to Creation Unit transactions (“Variable Charge,” and together with the Fixed Fee, the “Transaction Fees”). Transaction Fees may be used to cover the custodial and other costs incurred by a Fund.
The Transaction Fees for the Funds are listed in the table below:
| Fund | Fee for In-Kind and Cash Purchases | Maximum Additional Variable Charge for Cash Purchases* |
| MAMB | $225 | 2.00% |
| MBCC | $225 | 2.00% |
| MPRO | $225 | 2.00% |
* The maximum Transaction Fee is 2.00% as a percentage of the amount invested.
For the year ended February 29, 2024, the fixed and variable fees were as follows:
| Fund | Fixed Fees | Variable Fees | ||||||
| MAMB | $ | 9,450 | $ | — | ||||
| MBCC | $ | 9,000 | $ | — | ||||
| MPRO | $ | 12,150 | $ | — | ||||
6. DISTRIBUTIONS TO SHAREHOLDERS AND TAX COMPONENTS OF CAPITAL
The tax character of fund distributions paid for the years ended February 29, 2024 and February 28, 2023 was as follows:
| For fiscal year or period ended | Ordinary | Long-Term | Return of | |||||||||||||
| 2/29/2024 | Income | Capital Gains | Capital | Total | ||||||||||||
| MAMB | $ | 933,030 | $ | — | $ | — | $ | 933,030 | ||||||||
| MBCC | 49,740 | — | — | 49,740 | ||||||||||||
| MPRO | 1,234,853 | — | — | 1,234,853 | ||||||||||||
| For fiscal year or period ended | Ordinary | Long-Term | Return of | |||||||||||||
| 2/28/2023 | Income | Capital Gains | Capital | Total | ||||||||||||
| MAMB | $ | 351,088 | $ | — | $ | — | $ | 351,088 | ||||||||
| MBCC | — | — | — | — | ||||||||||||
| MPRO | 909,143 | — | — | 909,143 | ||||||||||||
28
The Monarch ETFs
NOTES TO FINANCIAL STATEMENTS (Continued)
February 29, 2024
As of February 29, 2024, the components of accumulated earnings/(deficit) on a tax basis were as follows:
| Undistributed | Undistributed | Post October Loss | Capital Loss | Other | Unrealized | Total | ||||||||||||||||||||||
| Ordinary | Long-Term | and | Carry | Book/Tax | Appreciation/ | Accumulated | ||||||||||||||||||||||
| Income | Capital Gains | Late Year Loss | Forwards | Differences | (Depreciation) | Earnings/(Deficits) | ||||||||||||||||||||||
| MAMB | $ | 101,333 | $ | — | $ | (90,684 | ) | $ | (4,864,085 | ) | $ | — | $ | (36,535 | ) | $ | (4,889,971 | ) | ||||||||||
| MBCC | $ | 2,323 | $ | — | $ | (289,302 | ) | $ | (2,779,319 | ) | $ | — | $ | 13,985,494 | $ | 10,919,196 | ||||||||||||
| MPRO | $ | 147,225 | $ | — | $ | — | $ | (9,276,480 | ) | $ | — | $ | 6,146,524 | $ | (2,982,731 | ) | ||||||||||||
The difference between book basis and tax basis undistributed net investment income (loss), accumulated net realized losses and unrealized appreciation (depreciation) from investments is primarily attributable to the tax deferral of losses on wash sales and adjustments for grantor trusts.
Late year losses incurred after October 31 within the fiscal year are deemed to arise on the first business day of the following fiscal year for tax purposes. The Funds incurred and elected to defer such late year losses as follows:
| Late Year | ||||
| Losses | ||||
| MAMB | $ | — | ||
| MBCC | 24,957 | |||
| MPRO | — | |||
Capital losses incurred after October 31 within the fiscal year are deemed to arise on the first business day of the following fiscal year for tax purposes. The Funds incurred and elected to defer such capital losses as follows:
| Post October | ||||
| Losses | ||||
| MAMB | $ | 90,684 | ||
| MBCC | 264,345 | |||
| MPRO | — | |||
At February 29, 2024, the Funds had capital loss carry forwards for federal income tax purposes available to offset future capital gains, along with capital loss carryforwards utilized as follows:
| Non Expiring | Non Expiring | Capital Loss Carry | ||||||||||||||
| Short-Term | Long-Term | Total | Forwards Utilized | |||||||||||||
| MAMB | $ | 3,171,758 | $ | 1,692,327 | $ | 4,864,085 | $ | — | ||||||||
| MBCC | 2,153,430 | 625,889 | 2,779,319 | — | ||||||||||||
| MPRO | 9,276,480 | — | 9,276,480 | — | ||||||||||||
29
The Monarch ETFs
NOTES TO FINANCIAL STATEMENTS (Continued)
February 29, 2024
Permanent book and tax differences, primarily attributable to tax adjustments for realized gain (loss) on in-kind redemptions and the book/tax basis treatment of non-deductible expenses, resulted in reclassifications for the Funds for the year ended February 29, 2024 as follows:
| Paid In Capital | Accumulated Earnings (Deficit) | |||||||
| MAMB | $ | 306,028 | $ | (306,028 | ) | |||
| MBCC | 1,155,051 | (1,155,051 | ) | |||||
| MPRO | 1,452,372 | (1,452,372 | ) | |||||
7. AGGREGATE UNREALIZED APPRECIATION AND DEPRECIATION – TAX BASIS
| Gross Unrealized | Gross Unrealized | Net Unrealized | ||||||||||||||
| Portfolio | Tax Cost | Appreciation | Depreciation | Appreciation (Depreciation) | ||||||||||||
| MAMB | $ | 67,756,367 | $ | 1,979,712 | $ | (2,016,247 | ) | $ | (36,535 | ) | ||||||
| MBCC | 62,456,800 | 14,432,420 | (446,926 | ) | 13,985,494 | |||||||||||
| MPRO | 109,897,370 | 7,909,414 | (1,762,890 | ) | 6,146,524 | |||||||||||
8. UNDERLYING INVESTMENT IN OTHER INVESTMENT COMPANIES
MPRO currently invests a significant portion of its assets in the iShares Core U.S. Aggregate Bond ETF (“iShares ETF”). MPRO may redeem its investment in the iShares ETF at any time if the Adviser determines that it is in the best interest of MPRO and its shareholders to do so. MPRO’s performance will be directly affected by the performance of the iShares ETF. The financial statements of the iShares ETF, including the portfolio of investments, can be found on the Securities and Exchange Commission’s website www.sec.gov and should be read in conjunction with MPRO’s financial statements. As of February 29, 2024, MPRO’s investment in iShares represented 48.7% of MPRO’s net assets.
9. REGULATORY UPDATES
On January 24, 2023, the SEC adopted rule and form amendments to require mutual funds and ETFs to transmit concise and visually engaging streamlined annual and semiannual reports to shareholders that highlight key information. Other information, including financial statements, will not appear in a streamlined shareholder report but must be available online, delivered free of charge upon request, and filed on a semiannual basis on Form N-CSR. The rule and form amendments have a compliance date of July 24, 2024. At this time, management is evaluating the impact of these amendments on the shareholder reports for the Funds.
30
The Monarch ETFs
NOTES TO FINANCIAL STATEMENTS (Continued)
February 29, 2024
10. SUBSEQUENT EVENTS
Subsequent events after the date of the Statements of Assets and Liabilities have been evaluated through the date the financial statements were issued. Management has determined that no other events or transactions occurred requiring adjustment or disclosure in the financial statements other than the following. Effective March 4, 2024 the Funds’ names changed as follows:
Monarch Ambassador Income ETF to “Monarch Ambassador Income Index ETF”
Monarch Blue Chips Core ETF to “Monarch Blue Chips Core Index ETF”
Monarch ProCap ETF to “Monarch ProCap Index ETF”
Effective March 4, 2024 the names of the indices that each Fund seeks to replicate changed as follows:
Kingsview Ambassador Income Index to “Monarch Ambassador Income Index”
Kingsview Blue Chips Core Index to “Monarch Blue Chips Core Index”
Kingsview ProCap Index to “Monarch ProCap Index”
31

REPORT OF INDEPENDENT REGISTERED PUBLIC ACCOUNTING FIRM
To the Shareholders of Monarch Ambassador Income ETF, Monarch Blue Chips Core ETF and Monarch ProCap ETF and Board of Trustees of Northern Lights Fund Trust IV
Opinion on the Financial Statements
We have audited the accompanying statements of assets and liabilities, including the schedules of investments, of Monarch Ambassador Income ETF, Monarch Blue Chips Core ETF and Monarch ProCap ETF (the “Funds”), each a series of Northern Lights Fund Trust IV, as of February 29, 2024, the related statements of operations for the year then ended, the statements of changes in net assets for each of the two years in the period then ended, the related notes, and the financial highlights for the years ended February 29, 2024, February 28, 2023, and for the period March 23, 2021 (commencement of operations) through February 28, 2022 (collectively referred to as the “financial statements”). In our opinion, the financial statements present fairly, in all material respects, the financial position of each of the Funds as of February 29, 2024, the results of their operations for the year then ended, the changes in net assets for each of the two years in the period then ended, and the financial highlights for the years ended February 29, 2024, February 28, 2023, and for the period March 23, 2021 (commencement of operations) through February 28, 2022, in conformity with accounting principles generally accepted in the United States of America.
Basis for Opinion
These financial statements are the responsibility of the Funds’ management. Our responsibility is to express an opinion on the Funds’ financial statements based on our audits. We are a public accounting firm registered with the Public Company Accounting Oversight Board (United States) (“PCAOB”) and are required to be independent with respect to the Funds in accordance with the U.S. federal securities laws and the applicable rules and regulations of the Securities and Exchange Commission and the PCAOB.
We conducted our audits in accordance with the standards of the PCAOB. Those standards require that we plan and perform the audit to obtain reasonable assurance about whether the financial statements are free of material misstatement whether due to error or fraud.
Our audits included performing procedures to assess the risks of material misstatement of the financial statements, whether due to error or fraud, and performing procedures that respond to those risks. Such procedures included examining, on a test basis, evidence regarding the amounts and disclosures in the financial statements. Our procedures included confirmation of securities owned as of February 29, 2024, by correspondence with the custodian and broker. Our audits also included evaluating the accounting principles used and significant estimates made by management, as well as evaluating the overall presentation of the financial statements. We believe that our audits provide a reasonable basis for our opinion.
We have served as the Funds’ auditor since 2021.

COHEN & COMPANY, LTD.
Philadelphia, Pennsylvania
April 25, 2024
COHEN & COMPANY, LTD.
800.229.1099 | 866.818.4538 fax | cohencpa.com
Registered with the Public Company Accounting Oversight Board
32
The Monarch ETFs
EXPENSE EXAMPLES
February 29, 2024
As a shareholder of one or more of the Funds, you incur two types of costs: (1) transaction costs, including brokerage commissions on purchases and sales of Fund shares; (2) ongoing costs, including management fees and other Fund expenses. These examples are intended to help you understand your ongoing costs (in dollars) of investing in the Funds and to compare these costs with the ongoing costs of investing in other funds.
The examples are based on an investment of $1,000 invested at the beginning of the period and held for the entire period from September 1, 2023 through February 29, 2024.
Actual Expenses
The “Actual” lines in the table below provide information about actual account values and actual expenses. You may use the information below, together with the amount you invested, to estimate the expenses that you paid over the period. Simply divide your account value by $1,000 (for example, an $8,600 account value divided by $1,000 = 8.6), then multiply the result by the number in the table under the heading entitled “Expenses Paid During Period” to estimate the expenses you paid on your account during this period.
Hypothetical Example for Comparison Purposes
The “Hypothetical” lines in the table below provide information about hypothetical account values and hypothetical expenses based on the Funds’ actual expense ratios and an assumed rate of return of 5% per year before expenses, which are not the Funds’ actual returns. The hypothetical account values and expenses may not be used to estimate the actual ending account balances or expenses you paid for the period. You may use this information to compare this 5% hypothetical example with the 5% hypothetical examples that appear in the shareholder reports of other funds.
Please note that the expenses shown in the table are meant to highlight your ongoing costs only and do not reflect any transactional costs, such as brokerage commissions paid on purchases and sales of Fund shares. Therefore, the table is useful in comparing ongoing costs only, and will not help you determine the relative total costs of owning different funds. In addition, if these transactional costs were included, your costs would have been higher.
| Actual | Beginning Account Value 9/1/23 | Ending Account Value 2/29/24 | Expenses Paid During Period* 9/1/23-2/29/24 | Expenses Paid During Period** 9/1/23-2/29/24 | ||||
| MAMB | $1,000.00 | $1,021.00 | $6.28 | 1.25% | ||||
| MBCC | $1,000.00 | $1,159.30 | $6.71 | 1.25% | ||||
| MPRO | $1,000.00 | $1,075.60 | $5.37 | 1.04% | ||||
| Hypothetical | ||||||||
| (5% return before expenses) | ||||||||
| MAMB | $1,000.00 | $1,018.65 | $6.27 | 1.25% | ||||
| MBCC | $1,000.00 | $1,018.65 | $6.27 | 1.25% | ||||
| MPRO | $1,000.00 | $1,019.69 | $5.22 | 1.04% |
| * | “Actual” expenses are equal to the average account value over the period multiplied by Fund’s annualized net expense ratios multiplied by 182/366 (to reflect the period from September 1, 2023 to February 29, 2024). “Hypothetical” expense information for the Funds is presented on the basis of the full one-half year period to enable comparison to other funds. It is based on assuming the same net expense ratios and average account values over the period, but is multiplied by 182/366 (to reflect the full half-year period). |
| ** | Annualized. |
33
The Monarch ETFs
SUPPLEMENTAL INFORMATION (Unaudited)
February 29, 2024
LIQUIDITY RISK MANAGEMENT PROGRAM
The Funds have adopted and implemented a written liquidity risk management program as required by Rule 22e-4 (the “Liquidity Rule”) under the 1940 Act. The program is reasonably designed to assess and manage the Funds’ liquidity risk, taking into consideration, among other factors, each respective Funds’ investment strategies and the liquidity of their portfolio investments during normal and reasonably foreseeable stressed conditions; their short and long-term cash flow projections; and their cash holdings and access to other funding sources.
During the year ended February 29, 2024, the Trust’s Liquidity Risk Management Program Committee (the “Committee”) reviewed the Funds’ investments and determined that the Funds held adequate levels of cash and highly liquid investments to meet shareholder redemption activities in accordance with applicable requirements. Accordingly, the Committee concluded that (i) the Funds’ liquidity risk management program is reasonably designed to prevent violations of the Liquidity Rule and (ii) the Funds’ liquidity risk management program has been effectively implemented.
34
The Monarch ETFs
SUPPLEMENTAL INFORMATION (Unaudited)
February 29, 2024
Renewal of the Investment Advisory Agreement with Kingsview Wealth Management LLC
In connection with the meeting of the Board of Trustees (the “Board”) of Northern Lights Fund Trust IV (the “Trust”) held on October 24, 2023 (the “Meeting”), the Board, including a majority of the Trustees who are not “interested persons” as that term is defined in the Investment Company Act of 1940, as amended, discussed the renewal of an investment advisory agreement (the “Kingsview Advisory Agreement”) between Kingsview Wealth Management LLC (“Kingsview”) and the Trust, with respect to Monarch Ambassador Income ETF (“Monarch AI”), Monarch Blue Chips Core ETF (“Monarch BCC”) and Monarch ProCap ETF (“Monarch PC”, each an “Existing Monarch ETF” and collectively, the “Existing Monarch ETFs”). In considering the renewal of the Kingsview Advisory Agreement, the Board received materials specifically relating to the Kingsview Advisory Agreement.
The Board reviewed and discussed the materials that were provided in advance of the Meeting and deliberated on the renewal of the Kingsview Advisory Agreement. The Board relied upon the advice of independent legal counsel and its own business judgment in determining the material factors to be considered in evaluating the Kingsview Advisory Agreement on behalf of Monarch AI, Monarch BCC and Monarch PC and the weight to be given to each factor considered. The conclusions reached by the Board were based on a comprehensive evaluation of all of the information provided and were not the result of any one factor. Moreover, each Trustee may have afforded different weight to the various factors in reaching his conclusions with respect to the renewal of the Kingsview Advisory Agreement.
Nature, Extent and Quality of Services. The Board noted that there were no changes to the key personnel who service the Existing Monarch ETFs. The Board discussed the services Kingsview provided the Existing Monarch ETFs, including portfolio management and compliance oversight. The Board acknowledged that Kingsview served as the index provider for the Existing Monarch ETFs and that it utilized an index calculator, which Kingsview did not foresee any issues or concerns regarding its financial ability to meet its commitments. The Board noted that Kingsview’s index specialists performed extensive research to develop indices on which strategies are based and that the index specialists ensured quality investment management techniques were provided to the Existing Monarch ETFs. The Board reviewed Kingsview’s policies on compliance monitoring and its robust cybersecurity policy. The Board noted that Kingsview utilized a trading sub-adviser that provided portfolio management services and trading, and that Kingsview believed that the sub-adviser was providing high quality services at appropriate sub-advisory fee levels. The Board acknowledged that Kingsview collaborated with its sub-adviser to monitor the trading of its shares with its internal tool. The Board observed that that the bid/ask spreads of the Existing Monarch ETFs were monitored throughout the course of the trading day and have remained tight over the past year. The Board acknowledged that Kingsview underwent an SEC examination that concluded several years ago and that there were no material litigation or administrative action involving Kingsview since the approval of the advisory agreement. The Board determined that it could expect Kingsview to continue to provide satisfactory services to each Existing Monarch ETF and its shareholders.
Performance.
Monarch AI—The Board discussed the performance of Monarch AI’s benchmark, which it sought to track, and noted that Kingsview believed that volatility and risk-adjusted returns were important considerations when evaluating index performance and that the index could have higher volatility than other funds in comparison groups because of its ability to invest a portion of its assets in an alternative sleeve that provided exposure to gold and other commodity ETFs. The Board concluded that Monarch AI’s tracking error was acceptable.
Monarch BCC—The Board noted that the benchmark index, which Monarch BCC sought to track, had higher volatility than other funds in its comparison groups at times because of its ability to concentrate its assets in a narrow group of sectors. The Board noted that the benchmark index’s exposure to the technology sector had negatively impacted the index over the past year as technology had seen higher volatility and diminished returns when compared to the S&P 500 Index as a whole. The Board concluded that the tracking error for Monarch BCC was acceptable.
Monarch PC—The Board discussed the performance of Monarch PC Index, which the Monarch PC sought to track, noting that the index was constructed to factor in proprietary analysis of economic data and make allocation adjustments that for the review period positively impacted performance of the index while reducing its volatility. The Board concluded that Monarch PC’s tracking error was satisfactory.
35
The Monarch ETFs
SUPPLEMENTAL INFORMATION (Unaudited) (Continued)
February 29, 2024
Fees and Expenses.
Monarch AI—The Board noted that the 0.85% advisory fee for Monarch AI and 1.25% expense ratio were the highest of Monarch AI’s peer group and its Morningstar category. The Board noted Kingsview’s representation that advisory fee was reasonable considering the expense caps Monarch AI had in place in order to limit the net expense ratio, as well as Monarch AI’s unique indexing approach to fixed income investing through the use of an alternative sleeve and ability to invest in a wide range of fixed income categories of varying credit quality and duration. The Board considered the fact that the contractual expense limitation would be renewed for an additional year. The Board concluded that the fee for the Monarch AI was not unreasonable.
Monarch BCC—The Board observed that the 0.85% advisory fee for Monarch BCC and 1.25% expense ratio were higher than Monarch BCC’s peer group and Morningstar category averages but below the 2.00% advisory fee high and the 1.99% expense ratio high of the Morningstar category. The Board noted Kingsview’s representation that the advisory fee was reasonable when considering the expense caps Monarch BCC had in place in order to limit the net expense ratio and the Monarch BCC’s exposure to unique index rules-based methodology the determines the 24 highest ranking companies. The Board considered the fact that the contractual expense limitation would be renewed for an additional year. The Board concluded that the fee for Monarch BCC was not unreasonable.
Monarch PC—The Board recognized that the 0.85% advisory fee for Monarch PC was higher than the Morningstar category average of 0.76% but lower than the peer group average of 0.90%. The Board noted that the 1.17% net expense ratio for Monarch PC was higher than the Morningstar category average of 0.99% and peer group average of 1.16%. The Board acknowledged that Kingsview believed the advisory fee to be reasonable considering the Monarch PC’s proprietary analysis of economic data and the index feature that adjusted equity sectors along with fixed income and alternative allocations on a monthly basis, which have been demonstrated by its since inception returns during difficult and volatile market conditions. The Board considered the fact that the contractual expense limitation would be renewed for an additional year. The Board concluded that the fee for Monarch PC was not unreasonable.
Profitability.
Monarch AI—The Board discussed that Kingsview earned a modest profit with respect to Monarch AI. The Board determined that excessive profitability was not an issue with respect to Monarch AI at this time.
Monarch BCC—The Board observed that Kingsview earned a modest profit with respect to Monarch BCC. The Board concluded that Kingsview’s profitability was not excessive.
Monarch PC—The Board noted that Kingsview earned a reasonable profit with respect to Monarch PC on an absolute and relative basis. The Board determined that excessive profitability was not an issue with respect to Monarch PC at this time.
Economies of Scale. The Board considered whether economies of scale had been reached with respect to the management of any of the Existing Monarch ETFs. The Board considered that Kingsview perceived no economies of scale with respect to the Existing Monarch ETFs at the present moment, but remained willing to consider breakpoints as the assets in each Existing Monarch ETF continued to grow.
Conclusion. Having requested such information from Kingsview as the Board believed to be reasonably necessary to evaluate the terms of the advisory agreement, and with the advice of independent counsel, the Board determined that renewal of the advisory agreement with Kingsview was in the best interests of each Existing Monarch ETF and its shareholders.
36
The Monarch ETFs
SUPPLEMENTAL INFORMATION (Unaudited)
February 29, 2024
Renewal of Investment Sub-Advisory Agreement between Kingsview Wealth Management LLC and Penserra Capital Management LLC
In connection with the meeting of the Board of Trustees (the “Board”) of Northern Lights Fund Trust IV (the “Trust”) held on October 24, 2023 (the “Meeting”), the Board ,including a majority of the Trustees who are not “interested persons” as that term is defined in the Investment Company Act of 1940, as amended, discussed the renewal of an investment sub-advisory agreement (“Penserra Sub-Advisory Agreement”) between Kingsview Wealth Management LLC (“Kingsview”) and Penserra Capital Management LLC (“Penserra”) with respect to Monarch Ambassador Income ETF (“Monarch AI”), Monarch Blue Chips Core ETF (“Monarch BCC”) and Monarch ProCap ETF (“Monarch PC”, each an “Existing Monarch ETF” and collectively, the “Existing Monarch ETFs”). In considering the renewal of the Penserra Sub-Advisory Agreement, the Board received materials specifically relating to the Penserra Sub-Advisory Agreement.
The Board reviewed and discussed the materials that were provided in advance of the Meeting and deliberated on the renewal of the Penserra Sub-Advisory Agreement. The Board relied upon the advice of independent legal counsel and its own business judgment in determining the material factors to be considered in evaluating the Penserra Sub-Advisory Agreement and the weight to be given to each factor considered. The conclusions reached by the Board were based on a comprehensive evaluation of all of the information provided and were not the result of any one factor. Moreover, each Trustee may have afforded different weight to the various factors in reaching his conclusions with respect to the renewal of the Penserra Sub-Advisory Agreement.
Nature, Extent and Quality of Services. The Board reviewed the responsibilities and experience of the key personnel at Penserra and noted that there were no changes since the approval of the sub-advisory agreement. The Board discussed the services provided by Penserra, which included portfolio management and trading, including performance of daily reconciliations, index checks, performance checks, cash management and corporate action responses. The Board noted that Penserra assisted the adviser with pricing and valuation issues, capital markets activity, compliance with ETF rules along with other matters. The Board discussed Penserra’s compliance monitoring practices, which included a technology platform and compliance calendar, and its cybersecurity protocols to protect the integrity of physical equipment and improper access to available systems. The Board reviewed Penserra’s polices with respect to the selection of broker-dealers for portfolio transactions, which included best execution reviews. The Board observed that Penserra reported no SEC or regulatory examination and was not a party to any litigation or administrative action. The Board concluded that it could expect Penserra to continue providing satisfactory services to the Existing Monarch ETFs and their shareholders.
Performance.
Monarch AI—The Board discussed the performance of Monarch AI’s benchmark, which it sought to track, and noted that Kingsview believed that volatility and risk-adjusted returns were important considerations when evaluating index performance and that the index could have higher volatility than other funds in comparison groups because of its ability to invest a portion of its assets in an alternative sleeve that provided exposure to gold and other commodity ETFs. The Board concluded that Monarch AI’s tracking error was acceptable.
Monarch BCC—The Board noted that the benchmark index, which Monarch BCC sought to track, had higher volatility than other funds in its comparison groups at times because of its ability to concentrate its assets in a narrow group of sectors. The Board noted that the benchmark index’s exposure to the technology sector had negatively impacted the index over the past year as technology had seen higher volatility and diminished returns when compared to the S&P 500 Index as a whole. The Board concluded that the tracking error for Monarch BCC was acceptable.
Monarch PC—The Board discussed the performance of Monarch PC Index, which the Monarch PC sought to track, noting that the index was constructed to factor in proprietary analysis of economic data and make allocation adjustments that for the review period positively impacted performance of the index while reducing its volatility. The Board concluded that Monarch PC’s tracking error was satisfactory.
Fees and Expenses. The Board observed that Penserra’s sub-advisory fee for each of the Existing Monarch ETFs included breakpoints at higher level of assets under management. The Board noted that the highest sub-advisory fee was in line with the average fee for Penserra’s other accounts. The Board concluded that each sub-advisory fee was not unreasonable.
37
The Monarch ETFs
SUPPLEMENTAL INFORMATION (Unaudited) (Continued)
February 29, 2024
Profitability. The Board reviewed a profitability analysis provided by Penserra and observed that Penserra was sub-advising the Existing Monarch ETFs at a loss. The Board determined that excessive profitability was therefore not an issue for Penserra at this time.
Economies of Scale. The Board considered whether Penserra would expect realized economies of scale with respect to the sub-advisory services provided to the Existing Monarch ETFs. The Board agreed that this was primarily an advisor-level issue and should be considered with respect to the overall advisory agreement taking into consideration the impact of the sub-advisory expense. The Board concluded that it was unlikely that Penserra was benefitting from any material economies of scale.
Conclusion . Having requested such information from Penserra as the Board believed to be reasonably necessary to evaluate the terms of the sub-advisory agreement, and with the advice of independent counsel, the Board determined that renewal of the sub-advisory agreement between Kingsview and Penserra was in the best interests of the Existing Monarch ETFs and their shareholders.
38
The Monarch ETFs
SUPPLEMENTAL INFORMATION (Unaudited)
February 29, 2024
The business address of each Trustee and Officer is 225 Pictoria Drive, Suite 450, Cincinnati, OH 45246. All correspondence to the Trustees and Officers should be directed to c/o Ultimus Fund Solutions, LLC, P.O. Box 541150, Omaha, Nebraska 68154.
Independent Trustees***
| Name, Address and Year of Birth | Position/Term of Office* | Principal Occupation During the Past Five Years | Number of Funds in Fund Complex** Overseen by Trustee | Other Directorships held by Trustee During the Past Five Years |
| Joseph Breslin Year of Birth: 1953 | Independent Trustee and Chairman of the Board since 2015 | President and Consultant, Adviser Counsel, Inc. (formerly J.E. Breslin & Co.) (management consulting firm to investment advisers), (since 2009); Senior Counsel, White Oak Global Advisors, LLC. (since 2016). | 3 | Northern Lights Fund Trust IV (for series not affiliated with the Fund since 2015); Director, Kinetics Mutual Funds, Inc. (since 2000); Trustee, Kinetics Portfolios Trust (since 2000); Trustee, Forethought Variable Insurance Trust (since 2013). |
| Thomas Sarkany Year of Birth: 1946 | Independent Trustee since 2015 | Founder and President, TTS Associates Inc. (since December 2022); and Founder and President, TTS Consultants, LLC (financial services) (since 2010). | 3 | Northern Lights Fund Trust IV (for series not affiliated with the Fund since 2015); Arrow Investments Trust (since 2014), Arrow ETF Trust (since 2012), Trustee, Northern Lights Fund Trust II (since 2011); Director, Aquila Distributors (since 1981) |
| Charles Ranson Year of Birth: 1947 | Independent Trustee since 2015 | Principal, Ranson & Associates (strategic analysis and planning, including risk assessment and capital formation for entrepreneurial ventures) (since 2003). | 3 | Northern Lights Fund Trust IV (for series not affiliated with the Fund since 2015); Advisors Preferred Trust (since November 2012) |
2/29/24 – NLFT IV_v1
39
The Monarch ETFs
SUPPLEMENTAL INFORMATION (Unaudited) (Continued)
February 29, 2024
Officers
| Name, Address and Year of Birth | Position/Term of Office* | Principal Occupation During the Past Five Years | Number of Funds in Fund Complex** Overseen by Trustee | Other Directorships held by Trustee During the Past Five Years |
| Wendy Wang*** 80 Arkay Drive Hauppauge, NY 11788 Year of Birth: 1970 | President since 2015 | Senior Vice President, Director of Tax and Compliance Administration, Ultimus Fund Solutions, LLC (since 2012). | N/A | N/A |
| Sam Singh 80 Arkay Drive Hauppauge, NY 11788 Year of Birth: 1976 | Treasurer since 2015 | Vice President, Ultimus Fund Solutions, LLC (since 2015). | N/A | N/A |
| Jennifer Farrell 80 Arkay Drive Hauppauge, NY 11788 Year of Birth: 1969 | Secretary since 2017 | Associate Director (since 2022) and Manager (2018-2022), Legal Administration), Ultimus Fund Solutions, LLC; Senior Paralegal, Gemini Fund Services, LLC (since 2015). | N/A | N/A |
| James Ash Year of Birth: 1976 | Chief Compliance Officer since 2019 | Senior Vice President, Head of Compliance (since 2023 ); Senior Compliance Officer, Northern Lights Compliance, LLC (2019 - 2023); Senior Vice President, National Sales Gemini Fund Services, LLC (2017-2019). | N/A | N/A |
| * | The term of office for each Trustee and officer listed above will continue indefinitely until the individual resigns or is removed. |
| ** | As of February 29, 2024, the Trust was comprised of 36 active portfolios managed by unaffiliated investment advisers. The term “Fund Complex” applies only to the Funds and the Funds managed by the same investment adviser. The Funds do not hold themselves out as related to any other series within the Trust for investment purposes, nor do they share the same investment adviser with any other series. |
| *** | Ms. Wang served as an interested Trustee from April 24, 2023 to January 25, 2024. She was an interested Trustee because she was also an officer of the Trust. |
The Funds’ SAI includes additional information about the Trustees and is available free of charge, upon request, by calling toll-free at 1-541-291-4405
2/29/24 – NLFT IV_v1
40
PRIVACY NOTICE
Northern Lights Fund Trust IV
Rev. April 2021
| FACTS | WHAT DOES NORTHERN LIGHTS FUND TRUST IV DO WITH YOUR PERSONAL INFORMATION? |
| Why? | Financial companies choose how they share your personal information. Federal law gives consumers the right to limit some, but not all sharing. Federal law also requires us to tell you how we collect, share, and protect your personal information. Please read this notice carefully to understand what we do. |
| What? | The types of personal information we collect and share depends on the product or service that you have with us. This information can include:
● Social Security number and wire transfer instructions
● account transactions and transaction history
● investment experience and purchase history
When you are no longer our customer, we continue to share your information as described in this notice. |
| How? | All financial companies need to share customers’ personal information to run their everyday business. In the section below, we list the reasons financial companies can share their customers’ personal information; the reasons Northern Lights Fund Trust IV chooses to share; and whether you can limit this sharing. |
| Reasons we can share your personal information: | Does Northern Lights Fund Trust IV share information? | Can you limit this sharing? |
| For our everyday business purposes - such as to process your transactions, maintain your account(s), respond to court orders and legal investigations, or report to credit bureaus. | YES | NO |
| For our marketing purposes - to offer our products and services to you. | NO | We don’t share |
| For joint marketing with other financial companies. | NO | We don’t share |
| For our affiliates’ everyday business purposes - information about your transactions and records. | NO | We don’t share |
| For our affiliates’ everyday business purposes - information about your credit worthiness. | NO | We don’t share |
| For nonaffiliates to market to you | NO | We don’t share |
| QUESTIONS? | Call 1-631-490-4300 |
41
PRIVACY NOTICE
Northern Lights Fund Trust IV
| Page 2 |
| What we do: | |
How does Northern Lights Fund Trust IV protect my personal information? | To protect your personal information from unauthorized access and use, we use security measures that comply with federal law. These measures include computer safeguards and secured files and buildings.
Our service providers are held accountable for adhering to strict policies and procedures to prevent any misuse of your nonpublic personal information. |
How does Northern Lights Fund Trust IV collect my personal information? | We collect your personal information, for example, when you ● open an account or deposit money
● direct us to buy securities or direct us to sell your securities
● seek advice about your investments
We also collect your personal information from others, such as credit bureaus, affiliates, or other companies. |
Why can’t I limit all sharing? | Federal law gives you the right to limit only: ● sharing for affiliates’ everyday business purposes – information about your creditworthiness.
● affiliates from using your information to market to you.
● sharing for nonaffiliates to market to you.
State laws and individual companies may give you additional rights to limit sharing. |
| Definitions | |
| Affiliates | Companies related by common ownership or control. They can be financial and nonfinancial companies.
● Northern Lights Fund Trust IV has no affiliates. |
| Nonaffiliates | Companies not related by common ownership or control. They can be financial and nonfinancial companies.
● Northern Lights Fund Trust IV does not share with nonaffiliates so they can market to you. |
| Joint marketing | A formal agreement between nonaffiliated financial companies that together market financial products or services to you.
● Northern Lights Fund Trust IV does not jointly market. |
42
PROXY VOTING POLICY
Information regarding how the Funds voted proxies relating to portfolio securities for the most recent twelve-month period ended June 30 as well as a description of the policies and procedures that the Funds use to determine how to vote proxies is available without charge, upon request, by calling 1-877 -658-9473 or by referring to the Securities and Exchange Commission’s (“SEC”) website at http://www.sec.gov.
PORTFOLIO HOLDINGS
The Funds file a complete schedule of portfolio holdings with the SEC for the first and third quarters of each fiscal year as an exhibit to their reports on Form N-PORT, within sixty days after the end of the period. Form N-PORT reports are available at the SEC’s website at www.sec.gov.
PREMIUM/DISCOUNT INFORMATION
Information regarding how often the Shares of each Fund traded on the exchange at a price above (i.e., at a premium) or below (i.e., at a discount) the NAV of the Fund during the past calendar year can be found at www.monarchfunds.com.
| INVESTMENT ADVISOR |
| Kingsview Wealth Management LLC |
| 509 SE 7th Street, 2nd Floor |
| Grants Pass, OR 97526 |
| INVESTMENT SUB-ADVISOR |
| Penserra Capital Management LLC |
| 4 Orinda Way, Suite 100 |
| Orinda, CA 94563 |
| ADMINISTRATOR |
| Ultimus Fund Solutions, LLC |
| 4221 North 203rd Street, Suite 100 |
| Elkhorn, NE 68022-3474 |
| MONARCH-A24 |
Item 2. Code of Ethics.
(a) As of the end of the period covered by this report, the registrant has adopted a code of ethics that applies to the registrant's principal executive officer, principal financial officer, principal accounting officer or controller, or persons performing similar functions, regardless of whether these individuals are employed by the registrant or a third party.
(b) For purposes of this item, “code of ethics” means written standards that are reasonably designed to deter wrongdoing and to promote:
| (1) | Honest and ethical conduct, including the ethical handling of actual or apparent conflicts of interest between personal and professional relationships; |
| (2) | Full, fair, accurate, timely, and understandable disclosure in reports and documents that a registrant files with, or submits to, the Commission and in other public communications made by the registrant; |
(3) Compliance with applicable governmental laws, rules, and regulations;
| (4) | The prompt internal reporting of violations of the code to an appropriate person or persons identified in the code; and |
(5) Accountability for adherence to the code.
(c) Amendments: During the period covered by the report, there have not been any amendments to the provisions of the code of ethics.
(d) Waivers: During the period covered by the report, the registrant has not granted any express or implicit waivers from the provisions of the code of ethics.
(e) The Code of Ethics is not posted on Registrant’ website.
(f) A copy of the Code of Ethics is attached as an exhibit.
Item 3. Audit Committee Financial Expert.
(a) The Registrant’s board of trustees has determined that Joseph Breslin is an audit committee financial expert, as defined in Item 3 of Form N-CSR. Mr. Breslin is independent for purposes of this Item 3.
Item 4. Principal Accountant Fees and Services.
| (a) | Audit Fees |
2024 – $40,500
2023 - $37,500
| (b) | Audit-Related Fees |
2024 – None
2023 – None
| (c) | Tax Fees |
2024 – $9,000
2023 – $9,000
Preparation of Federal & State income tax returns, assistance with calculation of required income, capital gain and excise distributions and preparation of Federal excise tax returns.
| (d) | All Other Fees |
2024 – None
2023 – None
| (e) | (1) Audit Committee’s Pre-Approval Policies |
The registrant’s Audit Committee is required to pre-approve all audit services and, when appropriate, any non-audit services (including audit-related, tax and all other services) to the registrant. The registrant’s Audit Committee also is required to pre-approve, when appropriate, any non-audit services (including audit-related, tax and all other services) to its adviser, or any entity controlling, controlled by or under common control with the adviser that provides ongoing services to the registrant, to the extent that the services may be determined to have an impact on the operations or financial reporting of the registrant. Services are reviewed on an engagement-by-engagement basis by the Audit Committee.
| (2) | Percentages of Services Approved by the Audit Committee |
| 2024 | 2023 | ||||||||
| Audit-Related Fees: | 0.00 | % | 0.00 | % | |||||
| Tax Fees: | 0.00 | % | 0.00 | % | |||||
| All Other Fees: | 0.00 | % | 0.00 | % | |||||
| (f) | During the audit of registrant's financial statements for the most recent fiscal year, less than 50 percent of the hours expended on the principal accountant's engagement were attributed to work performed by persons other than the principal accountant's full-time, permanent employees. |
| (g) | The aggregate non-audit fees billed by the registrant's accountant for services rendered to the registrant, and rendered to the registrant's investment adviser (not including any sub-adviser whose role is primarily portfolio management and is subcontracted with or overseen by another investment adviser), and any entity controlling, controlled by, or under common control with the adviser that provides ongoing services to the registrant: |
2024 - $9,000
2023 - $9,000
(h) The registrant's audit committee has considered whether the provision of non-audit services to the registrant's investment adviser (not including any sub-adviser whose role is primarily portfolio management and is subcontracted with or overseen by another investment adviser), and any entity controlling, controlled by, or under common control with the investment adviser that provides ongoing services to the registrant, that were not pre-approved pursuant to paragraph (c)(7)(ii) of Rule 2-01 of Regulation S-X, is compatible with maintaining the principal accountant's independence.
(i) Not applicable
(j) Not applicable
Item 5. Audit Committee of Listed Companies. The registrant is an issuer as defined in Rule 10A-3 under the Securities Exchange Act of 1934, as amended (the “Exchange Act”) and has a separately designated standing audit committee established in accordance with Section 3(a)(58)A of the Exchange Act. The registrant’s audit committee members are Joseph Breslin, Charles Ranson and Thomas T. Sarkany
Item 6. Schedule of Investments. Schedule of investments in securities of unaffiliated issuers is included under Item 1.
Item 7. Disclosure of Proxy Voting Policies and Procedures for Closed-End Funds. Not applicable to open-end investment companies.
Item 8. Portfolio Managers of Closed-End Management Investment Companies. Not applicable to open-end investment companies.
Item 9. Purchases of Equity Securities by Closed-End Funds. Not applicable to open-end investment companies.
Item 10. Submission of Matters to a Vote of Security Holders. None
Item 11. Controls and Procedures.
(a) Based on an evaluation of the Registrant’s disclosure controls and procedures as of a date within 90 days of filing date of this Form N-CSR, the principal executive officer and principal financial officer of the Registrant have concluded that the disclosure controls and procedures of the Registrant are reasonably designed to ensure that the information required in filings on Form N-CSR is recorded, processed, summarized, and reported by the filing date, including that information required to be
disclosed is accumulated and communicated to the Registrant’s management, including the Registrant’s principal executive officer and principal financial officer, as appropriate to allow timely decisions regarding required disclosure.
(b) There were no significant changes in the Registrant’s internal control over financial reporting that occurred during the period covered by this report that have materially affected, or are reasonably likely to materially affect, the Registrant’s internal control over financial reporting.
Item 12. Disclosure of Securities Lending Activities for Closed-End Management Investment Companies. Not applicable to open-end investment companies.
Item 13. Exhibits.
(a)(1) Not applicable.
(a)(3) Not applicable for open-end investment companies.
SIGNATURES
Pursuant to the requirements of the Securities Exchange Act of 1934 and the Investment Company Act of 1940, the registrant has duly caused this report to be signed on its behalf by the undersigned, thereunto duly authorized.
(Registrant) Northern Lights Fund Trust IV
By (Signature and Title)
/s/ Wendy Wang
Wendy Wang, Principal Executive Officer/President
Date 5/3/24
Pursuant to the requirements of the Securities Exchange Act of 1934 and the Investment Company Act of 1940, this report has been signed below by the following persons on behalf of the registrant and in the capacities and on the dates indicated.
By (Signature and Title)
/s/ Wendy Wang
Wendy Wang, Principal Executive Officer/President
Date 5/3/24
By (Signature and Title)
/s/ Sam Singh
Sam Singh, Principal Financial Officer/Treasurer
Date 5/3/24