united states
securities and exchange commission
washington, d.c. 20549
form n-csr
certified shareholder report of registered management
investment companies
Investment Company Act file number 811-23066
Northern Lights Fund Trust IV
(Exact name of registrant as specified in charter)
225 Pictoria Drive, Suite 450, Cincinnati, OH 45246
(Address of principal executive offices) (Zip code)
The Corporation Trust Company
1209 Orange Street, Wilmington, DE 19801
(Name and address of agent for service)
Registrant's telephone number, including area code: 631-490-4300
Date of fiscal year end: 2/29/24
Date of reporting period: 2/29/24
Item 1. Reports to Stockholders.

R3 Global Dividend Growth ETF
GDVD
Annual Report
February 29, 2024
833-ASK-RCGC
833-275-7342
www.R3ETFs.com
This report and the financial statements contained herein are submitted for the general information of shareholders and are not authorized for distribution to prospective investors unless preceded or accompanied by an effective prospectus. Nothing herein contained is to be considered an offer of sale or solicitation of an offer to buy shares of the R3 Global Dividend Growth ETF. Such offering is made only by prospectus, which includes details as to offering price and other material information.
Distributed by Northern Lights Distributors, LLC
Member FINRA
| R3 Global Dividend Growth ETF |
| PORTFOLIO REVIEW (Unaudited) |
| February 29, 2024 |
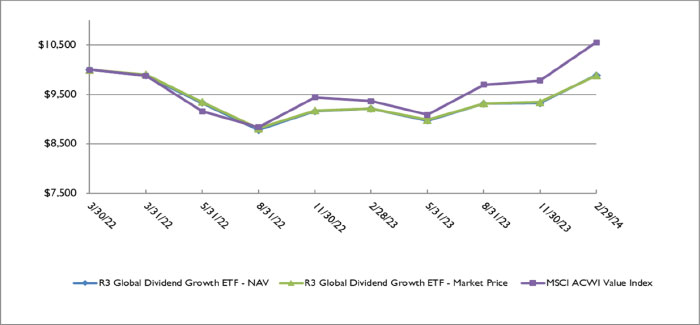
The Fund’s performance figures* for periods ended February 29, 2024, as compared to its benchmark:
| Since Inception** - | ||
| One Year | February 29, 2024 | |
| R3 Global Dividend Growth ETF - NAV | 7.35% | (0.57)% |
| R3 Global Dividend Growth ETF - Market Price | 7.26% | (0.60)% |
| MSCI ACWI Value Index *** | 12.73% | 2.87% |
| * | The Fund’s past performance does not guarantee future results. The investment return and principal value of an investment in the Fund will fluctuate so that an investor’s shares, when sold, may be worth more or less than their original cost. The returns shown do not reflect the deduction of taxes a shareholder would pay on Fund distributions or on the sale of Fund shares. Current performance of the Fund may be lower or higher than the performance quoted. Performance data current to the most recent month end may be obtained by visiting www.R3ETFs.com or by calling 1-833-275-7342. |
The Fund’s per share net asset value or NAV is the value of one share of the Fund as calculated in accordance with the standard formula for valuing shares. The NAV return is based on the NAV of the Fund and the Market Price Return is based on the Market Price per share of the Fund. Market Price returns are calculated using the closing price and account for distributions from the Fund. Market Price and NAV returns assume that dividends and capital gain distributions have been reinvested in the Fund at Market Price and NAV, respectively.
| ** | Commencement of operations was March 30, 2022. |
| *** | The MSCI ACWI Value Index captures large and mid cap securities exhibiting overall value style characteristics across 23 Developed Markets countries and 27 Emerging Markets (EM) countries. Investors cannot invest directly in an index, and unlike the Fund, returns do not reflect any fees, expenses or sales charges. |
Comparison of the Change in Value of a $10,000 Investment
1
R3 Global Dividend Growth ETF
PORTFOLIO REVIEW (Unaudited)(Continued)
February 29, 2024
The Fund’s Holdings by Country as of February 29, 2024 are as follows:
| Asset Class | % of Net Assets | |||
| Common Stocks | ||||
| United States | 36.6 | % | ||
| United Kingdom | 11.9 | % | ||
| France | 5.3 | % | ||
| Germany | 4.8 | % | ||
| Switzerland | 4.7 | % | ||
| Denmark | 4.4 | % | ||
| Taiwan | 4.3 | % | ||
| Hong Kong | 4.0 | % | ||
| Australia | 3.6 | % | ||
| Finland | 3.5 | % | ||
| Ireland | 3.0 | % | ||
| Japan | 2.5 | % | ||
| Canada | 2.3 | % | ||
| Netherlands | 2.1 | % | ||
| Singapore | 2.1 | % | ||
| Turkey | 1.9 | % | ||
| Brazil | 1.6 | % | ||
| Norway | 1.0 | % | ||
| Other Assets in Excess of Liabilities | 0.4 | % | ||
| 100.0 | % | |||
The Fund’s Holdings by Sector as of February 29, 2024 are as follows:
| Asset Class | % of Net Assets | |||
| Common Stocks | ||||
| Financial | 18.3 | % | ||
| Technology | 15.0 | % | ||
| Health Care | 12.6 | % | ||
| Industrials | 11.9 | % | ||
| Consumer Staples | 9.7 | % | ||
| Energy | 7.5 | % | ||
| Materials | 6.6 | % | ||
| Consumer Discretionary | 5.7 | % | ||
| Communications | 5.6 | % | ||
| Utilities | 5.2 | % | ||
| Real Estate | 1.5 | % | ||
| Other Assets in Excess of Liabilities | 0.4 | % | ||
| 100.0 | % | |||
Please refer to the Schedule of Investments in this Annual Report for a detailed listing of the Fund’s holdings.
2
Dear Shareholders,
The fiscal year ended February 29, 2024 was a very interesting year for global markets. Inflation and speculation regarding the actions of central banks around the world continued to significantly impact prices across almost all risk assets. The year started off with elevated volatility, which showed some reluctant dampening throughout the back half of the year. Unsurprisingly, the best performing equity sector for the year was Technology as traders crowded into just a few of the hot tech names and the term “Magnificent Seven” became commonplace in financial media. These seven include Nvidia, Meta (formerly known as Facebook), Amazon, Alphabet (formerly known as Google), Apple, Microsoft, and Tesla. These had little in common besides stratospheric stock prices and a loosely connected illusion that Artificial Intelligence was going to make these companies winners with endless profit potential.
The investment strategy adhered to by the Fund’s portfolio managers Trip Brannen and Cliff Remily is grounded in fundamental research, a strategy that has been proven for decades. The key tenet to the Fund’s investment strategy is that any business can be valued by applying rigorous research methods that simply answer the question “What is this business worth?”. Ultimately, a stock is merely an ownership claim in an underlying business. Pricing fluctuates in the near term, but we believe that if the underlying business is weak, over time the market will reflect that weakness.
We hope to explain to the Fund’s shareholders the difference in short-term performance relative to the broader market indices, absolute performance, and the importance of strategic consistency. Our unwavering focus on what matters in the long term can sometimes lead the Fund to underperform (which by no means implies loss) the broader benchmarks from time to time, which is what occurred over the prior 12 months.
For the year ended February 29, 2024, the Fund saw a total return of 7.35% with 4.28% of this attributable to price appreciation and 3.07% attributable to dividends. The MSCI World Value index saw a total return of 12.73% over this period. We believe this period of underperformance is largely due to short-term crowding into tech stocks and interest-rate-themed names. The Fund’s technology allocation was its best performing sector over the period and outperformed the MSCI World Value’s tech allocation by over 1,000bps. However, many of the tech names in the MSCI World Value do not pay a dividend and therefore, the Fund does not hold them. So, despite the outperformance in this sector, the Fund’s allocation to
18027554-NLD 04/17/2024
3
technology as a sector is smaller than that of the MSCI World Value. Therefore, the Fund did not receive the full benefit of our successful stock picking in this impactful sector.
We do not apologize for the short-term underperformance. Of course, we would rather generate triple digit positive returns year in and year out (likewise I wish I was 6 foot 8 inches and able to play point guard for the Lakers, but neither dream is realistic). We are proud that we have adhered to the Fund’s investment strategy and continued to identify good businesses; those that generate enough internal cash flow to allow them to use that internally-generated cash to maintain current operations, invest in future growth opportunities, and demonstrate an ability and willingness to pay reasonable dividends to shareholders. At any given short-term time interval, the market may not reward this strategy, but we are confident that over a reasonable, longer time horizon this method of finding value delivers desirable results.
The Fund did not invest in any derivatives during the period and paid out 100% of dividends collected after management fees. There was no specified level of distributions to shareholders. There was no inconsistency with the stated objectives or investment strategy detailed in the Fund’s prospectus during the period discussed.
Sincerely,
The R Cubed Global Capital Team
18027554-NLD 04/17/2024
4
| R3 GLOBAL DIVIDEND GROWTH ETF |
| SCHEDULE OF INVESTMENTS |
| February 29, 2024 |
| Shares | Fair Value | |||||||
| COMMON STOCKS — 99.6% | ||||||||
| APPAREL & TEXTILE PRODUCTS - 3.0% | ||||||||
| 447 | LVMH Moet Hennessy Louis Vuitton S.E. | $ | 407,190 | |||||
| 3,294 | NIKE, Inc., Class B | 342,345 | ||||||
| 749,535 | ||||||||
| ASSET MANAGEMENT - 3.0% | ||||||||
| 930 | BlackRock, Inc. | 754,546 | ||||||
| AUTOMOTIVE - 2.7% | ||||||||
| 18,737 | Cie Generale des Etablissements Michelin SCA | 692,410 | ||||||
| BANKING - 7.4% | ||||||||
| 21,586 | DBS Group Holdings Ltd. | 534,693 | ||||||
| 3,798 | JPMorgan Chase & Company | 706,656 | ||||||
| 60,921 | Mitsubishi UFJ Financial Group, Inc. | 626,623 | ||||||
| 1,867,972 | ||||||||
| BEVERAGES - 3.9% | ||||||||
| 163,231 | Ambev S.A. - ADR | 406,445 | ||||||
| 9,698 | Coca-Cola Company | 582,074 | ||||||
| 988,519 | ||||||||
| BIOTECH & PHARMA - 9.4% | ||||||||
| 2,849 | CSL Ltd. | 530,095 | ||||||
| 3,546 | Novartis AG | 358,867 | ||||||
| 6,712 | Novo Nordisk A/S | 797,810 | ||||||
| 14,246 | Pfizer, Inc. | 378,374 | ||||||
| 1,195 | Roche Holding A.G. | 313,460 | ||||||
| 2,378,606 | ||||||||
| CHEMICALS - 5.6% | ||||||||
| 1,521 | Avery Dennison Corporation | 329,342 | ||||||
| 6,400 | Croda International plc | 385,049 | ||||||
| 5,211 | Dow, Inc. | 291,191 | ||||||
| 26,467 | Victrex plc | 410,952 | ||||||
| 1,416,534 | ||||||||
| COMMERCIAL SUPPORT SERVICES - 2.2% | ||||||||
| 12,786 | Rollins, Inc. | 563,479 | ||||||
See accompanying notes to financial statements.
5
| R3 GLOBAL DIVIDEND GROWTH ETF |
| SCHEDULE OF INVESTMENTS (Continued) |
| February 29, 2024 |
| Shares | Fair Value | |||||||
| COMMON STOCKS — 99.6% (Continued) | ||||||||
| CONSTRUCTION MATERIALS - 1.0% | ||||||||
| 6,653 | James Hardie Industries plc - ADR(a) | $ | 263,259 | |||||
| DIVERSIFIED INDUSTRIALS - 1.2% | ||||||||
| 3,345 | 3M Company | 308,141 | ||||||
| ELECTRIC UTILITIES - 5.2% | ||||||||
| 62,195 | CLP Holdings Ltd. | 518,326 | ||||||
| 37,451 | National Grid PLC | 490,493 | ||||||
| 5,768 | NextEra Energy, Inc. | 318,336 | ||||||
| 1,327,155 | ||||||||
| ELECTRICAL EQUIPMENT - 4.9% | ||||||||
| 15,057 | Kone OYJ, Class B | 735,925 | ||||||
| 3,546 | TE Connectivity Ltd. | 509,064 | ||||||
| 1,244,989 | ||||||||
| INSTITUTIONAL FINANCIAL SERVICES - 6.2% | ||||||||
| 3,350 | Deutsche Boerse A.G. | 700,994 | ||||||
| 15,915 | Hong Kong Exchanges & Clearing Ltd. | 493,539 | ||||||
| 43,514 | IG Group Holdings plc | 383,962 | ||||||
| 1,578,495 | ||||||||
| INTERNET MEDIA & SERVICES - 2.2% | ||||||||
| 77,768 | Rightmove plc | 556,236 | ||||||
| MACHINERY - 2.0% | ||||||||
| 12,943 | Washtec A.G. | 509,214 | ||||||
| MEDICAL EQUIPMENT & DEVICES - 3.2% | ||||||||
| 2,364 | Coloplast A/S - Series B | 313,867 | ||||||
| 5,910 | Medtronic PLC | 492,658 | ||||||
| 806,525 | ||||||||
| OIL & GAS PRODUCERS - 7.5% | ||||||||
| 4,894 | Chevron Corporation | 743,937 | ||||||
| 9,235 | Rubis SCA | 242,753 | ||||||
| 17,520 | SHELL PLC | 543,401 | ||||||
See accompanying notes to financial statements.
6
| R3 GLOBAL DIVIDEND GROWTH ETF |
| SCHEDULE OF INVESTMENTS (Continued) |
| February 29, 2024 |
| Shares | Fair Value | |||||||
| COMMON STOCKS — 99.6% (Continued) | ||||||||
| OIL & GAS PRODUCERS - 7.5% (Continued) | ||||||||
| 18,914 | Woodside Energy Group Ltd. | $ | 373,264 | |||||
| 1,903,355 | ||||||||
| RETAIL - CONSUMER STAPLES - 3.8% | ||||||||
| 38,063 | BIM Birlesik Magazalar A/S | 473,142 | ||||||
| 3,108 | Target Corporation | 475,275 | ||||||
| 948,417 | ||||||||
| SELF-STORAGE REIT - 1.4% | ||||||||
| 37,777 | Safestore Holdings plc | 364,575 | ||||||
| SEMICONDUCTORS - 4.3% | ||||||||
| 8,449 | Taiwan Semiconductor Manufacturing Company Ltd. - ADR | 1,087,133 | ||||||
| SOFTWARE - 4.5% | ||||||||
| 2,364 | Microsoft Corporation | 977,845 | ||||||
| 6,035 | Neste OYJ | 165,486 | ||||||
| 1,143,331 | ||||||||
| SPECIALTY FINANCE - 1.7% | ||||||||
| 8,691 | Fidelity National Financial, Inc. | 439,591 | ||||||
| TECHNOLOGY HARDWARE - 2.3% | ||||||||
| 3,184 | Apple, Inc. | 575,508 | ||||||
| TECHNOLOGY SERVICES - 3.9% | ||||||||
| 9,765 | Experian plc | 417,266 | ||||||
| 2,049 | Visa, Inc., Class A | 579,129 | ||||||
| 996,395 | ||||||||
| TELECOMMUNICATIONS - 3.4% | ||||||||
| 16,084 | BCE, Inc. | 596,816 | ||||||
| 23,250 | Telenor ASA | 254,417 | ||||||
| 851,233 | ||||||||
| TOBACCO & CANNABIS - 2.1% | ||||||||
| 5,794 | Philip Morris International, Inc. | 521,228 | ||||||
See accompanying notes to financial statements.
7
| R3 GLOBAL DIVIDEND GROWTH ETF |
| SCHEDULE OF INVESTMENTS (Continued) |
| February 29, 2024 |
| Shares | Fair Value | |||||||
| COMMON STOCKS — 99.6% (Continued) | ||||||||
| TRANSPORTATION & LOGISTICS - 1.6% | ||||||||
| 1,573 | Union Pacific Corporation | $ | 399,054 | |||||
| TOTAL COMMON STOCKS (Cost $24,064,396) | 25,235,435 | |||||||
| TOTAL INVESTMENTS - 99.6% (Cost $24,064,396) | $ | 25,235,435 | ||||||
| OTHER ASSETS IN EXCESS OF LIABILITIES - 0.4% | 109,080 | |||||||
| NET ASSETS - 100.0% | $ | 25,344,515 | ||||||
| ADR | - American Depositary Receipt |
| A/S | - Anonim Sirketi |
| LTD | - Limited Company |
| OYJ | - Julkinen osakeyhtiö |
| PLC | - Public Limited Company |
| REIT | - Real Estate Investment Trust |
| S/A | - Société Anonyme |
| (a) | Non-income producing security. |
See accompanying notes to financial statements.
8
| R3 Global Dividend Growth ETF |
| STATEMENT OF ASSETS AND LIABILITIES |
| February 29, 2024 |
| ASSETS | ||||
| Investment securities: | ||||
| At cost | $ | 24,064,396 | ||
| At value | $ | 25,235,435 | ||
| Cash | 23,550 | |||
| Foreign cash (cost $58,283) | 56,096 | |||
| Dividends receivable | 75,931 | |||
| TOTAL ASSETS | 25,391,012 | |||
| LIABILITIES | ||||
| Investment advisory fees payable | 46,497 | |||
| TOTAL LIABILITIES | 46,497 | |||
| NET ASSETS | $ | 25,344,515 | ||
| Net Assets Consist Of: | ||||
| Paid in capital | $ | 24,834,850 | ||
| Distributable earnings | 509,665 | |||
| NET ASSETS | $ | 25,344,515 | ||
| Net Asset Value Per Share: | ||||
| Net Assets | $ | 25,344,515 | ||
| Shares of beneficial interest outstanding ($0 par value, unlimited shares authorized) | 1,070,000 | |||
| Net asset value (Net Assets ÷ Shares Outstanding) | $ | 23.69 |
See accompanying notes to financial statements.
9
| R3 Global Dividend Growth ETF |
| STATEMENT OF OPERATIONS |
| For the Year Ended February 29, 2024 |
| INVESTMENT INCOME | ||||
| Dividends (net of foreign withholding tax of $44,804) | $ | 570,518 | ||
| Interest | 672 | |||
| TOTAL INVESTMENT INCOME | 571,190 | |||
| EXPENSES | ||||
| Investment advisory fees | 157,316 | |||
| TOTAL EXPENSES | 157,316 | |||
| NET INVESTMENT INCOME | 413,874 | |||
| REALIZED AND UNREALIZED GAIN (LOSS) ON INVESTMENTS AND FOREIGN CURRENCY | ||||
| Net realized gain (loss) on: | ||||
| In-kind redemptions | 804,042 | |||
| Investments | (536,169 | ) | ||
| Foreign currency transactions | 7,192 | |||
| 275,065 | ||||
| Net change in unrealized appreciation (depreciation) on: | ||||
| Investments | 1,237,155 | |||
| Foreign currency translations | (5,290 | ) | ||
| 1,231,865 | ||||
| NET REALIZED AND UNREALIZED GAIN ON INVESTMENTS AND FOREIGN CURRENCY | 1,506,930 | |||
| NET INCREASE IN NET ASSETS RESULTING FROM OPERATIONS | $ | 1,920,804 |
See accompanying notes to financial statements.
10
| R3 Global Dividend Growth ETF |
| STATEMENTS OF CHANGES IN NET ASSETS |
| For the Year | For the Period* | |||||||
| Ended | Ended | |||||||
| February 29, 2024 | February 28, 2023 | |||||||
| FROM OPERATIONS | ||||||||
| Net investment income | $ | 413,874 | $ | 75,969 | ||||
| Net realized gain (loss) on in-kind redemptions, investments and foreign currency transactions | 275,065 | (183,875 | ) | |||||
| Net change in unrealized appreciation (depreciation) on investments and foreign currency translations | 1,231,865 | (62,887 | ) | |||||
| Net increase (decrease) in net assets resulting from operations | 1,920,804 | (170,793 | ) | |||||
| DISTRIBUTIONS TO SHAREHOLDERS | ||||||||
| Total distributions paid | (407,778 | ) | (68,550 | ) | ||||
| Net decrease in net assets resulting from distributions to shareholders | (407,778 | ) | (68,550 | ) | ||||
| FROM SHARES OF BENEFICIAL INTEREST | ||||||||
| Proceeds from shares sold | 22,642,614 | 5,861,291 | ||||||
| Cost of shares redeemed | (5,058,073 | ) | — | |||||
| Net increase in net assets resulting from shares of beneficial interest | 17,584,541 | 5,861,291 | ||||||
| TOTAL INCREASE IN NET ASSETS | 19,097,567 | 5,621,948 | ||||||
| NET ASSETS | ||||||||
| Beginning of Year/Period | 6,246,948 | 625,000 | ** | |||||
| End of Year/Period | $ | 25,344,515 | $ | 6,246,948 | ||||
| SHARE ACTIVITY | ||||||||
| Shares sold | 1,010,000 | 250,000 | ||||||
| Shares redeemed | (215,000 | ) | — | |||||
| Net increase in shares of beneficial interest outstanding | 795,000 | 250,000 | ||||||
| * | Commencement of operations was March 30, 2022. |
| ** | Beginning capital of $625,000 was contributed by fund management of R Cubed Global Capital, Inc., investment advisor to the Fund, in exchange for 25,000 shares of the Fund in connection with the seeding of the Fund. |
See accompanying notes to financial statements.
11
| R3 Global Dividend Growth ETF |
| FINANCIAL HIGHLIGHTS |
Per Share Data and Ratios for a Share of Beneficial Interest Outstanding Throughout Each Year/Period
| For the Year | For the Period* | |||||||
| Ended | Ended | |||||||
| February 29, 2024 | February 28, 2023 | |||||||
| Net asset value, beginning of year/period | $ | 22.72 | $ | 25.00 | ||||
| Activity from investment operations: | ||||||||
| Net investment income (1) | 0.52 | 0.35 | ||||||
| Net realized and unrealized gain (loss) on investments and foreign currency | 1.10 | (2.33 | ) | |||||
| Total from investment operations | 1.62 | (1.98 | ) | |||||
| Less distributions from: | ||||||||
| Net investment income | (0.65 | ) | (0.30 | ) | ||||
| Total distributions | (0.65 | ) | (0.30 | ) | ||||
| Net asset value, end of year/period | $ | 23.69 | $ | 22.72 | ||||
| Market Price, end of year/period | $ | 23.68 | $ | 22.73 | ||||
| Total return (2) | 7.35 | % | (7.87 | )% (5),(6) | ||||
| Market price total return | 7.26 | % | (7.83 | )% (5) | ||||
| Net assets, at end of year/period (000s) | $ | 25,345 | $ | 6,247 | ||||
| Ratio of expenses to average net assets | 0.88 | % | 0.88 | % (4) | ||||
| Ratio of net investment income to average net assets | 2.32 | % | 1.72 | % (4) | ||||
| Portfolio Turnover Rate (3) | 32 | % | 34 | % (5) | ||||
| * | Commencement of operations was March 30, 2022. |
| (1) | Per share amounts calculated using the average shares method, which more appropriately presents the per share data for the year/period. |
| (2) | Total return is calculated assuming a purchase of shares at net asset value on the first day and a sale at net asset value on the last day of the year. Distributions are assumed, for the purpose of this calculation, to be reinvested on the ex-dividend date at net asset value per share on their respective payment dates. |
| (3) | Portfolio turnover rate excludes portfolio securities received or delivered as a result of processing capital share transactions in Creation Units. |
| (4) | Annualized for periods less than one year. |
| (5) | Not annualized for periods less than one year. |
| (6) | Includes adjustments in accordance with accounting principles generally accepted in the United States of America and, consequently, the net asset value for financial reporting purposes and the returns based upon those net asset values may differ from the net asset values and returns for shareholder transactions. |
See accompanying notes to financial statements.
12
| R3 GLOBAL DIVIDEND GROWTH ETF |
| NOTES TO FINANCIAL STATEMENTS |
| February 29, 2024 |
| 1. | ORGANIZATION |
The R3 Global Dividend Growth ETF (the “Fund”) is a diversified series of shares of beneficial interest of Northern Lights Fund Trust IV (the “Trust”), a trust organized under the laws of the State of Delaware on June 2, 2015, and registered under the Investment Company Act of 1940, as amended (the “1940 Act”), as an open-end management investment company. The Fund’s investment objective is to seek current income and long-term growth of income and capital appreciation. The Fund commenced operations on March 30, 2022.
| 2. | SIGNIFICANT ACCOUNTING POLICIES |
The following is a summary of significant accounting policies followed by the Fund in preparation of its financial statements. These policies are in conformity with accounting principles generally accepted in the United States of America (“GAAP”). The preparation of financial statements requires management to make estimates and assumptions that affect the reported amounts of assets and liabilities and disclosure of contingent assets and liabilities at the date of the financial statements and the reported amounts of income and expenses for the period. Actual results could differ from those estimates. The Fund is an investment company and accordingly follows the investment company accounting and reporting guidance of the Financial Accounting Standards Board (“FASB”) Accounting Standards Codification Topic 946 “Financial Services – Investment Companies” including FASB Accounting Standards Update (“ASU”) 2013-08.
Securities valuation – Securities listed on an exchange are valued at the last reported sale price at the close of the regular trading session of the exchange on the business day the value is being determined, or in the case of securities listed on NASDAQ, at the NASDAQ Official Closing Price (“NOCP”). In the absence of a sale, such securities shall be valued at the mean between the current bid and ask prices on the day of valuation. Investments valued in currencies other than the U.S. dollar are converted to U.S. dollars using exchange rates obtained from pricing services. Short-term debt obligations having 60 days or less remaining until maturity, at time of purchase, may be valued at amortized cost.
The Fund may hold investments, such as private investments, interests in commodity pools, other non-traded securities or temporarily illiquid assets, for which market quotations are not readily available or are determined to be unreliable. These securities are valued using the “fair value” procedures approved by the Trust’s Board of Trustees (the “Board”). The Board may also enlist third party consultants such a valuation specialist at a public accounting firm, valuation consultant or financial officer of a security issuer on an as-needed basis to assist in determining a security-specific fair value.
Fair Valuation Process – Applicable investments are valued pursuant to valuation procedures established by the Board. For example, fair value determinations are required for the following securities: (i) securities for which market quotations are insufficient or not readily available on a particular business day (including securities for which there is a short and temporary lapse in the provision of a price by the regular pricing source); (ii) securities for which the prices or values available do not represent the fair value of the instrument; factors which may cause such a judgment include, but are not limited to, the following: only a bid price or an ask price is available; the spread between bid and ask prices is substantial; the frequency of sales; the thinness of the market; the size of reported trades; and actions of the securities markets, such as the suspension or limitation of trading; (iii) securities determined to be illiquid; and (iv) securities with respect to which an event that affects the value thereof has occurred (a “significant event”) since the closing prices were established on the principal exchange on which they are traded, but prior to a Fund’s calculation of its NAV. Specifically, interests in commodity pools or managed futures
13
| R3 GLOBAL DIVIDEND GROWTH ETF |
| NOTES TO FINANCIAL STATEMENTS (Continued) |
| February 29, 2024 |
pools are valued on a daily basis by reference to the closing market prices of each futures contract or other asset held by a pool, as adjusted for pool expenses. Restricted or illiquid investments, such as private investments or non-traded securities are valued based upon the current bid for the security from two or more independent dealers or other parties reasonably familiar with the facts and circumstances of the security (who should take into consideration all relevant factors as may be appropriate under the circumstances). If a current bid from such independent dealers or other independent parties is unavailable, the Board shall determine the fair value of such security using the following factors: (i) the type of security; (ii) the cost at date of purchase; (iii) the size and nature of the Fund’s holdings; (iv) the discount from market value of unrestricted securities of the same class at the time of purchase and subsequent thereto; (v) information as to any transactions or offers with respect to the security; (vi) the nature and duration of restrictions on disposition of the security and the existence of any registration rights; (vii) how the yield of the security compares to similar securities of companies of similar or equal creditworthiness; (viii) the level of recent trades of similar or comparable securities; (ix) the liquidity characteristics of the security; (x) current market conditions; and (xi) the market value of any securities into which the security is convertible or exchangeable.
The Fund utilizes various methods to measure the fair value of their investments on a recurring basis.
GAAP establishes a hierarchy that prioritizes inputs to valuation methods. The three levels of input are:
Level 1 – Unadjusted quoted prices in active markets for identical assets and liabilities that the Fund has the ability to access.
Level 2 – Observable inputs other than quoted prices included in Level 1 that are observable for the asset or liability, either directly or indirectly. These inputs may include quoted prices for the identical instrument in an inactive market, prices for similar instruments, interest rates, prepayment speeds, credit risk, yield curves, default rates and similar data.
Level 3 – Unobservable inputs for the asset or liability, to the extent relevant observable inputs are not available, representing the Fund’s own assumptions about the assumptions a market participant would use in valuing the asset or liability, and would be based on the best information available.
The availability of observable inputs can vary from security to security and is affected by a wide variety of factors, including, for example, the type of security, whether the security is new and not yet established in the marketplace, the liquidity of markets, and other characteristics particular to the security. To the extent that valuation is based on models or inputs that are less observable or unobservable in the market, the determination of fair value requires more judgment. Accordingly, the degree of judgment exercised in determining fair value is greatest for instruments categorized in Level 3.
The inputs used to measure fair value may fall into different levels of the fair value hierarchy. In such cases, for disclosure purposes, the level in the fair value hierarchy within which the fair value measurement falls in its entirety, is determined based on the lowest level input that is significant to the fair value measurement in its entirety.
14
| R3 GLOBAL DIVIDEND GROWTH ETF |
| NOTES TO FINANCIAL STATEMENTS (Continued) |
| February 29, 2024 |
The inputs or methodology used for valuing securities are not necessarily an indication of the risk associated with investing in those securities. The following table summarizes the inputs used as of February 29, 2024, for the Fund’s assets and liabilities measured at fair value:
| Assets | Level 1 | Level 2 | Level 3 | Total | ||||||||||||
| Investments | ||||||||||||||||
| Common Stocks * | $ | 25,235,435 | $ | — | $ | — | $ | 25,235,435 | ||||||||
| Total Investments | $ | 25,235,435 | $ | — | $ | — | $ | 25,235,435 | ||||||||
The Fund did not hold any Level 3 securities during the year.
| * | See Schedule of Investments for industry classification. |
Dividends and Distributions to Shareholders – Dividends from net investment income, if any, are declared and paid monthly (quarterly prior to May 23, 2023). Distributable net realized capital gains, if any, are declared and distributed annually. Dividends from net investment income and distributions from net realized gains are determined in accordance with federal income tax regulations, which may differ from GAAP. These “book/tax” differences are considered either temporary (e.g., deferred losses) or permanent in nature. To the extent these differences are permanent in nature, such amounts are reclassified within the composition of net assets based on their federal tax-basis treatment; temporary differences do not require reclassification. Monthly distributions in excess of ordinary taxable income are treated as returns of capital. Dividends and distributions to shareholders are recorded on the ex-dividend date.
Security Transactions and Related Income – Security transactions are accounted for on the trade date. Interest income is recognized on an accrual basis. Discounts are accreted and premiums are amortized on securities purchased over the lives of the respective securities or until call date. Dividend income is recorded on the ex-dividend date. Realized gains or losses from sales of securities are determined by comparing the identified cost of the security lot sold with the net sales proceeds. Withholding taxes on foreign dividends have been provided for in accordance with the Fund’s understanding of the applicable country’s tax rules and rates.
Federal Income Taxes – The Fund intends to continue to comply with the requirements of the Internal Revenue Code applicable to regulated investment companies and to distribute all of its taxable income to its shareholders. Therefore, no provision for federal income tax is required. The Fund recognizes the tax benefits of uncertain tax positions only where the position is “more likely than not” to be sustained assuming examination by tax authorities. Management has analyzed the Fund’s tax positions, and has concluded that no liability for unrecognized tax benefits should be recorded related to uncertain tax positions taken on returns filed for open tax year February 28, 2023 or expected to be taken in the Fund’s February 29, 2024 year-end tax returns. The Fund identifies its major tax jurisdictions as U.S. federal, Ohio and foreign jurisdictions where the Fund makes significant investments. The Fund is not aware of any tax positions for which it is reasonably possible that the total amounts of unrecognized tax benefits will change materially in the next twelve months.
15
| R3 GLOBAL DIVIDEND GROWTH ETF |
| NOTES TO FINANCIAL STATEMENTS (Continued) |
| February 29, 2024 |
Foreign Currency – The accounting records of the Fund are maintained in U.S. dollars. Investment securities and other assets and liabilities denominated in a foreign currency, and income receipts and expense payments are translated into U.S. dollars using the prevailing exchange rate at the London market close. Purchases and sales of securities are translated into U.S. dollars at the contractual currency rates established at the approximate time of the trade. Net realized gains and losses on foreign currency transactions represent net gains and losses from currency realized between the trade and settlement dates on securities transactions, gains and losses on the purchase and sale of foreign currencies and the difference between income accrued versus income received. The effects of changes in foreign currency exchange rates on investments in securities are included with the net realized and unrealized gain or loss on investment securities.
Expenses – Expenses of the Trust that are directly identifiable to a specific Fund are charged to that Fund. Expenses, which are not readily identifiable to a specific Fund, are allocated in such a manner as deemed equitable, taking into consideration the nature and type of expense and the relative sizes of the Funds in the Trust.
Indemnification – The Trust indemnifies its officers and Trustees for certain liabilities that may arise from the performance of their duties to the Trust. Additionally, in the normal course of business, the Fund enters into contracts that contain a variety of representations and warranties and which provide general indemnities. The Fund’s maximum exposure under these arrangements is unknown, as this would involve future claims that may be made against the Fund that have not yet occurred. However, based on experience, the risk of loss due to these warranties and indemnities appears to be remote.
| 3. | INVESTMENT TRANSACTIONS |
For the year ended February 29, 2024, cost of purchases and proceeds from sales of portfolio securities (excluding in-kind transactions and short-term investments), amounted to $5,890,235 and $5,584,612, respectively.
For the year ended February 29, 2024, cost of purchases and proceeds from sales of portfolio securities for in-kind transactions amounted to $21,664,052 and $4,749,843, respectively.
| 4. | INVESTMENT ADVISORY AGREEMENT AND TRANSACTIONS WITH RELATED PARTIES |
The business activities of the Fund are overseen by the Board, which is responsible for the overall management of the Fund. R Cubed Global Capital, Inc. (the “Advisor”) serves as the Fund’s investment advisor pursuant to an investment advisory agreement with the Trust on behalf of the Fund (the “Advisory Agreement”). The Trust has entered into a Global Custody Agreement with Brown Brothers Harriman & Co. to serve as custodian and to act as transfer and shareholder services agent. The Trust has also entered into an ETF Distribution Agreement (the “Distribution Agreement”) with Northern Lights Distributors, LLC (“NLD” or the “Distributor”) to serve as the principal underwriter and distributor for the Fund.
Pursuant to the Advisory Agreement, the Advisor, under the oversight of the Board, directs the daily
16
| R3 GLOBAL DIVIDEND GROWTH ETF |
| NOTES TO FINANCIAL STATEMENTS (Continued) |
| February 29, 2024 |
operations of the Fund and supervises the performance of administrative and professional services provided by others. As compensation for its services and the related expenses borne by the Advisor, the Fund pays the Advisor a unitary advisory fee, computed and accrued daily and paid monthly, at an annual rate of 0.88% of the Fund’s average daily net assets. During the year ended February 29, 2024, the Fund paid $157,316 in advisory fees.
The Advisor’s unitary advisory fee is designed to pay the Fund’s expenses and to compensate the Advisor for providing services for the Fund. Out of the unitary advisory fee, the Advisor pays substantially all expenses of the Fund, including the costs of transfer agency, custody, fund administration, legal, audit and other services and Independent Trustees’ fees, except for payment of advisory fees, any front-end or contingent deferred loads, brokerage fees and commissions, any Rule 12b-l fees, acquired fund fees and expenses, fees and expenses associated with investments in other collective investment vehicles or derivative instruments (including for example option and swap fees and expenses), borrowing costs (such as interest and dividend expense on securities sold short), taxes, and extraordinary expenses, such as litigation expenses (which may include indemnification of Fund officers and Trustees, and contractual indemnification of Fund service providers (other than the Advisor)). The Advisor, and not the Fund’s shareholders, would benefit from any reduction in fees paid for third-party services, including reductions based on increases in net assets.
The Trust, with respect to the Fund, has adopted a distribution and service plan (“Plan”) pursuant to Rule 12b-1 under the 1940 Act. Under the Plan, the Fund is authorized to pay distribution fees to the Distributor and other firms that provide distribution and shareholder services (“Service Providers”). If a Service Provider provides these services, the Fund may pay fees at an annual rate not to exceed 0.25% of average daily net assets, pursuant to Rule 12b-1 under the 1940 Act. No distribution or service fees are currently paid by the Fund and there are no current plans to impose these fees. In the event Rule 12b-1 fees were charged, over time they would increase the cost of an investment in the Fund.
Ultimus Fund Solutions, LLC (“UFS”) – UFS, an affiliate of the Distributor, provides administration and fund accounting services to the Fund. Pursuant to a separate servicing agreement with UFS, the Advisor, on behalf of the Fund, pays UFS customary fees for providing administration and fund accounting services to the Fund. Certain officers of the Trust are also officers of UFS, and are not paid any fees directly by the Trust for serving in such capacities.
Northern Lights Compliance Services, LLC (“NLCS” – NLCS, an affiliate of UFS and the Distributor, provides a Chief Compliance Officer to the Trust, as well as related compliance services, pursuant to a consulting agreement between NLCS and the Trust. Under the terms of such agreement, NLCS receives customary fees from the Fund.
Blu Giant, LLC (“Blu Giant”) – Blu Giant, an affiliate of UFS and the Distributor, provides EDGAR conversion and filing services as well as print management services for the Fund on an ad-hoc basis. For the provision of these services, Blu Giant receives customary fees from the Advisor, on behalf of the Fund.
17
| R3 GLOBAL DIVIDEND GROWTH ETF |
| NOTES TO FINANCIAL STATEMENTS (Continued) |
| February 29, 2024 |
| 5. | CAPITAL SHARE TRANSACTIONS |
Shares are not individually redeemable and may be redeemed by the Fund at NAV only in large blocks known as “Creation Units.” Shares are created and redeemed by the Fund only in Creation Unit size aggregations of 10,000 shares (25,000 shares prior to May 18, 2023). Only Authorized Participants are permitted to purchase or redeem Creation Units from the Fund. An Authorized Participant is either (i) a broker-dealer or other participant in the clearing process through the Continuous Net Settlement System of the National Securities Clearing Corporation or (ii) a Depository Trust Company participant and, in each case, must have executed a Participant Agreement with the distributor. Such transactions are generally permitted on an in-kind basis, with a balancing cash component to equate the transaction to the NAV per share of the Fund on the transaction date. Cash may be substituted equivalent to the value of certain securities generally when they are not available in sufficient quantity for delivery, not eligible for trading by the Authorized Participant or as a result of other market circumstances. In addition, the Fund may impose transaction fees on purchases and redemptions of Fund shares to cover the custodial and other costs incurred by the Fund in effecting trades. A fixed fee payable to the custodian may be imposed on each creation and redemption transaction regardless of the number of Creation Units involved in the transaction (“Fixed Fee”). Purchases and redemptions of Creation Units for cash or involving cash-in-lieu are required to pay an additional variable charge to compensate the Fund and its ongoing shareholders for brokerage and market impact expenses relating to Creation Unit transactions (“Variable Charge,” and together with the Fixed Fee, the “Transaction Fees”). Transaction Fees may be used to cover the custodial and other costs incurred by the Fund.
The Transaction Fees for the Fund are listed in the table below:
| Fixed Fee | Variable Charge |
| $300 | 2.00%* |
* The maximum Transaction Fee may be up to 2.00% of the amount invested.
| 6. | AGGREGATE UNREALIZED APPRECIATION AND DEPRECIATION – TAX BASIS |
The identified cost of investments in securities owned by the Funds for federal income tax purposes and its respective gross unrealized appreciation and depreciation at February 29, 2024, were as follows:
| Gross Unrealized | Gross Unrealized | Net Unrealized | ||||||||||||
| Tax Cost | Appreciation | (Depreciation) | Appreciation | |||||||||||
| $ | 24,193,909 | $ | 2,234,860 | $ | (1,193,334 | ) | $ | 1,041,526 | ||||||
18
| R3 GLOBAL DIVIDEND GROWTH ETF |
| NOTES TO FINANCIAL STATEMENTS (Continued) |
| February 29, 2024 |
| 7. | DISTRIBUTIONS TO SHAREHOLDERS AND TAX COMPONENTS OF CAPITAL |
The tax character of fund distributions paid for the year/period ended February 29, 2024, and 2023 were as follows:
| Fiscal Year Ended | Fiscal Period Ended | |||||||
| February 29, 2024 | February 28, 2023 | |||||||
| Ordinary Income | $ | 407,778 | $ | 72,295 | ||||
| $ | 407,778 | $ | 72,295 | |||||
As of February 29, 2024, the components of distributable earnings/(accumulated deficit) on a tax basis were as follows:
| Undistributed | Undistributed | Post October Loss | Capital Loss | Other | Unrealized | Total | ||||||||||||||||||||
| Ordinary | Long-Term | and | Carry | Book/Tax | Appreciation/ | Distributable Earnings/ | ||||||||||||||||||||
| Income | Gains | Late Year Loss | Forwards | Differences | (Depreciation) | (Accumulated Deficit) | ||||||||||||||||||||
| $ | 28,229 | $ | — | $ | (30,162 | ) | $ | (527,867 | ) | $ | — | $ | 1,039,465 | $ | 509,665 | |||||||||||
The difference between book basis and tax basis accumulated net realized losses and unrealized depreciation from investments is primarily attributable to the tax deferral of losses on wash sales and passive foreign investment companies. The unrealized appreciation (depreciation) in the table above includes unrealized foreign currency gains (losses) of $(2,061).
Capital losses incurred after October 31 within the fiscal year are deemed to arise on the first business day of the following fiscal year for tax purposes. The Fund incurred and elected to defer such capital losses of $30,162.
At February 29, 2024, the Fund had capital loss carry forwards for federal income tax purposes available to offset future capital gains as follows:
| CLCF | ||||||||||||||
| Short-Term | Long-Term | Total | Utilized | |||||||||||
| $ | 403,578 | $ | 124,289 | $ | 527,867 | $ | — | |||||||
Permanent book and tax differences, primarily attributable to tax adjustments for realized gain (loss) on in-kind redemptions, resulted in reclassifications for the Fund for the fiscal year ended February 29th, 2024, as follows:
| Paid In | Distributable | |||||
| Capital | Earnings | |||||
| $ | 764,107 | $ | (764,107 | ) | ||
19
| R3 GLOBAL DIVIDEND GROWTH ETF |
| NOTES TO FINANCIAL STATEMENTS (Continued) |
| February 29, 2024 |
The Fund intend to elect to pass through to shareholders the income tax credit for taxes paid to foreign countries. Foreign source income and foreign tax expense per outstanding share as of fiscal year/period ended February 29, 2024 and February 28, 2023, were as follows:
| For fiscal year ended | ||||||
| February 29, 2024 | ||||||
| Foreign Taxes Paid | Foreign Source Income | |||||
| $ | 0.0208 | $ | 0.2855 | |||
| For fiscal period ended | ||||||
| February 28, 2023 | ||||||
| Foreign Taxes Paid | Foreign Source Income | |||||
| $ | 0.1276 | $ | 0.0108 | |||
| 8. | REGULATORY UPDATES |
On January 24, 2023, the SEC adopted rule and form amendments to require mutual funds and ETFs to transmit concise and visually engaging streamlined annual and semiannual reports to shareholders that highlight key information. Other information, including financial statements, will not appear in a streamlined shareholder report but must be available online, delivered free of charge upon request, and filed on a semiannual basis on Form N-CSR. The rule and form amendments have a compliance date of July 24, 2024. At this time, management is evaluating the impact of these amendments on the shareholder reports for the Fund.
| 9. | SUBSEQUENT EVENTS |
Subsequent events after the date of the Statement of Assets and Liabilities have been evaluated through the date the financial statements were issued.
Management has determined that no events or transactions occurred requiring adjustment or disclosure in the financial statements, other than the following:
Distributions: The Board declared the following distributions after February 29, 2024:
| Dividend | Record | Payable | ||||
| Per Share | Date | Date | ||||
| $ | 0.1055 | 3/25/2024 | 3/28/2024 | |||
On April 4, 2024, the Advisor assigned the Advisory Agreement to Copper Place Global Capital LLC and the Board approved an interim advisory agreement with Copper Place Global Capital LLC. The Board further approved changing the name of the Fund to “Copper Place Global Dividend Growth ETF.”
20
REPORT OF INDEPENDENT REGISTERED PUBLIC ACCOUNTING FIRM
To the Board of Trustees of Northern Lights Fund Trust IV and the Shareholders of R3 Global Dividend Growth ETF:
Opinion on the Financial Statements and Financial Highlights
We have audited the accompanying statement of assets and liabilities, including the schedule of investments, of R3 Global Dividend Growth ETF, one of the funds constituting the Northern Lights Fund Trust IV (the “Fund”), as of February 29, 2024, the related statement of operations for the year then ended, and the statement of changes in net assets and financial highlights for the year then ended and for the period from March 30, 2022 (commencement of operations) through February 28, 2023, and the related notes. In our opinion, the financial statements and financial highlights present fairly, in all material respects, the financial position of the Fund as of February 29, 2024, the results of its operations for the year ended, and the changes in its net assets and the financial highlights for the year then ended and for the period from March 30, 2022 (commencement of operations) through February 28, 2023 in conformity with accounting principles generally accepted in the United States of America.
Basis for Opinion
These financial statements and financial highlights are the responsibility of the Fund’s management. Our responsibility is to express an opinion on the Fund’s financial statements and financial highlights based on our audit. We are a public accounting firm registered with the Public Company Accounting Oversight Board (United States) (PCAOB) and are required to be independent with respect to the Fund in accordance with the U.S. federal securities laws and the applicable rules and regulations of the Securities and Exchange Commission and the PCAOB.
We conducted our audit in accordance with the standards of the PCAOB. Those standards require that we plan and perform the audit to obtain reasonable assurance about whether the financial statements and financial highlights are free of material misstatement, whether due to error or fraud. The Fund is not required to have, nor were we engaged to perform, an audit of its internal control over financial reporting. As part of our audit we are required to obtain an understanding of internal control over financial reporting but not for the purpose of expressing an opinion on the effectiveness of the Fund’s internal control over financial reporting. Accordingly, we express no such opinion.
Our audit included performing procedures to assess the risks of material misstatement of the financial statements and financial highlights, whether due to error or fraud, and performing procedures that respond to those risks. Such procedures included examining, on a test basis, evidence regarding the amounts and disclosures in the financial statements and financial highlights. Our audit also included evaluating the accounting principles used and significant estimates made by management, as well as evaluating the overall presentation of the financial statements and financial highlights. Our procedures included confirmation of securities owned as of February 29, 2024, by correspondence with the custodian and brokers. We believe that our audit provides a reasonable basis for our opinion.
Costa Mesa, California
April 26, 2024
We have served as the auditor of one or more R Cubed Global Capital LLC investment companies since 2023.
21
| R3 Global Dividend Growth ETF |
| EXPENSE EXAMPLE (Unaudited) |
| February 29, 2024 |
As a shareholder of the Fund, you incur ongoing costs, including management fees and other Fund expenses. This example is intended to help you understand your ongoing costs (in dollars) of investing in the Fund and to compare these costs with the ongoing costs of investing in other exchange traded funds. This example does not take into account transaction costs, such as brokerage commissions that you may pay on your purchases and sales of shares of the Fund.
The example is based on an investment of $1,000 invested at the beginning of the period and held for the entire period from September 1, 2023 through February 29, 2024.
Actual Expenses
The “Actual” line in the table below provides information about actual account values and actual expenses. You may use the information below, together with the amount you invested, to estimate the expenses that you paid over the period. Simply divide your account value by $1,000 (for example, an $8,600 account value divided by $1,000 = 8.6), then multiply the result by the number in the table under the heading entitled “Expenses Paid During Period” to estimate the expenses you paid on your account during this period.
Hypothetical Example for Comparison Purposes
The “Hypothetical” line in the table below provides information about hypothetical account values and hypothetical expenses based on the Fund’s actual expense ratio and an assumed rate of return of 5% per year before expenses, which is not the Fund’s actual return. The hypothetical account values and expenses may not be used to estimate the actual ending account balances or expenses you paid for the period. You may use this information to compare this 5% hypothetical example with the 5% hypothetical examples that appear in the shareholder reports of other funds.
Please note that the expenses shown in the table are meant to highlight your ongoing costs only and do not reflect any transactional costs. Therefore, the table is useful in comparing ongoing costs only, and will not help you determine the relative total costs of owning different funds. In addition, if these transactional costs were included, your costs would have been higher.
| Beginning | Ending | Expenses Paid During | Expenses Ratio During | |||||||||||
| Account Value | Account Value | Period* | Period* | |||||||||||
| 9/1/2023 | 2/29/2024 | 9/1/2023-2/29/2024 | 9/1/2023-2/29/2024 | |||||||||||
| Actual | $ | 1,000.00 | $ | 1,062.00 | $ | 4.51 | 0.88% | |||||||
| Hypothetical | ||||||||||||||
| (5% return before expenses) | $ | 1,000.00 | $ | 1,020.49 | $ | 4.42 | 0.88% | |||||||
| * | Expenses are equal to the Fund’s annualized expense ratio, multiplied by the average account value over the period, multiplied by the number of days in the period (182), then divided by the number of days in the fiscal year (366). |
22
| R3 Global Dividend Growth ETF |
| Supplemental Information (Unaudited) |
| February 29, 2024 |
Renewal of the Investment Advisory Agreement with R Cubed Global Capital, Inc.
In connection with the meeting of the Board of Trustees (the “Board”) of Northern Lights Fund Trust IV (the “Trust”) held on October 24, 2023 (the “Meeting”), the Board, including a majority of the Trustees who are not “interested persons” as that term is defined in the Investment Company Act of 1940, as amended, discussed the renewal of an investment advisory agreement (the “R Cubed Advisory Agreement”) between R Cubed Global Capital, Inc. (“R Cubed”) and the Trust, with respect to R3 Global Dividend Growth ETF (“R3GD”). In considering the renewal of the R Cubed Advisory Agreement, the Board received materials specifically relating to the R Cubed Advisory Agreement.
The Board reviewed and discussed the materials that were provided in advance of the Meeting and deliberated on the renewal of the R Cubed Advisory Agreement. The Board relied upon the advice of independent legal counsel and its own business judgment in determining the material factors to be considered in evaluating the R Cubed Advisory Agreement on behalf of R3GD and the weight to be given to each factor considered. The conclusions reached by the Board were based on a comprehensive evaluation of all of the information provided and were not the result of any one factor. Moreover, each Trustee may have afforded different weight to the various factors in reaching his conclusions with respect to the renewal of the R Cubed Advisory Agreement.
Nature, Extent and Quality of Services. The Board acknowledged the key personnel servicing R3GD and noted that there were no changes since the last approval of the R Cubed Advisory Agreement. The Board discussed the services R Cubed provided R3GD, which included proprietary research and modeling based on the years of experience of the manager and making research decisions using fundamental analysis and the bottoms-up research driven proprietary model. The Board noted that R Cubed had no data security incident or compliance issues since the last approval of the R Cubed Advisory Agreement . The Board noted that R Cubed worked in conjunction with a third-party to ensure compliance, which included services for marketing approval, website compliance and post-trade monitoring, and that R Cubed received family compliance summaries. The Board noted that R Cubed selected broker-dealers on the basis of integrity, financial condition, size, best net price and the value of the expected contribution to the investment performance of R3GD. The Board noted that R Cubed had no material litigation or administrative action since the last approval of the R Cubed Advisory Agreement . The Board concluded that R Cubed had sufficient quality and depth of personnel and resources to continue performing its duties under the R Cubed Advisory Agreement in a manner and at a level that was consistent with the Board’s expectations.
Performance. The Board noted that R3GD underperformed its Morningstar category median, peer group median and benchmark, the MSCI ACWI NR USD index over the since inception period and 1-year period ended July 31, 2023 with net returns of -2.37% and 4.46%, respectively. The Board discussed that R Cubed believed that R3GD had been challenged by the market, including global inflation, slower than expected growth in China as it continued to work through supply chain interruptions, monetary tightening cycles across major developed markets and recessionary
23
| R3 Global Dividend Growth ETF |
| Supplemental Information (Unaudited)(Continued) |
| February 29, 2024 |
headwinds. The Board recognized that, despite the underperformance, R Cubed’s management team was satisfied with the results of R3GD as it achieved three goals: payment of an above average dividend yield, growth of the dividend payment over time and capital appreciation. The Board concluded that the performance of R3GD was satisfactory.
Fees and Expenses. The Board noted that R3GD had a unitary fee and that the unitary fee paid to R Cubed and net expense ratio for R3GD of 0.88% were higher than the Morningstar category average of 0.74% for an advisory (non-unitary) fee and 0.71% net expense ratio. The Board noted that the unitary fee was higher than the peer group average of 0.87% but the net expense ratio was lower than the peer group average of 1.36%. The Board noted the unitary fee and net expense ratio for R3GD were lower than the Morningstar category highs of 1.10% and 1.00%, respectively. The Board determined that R Cubed’s unitary fee with respect to advising R3GD was not unreasonable.
Profitability. The Board reviewed the profitability analysis provided by R Cubed showing that the firm was operating R3GD at a loss. The Board determined that excessive profitability was not an issue for R Cubed with respect to R3GD at this time. The Board noted that it would monitor R Cubed’s financial condition including periodically requesting information about its finances.
Economies of Scale. The Board considered whether economies of scale had been reached with respect to the management of R3GD. The Board noted R Cubed’s willingness to evaluate the appropriateness of breakpoints when at higher asset levels. The Board agreed to monitor and revisit the issue at the appropriate time.
Conclusion. Having requested such information from R Cubed as the Board believed to be reasonably necessary to evaluate the terms of the advisory agreement, and with the advice of independent counsel, the Board determined that renewal of the R Cubed Advisory Agreement was in the best interests of R3GD and its shareholders.
24
| R3 GLOBAL DIVIDEND GROWTH ETF |
| SUPPLEMENTAL INFORMATION (Unaudited) |
| February 29, 2024 |
The business address of each Trustee and Officer is 225 Pictoria Drive, Suite 450, Cincinnati, OH 45246. All correspondence to the Trustees and Officers should be directed to c/o Ultimus Fund Solutions, LLC, P.O. Box 541150, Omaha, Nebraska 68154.
Independent Trustees***
| Name, Address and Year of Birth | Position/Term of Office* | Principal Occupation During the Past Five Years | Number of Funds in Fund Complex** Overseen by Trustee | Other Directorships held by Trustee During the Past Five Years |
| Joseph Breslin Year of Birth: 1953 | Independent Trustee and Chairman of the Board since 2015 | President and Consultant, Adviser Counsel, Inc. (formerly J.E. Breslin & Co.) (management consulting firm to investment advisers), (since 2009); Senior Counsel, White Oak Global Advisors, LLC. (since 2016). | 1 | Northern Lights Fund Trust IV (for series not affiliated with the Fund since 2015); Director, Kinetics Mutual Funds, Inc. (since 2000); Trustee, Kinetics Portfolios Trust (since 2000); Trustee, Forethought Variable Insurance Trust (since 2013). |
| Thomas Sarkany Year of Birth: 1946 | Independent Trustee since 2015 | Founder and President, TTS Associates Inc. (since December 2022); and Founder and President, TTS Consultants, LLC (financial services) (since 2010). | 1 | Northern Lights Fund Trust IV (for series not affiliated with the Fund since 2015); Arrow Investments Trust (since 2014), Arrow ETF Trust (since 2012), Trustee, Northern Lights Fund Trust II (since 2011); Director, Aquila Distributors (since 1981) |
| Charles Ranson Year of Birth: 1947 | Independent Trustee since 2015 | Principal, Ranson & Associates (strategic analysis and planning, including risk assessment and capital formation for entrepreneurial ventures) (since 2003). | 1 | Northern Lights Fund Trust IV (for series not affiliated with the Fund since 2015); Advisors Preferred Trust (since November 2012) |
2/29/24 – NLFT IV_v1
25
| R3 GLOBAL DIVIDEND GROWTH ETF |
| SUPPLEMENTAL INFORMATION (Unaudited) (Continued) |
| February 29, 2024 |
Officers
| Name, Address and Year of Birth | Position/Term of Office* | Principal Occupation During the Past Five Years | Number of Funds in Fund Complex** Overseen by Trustee | Other Directorships held by Trustee During the Past Five Years |
| Wendy Wang*** 80 Arkay Drive Hauppauge, NY 11788 Year of Birth: 1970 | President since 2015 | Senior Vice President, Director of Tax and Compliance Administration, Ultimus Fund Solutions, LLC (since 2012). | N/A | N/A |
| Sam Singh 80 Arkay Drive Hauppauge, NY 11788 Year of Birth: 1976 | Treasurer since 2015 | Vice President, Ultimus Fund Solutions, LLC (since 2015). | N/A | N/A |
| Jennifer Farrell 80 Arkay Drive Hauppauge, NY 11788 Year of Birth: 1969 | Secretary since 2017 | Associate Director (since 2022) and Manager (2018-2022), Legal Administration), Ultimus Fund Solutions, LLC; Senior Paralegal, Gemini Fund Services, LLC (since 2015). | N/A | N/A |
| James Ash Year of Birth: 1976 | Chief Compliance Officer since 2019 | Senior Vice President, Head of Compliance (since 2023 ); Senior Compliance Officer, Northern Lights Compliance, LLC (2019 - 2023); Senior Vice President, National Sales Gemini Fund Services, LLC (2017-2019). | N/A | N/A |
| * | The term of office for each Trustee and officer listed above will continue indefinitely until the individual resigns or is removed. |
| ** | As of [date], the Trust was comprised of 36 active portfolios managed by unaffiliated investment advisers. The term “Fund Complex” applies only to the Fund and the one managed by the same investment adviser. The Fund does not hold itself out as related to any other series within the Trust for investment purposes, nor does it share the same investment adviser with any other series. |
| *** | Ms. Wang served as an interested Trustee from April 24, 2023 to January 25, 2024. She was an interested Trustee because she was also an officer of the Trust. |
The Fund’s SAI includes additional information about the Trustees and is available free of charge, upon request, by calling toll-free at 1-833-275-7342.
2/29/24 – NLFT IV_v1
26
PRIVACY NOTICE
Northern Lights Fund Trust IV
Rev. April 2021
| FACTS | WHAT DOES NORTHERN LIGHTS FUND TRUST IV DO WITH YOUR PERSONAL INFORMATION? |
| Why? | Financial companies choose how they share your personal information. Federal law gives consumers the right to limit some, but not all sharing. Federal law also requires us to tell you how we collect, share, and protect your personal information. Please read this notice carefully to understand what we do. |
| What? | The types of personal information we collect and share depends on the product or service that you have with us. This information can include:
● Social Security number and wire transfer instructions
● account transactions and transaction history
● investment experience and purchase history
When you are no longer our customer, we continue to share your information as described in this notice. |
| How? | All financial companies need to share customers’ personal information to run their everyday business. In the section below, we list the reasons financial companies can share their customers’ personal information; the reasons Northern Lights Fund Trust IV chooses to share; and whether you can limit this sharing. |
| Reasons we can share your personal information: | Does Northern Lights Fund Trust IV share information? | Can you limit this sharing? |
| For our everyday business purposes - such as to process your transactions, maintain your account(s), respond to court orders and legal investigations, or report to credit bureaus. | YES | NO |
| For our marketing purposes - to offer our products and services to you. | NO | We don’t share |
| For joint marketing with other financial companies. | NO | We don’t share |
| For our affiliates’ everyday business purposes - information about your transactions and records. | NO | We don’t share |
| For our affiliates’ everyday business purposes - information about your credit worthiness. | NO | We don’t share |
| For nonaffiliates to market to you | NO | We don’t share |
| QUESTIONS? | Call 1-631-490-4300 |
27
PRIVACY NOTICE
Northern Lights Fund Trust IV
| Page 2 |
| What we do: | |
How does Northern Lights Fund Trust IV protect my personal information? | To protect your personal information from unauthorized access and use, we use security measures that comply with federal law. These measures include computer safeguards and secured files and buildings.
Our service providers are held accountable for adhering to strict policies and procedures to prevent any misuse of your nonpublic personal information. |
How does Northern Lights Fund Trust IV collect my personal information? | We collect your personal information, for example, when you ● open an account or deposit money
● direct us to buy securities or direct us to sell your securities
● seek advice about your investments
We also collect your personal information from others, such as credit bureaus, affiliates, or other companies. |
Why can’t I limit all sharing? | Federal law gives you the right to limit only: ● sharing for affiliates’ everyday business purposes – information about your creditworthiness.
● affiliates from using your information to market to you.
● sharing for nonaffiliates to market to you.
State laws and individual companies may give you additional rights to limit sharing. |
| Definitions | |
| Affiliates | Companies related by common ownership or control. They can be financial and nonfinancial companies.
● Northern Lights Fund Trust IV has no affiliates. |
| Nonaffiliates | Companies not related by common ownership or control. They can be financial and nonfinancial companies.
● Northern Lights Fund Trust IV does not share with nonaffiliates so they can market to you. |
| Joint marketing | A formal agreement between nonaffiliated financial companies that together market financial products or services to you.
● Northern Lights Fund Trust IV does not jointly market. |
28
PROXY VOTING POLICY
Information regarding how the Fund voted proxies relating to portfolio securities for the most recent twelve-month period ended June 30 as well as a description of the policies and procedures that the Fund uses to determine how to vote proxies is available without charge, upon request, by calling 1-833-275-7342 or by referring to the Securities and Exchange Commission’s (“SEC”) website at http://www.sec.gov.
PORTFOLIO HOLDINGS
The Fund files a complete schedule of portfolio holdings with the SEC for the first and third quarters of each fiscal year as an exhibit to its reports on Form N-PORT, within sixty days after the end of the period. Form N-PORT reports are available at the SEC’s website at www.sec.gov.
PREMIUM/DISCOUNT INFORMATION
Information regarding how often the Shares of the Fund traded on the exchange at a price above (i.e., at a premium) or below (i.e., at a discount) the NAV of the Fund during the past calendar year can be found at www.R3ETFs.com.
| INVESTMENT ADVISOR |
| R Cubed Global Capital, Inc. |
| 11251 NW 4th Ct. |
| Plantation, FL 33325 |
| ADMINISTRATOR |
| Ultimus Fund Solutions, LLC |
| 225 Pictoria Drive, Suite 450 |
| Cincinnati, OH 45246 |
| GDVD-AR24 |
(b) Not applicable.
Item 2. Code of Ethics.
(a) As of the end of the period covered by this report, the registrant has adopted a code of ethics that applies to the registrant's principal executive officer, principal financial officer, principal accounting officer or controller, or persons performing similar functions, regardless of whether these individuals are employed by the registrant or a third party.
(b) For purposes of this item, “code of ethics” means written standards that are reasonably designed to deter wrongdoing and to promote:
| (1) | Honest and ethical conduct, including the ethical handling of actual or apparent conflicts of interest between personal and professional relationships; |
| (2) | Full, fair, accurate, timely, and understandable disclosure in reports and documents that a registrant files with, or submits to, the Commission and in other public communications made by the registrant; |
(3) Compliance with applicable governmental laws, rules, and regulations;
| (4) | The prompt internal reporting of violations of the code to an appropriate person or persons identified in the code; and |
(5) Accountability for adherence to the code.
(c) Amendments: During the period covered by the report, there have not been any amendments to the provisions of the code of ethics.
(d) Waivers: During the period covered by the report, the registrant has not granted any express or implicit waivers from the provisions of the code of ethics.
(e) The Code of Ethics is not posted on Registrant’ website.
(f) A copy of the Code of Ethics is attached as an exhibit.
Item 3. Audit Committee Financial Expert.
(a) The Registrant’s board of trustees has determined that Joseph Breslin is an audit committee financial expert, as defined in Item 3 of Form N-CSR. Mr. Breslin is independent for purposes of this Item 3.
Item 4. Principal Accountant Fees and Services.
| (a) | Audit Fees |
2024 – $14,700
2023 – $14,000
| (b) | Audit-Related Fees |
2024 – None
2023 – None
| (c) | Tax Fees |
2024 – $7,000
2023 – $6,500
Preparation of Federal & State income tax returns, assistance with calculation of required income, capital gain and excise distributions and preparation of Federal excise tax returns.
| (d) | All Other Fees |
2024 - None
2023 - None
| (e) | (1) Audit Committee’s Pre-Approval Policies |
The registrant’s Audit Committee is required to pre-approve all audit services and, when appropriate, any non-audit services (including audit-related, tax and all other services) to the registrant. The registrant’s Audit Committee also is required to pre-approve, when appropriate, any non-audit services (including audit-related, tax and all other services) to its adviser, or any entity controlling, controlled by or under common control with the adviser that provides ongoing services to the registrant, to the extent that the services may be determined to have an impact on the operations or financial reporting of the registrant. Services are reviewed on an engagement by engagement basis by the Audit Committee.
| (2) | Percentages of Services Approved by the Audit Committee |
| 2023 | 2024 | |||||||
| Audit-Related Fees: | 0.00 | % | 0.00 | % | ||||
| Tax Fees: | 0.00 | % | 0.00 | % | ||||
| All Other Fees: | 0.00 | % | 0.00 | % |
| (f) | During the audit of registrant's financial statements for the most recent fiscal year, less than 50 percent of the hours expended on the principal accountant's engagement were attributed to work performed by persons other than the principal accountant's full-time, permanent employees. |
| (g) | The aggregate non-audit fees billed by the registrant's accountant for services rendered to the registrant, and rendered to the registrant's investment adviser (not including any sub-adviser whose role is primarily portfolio management and is subcontracted with or overseen by another investment adviser), and any entity controlling, controlled by, or under common control with the adviser that provides ongoing services to the registrant: |
2024 - $7,000
2023 - $6,500
(h) The registrant's audit committee has considered whether the provision of non-audit services to the registrant's investment adviser (not including any sub-adviser whose role is primarily portfolio management and is subcontracted with or overseen by another investment adviser), and any entity controlling, controlled by, or under common control with the investment adviser that provides ongoing services to the registrant, that were not pre-approved pursuant to paragraph (c)(7)(ii) of Rule 2-01 of Regulation S-X, is compatible with maintaining the principal accountant's independence.
(i) Not applicable.
(j) Not applicable.
Item 5. Audit Committee of Listed Companies. Not applicable to open-end investment companies.
Item 6. Schedule of Investments. Schedule of investments in securities of unaffiliated issuers is included under Item 1.
Item 7. Disclosure of Proxy Voting Policies and Procedures for Closed-End Funds. Not applicable to open-end investment companies.
Item 8. Portfolio Managers of Closed-End Management Investment Companies. Not applicable to open-end investment companies.
Item 9. Purchases of Equity Securities by Closed-End Funds. Not applicable to open-end investment companies.
Item 10. Submission of Matters to a Vote of Security Holders. None
Item 11. Controls and Procedures.
(a) Based on an evaluation of the Registrant’s disclosure controls and procedures as of a date within 90 days of filing date of this Form N-CSR, the principal executive officer and principal financial officer of the Registrant have concluded that the disclosure controls and procedures of the Registrant are reasonably designed to ensure that the information required in filings on Form N-CSR is recorded, processed, summarized, and reported by the filing date, including that information required to be
disclosed is accumulated and communicated to the Registrant’s management, including the Registrant’s principal executive officer and principal financial officer, as appropriate to allow timely decisions regarding required disclosure.
(b) There were no significant changes in the Registrant’s internal control over financial reporting that occurred during the period covered by this report that have materially affected, or are reasonably likely to materially affect, the Registrant’s internal control over financial reporting.
Item 12. Disclosure of Securities Lending Activities for Closed-End Management Investment Companies. Not applicable to open-end investment companies.
Item 13. Exhibits.
(a)(1) Code of Ethics filed herewith.
(a)(3) Not applicable for open-end investment companies.
SIGNATURES
Pursuant to the requirements of the Securities Exchange Act of 1934 and the Investment Company Act of 1940, the registrant has duly caused this report to be signed on its behalf by the undersigned, thereunto duly authorized.
(Registrant) Northern Lights Fund Trust IV
By (Signature and Title)
/s/ Wendy Wang
Wendy Wang, Principal Executive Officer/President
Date 4/29/24
Pursuant to the requirements of the Securities Exchange Act of 1934 and the Investment Company Act of 1940, this report has been signed below by the following persons on behalf of the registrant and in the capacities and on the dates indicated.
By (Signature and Title)
/s/ Wendy Wang
Wendy Wang, Principal Executive Officer/President
Date 4/29/24
By (Signature and Title)
/s/ Sam Singh
Sam Singh, Principal Financial Officer/Treasurer
Date 4/29/24