united states
securities and exchange commission
washington, d.c. 20549
form n-csr
certified shareholder report of registered management
investment companies
| Investment Company Act file number | 811-23066 |
| Northern Lights Fund Trust IV |
| (Exact name of registrant as specified in charter) |
| 225 Pictoria Drive, Suite 450, Cincinnati, Ohio | 45246 |
| (Address of principal executive offices) | (Zip code) |
| The Corporation Trust Company |
| 1209 Orange Street Wilmington, DE 19801 |
| (Name and address of agent for service) |
| Registrant’s telephone number, including area code: | 631-490-4300 |
| Date of fiscal year end: | 5/31 | |
| | | |
| Date of reporting period: | 5/31/24 | |
| Item 1. | Reports to Stockholders. |
Brookstone Dividend Stock ETF
(BAMD) Cboe BZX Exchange, Inc
Annual Shareholder Report - May 31, 2024
This annual shareholder report contains important information about Brookstone Dividend Stock ETF for the period of September 27, 2023 to May 31, 2024. You can find additional information about the Fund at https://www.brookstoneam.com/brookstone-dividend-stock-etf. You can also request this information by contacting us at 1-888-562-8880.
What were the Fund’s costs for the reporting period?
(based on a hypothetical $10,000 investment)
| Fund Name | Costs of a $10,000 investment | Costs paid as a percentage of a $10,000 investment |
|---|
| Brookstone Dividend Stock ETF | $136 | 0.95% |
How did the Fund perform during the reporting period?
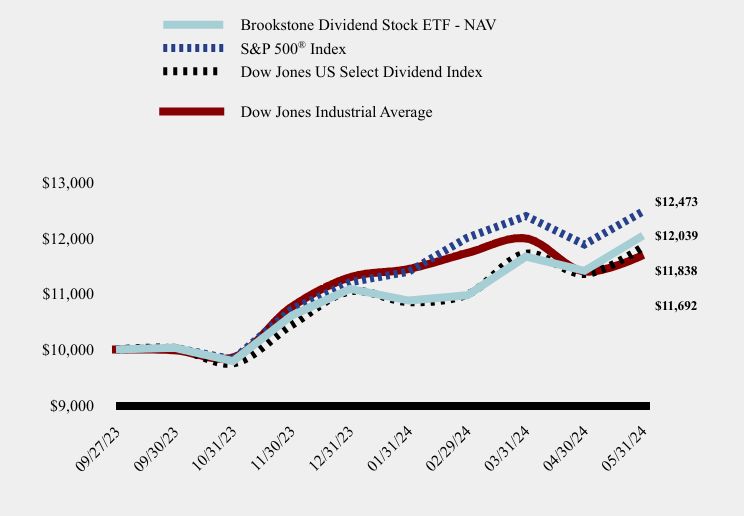
For the period from September 27, 2023, through May 31, 2024, US equities gained 24.62%, according to the S&P 500 index. A slowing pace of inflation and the resilient expansion of the US economy provided a favorable backdrop for higher-risk assets during much of this period. Most of the upturn was driven by a narrow set of firms in the information technology and communications services sectors, largely due to enthusiasm for generative artificial intelligence, with additional support provided by a solid US consumer backdrop. The Federal Reserve made no changes to its policy stance throughout the period, holding rates at a 22-year high. This decision was influenced by several inflation data points that came in marginally higher than expected in the first five months of 2024. While not indicating that it was necessary to continue the hiking cycle, the consensus was that it was too soon to begin cutting rates, as the data suggested that the process of bringing down inflation may have stalled. Although core US inflation remained elevated and investors dialed back their expectations for the pace and magnitude of expected rate cuts, investors remained largely optimistic that the Federal Reserve would eventually shift to easing after a historic hiking cycle. Since its inception, the Fund has gained 20.39%, beating its benchmark, the Dow Jones US Select Dividend Index, which gained 18.38% during the same period. The outperformance was largely driven by the security selection effect, with Eastman Chemical, Truist Financial Corp, Huntington Bancshares, 3M, and HP Inc. providing the largest contributions to the Fund's outperformance. The equal weight allocation of the Fund proved to be a slight detractor from benchmark performance, with underallocation to the information technology sector having the largest effect.
How has the Fund performed since inception?
Total Return Based on $10,000 Investment
| Brookstone Dividend Stock ETF - NAV | S&P 500® Index | Dow Jones US Select Dividend Index | Dow Jones Industrial Average |
|---|
| 09/27/23 | $10,000 | $10,000 | $10,000 | $10,000 |
| 09/30/23 | $10,032 | $10,033 | $10,023 | $9,987 |
| 10/31/23 | $9,792 | $9,822 | $9,753 | $9,861 |
| 11/30/23 | $10,606 | $10,719 | $10,437 | $10,764 |
| 12/31/23 | $11,086 | $11,206 | $11,042 | $11,295 |
| 01/31/24 | $10,877 | $11,395 | $10,849 | $11,443 |
| 02/29/24 | $10,972 | $12,003 | $10,988 | $11,729 |
| 03/31/24 | $11,665 | $12,389 | $11,716 | $11,988 |
| 04/30/24 | $11,410 | $11,883 | $11,353 | $11,398 |
| 05/31/24 | $12,039 | $12,473 | $11,838 | $11,692 |
Average Annual Total Returns
| Class Name | Since Inception (September 27, 2023) |
|---|
| Brookstone Dividend Stock ETF - NAV | 20.39% |
| Brookstone Dividend Stock ETF - Market Price | 20.27% |
| Dow Jones Industrial Average | 16.92% |
| Dow Jones US Select Dividend Index | 18.38% |
S&P 500® Index | 24.73% |
The Fund's past performance is not a good predictor of how the Fund will perform in the future. The graph and table do not reflect the deduction of taxes that a shareholder would pay on fund distributions or redemption of fund shares.
- Net Assets$75,634,869
- Number of Portfolio Holdings30
- Advisory Fee (net of waivers)$201,487
- Portfolio Turnover15%
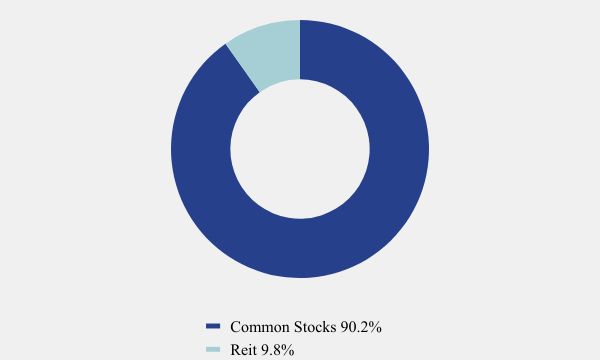
Asset Weighting (% of total investments)
| Value | Value |
|---|
| Common Stocks | 90.2% |
| Reit | 9.8% |
What did the Fund invest in?
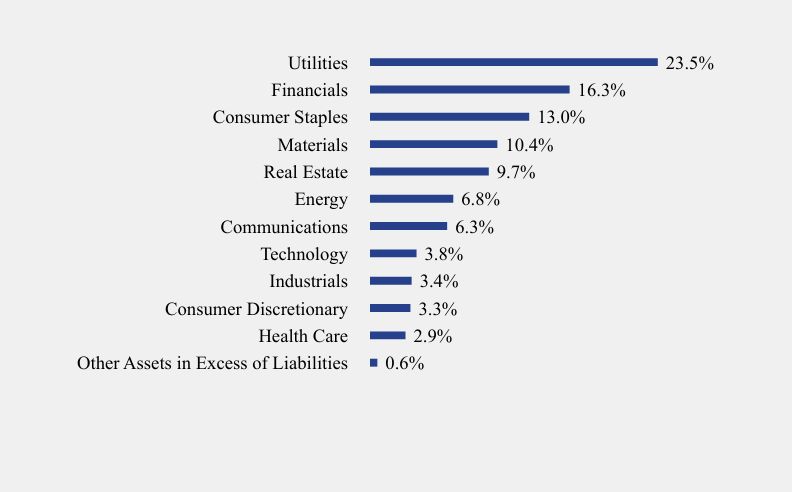
Sector Weighting (% of net assets)
| Value | Value |
|---|
| Other Assets in Excess of Liabilities | 0.6% |
| Health Care | 2.9% |
| Consumer Discretionary | 3.3% |
| Industrials | 3.4% |
| Technology | 3.8% |
| Communications | 6.3% |
| Energy | 6.8% |
| Real Estate | 9.7% |
| Materials | 10.4% |
| Consumer Staples | 13.0% |
| Financials | 16.3% |
| Utilities | 23.5% |
Top 10 Holdings (% of net assets)
| Holding Name | % of Net Assets |
| International Paper Company | 3.8% |
| HP, Inc. | 3.8% |
| Prudential Financial, Inc. | 3.7% |
| Dominion Energy, Inc. | 3.6% |
| American Electric Power Company, Inc. | 3.5% |
| ONEOK, Inc. | 3.5% |
| Altria Group, Inc. | 3.5% |
| NiSource, Inc. | 3.4% |
| Edison International | 3.4% |
| Kellanova | 3.4% |
No material changes occurred during the period ended May 31, 2024.
Brookstone Dividend Stock ETF
Annual Shareholder Report - May 31, 2024
Where can I find additional information about the Fund?
This annual shareholder report contains important information about Brookstone Dividend Stock ETF for the period of September 27, 2023 to May 31, 2024. You can find additional information about the Fund at https://www.brookstoneam.com/brookstone-dividend-stock-etf. You can also request this information by contacting us at 1-888-562-8880.
Prospectus
Financial information
Holdings
Proxy voting information
Brookstone Growth Stock ETF
(BAMG) Cboe BZX Exchange, Inc
Annual Shareholder Report - May 31, 2024
This annual shareholder report contains important information about Brookstone Growth Stock ETF for the period of September 26, 2023 to May 31, 2024. You can find additional information about the Fund at https://www.brookstoneam.com/brookstone-growth-stock-etf. You can also request this information by contacting us at 1-888-562-8880.
What were the Fund’s costs for the reporting period?
(based on a hypothetical $10,000 investment)
| Fund Name | Costs of a $10,000 investment | Costs paid as a percentage of a $10,000 investment |
|---|
| Brookstone Growth Stock ETF | $132 | 0.95% |
How did the Fund perform during the reporting period?
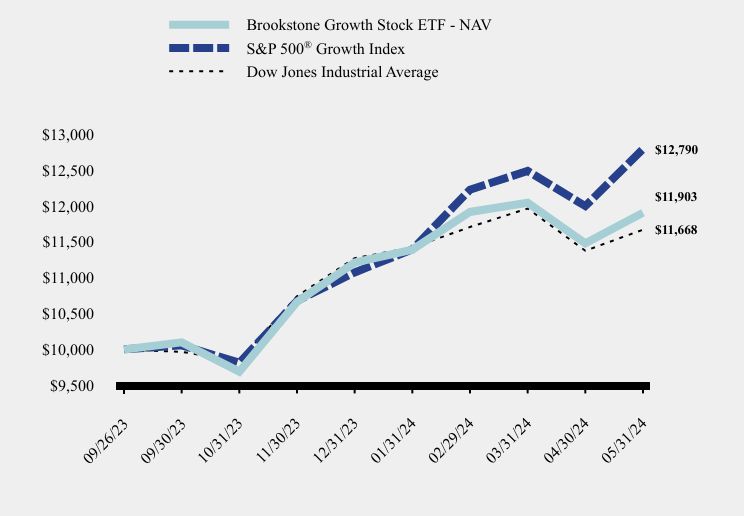
For the period from September 26, 2023, through May 31, 2024, US equities gained 24.62%, according to the S&P 500 Index. A slowing pace of inflation and the resilient expansion of the US economy provided a favorable backdrop for higher-risk assets during much of this period. Most of the upturn was driven by a narrow set of firms in the information technology and communications services sectors, largely due to enthusiasm for generative artificial intelligence, with additional support provided by a solid US consumer backdrop. The Federal Reserve made no changes to its policy stance throughout the period, holding rates at a 22-year high. This decision was influenced by several inflation data points that came in marginally higher than expected in the first five months of 2024. While not indicating that it was necessary to continue the hiking cycle, the consensus was that it was too soon to begin cutting rates, as the data suggested that the process of bringing down inflation may have stalled. Although core US inflation remained elevated and investors dialed back their expectations for the pace and magnitude of expected rate cuts, investors remained largely optimistic that the Federal Reserve would eventually shift to easing after a historic hiking cycle. Since its inception, the Fund has gained 19.03%, underperforming its benchmark, the S&P 500 Growth Index, which gained 27.90% during the same period. This underperformance was largely driven by security selection, with Bristol-Myers Squibb, Tesla, Adobe, Autodesk, and Snowflake contributing the most to the fund's lagging performance. Additionally, the stock rally has been concentrated in a few sectors and specific stocks, and the fund's equal weight allocation strategy detracted from its performance relative to the benchmark. Notably, the Fund's relative underallocation to Nvidia and Amazon had the most significant negative impact.
How has the Fund performed since inception?
Total Return Based on $10,000 Investment
| Brookstone Growth Stock ETF - NAV | S&P 500® Growth Index | Dow Jones Industrial Average |
|---|
| 09/26/23 | $10,000 | $10,003 | $10,000 |
| 09/30/23 | $10,100 | $10,058 | $9,967 |
| 10/31/23 | $9,692 | $9,815 | $9,841 |
| 11/30/23 | $10,661 | $10,676 | $10,742 |
| 12/31/23 | $11,210 | $11,073 | $11,272 |
| 01/31/24 | $11,390 | $11,393 | $11,419 |
| 02/29/24 | $11,915 | $12,225 | $11,705 |
| 03/31/24 | $12,043 | $12,485 | $11,963 |
| 04/30/24 | $11,478 | $11,997 | $11,375 |
| 05/31/24 | $11,903 | $12,790 | $11,668 |
Average Annual Total Returns
| Class Name | Since Inception (September 26, 2023) |
|---|
| Brookstone Growth Stock ETF - NAV | 19.03% |
| Brookstone Growth Stock ETF - Market Price | 19.19% |
| Dow Jones Industrial Average | 16.68% |
S&P 500® Growth Index | 27.90% |
The Fund's past performance is not a good predictor of how the Fund will perform in the future. The graph and table do not reflect the deduction of taxes that a shareholder would pay on fund distributions or redemption of fund shares.
- Net Assets$79,343,322
- Number of Portfolio Holdings30
- Advisory Fee (net of waivers)$234,490
- Portfolio Turnover26%
Asset Weighting (% of total investments)
| Value | Value |
|---|
| Common Stocks | 100.0% |
What did the Fund invest in?
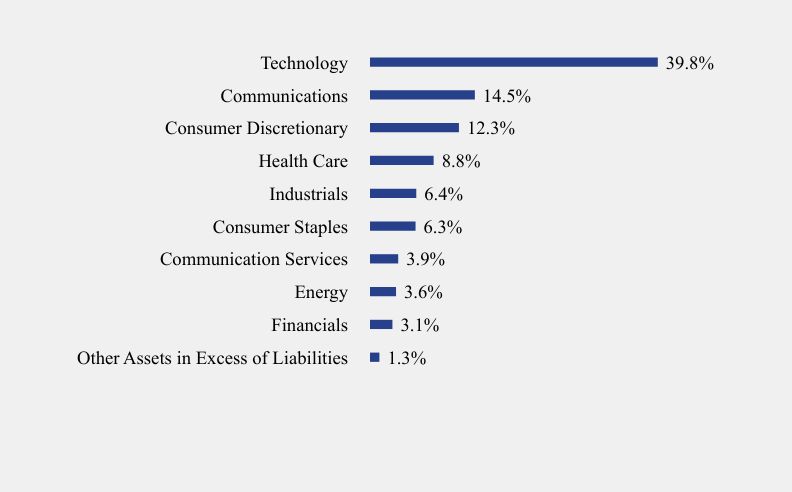
Sector Weighting (% of net assets)
| Value | Value |
|---|
| Other Assets in Excess of Liabilities | 1.3% |
| Financials | 3.1% |
| Energy | 3.6% |
| Communication Services | 3.9% |
| Consumer Staples | 6.3% |
| Industrials | 6.4% |
| Health Care | 8.8% |
| Consumer Discretionary | 12.3% |
| Communications | 14.5% |
| Technology | 39.8% |
Top 10 Holdings (% of net assets)
| Holding Name | % of Net Assets |
| NVIDIA Corporation | 5.9% |
| QUALCOMM, Inc. | 4.2% |
| Netflix, Inc. | 4.2% |
| Teradyne, Inc. | 4.1% |
| Meta Platforms, Inc., Class A | 3.9% |
| Amazon.com, Inc. | 3.8% |
| Alphabet, Inc., Class A | 3.6% |
| EOG Resources, Inc. | 3.6% |
| T-Mobile US, Inc. | 3.5% |
| Tyler Technologies, Inc. | 3.4% |
No material changes occurred during the period ended May 31, 2024.
Brookstone Growth Stock ETF
Annual Shareholder Report - May 31, 2024
Where can I find additional information about the Fund?
This annual shareholder report contains important information about Brookstone Growth Stock ETF for the period of September 26, 2023 to May 31, 2024. You can find additional information about the Fund at https://www.brookstoneam.com/brookstone-growth-stock-etf. You can also request this information by contacting us at 1-888-562-8880.
Prospectus
Financial information
Holdings
Proxy voting information
Brookstone Opportunities ETF
(BAMO) Cboe BZX Exchange, Inc
Annual Shareholder Report - May 31, 2024
This annual shareholder report contains important information about Brookstone Opportunities ETF for the period of September 27, 2023 to May 31, 2024. You can find additional information about the Fund at https://www.brookstoneam.com/brookstone-opportunities-etf. You can also request this information by contacting us at 1-888-562-8880.
What were the Fund’s costs for the reporting period?
(based on a hypothetical $10,000 investment)
| Fund Name | Costs of a $10,000 investment | Costs paid as a percentage of a $10,000 investment |
|---|
| Brookstone Opportunities ETF | $136 | 0.95% |
How did the Fund perform during the reporting period?
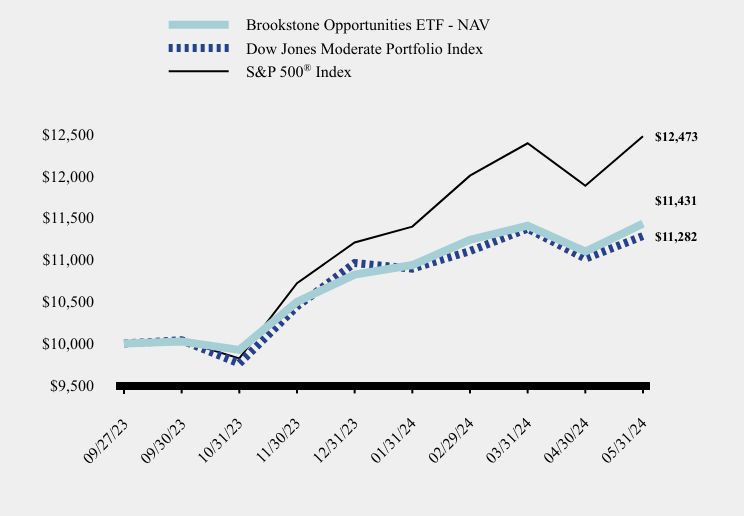
From September 27, 2023, through May 31, 2024, both US equities and taxable investment-grade bonds experienced notable fluctuations amid changing economic dynamics and Federal Reserve policies. US equities surged by 24.62%, driven by a narrow set of firms in the information technology and communications services sectors, buoyed by enthusiasm for generative artificial intelligence. Despite a slowing pace of inflation, the Federal Reserve maintained its policy stance, keeping rates at a 22-year high. Although core US inflation remained elevated, investors remained optimistic, anticipating a shift to easing after a historic hiking cycle. On the other hand, U.S. taxable investment-grade bonds, measured by the Bloomberg U.S. Aggregate Bond Index, returned 4.88%. A robust end to 2023 was followed by a challenging start to 2024, witnessing a -1.64% return. The late surge in 2023 was fueled by market optimism as the Federal Reserve signaled progress in its battle against inflation. However, stronger-than-anticipated economic data and higher-than-expected inflation readings in early 2024 led investors to reassess their expectations for monetary policy adjustments. hroughout the period, the bond market faced pressure from stronger economic indicators, prompting a negative return of -1.64% from January to May. Despite the Federal Reserve's cautious optimism regarding inflation, persistent inflation and robustness in various sectors suggested the economy could tolerate higher interest rates for an extended duration. This mixed performance reflected the ongoing challenge of balancing market expectations with evolving economic conditions amid Federal Reserve policies. Since its inception, the Fund has gained 14.31%, outperforming its benchmark, the Dow Jones Moderate Portfolio Index, which gained 12.82% during the same period. This outperformance can be attributed to the Funds's greater exposure to US equities and fixed income, while the Dow Jones Moderate Portfolio Index measures global stocks, global bonds, and cash, represented by multiple subindexes.
How has the Fund performed since inception?
Total Return Based on $10,000 Investment
| Brookstone Opportunities ETF - NAV | Dow Jones Moderate Portfolio Index | S&P 500® Index |
|---|
| 09/27/23 | $10,000 | $10,000 | $10,000 |
| 09/30/23 | $10,024 | $10,039 | $10,033 |
| 10/31/23 | $9,924 | $9,762 | $9,822 |
| 11/30/23 | $10,496 | $10,442 | $10,719 |
| 12/31/23 | $10,823 | $10,960 | $11,206 |
| 01/31/24 | $10,936 | $10,894 | $11,395 |
| 02/29/24 | $11,238 | $11,103 | $12,003 |
| 03/31/24 | $11,407 | $11,371 | $12,389 |
| 04/30/24 | $11,098 | $11,013 | $11,883 |
| 05/31/24 | $11,431 | $11,282 | $12,473 |
Average Annual Total Returns
| Class Name | Since Inception (September 27, 2023) |
|---|
| Brookstone Opportunities ETF - NAV | 14.31% |
| Brookstone Opportunities ETF - Market Price | 14.43% |
| Dow Jones Moderate Portfolio Index | 12.82% |
S&P 500® Index | 24.73% |
The Fund's past performance is not a good predictor of how the Fund will perform in the future. The graph and table do not reflect the deduction of taxes that a shareholder would pay on fund distributions or redemption of fund shares.
- Net Assets$34,826,556
- Number of Portfolio Holdings5
- Advisory Fee (net of waivers)$43,907
- Portfolio Turnover0%
Asset Weighting (% of total investments)
| Value | Value |
|---|
| Exchange-Traded Funds | 100.0% |
What did the Fund invest in?
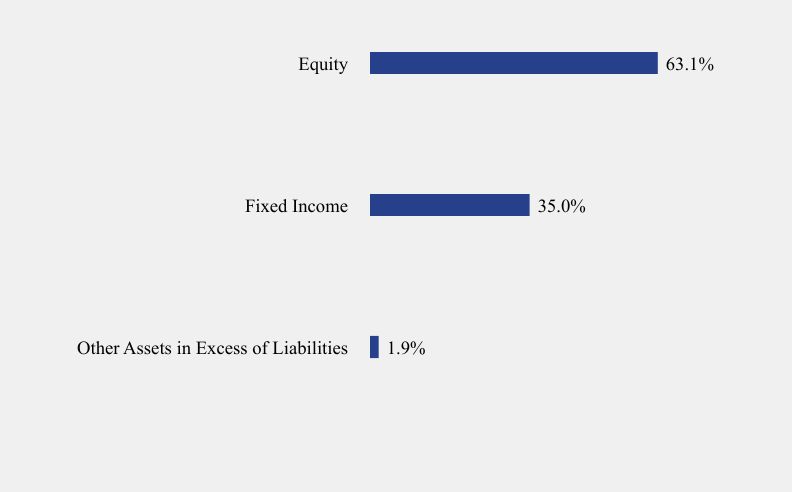
Sector Weighting (% of net assets)
| Value | Value |
|---|
| Other Assets in Excess of Liabilities | 1.9% |
| Fixed Income | 35.0% |
| Equity | 63.1% |
Top 10 Holdings (% of net assets)
| Holding Name | % of Net Assets |
| Invesco Nasdaq 100 ETF | 22.0% |
| Vanguard S&P 500 ETF | 21.2% |
| SPDR Dow Jones Industrial Average ETF Trust | 19.9% |
| SPDR Bloomberg 1-3 Month T-Bill ETF | 17.5% |
| iShares 0-3 Month Treasury Bond ETF | 17.5% |
No material changes occurred during the period ended May 31, 2024.
Brookstone Opportunities ETF
Annual Shareholder Report - May 31, 2024
Where can I find additional information about the Fund?
This annual shareholder report contains important information about Brookstone Opportunities ETF for the period of September 27, 2023 to May 31, 2024. You can find additional information about the Fund at https://www.brookstoneam.com/brookstone-opportunities-etf. You can also request this information by contacting us at 1-888-562-8880.
Prospectus
Financial information
Holdings
Proxy voting information
Brookstone Value Stock ETF
(BAMV) Cboe BZX Exchange, Inc
Annual Shareholder Report - May 31, 2024
This annual shareholder report contains important information about Brookstone Value Stock ETF for the period of September 26, 2023 to May 31, 2024.You can find additional information about the Fund at https://www.brookstoneam.com/brookstone-value-stock-etf. You can also request this information by contacting us at 1-888-562-8880.
What were the Fund’s costs for the reporting period?
(based on a hypothetical $10,000 investment)
| Fund Name | Costs of a $10,000 investment | Costs paid as a percentage of a $10,000 investment |
|---|
| Brookstone Value Stock ETF | $135 | 0.95% |
How did the Fund perform during the reporting period?
For the period from September 26, 2023, through May 31, 2024, US equities gained 24.62%, according to the S&P 500 Index. A slowing pace of inflation and the resilient expansion of the US economy provided a favorable backdrop for higher-risk assets during much of this period. Most of the upturn was driven by a narrow set of firms in the information technology and communications services sectors, largely due to enthusiasm for generative artificial intelligence, with additional support provided by a solid US consumer backdrop.
The Federal Reserve made no changes to its policy stance throughout the period, holding rates at a 22-year high. This decision was influenced by several inflation data points that came in marginally higher than expected in the first five months of 2024. While not indicating that it was necessary to continue the hiking cycle, the consensus was that it was too soon to begin cutting rates, as the data suggested that the process of bringing down inflation may have stalled.
Although core US inflation remained elevated and investors dialed back their expectations for the pace and magnitude of expected rate cuts, investors remained largely optimistic that the Fed would eventually shift to easing after a historic hiking cycle.
Since its inception, the Fund has gained 19.43%, underperforming its benchmark, the S&P 500 Value Index, which gained 21.17% during the same period. This underperformance can be attributed to both security selection and asset allocation effects. Specifically, CISCO Systems, Boeing, Comcast, Starbucks, and Cognizant Technology Solutions contributed the most to the Fund's lagging performance in terms of stock selection, while the Utilities and Healthcare sectors negatively impacted asset allocation. Given the stock rally's concentration in a few sectors and specific stocks, the Fund's equal weight allocation strategy served as an overall detractor relative to the benchmark.
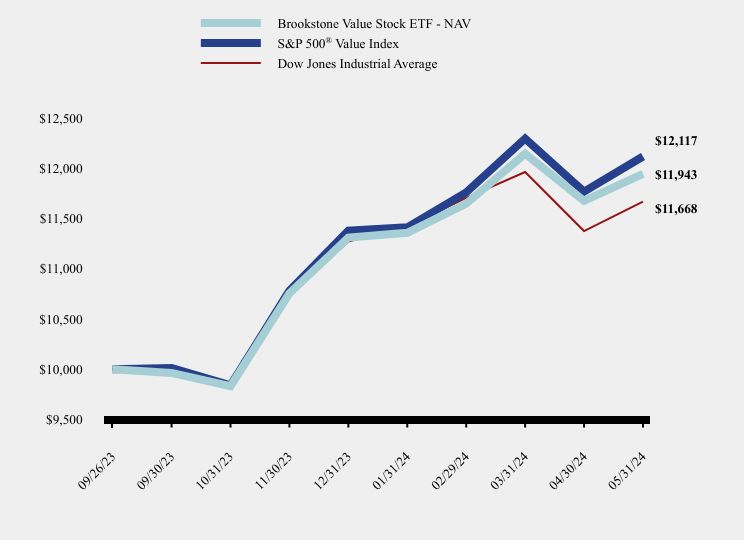
How has the Fund performed since inception?
Total Return Based on $10,000 Investment
| Brookstone Value Stock ETF - NAV | S&P 500® Value Index | Dow Jones Industrial Average |
|---|
| 09/26/23 | $10,000 | $10,000 | $10,000 |
| 09/30/23 | $9,964 | $10,013 | $9,967 |
| 10/31/23 | $9,832 | $9,841 | $9,841 |
| 11/30/23 | $10,755 | $10,782 | $10,742 |
| 12/31/23 | $11,310 | $11,379 | $11,272 |
| 01/31/24 | $11,358 | $11,412 | $11,419 |
| 02/29/24 | $11,647 | $11,760 | $11,705 |
| 03/31/24 | $12,145 | $12,295 | $11,963 |
| 04/30/24 | $11,675 | $11,767 | $11,375 |
| 05/31/24 | $11,943 | $12,117 | $11,668 |
Average Annual Total Returns
| Class Name | Since Inception (September 26, 2023) |
|---|
| Brookstone Value Stock ETF - NAV | 19.43% |
| Brookstone Value Stock ETF - Market Price | 19.43% |
| Dow Jones Industrial Average | 16.68% |
S&P 500® Value Index | 21.17% |
The Fund's past performance is not a good predictor of how the Fund will perform in the future. The graph and table do not reflect the deduction of taxes that a shareholder would pay on fund distributions or redemption of fund shares.
| Net Assets | $76,487,519 |
| Number of Portfolio Holdings | 30 |
| Advisory Fee (net of waivers) | $234,841 |
| Portfolio Turnover | 25% |
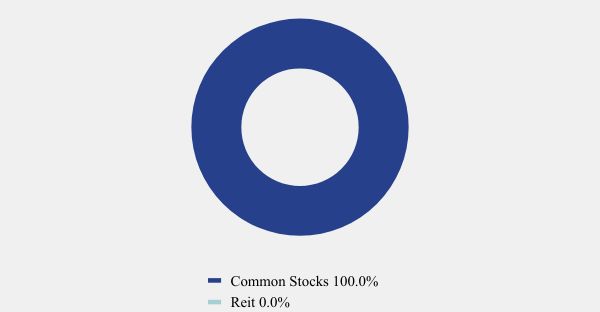
Asset Weighting (% of total investments)
| Value | Value |
|---|
| Common Stocks | 100.0% |
| Reit | 0.0% |
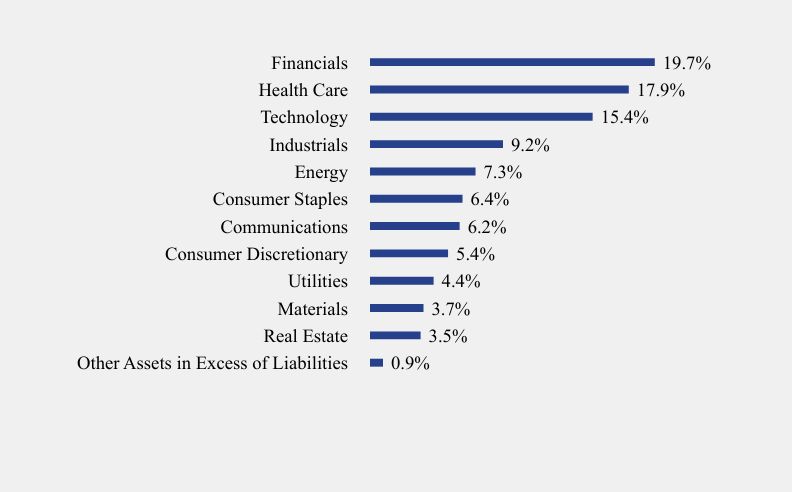
What did the Fund invest in?
Sector Weighting (% of net assets)
| Value | Value |
|---|
| Other Assets in Excess of Liabilities | 0.9% |
| Real Estate | 3.5% |
| Materials | 3.7% |
| Utilities | 4.4% |
| Consumer Discretionary | 5.4% |
| Communications | 6.2% |
| Consumer Staples | 6.4% |
| Energy | 7.3% |
| Industrials | 9.2% |
| Technology | 15.4% |
| Health Care | 17.9% |
| Financials | 19.7% |
Top 10 Holdings (% of net assets)
| Holding Name | % of Net Assets |
| NextEra Energy, Inc. | 4.4% |
| Fidelity National Information Services, Inc. | 4.1% |
| Wells Fargo & Company | 4.1% |
| Goldman Sachs Group, Inc. (The) | 4.1% |
| JPMorgan Chase & Company | 4.1% |
| Bank of America Corporation | 4.0% |
| Exxon Mobil Corporation | 3.7% |
| Newmont Corporation | 3.7% |
| Otis Worldwide Corporation | 3.6% |
| Chevron Corporation | 3.6% |
No material changes occurred during the period ended May 31, 2024.
Brookstone Value Stock ETF
Annual Shareholder Report - May 31, 2024
Where can I find additional information about the Fund?
This annual shareholder report contains important information about Brookstone Value Stock ETF for the period of September 26, 2023 to May 31, 2024. You can find additional information about the Fund at https://www.brookstoneam.com/brookstone-value-stock-etf. You can also request this information by contacting us at 1-888-562-8880.
Prospectus
Financial information
Holdings
Proxy voting information
Brookstone Ultra-Short Bond ETF
(BAMU) Cboe BZX Exchange, Inc
Annual Shareholder Report - May 31, 2024
This annual shareholder report contains important information about Brookstone Ultra-Short Bond ETF for the period of September 26, 2023 to May 31, 2024. You can find additional information about the Fund at https://www.brookstoneam.com/brookstone-ultra-short-bond-etf. You can also request this information by contacting us at 1-888-562-8880.
What were the Fund’s costs for the reporting period?
(based on a hypothetical $10,000 investment)
| Fund Name | Costs of a $10,000 investment | Costs paid as a percentage of a $10,000 investment |
|---|
| Brookstone Ultra-Short Bond ETF | $136 | 0.95% |
How did the Fund perform during the reporting period?
U.S. taxable investment-grade bonds, as measured by the Bloomberg U.S. Aggregate Bond Index, returned 4.88% from September 26, 2023, through May 31, 2024. This performance comprised a robust end to 2023, with a 6.63% return from September 26 to December 31, 2023, followed by a challenging start to 2024, witnessing a -1.64% return from January 1 to May 31, 2024. The late surge in 2023 was fueled by market optimism as the U.S. Federal Reserve cautiously signaled progress in its battle against inflation. In the latter months of 2023, capital markets experienced a significant upswing following hints from the Federal Reserve that it might be nearing the conclusion of its interest-rate-hiking cycle, initiated in March 2022. The Fed's positive outlook on inflation progress, coupled with resilient employment, manufacturing, and consumer spending data, drove the Bloomberg U.S. Aggregate Bond Index to impressive performance. Entering 2024, the bond market faced the challenge of maintaining the high standards set by the previous year's performance. Despite the Fed's optimism, stronger-than-anticipated economic data and higher-than-expected inflation readings in the first five months of the year prompted investors to reconsider their expectations for monetary policy adjustments. The robustness in these sectors and persistent inflation suggested that the economy could tolerate higher interest rates for an extended duration.The first five months of 2024 witnessed mixed performance in the bond market. From January to May, the Bloomberg U.S. Aggregate Bond Index experienced a negative return of -1.64%. Despite the Fed's ongoing cautious optimism regarding inflation, the market was pressured by stronger economic indicators and the reassessment of anticipated rate adjustments. Since its inception, the Fund has gained 3.01%, falling short of the 3.73% gain of its benchmark, the Bloomberg U.S. Treasury Bills: 1-3 Months Index, over the same period. This underperformance can be attributed almost exclusively to a slightly longer effective duration at the very front end of the interest rate curve of 4.5 months compared to 1.5 months for the Bloomberg U.S. Treasury Bills: 1-3 Months Index.
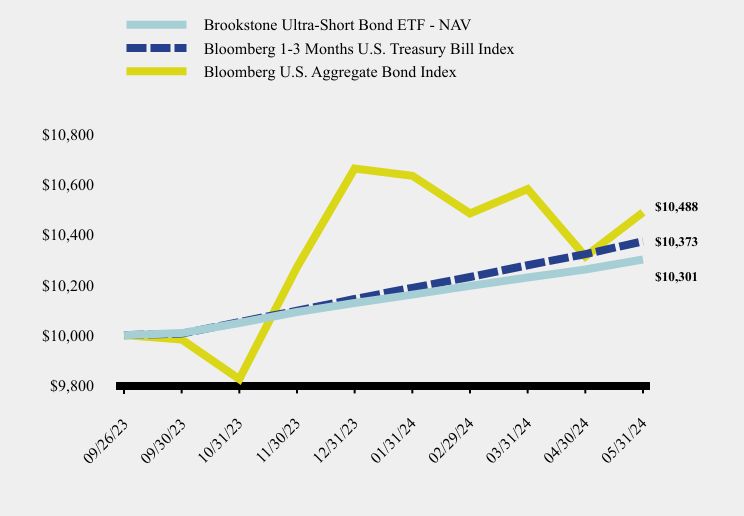
How has the Fund performed since inception?
Total Return Based on $10,000 Investment
| Brookstone Ultra-Short Bond ETF - NAV | Bloomberg 1-3 Months U.S. Treasury Bill Index | Bloomberg U.S. Aggregate Bond Index |
|---|
| 09/26/23 | $10,000 | $10,000 | $10,000 |
| 09/30/23 | $10,008 | $10,006 | $9,983 |
| 10/31/23 | $10,048 | $10,052 | $9,825 |
| 11/30/23 | $10,092 | $10,097 | $10,270 |
| 12/31/23 | $10,128 | $10,144 | $10,663 |
| 01/31/24 | $10,161 | $10,188 | $10,634 |
| 02/29/24 | $10,196 | $10,231 | $10,484 |
| 03/31/24 | $10,229 | $10,278 | $10,581 |
| 04/30/24 | $10,261 | $10,322 | $10,313 |
| 05/31/24 | $10,301 | $10,373 | $10,488 |
Average Annual Total Returns
| Class Name | Since Inception (September 26, 2023) |
|---|
| Brookstone Ultra-Short Bond ETF - NAV | 3.01% |
| Brookstone Ultra-Short Bond ETF - Market Price | 3.05% |
| Bloomberg 1-3 Months U.S. Treasury Bill Index | 3.73% |
| Bloomberg U.S. Aggregate Bond Index | 4.88% |
The Fund's past performance is not a good predictor of how the Fund will perform in the future. The graph and table do not reflect the deduction of taxes that a shareholder would pay on fund distributions or redemption of fund shares.
- Net Assets$62,258,220
- Number of Portfolio Holdings5
- Advisory Fee (net of waivers)$184,978
- Portfolio Turnover0%
Asset Weighting (% of total investments)
| Value | Value |
|---|
| Exchange-Traded Funds | 100.0% |
What did the Fund invest in?
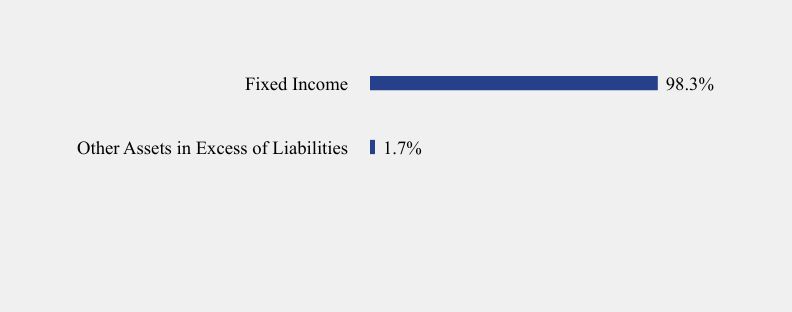
Sector Weighting (% of net assets)
| Value | Value |
|---|
| Other Assets in Excess of Liabilities | 1.7% |
| Fixed Income | 98.3% |
Top 10 Holdings (% of net assets)
| Holding Name | % of Net Assets |
| iShares iBonds Dec 2024 Term Treasury ETF | 19.7% |
| Invesco Short Term Treasury ETF | 19.7% |
| SPDR Bloomberg 1-3 Month T-Bill ETF | 19.7% |
| iShares 0-3 Month Treasury Bond ETF | 19.6% |
| SPDR Bloomberg 3-12 Month T-Bill ETF | 19.6% |
No material changes occurred during the period ended May 31, 2024.
Brookstone Ultra-Short Bond ETF
Annual Shareholder Report - May 31, 2024
Where can I find additional information about the Fund?
This annual shareholder report contains important information about Brookstone Ultra-Short Bond ETF for the period of September 26, 2023 to May 31, 2024. You can find additional information about the Fund at https://www.brookstoneam.com/brookstone-ultra-short-bond-etf. You can also request this information by contacting us at 1-888-562-8880.
Prospectus
Financial information
Holdings
Proxy voting information
(BAMA) Cboe BZX Exchange, Inc
Annual Shareholder Report - May 31, 2024
This annual shareholder report contains important information about Brookstone Active ETF for the period of September 27, 2023 to May 31, 2024. You can find additional information about the Fund at https://www.brookstoneam.com/brookstone-active-etf. You can also request this information by contacting us at 1-888-562-8880.
What were the Fund’s costs for the reporting period?
(based on a hypothetical $10,000 investment)
| Fund Name | Costs of a $10,000 investment | Costs paid as a percentage of a $10,000 investment |
|---|
| Brookstone Active ETF | $95 | 0.95% |
How did the Fund perform during the reporting period?
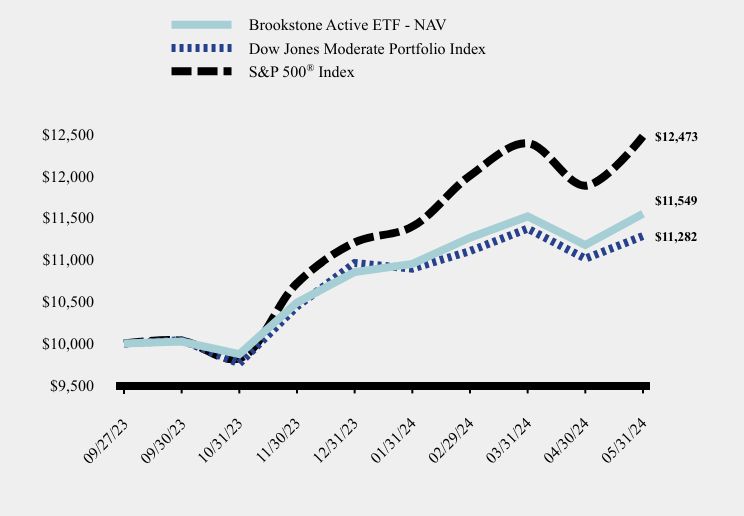
From September 27, 2023, through May 31, 2024, both US equities and taxable investment-grade bonds experienced notable fluctuations amid changing economic dynamics and Federal Reserve policies. US equities surged by 24.62%, driven by a narrow set of firms in the information technology and communications services sectors, buoyed by enthusiasm for generative artificial intelligence. Despite a slowing pace of inflation, the Federal Reserve maintained its policy stance, keeping rates at a 22-year high. Although core US inflation remained elevated, investors remained optimistic, anticipating a shift to easing after a historic hiking cycle. On the other hand, U.S. taxable investment-grade bonds, measured by the Bloomberg U.S. Aggregate Bond Index, returned 4.88%. A robust end to 2023 was followed by a challenging start to 2024, witnessing a -1.64% return. The late surge in 2023 was fueled by market optimism as the Federal Reserve signaled progress in its battle against inflation. However, stronger-than-anticipated economic data and higher-than-expected inflation readings in early 2024 led investors to reassess their expectations for monetary policy adjustments. Throughout the period, the bond market faced pressure from stronger economic indicators, prompting a negative return of -1.64% from January to May. Despite the Federal Reserve''s cautious optimism regarding inflation, persistent inflation and robustness in various sectors suggested the economy could tolerate higher interest rates for an extended duration. This mixed performance reflected the ongoing challenge of balancing market expectations with evolving economic conditions amid Federal Reserve policies. Since its inception, the Fund has gained 15.49%, outperforming its benchmark, the Dow Jones Moderate Portfolio Index, which gained 12.82% during the same period. This outperformance can be attributed to the Fund's greater exposure to US equities and fixed income, while the Dow Jones Moderate Portfolio Index measures global stocks, global bonds, and cash, represented by multiple subindexes.
How has the Fund performed since inception?
Total Return Based on $10,000 Investment
| Brookstone Active ETF - NAV | Dow Jones Moderate Portfolio Index | S&P 500® Index |
|---|
| 09/27/23 | $10,000 | $10,000 | $10,000 |
| 09/30/23 | $10,024 | $10,039 | $10,033 |
| 10/31/23 | $9,872 | $9,762 | $9,822 |
| 11/30/23 | $10,488 | $10,442 | $10,719 |
| 12/31/23 | $10,853 | $10,960 | $11,206 |
| 01/31/24 | $10,949 | $10,894 | $11,395 |
| 02/29/24 | $11,263 | $11,103 | $12,003 |
| 03/31/24 | $11,516 | $11,371 | $12,389 |
| 04/30/24 | $11,175 | $11,013 | $11,883 |
| 05/31/24 | $11,549 | $11,282 | $12,473 |
Average Annual Total Returns
| Class Name | Since Inception (September 27, 2023) |
|---|
| Brookstone Active ETF - NAV | 15.49% |
| Brookstone Active ETF - Market Price | 15.53% |
| Dow Jones Moderate Portfolio Index | 12.82% |
S&P 500® Index | 24.73% |
The Fund's past performance is not a good predictor of how the Fund will perform in the future. The graph and table do not reflect the deduction of taxes that a shareholder would pay on fund distributions or redemption of fund shares.
- Net Assets$36,662,188
- Number of Portfolio Holdings5
- Advisory Fee (net of waivers)$(17,402)
- Portfolio Turnover0%
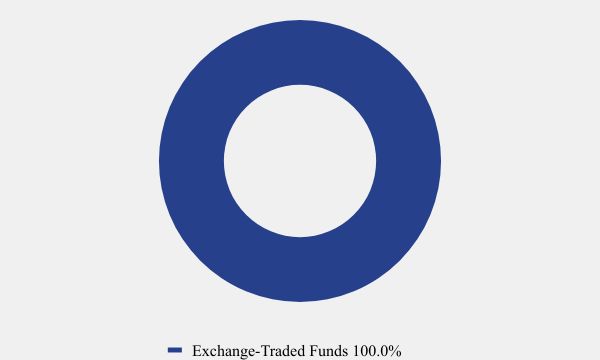
Asset Weighting (% of total investments)
| Value | Value |
|---|
| Exchange-Traded Funds | 100.0% |
What did the Fund invest in?
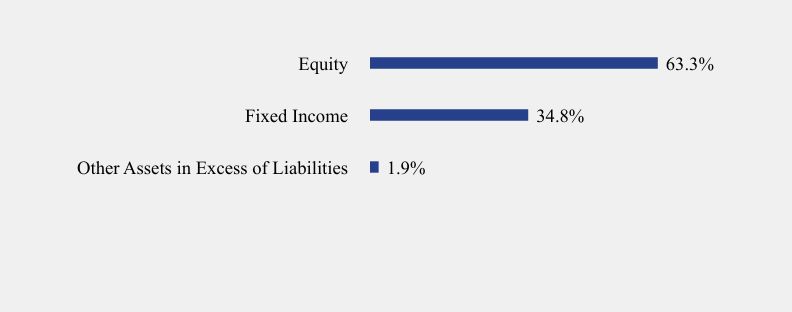
Sector Weighting (% of net assets)
| Value | Value |
|---|
| Other Assets in Excess of Liabilities | 1.9% |
| Fixed Income | 34.8% |
| Equity | 63.3% |
Top 10 Holdings (% of net assets)
| Holding Name | % of Net Assets |
| SPDR Portfolio S&P 500 Growth ETF | 21.8% |
| SPDR Portfolio S&P 500 ETF | 21.1% |
| SPDR Portfolio S&P 500 Value ETF | 20.4% |
| SPDR Portfolio Aggregate Bond ETF | 17.5% |
| iShares 0-3 Month Treasury Bond ETF | 17.3% |
No material changes occurred during the period ended May 31, 2024.
Annual Shareholder Report - May 31, 2024
Where can I find additional information about the Fund?
This annual shareholder report contains important information about Brookstone Active ETF for the period of September 27, 2023 to May 31, 2024. You can find additional information about the Fund at https://www.brookstoneam.com/brookstone-active-etf. You can also request this information by contacting us at 1-888-562-8880.
Prospectus
Financial information
Holdings
Proxy voting information
Brookstone Intermediate Bond ETF
(BAMB) Cboe BZX Exchange, Inc
Annual Shareholder Report - May 31, 2024
This annual shareholder report contains important information about Brookstone Intermediate Bond ETF for the period of September 26, 2023 to May 31, 2024. You can find additional information about the Fund at https://www.brookstoneam.com/brookstone-intermediate-bond-etf. You can also request this information by contacting us at 1-888-562-8880.
What were the Fund’s costs for the reporting period?
(based on a hypothetical $10,000 investment)
| Fund Name | Costs of a $10,000 investment | Costs paid as a percentage of a $10,000 investment |
|---|
| Brookstone Intermediate Bond ETF | $136 | 0.95% |
How did the Fund perform during the reporting period?
U.S. taxable investment-grade bonds, as measured by the Bloomberg U.S. Aggregate Bond Index, returned 4.88% from 9/26/2023, through 5/31/2024. This performance comprised a robust end to 2023, with a 6.63% return from 9/26 to 12/31/2023, followed by a challenging start to 2024, witnessing a -1.64% return from January 1 to May 31, 2024. The late surge in 2023 was fueled by market optimism as the U.S. Federal Reserve cautiously signaled progress in its battle against inflation.In the latter months of 2023, capital markets experienced a significant upswing following hints from the Federal Reserve that it might be nearing the conclusion of its interest-rate-hiking cycle, initiated in March 2022. The Fed's positive outlook on inflation progress, coupled with resilient employment, manufacturing, and consumer spending data, drove the Bloomberg U.S. Aggregate Bond index to impressive performance. Entering 2024, the bond market faced the challenge of maintaining the high standards set by the previous year's performance. Despite the Fed's optimism, stronger-than-anticipated economic data and higher-than-expected inflation readings in the first five months of the year prompted investors to reconsider their expectations for monetary policy adjustments. The robustness in these sectors and persistent inflation suggested that the economy could tolerate higher interest rates for an extended duration. The first five months of 2024 witnessed mixed performance in the bond market. From January to May, the Bloomberg U.S. Aggregate Bond Index experienced a negative return of -1.64%. Despite the Fed's ongoing cautious optimism regarding inflation, the market was pressured by stronger economic indicators and the reassessment of anticipated rate adjustments. Since its inception, the Brookstone Intermediate Bond ETF has gained 3.50%, falling short of the 4.88% gain of its benchmark, the Bloomberg U.S. Aggregate Bond Index, over the same period. This under performance can be attributed to two primary factors: firstly, a shorter effective duration of 4.82 years compared to 6.21 years for the Bloomberg U.S. Aggregate Bond Index. Secondly, there was an underallocation to the U.S. Corporates and Securitized market relative to the benchmark.
How has the Fund performed since inception?
Total Return Based on $10,000 Investment
| Brookstone Intermediate Bond ETF - NAV | Bloomberg U.S. Aggregate Bond Index |
|---|
| 09/26/23 | $10,000 | $10,000 |
| 09/30/23 | $10,004 | $9,983 |
| 10/31/23 | $9,984 | $9,825 |
| 11/30/23 | $10,145 | $10,270 |
| 12/31/23 | $10,286 | $10,663 |
| 01/31/24 | $10,310 | $10,634 |
| 02/29/24 | $10,266 | $10,484 |
| 03/31/24 | $10,311 | $10,581 |
| 04/30/24 | $10,230 | $10,313 |
| 05/31/24 | $10,350 | $10,488 |
Average Annual Total Returns
| Class Name | Since Inception (September 26, 2023) |
|---|
| Brookstone Intermediate Bond ETF - NAV | 3.50% |
| Brookstone Intermediate Bond ETF - Market Price | 3.54% |
| Bloomberg U.S. Aggregate Bond Index | 4.88% |
The Fund's past performance is not a good predictor of how the Fund will perform in the future. The graph and table do not reflect the deduction of taxes that a shareholder would pay on fund distributions or redemption of fund shares.
- Net Assets$54,973,819
- Number of Portfolio Holdings5
- Advisory Fee (net of waivers)$136,858
- Portfolio Turnover79%
Asset Weighting (% of total investments)
| Value | Value |
|---|
| Exchange-Traded Funds | 100.0% |
What did the Fund invest in?
Sector Weighting (% of net assets)
| Value | Value |
|---|
| Other Assets in Excess of Liabilities | 0.2% |
| Fixed Income | 99.8% |
Top 10 Holdings (% of net assets)
| Holding Name | % of Net Assets |
| iShares 7-10 Year Treasury Bond ETF | 20.0% |
| SPDR Portfolio Intermediate Term Treasury ETF | 20.0% |
| iShares 3-7 Year Treasury Bond ETF | 20.0% |
| Schwab Intermediate-Term U.S. Treasury ETF | 19.9% |
| iShares 1-5 Year Investment Grade Corporate Bond | 19.9% |
No material changes occurred during the period ended May 31, 2024.
Brookstone Intermediate Bond ETF
Annual Shareholder Report - May 31, 2024
Where can I find additional information about the Fund?
This annual shareholder report contains important information about Brookstone Intermediate Bond ETF for the period of September 26, 2023 to May 31, 2024. You can find additional information about the Fund at https://www.brookstoneam.com/brookstone-intermediate-bond-etf. You can also request this information by contacting us at 1-888-562-8880.
Prospectus
Financial information
Holdings
Proxy voting information
(BAMY) Cboe BZX Exchange, Inc
Annual Shareholder Report - May 31, 2024
This annual shareholder report contains important information about Brookstone Yield ETF for the period of September 27, 2023 to May 31, 2024. You can find additional information about the Fund at https://www.brookstoneam.com/brookstone-yield-etf. You can also request this information by contacting us at 1-888-562-8880.
What were the Fund’s costs for the reporting period?
(based on a hypothetical $10,000 investment)
| Fund Name | Costs of a $10,000 investment | Costs paid as a percentage of a $10,000 investment |
|---|
| Brookstone Yield ETF | $136 | 0.95% |
How did the Fund perform during the reporting period?
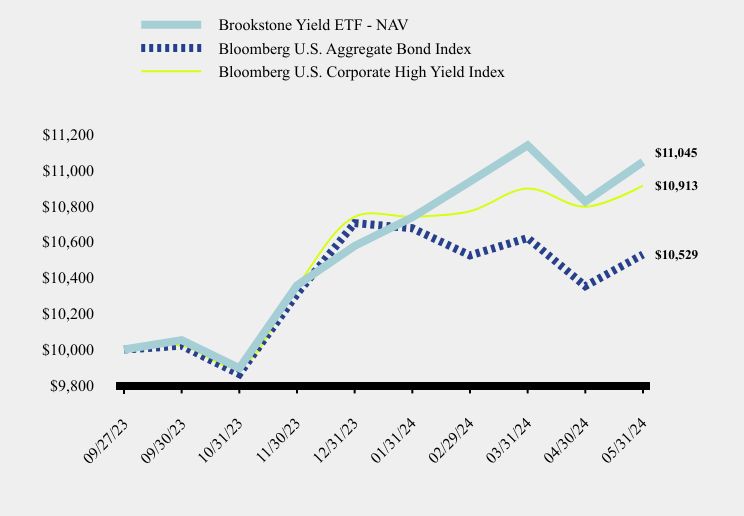
From September 27, 2023, through May 31, 2024, both US equities and taxable investment-grade bonds experienced notable fluctuations amid changing economic dynamics and Federal Reserve policies. US equities surged by 24.62%, driven by a narrow set of firms in the information technology and communications services sectors, buoyed by enthusiasm for generative artificial intelligence. Despite a slowing pace of inflation, the Federal Reserve maintained its policy stance, keeping rates at a 22-year high. Although core US inflation remained elevated, investors remained optimistic, anticipating a shift to easing after a historic hiking cycle. On the other hand, U.S. taxable investment-grade bonds, measured by the Bloomberg U.S. Aggregate Bond Index, returned 5.29%. A robust end to 2023 was followed by a challenging start to 2024, witnessing a -1.64% return. The late surge in 2023 was fueled by market optimism as the Federal Reserve signaled progress in its battle against inflation. However, stronger-than-anticipated economic data and higher-than-expected inflation readings in early 2024 led investors to reassess their expectations for monetary policy adjustments. Throughout the period, the bond market faced pressure from stronger economic indicators, prompting a negative return of -1.64% from January to May. Despite the Federal Reserve's cautious optimism regarding inflation, persistent inflation and robustness in various sectors suggested the economy could tolerate higher interest rates for an extended duration. This mixed performance reflected the ongoing challenge of balancing market expectations with evolving economic conditions amid Federal Reserve policies. Since its inception, the Fund has gained 10.45%, outperforming its benchmark, the Bloomberg U.S. Corporate High Yield Index, which gained 9.13% during the same period. This outperformance can be attributed to higher-than-average long-term bond volatility of 17.27 compared to its historic average of 15.60.
How has the Fund performed since inception?
Total Return Based on $10,000 Investment
| Brookstone Yield ETF - NAV | Bloomberg U.S. Aggregate Bond Index | Bloomberg U.S. Corporate High Yield Index |
|---|
| 09/27/23 | $10,000 | $10,000 | $10,000 |
| 09/30/23 | $10,052 | $10,021 | $10,021 |
| 10/31/23 | $9,896 | $9,863 | $9,904 |
| 11/30/23 | $10,357 | $10,310 | $10,353 |
| 12/31/23 | $10,577 | $10,704 | $10,739 |
| 01/31/24 | $10,736 | $10,675 | $10,739 |
| 02/29/24 | $10,935 | $10,524 | $10,770 |
| 03/31/24 | $11,137 | $10,621 | $10,897 |
| 04/30/24 | $10,824 | $10,353 | $10,795 |
| 05/31/24 | $11,045 | $10,529 | $10,913 |
Average Annual Total Returns
| Class Name | Since Inception (September 27, 2023) |
|---|
| Brookstone Yield ETF - NAV | 10.45% |
| Brookstone Yield ETF - Market Price | 10.45% |
| Bloomberg U.S. Aggregate Bond Index | 5.29% |
| Bloomberg U.S. Corporate High Yield Index | 9.13% |
The Fund's past performance is not a good predictor of how the Fund will perform in the future. The graph and table do not reflect the deduction of taxes that a shareholder would pay on fund distributions or redemption of fund shares.
- Net Assets$33,078,248
- Number of Portfolio Holdings6
- Advisory Fee (net of waivers)$40,224
- Portfolio Turnover77%
Asset Weighting (% of total investments)
| Value | Value |
|---|
| Exchange-Traded Funds | 100.0% |
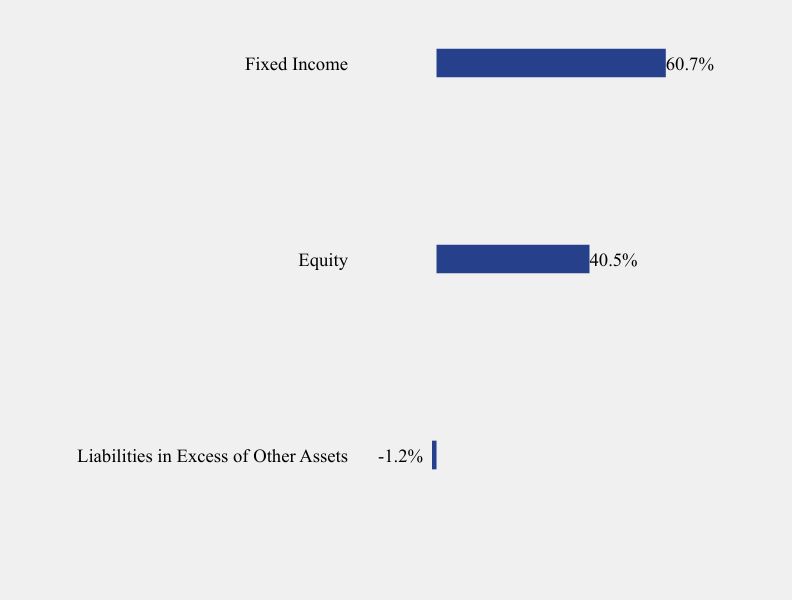
What did the Fund invest in?
Sector Weighting (% of net assets)
| Value | Value |
|---|
| Liabilities in Excess of Other Assets | -1.2% |
| Equity | 40.5% |
| Fixed Income | 60.7% |
Top 10 Holdings (% of net assets)
| Holding Name | % of Net Assets |
| JPMorgan Equity Premium Income ETF | 20.4% |
| SPDR Blackstone Senior Loan ETF | 20.3% |
| Invesco Senior Loan ETF | 20.2% |
| JPMorgan Nasdaq Equity Premium Income ETF | 20.1% |
| Panagram Bbb-B Clo Etf | 10.1% |
| Janus Henderson B-BBB CLO ETF | 10.1% |
No material changes occurred during the period ended May 31, 2024.
Annual Shareholder Report - May 31, 2024
Where can I find additional information about the Fund?
This annual shareholder report contains important information about Brookstone Yield ETF for the period of September 27, 2023 to May 31, 2024. You can find additional information about the Fund at https://www.brookstoneam.com/brookstone-yield-etf. You can also request this information by contacting us at 1-888-562-8880.
Prospectus
Financial information
Holdings
Proxy voting information
| (a) | The registrant has, as of the end of the period covered by this report, adopted a code of ethics that applies to the registrant’s principal executive officer, principal financial officer, and principal accounting officer or controller, or persons performing similar functions, regardless of whether these individuals are employed by the registrant or a third party. |
| | |
| (b) | During the period covered by this report, there were no amendments to any provision of the code of ethics. |
| | |
| (c) | During the period covered by this report, there were no waivers or implicit waivers of a provision of the code of ethics. |
| Item 3. | Audit Committee Financial Expert. |
| | (a)(1) The Registrant’s board of trustees has determined that Joseph Breslin is the audit committee financial expert, as defined in Item 3 of Form N-CSR. Mr. Joseph Breslin is independent for purposes of this Item. (a)(2) Not applicable. (a)(3) Not applicable. |
| Item 4. | Principal Accountant Fees and Services. |
| (a) | Audit Fees. The aggregate fees billed for each of the last two fiscal years for professional services rendered by the registrant’s principal accountant for the audit of the registrant’s annual financial statements or services that are normally provided by the accountant in connection with statutory and regulatory filings or engagements for those fiscal years are as follows: |
2024 $118,000
| (b) | Audit-Related Fees. There were no fees billed in each of the last two fiscal years for assurances and related services by the principal accountant that are reasonably related to the performance of the audit of the registrant’s financial statements and are not reported under paragraph (a) of this item. |
| | |
| (c) | Tax Fees. The aggregate fees billed in each of the last two fiscal years for professional services rendered by the principal accountant for tax compliance are as follows: |
| | |
| | 2024 $28,000 |
Preparation of Federal & State income tax returns, assistance with calculation of required income, capital gain and excise distributions and preparation of Federal excise tax returns.
| (d) | All Other Fees. The aggregate fees billed in each of the last two fiscal years for products and services provided by the registrant’s principal accountant, other than the services reported in paragraphs (a) through (c) of this item were $0 for the fiscal year ended May 31, 2024. |
| | |
| (e)(1) | The audit committee does not have pre-approval policies and procedures. Instead, the audit committee or audit committee chairman approves on a case-by-case basis each audit or non-audit service before the principal accountant is engaged by the registrant. |
| | |
| (e)(2) | There were no services described in each of paragraphs (b) through (d) of this Item that were approved by the audit committee pursuant to paragraph (c)(7)(i)(C) of Rule 2-01 of Regulation S-X. |
| | |
| (f) | Not applicable. The percentage of hours expended on the principal accountant’s engagement to audit the registrant’s financial statements for the most recent fiscal year that were attributed to work performed by persons other than the principal accountant’s full-time, permanent employees was zero percent (0%). |
| | |
| (g) | All non-audit fees billed by the registrant’s principal accountant for services rendered to the registrant for the fiscal year ended May 31,2024 are disclosed in (b)-(d) above. There were no audit or non-audit services performed by the registrant’s principal accountant for the registrant’s adviser. |
| (h) | Not applicable. |
| | |
| (i) | Not applicable. |
| | |
| (j) | Not applicable. |
| Item 5. | Audit Committee of Listed Registrants. |
The registrant is an issuer as defined in Rule 10A-3 under the Securities Exchange Act of 1934, as amended (the “Exchange Act”) and has a separately-designated standing audit committee established in accordance with Section 3(a)(58)A of the Exchange Act. The registrant’s audit committee members are Joseph Breslin, Thomas Sarkany and Charles Ranson
The Registrant’s schedule of investments in unaffiliated issuers is included in the Financial Statements under Item 7 of this form.
Item 7. Financial Statements and Financial Highlights for Open-End Management Investment Companies.
(a)
| |
| |
| |
| |
| |
 |
| |
| |
| |
| |
| |
| Brookstone Dividend Stock ETF (BAMD) |
| Brookstone Growth Stock ETF (BAMG) |
| Brookstone Value Stock ETF (BAMV) |
| Brookstone Intermediate Bond ETF (BAMB) |
| Brookstone Ultra-Short Bond ETF (BAMU) |
| Brookstone Active ETF (BAMA) |
| Brookstone Opportunities ETF (BAMO) |
| Brookstone Yield ETF (BAMY) |
| |
| |
| |
| |
| |
| |
| |
| |
| |
| |
| Annual Report |
| May 31, 2024 |
| |
| |
| |
| 1-888-562-8880 |
| www.brookstoneam.com |
| |
| |
| |
| This report and the financial statements contained herein are submitted for the general information of shareholders and are not authorized for distribution to prospective investors unless preceded or accompanied by an effective prospectus. Nothing herein contained is to be considered an offer of sale or solicitation of an offer to buy shares of the Brookstone ETFs. Such offering is made only by prospectus, which includes details as to offering price and other material information. |
| |
| Distributed by Northern Lights Distributors, LLC. |
| Member FINRA |
| |
| |
| |
| |
| |
| BROOKSTONE DIVIDEND STOCK ETF |
| SCHEDULE OF INVESTMENTS |
| May 31, 2024 |
| |
| Shares | | | | | Fair Value | |
| | | | | COMMON STOCKS — 99.4% | | | | |
| | | | | ASSET MANAGEMENT - 3.2% | | | | |
| | 20,849 | | | T Rowe Price Group, Inc. | | $ | 2,456,638 | |
| | | | | | | | | |
| | | | | AUTOMOTIVE - 3.3% | | | | |
| | 204,603 | | | Ford Motor Company | | | 2,481,834 | |
| | | | | | | | | |
| | | | | BANKING - 9.4% | | | | |
| | 179,647 | | | Huntington Bancshares, Inc. | | | 2,500,686 | |
| | 62,409 | | | Truist Financial Corporation | | | 2,355,940 | |
| | 55,185 | | | US Bancorp | | | 2,237,752 | |
| | | | | | | | 7,094,378 | |
| | | | | BIOTECH & PHARMA - 2.9% | | | | |
| | 34,460 | | | Gilead Sciences, Inc. | | | 2,214,744 | |
| | | | | | | | | |
| | | | | CHEMICALS - 6.6% | | | | |
| | 43,246 | | | Dow, Inc. | | | 2,492,267 | |
| | 41,119 | | | FMC Corporation | | | 2,506,203 | |
| | | | | | | | 4,998,470 | |
| | | | | CONTAINERS & PACKAGING - 3.8% | | | | |
| | 63,427 | | | International Paper Company | | | 2,859,923 | |
| | | | | | | | | |
| | | | | DIVERSIFIED INDUSTRIALS - 3.4% | | | | |
| | 25,471 | | | 3M Company | | | 2,550,666 | |
| | | | | | | | | |
| | | | | ELECTRIC UTILITIES - 20.1% | | | | |
| | 29,398 | | | American Electric Power Company, Inc. | | | 2,653,170 | |
| | 50,051 | | | Dominion Energy, Inc. | | | 2,698,751 | |
| | 23,826 | | | Duke Energy Corporation | | | 2,467,659 | |
| | 33,286 | | | Edison International | | | 2,558,029 | |
| | 22,103 | | | Entergy Corporation | | | 2,486,366 | |
| | 28,733 | | | WEC Energy Group, Inc. | | | 2,328,235 | |
| | | | | | | | 15,192,210 | |
| | | | | FOOD - 6.4% | | | | |
| | 77,544 | | | Conagra Brands, Inc. | | | 2,317,015 | |
| | | | | | | | | |
See accompanying notes which are an integral part of these financial statements.
| BROOKSTONE DIVIDEND STOCK ETF |
| SCHEDULE OF INVESTMENTS (Continued) |
| May 31, 2024 |
| |
| Shares | | | | | Fair Value | |
| | | | | COMMON STOCKS — 99.4% (Continued) | | | | |
| | | | | FOOD - 6.4% (Continued) | | | | |
| | 42,374 | | | Kellanova | | $ | 2,556,847 | |
| | | | | | | | 4,873,862 | |
| | | | | GAS & WATER UTILITIES - 3.4% | | | | |
| | 89,341 | | | NiSource, Inc. | | | 2,596,249 | |
| | | | | | | | | |
| | | | | HEALTH CARE REIT - 3.4% | | | | |
| | 127,484 | | | Healthpeak Properties, Inc. | | | 2,536,932 | |
| | | | | | | | | |
| | | | | HOUSEHOLD PRODUCTS - 3.1% | | | | |
| | 17,718 | | | Kimberly-Clark Corporation | | | 2,361,809 | |
| | | | | | | | | |
| | | | | INFRASTRUCTURE REIT - 3.3% | | | | |
| | 24,342 | | | Crown Castle, Inc. | | | 2,495,055 | |
| | | | | | | | | |
| | | | | INSURANCE - 3.7% | | | | |
| | 22,984 | | | Prudential Financial, Inc. | | | 2,766,124 | |
| | | | | | | | | |
| | | | | OIL & GAS PRODUCERS - 6.8% | | | | |
| | 128,628 | | | Kinder Morgan, Inc. | | | 2,506,960 | |
| | 32,494 | | | ONEOK, Inc. | | | 2,632,014 | |
| | | | | | | | 5,138,974 | |
| | | | | RETAIL REIT - 3.0% | | | | |
| | 43,258 | | | Realty Income Corporation | | | 2,295,269 | |
| | | | | | | | | |
| | | | | TECHNOLOGY HARDWARE - 3.8% | | | | |
| | 78,261 | | | HP, Inc. | | | 2,856,527 | |
| | | | | | | | | |
| | | | | TELECOMMUNICATIONS - 6.3% | | | | |
| | 136,989 | | | AT&T, Inc. | | | 2,495,939 | |
| | 54,731 | | | Verizon Communications, Inc. | | | 2,252,181 | |
| | | | | | | | 4,748,120 | |
| | | | | | | | | |
See accompanying notes which are an integral part of these financial statements.
| BROOKSTONE DIVIDEND STOCK ETF |
| SCHEDULE OF INVESTMENTS (Continued) |
| May 31, 2024 |
| |
| Shares | | | | | Fair Value | |
| | | | | COMMON STOCKS — 99.4% (Continued) | | | | |
| | | | | TOBACCO & CANNABIS - 3.5% | | | | |
| | 56,771 | | | Altria Group, Inc. | | $ | 2,625,659 | |
| | | | | | | | | |
| | | | | TOTAL COMMON STOCKS (Cost $65,843,284) | | $ | 75,143,443 | |
| | | | | | | | | |
| | | | | TOTAL INVESTMENTS - 99.4% (Cost $65,843,284) | | $ | 75,143,443 | |
| | | | | OTHER ASSETS IN EXCESS OF LIABILITIES - 0.6% | | | 491,426 | |
| | | | | NET ASSETS - 100.0% | | $ | 75,634,869 | |
| | | | | | | | | |
See accompanying notes which are an integral part of these financial statements.
| BROOKSTONE GROWTH STOCK ETF |
| SCHEDULE OF INVESTMENTS |
| May 31, 2024 |
| |
| Shares | | | | | Fair Value | |
| | | | | COMMON STOCKS — 98.7% | | | | |
| | | | | AEROSPACE & DEFENSE - 3.2% | | | | |
| | 5,340 | | | Lockheed Martin Corporation, B | | $ | 2,511,616 | |
| | | | | | | | | |
| | | | | AUTOMOTIVE - 2.7% | | | | |
| | 12,038 | | | Tesla, Inc.(a) | | | 2,143,727 | |
| | | | | | | | | |
| | | | | BEVERAGES - 3.3% | | | | |
| | 15,159 | | | PepsiCo, Inc. | | | 2,620,992 | |
| | | | | | | | | |
| | | | | BIOTECH & PHARMA - 2.6% | | | | |
| | 50,382 | | | Bristol-Myers Squibb Company | | | 2,070,196 | |
| | | | | | | | | |
| | | | | E-COMMERCE DISCRETIONARY - 3.8% | | | | |
| | 16,956 | | | Amazon.com, Inc.(a) | | | 2,991,716 | |
| | | | | | | | | |
| | | | | ELECTRICAL EQUIPMENT - 3.2% | | | | |
| | 34,398 | | | Fortive Corporation | | | 2,560,587 | |
| | | | | | | | | |
| | | | | HEALTH CARE FACILITIES & SERVICES - 3.1% | | | | |
| | 4,934 | | | UnitedHealth Group, Inc. | | | 2,444,156 | |
| | | | | | | | | |
| | | | | HOME CONSTRUCTION - 3.2% | | | | |
| | 36,567 | | | Masco Corporation | | | 2,556,765 | |
| | | | | | | | | |
| | | | | HOUSEHOLD PRODUCTS - 3.0% | | | | |
| | 123,448 | | | Kenvue, Inc. | | | 2,382,546 | |
| | | | | | | | | |
| | | | | INSTITUTIONAL FINANCIAL SERVICES - 3.2% | | | | |
| | 12,358 | | | CME Group, Inc. | | | 2,508,427 | |
| | | | | | | | | |
| | | | | INTERNET MEDIA & SERVICES - 14.9% | | | | |
| | 16,865 | | | Alphabet, Inc., Class A(a) | | | 2,909,213 | |
| | 6,586 | | | Meta Platforms, Inc., Class A | | | 3,074,542 | |
| | 5,173 | | | Netflix, Inc.(a) | | | 3,319,100 | |
| | | | | | | | | |
See accompanying notes which are an integral part of these financial statements.
| BROOKSTONE GROWTH STOCK ETF |
| SCHEDULE OF INVESTMENTS (Continued) |
| May 31, 2024 |
| |
| Shares | | | | | Fair Value | |
| | | | | COMMON STOCKS — 98.7% (Continued) | | | | |
| | | | | INTERNET MEDIA & SERVICES - 14.9% (Continued) | | | | |
| | 39,069 | | | Uber Technologies, Inc.(a) | | $ | 2,522,295 | |
| | | | | | | | 11,825,150 | |
| | | | | LEISURE FACILITIES & SERVICES - 2.6% | | | | |
| | 8,054 | | | McDonald’s Corporation | | | 2,085,100 | |
| | | | | | | | | |
| | | | | MEDICAL EQUIPMENT & DEVICES - 3.1% | | | | |
| | 4,316 | | | Thermo Fisher Scientific, Inc. | | | 2,451,402 | |
| | | | | | | | | |
| | | | | OIL & GAS PRODUCERS - 3.6% | | | | |
| | 22,923 | | | EOG Resources, Inc. | | | 2,855,060 | |
| | | | | | | | | |
| | | | | SEMICONDUCTORS - 14.1% | | | | |
| | 4,249 | | | NVIDIA Corporation | | | 4,658,306 | |
| | 16,557 | | | QUALCOMM, Inc. | | | 3,378,456 | |
| | 22,962 | | | Teradyne, Inc. | | | 3,236,264 | |
| | | | | | | | 11,273,026 | |
| | | | | SOFTWARE - 19.3% | | | | |
| | 4,119 | | | Adobe, Inc.(a) | | | 1,831,966 | |
| | 10,548 | | | Autodesk, Inc.(a) | | | 2,126,477 | |
| | 6,391 | | | Microsoft Corporation | | | 2,653,095 | |
| | 7,314 | | | Palo Alto Networks, Inc.(a) | | | 2,156,972 | |
| | 3,321 | | | ServiceNow, Inc.(a) | | | 2,181,665 | |
| | 12,600 | | | Snowflake, Inc.(a) | | | 1,715,868 | |
| | 5,607 | | | Tyler Technologies, Inc.(a) | | | 2,693,378 | |
| | | | | | | | 15,359,421 | |
| | | | | TECHNOLOGY HARDWARE - 3.1% | | | | |
| | 12,593 | | | Apple, Inc. | | | 2,421,004 | |
| | | | | | | | | |
| | | | | TECHNOLOGY SERVICES - 3.2% | | | | |
| | 9,345 | | | Visa, Inc., Class A | | | 2,546,139 | |
| | | | | | | | | |
See accompanying notes which are an integral part of these financial statements.
| BROOKSTONE GROWTH STOCK ETF |
| SCHEDULE OF INVESTMENTS (Continued) |
| May 31, 2024 |
| |
| Shares | | | | | Fair Value | |
| | | | | COMMON STOCKS — 98.7% (Continued) | | | | |
| | | | | TELECOMMUNICATIONS - 3.5% | | | | |
| | 15,665 | | | T-Mobile US, Inc. | | $ | 2,740,748 | |
| | | | | | | | | |
| | | | | TOTAL COMMON STOCKS (Cost $70,645,959) | | $ | 78,347,778 | |
| | | | | | | | | |
| | | | | TOTAL INVESTMENTS - 98.7% (Cost $70,645,959) | | $ | 78,347,778 | |
| | | | | OTHER ASSETS IN EXCESS OF LIABILITIES - 1.3% | | | 995,544 | |
| | | | | NET ASSETS - 100.0% | | $ | 79,343,322 | |
| | | | | | | | | |
| (a) | Non-income producing security. |
See accompanying notes which are an integral part of these financial statements.
| BROOKSTONE VALUE STOCK ETF |
| SCHEDULE OF INVESTMENTS |
| May 31, 2024 |
| |
| Shares | | | | | Fair Value | |
| | | | | COMMON STOCKS — 99.1% | | | | |
| | | | | AEROSPACE & DEFENSE - 2.6% | | | | |
| | 11,048 | | | Boeing Company (The)(a) | | $ | 1,962,235 | |
| | | | | | | | | |
| | | | | APPAREL & TEXTILE PRODUCTS - 2.7% | | | | |
| | 21,736 | | | NIKE, Inc., Class B | | | 2,066,007 | |
| | | | | | | | | |
| | | | | BANKING - 12.3% | | | | |
| | 77,636 | | | Bank of America Corporation | | | 3,104,664 | |
| | 15,324 | | | JPMorgan Chase & Company | | | 3,105,102 | |
| | 52,523 | | | Wells Fargo & Company | | | 3,147,178 | |
| | | | | | | | 9,356,944 | |
| | | | | BEVERAGES - 3.1% | | | | |
| | 38,106 | | | Coca-Cola Company (The) | | | 2,398,011 | |
| | | | | | | | | |
| | | | | BIOTECH & PHARMA - 5.9% | | | | |
| | 14,477 | | | Johnson & Johnson | | | 2,123,342 | |
| | 84,277 | | | Pfizer, Inc. | | | 2,415,378 | |
| | | | | | | | 4,538,720 | |
| | | | | CABLE & SATELLITE - 2.7% | | | | |
| | 50,900 | | | Comcast Corporation, Class A | | | 2,037,527 | |
| | | | | | | | | |
| | | | | DIVERSIFIED INDUSTRIALS - 3.0% | | | | |
| | 11,523 | | | Honeywell International, Inc. | | | 2,329,835 | |
| | | | | | | | | |
| | | | | ELECTRIC UTILITIES - 4.4% | | | | |
| | 41,896 | | | NextEra Energy, Inc. | | | 3,352,518 | |
| | | | | | | | | |
| | | | | ELECTRICAL EQUIPMENT - 3.6% | | | | |
| | 27,507 | | | Otis Worldwide Corporation | | | 2,728,695 | |
| | | | | | | | | |
| | | | | ENTERTAINMENT CONTENT - 3.5% | | | | |
| | 25,668 | | | Walt Disney Company (The) | | | 2,667,162 | |
| | | | | | | | | |
See accompanying notes which are an integral part of these financial statements.
| BROOKSTONE VALUE STOCK ETF |
| SCHEDULE OF INVESTMENTS (Continued) |
| May 31, 2024 |
| |
| Shares | | | | | Fair Value | |
| | | | | COMMON STOCKS — 99.1% (Continued) | | | | |
| | | | | HEALTH CARE FACILITIES & SERVICES - 2.4% | | | | |
| | 31,249 | | | CVS Health Corporation | | $ | 1,862,440 | |
| | | | | | | | | |
| | | | | HEALTH CARE REIT - 3.4% | | | | |
| | 25,410 | | | Welltower, Inc. | | | 2,634,255 | |
| | | | | | | | | |
| | | | | INSTITUTIONAL FINANCIAL SERVICES - 4.2% | | | | |
| | 6,889 | | | Goldman Sachs Group, Inc. (The) | | | 3,144,966 | |
| | | | | | | | | |
| | | | | INSURANCE - 3.3% | | | | |
| | 6,164 | | | Berkshire Hathaway, Inc., Class B(a) | | | 2,554,362 | |
| | | | | | | | | |
| | | | | LEISURE FACILITIES & SERVICES - 2.7% | | | | |
| | 25,678 | | | Starbucks Corporation | | | 2,059,889 | |
| | | | | | | | | |
| | | | | MEDICAL EQUIPMENT & DEVICES - 9.6% | | | | |
| | 10,123 | | | Becton Dickinson and Company | | | 2,348,232 | |
| | 10,334 | | | Danaher Corporation | | | 2,653,772 | |
| | 19,874 | | | Zimmer Biomet Holdings, Inc. | | | 2,288,491 | |
| | | | | | | | 7,290,495 | |
| | | | | METALS & MINING - 3.7% | | | | |
| | 68,095 | | | Newmont Corporation | | | 2,855,904 | |
| | | | | | | | | |
| | | | | OIL & GAS PRODUCERS - 7.3% | | | | |
| | 16,766 | | | Chevron Corporation | | | 2,721,122 | |
| | 24,394 | | | Exxon Mobil Corporation | | | 2,860,440 | |
| | | | | | | | 5,581,562 | |
| | | | | RETAIL - CONSUMER STAPLES - 3.3% | | | | |
| | 48,409 | | | Kroger Company (The) | | | 2,535,179 | |
| | | | | | | | | |
| | | | | SOFTWARE - 2.6% | | | | |
| | 8,569 | | | Salesforce, Inc. | | | 2,008,916 | |
| | | | | | | | | |
See accompanying notes which are an integral part of these financial statements.
| BROOKSTONE VALUE STOCK ETF |
| SCHEDULE OF INVESTMENTS (Continued) |
| May 31, 2024 |
| |
| Shares | | | | | Fair Value | |
| | | | | COMMON STOCKS — 99.1% (Continued) | | | | |
| | | | | TECHNOLOGY HARDWARE - 2.8% | | | | |
| | 46,385 | | | Cisco Systems, Inc. | | $ | 2,156,903 | |
| | | | | | | | | |
| | | | | TECHNOLOGY SERVICES - 10.0% | | | | |
| | 32,716 | | | Cognizant Technology Solutions Corporation, Class A | | | 2,164,163 | |
| | 41,598 | | | Fidelity National Information Services, Inc. | | | 3,156,456 | |
| | 36,835 | | | PayPal Holdings, Inc.(a) | | | 2,320,237 | |
| | | | | | | | 7,640,856 | |
| | | | | | | | | |
| | | | | TOTAL COMMON STOCKS (Cost $68,836,284) | | | 75,763,381 | |
| | | | | | | | | |
| | | | | TOTAL INVESTMENTS - 99.1% (Cost $68,836,284) | | $ | 75,763,381 | |
| | | | | OTHER ASSETS IN EXCESS OF LIABILITIES - 0.9% | | | 724,138 | |
| | | | | NET ASSETS - 100.0% | | $ | 76,487,519 | |
| | | | | | | | | |
| (a) | Non-income producing security. |
See accompanying notes which are an integral part of these financial statements.
| BROOKSTONE INTERMEDIATE BOND ETF |
| SCHEDULE OF INVESTMENTS |
| May 31, 2024 |
| |
| Shares | | | | | Fair Value | |
| | | | | EXCHANGE-TRADED FUNDS — 99.8% | | | | |
| | | | | FIXED INCOME - 99.8% | | | | |
| | 95,653 | | | iShares 3-7 Year Treasury Bond ETF | | $ | 10,970,443 | |
| | 118,636 | | | iShares 7-10 Year Treasury Bond ETF | | | 11,009,421 | |
| | 214,272 | | | iShares Trust iShares 1-5 Year Investment Grade | | | 10,957,870 | |
| | 226,558 | | | Schwab Intermediate-Term U.S. Treasury ETF | | | 10,969,938 | |
| | 394,449 | | | SPDR Portfolio Intermediate Term Treasury ETF | | | 10,973,571 | |
| | | | | | | | 54,881,243 | |
| | | | | | | | | |
| | | | | TOTAL EXCHANGE-TRADED FUNDS (Cost $54,250,958) | | | 54,881,243 | |
| | | | | | | | | |
| | | | | TOTAL INVESTMENTS - 99.8% (Cost $54,250,958) | | $ | 54,881,243 | |
| | | | | OTHER ASSETS IN EXCESS OF LIABILITIES - 0.2% | | | 92,576 | |
| | | | | NET ASSETS - 100.0% | | $ | 54,973,819 | |
| | | | | | | | | |
See accompanying notes which are an integral part of these financial statements.
| BROOKSTONE ULTRA-SHORT BOND ETF |
| SCHEDULE OF INVESTMENTS |
| May 31, 2024 |
| |
| Shares | | | | | Fair Value | |
| | | | | EXCHANGE-TRADED FUNDS — 98.3% | | | | |
| | | | | FIXED INCOME - 98.3% | | | | |
| | 116,020 | | | Invesco Short Term Treasury ETF | | $ | 12,241,270 | |
| | 121,412 | | | iShares 0-3 Month Treasury Bond ETF | | | 12,232,259 | |
| | 511,908 | | | iShares iBonds Dec 2024 Term Treasury ETF | | | 12,267,875 | |
| | 133,240 | | | SPDR Bloomberg 1-3 Month T-Bill ETF | | | 12,234,097 | |
| | 122,828 | | | SPDR Bloomberg 3-12 Month T-Bill ETF | | | 12,209,103 | |
| | | | | | | | 61,184,604 | |
| | | | | | | | | |
| | | | | TOTAL EXCHANGE-TRADED FUNDS (Cost $61,062,011) | | | 61,184,604 | |
| | | | | | | | | |
| | | | | TOTAL INVESTMENTS - 98.3% (Cost $61,062,011) | | $ | 61,184,604 | |
| | | | | OTHER ASSETS IN EXCESS OF LIABILITIES - 1.7% | | | 1,073,616 | |
| | | | | NET ASSETS - 100.0% | | $ | 62,258,220 | |
| | | | | | | | | |
See accompanying notes which are an integral part of these financial statements.
| BROOKSTONE ACTIVE ETF |
| SCHEDULE OF INVESTMENTS |
| May 31, 2024 |
| |
| Shares | | | | | Fair Value | |
| | | | | EXCHANGE-TRADED FUNDS — 98.1% | | | | |
| | | | | EQUITY - 63.3% | | | | |
| | 124,928 | | | SPDR Portfolio S&P 500 ETF | | $ | 7,748,035 | |
| | 106,240 | | | SPDR Portfolio S&P 500 Growth ETF | | | 7,969,062 | |
| | 151,552 | | | SPDR Portfolio S&P 500 Value ETF | | | 7,483,638 | |
| | | | | | | | 23,200,735 | |
| | | | | FIXED INCOME - 34.8% | | | | |
| | 62,976 | | | iShares 0-3 Month Treasury Bond ETF | | | 6,344,832 | |
| | 257,792 | | | SPDR Portfolio Aggregate Bond ETF | | | 6,429,332 | |
| | | | | | | | 12,774,164 | |
| | | | | | | | | |
| | | | | TOTAL EXCHANGE-TRADED FUNDS (Cost $32,306,800) | | | 35,974,899 | |
| | | | | | | | | |
| | | | | TOTAL INVESTMENTS - 98.1% (Cost $32,306,800) | | $ | 35,974,899 | |
| | | | | OTHER ASSETS IN EXCESS OF LIABILITIES - 1.9% | | | 687,289 | |
| | | | | NET ASSETS - 100.0% | | $ | 36,662,188 | |
| | | | | | | | | |
See accompanying notes which are an integral part of these financial statements.
| BROOKSTONE OPPORTUNITIES ETF |
| SCHEDULE OF INVESTMENTS |
| May 31, 2024 |
| |
| Shares | | | | | Fair Value | |
| | | | | EXCHANGE-TRADED FUNDS — 98.1% | | | | |
| | | | | EQUITY - 63.1% | | | | |
| | 41,205 | | | Invesco Nasdaq 100 ETF | | $ | 7,658,774 | |
| | 17,835 | | | SPDR Dow Jones Industrial Average ETF Trust | | | 6,911,598 | |
| | 15,252 | | | Vanguard S&P 500 ETF | | | 7,391,424 | |
| | | | | | | | 21,961,796 | |
| | | | | FIXED INCOME - 35.0% | | | | |
| | 60,516 | | | iShares 0-3 Month Treasury Bond ETF | | | 6,096,987 | |
| | 66,420 | | | SPDR Bloomberg 1-3 Month T-Bill ETF | | | 6,098,684 | |
| | | | | | | | 12,195,671 | |
| | | | | | | | | |
| | | | | TOTAL EXCHANGE-TRADED FUNDS (Cost $31,137,583) | | | 34,157,467 | |
| | | | | | | | | |
| | | | | TOTAL INVESTMENTS - 98.1% (Cost $31,137,583) | | $ | 34,157,467 | |
| | | | | OTHER ASSETS IN EXCESS OF LIABILITIES - 1.9% | | | 669,089 | |
| | | | | NET ASSETS - 100.0% | | $ | 34,826,556 | |
| | | | | | | | | |
See accompanying notes which are an integral part of these financial statements.
| BROOKSTONE YIELD ETF |
| SCHEDULE OF INVESTMENTS |
| May 31, 2024 |
| |
| Shares | | | | | Fair Value | |
| | | | | EXCHANGE-TRADED FUNDS — 101.2% | | | | |
| | | | | EQUITY - 40.5% | | | | |
| | 118,653 | | | JPMorgan Equity Premium Income ETF | | $ | 6,743,050 | |
| | 122,690 | | | JPMorgan Nasdaq Equity Premium Income ETF | | | 6,648,571 | |
| | | | | | | | 13,391,621 | |
| | | | | FIXED INCOME - 60.7% | | | | |
| | 317,028 | | | Invesco Senior Loan ETF | | | 6,695,631 | |
| | 67,962 | | | Janus Henderson B-BBB CLO ETF | | | 3,347,808 | |
| | 124,185 | | | Panagram Bbb-B Clo Etf | | | 3,351,753 | |
| | 159,118 | | | SPDR Blackstone Senior Loan ETF | | | 6,697,277 | |
| | | | | | | | 20,092,469 | |
| | | | | | | | | |
| | | | | TOTAL EXCHANGE-TRADED FUNDS (Cost $32,473,931) | | | 33,484,090 | |
| | | | | | | | | |
| | | | | TOTAL INVESTMENTS - 101.2% (Cost $32,473,931) | | $ | 33,484,090 | |
| | | | | LIABILITIES IN EXCESS OF OTHER ASSETS - (1.2)% | | | (405,842 | ) |
| | | | | NET ASSETS - 100.0% | | $ | 33,078,248 | |
| | | | | | | | | |
See accompanying notes which are an integral part of these financial statements.
| Brookstone ETFs |
| STATEMENTS OF ASSETS AND LIABILITIES |
| May 31, 2024 |
| | | Brookstone | | | Brookstone | | | Brookstone | | | Brookstone | |
| | | Dividend Stock | | | Growth Stock | | | Value Stock | | | Intermediate Bond | |
| | | ETF | | | ETF | | | ETF | | | ETF | |
| ASSETS | | | | | | | | | | | | | | | | |
| Investment securities: | | | | | | | | | | | | | | | | |
| At cost | | $ | 65,843,284 | | | $ | 70,645,959 | | | $ | 68,836,284 | | | $ | 54,250,958 | |
| At value | | $ | 75,143,443 | | | $ | 78,347,778 | | | $ | 75,763,381 | | | $ | 54,881,243 | |
| Cash and cash equivalents | | | 999,398 | | | | 1,058,212 | | | | 878,978 | | | | 621,912 | |
| Dividends and interest receivable | | | 305,870 | | | | 54,093 | | | | 180,860 | | | | 2,441 | |
| TOTAL ASSETS | | | 76,448,711 | | | | 79,460,083 | | | | 76,823,219 | | | | 55,505,596 | |
| | | | | | | | | | | | | | | | | |
| LIABILITIES | | | | | | | | | | | | | | | | |
| Distributions Payable | | | 698,527 | | | | — | | | | 224,460 | | | | 428,112 | |
| Investment advisory fees payable | | | 45,199 | | | | 47,441 | | | | 45,129 | | | | 31,426 | |
| Payable to related parties | | | 11,307 | | | | 13,045 | | | | 11,731 | | | | 21,276 | |
| Accrued expenses and other liabilities | | | 58,809 | | | | 56,275 | | | | 54,380 | | | | 50,963 | |
| TOTAL LIABILITIES | | | 813,842 | | | | 116,761 | | | | 335,700 | | | | 531,777 | |
| NET ASSETS | | $ | 75,634,869 | | | $ | 79,343,322 | | | $ | 76,487,519 | | | $ | 54,973,819 | |
| | | | | | | | | | | | | | | | | |
| Composition of Net Assets: | | | | | | | | | | | | | | | | |
| Paid in capital ($0 par value, unlimited shares authorized) | | $ | 65,632,116 | | | $ | 70,586,180 | | | $ | 67,537,094 | | | $ | 54,340,565 | |
| Accumulated earnings | | | 10,002,753 | | | | 8,757,142 | | | | 8,950,425 | | | | 633,254 | |
| NET ASSETS | | $ | 75,634,869 | | | $ | 79,343,322 | | | $ | 76,487,519 | | | $ | 54,973,819 | |
| | | | | | | | | | | | | | | | | |
| Net Asset Value Per Share: | | | | | | | | | | | | | | | | |
| Shares: | | | | | | | | | | | | | | | | |
| Net Assets | | $ | 75,634,869 | | | $ | 79,343,322 | | | $ | 76,487,519 | | | $ | 54,973,819 | |
| Shares of beneficial interest outstanding | | | 2,570,000 | | | | 2,670,000 | | | | 2,580,000 | | | | 2,160,000 | |
| | | | | | | | | | | | | | | | | |
| Net asset value (Net Assets ÷ Shares Outstanding), offering and redemption price per share | | $ | 29.43 | | | $ | 29.72 | | | $ | 29.65 | | | $ | 25.45 | |
| | | | | | | | | | | | | | | | | |
| Market Price | | $ | 29.40 | | | $ | 29.76 | | | $ | 29.65 | | | $ | 25.46 | |
See accompanying notes which are an integral part of these financial statements.
| Brookstone ETFs |
| STATEMENTS OF ASSETS AND LIABILITIES |
| May 31, 2024 |
| | | Brookstone | | | Brookstone | | | Brookstone | | | Brookstone | |
| | | Ultra-Short Bond | | | Active | | | Opportunities | | | Yield | |
| | | ETF | | | ETF | | | ETF | | | ETF | |
| ASSETS | | | | | | | | | | | | | | | | |
| Investment securities: | | | | | | | | | | | | | | | | |
| At cost | | $ | 61,062,011 | | | $ | 32,306,800 | | | $ | 31,137,583 | | | $ | 32,473,931 | |
| At value | | $ | 61,184,604 | | | $ | 35,974,899 | | | $ | 34,157,467 | | | $ | 33,484,090 | |
| Cash and cash equivalents | | | 1,789,738 | | | | 902,263 | | | | 887,888 | | | | 389,397 | |
| Dividends and interest receivable | | | 6,912 | | | | 3,598 | | | | 14,138 | | | | 7,278 | |
| TOTAL ASSETS | | | 62,981,254 | | | | 36,880,760 | | | | 35,059,493 | | | | 33,880,765 | |
| | | | | | | | | | | | | | | | | |
| LIABILITIES | | | | | | | | | | | | | | | | |
| Distributions Payable | | | 616,265 | | | | 131,584 | | | | 145,386 | | | | 716,058 | |
| Investment advisory fees payable | | | 36,328 | | | | 16,817 | | | | 16,561 | | | | 15,962 | |
| Payable to related parties | | | 17,037 | | | | 19,941 | | | | 20,466 | | | | 20,674 | |
| Accrued expenses and other liabilities | | | 53,404 | | | | 50,230 | | | | 50,524 | | | | 49,823 | |
| TOTAL LIABILITIES | | | 723,034 | | | | 218,572 | | | | 232,937 | | | | 802,517 | |
| NET ASSETS | | $ | 62,258,220 | | | $ | 36,662,188 | | | $ | 34,826,556 | | | $ | 33,078,248 | |
| | | | | | | | | | | | | | | | | |
| Composition of Net Assets: | | | | | | | | | | | | | | | | |
| Paid in capital ($0 par value, unlimited shares authorized) | | $ | 62,127,826 | | | $ | 32,984,375 | | | $ | 31,798,816 | | | $ | 32,270,407 | |
| Accumulated earnings (losses) | | | 130,394 | | | | 3,677,813 | | | | 3,027,740 | | | | 807,841 | |
| NET ASSETS | | $ | 62,258,220 | | | $ | 36,662,188 | | | $ | 34,826,556 | | | $ | 33,078,248 | |
| | | | | | | | | | | | | | | | | |
| Net Asset Value Per Share: | | | | | | | | | | | | | | | | |
| Shares: | | | | | | | | | | | | | | | | |
| Net Assets | | $ | 62,258,220 | | | $ | 36,662,188 | | | $ | 34,826,556 | | | $ | 33,078,248 | |
| Shares of beneficial interest outstanding | | | 2,470,000 | | | | 1,280,000 | | | | 1,230,000 | | | | 1,260,000 | |
| | | | | | | | | | | | | | | | | |
| Net asset value (Net Assets ÷ Shares Outstanding), offering and redemption price per share | | $ | 25.21 | | | $ | 28.64 | | | $ | 28.31 | | | $ | 26.25 | |
| | | | | | | | | | | | | | | | | |
| Market Price | | $ | 25.22 | | | $ | 28.65 | | | $ | 28.34 | | | $ | 26.25 | |
See accompanying notes which are an integral part of these financial statements.
| Brookstone ETFs |
| STATEMENTS OF OPERATIONS |
| For the Period Ended May 31, 2024 |
| | | Brookstone | | | Brookstone | | | Brookstone | | | Brookstone | |
| | | Dividend Stock | | | Growth Stock | | | Value Stock | | | Intermediate Bond | |
| | | ETF * | | | ETF ** | | | ETF ** | | | ETF ** | |
| INVESTMENT INCOME | | | | | | | | | | | | | | | | |
| Dividends | | $ | 1,871,937 | | | $ | 427,118 | | | $ | 842,627 | | | $ | 1,102,239 | |
| Interest | | | 19,667 | | | | 27,328 | | | | 17,119 | | | | 24,506 | |
| TOTAL INVESTMENT INCOME | | | 1,891,604 | | | | 454,446 | | | | 859,746 | | | | 1,126,745 | |
| | | | | | | | | | | | | | | | | |
| EXPENSES | | | | | | | | | | | | | | | | |
| Investment advisory fees | | | 236,935 | | | | 248,660 | | | | 248,577 | | | | 185,154 | |
| Administrative services fees | | | 44,810 | | | | 47,416 | | | | 46,746 | | | | 51,345 | |
| Professional fees | | | 16,505 | | | | 16,505 | | | | 16,505 | | | | 15,876 | |
| Legal fees | | | 14,204 | | | | 13,351 | | | | 13,407 | | | | 13,773 | |
| Transfer agent fees | | | 10,145 | | | | 10,310 | | | | 10,310 | | | | 10,310 | |
| Printing expenses | | | 10,056 | | | | 9,896 | | | | 10,049 | | | | 10,054 | |
| Custodian fees | | | 8,108 | | | | 8,206 | | | | 8,293 | | | | 8,553 | |
| Compliance officer fees | | | 7,602 | | | | 7,689 | | | | 7,692 | | | | 7,638 | |
| Trustees fees and expenses | | | 7,050 | | | | 7,055 | | | | 7,050 | | | | 7,273 | |
| Insurance expense | | | 1,692 | | | | 1,699 | | | | 1,507 | | | | 1,507 | |
| Other expenses | | | 8,839 | | | | 8,844 | | | | 8,844 | | | | 8,843 | |
| TOTAL EXPENSES | | | 365,946 | | | | 379,631 | | | | 378,980 | | | | 320,326 | |
| | | | | | | | | | | | | | | | | |
| Less: Contractual Fees waived and/or expenses reimbursed by the Adviser | | | (17,724 | ) | | | (14,170 | ) | | | (13,736 | ) | | | (48,296 | ) |
| TOTAL FEES WAIVED | | | (17,724 | ) | | | (14,170 | ) | | | (13,736 | ) | | | (48,296 | ) |
| | | | | | | | | | | | | | | | | |
| NET EXPENSES | | | 348,222 | | | | 365,461 | | | | 365,244 | | | | 272,030 | |
| NET INVESTMENT INCOME | | | 1,543,382 | | | | 88,985 | | | | 494,502 | | | | 854,715 | |
| | | | | | | | | | | | | | | | | |
| REALIZED AND UNREALIZED GAIN (LOSS) FROM INVESTMENTS | | | | | | | | | | | | | | | | |
| Net realized gain (loss) from investments | | | 678,453 | | | | 1,027,742 | | | | 2,012,261 | | | | (3,773 | ) |
| Net realized gain from in-kind redemptions | | | 395,615 | | | | 712,432 | | | | 754,463 | | | | — | |
| Net change in unrealized appreciation on investments | | | 9,300,159 | | | | 7,701,819 | | | | 6,927,097 | | | | 630,285 | |
| NET REALIZED AND UNREALIZED GAIN FROM INVESTMENTS | | | 10,374,227 | | | | 9,441,993 | | | | 9,693,821 | | | | 626,512 | |
| | | | | | | | | | | | | | | | | |
| NET INCREASE IN NET ASSETS RESULTING FROM OPERATIONS | | $ | 11,917,609 | | | $ | 9,530,978 | | | $ | 10,188,323 | | | $ | 1,481,227 | |
| * | Brookstone Dividend Stock ETF commenced operations on September 27, 2023. |
| ** | Brookstone Growth Stock ETF, Brookstone Value Stock ETF and Brookstone Intermediate Bond ETF commenced operations on September 26, 2023. |
See accompanying notes which are an integral part of these financial statements.
| Brookstone ETFs |
| STATEMENTS OF OPERATIONS |
| For the Period Ended May 31, 2024 |
| | | Brookstone | | | Brookstone | | | Brookstone | | | Brookstone | |
| | | Ultra-Short Bond | | | Active | | | Opportunities | | | Yield | |
| | | ETF * | | | ETF ** | | | ETF ** | | | ETF ** | |
| INVESTMENT INCOME | | | | | | | | | | | | | | | | |
| Dividends | | $ | 1,577,529 | | | $ | 432,757 | | | $ | 450,527 | | | $ | 1,725,907 | |
| Interest | | | 37,283 | | | | 19,978 | | | | 19,167 | | | | 37,145 | |
| TOTAL INVESTMENT INCOME | | | 1,614,812 | | | | 452,735 | | | | 469,694 | | | | 1,763,052 | |
| | | | | | | | | | | | | | | | | |
| EXPENSES | | | | | | | | | | | | | | | | |
| Investment advisory fees | | | 218,781 | | | | 121,281 | | | | 115,037 | | | | 112,454 | |
| Administrative services fees | | | 51,665 | | | | 41,106 | | | | 40,903 | | | | 40,786 | |
| Professional fees | | | 15,876 | | | | 15,867 | | | | 15,867 | | | | 15,867 | |
| Legal fees | | | 15,017 | | | | 15,907 | | | | 14,894 | | | | 14,894 | |
| Transfer agent fees | | | 10,310 | | | | 10,272 | | | | 10,272 | | | | 10,272 | |
| Printing expenses | | | 9,865 | | | | 9,860 | | | | 9,860 | | | | 9,860 | |
| Custodian fees | | | 8,315 | | | | 8,455 | | | | 8,521 | | | | 8,521 | |
| Compliance officer fees | | | 7,668 | | | | 7,054 | | | | 7,065 | | | | 7,063 | |
| Trustees fees and expenses | | | 7,331 | | | | 7,300 | | | | 7,299 | | | | 7,299 | |
| Insurance expense | | | 1,507 | | | | 1,500 | | | | 1,500 | | | | 1,499 | |
| Other expenses | | | 8,844 | | | | 8,933 | | | | 8,933 | | | | 8,933 | |
| TOTAL EXPENSES | | | 355,179 | | | | 247,535 | | | | 240,151 | | | | 237,448 | |
| | | | | | | | | | | | | | | | | |
| Less: Contractual Fees waived and/or expenses reimbursed by the Adviser | | | (33,803 | ) | | | (69,341 | ) | | | (71,130 | ) | | | (72,230 | ) |
| TOTAL FEES WAIVED | | | (33,803 | ) | | | (69,341 | ) | | | (71,130 | ) | | | (72,230 | ) |
| | | | | | | | | | | | | | | | | |
| NET EXPENSES | | | 321,376 | | | | 178,194 | | | | 169,021 | | | | 165,218 | |
| NET INVESTMENT INCOME | | | 1,293,436 | | | | 274,541 | | | | 300,673 | | | | 1,597,834 | |
| | | | | | | | | | | | | | | | | |
| REALIZED AND UNREALIZED GAIN (LOSS) FROM INVESTMENTS | | | | | | | | | | | | | | | | |
| Net realized loss from investments | | | — | | | | — | | | | — | | | | (208,107 | ) |
| Net realized gain from in-kind redemptions | | | 23,807 | | | | 125,372 | | | | 188,437 | | | | 135,566 | |
| Net change in unrealized appreciation on investments | | | 122,593 | | | | 3,668,099 | | | | 3,019,884 | | | | 1,010,159 | |
| NET REALIZED AND UNREALIZED GAIN FROM INVESTMENTS | | | 146,400 | | | | 3,793,471 | | | | 3,208,321 | | | | 937,618 | |
| | | | | | | | | | | | | | | | | |
| NET INCREASE IN NET ASSETS RESULTING FROM OPERATIONS | | $ | 1,439,836 | | | $ | 4,068,012 | | | $ | 3,508,994 | | | $ | 2,535,452 | |
| * | Brookstone Ultra-Short Bond ETF commenced operations on September 26, 2023. |
| ** | Brookstone Active ETF, Brookstone Opportunities ETF and Brookstone Yield ETF commenced operations on September 27, 2023. |
See accompanying notes which are an integral part of these financial statements.
| Brookstone ETFs |
| STATEMENTS OF CHANGES IN NET ASSETS |
| For the Period Ended May 31, 2024 |
| | | Brookstone | | | Brookstone | | | Brookstone | | | Brookstone | |
| | | Dividend Stock | | | Growth Stock | | | Value Stock | | | Intermediate Bond | |
| | | ETF * | | | ETF ** | | | ETF ** | | | ETF ** | |
| FROM OPERATIONS | | | | | | | | | | | | | | | | |
| Net investment income | | $ | 1,543,382 | | | $ | 88,985 | | | $ | 494,502 | | | $ | 854,715 | |
| Net realized gain (loss) from investments | | | 678,453 | | | | 1,027,742 | | | | 2,012,261 | | | | (3,773 | ) |
| Net realized gain from in-kind redemptions | | | 395,615 | | | | 712,432 | | | | 754,463 | | | | — | |
| Net change in unrealized appreciation on investments | | | 9,300,159 | | | | 7,701,819 | | | | 6,927,097 | | | | 630,285 | |
| Net increase in net assets resulting from operations | | | 11,917,609 | | | | 9,530,978 | | | | 10,188,323 | | | | 1,481,227 | |
| | | | | | | | | | | | | | | | | |
| DISTRIBUTIONS TO SHAREHOLDERS | | | | | | | | | | | | | | | | |
| Total distributions paid | | | (1,526,556 | ) | | | (72,992 | ) | | | (491,550 | ) | | | (857,320 | ) |
| Total distributions to shareholders | | | (1,526,556 | ) | | | (72,992 | ) | | | (491,550 | ) | | | (857,320 | ) |
| | | | | | | | | | | | | | | | | |
| FROM SHARES OF BENEFICIAL INTEREST | | | | | | | | | | | | | | | | |
| Proceeds from shares sold | | | 68,526,421 | | | | 74,437,562 | | | | 72,290,878 | | | | 54,344,912 | |
| Cost of shares redeemed | | | (3,293,105 | ) | | | (4,562,726 | ) | | | (5,509,192 | ) | | | — | |
| Transaction Fees (Note 5) | | | 10,500 | | | | 10,500 | | | | 9,060 | | | | 5,000 | |
| Net increase in net assets from shares of beneficial interest | | | 65,243,816 | | | | 69,885,336 | | | | 66,790,746 | | | | 54,349,912 | |
| | | | | | | | | | | | | | | | | |
| TOTAL INCREASE IN NET ASSETS | | | 75,634,869 | | | | 79,343,322 | | | | 76,487,519 | | | | 54,973,819 | |
| | | | | | | | | | | | | | | | | |
| NET ASSETS | | | | | | | | | | | | | | | | |
| Beginning of Period | | | — | | | | — | | | | — | | | | — | |
| End of Period | | $ | 75,634,869 | | | $ | 79,343,322 | | | $ | 76,487,519 | | | $ | 54,973,819 | |
| | | | | | | | | | | | | | | | | |
| SHARE ACTIVITY | | | | | | | | | | | | | | | | |
| Shares Sold | | | 2,690,000 | | | | 2,830,000 | | | | 2,770,000 | | | | 2,160,000 | |
| Shares Redeemed | | | (120,000 | ) | | | (160,000 | ) | | | (190,000 | ) | | | — | |
| Net increase in shares of beneficial interest outstanding | | | 2,570,000 | | | | 2,670,000 | | | | 2,580,000 | | | | 2,160,000 | |
| * | Brookstone Dividend Stock ETF commenced operations on September 27, 2023. |
| ** | Brookstone Growth Stock ETF, Brookstone Value Stock ETF and Brookstone Intermediate Bond ETF commenced operations on September 26, 2023. |
See accompanying notes which are an integral part of these financial statements.
| Brookstone ETFs |
| STATEMENTS OF CHANGES IN NET ASSETS |
| For the Period Ended May 31, 2024 |
| | | Brookstone | | | Brookstone | | | Brookstone | | | Brookstone | |
| | | Ultra-Short Bond | | | Active | | | Opportunities | | | Yield | |
| | | ETF * | | | ETF ** | | | ETF ** | | | ETF ** | |
| FROM OPERATIONS | | | | | | | | | | | | | | | | |
| Net investment income | | $ | 1,293,436 | | | $ | 274,541 | | | $ | 300,673 | | | $ | 1,597,834 | |
| Net realized loss from investments | | | — | | | | — | | | | — | | | | (208,107 | ) |
| Net realized gain from in-kind redemptions | | | 23,807 | | | | 125,372 | | | | 188,437 | | | | 135,566 | |
| Net change in unrealized appreciation on investments | | | 122,593 | | | | 3,668,099 | | | | 3,019,884 | | | | 1,010,159 | |
| Net increase in net assets resulting from operations | | | 1,439,836 | | | | 4,068,012 | | | | 3,508,994 | | | | 2,535,452 | |
| | | | | | | | | | | | | | | | | |
| DISTRIBUTIONS TO SHAREHOLDERS | | | | | | | | | | | | | | | | |
| Total distributions paid | | | (1,296,360 | ) | | | (276,252 | ) | | | (302,253 | ) | | | (1,601,515 | ) |
| Total distributions to shareholders | | | (1,296,360 | ) | | | (276,252 | ) | | | (302,253 | ) | | | (1,601,515 | ) |
| | | | | | | | | | | | | | | | | |
| FROM SHARES OF BENEFICIAL INTEREST | | | | | | | | | | | | | | | | |
| Proceeds from shares sold | | | 70,931,046 | | | | 34,221,992 | | | | 33,531,720 | | | | 34,004,547 | |
| Cost of shares redeemed | | | (8,824,302 | ) | | | (1,357,564 | ) | | | (1,916,905 | ) | | | (1,865,486 | ) |
| Transaction Fees (Note 5) | | | 8,000 | | | | 6,000 | | | | 5,000 | | | | 5,250 | |
| Net increase in net assets from shares of beneficial interest | | | 62,114,744 | | | | 32,870,428 | | | | 31,619,815 | | | | 32,144,311 | |
| | | | | | | | | | | | | | | | | |
| TOTAL INCREASE IN NET ASSETS | | | 62,258,220 | | | | 36,662,188 | | | | 34,826,556 | | | | 33,078,248 | |
| | | | | | | | | | | | | | | | | |
| NET ASSETS | | | | | | | | | | | | | | | | |
| Beginning of Period | | | — | | | | — | | | | — | | | | — | |
| End of Period | | $ | 62,258,220 | | | $ | 36,662,188 | | | $ | 34,826,556 | | | $ | 33,078,248 | |
| | | | | | | | | | | | | | | | | |
| SHARE ACTIVITY | | | | | | | | | | | | | | | | |
| Shares Sold | | | 2,820,000 | | | | 1,330,000 | | | | 1,300,000 | | | | 1,330,000 | |
| Shares Redeemed | | | (350,000 | ) | | | (50,000 | ) | | | (70,000 | ) | | | (70,000 | ) |
| Net increase in shares of beneficial interest outstanding | | | 2,470,000 | | | | 1,280,000 | | | | 1,230,000 | | | | 1,260,000 | |
| * | Brookstone Ultra-Short Bond ETF commenced operations on September 26, 2023. |
| ** | Brookstone Active ETF, Brookstone Opportunities ETF and Brookstone Yield ETF commenced operations on September 27, 2023. |
See accompanying notes which are an integral part of these financial statements.
| Brookstone ETFs |
| FINANCIAL HIGHLIGHTS |
Per Share Data and Ratios for a Share of Beneficial Interest Outstanding Throughout the Period Presented
| | Brookstone Dividend Stock ETF | |
| | | |
| | | For the Period Ended | |
| | | May 31, 2024 (1) | |
| Net asset value, beginning of period | | $ | 25.00 | |
| Activity from investment operations: | | | | |
| Net investment income (2) | | | 0.79 | |
| Net realized and unrealized gain on investments | | | 4.27 | |
| Total from investment operations | | | 5.06 | |
| Less distributions from: | | | | |
| Net investment income | | | (0.63 | ) |
| Total distributions | | | (0.63 | ) |
| Net asset value, end of period | | $ | 29.43 | |
| Market price, end of period | | $ | 29.40 | |
| Total return (3) | | | 20.39 | % (6) |
| Total return - Market price (4) | | | 20.27 | % (6) |
| Net assets, at end of period (000s) | | $ | 75,635 | |
| Ratio of gross expenses to average net assets | | | 1.00 | % (7) |
| Ratio of net expenses to average net assets | | | 0.95 | % (7) |
| Ratio of net investment income to average net assets | | | 4.21 | % (7) |
| Portfolio Turnover Rate (5) | | | 15 | % (6) |
| (1) | The Brookstone Dividend Stock ETF commenced operations on September 27, 2023. |
| (2) | Per share amounts calculated using the average shares method. |
| (3) | Total return is calculated assuming a purchase of shares at net asset value on the first day and a sale at net asset value on the last day of the period. Distributions are assumed, for the purpose of this calculation, to be reinvested at the ex-dividend date net asset value per share on their respective payment dates. |
| (4) | Market price returns are calculated using the closing price and account for distributions from the Fund. Distributions are assumed, for the purpose of this calculation, to be reinvested at the ex-dividend date market price per share on their respective payment dates. |
| (5) | Portfolio turnover rate excludes portfolio securities received or delivered as a result of processing capital share transactions in Creation Units. (See Note 5) |
See accompanying notes which are an integral part of these financial statements.
| Brookstone ETFs |
| FINANCIAL HIGHLIGHTS |
Per Share Data and Ratios for a Share of Beneficial Interest Outstanding Throughout the Period Presented
| | Brookstone Growth Stock ETF | |
| | | |
| | | For the Period Ended | |
| | | May 31, 2024 (1) | |
| Net asset value, beginning of period | | $ | 25.00 | |
| Activity from investment operations: | | | | |
| Net investment income (2) | | | 0.05 | |
| Net realized and unrealized gain on investments | | | 4.70 | |
| Total from investment operations | | | 4.75 | |
| Less distributions from: | | | | |
| Net investment income | | | (0.03 | ) |
| Total distributions | | | (0.03 | ) |
| Net asset value, end of period | | $ | 29.72 | |
| Market price, end of period | | $ | 29.76 | |
| Total return (3) | | | 19.03 | % (6) |
| Total return - Market price (4) | | | 19.19 | % (6) |
| Net assets, at end of period (000s) | | $ | 79,343 | |
| Ratio of gross expenses to average net assets | | | 0.99 | % (7) |
| Ratio of net expenses to average net assets | | | 0.95 | % (7) |
| Ratio of net investment income to average net assets | | | 0.23 | % (7) |
| Portfolio Turnover Rate (5) | | | 26 | % (6) |
| (1) | The Brookstone Growth Stock ETF commenced operations on September 26, 2023. |
| (2) | Per share amounts calculated using the average shares method. |
| (3) | Total return is calculated assuming a purchase of shares at net asset value on the first day and a sale at net asset value on the last day of the period. Distributions are assumed, for the purpose of this calculation, to be reinvested at the ex-dividend date net asset value per share on their respective payment dates. |
| (4) | Market price returns are calculated using the closing price and account for distributions from the Fund. Distributions are assumed, for the purpose of this calculation, to be reinvested at the ex-dividend date market price per share on their respective payment dates. |
| (5) | Portfolio turnover rate excludes portfolio securities received or delivered as a result of processing capital share transactions in Creation Units. (See Note 5) |
See accompanying notes which are an integral part of these financial statements.
| Brookstone ETFs |
| FINANCIAL HIGHLIGHTS |
Per Share Data and Ratios for a Share of Beneficial Interest Outstanding Throughout the Period Presented
| | Brookstone Value Stock ETF | |
| | | |
| | | For the Period Ended | |
| | | May 31, 2024 (1) | |
| Net asset value, beginning of period | | $ | 25.00 | |
| Activity from investment operations: | | | | |
| Net investment income (2) | | | 0.25 | |
| Net realized and unrealized gain on investments | | | 4.60 | |
| Total from investment operations | | | 4.85 | |
| Less distributions from: | | | | |
| Net investment income | | | (0.20 | ) |
| Total distributions | | | (0.20 | ) |
| Net asset value, end of period | | $ | 29.65 | |
| Market price, end of period | | $ | 29.65 | |
| Total return (3) | | | 19.43 | % (6) |
| Total return - Market price (4) | | | 19.43 | % (6) |
| Net assets, at end of period (000s) | | $ | 76,488 | |
| Ratio of gross expenses to average net assets | | | 0.99 | % (7) |
| Ratio of net expenses to average net assets | | | 0.95 | % (7) |
| Ratio of net investment income to average net assets | | | 1.29 | % (7) |
| Portfolio Turnover Rate (5) | | | 25 | % (6) |
| (1) | The Brookstone Value Stock ETF commenced operations on September 26, 2023. |
| (2) | Per share amounts calculated using the average shares method. |
| (3) | Total return is calculated assuming a purchase of shares at net asset value on the first day and a sale at net asset value on the last day of the period. Distributions are assumed, for the purpose of this calculation, to be reinvested at the ex-dividend date net asset value per share on their respective payment dates. |
| (4) | Market price returns are calculated using the closing price and account for distributions from the Fund. Distributions are assumed, for the purpose of this calculation, to be reinvested at the ex-dividend date market price per share on their respective payment dates. |
| (5) | Portfolio turnover rate excludes portfolio securities received or delivered as a result of processing capital share transactions in Creation Units. (See Note 5) |
See accompanying notes which are an integral part of these financial statements.
| Brookstone ETFs |
| FINANCIAL HIGHLIGHTS |
Per Share Data and Ratios for a Share of Beneficial Interest Outstanding Throughout the Period Presented
| | Brookstone Intermediate Bond ETF | |
| | | |
| | | For the Period Ended | |
| | | May 31, 2024 (1) | |
| Net asset value, beginning of period | | $ | 25.00 | |
| Activity from investment operations: | | | | |
| Net investment income (2)(6) | | | 0.52 | |
| Net realized and unrealized gain on investments | | | 0.35 | |
| Total from investment operations | | | 0.87 | |
| Less distributions from: | | | | |
| Net investment income | | | (0.42 | ) |
| Total distributions | | | (0.42 | ) |
| Net asset value, end of period | | $ | 25.45 | |
| Market price, end of period | | $ | 25.46 | |
| Total return (3) | | | 3.50 | % (8) |
| Total return - Market price (4) | | | 3.54 | % (8) |
| Net assets, at end of period (000s) | | $ | 54,974 | |
| Ratio of gross expenses to average net assets (6) | | | 1.12 | % (9) |
| Ratio of net expenses to average net assets (6) | | | 0.95 | % (9) |
| Ratio of net investment income to average net assets (5) | | | 2.98 | % (9) |
| Portfolio Turnover Rate (7) | | | 79 | % (8) |
| (1) | The Brookstone Intermediate Bond ETF commenced operations on September 26, 2023. |
| (2) | Per share amounts calculated using the average shares method. |
| (3) | Total return is calculated assuming a purchase of shares at net asset value on the first day and a sale at net asset value on the last day of the period. Distributions are assumed, for the purpose of this calculation, to be reinvested at the ex-dividend date net asset value per share on their respective payment dates. |
| (4) | Market price returns are calculated using the closing price and account for distributions from the Fund. Distributions are assumed, for the purpose of this calculation, to be reinvested at the ex-dividend date market price per share on their respective payment dates. |
| (5) | Recognition of net investment income by the Fund is affected by the timing of the declaration of dividends by the underlying investment companies in which the Fund invests. |
| (6) | Does not include the Fund’s share of the expenses of the underlying investment companies in which the Fund invests. |
| (7) | Portfolio turnover rate excludes portfolio securities received or delivered as a result of processing capital share transactions in Creation Units. (See Note 5) |
See accompanying notes which are an integral part of these financial statements.
| Brookstone ETFs |
| FINANCIAL HIGHLIGHTS |
Per Share Data and Ratios for a Share of Beneficial Interest Outstanding Throughout the Period Presented
| | Brookstone Ultra-Short Bond ETF | |
| | | |
| | | For the Period Ended | |
| | | May 31, 2024 (1) | |
| Net asset value, beginning of period | | $ | 25.00 | |
| Activity from investment operations: | | | | |
| Net investment income (2)(6) | | | 0.66 | |
| Net realized and unrealized gain on investments | | | 0.09 | |
| Total from investment operations | | | 0.75 | |
| Less distributions from: | | | | |
| Net investment income | | | (0.54 | ) |
| Total distributions | | | (0.54 | ) |
| Net asset value, end of period | | $ | 25.21 | |
| Market price, end of period | | $ | 25.22 | |
| Total return (3) | | | 3.01 | % (8) |
| Total return - Market price (4) | | | 3.05 | % (8) |
| Net assets, at end of period (000s) | | $ | 62,258 | |
| Ratio of gross expenses to average net assets (6) | | | 1.05 | % (9) |
| Ratio of net expenses to average net assets (6) | | | 0.95 | % (9) |
| Ratio of net investment income to average net assets (5) | | | 3.82 | % (9) |
| Portfolio Turnover Rate (7) | | | 0 | % (8) |
| (1) | The Brookstone Ultra-Short Bond ETF commenced operations on September 26, 2023. |
| (2) | Per share amounts calculated using the average shares method. |
| (3) | Total return is calculated assuming a purchase of shares at net asset value on the first day and a sale at net asset value on the last day of the period. Distributions are assumed, for the purpose of this calculation, to be reinvested at the ex-dividend date net asset value per share on their respective payment dates. |
| (4) | Market price returns are calculated using the closing price and account for distributions from the Fund. Distributions are assumed, for the purpose of this calculation, to be reinvested at the ex-dividend date market price per share on their respective payment dates. |
| (5) | Recognition of net investment income by the Fund is affected by the timing of the declaration of dividends by the underlying investment companies in which the Fund invests. |
| (6) | Does not include the Fund’s share of the expenses of the underlying investment companies in which the Fund invests. |
| (7) | Portfolio turnover rate excludes portfolio securities received or delivered as a result of processing capital share transactions in Creation Units. (See Note 5) |
See accompanying notes which are an integral part of these financial statements.
| Brookstone ETFs |
| FINANCIAL HIGHLIGHTS |
Per Share Data and Ratios for a Share of Beneficial Interest Outstanding Throughout the Period Presented
| | Brookstone Active ETF | |
| | | |
| | | For the Period Ended | |
| | | May 31, 2024 (1) | |
| Net asset value, beginning of period | | $ | 25.00 | |
| Activity from investment operations: | | | | |
| Net investment income (2)(6) | | | 0.27 | |
| Net realized and unrealized gain on investments | | | 3.60 | |
| Total from investment operations | | | 3.87 | |
| Less distributions from: | | | | |
| Net investment income | | | (0.23 | ) |
| Total distributions | | | (0.23 | ) |
| Net asset value, end of period | | $ | 28.64 | |
| Market price, end of period | | $ | 28.65 | |
| Total return (3) | | | 15.49 | % (8) |
| Total return - Market price (4) | | | 15.53 | % (8) |
| Net assets, at end of period (000s) | | $ | 36,662 | |
| Ratio of gross expenses to average net assets (6) | | | 1.32 | % (9) |
| Ratio of net expenses to average net assets (6) | | | 0.95 | % (9) |
| Ratio of net investment income to average net assets (5) | | | 1.46 | % (9) |
| Portfolio Turnover Rate (7) | | | 0 | % (8) |
| (1) | The Brookstone Active ETF commenced operations on September 27, 2023. |
| (2) | Per share amounts calculated using the average shares method. |
| (3) | Total return is calculated assuming a purchase of shares at net asset value on the first day and a sale at net asset value on the last day of the period. Distributions are assumed, for the purpose of this calculation, to be reinvested at the ex-dividend date net asset value per share on their respective payment dates. |
| (4) | Market price returns are calculated using the closing price and account for distributions from the Fund. Distributions are assumed, for the purpose of this calculation, to be reinvested at the ex-dividend date market price per share on their respective payment dates. |
| (5) | Recognition of net investment income by the Fund is affected by the timing of the declaration of dividends by the underlying investment companies in which the Fund invests. |
| (6) | Does not include the Fund’s share of the expenses of the underlying investment companies in which the Fund invests. |
| (7) | Portfolio turnover rate excludes portfolio securities received or delivered as a result of processing capital share transactions in Creation Units. (See Note 5) |
See accompanying notes which are an integral part of these financial statements.
| Brookstone ETFs |
| FINANCIAL HIGHLIGHTS |
Per Share Data and Ratios for a Share of Beneficial Interest Outstanding Throughout the Period Presented
| | Brookstone Opportunities ETF | |
| | | |
| | | For the Period Ended | |
| | | May 31, 2024 (1) | |
| Net asset value, beginning of period | | $ | 25.00 | |
| Activity from investment operations: | | | | |
| Net investment income (2)(6) | | | 0.31 | |
| Net realized and unrealized gain on investments | | | 3.26 | |
| Total from investment operations | | | 3.57 | |
| Less distributions from: | | | | |
| Net investment income | | | (0.26 | ) |
| Total distributions | | | (0.26 | ) |
| Net asset value, end of period | | $ | 28.31 | |
| Market price, end of period | | $ | 28.34 | |
| Total return (3) | | | 14.31 | % (8) |
| Total return - Market price (4) | | | 14.43 | % (8) |
| Net assets, at end of period (000s) | | $ | 34,827 | |
| Ratio of gross expenses to average net assets (6) | | | 1.35 | % (9) |
| Ratio of net expenses to average net assets (6) | | | 0.95 | % (9) |
| Ratio of net investment income to average net assets (5) | | | 1.69 | % (9) |
| Portfolio Turnover Rate (7) | | | 0 | % (8) |
| (1) | The Brookstone Opportunities ETF commenced operations on September 27, 2023. |
| (2) | Per share amounts calculated using the average shares method. |
| (3) | Total return is calculated assuming a purchase of shares at net asset value on the first day and a sale at net asset value on the last day of the period. Distributions are assumed, for the purpose of this calculation, to be reinvested at the ex-dividend date net asset value per share on their respective payment dates. |
| (4) | Market price returns are calculated using the closing price and account for distributions from the Fund. Distributions are assumed, for the purpose of this calculation, to be reinvested at the ex-dividend date market price per share on their respective payment dates. |
| (5) | Recognition of net investment income by the Fund is affected by the timing of the declaration of dividends by the underlying investment companies in which the Fund invests. |
| (6) | Does not include the Fund’s share of the expenses of the underlying investment companies in which the Fund invests. |
| (7) | Portfolio turnover rate excludes portfolio securities received or delivered as a result of processing capital share transactions in Creation Units. (See Note 5) |
See accompanying notes which are an integral part of these financial statements.
| Brookstone ETFs |
| FINANCIAL HIGHLIGHTS |
Per Share Data and Ratios for a Share of Beneficial Interest Outstanding Throughout the Period Presented
| | Brookstone Yield ETF | |
| | | |
| | | For the Period Ended | |
| | | May 31, 2024 (1) | |
| Net asset value, beginning of period | | $ | 25.00 | |
| Activity from investment operations: | | | | |
| Net investment income (2)(6) | | | 1.64 | |
| Net realized and unrealized gain on investments | | | 0.95 | |
| Total from investment operations | | | 2.59 | |
| Less distributions from: | | | | |
| Net investment income | | | (1.34 | ) |
| Net return of capital | | | — | |
| Total distributions | | | (1.34 | ) |
| Paid-in-Capital From Redemption Fees | | | — | |
| Net asset value, end of period | | $ | 26.25 | |
| Market price, end of period | | $ | 26.25 | |
| Total return (3) | | | 10.45 | % (8) |
| Total return - Market price (4) | | | 9.13 | % (8) |
| Net assets, at end of period (000s) | | $ | 33,078 | |
| Ratio of gross expenses to average net assets (6) | | | 1.37 | % (9) |
| Ratio of net expenses to average net assets (6) | | | 0.95 | % (9) |
| Ratio of net investment income to average net assets (5) | | | 9.19 | % (9) |
| Portfolio Turnover Rate (7) | | | 77 | % (8) |
| * | Per share amount represents less than $0.01 per share. |
| (1) | The Brookstone Yield ETF commenced operations on September 27, 2023. |
| (2) | Per share amounts calculated using the average shares method. |
| (3) | Total return is calculated assuming a purchase of shares at net asset value on the first day and a sale at net asset value on the last day of the period. Distributions are assumed, for the purpose of this calculation, to be reinvested at the ex-dividend date net asset value per share on their respective payment dates. |
| (4) | Market price returns are calculated using the closing price and account for distributions from the Fund. Distributions are assumed, for the purpose of this calculation, to be reinvested at the ex-dividend date market price per share on their respective payment dates. |
| (5) | Recognition of net investment income by the Fund is affected by the timing of the declaration of dividends by the underlying investment companies in which the Fund invests. |
| (6) | Does not include the Fund’s share of the expenses of the underlying investment companies in which the Fund invests. |
| (7) | Portfolio turnover rate excludes portfolio securities received or delivered as a result of processing capital share transactions in Creation Units. |
See accompanying notes which are an integral part of these financial statements.
Brookstone ETFs
NOTES TO FINANCIAL STATEMENTS
May 31, 2024
The Brookstone Dividend Stock ETF (“BAMD”), Brookstone Growth Stock ETF (“BAMG”), Brookstone Value Stock ETF (“BAMV”), Brookstone Intermediate Bond ETF (“BAMB”), Brookstone Ultra-Short Bond ETF (“BAMU”), Brookstone Active ETF (“BAMA”), Brookstone Opportunities ETF (“BAMO”) and Brookstone Yield ETF (“BAMY”) (each a “Fund” and collectively the “Funds”) are each a diversified series of Northern Lights Fund Trust IV (the “Trust”), a statutory trust organized under the laws of the State of Delaware on June 2, 2015, which is registered under the Investment Company Act of 1940, as amended (the “1940 Act”), as an open-end management investment company. BAMB, BAMU, BAMA, BAMO and BAMY are each a “fund of funds”, in that each Fund will generally invest in other investment companies.
BAMD’s investment objective seeks to provide income and capital appreciation. BAMG and BAMV’s investment objective seeks to provide capital appreciation. BAMB and BAMU’s investment objective seeks to provide current income. BAMA and BAMO’s investment objective seeks to provide total return. BAMY’s investment objective seeks to provide current income. BAMD, BAMA, BAMO and BAMY commenced operations on September 27, 2023. BAMG, BAMV, BAMB and BAMU commenced operations on September 26, 2023.
| 2. | SIGNIFICANT ACCOUNTING POLICIES |
The following is a summary of significant accounting policies followed by the Funds in preparation of their financial statements. These policies are in conformity with accounting principles generally accepted in the United States of America (“GAAP”). The preparation of financial statements requires management to make estimates and assumptions that affect the reported amounts of assets and liabilities and disclosure of contingent assets and liabilities at the date of the financial statements and the reported amounts of increases and decreases in net assets from operations during the reporting period. Actual results could differ from those estimates. The Funds are investment companies and accordingly follow the investment company accounting and reporting guidance of the Financial Accounting Standards Board (“FASB”) Accounting Standards Codification Topic 946 “Financial Services – Investment Companies”, including Accounting Standards Update 2013-08.
Securities Valuation – The Funds record their investments at fair value. Securities listed on an exchange are valued at the last reported sale price at the close of the regular trading session of the exchange on the business day the value is being determined, or in the case of securities listed on NASDAQ at the NASDAQ Official Closing Price. In the absence of a sale, such securities shall be valued at the mean between the current bid and ask prices on the day of valuation.
Valuation of Underlying Funds – The Funds may invest in portfolios of open-end or closed-end investment companies (the “investment companies”). Investment companies are valued at their respective net asset values as reported by such investment companies. Mutual funds value securities in their portfolios for which market quotations are readily available at their market values (generally the last reported sale price) and all other securities and assets at their fair value to the methods established by the board of directors of the open-end funds. Exchange-traded funds (“ETFs”) are valued at the last
Brookstone ETFs
NOTES TO FINANCIAL STATEMENTS (Continued)
May 31, 2024
reported price or official closing price. The shares of many closed-end investment companies and ETFs, after their initial public offering, frequently trade at a price per share, which is different than the net asset value per share. The difference represents a market premium or market discount of such shares. There can be no assurances that the market discount or market premium on shares of any closed-end investment company or ETF purchased by the Funds will not change.
The Funds may hold investments, such as private placements, interests in commodity pools, other non-traded securities or temporarily illiquid securities, for which market quotations are not readily available or are determined to be unreliable. These securities will be valued at their fair market value as determined using the “fair value” procedures approved by the Board of Trustees (the “Board”). The Board has designated the adviser as it’s “Valuation Designee” for execution of these procedures. The adviser may also enlist third party consultants such as an audit firm or financial officer of a security issuer on an as-needed basis to assist in determining a security-specific fair value.
Fair Valuation Process – Applicable investments are valued pursuant to valuation procedures established by the Board. For example, fair value determinations are required for the following securities: (i) securities for which market quotations are insufficient or not readily available on a particular business day (including securities for which there is a short and temporary lapse in the provision of a price by the regular pricing source); (ii) securities for which, in the judgment of the Valuation Designee, the prices or values available do not represent the fair value of the instrument. Factors which may cause the Valuation Designee to make such a judgment include, but are not limited to, the following: only a bid price or an asked price is available; the spread between bid and asked prices is substantial; the frequency of sales; the thinness of the market; the size of reported trades; and actions of the securities markets, such as the suspension or limitation of trading; (iii) securities determined to be illiquid; (iv) securities with respect to which an event that will affect the value thereof has occurred (a “significant event”) since the closing prices were established on the principal exchange on which they are traded, but prior to a Fund’s calculation of its net asset value. Specifically, interests in commodity pools or managed futures pools are valued on a daily basis by reference to the closing market prices of each futures contract or other asset held by a pool, as adjusted for pool expenses. Restricted or illiquid investments, such as private placements or non-traded securities are valued based upon the current bid for the security from two or more independent dealers or other parties reasonably familiar with the facts and circumstances of the security (who should take into consideration all relevant factors as may be appropriate under the circumstances). If the Valuation Designee is unable to obtain a current bid from such independent dealers or other independent parties, the adviser shall determine the fair value of such security using the following factors: (i) the type of security; (ii) the cost at date of purchase; (iii) the size and nature of a Fund’s holdings; (iv) the discount from market value of unrestricted securities of the same class at the time of purchase and subsequent thereto; (v) information as to any transactions or offers with respect to the security; (vi) the nature and duration of restrictions on disposition of the security and the existence of any registration rights; (vii) how the yield of the security compares to similar securities of companies of similar or equal creditworthiness; (viii) the level of recent trades of similar or comparable securities; (ix) the liquidity characteristics of the security; (x) current market conditions; and (xi) the market value of any securities into which the security is convertible or exchangeable.
Brookstone ETFs
NOTES TO FINANCIAL STATEMENTS (Continued)
May 31, 2024
The Funds utilize various methods to measure the fair value of all of their investments on a recurring basis. GAAP establishes a hierarchy that prioritizes inputs to valuation methods. The three levels of input are:
Level 1 – Unadjusted quoted prices in active markets for identical assets and liabilities that the Funds have the ability to access.
Level 2 – Observable inputs other than quoted prices included in Level 1 that are observable for the asset or liability, either directly or indirectly. These inputs may include quoted prices for the identical instrument in an inactive market, prices for similar instruments, interest rates, prepayment speeds, credit risk, yield curves, default rates and similar data.
Level 3 – Unobservable inputs for the asset or liability, to the extent relevant observable inputs are not available, representing the Funds’ own assumptions about the assumptions a market participant would use in valuing the asset or liability, and would be based on the best information available.
The availability of observable inputs can vary from security to security and is affected by a wide variety of factors, including, for example, the type of security, whether the security is new and not yet established in the marketplace, the liquidity of markets, and other characteristics particular to the security. To the extent that valuation is based on models or inputs that are less observable or unobservable in the market, the determination of fair value requires more judgment. Accordingly, the degree of judgment exercised in determining fair value is greatest for instruments categorized in Level 3.
The inputs used to measure fair value may fall into different levels of the fair value hierarchy. In such cases, for disclosure purposes, the level in the fair value hierarchy within which the fair value measurement falls in its entirety, is determined based on the lowest level input that is significant to the fair value measurement in its entirety.
The inputs or methodology used for valuing securities are not necessarily an indication of the risk associated with investing in those securities. The following tables summarize the inputs used as of May 31, 2024 for the Funds’ assets measured at fair value:
BAMD
| Assets * | | Level 1 | | | Level 2 | | | Level 3 | | | Total | |
| Common Stocks | | $ | 75,143,443 | | | $ | — | | | $ | — | | | $ | 75,143,443 | |
| Total | | $ | 75,143,443 | | | $ | — | | | $ | — | | | $ | 75,143,443 | |
BAMG
| Assets * | | Level 1 | | | Level 2 | | | Level 3 | | | Total | |
| Common Stocks | | $ | 78,347,778 | | | $ | — | | | $ | — | | | $ | 78,347,778 | |
| Total | | $ | 78,347,778 | | | $ | — | | | $ | — | | | $ | 78,347,778 | |
Brookstone ETFs
NOTES TO FINANCIAL STATEMENTS (Continued)
May 31, 2024
BAMV
| Assets * | | Level 1 | | | Level 2 | | | Level 3 | | | Total | |
| Common Stocks | | $ | 75,763,381 | | | $ | — | | | $ | — | | | $ | 75,763,381 | |
| Total | | $ | 75,763,381 | | | $ | — | | | $ | — | | | $ | 75,763,381 | |
BAMB
| Assets * | | Level 1 | | | Level 2 | | | Level 3 | | | Total | |
| Exchange-Traded Funds | | $ | 54,881,243 | | | $ | — | | | $ | — | | | $ | 54,881,243 | |
| Total | | $ | 54,881,243 | | | $ | — | | | $ | — | | | $ | 54,881,243 | |
BAMU
| Assets * | | Level 1 | | | Level 2 | | | Level 3 | | | Total | |
| Exchange-Traded Funds | | $ | 61,184,604 | | | $ | — | | | $ | — | | | $ | 61,184,604 | |
| Total | | $ | 61,184,604 | | | $ | — | | | $ | — | | | $ | 61,184,604 | |
BAMA
| Assets * | | Level 1 | | | Level 2 | | | Level 3 | | | Total | |
| Exchange-Traded Funds | | $ | 35,974,899 | | | $ | — | | | $ | — | | | $ | 35,974,899 | |
| Total | | $ | 35,974,899 | | | $ | — | | | $ | — | | | $ | 35,974,899 | |
BAMO
| Assets * | | Level 1 | | | Level 2 | | | Level 3 | | | Total | |
| Exchange-Traded Funds | | $ | 34,157,467 | | | $ | — | | | $ | — | | | $ | 34,157,467 | |
| Total | | $ | 34,157,467 | | | $ | — | | | $ | — | | | $ | 34,157,467 | |
BAMY
| Assets * | | Level 1 | | | Level 2 | | | Level 3 | | | Total | |
| Exchange-Traded Funds | | $ | 33,484,090 | | | $ | — | | | $ | — | | | $ | 33,484,090 | |
| Total | | $ | 33,484,090 | | | $ | — | | | $ | — | | | $ | 33,484,090 | |
The Funds did not hold any Level 2 or 3 securities during the period.
| * | See Schedules of Investments for industry classification. |
Exchange Traded Funds – The Funds may invest in ETFs. ETFs are a type of fund bought and sold on a securities exchange. An ETF trades like common stock. An index ETF represents a portfolio of securities. The risks of owning an ETF generally reflect the risks of owning the underlying securities in which it invests, although the lack of liquidity on an ETF could result in it being more volatile. Additionally, ETFs have fees and expenses that reduce their value.
Security Transactions and Related Income – Security transactions are accounted for on the trade date. Interest income is recognized on an accrual basis and includes amortization and accretion, which is recorded using the effective yield method. Dividend income is recorded on the ex-dividend date. Realized gains or losses from sales of securities are determined by comparing the identified cost of the security lot sold with the net sales proceeds.
Brookstone ETFs
NOTES TO FINANCIAL STATEMENTS (Continued)
May 31, 2024
Distributions to Shareholders – Dividends from net investment income, if any, are declared and paid quarterly for each Fund. Distributable net realized capital gains, if any, are declared and distributed annually to comply with distribution requirements. Dividends from net investment income and distributions from net realized gains are determined in accordance with federal income tax regulations, which may differ from GAAP. These “book/tax” differences are considered either temporary (e.g., deferred losses) or permanent in nature. To the extent these differences are permanent in nature, such amounts are reclassified within the composition of net assets based on their federal tax-basis treatment; temporary differences do not require reclassification. Dividends and distributions to shareholders are recorded on the ex-dividend date.
Cash and Cash Equivalents – Idle cash may be swept into various overnight demand deposits and is classified as cash and cash equivalents on the Statements of Assets and Liabilities. The Funds maintain cash in bank deposit accounts which, at times, may exceed United States federally insured limits. Amounts swept overnight are available on the next business day.
Federal Income Taxes – The Funds comply with the requirements of the Internal Revenue Code applicable to regulated investment companies and to distribute all of their taxable income to shareholders. Therefore, no provision for federal income tax is required.
The Funds recognize the tax benefits of uncertain tax positions only where the position is “more likely than not” to be sustained assuming examination by tax authorities. Management has analyzed each Fund’s tax position and has concluded that no liability for unrecognized tax benefits should be recorded related to uncertain tax positions taken on returns expected to be taken in each Fund’s May 31, 2024 year-end tax returns. The Funds recognize interest and penalties, if any, related to unrecognized tax benefits as income tax expenses, in the Statements of Operations. During the period ended May 31,2024, the Funds did not incur any interest or penalties.
Expenses – Expenses of the Trust that are directly identifiable to a specific Fund are charged to that Fund. Expenses, which are not readily identifiable to a specific Fund, are allocated in such a manner as deemed equitable (as determined by the Board), taking into consideration the nature and type of expense and the relative sizes of the Funds in the Trust.
Indemnification – The Trust indemnifies its officers and Trustees for certain liabilities that may arise from the performance of their duties to the Trust. Additionally, in the normal course of business, the Funds enter into contracts that contain a variety of representations and warranties and which provide general indemnities. The Funds’ maximum exposure under these arrangements is unknown, as this would involve future claims that may be made against the Funds that have not yet occurred. However, based on experience, the risk of loss due to these warranties and indemnities appears to be remote.
Brookstone ETFs
NOTES TO FINANCIAL STATEMENTS (Continued)
May 31, 2024
| 3. | INVESTMENT TRANSACTIONS |
For the period ended May 31, 2024, cost of purchases and proceeds from sales of portfolio securities (excluding in-kind transactions and short-term investments), amounted to:
| Fund | | Purchases | | | Sales | |
| BAMD | | $ | 8,569,940 | | | $ | 8,131,962 | |
| BAMG | | | 14,729,416 | | | | 14,332,287 | |
| BAMV | | | 14,042,017 | | | | 14,173,975 | |
| BAMB | | | 33,057,004 | | | | 32,215,565 | |
| BAMU | | | 2,640,496 | | | | — | |
| BAMA | | | — | | | | — | |
| BAMO | | | — | | | | — | |
| BAMY | | | 20,285,154 | | | | 18,648,101 | |
For the period ended May 31, 2024, cost of purchases and proceeds from sales of portfolio securities for in-kind transactions, amounted to:
| Fund | | Purchases | | | Sales | |
| BAMD | | $ | 67,639,567 | | | $ | 3,265,004 | |
| BAMG | | | 72,985,854 | | | | 4,477,199 | |
| BAMV | | | 71,566,058 | | | | 5,352,238 | |
| BAMB | | | 53,413,293 | | | | — | |
| BAMU | | | 67,068,763 | | | | 8,671,054 | |
| BAMA | | | 33,511,695 | | | | 1,330,267 | |
| BAMO | | | 32,827,578 | | | | 1,878,433 | |
| BAMY | | | 32,690,332 | | | | 1,778,865 | |
| 4. | INVESTMENT ADVISORY AGREEMENT AND TRANSACTIONS WITH RELATED PARTIES |
Brookstone Asset Management, LLC serves as the Funds’ investment adviser (the “Adviser”) pursuant to an investment advisory agreement with the Trust (the “Advisory Agreement”). Pursuant to the Advisory Agreement, the Adviser, under the oversight of the Board, directs the daily operations of the Funds and supervises the performance of administrative and professional services provided by others. As compensation for its services and the related expenses borne by the Adviser, the Funds pay the Adviser a fee, computed and accrued daily and paid monthly, at an annual rate indicated below of each Fund’s average daily net assets. During period ended May 31, 2024, the Adviser earned the following fees:
| Fund | | Annual Rate | | | Advisory Fee | |
| BAMD | | | 0.65 | % | | $ | 236,935 | |
| BAMG | | | 0.65 | % | | | 248,660 | |
| BAMV | | | 0.65 | % | | | 248,577 | |
| BAMB | | | 0.65 | % | | | 185,154 | |
| BAMU | | | 0.65 | % | | | 218,781 | |
| BAMA | | | 0.65 | % | | | 121,281 | |
| BAMO | | | 0.65 | % | | | 115,037 | |
| BAMY | | | 0.65 | % | | | 112,454 | |
Pursuant to a written agreement (the “Waiver Agreement”), the Adviser has contractually agreed, until at least September 30, 2024, to ensure that total annual fund operating expenses after fee waiver and/or reimbursement excluding (i) any front-end or contingent deferred loads; (ii) brokerage fees and commissions, (iii) acquired fund fees and expenses; (iv) fees and expenses associated with investments in
Brookstone ETFs
NOTES TO FINANCIAL STATEMENTS (Continued)
May 31, 2024
other collective investment vehicles or derivative instruments (including for example option and swap fees and expenses); (v) borrowing costs (such as interest and dividend expense on securities sold short); (vi) taxes; and (vii) extraordinary expenses, such as litigation expenses (which may include indemnification of Fund officers and Trustees, contractual indemnification of Fund service providers (other than the Adviser)) will not exceed 0.95% of average daily net assets of each Fund, respectively; subject to possible recoupment from the Funds in future years within the three years from the date the fees have been waived or reimbursed if such recoupment can be achieved within the lesser of the foregoing expense limits or the expense limits in place at the time of the recoupment. Fee waiver and reimbursement arrangements can decrease the Funds’ expenses and boost its performance. If the Adviser waives any fee or reimburses any expense pursuant to the Waiver Agreement, and the operating expenses attributable to the Funds are subsequently less than the expense limitation, the Adviser shall be entitled to reimbursement by the applicable Fund for such waived fees or reimbursed expenses provided that such reimbursement does not cause the expenses to exceed the Expense Limitation. If the Funds’ operating expenses subsequently exceed the expense limitation, the reimbursements shall be suspended.
During the period ended May 31, 2024, the Adviser waived fees and/or reimbursed expenses, pursuant to the Waiver Agreement, in the amounts of:
| | | Fees waived | |
| | | (reimbursed) by the | |
| Fund | | Adviser | |
| BAMD | | $ | 17,724 | |
| BAMG | | | 14,170 | |
| BAMV | | | 13,736 | |
| BAMB | | | 48,296 | |
| BAMU | | | 33,803 | |
| BAMA | | | 69,341 | |
| BAMO | | | 71,130 | |
| BAMY | | | 72,230 | |
The table below contains the amounts of fee waivers and expense reimbursements subject to recapture by the Adviser through May 31 of the year indicated.
| Fund | | 2027 | |
| BAMD | | $ | 17,724 | |
| BAMG | | | 14,170 | |
| BAMV | | | 13,736 | |
| BAMB | | | 48,296 | |
| BAMU | | | 33,803 | |
| BAMA | | | 69,341 | |
| BAMO | | | 71,130 | |
| BAMY | | | 72,230 | |
Brookstone ETFs
NOTES TO FINANCIAL STATEMENTS (Continued)
May 31, 2024
Distributor – The distributor of the Funds is Northern Lights Distributors, LLC (the “Distributor”). The Board has adopted, on behalf of the Funds, the Trust’s Master Distribution and Shareholder Servicing Plan as amended (the “Plan”), pursuant to Rule 12b-1 under the 1940 Act, to pay for certain distribution activities and shareholder services related to fund shares. Under the Plan, the Funds may pay 0.25% per year of the average daily net assets of fund shares for such distribution and shareholder service activities. As of May 31, 2024 the Plan has not been activated. For the period ended May 31, 2024, the Funds did not incur any distribution fees.
The Distributor acts as the Funds’ principal underwriter in a continuous public offering of the Funds’ shares and is an affiliate of Ultimus Fund Solutions, LLC. For the period ended May 31, 2024, there were no underwriting commissions.
In addition, certain affiliates of the Distributor provide services to the Funds as follows:
Ultimus Fund Solutions, LLC (“UFS”) – UFS, an affiliate of the Distributor, provides administration and fund accounting services to the Trust. Pursuant to separate servicing agreements with UFS, the Funds pay UFS customary fees for providing administration and fund accounting services to the Funds, which are included in administrative service fees in the Statements of Operations. Certain officers of the Trust are also officers of UFS, and are not paid any fees directly by the Funds for serving in such capacities.
Northern Lights Compliance Services, LLC (“NLCS”) – NLCS, an affiliate of UFS and the Distributor, provides a Chief Compliance Officer to the Trust, as well as related compliance services, pursuant to a consulting agreement between NLCS and the Trust. Under the terms of such agreement, NLCS receives customary fees from each Fund, which are included in compliance officer fees in the Statements of Operations.
Blu Giant, LLC (“Blu Giant”) – Blu Giant, an affiliate of UFS and the Distributor, provides EDGAR conversion and filing services as well as print management services for the Funds on an ad-hoc basis. For the provision of these services, Blu Giant receives customary fees from the Funds, which are included in printing expenses in the Statements of Operations.
| 5. | CAPITAL SHARE TRANSACTIONS |
Shares are not individually redeemable and may be redeemed by the Funds at NAV only in large blocks known as “Creation Units.” Shares are created and redeemed by the Funds only in Creation Unit size aggregations of 10,000. Only Authorized Participants or transactions done through an Authorized Participant are permitted to purchase or redeem Creation Units from the Funds. An Authorized Participant is either (i) a broker-dealer or other participant in the clearing process through the Continuous Net Settlement System of the National Securities Clearing Corporation or (ii) a DTC participant and, in each case, must have executed a Participant Agreement with the Distributor. Such transactions are generally permitted on an in-kind basis, with a balancing cash component to equate the transaction to the NAV per share of the Fund on the transaction date.
Cash may be substituted equivalent to the value of certain securities generally when they are not available in sufficient quantity for delivery, not eligible for trading by the Authorized Participant or as a result of other market circumstances. In addition, the Funds may impose transaction fees on purchases and
Brookstone ETFs
NOTES TO FINANCIAL STATEMENTS (Continued)
May 31, 2024
redemptions of Fund shares to cover the custodial and other costs incurred by the Funds in effecting trades. A fixed fee payable to the Custodian may be imposed on each creation and redemption transaction regardless of the number of Creation Units involved in the transaction (“Fixed Fee”). Purchases and redemptions of Creation Units for cash or involving cash-in-lieu are required to pay an additional variable charge to compensate the Funds and its ongoing shareholders for brokerage and market impact expenses relating to Creation Unit transactions (“Variable Charge,” and together with the Fixed Fee, the “Transaction Fees”). Transactions in capital shares for the Funds are disclosed in the Statements of Changes in Net Assets. For the period ended May 31, 2024, the Funds received the following fees:
| Fund | | Variable Fees | | | Fixed Fees | |
| BAMD | | $ | — | | | $ | 10,500 | |
| BAMG | | | — | | | | 10,500 | |
| BAMV | | | 310 | | | | 8,750 | |
| BAMB | | | — | | | | 5,000 | |
| BAMU | | | — | | | | 8,000 | |
| BAMA | | | — | | | | 6,000 | |
| BAMO | | | — | | | | 5,000 | |
| BAMY | | | — | | | | 5,250 | |
The Transaction Fees for the Funds are listed in the table below:
| Fee for in-Kind and Cash | Maximum Additional Variable |
| Purchases | Charge for Cash Purchases* |
| $250 | 2.00%* |
| * | The maximum Transaction Fee may be up to 2.00% of the amount invested. |
Other investment companies including ETFs (“Underlying Funds”) in which the Funds invest are subject to investment advisory and other expenses, which will be indirectly paid by the Funds. As a result, the cost of investing in the Funds will be higher than the cost of investing directly in the Underlying Funds and may be higher than other ETFs that invest directly in stocks and bonds. Each of the Underlying Funds is subject to its own specific risks, but the Adviser expects the principal investment risks of such Underlying Funds will be similar to the risks of investing in the corresponding Funds. ETFs may also trade at a discount or premium to their NAV and may trade at a larger discount or smaller premium subsequent to purchase by the Funds.
Brookstone ETFs
NOTES TO FINANCIAL STATEMENTS (Continued)
May 31, 2024
| 7. | AGGREGATE UNREALIZED APPRECIATION AND DEPRECATION-TAX BASIS |
The identified cost of investments in securities owned by each Fund for federal income tax purposes, and their respective gross unrealized appreciation and depreciation on May 31, 2024, were as follows:
| | | Cost for | | | | | | | | | | |
| | | Federal Tax | | | Unrealized | | | Unrealized | | | Tax Net Unrealized | |
| Portfolio | | Purposes | | | Appreciation | | | Depreciation | | | Appreciation | |
| BAMD | | $ | 65,835,264 | | | $ | 9,673,085 | | | $ | (364,906 | ) | | $ | 9,308,179 | |
| BAMG | | | 70,645,959 | | | | 10,205,743 | | | | (2,503,924 | ) | | | 7,701,819 | |
| BAMV | | | 68,836,284 | | | | 8,838,341 | | | | (1,911,244 | ) | | | 6,927,097 | |
| BAMB | | | 54,250,958 | | | | 630,285 | | | | — | | | | 630,285 | |
| BAMU | | | 61,062,011 | | | | 132,968 | | | | (10,375 | ) | | | 122,593 | |
| BAMA | | | 32,306,800 | | | | 3,668,099 | | | | — | | | | 3,668,099 | |
| BAMO | | | 31,137,583 | | | | 3,019,884 | | | | — | | | | 3,019,884 | |
| BAMY | | | 32,473,931 | | | | 1,010,159 | | | | — | | | | 1,010,159 | |
| 8. | DISTRIBUTIONS TO SHAREHOLDERS AND TAX COMPONENTS OF CAPITAL |
The tax character of distributions for the period ended May 31, 2024 was as follows:
| For Fiscal Year Ended | | Ordinary | | | Long-Term | | | Return of | | | | |
| 5/31/2024 | | Income | | | Capital Gains | | | Capital | | | Total | |
| BAMD | | $ | 1,526,556 | | | $ | — | | | $ | — | | | $ | 1,526,556 | |
| BAMG | | | 72,992 | | | | — | | | | — | | | | 72,992 | |
| BAMV | | | 491,550 | | | | — | | | | — | | | | 491,550 | |
| BAMB | | | 857,320 | | | | — | | | | — | | | | 857,320 | |
| BAMU | | | 1,296,360 | | | | — | | | | — | | | | 1,296,360 | |
| BAMA | | | 276,252 | | | | — | | | | — | | | | 276,252 | |
| BAMO | | | 302,253 | | | | — | | | | — | | | | 302,253 | |
| BAMY | | | 1,601,515 | | | | — | | | | — | | | | 1,601,515 | |
As of May 31, 2024, the components of accumulated earnings/(deficit) on a tax basis were as follows:
| | | Undistributed | | | Undistributed | | | Post October Loss | | | Capital Loss | | | Other | | | Unrealized | | | Total | |
| | | Ordinary | | | Long-Term | | | and | | | Carry | | | Book/Tax | | | Appreciation/ | | | Accumulated | |
| Fund | | Income | | | Capital Gains | | | Late Year Loss | | | Forwards | | | Differences | | | (Depreciation) | | | Earnings/(Deficits) | |
| BAMD | | $ | 687,484 | | | $ | 7,090 | | | $ | — | | | $ | — | | | $ | — | | | $ | 9,308,179 | | | $ | 10,002,753 | |
| BAMG | | | 1,055,323 | | | | — | | | | — | | | | — | | | | — | | | | 7,701,819 | | | | 8,757,142 | |
| BAMV | | | 2,021,472 | | | | 1,856 | | | | — | | | | — | | | | — | | | | 6,927,097 | | | | 8,950,425 | |
| BAMB | | | 6,742 | | | | — | | | | (3,773 | ) | | | — | | | | — | | | | 630,285 | | | | 633,254 | |
| BAMU | | | 7,801 | | | | — | | | | — | | | | — | | | | — | | | | 122,593 | | | | 130,394 | |
| BAMA | | | 9,714 | | | | — | | | | — | | | | — | | | | — | | | | 3,668,099 | | | | 3,677,813 | |
| BAMO | | | 7,856 | | | | — | | | | — | | | | — | | | | — | | | | 3,019,884 | | | | 3,027,740 | |
| BAMY | | | 5,897 | | | | — | | | | (208,215 | ) | | | — | | | | — | | | | 1,010,159 | | | | 807,841 | |
Brookstone ETFs
NOTES TO FINANCIAL STATEMENTS (Continued)
May 31, 2024
The difference between book basis and tax basis undistributed net investment income (losses), accumulated net realized gains (losses), and unrealized appreciation (depreciation) from C-Corporation return of capital distributions.
Capital losses incurred after October 31 within the fiscal year are deemed to arise on the first business day of the following fiscal year for tax purposes. The following Funds incurred and elected to defer such capital losses as follows:
| | | Post October | |
| Fund | | Losses | |
| BAMD | | $ | — | |
| BAMG | | | — | |
| BAMV | | | — | |
| BAMB | | | 3,773 | |
| BAMU | | | — | |
| BAMA | | | — | |
| BAMO | | | — | |
| BAMY | | | 208,215 | |
Permanent book and tax differences, primarily attributable to realized gain (loss) on in-kind redemptions, and non-deductible expenses, resulted in reclassifications for the tax year ended May 31, 2024, as follows:
| | | Paid | | | | |
| | | In | | | Accumulated | |
| | | Capital | | | Earnings (Losses) | |
| BAMD | | $ | 388,300 | | | $ | (388,300 | ) |
| BAMG | | | 700,844 | | | | (700,844 | ) |
| BAMV | | | 746,348 | | | | (746,348 | ) |
| BAMB | | | (9,347 | ) | | | 9,347 | |
| BAMU | | | 13,082 | | | | (13,082 | ) |
| BAMA | | | 113,947 | | | | (113,947 | ) |
| BAMO | | | 179,001 | | | | (179,001 | ) |
| BAMY | | | 126,096 | | | | (126,096 | ) |
Subsequent events after the date of the Statements of Assets and Liabilities have been evaluated through the date the financial statements were issued. Management has determined that no events or transactions occurred requiring adjustment or disclosure in the financial statements.

REPORT OF INDEPENDENT REGISTERED PUBLIC ACCOUNTING FIRM
To the Shareholders of Brookstone Dividend Stock ETF, Brookstone Growth Stock ETF, Brookstone Value Stock ETF, Brookstone Intermediate Bond ETF, Brookstone Ultra-Short Bond ETF, Brookstone Active ETF, Brookstone Opportunities ETF, and Brookstone Yield ETF and
Board of Trustees of Northern Lights Fund Trust IV
Opinion on the Financial Statements
We have audited the accompanying statements of assets and liabilities, including the schedules of investments, of Northern Lights Fund Trust IV comprising the funds listed below (the “Funds”), as of May 31, 2024, the related statements of operations and changes in net assets, and the financial highlights for each of the periods indicated below, and the related notes (collectively referred to as the “financial statements”). In our opinion, the financial statements present fairly, in all material respects, the financial position of each of the Funds as of May 31, 2024, the results of their operations, the changes in net assets, and the financial highlights for each of the periods indicated below in conformity with accounting principles generally accepted in the United States of America.
| | | Statements of | |
| | Statements of | Changes in Net | Financial |
| Fund Name | Operations | Assets | Highlights |
| Brookstone Growth Stock ETF, Brookstone Value Stock ETF, Brookstone Intermediate Bond ETF, and Brookstone Ultra-Short Bond ETF | For the period from September 26, 2023 (commencement of operations) through May 31, 2024 |
| Brookstone Dividend Stock ETF, Brookstone Active ETF, Brookstone Opportunities ETF, and Brookstone Yield ETF | For the period from September 27, 2023 (commencement of operations) through May 31, 2024 |
Basis for Opinion
These financial statements are the responsibility of the Funds’ management. Our responsibility is to express an opinion on the Funds’ financial statements based on our audits. We are a public accounting firm registered with the Public Company Accounting Oversight Board (United States) (“PCAOB”) and are required to be independent with respect to the Funds in accordance with the U.S. federal securities laws and the applicable rules and regulations of the Securities and Exchange Commission and the PCAOB.
We conducted our audits in accordance with the standards of the PCAOB. Those standards require that we plan and perform the audit to obtain reasonable assurance about whether the financial statements are free of material misstatement whether due to error or fraud.
COHEN & COMPANY, LTD.
800.229.1099 | 866.818.4538 fax | cohencpa.com
Registered with the Public Company Accounting Oversight Board
Our audits included performing procedures to assess the risks of material misstatement of the financial statements, whether due to error or fraud, and performing procedures that respond to those risks. Such procedures included examining, on a test basis, evidence regarding the amounts and disclosures in the financial statements. Our procedures included confirmation of securities owned as of May 31, 2024, by correspondence with the custodian. Our audits also included evaluating the accounting principles used and significant estimates made by management, as well as evaluating the overall presentation of the financial statements. We believe that our audits provide a reasonable basis for our opinion.
We have served as the Funds’ auditor since 2023.

COHEN & COMPANY, LTD.
Philadelphia, Pennsylvania
July 30, 2024
PRIVACY NOTICE
Northern Lights Fund Trust IV
Rev. April 2021
| FACTS | WHAT DOES NORTHERN LIGHTS FUND TRUST IV DO WITH YOUR PERSONAL INFORMATION? |
| Why? | Financial companies choose how they share your personal information. Federal law gives consumers the right to limit some, but not all sharing. Federal law also requires us to tell you how we collect, share, and protect your personal information. Please read this notice carefully to understand what we do. |
| What? | The types of personal information we collect and share depends on the product or service that you have with us. This information can include: ● Social Security number and wire transfer instructions ● account transactions and transaction history ● investment experience and purchase history When you are no longer our customer, we continue to share your information as described in this notice. |
| How? | All financial companies need to share customers’ personal information to run their everyday business. In the section below, we list the reasons financial companies can share their customers’ personal information; the reasons Northern Lights Fund Trust IV chooses to share; and whether you can limit this sharing. |
Reasons we can share
your personal information: | Does Northern Lights
Fund Trust IV
share information? | Can you limit this
sharing? |
| For our everyday business purposes - such as to process your transactions, maintain your account(s), respond to court orders and legal investigations, or report to credit bureaus. | YES | NO |
| For our marketing purposes - to offer our products and services to you. | NO | We don’t share |
| For joint marketing with other financial companies. | NO | We don’t share |
| For our affiliates’ everyday business purposes - information about your transactions and records. | NO | We don’t share |
| For our affiliates’ everyday business purposes - information about your credit worthiness. | NO | We don’t share |
| For nonaffiliates to market to you | NO | We don’t share |
| QUESTIONS? | Call 1-631-490-4300 |
PRIVACY NOTICE
Northern Lights Fund Trust IV
| What we do: |
How does Northern Lights Fund Trust IV protect my personal information? | To protect your personal information from unauthorized access and use, we use security measures that comply with federal law. These measures include computer safeguards and secured files and buildings. Our service providers are held accountable for adhering to strict policies and procedures to prevent any misuse of your nonpublic personal information. |
How does Northern Lights Fund Trust IV collect my personal information? | We collect your personal information, for example, when you ● open an account or deposit money ● direct us to buy securities or direct us to sell your securities ● seek advice about your investments We also collect your personal information from others, such as credit bureaus, affiliates, or other companies. |
Why can’t I limit all sharing? | Federal law gives you the right to limit only: ● sharing for affiliates’ everyday business purposes – information about your creditworthiness. ● affiliates from using your information to market to you. ● sharing for nonaffiliates to market to you. State laws and individual companies may give you additional rights to limit sharing. |
| Definitions |
| Affiliates | Companies related by common ownership or control. They can be financial and nonfinancial companies. ● Northern Lights Fund Trust IV has no affiliates. |
| Nonaffiliates | Companies not related by common ownership or control. They can be financial and nonfinancial companies. ● Northern Lights Fund Trust IV does not share with nonaffiliates so they can market to you. |
| Joint marketing | A formal agreement between nonaffiliated financial companies that together market financial products or services to you. ● Northern Lights Fund Trust IV does not jointly market. |
PROXY VOTING POLICY
Information regarding how the Funds voted proxies relating to portfolio securities for the most recent twelve month period ending June 30 as well as a description of the policies and procedures that the Funds use to determine how to vote proxies will be available without charge, upon request, by calling 1-888-562-8880 or by referring to the Securities and Exchange Commission’s (“SEC”) website at http://www.sec.gov.
PORTFOLIO HOLDINGS
Each Fund files its complete schedule of portfolio holdings with the SEC for the first and third quarters of each fiscal year on Form N-PORT. Form N-PORT is available on the SEC’s website at http://www.sec.gov. The information on Form N-PORT is available without charge, upon request, by calling 1-888-562-8880.
| |
| |
| |
| |
| |
| |
| |
| |
| |
| |
| |
| |
| |
| |
| |
| |
| |
| |
| |
| |
| |
| |
| |
| |
| |
| |
| |
| |
| |
| |
| |
| |
| INVESTMENT ADVISER |
| Brookstone Asset Management, LLC |
| 1745 S Naperville Rd |
| Wheaton, IL 60189 |
| |
| ADMINISTRATOR |
| Ultimus Fund Solutions, LLC |
| 225 Pictoria Drive, Suite 450 |
| Cincinnati, OH 45246 |
| |
| |
| |
| |
| |
| BROOK ETF-A24 |
Item 8. Changes in and Disagreements with Accountants for Open-End Management Investment Companies.
Not applicable
Item 9. Proxy Disclosures for Open-End Management Investment Companies.
Not applicable
Item 10. Remuneration Paid to Directors, Officers, and Others of Open-End Management Investment Companies.
Included under Item 7 of this Form
Item 11. Statement Regarding Basis for Approval of Investment Advisory Contract.
Included under Item 7 of this Form
Item 12. Disclosure of Proxy Voting Policies and Procedures for Closed-End Management Investment Companies.
Not applicable
Item 13. Portfolio Managers of Closed-End Management Investment Companies.
Not applicable
Item 14. Purchases of Equity Securities by Closed-End Management Investment Company and Affiliated Purchasers.
Not applicable
Item 15. Submission of Matters to a Vote of Security Holders.
None
Item 16. Controls and Procedures
(a) The registrant’s Principal Executive Officer and Principal Financial Officer have concluded that the registrant’s disclosure controls and procedures (as defined in Rule 30a-3(c) under the Act) are effective in design and operation and are sufficient to form the basis of the certifications required by Rule 30a-(2) under the Act, based on their evaluation of these disclosure controls and procedures as of a date within 90 days of this report on Form N-CSR.
(b) There were no changes in the registrant’s internal control over financial reporting (as defined in Rule 30a-3(d) under the Act) during the period covered by this report that have materially affected, or are reasonably likely to materially affect, the registrant’s internal control over financial reporting.
Item 17. Disclosure of Securities Lending Activities for Closed-End Management Investment Companies.
Not applicable
Item 18. Recovery of Erroneously Awarded Compensation.
(a) Not applicable
(b) Not applicable
Item 19. Exhibits.
(a)(1) Code of Ethics for Principal Executive and Senior Financial Officers. Exhibit 99.CODE
(a)(2) A separate certification for each principal executive officer and principal financial officer of the registrant as required by Rule 30a-2(a) under the Act (17 CFR 270.30a-2(a)): Attached hereto. Exhibit 99. CERT
(a)(3) Not applicable
(a)(4) Not applicable
(b) Certifications required by Rule 30a-2(b) under the Act (17 CFR 270.30a-2(b)): Attached hereto. Exhibit 99.906CERT
SIGNATURES
Pursuant to the requirements of the Securities Exchange Act of 1934 and the Investment Company Act of 1940, the registrant has duly caused this report to be signed on its behalf by the undersigned, thereunto duly authorized.
Registrant: Northern Lights Fund Trust IV
| By | /s/ Wendy Wang | |
| Wendy Wang | |
| Principal Executive Officer/President |
| Date: 08/08/2024 |
Pursuant to the requirements of the Securities Exchange Act of 1934 and the Investment Company Act of 1940, this report has been signed below by the following persons on behalf of the registrant and in the capacities and on the dates indicated.
| By | /s/ Wendy Wang | |
| Wendy Wang |
| Principal Executive Officer/President |
| Date: 08/08/2024 | |
| By | /s/ Sam Singh | |
| Sam Singh | |
| Principal Financial Officer/Treasurer |
| Date: 08/08/2024 |