united states
securities and exchange commission
washington, d.c. 20549
form n-csr
certified shareholder report of registered
management investment companies
| Investment Company Act file number | 811-23066 | |
Northern Lights Fund Trust IV
(Exact name of registrant as specified in charter)
| 225 Pictoria Drive, Suite 450, Cincinnati, OH | | 45246 |
| (Address of principal executive offices) | | (Zip code) |
Wendy Wang, Ultimus Fund Solutions, LLC
4221 North 203rd Street, Suite 100, Elkhorn, NE 68022
(Name and address of agent for service)
| Registrant’s telephone number, including area code: | 631-470-2612 | |
| Date of fiscal year end: | 6/30 | |
| | | |
| Date of reporting period: | 6/30/24 | |
Item 1. Reports to Stockholders.
| (a) | Insert Tailored Shareholder Report |
Fulcrum Diversified Absolute Return Fund
Institutional Class (FARIX)
Annual Shareholder Report - June 30, 2024
This annual shareholder report contains important information about Fulcrum Diversified Absolute Return Fund for the period of July 1, 2023 to June 30, 2024. You can find additional information about the Fund at https://www.fulcrumassetfunds.com/. You can also request this information by contacting us at 855-538-5278.
What were the Fund’s costs for the last year?
(based on a hypothetical $10,000 investment)
| Class Name | Costs of a $10,000 investment | Costs paid as a percentage of a $10,000 investment |
|---|
| Institutional | $113 | 1.13% |
How did the Fund perform during the reporting period?
Asset markets begun the period under pressure from talk of more restrictive monetary policy but this receded later in Q4-23 as an economic soft landing scenario and an improving environment for risk assets became the central theme. U.S. mega cap growth stocks were the main driver of equity market gains. Fixed income markets failed to benefit from the improved sentiment with inflation lingering above central bank targets. The Fund returned +9.35% for the period ended June 30, 2024, meeting its investment objective. Dynamic Asset Allocation strategies were the largest contributor to returns, capturing the broad upward move in equity markets, whilst remaining underweight fixed income. Discretionary Macro strategies also added to returns, from a broad array of sub-strategies and most notably thematic equities. Diversifying Strategies were flat over the period.
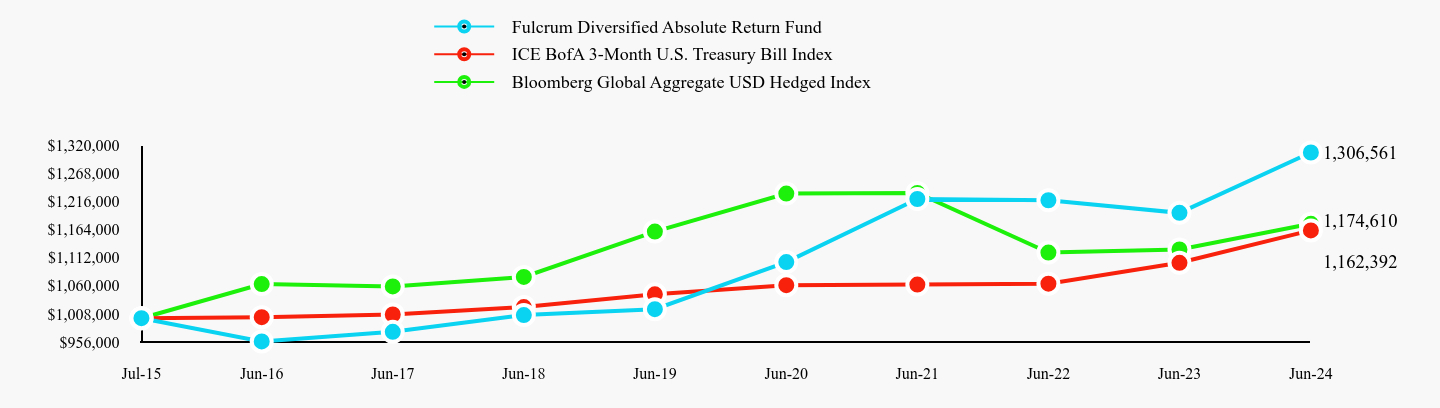
How has the Fund performed since inception?
The Fund has performed consistently against its benchmark. The market in the year ended 2024 proved to be more volatile than previous years. To counter the volatile, a long-term view has been taken when considering performance.
Total Return Based on $1,000,000 Investment
| Fulcrum Diversified Absolute Return Fund | ICE BofA 3-Month U.S. Treasury Bill Index | Bloomberg Global Aggregate USD Hedged Index |
|---|
| Jul-15 | $1,000,000 | $1,000,000 | $1,000,000 |
| Jun-16 | 957,000 | 1,001,957 | 1,063,172 |
| Jun-17 | 974,868 | 1,006,829 | 1,058,782 |
| Jun-18 | 1,005,761 | 1,020,545 | 1,076,299 |
| Jun-19 | 1,016,707 | 1,044,150 | 1,160,207 |
| Jun-20 | 1,103,789 | 1,061,158 | 1,230,612 |
| Jun-21 | 1,220,551 | 1,062,158 | 1,231,552 |
| Jun-22 | 1,218,137 | 1,063,942 | 1,121,452 |
| Jun-23 | 1,194,858 | 1,102,495 | 1,127,263 |
| Jun-24 | 1,306,561 | 1,162,392 | 1,174,610 |
Average Annual Total Returns
| 1 Year | 5 Years | Since Inception (July 31, 2015) |
|---|
| Fulcrum Diversified Absolute Return Fund | 9.35% | 5.14% | 3.04% |
| ICE BofA 3-Month U.S. Treasury Bill Index | 5.43% | 2.17% | 1.70% |
| Bloomberg Global Aggregate USD Hedged Index | 4.20% | 0.25% | 1.82% |
- Net Assets$200,114,475
- Number of Portfolio Holdings884
- Advisory Fee (net of waivers)$1,630,102
- Portfolio Turnover239%
The Fund's past performance is not a good predictor of how the Fund will perform in the future. The graph and table do not reflect the deduction of taxes that a shareholder would pay on fund distributions or redemption of fund shares.
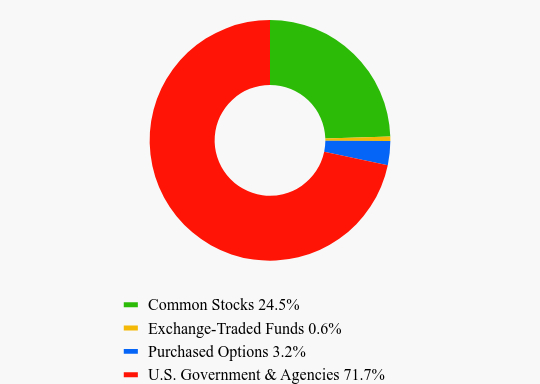
What did the Fund invest in?
Asset Weighting (% of total investments)
| Value | Value |
|---|
| Common Stocks | 24.5% |
| Exchange-Traded Funds | 0.6% |
| Purchased Options | 3.2% |
| U.S. Government & Agencies | 71.7% |
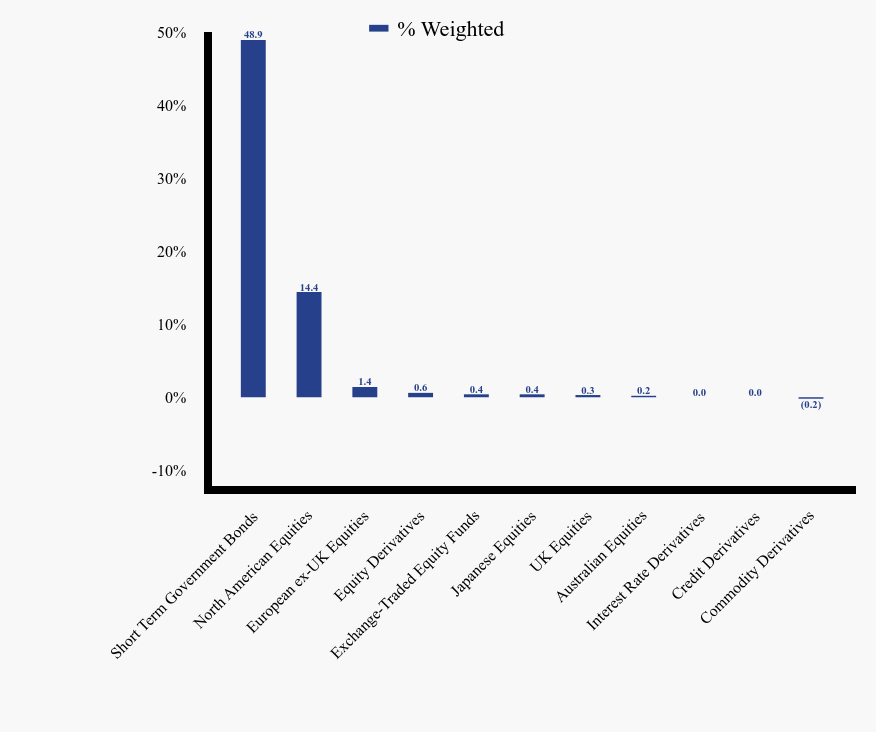
Sector Weighting (% of net assets)
| Value | Value |
|---|
| Short Term Government Bonds | 48.9 |
| North American Equities | 14.4 |
| European ex-UK Equities | 1.4 |
| Equity Derivatives | 0.6 |
| Exchange-Traded Equity Funds | 0.4 |
| Japanese Equities | 0.4 |
| UK Equities | 0.3 |
| Australian Equities | 0.2 |
| Interest Rate Derivatives | 0.0 |
| Credit Derivatives | 0.0 |
| Commodity Derivatives | (0.2) |
No material changes occurred during the year ended June 30, 2024.
If you wish to receive a copy of this document at a new address, contact 855-538-5278.
Where can I find additional information about the Fund?
Additional information is available on the Fund's website ( https://www.fulcrumassetfunds.com/ ), including its:
Prospectus
Financial information
Holdings
Proxy voting information
Fulcrum Diversified Absolute Return Fund (FARIX)
Annual Shareholder Report - June 30, 2024
Fulcrum Diversified Absolute Return Fund
Super Institutional Class (FARYX)
Annual Shareholder Report - June 30, 2024
This annual shareholder report contains important information about Fulcrum Diversified Absolute Return Fund for the period of July 1, 2023 to June 30, 2024. You can find additional information about the Fund at https://www.fulcrumassetfunds.com/. You can also request this information by contacting us at 855-538-5278.
What were the Fund’s costs for the last year?
(based on a hypothetical $10,000 investment)
| Class Name | Costs of a $10,000 investment | Costs paid as a percentage of a $10,000 investment |
|---|
| Super Institutional | $105 | 1.05% |
How did the Fund perform during the reporting period?
Asset markets begun the period under pressure from talk of more restrictive monetary policy but this receded later in Q4-23 as an economic soft landing scenario and an improving environment for risk assets became the central theme. U.S. mega cap growth stocks were the main driver of equity market gains. Fixed income markets failed to benefit from the improved sentiment with inflation lingering above central bank targets. The Fund returned +9.35% for the period ended June 30, 2024, meeting its investment objective. Dynamic Asset Allocation strategies were the largest contributor to returns, capturing the broad upward move in equity markets, whilst remaining underweight fixed income. Discretionary Macro strategies also added to returns, from a broad array of sub-strategies and most notably thematic equities. Diversifying Strategies were flat over the period.
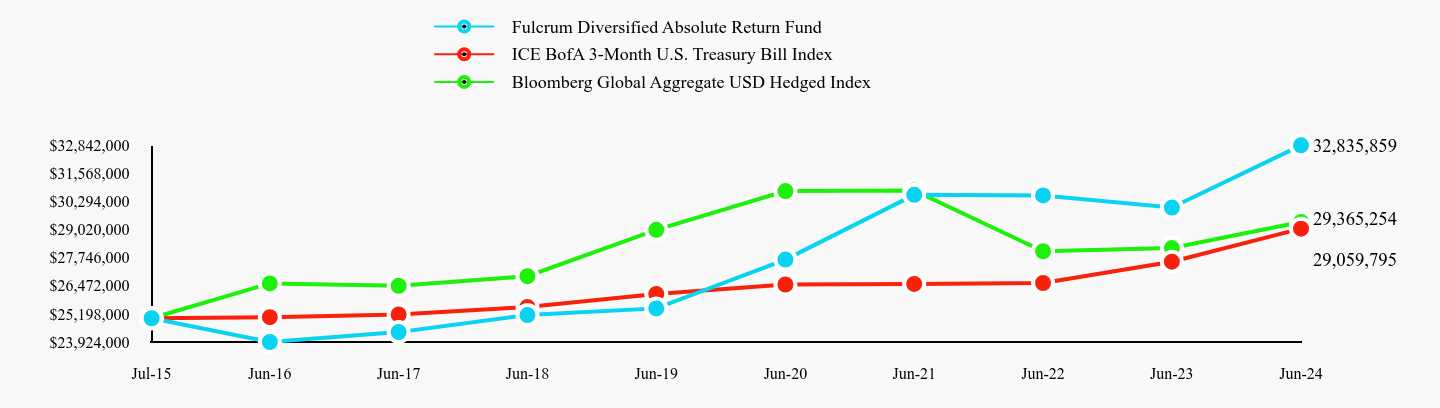
How has the Fund performed since inception?
The Fund has performed consistently against its benchmark. The market in the year ended 2024 proved to be more volatile than previous years. To counter the volatile, a long-term view has been taken when considering performance.
Total Return Based on $25,000,000 Investment
| Fulcrum Diversified Absolute Return Fund | ICE BofA 3-Month U.S. Treasury Bill Index | Bloomberg Global Aggregate USD Hedged Index |
|---|
| Jul-15 | $25,000,000 | $25,000,000 | $25,000,000 |
| Jun-16 | 23,925,000 | 25,048,935 | 26,579,288 |
| Jun-17 | 24,371,817 | 25,170,729 | 26,469,543 |
| Jun-18 | 25,143,299 | 25,513,637 | 26,907,479 |
| Jun-19 | 25,447,539 | 26,103,757 | 29,005,184 |
| Jun-20 | 27,659,280 | 26,528,948 | 30,765,291 |
| Jun-21 | 30,592,425 | 26,553,959 | 30,788,808 |
| Jun-22 | 30,565,144 | 26,598,544 | 28,036,289 |
| Jun-23 | 30,016,211 | 27,562,383 | 28,181,571 |
| Jun-24 | 32,835,859 | 29,059,795 | 29,365,254 |
Average Annual Total Returns
| 1 Year | 5 Years | Since Inception (July 31, 2015) |
|---|
| Fulcrum Diversified Absolute Return Fund | 9.39% | 5.23% | 3.10% |
| ICE BofA 3-Month U.S. Treasury Bill Index | 5.43% | 2.17% | 1.70% |
| Bloomberg Global Aggregate USD Hedged Index | 4.20% | 0.25% | 1.82% |
- Net Assets$200,114,475
- Number of Portfolio Holdings884
- Advisory Fee (net of waivers)$1,630,102
- Portfolio Turnover239%
The Fund's past performance is not a good predictor of how the Fund will perform in the future. The graph and table do not reflect the deduction of taxes that a shareholder would pay on fund distributions or redemption of fund shares.
What did the Fund invest in?
Asset Weighting (% of total investments)
| Value | Value |
|---|
| Common Stocks | 24.5% |
| Exchange-Traded Funds | 0.6% |
| Purchased Options | 3.2% |
| U.S. Government & Agencies | 71.7% |
Sector Weighting (% of net assets)
| Value | Value |
|---|
| Short Term Government Bonds | 48.9 |
| North American Equities | 14.4 |
| European ex-UK Equities | 1.4 |
| Equity Derivatives | 0.6 |
| Exchange-Traded Equity Funds | 0.4 |
| Japanese Equities | 0.4 |
| UK Equities | 0.3 |
| Australian Equities | 0.2 |
| Interest Rate Derivatives | 0.0 |
| Credit Derivatives | 0.0 |
| Commodity Derivatives | (0.2) |
No material changes occurred during the year ended June 30, 2024.
If you wish to receive a copy of this document at a new address, contact 855-538-5278.
Where can I find additional information about the Fund?
Additional information is available on the Fund's website ( https://www.fulcrumassetfunds.com/ ), including its:
Prospectus
Financial information
Holdings
Proxy voting information
Fulcrum Diversified Absolute Return Fund (FARYX)
Annual Shareholder Report - June 30, 2024
Item 2. Code of Ethics.
| (a) | The registrant has, as of the end of the period covered by this report, adopted a code of ethics that applies to the registrant's principal executive officer, principal financial officer, and principal accounting officer or controller, or persons performing similar functions, regardless of whether these individuals are employed by the registrant or a third party. |
| | |
| (b) | Not applicable |
| | |
| (c) | During the period covered by this report, there were no amendments to any provision of the code of ethics. |
| | |
| (d) | During the period covered by this report, there were no waivers or implicit waivers of a provision of the code of ethics. |
| | |
| (e) | Not applicable |
| | |
| (f) | See Item 19(a)(1) |
Item 3. Audit Committee Financial Expert.
| (a)(1) | The Registrant’s board of trustees has determined that Joseph Breslin is an audit committee financial expert, as defined in Item 3 of Form N-CSR. Mr. Breslin is independent for purposes of this Item 3. |
Item 4. Principal Accountant Fees and Services.
| (a) | Audit Fees. The aggregate fees billed for each of the last two fiscal years for professional services rendered by the registrant's principal accountant for the audit of the registrant's annual financial statements or services that are normally provided by the accountant in connection with statutory and regulatory filings or engagements for those fiscal years are as follows: |
2024 – $60,000
2023 – $75,000
| (b) | Audit-Related Fees. There were no fees billed in each of the last two fiscal years for assurances and related services by the principal accountant that are reasonably related to the performance of the audit of the registrant’s financial statements and are not reported under paragraph (a) of this item. |
| (c) | Tax Fees. The aggregate fees billed in each of the last two fiscal years for professional services rendered by the principal accountant for tax compliance are as follows: |
2024 – $10,000
2023 – $10,000
Preparation of Federal & State income tax returns, assistance with calculation of required income, capital gain and excise distributions and preparation of Federal excise tax returns.
| (d) | All Other Fees. The aggregate fees billed in each of the last two fiscal years for products and services provided by the registrant’s principal accountant, other than the services reported in paragraphs (a) through (c) of this item were $0 and $0 for the fiscal years ended June 30, 2023 and 2024, respectively. |
| (e)(1) | The audit committee does not have pre-approval policies and procedures. Instead, the audit committee or audit committee chairman approves on a case-by-case basis each audit or non-audit service before the principal accountant is engaged by the registrant. |
| | |
| (e)(2) | There were no services described in each of paragraphs (b) through (d) of this Item that were approved by the audit committee pursuant to paragraph (c)(7)(i)(C) of Rule 2-01 of Regulation S-X. |
| | |
| (f) | Not applicable. The percentage of hours expended on the principal accountant's engagement to audit the registrant's financial statements for the most recent fiscal year that were attributed to work performed by persons other than the principal accountant's full-time, permanent employees was zero percent (0%). |
| (g) | All non-audit fees billed by the registrant's principal accountant for services rendered to the registrant for the fiscal years ended June 30, 2023 and 2024, respectively are disclosed in (b)-(d) above. There were no audit or non-audit services performed by the registrant's principal accountant for the registrant's adviser. |
| | |
| (h) | Not applicable. |
| | |
| (i) | Not applicable. |
| | |
| (j) | Not applicable. |
Item 5. Audit Committee of Listed Companies.
Not applicable to open-end investment companies.
Item 6. Investments.
Schedule of investments in securities of unaffiliated issuers is included under Item 7.
Item 7. Financial Statements and Financial Highlights for Open-End Management Investment Companies.

Fulcrum Diversified Absolute Return Fund
| Super Institutional Class | FARYX |
| Institutional Class | FARIX |
a series of Northern Lights Fund Trust IV
Annual Financial Statements
June 30, 2024
855-538-5278
www.fulcrumassetfunds.com
fulcrumfunds@ultimusfundsolutions.com
FULCRUM DIVERSIFIED ABSOLUTE RETURN FUND
CONSOLIDATED SCHEDULE OF INVESTMENTS
June 30, 2024
| Shares | | | | | Fair Value | |
| | | | | COMMON STOCKS — 16.7% | | | | |
| | | | | ADVERTISING & MARKETING - 0.0%(a) | | | | |
| | 42 | | | Omnicom Group, Inc. | | $ | 3,767 | |
| | | | | | | | | |
| | | | | AEROSPACE & DEFENSE - 0.1% | | | | |
| | 29 | | | AeroVironment, Inc.(b) | | | 5,283 | |
| | 18 | | | Dassault Aviation S/A(c) | | | 3,270 | |
| | 5,508 | | | Saab A.B.(c) | | | 132,542 | |
| | 22 | | | Teledyne Technologies, Inc.(b) | | | 8,536 | |
| | | | | | | | 149,631 | |
| | | | | APPAREL & TEXTILE PRODUCTS - 0.1% | | | | |
| | 20 | | | adidas A.G.(c) | | | 4,778 | |
| | 112 | | | Gildan Activewear, Inc.(c) | | | 4,248 | |
| | 35 | | | Hermes International SCA(c) | | | 80,236 | |
| | 86 | | | LVMH Moet Hennessy Louis Vuitton S.E.(c) | | | 65,741 | |
| | 252 | | | NIKE, Inc., Class B | | | 18,993 | |
| | | | | | | | 173,996 | |
| | | | | ASSET MANAGEMENT - 0.1% | | | | |
| | 1,269 | | | Apollo Global Management, Inc. | | | 149,831 | |
| | 110 | | | BlackRock, Inc. | | | 86,605 | |
| | 1,482 | | | EQT A.B.(c) | | | 43,802 | |
| | 46 | | | Groupe Bruxelles Lambert N.V.(c) | | | 3,284 | |
| | 171 | | | Intermediate Capital Group PLC(c) | | | 4,717 | |
| | | | | | | | 288,239 | |
| | | | | AUTOMOTIVE - 0.2% | | | | |
| | 1,084 | | | Niterra Company Ltd.(c) | | | 31,469 | |
| | 251 | | | Rheinmetall A.G.(c) | | | 127,906 | |
| | 702 | | | Tesla, Inc.(b) | | | 138,912 | |
| | | | | | | | 298,287 | |
| | | | | BANKING - 0.5% | | | | |
| | 32,383 | | | Banco Santander S/A(c) | | | 150,225 | |
| | 2,216 | | | Bank of America Corporation | | | 88,130 | |
| | 398 | | | Bank of Ireland Group PLC(c) | | | 4,165 | |
| | 99 | | | BNP Paribas S/A(c) | | | 6,313 | |
| | 891 | | | CaixaBank S/A(c) | | | 4,718 | |
| | 544 | | | Commonwealth Bank of Australia(c) | | | 46,221 | |
See accompanying notes to consolidated financial statements.
FULCRUM DIVERSIFIED ABSOLUTE RETURN FUND
CONSOLIDATED SCHEDULE OF INVESTMENTS (Continued)
June 30, 2024
| Shares | | | | | Fair Value | |
| | | | | COMMON STOCKS — 16.7% (Continued) | | | | |
| | | | | BANKING - 0.5% (Continued) | | | | |
| | 8,608 | | | HSBC Holdings PLC(c) | | $ | 74,418 | |
| | 3,226 | | | Intesa Sanpaolo SpA(c) | | | 11,995 | |
| | 1,586 | | | JPMorgan Chase & Company | | | 320,785 | |
| | 56 | | | KBC Group N.V.(c) | | | 3,953 | |
| | 43 | | | Macquarie Group Ltd.(c) | | | 5,871 | |
| | 6,552 | | | Mitsubishi UFJ Financial Group, Inc.(c) | | | 70,421 | |
| | 374 | | | Nordea Bank Abp(c) | | | 4,450 | |
| | 657 | | | Royal Bank of Canada(c) | | | 69,940 | |
| | 378 | | | Toronto-Dominion Bank (The)(c) | | | 20,776 | |
| | 1,151 | | | Wells Fargo & Company | | | 68,358 | |
| | | | | | | | 950,739 | |
| | | | | BEVERAGES - 0.1% | | | | |
| | 2,049 | | | Celsius Holdings, Inc.(b) | | | 116,977 | |
| | 1,269 | | | Monster Beverage Corporation(b) | | | 63,387 | |
| | | | | | | | 180,364 | |
| | | | | BIOTECHNOLOGY & PHARMACEUTICALS - 0.8% | | | | |
| | 540 | | | AbbVie, Inc. | | | 92,621 | |
| | 244 | | | Amgen, Inc. | | | 76,238 | |
| | 789 | | | AstraZeneca PLC(c) | | | 123,237 | |
| | 119 | | | Bayer A.G.(c) | | | 3,363 | |
| | 960 | | | Bristol-Myers Squibb Company | | | 39,869 | |
| | 625 | | | CSL Ltd.(c) | | | 123,070 | |
| | 429 | | | Eli Lilly & Company | | | 388,407 | |
| | 4 | | | GRAIL, Inc.(b) | | | 67 | |
| | 845 | | | Johnson & Johnson | | | 123,505 | |
| | 772 | | | Merck & Company, Inc. | | | 95,574 | |
| | 2,028 | | | Novo Nordisk A/S(c) | | | 292,883 | |
| | 1,258 | | | Rhythm Pharmaceuticals, Inc.(b) | | | 51,653 | |
| | 340 | | | Sanofi S/A(c) | | | 32,758 | |
| | 2,147 | | | Structure Therapeutics, Inc. - ADR(b) | | | 84,313 | |
| | 1,461 | | | Viking Therapeutics, Inc.(b) | | | 77,448 | |
| | | | | | | | 1,605,006 | |
See accompanying notes to consolidated financial statements.
FULCRUM DIVERSIFIED ABSOLUTE RETURN FUND
CONSOLIDATED SCHEDULE OF INVESTMENTS (Continued)
June 30, 2024
| Shares | | | | | Fair Value | |
| | | | | COMMON STOCKS — 16.7% (Continued) | | | | |
| | | | | CABLE & SATELLITE - 0.0%(a) | | | | |
| | 1,234 | | | Comcast Corporation, Class A | | $ | 48,323 | |
| | | | | | | | | |
| | | | | CHEMICALS - 0.1% | | | | |
| | 32 | | | Arkema S/A(c) | | | 2,782 | |
| | 210 | | | Dow, Inc. | | | 11,141 | |
| | 518 | | | Sherwin-Williams Company (The) | | | 154,586 | |
| | 26 | | | Yara International ASA(c) | | | 749 | |
| | | | | | | | 169,258 | |
| | | | | COMMERCIAL SUPPORT SERVICES - 0.2% | | | | |
| | 3,896 | | | Castellum A.B.(b)(c) | | | 47,575 | |
| | 210 | | | Compass Group PLC(c) | | | 5,734 | |
| | 1,897 | | | Daiseki Company Ltd.(c) | | | 44,104 | |
| | 68 | | | Intertek Group PLC(c) | | | 4,121 | |
| | 1,670 | | | Recruit Holdings Company Ltd.(c) | | | 89,351 | |
| | 334 | | | Republic Services, Inc. | | | 64,910 | |
| | 601 | | | Waste Connections, Inc.(c) | | | 105,435 | |
| | 373 | | | Waste Management, Inc. | | | 79,576 | |
| | | | | | | | 440,806 | |
| | | | | CONSTRUCTION MATERIALS - 0.1% | | | | |
| | 1,199 | | | Holcim A.G.(c) | | | 106,269 | |
| | 994 | | | Kingspan Group PLC(c) | | | 84,652 | |
| | 129 | | | Owens Corning | | | 22,410 | |
| | | | | | | | 213,331 | |
| | | | | CONTAINERS & PACKAGING - 0.1% | | | | |
| | 664 | | | AptarGroup, Inc. | | | 93,497 | |
| | 4,314 | | | Billerud Aktiebolag(c) | | | 39,937 | |
| | | | | | | | 133,434 | |
| | | | | DATA CENTER REIT - 0.1% | | | | |
| | 161 | | | Equinix, Inc. | | | 121,812 | |
| | | | | | | | | |
| | | | | DIVERSIFIED INDUSTRIALS - 0.3% | | | | |
| | 979 | | | Eaton Corporation PLC(c) | | | 306,965 | |
| | 2,037 | | | Emerson Electric Company | | | 224,396 | |
| | | | | | | | 531,361 | |
See accompanying notes to consolidated financial statements.
FULCRUM DIVERSIFIED ABSOLUTE RETURN FUND
CONSOLIDATED SCHEDULE OF INVESTMENTS (Continued)
June 30, 2024
| Shares | | | | | Fair Value | |
| | | | | COMMON STOCKS — 16.7% (Continued) | | | | |
| | | | | E-COMMERCE DISCRETIONARY - 0.3% | | | | |
| | 3,088 | | | Amazon.com, Inc.(b) | | $ | 596,756 | |
| | | | | | | | | |
| | | | | ELECTRIC UTILITIES - 1.6% | | | | |
| | 8,040 | | | AES Corporation (The) | | | 141,263 | |
| | 3,213 | | | Alliant Energy Corporation | | | 163,542 | |
| | 1,886 | | | Ameren Corporation | | | 134,113 | |
| | 2,509 | | | American Electric Power Company, Inc. | | | 220,141 | |
| | 1,721 | | | Boralex, Inc.(c) | | | 42,150 | |
| | 2,024 | | | Consolidated Edison, Inc. | | | 180,986 | |
| | 1,078 | | | Constellation Energy Corporation | | | 215,891 | |
| | 1,113 | | | Duke Energy Corporation | | | 111,556 | |
| | 4,014 | | | Edison International | | | 288,246 | |
| | 472 | | | EDP Renovaveis S/A(c) | | | 6,598 | |
| | 9,611 | | | Enel SpA(c) | | | 66,860 | |
| | 1,086 | | | Engie S/A(c) | | | 15,513 | |
| | 2,722 | | | Evergy, Inc. | | | 144,184 | |
| | 2,574 | | | Eversource Energy | | | 145,972 | |
| | 318 | | | Hydro One Ltd.(c) | | | 9,262 | |
| | 6,400 | | | Iberdrola S/A(c) | | | 83,059 | |
| | 4,518 | | | National Grid PLC(c) | | | 50,408 | |
| | 4,014 | | | NextEra Energy, Inc. | | | 284,232 | |
| | 1,501 | | | Pinnacle West Capital Corporation | | | 114,646 | |
| | 802 | | | PNM Resources, Inc. | | | 29,642 | |
| | 1,340 | | | Public Service Enterprise Group, Inc. | | | 98,758 | |
| | 515 | | | RWE A.G.(c) | | | 17,626 | |
| | 2,697 | | | SEMPRA | | | 205,134 | |
| | 2,302 | | | Southern Company (The) | | | 178,566 | |
| | 2,233 | | | WEC Energy Group, Inc. | | | 175,201 | |
| | | | | | | | 3,123,549 | |
| | | | | ELECTRICAL EQUIPMENT - 0.7% | | | | |
| | 1,357 | | | AMETEK, Inc. | | | 226,226 | |
| | 3,264 | | | Amphenol Corporation, Class A | | | 219,896 | |
| | 755 | | | Assa Abloy A.B., Class B(c) | | | 21,346 | |
| | 815 | | | Daikin Industries Ltd.(c) | | | 113,334 | |
See accompanying notes to consolidated financial statements.
FULCRUM DIVERSIFIED ABSOLUTE RETURN FUND
CONSOLIDATED SCHEDULE OF INVESTMENTS (Continued)
June 30, 2024
| Shares | | | | | Fair Value | |
| | | | | COMMON STOCKS — 16.7% (Continued) | | | | |
| | | | | ELECTRICAL EQUIPMENT - 0.7% (Continued) | | | | |
| | 615 | | | Hubbell, Inc. | | $ | 224,770 | |
| | 46 | | | Lennox International, Inc. | | | 24,609 | |
| | 514 | | | Nibe Industrier A.B.(c) | | | 2,180 | |
| | 21 | | | Novanta, Inc.(b) | | | 3,425 | |
| | 2,670 | | | nVent Electric PLC(c) | | | 204,549 | |
| | 15 | | | Schindler Holding A.G.(c) | | | 3,770 | |
| | 753 | | | Schneider Electric S.E.(c) | | | 180,930 | |
| | 512 | | | Trane Technologies PLC(c) | | | 168,412 | |
| | | | | | | | 1,393,447 | |
| | | | | ENGINEERING & CONSTRUCTION - 0.3% | | | | |
| | 328 | | | AECOM | | | 28,910 | |
| | 404 | | | Arcosa, Inc. | | | 33,698 | |
| | 3,150 | | | Cellnex Telecom S/A(c) | | | 102,479 | |
| | 149 | | | Comfort Systems USA, Inc. | | | 45,314 | |
| | 571 | | | Construction Partners, Inc., Class A(b) | | | 31,525 | |
| | 961 | | | Fluor Corporation(b) | | | 41,852 | |
| | 542 | | | Granite Construction, Inc. | | | 33,588 | |
| | 110 | | | Installed Building Products, Inc. | | | 22,625 | |
| | 260 | | | Jacobs Solutions, Inc. | | | 36,325 | |
| | 588 | | | KBR, Inc. | | | 37,714 | |
| | 384 | | | Primoris Services Corporation | | | 19,158 | |
| | 171 | | | Quanta Services, Inc. | | | 43,449 | |
| | 466 | | | Sterling Infrastructure, Inc.(b) | | | 55,146 | |
| | 206 | | | Tetra Tech, Inc. | | | 42,123 | |
| | 60 | | | TopBuild Corporation(b) | | | 23,116 | |
| | | | | | | | 597,022 | |
| | | | | ENTERTAINMENT CONTENT - 0.1% | | | | |
| | 234 | | | Capcom Company Ltd.(c) | | | 4,412 | |
| | 148 | | | Konami Group Corporation(c) | | | 10,654 | |
| | 104 | | | Square Enix Holdings Company Ltd.(c) | | | 3,124 | |
| | 546 | | | Take-Two Interactive Software, Inc.(b) | | | 84,897 | |
| | | | | | | | 103,087 | |
| | | | | FOOD - 0.5% | | | | |
| | 707 | | | Bakkafrost P/F(c) | | | 35,893 | |
See accompanying notes to consolidated financial statements.
FULCRUM DIVERSIFIED ABSOLUTE RETURN FUND
CONSOLIDATED SCHEDULE OF INVESTMENTS (Continued)
June 30, 2024
| Shares | | | | | Fair Value | |
| | | | | COMMON STOCKS — 16.7% (Continued) | | | | |
| | | | | FOOD - 0.5% (Continued) | | | | |
| | 5,381 | | | BellRing Brands, Inc.(b) | | $ | 307,470 | |
| | 4,813 | | | Mowi ASA(c) | | | 80,111 | |
| | 1,995 | | | Nestle S/A(c) | | | 203,691 | |
| | 128 | | | Salmar ASA(c) | | | 6,738 | |
| | 1,806 | | | Simply Good Foods Company (The)(b) | | | 65,251 | |
| | 6,708 | | | Vital Farms, Inc.(b) | | | 313,733 | |
| | | | | | | | 1,012,887 | |
| | | | | FORESTRY, PAPER & WOOD PRODUCTS - 0.0%(a) | | | | |
| | 970 | | | West Fraser Timber Company Ltd.(c) | | | 74,490 | |
| | | | | | | | | |
| | | | | GAS & WATER UTILITIES - 0.1% | | | | |
| | 1,822 | | | American Water Works Company, Inc. | | | 235,329 | |
| | 1,078 | | | Veolia Environnement S/A(c) | | | 32,242 | |
| | | | | | | | 267,571 | |
| | | | | HEALTH CARE FACILITIES & SERVICES - 1.5% | | | | |
| | 4,889 | | | Cardinal Health, Inc. | | | 480,686 | |
| | 2,412 | | | Cencora, Inc. | | | 543,424 | |
| | 2,612 | | | Centene Corporation(b) | | | 173,176 | |
| | 710 | | | Cigna Group (The) | | | 234,705 | |
| | 831 | | | CVS Health Corporation | | | 49,079 | |
| | 591 | | | Elevance Health, Inc. | | | 320,239 | |
| | 177 | | | Humana, Inc. | | | 66,136 | |
| | 14 | | | Lonza Group A.G.(c) | | | 7,643 | |
| | 1,242 | | | McKesson Corporation | | | 725,377 | |
| | 388 | | | Molina Healthcare, Inc.(b) | | | 115,352 | |
| | 616 | | | UnitedHealth Group, Inc. | | | 313,704 | |
| | | | | | | | 3,029,521 | |
| | | | | HOME CONSTRUCTION - 0.5% | | | | |
| | 244 | | | Armstrong World Industries, Inc. | | | 27,631 | |
| | 525 | | | AZEK Company, Inc. (The)(b) | | | 22,118 | |
| | 1,185 | | | DR Horton, Inc. | | | 167,002 | |
| | 263 | | | Fortune Brands Innovations, Inc. | | | 17,079 | |
| | 1,944 | | | KB Home | | | 136,430 | |
| | 599 | | | Lennar Corporation, Class A | | | 89,772 | |
See accompanying notes to consolidated financial statements.
FULCRUM DIVERSIFIED ABSOLUTE RETURN FUND
CONSOLIDATED SCHEDULE OF INVESTMENTS (Continued)
June 30, 2024
| Shares | | | | | Fair Value | |
| | | | | COMMON STOCKS — 16.7% (Continued) | | | | |
| | | | | HOME CONSTRUCTION - 0.5% (Continued) | | | | |
| | 404 | | | LGI Homes, Inc.(b) | | $ | 36,154 | |
| | 275 | | | Masco Corporation | | | 18,334 | |
| | 239 | | | Meritage Homes Corporation | | | 38,682 | |
| | 19 | | | NVR, Inc.(b) | | | 144,183 | |
| | 1,220 | | | PulteGroup, Inc. | | | 134,322 | |
| | 1,541 | | | Taylor Morrison Home Corporation(b) | | | 85,433 | |
| | 749 | | | Toll Brothers, Inc. | | | 86,270 | |
| | 2,009 | | | Tri Pointe Homes, Inc.(b) | | | 74,835 | |
| | | | | | | | 1,078,245 | |
| | | | | HOUSEHOLD PRODUCTS - 0.3% | | | | |
| | 1,351 | | | Church & Dwight Company, Inc. | | | 140,072 | |
| | 156 | | | Colgate-Palmolive Company | | | 15,138 | |
| | 45 | | | Estee Lauder Companies, Inc. (The), Class A | | | 4,788 | |
| | 1,545 | | | Procter & Gamble Company (The) | | | 254,801 | |
| | 287 | | | Reckitt Benckiser Group PLC(c) | | | 15,535 | |
| | 3,432 | | | Unicharm Corporation(c) | | | 110,236 | |
| | | | | | | | 540,570 | |
| | | | | INDUSTRIAL REIT - 0.1% | | | | |
| | 783 | | | Prologis, Inc. | | | 87,939 | |
| | 130 | | | Warehouses De Pauw CVA(c) | | | 3,523 | |
| | | | | | | | 91,462 | |
| | | | | INDUSTRIAL SUPPORT SERVICES - 0.0%(a) | | | | |
| | 53 | | | Ashtead Group PLC(c) | | | 3,539 | |
| | 81 | | | Ferguson PLC(c) | | | 15,686 | |
| | 95 | | | SiteOne Landscape Supply, Inc.(b) | | | 11,534 | |
| | 42 | | | United Rentals, Inc. | | | 27,162 | |
| | | | | | | | 57,921 | |
| | | | | INFRASTRUCTURE REIT - 0.0%(a) | | | | |
| | 94 | | | American Tower Corporation, Class A | | | 18,272 | |
| | | | | | | | | |
| | | | | INSTITUTIONAL FINANCIAL SERVICES - 0.1% | | | | |
| | 191 | | | CME Group, Inc. | | | 37,551 | |
| | 135 | | | Deutsche Boerse A.G.(c) | | | 27,636 | |
| | 689 | | | Interactive Brokers Group, Inc., Class A | | | 84,471 | |
See accompanying notes to consolidated financial statements.
FULCRUM DIVERSIFIED ABSOLUTE RETURN FUND
CONSOLIDATED SCHEDULE OF INVESTMENTS (Continued)
June 30, 2024
| Shares | | | | | Fair Value | |
| | | | | COMMON STOCKS — 16.7% (Continued) | | | | |
| | | | | INSTITUTIONAL FINANCIAL SERVICES - 0.1% (Continued) | | | | |
| | 299 | | | London Stock Exchange Group PLC(c) | | $ | 35,529 | |
| | 881 | | | Morgan Stanley | | | 85,625 | |
| | | | | | | | 270,812 | |
| | | | | INSURANCE - 0.5% | | | | |
| | 27 | | | Allstate Corporation (The) | | | 4,311 | |
| | 41 | | | Aon PLC, Class A(c) | | | 12,037 | |
| | 114 | | | Arch Capital Group Ltd.(b)(c) | | | 11,501 | |
| | 395 | | | Arthur J Gallagher & Company | | | 102,427 | |
| | 501 | | | Berkshire Hathaway, Inc., Class B(b) | | | 203,806 | |
| | 486 | | | Chubb Ltd. (c) | | | 123,969 | |
| | 276 | | | Coface S/A(c) | | | 3,847 | |
| | 129 | | | Fairfax Financial Holdings Ltd.(c) | | | 146,736 | |
| | 1,109 | | | Hartford Financial Services Group, Inc. (The) | | | 111,499 | |
| | 149 | | | Marsh & McLennan Companies, Inc. | | | 31,397 | |
| | 876 | | | MS&AD Insurance Group Holdings, Inc.(c) | | | 19,468 | |
| | 178 | | | Progressive Corporation (The) | | | 36,972 | |
| | 126 | | | SCOR S.E.(c) | | | 3,194 | |
| | 5 | | | Swiss Life Holding A.G.(c) | | | 3,677 | |
| | 817 | | | Tokio Marine Holdings, Inc.(c) | | | 30,498 | |
| | 501 | | | Travelers Companies, Inc. (The) | | | 101,873 | |
| | 877 | | | Voya Financial, Inc. | | | 62,399 | |
| | | | | | | | 1,009,611 | |
| | | | | INTERNET MEDIA & SERVICES - 0.7% | | | | |
| | 484 | | | Airbnb, Inc., Class A(b) | | | 73,389 | |
| | 1,789 | | | Alphabet, Inc., Class A | | | 325,867 | |
| | 1,560 | | | Alphabet, Inc., Class C | | | 286,136 | |
| | 401 | | | Auto Trader Group PLC(c) | | | 4,061 | |
| | 744 | | | Meta Platforms, Inc., Class A | | | 375,140 | |
| | 172 | | | Netflix, Inc.(b) | | | 116,079 | |
| | 30 | | | REA Group Ltd.(c) | | | 3,935 | |
| | 500 | | | Rightmove PLC(c) | | | 3,394 | |
| | 379 | | | Shopify, Inc., Class A(b)(c) | | | 25,044 | |
| | 49 | | | Spotify Technology S/A(b)(c) | | | 15,376 | |
See accompanying notes to consolidated financial statements.
FULCRUM DIVERSIFIED ABSOLUTE RETURN FUND
CONSOLIDATED SCHEDULE OF INVESTMENTS (Continued)
June 30, 2024
| Shares | | | | | Fair Value | |
| | | | | COMMON STOCKS — 16.7% (Continued) | | | | |
| | | | | INTERNET MEDIA & SERVICES - 0.7% (Continued) | | | | |
| | 1,885 | | | Uber Technologies, Inc.(b) | | $ | 137,002 | |
| | | | | | | | 1,365,423 | |
| | | | | LEISURE FACILITIES & SERVICES - 0.3% | | | | |
| | 4,108 | | | Chipotle Mexican Grill, Inc.(b) | | | 257,366 | |
| | 219 | | | McDonald’s Corporation | | | 55,810 | |
| | 1,094 | | | Starbucks Corporation | | | 85,168 | |
| | 1,026 | | | TKO Group Holdings, Inc. | | | 110,798 | |
| | | | | | | | 509,142 | |
| | | | | MACHINERY - 0.1% | | | | |
| | 1,580 | | | Atlas Copco A.B., Class A(c) | | | 29,701 | |
| | 303 | | | Atlas Copco A.B., Class B(c) | | | 4,894 | |
| | 702 | | | Crane Company | | | 101,776 | |
| | 1,186 | | | Ingersoll Rand, Inc. | | | 107,736 | |
| | 301 | | | TOMRA Systems ASA(c) | | | 3,592 | |
| | | | | | | | 247,699 | |
| | | | | MEDICAL EQUIPMENT & DEVICES - 0.2% | | | | |
| | 1,099 | | | Boston Scientific Corporation(b) | | | 84,634 | |
| | 324 | | | Cochlear Ltd.(c) | | | 71,783 | |
| | 930 | | | Edwards Lifesciences Corporation(b) | | | 85,904 | |
| | 1,051 | | | Hoya Corporation(c) | | | 122,207 | |
| | 26 | | | Illumina, Inc.(b) | | | 2,714 | |
| | 224 | | | Insulet Corporation(b) | | | 45,203 | |
| | 31 | | | Mettler-Toledo International, Inc.(b) | | | 43,325 | |
| | | | | | | | 455,770 | |
| | | | | METALS & MINING - 0.2% | | | | |
| | 20,985 | | | Denison Mines Corporation(b)(c) | | | 42,025 | |
| | 4,755 | | | Energy Fuels, Inc.(b)(c) | | | 28,811 | |
| | 645 | | | Franco-Nevada Corporation(c) | | | 76,446 | |
| | 170 | | | Glencore PLC(c) | | | 969 | |
| | 724 | | | Hecla Mining Company | | | 3,511 | |
| | 1,115 | | | Newmont Corporation | | | 46,685 | |
| | 217 | | | Pan American Silver Corporation(c) | | | 4,314 | |
| | 607 | | | Rio Tinto Ltd.(c) | | | 48,181 | |
| | 933 | | | Rio Tinto PLC(c) | | | 61,341 | |
See accompanying notes to consolidated financial statements.
FULCRUM DIVERSIFIED ABSOLUTE RETURN FUND
CONSOLIDATED SCHEDULE OF INVESTMENTS (Continued)
June 30, 2024
| Shares | | | | | Fair Value | |
| | | | | COMMON STOCKS — 16.7% (Continued) | | | | |
| | | | | METALS & MINING - 0.2% (Continued) | | | | |
| | 30 | | | Royal Gold, Inc. | | $ | 3,755 | |
| | | | | | | | 316,038 | |
| | | | | MULTI ASSET CLASS REIT - 0.0%(a) | | | | |
| | 5,218 | | | Segro PLC(c) | | | 59,246 | |
| | | | | | | | | |
| | | | | OIL & GAS PRODUCERS - 0.3% | | | | |
| | 3,607 | | | Antero Resources Corporation(b) | | | 117,697 | |
| | 1,415 | | | BP PLC(c) | | | 8,500 | |
| | 1,797 | | | CNX Resources Corporation(b) | | | 43,667 | |
| | 4,598 | | | Eni SpA(c) | | | 70,701 | |
| | 3,374 | | | Itochu Enex Company Ltd.(c) | | | 31,901 | |
| | 245 | | | Murphy USA, Inc. | | | 115,018 | |
| | 1,896 | | | Ovintiv, Inc. | | | 88,866 | |
| | 1,299 | | | Parkland Corporation(c) | | | 36,410 | |
| | | | | | | | 512,760 | |
| | | | | OIL & GAS SERVICES & EQUIPMENT - 0.2% | | | | |
| | 8,879 | | | Aker Solutions ASA(c) | | | 36,760 | |
| | 3,729 | | | Baker Hughes Company | | | 131,149 | |
| | 2,220 | | | Expro Group Holdings N.V.(b) | | | 50,882 | |
| | 1,872 | | | Schlumberger N.V.(c) | | | 88,321 | |
| | | | | | | | 307,112 | |
| | | | | PUBLISHING & BROADCASTING - 0.0%(a) | | | | |
| | 3,700 | | | Future PLC(c) | | | 49,064 | |
| | 128 | | | Schibsted ASA(c) | | | 3,779 | |
| | | | | | | | 52,843 | |
| | | | | RESIDENTIAL REIT - 0.0%(a) | | | | |
| | 19 | | | AvalonBay Communities, Inc. | | | 3,931 | |
| | 278 | | | UNITE Group PLC (The)(c) | | | 3,135 | |
| | | | | | | | 7,066 | |
| | | | | RETAIL - CONSUMER STAPLES - 1.3% | | | | |
| | 871 | | | Costco Wholesale Corporation | | | 740,341 | |
| | 8,712 | | | Hims & Hers Health, Inc.(b) | | | 175,895 | |
| | 1,442 | | | Kroger Company (The) | | | 71,999 | |
| | 2,595 | | | Sprouts Farmers Market, Inc.(b) | | | 217,098 | |
See accompanying notes to consolidated financial statements.
FULCRUM DIVERSIFIED ABSOLUTE RETURN FUND
CONSOLIDATED SCHEDULE OF INVESTMENTS (Continued)
June 30, 2024
| Shares | | | | | Fair Value | |
| | | | | COMMON STOCKS — 16.7% (Continued) | | | | |
| | | | | RETAIL - CONSUMER STAPLES - 1.3% (Continued) | | | | |
| | 17,708 | | | Tesco PLC(c) | | $ | 68,498 | |
| | 18,285 | | | Walmart, Inc. | | | 1,238,077 | |
| | | | | | | | 2,511,908 | |
| | | | | RETAIL - DISCRETIONARY - 0.3% | | | | |
| | 449 | | | Brunello Cucinelli SpA(c) | | | 44,972 | |
| | 119 | | | Builders FirstSource, Inc.(b) | | | 16,471 | |
| | 506 | | | Home Depot, Inc. (The) | | | 174,185 | |
| | 39,617 | | | JD Sports Fashion PLC(c) | | | 59,846 | |
| | 410 | | | Lowe’s Companies, Inc. | | | 90,389 | |
| | 210 | | | Lululemon Athletica, Inc.(b) | | | 62,727 | |
| | 903 | | | Pets at Home Group PLC(c) | | | 3,372 | |
| | 1,122 | | | TJX Companies, Inc. (The) | | | 123,532 | |
| | | | | | | | 575,494 | |
| | | | | RETAIL REIT - 0.0%(a) | | | | |
| | 63 | | | Realty Income Corporation | | | 3,328 | |
| | | | | | | | | |
| | | | | SELF-STORAGE REIT - 0.0%(a) | | | | |
| | 235 | | | Big Yellow Group PLC(c) | | | 3,488 | |
| | 31 | | | Public Storage | | | 8,917 | |
| | | | | | | | 12,405 | |
| | | | | SEMICONDUCTORS - 1.1% | | | | |
| | 559 | | | Applied Materials, Inc. | | | 131,918 | |
| | 262 | | | BE Semiconductor Industries N.V.(c) | | | 43,826 | |
| | 186 | | | Broadcom, Inc. | | | 298,629 | |
| | 258 | | | Infineon Technologies A.G.(c) | | | 9,481 | |
| | 104 | | | KLA Corporation | | | 85,749 | |
| | 121 | | | Lam Research Corporation | | | 128,847 | |
| | 285 | | | Microchip Technology, Inc. | | | 26,078 | |
| | 1,078 | | | Micron Technology, Inc. | | | 141,789 | |
| | 8,141 | | | NVIDIA Corporation | | | 1,005,739 | |
| | 359 | | | NXP Semiconductors N.V.(c) | | | 96,603 | |
| | 357 | | | QUALCOMM, Inc. | | | 71,107 | |
| | 565 | | | Taiwan Semiconductor Manufacturing Company Ltd. - ADR | | | 98,202 | |
| | | | | | | | 2,137,968 | |
See accompanying notes to consolidated financial statements.
FULCRUM DIVERSIFIED ABSOLUTE RETURN FUND
CONSOLIDATED SCHEDULE OF INVESTMENTS (Continued)
June 30, 2024
| Shares | | | | | Fair Value | |
| | | | | COMMON STOCKS — 16.7% (Continued) | | | | |
| | | | | SOFTWARE - 1.2% | | | | |
| | 150 | | | Adobe, Inc.(b) | | $ | 83,331 | |
| | 525 | | | Akamai Technologies, Inc.(b) | | | 47,292 | |
| | 202 | | | ANSYS, Inc.(b) | | | 64,943 | |
| | 82 | | | Autodesk, Inc.(b) | | | 20,291 | |
| | 338 | | | Cadence Design Systems, Inc.(b) | | | 104,020 | |
| | 19 | | | Cloudflare, Inc., Class A(b) | | | 1,574 | |
| | 66 | | | Crowdstrike Holdings, Inc., Class A(b) | | | 25,291 | |
| | 141 | | | Dassault Systemes S.E.(c) | | | 5,332 | |
| | 129 | | | Elastic N.V.(b) | | | 14,694 | |
| | 406 | | | Fortinet, Inc.(b) | | | 24,470 | |
| | 45 | | | HubSpot, Inc.(b) | | | 26,541 | |
| | 115 | | | Intuit, Inc. | | | 75,579 | |
| | 339 | | | JFrog Ltd.(b) | | | 12,729 | |
| | 2,470 | | | Microsoft Corporation | | | 1,103,966 | |
| | 59 | | | nCino, Inc.(b) | | | 1,856 | |
| | 40 | | | Okta, Inc.(b) | | | 3,744 | |
| | 1,049 | | | Oracle Corporation | | | 148,118 | |
| | 278 | | | Palo Alto Networks, Inc.(b) | | | 94,245 | |
| | 138 | | | Pegasystems, Inc. | | | 8,353 | |
| | 21 | | | PTC, Inc.(b) | | | 3,815 | |
| | 173 | | | Qualys, Inc.(b) | | | 24,670 | |
| | 208 | | | Rapid7, Inc.(b) | | | 8,992 | |
| | 83 | | | Roper Technologies, Inc. | | | 46,784 | |
| | 434 | | | Salesforce, Inc. | | | 111,581 | |
| | 323 | | | SAP S.E.(c) | | | 65,576 | |
| | 180 | | | ServiceNow, Inc.(b) | | | 141,601 | |
| | 199 | | | Smartsheet, Inc., Class A(b) | | | 8,772 | |
| | 33 | | | Synopsys, Inc.(b) | | | 19,637 | |
| | 385 | | | Tenable Holdings, Inc.(b) | | | 16,778 | |
| | 9 | | | Tyler Technologies, Inc.(b) | | | 4,525 | |
| | 159 | | | Varonis Systems, Inc.(b) | | | 7,627 | |
| | 37 | | | Veeva Systems, Inc., Class A(b) | | | 6,771 | |
| | 228 | | | Workday, Inc., Class A(b) | | | 50,972 | |
| | | | | | | | 2,384,470 | |
See accompanying notes to consolidated financial statements.
FULCRUM DIVERSIFIED ABSOLUTE RETURN FUND
CONSOLIDATED SCHEDULE OF INVESTMENTS (Continued)
June 30, 2024
| Shares | | | | | Fair Value | |
| | | | | COMMON STOCKS — 16.7% (Continued) | | | | |
| | | | | SPECIALTY FINANCE - 0.0%(a) | | | | |
| | 121 | | | American Express Company | | $ | 28,018 | |
| | | | | | | | | |
| | | | | STEEL - 0.0%(a) | | | | |
| | 36 | | | ArcelorMittal S/A(c) | | | 824 | |
| | 1,146 | | | Mitsui & Company Ltd.(c) | | | 26,010 | |
| | | | | | | | 26,834 | |
| | | | | TECHNOLOGY HARDWARE - 0.5% | | | | |
| | 4,462 | | | Apple, Inc. | | | 939,787 | |
| | 450 | | | Nintendo Company Ltd.(c) | | | 23,934 | |
| | 520 | | | Panasonic Holdings Corporation(c) | | | 4,257 | |
| | 800 | | | Sony Group Corporation(c) | | | 67,833 | |
| | 15 | | | Super Micro Computer, Inc.(b) | | | 12,290 | |
| | | | | | | | 1,048,101 | |
| | | | | TECHNOLOGY SERVICES - 0.6% | | | | |
| | 210 | | | Accenture PLC, Class A(c) | | | 63,716 | |
| | 3 | | | Adyen N.V.(b)(c) | | | 3,578 | |
| | 1,499 | | | Amadeus IT Group S/A(c) | | | 99,783 | |
| | 42 | | | Amdocs Ltd. | | | 3,315 | |
| | 83 | | | Automatic Data Processing, Inc. | | | 19,811 | |
| | 29 | | | Booz Allen Hamilton Holding Corporation | | | 4,463 | |
| | 386 | | | Broadridge Financial Solutions, Inc. | | | 76,042 | |
| | 103 | | | Computacenter PLC(c) | | | 3,739 | |
| | 147 | | | Corpay, Inc.(b) | | | 39,162 | |
| | 15 | | | Equifax, Inc. | | | 3,637 | |
| | 114 | | | Experian PLC(c) | | | 5,312 | |
| | 8 | | | FactSet Research Systems, Inc. | | | 3,266 | |
| | 25 | | | Fair Isaac Corporation(b) | | | 37,217 | |
| | 877 | | | Fiserv, Inc.(b) | | | 130,708 | |
| | 305 | | | International Business Machines Corporation | | | 52,750 | |
| | 57 | | | Jack Henry & Associates, Inc. | | | 9,463 | |
| | 439 | | | Mastercard, Inc., Class A | | | 193,669 | |
| | 53 | | | MSCI, Inc. | | | 25,533 | |
| | 1,079 | | | Netcompany Group A/S(b)(c) | | | 46,302 | |
| | 39 | | | Paychex, Inc. | | | 4,624 | |
See accompanying notes to consolidated financial statements.
FULCRUM DIVERSIFIED ABSOLUTE RETURN FUND
CONSOLIDATED SCHEDULE OF INVESTMENTS (Continued)
June 30, 2024
| Shares | | | | | Fair Value | |
| | | | | COMMON STOCKS — 16.7% (Continued) | | | | |
| | | | | TECHNOLOGY SERVICES - 0.6% (Continued) | | | | |
| | 329 | | | PayPal Holdings, Inc.(b) | | $ | 19,092 | |
| | 926 | | | QinetiQ Group PLC(c) | | | 5,188 | |
| | 376 | | | RELX PLC(c) | | | 17,296 | |
| | 220 | | | S&P Global, Inc. | | | 98,120 | |
| | 211 | | | Softcat PLC(c) | | | 4,846 | |
| | 17 | | | Verisk Analytics, Inc. | | | 4,582 | |
| | 828 | | | Visa, Inc., Class A | | | 217,326 | |
| | 311 | | | WEX, Inc.(b) | | | 55,091 | |
| | 134 | | | Wolters Kluwer N.V.(c) | | | 22,221 | |
| | | | | | | | 1,269,852 | |
| | | | | TELECOMMUNICATIONS - 0.0%(a) | | | | |
| | 214 | | | TELUS Corporation(c) | | | 3,239 | |
| | 107 | | | T-Mobile US, Inc. | | | 18,851 | |
| | 1,333 | | | Verizon Communications, Inc. | | | 54,973 | |
| | | | | | | | 77,063 | |
| | | | | TRANSPORTATION & LOGISTICS - 0.4% | | | | |
| | 1 | | | AP Moller - Maersk A/S - Series A(c) | | | 1,698 | |
| | 2,845 | | | Ardmore Shipping Corporation(c) | | | 64,098 | |
| | 1,733 | | | Canadian Pacific Kansas City Ltd.(c) | | | 136,464 | |
| | 632 | | | CH Robinson Worldwide, Inc. | | | 55,692 | |
| | 6,657 | | | DHT Holdings, Inc.(c) | | | 77,021 | |
| | 486 | | | DSV A/S(c) | | | 74,474 | |
| | 691 | | | Expeditors International of Washington, Inc. | | | 86,230 | |
| | 3,317 | | | Frontline PLC(c) | | | 85,446 | |
| | 1,445 | | | International Seaways, Inc. | | | 85,443 | |
| | 11 | | | Kuehne + Nagel International A.G.(c) | | | 3,164 | |
| | 952 | | | Scorpio Tankers, Inc.(c) | | | 77,388 | |
| | 2 | | | Svitzer A/S(b)(c) | | | 75 | |
| | 1,232 | | | Teekay Tankers Ltd., Class A(c) | | | 84,774 | |
| | | | | | | | 831,967 | |
| | | | | WHOLESALE - CONSUMER STAPLES - 0.0%(a) | | | | |
| | 536 | | | ITOCHU Corporation(c) | | | 26,169 | |
See accompanying notes to consolidated financial statements.
FULCRUM DIVERSIFIED ABSOLUTE RETURN FUND
CONSOLIDATED SCHEDULE OF INVESTMENTS (Continued)
June 30, 2024
| Shares | | | | | Fair Value | |
| | | | | COMMON STOCKS — 16.7% (Continued) | | | | |
| | | | | WHOLESALE - DISCRETIONARY - 0.0%(a) | | | | |
| | 2,133 | | | Toyota Tsusho Corporation(c) | | $ | 41,529 | |
| | | | | | | | | |
| | | | | TOTAL COMMON STOCKS (Cost $29,358,319) | | | 33,381,782 | |
| | | | | | | | | |
| | | | | EXCHANGE-TRADED FUNDS — 0.4% | | | | |
| | | | | EQUITY - 0.4% | | | | |
| | 3,748 | | | Global X MSCI Argentina ETF | | | 212,924 | |
| | 11,882 | | | iShares MSCI Taiwan ETF | | | 643,885 | |
| | | | | TOTAL EXCHANGE-TRADED FUNDS (Cost $770,665) | | | 856,809 | |
| | Contracts | | | | | Broker/
Counterparty | | | Expiration Date | | | Exercise Price | | | Notional Value | | | Fair Value | |
| | | | | CURRENCY OPTIONS PURCHASED - 0.8% | | | | | | | | | | | | | | | | | | |
| | | | | CALL OPTIONS PURCHASED - 0.3% | | | | | | | | | | | | | | | | | | |
| | | | | AUD/USD | | JPM | | | 07/08/2024 | | | $ | 0.7000 | | | $ | 207,000 | | | $ | 22 | |
| | | | | AUD/USD | | JPM | | | 09/17/2024 | | | | 0.7950 | | | | 3,129,000 | | | | 279 | |
| | | | | EUR/CHF | | JPM | | | 07/19/2024 | | | | 0.9750 | | | | 3,659,000 | | | | 5,200 | |
| | | | | EUR/GBP | | JPM | | | 07/11/2024 | | | | 0.8640 | | | | 598,000 | | | | 18,135 | |
| | | | | EUR/HUF | | JPM | | | 09/11/2024 | | | | 420.0000 | | | | 148,000 | | | | 10,043 | |
| | | | | EUR/NOK | | JPM | | | 07/26/2024 | | | | 11.4000 | | | | 3,924,000 | | | | 9,161 | |
| | | | | MXN/JPY | | JPM | | | 09/25/2024 | | | | 9.3000 | | | | 3,623,000 | | | | 25,608 | |
| | | | | USD/CNH | | JPM | | | 07/11/2024 | | | | 7.2600 | | | | 4,652,000 | | | | 5 | |
| | | | | USD/CNH | | JPM | | | 07/25/2024 | | | | 7.5000 | | | | 4,703,000 | | | | 50 | |
| | | | | USD/CNH | | JPM | | | 08/29/2024 | | | | 7.3000 | | | | 4,063,000 | | | | 2,757 | |
| | | | | USD/CNH | | JPM | | | 09/27/2024 | | | | 7.3700 | | | | 6,228,000 | | | | 14,532 | |
| | | | | USD/CNH | | JPM | | | 10/18/2024 | | | | 7.7000 | | | | 216,000 | | | | 3,337 | |
| | | | | USD/CNH | | JPM | | | 10/30/2024 | | | | 7.5000 | | | | 214,000 | | | | 15,749 | |
| | | | | USD/CNH | | JPM | | | 11/28/2024 | | | | 7.4500 | | | | 19,334,000 | | | | 59,010 | |
| | | | | USD/CNH | | JPM | | | 12/18/2024 | | | | 7.6250 | | | | 2,250,000 | | | | 134,276 | |
| | | | | USD/CNH | | JPM | | | 12/20/2024 | | | | 7.7750 | | | | 45,000 | | | | 1,289 | |
| | | | | USD/JPY | | JPM | | | 07/15/2024 | | | | 162.0000 | | | | 4,077,000 | | | | 14,285 | |
| | | | | USD/JPY | | JPM | | | 07/16/2024 | | | | 161.0000 | | | | 6,071,000 | | | | 5,052 | |
| | | | | USD/JPY | | JPM | | | 02/17/2025 | | | | 171.0000 | | | | 872,000 | | | | 93,214 | |
| | | | | USD/JPY | | JPM | | | 02/25/2025 | | | | 175.0000 | | | | 30,683,000 | | | | 118,909 | |
| | | | | USD/JPY | | JPM | | | 06/30/2025 | | | | 182.5000 | | | | 207,000 | | | | 9,608 | |
| | | | | USD/KRW | | JPM | | | 07/22/2024 | | | | 1,406.0000 | | | | 3,249,000 | | | | 5,574 | |
| | | | | USD/MXN | | JPM | | | 07/12/2024 | | | | 19.5000 | | | | 2,148,000 | | | | 421 | |
| | | | | USD/MXN | | JPM | | | 07/16/2024 | | | | 19.5000 | | | | 3,194,000 | | | | 357 | |
| | | | | USD/MXN | | JPM | | | 09/10/2024 | | | | 19.2000 | | | | 860,000 | | | | 12,288 | |
| | | | | USD/TWD | | JPM | | | 03/31/2025 | | | | 33.5000 | | | | 11,123,000 | | | | 86,817 | |
| | | | | TOTAL CALL OPTIONS PURCHASED (Cost - $755,924) | | | | | | | | | | | | | | | | | 645,978 | |
See accompanying notes to consolidated financial statements.
FULCRUM DIVERSIFIED ABSOLUTE RETURN FUND
CONSOLIDATED SCHEDULE OF INVESTMENTS (Continued)
June 30, 2024
| Contracts | | | | | Broker/
Counterparty | | | Expiration Date | | | Exercise Price | | | Notional Value | | | Fair Value | |
| | | | | CURRENCY OPTIONS PURCHASED - 0.8% (Continued) | | | | | | | | | | | | | | | | | | |
| | | | | PUT OPTIONS PURCHASED - 0.5% | | | | | | | | | | | | | | | | | | |
| | | | | EUR/AUD | | JPM | | | 07/11/2024 | | | $ | 1.6250 | | | $ | 6,254,000 | | | $ | 7 | |
| | | | | EUR/CHF | | JPM | | | 08/12/2024 | | | | 0.9250 | | | | 299,000 | | | | 19,244 | |
| | | | | EUR/GBP | | JPM | | | 07/11/2024 | | | | 0.8210 | | | | 149,000 | | | | 1,513 | |
| | | | | EUR/GBP | | JPM | | | 07/11/2024 | | | | 0.8350 | | | | 3,022,000 | | | | 759 | |
| | | | | EUR/USD | | JPM | | | 07/11/2024 | | | | 1.0700 | | | | 4,686,000 | | | | 6,614 | |
| | | | | EUR/USD | | JPM | | | 07/19/2024 | | | | 1.0110 | | | | 593,000 | | | | 6,003 | |
| | | | | EURUSD | | JPM | | | 07/19/2024 | | | | 1.0400 | | | | 3,983,000 | | | | 4,022 | |
| | | | | EUR/USD | | JPM | | | 07/23/2024 | | | | 1.0500 | | | | 201,000 | | | | 26,046 | |
| | | | | EUR/USD | | JPM | | | 08/09/2024 | | | | 1.0500 | | | | 1,236,000 | | | | 187,953 | |
| | | | | EUR/USD | | JPM | | | 08/13/2024 | | | | 1.0550 | | | | 1,238,000 | | | | 251,232 | |
| | | | | EUR/USD | | JPM | | | 09/11/2024 | | | | 1.0500 | | | | 967,000 | | | | 179,482 | |
| | | | | EUR/USD | | JPM | | | 09/27/2024 | | | | 1.0100 | | | | 256,000 | | | | 11,362 | |
| | | | | GBP/USD | | JPM | | | 07/12/2024 | | | | 1.2600 | | | | 2,798,000 | | | | 4,869 | |
| | | | | GBP/USD | | JPM | | | 07/17/2024 | | | | 1.1800 | | | | 60,000 | | | | 47 | |
| | | | | NOK/SEK | | JPM | | | 08/27/2024 | | | | 0.9600 | | | | 5,179,000 | | | | 43,724 | |
| | | | | USD/CHF | | JPM | | | 08/05/2024 | | | | 0.8500 | | | | 216,000 | | | | 1,864 | |
| | | | | USD/JPY | | JPM | | | 07/17/2024 | | | | 152.5000 | | | | 3,738,000 | | | | 1,968 | |
| | | | | USD/JPY | | JPM | | | 07/17/2024 | | | | 155.0000 | | | | 3,203,000 | | | | 3,707 | |
| | | | | USD/JPY | | JPM | | | 12/03/2026 | | | | 110.0000 | | | | 633,000 | | | | 43,218 | |
| | | | | USD/JPY | | JPM | | | 12/03/2026 | | | | 110.0000 | | | | 730,000 | | | | 38,623 | |
| | | | | USD/KRW | | JPM | | | 07/22/2024 | | | | 1,365.0000 | | | | 3,249,000 | | | | 10,522 | |
| | | | | USD/MXN | | JPM | | | 07/03/2024 | | | | 16.5000 | | | | 1,554,000 | | | | 2 | |
| | | | | USD/MXN | | JPM | | | 07/03/2024 | | | | 17.1000 | | | | 3,196,000 | | | | 3 | |
| | | | | USD/MXN | | JPM | | | 07/03/2024 | | | | 17.1000 | | | | 3,108,000 | | | | 3 | |
| | | | | USD/MXN | | JPM | | | 08/06/2024 | | | | 17.0000 | | | | 3,197,000 | | | | 191 | |
| | | | | USD/MXN | | JPM | | | 08/06/2024 | | | | 17.1500 | | | | 4,673,000 | | | | 398 | |
| | | | | USD/TRY | | JPM | | | 11/11/2024 | | | | 30.0000 | | | | 129,000 | | | | 619 | |
| | | | | USD/TRY | | JPM | | | 01/10/2025 | | | | 32.0000 | | | | 116,000 | | | | 3,463 | |
| | | | | USD/TRY | | JPM | | | 02/24/2025 | | | | 34.5000 | | | | 4,341,000 | | | | 25,920 | |
| | | | | USD/TRY | | JPM | | | 03/05/2025 | | | | 35.0000 | | | | 4,320,000 | | | | 33,240 | |
| | | | | USD/ZAR | | JPM | | | 07/12/2024 | | | | 18.3000 | | | | 3,208,000 | | | | 3 | |
| | | | | USD/ZAR | | JPM | | | 08/13/2024 | | | | 17.5000 | | | | 9,568,000 | | | | 44,993 | |
| | | | | XAU/USD | | JPM | | | 10/02/2024 | | | | 1,250.0000 | | | | 1,213,000 | | | | 21 | |
| | | | | TOTAL PUT OPTIONS PURCHASED (Cost - $1,207,259) | | | | | | | | | | | | | | | | | 951,635 | |
| | | | | | | | | | | | | | | | | | | | | | | |
| | | | | TOTAL CURRENCY OPTIONS PURCHASED (Cost - $1,963,183) | | | | | | | | | | | | | | | | | 1,597,613 | |
| | | | | | | | | | | | | | | | | | | | | | | |
| | | | | INDEX OPTIONS PURCHASED - 0.2%(d) | | | | | | | | | | | | | | | | | | |
| | | | | CALL OPTIONS PURCHASED - 0.2%(d) | | | | | | | | | | | | | | | | | | |
| | 700 | | | Chicago Board Options Exchange VIX US | | MS | | | 10/17/2024 | | | | 45.0000 | | | | 870,800 | | | | 26,600 | |
| | 700 | | | Chicago Board Options Exchange VIX US | | MS | | | 10/17/2024 | | | | 47.5000 | | | | 870,800 | | | | 23,100 | |
See accompanying notes to consolidated financial statements.
FULCRUM DIVERSIFIED ABSOLUTE RETURN FUND
CONSOLIDATED SCHEDULE OF INVESTMENTS (Continued)
June 30, 2024
| Contracts | | | | | Broker/
Counterparty | | | Expiration Date | | | Exercise Price | | | Notional Value | | | Fair Value | |
| | | | | INDEX OPTIONS PURCHASED - 0.2%(d) (Continued) | | | | | | | | | | | | | | | | | | |
| | | | | CALL OPTIONS PURCHASED - 0.2%(d) (Continued) | | | | | | | | | | | | | | | | | | |
| | 700 | | | Chicago Board Options Exchange VIX US | | MS | | | 10/17/2024 | | | $ | 50.0000 | | | $ | 870,800 | | | $ | 21,700 | |
| | 700 | | | Chicago Board Options Exchange VIX US | | MS | | | 10/17/2024 | | | | 55.0000 | | | | 870,800 | | | | 18,200 | |
| | 700 | | | Chicago Board Options Exchange VIX US | | MS | | | 10/17/2024 | | | | 60.0000 | | | | 870,800 | | | | 14,700 | |
| | 700 | | | Chicago Board Options Exchange VIX US | | MS | | | 10/17/2024 | | | | 65.0000 | | | | 870,800 | | | | 13,300 | |
| | 206 | | | FTSE 100 Index UKX(e) | | MS | | | 09/23/2024 | | | | 8,750.0000 | | | | 16,818,087 | | | | 42,967 | |
| | 6 | | | Nikkei 225 NKY(e) | | MS | | | 07/15/2024 | | | | 39,000.0000 | | | | 1,476,720 | | | | 30,025 | |
| | 6 | | | Nikkei 225 NKY(e) | | MS | | | 07/15/2024 | | | | 39,375.0000 | | | | 1,476,720 | | | | 20,887 | |
| | 6 | | | Nikkei 225 NKY(e) | | MS | | | 07/15/2024 | | | | 39,750.0000 | | | | 1,476,720 | | | | 13,241 | |
| | 6 | | | Nikkei 225 NKY(e) | | MS | | | 07/15/2024 | | | | 40,250.0000 | | | | 1,476,720 | | | | 6,714 | |
| | 6 | | | Tokyo Stock Exchange Tokyo Stock Price Index TPX(e) | | MS | | | 07/15/2024 | | | | 2,750.0000 | | | | 1,048,200 | | | | 26,109 | |
| | 6 | | | Tokyo Stock Exchange Tokyo Stock Price Index TPX(e) | | MS | | | 07/15/2024 | | | | 2,775.0000 | | | | 1,048,200 | | | | 19,022 | |
| | 6 | | | Tokyo Stock Exchange Tokyo Stock Price Index TPX(e) | | MS | | | 07/15/2024 | | | | 2,800.0000 | | | | 1,048,200 | | | | 13,054 | |
| | 6 | | | Tokyo Stock Exchange Tokyo Stock Price Index TPX(e) | | MS | | | 07/15/2024 | | | | 2,850.0000 | | | | 1,048,200 | | | | 4,849 | |
| | | | | TOTAL CALL OPTIONS PURCHASED (Cost - $287,514) | | | | | | | | | | | | | | | | | 294,468 | |
| | | | | | | | | | | | | | | | | | | | | | | |
| | | | | PUT OPTIONS PURCHASED - 0.0%(a)(d) | | | | | | | | | | | | | | | | | | |
| | 6 | | | Nikkei 225 NKY(e) | | MS | | | 07/15/2024 | | | | 37,375.0000 | | | | 1,476,720 | | | | 1,082 | |
| | 6 | | | Nikkei 225 NKY(e) | | MS | | | 07/15/2024 | | | | 37,875.0000 | | | | 1,476,720 | | | | 2,126 | |
| | 6 | | | Nikkei 225 NKY(e) | | MS | | | 07/15/2024 | | | | 38,375.0000 | | | | 1,476,720 | | | | 3,916 | |
| | 6 | | | Nikkei 225 NKY(e) | | MS | | | 07/15/2024 | | | | 38,625.0000 | | | | 1,476,720 | | | | 5,222 | |
| | 6 | | | Tokyo Stock Exchange Tokyo Stock Price Index TPX(e) | | MS | | | 07/15/2024 | | | | 2,625.0000 | | | | 1,048,200 | | | | 410 | |
| | 6 | | | Tokyo Stock Exchange Tokyo Stock Price Index TPX(e) | | MS | | | 07/15/2024 | | | | 2,675.0000 | | | | 1,048,200 | | | | 895 | |
| | 6 | | | Tokyo Stock Exchange Tokyo Stock Price Index TPX(e) | | MS | | | 07/15/2024 | | | | 2,700.0000 | | | | 1,048,200 | | | | 1,455 | |
| | 6 | | | Tokyo Stock Exchange Tokyo Stock Price Index TPX(e) | | MS | | | 07/15/2024 | | | | 2,725.0000 | | | | 1,048,200 | | | | 2,312 | |
| | | | | TOTAL PUT OPTIONS PURCHASED (Cost - $86,254) | | | | | | | | | | | | | | | | | 17,418 | |
| | | | | | | | | | | | | | | | | | | | | | | |
| | | | | TOTAL INDEX OPTIONS PURCHASED (Cost - $373,768) | | | | | | | | | | | | | | | | | 311,886 | |
| | | | | | | | | | | | | | | | | | | | | | | |
| | | | | OTC DUAL AND TRIPLE BINARY OPTIONS PURCHASED - 0.9%(h) | | | | | | | | | | | | | | | | | | |
| | | | | PUT OPTIONS PURCHASED - 0.9% | | | | | | | | | | | | | | | | | | |
| | 294,000 | | | DEDZ4 ≥ 152 and SX5E ≤ 5375 | | MS | | | 12/23/2024 | | | | | | | | 59,332 | | | | 250,060 | |
| | 210,000 | | | EURUSD ≤ 1.0628 and US2YRSOFR ≤ 3.749% | | MS | | | 07/09/2024 | | | | | | | | 15,330 | | | | - | |
| | 156,000 | | | EURUSD ≤ 1.0644 and AUDUSD ≥ 0.6657 | | MS | | | 08/09/2024 | | | | | | | | 4,886 | | | | 11,286 | |
| | 247,000 | | | GBPUSD ≤ 1.2136 and SPX ≥ 5067.25 | | MS | | | 09/23/2024 | | | | | | | | 15,981 | | | | 19,139 | |
| | 588,000 | | | GLD US ≥ 194.3 and USO US ≤ 64.254 | | MS | | | 08/19/2024 | | | | | | | | 52,626 | | | | 12,612 | |
| | 1,032,000 | | | GLD US ≥ 198.93 and USO US ≤ 60.651 | | MS | | | 08/19/2024 | | | | | | | | 51,084 | | | | 8,504 | |
| | 780,000 | | | NKY ≥ 41013.50 and USDJPY ≤ 146.67 | | GS | | | 12/16/2024 | | | | | | | | 41,340 | | | | 18,613 | |
| | 779,000 | | | NKY ≥ 41386.35 and USDJPY ≤ 146.67 | | GS | | | 01/13/2025 | | | | | | | | 42,845 | | | | 21,017 | |
| | 748,000 | | | SPX ≤ 4652.75 and USDJPY ≤ 145.42 | | CIT | | | 03/24/2025 | | | | | | | | 60,588 | | | | 12,717 | |
| | 748,000 | | | SPX ≤ 4652.75 and USDJPY ≤ 145.42 | | CIT | | | 04/18/2025 | | | | | | | | 60,588 | | | | 15,257 | |
| | 766,000 | | | SPX ≤ 4675.28 and USDJPY ≤ 146.78 | | GS | | | 11/24/2025 | | | | | | | | 91,154 | | | | 41,911 | |
| | 766,000 | | | SPX ≤ 4675.28 and USDJPY ≤ 146.78 | | GS | | | 12/22/2025 | | | | | | | | 93,835 | | | | 41,316 | |
| | 748,000 | | | SPX ≤ 4757.30 and USDJPY ≤ 142.39 | | CIT | | | 03/24/2025 | | | | | | | | 60,588 | | | | 10,375 | |
| | 748,000 | | | SPX ≤ 4757.30 and USDJPY ≤ 142.39 | | CIT | | | 04/18/2025 | | | | | | | | 60,588 | | | | 12,134 | |
| | 763,000 | | | SPX ≤ 4760.29 and US5YRSOFR < 3.329% | | CIT | | | 07/22/2024 | | | | | | | | 62,566 | | | | 38 | |
See accompanying notes to consolidated financial statements.
FULCRUM DIVERSIFIED ABSOLUTE RETURN FUND
CONSOLIDATED SCHEDULE OF INVESTMENTS (Continued)
June 30, 2024
| Contracts | | | | | Broker/
Counterparty | | | Expiration Date | | | Exercise Price | | | Notional Value | | | Fair Value | |
| | | | | OTC DUAL AND TRIPLE BINARY OPTIONS PURCHASED - 0.9% (Continued)(h) | | | | | | | | | | | | | | | | | | |
| | | | | PUT OPTIONS PURCHASED - 0.9% (Continued) | | | | | | | | | | | | | | | | | | |
| | 775,000 | | | SPX < 4881.34 and US10YRSOFR ≥ 4.04% | | CIT | | | 12/23/2024 | | | | | | | $ | 37,588 | | | $ | 26,304 | |
| | 775,000 | | | SPX < 4881.34 and US10YRSOFR ≥ 4.120% | | CIT | | | 12/23/2024 | | | | | | | | 28,675 | | | | 22,829 | |
| | 782,000 | | | SPX < 5088.85 and US5YRSOFR ≥ 4.060% | | MS | | | 12/23/2024 | | | | | | | | 61,387 | | | | 38,993 | |
| | 783,000 | | | SPX ≤ 5088.85 and US5YRSOFR ≥ 4.066% | | MS | | | 12/16/2024 | | | | | | | | 61,466 | | | | 38,588 | |
| | 782,000 | | | SPX ≤ 5088.85 and US5YRSOFR ≥ 4.072% | | MS | | | 12/09/2024 | | | | | | | | 61,387 | | | | 37,663 | |
| | 783,000 | | | SPX ≤ 5088.85 and US5YRSOFR ≥ 4.078% | | MS | | | 12/02/2024 | | | | | | | | 61,466 | | | | 36,565 | |
| | 775,000 | | | SPX ≤ 5152.52 and US10YRSOFR ≥ 4.080% | | CIT | | | 12/23/2024 | | | | | | | | 47,663 | | | | 39,887 | |
| | 775,000 | | | SPX ≤ 5152.52 and US10YRSOFR ≥ 4.16% | | CIT | | | 12/23/2024 | | | | | | | | 75,950 | | | | 34,826 | |
| | 537,000 | | | SPX ≥ 5167.45 and USDCNH ≥ 7.25 | | CIT | | | 01/20/2025 | | | | | | | | 51,391 | | | | 158,588 | |
| | 781,000 | | | SPX ≥ 5488.88 and EURUSD ≤ 1.0445 | | CIT | | | 12/09/2024 | | | | | | | | 48,422 | | | | 77,672 | |
| | 781,000 | | | SPX ≥ 5488.88 and EURUSD ≤ 1.0445 | | CIT | | | 12/23/2024 | | | | | | | | 48,422 | | | | 82,432 | |
| | 771,000 | | | SPX ≥ 5510 and EURUSD ≤ 1.04 | | CIT | | | 11/25/2024 | | | | | | | | 37,548 | | | | 61,923 | |
| | 771,000 | | | SPX ≥ 5510 and EURUSD ≤ 1.04 | | CIT | | | 12/23/2024 | | | | | | | | 37,548 | | | | 68,898 | |
| | 771,000 | | | SPX ≥ 5599 and EURUSD ≤ 1.05 | | CIT | | | 11/25/2024 | | | | | | | | 37,548 | | | | 67,734 | |
| | 771,000 | | | SPX ≥ 5599 and EURUSD ≤ 1.05 | | CIT | | | 12/23/2024 | | | | | | | | 37,548 | | | | 76,265 | |
| | 78,000 | | | SPX ≥ 5908.50 and USDCNH ≥ 7.2680 | | JPM | | | 12/23/2024 | | | | | | | | 4,875 | | | | 5,567 | |
| | 786,000 | | | SPX ≥ 5937 and EURUSD ≤ 1.0594 | | GS | | | 12/02/2024 | | | | | | | | 42,051 | | | | 21,291 | |
| | 786,000 | | | SPX ≥ 5937 and EURUSD ≤ 1.0594 | | GS | | | 12/09/2024 | | | | | | | | 42,051 | | | | 22,268 | |
| | 786,000 | | | SPX ≥ 5937 and EURUSD ≤ 1.0594 | | GS | | | 12/16/2024 | | | | | | | | 42,051 | | | | 25,929 | |
| | 786,000 | | | SPX ≥ 5937 and EURUSD ≤ 1.0594 | | GS | | | 12/23/2024 | | | | | | | | 42,051 | | | | 27,666 | |
| | 1,660,000 | | | SPX≤4874.45 and USDJPY≤144.452 and CLV4≤67.473 | | CIT | | | 09/18/2024 | | | | | | | | 79,680 | | | | 738 | |
| | 2,168,000 | | | SPX≤4996.53 and USDJPY≤148.45 and CLV4≤69.82 | | CIT | | | 09/18/2024 | | | | | | | | 101,896 | | | | 3,105 | |
| | 209,000 | | | SX5E ≤ 5000.00 and DEDZ ≥ 160.00 | | MS | | | 12/23/2024 | | | | | | | | 55,852 | | | | 38,562 | |
| | 622,000 | | | US10YRSOFR ≥ 3.862% and USDJPY ≤ 153.8061 | | CIT | | | 08/16/2024 | | | | | | | | 58,468 | | | | 29,581 | |
| | 781,000 | | | US10YRSOFR ≥ 3.981% and USDJPY ≤ 156.18 | | CIT | | | 08/16/2024 | | | | | | | | 64,784 | | | | 51,134 | |
| | 783,000 | | | US10YRSOFR ≥ 3.981% and USDJPY ≤ 156.18 | | CIT | | | 08/30/2024 | | | | | | | | 64,950 | | | | 59,493 | |
| | 73,000 | | | USDCNH ≥ 7.3058 and USDMXN ≤ 16.7606 | | MS | | | 08/26/2024 | | | | | | | | 5,694 | | | | 576 | |
| | 200,000 | | | USDJPY ≥ 163.71 and USDMXN ≤ 17.9741 | | MS | | | 12/23/2024 | | | | | | | | 13,600 | | | | 15,971 | |
| | 766,000 | | | USDKRW ≥ 1420.64 and KOSPI ≥ 403.23 | | GS | | | 12/12/2025 | | | | | | | | 28,725 | | | | 35,675 | |
| | 516,667 | | | USO US ≤ 72.3995 and US10YSOFR ≥ 4.187% | | CIT | | | 07/18/2024 | | | | | | | | 47,792 | | | | 1,803 | |
| | 516,667 | | | USO US ≤ 72.3995 and US10YSOFR ≥ 4.187% | | CIT | | | 08/16/2024 | | | | | | | | 47,792 | | | | 12,225 | |
| | 516,667 | | | USO US ≤ 72.3995 and US10YSOFR ≥ 4.187% | | CIT | | | 09/18/2024 | | | | | | | | 47,792 | | | | 21,195 | |
| | 895,000 | | | XAUUSD ≥ 2485.10 and USDCNH ≥ 7.3417 | | MS | | | 04/18/2025 | | | | | | | | 48,330 | | | | 44,693 | |
| | 895,000 | | | XAUUSD ≥ 2485.10 and USDCNH ≥ 7.3417 | | MS | | | 05/19/2025 | | | | | | | | 48,330 | | | | 49,194 | |
| | | | | TOTAL PUT OPTIONS PURCHASED (Cost - $2,394,099) | | | | | | | | | | | | | | | | | 1,810,812 | |
| | | | | | | | | | | | | | | | | | | | | | | |
| | | | | TOTAL BINARY OPTIONS PURCHASED (Cost - $2,394,099) | | | | | | | | | | | | | | | | | 1,810,812 | |
| | | | | | | | | | | | | | | | | | | | | | | |
| | | | | FUTURE OPTIONS PURCHASED - 0.3%(f) | | | | | | | | | | | | | | | | | | |
| | | | | CALL OPTIONS PURCHASED - 0.2%(f) | | | | | | | | | | | | | | | | | | |
| | 137 | | | 3 Month SOFR | | MS | | | 09/16/2024 | | | | 95.0000 | | | | 32,486,125 | | | | 10,275 | |
| | 214 | | | 3 Month SOFR | | MS | | | 12/16/2024 | | | | 96.0000 | | | | 50,902,575 | | | | 25,412 | |
| | 16 | | | AUD/USD Euro | | MS | | | 07/08/2024 | | | | 67.0000 | | | | 1,069,280 | | | | 3,520 | |
| | 16 | | | AUD/USD Euro | | MS | | | 07/08/2024 | | | | 67.5000 | | | | 1,069,280 | | | | 1,280 | |
| | 16 | | | AUD/USD Euro | | MS | | | 07/08/2024 | | | | 68.0000 | | | | 1,069,280 | | | | 320 | |
See accompanying notes to consolidated financial statements.
FULCRUM DIVERSIFIED ABSOLUTE RETURN FUND
CONSOLIDATED SCHEDULE OF INVESTMENTS (Continued)
June 30, 2024
| Contracts | | | | | Broker/
Counterparty | | | Expiration Date | | | Exercise Price | | | Notional Value | | | Fair Value | |
| | | | | FUTURE OPTIONS PURCHASED - 0.3%(f) (Continued) | | | | | | | | | | | | | | | | | | |
| | | | | CALL OPTIONS PURCHASED - 0.2%(f) (Continued) | | | | | | | | | | | | | | | | | | |
| | 13 | | | Canadian Dollar | | MS | | | 07/08/2024 | | | $ | 73.2500 | | | $ | 951,600 | | | $ | 2,340 | |
| | 13 | | | Canadian Dollar | | MS | | | 07/08/2024 | | | | 73.5000 | | | | 951,600 | | | | 1,170 | |
| | 13 | | | Canadian Dollar | | MS | | | 07/08/2024 | | | | 73.7500 | | | | 951,600 | | | | 520 | |
| | 14 | | | Crude Oil(e) | | MS | | | 07/18/2024 | | | | 82.0000 | | | | 1,141,560 | | | | 21,280 | |
| | 14 | | | Crude Oil(e) | | MS | | | 07/18/2024 | | | | 83.0000 | | | | 1,141,560 | | | | 15,820 | |
| | 14 | | | Crude Oil(e) | | MS | | | 07/18/2024 | | | | 84.5000 | | | | 1,141,560 | | | | 9,940 | |
| | 14 | | | Crude Oil(e) | | MS | | | 07/18/2024 | | | | 86.5000 | | | | 1,141,560 | | | | 5,460 | |
| | 131 | | | EURIBOR 3M | | MS | | | 12/17/2024 | | | | 97.7500 | | | | 29,563,425 | | | | 6,140 | |
| | 132 | | | Stoxx50 1Y | | MS | | | 09/23/2024 | | | | 160.0000 | | | | 17,236,472 | | | | 59,672 | |
| | 44 | | | Stoxx50 1Y | | MS | | | 12/23/2024 | | | | 160.0000 | | | | 51,709,416 | | | | 28,234 | |
| | 130 | | | Stoxx50 2Y | | MS | | | 09/23/2024 | | | | 158.0000 | | | | 50,925,940 | | | | 26,599 | |
| | 49 | | | SX5E Dividend | | MS | | | 12/23/2024 | | | | 135.0000 | | | | 598,045 | | | | 134,691 | |
| | | | | TOTAL CALL OPTIONS PURCHASED (Cost - $566,066) | | | | | | | | | | | | | | | | | 352,673 | |
| | | | | | | | | | | | | | | | | | | | | | | |
| | | | | PUT OPTIONS PURCHASED - 0.1%(f) | | | | | | | | | | | | | | | | | | |
| | 137 | | | 3 Month SOFR | | MS | | | 09/16/2024 | | | | 94.6875 | | | | 32,486,125 | | | | 4,281 | |
| | 16 | | | AUD/USD Euro | | MS | | | 07/08/2024 | | | | 65.5000 | | | | 1,069,280 | | | | 320 | |
| | 16 | | | AUD/USD Euro | | MS | | | 07/08/2024 | | | | 66.0000 | | | | 1,069,280 | | | | 960 | |
| | 16 | | | AUD/USD Euro | | MS | | | 07/08/2024 | | | | 66.5000 | | | | 1,069,280 | | | | 2,720 | |
| | 13 | | | Canadian Dollar | | MS | | | 07/08/2024 | | | | 72.5000 | | | | 951,600 | | | | 325 | |
| | 13 | | | Canadian Dollar | | MS | | | 07/08/2024 | | | | 72.7500 | | | | 951,600 | | | | 650 | |
| | 13 | | | Canadian Dollar | | MS | | | 07/08/2024 | | | | 73.0000 | | | | 951,600 | | | | 1,560 | |
| | 14 | | | Crude Oil(e) | | MS | | | 07/18/2024 | | | | 76.0000 | | | | 1,141,560 | | | | 3,780 | |
| | 14 | | | Crude Oil(e) | | MS | | | 07/18/2024 | | | | 78.0000 | | | | 1,141,560 | | | | 7,560 | |
| | 14 | | | Crude Oil(e) | | MS | | | 07/18/2024 | | | | 79.5000 | | | | 1,141,560 | | | | 12,600 | |
| | 14 | | | Crude Oil(e) | | MS | | | 07/18/2024 | | | | 81.0000 | | | | 1,141,560 | | | | 20,580 | |
| | 115 | | | S&P Emini | | MS | | | 09/23/2024 | | | | 5,300.0000 | | | | 31,748,625 | | | | 265,937 | |
| | 9 | | | U.S. Treasury Bond | | MS | | | 07/29/2024 | | | | 114.0000 | | | | 1,064,813 | | | | 2,391 | |
| | 19 | | | U.S. Treasury Bond | | MS | | | 07/29/2024 | | | | 115.0000 | | | | 2,247,938 | | | | 8,016 | |
| | | | | TOTAL PUT OPTIONS PURCHASED (Cost - $449,289) | | | | | | | | | | | | | | | | | 331,680 | |
| | | | | | | | | | | | | | | | | | | | | | | |
| | | | | TOTAL FUTURE OPTIONS PURCHASED (Cost - $1,015,355) | | | | | | | | | | | | | | | | | 684,353 | |
Principal
Amount ($) | | | | | Yield (%) | | | Maturity | | | | |
| | | | | SHORT-TERM INVESTMENTS — 48.9% | | | | | | | | | | |
| | | | | U.S. TREASURY BILLS — 48.9% | | | | | | | | | | |
| | 10,500,000 | | | United States Treasury Bill | | 5.34 | | | 07/02/24 | | | | 10,498,472 | |
| | 12,000,000 | | | United States Treasury Bill | | 5.01 | | | 07/16/24 | | | | 11,973,725 | |
| | 12,000,000 | | | United States Treasury Bill | | 5.16 | | | 08/01/24 | | | | 11,945,957 | |
| | 8,650,000 | | | United States Treasury Bill | | 5.29 | | | 08/29/24 | | | | 8,575,468 | |
| | 9,150,000 | | | United States Treasury Bill | | 5.26 | | | 09/05/24 | | | | 9,062,560 | |
See accompanying notes to consolidated financial statements.
FULCRUM DIVERSIFIED ABSOLUTE RETURN FUND
CONSOLIDATED SCHEDULE OF INVESTMENTS (Continued)
June 30, 2024
Principal
Amount ($) | | | | | Yield (%) | | | Maturity | | | Fair Value | |
| | | | | SHORT-TERM INVESTMENTS — 48.9% (Continued) | | | | | | | | | | |
| | | | | U.S. TREASURY BILLS — 48.9% (Continued) | | | | | | | | | | |
| | 10,200,000 | | | United States Treasury Bill | | 5.28 | | | 09/19/24 | | | $ | 10,081,839 | |
| | 12,200,000 | | | United States Treasury Bill | | 5.26 | | | 10/31/24 | | | | 12,035,402 | |
| | 13,150,000 | | | United States Treasury Bill | | 5.29 | | | 10/31/24 | | | | 12,919,604 | |
| | 10,000,000 | | | United States Treasury Bill | | 5.29 | | | 12/05/24 | | | | 9,776,057 | |
| | 1,020,000 | | | United States Treasury Bill | | 5.28 | | | 12/19/24 | | | | 995,220 | |
| | | | | TOTAL SHORT-TERM INVESTMENTS (Cost $97,865,957) | | | | | | | | | 97,864,049 | |
| | | | | | | | | | | | | | | |
| | | | | TOTAL INVESTMENTS - 68.2% (Cost $133,741,346) | | | | | | | | $ | 136,507,304 | |
| | | | | CALL OPTIONS WRITTEN - (0.1)% (Premiums received - $443,450) | | | | | | | | | (325,165 | ) |
| | | | | PUT OPTIONS WRITTEN - (0.3)% (Premiums received - $361,818) | | | | | | | | | (536,250 | ) |
| | | | | OTHER ASSETS IN EXCESS OF LIABILITIES - 32.2% | | | | | | | | | 64,468,586 | |
| | | | | NET ASSETS - 100.0% | | | | | | | | $ | 200,114,475 | |
| Contracts | | | | | Broker/
Counterparty | | | Expiration Date | | | Exercise Price | | | Notional Value | | | | |
| | | | | WRITTEN FUTURE OPTIONS - (0.4)%(f) | | | | | | | | | | | | | | | | | | |
| | | | | CALL OPTIONS WRITTEN - (0.1)%(f) | | | | | | | | | | | | | | | | | | |
| | 16 | | | Cocoa(e) | | MS | | | 08/05/2024 | | | $ | 10,750.0000 | | | $ | 1,236,960 | | | $ | 18,880 | |
| | 169 | | | Euro STOXX 50 Volatility Index | | MS | | | 07/18/2024 | | | | 17.0000 | | | | 288,652 | | | | 19,914 | |
| | 105 | | | Euro STOXX 50 Volatility Index | | MS | | | 07/18/2024 | | | | 18.0000 | | | | 179,340 | | | | 9,842 | |
| | 158 | | | Euro STOXX 50 Volatility Index | | MS | | | 07/18/2024 | | | | 19.0000 | | | | 269,864 | | | | 11,848 | |
| | 58 | | | Euro STOXX 50 Volatility Index | | MS | | | 07/18/2024 | | | | 20.0000 | | | | 99,064 | | | | 3,417 | |
| | 111 | | | Euro STOXX 50 Volatility Index | | MS | | | 07/18/2024 | | | | 21.0000 | | | | 189,588 | | | | 5,351 | |
| | 58 | | | Euro STOXX 50 Volatility Index | | MS | | | 07/18/2024 | | | | 22.0000 | | | | 99,064 | | | | 2,330 | |
| | 47 | | | Euro STOXX 50 Volatility Index | | MS | | | 07/18/2024 | | | | 23.0000 | | | | 80,276 | | | | 1,636 | |
| | 47 | | | Euro STOXX 50 Volatility Index | | MS | | | 07/18/2024 | | | | 25.0000 | | | | 80,276 | | | | 1,133 | |
| | 111 | | | Euro STOXX 50 Volatility Index | | MS | | | 07/18/2024 | | | | 26.0000 | | | | 189,588 | | | | 2,378 | |
| | 6 | | | EURO-BUND | | MS | | | 07/29/2024 | | | | 131.5000 | | | | 789,720 | | | | 6,813 | |
| | 14 | | | EURO-BUND | | MS | | | 07/29/2024 | | | | 132.0000 | | | | 1,842,680 | | | | 12,598 | |
| | 14 | | | EURO-BUND | | MS | | | 07/29/2024 | | | | 133.0000 | | | | 1,842,680 | | | | 7,649 | |
| | 14 | | | EURO-BUND | | MS | | | 07/29/2024 | | | | 134.0000 | | | | 1,842,680 | | | | 4,649 | |
| | 8 | | | EURO-BUND | | MS | | | 07/29/2024 | | | | 135.0000 | | | | 1,052,960 | | | | 1,628 | |
| | 265 | | | Stoxx50 1Y | | MS | | | 09/23/2024 | | | | 164.0000 | | | | 103,810,570 | | | | 52,233 | |
| | 88 | | | Stoxx50 1Y | | MS | | | 12/23/2024 | | | | 166.0000 | | | | 34,472,944 | | | | 22,436 | |
| | 261 | | | Stoxx50 2Y | | MS | | | 09/23/2024 | | | | 162.0000 | | | | 102,243,618 | | | | 18,174 | |
| | 17 | | | U.S. 10 Year Treasury Note | | MS | | | 07/29/2024 | | | | 110.5000 | | | | 1,869,469 | | | | 8,766 | |
| | 9 | | | U.S. 10 Year Treasury Note | | MS | | | 07/29/2024 | | | | 110.7500 | | | | 989,719 | | | | 3,797 | |
| | 9 | | | U.S. 10 Year Treasury Note | | MS | | | 07/29/2024 | | | | 111.0000 | | | | 989,719 | | | | 3,094 | |
| | 9 | | | U.S. 10 Year Treasury Note | | MS | | | 07/29/2024 | | | | 111.2500 | | | | 989,719 | | | | 2,531 | |
| | 8 | | | U.S. 10 Year Treasury Note | | MS | | | 07/29/2024 | | | | 111.5000 | | | | 879,750 | | | | 1,875 | |
| | 27 | | | U.S. 10 Year Treasury Note | | MS | | | 07/29/2024 | | | | 112.0000 | | | | 2,969,156 | | | | 4,219 | |
| | 9 | | | U.S. 10 Year Treasury Note | | MS | | | 07/29/2024 | | | | 112.5000 | | | | 989,719 | | | | 844 | |
See accompanying notes to consolidated financial statements.
FULCRUM DIVERSIFIED ABSOLUTE RETURN FUND
CONSOLIDATED SCHEDULE OF INVESTMENTS (Continued)
June 30, 2024
| Contracts | | | | | Broker/
Counterparty | | | Expiration Date | | | Exercise Price | | | Notional Value | | | Fair Value | |
| | | | | WRITTEN FUTURE OPTIONS - (0.4)%(f) (Continued) | | | | | | | | | | | | | | | | | | |
| | | | | CALL OPTIONS WRITTEN - (0.1)%(f) (Continued) | | | | | | | | | | | | | | | | | | |
| | 9 | | | U.S. 10 Year Treasury Note | | MS | | | 07/29/2024 | | | $ | 112.7500 | | | $ | 989,719 | | | $ | 703 | |
| | 8 | | | U.S. 10 Year Treasury Note | | MS | | | 07/29/2024 | | | | 113.0000 | | | | 879,750 | | | | 500 | |
| | | | | TOTAL CALL OPTIONS WRITTEN (Proceeds - $391,188) | | | | | | | | | | | | | | | | | 229,238 | |
| | | | | | | | | | | | | | | | | | | | | | | |
| | | | | PUT OPTIONS WRITTEN - (0.3)%(f) | | | | | | | | | | | | | | | | | | |
| | 16 | | | Cocoa(e) | | MS | | | 08/05/2024 | | | | 10,000.0000 | | | | 1,236,960 | | | | 391,040 | |
| | 169 | | | Euro STOXX 50 Volatility Index | | MS | | | 07/18/2024 | | | | 13.5000 | | | | 288,652 | | | | 3,168 | |
| | 105 | | | Euro STOXX 50 Volatility Index | | MS | | | 07/18/2024 | | | | 14.0000 | | | | 179,340 | | | | 3,093 | |
| | 158 | | | Euro STOXX 50 Volatility Index | | MS | | | 07/18/2024 | | | | 14.5000 | | | | 269,864 | | | | 7,615 | |
| | 169 | | | Euro STOXX 50 Volatility Index | | MS | | | 07/18/2024 | | | | 15.0000 | | | | 288,652 | | | | 12,220 | |
| | 216 | | | Euro STOXX 50 Volatility Index | | MS | | | 07/18/2024 | | | | 16.0000 | | | | 368,928 | | | | 28,345 | |
| | 47 | | | Euro STOXX 50 Volatility Index | | MS | | | 07/18/2024 | | | | 17.0000 | | | | 80,276 | | | | 9,566 | |
| | 14 | | | EURO-BUND | | MS | | | 07/29/2024 | | | | 128.0000 | | | | 1,842,680 | | | | 1,350 | |
| | 6 | | | EURO-BUND | | MS | | | 07/29/2024 | | | | 129.0000 | | | | 789,720 | | | | 1,221 | |
| | 14 | | | EURO-BUND | | MS | | | 07/29/2024 | | | | 130.0000 | | | | 1,842,680 | | | | 5,699 | |
| | 6 | | | EURO-BUND | | MS | | | 07/29/2024 | | | | 130.5000 | | | | 789,720 | | | | 3,342 | |
| | 8 | | | EURO-BUND | | MS | | | 07/29/2024 | | | | 131.0000 | | | | 1,052,960 | | | | 6,085 | |
| | 8 | | | EURO-BUND | | MS | | | 07/29/2024 | | | | 131.5000 | | | | 1,052,960 | | | | 8,056 | |
| | 49 | | | SX5E Dividend | | MS | | | 12/23/2024 | | | | 90.0000 | | | | 598,045 | | | | 52 | |
| | 17 | | | U.S. 10 Year Treasury Note | | MS | | | 07/29/2024 | | | | 108.0000 | | | | 1,869,469 | | | | 2,391 | |
| | 9 | | | U.S. 10 Year Treasury Note | | MS | | | 07/29/2024 | | | | 108.5000 | | | | 989,719 | | | | 1,969 | |
| | 17 | | | U.S. 10 Year Treasury Note | | MS | | | 07/29/2024 | | | | 109.0000 | | | | 1,869,469 | | | | 5,844 | |
| | 9 | | | U.S. 10 Year Treasury Note | | MS | | | 07/29/2024 | | | | 109.2500 | | | | 989,719 | | | | 3,797 | |
| | 17 | | | U.S. 10 Year Treasury Note | | MS | | | 07/29/2024 | | | | 109.5000 | | | | 1,869,469 | | | | 8,766 | |
| | 9 | | | U.S. 10 Year Treasury Note | | MS | | | 07/29/2024 | | | | 109.7500 | | | | 989,719 | | | | 5,625 | |
| | 17 | | | U.S. 10 Year Treasury Note | | MS | | | 07/29/2024 | | | | 110.0000 | | | | 1,869,469 | | | | 12,750 | |
| | 9 | | | U.S. 10 Year Treasury Note | | MS | | | 07/29/2024 | | | | 110.2500 | | | | 989,719 | | | | 7,875 | |
| | 9 | | | U.S. Treasury Bond | | MS | | | 07/29/2024 | | | | 112.0000 | | | | 1,064,813 | | | | 984 | |
| | | | | TOTAL PUT OPTIONS WRITTEN (Proceeds - $339,047) | | | | | | | | | | | | | | | | | 530,853 | |
| | | | | | | | | | | | | | | | | | | | | | | |
| | | | | TOTAL FUTURE OPTIONS WRITTEN (Proceeds - $730,235) | | | | | | | | | | | | | | | | | 760,091 | |
| | | | | | | | | | | | | | | | | | | | | | | |
| | | | | CURRENCY OPTIONS WRITTEN - (0.0)%(a) | | | | | | | | | | | | | | | | | | |
| | | | | CALL OPTIONS WRITTEN - (0.0)%(a) | | | | | | | | | | | | | | | | | | |
| | 3,031,000 | | | EUR/CHF | | JPM | | | 07/22/2024 | | | | 0.9640 | | | | 9,567 | | | | 16,507 | |
| | 3,031,000 | | | EUR/SEK | | JPM | | | 07/22/2024 | | | | 11.3600 | | | | 7,594 | | | | 20,036 | |
| | 6,228,000 | | | USD/CNH | | JPM | | | 09/27/2024 | | | | 7.4750 | | | | 8,346 | | | | 5,481 | |
| | 3,203,000 | | | USD/JPY | | JPM | | | 07/17/2024 | | | | 158.7500 | | | | 14,766 | | | | 47,531 | |
| | 860,000 | | | USD/MXN | | JPM | | | 09/10/2024 | | | | 20.0000 | | | | 11,990 | | | | 6,372 | |
| | | | | TOTAL CALL OPTIONS WRITTEN (Proceeds - $52,262) | | | | | | | | | | | | | | | | | 95,927 | |
| | | | | | | | | | | | | | | | | | | | | | | |
| | | | | PUT OPTIONS WRITTEN - (0.0)%(a) | | | | | | | | | | | | | | | | | | |
| | 3,031,000 | | | EUR/CHF | | JPM | | | 07/22/2024 | | | | 0.9370 | | | | 9,567 | | | | 4,046 | |
| | 3,031,000 | | | EUR/SEK | | JPM | | | 07/22/2024 | | | | 11.0600 | | | | 9,671 | | | | 1,346 | |
| | 4,663,000 | | | USD/MXN | | JPM | | | 07/03/2024 | | | | 16.8000 | | | | 4,803 | | | | 5 | |
| | | | | TOTAL PUT OPTIONS WRITTEN (Proceeds - $24,040) | | | | | | | | | | | | | | | | | 5,397 | |
| | | | | | | | | | | | | | | | | | | | | | | |
| | | | | TOTAL CURRENCY OPTIONS WRITTEN (Proceeds - $76,302) | | | | | | | | | | | | | | | | $ | 101,324 | |
See accompanying notes to consolidated financial statements.
FULCRUM DIVERSIFIED ABSOLUTE RETURN FUND
CONSOLIDATED SCHEDULE OF INVESTMENTS (Continued)
June 30, 2024
| OPEN FUTURES CONTRACTS | |
Number of
Contracts | | | Open Long Futures Contracts | | Expiration | | | Notional Amount(g) | | | Value and Unrealized
Appreciation (Depreciation) | |
| | 41 | | | CBOT 2 Year US Treasury Note Future | | 10/01/2024 | | | $ | 8,372,969 | | | $ | (5,360 | ) |
| | 276 | | | CBOT 5 Year US Treasury Note | | 10/01/2024 | | | | 29,415,563 | | | | 34,982 | |
| | 9 | | | CBOT Soybean Future(e) | | 11/14/2024 | | | | 496,800 | | | | (22,485 | ) |
| | 36 | | | CBOT Soybean Meal Future(e) | | 12/16/2024 | | | | 1,207,800 | | | | (67,983 | ) |
| | 1 | | | CBOT US Treasury Bond Future | | 09/20/2024 | | | | 118,313 | | | | (18 | ) |
| | 7 | | | CBOT Wheat Future(e) | | 09/13/2024 | | | | 200,725 | | | | (33,250 | ) |
| | 138 | | | CME Australian Dollar Currency Future | | 09/17/2024 | | | | 9,222,540 | | | | 19,017 | |
| | 6 | | | CME E-Mini NASDAQ 100 Index Future | | 09/23/2024 | | | | 2,391,270 | | | | (15,660 | ) |
| | 87 | | | CME E-Mini Standard & Poor’s 500 Index Future | | 09/23/2024 | | | | 24,018,525 | | | | (79,169 | ) |
| | 227 | | | CME Euro Foreign Exchange Currency Future | | 09/17/2024 | | | | 30,508,800 | | | | (15,192 | ) |
| | 204 | | | CME Japanese Yen Currency Future | | 09/17/2024 | | | | 16,045,875 | | | | (240,715 | ) |
| | 56 | | | CME Live Cattle Future(e) | | 08/30/2024 | | | | 4,153,520 | | | | 197,610 | |
| | 22 | | | CME Norwegian Krone Currency Future | | 09/17/2024 | | | | 4,127,200 | | | | (15,486 | ) |
| | 23 | | | CME Swiss Franc Currency Future | | 09/17/2024 | | | | 3,229,488 | | | | (11,604 | ) |
| | 73 | | | COMEX Gold 100 Troy Ounces Future(e) | | 08/28/2024 | | | | 17,079,080 | | | | (36,298 | ) |
| | 24 | | | COMEX Silver Future(e) | | 09/27/2024 | | | | 3,547,200 | | | | (2,833 | ) |
| | 2 | | | E-mini Dow Jones Industrial Average Index Future | | 09/23/2024 | | | | 394,690 | | | | 2,257 | |
| | 34 | | | Eurex 2 Year Euro SCHATZ Future | | 09/09/2024 | | | | 3,849,813 | | | | (361 | ) |
| | 96 | | | Eurex 5 Year Euro BOBL Future | | 09/09/2024 | | | | 11,974,547 | | | | 39,947 | |
| | 39 | | | Eurex 10 Year Euro BUND Future | | 09/09/2024 | | | | 5,498,854 | | | | (40,555 | ) |
| | 219 | | | Eurex EURO STOXX 50 Future | | 09/23/2024 | | | | 11,556,444 | | | | (95,258 | ) |
| | 1 | | | Eurex Stoxx Europe 600 Future | | 09/23/2024 | | | | 27,542 | | | | (248 | ) |
| | 82 | | | Euronext CAC 40 Index Future | | 07/22/2024 | | | | 6,581,521 | | | | (137,426 | ) |
| | 12 | | | FTSE 100 Index Future | | 09/23/2024 | | | | 1,245,705 | | | | (3,188 | ) |
| | 3 | | | FTSE/MIB Index Future | | 09/23/2024 | | | | 536,144 | | | | (2,383 | ) |
| | 128 | | | FVSA index - Mini-Futures on VSTOXX | | 07/18/2024 | | | | 222,132 | | | | (6,184 | ) |
| | 28 | | | ICE Brent Crude Oil Future(e) | | 11/03/2025 | | | | 2,181,480 | | | | 45,910 | |
| | 15 | | | ICE Brent Crude Oil Future(e) | | 11/02/2026 | | | | 1,119,000 | | | | 22,190 | |
| | 12 | | | ICE Gas Oil Future(e) | | 08/12/2024 | | | | 940,800 | | | | 78,975 | |
| | 10 | | | ICE Natural Gas Future(e) | | 07/31/2024 | | | | 318,790 | | | | (3,880 | ) |
| | 34 | | | IFSC NIFTY 50 Index Future | | 07/26/2024 | | | | 1,641,486 | | | | 17,635 | |
| | 22 | | | KCBT Hard Red Winter Wheat Future(e) | | 09/16/2024 | | | | 644,875 | | | | (114,446 | ) |
| | 67 | | | KFE 3 Year Treasury Bond Future | | 09/16/2024 | | | | 5,109,832 | | | | 7,026 | |
| | 24 | | | KFE 10 Year Treasury Bond Future | | 09/16/2024 | | | | 1,994,287 | | | | (1,621 | ) |
| | 66 | | | KFE KOSPI 200 Index Future | | 09/13/2024 | | | | 4,621,479 | | | | 183,332 | |
| | 3 | | | LME Copper Future(e) | | 08/20/2024 | | | | 715,972 | | | | (33,503 | ) |
| | 1 | | | LME Lead Future(e) | | 08/20/2024 | | | | 55,319 | | | | (235 | ) |
| | 1 | | | LME Nickel Future(e) | | 08/20/2024 | | | | 103,141 | | | | (7,193 | ) |
| | 15 | | | LME Primary Aluminum Future(e) | | 08/20/2024 | | | | 940,943 | | | | (43,489 | ) |
| | 5 | | | LME Zinc Future(e) | | 08/20/2024 | | | | 364,444 | | | | 3,944 | |
| | 1 | | | Long Gilt Future | | 09/27/2024 | | | | 123,339 | | | | (249 | ) |
| | 5 | | | MEFF Madrid IBEX 35 Index Future | | 07/22/2024 | | | | 582,539 | | | | (7,621 | ) |
| | 1 | | | MGE Red Wheat Future(e) | | 09/16/2024 | | | | 30,650 | | | | (5,446 | ) |
| | 12 | | | Mini-DAX Future | | 09/23/2024 | | | | 1,182,839 | | | | 8,126 | |
| | 35 | | | Montreal Exchange 10 Year Canadian Bond Future | | 09/19/2024 | | | | 3,071,495 | | | | (50,276 | ) |
| | 6 | | | Montreal Exchange S&P/TSX 60 Index Future | | 09/20/2024 | | | | 1,149,385 | | | | 13,358 | |
| | 8 | | | NYBOT CSC C Coffee Future(e) | | 09/18/2024 | | | | 680,400 | | | | (29,681 | ) |
| | 82 | | | NYMEX Henry Hub Natural Gas Future(e) | | 07/29/2024 | | | | 2,132,820 | | | | (231,911 | ) |
See accompanying notes to consolidated financial statements.
FULCRUM DIVERSIFIED ABSOLUTE RETURN FUND
CONSOLIDATED SCHEDULE OF INVESTMENTS (Continued)
June 30, 2024
| OPEN FUTURES CONTRACTS (Continued) | |
Number of
Contracts | | | Open Long Futures Contracts | | Expiration | | | Notional Amount(g) | | | Value and Unrealized Appreciation (Depreciation) | |
| | 24 | | | NYMEX Light Sweet Crude Oil Future(e) | | 07/22/2024 | | | $ | 1,956,960 | | | $ | 128,717 | |
| | 13 | | | NYMEX Palladium Future(e) | | 09/27/2024 | | | | 1,271,270 | | | | 10,337 | |
| | 43 | | | NYMEX Platinum Future(e) | | 10/30/2024 | | | | 2,180,315 | | | | 23,315 | |
| | 34 | | | OML Stockholm OMXS30 Index Future | | 07/22/2024 | | | | 827,148 | | | | 2,256 | |
| | 76 | | | OSE Nikkei 225 mini Future | | 09/13/2024 | | | | 1,869,929 | | | | 24,747 | |
| | 4 | | | Robusta Coffee Future 10-Tonne(e) | | 09/25/2024 | | | | 160,440 | | | | (14,340 | ) |
| | 16 | | | SAFEX FTSE/JSE Top 40 Index Future | | 09/20/2024 | | | | 648,459 | | | | 2,513 | |
| | 11 | | | SFE 10 Year Australian Bond Future | | 09/17/2024 | | | | 702,064 | | | | 2,994 | |
| | 7 | | | SFE S&P ASX Share Price Index 200 Future | | 09/20/2024 | | | | 907,217 | | | | (706 | ) |
| | 36 | | | SGX FTSE Taiwan Index Future | | 07/31/2024 | | | | 2,777,400 | | | | 10,347 | |
| | 48 | | | SGX MSCI Singapore Index Future | | 07/31/2024 | | | | 1,119,873 | | | | 7,476 | |
| | 3 | | | TSE Japanese 10 Year Bond Future | | 09/13/2024 | | | | 2,664,205 | | | | (1,649 | ) |
| | 40 | | | TSE TOPIX (Tokyo Price Index) Future | | 09/13/2024 | | | | 6,988,425 | | | | 142,241 | |
| | 7 | | | Ultra 10-Year US Treasury Note Future | | 09/20/2024 | | | | 794,719 | | | | (3,563 | ) |
| | 23 | | | White Sugar Future(e) | | 07/17/2024 | | | | 688,160 | | | | 49,555 | |
| | | | | TOTAL LONG FUTURES CONTRACTS | | | | | | | | | | (302,658 | ) |
Number of
Contracts | | | Open Short Futures Contracts | | Expiration | | | Notional Amount(g) | | | Value and Unrealized Appreciation (Depreciation) | |
| | 5 | | | Carbon Emissions Future(e) | | 12/16/2024 | | | $ | 361,382 | | | $ | 23,948 | |
| | 6 | | | CBOE Volatility Index Future | | 07/17/2024 | | | | 84,137 | | | | 1,443 | |
| | 75 | | | CBOE Volatility Index Future | | 08/21/2024 | | | | 1,120,515 | | | | (14,115 | ) |
| | 30 | | | CBOE Volatility Index Future | | 10/16/2024 | | | | 545,325 | | | | 4,425 | |
| | 4 | | | CBOT 10 Year US Treasury Note | | 09/20/2024 | | | | 439,938 | | | | 969 | |
| | 7 | | | CBOT Corn Future(e) | | 09/13/2024 | | | | 142,625 | | | | 12,059 | |
| | 20 | | | CBOT Soybean Oil Future(e) | | 12/13/2024 | | | | 525,480 | | | | (1,374 | ) |
| | 23 | | | CME British Pound Currency Future | | 09/17/2024 | | | | 1,818,294 | | | | 5,567 | |
| | 158 | | | CME Canadian Dollar Currency Future | | 09/18/2024 | | | | 11,565,600 | | | | (50,357 | ) |
| | 5 | | | CME E-mini Russell 2000 Index Future | | 09/23/2024 | | | | 516,250 | | | | (3,627 | ) |
| | 19 | | | CME Feeder Cattle Future(e) | | 08/30/2024 | | | | 2,463,350 | | | | (34,449 | ) |
| | 19 | | | CME Lean Hogs Future(e) | | 08/15/2024 | | | | 680,200 | | | | 4,825 | |
| | 7 | | | CME Mexican Peso Currency Future | | 09/17/2024 | | | | 188,580 | | | | 212 | |
| | 22 | | | CME New Zealand Dollar Currency Future | | 09/17/2024 | | | | 1,340,900 | | | | 3,760 | |
| | 38 | | | CME Swedish Krona Currency Future | | 09/17/2024 | | | | 7,195,680 | | | | 38,131 | |
| | 3 | | | Eurex 30 Year Euro BUXL Future | | 09/09/2024 | | | | 418,554 | | | | 10,894 | |
| | 109 | | | Eurex EURO STOXX Banks Index Future | | 09/23/2024 | | | | 803,050 | | | | (1,248 | ) |
| | 39 | | | EURO STOXX Banks Index Dividend Future | | 12/19/2025 | | | | 189,882 | | | | (44,386 | ) |
| | 118 | | | EURO STOXX Banks Index Dividend Future | | 12/18/2026 | | | | 540,386 | | | | (57,167 | ) |
| | 29 | | | Euro-BTP Italian Bond Futures | | 09/09/2024 | | | | 3,581,585 | | | | 28,000 | |
| | 68 | | | Euronext Milling Wheat Future(e) | | 09/10/2024 | | | | 818,586 | | | | 102,019 | |
| | 12 | | | EUX Short term Euro-BTP Future | | 09/09/2024 | | | | 1,349,888 | | | | (1,059 | ) |
| | 5 | | | FTSE 250 Index Future | | 09/23/2024 | | | | 257,645 | | | | 1,651 | |
| | 27 | | | French Government Bond Future | | 09/09/2024 | | | | 3,561,050 | | | | 3,543 | |
| | 9 | | | HKG Hang Seng China Enterprises Index Future | | 07/31/2024 | | | | 361,025 | | | | 6,845 | |
| | 14 | | | HKG Hang Seng Index Future | | 07/31/2024 | | | | 1,580,352 | | | | 26,060 | |
| | 31 | | | ICE Brent Crude Oil Future(e) | | 09/02/2024 | | | | 2,635,000 | | | | (9,566 | ) |
See accompanying notes to consolidated financial statements.
FULCRUM DIVERSIFIED ABSOLUTE RETURN FUND
CONSOLIDATED SCHEDULE OF INVESTMENTS (Continued)
June 30, 2024
| OPEN FUTURES CONTRACTS (Continued) | |
Number of
Contracts | | | Open Short Futures Contracts | | Expiration | | | Notional Amount(g) | | | Value and Unrealized
Appreciation (Depreciation) | |
| | 55 | | | ICE US MSCI Emerging Markets EM Index Future | | 09/23/2024 | | | $ | 2,992,550 | | | $ | (31,825 | ) |
| | 5 | | | NYBOT CSC Cocoa Future(e) | | 09/13/2024 | | | | 386,550 | | | | (3,704 | ) |
| | 38 | | | NYBOT CSC Number 11 World Sugar Future(e) | | 10/01/2024 | | | | 863,968 | | | | (52,504 | ) |
| | 24 | | | NYBOT CTN Number 2 Cotton Future(e) | | 12/09/2024 | | | | 872,280 | | | | 4,890 | |
| | 6 | | | NYMEX NY Harbor ULSD Future(e) | | 07/31/2024 | | | | 638,341 | | | | (48,804 | ) |
| | 18 | | | NYMEX RBOB Gasoline Future(e) | | 07/31/2024 | | | | 1,891,134 | | | | (106,226 | ) |
| | 8 | | | OSE Nikkei 225 Index Future | | 09/13/2024 | | | | 1,968,346 | | | | 4,053 | |
| | 49 | | | SFE 3 Year Australian Bond Future | | 09/17/2024 | | | | 3,136,039 | | | | 22,118 | |
| | 12 | | | SGX TSI Iron Ore CFR China (62% FE FINES) Index Future(e) | | 09/03/2024 | | | | 127,620 | | | | 35 | |
| | 20 | | | TTF Natural Gas Base Future(e) | | 07/31/2024 | | | | 549,612 | | | | 11,073 | |
| | 32 | | | Ultra U.S. Treasury Bond Future | | 09/20/2024 | | | | 4,011,000 | | | | 63,927 | |
| | 167 | | | WCE Canola Future(e) | | 11/15/2024 | | | | 1,530,842 | | | | 36,266 | |
| | | | | TOTAL SHORT FUTURES CONTRACTS | | | | | | | | | | (43,698 | ) |
| | | | | | | | | | | | | | | | |
| | | | | TOTAL OPEN FUTURES CONTRACTS | | | | | | | | | $ | (346,356 | ) |
| OPEN FORWARD FOREIGN EXCHANGE CONTRACTS | |
| Foreign Currency | | Settlement Date | | | Counterparty | | | Local Currency | | | U.S. Dollar Value | | | Unrealized
Appreciation/
(Depreciation) | |
| To Buy: | | | | | | | | | | | | | | | | | | |
| Chinese Yuan | | 07/31/2024 | | | JPM | | | | 12,105,790 | | | $ | 1,668,544 | | | $ | 6,408 | |
| Hungarian Forints | | 07/31/2024 | | | JPM | | | | 139,411,878 | | | | 377,592 | | | | 676 | |
| Mexican Peso | | 07/31/2024 | | | JPM | | | | 77,738,029 | | | | 4,229,566 | | | | (52,636 | ) |
| Norwegian Krone | | 07/31/2024 | | | JPM | | | | 850,751 | | | | 79,749 | | | | (251 | ) |
| Polish Zloty | | 07/31/2024 | | | JPM | | | | 4,828,596 | | | | 1,199,248 | | | | (3,688 | ) |
| Singapore Dollar | | 07/31/2024 | | | JPM | | | | 121,839 | | | | 89,983 | | | | (17 | ) |
| South African Rand | | 07/31/2024 | | | JPM | | | | 49,729,258 | | | | 2,727,025 | | | | (6,730 | ) |
| Swedish Krona | | 07/31/2024 | | | JPM | | | | 18,047,793 | | | | 1,705,634 | | | | (20,327 | ) |
| Brazilian Real | | 09/18/2024 | | | JPM | | | | 17,206,595 | | | | 3,050,888 | | | | (125,226 | ) |
| Columbian Peso | | 09/18/2024 | | | JPM | | | | 2,349,542,537 | | | | 559,375 | | | | (1,535 | ) |
| Indian Rupee | | 09/18/2024 | | | JPM | | | | 457,737,840 | | | | 5,476,269 | | | | 11,519 | |
| Indonesia Rupiah | | 09/18/2024 | | | JPM | | | | 1,600,682,377 | | | | 97,690 | | | | 474 | |
| Philippine Peso | | 09/18/2024 | | | JPM | | | | 2,228,225 | | | | 38,106 | | | | 222 | |
| Taiwanese Dollar | | 09/18/2024 | | | JPM | | | | 10,461,302 | | | | 322,731 | | | | (3,064 | ) |
| Thailand Baht | | 09/18/2024 | | | JPM | | | | 61,676,449 | | | | 1,687,110 | | | | (9,890 | ) |
| Turkish Lira | | 09/18/2024 | | | JPM | | | | 20,702,862 | | | | 581,379 | | | | 1,785 | |
| South Korean Won | | 09/19/2024 | | | JPM | | | | 1,405,516,378 | | | | 1,022,763 | | | | (2,248 | ) |
| Chilean Peso | | 09/23/2024 | | | JPM | | | | 581,527,488 | | | | 617,610 | | | | (8,483 | ) |
| Egyptian Pound | | 12/18/2024 | | | JPM | | | | 11,504,040 | | | | 239,518 | | | | 17,518 | |
| | | | | | | | | | | | | | 25,770,780 | | | | (195,493 | ) |
| To Sell: | | | | | | | | | | | | | | | | | | |
| Chinese Yuan | | 07/31/2024 | | | JPM | | | | 75,270,163 | | | | 10,374,507 | | | | (24,086 | ) |
| Hungarian Forints | | 07/31/2024 | | | JPM | | | | 117,315,267 | | | | 317,744 | | | | (1,584 | ) |
| Japanese Yen | | 07/31/2024 | | | JPM | | | | 7,310,899 | | | | 45,655 | | | | 462 | |
| Mexican Peso | | 07/31/2024 | | | JPM | | | | 42,218,651 | | | | 2,297,030 | | | | 15,721 | |
See accompanying notes to consolidated financial statements.
FULCRUM DIVERSIFIED ABSOLUTE RETURN FUND
CONSOLIDATED SCHEDULE OF INVESTMENTS (Continued)
June 30, 2024
| OPEN FORWARD FOREIGN EXCHANGE CONTRACTS (Continued) | |
| Foreign Currency | | Settlement Date | | | Counterparty | | | Local Currency | | | U.S. Dollar Value | | | Unrealized
Appreciation/
(Depreciation) | |
| Norwegian Krone | | 07/31/2024 | | | JPM | | | | 3,914,691 | | | $ | 366,961 | | | $ | 4,184 | |
| Polish Zloty | | 07/31/2024 | | | JPM | | | | 5,170,011 | | | | 1,284,043 | | | | (2,042 | ) |
| Singapore Dollar | | 07/31/2024 | | | JPM | | | | 579,554 | | | | 428,024 | | | | 773 | |
| South African Rand | | 07/31/2024 | | | JPM | | | | 7,303,087 | | | | 400,483 | | | | (3,483 | ) |
| Swedish Krona | | 07/31/2024 | | | JPM | | | | 424,012 | | | | 40,072 | | | | (72 | ) |
| Swiss Franc | | 07/31/2024 | | | JPM | | | | 109,278 | | | | 122,085 | | | | 103 | |
| Brazilian Real | | 09/18/2024 | | | JPM | | | | 13,990,645 | | | | 2,480,670 | | | | 77,327 | |
| Columbian Peso | | 09/18/2024 | | | JPM | | | | 3,003,789,380 | | | | 715,136 | | | | 12,792 | |
| Indian Rupee | | 09/18/2024 | | | JPM | | | | 90,185,668 | | | | 1,078,960 | | | | (760 | ) |
| Indonesia Rupiah | | 09/18/2024 | | | JPM | | | | 22,582,532,913 | | | | 1,378,212 | | | | 3,030 | |
| Philippine Peso | | 09/18/2024 | | | JPM | | | | 203,643,451 | | | | 3,482,579 | | | | (25,318 | ) |
| Taiwanese Dollar | | 09/18/2024 | | | JPM | | | | 144,571,205 | | | | 4,460,015 | | | | 18,341 | |
| Thailand Baht | | 09/18/2024 | | | JPM | | | | 101,600,092 | | | | 2,779,189 | | | | (1,260 | ) |
| Turkish Lira | | 09/18/2024 | | | JPM | | | | 9,633,382 | | | | 270,525 | | | | (449 | ) |
| South Korean Won | | 09/19/2024 | | | JPM | | | | 3,419,452,545 | | | | 2,488,260 | | | | 1,079 | |
| Chilean Peso | | 09/23/2024 | | | JPM | | | | 386,462,477 | | | | 410,442 | | | | 3,377 | |
| Egyptian Pound | | 12/18/2024 | | | JPM | | | | 5,752,020 | | | | 119,759 | | | | (6,116 | ) |
| | | | | | | | | | | | | | 35,786,119 | | | | 72,019 | |
| | | | | | | | | | | | | | | | | | | |
| TOTAL | | | | | | | | | | | | | | | | $ | (123,474 | ) |
| CREDIT DEFAULT SWAP AGREEMENTS+ | |
| Description | | Counterparty | | | Fixed Deal (Pay) Rate | | | Maturity Date | | | Notional Value | | | Fair Value | | | Amortized Upfront
Payments
Paid/(Received) | | | Unrealized
Appreciation/
(Depreciation) | |
| Markit CDX EM 41^ | | JPM | | | | 1.00 | % | | 6/20/2029 | | | $ | (2,600,000 | ) | | | (82,277 | ) | | | (81,166 | ) | | $ | (1,111 | ) |
| Markit CDX NA HY 42^ | | JPM | | | | 5.00 | % | | 6/20/2029 | | | | (472,000 | ) | | | 30,379 | | | | 30,318 | | | | 61 | |
| Markit CDX NA IG 42^ | | JPM | | | | 1.00 | % | | 6/20/2029 | | | | (3,000,000 | ) | | | 62,718 | | | | 62,021 | | | | 697 | |
| Markit ITRAXX Europe 41^ | | JPM | | | | 1.00 | % | | 6/20/2029 | | | | (1,928,227 | ) | | | 34,887 | | | | 40,307 | | | | (5,420 | ) |
| Markit ITRAXX Europe Crossover 41+ | | JPM | | | | (5.00 | )% | | 6/20/2029 | | | | 2,275,308 | | | | (171,956 | ) | | | (165,859 | ) | | | (6,097 | ) |
| TOTAL | | | | | | | | | | | | | | | | | | | | | | | | $ | (11,870 | ) |
| + | Credit Default Swaps pay quarterly. |
| + | Buy protection. |
| ^ | Sell protection. |
See accompanying notes to consolidated financial statements.
FULCRUM DIVERSIFIED ABSOLUTE RETURN FUND
CONSOLIDATED SCHEDULE OF INVESTMENTS (Continued)
June 30, 2024
| DISPERSION SWAP AGREEMENTS* | |
| Description | | Counterparty | | | Receive | | | Pay | | | Maturity Date | | | Notional Value | | | Unrealized
Appreciation/
(Depreciation) | |
| Equity Volatility | | JPM | | | Stock Basket Volatility+ | | | Stock Basket Volatility+ | | | 9/20/2024 | | | | (8,000 | ) | | $ | (708 | ) |
| Equity Volatility | | JPM | | | Stock Basket Volatility+ | | | U.S. Index Volatility | | | 6/20/2025 | | | | (10,000 | ) | | | (24,541 | ) |
| SPX Index | | BAML | | | Stock Basket Volatility+ | | | U.S. Index Volatility | | | 1/17/2025 | | | | (20,000 | ) | | | 71,590 | |
| SPX Index | | BAR | | | Stock Basket Volatility+ | | | U.S. Index Volatility | | | 1/17/2025 | | | | (20,000 | ) | | | (177 | ) |
| SPX Index | | HSBC | | | Stock Basket Volatility+ | | | U.S. Index Volatility | | | 1/17/2025 | | | | (20,000 | ) | | | 44,118 | |
| SPX Index | | JPM | | | Stock Basket Volatility+ | | | U.S. Index Volatility | | | 6/20/2025 | | | | (14,000 | ) | | | 21,568 | |
| SPX Index | | UBS | | | Stock Basket Volatility+ | | | U.S. Index Volatility | | | 1/17/2025 | | | | (20,000 | ) | | | (53,407 | ) |
| SPX Index | | UBS | | | Stock Basket Volatility+ | | | U.S. Index Volatility | | | 1/17/2025 | | | | (25,000 | ) | | | (9,499 | ) |
| SX5E Index | | MS | | | Stock Basket Volatility^ | | | Europe Index Volatility | | | 12/20/2024 | | | | (10,000 | ) | | | 9,621 | |
| SX5E Index | | MS | | | Stock Basket Volatility^ | | | Europe Index Volatility | | | 12/20/2024 | | | | (10,000 | ) | | | 11,425 | |
| SX5E Index | | JPM | | | Stock Basket Volatility^ | | | Europe Index Volatility | | | 6/20/2025 | | | | (10,000 | ) | | | (12,743 | ) |
| SX5E Index | | MS | | | Stock Basket Volatility^ | | | Europe Index Volatility | | | 6/20/2025 | | | | (10,000 | ) | | | 175 | |
| SX5E Index | | MS | | | Stock Basket Volatility^ | | | Europe Index Volatility | | | 6/20/2025 | | | | (30,000 | ) | | | (20,891 | ) |
| TOTAL | | | | | | | | | | | | | | | | | | $ | 36,531 | |
| * | Dispersion Swaps pay at termination. |
| + | Volatility of custom basket of S&P 500 Index stocks. |
| ^ | Volatility of custom basket of Euro Stoxx 50 Index stocks. |
| INTEREST RATE SWAPS^ | |
| Rate Paid | | Rate Received | | | Payment Frequency | | | Maturity Date | | | Notional Value | | | Fair Value | | | Amortized Upfront
Payments
Paid/(Received) | | | Unrealized
Appreciation/
(Depreciation) | |
| INR - MIBOR | | 6.3350% | | | Semi-annually | | | 9/18/2029 | | | $ | 526,322 | | | $ | (1,733 | ) | | $ | 50 | | | $ | (1,783 | ) |
| 0.4980% | | JPY - TONAR | | | Annually | | | 9/18/2026 | | | | 22,548,978 | | | | (3,063 | ) | | | (11,632 | ) | | | 8,569 | |
| 1.7770% | | JPY - TONAR | | | Annually | | | 9/18/2064 | | | | 1,069,213 | | | | 11,873 | | | | 123 | | | | 11,750 | |
| CHF - SARON | | 1.3080% | | | Annually | | | 9/18/2034 | | | | 1,762,270 | | | | 56,629 | | | | 85 | | | | 56,544 | |
| GBP - SONIA | | 4.5260% | | | Annually | | | 9/18/2026 | | | | 8,173,613 | | | | 22,984 | | | | 17,123 | | | | 5,861 | |
| BRL - CDI | | 11.205% | | | Annually | | | 1/2/2026 | | | | 14,048,969 | | | | (52,046 | ) | | | (16,572 | ) | | | (35,474 | ) |
| MXN - TIIE | | 10.3290% | | | Monthly | | | 9/16/2026 | | | | 2,414,741 | | | | 11,993 | | | | 51 | | | | 11,942 | |
| EUR - EuroSTR | | 2.7553% | | | Annually | | | 9/18/2029 | | | | 2,321,050 | | | | 12,453 | | | | 14,662 | | | | (2,209 | ) |
| CNY - REPO RATE - CFXS | | 2.0090% | | | Quarterly | | | 9/18/2029 | | | | 6,604,838 | | | | 22,509 | | | | 3,138 | | | | 19,371 | |
| 1.7790% | | TWD - TAIBOR-Reuters | | | Quarterly | | | 9/18/2029 | | | | 2,029,271 | | | | 13,216 | | | | (817 | ) | | | 14,033 | |
| NZD - BBR - FRA | | 4.5630% | | | Quarterly | | | 9/18/2034 | | | | 1,436,221 | | | | 10,009 | | | | (149 | ) | | | 10,159 | |
| NZD - BBR - FRA | | 4.4850% | | | Quarterly | | | 9/18/2029 | | | | 1,472,770 | | | | 6,106 | | | | 3,531 | | | | 2,575 | |
| 3.9440% | | NOK - NIBOR | | | Semi-annually | | | 9/18/2029 | | | | 1,210,502 | | | | (2,499 | ) | | | (6,923 | ) | | | 4,424 | |
| 9.6000% | | MXN - TIIE | | | Monthly | | | 9/6/2034 | | | | 1,625,137 | | | | (28,706 | ) | | | 9,120 | | | | (37,826 | ) |
| 5.2410% | | CLP - TNA | | | Semi-annually | | | 9/23/2034 | | | | 1,275,171 | | | | 13,797 | | | | (747 | ) | | | 14,544 | |
| 4.5940% | | ILS - TELEBOR01 Reuters | | | Quarterly | | | 9/18/2034 | | | | 1,271,355 | | | | 3,474 | | | | 634 | | | | 2,840 | |
| NZD - BBR - FRA | | 4.7407% | | | Quarterly | | | 9/18/2026 | | | | 6,954,435 | | | | 7,326 | | | | 797 | | | | 6,529 | |
| TOTAL | | | | | | | | | | | | | | | | | | | | | | | $ | 91,849 | |
| ^ | Counterparty is J.P. Morgan Investment Bank. |
See accompanying notes to consolidated financial statements.
FULCRUM DIVERSIFIED ABSOLUTE RETURN FUND
CONSOLIDATED SCHEDULE OF INVESTMENTS (Continued)
June 30, 2024
| TOTAL RETURN SWAPS* | |
| Description | | Counterparty | | | Notional Value | | | Variable Rate | | | Maturity Date | | | Fair Value and
Unrealized
Appreciation/
(Depreciation) | |
| Acer, Inc. | | MS | | | $ | (10,025 | ) | | Receive SOFR – 3.750% | | | 8/25/2025 | | | $ | 439 | |
| Adnoc Drilling Company | | MS | | | | 57,714 | | | Pay SOFR + 1.150% | | | 2/3/2025 | | | | 549 | |
| Air China Ltd. | | JPM | | | | (103,144 | ) | | Receive HONIA – 0.350% | | | 10/9/2024 | | | | 3,666 | |
| Alchip Technologies | | MS | | | | 120,882 | | | Pay SOFR + 0.750% | | | 8/25/2025 | | | | (13,672 | ) |
| All Ring Tech Company Ltd. | | MS | | | | 23,643 | | | Pay SOFR + 0.750% | | | 8/25/2025 | | | | 147 | |
| Allis Electric Company Ltd. | | MS | | | | 49,739 | | | Pay SOFR + 0.750% | | | 8/25/2025 | | | | 3,308 | |
| Asia Vital Components Company Ltd. | | MS | | | | 172,623 | | | Pay SOFR + 0.750% | | | 8/25/2025 | | | | 9,085 | |
| ASUSTek Computer, Inc. | | MS | | | | (6,966 | ) | | Receive SOFR – 1.500% | | | 8/25/2025 | | | | (101 | ) |
| Auras Technology Company Ltd. | | MS | | | | 69,945 | | | Pay SOFR + 0.750% | | | 8/25/2025 | | | | 2,468 | |
| Banca Transilvania S/A | | MS | | | | 5,556 | | | Pay SOFR + 1.000% | | | 2/3/2025 | | | | 16 | |
| BCIIACTM1 | | BAR | | | | (2,434,197 | ) | | Receive SOFR – 0.260% | | | 6/15/2030 | | | | (26,681 | ) |
| BCIICAPG2 | | BAR | | | | (1,251,993 | ) | | Receive SOFR – 0.200% | | | 8/15/2030 | | | | 14,531 | |
| BCIIDISC3 | | BAR | | | | (3,442,242 | ) | | Receive SOFR – 0.250% | | | 7/15/2030 | | | | (4,471 | ) |
| BCIIFFOD4 | | BAR | | | | (2,161,417 | ) | | Receive SOFR – 0.300% | | | 4/15/2030 | | | | 45,612 | |
| BCIIJPNB5 | | BAR | | | | 3,563,590 | | | Pay TONAR + 0.080% | | | 2/15/2030 | | | | 264,167 | |
| BCIIPRIV6 | | BAR | | | | 2,436,891 | | | Pay SOFR + 0.250% | | | 4/15/2030 | | | | 12,419 | |
| BCIISHDF7 | | BAR | | | | 1,102,672 | | | Pay ESTR + 0.300% | | | 2/15/2030 | | | | 259 | |
| BCIISOXX8 | | BAR | | | | (1,608,530 | ) | | Receive SOFR – 0.350% | | | 9/15/2030 | | | | (13,979 | ) |
| BCIISTEL9 | | BAR | | | | (1,502,080 | ) | | Receive SOFR – 0.250% | | | 7/15/2030 | | | | (3,320 | ) |
| BCIITRAH10 | | BAR | | | | 1,060,265 | | | Pay TONAR + 0.080% | | | 2/15/2030 | | | | 20,776 | |
| BCIIUSBA11 | | BAR | | | | 1,040,767 | | | Receive SOFR – 0.300% | | | 2/15/2030 | | | | (55,877 | ) |
| BCIIWMAH12 | | BAR | | | | 1,604,291 | | | Pay SOFR + 0.200% | | | 12/15/2030 | | | | (10,205 | ) |
| Bloomberg Commodity Index | | JPM | | | | (1,212,649 | ) | | Pay Performance | | | 7/11/2024 | | | | 7,670 | |
| Bloomberg Industrial Metals Subindex | | JPM | | | | 536,910 | | | Pay Performance | | | 7/11/2024 | | | | (3,171 | ) |
| CGFCAWIN13 | | CIT | | | | 1,780,179 | | | Pay OBFR + 0.380% | | | 8/12/2024 | | | | (725 | ) |
| CGFCBVRG14 | | CIT | | | | (2,020,062 | ) | | Receive OBFR – 0.250% | | | 10/15/2024 | | | | 45,008 | |
| CGFCGROY15 | | CIT | | | | (215,243 | ) | | Receive OBFR – 0.250% | | | 9/13/2024 | | | | 3,863 | |
| CGFCJPBK16 | | CIT | | | | 622,862 | | | Pay TONA + 0.100% | | | 8/24/2024 | | | | 13,116 | |
| CGFOOILP17 | | CIT | | | | (2,510,052 | ) | | Receive OBFR – 0.150% | | | 7/12/2024 | | | | (39,251 | ) |
| CGNAECOM18 | | CIT | | | | (10,427 | ) | | Receive OBFR – 4.050% | | | 3/12/2025 | | | | 21 | |
| China Eastern Airlines | | JPM | | | | (25,109 | ) | | Receive HONIA – 4.250% | | | 10/9/2024 | | | | 1,216 | |
| Compeq Manufacturing Company Ltd. | | MS | | | | 27,336 | | | Pay SOFR + 0.750% | | | 8/25/2025 | | | | 3,514 | |
| CPFL Energia S/A | | MS | | | | 9,959 | | | Pay BRL 1D + 0.500% | | | 9/15/2025 | | | | 1,017 | |
| Elan Microelectronics Corporation | | MS | | | | (4,841 | ) | | Receive SOFR – 4.125% | | | 8/25/2025 | | | | 195 | |
| EVA Airways Corporation | | JPM | | | | (120,825 | ) | | Receive OBFR – 4.375% | | | 10/9/2024 | | | | (676 | ) |
| Evergreen Marine Corporation | | MS | | | | 40,137 | | | Pay SOFR + 0.750% | | | 8/25/2025 | | | | 388 | |
| Flexium Interconnect, Inc. | | MS | | | | (5,385 | ) | | Receive SOFR – 3.000% | | | 8/25/2025 | | | | (558 | ) |
| Fortune Electric Company Ltd. | | MS | | | | 93,439 | | | Pay SOFR + 0.750% | | | 8/25/2025 | | | | 3,630 | |
| George Weston Ltd. | | JPM | | | | (2,882 | ) | | Receive CAD CDOR – 0.300% | | | 5/6/2025 | | | | (148 | ) |
| Gigabyte Technology | | MS | | | | 144,544 | | | Pay SOFR + 0.750% | | | 8/25/2025 | | | | (1,116 | ) |
| Gold Circuit Electronics Ltd. | | MS | | | | 28,614 | | | Pay SOFR + 0.750% | | | 8/25/2025 | | | | 3,571 | |
| GSENEPOW19 | | GS | | | | 425,946 | | | Pay SOFR + 0.300% | | | 5/13/2027 | | | | (13,734 | ) |
| GSGLPHRE20 | | GS | | | | (4,611,715 | ) | | Receive SOFR – 0.500% | | | 4/21/2027 | | | | 147,494 | |
| GSMBATDM21 | | GS | | | | 1,431,421 | | | Pay SOFR + 0.450% | | | 4/21/2027 | | | | (14,940 | ) |
| GSMBECO322 | | GS | | | | (395,645 | ) | | Receive SOFR – 0.250% | | | 4/22/2027 | | | | (3,160 | ) |
| GSMBEXC023 | | GS | | | | 288,141 | | | Pay SOFR + 0.350% | | | 4/22/2027 | | | | (2,099 | ) |
See accompanying notes to consolidated financial statements.
FULCRUM DIVERSIFIED ABSOLUTE RETURN FUND
CONSOLIDATED SCHEDULE OF INVESTMENTS (Continued)
June 30, 2024
| Description | | Counterparty | | | Notional Value | | | Variable Rate | | | Maturity Date | | | Fair Value and
Unrealized
Appreciation/
(Depreciation) | |
| GSMBJDC024 | | GS | | | $ | 1,519,163 | | | Pay TONAR + 0.400% | | | 4/27/2027 | | | $ | 17,583 | |
| GSMBLITH25 | | GS | | | | (106,111 | ) | | Receive SOFR – 1.350% | | | 11/18/2026 | | | | 1,571 | |
| GSMBOILR26 | | GS | | | | 272,150 | | | Pay SOFR + 0.350% | | | 6/15/2027 | | | | 7,481 | |
| GSMBPSTC27 | | GS | | | | 1,381,786 | | | Pay SOFR + 0.360% | | | 5/26/2027 | | | | (13,719 | ) |
| GSMBRELH28 | | GS | | | | (811,273 | ) | | Receive SOFR – 0.400% | | | 5/13/2027 | | | | (7,369 | ) |
| GSMBURB029 | | GS | | | | (408,588 | ) | | Receive SOFR – 0.200% | | | 6/14/2027 | | | | (22,480 | ) |
| GSMBWHEL30 | | GS | | | | (2,007,074 | ) | | Receive SOFR – 0.250% | | | 1/7/2027 | | | | 21,837 | |
| GSMBWIH131 | | GS | | | | (1,346,406 | ) | | Receive SOFR – 0.250% | | | 3/4/2027 | | | | (5,514 | ) |
| GSMBWUTH32 | | GS | | | | (1,211,616 | ) | | Receive SOFR – 0.300% | | | 6/22/2027 | | | | 16,509 | |
| GSTMTAIP33 | | GS | | | | 1,073,207 | | | Pay SOFR + 0.300% | | | 6/18/2027 | | | | (7,284 | ) |
| GSTMTAIR34 | | GS | | | | (548,623 | ) | | Receive SOFR – 0.200% | | | 6/22/2027 | | | | 1,454 | |
| GSXEGRAN35 | | GS | | | | 1,273,898 | | | Pay EUR001M + 0.450% | | | 6/17/2027 | | | | (10,831 | ) |
| Hanwha Ocean Company Ltd. | | MS | | | | 18,743 | | | Pay SOFR + 0.750% | | | 11/7/2024 | | | | (1,127 | ) |
| HD Hyundai Electric Company Ltd. | | MS | | | | 165,641 | | | Pay SOFR + 0.750% | | | 11/7/2024 | | | | 13,629 | |
| HD Hyundai Heavy Industries Company Ltd. | | MS | | | | 23,484 | | | Pay SOFR + 0.750% | | | 11/7/2024 | | | | 3,713 | |
| Hon Hai Precision Industry Company Ltd. | | MS | | | | 49,557 | | | Pay SOFR + 0.750% | | | 8/25/2025 | | | | 3,194 | |
| ITEQ Corporation | | MS | | | | 46,439 | | | Pay SOFR + 0.750% | | | 8/25/2025 | | | | 131 | |
| JBS S/A | | MS | | | | (281,250 | ) | | Receive BRL 1D – 4.000% | | | 9/15/2025 | | | | (8,013 | ) |
| JPFCITSV36 | | JPM | | | | (1,990,904 | ) | | Receive OBFR – 0.300% | | | 3/27/2025 | | | | 13,814 | |
| JPFUMEDA37 | | JPM | | | | (235,270 | ) | | Pay OBFR + 0.400% | | | 2/12/2025 | | | | 142 | |
| JPFUNOI138 | | JPM | | | | (683,443 | ) | | Receive OBFR – 0.650% | | | 4/9/2025 | | | | 11,572 | |
| JPFUOMED39 | | JPM | | | | (402,136 | ) | | Receive OBFR – 0.500% | | | 4/15/2025 | | | | (1,206 | ) |
| JPFUPGM40 | | JPM | | | | 408,114 | | | Pay OBFR + 0.500% | | | 5/7/2025 | | | | (16,049 | ) |
| JPFURU141 | | JPM | | | | 1 | | | Pay OBFR | | | 3/14/2033 | | | | (1 | ) |
| JPFUSHP242 | | JPM | | | | (1,104,252 | ) | | Receive OBFR – 1.470% | | | 7/23/2024 | | | | (17,453 | ) |
| JPFUSOEC43 | | JPM | | | | (337,535 | ) | | Receive OBFR – 0.750% | | | 4/2/2025 | | | | 5,612 | |
| JPGLAG44 | | JPM | | | | 588,984 | | | Pay OBFR + 0.250% | | | 5/20/2025 | | | | 4,926 | |
| JPQLAG45 | | JPM | | | | 1,000,104 | | | Pay OBFR + 0.250% | | | 5/20/2025 | | | | 10,355 | |
| JPTAOBRL46 | | JPM | | | | (48,994 | ) | | Receive BRL 1D – 1.600% | | | 7/22/2025 | | | | (1,187 | ) |
| JPVWIN47 | | JPM | | | | 897,352 | | | Pay OBFR + 0.250% | | | 5/19/2025 | | | | (273 | ) |
| LS Electric Company Ltd. | | MS | | | | 157,539 | | | Pay SOFR + 0.750% | | | 11/7/2024 | | | | 10,715 | |
| MSFDRUS I48 | | MS | | | | 39,354,191 | | | N/A | | | 4/22/2026 | | | | 17,549 | |
| Novatek Microelectronics Corporation | | MS | | | | (9,976 | ) | | Receive SOFR – 3.500% | | | 8/25/2025 | | | | 288 | |
| Phison Electronics Corporation | | MS | | | | 53,423 | | | Pay SOFR + 0.750% | | | 8/25/2025 | | | | (1,812 | ) |
| Qatar Gas Transport Company Ltd. | | MS | | | | 23,022 | | | Pay SOFR + 1.150% | | | 2/3/2025 | | | | 729 | |
| Quanta Computer, Inc. | | MS | | | | 58,772 | | | Pay SOFR + 0.750% | | | 8/25/2025 | | | | 4,392 | |
| Realtek Semiconductor Corporation | | MS | | | | (8,998 | ) | | Receive SOFR – 1.250% | | | 8/25/2025 | | | | 276 | |
| Samsung Electronics Company Ltd. | | MS | | | | 164,391 | | | Pay SOFR + 0.750% | | | 11/7/2024 | | | | 6,433 | |
| Samsung Heavy Industries Company Ltd. | | MS | | | | 91,833 | | | Pay SOFR + 0.750% | | | 11/7/2024 | | | | 4,768 | |
| Sao Martinho S/A | | MS | | | | 10,052 | | | Pay BRL 1D + 1.50% | | | 9/15/2025 | | | | 595 | |
| Shihlin Electric & Engineering Corporation | | MS | | | | 74,514 | | | Pay SOFR + 0.750% | | | 8/25/2025 | | | | 9,396 | |
| SK Hynix, Inc. | | MS | | | | 323,775 | | | Pay SOFR + 0.750% | | | 11/7/2024 | | | | 19,601 | |
| Taiwan Semiconductor Manufacturing Company Ltd. | | MS | | | | 127,675 | | | Pay SOFR + 0.750% | | | 8/25/2025 | | | | 6,022 | |
| TXC Corporation | | MS | | | | (7,840 | ) | | Receive SOFR – 4.250% | | | 8/25/2025 | | | | (8 | ) |
| Wistron Corporation | | MS | | | | 31,668 | | | Pay SOFR – 1.750% | | | 8/25/2025 | | | | 1,097 | |
| Wiwynn Corporation | | MS | | | | 145,311 | | | Pay SOFR + 0.750% | | | 8/25/2025 | | | | 1,566 | |
| TOTAL | | | | | | | | | | | | | | | $ | 502,885 | |
| * | Total Return Swaps pay monthly. |
See accompanying notes to consolidated financial statements.
FULCRUM DIVERSIFIED ABSOLUTE RETURN FUND
CONSOLIDATED SCHEDULE OF INVESTMENTS (Continued)
June 30, 2024
Definitions
| ADR | | - | American Depositary Receipt |
| A/S | | - | Anonim Sirketi |
| CDI | | - | Certificado de Deposito Interbancario |
| ETF | | - | Exchange-Traded Fund |
| EURIBOR | | - | Euro Inter-Bank Offered Rate |
| ICPROM | | - | Indice Camara Promedio |
| Ltd. | | - | Limited Company |
| MIBOR | | - | Mumbai Inter-Bank Offered Rate |
| MIFOR | | - | Mumbai Inter-Bank Forward Rate |
| MSCI | | - | Morgan Stanley Capital International |
| NIBOR | | - | Norway Three Month Interbank Rate |
| NV | | - | Naamioze Vennootschap |
| PLC | | - | Public Limited Company |
| REIT | | - | Real Estate Investment Trust |
| S/A | | - | Société Anonyme |
| SARON | | - | Swiss Average Rate Overnight |
| SONIA | | - | Sterling Overnight Index Average |
| SPX | | - | S&P 500 Index |
| SX5E | | - | Euro Stoxx 50 Index |
| TIIE | | - | Tasa de Interes Interbancaria de Equilibrio |
| TONAR | | - | Tokyo Overnight Average Rate |
| 3M BILLS | | - | 3 Month Treasury Bills |
| 3M CP | | - | 3 Month Commercial Paper |
Counterparty Definitions
| BAML | | | Bank of America Merrill Lynch |
| BAR | | | Barclays |
| CIT | | | Citigroup |
| GS | | | Goldman Sachs |
| HSBC | | | HSBC Securities |
| JPM | | | JP Morgan |
| MER | | | Merrill Lynch |
| MS | | | Morgan Stanley |
| UBS | | | UBS |
| (a) | Percentage rounds to less than 0.1%. |
| (b) | Non-income producing security. |
| (c) | Foreign issued security. |
| (d) | Each option contract allows the holder of the option to purchase or sell 10 shares of the underlying index. |
| (e) | All or a portion of this investment is a holding of the Fulcrum Diversified Absolute Return Fund CFC. |
| (f) | Each contract is equivalent to one futures contract. |
| (g) | The amounts shown are the underlying reference notional amounts to stock exchange indices and equities upon which the fair value of the futures contracts held by the Fund are based. Notional values do not represent the current fair value of, and are not necessarily indicative of the future cash flows of the Fund’s futures contracts. Further, the underlying price changes in relation to the variables specified by the notional values affects the fair value of these derivative financial instruments. The notional values as set forth within this schedule do not purport to represent economic value at risk to the Fund. |
| (h) | Option only pays if both terms are met on the expiration date. |
See accompanying notes to consolidated financial statements.
FULCRUM DIVERSIFIED ABSOLUTE RETURN FUND
CONSOLIDATED SCHEDULE OF INVESTMENTS (Continued)
June 30, 2024
| 1 | BCIIACTM is a custom basket of investment management stocks. The components of the basket as of June 30, 2024 are shown on the following pages. |
| 2 | BCIICAPG is a custom basket of U.S. construction stocks. |
| 3 | BCIIDISC is a custom basket of U.S. housing stocks. The components of the basket as of June 30, 2024 are shown on the following pages. |
| 4 | BCIIFFOD is a custom basket of consumer trends sector stocks. The components of the basket as of June 30, 2024 are shown on the following pages. |
| 5 | BCIIJPNB is a custom basket of Japanese bank stocks. The components of the basket as of June 30, 2024 are shown on the following pages. |
| 6 | BCIIPRIV is a custom basket of global financial stocks. The components of the basket as of June 30, 2024 are shown on the following pages. |
| 7 | BCIISHDF is a custom basket of defense stocks. |
| 8 | BCIISOXX is a custom basket of technology stocks. |
| 9 | BCIISTEL is a custom basket of base metal and coal stocks. |
| 10 | BCIITRAH is a custom basket of Japanese housing stocks. |
| 11 | BCIIUSBA is a custom basket of global financial stocks. |
| 12 | BCIIWMAH is a custom basket of chemical industry stocks. |
| 13 | CGFCAWIN is a custom basket of technology stocks. |
| 14 | CGFCBVRG is a custom basket of consumer trends and short processed food stocks. The components of the basket as of June 30, 2024 are shown on the following pages. |
| 15 | CGFCGROY is a custom basket of gold stocks. |
| 16 | CGFCJPBK is a custom basket of global financial and bank stocks. |
| 17 | CGFOOILP is a custom basket of global energy and oil stocks. The components of the basket as of June 30, 2024 are shown on the following pages. |
| 18 | CGNAECOM is a custom basket of consumer trends stocks. |
| 19 | GSENEPOW is a custom basket of U.S. stocks. |
| 20 | GSGLPHRE is a custom basket of consumer trends stocks. The components of the basket as of June 30, 2024 are shown on the following pages. |
| 21 | GSMBATDM is a custom basket of consumer trends stocks. |
| 22 | GSMBECO3 is a custom basket of consumer trends stocks. |
| 23 | GSMBEXC0 is a custom basket of global financial stocks. |
| 24 | GSMBJDC0 is a custom basket of technology stocks. |
| 25 | GSMBLITH is a custom basket of auto company stocks. |
| 26 | GSMBOILR is a custom basket of energy stocks. |
| 27 | GSMBPSTC is a custom basket of chemical stocks. |
| 28 | GSMBRELH is a custom basket of energy stocks. |
| 29 | GSMBURB0 is a custom basket of global financial stocks. |
| 30 | GSMBWHEL is a custom basket of U.S. healthcare stocks. The components of the basket as of June 30, 2024 are shown on the following pages. |
| 31 | GSMBWIH1 is a custom basket of technology stocks. |
| 32 | GSMBWUTH is a custom basket of energy stocks. |
| 33 | GSTMTAIP is a custom basket of U.S. stocks. |
| 34 | GSTMTAIR is a custom basket of U.S. stocks. |
| 35 | GSXEGRAN is a custom basket of European stocks. |
| 36 | JPFCITSV is a custom basket of technology stocks. |
| 37 | JPFUMEDA is a custom basket of technology company stocks. |
| 38 | JPFUNOI1 is a custom basket of energy stocks. |
| 39 | JPFUOMED is a custom basket of technology company stocks. |
| 40 | JPFUPGM is a custom basket of gold stocks. |
| 41 | JPFURU1 I is a custom basket of metal and coal stocks. |
| 42 | JPFUSHP2 is a custom basket of shipping company stocks. |
| 43 | JPFUSOEC is a custom basket of Chinese company stocks. |
| 44 | JPGLAG Index. |
| 45 | JPQLAG Index. |
| 46 | JPTAOBRL is a custom basket of Brazilian company stocks. |
| 47 | JPVWIN Index. |
| 48 | MSFDRUS I – The components of the basket as of June 30, 2024 are shown on the following pages. |
See accompanying notes to consolidated financial statements.
FULCRUM DIVERSIFIED ABSOLUTE RETURN FUND
CONSOLIDATED SCHEDULE OF INVESTMENTS (Continued)
June 30, 2024
The following table represents the individual positions and related values of underlying securities of the BCIIACTM Index Total Return Swap with Barclays.^
| Name | | Quantity | | | Value | | | Weight | |
| Janus Henderson Group PLC | | | (9,443 | ) | | $ | (318,351 | ) | | | 12.91 | % |
| T Rowe Price Group, Inc. | | | (2,330 | ) | | | (268,660 | ) | | | 10.89 | % |
| Invesco Ltd. | | | (16,651 | ) | | | (249,106 | ) | | | 10.10 | % |
| Franklin Resources, Inc. | | | (9,159 | ) | | | (204,712 | ) | | | 8.30 | % |
| Artisan Partners Asset Management, Inc. | | | (4,859 | ) | | | (200,556 | ) | | | 8.13 | % |
| Abrdn PLC | | | (97,603 | ) | | | (182,873 | ) | | | 7.41 | % |
| Affiliated Managers Group, Inc. | | | (681 | ) | | | (106,460 | ) | | | 4.32 | % |
| Schroders PLC | | | (21,913 | ) | | | (100,786 | ) | | | 4.09 | % |
| Alliancebernstein Holding LP | | | (2,945 | ) | | | (99,511 | ) | | | 4.03 | % |
| Amundi SA | | | (1,462 | ) | | | (94,412 | ) | | | 3.83 | % |
| Federated Hermes, Inc. | | | (2,595 | ) | | | (85,341 | ) | | | 3.46 | % |
| StepStone Group, Inc. | | | (1,741 | ) | | | (79,898 | ) | | | 3.24 | % |
| Cohen & Steers, Inc. | | | (913 | ) | | | (66,221 | ) | | | 2.68 | % |
| Victory Capital Holdings, Inc. | | | (1,385 | ) | | | (66,112 | ) | | | 2.68 | % |
| Virtu Financial, Inc. | | | (2,700 | ) | | | (60,613 | ) | | | 2.46 | % |
| Virtus Investment Partners, Inc. | | | (228 | ) | | | (51,554 | ) | | | 2.09 | % |
| IGM Financial, Inc. | | | (1,811 | ) | | | (50,034 | ) | | | 2.03 | % |
| Magellan Financial Group Ltd. | | | (8,218 | ) | | | (46,181 | ) | | | 1.87 | % |
| Anima Holding SpA | | | (8,636 | ) | | | (43,128 | ) | | | 1.75 | % |
| Brightsphere Investment Group, Inc. | | | (1,624 | ) | | | (35,995 | ) | | | 1.46 | % |
| DWS Group GmbH & Company KgaA | | | (645 | ) | | | (22,909 | ) | | | 0.93 | % |
| Bridgepoint Group PLC | | | (7,586 | ) | | | (21,137 | ) | | | 0.86 | % |
| Ashmore Group PLC | | | (5,485 | ) | | | (11,795 | ) | | | 0.48 | % |
| | | | | | | $ | (2,466,345 | ) | | | 100.00 | % |
The following table represents the individual positions and related values of underlying securities of the BCIIDISC Index Total Return Swap with Barclays.^
| Name | | Quantity | | | Value | | | Weight | |
| Six Flags Entertainment Corporation | | | (2,307 | ) | | $ | (76,464 | ) | | | 2.21 | % |
| Best Buy Company, Inc. | | | (817 | ) | | | (68,827 | ) | | | 1.99 | % |
| BRP, Inc. | | | (1,029 | ) | | | (65,938 | ) | | | 1.91 | % |
| Target Corporation | | | (425 | ) | | | (62,965 | ) | | | 1.82 | % |
| Chewy, Inc., Class A | | | (2,283 | ) | | | (62,192 | ) | | | 1.80 | % |
| Whirlpool Corporation | | | (598 | ) | | | (61,111 | ) | | | 1.77 | % |
| International Game Tachnology PLC | | | (2,946 | ) | | | (60,276 | ) | | | 1.74 | % |
| YETI Holdings, Inc. | | | (1,468 | ) | | | (55,990 | ) | | | 1.62 | % |
| LCI Industries | | | (539 | ) | | | (55,694 | ) | | | 1.61 | % |
| Dollar General Corporation | | | (409 | ) | | | (54,107 | ) | | | 1.57 | % |
| Dollar Tree, Inc. | | | (502 | ) | | | (53,555 | ) | | | 1.55 | % |
| Harley-Davidson, Inc. | | | (1,581 | ) | | | (53,013 | ) | | | 1.53 | % |
| Hasbro, Inc. | | | (898 | ) | | | (52,506 | ) | | | 1.52 | % |
| Penn Entertainment, Inc. | | | (2,683 | ) | | | (51,918 | ) | | | 1.50 | % |
| Polaris, Inc. | | | (648 | ) | | | (50,759 | ) | | | 1.47 | % |
| Mattel, Inc. | | | (3,113 | ) | | | (50,613 | ) | | | 1.47 | % |
| Mohawk Industries, Inc. | | | (445 | ) | | | (50,595 | ) | | | 1.46 | % |
| Carmax, Inc. | | | (676 | ) | | | (49,559 | ) | | | 1.43 | % |
| Brunswick Corporation | | | (662 | ) | | | (48,165 | ) | | | 1.39 | % |
| Winnebago Industries, Inc. | | | (875 | ) | | | (47,401 | ) | | | 1.37 | % |
| La-Z-Boy, Inc. | | | (1,263 | ) | | | (47,086 | ) | | | 1.36 | % |
| Camping World Holdings, Inc., Class A | | | (2,608 | ) | | | (46,578 | ) | | | 1.35 | % |
| Life Time Group Holdings, Inc. | | | (2,393 | ) | | | (45,049 | ) | | | 1.30 | % |
| Floor & Decor Holdings, Inc., Class A | | | (452 | ) | | | (44,945 | ) | | | 1.30 | % |
| Leggett & Platt, Inc. | | | (3,910 | ) | | | (44,810 | ) | | | 1.30 | % |
| Vail Resorts, Inc. | | | (248 | ) | | | (44,723 | ) | | | 1.29 | % |
| Bowlero Corporation, Class A | | | (3,086 | ) | | | (44,720 | ) | | | 1.29 | % |
| Fox Factory Holding Corporation | | | (904 | ) | | | (43,582 | ) | | | 1.26 | % |
| RH | | | (169 | ) | | | (41,378 | ) | | | 1.20 | % |
| Papa John’s International, Inc. | | | (877 | ) | | | (41,194 | ) | | | 1.19 | % |
| BJ’s Restaurants, Inc. | | | (1,175 | ) | | | (40,769 | ) | | | 1.18 | % |
| Jack in the Box, Inc. | | | (756 | ) | | | (38,524 | ) | | | 1.12 | % |
| Cracker Barrel Old Country Store, Inc. | | | (910 | ) | | | (38,366 | ) | | | 1.11 | % |
| Cheesecake Factory, Inc. (The) | | | (953 | ) | | | (37,435 | ) | | | 1.08 | % |
See accompanying notes to consolidated financial statements.
FULCRUM DIVERSIFIED ABSOLUTE RETURN FUND
CONSOLIDATED SCHEDULE OF INVESTMENTS (Continued)
June 30, 2024
| Name | | Quantity | | | Value | | | Weight | |
| United Parks & Resorts, Inc. | | | (687 | ) | | $ | (37,319 | ) | | | 1.08 | % |
| Chefs’ Warehouse, Inc. (The) | | | (941 | ) | | | (36,799 | ) | | | 1.07 | % |
| Acushnet Holdings Corporation | | | (568 | ) | | | (36,074 | ) | | | 1.04 | % |
| Topgolf Callaway Brands Corporation | | | (2,357 | ) | | | (36,057 | ) | | | 1.04 | % |
| Genuine Parts Company | | | (259 | ) | | | (35,880 | ) | | | 1.04 | % |
| Patrick Industries, Inc. | | | (316 | ) | | | (34,288 | ) | | | 0.99 | % |
| LKQ Corporation | | | (821 | ) | | | (34,125 | ) | | | 0.99 | % |
| Thor Industries, Inc. | | | (362 | ) | | | (33,786 | ) | | | 0.98 | % |
| Yum! Brands, Inc. | | | (254 | ) | | | (33,593 | ) | | | 0.97 | % |
| Dine Brands Global, Inc. | | | (888 | ) | | | (32,127 | ) | | | 0.93 | % |
| Six Flags Entertainment Corporation | | | (960 | ) | | | (31,807 | ) | | | 0.92 | % |
| Monro, Inc. | | | (1,307 | ) | | | (31,186 | ) | | | 0.90 | % |
| Sonos, Inc. | | | (2,074 | ) | | | (30,618 | ) | | | 0.89 | % |
| Leslie’s, Inc. | | | (7,306 | ) | | | (30,609 | ) | | | 0.89 | % |
| Marinemax, Inc. | | | (922 | ) | | | (29,851 | ) | | | 0.86 | % |
| Mister Car Wash, Inc. | | | (4,179 | ) | | | (29,750 | ) | | | 0.86 | % |
| Other Underlying Index Components* | | | (45,150 | ) | | | (1,190,063 | ) | | | 34.49 | % |
| | | | | | | $ | (3,454,739 | ) | | | 100.00 | % |
The following table represents the individual positions and related values of underlying securities of the BCIIFFOD Index Total Return Swap with Barclays.^
| Name | | Quantity | | | Value | | | Weight | |
| Hershey Company (The) | | | (587 | ) | | $ | (107,914 | ) | | | 5.09 | % |
| Danone SA | | | (1,584 | ) | | | (96,859 | ) | | | 4.57 | % |
| Unilever PLC | | | (1,755 | ) | | | (96,420 | ) | | | 4.55 | % |
| Keurig Dr Pepper, Inc. | | | (2,798 | ) | | | (93,467 | ) | | | 4.41 | % |
| Kellogg Company | | | (1,489 | ) | | | (85,883 | ) | | | 4.05 | % |
| Campbell Soup Company | | | (1,728 | ) | | | (78,095 | ) | | | 3.68 | % |
| Coca-Cola Company (The) | | | (1,171 | ) | | | (74,544 | ) | | | 3.51 | % |
| McCormick & Company, Inc. | | | (1,021 | ) | | | (72,397 | ) | | | 3.41 | % |
| Conagra Brands, Inc. | | | (2,535 | ) | | | (72,053 | ) | | | 3.40 | % |
| General Mills, Inc. | | | (1,086 | ) | | | (68,693 | ) | | | 3.24 | % |
| Kraft Heinz Company (The) | | | (2,117 | ) | | | (68,214 | ) | | | 3.22 | % |
| TreeHouse Foods, Inc. | | | (1,853 | ) | | | (67,883 | ) | | | 3.20 | % |
| Utz Brands, Inc. | | | (3,954 | ) | | | (65,790 | ) | | | 3.10 | % |
| Constellation Brands, Inc. | | | (253 | ) | | | (65,210 | ) | | | 3.07 | % |
| J M Smucker Company (The) | | | (591 | ) | | | (64,448 | ) | | | 3.04 | % |
| PepsiCo, Inc. | | | (383 | ) | | | (63,194 | ) | | | 2.98 | % |
| Nestlé S.A. | | | (612 | ) | | | (62,493 | ) | | | 2.95 | % |
| Barry Callebaut AG | | | (38 | ) | | | (61,851 | ) | | | 2.92 | % |
| Reckitt Benckiser Group PLC | | | (1,073 | ) | | | (58,073 | ) | | | 2.74 | % |
| J & J Snack Foods Corporation | | | (351 | ) | | | (56,922 | ) | | | 2.68 | % |
| Tootsie Roll Industries, Inc. | | | (1,823 | ) | | | (55,723 | ) | | | 2.63 | % |
| Mondelez International, Inc., Class A | | | (806 | ) | | | (52,721 | ) | | | 2.49 | % |
| Flowers Foods, Inc. | | | (2,323 | ) | | | (51,568 | ) | | | 2.43 | % |
| Dollar Tree, Inc. | | | (465 | ) | | | (49,638 | ) | | | 2.34 | % |
| Hormel Foods Corporation | | | (1,541 | ) | | | (46,978 | ) | | | 2.21 | % |
| Sysco Corporation | | | (637 | ) | | | (45,454 | ) | | | 2.14 | % |
| Saputo, Inc. | | | (2,016 | ) | | | (45,287 | ) | | | 2.14 | % |
| Tate & Lyle PLC | | | (5,481 | ) | | | (41,439 | ) | | | 1.95 | % |
| Chocoladefabriken Lindt & Spruengli AG | | | (3 | ) | | | (38,838 | ) | | | 1.83 | % |
| Orkla ASA | | | (3,967 | ) | | | (32,262 | ) | | | 1.52 | % |
| JDE Peet’s NV | | | (1,583 | ) | | | (31,552 | ) | | | 1.49 | % |
| Post Holdings, Inc. | | | (299 | ) | | | (31,161 | ) | | | 1.47 | % |
| Lancaster Colony Corporation | | | (147 | ) | | | (27,720 | ) | | | 1.31 | % |
| Colgate-Palmolive Company | | | (248 | ) | | | (24,105 | ) | | | 1.14 | % |
| WK Kellogg Company | | | (1,263 | ) | | | (20,793 | ) | | | 0.98 | % |
| Lamb Weston Holdings, Inc. | | | (239 | ) | | | (20,100 | ) | | | 0.95 | % |
| Hain Celestial Group, Inc. (The) | | | (2,502 | ) | | | (17,287 | ) | | | 0.81 | % |
| B&G Foods, Inc. | | | (940 | ) | | | (7,593 | ) | | | 0.36 | % |
| | | | | | | $ | (2,120,622 | ) | | | 100.00 | % |
See accompanying notes to consolidated financial statements.
FULCRUM DIVERSIFIED ABSOLUTE RETURN FUND
CONSOLIDATED SCHEDULE OF INVESTMENTS (Continued)
June 30, 2024
The following table represents the individual positions and related values of underlying securities of the BCIIJPNB Index Total Return Swap with Barclays.^
| Name | | Quantity | | | Value | | | Weight | |
| Mitsubishi UFJ Financial Group, Inc. | | | 33,070 | | | $ | 355,428 | | | | 9.29 | % |
| Sumitomo Mitsui Financial Group, Inc. | | | 4,545 | | | | 303,006 | | | | 7.92 | % |
| Resona Holdings, Inc. | | | 41,995 | | | | 277,881 | | | | 7.26 | % |
| Concordia Financial Group Ltd. | | | 46,764 | | | | 275,053 | | | | 7.19 | % |
| Mizuho Financial Group, Inc. | | | 12,900 | | | | 269,270 | | | | 7.03 | % |
| Chiba Bank Ltd. (The) | | | 29,479 | | | | 262,402 | | | | 6.86 | % |
| Sumitomo Mitsui Trust Holdings, Inc. | | | 11,082 | | | | 252,824 | | | | 6.61 | % |
| Fukuoka Financial Group, Inc. | | | 6,850 | | | | 183,090 | | | | 4.78 | % |
| Mebuki Financial Group, Inc. | | | 45,691 | | | | 177,912 | | | | 4.65 | % |
| Yamaguchi Financial Group, Inc. | | | 13,899 | | | | 157,720 | | | | 4.12 | % |
| Shizuoka Financial Group, Inc. | | | 15,123 | | | | 145,150 | | | | 3.79 | % |
| 77 Bank Ltd. (The) | | | 4,683 | | | | 130,270 | | | | 3.40 | % |
| Hirogin Holdings, Inc. | | | 13,031 | | | | 100,686 | | | | 2.63 | % |
| Kyushu Financial Group, Inc. | | | 16,853 | | | | 98,811 | | | | 2.58 | % |
| Mitsubishi UFJ Financial Group, Inc. | | | 6,420 | | | | 68,996 | | | | 1.80 | % |
| Nishi-Nippon Financial Holdings, Inc. | | | 5,212 | | | | 65,635 | | | | 1.71 | % |
| Sumitomo Mitsui Financial Group, Inc. | | | 882 | | | | 58,820 | | | | 1.54 | % |
| Resona Holdings, Inc. | | | 8,152 | | | | 53,943 | | | | 1.41 | % |
| Concordia Financial Group Ltd. | | | 9,078 | | | | 53,394 | | | | 1.39 | % |
| Mizuho Financial Group, Inc. | | | 2,504 | | | | 52,271 | | | | 1.37 | % |
| Shiga Bank, Ltd. (The) | | | 1,970 | | | | 51,608 | | | | 1.35 | % |
| Chiba Bank Ltd. (The) | | | 5,722 | | | | 50,938 | | | | 1.33 | % |
| Sumitomo Mitsui Trust Holdings, Inc. | | | 2,151 | | | | 49,079 | | | | 1.28 | % |
| Gunma Bank Ltd. (The) | | | 6,568 | | | | 41,932 | | | | 1.10 | % |
| Fukuoka Financial Group, Inc. | | | 1,330 | | | | 35,542 | | | | 0.93 | % |
| Hachijuni Bank Ltd. (The) | | | 5,309 | | | | 34,635 | | | | 0.90 | % |
| Mebuki Financial Group, Inc. | | | 8,870 | | | | 34,537 | | | | 0.90 | % |
| Yamaguchi Financial Group, Inc. | | | 2,698 | | | | 30,617 | | | | 0.80 | % |
| Shizuoka Financial Group, Inc. | | | 2,936 | | | | 28,177 | | | | 0.74 | % |
| 77 Bank Ltd. (The) | | | 909 | | | | 25,288 | | | | 0.66 | % |
| Seven Bank Ltd. | | | 13,283 | | | | 22,211 | | | | 0.58 | % |
| Hirogin Holdings, Inc. | | | 2,530 | | | | 19,545 | | | | 0.51 | % |
| Kyushu Financial Group, Inc. | | | 3,272 | | | | 19,181 | | | | 0.50 | % |
| Nishi-Nippon Financial Holdings, Inc. | | | 1,012 | | | | 12,741 | | | | 0.33 | % |
| Shiga Bank, Ltd. (The) | | | 382 | | | | 10,018 | | | | 0.26 | % |
| Gunma Bank Ltd. (The) | | | 1,275 | | | | 8,140 | | | | 0.21 | % |
| Hachijuni Bank Ltd. (The) | | | 1,031 | | | | 6,723 | | | | 0.18 | % |
| Seven Bank Ltd. | | | 2,579 | | | | 4,312 | | | | 0.11 | % |
| | | | | | | $ | 3,827,786 | | | | 100.00 | % |
The following table represents the individual positions and related values of underlying securities of the BCIIPRIV Index Total Return Swap with Barclays.^
| Name | | Quantity | | | Value | | | Weight | |
| 3i Group PLC | | | 12,805 | | | $ | 496,373 | | | | 20.22 | % |
| Apollo Global Management, Inc. | | | 3,921 | | | | 462,956 | | | | 18.86 | % |
| Ares Management Corporation | | | 3,058 | | | | 407,617 | | | | 16.60 | % |
| Blue Owl Capital, Inc. | | | 17,323 | | | | 307,516 | | | | 12.52 | % |
| Hamilton Lane, Inc., Class A | | | 1,833 | | | | 226,592 | | | | 9.23 | % |
| Intermediate Capital Group PLC | | | 6,947 | | | | 191,641 | | | | 7.81 | % |
| Partners Group Holding AG | | | 113 | | | | 144,849 | | | | 5.90 | % |
| EQT AB | | | 4,013 | | | | 118,601 | | | | 4.83 | % |
| Man Group PLC | | | 17,437 | | | | 53,394 | | | | 2.17 | % |
| Blackstone, Inc. | | | 191 | | | | 23,639 | | | | 0.96 | % |
| Carlyle Group, Inc. (The) | | | 552 | | | | 22,159 | | | | 0.90 | % |
| | | | | | | $ | 2,455,337 | | | | 100.00 | % |
See accompanying notes to consolidated financial statements.
FULCRUM DIVERSIFIED ABSOLUTE RETURN FUND
CONSOLIDATED SCHEDULE OF INVESTMENTS (Continued)
June 30, 2024
The following table represents the individual positions and related values of underlying securities of the CGFCBVRG Index Total Return Swap with Citigroup.^
| Name | | Quantity | | | Value | | | Weight | |
| Constellation Brands, Inc. | | | (1,528 | ) | | $ | (393,015 | ) | | | 19.84 | % |
| Anheuser-Busch Inbev SA | | | (4,221 | ) | | | (244,822 | ) | | | 12.36 | % |
| Molson Coors Beverage Company, Class B | | | (4,531 | ) | | | (230,288 | ) | | | 11.63 | % |
| Diageo PLC | | | (7,153 | ) | | | (225,123 | ) | | | 11.36 | % |
| Davide Campari-Milano NV | | | (18,545 | ) | | | (175,357 | ) | | | 8.85 | % |
| Brown-Forman Corporation | | | (4,011 | ) | | | (173,226 | ) | | | 8.74 | % |
| Boston Beer Company, Inc. (The) | | | (504 | ) | | | (153,816 | ) | | | 7.76 | % |
| MGP Ingredients, Inc. | | | (1,320 | ) | | | (98,172 | ) | | | 4.96 | % |
| Duckhorn Portfolio, Inc. (The) | | | (11,323 | ) | | | (80,391 | ) | | | 4.06 | % |
| Remy Cointreau SA | | | (947 | ) | | | (79,051 | ) | | | 3.99 | % |
| Heineken NV | | | (758 | ) | | | (73,357 | ) | | | 3.70 | % |
| Pernod Ricard SA | | | (401 | ) | | | (54,410 | ) | | | 2.75 | % |
| | | | | | | $ | (1,981,028 | ) | | | 100.00 | % |
The following table represents the individual positions and related values of underlying securities of the CGFOOILP Index Total Return Swap with Citigroup.^
| Name | | Quantity | | | Value | | | Weight | |
| Equinor ASA | | | (6,602 | ) | | $ | (188,197 | ) | | | 7.36 | % |
| Equinor ASA | | | (5,693 | ) | | | (162,283 | ) | | | 6.35 | % |
| Vår Energi AS | | | (28,145 | ) | | | (99,573 | ) | | | 3.89 | % |
| Marathon Oil Corporation | | | (3,441 | ) | | | (98,687 | ) | | | 3.86 | % |
| APA Corporation | | | (3,268 | ) | | | (96,255 | ) | | | 3.76 | % |
| Occidental Petroleum Corporation | | | (1,371 | ) | | | (86,484 | ) | | | 3.38 | % |
| Vår Energi AS | | | (24,270 | ) | | | (85,862 | ) | | | 3.36 | % |
| Marathon Oil Corporation | | | (2,967 | ) | | | (85,098 | ) | | | 3.33 | % |
| APA Corporation | | | (2,818 | ) | | | (83,001 | ) | | | 3.25 | % |
| Santos Ltd. | | | (15,112 | ) | | | (77,291 | ) | | | 3.02 | % |
| Occidental Petroleum Corporation | | | (1,183 | ) | | | (74,575 | ) | | | 2.92 | % |
| Santos Ltd. | | | (13,031 | ) | | | (66,648 | ) | | | 2.61 | % |
| Chord Energy Corporation | | | (383 | ) | | | (64,329 | ) | | | 2.52 | % |
| Woodside Energy Group Ltd. | | | (3,410 | ) | | | (64,230 | ) | | | 2.51 | % |
| Harbour Oil PLC | | | (15,973 | ) | | | (62,972 | ) | | | 2.46 | % |
| Northern Oil & Gas, Inc. | | | (1,688 | ) | | | (62,789 | ) | | | 2.45 | % |
| Matador Resources Company | | | (1,047 | ) | | | (62,445 | ) | | | 2.44 | % |
| SM Energy Company | | | (1,394 | ) | | | (60,278 | ) | | | 2.36 | % |
| Devon Energy Corporation | | | (1,203 | ) | | | (57,070 | ) | | | 2.23 | % |
| Chord Energy Corporation | | | (331 | ) | | | (55,471 | ) | | | 2.17 | % |
| Woodside Energy Group Ltd. | | | (2,940 | ) | | | (55,385 | ) | | | 2.17 | % |
| Harbour Oil PLC | | | (13,774 | ) | | | (54,301 | ) | | | 2.12 | % |
| Magnolia Oil & Gas Corporation | | | (2,138 | ) | | | (54,204 | ) | | | 2.12 | % |
| Northern Oil & Gas, Inc. | | | (1,456 | ) | | | (54,143 | ) | | | 2.12 | % |
| Matador Resources Company | | | (903 | ) | | | (53,846 | ) | | | 2.11 | % |
| SM Energy Company | | | (1,202 | ) | | | (51,978 | ) | | | 2.03 | % |
| Murphy Oil Corporation | | | (1,205 | ) | | | (49,707 | ) | | | 1.94 | % |
| Devon Energy Corporation | | | (1,038 | ) | | | (49,212 | ) | | | 1.92 | % |
| Magnolia Oil & Gas Corporation | | | (1,844 | ) | | | (46,740 | ) | | | 1.83 | % |
| EOG Resources, Inc. | | | (358 | ) | | | (45,067 | ) | | | 1.76 | % |
| Murphy Oil Corporation | | | (1,039 | ) | | | (42,862 | ) | | | 1.68 | % |
| Permian Resources Corporation | | | (2,563 | ) | | | (41,406 | ) | | | 1.62 | % |
| EOG Resources, Inc. | | | (309 | ) | | | (38,861 | ) | | | 1.52 | % |
| Permian Resources Corporation | | | (2,210 | ) | | | (35,704 | ) | | | 1.40 | % |
| Talos Energy, Inc. | | | (2,901 | ) | | | (35,259 | ) | | | 1.38 | % |
| Aker BP ASA | | | (1,315 | ) | | | (33,571 | ) | | | 1.31 | % |
| Kosmos Energy Ltd. | | | (6,016 | ) | | | (33,344 | ) | | | 1.30 | % |
| Talos Energy, Inc. | | | (2,501 | ) | | | (30,404 | ) | | | 1.19 | % |
| Aker BP ASA | | | (1,134 | ) | | | (28,948 | ) | | | 1.13 | % |
| Kosmos Energy Ltd. | | | (5,188 | ) | | | (28,753 | ) | | | 1.12 | % |
| | | | | | | $ | (2,557,233 | ) | | | 100.00 | % |
See accompanying notes to consolidated financial statements.
FULCRUM DIVERSIFIED ABSOLUTE RETURN FUND
CONSOLIDATED SCHEDULE OF INVESTMENTS (Continued)
June 30, 2024
The following table represents the individual positions and related values of underlying securities of the GSGLPHRE Index Total Return Swap with Goldman Sachs.^
| Name | | Quantity | | | Value | | | Weight | |
| Hennes & Mauritz AB, Class B | | | (5,347 | ) | | $ | (84,586 | ) | | | 4.48 | % |
| Sally Beauty Holdings, Inc. | | | (7,387 | ) | | | (79,266 | ) | | | 4.19 | % |
| Kingfisher PLC | | | (25,011 | ) | | | (78,669 | ) | | | 4.16 | % |
| Hanesbrands, Inc. | | | (15,923 | ) | | | (78,499 | ) | | | 4.15 | % |
| Buckle, Inc. (The) | | | (2,021 | ) | | | (74,664 | ) | | | 3.95 | % |
| Newell Brands, Inc. | | | (11,119 | ) | | | (71,273 | ) | | | 3.77 | % |
| Bath & Body Works, Inc. | | | (1,805 | ) | | | (70,481 | ) | | | 3.73 | % |
| VF Corporation | | | (5,127 | ) | | | (69,216 | ) | | | 3.66 | % |
| Skechers USA, Inc., Class A | | | (974 | ) | | | (67,355 | ) | | | 3.56 | % |
| Kohl’s Corporation | | | (2,737 | ) | | | (62,927 | ) | | | 3.33 | % |
| Victoria’s Secret & Company | | | (3,382 | ) | | | (59,765 | ) | | | 3.16 | % |
| Oxford Industries, Inc. | | | (594 | ) | | | (59,509 | ) | | | 3.15 | % |
| Columbia Sportswear Company | | | (743 | ) | | | (58,781 | ) | | | 3.11 | % |
| Estee Lauder Companies, Class A | | | (547 | ) | | | (58,150 | ) | | | 3.08 | % |
| Nordstrom, Inc. | | | (2,690 | ) | | | (57,090 | ) | | | 3.02 | % |
| Canada Goose Holdings, Inc. | | | (4,283 | ) | | | (55,374 | ) | | | 2.93 | % |
| Carter’s, Inc. | | | (863 | ) | | | (53,495 | ) | | | 2.83 | % |
| Levi Strauss & Company, Class A | | | (2,768 | ) | | | (53,372 | ) | | | 2.82 | % |
| Macy’s, Inc. | | | (2,655 | ) | | | (50,970 | ) | | | 2.70 | % |
| Foot Locker, Inc. | | | (1,942 | ) | | | (48,401 | ) | | | 2.56 | % |
| Gap, Inc. (The) | | | (2,005 | ) | | | (47,889 | ) | | | 2.53 | % |
| Under Armour, Inc., Class A | | | (7,041 | ) | | | (46,964 | ) | | | 2.49 | % |
| Tapestry, Inc. | | | (1,082 | ) | | | (46,307 | ) | | | 2.45 | % |
| PVH Corporation | | | (431 | ) | | | (45,627 | ) | | | 2.41 | % |
| Wolverine World Wide, Inc. | | | (3,201 | ) | | | (43,281 | ) | | | 2.29 | % |
| Revolve Group, Inc. | | | (2,699 | ) | | | (42,935 | ) | | | 2.27 | % |
| Academy Sports & Outdoors | | | (787 | ) | | | (41,931 | ) | | | 2.22 | % |
| Adidas AG | | | (173 | ) | | | (41,286 | ) | | | 2.19 | % |
| Puma SE | | | (868 | ) | | | (39,865 | ) | | | 2.11 | % |
| Ollie’s Bargain Outlet Holdings, Inc. | | | (386 | ) | | | (37,929 | ) | | | 2.01 | % |
| Amer Sports, Inc. | | | (2,732 | ) | | | (34,337 | ) | | | 1.82 | % |
| Steven Madden Ltd. | | | (797 | ) | | | (33,723 | ) | | | 1.79 | % |
| Hugo Boss AG | | | (718 | ) | | | (32,139 | ) | | | 1.70 | % |
| Kinnevik AB, Class B | | | (3,052 | ) | | | (25,040 | ) | | | 1.33 | % |
| Crocs, Inc. | | | (152 | ) | | | (22,145 | ) | | | 1.17 | % |
| ASOS PLC | | | (1,995 | ) | | | (8,996 | ) | | | 0.48 | % |
| Boohoo Group PLC | | | (17,404 | ) | | | (7,569 | ) | | | 0.40 | % |
| | | | | | | $ | (1,889,806 | ) | | | 100.00 | % |
The following table represents the individual positions and related values of underlying securities of the GSMBWHEL Index Total Return Swap with Goldman Sachs.^
| Name | | Quantity | | | Value | | | Weight | |
| Johnson & Johnson | | | (429 | ) | | $ | (62,633 | ) | | | 3.15 | % |
| Merck & Company, Inc. | | | (418 | ) | | | (51,760 | ) | | | 2.60 | % |
| Abbvie, Inc. | | | (292 | ) | | | (50,000 | ) | | | 2.52 | % |
| Johnson & Johnson | | | (297 | ) | | | (43,339 | ) | | | 2.18 | % |
| Novartis AG | | | (372 | ) | | | (39,842 | ) | | | 2.00 | % |
| AstraZeneca PLC | | | (251 | ) | | | (39,253 | ) | | | 1.97 | % |
| Roch Holding AG | | | (133 | ) | | | (36,977 | ) | | | 1.86 | % |
| Thermo Fisher Scientific, Inc. | | | (65 | ) | | | (35,962 | ) | | | 1.81 | % |
| Merck & Company, Inc. | | | (289 | ) | | | (35,815 | ) | | | 1.80 | % |
| Abbvie, Inc. | | | (202 | ) | | | (34,597 | ) | | | 1.74 | % |
| Danaher Corporation | | | (123 | ) | | | (30,688 | ) | | | 1.54 | % |
| Abbott Laboratories | | | (285 | ) | | | (29,617 | ) | | | 1.49 | % |
| Amgen, Inc. | | | (90 | ) | | | (27,982 | ) | | | 1.41 | % |
| Novartis AG | | | (258 | ) | | | (27,569 | ) | | | 1.39 | % |
| AstraZeneca PLC | | | (174 | ) | | | (27,161 | ) | | | 1.37 | % |
| Johnson & Johnson | | | (181 | ) | | | (26,428 | ) | | | 1.33 | % |
| Pfizer, Inc. | | | (929 | ) | | | (25,992 | ) | | | 1.31 | % |
| Roch Holding AG | | | (92 | ) | | | (25,586 | ) | | | 1.29 | % |
| Thermo Fisher Scientific, Inc. | | | (45 | ) | | | (24,884 | ) | | | 1.25 | % |
| Merck & Company, Inc. | | | (176 | ) | | | (21,840 | ) | | | 1.10 | % |
| Stryker Corporation | | | (63 | ) | | | (21,487 | ) | | | 1.08 | % |
See accompanying notes to consolidated financial statements.
FULCRUM DIVERSIFIED ABSOLUTE RETURN FUND
CONSOLIDATED SCHEDULE OF INVESTMENTS (Continued)
June 30, 2024
| Name | | Quantity | | | Value | | | Weight | |
| Danaher Corporation | | | (85 | ) | | $ | (21,235 | ) | | | 1.07 | % |
| Abbvie, Inc. | | | (123 | ) | | | (21,097 | ) | | | 1.06 | % |
| Abbott Laboratories | | | (197 | ) | | | (20,494 | ) | | | 1.03 | % |
| Vertex Pharmaceuticals, Inc. | | | (43 | ) | | | (20,218 | ) | | | 1.02 | % |
| Amgen, Inc. | | | (62 | ) | | | (19,362 | ) | | | 0.97 | % |
| Regeneron Pharmaceuticals, Inc. | | | (18 | ) | | | (19,359 | ) | | | 0.97 | % |
| Boston Scientific Corporation, Class A | | | (240 | ) | | | (18,505 | ) | | | 0.93 | % |
| Pfizer, Inc. | | | (643 | ) | | | (17,985 | ) | | | 0.90 | % |
| Medtronic PLC | | | (221 | ) | | | (17,360 | ) | | | 0.87 | % |
| Novartis AG | | | (157 | ) | | | (16,811 | ) | | | 0.85 | % |
| AstraZeneca PLC | | | (106 | ) | | | (16,562 | ) | | | 0.83 | % |
| Roch Holding AG | | | (56 | ) | | | (15,602 | ) | | | 0.78 | % |
| CSL Ltd. | | | (78 | ) | | | (15,349 | ) | | | 0.77 | % |
| Thermo Fisher Scientific, Inc. | | | (27 | ) | | | (15,174 | ) | | | 0.76 | % |
| Stryker Corporation | | | (44 | ) | | | (14,868 | ) | | | 0.75 | % |
| HCA Healthcare, Inc. | | | (46 | ) | | | (14,643 | ) | | | 0.74 | % |
| Bristol-Myers Squibb Company (The) | | | (347 | ) | | | (14,393 | ) | | | 0.72 | % |
| Gilead Sciences, Inc. | | | (209 | ) | | | (14,327 | ) | | | 0.72 | % |
| Vertex Pharmaceuticals, Inc. | | | (30 | ) | | | (13,990 | ) | | | 0.70 | % |
| Regeneron Pharmaceuticals, Inc. | | | (13 | ) | | | (13,396 | ) | | | 0.67 | % |
| Zoetis, Inc. | | | (77 | ) | | | (13,343 | ) | | | 0.67 | % |
| GSK PLC | | | (673 | ) | | | (13,005 | ) | | | 0.65 | % |
| Danaher Corporation | | | (52 | ) | | | (12,948 | ) | | | 0.65 | % |
| Boston Scientific Corporation, Class A | | | (166 | ) | | | (12,805 | ) | | | 0.64 | % |
| Abbott Laboratories | | | (120 | ) | | | (12,497 | ) | | | 0.63 | % |
| CVS Health Corporation | | | (211 | ) | | | (12,438 | ) | | | 0.63 | % |
| Medtronic PLC | | | (153 | ) | | | (12,012 | ) | | | 0.60 | % |
| Amgen, Inc. | | | (38 | ) | | | (11,807 | ) | | | 0.59 | % |
| Merck KGaA | | | (70 | ) | | | (11,610 | ) | | | 0.58 | % |
| Other Underlying Index Components* | | | (13,959 | ) | | | (815,451 | ) | | | 41.06 | % |
| | | | | | | $ | (1,988,058 | ) | | | 100.00 | % |
The following table represents the individual positions and related values of underlying securities of the MSFDRUS I Index Total Return Swap with Morgan Stanley.^
| Name | | Quantity | | | Value | | | Weight | |
| Cash Balance | | | | | | $ | 24,006,180 | | | | 60.35 | % |
| US Momentum 3-Month Long | | | (5,474 | ) | | | (1,192,894 | ) | | | -3.00 | % |
| Eli Lilly & Company | | | 1,077 | | | | 975,094 | | | | 2.45 | % |
| Novo Nordisk A/S, Class B | | | 6,622 | | | | 956,910 | | | | 2.41 | % |
| PDD Holdings, Inc. - ADR | | | 5,999 | | | | 797,567 | | | | 2.00 | % |
| 1-Month Momentum | | | (4,082 | ) | | | (789,091 | ) | | | -1.98 | % |
| Tokyo SE TOPIX Banks Stock Price Index | | | 285,427 | | | | 622,524 | | | | 1.56 | % |
| US Momentum 6 Month Short | | | 4,370 | | | | 604,633 | | | | 1.52 | % |
| Canadian Natural Resources Ltd. | | | 16,744 | | | | 596,449 | | | | 1.50 | % |
| STOXX Europe 600 Food & Beverage | | | (590 | ) | | | (432,247 | ) | | | -1.09 | % |
| US Momentum 3-month Short | | | 2,789 | | | | 411,880 | | | | 1.04 | % |
| US Momentum 6 Month Long | | | (1,260 | ) | | | (388,345 | ) | | | -0.98 | % |
| Loblaw Companies Ltd. | | | 3,328 | | | | 386,080 | | | | 0.97 | % |
| CSL Ltd. | | | 1,590 | | | | 313,079 | | | | 0.79 | % |
| Wheaton Precious Metals Corporation | | | (5,927 | ) | | | (310,693 | ) | | | -0.78 | % |
| Bunge Global S.A. | | | (2,850 | ) | | | (304,295 | ) | | | -0.76 | % |
| Archer-Daniels-Midland Company | | | (4,936 | ) | | | (298,381 | ) | | | -0.75 | % |
| Mowi ASA | | | 17,704 | | | | 294,466 | | | | 0.74 | % |
| S&P Biotech Select Industry | | | (39 | ) | | | (281,778 | ) | | | -0.71 | % |
| Tencent Holdings Ltd. | | | 5,477 | | | | 261,216 | | | | 0.66 | % |
| Franco-Nevada Corporation | | | (2,161 | ) | | | (256,122 | ) | | | -0.64 | % |
| CF Industries Holdings, Inc. | | | (3,396 | ) | | | (251,712 | ) | | | -0.63 | % |
| Wingstop, Inc. | | | 585 | | | | 247,256 | | | | 0.62 | % |
| TransDigm Group, Inc. | | | 188 | | | | 240,191 | | | | 0.60 | % |
| FMC Corporation | | | (4,173 | ) | | | (240,156 | ) | | | -0.60 | % |
| Broadcom, Inc. | | | 149 | | | | 239,224 | | | | 0.60 | % |
| NVIDIA Corporation | | | 1,917 | | | | 236,826 | | | | 0.60 | % |
| Suncor Energy, Inc. | | | 6,181 | | | | 235,630 | | | | 0.59 | % |
| SalMar ASA | | | 4,396 | | | | 231,244 | | | | 0.58 | % |
| Disco Corporation | | | 608 | | | | 230,690 | | | | 0.58 | % |
| Republic Services, Inc. | | | 1,161 | | | | 225,629 | | | | 0.57 | % |
| Epiroc AB, Class A | | | 11,284 | | | | 225,204 | | | | 0.57 | % |
See accompanying notes to consolidated financial statements.
FULCRUM DIVERSIFIED ABSOLUTE RETURN FUND
CONSOLIDATED SCHEDULE OF INVESTMENTS (Continued)
June 30, 2024
| Name | | Quantity | | | Value | | | Weight | |
| MEG Energy Corporation | | | 10,486 | | | $ | 224,362 | | | | 0.56 | % |
| Clean Harbors, Inc. | | | 989 | | | | 223,662 | | | | 0.56 | % |
| JPMorgan Chase & Company | | | 1,104 | | | | 223,295 | | | | 0.56 | % |
| Rheinmetall AG | | | 437 | | | | 222,703 | | | | 0.56 | % |
| Cenovus Energy, Inc. | | | 11,291 | | | | 221,860 | | | | 0.56 | % |
| Nutrien Ltd. | | | (4,188 | ) | | | (213,211 | ) | | | -0.53 | % |
| Waste Connections, Inc. | | | 1,208 | | | | 211,958 | | | | 0.53 | % |
| ONEOK, Inc. | | | 2,592 | | | | 211,378 | | | | 0.53 | % |
| Targa Resources Corporation | | | 1,588 | | | | 204,503 | | | | 0.51 | % |
| Mitsubishi UFJ Financial Group, Inc. | | | 18,635 | | | | 200,274 | | | | 0.50 | % |
| Royal Gold, Inc. | | | (1,584 | ) | | | (198,253 | ) | | | -0.50 | % |
| Darling Ingredients, Inc. | | | (5,385 | ) | | | (197,899 | ) | | | -0.50 | % |
| Corteva, Inc. | | | (3,652 | ) | | | (196,989 | ) | | | -0.49 | % |
| Waste Management, Inc. | | | 914 | | | | 194,993 | | | | 0.49 | % |
| Micron Technology, Inc. | | | 1,469 | | | | 193,218 | | | | 0.49 | % |
| Komatsu Ltd. | | | 6,506 | | | | 188,901 | | | | 0.47 | % |
| Caterpillar, Inc. | | | 561 | | | | 186,869 | | | | 0.47 | % |
| Brixmor Property Group, Inc. | | | (8,053 | ) | | | (185,944 | ) | | | -0.47 | % |
| Other Underlying Index Components* | | | (104,193 | ) | | | 10,471,722 | | | | 26.32 | % |
| | | | | | | $ | 39,779,660 | | | | 100.00 | % |
| ^ | Components include cash and foreign cash balances which may not be reflected below. |
| * | Largest 50 underlying components by market value at June 30, 2024. |
See accompanying notes to consolidated financial statements.
Fulcrum Diversified Absolute Return Fund
CONSOLIDATED STATEMENT OF ASSETS AND LIABILITIES
June 30, 2024
| ASSETS | | | | |
| Investment securities: | | | | |
| At cost | | $ | 133,741,346 | |
| At fair value | | $ | 136,507,304 | |
| Cash and cash equivalents | | | 6,500,606 | |
| Cash on deposit with broker | | | 28,810,101 | |
| Foreign cash on deposit with broker (Cost - $1,314,635) | | | 1,421,929 | |
| Cash collateral for derivative instruments | | | 24,808,237 | |
| Foreign cash (Cost - $2,638,829) | | | 2,602,574 | |
| Unrealized appreciation from swap contracts | | | 1,153,491 | |
| Unrealized appreciation from futures contracts | | | 188,736 | |
| Unrealized appreciation from forward foreign currency contracts | | | 175,791 | |
| Premiums paid for swaps | | | 184,491 | |
| Receivable for securities sold | | | 87,816 | |
| Receivable for currency contracts | | | 374,199 | |
| Receivable for swaps | | | 14,255 | |
| Dividends and interest receivable | | | 92,735 | |
| Receivable for fund shares sold | | | 82,276 | |
| Prepaid expenses and other assets | | | 76,398 | |
| TOTAL ASSETS | | | 203,080,939 | |
| | | | | |
| LIABILITIES | | | | |
| Options written, at fair value (Premiums received $806,537) | | | 861,415 | |
| Unrealized depreciation on swap contracts | | | 534,096 | |
| Net unrealized depreciation of futures contracts | | | 535,092 | |
| Net unrealized depreciation from forward foreign currency contracts | | | 299,265 | |
| Premiums received from swaps | | | 286,398 | |
| Payable for investments purchased | | | 227,601 | |
| Payable for fund shares redeemed | | | 39,341 | |
| Investment advisory fees payable | | | 60,241 | |
| Audit and tax fees payable | | | 68,091 | |
| Payable to related parties | | | 30,339 | |
| Shareholder services fees - Class I | | | 17,982 | |
| Accrued expenses and other liabilities | | | 6,603 | |
| TOTAL LIABILITIES | | | 2,966,464 | |
| | | | | |
| NET ASSETS | | $ | 200,114,475 | |
| | | | | |
| Composition of Net Assets: | | | | |
| Paid in capital | | $ | 191,139,721 | |
| Accumulated earnings | | | 8,974,754 | |
| NET ASSETS | | $ | 200,114,475 | |
See accompanying notes to consolidated financial statements.
Fulcrum Diversified Absolute Return Fund
CONSOLIDATED STATEMENT OF ASSETS AND LIABILITIES (Continued)
June 30, 2024
| Net Asset Value Per Share: | | | |
| Super Institutional Class Shares: | | | | |
| Net Assets | | $ | 125,853,888 | |
| Shares of beneficial interest outstanding ($0 par value, unlimited shares authorized) | | | 13,035,882 | |
| Net asset value (Net Assets ÷ Shares Outstanding), offering price and redemption price per share | | $ | 9.65 | |
| | | | | |
| Institutional Class Shares: | | | | |
| Net Assets | | $ | 74,260,587 | |
| Shares of beneficial interest outstanding ($0 par value, unlimited shares authorized) | | | 7,726,589 | |
| Net asset value (Net Assets ÷ Shares Outstanding), offering price and redemption price per share | | $ | 9.61 | |
See accompanying notes to consolidated financial statements.
Fulcrum Diversified Absolute Return Fund
CONSOLIDATED STATEMENT OF OPERATIONS
For the Year Ended June 30, 2024
| INVESTMENT INCOME | | | | |
| Dividends | | $ | 531,115 | |
| Interest | | | 6,506,553 | |
| Less: Foreign withholding taxes | | | (21,506 | ) |
| TOTAL INVESTMENT INCOME | | | 7,016,162 | |
| | | | | |
| EXPENSES | | | | |
| Investment advisory fees | | | 1,914,963 | |
| Shareholder services fees | | | | |
| Institutional Class | | | 69,731 | |
| Administrative services fees | | | 216,825 | |
| Custodian fees | | | 93,219 | |
| Audit and tax fees | | | 90,582 | |
| Transfer agent fees | | | 85,274 | |
| Legal fees | | | 29,480 | |
| Compliance officer fees | | | 27,760 | |
| Registration fees | | | 21,037 | |
| Printing and postage expenses | | | 14,578 | |
| Trustees fees and expenses | | | 7,753 | |
| Insurance expense | | | 5,716 | |
| Other expenses | | | 10,971 | |
| TOTAL EXPENSES | | | 2,587,889 | |
| Less: Fees waived by the Advisor | | | (284,861 | ) |
| NET EXPENSES | | | 2,303,028 | |
| NET INVESTMENT INCOME | | | 4,713,134 | |
| | | | | |
| REALIZED AND UNREALIZED GAIN/(LOSS) ON INVESTMENTS | | | | |
| Net realized gain/(loss) from: | | | | |
| Investment transactions | | | (3,170 | ) |
| Swap contracts | | | 3,427,797 | |
| Options written | | | 3,379,575 | |
| Futures contracts | | | 6,929,527 | |
| Forward foreign currency exchange contracts | | | (382,427 | ) |
| Foreign currency transactions | | | (2,605,261 | ) |
| | | | 10,746,041 | |
| Net change in unrealized appreciation/(depreciation) of: | | | | |
| Investments | | | 2,350,790 | |
| Swap contracts | | | 1,292,091 | |
| Options written | | | (291,644 | ) |
| Futures contracts | | | 70,582 | |
| Forward foreign currency exchange contracts | | | (292,366 | ) |
| Foreign currency translations | | | 113,701 | |
| | | | 3,243,154 | |
| NET REALIZED AND UNREALIZED GAIN ON INVESTMENTS | | | 13,989,195 | |
| NET INCREASE IN NET ASSETS RESULTING FROM OPERATIONS | | $ | 18,702,329 | |
See accompanying notes to consolidated financial statements.
Fulcrum Diversified Absolute Return Fund
CONSOLIDATED STATEMENTS OF CHANGES IN NET ASSETS
| | | Year Ended
June 30,
2024 | | | Year Ended
June 30,
2023 | |
| FROM OPERATIONS | | | | | | | | |
| Net investment income | | $ | 4,713,134 | | | $ | 3,038,698 | |
| Net realized gain/(loss) from investment transactions, options written, swap contracts, futures contracts forward foreign exchange contracts and foreign currency transactions | | | 10,746,041 | | | | (9,497,042 | ) |
| Net change in unrealized appreciation/(depreciation) of investments options written, swap contracts, futures contracts, forward foreign exchange contracts and foreign currency translations | | | 3,243,154 | | | | 709,067 | |
| Net increase/(decrease) in net assets resulting from operations | | | 18,702,329 | | | | (5,749,277 | ) |
| | | | | | | | | |
| DISTRIBUTIONS TO SHAREHOLDERS | | | | | | | | |
| Institutional Class | | | (796,424 | ) | | | (1,207,965 | ) |
| Super Institutional Class | | | (1,100,901 | ) | | | (1,481,328 | ) |
| Decrease in net assets from distributions to shareholders | | | (1,897,325 | ) | | | (2,689,293 | ) |
| | | | | | | | | |
| CAPITAL TRANSACTIONS | | | | | | | | |
| Proceeds from shares sold: | | | | | | | | |
| Institutional Class | | | 28,829,785 | | | | 124,559,992 | |
| Super Institutional Class | | | 2,253,768 | | | | 86,789,475 | |
| Net asset value of shares issued in reinvestment of distributions: | | | | | | | | |
| Institutional Class | | | 629,699 | | | | 823,455 | |
| Super Institutional Class | | | 1,095,611 | | | | 1,464,262 | |
| Payments for shares redeemed: | | | | | | | | |
| Institutional Class | | | (62,129,800 | ) | | | (95,253,840 | ) |
| Super Institutional Class | | | (14,493,101 | ) | | | (41,803,143 | ) |
| Net increase/(decrease) in net assets from shares of beneficial interest | | | (43,814,038 | ) | | | 76,580,201 | |
| | | | | | | | | | | |
| TOTAL INCREASE/(DECREASE) IN NET ASSETS | | | (27,009,034 | ) | | | 68,141,631 | | | |
| | | | | | | | | | | |
| NET ASSETS | | | | | | | | |
| Beginning of Year | | | 227,123,509 | | | | 158,981,878 | |
| End of Year | | $ | 200,114,475 | | | $ | 227,123,509 | | | |
See accompanying notes to consolidated financial statements.
Fulcrum Diversified Absolute Return Fund
CONSOLIDATED STATEMENTS OF CHANGES IN NET ASSETS (Continued)
| |
| Year Ended
June 30,
2024 |
|
| Year Ended
June 30,
2023 |
|
| SHARE ACTIVITY | | | | | | | | |
| Institutional Class: | | | | | | | | |
| Shares Sold | | | 3,196,759 | | | | 13,663,860 | |
| Shares Reinvested | | | 70,753 | | | | 91,495 | |
| Shares Redeemed | | | (6,873,798 | ) | | | (10,435,319 | ) |
| Net increase/(decrease) in shares of beneficial interest outstanding | | | (3,606,286 | ) | | | 3,320,036 | |
| | | | | | | | | |
| Super Institutional Class: | | | | | | | | |
| Shares Sold | | | 249,829 | | | | 9,453,937 | |
| Shares Reinvested | | | 122,552 | | | | 161,976 | |
| Shares Redeemed | | | (1,569,913 | ) | | | (4,680,071 | ) |
| Net increase/(decrease) in shares of beneficial interest outstanding | | | (1,197,532 | ) | | | 4,935,842 | |
See accompanying notes to consolidated financial statements.
Fulcrum Diversified Absolute Return Fund
CONSOLIDATED FINANCIAL HIGHLIGHTS
Per Share Data and Ratios for a Share of Beneficial Interest Outstanding Throughout Each Year
| | | Institutional Class | |
| | | Year Ended
June 30
2024 | | | Year Ended
June 30
2023 | | | Year Ended
June 30
2022 | | | Year Ended
June 30
2021 | | | Year Ended
June 30
2020 | |
| Net asset value, beginning of year | | $ | 8.86 | | | $ | 9.17 | | | $ | 10.01 | | | $ | 9.76 | | | $ | 8.99 | |
| | | | | | | | | | | | | | | | | | | | | |
| Activity from investment operations: | | | | | | | | | | | | | | | | | | | | |
| Net investment income/(loss) (1) | | | 0.20 | | | | 0.12 | | | | (0.06 | ) | | | (0.10 | ) | | | (0.00 | ) |
| Net realized and unrealized gain/(loss) on investments | | | 0.62 | | | | (0.31 | ) | | | 0.03 | | | | 1.08 | | | | 0.77 | |
| Total from investment operations | | | 0.82 | | | | (0.19 | ) | | | (0.03 | ) | | | 0.98 | | | | 0.77 | |
| | | | | | | | | | | | | | | | | | | | | |
| Less distributions from: | | | | | | | | | | | | | | | | | | | | |
| Net investment income | | | (0.07 | ) | | | - | | | | (0.81 | ) | | | (0.41 | ) | | | - | |
| Net realized gains | | | - | | | | (0.12 | ) | | | - | | | | (0.32 | ) | | | - | |
| Total distributions | | | (0.07 | ) | | | (0.12 | ) | | | (0.81 | ) | | | (0.73 | ) | | | - | |
| | | | | | | | | | | | | | | | | | | | | |
| Net asset value, end of year | | $ | 9.61 | (2) | | $ | 8.86 | (2) | | $ | 9.17 | | | $ | 10.01 | | | $ | 9.76 | |
| | | | | | | | | | | | | | | | | | | | | |
| Total return (3) | | | 9.36 | %(2) | | | -2.13 | %(2) | | | -0.09 | % | | | 10.58 | % | | | 8.57 | % |
| | | | | | | | | | | | | | | | | | | | | |
| Net assets, at end of year (000s) | | $ | 74,261 | | | $ | 100,426 | | | $ | 73,478 | | | $ | 1,990 | | | $ | 1,340 | |
| | | | | | | | | | | | | | | | | | | | | |
| Ratios including the income and expenses of FDFC | | | | | | | | | | | | | | | | | | | | |
| Ratio of gross expenses to average net assets (4)(5) | | | 1.26 | % | | | 1.40 | % | | | 1.41 | % | | | 1.32 | % | | | 1.19 | % |
| Ratio of net expenses to average net assets (6) | | | 1.13 | % | | | 1.20 | % | | | 1.13 | % | | | 1.11 | % | | | 1.09 | % |
| Ratio of net investment income/(loss) to average net assets (7) | | | 2.16 | % | | | 1.34 | % | | | -0.65 | % | | | -0.98 | % | | | -0.01 | % |
| | | | | | | | | | | | | | | | | | | | | |
| Portfolio Turnover Rate | | | 239 | % | | | 84 | % | | | 129 | % | | | 140 | % | | | 88 | % |
| (1) | Per share amounts calculated using the average shares method, which more appropriately presents the per share data for the year. |
| (2) | Includes adjustments made in accordance with generally accepted accounting principles. |
| (3) | Total returns shown exclude the effect of applicable sales charges and redemption fees. Had the advisor not waived its fees or reimbursed a portion of the Fund’s expenses, the returns would have been lower. |
| (4) | Represents the ratio of expenses to average net assets absent fee waivers and/or expense reimbursements by the advisor. |
| (5) | Ratio of gross expenses to average net assets excluding interest and brokerage expenses | | | 1.26 | % | | | 1.33 | % | | | 1.41 | % | | | 1.26 | % | | | 1.18 | % |
| (6) | Ratio of net expenses to average net assets excluding interest and brokerage expenses | | | 1.13 | % | | | 1.14 | % | | | 1.13 | % | | | 1.05 | % | | | 1.08 | % |
| (7) | Ratio of net investment income/(loss) to average net assets excluding interest and brokerage expenses | | | 2.16 | % | | | 1.40 | % | | | -0.64 | % | | | -0.93 | % | | | 0.00 | % |
See accompanying notes to consolidated financial statements.
Fulcrum Diversified Absolute Return Fund
CONSOLIDATED FINANCIAL HIGHLIGHTS
Per Share Data and Ratios for a Share of Beneficial Interest Outstanding Throughout Each Year
| | | Super Institutional Class | |
| | | Year Ended
June 30
2024 | | | Year Ended
June 30
2023 | | | Year Ended
June 30
2022 | | | Year Ended
June 30
2021 | | | Year Ended
June 30
2020 | |
| Net asset value, beginning of year | | $ | 8.90 | | | $ | 9.20 | | | $ | 10.03 | | | $ | 9.78 | | | $ | 9.00 | |
| | | | | | | | | | | | | | | | | | | | | |
| Activity from investment operations: | | | | | | | | | | | | | | | | | | | | |
| Net investment income/(loss) (1) | | | 0.21 | | | | 0.14 | | | | (0.08 | ) | | | (0.10 | ) | | | 0.02 | |
| Net realized and unrealized gain/(loss) on investments | | | 0.62 | | | | (0.32 | ) | | | 0.06 | | | | 1.08 | | | | 0.76 | |
| Total from investment operations | | | 0.83 | | | | (0.18 | ) | | | (0.02 | ) | | | 0.98 | | | | 0.78 | |
| | | | | | | | | | | | | | | | | | | | | |
| Less distributions from: | | | | | | | | | | | | | | | | | | | | |
| Net investment income | | | (0.08 | ) | | | - | | | | (0.81 | ) | | | (0.41 | ) | | | (0.00 | ) |
| Net realized gains | | | - | | | | (0.12 | ) | | | - | | | | (0.32 | ) | | | - | |
| Total distributions | | | (0.08 | ) | | | (0.12 | ) | | | (0.81 | ) | | | (0.73 | ) | | | (0.00 | ) |
| | | | | | | | | | | | | | | | | | | | | |
| Net asset value, end of year | | $ | 9.65 | (2) | | $ | 8.90 | (2) | | $ | 9.20 | | | $ | 10.03 | | | $ | 9.78 | |
| | | | | | | | | | | | | | | | | | | | | |
| Total return (3) | | | 9.40 | %(2) | | | -2.01 | %(2) | | | 0.02 | % | | | 10.60 | % | | | 8.69 | % |
| | | | | | | | | | | | | | | | | | | | | |
| Net assets, at end of year (000s) | | $ | 125,854 | | | $ | 126,697 | | | $ | 85,504 | | | $ | 108,011 | | | $ | 167,280 | |
| | | | | | | | | | | | | | | | | | | | | |
| Ratios including the income and expenses of FDFC | | | | | | | | | | | | | | | | | | | | |
| Ratio of gross expenses to average net assets (4)(5) | | | 1.19 | % | | | 1.30 | % | | | 1.37 | % | | | 1.29 | % | | | 1.16 | % |
| Ratio of net expenses to average net assets (6) | | | 1.05 | % | | | 1.10 | % | | | 1.08 | % | | | 1.10 | % | | | 1.06 | % |
| Ratio of net investment income/(loss) to average net assets (7) | | | 2.26 | % | | | 1.55 | % | | | -0.85 | % | | | -0.97 | % | | | 0.17 | % |
| | | | | | | | | | | | | | | | | | | | | |
| Portfolio Turnover Rate | | | 239 | % | | | 84 | % | | | 129 | % | | | 140 | % | | | 88 | % |
| (1) | Per share amounts calculated using the average shares method, which more appropriately presents the per share data for the year. |
| (2) | Includes adjustments made in accordance with generally accepted accounting principles. |
| (3) | Total returns shown exclude the effect of applicable sales charges and redemption fees. Had the advisor not waived its fees or reimbursed a portion of the Fund’s expenses, the returns would have been lower. |
| (4) | Represents the ratio of expenses to average net assets absent fee waivers and/or expense reimbursements by the advisor. |
| (5) | Ratio of gross expenses to average net assets excluding interest and brokerage expenses | | | 1.19 | % | | | 1.24 | % | | | 1.33 | % | | | 1.24 | % | | | 1.15 | % |
| (6) | Ratio of net expenses to average net assets excluding interest and brokerage expenses | | | 1.05 | % | | | 1.05 | % | | | 1.04 | % | | | 1.05 | % | | | 1.05 | % |
| (7) | Ratio of net investment income/(loss) to average net assets excluding interest and brokerage expenses | | | 2.26 | % | | | 1.61 | % | | | -0.82 | % | | | -0.93 | % | | | 0.18 | % |
See accompanying notes to consolidated financial statements.
Fulcrum Diversified Absolute Return Fund
NOTES TO CONSOLIDATED FINANCIAL STATEMENTS
June 30, 2024
1. ORGANIZATION
The Fulcrum Diversified Absolute Return Fund (the “Fund”) is a diversified series of Northern Lights Fund Trust IV (the “Trust”), a trust organized under the laws of the State of Delaware on June 2, 2015, and registered under the Investment Company Act of 1940, as amended (the "1940 Act"), as an open-end management investment company. Prior to March 13, 2023, the Fund was a series of Trust for Advised Portfolios (the “Predecessor Fund”). The Fund seeks to achieve long-term absolute returns. The investment objective of the Fund is non-fundamental and may be changed without shareholder approval.
The Fund currently offers Super Institutional Class shares and Institutional Class shares at net asset value, both of which commenced operations on July 31, 2015. Each class represents an interest in the same assets of the Fund and classes are identical except for differences in their ongoing service and distribution charges. Institutional Class is subject to a shareholders servicing fee up to 0.10%. All classes of shares have equal voting privileges except that each class has exclusive voting rights with respect to its service and/or distribution plans. The Fund’s income, expenses (other than class specific distribution fees) and realized and unrealized gains and losses are allocated proportionately each day based upon the relative net assets of each class.
The Predecessor Fund was reorganized on March 10, 2023, from a series of Trust for Advised Portfolios, a Delaware statutory trust, to a series of Northern Lights Fund Trust IV, also a Delaware statutory trust. As a series of Northern Lights Fund Trust IV, the Fund is a continuation of the identically-named predecessor fund managed by Fulcrum Asset Management LLP that was a series of Trust for Advised Portfolios. The Fund and the Predecessor Fund have the same investment objective, principal investment strategies and portfolio manager.
2. SIGNIFICANT ACCOUNTING POLICIES
The following is a summary of significant accounting policies followed by the Fund in preparation of its consolidated financial statements. The policies are in conformity with accounting principles generally accepted in the United States of America (“GAAP”). The preparation of the consolidated financial statements requires management to make estimates and assumptions that affect the reported amounts of assets and liabilities and disclosure of contingent assets and liabilities at the date of the consolidated financial statements and the reported amounts of income and expenses for the period. Actual results could differ from those estimates. The Fund is an investment company and accordingly follows the investment company accounting and reporting guidance of the Financial Accounting Standards Board (“FASB”) Accounting Standards Codification Topic 946 "Financial Services – Investment Companies," including Accounting Standards Update 2013-08.
Security Valuation - The Fund records its investments at fair value. Fair value is defined as the price that would be received to sell an asset or paid to transfer a liability in an orderly transaction between market participants at the measurement date. Securities, including common/preferred stocks and exchange traded funds, listed on an exchange are valued at the last reported sale price at the close of the regular trading session of the exchange on the business day the value is being determined, or in the case of securities listed on NASDAQ at the NASDAQ Official Closing Price (“NOCP”). In the absence of a sale, such securities shall be valued at the mean between the current bid and ask prices on the primary exchange on the day of valuation. Investments in swap contracts are reported at fair value based on the underlying equity securities held within the swap or daily price reporting from the swap counterparty. The independent pricing service does not distinguish between smaller-sized bond positions known as “odd lots” and larger institutional-sized bond positions known as “round lots”. The Fund may fair value a particular bond if the advisor does not believe that the round lot value provided by the independent pricing service reflects fair value of the Fund’s holding. Short-term debt obligations having 60 days or less remaining until maturity, at time of purchase, may be valued at amortized cost.
Fulcrum Diversified Absolute Return Fund
NOTES TO CONSOLIDATED FINANCIAL STATEMENTS (Continued)
June 30, 2024
Futures contracts and options on futures contracts that are actively traded on commodity exchanges are fair valued based on quoted prices from the applicable exchange, and to the extent valuation adjustments are not applied to futures contracts, they are categorized as Level 1. To the extent that valuation adjustments are observable and timely, the fair values of futures contracts would be categorized as Level 2; otherwise the fair values would be categorized as Level 3.
Forward foreign currency exchange contracts are fair valued using the mean between broker-dealer bid and ask quotations, and forward foreign currency exchange rates gathered from leading market makers. To the extent that these inputs are observable and timely, the fair values of forward foreign currency contracts would be categorized as Level 2; otherwise the fair values would be categorized as Level 3.
Options contracts listed on a securities exchange or board of trade for which market quotations are readily available shall be valued at the last quoted sales price or, in the absence of a sale, at the mean between the current bid and ask prices on the day of valuation. Option contracts not listed on a securities exchange or board of trade for which over-the-counter market quotations are readily available shall be valued at the mean between the current bid and ask prices on the day of valuation. Index options shall be valued at the mean between the current bid and ask prices on the day of valuation. To the extent valuation adjustments are not applied to index options or future options, they are categorized as Level 1.
Over-the-counter derivatives are valued by an independent pricing service using a series of techniques, including simulation pricing models. The pricing models use various inputs that are observed from actively quoted markets such as issuer details, indices, spreads, interest rates, curves, implied volatility and exchange rates. When prices are determined by the pricing agent, positions are classified as Level 2 of the fair value hierarchy.
The Fund may hold investments, such as private investments, interests in commodity pools, other non-traded securities or temporarily illiquid investments, for which market quotations are not readily available or are determined to be unreliable. These securities are valued using the “fair value” procedures approved by the Board. The Board has designated the advisor as its valuation designee (the “Valuation Designee”) to execute these procedures. The Board may also enlist third party consultants such as a valuation specialist at a public accounting firm, valuation consultant or financial officer of a security issuer on an as-needed basis to assist the Valuation Designee in determining a security-specific fair value. The Board is responsible for reviewing and approving fair value methodologies utilized by the Valuation Designee, approval of which shall be based upon whether the Valuation Designee followed the valuation procedures established by the Board.
Fair Valuation Process - Applicable investments are valued by the Valuation Designee pursuant to valuation procedures established by the Board. For example, fair value determinations are required for the following securities: (i) securities for which market quotations are insufficient or not readily available on a particular business day (including securities for which there is a short and temporary lapse in the provision of a price by the regular pricing source); (ii) securities for which, in the judgment of the Valuation Designee, the prices or values available do not represent the fair value of the instrument; factors which may cause the Valuation Designee to make such a judgment include, but are not limited to, the following: only a bid price or an asked price is available; the spread between bid and asked prices is substantial; the frequency of sales; the thinness of the market; the size of reported trades; and actions of the securities markets, such as the suspension or limitation of trading; (iii) securities determined to be illiquid; and (iv) securities with respect to which an event that affects the value thereof has occurred (a “significant event”) since the closing prices were established on the principal exchange on which they are traded, but prior to the Fund’s calculation of its net asset value. Specifically, interests in commodity pools or managed futures pools are valued on a daily basis by reference to the closing market prices of each futures contract or other asset held by a pool, as adjusted for pool expenses. Restricted or illiquid investments, such as private investments or non-traded securities are valued based upon
Fulcrum Diversified Absolute Return Fund
NOTES TO CONSOLIDATED FINANCIAL STATEMENTS (Continued)
June 30, 2024
the current bid for the security from two or more independent dealers or other parties reasonably familiar with the facts and circumstances of the security (who should take into consideration all relevant factors as may be appropriate under the circumstances). If a current bid from such independent dealers or other independent parties is unavailable, the Valuation Designee shall determine the fair value of such security using the following factors: (i) the type of security; (ii) the cost at date of purchase; (iii) the size and nature of the Fund’s holdings; (iv) the discount from market value of unrestricted securities of the same class at the time of purchase and subsequent thereto; (v) information as to any transactions or offers with respect to the security; (vi) the nature and duration of restrictions on disposition of the security and the existence of any registration rights; (vii) how the yield of the security compares to similar securities of companies of similar or equal creditworthiness; (viii) the level of recent trades of similar or comparable securities; (ix) the liquidity characteristics of the security; (x) current market conditions; and (xi) the market value of any securities into which the security is convertible or exchangeable.
The Fund utilizes various methods to measure the fair value of all of its investments on a recurring basis. GAAP establishes a hierarchy that prioritizes inputs to valuation methods. The three levels of input are:
Level 1 – Unadjusted quoted prices in active markets for identical assets and liabilities that the Fund has the ability to access.
Level 2 – Observable inputs other than quoted prices included in Level 1 that are observable for the asset or liability, either directly or indirectly. These inputs may include quoted prices for the identical instrument in an inactive market, prices for similar instruments, interest rates, prepayment speeds, credit risk, yield curves, default rates and similar data.
Level 3 – Unobservable inputs for the asset or liability, to the extent relevant observable inputs are not available, representing the Fund’s own assumptions about the assumptions a market participant would use in valuing the asset or liability, and would be based on the best information available.
The availability of observable inputs can vary from security to security and is affected by a wide variety of factors, including, for example, the type of security, whether the security is new and not yet established in the marketplace, the liquidity of markets, and other characteristics particular to the security. To the extent that valuation is based on models or inputs that are less observable or unobservable in the market, the determination of fair value requires more judgment. Accordingly, the degree of judgment exercised in determining fair value is greatest for instruments categorized in Level 3.
The inputs used to measure fair value may fall into different levels of the fair value hierarchy. In such cases, for disclosure purposes, the level in the fair value hierarchy within which the fair value measurement falls in its entirety, is determined based on the lowest level input that is significant to the fair value measurement in its entirety.
The inputs or methodology used for valuing securities are not necessarily an indication of the risk associated with investing in those securities. The following tables summarize the inputs used as of June 30, 2024 for the Fund’s assets and liabilities measured at fair value:
Fulcrum Diversified Absolute Return Fund
NOTES TO CONSOLIDATED FINANCIAL STATEMENTS (Continued)
June 30, 2024
| Assets | | Level 1 | | | Level 2 | | | Level 3 | | | Total | |
| Common Stocks | | $ | 33,381,782 | | | $ | - | | | $ | - | | | $ | 33,381,782 | |
| Exchange-Traded Funds | | | 856,809 | | | | - | | | | - | | | | 856,809 | |
| Currency Options Purchased | | | - | | | | 1,597,613 | | | | - | | | | 1,597,613 | |
| Index Options Purchased | | | 311,886 | | | | - | | | | - | | | | 311,886 | |
| OTC Dual Binary Options Purchased | | | - | | | | 1,810,812 | | | | - | | | | 1,810,812 | |
| Future Options Purchased | | | 684,353 | | | | - | | | | - | | | | 684,353 | |
| U.S. Treasury Bills | | | - | | | | 97,864,049 | | | | - | | | | 97,864,049 | |
| Total | | $ | 35,234,830 | | | $ | 101,272,474 | | | $ | - | | | $ | 136,507,304 | |
| Other Financial Instruments | | Level 1 | | | Level 2 | | | Level 3 | | | Total | |
| Futures Contracts | | $ | 188,736 | | | $ | - | | | $ | - | | | $ | 188,736 | |
| Dispersion Swap Contracts | | | - | | | | 36,531 | | | | - | | | | 36,531 | |
| Interest Rate Swap Contracts | | | - | | | | 91,849 | | | | - | | | | 91,849 | |
| Forward Exchange Contracts | | | - | | | | 175,791 | | | | - | | | | 175,791 | |
| Total Return Swap Contracts | | | - | | | | 502,885 | | | | | | | | 502,885 | |
| Total | | $ | 188,736 | | | $ | 807,056 | | | $ | - | | | $ | 995,792 | |
Liabilities
| Other Financial Instruments | | Level 1 | | | Level 2 | | | Level 3 | | | Total | |
| Futures Options Written | | $ | 760,091 | | | $ | - | | | $ | - | | | $ | 760,091 | |
| Currency Options Written | | | - | | | | 101,324 | | | | - | | | | 101,324 | |
| Futures Contracts | | | 535,092 | | | | - | | | | - | | | | 535,092 | |
| Forward Exchange Contracts | | | - | | | | 299,265 | | | | - | | | | 299,265 | |
| Credit Default Swaps | | | - | | | | 11,870 | | | | - | | | | 11,870 | |
| Total | | $ | 1,295,183 | | | $ | 412,459 | | | $ | - | | | $ | 1,707,642 | |
The Fund did not hold any level 3 securities during the fiscal year.
Fulcrum Diversified Absolute Return Fund
NOTES TO CONSOLIDATED FINANCIAL STATEMENTS (Continued)
June 30, 2024
Consolidation of Subsidiaries - The consolidated financial statements of the Fund include Fulcrum Diversified Absolute Return Cayman Fund (“FDFC”), a wholly owned and controlled subsidiary. All inter-company accounts and transactions have been eliminated in consolidation.
The Fund may invest up to 25% of its total assets in a controlled foreign corporation (“CFC”), which acts as an investment vehicle in order to effect certain investments consistent with the Fund’s investment objectives and policies.
A summary of the Fund’s investments in FDFC is as follows:
| | | | FDFC Net Assets at
June 30,
2024 | | | % of
the Fund’s Total
Net Assets at
June 30,
2024 | |
| FDFC | | | $ | 11,841,057 | | | | 5.9 | % |
For tax purposes, FDFC is an exempted Cayman investment company. FDFC has received an undertaking from the Government of the Cayman Islands exempting it from all local income, profits, and capital gains taxes. No such taxes are levied in the Cayman Islands at the present time. For U.S. income tax purposes, FDFC is a CFC and as such is not subject to U.S. income tax. However, as a wholly-owned CFC, FDFC’s net income and capital gains, to the extent of its earnings and profits, will be included each year in the Fund’s investment company taxable income.
Commodities Risk - Exposure to the commodities markets may subject the Fund to greater volatility than investments in traditional securities. The value of commodity-linked derivative investments may be affected by changes in overall market movements, commodity index volatility, changes in interest rates, or sectors affecting a particular industry or commodity, such as drought, floods, weather, embargoes, tariffs and international economic, political and regulatory developments.
Counterparty Risk - Many derivative contracts are privately negotiated in the over-the-counter market. Fund transactions involving a counterparty are subject to the risk that the counterparty or a third party will not fulfill its obligation to the Fund. Counterparty risk may arise because of the counterparty’s financial condition (i.e., financial difficulties, bankruptcy, or insolvency), market activities and developments, or other reasons, whether foreseen or not. A counterparty’s inability to fulfill its obligation may result in significant financial loss to the Fund.
Credit Default Index Swaps Risk - Credit defaults swaps (“CDS”) are typically two-party financial contracts that transfer credit exposure between the two parties. The use of CDS involves investment techniques and risks different from those associated with ordinary portfolio security transactions, such as potentially heightened counterparty, concentration and exposure risks.
Currency Risk - The risk that changes in currency exchange rates will negatively affect securities denominated in, and/or receiving revenues in, foreign currencies. The liquidity and trading value of foreign currencies could be affected by global economic factors, such as inflation, interest rate levels, and trade balances among countries, as well as the actions of sovereign governments and central banks. Adverse changes in currency exchange rates (relative to the U.S. dollar) may erode or reverse any potential gains from the Fund’s investments in securities denominated in a foreign currency or may widen existing losses. The Fund’s net currency positions may expose it to risks independent of its securities positions.
Fulcrum Diversified Absolute Return Fund
NOTES TO CONSOLIDATED FINANCIAL STATEMENTS (Continued)
June 30, 2024
Currency Swaps Risk - Currency swaps are subject to market risk, counterparty risk, and the risk of imperfect correlation between profit or loss on the currency swap and the underlying currency exchange rate. In the event of the insolvency of the counterparty, the Fund may sustain losses or be unable to liquidate the swap position.
Derivatives Risk - A small investment in derivatives could have a potentially large impact on the Fund’s performance. The use of derivatives involves risks different from, or possibly greater than, the risks associated with investing directly in the underlying assets. Derivatives can be highly volatile, illiquid and difficult to value, and there is a risk that changes in the value of a derivative held by the Fund will not correlate with the Fund’s other investments. Gains or losses from speculative positions in a derivative may be much greater than the derivative’s original cost and potential losses may be substantial.
Emerging Market Risk - The Fund intends to have exposure to emerging markets. Emerging markets are riskier than more developed markets because they tend to develop unevenly and may never fully develop. In addition, investments in securities and instruments traded in emerging markets, or that provide exposure to such securities or markets, can involve additional risks relating to political, economic, or regulatory conditions not associated with investments in U.S. securities and instruments. For example, emerging markets may be subject to greater market volatility, lower trading volume and liquidity, greater social, political and economic uncertainty, governmental controls on foreign investments and limitations on repatriation of invested capital, lower disclosure, corporate governance, auditing and financial reporting standards, fewer protections of property rights, restrictions on the transfer of securities or currency, and settlement and trading practices that differ from those in U.S. markets.
Equity Index Swaps Risk - Equity swaps are subject to liquidity risk because the liquidity of equity swaps is based on the liquidity of the underlying instrument, and are subject to the risk that the counterparty to the equity swap may be unable to or unwilling to make payments or otherwise honor its financial obligations under the terms of the contract.
Options Risk - There are risks associated with the sale of call and put options. As the seller (writer) of a call option, the Fund assumes the risk of a decline in the market price of the underlying security below the purchase price of the underlying security less the premium received, and gives up the opportunity for gain on the underlying security above the exercise option price. As a seller (writer) of a put option, the Fund will lose money if the value of the security falls below the strike price.
Subsidiary Risk - By investing in FDFC, the Fund is indirectly exposed to the risks associated with FDFC’s investments. The commodity-related instruments held by FDFC are generally similar to those that are permitted to be held by the Fund and are subject to the same risks that apply to similar investments if held directly by the Fund (see “Commodities Risk” above). There can be no assurance that the investment objective of FDFC will be achieved. FDFC is not registered under the 1940 Act, and, unless otherwise noted in the Fund’s prospectus, is not subject to all the investor protections of the 1940 Act. However, the Fund wholly owns FDFC, and the Fund and FDFC are both managed by the advisor, making it unlikely that FDFC will take action contrary to the interests of the Fund and its shareholders. The Board has oversight responsibility for the investment activities of the Fund, including its investment in FDFC, and the Fund’s role as sole shareholder of FDFC. To the extent applicable to the investment activities of FDFC, FDFC will be subject to the same investment restrictions and limitations, and follow the same compliance policies and procedures, as the Fund.
Security Transactions and Related Income – Security transactions are accounted for on a trade date basis. Interest income is recognized on an accrual basis. Discounts are accreted and premiums are amortized on securities purchased over the lives of the respective securities. Dividend income is recorded on the ex-dividend date. Realized gains or losses from sales of securities are determined by comparing the identified cost of the security lot sold with the net sales proceeds. Foreign withholding taxes and foreign capital gains taxes, if any, have been provided for in accordance with the Fund’s understanding of the applicable tax rules and regulations.
Fulcrum Diversified Absolute Return Fund
NOTES TO CONSOLIDATED FINANCIAL STATEMENTS (Continued)
June 30, 2024
Dividends and Distributions to Shareholders – Dividends from net investment income, if any, are declared and paid semi-annually. Distributable net realized capital gains, if any, are declared and distributed annually. Dividends from net investment income and distributions from net realized gains are determined in accordance with federal income tax regulations, which may differ from GAAP. These “book/tax” differences are considered either temporary (i.e., deferred losses, capital loss carry forwards) or permanent in nature. To the extent these differences are permanent in nature, such amounts are reclassified within the composition of net assets based on their federal tax-basis treatment; temporary differences do not require reclassification. Dividends and distributions to shareholders are recorded on the ex-dividend date.
Expenses – Expenses of the Trust that are directly identifiable to a specific fund are charged to that fund. Expenses, which are not readily identifiable to a specific fund, are allocated in such a manner as deemed equitable (as determined by the Board), taking into consideration the nature and type of expense and the relative sizes of the fund in the Trust.
Cash and Cash Equivalents – Cash and cash equivalents include cash and overnight investments in interest-bearing demand deposits with a financial institution with original maturities of three months or less. The Fund maintains deposits with a financial institution in an amount that is in excess of federally insured limits.
Restricted Cash and Deposits with Brokers - At June 30, 2024, the Fund held restricted cash in connection with investments in certain derivative securities. Restricted cash is held in a segregated account with the Fund’s custodian and/or counterparty broker and is reflected in the Consolidated Statement of Assets and Liabilities as cash collateral for derivative instruments. On June 30, 2024, the Fund had pledged the following amounts as collateral for open currency contracts, options, futures and swap contracts:
| Counterparty | | Amounts Pledged(1) | | | Deposits with Brokers | |
| Barclays | | $ | - | | | $ | 3,369,839 | |
| Citibank, N.A. | | | 2,901,199 | | | | - | |
| Goldman Sachs | | | 1,420,000 | | | | - | |
| JPMorgan Chase | | | 2,527,038 | | | | 2,648,943 | |
| Merrill Lynch | | | 110,000 | | | | - | |
| Morgan Stanley | | | 17,850,000 | | | | 24,213,274 | |
| Total | | $ | 24,808,237 | | | $ | 30,232,056 | |
| (1) | Excludes non-pledged cash or collateral held by the broker. |
Federal Income Taxes – The Fund intends to continue to comply with the requirements of the Internal Revenue Code applicable to regulated investment companies and to distribute all of its taxable income to its shareholders. Therefore, no provision for federal income tax is required. The Fund recognizes the tax benefits of uncertain tax positions only where the position is “more likely than not” to be sustained assuming examination by tax authorities. Management has analyzed the Fund’s tax positions and has concluded that no liability should be recorded related to uncertain tax positions taken on returns filed for open tax years (2021 – 2023) or expected to be taken on the Fund’s 2024 return. The Fund identifies its major tax jurisdictions as U.S. federal, Ohio and foreign jurisdictions where the Fund makes significant investments; however, the Fund is not aware of any tax positions for which it is reasonably possible that the total amounts of unrecognized tax benefits will change materially in the next twelve months.
Fulcrum Diversified Absolute Return Fund
NOTES TO CONSOLIDATED FINANCIAL STATEMENTS (Continued)
June 30, 2024
The Fund invests in certain derivative instruments, as detailed below, to meet its investment objectives. Derivatives are financial contracts whose value depends upon, or is derived from, the value of an underlying asset, reference rate, or index, and may relate to equity securities, fixed income securities, interest rates, commodities, or currency exchange rates and related indexes. The Fund may also use these derivatives to modify or hedge the Fund’s exposure to a particular investment market related risk, as well as to manage the volatility of the Fund. Additionally, the Fund may use derivatives to manage cash. By investing in derivatives, the Fund attempts to achieve the economic equivalence it would achieve if it were to invest directly in the underlying security. Derivatives may involve various risks, including the potential inability of the counterparty to fulfill its obligation under the terms of the contract, the potential for an illiquid secondary market (making it difficult for the Fund to sell at favorable prices) and the potential for market movements which may expose the Fund to gains or losses in excess of the amount shown in the Consolidated Statement of Assets and Liabilities.
Specific types of derivative instruments used by the Fund for the year ended June 30, 2024, include purchased option; written options; forward currency and futures contracts; and interest rate, credit default, dispersion and total return swaps. All open derivative positions are listed on the Consolidated Schedule of Investments.
Foreign Currency – The accounting records of the Fund are maintained in U.S. dollars. Investment securities and other assets and liabilities denominated in a foreign currency and income receipts and expense payments are translated into U.S. dollars using the prevailing exchange rate at the London market close. Purchases and sales of securities are translated into U.S. dollars at the contractual currency rates established at the approximate time of the trade. Net realized gains and losses on foreign currency transactions represent net gains and losses from currency realized between the trade and settlement dates on securities transactions, gains and losses on the purchase and sale of foreign currencies and the difference between income accrued versus income received. The effects of changes in foreign currency exchange rates on investments in securities are included with the net realized and unrealized gain or loss on investment securities.
Forward Foreign Currency Contracts – As foreign securities are purchased and sold, the Fund may enter into forward foreign currency contracts in order to hedge against foreign currency exchange rate risks. The market value of the contracts fluctuate with changes in currency exchange rates. The contract is marked-to-market daily and the change in market value is recorded by the Fund as an unrealized gain or loss. As foreign securities are sold, a portion of the contract is generally closed and the Fund records a realized gain or loss equal to the difference between the value of the contract at the time it was opened and the value at the time it was closed.
A fund investing in forward foreign currency contracts is exposed to risk if the value of the currency changes unfavorably, if the counterparties to the contracts are unable to meet the terms of their contracts or if the fund is unable to enter into a closing position.
Forward foreign currency contracts outstanding as of June 30, 2024 are reflected in the Consolidated Schedule of Investments.
Futures – The Fund is subject to equity price risk in the normal course of pursuing its investment objectives. To manage equity price risk, the Fund may enter into futures contracts. Upon entering a futures contract with a broker, the Fund deposits a “cash deposit” with the broker as recorded in the accompanying Consolidated Statements of Assets and Liabilities. Futures contracts are marked-to-market daily and subsequent daily payments (variation margin) are made or received by a fund depending on the daily fluctuations in the value of the futures contracts and are recorded as unrealized appreciation or (depreciation). This receivable and/or payable, if any, is included in daily variation margin on futures contracts in the Consolidated Statement of Assets and Liabilities. When a contract is closed, the Fund recognizes a realized gain or loss. Futures contracts have
Fulcrum Diversified Absolute Return Fund
NOTES TO CONSOLIDATED FINANCIAL STATEMENTS (Continued)
June 30, 2024
market risks, including the risk that the change in the value of the contract may not correlate with changes in the value of the underlying securities. With futures contracts, there is minimal counterparty credit risk to the Fund since futures are exchange traded and the exchange’s clearinghouse, as counterparty to all exchange traded futures, guarantees the futures against default. Futures contracts outstanding at year end are listed in the Fund’s Consolidated Schedule of Investments.
Option Transactions – When the Fund writes a call option, an amount equal to the premium received is included in the Consolidated Statement of Assets and Liabilities as a liability. The amount of the liability is subsequently marked-to-market to reflect the current market value of the option. If an option expires on its stipulated expiration date or if the Fund enters into a closing purchase transaction, a gain or loss is realized. If a written call option is exercised, a gain or loss is realized for the sale of the underlying security and the proceeds from the sale are increased by the premium originally received. As writer of an option, the Fund has no control over whether the option will be exercised and, as a result, retains the market risk of an unfavorable change in the price of the security underlying the written option.
The Fund may purchase put and call options. A call option on a security is a contract that gives the holder of the option, in return for a premium, the right, but not the obligation, to buy from the writer of the option the security underlying the option at a specified exercise or “strike” price by or before the contract’s expiration. Put options are purchased to hedge against a decline in the value of securities held in the Fund’s portfolio. If such a decline occurs, the put options will permit the Fund to sell the securities underlying such options at the exercise price, or to close out the options at a profit. The premium paid for a put or call option plus any transaction costs will reduce the benefit, if any, realized by the Fund upon exercise of the option, and, unless the price of the underlying security rises or declines sufficiently, the option may expire worthless to the Fund. In addition, in the event that the price of the security in connection with which an option was purchased moves in a direction favorable to the Fund, the benefits realized by the Fund as a result of such favorable movement will be reduced by the amount of the premium paid for the option and related transaction costs. Written and purchased options are non-income producing securities. With purchased options, there is minimal counterparty risk to the Fund since these options are exchange traded and the exchange’s clearinghouse, as counterparty to all exchange traded options, guarantees against a possible default. Securities held as collateral for options, if any, is reported on the Consolidated Schedule of Investments.
Swap Agreements – The Fund is subject to equity price risk, interest rate risk, credit risk, currency risk, volatility risk, counterparty risk and/or commodity risk in the normal course of pursuing its investment objective. The Fund may enter into various swap transactions for investment purposes or to manage interest rate, equity, foreign exchange (currency), or credit risk. These would be two-party contracts entered into primarily to exchange the returns (or differentials in rates of returns) earned or realized on particular pre-determined investments or instruments.
The gross returns to be exchanged or “swapped” between parties are calculated with respect to a notional amount, i.e., the return on or increase in value of a particular dollar amount invested at a particular interest rate, in a particular foreign currency, or in a “basket” of securities representing a particular index or market segment. Changes in the value of swap agreements are recognized as unrealized gains or losses in the Consolidated Statement of Operations by “marking to market” on a daily basis to reflect the value of the swap agreement at the end of each day as reported by the swap counterparty. Realized gains and losses from the decrease in notional value of the swap are recognized on the trade date. A liquidation payment received or made at the termination of the swap agreement is recorded as a realized gain or loss on the Consolidated Statement of Operations.
Fulcrum Diversified Absolute Return Fund
NOTES TO CONSOLIDATED FINANCIAL STATEMENTS (Continued)
June 30, 2024
Entering into these agreements involves, to varying degrees, lack of liquidity and elements of credit, market, and counterparty risk in excess of amounts recognized on the Consolidated Statement of Assets and Liabilities. The Fund’s maximum risk of loss from counterparty credit risk is the discounted net value of the cash flows to be received from the counterparty over the contract’s remaining life, to the extent that amount is positive. In order to maintain prudent risk exposure to the counterparty, the advisor will reduce exposure to the counterparty whenever that exposure exceeds 5% of the net assets of the Fund for a period of one week or such lesser time as the advisor may determine. If the advisor determines that the counterparty presents an imprudent risk, the swap may be terminated in its entirety.
Total Return Swaps - The Fund may also engage in total return swaps, in which payments made by the Fund or the counterparty are based on the total return of a particular reference asset or assets (such as a fixed income security, a combination of securities, or an index). The value of the Fund’s swap positions would increase or decrease depending on the changes in value of the underlying rates, currency values, volatility or other indices or measures. Caps and floors have an effect similar to buying or writing options. Depending on how they are used, swap agreements may increase or decrease the overall volatility of the Fund’s investments and its share price. The Fund’s ability to engage in certain swap transactions may be limited by tax considerations
Interest Rate Swaps - The Fund may enter into interest rate swaps. The two parties to the swap exchange the right to receive floating interest payments versus fixed interest payments. The value of an interest rate swap will change based on the spread between the rates.
Credit Default Swaps - The Fund enters into credit default swap agreements, credit default index swap agreements and similar agreements as a protection “seller” or as a “buyer” of credit protection. The credit default swap agreement or similar instruments may have as reference obligations one or more securities that are not held by the Fund. The protection “buyer” in a credit default swap agreement is generally obligated to pay the protection “seller” a periodic stream of payments over the term of the agreement, provided generally that no credit event on a reference obligation has occurred. In addition, at the inception of the agreement, the protection “buyer” may receive or be obligated to pay an additional up-front amount depending on the current market value of the contract. If a credit event occurs, an auction process is used to determine the “recovery value” of the contract. The seller then must pay the buyer the “par value” (full notional value) of the swap contract minus the “recovery value” as determined by the auction process. For credit default index swaps, the settlement payment for a constituent’s credit event is scaled down to the weighting in the index.
As a seller of protection, the Fund generally receives a fixed rate of income throughout the term of the swap provided that there is no credit event. In addition, at the inception of the agreement, the Fund may receive or be obligated to pay an additional up-front amount depending on the current market value of the contract. If a credit event occurs, the Fund will be generally obligated to pay the buyer the “par value” (full notional value) of the swap contract minus the “recovery value” as determined by the auction process. Credit default swaps could result in losses if the advisor does not correctly evaluate the creditworthiness of the underlying instrument on which the credit default swap is based. Additionally, if the Fund is a seller of a credit default swap and a credit event occurs, the Fund could suffer significant losses.
Changes in the value of swaps are recorded as unrealized appreciation (depreciation). Unrealized gains are reported as an asset and unrealized losses are reported as a liability. The change in value of swaps, including accruals of interest to be paid or received is reported as unrealized gains or losses. Gains or losses are realized upon termination of the contracts. Payments received or paid at the beginning of the agreement are reflected as such on the Statements of Assets and Liabilities and may be referred to as premiums paid for swap contacts. The risk of loss on a swap contract may exceed the amount recorded as an asset or liability on the Consolidated
Fulcrum Diversified Absolute Return Fund
NOTES TO CONSOLIDATED FINANCIAL STATEMENTS (Continued)
June 30, 2024
Statement of Assets and Liabilities. The notional amount of a swap contract is the reference amount pursuant to which the counterparties make payments. Risks associated with swap contracts include changes in the returns of underlying instruments, failure of the counterparties to perform under a contract’s terms and the possible lack of liquidity with respect to the contracts.
For the year ended June 30, 2024, the net change in unrealized appreciation on swap contracts was $1,292,091. For the year ended June 30, 2024, the Fund had a realized gain of $3,412,921 on swap contracts.
Offsetting of Financial Assets and Derivative Assets
The following table presents the Fund’s asset and liability derivatives available for offset under a master netting arrangement along with collateral pledged for these contracts as of June 30, 2024.
| | | | | | | | | | | | | | | | Gross Amounts Not Offset in the | | | | | |
| | | | | | | | | | | | | | | | Consolidated Statement of Assets & | | | | | |
| | | | | | | | | | | | | | | | Liabilities | | | | | |
Description | |
Gross Amounts of
Recognized
Assets and
(Liabilities) | | | Gross Amounts
Offset in the Consolidated
Statement of
Assets and
Liabilities | | | Net Amount of Assets
Present in the
Consolidated Statement
of Assets and Liabilities | | |
Offsetting
Derivative
Position | | |
Cash Collateral
Pledged(1) | | |
Total | |
| Purchased Options | | | | | | | | | | | | | | | | | | | | | | | | |
| Citigroup | | $ | 947,153 | | | $ | - | | | $ | 947,153 | | | $ | - | | | $ | - | | | $ | 947,153 | |
| Goldman Sachs | | | 255,686 | | | | - | | | | 255,686 | | | | - | | | | - | | | | 255,686 | |
| JPMorgan Chase | | | 1,603,180 | | | | - | | | | 1,603,180 | | | | (101,324 | ) | | | - | | | | 1,501,856 | |
| Morgan Stanley | | | 1,598,645 | | | | - | | | | 1,598,645 | | | | (760,091 | ) | | | - | | | | 838,554 | |
| Futures Contracts (2) | | | | | | | | | | | | | | | | | | | | | | | | |
| JPMorgan Chase | | | 190,357 | | | | (1,621 | ) | | | 188,736 | | | | - | | | | - | | | | 188,736 | |
| Morgan Stanley | | | 1,305,163 | | | | (1,305,163 | ) | | | - | | | | - | | | | - | | | | - | |
| Forward Contracts | | | | | | | | | | | | | | | | | | | | | | | | |
| JPMorgan Chase | | | 175,791 | | | | - | | | | 175,791 | | | | (175,791 | ) | | | - | | | | - | |
| Swap Contracts | | | | | | | | | | | | | | | | | | | | | | | | |
| BAML | | | 71,590 | | | | - | | | | 71,590 | | | | - | | | | - | | | | 71,590 | |
| Barclays | | | 357,764 | | | | - | | | | 357,764 | | | | (114,710 | ) | | | - | | | | 243,054 | |
| Citigroup | | | 62,008 | | | | - | | | | 62,008 | | | | (46,073 | ) | | | - | | | | 15,935 | |
| Goldman Sachs | | | 213,929 | | | | - | | | | 213,929 | | | | (101,130 | ) | | | - | | | | 112,799 | |
| HSBC | | | 44,179 | | | | - | | | | 44,179 | | | | - | | | | - | | | | 44,179 | |
| JPMorgan Chase | | | 250,379 | | | | - | | | | 250,379 | | | | (169,992 | ) | | | - | | | | 80,387 | |
| Morgan Stanley | | | 153,642 | | | | - | | | | 153,642 | | | | (39,285 | ) | | | - | | | | 114,357 | |
| Total | | $ | 7,229,466 | | | $ | (1,306,784 | ) | | $ | 5,922,682 | | | $ | (1,508,396 | ) | | $ | - | | | $ | 4,414,286 | |
Fulcrum Diversified Absolute Return Fund
NOTES TO CONSOLIDATED FINANCIAL STATEMENTS (Continued)
June 30, 2024
| | | | | | | | | | | | | | | | Gross Amounts Not Offset in the
Consolidated Statement of Assets &
Liabilities | | | | | |
Description | | Gross Amounts of
Recognized
Assets and
(Liabilities) | | | Gross Amounts
Offset in the Consolidated
Statement of
Assets and
Liabilities | | | Net Amount of Assets
Present in the
Consolidated Statement
of Assets and Liabilities | | | Offsetting
Derivative
Position | | | Cash Collateral
Pledged(1) | | | Total | |
| Written Options | | | | | | | | | | | | | | | | | | | | | | | | |
| Morgan Stanley | | $ | (760,091 | ) | | $ | - | | | $ | (760,091 | ) | | $ | 760,091 | | | $ | - | | | $ | - | |
| JPMorgan Chase | | | (101,324 | ) | | | - | | | | (101,324 | ) | | | 101,324 | | | | - | | | | - | |
| Futures Contracts (2) | | | | | | | | | | | | | | | | | | | | | | | | |
| JPMorgan Chase | | | (1,621 | ) | | | 1,621 | | | | - | | | | - | | | | - | | | | - | |
| Morgan Stanley | | | (1,840,255 | ) | | | 1,305,163 | | | | (535,092 | ) | | | - | | | | 535,092 | | | | - | |
| Forward Contracts | | | | | | | | | | | | | | | | | | | | | | | | |
| JPMorgan Chase | | | (299,265 | ) | | | - | | | | (299,265 | ) | | | 175,791 | | | | 123,474 | | | | - | |
| Swap Contracts | | | | | | | | | | | | | | | | | | | | | | | | |
| Barclays | | | (114,710 | ) | | | - | | | | (114,710 | ) | | | 114,710 | | | | - | | | | - | |
| Citigroup | | | (46,073 | ) | | | - | | | | (46,073 | ) | | | 46,073 | | | | - | | | | - | |
| Goldman Sachs | | | (101,130 | ) | | | - | | | | (101,130 | ) | | | 101,130 | | | | - | | | | - | |
| JPMorgan Chase | | | (169,992 | ) | | | - | | | | (169,992 | ) | | | 169,992 | | | | - | | | | - | |
| Morgan Stanley | | | (39,285 | ) | | | - | | | | (39,285 | ) | | | 39,285 | | | | - | | | | - | |
| UBS | | | (62,906 | ) | | | - | | | | (62,906 | ) | | | - | | | | - | | | | (62,906 | ) |
| Total | | $ | (3,536,652 | ) | | $ | 1,306,784 | | | $ | (2,229,868 | ) | | $ | 1,508,396 | | | $ | 658,566 | | | $ | (62,906 | ) |
| (1) | Over-collateralization of total financial instruments or cash is not shown. |
| (2) | Reflects the cumulative unrealized appreciation (depreciation) of futures contracts as shown in the Consolidated Schedule of Investments. |
Impact of Derivatives on the Consolidated Statement of Assets and Liabilities and Consolidated Statement of Operations
The following is a summary of the location of derivative investments on the Fund’s Consolidated Statement of Assets and Liabilities as of June 30, 2024:
| Location on the Consolidated Statement of Assets and Liabilities |
| Derivatives Investment Type | | Asset/Liability Derivatives |
Equity/Interest Rate/ Credit/Currency/Commodity | | Fair Value of Investments Options Written, at Fair Value Net unrealized appreciation/(depreciation) from swap contracts Net unrealized appreciation/(depreciation of futures contracts Net unrealized appreciation/(depreciation) of forward foreign currency exchange contracts |
Fulcrum Diversified Absolute Return Fund
NOTES TO CONSOLIDATED FINANCIAL STATEMENTS (Continued)
June 30, 2024
The following table sets forth the fair value of the Fund’s derivative contracts by primary risk exposure as of June 30, 2024:
| Asset Derivatives Investment Fair Value | |
| | | Equity | | | Interest Rate | | | Credit | | | Currency | | | Commodity | | | Total as of June 30, 2024 | |
| Swap Contracts | | $ | 983,592 | | | $ | 169,141 | | | $ | 758 | | | $ | - | | | $ | - | | | $ | 1,153,491 | |
| Futures Contracts | | | 458,765 | | | | 214,399 | | | | - | | | | 66,687 | | | | 755,669 | | | | 1,495,520 | |
| Options Purchased^ | | | 2,181,354 | | | | - | | | | 285,188 | | | | 1,803,440 | | | | 134,681 | | | | 4,404,663 | |
| | | $ | 3,623,711 | | | $ | 383,540 | | | $ | 285,946 | | | $ | 1,870,127 | | | $ | 890,350 | | | $ | 7,053,674 | |
| Liability Derivatives Investment Fair Value | |
| | | Equity | | | Interest Rate | | | Credit | | | Currency | | | Commodity | | | Total as of June 30, 2024 | |
| Swap Contracts | | $ | 446,176 | | | $ | 77,292 | | | $ | 12,628 | | | $ | - | | | $ | - | | | $ | 536,096 | |
| Futures Contracts | | | 498,714 | | | | 106,207 | | | | - | | | | 333,354 | | | | 903,601 | | | | 1,841,876 | |
| Forward Foreign Currency Contracts | | | - | | | | - | | | | - | | | | 123,474 | | | | - | | | | 123,474 | |
| Options Written | | | 290,098 | | | | - | | | | - | | | | 101,324 | | | | 469,993 | | | | 861,415 | |
| | | $ | 1,234,988 | | | $ | 183,499 | | | $ | 12,628 | | | $ | 558,152 | | | $ | 1,373,594 | | | $ | 3,362,861 | |
| ^ | Included with fair value of investments. |
The following is a summary of the location of derivative investments on the Fund’s Consolidated Statement of Operations for the year ended June 30, 2024:
| Derivative Investment Type | | Location of Net Realized and Unrealized Gain/(Loss) on Derivatives |
Equity/Interest Rate/ Credit/Currency/Commodity | | Net realized gain/(loss) and change in net unrealized appreciation/(depreciation) of: Investments, Swap Contracts, Futures Contracts, Forward Foreign Currency Contracts and Options Written |
Fulcrum Diversified Absolute Return Fund
NOTES TO CONSOLIDATED FINANCIAL STATEMENTS (Continued)
June 30, 2024
The following is a summary of the Fund’s realized and unrealized gain/(loss) on derivative investments recognized in the Consolidated Statement of Operations categorized by primary risk exposure for the year ended June 30, 2024:
| Realized Gain/(Loss) | |
| | | Equity | | | Interest Rate | | | Credit | | | Currency | | | Commodity | | | Total as of June 30, 2024 | |
| Swap Contracts* | | $ | 3,746,892 | | | $ | (83,664 | ) | | $ | 135,960 | | | $ | - | | | $ | - | | | $ | 3,799,188 | |
| Futures Contracts | | | 7,800,079 | | | | (1,432,286 | ) | | | - | | | | (933,044 | ) | | | 1,494,778 | | | | 6,929,527 | |
| Forward Foreign Currency Contracts | | | - | | | | - | | | | - | | | | (382,427 | ) | | | - | | | | (382,427 | ) |
| Options Purchased^ | | | (2,248,604 | ) | | | - | | | | - | | | | (1,436,847 | ) | | | (536,217 | ) | | | (4,221,668 | ) |
| Options Written | | | 1,558,293 | | | | - | | | | - | | | | 317,862 | | | | 1,503,420 | | | | 3,379,575 | |
| | | $ | 10,856,660 | | | $ | (1,515,950 | ) | | $ | 135,960 | | | $ | (2,434,456 | ) | | $ | 2,461,981 | | | $ | 9,504,195 | |
| Change in Unrealized Appreciation/(Depreciation) | |
| | | Equity | | | Interest Rate | | | Credit | | | Currency | | | Commodity | | | Total as of June 30, 2024 | |
| Swap Contracts | | $ | 705,021 | | | $ | 634,239 | | | $ | (47,169 | ) | | $ | - | | | $ | - | | | $ | 1,292,091 | |
| Futures Contracts | | | (709,798 | ) | | | 271,747 | | | | - | | | | 416,884 | | | | 91,749 | | | | 70,582 | |
| Forward Foreign Currency Contracts | | | - | | | | - | | | | - | | | | (292,366 | ) | | | - | | | | (292,366 | ) |
| Options Purchased^ | | | 63,929 | | | | 72,012 | | | | 90,463 | | | | 245,398 | | | | 94,272 | | | | 566,074 | |
| Options Written | | | (158,695 | ) | | | - | | | | - | | | | (25,021 | ) | | | (107,928 | ) | | | (291,644 | ) |
| | | $ | (99,543 | ) | | $ | 977,998 | | | $ | 43,294 | | | $ | 344,895 | | | $ | 78,093 | | | $ | 1,344,737 | |
| * | Excludes income earned on swap contracts. |
| ^ | Included with realized loss on investment transactions and change in unrealized appreciation/(depreciation) of investments. |
The notional value of the derivative instruments outstanding as of June 30, 2024 as disclosed in the Consolidated Portfolio of Investments and the amounts of realized and changes in unrealized gains and losses on derivative instruments during the period as disclosed above and within the Consolidated Statement of Operations serve as indicators of the volume of derivative activity for the Fund.
Indemnification – The Trust indemnifies its officers and Trustees for certain liabilities that may arise from the performance of their duties to the Trust. Additionally, in the normal course of business, the Fund enters into contracts that contain a variety of representations and warranties and which provide general indemnities. The Fund’s maximum exposure under these arrangements is unknown, as this would involve future claims that may be made against the Fund that have not yet occurred. However, based on experience, the risk of loss due to these warranties and indemnities appears to be remote.
3. INVESTMENT TRANSACTIONS
For the year ended June 30, 2024, cost of purchases and proceeds from sales of portfolio securities, other than short-term investments and U.S. Government securities amounted to $76,671,047 and $77,946,826 respectively.
Fulcrum Diversified Absolute Return Fund
NOTES TO CONSOLIDATED FINANCIAL STATEMENTS (Continued)
June 30, 2024
4. INVESTMENT ADVISORY AGREEMENT AND TRANSACTIONS WITH RELATED PARTIES
Fulcrum Asset Management LLP serves as the Fund’s investment advisor (the “Advisor”). Pursuant to an investment advisory agreement with the Fund, the Advisor, under the oversight of the Board, directs the daily operations of the Fund and supervises the performance of administrative and professional services provided by others. As compensation for its services and the related expenses borne by the Advisor, the Fund pays the Advisor a management fee, calculated and accrued daily and paid monthly, at an annual rate of 0.90% of the Fund’s average daily net assets. For the year ended June 30, 2024, the Advisor earned $1,914,963 in advisory fees. As of June 30, 2024, the Fund had a payable for advisory fees of $60,241.
Pursuant to a written contract (the “Waiver Agreement”), the Advisor has contractually agreed, at least until April 30, 2025, to waive a portion or all of its management fees and pay Fund expenses (excluding any front end or contingent deferred loads; brokerage fees and commissions; acquired fund fees and expenses (“AFFE”); fees and expenses associated with investments in other collective investment vehicles or derivative instruments (including for example option and swap fees and expenses); borrowing costs (such as interest and dividend expense on securities sold short); taxes; extraordinary expenses, such as litigation expenses (which may include indemnification of Fund officers and Trustees, contractual indemnification of Fund service providers (other than the Advisor)) in order to limit the annual fund operating expenses to 1.05% of the average daily net assets of each of the Super Institutional Class and Institutional Class shares (the “Expense Limitation”).
If the Advisor waives any fee or reimburses any expense pursuant to the Waiver Agreement, and the Fund’s operating expenses are subsequently less than the Expense Limitation, the Advisor shall be entitled to reimbursement by the Fund for such waived fees or reimbursed expenses provided that such reimbursement does not cause the Fund’s expenses to exceed the Expense Limitation that was in place at the time of the original expense waiver. If Fund operating expenses attributable to Super Institutional Class shares or Institutional Class shares subsequently exceed the Expense Limitation, the reimbursements shall be suspended. For the year ended June 30, 2024, the Advisor waived $284,861 of fees which are subject to recapture by the Advisor.
As of June 30, 2024, the Advisor has waived fees that can be recouped up to three years from the date incurred before expiring as summarized below:
June 30,
2025 | | June 30,
2026 | | June 30,
2027 |
| $323,321 | | $402,825 | | $284,861 |
As of June 30, 2024, $244,854 in waived fees have expired unrecouped.
The distributor of the Fund is Northern Lights Distributors, LLC (“NLD” or the “Distributor”). The Board has adopted, on behalf of the Fund, the Trust’s Master Distribution and Shareholder Servicing Plan (the “Plan”), as amended, pursuant to Rule 12b-1 under the 1940 Act. For the year ended June 30, 2024, the Fund did not pay distribution related charges pursuant to the Plan.
Fulcrum Diversified Absolute Return Fund
NOTES TO CONSOLIDATED FINANCIAL STATEMENTS (Continued)
June 30, 2024
In addition, certain affiliates of the Distributor provide services to the Fund as follows:
Ultimus Fund Solutions, LLC (“UFS”), an affiliate of the Distributor, provides administration, fund accounting, and transfer agent services to the Trust. Pursuant to separate servicing agreements with UFS, the Fund pays UFS customary fees for providing administration, fund accounting and transfer agency services to the Fund. Certain officers of the Trust are also officers of UFS, and are not paid any fees directly by the Fund for serving in such capacities.
Northern Lights Compliance Services, LLC (“NLCS”), an affiliate of UFS and the Distributor, provides a Chief Compliance Officer to the Trust, as well as related compliance services, pursuant to a consulting agreement between NLCS and the Trust. Under the terms of such agreement, NLCS receives customary fees from the Fund.
BluGiant, LLC (“BluGiant”), an affiliate of UFS and the Distributor, provides EDGAR conversion and filing services as well as print management services for the Fund on an ad-hoc basis. For the provision of these services, Blu Giant receives customary fees from the Fund.
In addition, the Fund’s Custodian, U.S. Bank NA is affiliated with U.S. Bank Global Fund Services.
5. AGGREGATE UNREALIZED APPRECIATION AND DEPRECIATION – TAX BASIS (TO BE UPDATED)
The identified cost of investments in securities owned by the Fund for federal income tax purposes, and its respective gross unrealized appreciation and depreciation at June 30, 2024, were as follows:
| Cost for Federal Tax purposes | | $ | 134,120,727 | |
| | | | | |
| Unrealized Appreciation | | $ | 119,291,191 | |
| Unrealized Depreciation | | | (116,477,692 | ) |
| Tax Net Unrealized Appreciation | | $ | 2,813,499 | |
6. DISTRIBUTIONS TO SHAREHOLDERS AND TAX COMPONENTS OF CAPITAL
The tax character of distributions paid during the following fiscal years was as follows:
| | | Fiscal Year Ended
June 30,
2024 | | | Fiscal Year Ended
June 30,
2023 | |
| Ordinary Income | | $ | 1,897,325 | | | $ | 1,243,543 | |
| Long-Term Capital Gain | | | - | | | | 1,445,750 | |
| Return of Capital | | | - | | | | - | |
| | | $ | 1,897,325 | | | $ | 2,689,293 | |
Fulcrum Diversified Absolute Return Fund
NOTES TO CONSOLIDATED FINANCIAL STATEMENTS (Continued)
June 30, 2024
As of June 30, 2024, the components of accumulated earnings/(deficit) on a tax basis were as follows:
| Undistributed Ordinary Income | | | Undistributed Long-Term Gains | | | Post October Loss and Late Year Loss | | | Capital Loss Carry Forwards | | | Other Book/Tax Differences | | | Unrealized Appreciation/ (Depreciation) | | | Total Distributable Earnings/ (Accumulated Deficit) | |
| $ | 5,835,722 | | | $ | 254,844 | | | $ | - | | | $ | - | | | $ | (489 | ) | | $ | 2,884,677 | | | $ | 8,974,754 | |
The difference between book basis and tax basis undistributed net investment income, accumulated net realized loss and unrealized appreciation from investments is primarily attributable to the tax deferral of losses on wash sales, tax adjustment for unsettled short positions and corporate return of capital distributions, and the mark-to-market on open futures, 1256 option contracts, passive foreign investment companies, forward contracts and swaps. The unrealized appreciation (depreciation) in the table above includes unrealized net foreign currency gains of $71,178. In addition, the amount listed under other book/tax differences are primarily attributable to the tax deferral of losses on straddles.
During the fiscal year ended June 30, 2024, the Fund utilized tax equalization which is the use of earnings and profits distributions to shareholders on redemption of shares as part of the dividends paid deduction for income tax purposes. Permanent book and tax differences, primarily attributable to the use of tax equalization credits, and tax adjustments for the Fund’s wholly owned subsidiary, resulted in reclassifications for the Fund for the fiscal year ended June 30, 2024, as follows:
| | Paid In Capital | | | Distributable Earnings | |
| $ | 146,715 | | $ | (146,715 | ) |
7. SUBSEQUENT EVENTS
Subsequent events after the date of the Consolidated Statement of Assets and Liabilities have been evaluated through the date the consolidated financial statements were issued. Management has determined that no events or transactions occurred requiring adjustment or disclosure in the consolidated financial statements.

REPORT OF INDEPENDENT REGISTERED PUBLIC ACCOUNTING FIRM
To the Shareholders of Fulcrum Diversified Absolute Return Fund and
Board of Trustees of Northern Lights Fund Trust IV
Opinion on the Financial Statements
We have audited the accompanying consolidated statement of assets and liabilities, including the consolidated schedule of investments, of Fulcrum Diversified Absolute Return Fund (the “Fund”), a series of Northern Lights Fund Trust IV, as of June 30, 2024, the related consolidated statement of operations for the year then ended, the consolidated statements of changes in net assets and financial highlights for each of the two years in the period then ended, and the related notes (collectively referred to as the “financial statements”). In our opinion, the financial statements present fairly, in all material respects, the financial position of the Fund as of June 30, 2024, the results of its operations for the year then ended, and the changes in net assets and financial highlights for each of the two years in the period then ended, in conformity with accounting principles generally accepted in the United States of America.
The Fund’s consolidated financial highlights for the years ended June 30, 2022, and prior, were audited by other auditors whose report dated September 1, 2022, expressed an unqualified opinion on those and financial highlights.
Basis for Opinion
These financial statements are the responsibility of the Fund’s management. Our responsibility is to express an opinion on the Fund’s financial statements based on our audits. We are a public accounting firm registered with the Public Company Accounting Oversight Board (United States) (“PCAOB”) and are required to be independent with respect to the Fund in accordance with the U.S. federal securities laws and the applicable rules and regulations of the Securities and Exchange Commission and the PCAOB.
We conducted our audits in accordance with the standards of the PCAOB. Those standards require that we plan and perform the audit to obtain reasonable assurance about whether the financial statements are free of material misstatement whether due to error or fraud.
Our audits included performing procedures to assess the risks of material misstatement of the financial statements, whether due to error or fraud, and performing procedures that respond to those risks. Such procedures included examining, on a test basis, evidence regarding the amounts and disclosures in the financial statements. Our procedures included confirmation of securities owned as of June 30, 2024, by correspondence with the custodian and brokers; when replies were not received from brokers, we performed other auditing procedures. Our audits also included evaluating the accounting principles used and significant estimates made by management, as well as evaluating the overall presentation of the financial statements. We believe that our audits provide a reasonable basis for our opinion.
We have served as the Fund’s auditor since 2022.

COHEN & COMPANY, LTD.
Philadelphia, Pennsylvania
August 29, 2024
COHEN & COMPANY, LTD.
800.229.1099 | 866.818.4538 fax | cohencpa.com
Registered with the Public Company Accounting Oversight Board
PROXY VOTING POLICY
Information regarding how the Fund voted proxies relating to portfolio securities for the most recent twelve month period ended June 30 as well as a description of the policies and procedures that the Fund uses to determine how to vote proxies is available without charge, upon request, by calling 1-855 -538-5278 or by referring to the Securities and Exchange Commission’s (“SEC”) website at http://www.sec.gov.
PORTFOLIO HOLDINGS
The Fund files its complete schedule of portfolio holdings with the SEC for the first and third quarters of each fiscal year on as an exhibit to its reports on Form N-PORT, within sixty days after the end of the period. Form N-PORT reports are available on the SEC’s website at http://www.sec.gov. The information on Form N-PORT is available without charge, upon request, by calling 1-855-538-5278.
INVESTMENT ADVISOR
Fulcrum Asset Management LLP
Marble Arch House
66 Seymour Street
London W1H 5BT
United Kingdom
ADMINISTRATOR
Ultimus Fund Solutions, LLC
225 Pictoria Drive, Suite 450
Cincinnati, OH 45246
Item 8. Changes in and Disagreements with Accountants for Open-End Management Investment Companies.
Not applicable
Item 9. Proxy Disclosures for Open-End Management Investment Companies.
Not applicable
Item 10. Remuneration Paid to Directors, Officers, and Others of Open-End Management Investment Companies.
Included under Item 7
Item 11. Statement Regarding Basis for Approval of Investment Advisory Contract.
Not applicable
Item 12. Disclosure of Proxy Voting Policies and Procedures for Closed-End Management Investment Companies.
Not applicable
Item 13. Portfolio Managers of Closed-End Management Investment Companies.
Not applicable
Item 14. Purchases of Equity Securities by Closed-End Management Investment Company and Affiliated Purchasers.
Not applicable
Item 15. Submission of Matters to a Vote of Security Holders.
None
Item 16. Controls and Procedures.
| (a) | The registrant’s Principal Executive Officer and Principal Financial Officer have concluded that the registrant’s disclosure controls and procedures (as defined in Rule 30a-3(c) under the Act) are effective in design and operation and are sufficient to form the basis of the certifications required by Rule 30a-(2) under the Act, based on their evaluation of these disclosure controls and procedures as of a date within 90 days of this report on Form N-CSR. |
| (b) | There were no changes in the registrant’s internal control over financial reporting (as defined in Rule 30a-3(d) under the Act) during the period covered by this report that have materially affected, or are reasonably likely to materially affect, the registrant’s internal control over financial reporting. |
Item 17. Disclosure of Securities Lending Activities for Closed-End Management Investment Companies.
Not applicable
Item 18. Recovery of Erroneously Awarded Compensation.
Item 19. Exhibits.
SIGNATURES
Pursuant to the requirements of the Securities Exchange Act of 1934 and the Investment Company Act of 1940, the registrant has duly caused this report to be signed on its behalf by the undersigned, thereunto duly authorized.
| (Registrant) | Northern Lights Fund Trust IV | |
By (Signature and Title)
Wendy Wang, Principal Executive Officer/President
Pursuant to the requirements of the Securities Exchange Act of 1934 and the Investment Company Act of 1940, this report has been signed below by the following persons on behalf of the registrant and in the capacities and on the dates indicated.
By (Signature and Title)
Wendy Wang, Principal Executive Officer/President
By (Signature and Title)
Sam Singh, Principal Financial Officer/Treasurer