united states
securities and exchange commission
washington, d.c. 20549
form n-csr
certified shareholder report of registered
management investment companies
| Investment Company Act file number | 811-23066 | |
Northern Lights Fund Trust IV
(Exact name of registrant as specified in charter)
| 225 Pictoria Drive, Suite 450 Cincinnati, OH | | 45246 |
| (Address of principal executive offices) | | (Zip code) |
The Corporation Trust Company
1209 Orange Street Wilmington, DE 19801
(Name and address of agent for service)
| Registrant’s telephone number, including area code: | (631) 490-4300 | |
| Date of fiscal year end: | 11/30 | |
| | | |
| Date of reporting period: | 11/30/2024 | |
Item 1. Reports to Stockholders.
National Security Emerging Markets Index ETF
Annual Shareholder Report - November 30, 2024
This annual shareholder report contains important information about National Security Emerging Markets Index ETF for the period of December 6, 2023 to November 30, 2024. You can find additional information about the Fund at www.nationalsecurityindex.com. You can also request this information by contacting us at 833-906-5569.
What were the Fund’s costs for the last year?
(based on a hypothetical $10,000 investment)
| Fund Name | Costs of a $10,000 investment | Costs paid as a percentage of a $10,000 investment |
|---|
| National Security Emerging Markets Index ETF | $76 | 0.75% |
|---|
How did the Fund perform during the reporting period?
The performance of the National Security Emerging Markets Index ETF was in line relative to its peer group of thematic strategies within the diversified emerging markets category. Emerging markets in the later months of the reporting period were challenged by geopolitical events ranging from political instability to uncertainty about future United States tariff policies following Donald Trump’s victory in the November presidential election. The asset class also faced headwinds from a strong U.S. dollar on expectations of fewer Federal Reserve interest rate cuts. Country performance was highest in Taiwan, China and India, each of which attracted capital flows related to growth stories in artificial intelligence and related semiconductor industries. Performance was weakest in Mexico and Brazil. South Korean equities also pulled back toward the end of the reporting period amidst growing political uncertainty. At the individual security level, the Fund benefited from exposure to its largest holding, Taiwan Semiconductor Manufacturing; its largest detractor was Samsung Electronics.
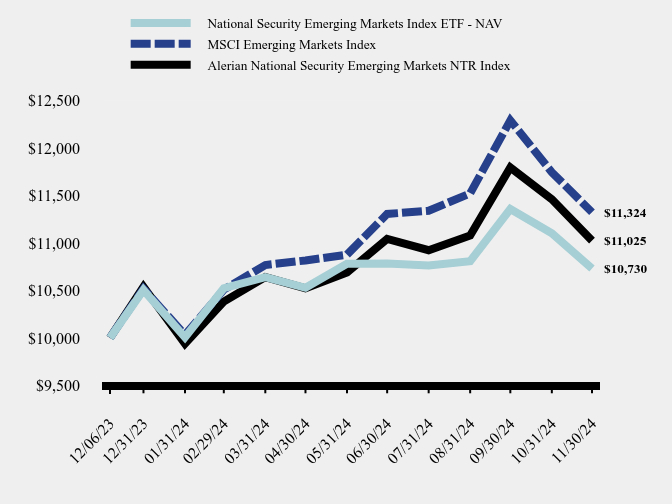
How has the Fund performed since inception?
Total Return Based on $10,000 Investment
| National Security Emerging Markets Index ETF - NAV | MSCI Emerging Markets Index | Alerian National Security Emerging Markets NTR Index |
|---|
| 12/06/23 | $10,000 | $10,000 | $10,000 |
|---|
| 12/31/23 | $10,504 | $10,519 | $10,538 |
|---|
| 01/31/24 | $10,006 | $10,031 | $9,938 |
|---|
| 02/29/24 | $10,524 | $10,508 | $10,382 |
|---|
| 03/31/24 | $10,640 | $10,768 | $10,640 |
|---|
| 04/30/24 | $10,528 | $10,816 | $10,522 |
|---|
| 05/31/24 | $10,781 | $10,877 | $10,688 |
|---|
| 06/30/24 | $10,785 | $11,306 | $11,043 |
|---|
| 07/31/24 | $10,764 | $11,340 | $10,924 |
|---|
| 08/31/24 | $10,809 | $11,523 | $11,079 |
|---|
| 09/30/24 | $11,358 | $12,293 | $11,796 |
|---|
| 10/31/24 | $11,103 | $11,746 | $11,461 |
|---|
| 11/30/24 | $10,730 | $11,324 | $11,025 |
|---|
Average Annual Total Returns
| Since Inception (December 6, 2023) |
|---|
| National Security Emerging Markets Index ETF - NAV | 7.30% |
|---|
| MSCI Emerging Markets Index | 13.24% |
|---|
| Alerian National Security Emerging Markets NTR Index | 10.25% |
|---|
The Fund's past performance is not a good predictor of how the Fund will perform in the future. The graph and table do not reflect the deduction of taxes that a shareholder would pay on fund distributions or redemption of fund shares.
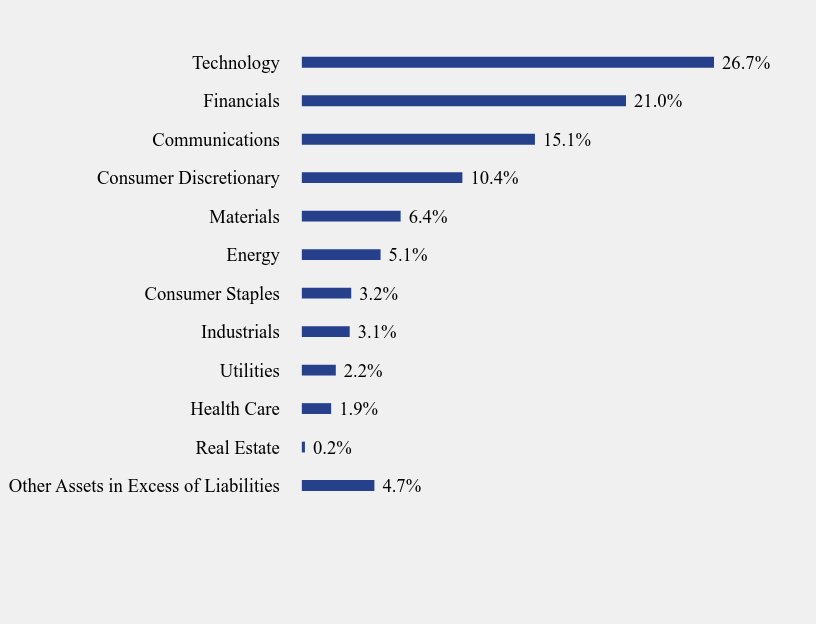
What did the Fund invest in?
Sector Weighting (% of net assets)
| Value | Value |
|---|
| Other Assets in Excess of Liabilities | 4.7% |
| Real Estate | 0.2% |
| Health Care | 1.9% |
| Utilities | 2.2% |
| Industrials | 3.1% |
| Consumer Staples | 3.2% |
| Energy | 5.1% |
| Materials | 6.4% |
| Consumer Discretionary | 10.4% |
| Communications | 15.1% |
| Financials | 21.0% |
| Technology | 26.7% |
- Net Assets$7,638,574
- Number of Portfolio Holdings120
- Advisory Fee $46,369
- Portfolio Turnover42%
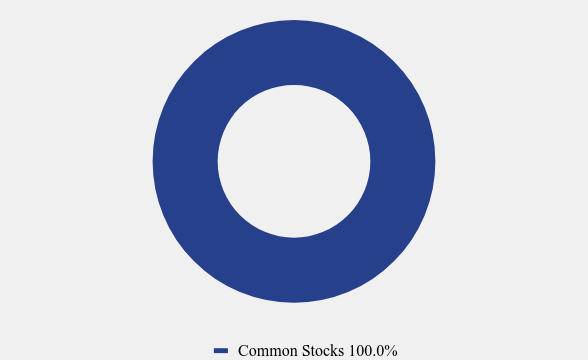
Asset Weighting (% of total investments)
| Value | Value |
|---|
| Common Stocks | 100.0% |
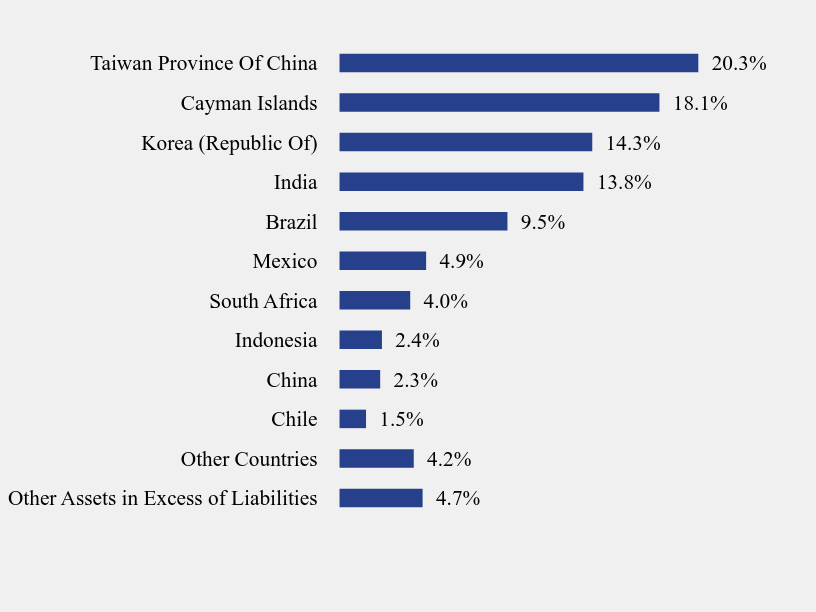
Country Weighting (% of net assets)
| Value | Value |
|---|
| Other Assets in Excess of Liabilities | 4.7% |
| Other Countries | 4.2% |
| Chile | 1.5% |
| China | 2.3% |
| Indonesia | 2.4% |
| South Africa | 4.0% |
| Mexico | 4.9% |
| Brazil | 9.5% |
| India | 13.8% |
| Korea (Republic Of) | 14.3% |
| Cayman Islands | 18.1% |
| Taiwan Province Of China | 20.3% |
Top 10 Holdings (% of net assets)
| Holding Name | % of Net Assets |
| Taiwan Semiconductor Manufacturing Company Ltd. | 11.7% |
| Samsung Electronics Company Ltd. | 5.4% |
| HDFC Bank Ltd. | 3.9% |
| PDD Holdings, Inc. | 3.8% |
| Reliance Industries Ltd. | 2.8% |
| Hon Hai Precision Industry Company Ltd. | 2.6% |
| ICICI Bank Ltd. | 2.3% |
| Chunghwa Telecom Company Ltd. | 2.1% |
| ASE Technology Holding Company Ltd. | 2.1% |
| Meituan | 1.8% |
No material changes occurred during the year ended November 30, 2024.
Where can I find additional information about the Fund?
Additional information is available on the Fund's website ( www.nationalsecurityindex.com ), including its:
Prospectus
Financial information
Holdings
Proxy voting information
National Security Emerging Markets Index ETF
Annual Shareholder Report - November 30, 2024
Item 2. Code of Ethics.
| (a) | The registrant has, as of the end of the period covered by this report, adopted a code of ethics that applies to the registrant’s principal executive officer, principal financial officer, and principal accounting officer or controller, or persons performing similar functions, regardless of whether these individuals are employed by the registrant or a third party. |
| | |
| (b) | N/A |
| | |
| (c) | During the period covered by this report, there were no amendments to any provision of the code of ethics. |
| | |
| (d) | During the period covered by this report, there were no waivers or implicit waivers of a provision of the code of ethics. |
| | |
| (e) | N/A |
| | |
| (f) | See Item 19(a)(1) |
Item 3. Audit Committee Financial Expert.
| (a)(1) | The Registrant’s Board of Trustees has determined that Mr. Joseph Breslin are audit committee financial experts, as defined in Item 3 of Form N-CSR. Mr. Breslin is independent for purposes of this Item. |
Item 4. Principal Accountant Fees and Services.
| (a) | Audit Fees. The aggregate fees billed for each of the last two fiscal years for professional services rendered by the registrant’s principal accountant for the audit of the registrant’s annual financial statements or services that are normally provided by the accountant in connection with statutory and regulatory filings or engagements for those fiscal years are as follows: |
| (b) | Audit-Related Fees. There were no fees billed in each of the last two fiscal years for assurances and related services by the principal accountant that are reasonably related to the performance of the audit of the registrant’s financial statements and are not reported under paragraph (a) of this Item. |
| (c) | Tax Fees. The aggregate fees billed in each of the last two fiscal years for professional services rendered by the principal accountant for tax compliance are as follows: |
Preparation of Federal & State income tax returns, assistance with calculation of required income, capital gain and excise distributions and preparation of Federal excise tax returns.
| (d) | All Other Fees. The aggregate fees billed in each of the last two fiscal years for products and services provided by the registrant’s principal accountant, other than the services reported in paragraphs (a) through (c) of this item were $0 and $0 for the fiscal years ended November 30, 2024 and 2023, respectively. |
| | |
| (e)(1) | The audit committee does not have pre-approval policies and procedures. Instead, the audit committee or audit committee chairman approves on a case-by-case basis each audit or non-audit service before the principal accountant is engaged by the registrant. |
| | |
| (e)(2) | There were no services described in each of paragraphs (b) through (d) of this Item that were approved by the audit committee pursuant to paragraph (c)(7)(i)(C) of Rule 2-01 of Regulation S-X. |
| | |
| (f) | Not applicable. |
| | |
| (g) | All non-audit fees billed by the registrant’s principal accountant for services rendered to the registrant for the fiscal years ended November 30, 2024 and 2023 respectively are disclosed in (b)-(d) above. There were no audit or non-audit services performed by the registrant’s principal accountant for the registrant’s adviser. |
| | |
| (h) | Not applicable. |
| | |
| (i) | Not applicable. |
| | |
| (j) | Not applicable. |
Item 5. Audit Committee of Listed Registrants.
Not applicable
Item 6. Investments.
The Registrant’s schedule of investments in unaffiliated issuers is included in the Financial Statements under Item 7 of this form.
Item 7. Financial Statements and Financial Highlights for Open-End Management Investment Companies.

NATIONAL SECURITY EMERGING MARKETS INDEX ETF
NSI
Annual Financial Statements and Additional Information
November 30, 2024
Listed and traded on:
the NASDAQ, Inc.
NATIONAL SECURITY EMERGING MARKETS INDEX ETF
SCHEDULE OF INVESTMENTS
November 30, 2024
| Shares | | | | | Fair Value | |
| | | | | COMMON STOCKS — 95.3% | | | | |
| | | | | AEROSPACE & DEFENSE - 0.2% | | | | |
| | 362 | | | Embraer S.A. - ADR(a) | | $ | 13,839 | |
| | | | | | | | | |
| | | | | ASSET MANAGEMENT - 0.3% | | | | |
| | 1,680 | | | XP, Inc., Class A | | | 22,747 | |
| | | | | | | | | |
| | | | | AUTOMOTIVE - 1.4% | | | | |
| | 1,981 | | | Li Auto, Inc., Class A - ADR(a) | | | 46,910 | |
| | 5,649 | | | NIO, Inc. - ADR(a) | | | 25,308 | |
| | 2,862 | | | XPeng, Inc. - ADR(a) | | | 34,487 | |
| | | | | | | | 106,705 | |
| | | | | BANKING - 18.3% | | | | |
| | 5,495 | | | Akbank TAS - ADR | | | 19,013 | |
| | 1,320 | | | Axis Bank Ltd. | | | 88,440 | |
| | 10,519 | | | Banco Bradesco S.A. - ADR | | | 22,405 | |
| | 1,344 | | | Banco de Chile - ADR | | | 30,643 | |
| | 3,296 | | | Banco do Brasil S.A. - ADR | | | 13,612 | |
| | 1,612 | | | Banco Santander Brasil S.A. - ADR | | | 6,706 | |
| | 964 | | | Banco Santander Chile - ADR | | | 18,287 | |
| | 862 | | | Bancolombia S.A. - ADR | | | 28,187 | |
| | 3,287 | | | Bank Central Asia Tbk P.T. - ADR | | | 51,967 | |
| | 2,221 | | | Bank Mandiri Persero Tbk P.T. - ADR | | | 34,736 | |
| | 4,306 | | | Bank Rakyat Indonesia Persero Tbk P.T. - ADR | | | 57,959 | |
| | 100 | | | Credicorp Ltd. | | | 18,547 | |
| | 1,221 | | | Grupo Financiero Banorte S.A.B. de C.V. - ADR | | | 40,940 | |
| | 4,457 | | | HDFC Bank Ltd. - ADR | | | 297,550 | |
| | 5,793 | | | ICICI Bank Ltd. - ADR | | | 176,977 | |
| | 8,619 | | | Itau Unibanco Holding S.A. - ADR | | | 46,198 | |
| | 1,423 | | | KB Financial Group, Inc. - ADR | | | 98,088 | |
| | 5,335 | | | NU Holdings Ltd./Cayman Islands, CLASS A(a) | | | 66,848 | |
| | 2,414 | | | Shinhan Financial Group Company Ltd. - ADR | | | 93,132 | |
| | 1,933 | | | Standard Bank Group Ltd. - ADR | | | 25,496 | |
| | 806 | | | State Bank of India | | | 80,358 | |
| | 2,462 | | | Woori Financial Group, Inc. - ADR | | | 87,992 | |
| | | | | | | | 1,404,081 | |
See accompanying notes to financial statements.
NATIONAL SECURITY EMERGING MARKETS INDEX ETF
SCHEDULE OF INVESTMENTS (Continued)
November 30, 2024
| Shares | | | | | Fair Value | |
| | | | | COMMON STOCKS — 95.3% (Continued) | | | | |
| | | | | BEVERAGES - 2.1% | | | | |
| | 25,275 | | | Ambev S.A. - ADR | | $ | 53,583 | |
| | 486 | | | Coca-Cola Femsa S.A.B. de C.V. - ADR | | | 38,700 | |
| | 735 | | | Fomento Economico Mexicano S.A.B. de C.V. - ADR | | | 65,701 | |
| | | | | | | | 157,984 | |
| | | | | BIOTECH & PHARMA - 1.9% | | | | |
| | 225 | | | BeiGene Ltd. - ADR(a) | | | 48,375 | |
| | 4,695 | | | Dr Reddy’s Laboratories Ltd. - ADR | | | 66,388 | |
| | 1,254 | | | Hutchison China MediTech Ltd. - ADR(a) | | | 21,255 | |
| | 3,619 | | | Hypera S.A. - ADR | | | 11,617 | |
| | | | | | | | 147,635 | |
| | | | | CHEMICALS - 1.2% | | | | |
| | 1,280 | | | Braskem S.A. - ADR(a) | | | 6,426 | |
| | 9,363 | | | Sasol Ltd. - ADR | | | 46,909 | |
| | 992 | | | Sociedad Quimica y Minera de Chile S.A. - ADR | | | 38,152 | |
| | | | | | | | 91,487 | |
| | | | | CONSTRUCTION MATERIALS - 0.6% | | | | |
| | 3,756 | | | Cemex S.A.B. de C.V. - ADR | | | 20,921 | |
| | 244 | | | Tecnoglass, Inc. | | | 19,776 | |
| | | | | | | | 40,697 | |
| | | | | CONSUMER SERVICES - 0.7% | | | | |
| | 542 | | | New Oriental Education & Technology Group, Inc. - ADR | | | 31,610 | |
| | 2,383 | | | TAL Education Group - ADR(a) | | | 23,663 | |
| | | | | | | | 55,273 | |
| | | | | E-COMMERCE DISCRETIONARY - 6.7% | | | | |
| | 1,820 | | | Coupang, Inc.(a) | | | 46,155 | |
| | 70 | | | MercadoLibre, Inc.(a) | | | 138,962 | |
| | 3,026 | | | PDD Holdings, Inc. - ADR(a) | | | 292,190 | |
| | 3,092 | | | Vipshop Holdings Ltd. - ADR | | | 42,700 | |
| | | | | | | | 520,007 | |
| | | | | ELECTRIC UTILITIES - 1.6% | | | | |
| | 2,078 | | | Centrais Eletricas Brasileiras S.A. - ADR | | | 11,865 | |
| | 4,694 | | | Cia Energetica de Minas Gerais - ADR | | | 9,153 | |
| | 1,194 | | | Cia Paranaense de Energia - ADR | | | 7,725 | |
| | 11,188 | | | Enel Chile S.A. - ADR | | | 30,431 | |
See accompanying notes to financial statements.
NATIONAL SECURITY EMERGING MARKETS INDEX ETF
SCHEDULE OF INVESTMENTS (Continued)
November 30, 2024
| Shares | | | | | Fair Value | |
| | | | | COMMON STOCKS — 95.3% (Continued) | | | | |
| | | | | ELECTRIC UTILITIES - 1.6% (Continued) | | | | |
| | 7,204 | | | Korea Electric Power Corporation - ADR(a) | | $ | 64,837 | |
| | | | | | | | 124,011 | |
| | | | | ENTERTAINMENT CONTENT - 1.9% | | | | |
| | 1,411 | | | Bilibili, Inc. - ADR(a) | | | 27,049 | |
| | 1,359 | | | NetEase, Inc. - ADR | | | 118,885 | |
| | | | | | | | 145,934 | |
| | | | | FOOD - 0.4% | | | | |
| | 1,895 | | | BRF S.A. - ADR | | | 7,826 | |
| | 1,624 | | | JBS S/A - ADR | | | 19,976 | |
| | | | | | | | 27,802 | |
| | | | | FORESTRY, PAPER & WOOD PRODUCTS - 0.2% | | | | |
| | 1,341 | | | Suzano S.A. - ADR | | | 13,879 | |
| | | | | | | | | |
| | | | | GAS & WATER UTILITIES - 0.6% | | | | |
| | 505 | | | Cia de Saneamento Basico do Estado de Sao Paulo - ADR | | | 7,706 | |
| | 1,441 | | | ENN Energy Holdings Ltd. - ADR | | | 39,095 | |
| | | | | | | | 46,801 | |
| | | | | HOME & OFFICE PRODUCTS - 0.3% | | | | |
| | 1,906 | | | Haier Smart Home Company Ltd. - ADR | | | 25,350 | |
| | | | | | | | | |
| | | | | INSURANCE - 1.7% | | | | |
| | 4,156 | | | BB Seguridade Participacoes S.A. - ADR | | | 22,816 | |
| | 8,929 | | | Ping An Insurance Group Company of China Ltd. - ADR | | | 104,380 | |
| | | | | | | | 127,196 | |
| | | | | INTERNET MEDIA & SERVICES - 6.2% | | | | |
| | 630 | | | Autohome, Inc. - ADR | | | 17,331 | |
| | 8,080 | | | iQIYI, Inc. - ADR(a) | | | 17,453 | |
| | 1,404 | | | Kanzhun Ltd. - ADR | | | 18,954 | |
| | 2,532 | | | KE Holdings, Inc., Institutional Class - ADR | | | 47,728 | |
| | 122 | | | MakeMyTrip Ltd.(a) | | | 13,999 | |
| | 3,378 | | | Meituan - ADR(a) | | | 140,863 | |
| | 2,931 | | | Naspers Ltd., Class N - ADR | | | 133,976 | |
| | 1,294 | | | Trip.com Group Ltd. - ADR(a) | | | 83,657 | |
| | | | | | | | 473,961 | |
See accompanying notes to financial statements.
NATIONAL SECURITY EMERGING MARKETS INDEX ETF
SCHEDULE OF INVESTMENTS (Continued)
November 30, 2024
| Shares | | | | | Fair Value | |
| | | | | COMMON STOCKS — 95.3% (Continued) | | | | |
| | | | | LEISURE FACILITIES & SERVICES - 0.9% | | | | |
| | 1,150 | | | Huazhu Group Ltd. - ADR | | $ | 36,996 | |
| | 582 | | | Yum China Holdings, Inc. | | | 27,092 | |
| | | | | | | | 64,088 | |
| | | | | MACHINERY - 0.4% | | | | |
| | 3,472 | | | WEG S.A. - ADR | | | 31,005 | |
| | | | | | | | | |
| | | | | METALS & MINING - 2.8% | | | | |
| | 2,846 | | | China Shenhua Energy Company Ltd. - ADR | | | 47,130 | |
| | 844 | | | Cia de Minas Buenaventura S.A.A - ADR | | | 10,212 | |
| | 1,951 | | | Gold Fields Ltd. - ADR | | | 28,270 | |
| | 1,835 | | | Harmony Gold Mining Company Ltd. - ADR | | | 16,864 | |
| | 3,594 | | | Impala Platinum Holdings Ltd. - ADR(a) | | | 20,881 | |
| | 3,957 | | | Sibanye Stillwater Ltd. - ADR(a) | | | 16,184 | |
| | 7,681 | | | Vale S.A. - ADR | | | 75,735 | |
| | | | | | | | 215,276 | |
| | | | | OFFICE REIT - 0.1% | | | | |
| | 475 | | | Vesta Real Estate Corporation - ADR | | | 11,447 | |
| | | | | | | | | |
| | | | | OIL & GAS PRODUCERS - 4.7% | | | | |
| | 986 | | | Cosan S.A. - ADR | | | 6,517 | |
| | 1,712 | | | Ecopetrol S.A. - ADR | | | 13,747 | |
| | 6,734 | | | Petroleo Brasileiro S.A. - ADR | | | 96,162 | |
| | 3,578 | | | Reliance Industries Ltd. 144A(b) | | | 215,754 | |
| | 2,235 | | | Ultrapar Participacoes S.A. - ADR | | | 6,593 | |
| | 340 | | | Vista Oil & Gas S.A.B. de C.V. - ADR(a) | | | 18,098 | |
| | | | | | | | 356,871 | |
| | | | | OIL & GAS SERVICES & EQUIPMENT - 0.4% | | | | |
| | 820 | | | Seadrill Ltd.(a) | | | 33,325 | |
| | | | | | | | | |
| | | | | RETAIL - CONSUMER STAPLES - 0.7% | | | | |
| | 2,075 | | | Wal-Mart de Mexico S.A.B. de C.V. - ADR | | | 54,905 | |
See accompanying notes to financial statements.
NATIONAL SECURITY EMERGING MARKETS INDEX ETF
SCHEDULE OF INVESTMENTS (Continued)
November 30, 2024
| Shares | | | | | Fair Value | |
| | | | | COMMON STOCKS — 95.3% (Continued) | | | | |
| | | | | RETAIL - DISCRETIONARY - 0.2% | | | | |
| | 2,112 | | | Localiza Rent a Car S.A. - ADR | | $ | 12,883 | |
| | | | | | | | | |
| | | | | SEMICONDUCTORS - 15.7% | | | | |
| | 16,484 | | | ASE Technology Holding Company Ltd. - ADR | | | 160,224 | |
| | 4,831 | | | Taiwan Semiconductor Manufacturing Company Ltd. - ADR | | | 892,092 | |
| | 20,629 | | | United Microelectronics Corporation - ADR | | | 139,246 | |
| | | | | | | | 1,191,562 | |
| | | | | SPECIALTY FINANCE - 0.7% | | | | |
| | 1,095 | | | 360 DigiTech, Inc. - ADR | | | 41,731 | |
| | 5,158 | | | Lufax Holding Ltd. - ADR | | | 12,637 | |
| | | | | | | | 54,368 | |
| | | | | STEEL - 1.6% | | | | |
| | 5,357 | | | Gerdau S.A. - ADR | | | 18,000 | |
| | 1,990 | | | POSCO - ADR | | | 102,723 | |
| | | | | | | | 120,723 | |
| | | | | TECHNOLOGY HARDWARE - 9.1% | | | | |
| | 215 | | | Credo Technology Group Holding Ltd.(a) | | | 10,526 | |
| | 70 | | | Fabrinet(a) | | | 16,421 | |
| | 16,179 | | | Hon Hai Precision Industry Company Ltd. | | | 195,442 | |
| | 19,228 | | | LG Display Company Ltd. – ADR(a) | | | 64,991 | |
| | 417 | | | Samsung Electronics Company Ltd. | | | 409,077 | |
| | | | | | | | 696,457 | |
| | | | | TECHNOLOGY SERVICES - 2.0% | | | | |
| | 4,383 | | | Infosys Ltd. - ADR | | | 96,733 | |
| | 1,360 | | | Pagseguro Digital Ltd., Class A(a) | | | 9,982 | |
| | 1,189 | | | StoneCompany Ltd.(a) | | | 11,272 | |
| | 4,904 | | | Wipro Ltd. - ADR | | | 34,279 | |
| | | | | | | | 152,266 | |
| | | | | TELECOMMUNICATIONS - 7.0% | | | | |
| | 2,760 | | | America Movil S.A.B. de C.V. - ADR | | | 40,931 | |
| | 4,274 | | | Chunghwa Telecom Company Ltd. - ADR | | | 162,796 | |
| | 5,699 | | | KT Corporation - ADR | | | 103,437 | |
| | 2,198 | | | PLDT, Inc. - ADR | | | 48,774 | |
| | 2,642 | | | SK Telecom Company Ltd. - ADR | | | 63,989 | |
See accompanying notes to financial statements.
NATIONAL SECURITY EMERGING MARKETS INDEX ETF
SCHEDULE OF INVESTMENTS (Continued)
November 30, 2024
| Shares | | | | | Fair Value | |
| | | | COMMON STOCKS — 95.3% (Continued) | | | |
| | | | TELECOMMUNICATIONS - 7.0% (Continued) | | | |
| | 1,199 | | | Telefonica Brasil S.A. - ADR | | $ | 9,844 | |
| | 1,748 | | | Telekomunikasi Indonesia Persero Tbk P.T. - ADR | | | 29,856 | |
| | 527 | | | TIM SA Brazil - ADR | | | 6,798 | |
| | 7,114 | | | Turkcell Iletisim Hizmetleri A/S - ADR | | | 47,166 | |
| | 3,172 | | | Vodacom Group Ltd. - ADR | | | 17,747 | |
| | | | | | | | 531,338 | |
| | | | | TRANSPORTATION & LOGISTICS - 2.5% | | | | |
| | 4,605 | | | Full Truck Alliance Company Ltd. - ADR | | | 46,096 | |
| | 412 | | | Grupo Aeroportuario del Centro Norte S.A.B. del centro norte - ADR | | | 26,875 | |
| | 208 | | | Grupo Aeroportuario del Pacifico S.A.B. de C.V. - ADR | | | 39,100 | |
| | 131 | | | Grupo Aeroportuario del Sureste SAB de CV - ADR | | | 34,078 | |
| | 2,558 | | | ZTO Express Cayman, Inc. - ADR | | | 48,602 | |
| | | | | | | | 194,751 | |
| | | | | WHOLESALE - DISCRETIONARY - 0.2% | | | | |
| | 2,220 | | | Sendas Distribuidora S.A. - ADR(a) | | | 11,677 | |
| | | | | | | | | |
| | | | | TOTAL COMMON STOCKS (Cost $7,101,040) | | | 7,278,331 | |
| | | | | | | | | |
| | | | | TOTAL INVESTMENTS - 95.3% (Cost $7,101,040) | | $ | 7,278,331 | |
| | | | | OTHER ASSETS IN EXCESS OF LIABILITIES - 4.7% | | | 360,243 | |
| | | | | NET ASSETS - 100.0% | | $ | 7,638,574 | |
| ADR | - American Depositary Receipt |
| A/S | - Anonim Sirketi |
| LTD | - Limited Company |
| PT | - Perseroan Terbatas |
| REIT | - Real Estate Investment Trust |
| S/A | - Société Anonyme |
| (a) | Non-income producing security. |
| (b) | Security exempt from registration under Rule 144A or Section 4(2) of the Securities Act of 1933. The security may be resold in transactions exempt from registration, normally to qualified institutional buyers. As of November 30, 2024 the total market value of Rule 144A securities is 215,754 or 2.8% of net assets. |
See accompanying notes to financial statements.
NATIONAL SECURITY EMERGING MARKETS INDEX ETF
STATEMENT OF ASSETS AND LIABILITIES
November 30, 2024
| ASSETS | | | |
| Investment securities: | | | | |
| Securities at Cost | | $ | 7,101,040 | |
| Securities at Value | | $ | 7,278,331 | |
| Cash | | | 355,079 | |
| Dividends and interest receivable | | | 9,982 | |
| TOTAL ASSETS | | | 7,643,392 | |
| | | | | |
| LIABILITIES | | | | |
| Investment advisory fees payable | | | 4,818 | |
| TOTAL LIABILITIES | | | 4,818 | |
| NET ASSETS | | $ | 7,638,574 | |
| | | | | |
| Net Assets Consist of: | | | | |
| Paid in capital | | $ | 7,528,515 | |
| Accumulated earnings | | | 110,059 | |
| NET ASSETS | | $ | 7,638,574 | |
| | | | | |
| Net Asset Value Per Share: | | | | |
| Net Assets | | $ | 7,638,574 | |
| Shares of beneficial interest outstanding (a) | | | 290,000 | |
| Net asset value (Net Assets ÷ Shares Outstanding), offering price and redemption price per share | | $ | 26.34 | |
| (a) | Unlimited number of shares of beneficial interest authorized, no par value. |
See accompanying notes to financial statements.
NATIONAL SECURITY EMERGING MARKETS INDEX ETF
STATEMENT OF OPERATIONS
For the Period Ended November 30, 2024*
| INVESTMENT INCOME | | | | |
| Dividends (net of $36,283 foreign withholding taxes) | | $ | 153,699 | |
| Interest | | | 15,520 | |
| TOTAL INVESTMENT INCOME | | | 169,219 | |
| | | | | |
| EXPENSES | | | | |
| Investment advisory fees | | | 46,369 | |
| | | | | |
| NET INVESTMENT INCOME | | | 122,850 | |
| | | | | |
| REALIZED AND UNREALIZED GAIN (LOSS) ON INVESTMENTS | | | | |
| Net realized loss from: | | | | |
| Investments | | | (69,226 | ) |
| Foreign currency transactions | | | (17 | ) |
| | | | (69,243 | ) |
| Net change in unrealized appreciation on: | | | | |
| Investments | | | 177,291 | |
| | | | | |
| NET REALIZED AND UNREALIZED GAIN ON INVESTMENTS | | | 108,048 | |
| | | | | |
| NET INCREASE IN NET ASSETS RESULTING FROM OPERATIONS | | $ | 230,898 | |
| * | The National Security Emerging Markets Index ETF commenced operations on December 6, 2023. |
See accompanying notes to financial statements.
NATIONAL SECURITY EMERGING MARKETS INDEX ETF
STATEMENT OF CHANGES IN NET ASSETS
| | | For the
Period Ended
November 30,
2024* | |
| FROM OPERATIONS: | | | | |
| Net investment income | | $ | 122,850 | |
| Net realized loss on investment transactions | | | (69,243 | ) |
| Net change in unrealized appreciation (depreciation) on investments | | | 177,291 | |
| Net increase in net assets resulting from operations | | | 230,898 | |
| | | | | |
| DISTRIBUTIONS TO SHAREHOLDERS: | | | | |
| Total distributions paid | | | (120,839 | ) |
| | | | | |
| FROM SHARES OF BENEFICIAL INTEREST: | | | | |
| Proceeds from shares sold | | | 7,521,515 | |
| Transaction Fees (Note 5) | | | 7,000 | |
| Net increase in net assets from shares of beneficial interest | | | 7,528,515 | |
| | | | | |
| TOTAL INCREASE IN NET ASSETS | | | 7,638,574 | |
| | | | | |
| NET ASSETS: | | | | |
| Beginning of Period | | | - | |
| End of Period | | $ | 7,638,574 | |
| | | | | |
| SHARE ACTIVITY | | | | |
| Shares Sold | | | 290,000 | |
| Net increase in shares of beneficial interest outstanding | | | 290,000 | |
| * | The National Security Emerging Markets Index ETF commenced operations on December 6, 2023. |
See accompanying notes to financial statements.
NATIONAL SECURITY EMERGING MARKETS INDEX ETF
FINANCIAL HIGHLIGHTS
Per Share Data and Ratios for a Share of Beneficial Interest Outstanding Throughout the Period Presented
| | | For the
Period Ended
November 30,
2024* | |
| Net asset value, beginning of period | | $ | 25.00 | |
| | | | | |
| Activity from investment operations: | | | | |
| Net investment income (1) | | | 0.52 | |
| Net realized and unrealized gain on investments | | | 1.31 | |
| Total from investment operations | | | 1.83 | |
| | | | | |
| Less distributions from: | | | | |
| Net investment income | | | (0.49 | ) |
| | | | | |
| Net asset value, end of period | | $ | 26.34 | |
| | | | | |
| Market price, end of period | | $ | 26.35 | |
| | | | | |
| Total return (2) | | | 7.30 | %(3) |
| | | | | |
| Net assets, end of period (000s) | | $ | 7,639 | |
| | | | | |
| Ratio of gross expenses to average net assets | | | 0.75 | %(4) |
| Ratio of net expenses to average net assets | | | 0.75 | %(4) |
| Ratio of net investment income to average net assets | | | 1.98 | %(4) |
| Portfolio Turnover Rate (5) | | | 42 | %(3) |
| * | The National Security Emerging Markets ETF commenced operations on December 6, 2023. |
| (1) | Per share amounts calculated using the average shares method, which more appropriately presents the per share data for the period. |
| (2) | Total returns are historical in nature and assume changes in share price, reinvestment of all dividends and distributions, if any. |
| (3) | Not annualized. |
| (4) | Annualized. |
| (5) | Portfolio turnover rate excludes portfolio securities received or delivered as a result of processing capital share transactions in Creation Units. (Note 5) |
See accompanying notes to financial statements.
NATIONAL SECURITY EMERGING MARKETS INDEX ETF
NOTES TO FINANCIAL STATEMENTS
November 30, 2024
The National Security Emerging Markets Index ETF (the “Fund”) is a diversified series of Northern Lights Fund Trust IV (the “Trust”), a trust organized under the laws of the State of Delaware on June 2, 2015, and registered under the Investment Company Act of 1940, as amended (the “1940 Act”), as an open-end management investment company. The Fund seeks to track the results, before fees and expenses, of the Alerian National Security Emerging Markets Index (the “Index”). The Fund invests at least 80% of its total assets in component securities of the Index. The Index consists of stocks listed on globally recognized stock exchanges that excludes companies benefiting end-users that, in the view of the sponsor of the Fund, National Security Index, LLC (the “Sponsor”) pose a threat to the national security interests of the United States. The Fund commenced operations on December 6, 2023.
| 2. | SIGNIFICANT ACCOUNTING POLICIES |
The following is a summary of significant accounting policies followed by the Fund in preparation of their financial statements. These policies are in conformity with generally accepted accounting principles in the United States of America (“GAAP”). The preparation of financial statements requires management to make estimates and assumptions that affect the reported amounts of assets and liabilities and disclosure of contingent assets and liabilities at the date of the financial statements and the reported amounts of income and expenses for the year. Actual results could differ from those estimates. The Fund follows the specialized accounting and reporting requirements under GAAP that are applicable to investment companies. The Fund is an investment company and accordingly follows the investment company accounting and reporting guidance of the Financial Accounting Standards Board (“FASB”) Accounting Standards Codification Topic 946 “Financial Services – Investment Companies”, including Accounting Standards Update 2013-08.
Security Valuation – The Fund records its investments at fair value. Securities listed on an exchange are valued at the last reported sale price at the close of the regular trading session of the exchange on the business day the value is being determined, or in the case of securities listed on NASDAQ at the NASDAQ Official Closing Price. In the absence of a sale, such securities shall be valued at the mean between the current bid and ask prices on the day of valuation. Short-term debt obligations having 60 days or less remaining until maturity, at time of purchase, may be valued at amortized cost which approximates fair value. Debt securities (other than short-term obligations) are valued each day by an independent pricing service approved by the Board of Trustees (the “Board”) based on methods which include consideration of yields or prices of securities of comparable quality, coupon, maturity and type, indications as to values from dealers, and general market conditions or market quotations from a major market maker in the securities. Securities traded on a foreign exchange which has not closed by the valuation time or for which the official closing prices are not available at the time the net asset value per share (“NAV”) is determined may use alternative market prices provided by a pricing service.
The Fund may invest in portfolios of open-end or closed-end investment companies (the “Underlying Funds”). Mutual funds are valued at their respective NAV as reported by such investment companies. Exchange-traded funds (“ETFs”) are valued at the last reported sale price or official closing price. Mutual funds value securities in their portfolios for which market quotations are readily available at their market values (generally the last reported sale price) and all other securities and assets at their fair value to the methods established by the board of directors of the open-end funds. The shares of many closed-end investment companies and ETFs, after their initial public offering, frequently trade at a price per share, which is different than the NAV. The difference represents a market premium or market discount of such shares. There can be no assurances that the market discount or market premium on shares of any closed-end investment company or ETF purchased by the Fund will not change.
NATIONAL SECURITY EMERGING MARKETS INDEX ETF
NOTES TO FINANCIAL STATEMENTS (Continued)
November 30, 2024
The Fund may hold investments, such as private investments, interests in commodity pools, other non-traded securities or temporarily illiquid securities, for which market quotations are not readily available or are determined to be unreliable. These securities are valued using the “fair value” procedures approved by the Board. The Board has designated the adviser as its valuation designee (the “Valuation Designee”) to execute these procedures. The Board may also enlist third-party consultants such a valuation specialist at a public accounting firm, valuation consultant or financial officer of a security issuer on an as-needed basis to assist the Valuation Designee in determining a security-specific fair value. The Board is responsible for reviewing and approving fair value methodologies utilized by the Valuation Designee, approval of which shall be based upon whether the Valuation Designee followed the valuation procedures established by the Board.
Fair Valuation Process – Applicable investments are valued by the Valuation Designee pursuant to valuation procedures established by the Board. For example, fair value determinations are required for the following securities: (i) securities for which market quotations are insufficient or not readily available on a particular business day (including securities for which there is a short and temporary lapse in the provision of a price by the regular pricing source); (ii) securities for which, in the judgment of the Valuation Designee, the prices or values available do not represent the fair value of the instrument; factors which may cause the Valuation Designee to make such a judgment include, but are not limited to, the following: only a bid price or an asked price is available; the spread between bid and asked prices is substantial; the frequency of sales; the thinness of the market; the size of reported trades; and actions of the securities markets, such as the suspension or limitation of trading; (iii) securities determined to be illiquid; and (iv) securities with respect to which an event that affects the value thereof has occurred (a “significant event”) since the closing prices were established on the principal exchange on which they are traded, but prior to the Fund’s calculation of its net asset value. Specifically, interests in commodity pools or managed futures pools are valued on a daily basis by reference to the closing market prices of each futures contract or other asset held by a pool, as adjusted for pool expenses. Restricted or illiquid investments, such as private investments or non-traded securities are valued based upon the current bid for the security from two or more independent dealers or other parties reasonably familiar with the facts and circumstances of the security (who should take into consideration all relevant factors as may be appropriate under the circumstances). If a current bid from such independent dealers or other independent parties is unavailable, the Valuation Designee shall determine the fair value of such security using the following factors: (i) the type of security; (ii) the cost at date of purchase; (iii) the size and nature of the Fund’s holdings; (iv) the discount from market value of unrestricted securities of the same class at the time of purchase and subsequent thereto; (v) information as to any transactions or offers with respect to the security; (vi) the nature and duration of restrictions on disposition of the security and the existence of any registration rights; (vii) how the yield of the security compares to similar securities of companies of similar or equal creditworthiness; (viii) the level of recent trades of similar or comparable securities; (ix) the liquidity characteristics of the security; (x) current market conditions; and (xi) the market value of any securities into which the security is convertible or exchangeable.
The Fund utilizes various methods to measure the fair value of its investments on a recurring basis. GAAP establishes a hierarchy that prioritizes inputs to valuation methods. The three levels of input are:
Level 1 – Unadjusted quoted prices in active markets for identical assets and liabilities that the Fund has the ability to access.
Level 2 – Observable inputs other than quoted prices included in Level 1 that are observable for the asset or liability, either directly or indirectly. These inputs may include quoted prices for the identical instrument in an inactive market, prices for similar instruments, interest rates, prepayment speeds, credit risk, yield curves, default rates and similar data.
Level 3 – Unobservable inputs for the asset or liability, to the extent relevant observable inputs are not available, representing the Fund’s own assumptions about the assumptions a market participant would use in valuing the asset or liability, and would be based on the best information available.
NATIONAL SECURITY EMERGING MARKETS INDEX ETF
NOTES TO FINANCIAL STATEMENTS (Continued)
November 30, 2024
The availability of observable inputs can vary from security to security and is affected by a wide variety of factors, including, for example, the type of security, whether the security is new and not yet established in the marketplace, the liquidity of markets, and other characteristics particular to the security. To the extent that valuation is based on models or inputs that are less observable or unobservable in the market, the determination of fair value requires more judgment. Accordingly, the degree of judgment exercised in determining fair value is greatest for instruments categorized in Level 3.
The inputs used to measure fair value may fall into different levels of the fair value hierarchy. In such cases, for disclosure purposes, the level in the fair value hierarchy within which the fair value measurement falls in its entirety, is determined based on the lowest level input that is significant to the fair value measurement in its entirety.
The inputs or methodology used for valuing securities are not necessarily an indication of the risk associated with investing in those securities. The following tables summarize the inputs used as of November 30, 2024 for the Fund’s investments measured at fair value:
| Assets * | | Level 1 | | | Level 2 | | | Level 3 | | | Total | |
| Common Stocks | | $ | 7,278,331 | | | $ | - | | | $ | - | | | $ | 7,278,331 | |
| Total | | $ | 7,278,331 | | | $ | - | | | $ | - | | | $ | 7,278,331 | |
The Fund did not hold any Level 2 or 3 securities during the period.
| * | Please refer to the Schedule of Investments for industry classifications. |
Security Transactions and Related Income – Security transactions are accounted for on the trade date. Interest income is recognized on an accrual basis. Discounts are accreted and premiums are amortized on securities purchased over the lives of the respective securities using effective yield method. Dividend income is recorded on the ex-dividend date. Realized gains or losses from sales of securities are determined by comparing the identified cost of the security lot sold with the net sales proceeds.
Dividends and Distributions to Shareholders – Dividends from net investment income, if any, are declared and paid at least semi-annually for the Fund. Distributable net realized capital gains, if any, are declared and distributed annually for the Fund. Dividends from net investment income and distributions from net realized gains are determined in accordance with federal income tax regulations, which may differ from GAAP and are recorded on the ex-dividend date. These “book/tax” differences are considered either temporary (e.g., deferred losses, capital loss carryforwards, etc.) or permanent in nature. To the extent these differences are permanent in nature, such amounts are reclassified within the composition of net assets based on their federal tax-basis treatment; temporary differences do not require reclassification. Any such reclassifications will have no effect on net assets, results of operations, or NAV per share of the Fund.
Federal Income Tax – The Fund complies with the requirements of the Internal Revenue Code applicable to regulated investment companies and intends to distribute all of its taxable income to shareholders. Therefore, no provision for federal income tax is required.
The Fund recognizes the tax benefits of uncertain tax positions only where the position is “more likely than not” to be sustained assuming examination by tax authorities. Management has analyzed the Fund’s tax positions and has concluded that no liability for unrecognized tax benefits should be recorded related to uncertain tax positions taken on returns to be filed for the open tax year ended November 30, 2024. The Fund identifies its major tax jurisdictions as U.S. federal, Ohio and foreign jurisdictions where the Fund makes significant investments. The Fund recognizes interest and penalties, if any, related to unrecognized tax benefits as income tax expenses in the Statement of Operations. During the period ended November 30, 2024, the Fund did not incur any interest or penalties. The Fund is not aware of any tax positions for which there is a reasonable possibility that the total amounts of unrecognized tax benefits will change materially in the next twelve months.
NATIONAL SECURITY EMERGING MARKETS INDEX ETF
NOTES TO FINANCIAL STATEMENTS (Continued)
November 30, 2024
Expenses – Expenses of the Trust that are directly identifiable to a specific fund are charged to that fund. Expenses which are not readily identifiable to a specific fund, are allocated in such a manner as deemed equitable, taking into consideration the nature and type of expense and the relative sizes of the fund in the Trust.
Indemnification – The Trust indemnifies its officers and trustees for certain liabilities that may arise from the performance of their duties to the Trust. Additionally, in the normal course of business, the Fund enters into contracts that contain a variety of representations and warranties and which provide general indemnities. The Fund’s maximum exposure under these arrangements is unknown, as this would involve future claims that may be made against the Fund that have not yet occurred. However, based on experience, the risk of loss due to these warranties and indemnities appears to be remote.
PRINCIPAL INVESTMENT RISKS:
Currency Exchange Rate Risk – To the extent the Fund invests in securities denominated in non-U.S. currencies, changes in currency exchange rates and the relative value of non-U.S. currencies will affect the value of the Fund’s investment and the value of your shares. Because the Fund’s net asset value is determined in U.S. dollars, the Fund’s NAV could decline if the currency of the non-U.S. market in which the Fund invests depreciates against the U.S. dollar, even if the value of the Fund’s holdings, measured in the foreign currency, increases. Currency exchange rates can be very volatile and can change quickly and unpredictably. As a result, the value of an investment in the Fund may change quickly and without warning and you may lose money.
Emerging Markets Risk – The Fund may invest in countries with newly organized or less developed securities markets. There are typically greater risks involved in investing in emerging markets securities. Generally, economic structures in these countries are less diverse and mature than those in developed countries and their political systems tend to be less stable. Emerging market economies may be based on only a few industries, therefore security issuers, including governments, may be more susceptible to economic weakness and more likely to default. Emerging market countries also may have relatively unstable governments, weaker economies, and less-developed legal systems with fewer security holder rights. Investments in emerging markets countries may be affected by government policies that restrict foreign investment in certain issuers or industries. The potentially smaller size of their securities markets and lower trading volumes can make investments relatively illiquid and potentially more volatile than investments in developed countries, and such securities may be subject to abrupt and severe price declines. Due to this relative lack of liquidity, the Fund may have to accept a lower price or may not be able to sell a portfolio security at all. An inability to sell a portfolio position can adversely affect the Fund’s value or prevent the Fund from being able to meet cash obligations or take advantage of other investment opportunities.
| 3. | INVESTMENT TRANSACTIONS |
For the period ended November 30, 2024, cost of purchases and proceeds from sales of portfolio securities, other than in-kind transactions, short-term investments and U.S. government securities, amounted to the following:
| Fund | | Purchases | | | Sales | |
| National Security Emerging Markets Index ETF | | $ | 3,316,864 | | | $ | 2,524,518 | |
For the period ended November 30, 2024, cost of purchases and proceeds from sales of portfolio securities for in-kind transactions, amounted to the following:
| Fund | | Purchases | | | Sales | |
| National Security Emerging Markets Index ETF | | $ | 6,377,921 | | | $ | - | |
NATIONAL SECURITY EMERGING MARKETS INDEX ETF
NOTES TO FINANCIAL STATEMENTS (Continued)
November 30, 2024
| 4. | INVESTMENT ADVISORY AGREEMENT AND TRANSACTIONS WITH RELATED PARTIES |
Tuttle Capital Management, LLC, is the investment adviser for the Fund (the “Adviser”). Pursuant to an investment advisory agreement with the Trust, on behalf of the Fund, the Adviser, under the oversight of the Board, oversees the daily operations of the Fund, manages the Fund’s portfolio and supervises the performance of administrative and professional services provided by others. As compensation for its services and the related expenses borne by the Adviser, the Fund pays the Adviser a management fee, computed and accrued daily and paid monthly, at an annual rate of 0.75% of the Fund’s average daily net assets for the Fund. For the period ended November 30, 2024, the Fund incurred $46,369 in advisory fees.
Northern Lights Distributors, LLC (the “Distributor”) serves as the principal underwriter and national distributor for the shares of the Fund. The Fund has adopted a distribution and service plan (“Plan”) pursuant to Rule 12b-1 under the 1940 Act. Under the Plan, the Fund is authorized to pay distribution fees to the distributor and other firms that provide distribution and shareholder services (“Service Providers”). If a Service Provider provides these services, the Fund may pay fees at an annual rate not to exceed 0.25% of average daily net assets, pursuant to Rule 12b-1 under the 1940 Act.
No distribution or service fees are currently paid by the Fund and will not be paid by the Fund unless authorized by the Board.
The Adviser’s unitary management fee is designed to pay the Fund’s expenses and to compensate the Adviser for providing services for the Fund. Out of the unitary management fee, the Adviser pays substantially all expenses of the Fund, including the costs of transfer agency, custody, fund administration, legal, audit and other services and independent Trustees’ fees, but not any front-end or contingent deferred loads; brokerage fees and commissions; any Rule 12b-l fees; acquired fund fees and expenses; fees and expenses associated with investments in other collective investment vehicles or derivative instruments (including, for example, option and swap fees and expenses); borrowing costs (such as interest and dividend expense on securities sold short); taxes; and extraordinary expenses, such as litigation expenses (which may include indemnification of Fund officers and Trustees, contractual indemnification of Fund service providers (other than the Adviser)). The Adviser, and not the Fund’s shareholders, would benefit from any reduction in fees paid for third-party services, including reductions based on increases in net assets.
Ultimus Fund Services, LLC (“UFS”) – UFS, an affiliate of the Distributor, provides administration and fund accounting services to the Trust. Pursuant to separate servicing agreements with UFS, the Adviser pays UFS customary fees for providing administration and fund accounting services to the Fund. Certain officers of the Trust are also officers of UFS, and are not paid any fees directly by the Fund for serving in such capacities.
Northern Lights Compliance Services, LLC (“NLCS”) – NLCS, an affiliate of UFS and the Distributor, provides a Chief Compliance Officer to the Trust, as well as related compliance services, pursuant to a consulting agreement between NLCS and the Trust. Under the terms of such agreement, NLCS receives customary fees from the Adviser.
Blu Giant, LLC (“Blu Giant”) – Blu Giant, an affiliate of UFS and the Distributor, provides EDGAR conversion and filing services as well as print management services for the Fund on an ad-hoc basis. For the provision of these services, Blu Giant receives customary fees from the Adviser.
For the period ended November 30, 2024, the Trustees received fees in the aggregate amount of $10,637, paid by the Adviser.
NATIONAL SECURITY EMERGING MARKETS INDEX ETF
NOTES TO FINANCIAL STATEMENTS (Continued)
November 30, 2024
| 5. | CAPITAL SHARE TRANSACTIONS |
Shares are not individually redeemable and may be redeemed by the Fund at NAV only in large blocks known as “Creation Units.” Shares are created and redeemed by the Fund only in Creation Unit size aggregations of 10,000 shares. Only Authorized Participants or transactions done through an Authorized Participant are permitted to purchase or redeem Creation Units from the Fund. An Authorized Participant is either (i) a broker-dealer or other participant in the clearing process through the Continuous Net Settlement System of the National Securities Clearing Corporation or (ii) a DTC participant and, in each case, must have executed a Participant Agreement with the Distributor. Such transactions are generally permitted on an in-kind basis, with a balancing cash component to equate the transaction to the NAV per share of the Fund on the transaction date. Cash may be substituted equivalent to the value of certain securities generally when they are not available in sufficient quantity for delivery, not eligible for trading by the Authorized Participant or as a result of other market circumstances. In addition, the Fund generally imposes transaction fees on purchases and redemptions of the Fund’s shares to cover the custodial and other costs incurred by the Fund in effecting trades, which is payable to the custodian (“Fixed Fee”). Purchases and redemptions of Creation Units for cash or involving cash-in-lieu are required to pay an additional variable charge to compensate the Fund and their ongoing shareholders for brokerage and market impact expenses relating to Creation Unit transactions (“Variable Charge,” and together with the Fixed Fee, the “Transaction Fees”). Transactions in capital shares for the Fund are disclosed in the Statements of Changes in Net Assets.
The Transaction Fees for the Fund are listed in the table below:
| Fee for In-Kind and Cash Purchases | Maximum Additional Variable
Charge for Cash Purchases* |
| $500 | 2.00% |
| * | As a percentage of the amount invested. |
| 6. | AGGREGATE UNREALIZED APPRECIATION AND DEPRECIATION - TAX BASIS |
At November 30, 2024, the aggregate cost for federal tax purposes, which differs from fair value by net unrealized appreciation (depreciation) of securities, is as follows:
| | | | Gross
Unrealized | | | Gross
Unrealized | | | Net Unrealized
Appreciation/ | |
| Tax Cost | | | Appreciation | | | Depreciation | | | Depreciation | |
| $ | 7,171,087 | | | $ | 939,078 | | | $ | (831,834 | ) | | $ | 107,244 | |
| 7. | DISTRIBUTIONS TO SHAREHOLDERS AND TAX COMPONENTS OF CAPITAL |
The tax character of distributions paid for the period ended November 30, 2024, was as follows:
| | | Fiscal Year Ended | |
| | | November 30,
2024 | |
| Ordinary Income | | $ | 120,839 | |
| Long-Term Capital Gain | | | - | |
| Return of Capital | | | - | |
| | | $ | 120,839 | |
As of November 30, 2024, the components of accumulated earnings/(deficit) on a tax basis were as follows:
NATIONAL SECURITY EMERGING MARKETS INDEX ETF
NOTES TO FINANCIAL STATEMENTS (Continued)
November 30, 2024
Undistributed
Ordinary
Income | | | Undistributed
Long-Term
Gains | | | Post October
Loss and
Late Year Loss | | | Capital Loss
Carry
Forwards | | | Other
Book/Tax
Differences | | | Unrealized
Appreciation/
(Depreciation) | | | Total
Distributable Earnings/
(Accumulated Deficit) | |
| $ | 87,699 | | | $ | - | | | $ | (1,620 | ) | | $ | (83,264 | ) | | $ | - | | | $ | 107,244 | | | $ | 110,059 | |
The difference between book basis and tax basis unrealized appreciation (depreciation) and accumulated net realized gains (losses) from investments is primarily attributable to the tax deferral of losses on wash sales. In addition, the amount listed under other book/tax differences for the Fund is primarily the mark to market on passive foreign investment companies.
Capital losses incurred after October 31 within the fiscal year are deemed to arise on the first business day of the following fiscal year for tax purposes. The Fund incurred and elected to defer such capital losses of $1,620.
Subsequent events after the date of the Statements of Assets and Liabilities have been evaluated through the date the financial statements were issued. Management has determined that no events or transactions occurred requiring adjustment or disclosure in the financial statements.

REPORT OF INDEPENDENT REGISTERED PUBLIC ACCOUNTING FIRM
To the Shareholders of National Security Emerging Markets Index ETF and
Board of Trustees of Northern Lights Fund Trust IV
Opinion on the Financial Statements
We have audited the accompanying statement of assets and liabilities, including the schedule of investments, of National Security Emerging Markets Index ETF (the “Fund”), a series of Northern Lights Fund Trust IV, as of November 30, 2024, the related statement of operations, statement of changes in net assets, and the financial highlights for the period December 6, 2023 (commencement of operations) through November 30, 2024, and the related notes (collectively referred to as the “financial statements”). In our opinion, the financial statements present fairly, in all material respects, the financial position of the Fund as of November 30, 2024, the results of its operations, the changes in net assets, and the financial highlights for the period December 6, 2023 (commencement of operations) through November 30, 2024, in conformity with accounting principles generally accepted in the United States of America.
Basis for Opinion
These financial statements are the responsibility of the Fund’s management. Our responsibility is to express an opinion on the Fund’s financial statements based on our audit. We are a public accounting firm registered with the Public Company Accounting Oversight Board (United States) (“PCAOB”) and are required to be independent with respect to the Fund in accordance with the U.S. federal securities laws and the applicable rules and regulations of the Securities and Exchange Commission and the PCAOB.
We conducted our audit in accordance with the standards of the PCAOB. Those standards require that we plan and perform the audit to obtain reasonable assurance about whether the financial statements are free of material misstatement whether due to error or fraud.
Our audit included performing procedures to assess the risks of material misstatement of the financial statements, whether due to error or fraud, and performing procedures that respond to those risks. Such procedures included examining, on a test basis, evidence regarding the amounts and disclosures in the financial statements. Our procedures included confirmation of securities owned as of November 30, 2024, by correspondence with the custodian and brokers; when replies were not received from brokers, we performed other auditing procedures. Our audit also included evaluating the accounting principles used and significant estimates made by management, as well as evaluating the overall presentation of the financial statements. We believe that our audit provides a reasonable basis for our opinion.
We have served as the auditor of one or more investment companies advised by Tuttle Capital Management, LLC since 2018.

COHEN & COMPANY, LTD.
Philadelphia, Pennsylvania
January 29, 2025

NATIONAL SECURITY EMERGING MARKETS INDEX ETF
ADDITIONAL INFORMATION
November 30, 2024
Changes in and Disagreements with Accountants
There were no changes in or disagreements with accountants during the period covered by this report.
Proxy Disclosures
Not applicable.
Remuneration Paid to Directors, Officers and Others
Refer to the financial statements included herein.
Statement Regarding Basis for Approval of Investment Advisory Agreement
Not applicable.
Proxy Voting Policy
Information regarding how the Funds vote proxies relating to portfolio securities for the 12 month period ended June 30th as well as a description of the policies and procedures that the Funds used to determine how to vote proxies is available without charge, upon request, by calling 833-906-5569 or by referring to the Securities and Exchange Commission’s (“SEC”) website at http://www.sec.gov.
Item 8. Changes in and Disagreements with Accountants for Open-End Management Investment Companies.
Not applicable
Item 9. Proxy Disclosures for Open-End Management Investment Companies.
Not applicable
Item 10. Remuneration Paid to Directors, Officers, and Others of Open-End Management Investment Companies.
Included under Item 7
Item 11. Statement Regarding Basis for Approval of Investment Advisory Contract.
Included under Item 7
Item 12. Disclosure of Proxy Voting Policies and Procedures for Closed-End Management Investment Companies.
Not applicable
Item 13. Portfolio Managers of Closed-End Management Investment Companies.
Not applicable
Item 14. Purchases of Equity Securities by Closed-End Management Investment Company and Affiliated Purchasers.
Not applicable
Item 15. Submission of Matters to a Vote of Security Holders.
None
Item 16. Controls and Procedures
| (a) | The registrant’s Principal Executive Officer and Principal Financial Officer have concluded that the registrant’s disclosure controls and procedures (as defined in Rule 30a-3(c) under the Act) are effective in design and operation and are sufficient to form the basis of the certifications required by Rule 30a-(2) under the Act, based on their evaluation of these disclosure controls and procedures as of a date within 90 days of this report on Form N-CSR. |
| (b) | There were no changes in the registrant’s internal control over financial reporting (as defined in Rule 30a-3(d) under the Act) during the period covered by this report that have materially affected, or are reasonably likely to materially affect, the registrant’s internal control over financial reporting. |
Item 17. Disclosure of Securities Lending Activities for Closed-End Management Investment Companies.
Not applicable
Item 18. Recovery of Erroneously Awarded Compensation.
Item 19. Exhibits.
| (a)(3) | A separate certification for each principal executive officer and principal financial officer of the registrant as required by Rule 30a-2(a) under the Act (17 CFR 270.30a-2(a)): Attached hereto. |
| (b) | Certifications required by Rule 30a-2(b) under the Act (17 CFR 270.30a-2(b)): Attached hereto. |
SIGNATURES
Pursuant to the requirements of the Securities Exchange Act of 1934 and the Investment Company Act of 1940, the registrant has duly caused this report to be signed on its behalf by the undersigned, thereunto duly authorized.
| Northern Lights Fund Trust IV | |
| By | /s/ Wendy Wang | |
| | Wendy Wang
Principal Executive Officer | |
Pursuant to the requirements of the Securities Exchange Act of 1934 and the Investment Company Act of 1940, this report has been signed below by the following persons on behalf of the registrant and in the capacities and on the dates indicated.
| By | /s/ Wendy Wang | |
| | Wendy Wang
Principal Executive Officer | |
| By | /s/ Sam Singh | |
| | Sam Singh
Principal Financial Officer | |