united states
securities and exchange commission
washington, d.c. 20549
form n-csr
certified shareholder report of registered
management investment companies
| Investment Company Act file number | 811-23066 | |
Northern Lights Fund Trust IV
(Exact name of registrant as specified in charter)
| 225 Pictoria Drive, Suite 450 Cincinnati, OH | | 45246 |
| (Address of principal executive offices) | | (Zip code) |
The Corporation Trust Company
1209 Orange Street Wilmington, DE 19801
(Name and address of agent for service)
| Registrant’s telephone number, including area code: | (631) 490-4300 | |
| Date of fiscal year end: | 11/30 | |
| | | |
| Date of reporting period: | 11/30/2024 | |
Item 1. Reports to Stockholders.
Moerus Worldwide Value Fund
Annual Shareholder Report - November 30, 2024
This annual shareholder report contains important information about Moerus Worldwide Value Fund for the period of December 1, 2023 to November 30, 2024. You can find additional information about the Fund at www.moeruscap.com/regulatory-resources/. You can also request this information by contacting us at 1-844-663-7871.
What were the Fund’s costs for the last year?
(based on a hypothetical $10,000 investment)
| Class Name | Costs of a $10,000 investment | Costs paid as a percentage of a $10,000 investment |
|---|
| Class N | $170 | 1.50% |
|---|
How did the Fund perform during the reporting period?
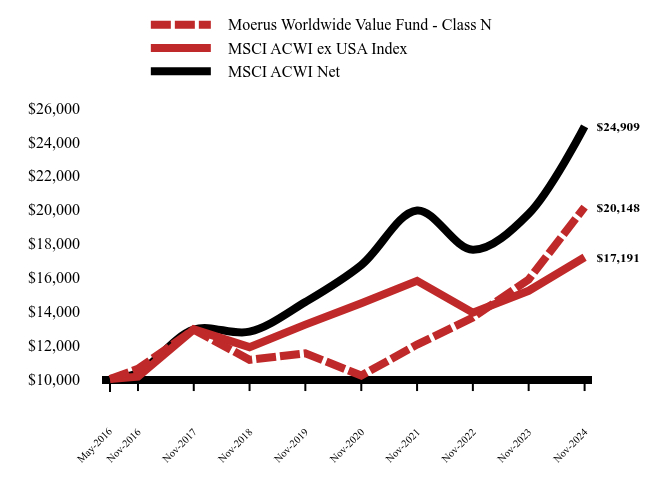
The Moerus Worldwide Value Fund (“the Fund”) returned +26.88 (net of fees) for the Class N share class, during the twelve months ended November 30, 2024. By comparison, the MSCI All Country World ex USA Index (“MSCI ACWI ex USA”) returned +13.03% (net), while the MSCI All Country World Index (“MSCI ACWI”) returned +26.12% (net) over the same period. In relative terms, U.S. equities generally outperformed international (as evidenced by the MSCI ACWI outperforming the MSCI ACWI ex USA) and the MSCI ACWI Growth Index (+28.98%) outperformed the MSCI ACWI Value Index (+23.18%), driven by large-cap U.S. Technology stocks. Yet despite the above market factors and conditions, which are generally not supportive of the relative performance of the Fund’s strategy, the Fund outperformed the MSCI ACWI and significantly outperformed the MSCI ACWI ex USA during the period. The Fund’s value-conscious, opportunistic, and flexible approach typically results in a portfolio of bottom-up investments that tends to have high active share and low overlap with broader market indices. During the twelve months ended November 30, 2024, the Fund’s strong absolute performance and meaningful relative outperformance was driven by significant individual contributors to performance that included (in order of magnitude): Argentine bank Grupo Financiero Galicia S.A.; online travel agency Despegar.com Corp.; financial services provider Jefferies Financial Group Inc.; Argentine bank Banco Macro S.A.; and residential brokerage company Douglas Elliman, Inc. On the negative side, the most significant detractors from the Fund’s absolute performance during the period included: engineering and consulting services provider John Wood Group PLC; grocery retailer Companhia Brasileira de Distribuição; beauty products retailer Natura & Co. Holding S.A.; Latin American McDonald’s franchisee Arcos Dorados Holdings, Inc.; and Indian bank IDFC First Bank Limited.
How has the Fund performed since inception?
Total Return Based on $10,000 Investment
| Moerus Worldwide Value Fund - Class N | MSCI ACWI ex USA Index | MSCI ACWI Net |
|---|
| May-2016 | $10,000 | $10,000 | $10,000 |
|---|
| Nov-2016 | $10,600 | $10,136 | $10,367 |
|---|
| Nov-2017 | $12,913 | $12,933 | $12,921 |
|---|
| Nov-2018 | $11,132 | $11,883 | $12,795 |
|---|
| Nov-2019 | $11,521 | $13,214 | $14,545 |
|---|
| Nov-2020 | $10,206 | $14,472 | $16,727 |
|---|
| Nov-2021 | $12,032 | $15,795 | $19,951 |
|---|
| Nov-2022 | $13,631 | $13,920 | $17,633 |
|---|
| Nov-2023 | $15,879 | $15,209 | $19,751 |
|---|
| Nov-2024 | $20,148 | $17,191 | $24,909 |
|---|
Average Annual Total Returns
| 1 Year | 5 Years | Since Inception (May 31, 2016) |
|---|
| Moerus Worldwide Value Fund - Class N | 26.88% | 11.83% | 8.59% |
|---|
| MSCI ACWI ex USA Index | 13.03% | 5.40% | 6.58% |
|---|
| MSCI ACWI Net | 26.12% | 11.36% | 11.33% |
|---|
The Fund's past performance is not a good predictor of how the Fund will perform in the future. The graph and table do not reflect the deduction of taxes that a shareholder would pay on fund distributions or redemption of fund shares.
What did the Fund invest in?
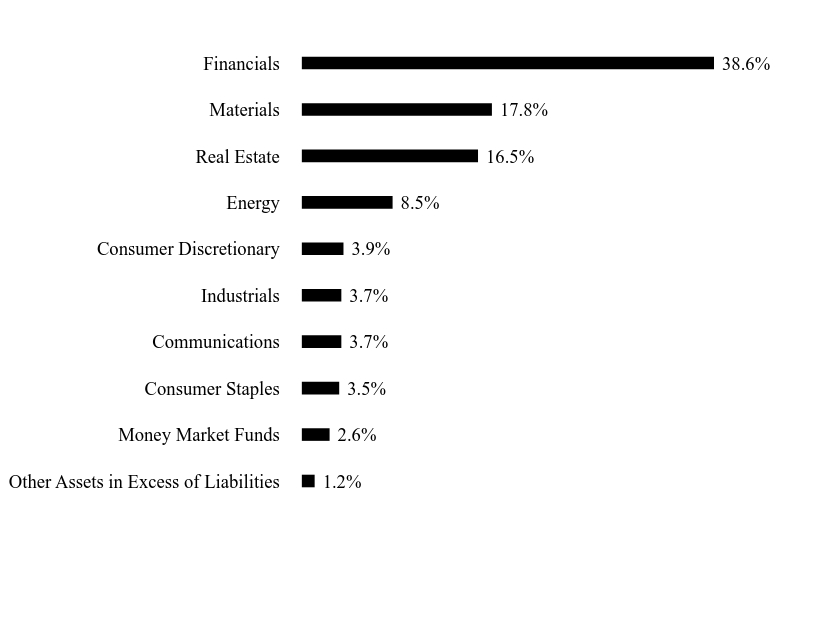
Sector Weighting (% of net assets)
| Value | Value |
|---|
| Other Assets in Excess of Liabilities | 1.2% |
| Money Market Funds | 2.6% |
| Consumer Staples | 3.5% |
| Communications | 3.7% |
| Industrials | 3.7% |
| Consumer Discretionary | 3.9% |
| Energy | 8.5% |
| Real Estate | 16.5% |
| Materials | 17.8% |
| Financials | 38.6% |
- Net Assets$87,027,057
- Number of Portfolio Holdings39
- Advisory Fee (net of waivers)$501,359
- Portfolio Turnover46%
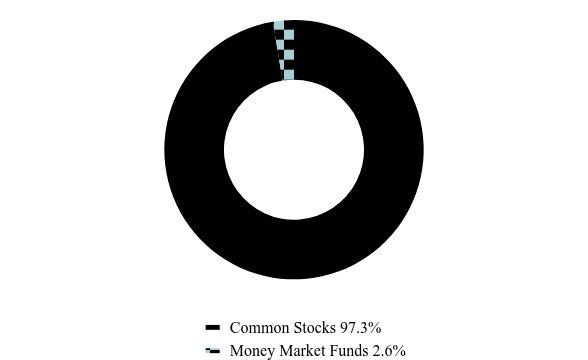
Asset Weighting (% of total investments)
| Value | Value |
|---|
| Common Stocks | 97.3% |
| Money Market Funds | 2.6% |
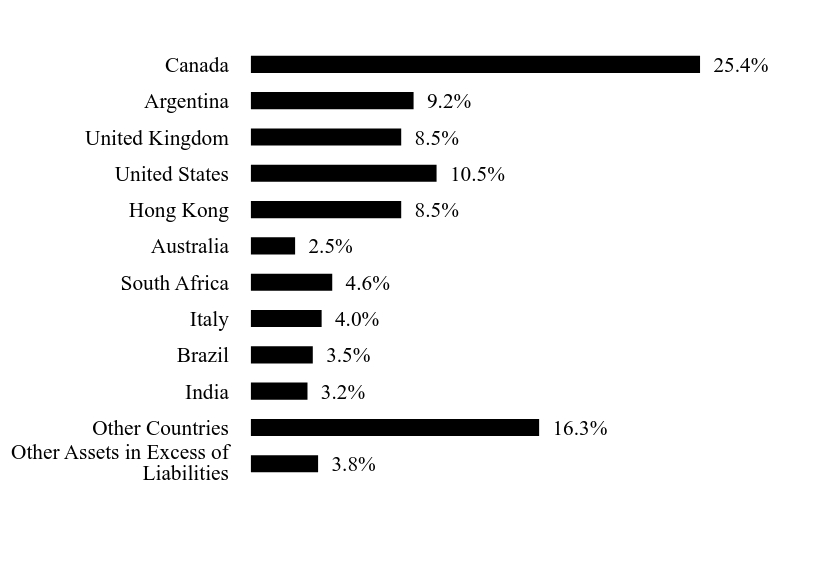
Country Weighting (% of net assets)
| Value | Value |
|---|
| Other Assets in Excess of Liabilities | 3.8% |
| Other Countries | 16.3% |
| India | 3.2% |
| Brazil | 3.5% |
| Italy | 4.0% |
| South Africa | 4.6% |
| Australia | 2.5% |
| Hong Kong | 8.5% |
| United States | 10.5% |
| United Kingdom | 8.5% |
| Argentina | 9.2% |
| Canada | 25.4% |
Top 10 Holdings (% of net assets)
| Holding Name | % of Net Assets |
| Jefferies Financial Group, Inc. | 4.1% |
| Douglas Elliman, Inc. | 4.1% |
| Grupo Financiero Galicia S.A. - ADR | 4.0% |
| Despegar.com Corporation | 3.7% |
| Dundee Corporation | 3.6% |
| Hong Kong Exchanges & Clearing Ltd. | 3.5% |
| Wheaton Precious Metals Corporation | 3.3% |
| Standard Chartered PLC | 3.1% |
| Enerflex Ltd. | 2.9% |
| ESR Group Ltd. | 2.9% |
No material changes occurred during the year ended November 30, 2024.
Where can I find additional information about the Fund?
Additional information is available on the Fund's website www.moeruscap.com/regulatory-resources/ , including its:
Prospectus
Financial information
Holdings
Proxy voting information
Moerus Worldwide Value Fund - Class N (MOWNX)
Annual Shareholder Report - November 30, 2024
Moerus Worldwide Value Fund
Institutional Class (MOWIX)
Annual Shareholder Report - November 30, 2024
This annual shareholder report contains important information about Moerus Worldwide Value Fund for the period of December 1, 2023 to November 30, 2024. You can find additional information about the Fund at www.moeruscap.com/regulatory-resources/. You can also request this information by contacting us at 1-844-663-7871.
What were the Fund’s costs for the last year?
(based on a hypothetical $10,000 investment)
| Class Name | Costs of a $10,000 investment | Costs paid as a percentage of a $10,000 investment |
|---|
| Institutional Class | $142 | 1.25% |
|---|
How did the Fund perform during the reporting period?
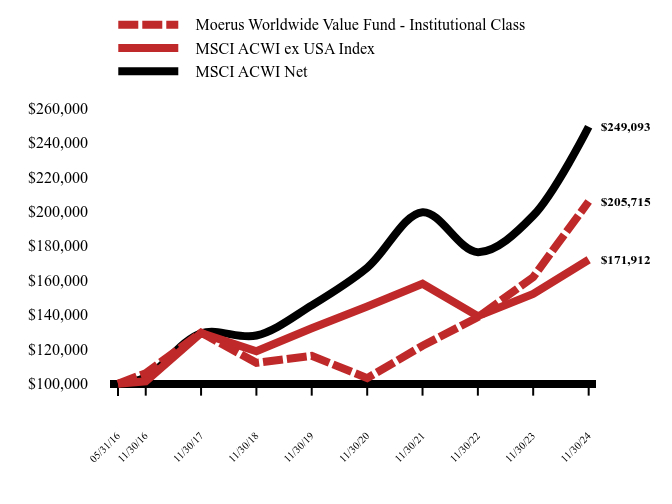
The Moerus Worldwide Value Fund (“the Fund”) returned +27.13% (net of fees) for the Institutional Class during the twelve months ended November 30, 2024. By comparison, the MSCI All Country World ex USA Index (“MSCI ACWI ex USA”) returned +13.03% (net), while the MSCI All Country World Index (“MSCI ACWI”) returned +26.12% (net) over the same period. In relative terms, U.S. equities generally outperformed international (as evidenced by the MSCI ACWI outperforming the MSCI ACWI ex USA) and the MSCI ACWI Growth Index (+28.98%) outperformed the MSCI ACWI Value Index (+23.18%), driven by large-cap U.S. Technology stocks. Yet despite the above market factors and conditions, which are generally not supportive of the relative performance of the Fund’s strategy, the Fund outperformed the MSCI ACWI and significantly outperformed the MSCI ACWI ex USA during the period. The Fund’s value-conscious, opportunistic, and flexible approach typically results in a portfolio of bottom-up investments that tends to have high active share and low overlap with broader market indices. During the twelve months ended November 30, 2024, the Fund’s strong absolute performance and meaningful relative outperformance was driven by significant individual contributors to performance that included (in order of magnitude): Argentine bank Grupo Financiero Galicia S.A.; online travel agency Despegar.com Corp.; financial services provider Jefferies Financial Group Inc.; Argentine bank Banco Macro S.A.; and residential brokerage company Douglas Elliman, Inc. On the negative side, the most significant detractors from the Fund’s absolute performance during the period included: engineering and consulting services provider John Wood Group PLC; grocery retailer Companhia Brasileira de Distribuição; beauty products retailer Natura & Co. Holding S.A.; Latin American McDonald’s franchisee Arcos Dorados Holdings, Inc.; and Indian bank IDFC First Bank Limited.
How has the Fund performed since inception?
Total Return Based on $100,000 Investment
| Moerus Worldwide Value Fund - Institutional Class | MSCI ACWI ex USA Index | MSCI ACWI Net |
|---|
| 05/31/16 | $100,000 | $100,000 | $100,000 |
|---|
| 11/30/16 | $106,100 | $101,365 | $103,669 |
|---|
| 11/30/17 | $129,617 | $129,331 | $129,211 |
|---|
| 11/30/18 | $112,054 | $118,834 | $127,947 |
|---|
| 11/30/19 | $116,173 | $132,138 | $145,445 |
|---|
| 11/30/20 | $103,200 | $144,721 | $167,275 |
|---|
| 11/30/21 | $121,971 | $157,948 | $199,509 |
|---|
| 11/30/22 | $138,561 | $139,197 | $176,325 |
|---|
| 11/30/23 | $161,821 | $152,088 | $197,509 |
|---|
| 11/30/24 | $205,715 | $171,912 | $249,093 |
|---|
Average Annual Total Returns
| 1 Year | 5 Years | Since Inception (May 31, 2016) |
|---|
| Moerus Worldwide Value Fund - Institutional Class | 27.13% | 12.11% | 8.86% |
|---|
| MSCI ACWI ex USA Index | 13.03% | 5.40% | 6.58% |
|---|
| MSCI ACWI Net | 26.12% | 11.36% | 11.33% |
|---|
The Fund's past performance is not a good predictor of how the Fund will perform in the future. The graph and table do not reflect the deduction of taxes that a shareholder would pay on fund distributions or redemption of fund shares.
What did the Fund invest in?
Sector Weighting (% of net assets)
| Value | Value |
|---|
| Other Assets in Excess of Liabilities | 1.2% |
| Money Market Funds | 2.6% |
| Consumer Staples | 3.5% |
| Communications | 3.7% |
| Industrials | 3.7% |
| Consumer Discretionary | 3.9% |
| Energy | 8.5% |
| Real Estate | 16.5% |
| Materials | 17.8% |
| Financials | 38.6% |
- Net Assets$87,027,057
- Number of Portfolio Holdings39
- Advisory Fee (net of waivers)$501,359
- Portfolio Turnover46%
Asset Weighting (% of total investments)
| Value | Value |
|---|
| Common Stocks | 97.3% |
| Money Market Funds | 2.6% |
Country Weighting (% of net assets)
| Value | Value |
|---|
| Other Assets in Excess of Liabilities | 3.8% |
| Other Countries | 16.3% |
| India | 3.2% |
| Brazil | 3.5% |
| Italy | 4.0% |
| South Africa | 4.6% |
| Australia | 2.5% |
| Hong Kong | 8.5% |
| United States | 10.5% |
| United Kingdom | 8.5% |
| Argentina | 9.2% |
| Canada | 25.4% |
Top 10 Holdings (% of net assets)
| Holding Name | % of Net Assets |
| Jefferies Financial Group, Inc. | 4.1% |
| Douglas Elliman, Inc. | 4.1% |
| Grupo Financiero Galicia S.A. - ADR | 4.0% |
| Despegar.com Corporation | 3.7% |
| Dundee Corporation | 3.6% |
| Hong Kong Exchanges & Clearing Ltd. | 3.5% |
| Wheaton Precious Metals Corporation | 3.3% |
| Standard Chartered PLC | 3.1% |
| Enerflex Ltd. | 2.9% |
| ESR Group Ltd. | 2.9% |
No material changes occurred during the year ended November 30, 2024.
Where can I find additional information about the Fund?
Additional information is available on the Fund's website www.moeruscap.com/regulatory-resources/ , including its:
Prospectus
Financial information
Holdings
Proxy voting information
Moerus Worldwide Value Fund - Institutional Class (MOWIX)
Annual Shareholder Report - November 30, 2024
Item 2. Code of Ethics.
| (a) | The registrant has, as of the end of the period covered by this report, adopted a code of ethics that applies to the registrant’s principal executive officer, principal financial officer, and principal accounting officer or controller, or persons performing similar functions, regardless of whether these individuals are employed by the registrant or a third party. |
| | |
| (b) | N/A |
| | |
| (c) | During the period covered by this report, there were no amendments to any provision of the code of ethics. |
| | |
| (d) | During the period covered by this report, there were no waivers or implicit waivers of a provision of the code of ethics. |
| | |
| (e) | N/A |
| | |
| (f) | See Item 19(a)(1) |
Item 3. Audit Committee Financial Expert.
| (a)(1) | The Registrant’s Board of Trustees has determined that Mr. Joseph Breslin are audit committee financial experts, as defined in Item 3 of Form N-CSR. Mr. Breslin is independent for purposes of this Item. |
Item 4. Principal Accountant Fees and Services.
| (a) | Audit Fees. The aggregate fees billed for each of the last two fiscal years for professional services rendered by the registrant’s principal accountant for the audit of the registrant’s annual financial statements or services that are normally provided by the accountant in connection with statutory and regulatory filings or engagements for those fiscal years are as follows: |
| | 2024 | | | $ | 15,350 | |
| | 2023 | | | $ | 14,500 | |
| (b) | Audit-Related Fees. There were no fees billed in each of the last two fiscal years for assurances and related services by the principal accountant that are reasonably related to the performance of the audit of the registrant’s financial statements and are not reported under paragraph (a) of this Item. |
| (c) | Tax Fees. The aggregate fees billed in each of the last two fiscal years for professional services rendered by the principal accountant for tax compliance are as follows: |
Preparation of Federal & State income tax returns, assistance with calculation of required income, capital gain and excise distributions and preparation of Federal excise tax returns.
| (d) | All Other Fees. The aggregate fees billed in each of the last two fiscal years for products and services provided by the registrant’s principal accountant, other than the services reported in paragraphs (a) through (c) of this item were $0 and $0 for the fiscal years ended November 30, 2024 and 2023, respectively. |
| | |
| (e)(1) | The audit committee does not have pre-approval policies and procedures. Instead, the audit committee or audit committee chairman approves on a case-by-case basis each audit or non-audit service before the principal accountant is engaged by the registrant. |
| | |
| (e)(2) | There were no services described in each of paragraphs (b) through (d) of this Item that were approved by the audit committee pursuant to paragraph (c)(7)(i)(C) of Rule 2-01 of Regulation S-X. |
| | |
| (f) | Not applicable. |
| | |
| (g) | All non-audit fees billed by the registrant’s principal accountant for services rendered to the registrant for the fiscal years ended November 30, 2024 and 2023 respectively are disclosed in (b)-(d) above. There were no audit or non-audit services performed by the registrant’s principal accountant for the registrant’s adviser. |
| | |
| (h) | Not applicable. |
| | |
| (i) | Not applicable. |
| | |
| (j) | Not applicable. |
Item 5. Audit Committee of Listed Registrants.
Not applicable
Item 6. Investments.
The Registrant’s schedule of investments in unaffiliated issuers is included in the Financial Statements under Item 7 of this form.
Item 7. Financial Statements and Financial Highlights for Open-End Management Investment Companies.

Moerus Worldwide Value Fund
Class N Shares (MOWNX)
Institutional Class Shares (MOWIX)
Annual Financial Statements and Additional Information
November 30, 2024
Moerus Worldwide Value Fund
SCHEDULE OF INVESTMENTS
November 30, 2024
| Shares | | | | | Fair Value | |
| | | | | COMMON STOCKS — 96.2% | | | | |
| | | | | APPAREL & TEXTILE PRODUCTS - 2.3% | | | | |
| | 738,465 | | | Samsonite International S.A. | | $ | 1,993,294 | |
| | | | | | | | | |
| | | | | ASSET MANAGEMENT - 8.1% | | | | |
| | 37,064 | | | Aker ASA | | | 1,930,238 | |
| | 2,728,375 | | | Dundee Corporation(a) | | | 3,098,898 | |
| | 20,214 | | | EXOR N.V. | | | 1,999,832 | |
| | | | | | | | 7,028,968 | |
| | | | | BANKING - 13.8% | | | | |
| | 15,392 | | | Banco Macro S.A. - ADR | | | 1,306,781 | |
| | 230,728 | | | Bancolombia S.A. | | | 2,020,504 | |
| | 60,981 | | | Grupo Financiero Galicia S.A. - ADR | | | 3,441,767 | |
| | 1,359,234 | | | IDFC First Bank Ltd.(a) | | | 1,029,966 | |
| | 217,508 | | | Standard Chartered PLC | | | 2,691,243 | |
| | 39,263 | | | UniCredit SpA | | | 1,509,174 | |
| | | | | | | | 11,999,435 | |
| | | | | CHEMICALS - 2.2% | | | | |
| | 41,439 | | | Nutrien Ltd. | | | 1,933,544 | |
| | | | | | | | | |
| | | | | HOUSEHOLD PRODUCTS - 2.1% | | | | |
| | 810,264 | | | Natura & Company Holding S.A. | | | 1,821,741 | |
| | | | | | | | | |
| | | | | INSTITUTIONAL FINANCIAL SERVICES - 10.3% | | | | |
| | 82,243 | | | Hong Kong Exchanges & Clearing Ltd. | | | 3,063,511 | |
| | 45,283 | | | Jefferies Financial Group, Inc. | | | 3,583,696 | |
| | 355,378 | | | JSE Ltd. | | | 2,331,576 | |
| | | | | | | | 8,978,783 | |
| | | | | INSURANCE - 4.4% | | | | |
| | 315,331 | | | Conduit Holdings Ltd. | | | 1,937,967 | |
| | 4,874,937 | | | Turkiye Sigorta A/S | | | 1,846,232 | |
| | | | | | | | 3,784,199 | |
| | | | | INTERNET MEDIA & SERVICES - 3.7% | | | | |
| | 178,982 | | | Despegar.com Corporation(a) | | | 3,201,988 | |
See accompanying notes to financial statements.
Moerus Worldwide Value Fund
SCHEDULE OF INVESTMENTS (Continued)
November 30, 2024
| Shares | | | | | Fair Value | |
| | | | | COMMON STOCKS — 96.2% (Continued) | | | | |
| | | | | LEISURE FACILITIES & SERVICES - 1.6% | | | | |
| | 169,123 | | | Arcos Dorados Holdings, Inc., Class A | | $ | 1,368,205 | |
| | | | | | | | | |
| | | | | METALS & MINING - 15.6% | | | | |
| | 50,534 | | | Anglo American Platinum Ltd. | | | 1,665,496 | |
| | 69,225 | | | Anglo American PLC | | | 2,220,150 | |
| | 36,317 | | | Cameco Corporation | | | 2,175,300 | |
| | 366,028 | | | Major Drilling Group International, Inc.(a) | | | 2,246,020 | |
| | 50,838 | | | Teck Resources Ltd., Class B | | | 2,373,118 | |
| | 46,678 | | | Wheaton Precious Metals Corporation | | | 2,909,439 | |
| | | | | | | | 13,589,523 | |
| | | | | OIL & GAS PRODUCERS - 5.6% | | | | |
| | 209,581 | | | International Petroleum Corporation(a) | | | 2,375,937 | |
| | 136,928 | | | MEG Energy Corporation | | | 2,464,898 | |
| | | | | | | | 4,840,835 | |
| | | | | OIL & GAS SERVICES & EQUIPMENT - 2.9% | | | | |
| | 279,890 | | | Enerflex Ltd. | | | 2,557,196 | |
| | | | | | | | | |
| | | | | REAL ESTATE INVESTMENT TRUSTS - 2.5% | | | | |
| | 8,634,986 | | | Cromwell Property Group | | | 2,139,882 | |
| | | | | | | | | |
| | | | | REAL ESTATE OWNERS & DEVELOPERS - 4.3% | | | | |
| | 1,888,301 | | | Sino Land Company Ltd. | | | 1,849,474 | |
| | 1,751,166 | | | Straits Trading Company Ltd. | | | 1,909,041 | |
| | | | | | | | 3,758,515 | |
| | | | | REAL ESTATE SERVICES - 7.0% | | | | |
| | 1,407,760 | | | Douglas Elliman, Inc.(a) | | | 3,575,711 | |
| | 1,702,898 | | | ESR Group Ltd. | | | 2,504,014 | |
| | | | | | | | 6,079,725 | |
| | | | | RETAIL - CONSUMER STAPLES - 1.4% | | | | |
| | 2,886,568 | | | Cia Brasileira de Distribuicao(a) | | | 1,247,146 | |
| | | | | | | | | |
| | | | | RETAIL REIT - 2.7% | | | | |
| | 649,520 | | | Hammerson plc | | | 2,418,241 | |
See accompanying notes to financial statements.
Moerus Worldwide Value Fund
SCHEDULE OF INVESTMENTS (Continued)
November 30, 2024
| Shares | | | | | Fair Value | |
| | | | | COMMON STOCKS — 96.2% (Continued) | | | | |
| | | | | SPECIALTY FINANCE - 2.0% | | | | |
| | 13,762 | | | Bajaj Holdings & Investment Ltd. | | $ | 1,703,578 | |
| | | | | | | | | |
| | | | | TRANSPORTATION & LOGISTICS - 3.7% | | | | |
| | 12,375 | | | Copa Holdings S.A., Class A | | | 1,155,454 | |
| | 149,145,907 | | | Latam Airlines Group S.A.(a) | | | 2,070,280 | |
| | | | | | | | 3,225,734 | |
| | | | | | | | | |
| | | | | TOTAL COMMON STOCKS (Cost $64,011,931) | | | 83,670,532 | |
| | | | | | | | | |
| | | | | SHORT-TERM INVESTMENT — 2.6% | | | | |
| | | | | MONEY MARKET FUND - 2.6% | | | | |
| | 2,293,297 | | | Morgan Stanley Institutional Liquidity Funds - Treasury Securities Portfolio, Institutional Class, 4.49% (Cost $2,293,297)(b) | | | 2,293,297 | |
| | | | | | | | | |
| | | | | TOTAL INVESTMENTS - 98.8% (Cost $66,305,228) | | $ | 85,963,829 | |
| | | | | OTHER ASSETS IN EXCESS OF LIABILITIES - 1.2% | | | 1,063,228 | |
| | | | | NET ASSETS - 100.0% | | $ | 87,027,057 | |
| ADR | - American Depositary Receipt |
| A/S | - Anonim Sirketi |
| LTD | - Limited Company |
| N.V. | - Naamioze Vennootschap |
| PLC | - Public Limited Company |
| REIT | - Real Estate Investment Trust |
| S.A. | - Société Anonyme |
| (a) | Non-income producing security. |
| (b) | Rate disclosed is the seven day effective yield as of November 30, 2024. |
See accompanying notes to financial statements.
Moerus Worldwide Value Fund
STATEMENT OF ASSETS AND LIABILITIES
November 30, 2024
| ASSETS | | | |
| Investment securities: | | | | |
| Securities at Cost | | $ | 66,305,228 | |
| Securities at Value | | $ | 85,963,829 | |
| Receivable for securities sold | | | 1,120,977 | |
| Receivable for Fund shares sold | | | 529 | |
| Dividends and interest receivable | | | 130,988 | |
| Receivable for foreign tax reclaims | | | 63,643 | |
| Prepaid expenses and other assets | | | 32,245 | |
| TOTAL ASSETS | | | 87,312,211 | |
| | | | | |
| LIABILITIES | | | | |
| Payable for Fund shares redeemed | | | 29 | |
| Investment advisory fees payable | | | 47,258 | |
| Payable to related parties | | | 22,784 | |
| Distribution (12b-1) fees payable | | | 597 | |
| Deferred capital gains tax payable | | | 182,001 | |
| Accrued expenses and other liabilities | | | 32,485 | |
| TOTAL LIABILITIES | | | 285,154 | |
| NET ASSETS | | $ | 87,027,057 | |
| | | | | |
| Net Assets Consist of: | | | | |
| Paid in capital | | $ | 66,588,882 | |
| Accumulated Earnings | | | 20,438,175 | |
| NET ASSETS | | $ | 87,027,057 | |
| | | | | |
| Net Asset Value Per Share: | | | | |
| Class N Shares: | | | | |
| Net Assets | | $ | 2,951,114 | |
| Shares of beneficial interest outstanding ($0 par value, unlimited shares authorized) | | | 169,713 | |
| Net asset value, offering price and redemption price per share (Net assets/Shares of Beneficial Interest) | | $ | 17.39 | (a) |
| | | | | |
| Institutional Class Shares: | | | | |
| Net Assets | | $ | 84,075,943 | |
| Shares of beneficial interest outstanding ($0 par value, unlimited shares authorized) | | | 4,819,444 | |
| Net asset value, offering price and redemption price per share (Net assets/Shares of Beneficial Interest) | | $ | 17.45 | (a) |
| (a) | The NAV for Class N and the Institutional Class shown above differs from the traded NAV on November 30, 2024 due to financial statement rounding and/or financial statement adjustments. |
See accompanying notes to financial statements.
Moerus Worldwide Value Fund
STATEMENT OF OPERATIONS
For the Year Ended November 30, 2024
| INVESTMENT INCOME | | | |
| Dividends (net of $137,145 foreign withholding taxes) | | $ | 1,912,433 | |
| Interest | | | 185,922 | |
| TOTAL INVESTMENT INCOME | | | 2,098,355 | |
| | | | | |
| EXPENSES | | | | |
| Investment advisory fees | | | 732,725 | |
| Distribution (12b-1) fees: | | | | |
| Class N | | | 5,213 | |
| Administrative services fees | | | 124,183 | |
| Custodian fees | | | 73,170 | |
| Transfer agent fees | | | 55,689 | |
| Registration fees | | | 46,252 | |
| Accounting services fees | | | 40,841 | |
| Legal fees | | | 34,000 | |
| Compliance officer fees | | | 24,332 | |
| Shareholder reporting expenses | | | 21,645 | |
| Audit and tax fees | | | 19,540 | |
| Trustees’ fees and expenses | | | 16,209 | |
| Insurance expense | | | 2,891 | |
| Other expenses | | | 4,888 | |
| TOTAL EXPENSES | | | 1,201,578 | |
| Fees waived by Adviser | | | (231,366 | ) |
| NET EXPENSES | | | 970,212 | |
| | | | | |
| NET INVESTMENT INCOME | | | 1,128,143 | |
| | | | | |
| REALIZED AND UNREALIZED GAIN ON INVESTMENTS | | | | |
| Net realized gain from investments and foreign currency translations (net of capital gains tax paid of $337,882) | | | 5,178,269 | |
| Net change in unrealized appreciation (depreciation) on investments and foreign currency translations (net of decrease in deferred capital gains tax of $49,118) | | | 11,328,467 | |
| | | | | |
| NET REALIZED AND UNREALIZED GAIN ON INVESTMENTS | | | 16,506,736 | |
| | | | | |
| NET INCREASE IN NET ASSETS FROM OPERATIONS | | $ | 17,634,879 | |
See accompanying notes to financial statements.
Moerus Worldwide Value Fund
STATEMENTS OF CHANGES IN NET ASSETS
| | | For the
Year Ended
November 30,
2024 | | | For the
Year Ended
November 30,
2023 | |
| FROM OPERATIONS: | | | | | | | | |
| Net investment income | | $ | 1,128,143 | | | $ | 3,345,799 | |
| Net realized gain from investments | | | 5,178,269 | | | | 2,751,777 | |
| Net change in unrealized appreciation on investments | | | 11,328,467 | | | | 2,255,396 | |
| Net increase in net assets resulting from operations | | | 17,634,879 | | | | 8,352,972 | |
| | | | | | | | | |
| DISTRIBUTIONS TO SHAREHOLDERS FROM: | | | | | | | | |
| Class N | | | (75,382 | ) | | | (3,069 | ) |
| Institutional Class | | | (3,031,472 | ) | | | (265,763 | ) |
| Decrease in net assets from distributions to shareholders | | | (3,106,854 | ) | | | (268,832 | ) |
| | | | | | | | | |
| FROM SHARES OF BENEFICIAL INTEREST: | | | | | | | | |
| Proceeds from shares sold: | | | | | | | | |
| Class N | | | 1,321,450 | | | | 743,691 | |
| Institutional Class | | | 26,969,609 | | | | 10,839,681 | |
| Net asset value of shares issued in reinvestment of distributions to shareholders: | | | | | | | | |
| Class N | | | 75,046 | | | | 3,061 | |
| Institutional Class | | | 2,853,818 | | | | 259,713 | |
| Payments for shares redeemed: | | | | | | | | |
| Class N | | | (366,365 | ) | | | (330,347 | ) |
| Institutional Class | | | (19,583,673 | ) | | | (7,539,595 | ) |
| Net increase in net assets from shares of beneficial interest | | | 11,269,885 | | | | 3,976,204 | |
| | | | | | | | | |
| TOTAL INCREASE IN NET ASSETS | | | 25,797,910 | | | | 12,060,344 | |
| | | | | | | | | |
| NET ASSETS: | | | | | | | | |
| Beginning of Year | | | 61,229,147 | | | | 49,168,803 | |
| End of Year | | $ | 87,027,057 | | | $ | 61,229,147 | |
| | | | | | | | | |
| SHARE ACTIVITY | | | | | | | | |
| Class N: | | | | | | | | |
| Shares Sold | | | 80,778 | | | | 54,956 | |
| Shares Reinvested | | | 5,307 | | | | 248 | |
| Shares Redeemed | | | (23,590 | ) | | | (25,189 | ) |
| Net increase in shares of beneficial interest outstanding | | | 62,495 | | | | 30,015 | |
| Institutional Class: | | | | | | | | |
| Shares Sold | | | 1,687,022 | | | | 800,605 | |
| Shares Reinvested | | | 201,541 | | | | 21,029 | |
| Shares Redeemed | | | (1,212,717 | ) | | | (563,541 | ) |
| Net increase in shares of beneficial interest outstanding | | | 675,846 | | | | 258,093 | |
See accompanying notes to financial statements.
Moerus Worldwide Value Fund
FINANCIAL HIGHLIGHTS
Per Share Data and Ratios for a Share of Beneficial Interest Outstanding Throughout Each Year Presented
| | | Class N | |
| | | For the
Year Ended
November 30,
2024 | | | For the
Year Ended
November 30,
2023 | | | For the
Year Ended
November 30,
2022 | | | For the
Year Ended
November 30,
2021 | | | For the
Year Ended
November 30,
2020 | |
| Net asset value, beginning of year | | $ | 14.37 | | | $ | 12.37 | | | $ | 11.49 | | | $ | 9.81 | | | $ | 11.22 | |
| | | | | | | | | | | | | | | | | | | | | |
| Activity from investment operations: | | | | | | | | | | | | | | | | | | | | |
| Investment income (loss) (1) | | | 0.19 | | | | 0.82 | | | | 0.09 | | | | (0.01 | ) | | | 0.05 | |
| Realized and unrealized gain (loss) on investments | | | 3.53 | | | | 1.22 | | | | 1.38 | | | | 1.74 | | | | (1.33 | ) |
| Total from investment operations | | | 3.72 | | | | 2.04 | | | | 1.47 | | | | 1.73 | | | | (1.28 | ) |
| | | | | | | | | | | | | | | | | | | | | |
| Less distributions from: | | | | | | | | | | | | | | | | | | | | |
| Net investment income | | | (0.70 | ) | | | (0.04 | ) | | | (0.59 | ) | | | (0.05 | ) | | | (0.13 | ) |
| Total distributions | | | (0.70 | ) | | | (0.04 | ) | | | (0.59 | ) | | | (0.05 | ) | | | (0.13 | ) |
| | | | | | | | | | | | | | | | | | | | | |
| Net asset value, end of year | | $ | 17.39 | | | $ | 14.37 | | | $ | 12.37 | | | $ | 11.49 | | | $ | 9.81 | |
| | | | | | | | | | | | | | | | | | | | | |
| Total return (2) | | | 27.02 | % | | | 16.54 | % | | | 13.32 | % | | | 17.72 | % | | | (11.59 | )% |
| | | | | | | | | | | | | | | | | | | | | |
| Net assets, end of year (000s) | | $ | 2,951 | | | $ | 1,540 | | | $ | 955 | | | $ | 835 | | | $ | 898 | |
| | | | | | | | | | | | | | | | | | | | | |
| Ratio of gross expenses to average net assets (3) | | | 1.80 | % | | | 1.96 | % | | | 1.99 | % | | | 1.92 | % | | | 2.20 | % |
| Ratio of net expenses to average net assets | | | 1.50 | % | | | 1.55 | % (4) | | | 1.65 | % | | | 1.65 | % | | | 1.65 | % |
| Ratio of net investment income (loss) to average net assets | | | 1.20 | % | | | 6.12 | % | | | 0.77 | % | | | (0.10 | )% | | | 0.52 | % |
| Portfolio Turnover Rate | | | 46 | % | | | 34 | % | | | 34 | % | | | 28 | % | | | 29 | % |
| | | | | | | | | | | | | | | | | | | | | |
| (1) | Per share amounts calculated using the average shares method, which more appropriately presents the per share data for the year. |
| (2) | Total returns shown exclude the effect of applicable sales loads/redemption fees. Total returns are historical in nature and assume changes in share price, reinvestment of dividends and capital gain distributions, if any. Had the Adviser not absorbed a portion of the Fund expenses, total returns would have been lower. Total return represents aggregate total return based on net asset value. |
| (3) | Represents the ratio of expenses to average net assets absent fee waivers and/or expense reimbursements by the Adviser. |
| (4) | Effective March 31, 2023, the operating expense limitation was reduced to 1.50% from 1.65%. |
See accompanying notes to financial statements.
Moerus Worldwide Value Fund
FINANCIAL HIGHLIGHTS
Per Share Data and Ratios for a Share of Beneficial Interest Outstanding Throughout Each Year Presented
| | | Institutional Class | |
| | | For the
Year Ended
November 30,
2024 | | | For the
Year Ended
November 30,
2023 | | | For the
Year Ended
November 30,
2022 | | | For the
Year Ended
November 30,
2021 | | | For the
Year Ended
November 30,
2020 | |
| Net asset value, beginning of year | | $ | 14.41 | | | $ | 12.41 | | | $ | 11.54 | | | $ | 9.84 | | | $ | 11.25 | |
| | | | | | | | | | | | | | | | | | | | | |
| Activity from investment operations: | | | | | | | | | | | | | | | | | | | | |
| Investment income (1) | | | 0.23 | | | | 0.83 | | | | 0.12 | | | | 0.02 | | | | 0.07 | |
| Realized and unrealized gain (loss) on investments | | | 3.54 | | | | 1.24 | | | | 1.37 | | | | 1.75 | | | | (1.33 | ) |
| Total from investment operations | | | 3.77 | | | | 2.07 | | | | 1.49 | | | | 1.77 | | | | (1.26 | ) |
| | | | | | | | | | | | | | | | | | | | | |
| Less distributions from: | | | | | | | | | | | | | | | | | | | | |
| Net investment income | | | (0.73 | ) | | | (0.07 | ) | | | (0.62 | ) | | | (0.07 | ) | | | (0.15 | ) |
| Total distributions | | | (0.73 | ) | | | (0.07 | ) | | | (0.62 | ) | | | (0.07 | ) | | | (0.15 | ) |
| | | | | | | | | | | | | | | | | | | | | |
| Net asset value, end of year | | $ | 17.45 | | | $ | 14.41 | | | $ | 12.41 | | | $ | 11.54 | | | $ | 9.84 | |
| | | | | | | | | | | | | | | | | | | | | |
| Total return (2) | | | 27.35 | % | | | 16.76 | % | | | 13.53 | % | | | 18.12 | % | | | (11.35 | )% |
| | | | | | | | | | | | | | | | | | | | | |
| Net assets, end of year (000s) | | $ | 84,076 | | | $ | 59,689 | | | $ | 48,214 | | | $ | 38,446 | | | $ | 33,333 | |
| | | | | | | | | | | | | | | | | | | | | |
| Ratio of gross expenses to average net assets (3) | | | 1.55 | % | | | 1.71 | % | | | 1.74 | % | | | 1.67 | % | | | 1.95 | % |
| Ratio of net expenses to average net assets | | | 1.25 | % | | | 1.30 | % (4) | | | 1.40 | % | | | 1.40 | % | | | 1.40 | % |
| Ratio of net investment income to average net assets | | | 1.47 | % | | | 6.18 | % | | | 1.04 | % | | | 0.14 | % | | | 0.75 | % |
| Portfolio Turnover Rate | | | 46 | % | | | 34 | % | | | 34 | % | | | 28 | % | | | 29 | % |
| | | | | | | | | | | | | | | | | | | | | |
| (1) | Per share amounts calculated using the average shares method, which more appropriately presents the per share data for the year. |
| (2) | Total returns shown exclude the effect of applicable sales loads/redemption fees. Total returns are historical in nature and assume changes in share price, reinvestment of dividends and capital gain distributions, if any. Had the Adviser not absorbed a portion of the Fund expenses, total returns would have been lower. Total return represents aggregate total return based on net asset value. |
| (3) | Represents the ratio of expenses to average net assets absent fee waivers and/or expense reimbursements by the Adviser. |
| (4) | Effective March 31, 2023, the operating expense limitation was reduced to 1.25% from 1.40%. |
See accompanying notes to financial statements.
MOERUS WORLDWIDE VALUE FUND
NOTES TO FINANCIAL STATEMENTS
November 30, 2024
The Moerus Worldwide Value Fund (the “Fund”) is a diversified series of Northern Lights Fund Trust IV (the “Trust”), a trust organized under the laws of the State of Delaware on June 2, 2015, and registered under the Investment Company Act of 1940, as amended (the “1940 Act”), as an open-end management investment company. The Fund’s investment objective is long-term capital appreciation. The Fund commenced operations on May 31, 2016.
The Fund currently offers Class N and Institutional Class shares, which are offered at net asset value. Each class represents an interest in the same assets of the Fund and classes are identical except for differences in their distribution charges. All classes of shares have equal voting privileges except that each class has exclusive voting rights with respect to its service and/or distribution plans.
| 2. | SIGNIFICANT ACCOUNTING POLICIES |
The following is a summary of significant accounting policies followed by the Fund in preparation of its financial statements. These policies are in conformity with generally accepted accounting principles in the United States of America (“GAAP”). The preparation of financial statements requires management to make estimates and assumptions that affect the reported amounts of assets and liabilities and disclosure of contingent assets and liabilities at the date of the financial statements and the reported amounts of income and expenses for the year. Actual results could differ from those estimates. The Fund is an investment company and accordingly follows the investment company accounting and reporting guidance of the Financial Accounting Standards Board (“FASB”) Accounting Standards Codification Topic 946 “Financial Services – Investment Companies”, including Accounting Standards Update 2013-08. Fund level income and expenses, and realized and unrealized capital gains and losses are allocated to each class of shares based on their relative net assets within the Fund. Class specific expenses are allocated to that share class.
Security Valuation – Securities listed on an exchange are valued at the last reported sale price at the close of the regular trading session of the exchange on the business day the value is being determined, or in the case of securities listed on NASDAQ at the NASDAQ Official Closing Price. In the absence of a sale, such securities shall be valued at the mean between the current bid and ask prices on the day of valuation. Short-term debt obligations having 60 days or less remaining until maturity, at time of purchase, may be valued at amortized cost which approximates fair value. Securities traded on a foreign exchange which has not closed by the valuation time or for which the official closing prices are not available at the time the net asset value per share (“NAV”) is determined may use alternative market prices provided by a pricing service.
Valuation of Underlying Funds – The Fund may invest in portfolios of open-end or closed-end investment companies (the “Underlying Funds”). Mutual funds are valued at their respective NAV as reported by such investment companies. Exchange-traded funds (“ETFs”) are valued at the last reported sale price or official closing price. Mutual funds value securities in their portfolios for which market quotations are readily available at their market values (generally the last reported sale price) and all other securities and assets at their fair value pursuant to the methods established by the board of directors of the open-end funds. The shares of many closed-end investment companies and ETFs, after their initial public offering, frequently trade at a price per share, which is different than the NAV. The difference represents a market premium or market discount of such shares. There can be no assurances that the market discount or market premium on shares of any closed-end investment company or ETF purchased by the Fund will not change.
MOERUS WORLDWIDE VALUE FUND
NOTES TO FINANCIAL STATEMENTS (Continued)
November 30, 2024
The Fund may hold investments, such as private investments, interests in commodity pools, other non-traded securities or temporarily illiquid securities, for which market quotations are not readily available or are determined to be unreliable. These securities are valued using the “fair value” procedures approved by the Board. The Board has designated the adviser as its valuation designee (the “Valuation Designee”) to execute these procedures. The Board may also enlist third party consultants such a valuation specialist at a public accounting firm, valuation consultant or financial officer of a security issuer on an as-needed basis to assist the Valuation Designee in determining a security-specific fair value. The Board is responsible for reviewing and approving fair value methodologies utilized by the Valuation Designee, approval of which shall be based upon whether the Valuation Designee followed the valuation procedures established by the Board.
Fair Valuation Process – Applicable investments are valued by the Valuation Designee pursuant to valuation procedures established by the Board. For example, fair value determinations are required for the following securities: (i) securities for which market quotations are insufficient or not readily available on a particular business day (including securities for which there is a short and temporary lapse in the provision of a price by the regular pricing source); (ii) securities for which, in the judgment of the Valuation Designee, the prices or values available do not represent the fair value of the instrument; factors which may cause the Valuation Designee to make such a judgment include, but are not limited to, the following: only a bid price or an asked price is available; the spread between bid and asked prices is substantial; the frequency of sales; the thinness of the market; the size of reported trades; and actions of the securities markets, such as the suspension or limitation of trading; (iii) securities determined to be illiquid; and (iv) securities with respect to which an event that affects the value thereof has occurred (a “significant event”) since the closing prices were established on the principal exchange on which they are traded, but prior to the Fund’s calculation of its net asset value. Specifically, interests in commodity pools or managed futures pools are valued on a daily basis by reference to the closing market prices of each futures contract or other asset held by a pool, as adjusted for pool expenses. Restricted or illiquid investments, such as private investments or non-traded securities are valued based upon the current bid for the security from two or more independent dealers or other parties reasonably familiar with the facts and circumstances of the security (who should take into consideration all relevant factors as may be appropriate under the circumstances). If a current bid from such independent dealers or other independent parties is unavailable, the Valuation Designee shall determine the fair value of such security using the following factors: (i) the type of security; (ii) the cost at date of purchase; (iii) the size and nature of the Fund’s holdings; (iv) the discount from market value of unrestricted securities of the same class at the time of purchase and subsequent thereto; (v) information as to any transactions or offers with respect to the security; (vi) the nature and duration of restrictions on disposition of the security and the existence of any registration rights; (vii) how the yield of the security compares to similar securities of companies of similar or equal creditworthiness; (viii) the level of recent trades of similar or comparable securities; (ix) the liquidity characteristics of the security; (x) current market conditions; and (xi) the market value of any securities into which the security is convertible or exchangeable.
The Fund values its investments utilizing various methods to measure their fair value on a recurring basis. GAAP establishes a hierarchy that prioritizes inputs to valuation methods. The three levels of input are:
Level 1 – Unadjusted quoted prices in active markets for identical assets and liabilities that the Fund has the ability to access.
Level 2 – Observable inputs other than quoted prices included in Level 1 that are observable for the asset or liability, either directly or indirectly. These inputs may include quoted prices for the identical instrument in an inactive market, prices for similar instruments, interest rates, prepayment speeds, credit risk, yield curves, default rates and similar data.
Level 3 – Unobservable inputs for the asset or liability, to the extent relevant observable inputs are not available, representing the Fund’s own assumptions about the assumptions a market participant would use in valuing the asset or liability, and would be based on the best information available.
MOERUS WORLDWIDE VALUE FUND
NOTES TO FINANCIAL STATEMENTS (Continued)
November 30, 2024
The availability of observable inputs can vary from security to security and is affected by a wide variety of factors, including, for example, the type of security, whether the security is new and not yet established in the marketplace, the liquidity of markets, and other characteristics particular to the security. To the extent that valuation is based on models or inputs that are less observable or unobservable in the market, the determination of fair value requires more judgment. Accordingly, the degree of judgment exercised in determining fair value is greatest for instruments categorized in Level 3.
The inputs used to measure fair value may fall into different levels of the fair value hierarchy. In such cases, for disclosure purposes, the level in the fair value hierarchy within which the fair value measurement falls in its entirety, is determined based on the lowest level input that is significant to the fair value measurement in its entirety.
The inputs or methodology used for valuing securities are not necessarily an indication of the risk associated with investing in those securities. The following tables summarize the inputs used as of November 30, 2024 for the Fund’s investments measured at fair value:
| Assets * | | Level 1 | | | Level 2 | | | Level 3 | | | Total | |
| Common Stocks | | $ | 83,670,532 | | | $ | - | | | $ | - | | | $ | 83,670,532 | |
| Money Market Fund | | | 2,293,297 | | | | - | | | | - | | | | 2,293,297 | |
| Total | | $ | 85,963,829 | | | $ | - | | | $ | - | | | $ | 85,963,829 | |
The Fund did not hold any level 2 or level 3 securities during the year.
| * | Please refer to the Schedule of Investments for industry classifications. |
Foreign Currency: Investment securities and other assets and liabilities denominated in foreign currencies are translated into U.S. dollar amounts at the date of valuation. Purchases and sales of investment securities and income and expense items denominated in foreign currencies are translated into U.S. dollar amounts on the respective dates of such transactions.
The Fund does not isolate that portion of the results of operations resulting from changes in foreign exchange rates on investments from the fluctuations arising from changes in market prices of securities held. Such fluctuations are included with the net realized and unrealized gain or loss from investments.
Reported net realized foreign exchange gains or losses arise from sales of foreign currencies, currency gains or losses realized between the trade and settlement dates on securities transactions, and the difference between the amounts of dividends, interest, and foreign withholding taxes recorded on the Fund’s books and the U.S. dollar equivalent of the amounts actually received or paid. Net unrealized foreign exchange gains and losses arise from changes in the fair values of assets and liabilities, other than investments in securities at fiscal year end, resulting from changes in exchange rates.
Foreign Currency Risk: Currency investing and trading risks include market risk, credit risk and country risk. Market risk results from adverse changes in exchanges in exchange rates. Credit risk results because a currency-trade counterparty may default. Country risk arises because a government may interfere with transactions in its currency.
Foreign Investment Risk: Foreign investing involves adverse fluctuations in foreign currency values, adverse political, social and economic developments, less liquidity, greater volatility, less developed or less efficient trading markets, political instability and differing auditing and legal standards.
Concentration of Risk: Investing in securities of foreign issuers and currency transactions may involve certain considerations and risks not typically associated with investments in the United States. These risks include revaluation of currencies, adverse fluctuations in foreign currency values and possible adverse political, social and economic developments, including those particular to a specific industry, country or region. These conditions could cause the securities and their markets to be less liquid and prices more volatile than those of comparable U.S. companies and U.S. government securities.
MOERUS WORLDWIDE VALUE FUND
NOTES TO FINANCIAL STATEMENTS (Continued)
November 30, 2024
Market and Geopolitical Risk: The increasing interconnectivity between global economies and financial markets increases the likelihood that events or conditions in one region or financial market may adversely impact issuers in a different country, region or financial market. Securities in the Fund’s portfolio may underperform due to inflation (or expectations for inflation), interest rates, global demand for particular products or resources, natural disasters, climate change or climate–related events, pandemics, epidemics, terrorism, regulatory events and governmental or quasi-governmental actions. The occurrence of global events similar to those in recent years may result in market volatility and may have long term effects on both the U.S. and global financial markets.
Security Transactions and Related Income – Security transactions are accounted for on the trade date. Interest income is recognized on an accrual basis. Discounts are accreted and premiums are amortized on securities purchased over the lives of the respective securities using the effective yield method. Dividend income and expense are recorded on the ex-dividend date. Realized gains or losses from sales of securities are determined by comparing the identified cost of the security lot sold with the net sales proceeds. Withholding taxes on foreign dividends and foreign capital gain taxes have been provided for in accordance with the Fund’s understanding of the applicable country’s tax rules and rates. As of November 30, 2024, the Fund recorded a deferred liability for potential future Indian capital gains taxes of $182,001. During the year ended November 30, 2024, the Fund paid Indian capital gains taxes in the amount of $337,882.
Distributions to Shareholders – Dividends from net investment income, if any, are declared and paid annually. Distributable net realized capital gains, if any, are declared and distributed annually. Dividends from net investment income and distributions from net realized gains are determined in accordance with federal income tax regulations, which may differ from GAAP and are recorded on the ex-dividend date. These “book/tax” differences are considered either temporary (e.g., deferred losses, capital loss carryforwards, etc.) or permanent in nature. To the extent these differences are permanent in nature, such amounts are reclassified within the composition of net assets based on their federal tax-basis treatment; temporary differences do not require reclassification. Any such reclassifications will have no effect on net assets, results of operations, or net asset values per share of the Fund.
Cash and cash equivalents – Cash and cash equivalents are held with a financial institution and include demand deposits and short-term, liquid investments with an original maturity of three months or less. The assets of the Fund may be placed in deposit accounts at U.S. banks and such deposits generally exceed Federal Deposit Insurance Corporation (“FDIC”) insurance limits. The FDIC insures deposit accounts up to $250,000 for each accountholder. The counterparty is generally a single bank rather than a group of financial institutions; thus there may be a greater counterparty credit risk. The Fund places deposits only with those counterparties which are believed to be creditworthy and there has been no history of loss.
Federal Income Tax – The Fund intends to continue to comply with the requirements of the Internal Revenue Code applicable to regulated investment companies and to distribute all its taxable income to shareholders. Therefore, no provision for federal income tax is required.
The Fund recognizes the tax benefits of uncertain tax positions only where the position is “more likely than not” to be sustained assuming examination by tax authorities. Management has analyzed the Fund’s tax positions and has concluded that no liability for unrecognized tax benefits should be recorded related to uncertain tax positions taken on returns filed for open tax years November 30, 2020, to November 30, 2023, or expected to be taken in the Fund’s November 30, 2024, tax returns. The Fund identified its major tax jurisdictions as U.S. federal, Ohio and foreign jurisdictions where the Fund makes significant investments. The Fund recognizes interest and penalties, if any, related to unrecognized tax benefits as income tax expenses in the Statement of Operations. During the year ended November 30, 2024, the Fund did not incur any interest or penalties. The Fund is not aware of any tax positions for which it is reasonably possible that the total amounts of unrecognized tax benefits will change materially in the next twelve months.
Expenses – Expenses of the Trust that are directly identifiable to a specific fund are charged to that fund. Expenses, which are not readily identifiable to a specific fund, are allocated in such a manner as deemed equitable, taking into consideration the nature and type of expense and the relative sizes of the funds in the Trust.
MOERUS WORLDWIDE VALUE FUND
NOTES TO FINANCIAL STATEMENTS (Continued)
November 30, 2024
Indemnification – The Trust indemnifies its officers and trustees for certain liabilities that may arise from the performance of their duties to the Trust. Additionally, in the normal course of business, the Fund enters into contracts that contain a variety of representations and warranties and which provide general indemnities. The Fund’s maximum exposure under these arrangements is unknown, as this would involve future claims that may be made against the Fund that have not yet occurred. However, based on experience, the risk of loss due to these warranties and indemnities appears to be remote.
| 3. | INVESTMENT TRANSACTIONS |
For the year ended November 30, 2024, cost of purchases and proceeds from sales of portfolio securities, other than short-term investments and U.S. government securities, amounted to $42,249,559 and $33,656,334, respectively.
| 4. | INVESTMENT ADVISORY AGREEMENT AND TRANSACTIONS WITH RELATED PARTIES |
Moerus Capital Management LLC serves as the Fund’s investment adviser (“Adviser”). Pursuant to an investment advisory agreement with the Trust, on behalf of the Fund, the Adviser, under the oversight of the Board, oversees the daily operations of the Fund, manages the Fund’s portfolio and supervises the performance of administrative and professional services provided by others. As compensation for its services and the related expenses borne by the Adviser, the Fund pays the Adviser an investment advisory fee, computed and accrued daily and paid monthly, at an annual rate of 0.95% of the Fund’s average daily net assets. For the year ended November 30, 2024, the Fund incurred $732,725 in investment advisory fees.
The Adviser has contractually agreed to reduce its fees and/or absorb expenses of the Fund, until at least March 31, 2025, to ensure that total annual fund operating expenses after fee waiver and/or reimbursement (excluding (i) any front-end or contingent deferred loads; (ii) brokerage fees and commissions; (iii) acquired fund fees and expenses; (iv) fees and expenses associated with investments in other collective investment vehicles or derivative instruments (including for example option and swap fees and expenses); (v) borrowing costs (such as interest and dividend expense on securities sold short); (vi) taxes; and (vii) extraordinary expenses, such as litigation expenses (which may include indemnification of Fund officers and Trustees, contractual indemnification of Fund service providers (other than the Adviser)), will not exceed 1.50% and 1.25% of the Fund’s average daily net assets attributable to Class N shares and Institutional Class shares, respectively. During the year ended November 30, 2024, the Adviser waived fees in the amount of $231,366 pursuant to its contractual agreement.
If the Adviser waives any fees or reimburses any expenses and any operating expenses are subsequently lower than their respective expense limitation, the Adviser shall be entitled to reimbursement by the Fund provided that such reimbursement does not cause the Fund’s operating expenses to exceed the respective expense limitation. The Adviser may seek reimbursement only for expenses waived or paid by it during the three years prior to such reimbursement; provided, however, that such expenses may only be reimbursed to the extent they were waived or paid after the date of the waiver agreement (or any similar agreement).
Expenses subject to recapture pursuant to the aforementioned conditions as of November 30, 2024 will expire on November 30 of the following years:
November 30,
2025 | | | November 30,
2026 | | | November 30,
2027 | |
| $ | 153,840 | | | $ | 226,707 | | | $ | 231,366 | |
Foreside Fund Services, LLC is the distributor for the shares of the Fund (the “Distributor”). Shares of the Fund are offered on a continuous basis.
MOERUS WORLDWIDE VALUE FUND
NOTES TO FINANCIAL STATEMENTS (Continued)
November 30, 2024
The Trust, with respect to the Fund, has adopted the Trust’s Master Distribution and Shareholder Servicing Plan (the “Plan”) for Class N shares, pursuant to Rule 12b-1 of the 1940 Act, which allows the Fund to pay the Fund’s Distributor an annual fee for distribution and shareholder servicing expenses of up to 0.25% of the Fund’s average daily net assets attributable to Class N shares. For the year ended November 30, 2024, the Fund incurred $5,213 in distribution and shareholder servicing fees.
Ultimus Fund Solutions, LLC (“UFS”) – UFS provides administration, fund accounting, and transfer agent services to the Trust. Pursuant to separate servicing agreements with UFS, the Fund pays UFS customary fees for providing administration, fund accounting and transfer agency services to the Fund as shown in the Statement of Operations. Certain officers of the Trust are also officers of UFS and are not paid any fees directly by the Fund for serving in such capacities.
Northern Lights Compliance Services, LLC (“NLCS”) – NLCS, an affiliate of UFS, provides a Chief Compliance Officer to the Trust, as well as related compliance services, pursuant to a consulting agreement between NLCS and the Trust. Under the terms of such agreement, NLCS receives customary fees from the Fund which are included in the compliance officer fees in the Statement of Operations.
Blu Giant, LLC (“Blu Giant”) – Blu Giant, an affiliate of UFS, provides EDGAR conversion and filing services as well as print management services for the Fund on an ad-hoc basis. For the provision of these services, Blu Giant receives customary fees from the Fund which are included in the shareholder reporting expenses in the Statement of Operations.
The beneficial ownership, either directly or indirectly, of more than 25% of the voting securities of a fund creates presumption of control of the fund under Section 2(a)(9) of the 1940 Act. As of November 30, 2024, Charles Schwab & Co., Inc., on behalf of its clients, held approximately 69.72% of the voting securities of the Fund, and therefore, may be deemed to control the Fund.
| 6. | AGGREGATE UNREALIZED APPRECIATION AND DEPRECIATION - TAX BASIS |
At November 30, 2024, the aggregate cost for federal tax purposes, which differs from fair value by net unrealized appreciation (depreciation) of securities, are as follows:
| | | | Gross Unrealized | | | Gross Unrealized | | | Net Unrealized | |
| Tax Cost | | | Appreciation | | | Depreciation | | | Appreciation | |
| $ | 68,374,530 | | | $ | 23,444,925 | | | $ | (6,037,627 | ) | | $ | 17,407,298 | |
| 7. | DISTRIBUTION TO SHAREHOLDERS AND TAX COMPONENTS OF CAPITAL |
The tax character of fund distributions paid for the years ended November 30, 2024, and November 30, 2023, was as follows:
| | | Fiscal Year Ended
November 30,
2024 | | | Fiscal Year Ended
November 30, 2023 | |
| Ordinary Income | | $ | 3,106,854 | | | $ | 268,832 | |
As of November 30, 2024, the components of accumulated earnings/(deficit) on a tax basis were as follows:
Undistributed
Ordinary
Income | | | Undistributed
Long-Term
Gains | | | Post October
Loss and
Late Year Loss | | | Capital Loss
Carry
Forwards | | | Other Book/Tax
Differences | | | Unrealized
Appreciation/
(Depreciation) | | | Total Accumulated
Earnings/(Deficits) | |
| $ | 3,033,010 | | | $ | - | | | $ | - | | | $ | - | | | $ | - | | | $ | 17,405,165 | | | $ | 20,438,175 | |
MOERUS WORLDWIDE VALUE FUND
NOTES TO FINANCIAL STATEMENTS (Continued)
November 30, 2024
At November 30, 2024, the Fund had capital loss carryforwards utilized as follows:
| Short-Term | | | Long-Term | | | Total | | | CLCF Utilized | |
| $ | - | | | $ | - | | | $ | - | | | $ | 3,698,329 | |
The difference between book basis and tax basis unrealized appreciation (depreciation), undistributed net investment income (loss) and accumulated net realized gain (loss) from investments are primarily attributable to the tax deferral of losses on wash sales, and mark-to-market on passive foreign investment companies. The unrealized appreciation (depreciation) in the table above includes unrealized foreign currency losses of $(2,133).
Permanent book and tax differences, primarily attributable to tax adjustments for realized gain (loss) on use of tax equalization credits, resulted in reclassifications for the Fund for the fiscal year ended November 30, 2024, as follows:
Paid In
Capital | | | Distributable
Earnings | |
| $ | 53,752 | | | $ | (53,752 | ) |
Subsequent events after the date of the Statement of Assets and Liabilities have been evaluated through the date the financial statements were issued. Management has determined that no events or transactions occurred requiring adjustment or disclosure in the financial statements.
| 9. | TAX INFORMATION (UNAUDITED) |
The Fund intends to elect to pass through to shareholders the income tax credit for taxes paid to foreign countries. Foreign source income and foreign tax expense per outstanding share as of fiscal year ended November 30, 2024, and November 30, 2023, were as follows:
| Fiscal Year Ended November 30, 2024 | |
| | | | | |
Foreign
Taxes Paid | | | Foreign
Source Income | |
| $ | 0.09 | | | $ | 0.33 | |
| $ | 0.09 | | | $ | 0.33 | |
| Fiscal Year Ended November 30, 2023 | |
| | | | | |
Foreign
Taxes Paid | | | Foreign
Source Income | |
| $ | 0.03 | | | $ | 0.73 | |
| $ | 0.03 | | | $ | 0.73 | |

REPORT OF INDEPENDENT REGISTERED PUBLIC ACCOUNTING FIRM
To the Shareholders of Moerus Worldwide Value Fund and
Board of Trustees of Northern Lights Fund Trust IV
Opinion on the Financial Statements
We have audited the accompanying statement of assets and liabilities, including the schedule of investments, of Moerus Worldwide Value Fund (the “Fund”), a series of Northern Lights Fund Trust IV, as of November 30, 2024, the related statement of operations for the year then ended, the statements of changes in net assets for each of the two years in the period then ended, the financial highlights for each of the five years in the period then ended, and the related notes (collectively referred to as the “financial statements”). In our opinion, the financial statements present fairly, in all material respects, the financial position of the Fund as of November 30, 2024, the results of its operations for the year then ended, the changes in net assets for each of the two years in the period then ended, and the financial highlights for each of the five years in the period then ended, in conformity with accounting principles generally accepted in the United States of America.
Basis for Opinion
These financial statements are the responsibility of the Fund’s management. Our responsibility is to express an opinion on the Fund’s financial statements based on our audits. We are a public accounting firm registered with the Public Company Accounting Oversight Board (United States) (“PCAOB”) and are required to be independent with respect to the Fund in accordance with the U.S. federal securities laws and the applicable rules and regulations of the Securities and Exchange Commission and the PCAOB.
We conducted our audits in accordance with the standards of the PCAOB. Those standards require that we plan and perform the audit to obtain reasonable assurance about whether the financial statements are free of material misstatement whether due to error or fraud.
Our audits included performing procedures to assess the risks of material misstatement of the financial statements, whether due to error or fraud, and performing procedures that respond to those risks. Such procedures included examining, on a test basis, evidence regarding the amounts and disclosures in the financial statements. Our procedures included confirmation of securities owned as of November 30, 2024, by correspondence with the custodian and brokers; when replies were not received from brokers, we performed other auditing procedures. Our audits also included evaluating the accounting principles used and significant estimates made by management, as well as evaluating the overall presentation of the financial statements. We believe that our audits provide a reasonable basis for our opinion.
We have served as the Fund’s auditor since 2016.

COHEN & COMPANY, LTD.
Philadelphia, Pennsylvania
January 29, 2025

MOERUS WORLDWIDE VALUE FUND
ADDITIONAL INFORMATION (Unaudited)
November 30, 2024
Changes in and Disagreements with Accountants
There were no changes in or disagreements with accountants during the period covered by this report.
Proxy Disclosures
Not applicable.
Remuneration Paid to Directors, Officers and Others
Refer to the financial statements included herein.
Statement Regarding Basis for Approval of Investment Advisory Agreement
Not applicable.
PROXY VOTING POLICY
Information regarding how the Fund voted proxies relating to portfolio securities for the twelve month period ended June 30 as well as a description of the policies and procedures that the Fund uses to determine how to vote proxies will be available without charge, upon request, by calling 1-844-663-7871 or by referring to the Securities and Exchange Commission’s (“SEC”) website at http://www.sec.gov.
Item 8. Changes in and Disagreements with Accountants for Open-End Management Investment Companies.
Not applicable
Item 9. Proxy Disclosures for Open-End Management Investment Companies.
Not applicable
Item 10. Remuneration Paid to Directors, Officers, and Others of Open-End Management Investment Companies.
Included under Item 7
Item 11. Statement Regarding Basis for Approval of Investment Advisory Contract.
Included under Item 7
Item 12. Disclosure of Proxy Voting Policies and Procedures for Closed-End Management Investment Companies.
Not applicable
Item 13. Portfolio Managers of Closed-End Management Investment Companies.
Not applicable
Item 14. Purchases of Equity Securities by Closed-End Management Investment Company and Affiliated Purchasers.
Not applicable
Item 15. Submission of Matters to a Vote of Security Holders.
None
Item 16. Controls and Procedures
| (a) | The registrant’s Principal Executive Officer and Principal Financial Officer have concluded that the registrant’s disclosure controls and procedures (as defined in Rule 30a-3(c) under the Act) are effective in design and operation and are sufficient to form the basis of the certifications required by Rule 30a-(2) under the Act, based on their evaluation of these disclosure controls and procedures as of a date within 90 days of this report on Form N-CSR. |
| (b) | There were no changes in the registrant’s internal control over financial reporting (as defined in Rule 30a-3(d) under the Act) during the period covered by this report that have materially affected, or are reasonably likely to materially affect, the registrant’s internal control over financial reporting. |
Item 17. Disclosure of Securities Lending Activities for Closed-End Management Investment Companies.
Not applicable
Item 18. Recovery of Erroneously Awarded Compensation.
Item 19. Exhibits.
| (a)(3) | A separate certification for each principal executive officer and principal financial officer of the registrant as required by Rule 30a-2(a) under the Act (17 CFR 270.30a-2(a)): Attached hereto. |
| (b) | Certifications required by Rule 30a-2(b) under the Act (17 CFR 270.30a-2(b)): Attached hereto. |
SIGNATURES
Pursuant to the requirements of the Securities Exchange Act of 1934 and the Investment Company Act of 1940, the registrant has duly caused this report to be signed on its behalf by the undersigned, thereunto duly authorized.
| Northern Lights Fund Trust IV | |
| By | /s/ Wendy Wang | |
| | Wendy Wang
Principal Executive Officer | |
Pursuant to the requirements of the Securities Exchange Act of 1934 and the Investment Company Act of 1940, this report has been signed below by the following persons on behalf of the registrant and in the capacities and on the dates indicated.
| By | /s/ Wendy Wang | |
| | Wendy Wang
Principal Executive Officer | |
| By | /s/ Sam Singh | |
| | Sam Singh
Principal Financial Officer | |