UNITED STATES
SECURITIES AND EXCHANGE COMMISSION
WASHINGTON, D.C. 20549
FORM N-CSR
CERTIFIED SHAREHOLDER REPORT OF REGISTERED MANAGEMENT
INVESTMENT COMPANIES
| Investment Company Act file number | 811-23066 |
| Northern Lights Fund Trust IV |
| (Exact name of registrant as specified in charter) |
| 225 Pictoria Drive, Suite 450, Cincinnati, OH | 45246 |
| (Address of principal executive offices) | (Zip code) |
| The Corporation Trust Company |
| 1209 Orange Street, Wilmington, DE 19801 |
| (Name and address of agent for service) |
| Registrant’s telephone number, including area code: | 631-490-4300 |
| Date of fiscal year end: | 5/31 | |
| | | |
| Date of reporting period: | 11/30/24 | |
Item 1. Reports to Stockholders.
LGM Risk Managed Total Return Fund - Institutional Class (LBETX )
Semi-Annual Shareholder Report - November 30, 2024
This semi-annual shareholder report contains important information about LGM Risk Managed Total Return Fund for the period of June 1, 2024 to November 30, 2024. You can find additional information about the Fund at www.LGMCapitalmanagement.com . You can also request this information by contacting us at 1-844-655-9371.
What were the Fund’s costs for the last six months?
(based on a hypothetical $10,000 investment)
| Class Name | Costs of a $10,000 investment | Costs paid as a percentage of a $10,000 investment |
|---|
| Institutional Class | $283 | 2.73% |
|---|
How did the Fund perform during the reporting period?
Investment strategy
The Fund seeks to provide total returns from capital appreciation and income and minimize risk during unfavorable or declining market conditions with lower volatility than the S&P 500 Index. It is designed for investors seeking a risk-managed alternative to traditional buy and hold strategies, without sacrificing the potential for growth.
The majority of mutual funds are buy and hold and cannot de-risk as markets dictate. The Fund has the flexibility to invest as market conditions dictate in a combination of assets as described in the Prospectus. The adviser's decisions are based on technical research and analysis, including price movements and trends. In the past six-months, the Fund's performance was due to its unique investment flexibility.
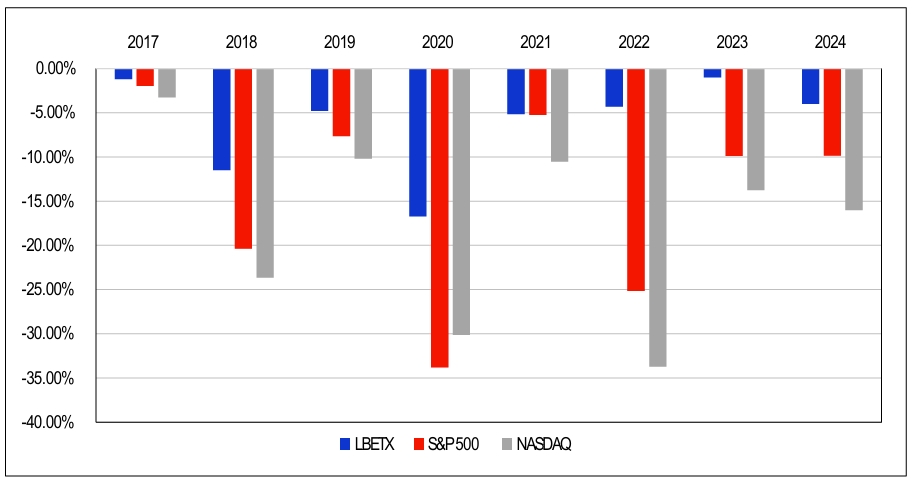
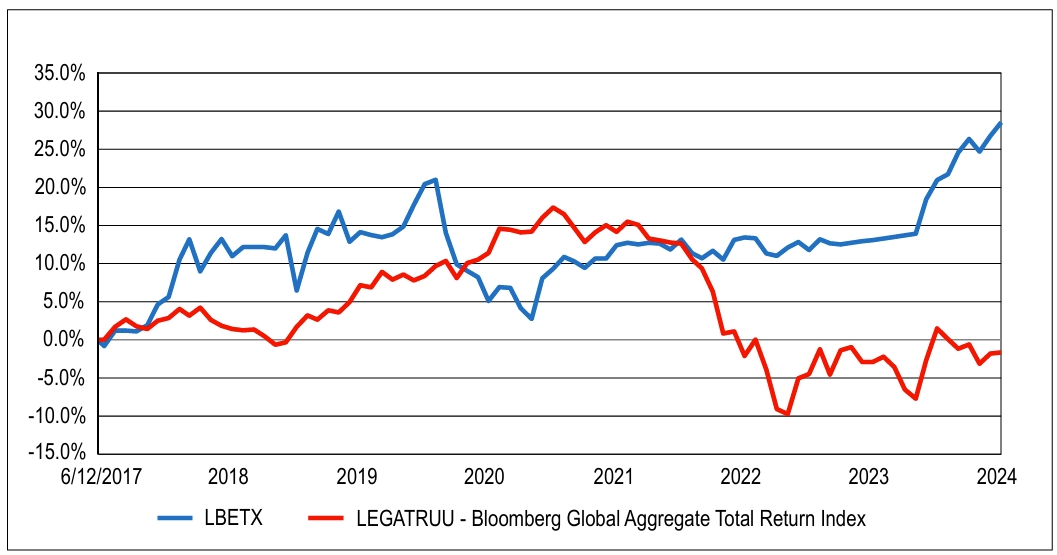
Managed Risk and Minimized Losses
Managing risk and minimizing losses are crucial to investors. Due to its unique investment flexibility, the chart illustrates the Fund's top-performance in minimizing losses ending November 30, 2024, and every year since its inception versus the S&P 500 and NASDAQ.
2017-2024 Maximum Drawdowns
Maximum Drawdown is the largest decline from peak to trough in value.
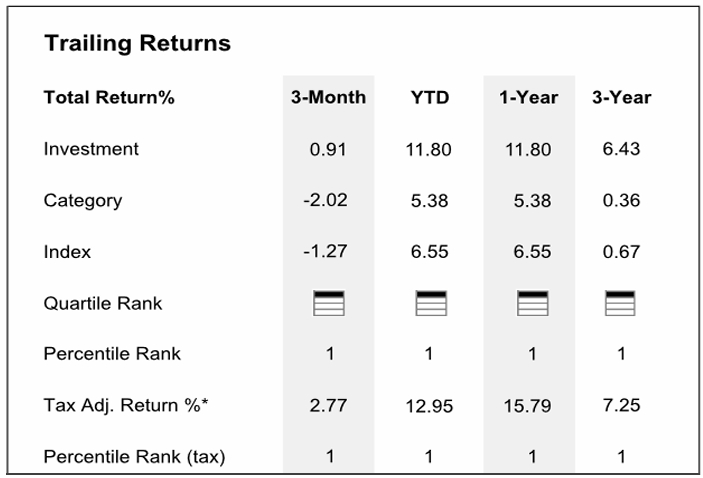
LBETX Total and Tax Adjusted Returns are #1 Percentile in its Morningstar category.
LBETX Total Returns as of May 31, 2024 outperformed its Morningstar Index since inception.
Performance
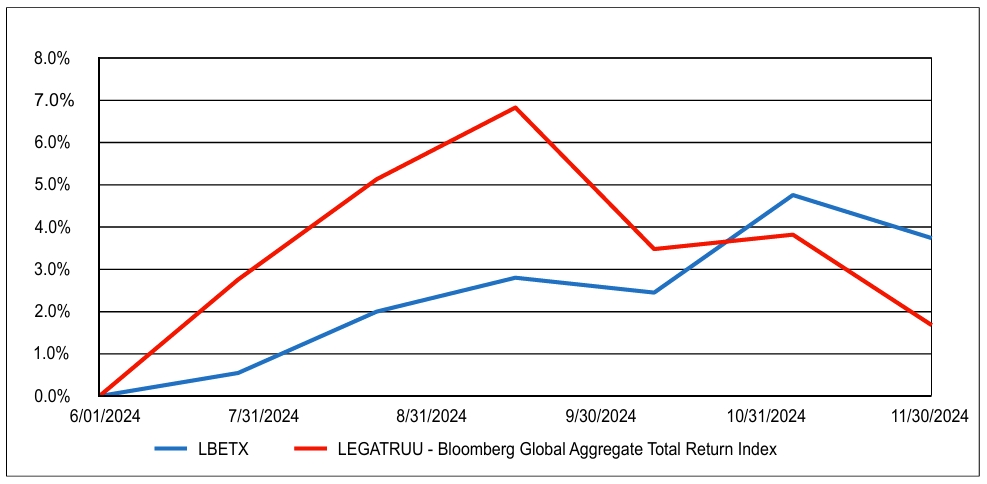
Due to its unique investment flexibility of managing risk and minimizing losses as market conditions dictated, the Fund was #1 Percentile in its Morningstar Category, outperformed its Morningstar Index, and outperformed its Benchmark (Bloomberg Global Aggregate Total Return Index) for the six-month period and since inception, all ending November 30, 2024.
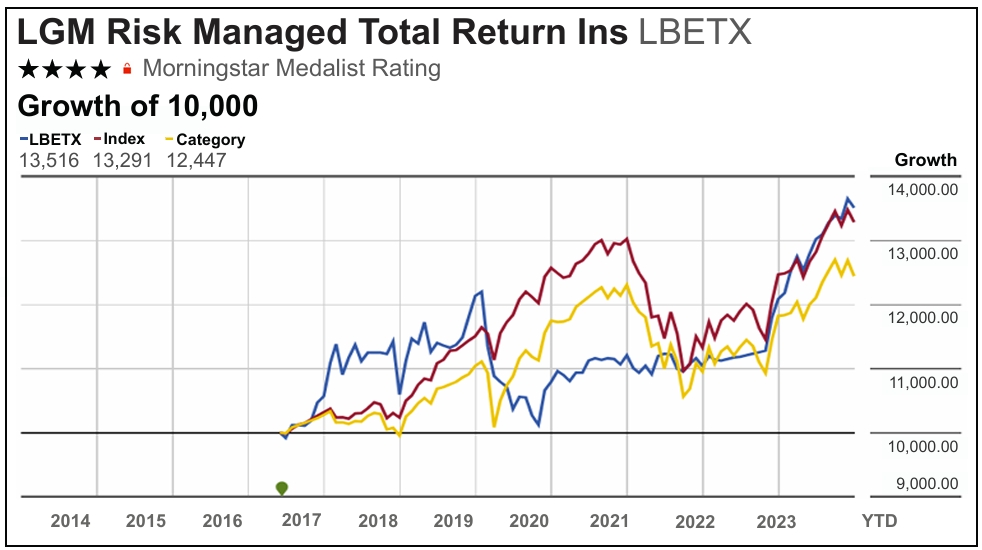
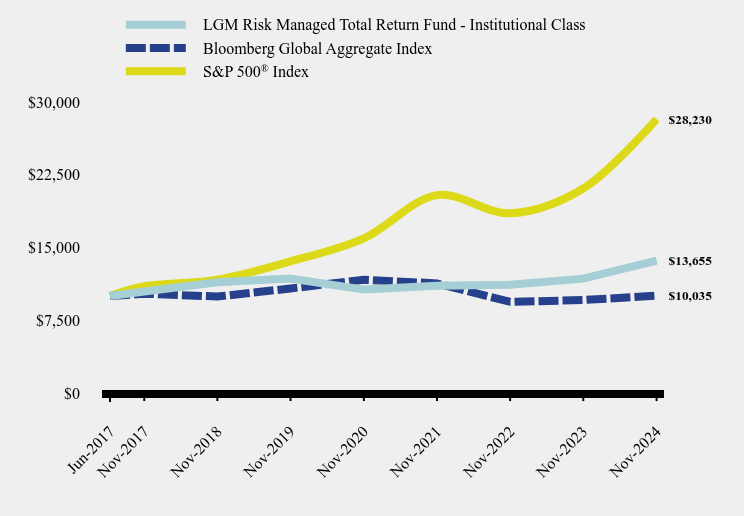
How has the Fund performed since inception?
Total Return Based on $10,000 Investment
| LGM Risk Managed Total Return Fund - Institutional Class | Bloomberg Global Aggregate Index | S&P 500® Index |
|---|
| Jun-2017 | $10,000 | $10,000 | $10,000 |
|---|
| Nov-2017 | $10,470 | $10,236 | $11,003 |
|---|
| Nov-2018 | $11,425 | $9,947 | $11,693 |
|---|
| Nov-2019 | $11,813 | $10,779 | $13,577 |
|---|
| Nov-2020 | $10,662 | $11,682 | $15,947 |
|---|
| Nov-2021 | $11,068 | $11,297 | $20,400 |
|---|
| Nov-2022 | $11,163 | $9,398 | $18,521 |
|---|
| Nov-2023 | $11,792 | $9,590 | $21,084 |
|---|
| Nov-2024 | $13,655 | $10,035 | $28,230 |
|---|
Average Annual Total Returns
| 1 Year | 5 Years | Since Inception (June 12, 2017) |
|---|
| LGM Risk Managed Total Return Fund - Institutional Class | 15.79% | 2.94% | 4.26% |
|---|
| Bloomberg Global Aggregate Index | 4.64% | -1.42% | 0.05% |
|---|
S&P 500® Index | 33.89% | 15.77% | 14.91% |
|---|
The Fund's past performance is not a good predictor of how the Fund will perform in the future. The graph and table do not reflect the deduction of taxes that a shareholder would pay on fund distributions or redemption of fund shares.
- Net Assets$15,751,193
- Number of Portfolio Holdings4
- Advisory Fee $70,775
- Portfolio Turnover73%
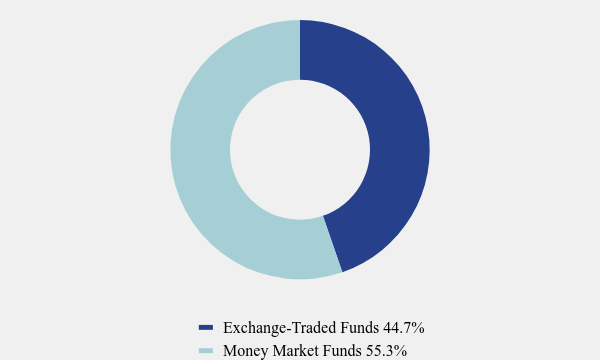
Asset Weighting (% of total investments)
| Value | Value |
|---|
| Exchange-Traded Funds | 44.7% |
| Money Market Funds | 55.3% |
What did the Fund invest in?
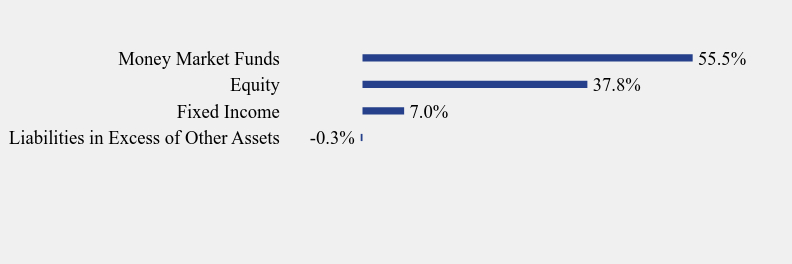
Sector Weighting (% of net assets)
| Value | Value |
|---|
| Liabilities in Excess of Other Assets | -0.3% |
| Fixed Income | 7.0% |
| Equity | 37.8% |
| Money Market Funds | 55.5% |
Top 10 Holdings (% of net assets)
| Holding Name | % of Net Assets |
| Morgan Stanley Institutional Liquidity - Treasury Portfolio, Institutional Class | 55.5% |
| SPDR S&P 500 ETF Trust | 36.3% |
| Vanguard Total Bond Market ETF | 7.0% |
| Technology Select Sector SPDR Fund | 1.5% |
No material changes occurred during the period ended November 30, 2024.
LGM Risk Managed Total Return Fund - Institutional Class (LBETX )
Semi-Annual Shareholder Report - November 30, 2024
Additional information is available on the Fund's website ( www.LGMCapitalmanagement.com ), including its:
Prospectus
Financial information
Holdings
Proxy voting information
Item 2. Code of Ethics. Not applicable.
Item 3. Audit Committee Financial Expert. Not applicable.
Item 4. Principal Accountant Fees and Services. Not applicable.
Item 5. Audit Committee of Listed Companies. Not applicable.
Item 6. Investments.
| (a) | The Registrant’s schedule of investments in unaffiliated issuers is included in the Financial Statements under Item 7 of this form. |
Item 7. Financial Statements and Financial Highlights for Open-End Management Investment Companies.
LGM Risk Managed Total Return Fund
Institutional Class – LBETX
Semi-Annual Financial Statements
November 30, 2024
| LGM RISK MANAGED TOTAL RETURN FUND |
| SCHEDULE OF INVESTMENTS (Unaudited) |
| November 30, 2024 |
| Shares | | | | | Fair Value | |
| | | | | EXCHANGE-TRADED FUNDS — 44.8% | | | | |
| | | | | EQUITY - 37.8% | | | | |
| | 9,500 | | | SPDR S&P 500 ETF Trust | | $ | 5,724,225 | |
| | 1,000 | | | Technology Select Sector SPDR Fund | | | 233,730 | |
| | | | | | | | 5,957,955 | |
| | | | | | | | | |
| | | | | FIXED INCOME – 7.0% | | | | |
| | 15,000 | | | Vanguard Total Bond Market ETF USD Class | | | 1,104,000 | |
| | | | | | | | 1,104,000 | |
| | | | | | | | | |
| | | | | TOTAL EXCHANGE-TRADED FUNDS (Cost $5,923,841) | | | 7,061,955 | |
| | | | | | | | | |
| Shares | | | | | Fair Value | |
| | | | | SHORT-TERM INVESTMENT — 55.5% | | | | |
| | | | | MONEY MARKET FUND - 55.5% | | | | |
| | 8,742,388 | | | Morgan Stanley Institutional Liquidity - Treasury Portfolio, Institutional Class, 4.51% (Cost $8,742,388)(a) | | | 8,742,388 | |
| | | | | | | | | |
| | | | | TOTAL INVESTMENTS - 100.3% (Cost $14,666,229) | | $ | 15,804,343 | |
| | | | | LIABILITIES IN EXCESS OF OTHER ASSETS - (0.3)% | | | (53,150 | ) |
| | | | | NET ASSETS - 100.0% | | $ | 15,751,193 | |
| ETF | - Exchange-Traded Fund |
| | |
| SPDR | - Standard & Poor’s Depositary Receipt |
| (a) | Rate disclosed is the seven day effective yield as of November 30, 2024. |
See accompanying notes which are an integral part of these financial statements.
| LGM Risk Managed Total Return Fund |
| STATEMENT OF ASSETS AND LIABILITIES (Unaudited) |
| November 30, 2024 |
| ASSETS | | | | |
| Investment securities: | | | | |
| At cost | | $ | 14,666,229 | |
| At fair value | | $ | 15,804,343 | |
| Interest receivable | | | 28,960 | |
| TOTAL ASSETS | | | 15,833,624 | |
| | | | | |
| LIABILITIES | | | | |
| Investment advisory fees payable | | | 12,153 | |
| Payable to related parties | | | 46,238 | |
| Accrued expenses and other liabilities | | | 24,040 | |
| TOTAL LIABILITIES | | | 82,431 | |
| NET ASSETS | | $ | 15,751,193 | |
| | | | | |
| Net Assets Consist Of: | | | | |
| Paid in capital ($0 par value, unlimited shares authorized) | | $ | 17,098,573 | |
| Accumulated losses | | | (1,347,380 | ) |
| NET ASSETS | | $ | 15,751,193 | |
| | | | | |
| Net Asset Value Per Share: | | | | |
| Institutional Class Shares: | | | | |
| Net Assets | | $ | 15,751,193 | |
| Shares of beneficial interest outstanding * | | | 1,369,058 | |
| | | | | |
| Net asset value (Net Assets ÷ Shares Outstanding), offering price and redemption price per share ** | | $ | 11.51 | |
| * | Unlimited number of shares of beneficial interest authorized, no par value. |
| ** | Redemptions made within 90 days of purchase may be assessed a redemption fee of 2.00%. |
See accompanying notes to financial statements.
| LGM Risk Managed Total Return Fund |
| STATEMENT OF OPERATIONS (Unaudited) |
| For the Six Months Ended November 30, 2024 |
| INVESTMENT INCOME | | | | |
| Dividends | | $ | 39,502 | |
| Interest | | | 196,583 | |
| TOTAL INVESTMENT INCOME | | | 236,085 | |
| | | | | |
| EXPENSES | | | | |
| Investment advisory fees | | | 70,775 | |
| Administrative services fees | | | 28,431 | |
| Transfer agent fees | | | 16,741 | |
| Accounting services fees | | | 14,823 | |
| Legal fees | | | 14,314 | |
| Compliance officer fees | | | 12,100 | |
| Audit and tax fees | | | 8,125 | |
| Trustees’ fees and expenses | | | 5,100 | |
| Third party administrative servicing fees | | | 5,550 | |
| Printing and postage expenses | | | 8,749 | |
| Registration fees | | | 4,575 | |
| Custodian fees | | | 1,801 | |
| Insurance expense | | | 915 | |
| Other expenses | | | 1,382 | |
| NET EXPENSES | | | 193,381 | |
| | | | | |
| NET INVESTMENT INCOME | | | 42,704 | |
| | | | | |
| NET REALIZED GAIN FROM INVESTMENTS | | | | |
| Net realized gain from investments | | | 811,440 | |
| Net change in unrealized appreciation on investments | | | 61,764 | |
| NET REALIZED GAIN FROM INVESTMENTS | | | 873,204 | |
| | | | | |
| NET INCREASE IN NET ASSETS RESULTING FROM OPERATIONS | | $ | 915,908 | |
See accompanying notes to financial statements.
| LGM Risk Managed Total Return Fund |
| STATEMENTS OF CHANGES IN NET ASSETS (Unaudited) |
| | | For the | | | For the | |
| | | Six Months Ended | | | Year Ended | |
| | | November 30, 2024 | | | May 31, 2024 | |
| | | | | | | |
| FROM OPERATIONS | | | | | | | | |
| Net investment income | | $ | 42,704 | | | $ | 141,272 | |
| Net realized gain from investments | | | 811,440 | | | | 463,805 | |
| Net change in unrealized appreciation on investments | | | 61,764 | | | | 1,076,350 | |
| Net increase in net assets resulting from operations | | | 915,908 | | | | 1,681,427 | |
| | | | | | | | | |
| FROM SHARES OF BENEFICIAL INTEREST | | | | | | | | |
| Proceeds from shares sold | | | 3,477,022 | | | | 1,000,012 | |
| Payments for shares redeemed | | | (1,678,759 | ) | | | (3,943,943 | ) |
| Net increase (decrease) in net assets from shares of beneficial interest | | | 1,798,263 | | | | (2,943,931 | ) |
| | | | | | | | | |
| TOTAL INCREASE (DECREASE) IN NET ASSETS | | | 2,714,171 | | | | (1,262,504 | ) |
| | | | | | | | | |
| NET ASSETS | | | | | | | | |
| Beginning of Period/Year | | | 13,037,022 | | | | 14,299,526 | |
| End of Period/Year | | $ | 15,751,193 | | | $ | 13,037,022 | |
| | | | | | | | | |
| SHARE ACTIVITY | | | | | | | | |
| Institutional Class: | | | | | | | | |
| Shares Sold | | | 310,745 | | | | 95,329 | |
| Shares Redeemed | | | (149,669 | ) | | | (405,771 | ) |
| Net decrease in shares of beneficial interest outstanding | | | 161,076 | | | | (310,442 | ) |
See accompanying notes to financial statements.
| LGM Risk Managed Total Return Fund |
| FINANCIAL HIGHLIGHTS (Unaudited) |
Per Share Data and Ratios for a Share of Beneficial Interest Outstanding Throughout each Period/Year Presented
| | | Institutional Class | |
| | | For the | | | For the | | | For the | | | For the | | | For the | | | For the | |
| | | Six Months | | | Year Ended | | | Year Ended | | | Year Ended | | | Year Ended | | | Year Ended | |
| | | November 30, 2024 | | | May 31, 2024 | | | May 31, 2023 | | | May 31, 2022 | | | May 31, 2021 | | | May 31, 2020 | |
| Net asset value, beginning of period/year | | $ | 10.79 | | | $ | 9.42 | | | $ | 9.44 | | | $ | 9.22 | | | $ | 9.58 | | | $ | 10.47 | |
| Activity from investment operations: | | | | | | | | | | | | | | | | | | | | | | | | |
| Net investment income (loss) (1) | | $ | 0.04 | | | | 0.11 | | | | 0.03 | | | | (0.18 | ) | | | (0.12 | ) | | | 0.04 | |
| Net realized and unrealized gain (loss) on investments | | $ | 0.68 | | | | 1.26 | | | | (0.05 | ) | | | 0.40 | | | | 0.32 | | | | (0.51 | ) |
| Total from investment operations | | $ | 0.72 | | | | 1.37 | | | | (0.02 | ) | | | 0.22 | | | | 0.20 | | | | (0.47 | ) |
| Redemption fees | | $ | — | | | | — | | | | — | | | | 0.00 | (2) | | | 0.00 | (2) | | | 0.00 | (2) |
| Less distributions from: | | | | | | | | | | | | | | | | | | | | | | | | |
| Net investment income | | $ | — | | | | — | | | | — | | | | — | | | | (0.06 | ) | | | (0.02 | ) |
| Net realized gains | | $ | — | | | | — | | | | — | | | | — | | | | (0.50 | ) | | | (0.40 | ) |
| Total distributions | | $ | — | | | | — | | | | — | | | | — | | | | (0.56 | ) | | | (0.42 | ) |
| Net asset value, end of period/year | | $ | 11.51 | | | $ | 10.79 | | | $ | 9.42 | | | $ | 9.44 | | | $ | 9.22 | | | $ | 9.58 | |
| | | | | | | | | | | | | | | | | | | | | | | | | |
| Total return (3) | | | 6.67 | % (7) | | | 14.54 | % | | | (0.21 | )% | | | 2.39 | % | | | 2.16 | % | | | (4.95 | )% |
| | | | | | | | | | | | | | | | | | | | | | | | | |
| Net assets, end of period/year (000s) | | $ | 15,751 | | | $ | 13,037 | | | $ | 14,300 | | | $ | 15,060 | | | $ | 19,728 | | | $ | 35,001 | |
| | | | | | | | | | | | | | | | | | | | | | | | | |
| Ratio of gross expenses to average net assets (4,5) | | | 2.73 | % (8) | | | 2.86 | % | | | 2.72 | % | | | 2.32 | % | | | 2.08 | % | | | 1.67 | % |
| Ratio of net expenses to average net assets (5) | | | 2.73 | % (8) | | | 2.86 | % | | | 2.72 | % | | | 2.32 | % | | | 1.91 | % | | | 1.55 | % |
| Ratio of net investment income (loss) to average net assets (6) | | | 0.60 | % (8) | | | 1.10 | % | | | 0.28 | % | | | (1.96 | )% | | | (1.25 | )% | | | 0.41 | % |
| Portfolio Turnover Rate | | | 73 | % (7) | | | 355 | % | | | 1361 | % | | | 3065 | % | | | 5180 | % | | | 5582 | % |
| | | | | | | | | | | | | | | | | | | | | | | | | |
| (1) | Per share amounts calculated using the average shares method, which more appropriately represents the per share data for the year. |
| (2) | Less than $0.01 per share. |
| (3) | Total returns shown exclude the effect of applicable sales charges and redemption fees and assumes reinvestment of all distributions. |
| (4) | Represents the ratio of expenses to average net assets absent fee waivers and/or expense reimbursements by the Advisor. |
| (5) | Does not include the expenses of other investment companies in which the Fund invests. |
| (6) | Recognition of net investment income (loss) by the Fund is affected by the timing and declaration of dividends by the underlying investment companies in which the Fund invests. |
See accompanying notes to financial statements.
The LGM Risk Managed Total Return Fund (the “Fund”) is a diversified series of shares of Northern Lights Fund Trust IV (the “Trust”), a statutory trust organized under the laws of the State of Delaware on June 2, 2015, and registered under the Investment Company Act of 1940, as amended (the “1940 Act”), as an open-end management investment company. The Fund commenced operations on June 12, 2017. The Fund’s objective is to provide total return from capital appreciation and income with lower volatility than the S&P 500 Index, with a secondary objective of limiting risk during unfavorable or declining market conditions. The Fund is a “fund of funds”, in that the Fund will generally invest in other investment companies.
The Fund currently offers Institutional Class shares at net asset value.
| 2. | SUMMARY OF SIGNIFICANT ACCOUNTING POLICIES |
The following is a summary of significant accounting policies consistently followed by the Fund in the preparation of its financial statements. The policies are in conformity with generally accepted accounting principles in the United States of America (’‘GAAP”), which require management to make estimates and assumptions that affect the reported amounts of assets and liabilities and disclosure of contingent assets and liabilities at the date of the financial statements and the reported amounts of increases and decreases in net assets from operations during the reporting period. Actual results could differ from those estimates. The Fund is an investment company and accordingly follows the investment company accounting and reporting guidance of the Financial Accounting Standards Board (“FASB”) Accounting Standards Codification Topic 946 “Financial Services – Investment Companies”, including Accounting Standards Update 2013-08.
Security Valuation – The Fund records its investments at fair value. Securities listed on an exchange are valued at the last reported sale price at the close of the regular trading session of the exchange on the business day the value is being determined or, in the case of securities listed on NASDAQ, at the NASDAQ Official Closing Price. In the absence of a sale, such securities shall be valued at the mean between the current bid and ask prices on the day of valuation. Short-term debt obligations having 60 days or less remaining until maturity at time of purchase may be valued at amortized cost. Investments in open-end investment companies are valued at net asset value, including the short-term investment currently held.
The Fund may hold investments, such as private investments, interests in commodity pools, other non-traded securities or temporarily illiquid investments, for which market quotations are not readily available or are determined to be unreliable. These securities are valued using the “fair value” procedures approved by the Board of Trustees (“Board”). The Board has delegated execution of these procedures to a fair value committee composed of one or more representatives from each of the (i) Trust, (ii) administrator, and (iii) adviser. The committee may also enlist third party consultants such as a valuation specialist at a public accounting firm, valuation consultant, or financial officer of a security issuer on an as-needed basis to assist in determining a security-specific fair value.
Valuation of Underlying Funds – The Fund may invest in portfolios of open-end or closed-end investment companies (the “Underlying Funds”). Mutual funds, including money market funds, are valued at their respective net asset values as reported by such investment companies. Exchange-traded funds (“ETFs”) are valued at the last reported sale price or official closing price. Open-end investment companies value securities in their portfolios for which market quotations are readily available at their market values (generally the last reported sale price) and all other securities and assets at their fair value pursuant to the methods established by the board of directors of the open-end funds. The shares of many closed-end investment companies and ETFs, after their initial public offering, frequently trade at a price per share, which is different than the net asset value per share. The difference represents a market premium or market discount of such shares. There can be no assurances that the market discount or market premium on shares of any closed-end investment company or ETF purchased by the Fund will not change.
Fair Valuation Process – As noted above, the fair value committee is composed of one or more representatives from each of the (i) Trust, (ii) administrator, and (iii) adviser. Applicable investments are valued collectively via inputs from each of these groups. For example, fair value determinations are required for the following securities: (i) securities for which market quotations are insufficient or not readily available on a particular business day (including securities for which there is a short and temporary lapse in the provision of a price by the regular pricing source); (ii) securities for which, in the judgment of the adviser, the prices or values available do not represent the fair value of the instrument. Factors which may cause the adviser to make such a judgment include, but are not limited to, the following: only a bid price or an ask price is available; the spread between bid and ask prices is substantial; the frequency of sales; the thinness of the market; the size of
reported trades; and actions of the securities markets, such as the suspension or limitation of trading; (iii) securities determined to be illiquid; (iv) securities with respect to which an event that will affect the value thereof has occurred (a “significant event”) since the closing prices were established on the principal exchange on which they are traded, but prior to the Fund’s calculation of its net asset value. Restricted or illiquid investments, such as private investments or non-traded securities are valued via inputs from the adviser based upon the current bid for the security from two or more independent dealers or other parties reasonably familiar with the facts and circumstances of the security (who should take into consideration all relevant factors as may be appropriate under the circumstances). If the adviser is unable to obtain a current bid from such independent dealers or other independent parties, the fair value committee shall determine the fair value of such security using the following factors: (i) the type of security; (ii) the cost at date of purchase; (iii) the size and nature of the Fund’s holdings; (iv) the discount from market value of unrestricted securities of the same class at the time of purchase and subsequent thereto; (v) information as to any transactions or offers with respect to the security; (vi) the nature and duration of restrictions on disposition of the security and the existence of any registration rights; (vii) how the yield of the security compares to similar securities of companies of similar or equal creditworthiness; (viii) the level of recent trades of similar or comparable securities; (ix) the liquidity characteristics of the security; (x) current market conditions; and (xi) the market value of any securities into which the security is convertible or exchangeable.
The Fund utilizes various methods to measure the fair value of all of its investments on a recurring basis. GAAP establishes a hierarchy that prioritizes inputs to valuation methods. The three levels of inputs are:
Level 1 – Unadjusted quoted prices in active markets for identical assets and liabilities that the Fund has the ability to access.
Level 2 – Observable inputs other than quoted prices included in Level 1 that are observable for the asset or liability, either directly or indirectly. These inputs may include quoted prices for the identical instrument on an inactive market, prices for similar instruments, interest rates, prepayment speeds, credit risk, yield curves, default rates and similar data.
Level 3 – Unobservable inputs for the asset or liability, to the extent relevant observable inputs are not available, representing the Fund’s own assumptions about the assumptions a market participant would use in valuing the asset or liability, and would be based on the best information available.
The availability of observable inputs can vary from security to security and is affected by a wide variety of factors, including, for example, the type of security, whether the security is new and not yet established in the marketplace, the liquidity of markets, and other characteristics particular to the security. To the extent that valuation is based on models or inputs that are less observable or unobservable in the market, the determination of fair value requires more judgment. Accordingly, the degree of judgment exercised in determining fair value is greatest for instruments categorized in Level 3.
The inputs used to measure fair value may fall into different levels of the fair value hierarchy. In such cases, for disclosure purposes, the level in the fair value hierarchy within which the fair value measurement falls in its entirety, is determined based on the lowest level input that is significant to the fair value measurement in its entirety.
The inputs or methodology used for valuing securities are not necessarily an indication of the risk associated with investing in those securities. The following table summarizes the inputs used as of November 30, 2024, for the Fund’s investments measured at fair value:
| Assets* | | Level 1 | | | Level 2 | | | Level 3 | | | Total | |
| Exchange-Traded Fund | | $ | 7,061,955 | | | $ | — | | | $ | — | | | $ | 7,061,955 | |
| Short-Term Investments | | | 8,742,388 | | | | — | | | | — | | | | 8,742,388 | |
| Total | | $ | 15,804,343 | | | $ | — | | | $ | — | | | $ | 15,804,343 | |
The Fund did not hold any level 2 or 3 securities during the period.
| * | Refer to the Schedule of Investments for classifications. |
Exchange Traded Funds – The Fund may invest in ETFs. ETFs are a type of fund bought and sold on a securities exchange. An ETF trades like common stock. An index ETF represents a fixed portfolio of securities designed to track the performance and dividend yield of a particular domestic or foreign market index. The risks of owning an ETF generally reflect the risks of owning the underlying securities in their portfolio, although the lack of liquidity on an ETF could result in it being more volatile. Additionally, ETFs have fees and expenses that reduce their value.
Security Transactions and Related Income – Security transactions are accounted for on the trade date. Interest income is recognized on an accrual basis. Discounts are accreted and premiums are amortized on securities purchased over the lives of the respective securities using the effective yield method. Dividend income is recorded on the ex-dividend date. Realized gains or losses from sales of securities are determined by comparing the identified cost of the security lot sold with the net sales proceeds. Dividends that represent long-term capital gain distributions from underlying investments are reclassified out of dividend income and presented separately for financial reporting purposes. The Fund holds certain investments which pay dividends to their shareholders based upon available funds from operations. Distributions received from investments in securities that represent a return of capital or long-term capital gains are recorded as a reduction of the cost of investments or as a realized gain, respectively.
Distributions to Shareholders – Dividends from net investment income are declared and paid at least annually. Distributions from net realized capital gains, if any, are declared and paid annually. Dividends and distributions to shareholders are recorded on the ex -dividend date and are determined in accordance with federal income tax regulations, which may differ from GAAP. These “book/tax” differences are considered either temporary (e.g., deferred losses, capital loss carryforwards) or permanent in nature. To the extent these differences are permanent in nature, such amounts are reclassified within the composition of net assets based on their federal tax -basis treatment; temporary differences do not require reclassification. These reclassifications have no effect on net assets, results from operations or net asset values per share of the Fund.
Federal Income Taxes – The Fund qualifies as a regulated investment company by complying with the provisions of the Internal Revenue Code of 1986, as amended, that are applicable to regulated investment companies and to distribute substantially all of its taxable income and net realized gains to shareholders. Therefore, no federal income tax provision has been recorded. The Fund recognizes the tax benefits of uncertain tax positions only where the position is “more likely than not” to be sustained assuming examination by tax authorities. Management has analyzed the Fund’s tax positions and has concluded that no liability for unrecognized tax benefits should be recorded related to uncertain tax positions taken on returns filed for open tax years ended May 31, 2022 through May 31, 2024, or expected to be taken in the Fund’s May 31, 2025 year-end tax returns. The Fund recognizes interest and penalties, if any, related to unrecognized tax benefits as income tax expense in the Statement of Operations. During the six months ended November 30, 2024, the Fund did not incur any interest or penalties. The Fund identified its major tax jurisdictions as U.S. Federal, Ohio, and foreign jurisdictions where the Fund makes significant investments. The Fund is not aware of any tax positions for which it is reasonably possible that the total amounts of unrecognized tax benefits will change materially in the next twelve months.
Expenses – Expenses of the Trust that are directly identifiable to a specific fund are charged to that fund. Expenses, which are not readily identifiable to a specific fund, are allocated in such a manner as deemed equitable (as determined by the Board), taking into consideration the nature and type of expense and the relative sizes of the funds in the Trust.
Cash and Cash Equivalents – Cash and cash equivalents, if any, are held with a financial institution. The assets of the Fund may be placed in deposit accounts at U.S. banks and such deposits generally exceed Federal Deposit Insurance Corporation (“FDIC”) insurance limits. The FDIC insures deposit accounts up to $250,000 for each accountholder. The Fund maintains cash balances, which, at times, may exceed federally insured limits. The counterparty is generally a single bank rather than a group of financial institutions; thus there may be a greater counterparty credit risk. The Fund places deposits only with those counterparties which are believed to be creditworthy and there has been no history of loss.
Indemnification – The Trust indemnifies its officers and Trustees for certain liabilities that may arise from the performance of their duties to the Trust. Additionally, in the normal course of business, the Fund enters into contracts that contain a variety of representations and warranties and which provide general indemnities. The Fund’s maximum exposure under these arrangements is unknown, as this would involve future claims that may be made against the Fund that have not yet occurred. However, based on experience, the risk of loss due to these warranties and indemnities appears to be
remote.
| 3. | INVESTMENT TRANSACTIONS |
For the six months ended November 30, 2024, cost of purchases and proceeds from sales of portfolio securities, excluding short-term investments, amounted to $509,891 and $4,728,711, respectively.
| 4. | INVESTMENT ADVISORY AGREEMENT AND TRANSACTIONS WITH RELATED PARTIES |
LGM Capital Management, LLC serves as the Fund’s investment adviser (the “Adviser”). Pursuant to an advisory agreement with the Trust on behalf of the Fund, the Adviser, under the oversight of the Board, directs the daily operations of the Fund and supervises the performance of administrative and professional services provided by others. As compensation for its services and the related expenses borne by the Adviser, the Fund pays the Adviser a fee computed and accrued daily and paid monthly, based on the Fund’s average daily net assets and is computed at the annual rate of 1.00%. Pursuant to the advisory agreement, the Fund accrued $70,775 in advisory fees for the six months ended November 30, 2024.
Prior to October 1, 2020, the Adviser had contractually agreed to reduce its fees and/or absorb expenses of the Fund (“Waiver Agreement”) to ensure that Total Annual Fund Operating Expenses After Fee Waiver and/or Reimbursement (exclusive fees and expenses associated with investments in other collective investment vehicles or derivative instruments (including for example option and swap fees and expenses) and derivatives of any front-end or contingent deferred loads; brokerage fees and commissions, acquired fund fees and expenses; borrowing costs (such as interest and dividend expense on securities sold short); taxes; and extraordinary expenses, such as litigation expenses (which may include indemnification of Fund officers and Trustees, contractual indemnification of Fund service providers (other than the Adviser))), did not exceed 1.55% of the daily average net assets attributable to Institutional Class shares. This expense limitation expired on September 30, 2020. These fee waivers and reimbursements were subject to possible recoupment from the Fund by the Adviser (within the three years after the fees have been waived or reimbursed) if such recoupment could be achieved within the lesser of the expense limitation in place at the time of wavier and the expense limitation in place at the time of recapture. During the six months ended November 30, 2024, the Fund recaptured $0, the remaining recapturable balance of $43,058, expired on September 30, 2023.
As of October 1, 2024, the Adviser has contractually agreed to reduce its fees and/or absorb expenses of the Fund, until at least September 30, 2025, to ensure that Total Annual Fund Operating Expenses after Fee Waiver and/or Reimbursement excluding (i) any front-end or contingent deferred loads; (ii) brokerage fees and commissions, (iii) acquired fund fees and expenses; (iv) fees and expenses associated with investments in other collective investment vehicles or derivative instruments (including for example option and swap fees and expenses); (v) borrowing costs (such as interest and dividend expense on securities sold short); (vi) taxes; and (vii) extraordinary expenses, such as litigation expenses (which may include indemnification of Fund officers and Trustees, and contractual indemnification of Fund service providers (other than the Adviser)) will not exceed 2.79% of the Fund’s net assets, subject to possible recoupment from the Fund in future years within the three years from the date the fees have been waived or reimbursed if such recoupment can be achieved within the lesser of the expense limitations in place at the time of waiver and the expense limitation in place at the time of recapture after the recoupment is taken into account. During the period ended November 30, 2024, the Adviser did not waive any fees or reimburse any expenses.
In addition, certain affiliates of the Northern Lights Distributors, LLC (the “Distributor”) provide services to the Fund as follows:
Ultimus Fund Solutions, LLC (“UFS”), an affiliate of the Distributor, provides administration, fund accounting, and transfer agent services to the Trust. Pursuant to a separate servicing agreement with UFS, the Fund pays UFS customary fees for providing administration, fund accounting and transfer agency services to the Fund as shown in the Statement of Operations. Certain officers of the Trust are also officers of UFS and are not paid any fees directly by the Fund for serving in such capacities.
Northern Lights Compliance Services, LLC (“NLCS”), an affiliate of UFS and the Distributor, provides a Chief Compliance Officer to the Trust, as well as related compliance services, pursuant to a consulting agreement between NLCS and the Trust. Under the terms of such agreement, NLCS receives customary fees from the Fund which are included in “Compliance officer fees” in the Statement of Operations.
Blu Giant, LLC (“Blu Giant”), an affiliate of UFS and the Distributor, provides EDGAR conversion and filing services as well as print management services for the Fund on an ad-hoc basis as shown in the Statement of Operations. For the provision of these services, Blu Giant receives customary fees from the Fund which are included in “Printing and postage expenses” in the Statement of Operations.
| 5. | DISTRIBUTIONS TO SHAREHOLDERS AND TAX COMPONENTS OF CAPITAL |
The Statement of Assets and Liabilities represents cost for financial reporting purposes. Aggregate cost for federal tax purposes is $14,666,229 for the Fund.
| Unrealized Appreciation | | $ | 1,138,114 | |
| Unrealized Depreciation | | | — | |
| Tax Net Unrealized Appreciation | | $ | 1,138,114 | |
There were no Fund distributions for the year ended May 31, 2024 and May 31, 2023.
As of May 31, 2024, the components of accumulated earnings/(deficit) on a tax basis were as follows:
| Undistributed | | | Undistributed | | | Post October Loss | | | Capital Loss | | | Other | | | Unrealized | | | Total | |
| Ordinary | | | Long-Term | | | and | | | Carry | | | Book/Tax | | | Appreciation/ | | | Distributable Earnings/ | |
| Income | | | Gains | | | Late Year Loss | | | Forwards | | | Differences | | | (Depreciation) | | | (Accumulated Deficit) | |
| $ | 141,272 | | | $ | — | | | $ | — | | | $ | (3,480,910 | ) | | $ | — | | | $ | 1,076,350 | | | $ | (2,263,288 | ) |
At May 31, 2024, the Fund had capital loss carry forwards for federal income tax purposes available to offset future capital gains and utilized capital loss carryforwards as follows:
| Non-expiring Short-Term | | | Non-expiring Long-Term | | | Total | | | CLCF Utilized | |
| $ | 3,480,910 | | | $ | — | | | $ | 3,480,910 | | | $ | 463,805 | |
The Fund may assess a short-term redemption fee of 2.00% of the total redemption amount if shareholders sell their shares after holding them for less than ninety days. The redemption fee is paid directly to the Fund. Please refer to the Statements of Changes in Net Assets for the collected redemption fees.
The beneficial ownership, either directly or indirectly, of more than 25% of voting securities of the Fund creates a presumption of control of the Fund, under Section 2(a)(9) of the 1940 Act. As of November 30, 2024, Charles Schwab & Co. and SEI Private Trust Company held 60.66% and 38.02%, respectively, of the voting securities and may be deemed to control the Fund.
| 8. | UNDERLYING INVESTMENT IN OTHER INVESTMENT COMPANIES |
The Fund currently seeks to achieve its investment objectives by investing its assets in Underlying Funds. As of November 30, 2024, the percentage of the Fund’s net assets invested in the Morgan Stanley Institutional Liquidity - Treasury Portfolio, Institutional Class was 55.5%, SPDR S&P 500 ETF Trust was 36.3%, Technology Select Sector SPDR Fund was 1.5% and Vanguard Total Bond Market ETF USD Class was 7.0% (the “Securities”). The Fund may sell its investments in the Securities at any time if the Adviser determines that it is in the best interest of the Fund and its shareholders to do so.
The performance of the Fund will be directly affected by the performance of these investments. The annual reports of the Securities, along with the reports of the independent registered public accounting firm is available at “www.sec.gov”.
Subsequent events after the date of the Statement of Assets and Liabilities have been evaluated through the date the financial statements were issued. Management has determined that no events or transactions, other than what is disclosed below, occurred requiring adjustment or disclosure in the financial statements.
As of December 16, 2024, the Adviser has contractually agreed to reduce the Fund’s fees and/or absorb expenses of the Fund, until at least September 30, 2025, to ensure the total annual fund operating expenses after fee waiver and/or reimbursement will not exceed 2.62% of the Fund’s assets.
PROXY VOTING POLICY
Information regarding how the Fund votes proxies related to portfolio securities for the twelve month period ended June 30, as well as a description of the policies and procedures that the Fund used to determine how to vote proxies is available without charge, upon request, by calling 1-844-655-9371 or by referring to the Securities and Exchange Commission’s website at http:www/sec.gov.
LGM-SAR24
Item 8. Changes in and Disagreements with Accountants for Open-End Management Investment Companies.
Not applicable.
Item 9. Proxy Disclosures for Open-End Management Investment Companies.
Included under Item 7
Item 10. Remuneration Paid to Directors, Officers, and Others of Open-End Management Investment Companies.
Included under Item 7
Item 11. Statement Regarding Basis for Approval of Investment Advisory Contract.
Included under Item 7
Item 12. Disclosure of Proxy Voting Policies and Procedures for Closed-End Management Investment Companies.
Not applicable.
Item 13. Portfolio Managers of Closed-End Management Investment Companies.
Not applicable.
Item 14. Purchases of Equity Securities by Closed-End Management Investment Company and Affiliated Purchasers.
Not applicable.
Item 15. Submission of Matters to a Vote of Security Holders.
None
Item 16. Controls and Procedures
(a) The registrant’s Principal Executive Officer and Principal Financial Officer have concluded that the registrant’s disclosure controls and procedures (as defined in Rule 30a-3(c) under the Act) are effective in design and operation as of a date within 90 days of this report on Form N-CSR, based on their evaluation of these disclosure controls and procedures as required by Rule 30a-3(b) under the Act.
(b) There were no changes in the registrant’s internal control over financial reporting (as defined in Rule 30a-3(d) under the Act) during the period covered by this report that have materially affected, or are reasonably likely to materially affect, the registrant’s internal control over financial reporting.
Item 17. Disclosure of Securities Lending Activities for Closed-End Management Investment Companies.
Not applicable.
Item 18. Recovery of Erroneously Awarded Compensation.
Item 19. Exhibits.
(a)(1) Not applicable.
(a)(2) Not applicable.
(a)(3) A separate certification for each principal executive officer and principal financial officer of the registrant as required by Rule 30a-2(a) under the Act (17 CFR 270.30a-2(a)): Attached hereto.
(a)(4) Not applicable.
(b) Certifications required by Rule 30a-2(b) under the Act (17 CFR 270.30a-2(b)): Attached hereto.
SIGNATURES
Pursuant to the requirements of the Securities Exchange Act of 1934 and the Investment Company Act of 1940, the registrant has duly caused this report to be signed on its behalf by the undersigned, thereunto duly authorized.
(Registrant) Northern Lights Fund Trust IV
| By (Signature and Title) | |
| /s/ Wendy Wang | |
| Wendy Wang, Principal Executive Officer/President |
| | |
Pursuant to the requirements of the Securities Exchange Act of 1934 and the Investment Company Act of 1940, this report has been signed below by the following persons on behalf of the registrant and in the capacities and on the dates indicated.
| By (Signature and Title) | |
| /s/ Wendy Wang | |
| Wendy Wang, Principal Executive Officer/President |
| | |
| By (Signature and Title) | |
| /s/ Sam Singh | |
| Sam Singh, Principal Financial Officer/Treasurer |
| | |