UNITED STATES
SECURITIES AND EXCHANGE COMMISSION
WASHINGTON, D.C. 20549
FORM N-CSR
CERTIFIED SHAREHOLDER REPORT OF REGISTERED MANAGEMENT
INVESTMENT COMPANIES
| Investment Company Act file number | 811-23066 |
| Northern Lights Fund Trust IV |
| (Exact name of registrant as specified in charter) |
| 225 Pictoria Drive, Suite 450, Cincinnati, Ohio | 45246 |
| (Address of principal executive offices) | (Zip code) |
| The Corporation Trust Company |
| 1209 Orange Street Wilmington, DE 19801 |
| (Name and address of agent for service) |
| Registrant’s telephone number, including area code: | 631-470-2600 |
| Date of fiscal year end: | 5/31 | |
| | | |
| Date of reporting period: | 11/30/24 | |
Item 1. Reports to Stockholders.
(BAMA) Cboe BZX Exchange, Inc.
Semi-Annual Shareholder Report - November 30, 2024
This semi-annual shareholder report contains important information about Brookstone Active ETF for the period of June 1, 2024 to November 30, 2024. You can find additional information about the Fund at https://www.brookstoneam.com/brookstone-active-etf. You can also request this information by contacting us at 1-888-562-8880.
What were the Fund’s costs for the reporting period?
(based on a hypothetical $10,000 investment)
| Fund Name | Costs of a $10,000 investment | Costs paid as a percentage of a $10,000 investment |
|---|
| Brookstone Active ETF | $50 | 0.95% |
|---|
- Net Assets$40,140,372
- Number of Portfolio Holdings5
- Advisory Fee (net of waivers)$114,319
- Portfolio Turnover0%
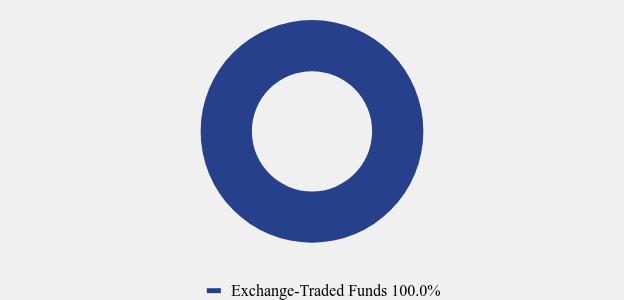
Asset Weighting (% of total investments)
| Value | Value |
|---|
| Exchange-Traded Funds | 100.0% |
What did the Fund invest in?
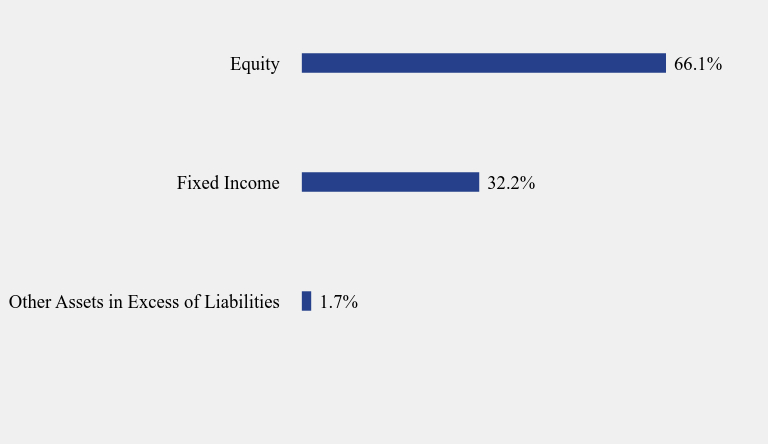
Sector Weighting (% of net assets)
| Value | Value |
|---|
| Other Assets in Excess of Liabilities | 1.7% |
| Fixed Income | 32.2% |
| Equity | 66.1% |
Top 10 Holdings (% of net assets)
| Holding Name | % of Net Assets |
| SPDR Portfolio S&P 500 Growth ETF | 23.1% |
| SPDR Portfolio S&P 500 ETF | 22.1% |
| SPDR Portfolio S&P 500 Value ETF | 20.9% |
| SPDR Portfolio Aggregate Bond ETF | 16.4% |
| iShares 0-3 Month Treasury Bond ETF | 15.8% |
No material changes occurred during the period ended November 30, 2024.
Semi-Annual Shareholder Report - November 30, 2024
Where can I find additional information about the Fund?
This semi-annual shareholder report contains important information about Brookstone Active ETF for the period of June 1, 2024 to November 30, 2024. You can find additional information about the Fund at https://www.brookstoneam.com/brookstone-active-etf. You can also request this information by contacting us at 1-888-562-8880.
Prospectus
Financial information
Holdings
Proxy voting information
Brookstone Dividend Stock ETF
(BAMD) Cboe BZX Exchange, Inc.
Semi-Annual Shareholder Report - November 30, 2024
This semi-annual shareholder report contains important information about Brookstone Dividend Stock ETF for the period of June 1, 2024 to November 30, 2024. You can find additional information about the Fund at https://www.brookstoneam.com/brookstone-dividend-stock-etf. You can also request this information by contacting us at 1-888-562-8880.
What were the Fund’s costs for the reporting period?
(based on a hypothetical $10,000 investment)
| Fund Name | Costs of a $10,000 investment | Costs paid as a percentage of a $10,000 investment |
|---|
| Brookstone Dividend Stock ETF | $52 | 0.95% |
|---|
- Net Assets$93,797,658
- Number of Portfolio Holdings30
- Advisory Fee $271,328
- Portfolio Turnover8%
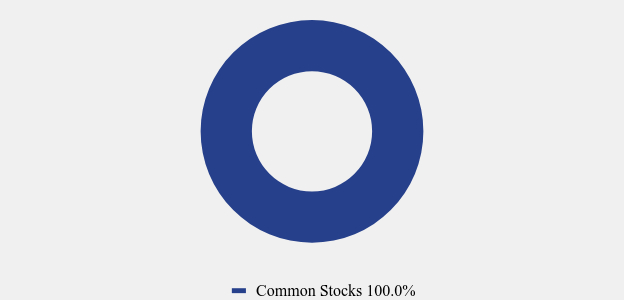
Asset Weighting (% of total investments)
| Value | Value |
|---|
| Common Stocks | 100.0% |
What did the Fund invest in?
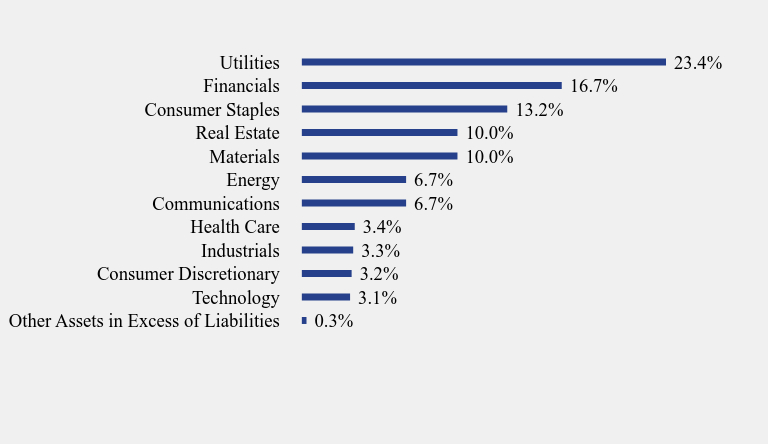
Sector Weighting (% of net assets)
| Value | Value |
|---|
| Other Assets in Excess of Liabilities | 0.3% |
| Technology | 3.1% |
| Consumer Discretionary | 3.2% |
| Industrials | 3.3% |
| Health Care | 3.4% |
| Communications | 6.7% |
| Energy | 6.7% |
| Materials | 10.0% |
| Real Estate | 10.0% |
| Consumer Staples | 13.2% |
| Financials | 16.7% |
| Utilities | 23.4% |
Top 10 Holdings (% of net assets)
| Holding Name | % of Net Assets |
| FMC Corporation | 3.4% |
| US Bancorp | 3.4% |
| Verizon Communications, Inc. | 3.4% |
| Crown Castle, Inc. | 3.4% |
| Gilead Sciences, Inc. | 3.4% |
| T Rowe Price Group, Inc. | 3.4% |
| NiSource, Inc. | 3.4% |
| Kinder Morgan, Inc. | 3.4% |
| Kraft Heinz Company (The) | 3.4% |
| Entergy Corporation | 3.4% |
No material changes occurred during the period ended May 31, 2024.
Brookstone Dividend Stock ETF
Semi-Annual Shareholder Report - November 30, 2024
Where can I find additional information about the Fund?
This semi-annual shareholder report contains important information about Brookstone Dividend Stock ETF for the period of June 1, 2024 to November 30, 2024. You can find additional information about the Fund at https://www.brookstoneam.com/brookstone-dividend-stock-etf. You can also request this information by contacting us at 1-888-562-8880.
Prospectus
Financial information
Holdings
Proxy voting information
Brookstone Growth Stock ETF
(BAMG) Cboe BZX Exchange, Inc.
Semi-Annual Shareholder Report - November 30, 2024
This semi-annual shareholder report contains important information about Brookstone Growth Stock ETF for the period of June 1, 2024 to November 30, 2024. You can find additional information about the Fund at https://www.brookstoneam.com/brookstone-growth-stock-etf. You can also request this information by contacting us at 1-888-562-8880.
What were the Fund’s costs for the reporting period?
(based on a hypothetical $10,000 investment)
| Fund Name | Costs of a $10,000 investment | Costs paid as a percentage of a $10,000 investment |
|---|
| Brookstone Growth Stock ETF | $52 | 0.95% |
|---|
- Net Assets$103,128,924
- Number of Portfolio Holdings30
- Advisory Fee $285,897
- Portfolio Turnover15%
Asset Weighting (% of total investments)
| Value | Value |
|---|
| Common Stocks | 100.0% |
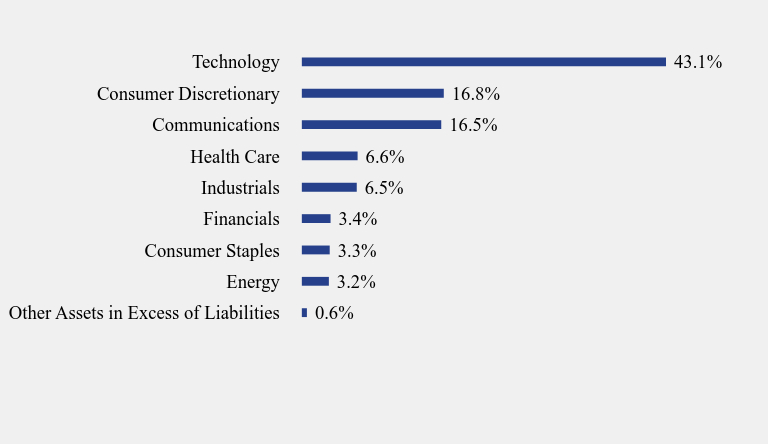
What did the Fund invest in?
Sector Weighting (% of net assets)
| Value | Value |
|---|
| Other Assets in Excess of Liabilities | 0.6% |
| Energy | 3.2% |
| Consumer Staples | 3.3% |
| Financials | 3.4% |
| Industrials | 6.5% |
| Health Care | 6.6% |
| Communications | 16.5% |
| Consumer Discretionary | 16.8% |
| Technology | 43.1% |
Top 10 Holdings (% of net assets)
| Holding Name | % of Net Assets |
| Veeva Systems, Inc., Class A | 3.4% |
| Las Vegas Sands Corporation | 3.5% |
| McDonald's Corporation | 3.4% |
| Snowflake, Inc. | 3.4% |
| ServiceNow, Inc. | 3.4% |
| CME Group, Inc. | 3.4% |
| Tyler Technologies, Inc. | 3.4% |
| Apple, Inc. | 3.4% |
| Teradyne, Inc. | 3.4% |
| UnitedHealth Group, Inc. | 3.3% |
No material changes occurred during the period ended November 30, 2024.
Brookstone Growth Stock ETF
Semi-Annual Shareholder Report - November 30, 2024
Where can I find additional information about the Fund?
This semi-annual shareholder report contains important information about Brookstone Growth Stock ETF for the period of June 1, 2024 to November 30, 2024. You can find additional information about the Fund at https://www.brookstoneam.com/brookstone-growth-stock-etf. You can also request this information by contacting us at 1-888-562-8880.
Prospectus
Financial information
Holdings
Proxy voting information
Brookstone Intermediate Bond ETF
(BAMB) Cboe BZX Exchange, Inc.
Semi-Annual Shareholder Report - November 30, 2024
This semi-annual shareholder report contains important information about Brookstone Intermediate Bond ETF for the period of June 1, 2024 to November 30, 2024. You can find additional information about the Fund at https://www.brookstoneam.com/brookstone-intermediate-bond-etf. You can also request this information by contacting us at 1-888-562-8880.
What were the Fund’s costs for the reporting period?
(based on a hypothetical $10,000 investment)
| Fund Name | Costs of a $10,000 investment | Costs paid as a percentage of a $10,000 investment |
|---|
| Brookstone Intermediate Bond ETF | $48 | 0.95% |
|---|
- Net Assets$57,722,495
- Number of Portfolio Holdings5
- Advisory Fee $184,346
- Portfolio Turnover0%
Asset Weighting (% of total investments)
| Value | Value |
|---|
| Exchange-Traded Funds | 100.0% |
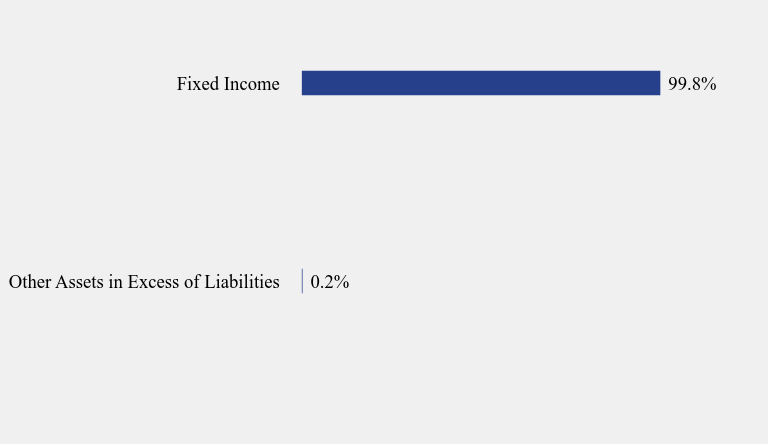
What did the Fund invest in?
Sector Weighting (% of net assets)
| Value | Value |
|---|
| Other Assets in Excess of Liabilities | 0.2% |
| Fixed Income | 99.8% |
Top 10 Holdings (% of net assets)
| Holding Name | % of Net Assets |
| iShares 7-10 Year Treasury Bond ETF | 20.1% |
| iShares 3-7 Year Treasury Bond ETF | 20.0% |
| SPDR Portfolio Intermediate Term Treasury ETF | 19.9% |
| Schwab Intermediate-Term U.S. Treasury ETF | 19.9% |
| iShares 1-5 Year Investment Grade Corporate Bond | 19.9% |
No material changes occurred during the period ended November 30, 2024.
Brookstone Intermediate Bond ETF
Semi-Annual Shareholder Report - November 30, 2024
Where can I find additional information about the Fund?
This semi-annual shareholder report contains important information about Brookstone Intermediate Bond ETF for the period of June 1, 2024 to November 30, 2024. You can find additional information about the Fund at https://www.brookstoneam.com/brookstone-intermediate-bond-etf. You can also request this information by contacting us at 1-888-562-8880.
Prospectus
Financial information
Holdings
Proxy voting information
Brookstone Opportunities ETF
(BAMO) Cboe BZX Exchange, Inc.
Semi-Annual Shareholder Report - November 30, 2024
This semi-annual shareholder report contains important information about Brookstone Opportunities ETF for the period of June 1, 2024 to November 30, 2024. You can find additional information about the Fund at https://www.brookstoneam.com/brookstone-opportunities-etf. You can also request this information by contacting us at 1-888-562-8880.
What were the Fund’s costs for the reporting period?
(based on a hypothetical $10,000 investment)
| Fund Name | Costs of a $10,000 investment | Costs paid as a percentage of a $10,000 investment |
|---|
| Brookstone Opportunities ETF | $50 | 0.95% |
|---|
- Net Assets$37,968,604
- Number of Portfolio Holdings5
- Advisory Fee (net of waivers)$105,667
- Portfolio Turnover0%
Asset Weighting (% of total investments)
| Value | Value |
|---|
| Exchange-Traded Funds | 100.0% |
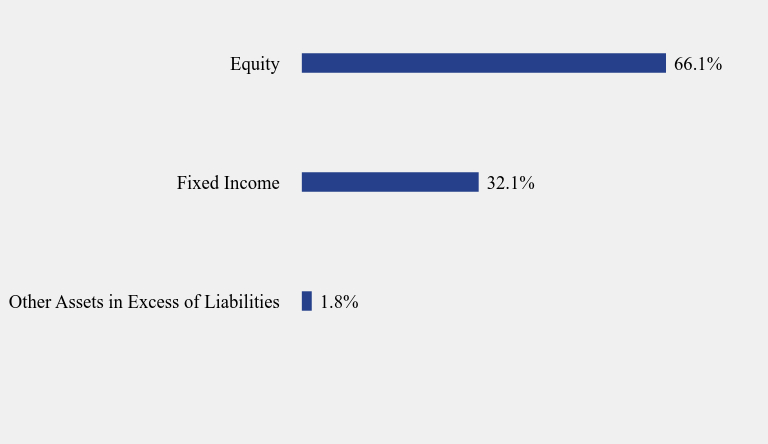
What did the Fund invest in?
Sector Weighting (% of net assets)
| Value | Value |
|---|
| Other Assets in Excess of Liabilities | 1.8% |
| Fixed Income | 32.1% |
| Equity | 66.1% |
Top 10 Holdings (% of net assets)
| Holding Name | % of Net Assets |
| Invesco Nasdaq 100 ETF | 22.8% |
| Vanguard S&P 500 ETF | 22.2% |
| SPDR Dow Jones Industrial Average ETF Trust | 21.1% |
| SPDR Bloomberg 1-3 Month T-Bill ETF | 16.1% |
| iShares 0-3 Month Treasury Bond ETF | 16.0% |
No material changes occurred during the period ended November 30, 2024.
Brookstone Opportunities ETF
Semi-Annual Shareholder Report - November 30, 2024
Where can I find additional information about the Fund?
This semi-annual shareholder report contains important information about Brookstone Opportunities ETF for the period of June 1, 2024 to November 30, 2024. You can find additional information about the Fund at https://www.brookstoneam.com/brookstone-opportunities-etf. You can also request this information by contacting us at 1-888-562-8880.
Prospectus
Financial information
Holdings
Proxy voting information
Brookstone Ultra-Short Bond ETF
(BAMU) Cboe BZX Exchange, Inc.
Semi-Annual Shareholder Report - November 30, 2024
This semi-annual shareholder report contains important information about Brookstone Ultra-Short Bond ETF for the period of June 1, 2024 to November 30, 2024. You can find additional information about the Fund at https://www.brookstoneam.com/brookstone-ultra-short-bond-etf. You can also request this information by contacting us at 1-888-562-8880.
What were the Fund’s costs for the reporting period?
(based on a hypothetical $10,000 investment)
| Fund Name | Costs of a $10,000 investment | Costs paid as a percentage of a $10,000 investment |
|---|
| Brookstone Ultra-Short Bond ETF | $48 | 0.95% |
|---|
- Net Assets$65,051,251
- Number of Portfolio Holdings5
- Advisory Fee $208,191
- Portfolio Turnover0%
Asset Weighting (% of total investments)
| Value | Value |
|---|
| Exchange-Traded Funds | 100.0% |
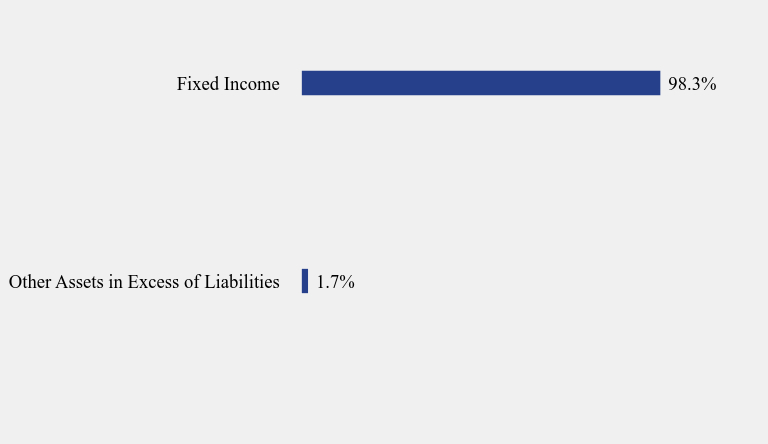
What did the Fund invest in?
Sector Weighting (% of net assets)
| Value | Value |
|---|
| Other Assets in Excess of Liabilities | 1.7% |
| Fixed Income | 98.3% |
Top 10 Holdings (% of net assets)
| Holding Name | % of Net Assets |
| iShares iBonds Dec 2024 Term Treasury ETF | 19.7% |
| Invesco Short Term Treasury ETF | 19.7% |
| SPDR Bloomberg 1-3 Month T-Bill ETF | 19.7% |
| iShares 0-3 Month Treasury Bond ETF | 19.6% |
| SPDR Bloomberg 3-12 Month T-Bill ETF | 19.6% |
No material changes occurred during the period ended November 30, 2024.
Brookstone Ultra-Short Bond ETF
Semi-Annual Shareholder Report - November 30, 2024
Where can I find additional information about the Fund?
This semi-annual shareholder report contains important information about Brookstone Ultra-Short Bond ETF for the period of June 1, 2024 to November 30, 2024. You can find additional information about the Fund at https://www.brookstoneam.com/brookstone-ultra-short-bond-etf. You can also request this information by contacting us at 1-888-562-8880.
Prospectus
Financial information
Holdings
Proxy voting information
Brookstone Value Stock ETF
(BAMV) Cboe BZX Exchange, Inc.
Semi-Annual Shareholder Report - November 30, 2024
This semi-annual shareholder report contains important information about Brookstone Value Stock ETF for the period of June 1, 2024 to November 30, 2024.You can find additional information about the Fund at https://www.brookstoneam.com/brookstone-value-stock-etf. You can also request this information by contacting us at 1-888-562-8880.
What were the Fund’s costs for the reporting period?
(based on a hypothetical $10,000 investment)
| Fund Name | Costs of a $10,000 investment | Costs paid as a percentage of a $10,000 investment |
|---|
| Brookstone Value Stock ETF | $51 | 0.95% |
|---|
- Net Assets$86,746,552
- Number of Portfolio Holdings30
- Advisory Fee $259,616
- Portfolio Turnover20%
Asset Weighting (% of total investments)
| Value | Value |
|---|
| Common Stocks | 100.0% |
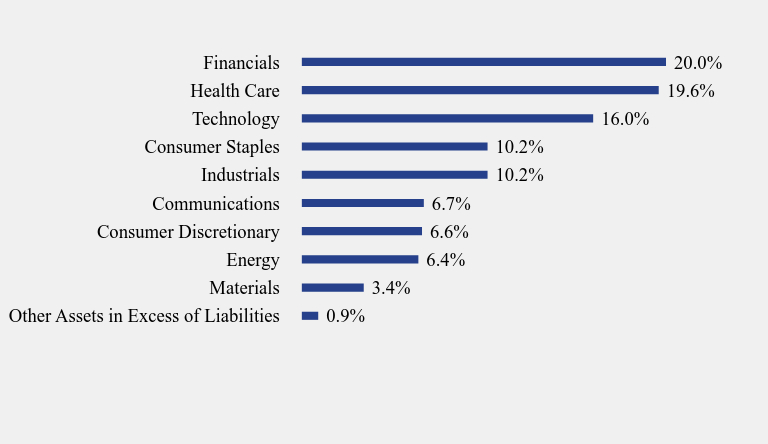
What did the Fund invest in?
Sector Weighting (% of net assets)
| Value | Value |
|---|
| Other Assets in Excess of Liabilities | 0.9% |
| Materials | 3.4% |
| Energy | 6.4% |
| Consumer Discretionary | 6.6% |
| Communications | 6.7% |
| Industrials | 10.2% |
| Consumer Staples | 10.2% |
| Technology | 16.0% |
| Health Care | 19.6% |
| Financials | 20.0% |
Top 10 Holdings (% of net assets)
| Holding Name | % of Net Assets |
| Estee Lauder Companies, Inc. (The), Class A | 3.6% |
| Boeing Company (The) | 3.6% |
| CVS Health Corporation | 3.5% |
| Walt Disney Company (The) | 3.5% |
| Wells Fargo & Company | 3.4% |
| Albemarle Corporation | 3.4% |
| Berkshire Hathaway, Inc., Class B | 3.4% |
| Bank of America Corporation | 3.3% |
| Goldman Sachs Group, Inc. (The) | 3.3% |
| Starbucks Corporation | 3.3% |
No material changes occurred during the period ended November 30, 2024.
Brookstone Value Stock ETF
Semi-Annual Shareholder Report - November 30, 2024
Where can I find additional information about the Fund?
This semi-annual shareholder report contains important information about Brookstone Value Stock ETF for the period of June 1, 2024 to November 30, 2024. You can find additional information about the Fund at https://www.brookstoneam.com/brookstone-value-stock-etf. You can also request this information by contacting us at 1-888-562-8880.
Prospectus
Financial information
Holdings
Proxy voting information
(BAMY) Cboe BZX Exchange, Inc.
Semi-Annual Shareholder Report - November 30, 2024
This semi-annual shareholder report contains important information about Brookstone Yield ETF for the period of June 1, 2024 to November 30, 2024. You can find additional information about the Fund at https://www.brookstoneam.com/brookstone-yield-etf. You can also request this information by contacting us at 1-888-562-8880.
What were the Fund’s costs for the reporting period?
(based on a hypothetical $10,000 investment)
| Fund Name | Costs of a $10,000 investment | Costs paid as a percentage of a $10,000 investment |
|---|
| Brookstone Yield ETF | $49 | 0.95% |
|---|
- Net Assets$36,103,201
- Number of Portfolio Holdings6
- Advisory Fee (net of waivers)$99,183
- Portfolio Turnover0%
Asset Weighting (% of total investments)
| Value | Value |
|---|
| Exchange-Traded Funds | 100.0% |
What did the Fund invest in?
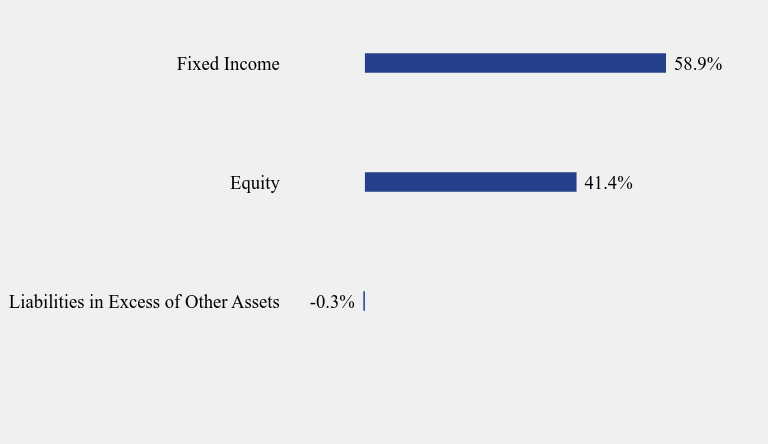
Sector Weighting (% of net assets)
| Value | Value |
|---|
| Liabilities in Excess of Other Assets | -0.3% |
| Equity | 41.4% |
| Fixed Income | 58.9% |
Top 10 Holdings (% of net assets)
| Holding Name | % of Net Assets |
| JPMorgan Equity Premium Income ETF | 21.3% |
| JPMorgan Nasdaq Equity Premium Income ETF | 20.1% |
| SPDR Blackstone Senior Loan ETF | 19.7% |
| Invesco Senior Loan ETF | 19.4% |
| Panagram Bbb-B Clo Etf | 9.9% |
| Janus Henderson B-BBB CLO ETF | 9.9% |
No material changes occurred during the period ended November 30, 2024.
Semi-Annual Shareholder Report - November 30, 2024
Where can I find additional information about the Fund?
This semi-annual shareholder report contains important information about Brookstone Yield ETF for the period of June 1, 2024 to November 30, 2024. You can find additional information about the Fund at https://www.brookstoneam.com/brookstone-yield-etf. You can also request this information by contacting us at 1-888-562-8880.
Prospectus
Financial information
Holdings
Proxy voting information
Item 2. Code of Ethics. Not applicable.
Item 3. Audit Committee Financial Expert. Not applicable.
Item 4. Principal Accountant Fees and Services. Not applicable.
Item 5. Audit Committee of Listed Registrants. Not applicable.
Item 6. Investments. Schedule of investments in securities of unaffiliated issuers is included under Item 1.
Item 7. Financial Statements and Financial Highlights for Open-End Management Investment Companies.
| (a) | The Registrant’s Financial Statements are attached herewith. |
| |
| |
| |
| |
| |
 |
| |
| |
| |
| |
| |
| Brookstone Dividend Stock ETF (BAMD) |
| Brookstone Growth Stock ETF (BAMG) |
| Brookstone Value Stock ETF (BAMV) |
| Brookstone Intermediate Bond ETF (BAMB) |
| Brookstone Ultra-Short Bond ETF (BAMU) |
| Brookstone Active ETF (BAMA) |
| Brookstone Opportunities ETF (BAMO) |
| Brookstone Yield ETF (BAMY) |
| |
| |
| |
| |
| |
| |
| |
| |
| |
| |
| Semi-Annual Financial Statements and |
| Additional Information |
| November 30, 2024 |
| |
| |
| |
| 1-888-562-8880 |
| www.brookstoneam.com |
| |
| |
| |
| This report and the financial statements contained herein are submitted for the general information of shareholders and are not authorized for distribution to prospective investors unless preceded or accompanied by an effective prospectus. Nothing herein contained is to be considered an offer of sale or solicitation of an offer to buy shares of the Brookstone ETFs. Such offering is made only by prospectus, which includes details as to offering price and other material information. |
| |
| Distributed by Northern Lights Distributors, LLC. |
| Member FINRA |
| |
| |
BROOKSTONE DIVIDEND STOCK ETF |
| SCHEDULE OF INVESTMENTS (Unaudited) |
| November 30, 2024 |
| Shares | | | | | Fair Value | |
| | | | | COMMON STOCKS — 99.7% | | | | |
| | | | | ASSET MANAGEMENT - 3.4% | | | | |
| | 25,558 | | | T Rowe Price Group, Inc. | | $ | 3,165,103 | |
| | | | | | | | | |
| | | | | AUTOMOTIVE - 3.2% | | | | |
| | 271,258 | | | Ford Motor Company | | | 3,019,102 | |
| | | | | | | | | |
| | | | | BANKING - 10.0% | | | | |
| | 171,128 | | | Huntington Bancshares, Inc. | | | 3,082,015 | |
| | 64,759 | | | Truist Financial Corporation | | | 3,087,709 | |
| | 60,075 | | | US Bancorp | | | 3,201,397 | |
| | | | | | | | 9,371,121 | |
| | | | | BIOTECH & PHARMA - 3.4% | | | | |
| | 34,288 | | | Gilead Sciences, Inc. | | | 3,174,383 | |
| | | | | | | | | |
| | | | | CHEMICALS - 6.7% | | | | |
| | 69,097 | | | Dow, Inc. | | | 3,054,778 | |
| | 54,189 | | | FMC Corporation | | | 3,202,028 | |
| | | | | | | | 6,256,806 | |
| | | | | CONTAINERS & PACKAGING - 3.3% | | | | |
| | 53,242 | | | International Paper Company | | | 3,132,227 | |
| | | | | | | | | |
| | | | | ELECTRIC UTILITIES - 20.0% | | | | |
| | 31,494 | | | American Electric Power Company, Inc. | | | 3,144,990 | |
| | 52,957 | | | Dominion Energy, Inc. | | | 3,111,224 | |
| | 26,836 | | | Duke Energy Corporation | | | 3,141,154 | |
| | 35,722 | | | Edison International | | | 3,134,606 | |
| | 20,140 | | | Entergy Corporation | | | 3,145,263 | |
| | 30,547 | | | WEC Energy Group, Inc. | | | 3,086,774 | |
| | | | | | | | 18,764,011 | |
| | | | | FOOD - 6.6% | | | | |
| | 113,781 | | | Conagra Brands, Inc. | | | 3,134,667 | |
| | 98,386 | | | Kraft Heinz Company (The) | | | 3,145,400 | |
| | | | | | | | 6,280,067 | |
See accompanying notes which are an integral part of these financial statements.
| BROOKSTONE DIVIDEND STOCK ETF |
| SCHEDULE OF INVESTMENTS (Unaudited) (Continued) |
| November 30, 2024 |
| Shares | | | | | Fair Value | |
| | | | | COMMON STOCKS — 99.7% (Continued) | | | | |
| | | | | GAS & WATER UTILITIES - 3.4% | | | | |
| | 82,816 | | | NiSource, Inc. | | $ | 3,154,461 | |
| | | | | | | | | |
| | | | | HEALTH CARE REIT - 3.3% | | | | |
| | 142,031 | | | Healthpeak Properties, Inc. | | | 3,123,262 | |
| | | | | | | | | |
| | | | | HOUSEHOLD PRODUCTS - 3.3% | | | | |
| | 21,996 | | | Kimberly-Clark Corporation | | | 3,065,143 | |
| | | | | | | | | |
| | | | | INFRASTRUCTURE REIT - 3.4% | | | | |
| | 29,983 | | | Crown Castle, Inc. | | | 3,185,694 | |
| | | | | | | | | |
| | | | | INSURANCE - 3.3% | | | | |
| | 24,186 | | | Prudential Financial, Inc. | | | 3,129,910 | |
| | | | | | | | | |
| | | | | OIL & GAS PRODUCERS - 6.7% | | | | |
| | 111,289 | | | Kinder Morgan, Inc. | | | 3,146,140 | |
| | 27,595 | | | ONEOK, Inc. | | | 3,134,792 | |
| | | | | | | | 6,280,932 | |
| | | | | RETAIL REIT - 3.3% | | | | |
| | 53,699 | | | Realty Income Corporation | | | 3,108,635 | |
| | | | | | | | | |
| | | | | TECHNOLOGY HARDWARE - 3.1% | | | | |
| | 81,978 | | | HP, Inc. | | | 2,904,481 | |
| | | | | | | | | |
| | | | | TELECOMMUNICATIONS - 6.7% | | | | |
| | 132,412 | | | AT&T, Inc. | | | 3,066,662 | |
| | 72,007 | | | Verizon Communications, Inc. | | | 3,192,790 | |
| | | | | | | | 6,259,452 | |
| | | | | TOBACCO & CANNABIS - 3.3% | | | | |
| | 53,391 | | | Altria Group, Inc. | | | 3,082,796 | |
See accompanying notes which are an integral part of these financial statements.
| BROOKSTONE DIVIDEND STOCK ETF |
| SCHEDULE OF INVESTMENTS (Unaudited) (Continued) |
| November 30, 2024 |
| Shares | | | | | Fair Value | |
| | | | | COMMON STOCKS — 99.7% (Continued) | | | | |
| | | | | TRANSPORTATION & LOGISTICS - 3.3% | | | | |
| | 22,555 | | | United Parcel Service, Inc., B | | $ | 3,061,164 | |
| | | | | | | | | |
| | | | | TOTAL COMMON STOCKS (Cost $77,052,242) | | $ | 93,518,750 | |
| | | | | | | | | |
| | | | | TOTAL INVESTMENTS - 99.7% (Cost $77,052,242) | | $ | 93,518,750 | |
| | | | | OTHER ASSETS IN EXCESS OF LIABILITIES- 0.3% | | | 278,908 | |
| | | | | NET ASSETS - 100.0% | | $ | 93,797,658 | |
See accompanying notes which are an integral part of these financial statements.
| BROOKSTONE GROWTH STOCK ETF |
| SCHEDULE OF INVESTMENTS (Unaudited) |
| November 30, 2024 |
| Shares | | | | | Fair Value | |
| | | | | COMMON STOCKS — 99.4% | | | | |
| | | | | AEROSPACE & DEFENSE - 3.2% | | | | |
| | 16,807 | | | Huntington Ingalls Industries, Inc. | | $ | 3,326,441 | |
| | | | | | | | | |
| | | | | AUTOMOTIVE - 3.3% | | | | |
| | 9,950 | | | Tesla, Inc.(a) | | | 3,434,342 | |
| | | | | | | | | |
| | | | | BEVERAGES - 3.3% | | | | |
| | 20,853 | | | PepsiCo, Inc. | | | 3,408,423 | |
| | | | | | | | | |
| | | | | E-COMMERCE DISCRETIONARY - 3.3% | | | | |
| | 16,440 | | | Amazon.com, Inc.(a) | | | 3,417,712 | |
| | | | | | | | | |
| | | | | ELECTRICAL EQUIPMENT - 3.3% | | | | |
| | 42,927 | | | Fortive Corporation | | | 3,405,399 | |
| | | | | | | | | |
| | | | | HEALTH CARE FACILITIES & SERVICES - 3.3% | | | | |
| | 5,651 | | | UnitedHealth Group, Inc. | | | 3,448,241 | |
| | | | | | | | | |
| | | | | HOME CONSTRUCTION - 3.3% | | | | |
| | 42,465 | | | Masco Corporation | | | 3,420,980 | |
| | | | | | | | | |
| | | | | INSTITUTIONAL FINANCIAL SERVICES - 3.4% | | | | |
| | 14,596 | | | CME Group, Inc. | | | 3,473,848 | |
| | | | | | | | | |
| | | | | INTERNET MEDIA & SERVICES - 16.5% | | | | |
| | 20,367 | | | Alphabet, Inc., Class A | | | 3,441,004 | |
| | 17,981 | | | Expedia Group, Inc.(a) | | | 3,319,652 | |
| | 5,899 | | | Meta Platforms, Inc., Class A | | | 3,387,914 | |
| | 3,847 | | | Netflix, Inc.(a) | | | 3,411,558 | |
| | 47,461 | | | Uber Technologies, Inc.(a) | | | 3,415,294 | |
| | | | | | | | 16,975,422 | |
| | | | | LEISURE FACILITIES & SERVICES - 6.9% | | | | |
| | 66,843 | | | Las Vegas Sands Corporation | | | 3,546,689 | |
| | 11,867 | | | McDonald’s Corporation | | | 3,512,751 | |
| | | | | | | | 7,059,440 | |
See accompanying notes which are an integral part of these financial statements.
| BROOKSTONE GROWTH STOCK ETF |
| SCHEDULE OF INVESTMENTS (Unaudited) (Continued) |
| November 30, 2024 |
| Shares | | | | | Fair Value | |
| | | | | COMMON STOCKS — 99.4% (Continued) | | | | |
| | | | | MEDICAL EQUIPMENT & DEVICES - 3.3% | | | | |
| | 6,407 | | | Thermo Fisher Scientific, Inc. | | $ | 3,393,339 | |
| | | | | | | | | |
| | | | | OIL & GAS PRODUCERS - 3.2% | | | | |
| | 24,468 | | | EOG Resources, Inc. | | | 3,260,606 | |
| | | | | | | | | |
| | | | | SEMICONDUCTORS - 9.8% | | | | |
| | 23,362 | | | NVIDIA Corporation | | | 3,229,797 | |
| | 21,679 | | | QUALCOMM, Inc. | | | 3,436,772 | |
| | 31,509 | | | Teradyne, Inc. | | | 3,465,989 | |
| | | | | | | | 10,132,558 | |
| | | | | SOFTWARE - 26.6% | | | | |
| | 6,584 | | | Adobe, Inc.(a) | | | 3,396,883 | |
| | 10,842 | | | Autodesk, Inc.(a) | | | 3,164,780 | |
| | 8,130 | | | Microsoft Corporation | | | 3,442,730 | |
| | 8,865 | | | Palo Alto Networks, Inc.(a) | | | 3,438,024 | |
| | 3,312 | | | ServiceNow, Inc.(a) | | | 3,475,745 | |
| | 19,933 | | | Snowflake, Inc.(a) | | | 3,484,288 | |
| | 5,517 | | | Tyler Technologies, Inc.(a) | | | 3,471,131 | |
| | 15,674 | | | Veeva Systems, Inc., Class A(a) | | | 3,571,322 | |
| | | | | | | | 27,444,903 | |
| | | | | TECHNOLOGY HARDWARE - 3.4% | | | | |
| | 14,617 | | | Apple, Inc. | | | 3,469,053 | |
| | | | | | | | | |
| | | | | TECHNOLOGY SERVICES - 3.3% | | | | |
| | 10,829 | | | Visa, Inc., Class A | | | 3,412,002 | |
| | | | | | | | | |
| | | | | TOTAL COMMON STOCKS (Cost $90,972,414) | | | 102,482,709 | |
| | | | | | | | | |
| | | | | TOTAL INVESTMENTS - 99.4% (Cost $90,972,414) | | $ | 102,482,709 | |
| | | | | OTHER ASSETS IN EXCESS OF LIABILITIES- 0.6% | | | 646,215 | |
| | | | | NET ASSETS - 100.0% | | $ | 103,128,924 | |
| (a) | Non-income producing security. |
See accompanying notes which are an integral part of these financial statements.
| BROOKSTONE VALUE STOCK ETF |
| SCHEDULE OF INVESTMENTS (Unaudited) |
| November 30, 2024 |
| Shares | | | | | Fair Value | |
| | | | | COMMON STOCKS — 99.1% | | | | |
| | | | | AEROSPACE & DEFENSE - 3.6% | | | | |
| | 20,034 | | | Boeing Company (The)(a) | | $ | 3,114,085 | |
| | | | | | | | | |
| | | | | APPAREL & TEXTILE PRODUCTS - 3.3% | | | | |
| | 36,526 | | | NIKE, Inc., Class B | | | 2,877,153 | |
| | | | | | | | | |
| | | | | ASSET MANAGEMENT - 3.3% | | | | |
| | 34,787 | | | Charles Schwab Corporation (The) | | | 2,878,972 | |
| | | | | | | | | |
| | | | | BANKING - 10.1% | | | | |
| | 60,893 | | | Bank of America Corporation | | | 2,893,026 | |
| | 11,530 | | | JPMorgan Chase & Company | | | 2,879,272 | |
| | 38,367 | | | Wells Fargo & Company | | | 2,922,414 | |
| | | | | | | | 8,694,712 | |
| | | | | BIOTECH & PHARMA - 9.7% | | | | |
| | 47,674 | | | Bristol-Myers Squibb Company | | | 2,823,255 | |
| | 18,144 | | | Johnson & Johnson | | | 2,812,501 | |
| | 104,900 | | | Pfizer, Inc. | | | 2,749,429 | |
| | | | | | | | 8,385,185 | |
| | | | | CABLE & SATELLITE - 3.2% | | | | |
| | 64,228 | | | Comcast Corporation, Class A | | | 2,774,007 | |
| | | | | | | | | |
| | | | | CHEMICALS - 3.3% | | | | |
| | 26,970 | | | Albemarle Corporation | | | 2,904,669 | |
| | | | | | | | | |
| | | | | DIVERSIFIED INDUSTRIALS - 3.2% | | | | |
| | 12,067 | | | Honeywell International, Inc. | | | 2,810,766 | |
| | | | | | | | | |
| | | | | ELECTRICAL EQUIPMENT - 3.3% | | | | |
| | 27,943 | | | Otis Worldwide Corporation | | | 2,877,570 | |
| | | | | | | | | |
| | | | | ENTERTAINMENT CONTENT - 3.5% | | | | |
| | 25,553 | | | Walt Disney Company (The) | | | 3,001,711 | |
See accompanying notes which are an integral part of these financial statements.
| BROOKSTONE VALUE STOCK ETF |
| SCHEDULE OF INVESTMENTS (Unaudited) (Continued) |
| November 30, 2024 |
| Shares | | | | | Fair Value | |
| | | | | COMMON STOCKS — 99.1% (Continued) | | | | |
| | | | | HEALTH CARE FACILITIES & SERVICES - 3.6% | | | | |
| | 51,513 | | | CVS Health Corporation | | $ | 3,083,053 | |
| | | | | | | | | |
| | | | | HOUSEHOLD PRODUCTS - 6.9% | | | | |
| | 43,371 | | | Estee Lauder Companies, Inc. (The), Class A | | | 3,127,916 | |
| | 119,072 | | | Kenvue, Inc. | | | 2,867,254 | |
| | | | | | | | 5,995,170 | |
| | | | | INSTITUTIONAL FINANCIAL SERVICES - 3.3% | | | | |
| | 4,745 | | | Goldman Sachs Group, Inc. (The) | | | 2,887,665 | |
| | | | | | | | | |
| | | | | INSURANCE - 3.4% | | | | |
| | 5,995 | | | Berkshire Hathaway, Inc., Class B(a) | | | 2,895,705 | |
| | | | | | | | | |
| | | | | LEISURE FACILITIES & SERVICES - 3.3% | | | | |
| | 28,156 | | | Starbucks Corporation | | | 2,884,864 | |
| | | | | | | | | |
| | | | | MEDICAL EQUIPMENT & DEVICES - 6.4% | | | | |
| | 12,588 | | | Becton Dickinson and Company | | | 2,793,277 | |
| | 24,746 | | | Zimmer Biomet Holdings, Inc. | | | 2,774,027 | |
| | | | | | | | 5,567,304 | |
| | | | | OIL & GAS PRODUCERS - 6.4% | | | | |
| | 17,505 | | | Chevron Corporation | | | 2,834,585 | |
| | 23,149 | | | Exxon Mobil Corporation | | | 2,730,656 | |
| | | | | | | | 5,565,241 | |
| | | | | RETAIL - CONSUMER STAPLES - 3.3% | | | | |
| | 47,121 | | | Kroger Company (The) | | | 2,878,151 | |
| | | | | | | | | |
| | | | | SOFTWARE - 3.2% | | | | |
| | 8,396 | | | Salesforce, Inc. | | | 2,770,596 | |
| | | | | | | | | |
| | | | | TECHNOLOGY HARDWARE - 3.3% | | | | |
| | 48,289 | | | Cisco Systems, Inc. | | | 2,859,192 | |
| | | | | | | | | |
| | | | | TECHNOLOGY SERVICES - 9.5% | | | | |
| | 34,501 | | | Cognizant Technology Solutions Corporation, Class A | | | 2,776,985 | |
See accompanying notes which are an integral part of these financial statements.
| BROOKSTONE VALUE STOCK ETF |
| SCHEDULE OF INVESTMENTS (Unaudited) (Continued) |
| November 30, 2024 |
| Shares | | | | | Fair Value | |
| | | | | COMMON STOCKS — 99.1% (Continued) | | | | |
| | | | | TECHNOLOGY SERVICES - 9.5% (Continued) | | | | |
| | 31,655 | | | Fidelity National Information Services, Inc. | | $ | 2,700,172 | |
| | 32,368 | | | PayPal Holdings, Inc.(a) | | | 2,808,571 | |
| | | | | | | | 8,285,728 | |
| | | | | | | | | |
| | | | | TOTAL COMMON STOCKS (Cost $75,206,650) | | | 85,991,499 | |
| | | | | | | | | |
| | | | | TOTAL INVESTMENTS - 99.1% (Cost $75,206,650) | | $ | 85,991,499 | |
| | | | | OTHER ASSETS IN EXCESS OF LIABILITIES- 0.9% | | | 755,053 | |
| | | | | NET ASSETS - 100.0% | | $ | 86,746,552 | |
| (a) | Non-income producing security. |
See accompanying notes which are an integral part of these financial statements.
| BROOKSTONE INTERMEDIATE BOND ETF |
| SCHEDULE OF INVESTMENTS (Unaudited) |
| November 30, 2024 |
| Shares | | | | | Fair Value | |
| | | | | EXCHANGE-TRADED FUNDS — 99.8% | | | | |
| | | | | FIXED INCOME - 99.8% | | | | |
| | 220,206 | | | iShares 1-5 Year Investment Grade Corporate Bond | | $ | 11,483,743 | |
| | 98,305 | | | iShares 3-7 Year Treasury Bond ETF | | | 11,514,465 | |
| | 121,918 | | | iShares 7-10 Year Treasury Bond ETF | | | 11,605,373 | |
| | 465,668 | | | Schwab Intermediate-Term U.S. Treasury ETF | | | 11,502,000 | |
| | 405,375 | | | SPDR Portfolio Intermediate Term Treasury ETF | | | 11,512,650 | |
| | | | | | | | 57,618,231 | |
| | | | | | | | | |
| | | | | TOTAL EXCHANGE-TRADED FUNDS (Cost $55,823,571) | | | 57,618,231 | |
| | | | | | | | | |
| | | | | TOTAL INVESTMENTS - 99.8% (Cost $55,823,571) | | $ | 57,618,231 | |
| | | | | OTHER ASSETS IN EXCESS OF LIABILITIES- 0.2% | | | 104,264 | |
| | | | | NET ASSETS - 100.0% | | $ | 57,722,495 | |
See accompanying notes which are an integral part of these financial statements.
| BROOKSTONE ULTRA-SHORT BOND ETF |
| SCHEDULE OF INVESTMENTS (Unaudited) |
| November 30, 2024 |
| Shares | | | | | Fair Value | |
| | | | | EXCHANGE-TRADED FUNDS — 98.3% | | | | |
| | | | | FIXED INCOME - 98.3% | | | | |
| | 121,190 | | | Invesco Short Term Treasury ETF | | $ | 12,786,757 | |
| | 126,824 | | | iShares 0-3 Month Treasury Bond ETF | | | 12,768,640 | |
| | 534,766 | | | iShares iBonds Dec 2024 Term Treasury ETF | | | 12,829,037 | |
| | 139,180 | | | SPDR Bloomberg 1-3 Month T-Bill ETF | | | 12,773,940 | |
| | 128,306 | | | SPDR Bloomberg 3-12 Month T-Bill ETF | | | 12,763,881 | |
| | | | | | | | 63,922,255 | |
| | | | | | | | | |
| | | | | TOTAL EXCHANGE-TRADED FUNDS (Cost $63,787,554) | | | 63,922,255 | |
| | | | | | | | | |
| | | | | TOTAL INVESTMENTS - 98.3% (Cost $63,787,554) | | $ | 63,922,255 | |
| | | | | OTHER ASSETS IN EXCESS OF LIABILITIES- 1.7% | | | 1,128,996 | |
| | | | | NET ASSETS - 100.0% | | $ | 65,051,251 | |
See accompanying notes which are an integral part of these financial statements.
| BROOKSTONE ACTIVE ETF |
| SCHEDULE OF INVESTMENTS (Unaudited) |
| November 30, 2024 |
| Shares | | | | | Fair Value | |
| | | | | EXCHANGE-TRADED FUNDS — 98.3% | | | | |
| | | | | EQUITY - 66.1% | | | | |
| | 124,928 | | | SPDR Portfolio S&P 500 ETF | | $ | 8,856,146 | |
| | 106,240 | | | SPDR Portfolio S&P 500 Growth ETF | | | 9,281,126 | |
| | 151,552 | | | SPDR Portfolio S&P 500 Value ETF | | | 8,376,279 | |
| | | | | | | | 26,513,551 | |
| | | | | FIXED INCOME - 32.2% | | | | |
| | 62,976 | | | iShares 0-3 Month Treasury Bond ETF | | | 6,340,424 | |
| | 257,792 | | | SPDR Portfolio Aggregate Bond ETF | | | 6,602,053 | |
| | | | | | | | 12,942,477 | |
| | | | | | | | | |
| | | | | TOTAL EXCHANGE-TRADED FUNDS (Cost $32,454,382) | | | 39,456,028 | |
| | | | | | | | | |
| | | | | TOTAL INVESTMENTS - 98.3% (Cost $32,454,382) | | $ | 39,456,028 | |
| | | | | OTHER ASSETS IN EXCESS OF LIABILITIES- 1.7% | | | 684,344 | |
| | | | | NET ASSETS - 100.0% | | $ | 40,140,372 | |
See accompanying notes which are an integral part of these financial statements.
| BROOKSTONE OPPORTUNITIES ETF |
| SCHEDULE OF INVESTMENTS (Unaudited) |
| November 30, 2024 |
| Shares | | | | | Fair Value | |
| | | | | EXCHANGE-TRADED FUNDS — 98.2% | | | | |
| | | | | EQUITY - 66.1% | | | | |
| | 41,205 | | | Invesco Nasdaq 100 ETF | | $ | 8,644,810 | |
| | 17,835 | | | SPDR Dow Jones Industrial Average ETF Trust | | | 8,027,355 | |
| | 15,252 | | | Vanguard S&P 500 ETF | | | 8,441,219 | |
| | | | | | | | 25,113,384 | |
| | | | | FIXED INCOME - 32.1% | | | | |
| | 60,516 | | | iShares 0-3 Month Treasury Bond ETF | | | 6,092,751 | |
| | 66,420 | | | SPDR Bloomberg 1-3 Month T-Bill ETF | | | 6,096,027 | |
| | | | | | | | 12,188,778 | |
| | | | | | | | | |
| | | | | TOTAL EXCHANGE-TRADED FUNDS (Cost $31,294,989) | | | 37,302,162 | |
| | | | | | | | | |
| | | | | TOTAL INVESTMENTS - 98.2% (Cost $31,294,989) | | $ | 37,302,162 | |
| | | | | OTHER ASSETS IN EXCESS OF LIABILITIES- 1.8% | | | 666,442 | |
| | | | | NET ASSETS - 100.0% | | $ | 37,968,604 | |
See accompanying notes which are an integral part of these financial statements.
| BROOKSTONE YIELD ETF |
| SCHEDULE OF INVESTMENTS (Unaudited) |
| November 30, 2024 |
| Shares | | | | | Fair Value | |
| | | | | EXCHANGE-TRADED FUNDS — 100.3% | | | | |
| | | | | EQUITY - 41.4% | | | | |
| | 126,095 | | | JPMorgan Equity Premium Income ETF | | $ | 7,670,359 | |
| | 127,233 | | | JPMorgan Nasdaq Equity Premium Income ETF | | | 7,263,732 | |
| | | | | | | | 14,934,091 | |
| | | | | FIXED INCOME - 58.9% | | | | |
| | 331,372 | | | Invesco Senior Loan ETF | | | 6,995,263 | |
| | 72,235 | | | Janus Henderson B-BBB CLO ETF | | | 3,569,131 | |
| | 131,978 | | | Panagram Bbb-B Clo Etf | | | 3,579,243 | |
| | 169,136 | | | SPDR Blackstone Senior Loan ETF | | | 7,117,243 | |
| | | | | | | | 21,260,880 | |
| | | | | | | | | |
| | | | | TOTAL EXCHANGE-TRADED FUNDS (Cost $34,318,755) | | | 36,194,971 | |
| | | | | | | | | |
| | | | | TOTAL INVESTMENTS - 100.3% (Cost $34,318,755) | | $ | 36,194,971 | |
| | | | | LIABILITIES IN EXCESS OF OTHER ASSETS - (0.3)% | | | (91,770 | ) |
| | | | | NET ASSETS - 100.0% | | $ | 36,103,201 | |
See accompanying notes which are an integral part of these financial statements.
| Brookstone ETFs |
| STATEMENTS OF ASSETS AND LIABILITIES (Unaudited) |
| November 30, 2024 |
| | | Brookstone | | | Brookstone | | | Brookstone | | | Brookstone | |
| | | Dividend Stock | | | Growth Stock | | | Value Stock | | | Intermediate Bond | |
| | | ETF | | | ETF | | | ETF | | | ETF | |
| ASSETS | | | | | | | | | | | | | | | | |
| Investment securities: | | | | | | | | | | | | | | | | |
| At cost | | $ | 77,052,242 | | | $ | 90,972,414 | | | $ | 75,206,650 | | | $ | 55,823,571 | |
| At value | | $ | 93,518,750 | | | $ | 102,482,709 | | | $ | 85,991,499 | | | $ | 57,618,231 | |
| Cash and cash equivalents | | | 727,293 | | | | 734,118 | | | | 917,240 | | | | 573,064 | |
| Dividends and interest receivable | | | 383,786 | | | | 47,162 | | | | 195,608 | | | | 1,809 | |
| Prepaid expenses and other assets | | | — | | | | 13 | | | | 895 | | | | 654 | |
| TOTAL ASSETS | | | 94,629,829 | | | | 103,264,002 | | | | 87,105,242 | | | | 58,193,758 | |
| | | | | | | | | | | | | | | | | |
| LIABILITIES | | | | | | | | | | | | | | | | |
| Distributions Payable | | | 748,272 | | | | 42,195 | | | | 274,314 | | | | 398,046 | |
| Investment advisory fees payable | | | 48,805 | | | | 52,678 | | | | 45,473 | | | | 30,345 | |
| Payable to related parties | | | 5,587 | | | | 13,104 | | | | 10,022 | | | | 13,104 | |
| Accrued expenses and other liabilities | | | 29,507 | | | | 27,101 | | | | 28,881 | | | | 29,768 | |
| TOTAL LIABILITIES | | | 832,171 | | | | 135,078 | | | | 358,690 | | | | 471,263 | |
| NET ASSETS | | $ | 93,797,658 | | | $ | 103,128,924 | | | $ | 86,746,552 | | | $ | 57,722,495 | |
| | | | | | | | | | | | | | | | | |
| Composition of Net Assets: | | | | | | | | | | | | | | | | |
| Paid in capital ($0 par value, unlimited shares authorized) | | $ | 70,213,631 | | | $ | 78,494,650 | | | $ | 68,711,455 | | | $ | 55,914,544 | |
| Accumulated earnings | | | 23,584,027 | | | | 24,634,274 | | | | 18,035,097 | | | | 1,807,951 | |
| NET ASSETS | | $ | 93,797,658 | | | $ | 103,128,924 | | | $ | 86,746,552 | | | $ | 57,722,495 | |
| | | | | | | | | | | | | | | | | |
| Net Asset Value Per Share: | | | | | | | | | | | | | | | | |
| Shares: | | | | | | | | | | | | | | | | |
| Net Assets | | $ | 93,797,658 | | | $ | 103,128,924 | | | $ | 86,746,552 | | | $ | 57,722,495 | |
| Shares of beneficial interest outstanding | | | 2,720,000 | | | | 2,910,000 | | | | 2,620,000 | | | | 2,220,000 | |
| | | | | | | | | | | | | | | | | |
| Net asset value (Net Assets ÷ Shares Outstanding), offering and redemption price per share | | $ | 34.48 | | | $ | 35.44 | | | $ | 33.11 | | | $ | 26.00 | |
| Market Price | | $ | 34.51 | | | $ | 35.44 | | | $ | 33.14 | | | $ | 25.99 | |
See accompanying notes which are an integral part of these financial statements.
| Brookstone ETFs |
| STATEMENTS OF ASSETS AND LIABILITIES (Unaudited) |
| November 30, 2024 |
| | | Brookstone | | | Brookstone | | | Brookstone | | | Brookstone | |
| | | Ultra-Short Bond | | | Active | | | Opportunities | | | Yield | |
| | | ETF | | | ETF | | | ETF | | | ETF | |
| ASSETS | | | | | | | | | | | | | | | | |
| Investment securities: | | | | | | | | | | | | | | | | |
| At cost | | $ | 63,787,554 | | | $ | 32,454,382 | | | $ | 31,294,989 | | | $ | 34,318,755 | |
| At value | | $ | 63,922,255 | | | $ | 39,456,028 | | | $ | 37,302,162 | | | $ | 36,194,971 | |
| Cash and cash equivalents | | | 1,856,937 | | | | 895,061 | | | | 874,144 | | | | 692,978 | |
| Dividends and interest receivable | | | 5,932 | | | | 2,983 | | | | 7,635 | | | | 2,118 | |
| Prepaid expenses and other assets | | | 735 | | | | 452 | | | | 430 | | | | 411 | |
| TOTAL ASSETS | | | 65,785,859 | | | | 40,354,524 | | | | 38,184,371 | | | | 36,890,478 | |
| | | | | | | | | | | | | | | | | |
| LIABILITIES | | | | | | | | | | | | | | | | |
| Distributions Payable | | | 659,190 | | | | 145,024 | | | | 149,445 | | | | 721,590 | |
| Investment advisory fees payable | | | 34,768 | | | | 21,652 | | | | 19,571 | | | | 18,752 | |
| Payable to related parties | | | 14,057 | | | | 9,985 | | | | 10,981 | | | | 11,149 | |
| Accrued expenses and other liabilities | | | 26,593 | | | | 37,491 | | | | 35,770 | | | | 35,786 | |
| TOTAL LIABILITIES | | | 734,608 | | | | 214,152 | | | | 215,767 | | | | 787,277 | |
| NET ASSETS | | $ | 65,051,251 | | | $ | 40,140,372 | | | $ | 37,968,604 | | | $ | 36,103,201 | |
| | | | | | | | | | | | | | | | | |
| Composition of Net Assets: | | | | | | | | | | | | | | | | |
| Paid in capital ($0 par value, unlimited shares authorized) | | $ | 64,913,546 | | | $ | 32,979,063 | | | $ | 31,833,114 | | | $ | 34,407,026 | |
| Accumulated earning | | | 137,705 | | | | 7,161,309 | | | | 6,135,490 | | | | 1,696,175 | |
| NET ASSETS | | $ | 65,051,251 | | | $ | 40,140,372 | | | $ | 37,968,604 | | | $ | 36,103,201 | |
| | | | | | | | | | | | | | | | | |
| Net Asset Value Per Share: | | | | | | | | | | | | | | | | |
| Shares: | | | | | | | | | | | | | | | | |
| Net Assets | | $ | 65,051,251 | | | $ | 40,140,372 | | | $ | 37,968,604 | | | $ | 36,103,201 | |
| Shares of beneficial interest outstanding | | | 2,580,000 | | | | 1,280,000 | | | | 1,230,000 | | | | 1,340,000 | |
| | | | | | | | | | | | | | | | | |
| Net asset value (Net Assets ÷ Shares Outstanding), offering and redemption price per share | | $ | 25.21 | | | $ | 31.36 | | | $ | 30.87 | | | $ | 26.94 | |
| Market Price | | $ | 25.24 | | | $ | 31.37 | | | $ | 30.87 | | | $ | 26.95 | |
See accompanying notes which are an integral part of these financial statements.
| Brookstone ETFs |
| STATEMENTS OF OPERATIONS (Unaudited) |
| For the Six Months Ended November 30, 2024 |
| | | Brookstone | | | Brookstone | | | Brookstone | | | Brookstone | |
| | | Dividend Stock | | | Growth Stock | | | Value Stock | | | Intermediate Bond | |
| | | ETF | | | ETF | | | ETF | | | ETF | |
| INVESTMENT INCOME | | | | | | | | | | | | | | | | |
| Dividends | | $ | 1,885,216 | | | $ | 434,473 | | | $ | 868,384 | | | $ | 1,033,686 | |
| Interest | | | 18,254 | | | | 24,966 | | | | 19,544 | | | | 10,354 | |
| TOTAL INVESTMENT INCOME | | | 1,903,470 | | | | 459,439 | | | | 887,928 | | | | 1,044,040 | |
| | | | | | | | | | | | | | | | | |
| EXPENSES | | | | | | | | | | | | | | | | |
| Investment advisory fees | | | 271,328 | | | | 285,897 | | | | 259,616 | | | | 184,346 | |
| Administrative services fees | | | 37,569 | | | | 45,077 | | | | 42,454 | | | | 28,008 | |
| Professional fees | | | 11,201 | | | | 11,171 | | | | 11,171 | | | | 9,368 | |
| Custodian fees | | | 9,646 | | | | 5,074 | | | | 10,518 | | | | 4,003 | |
| Compliance officer fees | | | 8,996 | | | | 9,339 | | | | 7,708 | | | | 8,416 | |
| Trustees fees and expenses | | | 4,895 | | | | 4,844 | | | | 4,828 | | | | 5,461 | |
| Printing expenses | | | 4,172 | | | | 4,410 | | | | 4,989 | | | | 3,865 | |
| Transfer agent fees | | | 3,257 | | | | 6,881 | | | | 2,532 | | | | 1,868 | |
| Legal fees | | | 3,177 | | | | 4,293 | | | | 4,449 | | | | 6,149 | |
| Insurance expense | | | 924 | | | | 944 | | | | 220 | | | | 207 | |
| Other expenses | | | 4,474 | | | | 4,752 | | | | 5,044 | | | | 10,180 | |
| TOTAL EXPENSES | | | 359,639 | | | | 382,682 | | | | 353,529 | | | | 261,871 | |
| | | | | | | | | | | | | | | | | |
| NET INVESTMENT INCOME | | | 1,543,831 | | | | 76,757 | | | | 534,399 | | | | 782,169 | |
| | | | | | | | | | | | | | | | | |
| REALIZED AND UNREALIZED GAIN (LOSS) FROM INVESTMENTS | | | | | | | | | | | | | | | | |
| Net realized gain (loss) from investments | | | 33,173 | | | | (144,210 | ) | | | 39,497 | | | | — | |
| Net realized gain from in-kind redemptions | | | 6,267,104 | | | | 12,195,854 | | | | 5,180,122 | | | | 15,994 | |
| Net change in unrealized appreciation on investments | | | 7,166,349 | | | | 3,808,476 | | | | 3,857,752 | | | | 1,164,375 | |
| NET REALIZED AND UNREALIZED GAIN FROM INVESTMENTS | | | 13,466,626 | | | | 15,860,120 | | | | 9,077,371 | | | | 1,180,369 | |
| | | | | | | | | | | | | | | | | |
| NET INCREASE IN NET ASSETS RESULTING FROM OPERATIONS | | $ | 15,010,457 | | | $ | 15,936,877 | | | $ | 9,611,770 | | | $ | 1,962,538 | |
See accompanying notes which are an integral part of these financial statements.
| Brookstone ETFs |
| STATEMENTS OF OPERATIONS (Unaudited) |
| For the Six Months Ended November 30, 2024 |
| | | Brookstone | | | Brookstone | | | Brookstone | | | Brookstone | |
| | | Ultra-Short Bond | | | Active | | | Opportunities | | | Yield | |
| | | ETF | | | ETF | | | ETF | | | ETF | |
| INVESTMENT INCOME | | | | | | | | | | | | | | | | |
| Dividends | | $ | 1,579,112 | | | $ | 459,117 | | | $ | 440,115 | | | $ | 1,499,363 | |
| Interest | | | 36,664 | | | | 20,040 | | | | 19,010 | | | | 9,406 | |
| TOTAL INVESTMENT INCOME | | | 1,615,776 | | | | 479,157 | | | | 459,125 | | | | 1,508,769 | |
| | | | | | | | | | | | | | | | | |
| EXPENSES | | | | | | | | | | | | | | | | |
| Investment advisory fees | | | 208,191 | | | | 125,512 | | | | 116,910 | | | | 112,334 | |
| Administrative services fees | | | 37,334 | | | | 16,180 | | | | 15,425 | | | | 14,963 | |
| Professional fees | | | 9,368 | | | | 9,372 | | | | 9,372 | | | | 9,372 | |
| Compliance officer fees | | | 7,719 | | | | 6,148 | | | | 6,244 | | | | 6,332 | |
| Legal fees | | | 6,554 | | | | 13,249 | | | | 9,350 | | | | 9,600 | |
| Trustees fees and expenses | | | 5,633 | | | | 5,619 | | | | 5,618 | | | | 5,667 | |
| Transfer agent fees | | | 4,427 | | | | 5,976 | | | | 6,368 | | | | 6,376 | |
| Custodian fees | | | 3,529 | | | | 3,613 | | | | 3,746 | | | | 3,912 | |
| Printing expenses | | | 1,356 | | | | 3,509 | | | | 3,364 | | | | 3,509 | |
| Insurance expense | | | 213 | | | | 199 | | | | 199 | | | | 198 | |
| Other expenses | | | 7,629 | | | | 5,348 | | | | 5,597 | | | | 5,147 | |
| TOTAL EXPENSES | | | 291,953 | | | | 194,725 | | | | 182,193 | | | | 177,410 | |
| | | | | | | | | | | | | | | | | |
| Less: Contractual Fees waived and/or expenses reimbursed by the Adviser | | | — | | | | (11,193 | ) | | | (11,243 | ) | | | (13,151 | ) |
| TOTAL FEES WAIVED | | | — | | | | (11,193 | ) | | | (11,243 | ) | | | (13,151 | ) |
| | | | | | | | | | | | | | | | | |
| NET EXPENSES | | | 291,953 | | | | 183,532 | | | | 170,950 | | | | 164,259 | |
| NET INVESTMENT INCOME | | | 1,323,823 | | | | 295,625 | | | | 288,175 | | | | 1,344,510 | |
| | | | | | | | | | | | | | | | | |
| REALIZED AND UNREALIZED GAIN (LOSS) FROM INVESTMENTS | | | | | | | | | | | | | | | | |
| Net realized gain from investments | | | — | | | | — | | | | — | | | | 6,767 | |
| Net realized gain from in-kind redemptions | | | 991 | | | | 153,761 | | | | 124,027 | | | | 19,014 | |
| Net change in unrealized appreciation on investments | | | 12,108 | | | | 3,333,547 | | | | 2,987,289 | | | | 866,057 | |
| NET REALIZED AND UNREALIZED GAIN FROM INVESTMENTS | | | 13,099 | | | | 3,487,308 | | | | 3,111,316 | | | | 891,838 | |
| | | | | | | | | | | | | | | | | |
| NET INCREASE IN NET ASSETS RESULTING FROM OPERATIONS | | $ | 1,336,922 | | | $ | 3,782,933 | | | $ | 3,399,491 | | | $ | 2,236,348 | |
See accompanying notes which are an integral part of these financial statements.
| Brookstone Dividend Stock ETF |
| STATEMENTS OF CHANGES IN NET ASSETS |
| | | For the Six Months Ended | | | | |
| | | November 30, 2024 | | | For the Period Ended | |
| | | (Unaudited) | | | May 31, 2024 * | |
| FROM OPERATIONS | | | | | | | | |
| Net investment income | | $ | 1,543,831 | | | $ | 1,543,382 | |
| Net realized gain from investments | | | 33,173 | | | | 678,453 | |
| Net realized gain from in-kind redemptions | | | 6,267,104 | | | | 395,615 | |
| Net change in unrealized appreciation on investments | | | 7,166,349 | | | | 9,300,159 | |
| Net increase in net assets resulting from operations | | | 15,010,457 | | | | 11,917,609 | |
| | | | | | | | | |
| DISTRIBUTIONS TO SHAREHOLDERS | | | | | | | | |
| Total distributions paid | | | (1,429,183 | ) | | | (1,526,556 | ) |
| Total distributions to shareholders | | | (1,429,183 | ) | | | (1,526,556 | ) |
| | | | | | | | | |
| FROM SHARES OF BENEFICIAL INTEREST | | | | | | | | |
| Proceeds from shares sold | | | 23,242,505 | | | | 68,526,421 | |
| Cost of shares redeemed | | | (18,666,490 | ) | | | (3,293,105 | ) |
| Transaction Fees (Note 5) | | | 5,500 | | | | 10,500 | |
| Net increase in net assets from shares of beneficial interest | | | 4,581,515 | | | | 65,243,816 | |
| | | | | | | | | |
| TOTAL INCREASE IN NET ASSETS | | | 18,162,789 | | | | 75,634,869 | |
| | | | | | | | | |
| NET ASSETS | | | | | | | | |
| Beginning of Period | | | 75,634,869 | | | | — | |
| End of Period | | $ | 93,797,658 | | | $ | 75,634,869 | |
| | | | | | | | | |
| SHARE ACTIVITY | | | | | | | | |
| Shares Sold | | | 710,000 | | | | 2,690,000 | |
| Shares Redeemed | | | (560,000 | ) | | | (120,000 | ) |
| Net increase in shares of beneficial interest outstanding | | | 150,000 | | | | 2,570,000 | |
| * | Brookstone Dividend Stock ETF commenced operations on September 27, 2023. |
See accompanying notes which are an integral part of these financial statements.
| Brookstone Growth Stock ETF |
| STATEMENTS OF CHANGES IN NET ASSETS |
| | | For the Six Months Ended | | | | |
| | | November 30, 2024 | | | For the Period Ended | |
| | | (Unaudited) | | | May 31, 2024 * | |
| FROM OPERATIONS | | | | | | | | |
| Net investment income | | $ | 76,757 | | | $ | 88,985 | |
| Net realized gain (loss) from investments | | | (144,210 | ) | | | 1,027,742 | |
| Net realized gain from in-kind redemptions | | | 12,195,854 | | | | 712,432 | |
| Net change in unrealized appreciation on investments | | | 3,808,476 | | | | 7,701,819 | |
| Net increase in net assets resulting from operations | | | 15,936,877 | | | | 9,530,978 | |
| | | | | | | | | |
| DISTRIBUTIONS TO SHAREHOLDERS | | | | | | | | |
| Total distributions paid | | | (59,745 | ) | | | (72,992 | ) |
| Total distributions to shareholders | | | (59,745 | ) | | | (72,992 | ) |
| | | | | | | | | |
| FROM SHARES OF BENEFICIAL INTEREST | | | | | | | | |
| Proceeds from shares sold | | | 42,781,448 | | | | 74,437,562 | |
| Cost of shares redeemed | | | (34,876,228 | ) | | | (4,562,726 | ) |
| Transaction Fees (Note 5) | | | 3,250 | | | | 10,500 | |
| Net increase in net assets from shares of beneficial interest | | | 7,908,470 | | | | 69,885,336 | |
| | | | | | | | | |
| TOTAL INCREASE IN NET ASSETS | | | 23,785,602 | | | | 79,343,322 | |
| | | | | | | | | |
| NET ASSETS | | | | | | | | |
| Beginning of Period | | | 79,343,322 | | | | — | |
| End of Period | | $ | 103,128,924 | | | $ | 79,343,322 | |
| | | | | | | | | |
| SHARE ACTIVITY | | | | | | | | |
| Shares Sold | | | 1,240,000 | | | | 2,830,000 | |
| Shares Redeemed | | | (1,000,000 | ) | | | 2,670,000 | |
| Net increase in shares of beneficial interest outstanding | | | 240,000 | | | | 2,670,000 | |
| * | Brookstone Growth Stock ETF commenced operations on September 26, 2023. |
See accompanying notes which are an integral part of these financial statements.
| Brookstone Value Stock ETF |
| STATEMENTS OF CHANGES IN NET ASSETS |
| | | For the Six Months Ended | | | | |
| | | November 30, 2024 | | | For the Period Ended | |
| | | (Unaudited) | | | May 31, 2024 * | |
| FROM OPERATIONS | | | | | | | | |
| Net investment income | | $ | 534,399 | | | $ | 494,502 | |
| Net realized gain from investments | | | 39,497 | | | | 2,012,261 | |
| Net realized gain from in-kind redemptions | | | 5,180,122 | | | | 754,463 | |
| Net change in unrealized appreciation on investments | | | 3,857,752 | | | | 6,927,097 | |
| Net increase in net assets resulting from operations | | | 9,611,770 | | | | 10,188,323 | |
| | | | | | | | | |
| DISTRIBUTIONS TO SHAREHOLDERS | | | | | | | | |
| Distributions paid | | | (527,098 | ) | | | (491,550 | ) |
| Total distributions to shareholders | | | (527,098 | ) | | | (491,550 | ) |
| | | | | | | | | |
| FROM SHARES OF BENEFICIAL INTEREST | | | | | | | | |
| Proceeds from shares sold | | | 23,061,502 | | | | 72,290,878 | |
| Cost of shares redeemed | | | (21,890,891 | ) | | | (5,509,192 | ) |
| Transaction Fees (Note 5) | | | 3,750 | | | | 9,060 | |
| Net increase in net assets from shares of beneficial interest | | | 1,174,361 | | | | 66,790,746 | |
| | | | | | | | | |
| TOTAL INCREASE IN NET ASSETS | | | 10,259,033 | | | | 76,487,519 | |
| | | | | | | | | |
| NET ASSETS | | | | | | | | |
| Beginning of Period | | | 76,487,519 | | | | — | |
| End of Period | | $ | 86,746,552 | | | $ | 76,487,519 | |
| | | | | | | | | |
| SHARE ACTIVITY | | | | | | | | |
| Shares Sold | | | 720,000 | | | | 2,770,000 | |
| Shares Redeemed | | | (680,000 | ) | | | (190,000 | ) |
| Net increase in shares of beneficial interest outstanding | | | 40,000 | | | | 2,580,000 | |
| * | Brookstone Value Stock ETF commenced operations on September 26, 2023. |
See accompanying notes which are an integral part of these financial statements.
| Brookstone Intermediate Bond ETF |
| STATEMENTS OF CHANGES IN NET ASSETS |
| | | For the Six Months Ended | | | | |
| | | November 30, 2024 | | | For the Period Ended | |
| | | (Unaudited) | | | May 31, 2024 * | |
| FROM OPERATIONS | | | | | | | | |
| Net investment income | | $ | 782,169 | | | $ | 854,715 | |
| Net realized loss from investments | | | — | | | | (3,773 | ) |
| Net realized gain from in-kind redemptions | | | 15,994 | | | | — | |
| Net change in unrealized appreciation on investments | | | 1,164,375 | | | | 630,285 | |
| Net increase in net assets resulting from operations | | | 1,962,538 | | | | 1,481,227 | |
| | | | | | | | | |
| DISTRIBUTIONS TO SHAREHOLDERS | | | | | | | | |
| Distributions paid | | | (787,841 | ) | | | (857,320 | ) |
| Total distributions to shareholders | | | (787,841 | ) | | | (857,320 | ) |
| | | | | | | | | |
| FROM SHARES OF BENEFICIAL INTEREST | | | | | | | | |
| Proceeds from shares sold | | | 2,090,966 | | | | 54,344,912 | |
| Cost of shares redeemed | | | (518,237 | ) | | | — | |
| Transaction Fees (Note 5) | | | 1,250 | | | | 5,000 | |
| Net increase in net assets from shares of beneficial interest | | | 1,573,979 | | | | 54,349,912 | |
| | | | | | | | | |
| TOTAL DECREASE IN NET ASSETS | | | 2,748,676 | | | | 54,973,819 | |
| | | | | | | | | |
| NET ASSETS | | | | | | | | |
| Beginning of Period | | | 54,973,819 | | | | — | |
| End of Period | | $ | 57,722,495 | | | $ | 54,973,819 | |
| | | | | | | | | |
| SHARE ACTIVITY | | | | | | | | |
| Shares Sold | | | 80,000 | | | | 2,160,000 | |
| Shares Redeemed | | | (20,000 | ) | | | — | |
| Net increase in shares of beneficial interest outstanding | | | 60,000 | | | | 2,160,000 | |
| * | Brookstone Intermediate Bond ETF commenced operations on September 26, 2023. |
See accompanying notes which are an integral part of these financial statements.
| Brookstone Ultra-Short Bond ETF |
| STATEMENTS OF CHANGES IN NET ASSETS |
| | | For the Six Months Ended | | | | |
| | | November 30, 2024 | | | For the Period Ended | |
| | | (Unaudited) | | | May 31, 2024 * | |
| FROM OPERATIONS | | | | | | | | |
| Net investment income | | $ | 1,323,823 | | | $ | 1,293,436 | |
| Net realized gain from in-kind redemptions | | | 991 | | | | 23,807 | |
| Net change in unrealized appreciation on investments | | | 12,108 | | | | 122,593 | |
| Net increase in net assets resulting from operations | | | 1,336,922 | | | | 1,439,836 | |
| | | | | | | | | |
| DISTRIBUTIONS TO SHAREHOLDERS | | | | | | | | |
| Total distributions paid | | | (1,329,611 | ) | | | (1,296,360 | ) |
| Total distributions to shareholders | | | (1,329,611 | ) | | | (1,296,360 | ) |
| | | | | | | | | |
| FROM SHARES OF BENEFICIAL INTEREST | | | | | | | | |
| Proceeds from shares sold | | | 3,291,752 | | | | 70,931,046 | |
| Cost of shares redeemed | | | (507,782 | ) | | | (8,824,302 | ) |
| Transaction Fees (Note 5) | | | 1,750 | | | | 8,000 | |
| Net increase in net assets from shares of beneficial interest | | | 2,785,720 | | | | 62,114,744 | |
| | | | | | | | | |
| TOTAL INCREASE IN NET ASSETS | | | 2,793,031 | | | | 62,258,220 | |
| | | | | | | | | |
| NET ASSETS | | | | | | | | |
| Beginning of Period | | | 62,258,220 | | | | — | |
| End of Period | | $ | 65,051,251 | | | $ | 62,258,220 | |
| | | | | | | | | |
| SHARE ACTIVITY | | | | | | | | |
| Shares Sold | | | 130,000 | | | | 2,820,000 | |
| Shares Redeemed | | | (20,000 | ) | | | (350,000 | ) |
| Net increase in shares of beneficial interest outstanding | | | 110,000 | | | | 2,470,000 | |
| * | Brookstone Ultra-Short Bond ETF commenced operations on September 26, 2023. |
See accompanying notes which are an integral part of these financial statements.
| Brookstone Active ETF |
| STATEMENTS OF CHANGES IN NET ASSETS |
| | | For the Six Months Ended | | | | |
| | | November 30, 2024 | | | For the Period Ended | |
| | | (Unaudited) | | | May 31, 2024 * | |
| FROM OPERATIONS | | | | | | | | |
| Net investment income | | $ | 295,625 | | | $ | 274,541 | |
| Net realized gain from in-kind redemptions | | | 153,761 | | | | 125,372 | |
| Net change in unrealized appreciation on investments | | | 3,333,547 | | | | 3,668,099 | |
| Net increase in net assets resulting from operations | | | 3,782,933 | | | | 4,068,012 | |
| | | | | | | | | |
| DISTRIBUTIONS TO SHAREHOLDERS | | | | | | | | |
| Total distributions paid | | | (299,437 | ) | | | (276,252 | ) |
| Total distributions to shareholders | | | (299,437 | ) | | | (276,252 | ) |
| | | | | | | | | |
| FROM SHARES OF BENEFICIAL INTEREST | | | | | | | | |
| Proceeds from shares sold | | | 887,866 | | | | 34,221,992 | |
| Cost of shares redeemed | | | (894,428 | ) | | | (1,357,564 | ) |
| Transaction Fees (Note 5) | | | 1,250 | | | | 6,000 | |
| Net increase (decrease) in net assets from shares of beneficial interest | | | (5,312 | ) | | | 32,870,428 | |
| | | | | | | | | |
| TOTAL DECREASE IN NET ASSETS | | | 3,478,184 | | | | 36,662,188 | |
| | | | | | | | | |
| NET ASSETS | | | | | | | | |
| Beginning of Period | | | 36,662,188 | | | | — | |
| End of Period | | $ | 40,140,372 | | | $ | 36,662,188 | |
| | | | | | | | | |
| SHARE ACTIVITY | | | | | | | | |
| Shares Sold | | | 30,000 | | | | 1,330,000 | |
| Shares Redeemed | | | (30,000 | ) | | | (50,000 | ) |
| Net increase in shares of beneficial interest outstanding | | | — | | | | 1,280,000 | |
| * | Brookstone Active ETF commenced operations on September 27, 2023. |
See accompanying notes which are an integral part of these financial statements.
| Brookstone Opportunities ETF |
| STATEMENTS OF CHANGES IN NET ASSETS |
| | | For the Six Months Ended | | | | |
| | | November 30, 2024 | | | For the Period Ended | |
| | | (Unaudited) | | | May 31, 2024 * | |
| FROM OPERATIONS | | | | | | | | |
| Net investment income | | $ | 288,175 | | | $ | 300,673 | |
| Net realized gain from in-kind redemptions | | | 124,027 | | | | 188,437 | |
| Net change in unrealized appreciation on investments | | | 2,987,289 | | | | 3,019,884 | |
| Net increase in net assets resulting from operations | | | 3,399,491 | | | | 3,508,994 | |
| | | | | | | | | |
| DISTRIBUTIONS TO SHAREHOLDERS | | | | | | | | |
| Distributions paid | | | (291,741 | ) | | | (302,253 | ) |
| Total distributions to shareholders | | | (291,741 | ) | | | (302,253 | ) |
| | | | | | | | | |
| FROM SHARES OF BENEFICIAL INTEREST | | | | | | | | |
| Proceeds from shares sold | | | 903,597 | | | | 33,531,720 | |
| Cost of shares redeemed | | | (870,049 | ) | | | (1,916,905 | ) |
| Transaction Fees (Note 5) | | | 750 | | | | 5,000 | |
| Net increase in net assets from shares of beneficial interest | | | 34,298 | | | | 31,619,815 | |
| | | | | | | | | |
| TOTAL INCREASE IN NET ASSETS | | | 3,142,048 | | | | 34,826,556 | |
| | | | | | | | | |
| NET ASSETS | | | | | | | | |
| Beginning of Period | | | 34,826,556 | | | | — | |
| End of Period | | $ | 37,968,604 | | | $ | 34,826,556 | |
| | | | | | | | | |
| SHARE ACTIVITY | | | | | | | | |
| Shares Sold | | | 30,000 | | | | 1,300,000 | |
| Shares Redeemed | | | (30,000 | ) | | | (70,000 | ) |
| Net increase in shares of beneficial interest outstanding | | | — | | | | 1,230,000 | |
| * | Brookstone Opportunities ETF commenced operations on September 27, 2023. |
See accompanying notes which are an integral part of these financial statements.
| Brookstone Yield ETF |
| STATEMENTS OF CHANGES IN NET ASSETS |
| | | For the Six Months Ended | | | | |
| | | November 30, 2024 | | | For the Period Ended | |
| | | (Unaudited) | | | May 31, 2024 * | |
| FROM OPERATIONS | | | | | | | | |
| Net investment income | | $ | 1,344,510 | | | $ | 1,597,834 | |
| Net realized gain (loss) from investments | | | 6,767 | | | | (208,107 | ) |
| Net realized gain from in-kind redemptions | | | 19,014 | | | | 135,566 | |
| Net change in unrealized appreciation on investments | | | 866,057 | | | | 1,010,159 | |
| Net increase in net assets resulting from operations | | | 2,236,348 | | | | 2,535,452 | |
| | | | | | | | | |
| DISTRIBUTIONS TO SHAREHOLDERS | | | | | | | | |
| Distributions paid | | | (1,348,014 | ) | | | (1,601,515 | ) |
| Total distributions to shareholders | | | (1,348,014 | ) | | | (1,601,515 | ) |
| | | | | | | | | |
| FROM SHARES OF BENEFICIAL INTEREST | | | | | | | | |
| Proceeds from shares sold | | | 2,408,880 | | | | 34,004,547 | |
| Cost of shares redeemed | | | (273,511 | ) | | | (1,865,486 | ) |
| Transaction Fees (Note 5) | | | 1,250 | | | | 5,250 | |
| Net increase in net assets from shares of beneficial interest | | | 2,136,619 | | | | 32,144,311 | |
| | | | | | | | | |
| TOTAL INCREASE IN NET ASSETS | | | 3,024,953 | | | | 33,078,248 | |
| | | | | | | | | |
| NET ASSETS | | | | | | | | |
| Beginning of Period | | | 33,078,248 | | | | — | |
| End of Period | | $ | 36,103,201 | | | $ | 33,078,248 | |
| | | | | | | | | |
| SHARE ACTIVITY | | | | | | | | |
| Shares Sold | | | 90,000 | | | | 1,330,000 | |
| Shares Redeemed | | | (10,000 | ) | | | (70,000 | ) |
| Net increase in shares of beneficial interest outstanding | | | 80,000 | | | | 1,260,000 | |
| * | Brookstone Yield ETF commenced operations on September 27, 2023. |
See accompanying notes which are an integral part of these financial statements.
| Brookstone Dividend Stock ETF |
| FINANCIAL HIGHLIGHTS |
Per Share Data and Ratios for a Share of Beneficial Interest Outstanding Throughout Each Period Presented
| | | For the Six Months Ended | | | For the Period Ended | |
| | | November 30, 2024 | | | May 31, 2024 | (1) |
| | | (Unaudited) | | | | |
| Net asset value, beginning of period | | $ | 29.43 | | | $ | 25.00 | |
| Activity from investment operations: | | | | | | | | |
| Net investment income (2) | | | 0.59 | | | | 0.79 | |
| Net realized and unrealized gain on investments | | | 5.00 | | | | 4.27 | |
| Total from investment operations | | | 5.59 | | | | 5.06 | |
| Less distributions from: | | | | | | | | |
| Net investment income | | | (0.54 | ) | | | (0.63 | ) |
| Total distributions | | | (0.54 | ) | | | (0.63 | ) |
| Net asset value, end of period | | $ | 34.48 | | | $ | 29.43 | |
| Market price, end of period | | $ | 34.51 | | | $ | 29.40 | |
| Total return (3)(6) | | | 19.05 | % | | | 20.39 | % |
| Total return - Market price (4)(6) | | | 19.28 | % | | | 20.27 | % |
| Net assets, at end of period (000s) | | $ | 93,798 | | | $ | 75,635 | |
| Ratio of gross expenses to average net assets (7) | | | 0.87 | % | | | 1.00 | % |
| Ratio of net expenses to average net assets (7) | | | 0.87 | % | | | 0.95 | % |
| Ratio of net investment income to average net assets (7) | | | 3.71 | % | | | 4.21 | % |
| Portfolio Turnover Rate (5)(6) | | | 8 | % | | | 15 | % |
| (1) | The Brookstone Dividend Stock ETF commenced operations on September 27, 2023. |
| (2) | Per share amounts calculated using the average shares method. |
| (3) | Total return is calculated assuming a purchase of shares at net asset value on the first day and a sale at net asset value on the last day of the period. Distributions are assumed, for the purpose of this calculation, to be reinvested at the ex-dividend date net asset value per share on their respective payment dates. |
| (4) | Market price returns are calculated using the closing price and account for distributions from the Fund. Distributions are assumed, for the purpose of this calculation, to be reinvested at the ex-dividend date market price per share on their respective payment dates. |
| (5) | Portfolio turnover rate excludes portfolio securities received or delivered as a result of processing capital share transactions in Creation Units. (See Note 5) |
See accompanying notes which are an integral part of these financial statements.
| Brookstone Growth Stock ETF |
| FINANCIAL HIGHLIGHTS |
Per Share Data and Ratios for a Share of Beneficial Interest Outstanding Throughout Each Period Presented
| | | For the Six Months Ended | | | For the Period Ended | |
| | | November 30, 2024 | | | May 31, 2024 | (1) |
| | | (Unaudited) | | | | |
| Net asset value, beginning of period | | $ | 29.72 | | | $ | 25.00 | |
| Activity from investment operations: | | | | | | | | |
| Net investment income (2) | | | 0.03 | | | | 0.05 | |
| Net realized and unrealized gain on investments | | | 5.71 | | | | 4.70 | |
| Total from investment operations | | | 5.74 | | | | 4.75 | |
| Less distributions from: | | | | | | | | |
| Net investment income | | | (0.02 | ) | | | (0.03 | ) |
| Total distributions | | | (0.02 | ) | | | (0.03 | ) |
| Net asset value, end of period | | $ | 35.44 | | | $ | 29.72 | |
| Market price, end of period | | $ | 35.44 | | | $ | 29.76 | |
| Total return (3)(6) | | | 19.32 | % | | | 19.03 | % |
| Total return - Market price (4)(6) | | | 19.16 | % | | | 19.19 | % |
| Net assets, at end of period (000s) | | $ | 103,129 | | | $ | 79,343 | |
| Ratio of gross expenses to average net assets (7) | | | 0.87 | % | | | 0.99 | % |
| Ratio of net expenses to average net assets (7) | | | 0.87 | % | | | 0.95 | % |
| Ratio of net investment income to average net assets (7) | | | 0.17 | % | | | 0.23 | % |
| Portfolio Turnover Rate (5)(6) | | | 15 | % | | | 26 | % |
| (1) | The Brookstone Growth Stock ETF commenced operations on September 26, 2023. |
| (2) | Per share amounts calculated using the average shares method. |
| (3) | Total return is calculated assuming a purchase of shares at net asset value on the first day and a sale at net asset value on the last day of the period. Distributions are assumed, for the purpose of this calculation, to be reinvested at the ex-dividend date net asset value per share on their respective payment dates. |
| (4) | Market price returns are calculated using the closing price and account for distributions from the Fund. Distributions are assumed, for the purpose of this calculation, to be reinvested at the ex-dividend date market price per share on their respective payment dates. |
| (5) | Portfolio turnover rate excludes portfolio securities received or delivered as a result of processing capital share transactions in Creation Units. (See Note 5) |
See accompanying notes which are an integral part of these financial statements.
| Brookstone Value Stock ETF |
| FINANCIAL HIGHLIGHTS |
Per Share Data and Ratios for a Share of Beneficial Interest Outstanding Throughout Each Period Presented
| | | For the Six Months Ended | | | For the Period Ended | |
| | | November 30, 2024 | | | May 31, 2024 | (1) |
| | | (Unaudited) | | | | |
| Net asset value, beginning of period | | $ | 29.65 | | | $ | 25.00 | |
| Activity from investment operations: | | | | | | | | |
| Net investment income (2) | | | 0.21 | | | | 0.25 | |
| Net realized and unrealized gain on investments | | | 3.45 | | | | 4.60 | |
| Total from investment operations | | | 3.66 | | | | 4.85 | |
| Less distributions from: | | | | | | | | |
| Net investment income | | | (0.20 | ) | | | (0.20 | ) |
| Total distributions | | | (0.20 | ) | | | (0.20 | ) |
| Net asset value, end of period | | $ | 33.11 | | | $ | 29.65 | |
| Market price, end of period | | $ | 33.14 | | | $ | 29.65 | |
| Total return (3)(6) | | | 12.37 | % (6) | | | 19.43 | % |
| Total return - Market price (4)(6) | | | 12.47 | % | | | 19.43 | % |
| Net assets, at end of period (000s) | | $ | 86,747 | | | $ | 76,488 | |
| Ratio of gross expenses to average net assets (7) | | | 0.88 | % | | | 0.99 | % |
| Ratio of net expenses to average net assets (7) | | | 0.88 | % | | | 0.95 | % |
| Ratio of net investment income to average net assets (7) | | | 1.34 | % | | | 1.29 | % |
| Portfolio Turnover Rate (5) | | | 20 | % | | | 25 | % |
| (1) | The Brookstone Value Stock ETF commenced operations on September 26, 2023. |
| (2) | Per share amounts calculated using the average shares method. |
| (3) | Total return is calculated assuming a purchase of shares at net asset value on the first day and a sale at net asset value on the last day of the period. Distributions are assumed, for the purpose of this calculation, to be reinvested at the ex-dividend date net asset value per share on their respective payment dates. |
| (4) | Market price returns are calculated using the closing price and account for distributions from the Fund. Distributions are assumed, for the purpose of this calculation, to be reinvested at the ex-dividend date market price per share on their respective payment dates. |
| (5) | Portfolio turnover rate excludes portfolio securities received or delivered as a result of processing capital share transactions in Creation Units. (See Note 5) |
See accompanying notes which are an integral part of these financial statements.
| Brookstone Intermediate Bond ETF |
| FINANCIAL HIGHLIGHTS |
Per Share Data and Ratios for a Share of Beneficial Interest Outstanding Throughout Each Period Presented
| | | For the Six Months Ended | | | For the Period Ended | |
| | | November 30, 2024 | | | May 31, 2024 | (1) |
| | | (Unaudited) | | | | |
| Net asset value, beginning of period | | $ | 25.45 | | | $ | 25.00 | |
| Activity from investment operations: | | | | | | | | |
| Net investment income (2)(6) | | | 0.36 | | | | 0.52 | |
| Net realized and unrealized gain on investments | | | 0.55 | | | | 0.35 | |
| Total from investment operations | | | 0.91 | | | | 0.87 | |
| Less distributions from: | | | | | | | | |
| Net investment income | | | (0.36 | ) | | | (0.42 | ) |
| Total distributions | | | (0.36 | ) | | | (0.42 | ) |
| Net asset value, end of period | | $ | 26.00 | | | $ | 25.45 | |
| Market price, end of period | | $ | 25.99 | | | $ | 25.46 | |
| Total return (3)(8) | | | 3.57 | % | | | 3.50 | % |
| Total return - Market price (4)(8) | | | 3.49 | % | | | 3.54 | % |
| Net assets, at end of period (000s) | | $ | 57,722 | | | $ | 54,974 | |
| Ratio of gross expenses to average net assets (6)(9) | | | 0.92 | % | | | 1.12 | % |
| Ratio of net expenses to average net assets (6)(9) | | | 0.92 | % | | | 0.95 | % |
| Ratio of net investment income to average net assets (5)(9) | | | 2.76 | % | | | 2.98 | % |
| Portfolio Turnover Rate (7)(8) | | | 0 | % | | | 79 | % |
| (1) | The Brookstone Intermediate Bond ETF commenced operations on September 26, 2023. |
| (2) | Per share amounts calculated using the average shares method. |
| (3) | Total return is calculated assuming a purchase of shares at net asset value on the first day and a sale at net asset value on the last day of the period. Distributions are assumed, for the purpose of this calculation, to be reinvested at the ex-dividend date net asset value per share on their respective payment dates. |
| (4) | Market price returns are calculated using the closing price and account for distributions from the Fund. Distributions are assumed, for the purpose of this calculation, to be reinvested at the ex-dividend date market price per share on their respective payment dates. |
| (5) | Recognition of net investment income by the Fund is affected by the timing of the declaration of dividends by the underlying investment companies in which the Fund invests. |
| (6) | Does not include the Fund’s share of the expenses of the underlying investment companies in which the Fund invests. |
| (7) | Portfolio turnover rate excludes portfolio securities received or delivered as a result of processing capital share transactions in Creation Units. (See Note 5) |
See accompanying notes which are an integral part of these financial statements.
| Brookstone Ultra-Short Bond ETF |
| FINANCIAL HIGHLIGHTS |
Per Share Data and Ratios for a Share of Beneficial Interest Outstanding Throughout Each Period Presented
| | | For the Six Months Ended | | | For the Period Ended | |
| | | November 30, 2024 | | | May 31, 2024 | (1) |
| | | (Unaudited) | | | | |
| Net asset value, beginning of period | | $ | 25.21 | | | $ | 25.00 | |
| Activity from investment operations: | | | | | | | | |
| Net investment income (2)(6) | | | 0.53 | | | | 0.66 | |
| Net realized and unrealized gain on investments | | | (0.01 | ) | | | 0.09 | |
| Total from investment operations | | | 0.52 | | | | 0.75 | |
| Less distributions from: | | | | | | | | |
| Net investment income | | | (0.52 | ) | | | (0.54 | ) |
| Total distributions | | | (0.52 | ) | | | (0.54 | ) |
| Net asset value, end of period | | $ | 25.21 | | | $ | 25.21 | |
| Market price, end of period | | $ | 25.24 | | | $ | 25.22 | |
| Total return (3)(8) | | | 2.08 | % | | | 3.01 | % |
| Total return - Market price (4)(8) | | | 2.16 | % | | | 3.05 | % |
| Net assets, at end of period (000s) | | $ | 65,051 | | | $ | 62,258 | |
| Ratio of gross expenses to average net assets (6)(9) | | | 0.91 | % | | | 1.05 | % |
| Ratio of net expenses to average net assets (6)(9) | | | 0.91 | % | | | 0.95 | % |
| Ratio of net investment income to average net assets (5)(9) | | | 4.13 | % | | | 3.82 | % |
| Portfolio Turnover Rate (7)(8) | | | 0 | % | | | 0 | % |
| (1) | The Brookstone Ultra-Short Bond ETF commenced operations on September 26, 2023. |
| (2) | Per share amounts calculated using the average shares method. |
| (3) | Total return is calculated assuming a purchase of shares at net asset value on the first day and a sale at net asset value on the last day of the period. Distributions are assumed, for the purpose of this calculation, to be reinvested at the ex-dividend date net asset value per share on their respective payment dates. |
| (4) | Market price returns are calculated using the closing price and account for distributions from the Fund. Distributions are assumed, for the purpose of this calculation, to be reinvested at the ex-dividend date market price per share on their respective payment dates. |
| (5) | Recognition of net investment income by the Fund is affected by the timing of the declaration of dividends by the underlying investment companies in which the Fund invests. |
| (6) | Does not include the Fund’s share of the expenses of the underlying investment companies in which the Fund invests. |
| (7) | Portfolio turnover rate excludes portfolio securities received or delivered as a result of processing capital share transactions in Creation Units. (See Note 5) |
See accompanying notes which are an integral part of these financial statements.
| Brookstone Active ETF |
| FINANCIAL HIGHLIGHTS |
Per Share Data and Ratios for a Share of Beneficial Interest Outstanding Throughout Each Period Presented
| | | For the Six Months Ended | | | For the Period Ended | |
| | | November 30, 2024 | | | May 31, 2024 | (1) |
| | | (Unaudited) | | | | |
| Net asset value, beginning of period | | $ | 28.64 | | | $ | 25.00 | |
| Activity from investment operations: | | | | | | | | |
| Net investment income (2)(6) | | | 0.23 | | | | 0.27 | |
| Net realized and unrealized gain on investments | | | 2.72 | | | | 3.60 | |
| Total from investment operations | | | 2.95 | | | | 3.87 | |
| Less distributions from: | | | | | | | | |
| Net investment income | | | (0.23 | ) | | | (0.23 | ) |
| Total distributions | | | (0.23 | ) | | | (0.23 | ) |
| Net asset value, end of period | | $ | 31.36 | | | $ | 28.64 | |
| Market price, end of period | | $ | 31.37 | | | $ | 28.65 | |
| Total return (3)(8) | | | 10.33 | % | | | 15.49 | % |
| Total return - Market price (4)(8) | | | 10.33 | % | | | 15.53 | % |
| Net assets, at end of period (000s) | | $ | 40,140 | | | $ | 36,662 | |
| Ratio of gross expenses to average net assets (6)(9) | | | 1.01 | % | | | 1.32 | % |
| Ratio of net expenses to average net assets (6)(9) | | | 0.95 | % | | | 0.95 | % |
| Ratio of net investment income to average net assets (5)(9) | | | 1.53 | % | | | 1.46 | % |
| Portfolio Turnover Rate (7)(8) | | | 0 | % | | | 0 | % |
| (1) | The Brookstone Active ETF commenced operations on September 27, 2023. |
| (2) | Per share amounts calculated using the average shares method. |
| (3) | Total return is calculated assuming a purchase of shares at net asset value on the first day and a sale at net asset value on the last day of the period. Distributions are assumed, for the purpose of this calculation, to be reinvested at the ex-dividend date net asset value per share on their respective payment dates. |
| (4) | Market price returns are calculated using the closing price and account for distributions from the Fund. Distributions are assumed, for the purpose of this calculation, to be reinvested at the ex-dividend date market price per share on their respective payment dates. |
| (5) | Recognition of net investment income by the Fund is affected by the timing of the declaration of dividends by the underlying investment companies in which the Fund invests. |
| (6) | Does not include the Fund’s share of the expenses of the underlying investment companies in which the Fund invests. |
| (7) | Portfolio turnover rate excludes portfolio securities received or delivered as a result of processing capital share transactions in Creation Units. (See Note 5) |
See accompanying notes which are an integral part of these financial statements.
| Brookstone Opportunities ETF |
| FINANCIAL HIGHLIGHTS |
Per Share Data and Ratios for a Share of Beneficial Interest Outstanding Throughout Each Period Presented
| | | For the Six Months Ended | | | For the Period Ended | |
| | | November 30, 2024 | | | May 31, 2024 | (1) |
| | | (Unaudited) | | | | |
| Net asset value, beginning of period | | $ | 28.31 | | | $ | 25.00 | |
| Activity from investment operations: | | | | | | | | |
| Net investment income (2)(6) | | | 0.24 | | | | 0.31 | |
| Net realized and unrealized gain on investments | | | 2.57 | | | | 3.26 | |
| Total from investment operations | | | 2.81 | | | | 3.57 | |
| Less distributions from: | | | | | | | | |
| Net investment income | | | (0.25 | ) | | | (0.26 | ) |
| Total distributions | | | (0.25 | ) | | | (0.26 | ) |
| Net asset value, end of period | | $ | 30.87 | | | $ | 28.31 | |
| Market price, end of period | | $ | 30.87 | | | $ | 28.34 | |
| Total return (3)(8) | | | 9.94 | % | | | 14.31 | % |
| Total return - Market price (4)(8) | | | 9.82 | % | | | 14.43 | % |
| Net assets, at end of period (000s) | | $ | 37,969 | | | $ | 34,827 | |
| Ratio of gross expenses to average net assets (6)(9) | | | 1.01 | % | | | 1.35 | % |
| Ratio of net expenses to average net assets (6)(9) | | | 0.95 | % | | | 0.95 | % |
| Ratio of net investment income to average net assets (5)(9) | | | 1.60 | % | | | 1.69 | % |
| Portfolio Turnover Rate (7)(8) | | | 0 | % | | | 0 | % |
| (1) | The Brookstone Opportunities ETF commenced operations on September 27, 2023. |
| (2) | Per share amounts calculated using the average shares method. |
| (3) | Total return is calculated assuming a purchase of shares at net asset value on the first day and a sale at net asset value on the last day of the period. Distributions are assumed, for the purpose of this calculation, to be reinvested at the ex-dividend date net asset value per share on their respective payment dates. |
| (4) | Market price returns are calculated using the closing price and account for distributions from the Fund. Distributions are assumed, for the purpose of this calculation, to be reinvested at the ex-dividend date market price per share on their respective payment dates. |
| (5) | Recognition of net investment income by the Fund is affected by the timing of the declaration of dividends by the underlying investment companies in which the Fund invests. |
| (6) | Does not include the Fund’s share of the expenses of the underlying investment companies in which the Fund invests. |
| (7) | Portfolio turnover rate excludes portfolio securities received or delivered as a result of processing capital share transactions in Creation Units. (See Note 5) |
See accompanying notes which are an integral part of these financial statements.
| Brookstone Yield ETF |
| FINANCIAL HIGHLIGHTS |
Per Share Data and Ratios for a Share of Beneficial Interest Outstanding Throughout Each Period Presented
| | | For the Six Months Ended | | | For the Period Ended | |
| | | November 30, 2024 | | | May 31, 2024 | (1) |
| | | (Unaudited) | | | | |
| Net asset value, beginning of period | | $ | 26.25 | | | $ | 25.00 | |
| Activity from investment operations: | | | | | | | | |
| Net investment income (2)(6) | | | 1.04 | | | | 1.64 | |
| Net realized and unrealized gain on investments | | | 0.67 | | | | 0.95 | |
| Total from investment operations | | | 1.71 | | | | 2.59 | |
| Less distributions from: | | | | | | | | |
| Net investment income | | | (1.02 | ) | | | (1.34 | ) |
| Net return of capital | | | — | | | | — | |
| Total distributions | | | (1.02 | ) | | | (1.34 | ) |
| Paid-in-Capital From Redemption Fees | | | — | | | | — | |
| Net asset value, end of period | | $ | 26.94 | | | $ | 26.25 | |
| Market price, end of period | | $ | 26.95 | | | $ | 26.25 | |
| Total return (3)(8) | | | 6.61 | % | | | 10.45 | % |
| Total return - Market price (4)(8) | | | 6.65 | % | | | 9.13 | % |
| Net assets, at end of period (000s) | | $ | 36,103 | | | $ | 33,078 | |
| Ratio of gross expenses to average net assets (6)(9) | | | 1.03 | % | | | 1.37 | % |
| Ratio of net expenses to average net assets (6)(9) | | | 0.95 | % | | | 0.95 | % |
| Ratio of net investment income to average net assets (5)(9) | | | 7.78 | % | | | 9.19 | % |
| Portfolio Turnover Rate (7)(8) | | | 0 | % | | | 77 | % |
| (1) | The Brookstone Yield ETF commenced operations on September 27, 2023. |
| (2) | Per share amounts calculated using the average shares method. |
| (3) | Total return is calculated assuming a purchase of shares at net asset value on the first day and a sale at net asset value on the last day of the period. Distributions are assumed, for the purpose of this calculation, to be reinvested at the ex-dividend date net asset value per share on their respective payment dates. |
| (4) | Market price returns are calculated using the closing price and account for distributions from the Fund. Distributions are assumed, for the purpose of this calculation, to be reinvested at the ex-dividend date market price per share on their respective payment dates. |
| (5) | Recognition of net investment income by the Fund is affected by the timing of the declaration of dividends by the underlying investment. |
| (6) | Does not include the Fund’s share of the expenses of the underlying investment companies in which the Fund invests. |
| (7) | Portfolio turnover rate excludes portfolio securities received or delivered as a result of processing capital share transactions in Creation Units. (See Note 5) |
See accompanying notes which are an integral part of these financial statements.
| Brookstone ETFs |
| NOTES TO FINANCIAL STATEMENTS (Unaudited) |
| November 30, 2024 |
The Brookstone Dividend Stock ETF (“BAMD”), Brookstone Growth Stock ETF (“BAMG”), Brookstone Value Stock ETF (“BAMV”), Brookstone Intermediate Bond ETF (“BAMB”), Brookstone Ultra-Short Bond ETF (“BAMU”), Brookstone Active ETF (“BAMA”), Brookstone Opportunities ETF (“BAMO”) and Brookstone Yield ETF (“BAMY”) (each a “Fund” and collectively the “Funds”) are each a diversified series of Northern Lights Fund Trust IV (the “Trust”), a statutory trust organized under the laws of the State of Delaware on June 2, 2015, which is registered under the Investment Company Act of 1940, as amended (the “1940 Act”), as an open-end management investment company. BAMB, BAMU, BAMA, BAMO and BAMY are each a “fund of funds”, in that each Fund will generally invest in other investment companies.
BAMD’s investment objective seeks to provide income and capital appreciation. BAMG and BAMV’s investment objective seeks to provide capital appreciation. BAMB, BAMY and BAMU’s investment objective seeks to provide current income. BAMA and BAMO’s investment objective seeks to provide total return. BAMD, BAMA, BAMO and BAMY commenced operations on September 27, 2023. BAMG, BAMV, BAMB and BAMU commenced operations on September 26, 2023.
| 2. | SIGNIFICANT ACCOUNTING POLICIES |
The following is a summary of significant accounting policies followed by the Funds in preparation of their financial statements. These policies are in conformity with accounting principles in the United States of America (“GAAP”). The preparation of financial statements requires management to make estimates and assumptions that affect the reported amounts of assets and liabilities and disclosure of contingent assets and liabilities at the date of the financial statements and the reported amounts of increases and decreases in net assets from operations during the reporting period. Actual results could differ from those estimates. The Funds are investment companies and accordingly follow the investment company accounting and reporting guidance of the Financial Accounting Standards Board (“FASB”) Accounting Standards Codification Topic 946 “Financial Services – Investment Companies”, including Accounting Standards Update 2013-08.
Securities Valuation – The Funds record their investments at fair value. Securities listed on an exchange are valued at the last reported sale price at the close of the regular trading session of the exchange on the business day the value is being determined, or in the case of securities listed on NASDAQ at the NASDAQ Official Closing Price. In the absence of a sale, such securities shall be valued at the mean between the current bid and ask prices on the day of valuation.
Valuation of Underlying Funds – The Funds may invest in portfolios of open-end or closed-end investment companies (the “investment companies”). Investment companies are valued at their respective net asset values as reported by such investment companies. Mutual funds value securities in their portfolios for which market quotations are readily available at their market values (generally the last reported sale price) and all other securities and assets at their fair value to the methods established by the board of directors of the open-end funds. Exchange-traded funds (“ETFs”) are valued at the last reported price or official closing price. The shares of many closed-end investment companies and ETFs,
| Brookstone ETFs |
| NOTES TO FINANCIAL STATEMENTS (Unaudited)(Continued) |
| November 30, 2024 |
after their initial public offering, frequently trade at a price per share, which is different than the net asset value per share. The difference represents a market premium or market discount of such shares. There can be no assurances that the market discount or market premium on shares of any closed-end investment company or ETF purchased by the Funds will not change.
The Funds may hold investments, such as private placements, interests in commodity pools, other non-traded securities or temporarily illiquid securities, for which market quotations are not readily available or are determined to be unreliable. These securities will be valued at their fair market value as determined using the “fair value” procedures approved by the Board of Trustees (the “Board”). The Board has designated the Adviser as it’s “Valuation Designee” for execution of these procedures. The Adviser may also enlist third-party consultants such as an audit firm or financial officer of a security issuer on an as-needed basis to assist in determining a security-specific fair value.
Fair Valuation Process – Applicable investments are valued pursuant to valuation procedures established by the Board. For example, fair value determinations are required for the following securities: (i) securities for which market quotations are insufficient or not readily available on a particular business day (including securities for which there is a short and temporary lapse in the provision of a price by the regular pricing source); (ii) securities for which, in the judgment of the Valuation Designee, the prices or values available do not represent the fair value of the instrument. Factors which may cause the Valuation Designee to make such a judgment include, but are not limited to, the following: only a bid price or an asked price is available; the spread between bid and asked prices is substantial; the frequency of sales; the thinness of the market; the size of reported trades; and actions of the securities markets, such as the suspension or limitation of trading; (iii) securities determined to be illiquid; (iv) securities with respect to which an event that will affect the value thereof has occurred (a “significant event”) since the closing prices were established on the principal exchange on which they are traded, but prior to a Fund’s calculation of its net asset value. Specifically, interests in commodity pools or managed futures pools are valued on a daily basis by reference to the closing market prices of each futures contract or other asset held by a pool, as adjusted for pool expenses. Restricted or illiquid investments, such as private placements or non-traded securities are valued based upon the current bid for the security from two or more independent dealers or other parties reasonably familiar with the facts and circumstances of the security (who should take into consideration all relevant factors as may be appropriate under the circumstances). If the Valuation Designee is unable to obtain a current bid from such independent dealers or other independent parties, the adviser shall determine the fair value of such security using the following factors: (i) the type of security; (ii) the cost at date of purchase; (iii) the size and nature of a Fund’s holdings; (iv) the discount from market value of unrestricted securities of the same class at the time of purchase and subsequent thereto; (v) information as to any transactions or offers with respect to the security; (vi) the nature and duration of restrictions on disposition of the security and the existence of any registration rights; (vii) how the yield of the security compares to similar securities of companies of similar or equal creditworthiness; (viii) the level of recent trades of similar or comparable securities; (ix) the liquidity characteristics of the security; (x) current market conditions; and (xi) the market value of any securities into which the security is convertible or exchangeable.
| Brookstone ETFs |
| NOTES TO FINANCIAL STATEMENTS (Unaudited)(Continued) |
| November 30, 2024 |
The Funds utilize various methods to measure the fair value of all of their investments on a recurring basis. GAAP establishes a hierarchy that prioritizes inputs to valuation methods. The three levels of input are:
Level 1 – Unadjusted quoted prices in active markets for identical assets and liabilities that the Funds have the ability to access.
Level 2 – Observable inputs other than quoted prices included in Level 1 that are observable for the asset or liability, either directly or indirectly. These inputs may include quoted prices for the identical instrument in an inactive market, prices for similar instruments, interest rates, prepayment speeds, credit risk, yield curves, default rates and similar data.
Level 3 – Unobservable inputs for the asset or liability, to the extent relevant observable inputs are not available, representing the Funds’ own assumptions about the assumptions a market participant would use in valuing the asset or liability, and would be based on the best information available.
The availability of observable inputs can vary from security to security and is affected by a wide variety of factors, including, for example, the type of security, whether the security is new and not yet established in the marketplace, the liquidity of markets, and other characteristics particular to the security. To the extent that valuation is based on models or inputs that are less observable or unobservable in the market, the determination of fair value requires more judgment. Accordingly, the degree of judgment exercised in determining fair value is greatest for instruments categorized in Level 3.
The inputs used to measure fair value may fall into different levels of the fair value hierarchy. In such cases, for disclosure purposes, the level in the fair value hierarchy within which the fair value measurement falls in its entirety, is determined based on the lowest level input that is significant to the fair value measurement in its entirety.
The inputs or methodology used for valuing securities are not necessarily an indication of the risk associated with investing in those securities. The following tables summarize the inputs used as of November 30, 2024 for each Fund’s assets measured at fair value:
| BAMD | | | | | | | | | | | | |
| | | | | | | | | | | | | |
| Assets * | | Level 1 | | | Level 2 | | | Level 3 | | | Total | |
| Common Stocks | | $ | 93,518,750 | | | $ | — | | | $ | — | | | $ | 93,518,750 | |
| Total | | $ | 93,518,750 | | | $ | — | | | $ | — | | | $ | 93,518,750 | |
| | | | | | | | | | | | | | | | | |
| BAMG | | | | | | | | | | | | |
| | | | | | | | | | | | | |
| Assets * | | Level 1 | | | Level 2 | | | Level 3 | | | Total | |
| Common Stocks | | $ | 102,482,709 | | | $ | — | | | $ | — | | | $ | 102,482,709 | |
| Total | | $ | 102,482,709 | | | $ | — | | | $ | — | | | $ | 102,482,709 | |
| Brookstone ETFs |
| NOTES TO FINANCIAL STATEMENTS (Unaudited)(Continued) |
| November 30, 2024 |
| BAMV | | | | | | | | | | | | |
| | | | | | | | | | | | | |
| Assets * | | Level 1 | | | Level 2 | | | Level 3 | | | Total | |
| Common Stocks | | $ | 85,991,499 | | | $ | — | | | $ | — | | | $ | 85,991,499 | |
| Total | | $ | 85,991,499 | | | $ | — | | | $ | — | | | $ | 85,991,499 | |
| | | | | | | | | | | | | | | | | |
| BAMB | | | | | | | | | | | | |
| | | | | | | | | | | | | |
| Assets * | | Level 1 | | | Level 2 | | | Level 3 | | | Total | |
| Exchange-Traded Funds | | $ | 57,618,231 | | | $ | — | | | $ | — | | | $ | 57,618,231 | |
| Total | | $ | 57,618,231 | | | $ | — | | | $ | — | | | $ | 57,618,231 | |
| | | | | | | | | | | | | | | | | |
| BAMU | | | | | | | | | | | | |
| | | | | | | | | | | | | |
| Assets * | | Level 1 | | | Level 2 | | | Level 3 | | | Total | |
| Exchange-Traded Funds | | $ | 63,922,255 | | | $ | — | | | $ | — | | | $ | 63,922,255 | |
| Total | | $ | 63,922,255 | | | $ | — | | | $ | — | | | $ | 63,922,255 | |
| | | | | | | | | | | | | | | | | |
| BAMA | | | | | | | | | | | | |
| | | | | | | | | | | | | |
| Assets * | | Level 1 | | | Level 2 | | | Level 3 | | | Total | |
| Exchange-Traded Funds | | $ | 39,456,028 | | | $ | — | | | $ | — | | | $ | 39,456,028 | |
| Total | | $ | 39,456,028 | | | $ | — | | | $ | — | | | $ | 39,456,028 | |
| | | | | | | | | | | | | | | | | |
| BAMO | | | | | | | | | | | | |
| | | | | | | | | | | | | |
| Assets * | | Level 1 | | | Level 2 | | | Level 3 | | | Total | |
| Exchange-Traded Funds | | $ | 37,302,162 | | | $ | — | | | $ | — | | | $ | 37,302,162 | |
| Total | | $ | 37,302,162 | | | $ | — | | | $ | — | | | $ | 37,302,162 | |
| | | | | | | | | | | | | | | | | |
| BAMY | | | | | | | | | | | | |
| | | | | | | | | | | | | |
| Assets * | | Level 1 | | | Level 2 | | | Level 3 | | | Total | |
| Exchange-Traded Funds | | $ | 36,194,971 | | | $ | — | | | $ | — | | | $ | 36,194,971 | |
| Total | | $ | 36,194,971 | | | $ | — | | | $ | — | | | $ | 36,194,971 | |
The Funds did not hold any Level 2 or 3 securities during the period.
| * | See Schedules of Investments for industry classification. |
Exchange Traded Funds – The Funds may invest in ETFs. ETFs are a type of fund bought and sold on a securities exchange. An ETF trades like common stock. An index ETF represents a portfolio of securities. The risks of owning an ETF generally reflect the risks of owning the underlying securities in which it invests, although the lack of liquidity on an ETF could result in it being more volatile. Additionally, ETFs have fees and expenses that reduce their value.
Security Transactions and Related Income – Security transactions are accounted for on the trade date. Interest income is recognized on an accrual basis and includes amortization and accretion, which is recorded using the effective yield method. Dividend income is recorded on the ex-dividend date. Realized gains or losses from sales of securities are determined by comparing the identified cost of the security lot sold with the net sales proceeds.
Distributions to Shareholders – Dividends from net investment income, if any, are declared and paid quarterly for each Fund. Distributable net realized capital gains, if any, are declared and distributed
| Brookstone ETFs |
| NOTES TO FINANCIAL STATEMENTS (Unaudited)(Continued) |
| November 30, 2024 |
annually to comply with distribution requirements. Dividends from net investment income and distributions from net realized gains are determined in accordance with federal income tax regulations, which may differ from GAAP. These “book/tax” differences are considered either temporary (e.g., deferred losses) or permanent in nature. To the extent these differences are permanent in nature, such amounts are reclassified within the composition of net assets based on their federal tax-basis treatment; temporary differences do not require reclassification. Dividends and distributions to shareholders are recorded on the ex-dividend date.
Cash and Cash Equivalents – Idle cash may be swept into various overnight demand deposits and is classified as cash and cash equivalents on the Statements of Assets and Liabilities. The Funds maintain cash in bank deposit accounts which, at times, may exceed United States federally insured limits. Amounts swept overnight are available on the next business day.
Federal Income Taxes – The Funds comply with the requirements of the Internal Revenue Code applicable to regulated investment companies and to distribute all of their taxable income to shareholders. Therefore, no provision for federal income tax is required.
The Funds recognize the tax benefits of uncertain tax positions only where the position is “more likely than not” to be sustained assuming examination by tax authorities. Management has analyzed each Fund’s tax position and has concluded that no liability for unrecognized tax benefits should be recorded related to uncertain tax positions taken on returns expected to be taken in each Fund’s May 31, 2025 year-end tax returns. The Funds recognize interest and penalties, if any, related to unrecognized tax benefits as income tax expenses, in the Statements of Operations. During the six months ended November 30,2024, the Funds did not incur any interest or penalties.
Expenses – Expenses of the Trust that are directly identifiable to a specific fund are charged to that fund. Expenses, which are not readily identifiable to a specific fund, are allocated in such a manner as deemed equitable (as determined by the Board), taking into consideration the nature and type of expense and the relative sizes of the funds in the Trust.
Indemnification – The Trust indemnifies its officers and Trustees for certain liabilities that may arise from the performance of their duties to the Trust. Additionally, in the normal course of business, the Funds enter into contracts that contain a variety of representations and warranties and which provide general indemnities. The Funds’ maximum exposure under these arrangements is unknown, as this would involve future claims that may be made against the Funds that have not yet occurred. However, based on experience, the risk of loss due to these warranties and indemnities appears to be remote.
| Brookstone ETFs |
| NOTES TO FINANCIAL STATEMENTS (Unaudited)(Continued) |
| November 30, 2024 |
| 3. | INVESTMENT TRANSACTIONS |
For the six months ended November 30, 2024, cost of purchases and proceeds from sales of portfolio securities (excluding in-kind transactions and short-term investments), amounted to:
| Fund | | Purchases | | | Sales | |
| BAMD | | $ | 7,753,097 | | | $ | 6,985,650 | |
| BAMG | | | 14,006,146 | | | | 13,156,558 | |
| BAMV | | | 16,179,211 | | | | 15,872,925 | |
| BAMB | | | — | | | | — | |
| BAMU | | | — | | | | — | |
| BAMA | | | — | | | | — | |
| BAMO | | | 443,122 | | | | — | |
| BAMY | | | — | | | | 285,154 | |
For the six months ended November 30, 2024, cost of purchases and proceeds from sales of portfolio securities for in-kind transactions, amounted to:
| Fund | | Purchases | | | Sales | |
| BAMD | | $ | 23,609,086 | | | $ | 18,550,471 | |
| BAMG | | | 42,017,770 | | | | 34,592,547 | |
| BAMV | | | 22,768,093 | | | | 21,923,633 | |
| BAMB | | | 2,069,817 | | | | 513,197 | |
| BAMU | | | 3,219,883 | | | | 495,331 | |
| BAMA | | | 870,529 | | | | 876,709 | |
| BAMO | | | 884,997 | | | | 851,617 | |
| BAMY | | | 2,370,887 | | | | 266,688 | |
| 4. | INVESTMENT ADVISORY AGREEMENT AND TRANSACTIONS WITH RELATED PARTIES |
Brookstone Asset Management, LLC serves as the Funds’ investment adviser (the “Adviser”) pursuant to an investment advisory agreement with the Trust (the “Advisory Agreement”). Pursuant to the Advisory Agreement, the Adviser, under the oversight of the Board, directs the daily operations of the Funds and supervises the performance of administrative and professional services provided by others. As compensation for its services and the related expenses borne by the Adviser, the Funds pay the Adviser a fee, computed and accrued daily and paid monthly, at an annual rate indicated below of each Fund’s average daily net assets. During the six months ended November 30, 2024, the Adviser earned the following fees:
| Fund | | Annual Rate | | Advisory Fee | |
| BAMD | | 0.65% | | $ | 271,328 | |
| BAMG | | 0.65% | | | 285,897 | |
| BAMV | | 0.65% | | | 259,616 | |
| BAMB | | 0.65% | | | 184,346 | |
| BAMU | | 0.65% | | | 208,191 | |
| BAMA | | 0.65% | | | 125,512 | |
| BAMO | | 0.65% | | | 116,910 | |
| BAMY | | 0.65% | | | 112,334 | |
Pursuant to a written agreement (the “Waiver Agreement”), the Adviser has contractually agreed, until at least September 30, 2025, to ensure that total annual fund operating expenses after fee waiver and/or reimbursement excluding (i) any front-end or contingent deferred loads; (ii) brokerage fees and commissions, (iii) acquired fund fees and expenses; (iv) fees and expenses associated with investments in other collective investment vehicles or derivative instruments (including for example option and swap
| Brookstone ETFs |
| NOTES TO FINANCIAL STATEMENTS (Unaudited)(Continued) |
| November 30, 2024 |
fees and expenses); (v) borrowing costs (such as interest and dividend expense on securities sold short); (vi) taxes; and (vii) extraordinary expenses, such as litigation expenses (which may include indemnification of Fund officers and Trustees, contractual indemnification of Fund service providers (other than the Adviser)) will not exceed 0.95% of average daily net assets of each Fund, respectively; subject to possible recoupment from the Funds in future years within the three years from the date the fees have been waived or reimbursed if such recoupment can be achieved within the lesser of the foregoing expense limits or the expense limits in place at the time of the recoupment. Fee waiver and reimbursement arrangements can decrease the Funds’ expenses and boost its performance. If the Adviser waives any fee or reimburses any expense pursuant to the Waiver Agreement, and the operating expenses attributable to the Funds are subsequently less than the expense limitation, the Adviser shall be entitled to reimbursement by the applicable Fund for such waived fees or reimbursed expenses provided that such reimbursement does not cause the expenses to exceed the Expense Limitation. If the Funds’ operating expenses subsequently exceed the expense limitation, the reimbursements shall be suspended.
During the six months ended November 30, 2024, the Adviser waived fees and/or reimbursed expenses, pursuant to the Waiver Agreement, in the amounts of:
| | | Fees waived | |
| | | (reimbursed) by the | |
| Fund | | Adviser | |
| BAMD | | $ | — | |
| BAMG | | | — | |
| BAMV | | | — | |
| BAMB | | | — | |
| BAMU | | | — | |
| BAMA | | | 11,193 | |
| BAMO | | | 11,243 | |
| BAMY | | | 13,151 | |
The table below contains the amounts of fee waivers and expense reimbursements subject to recapture by the Adviser through May 31 of the year indicated.
| Fund | | 2027 | |
| BAMD | | $ | 17,724 | |
| BAMG | | | 14,170 | |
| BAMV | | | 13,736 | |
| BAMB | | | 48,296 | |
| BAMU | | | 33,803 | |
| BAMA | | | 69,341 | |
| BAMO | | | 71,130 | |
| BAMY | | | 72,230 | |
| Brookstone ETFs |
| NOTES TO FINANCIAL STATEMENTS (Unaudited)(Continued) |
| November 30, 2024 |
Distributor – The distributor of the Funds is Northern Lights Distributors, LLC (the “Distributor”). The Board has adopted, on behalf of the Funds, the Trust’s Master Distribution and Shareholder Servicing Plan as amended (the “Plan”), pursuant to Rule 12b-1 under the 1940 Act, to pay for certain distribution activities and shareholder services related to fund shares. Under the Plan, the Funds may pay 0.25% per year of the average daily net assets of fund shares for such distribution and shareholder service activities. As of November 30, 2024 the Plan has not been activated. For the six months ended November 30, 2024, the Funds did not incur any distribution fees.
The Distributor acts as the Funds’ principal underwriter in a continuous public offering of the Funds’ shares and is an affiliate of Ultimus Fund Solutions, LLC. For the six months ended November 30, 2024, there were no underwriting commissions.
In addition, certain affiliates of the Distributor provide services to the Funds as follows:
Ultimus Fund Solutions, LLC (“UFS”) - UFS, an affiliate of the Distributor, provides administration and fund accounting services to the Trust. Pursuant to separate servicing agreements with UFS, the Funds pay UFS customary fees for providing administration and fund accounting services to the Funds, which are included in administrative service fees in the Statements of Operations. Certain officers of the Trust are also officers of UFS, and are not paid any fees directly by the Funds for serving in such capacities.
Northern Lights Compliance Services, LLC (“NLCS”) - NLCS, an affiliate of UFS and the Distributor, provides a Chief Compliance Officer to the Trust, as well as related compliance services, pursuant to a consulting agreement between NLCS and the Trust. Under the terms of such agreement, NLCS receives customary fees from each Fund, which are included in compliance officer fees in the Statements of Operations.
Blu Giant, LLC (“Blu Giant”) – Blu Giant, an affiliate of UFS and the Distributor, provides EDGAR conversion and filing services as well as print management services for the Funds on an ad-hoc basis. For the provision of these services, Blu Giant receives customary fees from the Funds, which are included in printing expenses in the Statements of Operations.
| 5. | CAPITAL SHARE TRANSACTIONS |
Shares are not individually redeemable and may be redeemed by the Funds at NAV only in large blocks known as “Creation Units.” Shares are created and redeemed by the Funds only in Creation Unit size aggregations of 10,000. Only Authorized Participants or transactions done through an Authorized Participant are permitted to purchase or redeem Creation Units from the Funds. An Authorized Participant is either (i) a broker-dealer or other participant in the clearing process through the Continuous Net Settlement System of the National Securities Clearing Corporation or (ii) a DTC participant and, in each case, must have executed a Participant Agreement with the Distributor. Such transactions are generally permitted on an in-kind basis, with a balancing cash component to equate the transaction to the NAV per share of the Fund on the transaction date.
Cash may be substituted equivalent to the value of certain securities generally when they are not available in sufficient quantity for delivery, not eligible for trading by the Authorized Participant or as a result of other market circumstances. In addition, the Funds may impose transaction fees on purchases and
| Brookstone ETFs |
| NOTES TO FINANCIAL STATEMENTS (Unaudited)(Continued) |
| November 30, 2024 |
redemptions of Fund shares to cover the custodial and other costs incurred by the Funds in effecting trades. A fixed fee payable to the Custodian may be imposed on each creation and redemption transaction regardless of the number of Creation Units involved in the transaction (“Fixed Fee”). Purchases and redemptions of Creation Units for cash or involving cash-in-lieu are required to pay an additional variable charge to compensate the Funds and its ongoing shareholders for brokerage and market impact expenses relating to Creation Unit transactions (“Variable Charge,” and together with the Fixed Fee, the “Transaction Fees”). Transactions in capital shares for the Funds are disclosed in the Statements of Changes in Net Assets. For the six months ended November 30, 2024, the Funds received the following fees:
| Fund | | Variable Fees | | | Fixed Fees | |
| BAMD | | $ | — | | | $ | 5,500 | |
| BAMG | | | — | | | | 3,250 | |
| BAMV | | | — | | | | 3,750 | |
| BAMB | | | — | | | | 1,250 | |
| BAMU | | | — | | | | 1,750 | |
| BAMA | | | — | | | | 1,250 | |
| BAMO | | | — | | | | 750 | |
| BAMY | | | — | | | | 1,250 | |
The Transaction Fees for the Funds are listed in the table below:
| Fee for in-Kind and Cash | Maximum Additional Variable |
| Purchases | Charge for Cash Purchases* |
| $250 | 2.00%* |
| * | The maximum Transaction Fee may be up to 2.00% of the amount invested. |
Other investment companies including ETFs (“Underlying Funds”) in which the Funds invest are subject to investment advisory and other expenses, which will be indirectly paid by the Funds. As a result, the cost of investing in the Funds will be higher than the cost of investing directly in the Underlying Funds and may be higher than other ETFs that invest directly in stocks and bonds. Each of the Underlying Funds is subject to its own specific risks, but the Adviser expects the principal investment risks of such Underlying Funds will be similar to the risks of investing in the corresponding Funds. ETFs may also trade at a discount or premium to their NAV and may trade at a larger discount or smaller premium subsequent to purchase by the Funds.
| Brookstone ETFs |
| NOTES TO FINANCIAL STATEMENTS (Unaudited)(Continued) |
| November 30, 2024 |
| 7. | AGGREGATE UNREALIZED APPRECIATION AND DEPRECIATION-TAX BASIS |
The identified cost of investments in securities owned by each Fund for federal income tax purposes, and their respective gross unrealized appreciation and depreciation on May 31, 2024, were as follows:
| | | Cost for | | | | | | | | | | |
| | | Federal Tax | | | Unrealized | | | Unrealized | | | Tax Net Unrealized | |
| Portfolio | | Purposes | | | Appreciation | | | Depreciation | | | Appreciation | |
| BAMD | | $ | 77,044,222 | | | $ | 16,764,218 | | | $ | (297,710 | ) | | $ | 16,466,508 | |
| BAMG | | | 90,972,414 | | | | 11,919,226 | | | | (408,931 | ) | | | 11,510,295 | |
| BAMV | | | 75,206,650 | | | | 12,254,395 | | | | (1,469,546 | ) | | | 10,784,849 | |
| BAMB | | | 55,823,571 | | | | 1,794,660 | | | | — | | | | 1,794,660 | |
| BAMU | | | 63,787,554 | | | | 145,644 | | | | (10,943 | ) | | | 134,701 | |
| BAMA | | | 32,454,382 | | | | 7,001,646 | | | | — | | | | 7,001,646 | |
| BAMO | | | 31,294,989 | | | | 6,007,173 | | | | — | | | | 6,007,173 | |
| BAMY | | | 34,318,755 | | | | 1,876,216 | | | | — | | | | 1,876,216 | |
| 8. | DISTRIBUTIONS TO SHAREHOLDERS AND TAX COMPONENTS OF CAPITAL |
The tax character of distributions for the period ended May 31, 2024 was as follows:
| For Fiscal Year Ended | | Ordinary | | | Long-Term | | | Return of | | | | |
| 5/31/2024 | | Income | | | Capital Gains | | | Capital | | | Total | |
| BAMD | | $ | 1,526,556 | | | $ | — | | | $ | — | | | $ | 1,526,556 | |
| BAMG | | | 72,992 | | | | — | | | | — | | | | 72,992 | |
| BAMV | | | 491,550 | | | | — | | | | — | | | | 491,550 | |
| BAMB | | | 857,320 | | | | — | | | | — | | | | 857,320 | |
| BAMU | | | 1,296,360 | | | | — | | | | — | | | | 1,296,360 | |
| BAMA | | | 276,252 | | | | — | | | | — | | | | 276,252 | |
| BAMO | | | 302,253 | | | | — | | | | — | | | | 302,253 | |
| BAMY | | | 1,601,515 | | | | — | | | | — | | | | 1,601,515 | |
As of May 31, 2024, the components of accumulated earnings/(deficit) on a tax basis were as follows:
| | | Undistributed | | | Undistributed | | | Post October Loss | | | Capital Loss | | | Other | | | Unrealized | | | Total | |
| | | Ordinary | | | Long-Term | | | and | | | Carry | | | Book/Tax | | | Appreciation/ | | | Accumulated | |
| Fund | | Income | | | Capital Gains | | | Late Year Loss | | | Forwards | | | Differences | | | (Depreciation) | | | Earnings/(Deficits) | |
| BAMD | | $ | 687,484 | | | $ | 7,090 | | | $ | — | | | $ | — | | | $ | — | | | $ | 9,308,179 | | | $ | 10,002,753 | |
| BAMG | | | 1,055,323 | | | | — | | | | — | | | | — | | | | — | | | | 7,701,819 | | | | 8,757,142 | |
| BAMV | | | 2,021,472 | | | | 1,856 | | | | — | | | | — | | | | — | | | | 6,927,097 | | | | 8,950,425 | |
| BAMB | | | 6,742 | | | | — | | | | (3,773 | ) | | | — | | | | — | | | | 630,285 | | | | 633,254 | |
| BAMU | | | 7,801 | | | | — | | | | — | | | | — | | | | — | | | | 122,593 | | | | 130,394 | |
| BAMA | | | 9,714 | | | | — | | | | — | | | | — | | | | — | | | | 3,668,099 | | | | 3,677,813 | |
| BAMO | | | 7,856 | | | | — | | | | — | | | | — | | | | — | | | | 3,019,884 | | | | 3,027,740 | |
| BAMY | | | 5,897 | | | | — | | | | (208,215 | ) | | | — | | | | — | | | | 1,010,159 | | | | 807,841 | |
| Brookstone ETFs |
| NOTES TO FINANCIAL STATEMENTS (Unaudited)(Continued) |
| November 30, 2024 |
The difference between book basis and tax basis undistributed net investment income (losses), accumulated net realized gains (losses), and unrealized appreciation (depreciation) from C-Corporation return of capital distributions.
Capital losses incurred after October 31 within the fiscal year are deemed to arise on the first business day of the following fiscal year for tax purposes. The following Funds incurred and elected to defer such capital losses as follows:
| | | Post October | |
| Fund | | Losses | |
| BAMD | | $ | — | |
| BAMG | | | — | |
| BAMV | | | — | |
| BAMB | | | 3,773 | |
| BAMU | | | — | |
| BAMA | | | — | |
| BAMO | | | — | |
| BAMY | | | 208,215 | |
Permanent book and tax differences, primarily attributable to realized gain (loss) on in-kind redemptions, and non-deductible expenses, resulted in reclassifications for the tax year ended May 31, 2024, as follows:
| | | Paid | | | | |
| | | In | | | Accumulated | |
| | | Capital | | | Earnings (Losses) | |
| BAMD | | $ | 388,300 | | | $ | (388,300 | ) |
| BAMG | | | 700,844 | | | | (700,844 | ) |
| BAMV | | | 746,348 | | | | (746,348 | ) |
| BAMB | | | (9,347 | ) | | | 9,347 | |
| BAMU | | | 13,082 | | | | (13,082 | ) |
| BAMA | | | 113,947 | | | | (113,947 | ) |
| BAMO | | | 179,001 | | | | (179,001 | ) |
| BAMY | | | 126,096 | | | | (126,096 | ) |
Subsequent events after the date of the Statements of Assets and Liabilities have been evaluated through the date the financial statements were issued.
Distributions: The Board declared the following distributions:
| Fund | | Dividend Per Share | | | Record Date | | Ex-Date | | Payable Date |
| BAMD | | $ | 0.2751 | | | 11/29/2024 | | 11/29/2024 | | 12/6/2024 |
| BAMG | | $ | 0.0145 | | | 11/29/2024 | | 11/29/2024 | | 12/6/2024 |
| BAMV | | $ | 0.1047 | | | 11/29/2024 | | 11/29/2024 | | 12/6/2024 |
| BAMB | | $ | 0.1793 | | | 11/29/2024 | | 11/29/2024 | | 12/6/2024 |
| BAMU | | $ | 0.2555 | | | 11/29/2024 | | 11/29/2024 | | 12/6/2024 |
| BAMA | | $ | 0.1133 | | | 11/29/2024 | | 11/29/2024 | | 12/6/2024 |
| BAMO | | $ | 0.1215 | | | 11/29/2024 | | 11/29/2024 | | 12/6/2024 |
| BAMY | | $ | 0.5385 | | | 11/29/2024 | | 11/29/2024 | | 12/6/2024 |
| Brookstone ETFs |
| NOTES TO FINANCIAL STATEMENTS (Unaudited)(Continued) |
| November 30, 2024 |
| | | Short Term Cap | | | Long Term Cap | | | | | | | | | | |
| | | Gain Dividend Per | | | Gain Dividend Per | | | | | | | | | | |
| Fund | | Share | | | Share | | | Dividend Per Share | | | Record Date | | Ex-Date | | Payable Date |
| BAMD | | $ | 0.2394 | | | $ | 0.0039 | | | $ | 0.1123 | | | 12/27/2024 | | 12/27/2024 | | 1/3/2025 |
| BAMG | | $ | 0.3473 | | | $ | — | | | $ | 0.0572 | | | 12/27/2024 | | 12/27/2024 | | 1/3/2025 |
| BAMV | | $ | 0.7473 | | | $ | 0.0010 | | | $ | 0.0200 | | | 12/27/2024 | | 12/27/2024 | | 1/3/2025 |
| BAMB | | $ | — | | | $ | — | | | $ | 0.1418 | | | 12/27/2024 | | 12/27/2024 | | 1/3/2025 |
| BAMU | | $ | — | | | $ | — | | | $ | 0.1470 | | | 12/27/2024 | | 12/27/2024 | | 1/3/2025 |
| BAMA | | $ | — | | | $ | — | | | $ | 0.1213 | | | 12/27/2024 | | 12/27/2024 | | 1/3/2025 |
| BAMO | | $ | — | | | $ | — | | | $ | 0.1105 | | | 12/27/2024 | | 12/27/2024 | | 1/3/2025 |
| BAMY | | $ | — | | | $ | — | | | $ | 0.3218 | | | 12/27/2024 | | 12/27/2024 | | 1/3/2025 |
Management has determined that no events or transactions occurred requiring adjustment or disclosure in the financial statements other than that discussed above.
ADDITIONAL INFORMATION
Changes in and Disagreements with Accountants
There were no changes in or disagreements with accountants during the period covered by this report.
Proxy Disclosures - Not applicable
Remuneration Paid to Directors, Officers and Others
Refer to the financial statements included herein
Statement Regarding Basis for Approval of Investment Advisory Agreement
Not applicable
| |
| |
| |
| |
| |
| |
| |
| |
| |
| |
| |
| |
| |
| |
| |
| |
| |
| |
| |
| |
| |
| |
| |
| |
| |
| |
| |
| |
| |
| |
| |
| |
| |
| |
| |
| |
| |
| |
| INVESTMENT ADVISER |
| Brookstone Asset Management, LLC |
| 1745 S Naperville Rd |
| Wheaton, IL 60189 |
| |
| ADMINISTRATOR |
| Ultimus Fund Solutions, LLC |
| 225 Pictoria Drive, Suite 450 |
| Cincinnati, OH 45246 |
| |
| |
| |
| |
| |
| |
| BROOK ETF-SA24 |
Item 8. Changes in and Disagreements with Accountants for Open-End Management Investment Companies.
There were no changes in or disagreements with accountants during the period covered by this report
Item 9. Proxy Disclosures for Open-End Management Investment Companies.
Not applicable
Item 10. Remuneration Paid to Directors, Officers, and Others of Open-End Management Investment Companies.
Refer to the financial statements included herein
Item 11. Statement Regarding Basis for Approval of Investment Advisory Contract.
Included under Item 7
Item 12. Disclosure of Proxy Voting Policies and Procedures for Closed-End Management Investment Companies.
Not applicable
Item 13. Portfolio Managers of Closed-End Management Investment Companies.
Not applicable
Item 14. Purchases of Equity Securities by Closed-End Management Investment Company and Affiliated Purchasers.
Not applicable
Item 15. Submission of Matters to a Vote of Security Holders.
None
Item 16. Controls and Procedures.
(a) The registrant’s Principal Executive Officer and Principal Financial Officer have concluded that the registrant’s disclosure controls and procedures (as defined in Rule 30a-3(c) under the Act) are effective in design and operation and are sufficient to form the basis of the certifications required by Rule 30a-(2) under the Act, based on their evaluation of these disclosure controls and procedures as of a date within 90 days of this report on Form N-CSR.
(b) There were no changes in the registrant’s internal control over financial reporting (as defined in Rule 30a-3(d) under the Act) during the period covered by this report that have materially affected, or are reasonably likely to materially affect, the registrant’s internal control over financial reporting.
Item 17. Disclosure of Securities Lending Activities for Closed-End Management Investment Companies.
Not applicable
Item 18. Recovery of Erroneously Awarded Compensation.
Item 19. Exhibits.
| (a)(3) | A separate certification for each principal executive officer and principal financial officer of the registrant as required by Rule 30a-2(a) under the Act (17 CFR 270.30a-2(a)): Attached hereto. |
| (b) | Certifications required by Rule 30a-2(b) under the Act (17 CFR 270.30a-2(b)): Attached hereto |
SIGNATURES
Pursuant to the requirements of the Securities Exchange Act of 1934 and the Investment Company Act of 1940, the registrant has duly caused this report to be signed on its behalf by the undersigned, thereunto duly authorized.
(Registrant) Northern Lights Fund Trust IV
| By (Signature and Title) | |
| /s/ Wendy Wang | |
| Wendy Wang, Principal Executive Officer/President |
| | |
Pursuant to the requirements of the Securities Exchange Act of 1934 and the Investment Company Act of 1940, this report has been signed below by the following persons on behalf of the registrant and in the capacities and on the dates indicated.
| By (Signature and Title) | |
| /s/ Wendy Wang | |
| Wendy Wang, Principal Executive Officer/President |
| | |
| By (Signature and Title) | |
| /s/ Sam Singh | |
| Sam Singh, Principal Financial Officer/Treasurer |
| | |