UNITED STATES
SECURITIES AND EXCHANGE COMMISSION
Washington, D.C. 20549
FORM N-CSR
CERTIFIED SHAREHOLDER REPORT OF REGISTERED
MANAGEMENT INVESTMENT COMPANIES
Investment Company Act file number 811-23096
Legg Mason ETF Investment Trust
(Exact name of registrant as specified in charter)
620 Eighth Avenue, 49th Floor, New York, NY 10018
(Address of principal executive offices) (Zip code)
Robert I. Frenkel, Esq.
Legg Mason & Co., LLC
100 First Stamford Place
Stamford, CT 06902
(Name and address of agent for service)
Registrant’s telephone number, including area code: 1-877-721-1926
Date of fiscal year end: September 30
Date of reporting period: September 30, 2018
ITEM 1. REPORT TO STOCKHOLDERS.
The Annual Report to Stockholders is filed herewith.

| | |
| Annual Report | | September 30, 2018 |
CLEARBRIDGE
ALL CAP GROWTH ETF
CACG

|
| INVESTMENT PRODUCTS: NOT FDIC INSURED • NO BANK GUARANTEE • MAY LOSE VALUE |
Fund objective
The Fund seeks to achieve long-term capital appreciation.
Letter from the president

Dear Shareholder,
We are pleased to provide the annual report of ClearBridge All Cap Growth ETF for the twelve-month reporting period ended September 30, 2018. Please read on for a detailed look at prevailing economic and market conditions during the Fund’s reporting period and to learn how those conditions have affected Fund performance.
As always, we remain committed to providing you with excellent service and a full spectrum of investment choices. We also remain committed to supplementing the support you receive from your financial advisor. One way we accomplish this is through our website, www.leggmason.com. Here you can gain immediate access to market and investment information, including:
| • | | Fund net asset value and market price, |
| • | | Market insights and commentaries from our portfolio managers, and |
| • | | A host of educational resources. |
We look forward to helping you meet your financial goals.
Sincerely,

Jane Trust, CFA
President and Chief Executive Officer
October 31, 2018
| | |
| II | | ClearBridge All Cap Growth ETF |
Investment commentary
Economic review
Economic activity in the U.S. was mixed during the twelve months ended September 30, 2018 (the “reporting period”). Looking back, the U.S. Department of Commerce reported that fourth quarter 2017 and first quarter 2018 U.S. gross domestic product (“GDP”)i growth was 2.3% and 2.2%, respectively. GDP growth then accelerated to 4.2% during the second quarter of 2018 — the strongest reading since the third quarter of 2014. Finally, the U.S. Department of Commerce’s initial reading for third quarter 2018 GDP growth — released after the reporting period ended —was 3.5%. The deceleration in GDP growth in the third quarter of 2018 reflected a downturn in exports and a deceleration in nonresidential fixed investment. Imports increased in the third quarter after decreasing in the second. These movements were partly offset by an upturn in private inventory investment.
Job growth in the U.S. was solid overall and supported the economy during the reporting period. As reported by the U.S. Department of Labor, when the reporting period ended on September 30, 2018, the unemployment rate was 3.7%, versus 4.1% when the period began. September 2018’s reading was the lowest unemployment rate since 1969. The percentage of longer-term unemployed also declined during the reporting period. In September 2018, 22.9% of Americans looking for a job had been out of work for more than six months, versus 24.8% when the period began.
Turning to the global economy, in its October 2018 World Economic Outlook — released after the reporting period ended — the International Monetary Fund (“IMF”)ii said, “Global growth for 2018–19 is projected to remain steady at its 2017 level, but its pace is less vigorous than projected in April [2018] and it has become less balanced. Downside risks to global growth have risen in the past six months and the potential for upside surprises has receded.” From a regional perspective, the IMF projects 2018 growth in the Eurozone will be 2.0%, versus 2.4% in 2017. Japan’s economy is expected to expand 1.1% in 2018, compared to 1.7% in 2017. Elsewhere, the IMF projects that overall growth in emerging market countries will accelerate to 4.7% in 2018, the same as in 2017.
Looking back, at its meeting that concluded on September 20, 2017, the Federal Reserve Board (the “Fed”)iii kept the federal funds rateiv on hold, but reiterated its intention to begin reducing its balance sheet, saying, “In October, the Committee will initiate the balance sheet normalization program….” At its meeting that ended on December 13, 2017, the Fed raised rates to a range between 1.25% and 1.50%. As expected, the Fed kept rates on hold at its meeting that concluded on January 31, 2018. However, at its meeting that ended on March 21, 2018, the Fed again raised the federal funds rate, moving it to a range between 1.50% and 1.75%. At its meeting that concluded on June 13, 2018, the Fed raised the federal funds rate to a range between 1.75% and 2.00%. Finally, at its meeting that ended on September 26, 2018, the Fed raised the federal funds rate to a range between 2.00% and 2.25%.
Central banks outside the U.S. took different approaches to monetary policy during the reporting period. Looking back, in December 2016, the European Central Bank (“ECB”)v extended its bond buying program until December 2017. From April 2017 through
| | |
| ClearBridge All Cap Growth ETF | | III |
Investment commentary (cont’d)
December 2017, the ECB purchased €60 billion-per-month of bonds. In October 2017, the ECB announced that it would continue to buy bonds through September 2018, but after December 2017 it would pare its purchases to €30 billion-per-month. In June 2018, the ECB announced it would end its bond buying program by the end of the year, but it did not anticipate raising interest rates “at least through the summer of 2019”. In other developed countries, on November 2, 2017, the Bank of Englandvi raised rates from 0.25% to 0.50% — the first increase since July 2007. It then raised rates to 0.75% at its meeting on August 2, 2018. After holding rates steady at 0.10% for more than five years, in January 2016, the Bank of Japanvii announced that it cut the rate on current accounts that commercial banks hold with it to -0.10% and kept rates on hold during the reporting period. Elsewhere, the People’s Bank of Chinaviii kept rates steady at 4.35% during the reporting period.
As always, thank you for your confidence in our stewardship of your assets.
Sincerely,
Jane Trust, CFA
President and Chief Executive Officer
October 31, 2018
All investments are subject to risk including the possible loss of principal. Past performance is no guarantee of future results. Forecasts and predictions are inherently limited and should not be relied upon as an indication of actual or future performance.
| i | Gross domestic product (“GDP”) is the market value of all final goods and services produced within a country in a given period of time. |
| ii | The International Monetary Fund (“IMF”) is an organization of 189 countries, working to foster global monetary cooperation, secure financial stability, facilitate international trade, promote high employment and sustainable economic growth, and reduce poverty around the world. |
| iii | The Federal Reserve Board (the “Fed”) is responsible for the formulation of U.S. policies designed to promote economic growth, full employment, stable prices, and a sustainable pattern of international trade and payments. |
| iv | The federal funds rate is the rate charged by one depository institution on an overnight sale of immediately available funds (balances at the Federal Reserve) to another depository institution; the rate may vary from depository institution to depository institution and from day to day. |
| v | The European Central Bank (“ECB”) is responsible for the monetary system of the European Union and the euro currency. |
| vi | The Bank of England (“BoE”), formally the Governor and Company of the BoE, is the central bank of the United Kingdom. The BoE’s purpose is to maintain monetary and financial stability. |
| vii | The Bank of Japan is the central bank of Japan. The bank is responsible for issuing and handling currency and treasury securities, implementing monetary policy, maintaining the stability of the Japanese financial system and the yen currency. |
| viii | The People’s Bank of China is the central bank of the People’s Republic of China with the power to carry out monetary policy and regulate financial institutions in mainland China. |
| | |
| IV | | ClearBridge All Cap Growth ETF |
Fund overview
Q. What is the Fund’s investment strategy?
A. The ClearBridge All Cap Growth ETF (the “Fund”) seeks to achieve long-term capital appreciation. The Fund seeks to invest in a diversified portfolio of large, medium and small capitalization stocks that have the potential for above-average long-term earnings and/or cash flow growth. We at ClearBridge Investments, LLC (“ClearBridge”), the Fund’s subadviser, use a bottom-up investment process that seeks to find inefficiently priced companies with strong fundamentals, incentive-driven management teams, dominant positions in niche markets and/or goods and services that are in high customer demand. The bottom-up process that we use relies on extensive fundamental research that looks to identify companies with a range of growth opportunities while evaluating the company’s business model, financial structure and management acumen.
Research is conducted by the portfolio managers with input from the sector analysts of ClearBridge’s Fundamental Research Team. The team utilizes proprietary and independent research to identify companies whose projected rapid growth in earnings and cash flow is based on their participation in new products or markets. For large company growth stocks, the team seeks companies that exhibit superior balance sheets, exceptional management teams and long-term, consistent operating histories. We attempt to complement this core group of companies with tactical stocks that reflect themes within the prevailing market environment. When looking at small- and medium-sized company growth stocks, we focus on companies with rapid earnings growth potential, unrecognized values, industry leadership and management teams that have a significant ownership stake. The Fund may invest up to 25% of its net assets (at the time of investment) in foreign securities, either directly or through depositary receipts. We anticipate using a long-term approach to investing that typically results in low portfolio turnover. However, we may take a more active approach to the portfolio, depending upon market conditions.
Q. What were the overall market conditions during the Fund’s reporting period?
A. Above-average corporate earnings growth, boosted by corporate tax reform and continued economic strength drove U.S. markets steadily higher for the twelve-month reporting period ended September 30, 2018. The S&P 500 Indexi gained 17.91%, while the small cap Russell 2000 Indexii added 15.24% and the broad market Russell 3000 Indexiii rose 17.58% for the period. Growth stocks outperformed value stocks with the Russell 3000 Growth Index’siv 25.89% return besting the Russell 3000 Value Index’sv gain by 1,643 basis pointsvi for the period.
The momentum trade, bolstered by inflows into exchange-traded funds (ETFs) and similar passive vehicles, was a primary driver of stock performance. This was evident in the continued market leadership of the FAANG stocks (Facebook, Amazon.com, Apple, Netflix and Google/Alphabet). During the reporting period, the Consumer Discretionary (+41.67%) and the Information Technology (“IT”) (+40.40%) sectors were the best performers in the Russell 3000 Growth Index by a wide margin.
While crowding into these stocks worsened, complacency receded a bit as equity volatility trended closer to normal levels than it had in the last several years. Fears of rising inflation in late January and February 2018,
| | |
| ClearBridge All Cap Growth ETF 2018 Annual Report | | 1 |
Fund overview (cont’d)
coincident with the unwinding of low volatility ETFs, led to a 10% correction for the S&P 500 Index and the first negative quarter for the index since 2015. The heightening of U.S.-China trade tensions also created headwinds for stock performance, with some of the steepest declines occurring among the more momentum-driven segments of the market.
Positive drivers for the year included a comprehensive U.S. tax reform package that lowered individual and corporate tax rates and provided incentives for companies to repatriate profits earned overseas. Much of that cash was directed to share repurchases and mergers & acquisitions activity (“M&A”). The U.S. economy expanded at a healthy clip with U.S. gross domestic product (“GDP”)vii growing 4.2% year-over-year in the second quarter of 2018 while the unemployment rate fell to 3.7% as the economy created over 2.4 million new jobs over the trailing twelve months. Reacting to the healthy expansion and indications of rising prices, the Federal Reserve Board (the “Fed”)viii raised short-term interest rates four times and communicated that its tightening program would continue. Prices for West Texas Intermediate (“WTI”) crude oil rose 45% to finish the reporting period around $73 per barrel, as the Organization of the Petroleum Exporting Countries (“OPEC”) maintained its production targets and energy demand showed resilience.
Q. How did we respond to these changing market conditions?
A. Against a mixed and often volatile geopolitical backdrop, the U.S.’ bull market run continued, led by inflows into ETFs and other passive vehicles. September 2018 U.S. equity fund inflows were the highest since March 2018 as investors continued to participate in the powerful momentum trade. While bullishness is not at the extremes we have seen in the past, complacency, particularly apropos to passive vehicles, is rising, which bears watching. The sell-off in Facebook late in the reporting period on the threat of greater regulatory scrutiny and the underperformance of certain FAANG stocks versus the S&P 500 illustrate the risks being overlooked in the largest names in the market. From a relative performance standpoint, recent results have trailed the Russell 3000 Growth Index, the Fund’s benchmark, as we have been in a high-betaix environment most rewarding to riskier growth companies. The short-term character of the market does not influence portfolio construction as we remain focused on generating consistent returns with attention to risk management. This is supported by the Fund owning stocks that we consider cyclical growth stories
The Energy sector was another headwind as announcements of increased capital spending by drillers was viewed negatively by the market. The firming of crude oil prices stalled late in the reporting period. Longer-term, however, we remain constructive on exploration & production and oil services companies as the OPEC’s September 2018 decision to keep production levels intact, combined with a series of supply disruptions around the globe, should cause commodity prices to rise. As U.S. producers work through supply bottlenecks in Texas and Oklahoma and inventories decline, the call on the U.S. to step up production should resume, boosting demand for drilling equipment and infrastructure.
The Health Care sector was the largest drag on results during the reporting period, but we are encouraged by the positive clinical news being reported by the portfolio’s
| | |
| 2 | | ClearBridge All Cap Growth ETF 2018 Annual Report |
biotechnology companies. An appreciation for the innovative treatments being developed is providing a boost to the Health Care sector that has struggled for much of the last year and represents the portfolio’s largest overweight. We have always pointed to M&A activity as a bellwether of value creation and the media industry was a beneficiary during the reporting period.
Performance review
For the twelve-months ended September 30, 2018, ClearBridge All Cap Growth ETF generated a 20.28% return on a net asset value (“NAV”)x basis and 20.43% based on its market price per sharexi.
The performance table shows the Fund’s total return for the twelve months ended September 30, 2018 based on its NAV and market price as of September 30, 2018. The Fund’s broad-based market index, the Russell 3000 Growth Index, returned 25.89% over the same time frame. The Lipper Multi-Cap Growth Funds Category Average1 returned 22.92% for the period. Please note that Lipper performance returns are based on each fund’s NAV.
| | | | | | | | |
Performance Snapshot as of September 30, 2018
(unaudited) | |
| | | 6 months | | | 12 months | |
| ClearBridge All Cap Growth ETF: | | | | | | | | |
$31.39 (NAV) | | | 11.23 | % | | | 20.28 | %*† |
$31.43 (Market Price) | | | 11.26 | % | | | 20.43 | %*‡ |
| Russell 3000 Growth Index | | | 15.28 | % | | | 25.89 | % |
| Lipper Multi-Cap Growth Funds Category Average1 | | | 12.75 | % | | | 22.92 | % |
The performance shown represents past performance. Past performance is no guarantee of future results and current performance may be higher or lower than the performance shown. Principal value and investment returns will fluctuate so shares, when sold, may be worth more or less than their original cost. Performance data current to the most recent month-end is available at www.leggmason.com/etf.
Investors buy and sell shares of an exchange-traded fund (“ETF”) at market price (not NAV) in the secondary market throughout the trading day. These shares are not individually available for direct purchase from or direct redemption to the ETF. Market price returns shown are typically based upon the mid-point between the bid and ask on the Fund’s principal trading market when the Fund’s NAV is determined, which is typically 4:00 p.m. Eastern time (US). These returns do not represent investors’ returns had they traded shares at other times. Performance figures for periods shorter than one year represent cumulative figures and are not annualized.
Information showing the number of days the market price of the Fund’s shares was greater than the Fund’s NAV and the number of days it was less than the Fund’s NAV (i.e., premium or discount) for various time periods is available by visiting the Fund’s website at www.leggmason.com/etf.
As of the Fund’s current prospectus dated February 1, 2018, the gross total annual fund operating expense ratio for the Fund was 0.53%.
* Total returns are based on changes in NAV or market price, respectively. Returns reflect the deduction of all Fund expenses. Returns do not reflect the deduction of brokerage
| 1 | Lipper, Inc., a wholly-owned subsidiary of Reuters, provides independent insight on global collective investments. Returns are based on the period ended September 30, 2018 calculated among the 560 funds for the six-month period and among the 554 funds for the twelve-month period in the Fund’s Lipper category. |
| | |
| ClearBridge All Cap Growth ETF 2018 Annual Report | | 3 |
Fund overview (cont’d)
commissions or taxes that investors pay on distributions or the sale of shares.
† Total return assumes the reinvestment of all distributions, at NAV.
‡ Total return assumes the reinvestment of all distributions at market price.
Q. What were the leading contributors to performance?
A. On an absolute basis, the Fund’s positions in nine of the ten sectors in which it was invested (out of eleven sectors in total) contributed positively to performance for the reporting period. The greatest contributions to absolute returns came from the Fund’s holdings in the IT sector.
Relative to the benchmark, stock selection in the Materials and the Consumer Discretionary sectors and underweight allocations to the Real Estate and Industrials sectors contributed the most to returns.
In terms of individual Fund holdings, leading contributors to performance for the period included positions in Amazon.com in the Consumer Discretionary sector, UnitedHealth Group in the Health Care sector, Microsoft and Adobe Systems, both in the IT sector, as well as Twitter in the Communication Services1 sector.
Q. What were the leading detractors from performance?
A. Relative to the benchmark, the Fund’s overall stock selection and sector allocation detracted from performance for the reporting period. In particular, stock selection within the Health Care and IT sectors, as well as overweights to the Health Care and the Energy sectors had the most significant negative impacts on relative returns.
In terms of individual Fund holdings, leading detractors from performance for the period included positions in Celgene, Dentsply Sirona and CVS Health, Weatherford International, all in the Energy sector and Anheuser-Busch InBev in the Consumer Staples sector.
Q. Were there any significant changes to the Fund during the reporting period?
A We were opportunistic in repositioning the Fund’s portfolio during the reporting period, adding nine new positions and closing eight existing positions. The largest additions to the Fund included Oracle and QUALCOMM in the IT sector, Equinix in the Real Estate sector and Costco Wholesale in the Consumer Staples sector. The largest sales include CVS Health in the Health Care sector, Rockwell Collins in the Industrials sector and Monsanto in the Materials sector, the latter two were sold due to acquisitions.
The Fund continues to look very different from its benchmark, holding companies across the market cap spectrum and seeking to deliver returns with a low correlation to those offered by passive vehicles. Entering into a period where volatility may be higher and driven more by M&A activity than money flows to ETFs, we believe the large valuation discount gap afforded the Fund’s companies vis-à-vis the market will continue to close.
| 1 | As of September 28, 2018, the Telecommunication Services sector was broadened to include some companies previously classified in the Consumer Discretionary and Information Technology sectors and renamed the Communication Services sector. |
| | |
| 4 | | ClearBridge All Cap Growth ETF 2018 Annual Report |
Looking for additional information?
The Fund’s daily NAV is available on-line at www.leggmason/etf. The Fund is traded under the symbol “CACG” and its closing market price is available on most financial websites. In a continuing effort to provide information concerning the Fund, shareholders may call 1-877-721-1926 (toll free), Monday through Friday from 8:00 a.m. to 5:30 p.m. Eastern time, for the Fund’s current NAV, market price and other information.
Thank you for your investment in ClearBridge All Cap Growth ETF. As always, we appreciate that you have chosen us to manage your assets and we remain focused on achieving the Fund’s investment goals.
Sincerely,

Peter Bourbeau
Portfolio Manager
ClearBridge Investments, LLC

Richard Freeman
Portfolio Manager
ClearBridge Investments, LLC

Evan Bauman
Portfolio Manager
ClearBridge Investments, LLC

Margaret Vitrano
Portfolio Manager
ClearBridge Investments, LLC
October 22, 2018
RISKS: Equity securities are subject to market and price fluctuations. In addition to investments in large-capitalization companies, investments may be made in speculative and/or small-cap and mid-cap companies which involve a higher degree of risk and volatility than investments in larger, more established companies. The Fund’s growth-oriented investment style may increase the risks of investing in the Fund. Growth securities typically are very sensitive to market movements because their market prices tend to reflect future expectations. When it appears those expectations will not be met, the prices of growth securities typically fall. Growth stocks as a group may be out of favor and underperform the overall equity market while the market concentrates on value stocks. Although the Fund will not concentrate its investments in any one industry or industry group, it may, like many growth funds, weight its investments toward certain industries, thus increasing its exposure to factors adversely affecting issuers within those industries. Investments may also be made in depositary receipts and other securities of non-U.S. companies in developed and emerging markets which involve risks in addition to those ordinarily associated with investing in domestic securities, including the potentially negative effects of currency fluctuation, political and economic developments, foreign taxation and differences in auditing and other financial standards. These risks are magnified in emerging markets. Active management and diversification does not ensure gains or protect
| | |
| ClearBridge All Cap Growth ETF 2018 Annual Report | | 5 |
Fund overview (cont’d)
against market declines. Distributions are not guaranteed and are subject to change. Please see the Fund’s prospectus for a more complete discussion of these and other risks and the Fund’s investment strategies.
Portfolio holdings and breakdowns are as of September 30, 2018 and are subject to change and may not be representative of the portfolio manager’s current or future investments. The Fund’s top ten holdings (as a percentage of net assets) as of September 30, 2018 were: UnitedHealth Group Inc. (6.0%), Amazon.com Inc. (4.3%), Biogen Inc. (3.5%), Comcast Corp. (3.3%), Microsoft Corp. (2.7%), Visa Inc. (2.4), Allergan PLC (2.3%), Adobe Systems Inc. (2.1%), JPMorgan 100% U.S. Treasury Securities Money Market Fund, Institutional Class (2.1%) and Facebook Inc. (2.0%). Please refer to pages 11 through 15 for a list and percentage breakdown of the Fund’s holdings.
The mention of sector breakdowns is for informational purposes only and should not be construed as a recommendation to purchase or sell any securities. The information provided regarding such sectors is not a sufficient basis upon which to make an investment decision. Investors seeking financial advice regarding the appropriateness of investing in any securities or investment strategies discussed should consult their financial professional. The Fund’s top five sector holdings (as a percentage of net assets) as of September 30, 2018 were: Information Technology (29.4%), Health Care (22.2%), Communication Services (13.4%), Consumer Discretionary (8.5%) and Industrials (8.3%). The Fund’s composition may differ over time.
All investments are subject to risk including the possible loss of principal. Past performance is no guarantee of future results. All index performance reflects no deduction for fees, expenses or taxes. Please note that an investor cannot invest directly in an index.
The information provided is not intended to be a forecast of future events, a guarantee of future results or investment advice. Views expressed may differ from those of the firm as a whole.
| i | The S&P 500 Index is an unmanaged index of 500 stocks and is generally representative of the performance of larger companies in the U.S. |
| ii | The Russell 2000 Index measures the performance of the small-cap segment of the U.S. equity universe. The Russell 2000 is a subset of the Russell 3000 Index representing approximately 10% of the total market capitalization of that index. It includes approximately 2,000 of the smallest securities based on a combination of their market cap and current index membership. |
| iii | The Russell 3000 Index measures the performance of the 3,000 largest U.S. companies based on total market capitalization, which represents approximately 98% of the U.S. equity market. |
| iv | The Russell 3000 Growth Index measures the performance of the broad growth segment of the U.S. equity universe. It includes those Russell 3000 Index companies with higher price-to-book ratios and higher forecasted growth values. (A price-to-book ratio is the price of a stock compared to the difference between a company’s assets and liabilities.) |
| v | The Russell 3000 Value Index measures the performance of the broad value segment of the U.S. equity universe. It includes those Russell 3000 Index companies with lower price-to-book ratios and lower forecasted growth values. |
| vi | A basis point is one-hundredth (1/100 or 0.01) of one percent. |
| vii | Gross domestic product (“GDP”) is the market value of all final goods and services produced within a country in a given period of time. |
| viii | The Federal Reserve Board (the “Fed”) is responsible for the formulation of U.S. policies designed to promote economic growth, full employment, stable prices and a sustainable pattern of international trade and payments. |
| ix | Beta measures the sensitivity of the investment to the movements of its benchmark. A beta higher than 1.0 indicates the investment has been more volatile than the benchmark and a beta of less than 1.0 indicates that the investment has been less volatile than the benchmark. |
| x | Net Asset Value (“NAV”) is calculated by subtracting total liabilities from total assets and dividing the results by the number of shares outstanding. |
| xi | Market Price is determined by supply and demand. It is the price at which an investor purchases or sells shares of the Fund. The Market Price may differ from the Fund’s NAV. |
| | |
| 6 | | ClearBridge All Cap Growth ETF 2018 Annual Report |
Fund at a glance† (unaudited)
Investment breakdown (%) as a percent of total investments
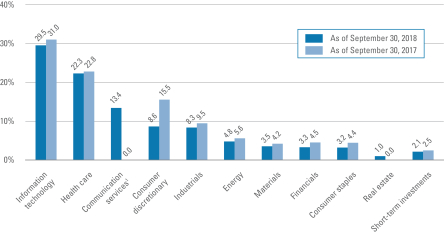
| † | The bar graph above represents the composition of the Fund’s investments as of September 30, 2018 and September 30, 2017. The composition of the Fund’s investments is subject to change at any time. |
| 1 | As of September 28, 2018, the Telecommunication Services sector was broadened to include some companies previously classified in the Consumer Discretionary and Information Technology sectors and renamed the Communication Services sector. |
| | |
| ClearBridge All Cap Growth ETF 2018 Annual Report | | 7 |
Fund expenses (unaudited)
Example
As a shareholder of the Fund, you may incur two types of costs: (1) transaction costs, such as brokerage commissions paid on purchases and sales of Fund shares; and (2) ongoing costs, including management fees; and other Fund expenses. This example is intended to help you understand your ongoing costs (in dollars) of investing in the Fund and to compare these costs with the ongoing costs of investing in other mutual funds.
This example is based on an investment of $1,000 invested on April 1, 2018 and held for the six months ended September 30, 2018.
Actual expenses
The table below titled “Based on Actual Total Return” provides information about actual account values and actual expenses. You may use the information provided in this table, together with the amount you invested, to estimate the expenses that you paid over the period. To estimate the expenses you paid on your account, divide your ending account value by $1,000 (for example, an $8,600 ending account value divided by $1,000 = 8.6), then multiply the result by the number under the heading entitled “Expenses Paid During the Period”.
Hypothetical example for comparison purposes
The table below titled “Based on Hypothetical Total Return” provides information about hypothetical account values and hypothetical expenses based on the actual expense ratio and an assumed rate of return of 5.00% per year before expenses, which is not the Fund’s actual return. The hypothetical account values and expenses may not be used to estimate the actual ending account balance or expenses you paid for the period. You may use the information provided in this table to compare the ongoing costs of investing in the Fund and other funds. To do so, compare the 5.00% hypothetical example relating to the Fund with the 5.00% hypothetical examples that appear in the shareholder reports of the other funds.
Please note that the expenses shown in the table below are meant to highlight your ongoing costs only and do not reflect any transactional costs, such as brokerage commissions paid on purchases and sales of Fund shares. Therefore, the table is useful in comparing ongoing costs only, and will not help you determine the relative total costs of owning different funds. In addition, if these transaction costs were included, your costs would have been higher.
| | | | | | | | | | | | | | | | | | | | | | | | | | | | | | | | | | | | | | | | | | | | | | | | | | |
| Based on actual total return1 | | | | Based on hypothetical total return1 |
Actual
Total
Return2 | | Beginning
Account
Value | | Ending
Account
Value | | Annualized
Expense
Ratio | | Expenses
Paid During
the Period3 | | | | Hypothetical
Annualized
Total Return | | Beginning
Account
Value | | Ending
Account
Value | | Annualized
Expense
Ratio | | Expenses
Paid During
the Period3 |
| | | 11.23% | | | | $ | 1,000.00 | | | | $ | 1,112.30 | | | | | 0.53 | % | | | $ | 2.81 | | | | | | | 5.00 | % | | | | $1,000.00 | | | | $ | 1,022.41 | | | | | 0.53 | % | | | $ | 2.69 | |
| 1 | For the six months ended September 30, 2018. |
| 2 | Assumes the reinvestment of all distributions, including returns of capital, if any, at net asset value. Total return is not annualized, as it may not be representative of the total return for the year. Performance figures may reflect fee waivers and/or expense reimbursements. In the absence of fee waivers and/or expense reimbursements, the total return would have been lower. Past performance is no guarantee of future results. |
| 3 | Expenses (net of fee waivers and/or expense reimbursements) are equal to each class’ respective annualized expense ratio multiplied by the average account value over the period, multiplied by the number of days in the most recent fiscal half-year (183), then divided by 365. |
| | |
| 8 | | ClearBridge All Cap Growth ETF 2018 Annual Report |
Fund performance (unaudited)
| | | | |
| Net asset value | | | |
| Average annual total returns1 | | | |
| Twelve Months Ended 9/30/18 | | | 20.28 | % |
| Inception* through 9/30/18 | | | 18.24 | |
| |
| Cumulative total returns1 | | | |
| Inception date of 5/3/17 through 9/30/18 | | | 26.67 | % |
| | | | |
| Market price | | | |
| Average annual total returns2 | | | |
| Twelve Months Ended 9/30/18 | | | 20.43 | % |
| Inception through 9/30/18 | | | 18.35 | |
| |
| Cumulative total returns2 | | | |
| Inception date of 5/3/17 through 9/30/18 | | | 26.83 | % |
All figures represent past performance and are not a guarantee of future results. Investment returns and principal value of an investment will fluctuate so that an investor’s shares, when redeemed, may be worth more or less than their original cost. The returns shown do not reflect the deduction of brokerage commissions or taxes that a shareholder would pay on Fund distributions or the sale of shares. Performance figures may reflect fee waivers and/or expense reimbursements. In the absence of fee waivers and/or expense reimbursements, the total return would have been lower.
Investors buy and sell shares of the Fund at market price, not NAV, in the secondary market throughout the trading day. These share are not individually available for purchase or redemption directly from the Fund. The Fund’s per share NAV is the value of one share of the Fund and is calculated by dividing the value of total assets less total liabilities by the number of shares outstanding. The NAV return is based on the NAV of the Fund and the market price return is typically based upon the mid-point between the bid and ask on the Fund’s principal trading market when the Fund’s NAV is determined, which is typically 4:00 p.m. Eastern time (US). These returns do not represent investors’ returns had they traded shares at other times. NAV and market price returns assume that dividends and capital gain distributions have been reinvested in the Fund at NAV and market price, respectively. As with other exchange-traded funds, NAV returns and market price returns may differ because of factors such as the supply and demand for Fund shares and investors’ assessment of the underlying value of the Fund’s portfolio securities.
| 1 | Assumes the reinvestment of all distributions, including returns of capital, if any, at net asset value. |
| 2 | Assumes the reinvestment of all distributions, including returns of capital, if any, at market price. |
| * | Inception date of the Fund is May 3, 2017. |
| | |
| ClearBridge All Cap Growth ETF 2018 Annual Report | | 9 |
Fund performance (unaudited) (cont’d)
Historical performance
Value of $10,000 invested in
ClearBridge All Cap Growth ETF vs Russell 3000 Growth Index† — May 3, 2017 - September 2018
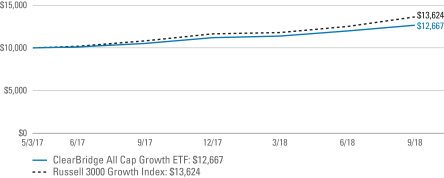
All figures represent past performance and are not a guarantee of future results. Investment returns and principal value of an investment will fluctuate so that an investor’s shares, when redeemed, may be worth more or less than their original cost. NAV returns assume that dividends and capital gain distributions have been reinvested in the Fund at NAV. The returns shown do not reflect the deduction of brokerage commissions or taxes that investors would pay on distributions or the sale of shares. Performance figures may reflect fee waivers and/or expense reimbursements. In the absence of fee waivers and/or expense reimbursements, the total return would have been lower.
| † | Hypothetical illustration of $10,000 invested in ClearBridge All Cap Growth ETF on May 3, 2017, assuming the reinvestment of all distributions, including returns of capital, if any, at net asset value through September 30, 2018. The hypothetical illustration also assumes a $10,000 investment in the Russell 3000 Growth Index. The Fund’s per share NAV is the value of one share of the Fund and is calculated by dividing the value of total assets less total liabilities by the number of shares outstanding. The NAV return is based on the NAV of the Fund. The Russell 3000 Growth Index (the “Index”) measures the performance of the broad growth segment of the U.S. equity universe. It includes those Russell 3000 Index companies with higher price-to-book ratios and higher forecasted growth values. (A price-to-book ratio is the price of a stock compared to the difference between a company’s assets and liabilities.) The index is unmanaged and not subject to the same management and trading expenses as a fund. An index is a statistical composite that tracks a specified financial market, sector, or rules-based investment process. Unlike a fund, an index does not actually hold a portfolio of securities and therefore does not incur the expenses incurred by a fund. These expenses negatively impact fund performance. All index performance reflects no deduction for fees, expenses or taxes. Please note that an investor cannot invest directly in an index. |
| | |
| 10 | | ClearBridge All Cap Growth ETF 2018 Annual Report |
Schedule of investments
September 30, 2018
ClearBridge All Cap Growth ETF
| | | | | | | | | | | | | | | | |
| Security | | | | | | | | Shares | | | Value | |
| Common Stocks — 97.5% | | | | | | | | | | | | | | | | |
| Communication Services — 13.4% | | | | | | | | | | | | | | | | |
Entertainment — 1.5% | | | | | | | | | | | | | | | | |
Liberty Media Corp-Liberty Formula One, Class A Shares | | | | | | | | | | | 615 | | | $ | 21,882 | * |
Liberty Media Corp-Liberty Formula One, Class C Shares | | | | | | | | | | | 943 | | | | 35,070 | * |
Lions Gate Entertainment Corp., Class B Shares | | | | | | | | | | | 4,059 | | | | 94,575 | |
Walt Disney Co. | | | | | | | | | | | 6,642 | | | | 776,715 | |
Total Entertainment | | | | | | | | | | | | | | | 928,242 | |
Interactive Media & Services — 7.0% | | | | | | | | | | | | | | | | |
Alphabet Inc., Class A Shares | | | | | | | | | | | 697 | | | | 841,335 | * |
Alphabet Inc., Class C Shares | | | | | | | | | | | 1,066 | | | | 1,272,239 | * |
Facebook Inc., Class A Shares | | | | | | | | | | | 7,750 | | | | 1,274,565 | * |
Twitter Inc. | | | | | | | | | | | 39,196 | | | | 1,115,518 | * |
Total Interactive Media & Services | | | | | | | | | | | | | | | 4,503,657 | |
Media — 4.9% | | | | | | | | | | | | | | | | |
AMC Networks Inc., Class A Shares | | | | | | | | | | | 3,321 | | | | 220,315 | * |
Comcast Corp., Class A Shares | | | | | | | | | | | 59,163 | | | | 2,094,962 | |
Discovery Inc., Class A Shares | | | | | | | | | | | 10,332 | | | | 330,624 | * |
GCI Liberty Inc., Class A Shares | | | | | | | | | | | 1,599 | | | | 81,549 | * |
Liberty Broadband Corp., Class A Shares | | | | | | | | | | | 369 | | | | 31,118 | * |
Liberty Broadband Corp., Class C Shares | | | | | | | | | | | 697 | | | | 58,757 | * |
Liberty Media Corp-Liberty SiriusXM, Class A Shares | | | | | | | | | | | 2,624 | | | | 113,986 | * |
Liberty Media Corp-Liberty SiriusXM, Class C Shares | | | | | | | | | | | 5,248 | | | | 228,026 | * |
Total Media | | | | | | | | | | | | | | | 3,159,337 | |
Total Communication Services | | | | | | | | | | | | | | | 8,591,236 | |
| Consumer Discretionary — 8.5% | | | | | | | | | | | | | | | | |
Hotels, Restaurants & Leisure — 1.5% | | | | | | | | | | | | | | | | |
Chipotle Mexican Grill Inc. | | | | | | | | | | | 914 | | | | 415,431 | * |
Yum China Holdings Inc. | | | | | | | | | | | 16,103 | | | | 565,377 | |
Total Hotels, Restaurants & Leisure | | | | | | | | | | | | | | | 980,808 | |
Internet & Direct Marketing Retail — 5.6% | |
Alibaba Group Holding Ltd., ADR | | | | | | | | | | | 2,394 | | | | 394,435 | * |
Amazon.com Inc. | | | | | | | | | | | 1,374 | | | | 2,752,122 | * |
Qurate Retail Inc. | | | | | | | | | | | 20,049 | | | | 445,288 | * |
Total Internet & Direct Marketing Retail | | | | | | | | | | | | | | | 3,591,845 | |
Specialty Retail — 1.4% | | | | | | | | | | | | | | | | |
Home Depot Inc. | | | | | | | | | | | 4,453 | | | | 922,439 | |
Total Consumer Discretionary | | | | | | | | | | | | | | | 5,495,092 | |
See Notes to Financial Statements.
| | |
| ClearBridge All Cap Growth ETF 2018 Annual Report | | 11 |
Schedule of investments (cont’d)
September 30, 2018
ClearBridge All Cap Growth ETF
| | | | | | | | | | | | | | | | |
| Security | | | | | | | | Shares | | | Value | |
| Consumer Staples — 3.2% | | | | | | | | | | | | | | | | |
Beverages — 1.4% | | | | | | | | | | | | | | | | |
Anheuser-Busch InBev SA/NV, ADR | | | | | | | | | | | 6,601 | | | $ | 578,049 | |
Coca-Cola Co. | | | | | | | | | | | 6,882 | | | | 317,880 | |
Total Beverages | | | | | | | | | | | | | | | 895,929 | |
Food & Staples Retailing — 0.9% | | | | | | | | | | | | | | | | |
Costco Wholesale Corp. | | | | | | | | | | | 2,513 | | | | 590,254 | |
Food Products — 0.9% | | | | | | | | | | | | | | | | |
McCormick & Co. Inc., Non Voting Shares | | | | | | | | | | | 4,215 | | | | 555,326 | |
Total Consumer Staples | | | | | | | | | | | | | | | 2,041,509 | |
| Energy — 4.8% | | | | | | | | | | | | | | | | |
Energy Equipment & Services — 2.3% | | | | | | | | | | | | | | | | |
National Oilwell Varco Inc. | | | | | | | | | | | 9,922 | | | | 427,440 | |
Schlumberger Ltd. | | | | | | | | | | | 10,701 | | | | 651,905 | |
Weatherford International PLC | | | | | | | | | | | 143,377 | | | | 388,551 | * |
Total Energy Equipment & Services | | | | | | | | | | | | | | | 1,467,896 | |
Oil, Gas & Consumable Fuels — 2.5% | | | | | | | | | | | | | | | | |
Anadarko Petroleum Corp. | | | | | | | | | | | 15,539 | | | | 1,047,484 | |
Pioneer Natural Resources Co. | | | | | | | | | | | 3,278 | | | | 570,995 | |
Total Oil, Gas & Consumable Fuels | | | | | | | | | | | | | | | 1,618,479 | |
Total Energy | | | | | | | | | | | | | | | 3,086,375 | |
| Financials — 3.2% | | | | | | | | | | | | | | | | |
Capital Markets — 2.1% | | | | | | | | | | | | | | | | |
BlackRock Inc. | | | | | | | | | | | 1,652 | | | | 778,637 | |
Charles Schwab Corp. | | | | | | | | | | | 12,505 | | | | 614,621 | |
Total Capital Markets | | | | | | | | | | | | | | | 1,393,258 | |
Consumer Finance — 1.1% | | | | | | | | | | | | | | | | |
American Express Co. | | | | | | | | | | | 6,519 | | | | 694,208 | |
Total Financials | | | | | | | | | | | | | | | 2,087,466 | |
| Health Care — 22.2% | | | | | | | | | | | | | | | | |
Biotechnology — 9.3% | | | | | | | | | | | | | | | | |
Alexion Pharmaceuticals Inc. | | | | | | | | | | | 3,936 | | | | 547,143 | * |
Biogen Inc. | | | | | | | | | | | 6,355 | | | | 2,245,285 | * |
BioMarin Pharmaceutical Inc. | | | | | | | | | | | 3,505 | | | | 339,880 | * |
Celgene Corp. | | | | | | | | | | | 8,036 | | | | 719,142 | * |
ImmunoGen Inc. | | | | | | | | | | | 8,493 | | | | 80,429 | * |
Ionis Pharmaceuticals Inc. | | | | | | | | | | | 8,774 | | | | 452,563 | * |
Regeneron Pharmaceuticals Inc. | | | | | | | | | | | 1,271 | | | | 513,535 | * |
Vertex Pharmaceuticals Inc. | | | | | | | | | | | 5,740 | | | | 1,106,327 | * |
Total Biotechnology | | | | | | | | | | | | | | | 6,004,304 | |
See Notes to Financial Statements.
| | |
| 12 | | ClearBridge All Cap Growth ETF 2018 Annual Report |
ClearBridge All Cap Growth ETF
| | | | | | | | | | | | | | | | |
| Security | | | | | | | | Shares | | | Value | |
Health Care Equipment & Supplies — 0.6% | | | | | | | | | | | | | | | | |
Medtronic PLC | | | | | | | | | | | 3,690 | | | $ | 362,985 | |
Health Care Providers & Services — 6.1% | | | | | | | | | | | | | | | | |
UnitedHealth Group Inc. | | | | | | | | | | | 14,596 | | | | 3,883,120 | |
Life Sciences Tools & Services — 1.4% | | | | | | | | | | | | | | | | |
Thermo Fisher Scientific Inc. | | | | | | | | | | | 3,772 | | | | 920,670 | |
Pharmaceuticals — 4.8% | | | | | | | | | | | | | | | | |
Allergan PLC | | | | | | | | | | | 7,739 | | | | 1,474,125 | |
Johnson & Johnson | | | | | | | | | | | 4,879 | | | | 674,131 | |
Zoetis Inc. | | | | | | | | | | | 10,373 | | | | 949,752 | |
Total Pharmaceuticals | | | | | | | | | | | | | | | 3,098,008 | |
Total Health Care | | | | | | | | | | | | | | | 14,269,087 | |
| Industrials — 8.3% | | | | | | | | | | | | | | | | |
Aerospace & Defense — 1.6% | | | | | | | | | | | | | | | | |
L3 Technologies Inc. | | | | | | | | | | | 4,756 | | | | 1,011,220 | |
Air Freight & Logistics — 1.0% | | | | | | | | | | | | | | | | |
United Parcel Service Inc., Class B Shares | | | | | | | | | | | 5,617 | | | | 655,785 | |
Building Products — 0.9% | | | | | | | | | | | | | | | | |
Johnson Controls International PLC | | | | | | | | | | | 16,605 | | | | 581,175 | |
Construction & Engineering — 0.9% | | | | | | | | | | | | | | | | |
Fluor Corp. | | | | | | | | | | | 10,578 | | | | 614,582 | |
Industrial Conglomerates — 1.3% | | | | | | | | | | | | | | | | |
Honeywell International Inc. | | | | | | | | | | | 4,865 | | | | 809,536 | |
Machinery — 1.1% | | | | | | | | | | | | | | | | |
Caterpillar Inc. | | | | | | | | | | | 3,181 | | | | 485,071 | |
Pentair PLC | | | | | | | | | | | 5,084 | | | | 220,391 | * |
Total Machinery | | | | | | | | | | | | | | | 705,462 | |
Trading Companies & Distributors — 1.5% | | | | | | | | | | | | | | | | |
NOW Inc. | | | | | | | | | | | 10,086 | | | | 166,923 | * |
W.W. Grainger Inc. | | | | | | | | | | | 2,243 | | | | 801,671 | |
Total Trading Companies & Distributors | | | | | | | | | | | | | | | 968,594 | |
Total Industrials | | | | | | | | | | | | | | | 5,346,354 | |
| Information Technology — 29.4% | | | | | | | | | | | | | | | | |
Communications Equipment — 1.3% | | | | | | | | | | | | | | | | |
Palo Alto Networks Inc. | | | | | | | | | | | 3,731 | | | | 840,445 | * |
Electronic Equipment, Instruments & Components — 2.3% | | | | | | | | | | | | | | | | |
Dolby Laboratories Inc., Class A Shares | | | | | | | | | | | 7,995 | | | | 559,410 | |
TE Connectivity Ltd. | | | | | | | | | | | 10,865 | | | | 955,360 | |
Total Electronic Equipment, Instruments & Components | | | | | | | | | | | | | | | 1,514,770 | |
See Notes to Financial Statements.
| | |
| ClearBridge All Cap Growth ETF 2018 Annual Report | | 13 |
Schedule of investments (cont’d)
September 30, 2018
ClearBridge All Cap Growth ETF
| | | | | | | | | | | | | | | | |
| Security | | | | | | | | Shares | | | Value | |
IT Services — 5.5% | | | | | | | | | | | | | | | | |
Akamai Technologies Inc. | | | | | | | | | | | 13,007 | | | $ | 951,462 | * |
PayPal Holdings Inc. | | | | | | | | | | | 11,972 | | | | 1,051,620 | * |
Visa Inc., Class A Shares | | | | | | | | | | | 10,086 | | | | 1,513,808 | |
Total IT Services | | | | | | | | | | | | | | | 3,516,890 | |
Semiconductors & Semiconductor Equipment — 3.7% | | | | | | | | | | | | | | | | |
Broadcom Ltd. | | | | | | | | | | | 2,788 | | | | 687,883 | |
Cree Inc. | | | | | | | | | | | 7,216 | | | | 273,270 | * |
QUALCOMM Inc. | | | | | | | | | | | 10,939 | | | | 787,936 | |
Texas Instruments Inc. | | | | | | | | | | | 5,863 | | | | 629,042 | |
Total Semiconductors & Semiconductor Equipment | | | | | | | | | | | | | | | 2,378,131 | |
Software — 13.4% | | | | | | | | | | | | | | | | |
Adobe Systems Inc. | | | | | | | | | | | 5,002 | | | | 1,350,290 | * |
Autodesk Inc. | | | | | | | | | | | 6,765 | | | | 1,056,084 | * |
Citrix Systems Inc. | | | | | | | | | | | 10,701 | | | | 1,189,523 | |
LogMeIn Inc. | | | | | | | | | | | 1,066 | | | | 94,981 | |
Microsoft Corp. | | | | | | | | | | | 15,252 | | | | 1,744,371 | |
Nuance Communications Inc. | | | | | | | | | | | 11,644 | | | | 201,674 | * |
Oracle Corp. | | | | | | | | | | | 14,428 | | | | 743,908 | |
Red Hat Inc. | | | | | | | | | | | 6,271 | | | | 854,612 | * |
Splunk Inc. | | | | | | | | | | | 6,734 | | | | 814,208 | * |
VMware Inc., Class A Shares | | | | | | | | | | | 3,657 | | | | 570,711 | * |
Total Software | | | | | | | | | | | | | | | 8,620,362 | |
Technology Hardware, Storage & Peripherals — 3.2% | | | | | | | | | | | | | | | | |
Apple Inc. | | | | | | | | | | | 3,280 | | | | 740,427 | |
Seagate Technology PLC | | | | | | | | | | | 20,853 | | | | 987,390 | |
Western Digital Corp. | | | | | | | | | | | 5,289 | | | | 309,618 | |
Total Technology Hardware, Storage & Peripherals | | | | | | | | | | | | | | | 2,037,435 | |
Total Information Technology | | | | | | | | | | | | | | | 18,908,033 | |
| Materials — 3.5% | | | | | | | | | | | | | | | | |
Chemicals — 1.9% | | | | | | | | | | | | | | | | |
Ecolab Inc. | | | | | | | | | | | 5,002 | | | | 784,214 | |
Praxair Inc. | | | | | | | | | | | 2,902 | | | | 466,438 | |
Total Chemicals | | | | | | | | | | | | | | | 1,250,652 | |
Metals & Mining — 1.6% | | | | | | | | | | | | | | | | |
Freeport-McMoRan Inc. | | | | | | | | | | | 37,228 | | | | 518,214 | |
Nucor Corp. | | | | | | | | | | | 7,995 | | | | 507,283 | |
Total Metals & Mining | | | | | | | | | | | | | | | 1,025,497 | |
Total Materials | | | | | | | | | | | | | | | 2,276,149 | |
See Notes to Financial Statements.
| | |
| 14 | | ClearBridge All Cap Growth ETF 2018 Annual Report |
ClearBridge All Cap Growth ETF
| | | | | | | | | | | | | | | | |
| Security | | | | | | | | Shares | | | Value | |
| Real Estate — 1.0% | | | | | | | | | | | | | | | | |
Equity Real Estate Investment Trusts (REITs) — 1.0% | | | | | | | | | | | | | | | | |
Equinix Inc. | | | | | | | | | | | 1,464 | | | $ | 633,751 | |
Total Investments before Short-Term Investments (Cost — $57,423,088) | | | | 62,735,052 | |
| | | | |
| | | | | | Rate | | | | | | | |
| Short-Term Investments — 2.1% | | | | | | | | | | | | | | | | |
JPMorgan 100% U.S. Treasury Securities Money Market Fund, Institutional Class (Cost — $1,336,180) | | | | | | | 1.930% | | | | 1,336,180 | | | | 1,336,180 | |
Total Investments — 99.6% (Cost — $58,759,268) | | | | | | | | | | | | | | | 64,071,232 | |
Other Assets in Excess of Liabilities — 0.4% | | | | | | | | | | | | | | | 284,639 | |
Total Net Assets — 100.0% | | | | | | | | | | | | | | $ | 64,355,871 | |
| * | Non-income producing security. |
| | |
Abbreviation used in this schedule: |
| ADR | | — American Depositary Receipts |
See Notes to Financial Statements.
| | |
| ClearBridge All Cap Growth ETF 2018 Annual Report | | 15 |
Statement of assets and liabilities
September 30, 2018
| | | | |
| |
| Assets: | | | | |
Investments, at value (Cost — $58,759,268) | | $ | 64,071,232 | |
Receivable for securities sold | | | 267,288 | |
Dividends and interest receivable | | | 46,215 | |
Total Assets | | | 64,384,735 | |
| |
| Liabilities: | | | | |
Investment management fee payable | | | 28,864 | |
Total Liabilities | | | 28,864 | |
| Total Net Assets | | $ | 64,355,871 | |
| |
| Net Assets: | | | | |
Par value (Note 5) | | $ | 21 | |
Paid-in capital in excess of par value | | | 58,866,257 | |
Undistributed net investment income | | | 285,166 | |
Accumulated net realized loss on investments | | | (107,537) | |
Net unrealized appreciation on investments | | | 5,311,964 | |
| Total Net Assets | | $ | 64,355,871 | |
| |
| Shares Outstanding | | | 2,050,000 | |
| |
| Net Asset Value | | | $31.39 | |
See Notes to Financial Statements.
| | |
| 16 | | ClearBridge All Cap Growth ETF 2018 Annual Report |
Statement of operations
For the Year Ended September 30, 2018
| | | | |
| |
| Investment Income: | | | | |
Dividends | | $ | 641,938 | |
Interest | | | 20,942 | |
Less: Foreign taxes withheld | | | (5,916) | |
Total Investment Income | | | 656,964 | |
| |
| Expenses: | | | | |
Investment management fee (Note 2) | | | 311,768 | |
Total Expenses | | | 311,768 | |
| Net Investment Income | | | 345,196 | |
| |
| Realized and Unrealized Gain on Investments (Notes 1 and 3): | | | | |
Net Realized Gain From Investment Transactions | | | 6,127,548 | |
Change in Net Unrealized Appreciation (Depreciation) From Investments | | | 4,010,730 | |
| Net Gain on Investments | | | 10,138,278 | |
| Increase in Net Assets From Operations | | $ | 10,483,474 | |
See Notes to Financial Statements.
| | |
| ClearBridge All Cap Growth ETF 2018 Annual Report | | 17 |
Statements of changes in net assets
| | | | | | | | |
For the Year Ended September 30,
and the Period Ended September 30, 2017 | | 2018 | | | 2017† | |
| | |
| Operations: | | | | | | | | |
Net investment income | | $ | 345,196 | | | $ | 70,172 | |
Net realized gain (loss) | | | 6,127,548 | | | | (17,517) | |
Change in net unrealized appreciation (depreciation) | | | 4,010,730 | | | | 1,301,234 | |
Increase in Net Assets From Operations | | | 10,483,474 | | | | 1,353,889 | |
| | |
| Distributions to Shareholders From (Note 1): | | | | | | | | |
Net investment income | | | (130,202) | | | | — | |
Decrease in Net Assets From Distributions to Shareholders | | | (130,202) | | | | — | |
| | |
| Fund Share Transactions (Note 5): | | | | | | | | |
Net proceeds from sale of shares (2,200,000 and 1,400,000 shares issued, respectively) | | | 62,846,056 | | | | 35,272,848 | |
Cost of shares repurchased (1,550,000 and 0 shares repurchased, respectively) | | | (45,470,194) | | | | — | |
Increase in Net Assets From Fund Share Transactions | | | 17,375,862 | | | | 35,272,848 | |
Increase in Net Assets | | | 27,729,134 | | | | 36,626,737 | |
| | |
| Net Assets: | | | | | | | | |
Beginning of year | | | 36,626,737 | | | | — | |
End of year* | | $ | 64,355,871 | | | $ | 36,626,737 | |
*Includes undistributed net investment income of: | | | $285,166 | | | | $70,172 | |
| † | For the period May 3, 2017 (inception date) to September 30, 2017. |
See Notes to Financial Statements.
| | |
| 18 | | ClearBridge All Cap Growth ETF 2018 Annual Report |
Financial highlights
| | | | | | | | |
For a share of beneficial interest outstanding throughout each year ended September 30,
unless otherwise noted: | |
| | | 20181 | | | 20171,2 | |
| | |
| Net asset value, beginning of year | | | $26.16 | | | | $24.84 | |
| | |
| Income from operations: | | | | | | | | |
Net investment income | | | 0.17 | | | | 0.06 | |
Net realized and unrealized gain | | | 5.13 | | | | 1.26 | |
Total income from operations | | | 5.30 | | | | 1.32 | |
| | |
| Less distributions from: | | | | | | | | |
Net investment income | | | (0.07) | | | | — | |
Total distributions | | | (0.07) | | | | — | |
| | |
| Net asset value, end of year | | | $31.39 | | | | $26.16 | |
Total return, based on NAV3 | | | 20.28 | % | | | 5.31 | % |
| | |
| Net assets, end of year (000s) | | | $64,356 | | | | $36,627 | |
| | |
| Ratios to average net assets: | | | | | | | | |
Gross expenses | | | 0.53 | % | | | 0.53 | %4 |
Net expenses | | | 0.53 | | | | 0.53 | 4 |
Net investment income | | | 0.59 | | | | 0.62 | 4 |
| | |
| Portfolio turnover rate5 | | | 15 | % | | | 2 | % |
| 1 | Per share amounts have been calculated using the average shares method. |
| 2 | For the period May 3, 2017 (inception date) to September 30, 2017. |
| 3 | Performance figures may reflect fee waivers and/or expense reimbursements. In the absence of fee waivers and/or expense reimbursements, the total return would have been lower. The total return calculation assumes that distributions are reinvested at NAV. Past performance is no guarantee of future results. Total returns for periods of less than one year are not annualized. |
| 5 | Portfolio turnover excludes the value of portfolio securities received or delivered as a result of in-kind fund share transactions. |
See Notes to Financial Statements.
| | |
| ClearBridge All Cap Growth ETF 2018 Annual Report | | 19 |
Notes to financial statements
1. Organization and significant accounting policies
ClearBridge All Cap Growth ETF (the “Fund”) is a separate diversified investment series of Legg Mason ETF Investment Trust (the “Trust”). The Trust, a Maryland statutory trust, is registered under the Investment Company Act of 1940, as amended (the “1940 Act”), as an open-end management investment company.
The Fund is an actively managed exchange-traded fund (“ETF”). ETFs are funds that trade like other publicly-traded securities. Unlike shares of a mutual fund, which can be bought from and redeemed by the issuing fund by all shareholders at a price based on net asset value (“NAV”), shares of the Fund may be directly purchased from and redeemed by the Fund at NAV solely by certain large institutional investors who have entered into agreements with the Fund’s distributor (“Authorized Participants”). Also unlike shares of a mutual fund, shares of the Fund are listed on a national securities exchange and trade in the secondary market at market prices that change throughout the day.
Shares of the Fund are listed and traded at market prices on NASDAQ. The market price for the Fund’s shares may be different from the Fund’s NAV. The Fund issues and redeems shares at NAV only in blocks of a specified number of shares or multiples thereof (“Creation Units”). Only Authorized Participants may purchase or redeem Creation Units directly with the Fund at NAV. Creation Units are created and redeemed principally in kind (although under some circumstances its shares are created and redeemed partially for cash). Except when aggregated in Creation Units, shares of the Fund are not redeemable securities. Shareholders who are not Authorized Participants may not redeem shares directly from the Fund at NAV.
The Fund seeks to achieve long-term capital appreciation through investing in a diversified portfolio of large, medium and small capitalization stocks that have the potential for above-average long-term earnings and/or cash flow growth.
The following are significant accounting policies consistently followed by the Fund and are in conformity with U.S. generally accepted accounting principles (“GAAP”). Estimates and assumptions are required to be made regarding assets, liabilities and changes in net assets resulting from operations when financial statements are prepared. Changes in the economic environment, financial markets and any other parameters used in determining these estimates could cause actual results to differ. Subsequent events have been evaluated through the date the financial statements were issued.
(a) Investment valuation. Equity securities for which market quotations are available are valued at the last reported sales price or official closing price on the primary market or exchange on which they trade. The valuations for fixed income securities (which may include, but are not limited to, corporate, government, municipal, mortgage-backed, collateralized mortgage obligations and asset-backed securities) and certain derivative instruments are typically the prices supplied by independent third party pricing services, which may use market prices or broker/dealer quotations or a variety of valuation techniques and methodologies. The independent third party pricing services use inputs that are
| | |
| 20 | | ClearBridge All Cap Growth ETF 2018 Annual Report |
observable such as issuer details, interest rates, yield curves, prepayment speeds, credit risks/spreads, default rates and quoted prices for similar securities. Prior to December 1, 2017, short-term fixed income securities that would mature in 60 days or less were valued at amortized cost, unless it was determined that using this method would not reflect an investment’s fair value. Investments in open-end funds are valued at the closing net asset value per share of each fund on the day of valuation. When the Fund holds securities or other assets that are denominated in a foreign currency, the Fund will normally use the currency exchange rates as of 4:00 p.m. (Eastern Time). If independent third party pricing services are unable to supply prices for a portfolio investment, or if the prices supplied are deemed by the manager to be unreliable, the market price may be determined by the manager using quotations from one or more broker/dealers or at the transaction price if the security has recently been purchased and no value has yet been obtained from a pricing service or pricing broker. When reliable prices are not readily available, such as when the value of a security has been significantly affected by events after the close of the exchange or market on which the security is principally traded, but before the Fund calculates its net asset value, the Fund values these securities as determined in accordance with procedures approved by the Fund’s Board of Trustees.
The Board of Trustees is responsible for the valuation process and has delegated the supervision of the daily valuation process to the Legg Mason North Atlantic Fund Valuation Committee (the “Valuation Committee”). The Valuation Committee, pursuant to the policies adopted by the Board of Trustees, is responsible for making fair value determinations, evaluating the effectiveness of the Fund’s pricing policies, and reporting to the Board of Trustees. When determining the reliability of third party pricing information for investments owned by the Fund, the Valuation Committee, among other things, conducts due diligence reviews of pricing vendors, monitors the daily change in prices and reviews transactions among market participants.
The Valuation Committee will consider pricing methodologies it deems relevant and appropriate when making fair value determinations. Examples of possible methodologies include, but are not limited to, multiple of earnings; discount from market of a similar freely traded security; discounted cash-flow analysis; book value or a multiple thereof; risk premium/yield analysis; yield to maturity; and/or fundamental investment analysis. The Valuation Committee will also consider factors it deems relevant and appropriate in light of the facts and circumstances. Examples of possible factors include, but are not limited to, the type of security; the issuer’s financial statements; the purchase price of the security; the discount from market value of unrestricted securities of the same class at the time of purchase; analysts’ research and observations from financial institutions; information regarding any transactions or offers with respect to the security; the existence of merger proposals or tender offers affecting the security; the price and extent of public trading in similar securities of the issuer or comparable companies; and the existence of a shelf registration for restricted securities.
| | |
| ClearBridge All Cap Growth ETF 2018 Annual Report | | 21 |
Notes to financial statements (cont’d)
For each portfolio security that has been fair valued pursuant to the policies adopted by the Board of Trustees, the fair value price is compared against the last available and next available market quotations. The Valuation Committee reviews the results of such back testing monthly and fair valuation occurrences are reported to the Board of Trustees quarterly.
The Fund uses valuation techniques to measure fair value that are consistent with the market approach and/or income approach, depending on the type of security and the particular circumstance. The market approach uses prices and other relevant information generated by market transactions involving identical or comparable securities. The income approach uses valuation techniques to discount estimated future cash flows to present value.
GAAP establishes a disclosure hierarchy that categorizes the inputs to valuation techniques used to value assets and liabilities at measurement date. These inputs are summarized in the three broad levels listed below:
| • | | Level 1 — quoted prices in active markets for identical investments |
| • | | Level 2 — other significant observable inputs (including quoted prices for similar investments, interest rates, prepayment speeds, credit risk, etc.) |
| • | | Level 3 — significant unobservable inputs (including the Fund’s own assumptions in determining the fair value of investments) |
The inputs or methodologies used to value securities are not necessarily an indication of the risk associated with investing in those securities.
The following is a summary of the inputs used in valuing the Fund’s assets carried at fair value:
| | | | | | | | | | | | | | | | |
| ASSETS | |
| Description | | Quoted Prices
(Level 1) | | | Other Significant
Observable Inputs
(Level 2) | | | Significant
Unobservable
Inputs
(Level 3) | | | Total | |
| Common stocks† | | $ | 62,735,052 | | | | — | | | | — | | | $ | 62,735,052 | |
| Short-term investments† | | | 1,336,180 | | | | — | | | | — | | | | 1,336,180 | |
| Total investments | | $ | 64,071,232 | | | | — | | | | — | | | $ | 64,071,232 | |
| † | See Schedule of Investments for additional detailed categorizations. |
(b) Foreign investment risks. The Fund’s investments in foreign securities may involve risks not present in domestic investments. Since securities may be denominated in foreign currencies, may require settlement in foreign currencies or pay interest or dividends in foreign currencies, changes in the relationship of these foreign currencies to the U.S. dollar can significantly affect the value of the investments and earnings of the Fund. Foreign investments may also subject the Fund to foreign government exchange restrictions, expropriation, taxation or other political, social or economic developments, all of which affect the market and/or credit risk of the investments.
| | |
| 22 | | ClearBridge All Cap Growth ETF 2018 Annual Report |
(c) Security transactions and investment income. Security transactions are accounted for on a trade date basis. Interest income (including interest income from payment-in-kind securities), adjusted for amortization of premium and accretion of discount, is recorded on the accrual basis. Dividend income is recorded on the ex-dividend date for dividends received in cash and/or securities. Foreign dividend income is recorded on the ex-dividend date or as soon as practicable after the Fund determines the existence of a dividend declaration after exercising reasonable due diligence. The cost of investments sold is determined by use of the specific identification method. To the extent any issuer defaults or a credit event occurs that impacts the issuer, the Fund may halt any additional interest income accruals and consider the realizability of interest accrued up to the date of default or credit event.
(d) Distributions to shareholders. Distributions from net investment income and distributions of net realized gains, if any, are declared at least annually. Distributions to shareholders of the Fund are recorded on the ex-dividend date and are determined in accordance with income tax regulations, which may differ from GAAP.
(e) Federal and other taxes. It is the Fund’s policy to comply with the federal income and excise tax requirements of the Internal Revenue Code of 1986 (the “Code”), as amended, applicable to regulated investment companies. Accordingly, the Fund intends to distribute its taxable income and net realized gains, if any, to shareholders in accordance with timing requirements imposed by the Code. Therefore, no federal or state income tax provision is required in the Fund’s financial statements.
Management has analyzed the Fund’s tax positions taken on income tax returns for all open tax years and has concluded that as of September 30, 2018, no provision for income tax is required in the Fund’s financial statements. The Fund’s federal and state income and federal excise tax returns for tax years for which the applicable statutes of limitations have not expired are subject to examination by the Internal Revenue Service and state departments of revenue.
Under the applicable foreign tax laws, a withholding tax may be imposed on interest, dividends and capital gains at various rates.
(f) Reclassification. GAAP requires that certain components of net assets be reclassified to reflect permanent differences between financial and tax reporting. These reclassifications have no effect on net assets or net asset value per share. During the current year, the following reclassifications have been made:
| | | | | | | | |
| | | Accumulated Net
Realized Loss | | | Paid-in
Capital | |
| (a) | | $ | (6,217,568) | | | $ | 6,217,568 | |
| (a) | Reclassifications are due to book/tax differences in the treatment of an in-kind distribution of securities. |
| | |
| ClearBridge All Cap Growth ETF 2018 Annual Report | | 23 |
Notes to financial statements (cont’d)
2. Investment management agreement and other transactions with affiliates
Legg Mason Partners Fund Advisor, LLC (“LMPFA”) is the Fund’s investment manager and ClearBridge Investments, LLC (“ClearBridge”) is the Fund’s subadviser. Western Asset Management Company, LLC (formerly Western Asset Management Company) (“Western Asset”) manages the portion of the Fund’s cash and short-term instruments allocated to it. LMPFA, ClearBridge and Western Asset are wholly owned subsidiaries of Legg Mason, Inc. (“Legg Mason”).
LMPFA provides administrative and certain oversight services to the Fund. LMPFA delegates to the subadviser the day-to-day portfolio management of the Fund. The Fund is responsible for paying interest expenses, taxes, brokerage expenses, future 12b-1 fees (if any), acquired fund fees and expenses, extraordinary expenses and the management fee payable to LMPFA under the investment management agreement. LMPFA has agreed to pay all of the Fund’s organization and offering costs.
Under the investment management agreement and subject to the general supervision of the Fund’s Board of Trustees, LMPFA provides or causes to be furnished all investment management, supervisory, administrative and other services reasonably necessary for the operation of the Fund, including certain distribution services (provided pursuant to a separate distribution agreement) and investment advisory services (provided pursuant to separate subadvisory agreements) under a unitary fee structure. The Fund pays an investment management fee, calculated daily and paid monthly, at an annual rate of 0.53% of the Fund’s average daily net assets.
As compensation for its subadvisory services, LMPFA pays ClearBridge monthly 70% of the management fee paid by the Fund to LMPFA, net of (i) all fees and expenses incurred by LMPFA under the investment management agreement (including without limitation any subadvisory fee paid to another subadviser to the Fund) and (ii) expense waivers, if any, and reimbursements. LMPFA pays Western Asset monthly a fee of 0.02% of the portion of the Fund’s average daily net assets allocated to Western Asset for the management of cash and other short-term instruments, net of expense waivers, if any, and reimbursements.
Legg Mason Investor Services, LLC, a wholly-owned broker-dealer subsidiary of Legg Mason, serves as the distributor of Creation Units for the Fund on an agency basis.
The Fund’s Board of Trustees has adopted a Rule 12b-1 shareholder services and distribution plan and under that plan, the Fund is authorized to pay service and/or distribution fees calculated at an annual rate of up to 0.25% of its average daily net assets. No service and/or distribution fees are currently paid by the Fund, and there are no current plans to impose these fees.
All officers and one Trustee of the Trust are employees of Legg Mason or its affiliates and do not receive compensation from the Trust.
| | |
| 24 | | ClearBridge All Cap Growth ETF 2018 Annual Report |
3. Investments
During the year ended September 30, 2018, the aggregate cost of purchases and proceeds from sales of investments (excluding in-kind transactions and short-term investments) were as follows:
| | | | |
| Purchases | | $ | 10,533,039 | |
| Sales | | | 8,339,601 | |
During the year ended September 30, 2018, in-kind transactions (See Note 5) were as follows:
| | | | |
| Contributions | | $ | 49,135,956 | |
| Redemptions | | | 34,439,123 | |
| Realized gain (loss)* | | | 6,358,243 | |
| * | Net realized gains on redemptions in-kind are not taxable to the remaining shareholders of the Fund. |
The in-kind contributions and in-kind redemptions shown in this table may not agree with the Fund Share Transactions on the Statement of Changes in Net Assets. This table represents the accumulation of the Fund’s daily net shareholder transactions while the Statement of Changes in Net Assets reflects gross shareholder transactions including any cash component of the transactions.
At September 30, 2018, the aggregate cost of investments and the aggregate gross unrealized appreciation and depreciation of investments for federal income tax purposes were as follows:
| | | | | | | | | | | | | | | | |
| | | Cost | | | Gross
Unrealized
Appreciation | | | Gross
Unrealized
Depreciation | | | Net
Unrealized
Appreciation | |
| Securities | | $ | 58,838,176 | | | $ | 7,552,856 | | | $ | (2,319,800) | | | $ | 5,233,056 | |
4. Derivative instruments and hedging activities
During the year ended September 30, 2018, the Fund did not invest in derivative instruments.
5. Fund share transactions
At September 30, 2018, the Trust had an unlimited number of shares of beneficial interest authorized with a par value of $0.00001 per share. Fund shares are issued and redeemed by the Fund only in Creation Units or Creation Unit aggregations, where 50,000 shares of the Fund constitute a Creation Unit. Such transactions are made principally on an in-kind basis and under some circumstances partially on a cash basis, with a separate cash payment, which is a balancing cash component to equate the transaction to the net asset value per share of the Fund on the transaction date. Transactions in capital shares of the Fund are disclosed in detail in the Statement of Changes in Net Assets. Authorized Participants are subject to standard creation and redemption transaction fees to offset transfer and other transaction costs associated with the issuance and redemption of Creation Units. Creations and redemptions for cash (when cash creations and redemptions are available or specified) may be subject to an additional variable fee.
| | |
| ClearBridge All Cap Growth ETF 2018 Annual Report | | 25 |
Notes to financial statements (cont’d)
6. Income tax information and distributions to shareholders
The tax character of distributions paid during the fiscal years ended September 30, was as follows:
| | | | | | | | |
| | | 2018 | | | 2017 | |
| Distributions paid from: | | | | | | | | |
| Ordinary income | | $ | 130,202 | | | | — | |
As of September 30, 2018, the components of accumulated earnings (losses) on a tax basis were as follows:
| | | | |
| Undistributed ordinary income — net | | $ | 285,166 | |
| Deferred capital losses* | | | (28,629) | |
| Unrealized appreciation (depreciation)(a) | | | 5,233,056 | |
| Total accumulated earnings (losses) — net | | $ | 5,489,593 | |
| * | These capital losses have been deferred in the current year as either short-term or long-term losses. The losses will be deemed to occur on the first day of the next taxable year in the same character as they were originally deferred and will be available to offset future taxable capital gains. |
| (a) | The difference between book-basis and tax-basis unrealized appreciation (depreciation) is attributable to the tax deferral of losses on wash sales. |
| | |
| 26 | | ClearBridge All Cap Growth ETF 2018 Annual Report |
Report of independent registered public accounting firm
To the Board of Trustees of Legg Mason ETF Investment Trust and Shareholders of ClearBridge All Cap Growth ETF
Opinion on the financial statements
We have audited the accompanying statement of assets and liabilities, including the schedule of investments, of ClearBridge All Cap Growth ETF (one of the funds constituting Legg Mason ETF Investment Trust, referred to hereafter as the “Fund”) as of September 30, 2018, the related statement of operations for the year ended September 30, 2018, and the statement of changes in net assets and the financial highlights for the year ended September 30, 2018 and for the period May 3, 2017 (commencement of operations) through September 30, 2017, including the related notes (collectively referred to as the “financial statements”). In our opinion, the financial statements present fairly, in all material respects, the financial position of the Fund as of September 30, 2018, the results of its operations for the year ended September 30, 2018, and the changes in its net assets and the financial highlights for the year ended September 30, 2018 and for the period May 3, 2017 (commencement of operations) through September 30, 2017 in conformity with accounting principles generally accepted in the United States of America.
Basis for opinion
These financial statements are the responsibility of the Fund’s management. Our responsibility is to express an opinion on the Fund’s financial statements based on our audits. We are a public accounting firm registered with the Public Company Accounting Oversight Board (United States) (“PCAOB”) and are required to be independent with respect to the Fund in accordance with the U.S. federal securities laws and the applicable rules and regulations of the Securities and Exchange Commission and the PCAOB.
We conducted our audits of these financial statements in accordance with the standards of the PCAOB. Those standards require that we plan and perform the audit to obtain reasonable assurance about whether the financial statements are free of material misstatement, whether due to error or fraud.
Our audits included performing procedures to assess the risks of material misstatement of the financial statements, whether due to error or fraud, and performing procedures that respond to those risks. Such procedures included examining, on a test basis, evidence regarding the amounts and disclosures in the financial statements. Our audits also included evaluating the accounting principles used and significant estimates made by management, as well as evaluating the overall presentation of the financial statements. Our procedures included confirmation of securities owned as of September 30, 2018 by correspondence with the custodian. We believe that our audits provide a reasonable basis for our opinion.
/s/PricewaterhouseCoopers LLP
Baltimore, Maryland
November 20, 2018
We have served as the auditor of one or more investment companies in Legg Mason investment company group since 1973. We have not determined the specific year we began serving as auditor.
| | |
| ClearBridge All Cap Growth ETF 2018 Annual Report | | 27 |
Additional information (unaudited)
Information about Trustees and Officers
The business and affairs of ClearBridge All Cap Growth ETF (the “Fund”) are conducted by management under the supervision and subject to the direction of its Board of Trustees. The business address of each Trustee is c/o Jane Trust, Legg Mason, 100 International Drive, 11th Floor, Baltimore, Maryland 21202. Information pertaining to the Trustees and officers of the Fund is set forth below.
The Statement of Additional Information includes additional information about Trustees and is available, without charge, upon request by calling the Fund at 1-877-721-1926.
| | |
| Independent Trustees† | | |
| Paul R. Ades | | |
| Year of birth | | 1940 |
| Position(s) with Trust | | Trustee |
| Term of office1 and length of time served2 | | Since 1983 |
| Principal occupation(s) during past five years | | Paul R. Ades, PLLC (law firm) (since 2000) |
| Number of funds in fund complex overseen by Trustee | | 47 |
| Other board memberships held by Trustee during past five years | | None |
| |
| Andrew L. Breech | | |
| Year of birth | | 1952 |
| Position(s) with Trust | | Trustee |
| Term of office1 and length of time served2 | | Since 1991 |
| Principal occupation(s) during past five years | | President, Dealer Operating Control Service, Inc. (automotive retail management) (since 1985) |
| Number of funds in fund complex overseen by Trustee | | 47 |
| Other board memberships held by Trustee during past five years | | None |
| |
| Dwight B. Crane | | |
| Year of birth | | 1937 |
| Position(s) with Trust | | Trustee |
| Term of office1 and length of time served2 | | Since 1981 |
| Principal occupation(s) during past five years | | Professor Emeritus, Harvard Business School (since 2007); formerly, Professor, Harvard Business School (1969 to 2007); Independent Consultant (since 1969) |
| Number of funds in fund complex overseen by Trustee | | 47 |
| Other board memberships held by Trustee during past five years | | None |
| |
| Althea L. Duersten | | |
| Year of birth | | 1951 |
| Position(s) with Trust | | Trustee |
| Term of office1 and length of time served2 | | Since 2014 |
| Principal occupation(s) during past five years | | Retired (since 2011); formerly, Chief Investment Officer, North America, JPMorgan Chase (investment bank) and member of JPMorgan Executive Committee (2007 to 2011) |
| Number of funds in fund complex overseen by Trustee | | 47 |
| Other board memberships held by Trustee during past five years | | None |
| | |
| 28 | | ClearBridge All Cap Growth ETF |
| | |
| Independent Trustees† cont’d | | |
| Frank G. Hubbard | | |
| Year of birth | | 1937 |
| Position(s) with Trust | | Trustee |
| Term of office1 and length of time served2 | | Since 1993 |
| Principal occupation(s) during past five years | | President, Fealds, Inc. (business development) (since 2016); formerly, President, Avatar International Inc. (business development) (1998 to 2015) |
| Number of funds in fund complex overseen by Trustee | | 47 |
| Other board memberships held by Trustee during past five years | | None |
| |
| Howard J. Johnson | | |
| Year of birth | | 1938 |
| Position(s) with Trust | | Trustee and Chairman |
| Term of office1 and length of time served2 | | From 1981 to 1998 and since 2000 (Chairman since 2013) |
| Principal occupation(s) during past five years | | Chief Executive Officer, Genesis Imaging LLC (technology company) (since 2003) |
| Number of funds in fund complex overseen by Trustee | | 47 |
| Other board memberships held by Trustee during past five years | | None |
| |
| Jerome H. Miller | | |
| Year of birth | | 1938 |
| Position(s) with Trust | | Trustee |
| Term of office1 and length of time served2 | | Since 1995 |
| Principal occupation(s) during past five years | | Retired |
| Number of funds in fund complex overseen by Trustee | | 47 |
| Other board memberships held by Trustee during past five years | | None |
| |
| Ken Miller | | |
| Year of birth | | 1942 |
| Position(s) with Trust | | Trustee |
| Term of office1 and length of time served2 | | Since 1983 |
| Principal occupation(s) during past five years | | Retired; formerly, President, Young Stuff Apparel Group, Inc. (apparel manufacturer), division of Li & Fung (1963 to 2012) |
| Number of funds in fund complex overseen by Trustee | | 47 |
| Other board memberships held by Trustee during past five years | | None |
| | |
| ClearBridge All Cap Growth ETF | | 29 |
Additional information (unaudited) (cont’d)
Information about Trustees and Officers
| | |
| Independent Trustees† cont’d | | |
| John J. Murphy | | |
| Year of birth | | 1944 |
| Position(s) with Trust | | Trustee |
| Term of office1 and length of time served2 | | Since 2002 |
| Principal occupation(s) during past five years | | President (since 2017) and formerly, Founder and Senior Principal (1983 to 2017), Murphy Capital Management (investment management); and Senior Vice President, Peapack-Gladstone Bank (commercial bank) (since 2017) |
| Number of funds in fund complex overseen by Trustee | | 47 |
| Other board memberships held by Trustee during past five years | | Trustee, UBS Funds (24 funds) (since 2008); Trustee, Consulting Group Capital Markets Funds (11 funds) (since 2002); Director, Fort Dearborn Income Securities, Inc. (2013 to 2016) |
| |
| Thomas F. Schlafly | | |
| Year of birth | | 1948 |
| Position(s) with Trust | | Trustee |
| Term of office1 and length of time served2 | | Since 1983 |
| Principal occupation(s) during past five years | | Chairman, The Saint Louis Brewery, LLC (brewery) (since 2012); formerly, President, The Saint Louis Brewery, Inc. (1989 to 2012); Senior Counsel (since 2017) and formerly, Partner (2009 to 2016), Thompson Coburn LLP (law firm) |
| Number of funds in fund complex overseen by Trustee | | 47 |
| Other board memberships held by Trustee during past five years | | Director, Citizens National Bank of Greater St. Louis (since 2006) |
| | |
| Interested Trustee and Officer | | |
| Jane Trust, CFA3 | | |
| Year of birth | | 1962 |
| Position(s) with Trust | | Trustee, President and Chief Executive Officer |
| Term of office1 and length of time served2 | | Since 2015 |
| Principal occupation(s) during past five years | | Senior Managing Director of Legg Mason & Co., LLC (“Legg Mason & Co.”) (since 2018); Managing Director of Legg Mason & Co. (2016 to 2018); Officer and/or Trustee/ Director of 147 funds associated with Legg Mason Partners Fund Advisor, LLC (“LMPFA”) or its affiliates (since 2015); President and Chief Executive Officer of LMPFA (since 2015); formerly, Senior Vice President of LMPFA (2015); Director of ClearBridge, LLC (formerly, Legg Mason Capital Management, LLC) (2007 to 2014); Managing Director of Legg Mason Investment Counsel & Trust Co. (2000 to 2007) |
| Number of funds in fund complex overseen by Trustee | | 138 |
| Other board memberships held by Trustee during past five years | | None |
| | |
| 30 | | ClearBridge All Cap Growth ETF |
| | |
| Additional Officers | | |
Ted P. Becker Legg Mason 620 Eighth Avenue, 49th Floor, New York, NY 10018 | | |
| Year of birth | | 1951 |
| Position(s) with Trust | | Chief Compliance Officer |
| Term of office1 and length of time served2 | | Since 2007 |
| Principal occupation(s) during past five years | | Director of Global Compliance at Legg Mason (since 2006); Chief Compliance Officer of LMPFA (since 2006); Managing Director of Compliance of Legg Mason & Co. (since 2005); Chief Compliance Officer of certain mutual funds associated with Legg Mason & Co. or its affiliates (since 2006) |
| |
Susan Kerr Legg Mason 620 Eighth Avenue, 49th Floor, New York, NY 10018 | | |
| Year of birth | | 1949 |
| Position(s) with Trust | | Chief Anti-Money Laundering Compliance Officer |
| Term of office1 and length of time served2 | | Since 2013 |
| Principal occupation(s) during past five years | | Assistant Vice President of Legg Mason & Co. and Legg Mason Investor Services, LLC (“LMIS”) (since 2010); Chief Anti-Money Laundering Compliance Officer of certain mutual funds associated with Legg Mason & Co. or its affiliates (since 2013) and Anti-Money Laundering Compliance Officer of LMIS (since 2012); Senior Compliance Officer of LMIS (since 2011); formerly, AML Consultant, DTCC (2010); AML Consultant, Rabobank Netherlands, (2009); First Vice President, Director of Marketing & Advertising Compliance and Manager of Communications Review Group at Citigroup Inc. (1996 to 2008) |
| |
Jenna Bailey Legg Mason 100 First Stamford Place, 5th Floor, Stamford, CT 06902 | | |
| Year of birth | | 1978 |
| Position(s) with Trust | | Identity Theft Prevention Officer |
| Term of office1 and length of time served2 | | Since 2015 |
| Principal occupation(s) during past five years | | Identity Theft Prevention Officer of certain mutual funds associated with Legg Mason & Co. or its affiliates (since 2015); Compliance Officer of Legg Mason & Co. (since 2013); Assistant Vice President of Legg Mason & Co. (since 2011); formerly, Associate Compliance Officer of Legg Mason & Co. (2011 to 2013) |
| | |
| ClearBridge All Cap Growth ETF | | 31 |
Additional information (unaudited) (cont’d)
Information about Trustees and Officers
| | |
| Additional Officers cont’d | | |
Robert I. Frenkel Legg Mason 100 First Stamford Place, 6th Floor, Stamford, CT 06902 | | |
| Year of birth | | 1954 |
| Position(s) with Trust | | Secretary and Chief Legal Officer |
| Term of office1 and length of time served2 | | Since 2007 |
| Principal occupation(s) during past five years | | Vice President and Deputy General Counsel of Legg Mason (since 2006); Managing Director and General Counsel— U.S. Mutual Funds for Legg Mason & Co. (since 2006) and Legg Mason & Co. predecessors (since 1994); Secretary and Chief Legal Officer of certain mutual funds associated with Legg Mason & Co. or its affiliates (since 2006) and Legg Mason & Co. predecessors (prior to 2006) |
| |
Thomas C. Mandia Legg Mason 100 First Stamford Place, 6th Floor, Stamford, CT 06902 | | |
| Year of birth | | 1962 |
| Position(s) with Trust | | Assistant Secretary |
| Term of office1 and length of time served2 | | Since 2007 |
| Principal occupation(s) during past five years | | Managing Director and Deputy General Counsel of Legg Mason & Co. (since 2005) and Legg Mason & Co. predecessors (prior to 2005); Secretary of LMPFA (since 2006); Assistant Secretary of certain mutual funds associated with Legg Mason & Co. or its affiliates (since 2006) and Legg Mason & Co. predecessors (prior to 2006); Secretary of LM Asset Services, LLC (“LMAS”) (since 2002) and Legg Mason Fund Asset Management, Inc. (“LMFAM”) (since 2013) (formerly registered investment advisers) |
| |
Richard F. Sennett Legg Mason 100 International Drive, 7th Floor, Baltimore, MD 21202 | | |
| Year of birth | | 1970 |
| Position(s) with Trust | | Principal Financial Officer |
| Term of office1 and length of time served2 | | Since 2011 |
| Principal occupation(s) during past five years | | Principal Financial Officer and Treasurer of certain mutual funds associated with Legg Mason & Co. or its affiliates (since 2011 and since 2013); Managing Director of Legg Mason & Co. and Senior Manager of the Treasury Policy group for Legg Mason & Co.’s Global Fiduciary Platform (since 2011); formerly, Chief Accountant within the SEC’s Division of Investment Management (2007 to 2011); Assistant Chief Accountant within the SEC’s Division of Investment Management (2002 to 2007) |
| | |
| 32 | | ClearBridge All Cap Growth ETF |
| | |
| Additional Officers cont’d | | |
Christopher Berarducci Legg Mason 620 Eighth Avenue, 49th Floor, New York, NY 10018 | | |
| Year of birth | | 1974 |
| Position(s) with Trust | | Treasurer |
| Term of office1 and length of time served2 | | Since 2014 |
| Principal occupation(s) during past five years | | Director of Legg Mason & Co. (since 2015); Treasurer of certain mutual funds associated with Legg Mason & Co. or its affiliates (since 2010); formerly, Vice President of Legg Mason & Co. (2011 to 2015); Assistant Controller of certain mutual funds associated with Legg Mason & Co. or its affiliates (prior to 2010) |
| |
Jeanne M. Kelly Legg Mason 620 Eighth Avenue, 49th Floor, New York, NY 10018 | | |
| Year of birth | | 1951 |
| Position(s) with Trust | | Senior Vice President |
| Term of office1 and length of time served2 | | Since 2007 |
| Principal occupation(s) during past five years | | Senior Vice President of certain mutual funds associated with Legg Mason & Co. or its affiliates (since 2007); Senior Vice President of LMPFA (since 2006); President and Chief Executive Officer of LMAS and LMFAM (since 2015); Managing Director of Legg Mason & Co. (since 2005) and Legg Mason & Co. predecessors (prior to 2005); formerly, Senior Vice President of LMFAM (2013 to 2015) |
| † | Trustees who are not “interested persons” of the Fund within the meaning of Section 2(a)(19) of the Investment Company Act of 1940, as amended (the “1940 Act”). |
| 1 | Each Trustee and officer serves until his or her respective successor has been duly elected and qualified or until his or her earlier death, resignation, retirement or removal. |
| 2 | Indicates the earliest year in which the Trustee became a board member for a fund in the Legg Mason fund complex or the officer took such office. |
| 3 | Ms. Trust is an “interested person” of the Funds, as defined in the 1940 Act, because of her position with LMPFA and/or certain of its affiliates. |
| | |
| ClearBridge All Cap Growth ETF | | 33 |
Important tax information (unaudited)
The following information is provided with respect to the distributions paid during the taxable year ended September 30, 2018:
| | | | |
| Record date: | | | 12/28/2017 | |
| Payable date: | | | 12/29/2017 | |
| Ordinary income: | | | | |
Qualified dividend income for individuals | | | 100.00 | % |
Dividends qualifying for the dividends | | | | |
received deduction for corporations | | | 100.00 | % |
Please retain this information for your records.
| | |
| 34 | | ClearBridge All Cap Growth ETF |
ClearBridge
All Cap Growth ETF
Trustees
Paul R. Ades
Andrew L. Breech
Dwight B. Crane
Althea L. Duersten
Frank G. Hubbard
Howard J. Johnson
Chairman
Jerome H. Miller
Ken Miller
John J. Murphy
Thomas F. Schlafly
Jane Trust
Investment manager
Legg Mason Partners Fund Advisor, LLC
Subadviser
ClearBridge Investments, LLC
Custodian
The Bank of New York Mellon (“BNY”)*
| * | Effective July 16, 2018, BNY became custodian and BNY Mellon became transfer agent. |
Transfer agent
BNY Mellon Investment Servicing (US) Inc. (“BNY Mellon”)*
4400 Computer Drive
Westborough, MA 01581
Independent registered public accounting firm
PricewaterhouseCoopers LLP
Baltimore, MD
ClearBridge All Cap Growth ETF
The Fund is a separate investment series of Legg Mason ETF Investment Trust, a Maryland statutory trust.
ClearBridge All Cap Growth ETF
Legg Mason Funds
620 Eighth Avenue, 49th Floor
New York, NY 10018
The Fund files its complete schedule of portfolio holdings with the Securities and Exchange Commission (“SEC”) for the first and third quarters of each fiscal year on Form N-Q. The Fund’s Forms N-Q are available on the SEC’s website at www.sec.gov. The Fund’s Forms N-Q may be reviewed and copied at the SEC’s Public Reference Room in Washington, D.C., and information on the operation of the Public Reference Room may be obtained by calling 1-800-SEC-0330. To obtain information on Form N-Q, shareholders can call the Fund at 1-877-721-1926.
Information on how the Fund voted proxies relating to portfolio securities during the prior 12-month period ended June 30th of each year and a description of the policies and procedures that the Fund uses to determine how to vote proxies related to portfolio transactions are available (1) without charge, upon request, by calling the Fund at 1-877-721-1926, (2) at www.leggmason.com/etf and (3) on the SEC’s website at www.sec.gov.
This report is submitted for the general information of the shareholders of ClearBridge All Cap Growth ETF. This report is not authorized for distribution to prospective investors in the Fund unless preceded or accompanied by a current prospectus.
Investors should consider the Fund’s investment objectives, risks, charges and expenses carefully before investing. The prospectus contains this and other important information about the Fund. Please read the prospectus carefully before investing.
www.leggmason.com
© 2018 Legg Mason Investor Services, LLC
Member FINRA, SIPC
www.leggmason.com
© 2018 Legg Mason Investor Services, LLC Member FINRA, SIPC
CBAX413411 11/18 SR18-3477
| | |
| ITEM 2. | | CODE OF ETHICS. |
| |
| | The registrant has adopted a code of ethics that applies to the registrant’s principal executive officer, principal financial officer, principal accounting officer or controller. |
| |
| ITEM 3. | | AUDIT COMMITTEE FINANCIAL EXPERT. |
| |
| | The Board of Trustees of the registrant has determined that Dwight B. Crane, possess the technical attributes identified in Instruction 2(b) of Item 3 to Form N-CSR to qualify as “audit committee financial experts,” and have designated Dwight B. Crane as the Audit Committee’s financial experts. Dwight B. Crane is an “independent” Trustees pursuant to paragraph (a) (2) of Item 3 to Form N-CSR. |
| |
| ITEM 4. | | PRINCIPAL ACCOUNTANT FEES AND SERVICES. |
| |
| | a) Audit Fees. The aggregate fees billed in the last fiscal period ending September 30, 2017 and September 30, 2018 (the “Reporting Period”) for professional services rendered by the Registrant’s principal accountant (the “Auditor”) for the audit of the Registrant’s annual financial statements, or services that are normally provided by the Auditor in connection with the statutory and regulatory filings or engagements for the Reporting Period, were $0 in September 30, 2017 and $10,000 in September 30, 2018. |
| |
| | b) Audit-Related Fees. The aggregate fees billed in the Reporting Period for assurance and related services by the Auditor that are reasonably related to the performance of the Registrant’s financial statements were $0 September 30, 2017 and $2,427 in September 30, 2018. |
| |
| | In addition, there were no Audit-Related Fees billed in the Reporting Period for assurance and related services by the Auditor to the Registrant’s investment adviser (not including any sub-adviser whose role is primarily portfolio management and is subcontracted with or overseen by another investment adviser), and any entity controlling, controlled by or under common control with the investment adviser that provides ongoing services to the Legg Mason ETF Investment Trust (“service affiliates”), that were reasonably related to the performance of the annual audit of the service affiliates. Accordingly, there were no such fees that required pre-approval by the Audit Committee for the Reporting Period. |
| |
| | (c) Tax Fees. The aggregate fees billed in the Reporting Period for professional services rendered by the Auditor for tax compliance, tax advice and tax planning (“Tax Services”) were $0 in September 30, 2017 and $0 in September 30, 2018. These services consisted of (i) review or preparation of U.S. federal, state, local and excise tax returns; (ii) U.S. federal, state and local tax planning, advice and assistance regarding statutory, regulatory or administrative developments, and (iii) tax advice regarding tax qualification matters and/or treatment of various financial instruments held or proposed to be acquired or held. |
| |
| | There were no fees billed for tax services by the Auditors to service affiliates during the Reporting Period that required pre-approval by the Audit Committee. d) All Other Fees. The aggregate fees for other fees billed in the Reporting Periods for products and services provided by the Auditor were $0 in September 30, 2017 and $0 in September 30, 2018, other than the services reported in paragraphs (a) through (c) of this item for the Legg Mason ETF Investment Trust. |
| |
| | All Other Fees. There were no other non-audit services rendered by the Auditor to Legg Mason Partners Fund Advisors, LLC (“LMPFA”), and any entity controlling, controlled by or under common control with LMPFA that provided ongoing services to Legg Mason ETF Investment Trust requiring pre-approval by the Audit Committee in the Reporting Period. |
| | |
| |
| | (e) Audit Committee’s pre–approval policies and procedures described in paragraph (c) (7) of Rule 2-01 of Regulation S-X. |
| |
| | | (1) The Charter for the Audit Committee (the “Committee”) of the Board of each registered investment company (the “Fund”) advised by LMPFA or one of their affiliates (each, an “Adviser”) requires that the Committee shall approve (a) all audit and permissible non-audit services to be provided to the Fund and (b) all permissible non-audit services to be provided by the Fund’s independent auditors to the Adviser and any Covered Service Providers if the engagement relates directly to the operations and financial reporting of the Fund. The Committee may implement policies and procedures by which such services are approved other than by the full Committee. |
| |
| | The Committee shall not approve non-audit services that the Committee believes may impair the independence of the auditors. As of the date of the approval of this Audit Committee Charter, permissible non-audit services include any professional services (including tax services), that are not prohibited services as described below, provided to the Fund by the independent auditors, other than those provided to the Fund in connection with an audit or a review of the financial statements of the Fund. Permissible non-audit services may not include: (i) bookkeeping or other services related to the accounting records or financial statements of the Fund; (ii) financial information systems design and implementation; (iii) appraisal or valuation services, fairness opinions or contribution-in-kind reports; (iv) actuarial services; (v) internal audit outsourcing services; (vi) management functions or human resources; (vii) broker or dealer, investment adviser or investment banking services; (viii) legal services and expert services unrelated to the audit; and (ix) any other service the Public Company Accounting Oversight Board determines, by regulation, is impermissible. |
| |
| | Pre-approval by the Committee of any permissible non-audit services is not required so long as: (i) the aggregate amount of all such permissible non-audit services provided to the Fund, the Adviser and any service providers controlling, controlled by or under common control with the Adviser that provide ongoing services to the Fund (“Covered Service Providers”) constitutes not more than 5% of the total amount of revenues paid to the independent auditors during the fiscal year in which the permissible non-audit services are provided to (a) the Fund, (b) the Adviser and (c) any entity controlling, controlled by or under common control with the Adviser that provides ongoing services to the Fund during the fiscal year in which the services are provided that would have to be approved by the Committee; (ii) the permissible non-audit services were not recognized by the Fund at the time of the engagement to be non-audit services; and (iii) such services are promptly brought to the attention of the Committee and approved by the Committee (or its delegate(s)) prior to the completion of the audit. |
| |
| | (2) For the Legg Mason ETF Investment Trust, the percentage of fees that were approved by the audit committee, with respect to: Audit-Related Fees were 100% and 100% for September 30, 2017 and September 30, 2018; Tax Fees were 100% and 100% for September 30, 2017 and September 30, 2018; and Other Fees were 100% and 100% for September 30, 2017 and September 30, 2018. |
| |
| | (f) N/A |
| |
| | (g) Non-audit fees billed by the Auditor for services rendered to Legg Mason ETF Investment Trust, LMPFA and any entity controlling, controlled by, or under common control with LMPFA that provides ongoing services to Legg Mason ETF Investment Trust during the reporting period were $160,000 in September 30, 2017 and $ 432,645 in September 30, 2018. |
| |
| | (h) Yes. Legg Mason ETF Investment Trust’s Audit Committee has considered whether the provision of non-audit services that were rendered to Service Affiliates, which were not pre-approved (not requiring pre-approval), is compatible with maintaining the Accountant’s independence. All services provided by the Auditor to the Legg Mason ETF Investment Trust or to Service Affiliates, which were required to be pre-approved, were pre-approved as required. |
| | |
| ITEM 5. | | AUDIT COMMITTEE OF LISTED REGISTRANTS. |
| |
| | a) The independent board members are acting as the registrant’s audit committee as specified in Section 3(a)(58)(B) of the Exchange Act .The Audit Committee consists of the following Board members: |
| |
| | Paul R. Ades |
| | Andrew L. Breech |
| | Dwight B. Crane |
| | Althea L. Duersten |
| | Frank G. Hubbard |
| | Howard J. Johnson |
| | Jerome H. Miller |
| | Ken Miller |
| | John J. Murphy |
| | Thomas F. Schlafly |
| |
| | b) Not applicable |
| |
| ITEM 6. | | SCHEDULE OF INVESTMENTS. |
| |
| | Included herein under Item 1. |
| |
| ITEM 7. | | DISCLOSURE OF PROXY VOTING POLICIES AND PROCEDURES FOR CLOSED-END MANAGEMENT INVESTMENT COMPANIES. |
| |
| | Not applicable. |
| |
| ITEM 8. | | PORTFOLIO MANAGERS OF CLOSED-END MANAGEMENT INVESTMENT COMPANIES. |
| |
| | Not applicable. |
| |
| ITEM 9. | | PURCHASES OF EQUITY SECURITIES BY CLOSED-END MANAGEMENT INVESTMENT COMPANY AND AFFILIATED PURCHASERS. |
| |
| | Not applicable. |
| |
| ITEM 10. | | SUBMISSION OF MATTERS TO A VOTE OF SECURITY HOLDERS. |
| |
| | Not applicable. |
| |
| ITEM 11. | | CONTROLS AND PROCEDURES. |
| |
| | (a) The registrant’s principal executive officer and principal financial officer have concluded that the registrant’s disclosure controls and procedures (as defined in Rule 30a- 3(c) under the Investment Company Act of 1940, as amended (the “1940 Act”)) are effective as of a date within 90 days of the filing date of this report that includes the disclosure required by this paragraph, based on their evaluation of the disclosure controls and procedures required by Rule 30a-3(b) under the 1940 Act and 15d-15(b) under the Securities Exchange Act of 1934. |
| |
| | (b) There were no changes in the registrant’s internal control over financial reporting (as defined in Rule 30a-3(d) under the 1940 Act) that occurred during the second fiscal quarter of the period covered by this report that have materially affected, or are likely to materially affect the registrant’s internal control over financial reporting. |
| | |
| |
| ITEM 12. | | EXHIBITS. |
| |
| | (a) (1) Code of Ethics attached hereto. |
| | Exhibit 99.CODE ETH |
| |
| | (a) (2) Certifications pursuant to section 302 of the Sarbanes-Oxley Act of 2002 attached hereto. |
| | Exhibit 99.CERT |
| |
| | (b) Certifications pursuant to Section 906 of the Sarbanes-Oxley Act of 2002 attached hereto. |
| | Exhibit 99.906CERT |
SIGNATURES
Pursuant to the requirements of the Securities Exchange Act of 1934 and the Investment Company Act of 1940, the registrant has duly caused this Report to be signed on its behalf by the undersigned, there unto duly authorized.
Legg Mason ETF Investment Trust
| | | | |
| By: | | /s/ Jane Trust | | |
| | Jane Trust | | |
| | Chief Executive Officer | | |
| | |
| Date: | | November 21, 2018 | | |
|
Pursuant to the requirements of the Securities Exchange Act of 1934 and the Investment Company Act of 1940, this report has been signed below by the following persons on behalf of the registrant and in the capacities and on the dates indicated. |
| | |
| By: | | /s/ Jane Trust | | |
| | Jane Trust | | |
| | Chief Executive Officer | | |
| | |
| Date: | | November 21, 2018 | | |
| | |
| By: | | /s/ Richard F. Sennett | | |
| | Richard F. Sennett | | |
| | Principal Financial Officer | | |
| | |
| Date: | | November 21, 2018 | | |