UNITED STATES
SECURITIES AND EXCHANGE COMMISSION
Washington, D.C. 20549
FORM N-CSR
CERTIFIED SHAREHOLDER REPORT OF REGISTERED
MANAGEMENT INVESTMENT COMPANIES
Investment Company Act file number 811-23096
Legg Mason ETF Investment Trust
(Exact name of registrant as specified in charter)
620 Eighth Avenue, 49th Floor, New York, NY 10018
(Address of principal executive offices) (Zip code)
Robert I. Frenkel, Esq.
Legg Mason & Co., LLC
100 First Stamford Place
Stamford, CT 06902
(Name and address of agent for service)
Registrant’s telephone number, including area code: 1-877-721-1926
Date of fiscal year end: October 31
Date of reporting period: October 31, 2018
| ITEM 1. | REPORT TO STOCKHOLDERS. |
The Annual Report to Stockholders is filed herewith.

| Annual Report | October 31, 2018 |
LEGG MASON
GLOBAL INFRASTRUCTURE ETF
INFR
| INVESTMENT PRODUCTS: NOT FDIC INSURED • NO BANK GUARANTEE • MAY LOSE VALUE |
Fund objective
The Fund seeks to track the investment results of an index composed of infrastructure-related equity securities from global markets constructed through the application of several fundamental factors.

Dear Shareholder,
We are pleased to provide the annual report of Legg Mason Global Infrastructure ETF for the twelve-month reporting period ended October 31, 2018. Please read on for a detailed look at prevailing economic and market conditions during the Fund’s reporting period and to learn how those conditions have affected Fund performance.
As always, we remain committed to providing you with excellent service and a full spectrum of investment choices. We also remain committed to supplementing the support you receive from your financial advisor. One way we accomplish this is through our website, www.leggmason.com. Here you can gain immediate access to market and investment information, including:
| • | Fund net asset value and market price, |
| • | Market insights and commentaries from our portfolio managers, and |
| • | A host of educational resources. |
We look forward to helping you meet your financial goals.
Sincerely,

Jane Trust, CFA
President and Chief Executive Officer
November 30, 2018
| II | Legg Mason Global Infrastructure ETF |
Economic review
Economic activity in the U.S. was mixed during the twelve months ended October 31, 2018 (the “reporting period”). Looking back, the U.S. Department of Commerce reported that fourth quarter 2017 and first quarter 2018 U.S. gross domestic product (“GDP”)i growth was 2.3% and 2.2%, respectively. GDP growth then accelerated to 4.2% during the second quarter of 2018 — the strongest reading since the third quarter of 2014. Finally, the U.S. Department of Commerce’s second reading for third quarter 2018 GDP growth — released after the reporting period ended — was 3.5%. The deceleration in GDP growth in the third quarter of 2018 reflected a downturn in exports and decelerations in nonresidential fixed investment and personal consumption expenditures. Imports increased in the third quarter after decreasing in the second. These movements were partly offset by an upturn in private inventory investment.
Job growth in the U.S. was solid overall and supported the economy during the reporting period. As reported by the U.S. Department of Labor, when the reporting period ended on October 31, 2018, the unemployment rate was 3.7%, versus 4.1% when the period began. October 2018’s reading equaled the lowest unemployment rate since 1969. The percentage of longer-term unemployed also declined during the reporting period. In October 2018, 22.5% of Americans looking for a job had been out of work for more than six months, versus 23.8% when the period began.
Turning to the global economy, in its October 2018 World Economic Outlook, the International Monetary Fund (“IMF”)ii said, “Global growth for 2018–19 is projected to remain steady at its 2017 level, but its pace is less vigorous than projected in April [2018] and it has become less balanced. Downside risks to global growth have risen in the past six months and the potential for upside surprises has receded.” From a regional perspective, the IMF projects 2018 growth in the Eurozone will be 2.0%, versus 2.4% in 2017. Japan’s economy is expected to expand 1.1% in 2018, compared to 1.7% in 2017. Elsewhere, the IMF projects that overall growth in emerging market countries will be 4.7% in 2018, the same as in 2017.
Looking back, at its meeting that concluded on September 20, 2017, the Federal Reserve Board (the “Fed”)iii kept the federal funds rateiv on hold, but reiterated its intention to begin reducing its balance sheet, saying, “In October, the Committee will initiate the balance sheet normalization program….” At its meeting that ended on December 13, 2017, the Fed raised rates to a range between 1.25% and 1.50%. As expected, the Fed kept rates on hold at its meeting that concluded on January 31, 2018. However, at its meeting that ended on March 21, 2018, the Fed again raised the federal funds rate, moving it to a range between 1.50% and 1.75%. At its meeting that concluded on June 13, 2018, the Fed raised the federal funds rate to a range between 1.75% and 2.00%. Finally, at its meeting that ended on September 26, 2018, the Fed raised the federal funds rate to a range between 2.00% and 2.25%.
Central banks outside the U.S. took different approaches to monetary policy during the reporting period. Looking back, in December 2016, the European Central Bank (“ECB”)v extended its bond buying program until December 2017. From April 2017 through
| Legg Mason Global Infrastructure ETF | III |
Investment commentary (cont’d)
December 2017, the ECB purchased €60 billion-per-month of bonds. In October 2017, the ECB announced that it would continue to buy bonds through September 2018, but after December 2017 it would pare its purchases to €30 billion-per-month. In June 2018, the ECB announced it would end its bond buying program by the end of the year, but it did not anticipate raising interest rates “at least through the summer of 2019”. In other developed countries, on November 2, 2017, the Bank of Englandvi raised rates from 0.25% to 0.50% — the first increase since July 2007. It then raised rates to 0.75% at its meeting on August 2, 2018. After holding rates steady at 0.10% for more than five years, in January 2016, the Bank of Japanvii announced that it cut the rate on current accounts that commercial banks hold with it to -0.10% and kept rates on hold during the reporting period. Elsewhere, the People’s Bank of Chinaviii kept rates steady at 4.35% during the reporting period.
As always, thank you for your confidence in our stewardship of your assets.
Sincerely,
Jane Trust, CFA
President and Chief Executive Officer
November 30, 2018
All investments are subject to risk including the possible loss of principal. Past performance is no guarantee of future results. Forecasts and predictions are inherently limited and should not be relied upon as an indication of actual or future performance.
| i | Gross domestic product (“GDP”) is the market value of all final goods and services produced within a country in a given period of time. |
| ii | The International Monetary Fund (“IMF”) is an organization of 189 countries, working to foster global monetary cooperation, secure financial stability, facilitate international trade, promote high employment and sustainable economic growth, and reduce poverty around the world. |
| iii | The Federal Reserve Board (the “Fed”) is responsible for the formulation of U.S. policies designed to promote economic growth, full employment, stable prices, and a sustainable pattern of international trade and payments. |
| iv | The federal funds rate is the rate charged by one depository institution on an overnight sale of immediately available funds (balances at the Federal Reserve) to another depository institution; the rate may vary from depository institution to depository institution and from day to day. |
| v | The European Central Bank (“ECB”) is responsible for the monetary system of the European Union and the euro currency. |
| vi | The Bank of England (“BoE”), formally the Governor and Company of the BoE, is the central bank of the United Kingdom. The BoE’s purpose is to maintain monetary and financial stability. |
| vii | The Bank of Japan is the central bank of Japan. The bank is responsible for issuing and handling currency and treasury securities, implementing monetary policy, maintaining the stability of the Japanese financial system and the yen currency. |
| viii | The People’s Bank of China is the central bank of the People’s Republic of China with the power to carry out monetary policy and regulate financial institutions in mainland China. |
| IV | Legg Mason Global Infrastructure ETF |
Q. What is the Fund’s investment strategy?
A. The Legg Mason Global Infrastructure ETF (the “Fund”) seeks to track the investment results of the RARE Global Infrastructure Index (the “Underlying Index”). The Underlying Index is constructed from global infrastructure-related equity securities. The Underlying Index utilizes a proprietary methodology created and sponsored by RARE Infrastructure (North America) Pty Limited (“RARE”), the Fund’s subadviser. The Fund will invest at least 80% of its net assets, plus borrowings for investment purposes, if any, in securities that compose its Underlying Index. Securities that compose the Underlying Index include depositary receipts representing securities in the Underlying Index. The Underlying Index is composed of equity securities in developing markets that are included in the MSCI ACWI All Cap Index.i
The Underlying Index’s securities are reconstituted quarterly and rebalanced quarterly. The Underlying Index is reconstituted on different dates from the MSCI ACWI All Cap Index. The Fund’s securities portfolio is rebalanced when the Underlying Index is rebalanced or reconstituted. The composition of the Underlying Index and the Fund after reconstitution and rebalancing may fluctuate and exceed the above Underlying Index limitations due to market movements and other factors. The components of the Underlying Index, and the degree to which these components represent certain sectors and industries, may change over time.
The Fund may invest up to 20% of its net assets in certain index futures, options, and options on index futures (“Financial Instruments”) related to its Underlying Index and its component securities; cash and cash equivalents; other investment companies, including exchange-traded funds; exchange-traded notes; and in securities and other instruments not included in its Underlying Index but which RARE believes will help the Fund track its Underlying Index, including structured instruments such as participation notes and low exercise price warrants or other similar instruments. The Fund may invest in Financial Instruments to gain exposure to local markets, as a substitute for buying or selling securities or for cash management purposes.
Q. What were the overall market conditions during the Fund’s reporting period?
A. The twelve-month reporting period ended October 31, 2018, was a volatile period for global equity markets dominated by geopolitical events.
Global equities started 2018 on a positive note with optimism around global growth on the back of U.S. tax reform and better than expected macroeconomic data. However, in February 2018, the market reacted negatively to climbing bond yields. As it relates to listed infrastructure, the rise in bond yields weighed heavily on developed market defensive stocks, namely regulated utilities (gas, water and electric transmission and distribution companies).
In the second quarter of 2018, alongside the broader equity market, global listed infrastructure rebounded with North American Gas and Western European Water sectors leading returns.
In the third quarter of 2018, the U.S. and China trade tensions continued to dominate the headlines as both countries imposed additional tariffs on imports.
In October 2018, equity market volatility stepped up during the month with all developed markets recording large losses despite some recovery at the end of the month. The VIX Index (“VIX”)ii spiked several times in October 2018, testing its second-highest level for the reporting period and finishing
| Legg Mason Global Infrastructure ETF 2018 Annual Report | 1 |
Fund overview (cont’d)
just above twenty-one after starting the month at twelve.
The Fund uses a passive investment approach to achieve its investment objective and therefore made no change in investment approach in response to market conditions.
Performance review
For the twelve months ended October 31, 2018, Legg Mason Global Infrastructure ETF generated a -5.76% return on a net asset value (“NAV”)iii basis and -7.32% based on its market priceiv per share.
The performance table shows the Fund’s total return for the twelve months ended October 31, 2018 based on its NAV and market price as of October 31, 2018. The Fund seeks to track the investment results of the RARE Global Infrastructure Index, which returned -5.33%, for the same period. The Fund’s broad-based market index, the S&P Global Infrastructure Index (NTR)v returned -8.46% over the same time frame. The Lipper Global Infrastructure Funds Category Average1 returned -5.17% for the same period. Please note that Lipper performance returns are based on each fund’s NAV.
| Performance Snapshot as of October 31, 2018 (unaudited) | ||||||||
| 6 months | 12 months | |||||||
| Legg Mason Global Infrastructure ETF: | ||||||||
$26.49 (NAV) | -3.80 | % | -5.76 | %*† | ||||
$26.32 (Market Price) | -3.37 | % | -7.32 | %*‡ | ||||
| RARE Global Infrastructure Index | -3.62 | % | -5.33 | % | ||||
| S&P Global Infrastructure Index (NTR) | -5.86 | % | -8.46 | % | ||||
| Lipper Global Infrastructure Funds Category Average1 | -3.50 | % | -5.17 | % | ||||
The performance shown represents past performance. Past performance is no guarantee of future results and current performance may be higher or lower than the performance shown. Principal value and investment returns will fluctuate so shares, when sold, may be worth more or less than their original cost. Performance data current to the most recent month-end is available at www.leggmason.com/etf.
Investors buy and sell shares of an exchange-traded fund (“ETF”) at market price (not NAV) in the secondary market throughout the trading day. These shares are not individually available for direct purchase from or direct redemption to the ETF. Market price returns shown are typically based upon the mid-point between the bid and ask on the Fund’s principal trading market when the Fund’s NAV is determined, which is typically 4:00 p.m. Eastern time (US). These returns do not represent investors’ returns had they traded shares at other times. Performance figures for periods shorter than one year represent cumulative figures and are not annualized.
Information showing the number of days the market price of the Fund’s shares was greater than the Fund’s NAV and the number of days it was less than the Fund’s NAV (i.e., premium or discount) for various time periods is available by visiting the Fund’s website at www.leggmason.com/etf.
As of the Fund’s current prospectus dated March 1, 2018, supplemented on May 4, 2018, the gross total annual fund operating expense ratio for the Fund was 0.45%.
The management agreement between Legg Mason ETF Investment Trust (the “Trust”) and Legg Mason Partners Fund Advisor, LLC (the “manager” or “LMPFA”) (the “Management Agreement”) provides that LMPFA will pay all operating expenses of the Fund, other than interest expenses, taxes, brokerage
| 1 | Lipper, Inc., a wholly-owned subsidiary of Reuters, provides independent insight on global collective investments. Returns are based on the period ended October 31, 2018, including the reinvestment of all distributions, including returns of capital, if any, calculated among the 105 funds for the six-month period and among the 96 funds for the twelve-month period in the Fund’s Lipper category. |
| 2 | Legg Mason Global Infrastructure ETF 2018 Annual Report |
expenses, future Rule 12b-1 fees (if any), acquired fund fees and expenses, extraordinary expenses and the management fee payable to LMPFA under the Management Agreement. The Fund’s Board of Trustees approved a permanent reduction of the management fees payable under the Management Agreement from 0.53% of the Fund’s average daily net assets to 0.45% of the Fund’s average daily net assets effective on May 4, 2018.
The manager also agreed to contractually waive and/or reimburse management fees, other than interest expenses, taxes, brokerage expenses, future Rule 12b-1 fees (if any), acquired fund fees and expenses, extraordinary expenses and the management fee payable to LMPFA under the Management Agreement, so that the ratio of total annual fund operating expenses will not exceed 0.40% of the Fund’s average daily net assets. The contractual fee waiver is effective on May 4, 2018, will expire on February 29, 2020, and cannot be terminated prior to February 29, 2020 without the Board of Trustees’ consent.
* Total returns are based on changes in NAV or market price, respectively. Returns reflect the deduction of all Fund expenses. Returns do not reflect the deduction of brokerage commissions or taxes that investors pay on distributions or the sale of shares.
† Total return assumes the reinvestment of all distributions at NAV.
‡ Total return assumes the reinvestment of all distributions at market price.
Q. What were the leading contributors to performance?
A. During the reporting period, the Underlying Index’s exposure to the U.S. contributed significantly to absolute return, in particular, U.S. rail stocks Norfolk Southern Railway and Union Pacific Railroad. Operational improvements and rising rates and surcharges further helped boost company profits and returns.
Q. What were the leading detractors from performance?
A. The Underlying Index’s exposure to Atlantia SpA (“ATL”), was the largest detractor from performance during the reporting period. ATL is an Italian diversified infrastructure company, operating both toll road and airport concessions. The collapse of the Polcevera road bridge in Genoa on August 14, 2018, focused the market’s attention on ASPI, ATL’s core Italian toll road asset.
Looking for additional information?
The Fund’s daily NAV is available on-line at www.leggmason.com/etf. The Fund is traded under the symbol “INFR” and its closing market price is available on most financial websites. In a continuing effort to provide information concerning the Fund, shareholders may call 1-877-721-1926 (toll free), Monday through Friday from 8:00 a.m. to 5:30 p.m. Eastern time, for the Fund’s current NAV, market price and other information.
Thank you for your investment in Legg Mason Global Infrastructure ETF. As always, we appreciate that you have chosen us to manage your assets and we remain focused on achieving the Fund’s investment goals.
Sincerely,

Charles Hamieh
Portfolio Manager
RARE Infrastructure
(North America) Pty Limited
November 20, 2018
| Legg Mason Global Infrastructure ETF 2018 Annual Report | 3 |
Fund overview (cont’d)
RISKS: Equity securities are subject to market and price fluctuations. Companies in the infrastructure industry may be subject to a variety of factors that could adversely affect their business or operations, including high interest costs in connection with capital construction programs, high degrees of leverage, costs associated with governmental, environmental and other regulations, the effects of economic slowdowns, increased competition from other providers of services, uncertainties concerning costs, the level of government spending on infrastructure projects, and other factors. International investments are subject to special risks including currency fluctuations, social, economic and political uncertainties, which could increase volatility. These risks are magnified in emerging markets. In rising markets, the value of large-cap stocks may not rise as much as smaller-cap stocks. Small- and mid-cap stocks involve greater risks and volatility than large-cap stocks. The Fund may focus its investments in certain industries, increasing its vulnerability to market volatility. There is no guarantee that the Fund will achieve a high degree of correlation to the index it seeks to track. The Fund does not seek to outperform the index it tracks, and does not seek temporary defensive positions when markets decline or appear overvalued. Derivatives, such as options and futures, can be illiquid, may disproportionately increase losses and have a potentially large impact on Fund performance. Please see the Fund’s prospectus for a more complete discussion of these and other risks and the Fund’s investment strategies.
The mention of sector breakdowns is for informational purposes only and should not be construed as a recommendation to purchase or sell any securities. The information provided regarding such sectors is not a sufficient basis upon which to make an investment decision. Investors seeking financial advice regarding the appropriateness of investing in any securities or investment strategies discussed should consult their financial professional. The Fund’s top five sector holdings (as a percentage of net assets) as of October 31, 2018 were: Utilities (45.4%), Industrials (26.2%), Energy (21.5%), Real Estate (5.2%) and Communication Services (0.8%). The Fund’s composition may differ over time.
All investments are subject to risk including the possible loss of principal. Past performance is no guarantee of future results. An index is a statistical composite that tracks a specified financial market, sector or rules-based investment process. Unlike a fund, an index does not actually hold a portfolio of securities and therefore does not incur the expenses incurred by a fund. These expenses negatively impact fund performance. All index performance reflects no deduction for fees, expenses or taxes. Please note that an investor cannot invest directly in an index.
The information provided is not intended to be a forecast of future events, a guarantee of future results or investment advice. Views expressed may differ from those of the firm as a whole.
| 4 | Legg Mason Global Infrastructure ETF 2018 Annual Report |
| i | The MSCI ACWI All Cap Index captures large, mid, small and microcap representation across 23 Developed Markets countries and large, mid and small cap representation across 24 Emerging Markets countries. With 14,284 constituents, the index is comprehensive, covering approximately 99% of the global equity investment opportunity set. |
| ii | The Chicago Board Options Exchange (“CBOE”) Volatility Index (“VIX”) is a measure of market expectations of near-term volatility as conveyed by S&P 500 stock index option prices. |
| iii | Net Asset Value (NAV) is calculated by subtracting total liabilities from total assets and dividing the results by the number of shares outstanding. |
| iv | Market Price is determined by supply and demand. It is the price at which an investor purchases or sells shares of the Fund. The Market Price may differ from the Fund’s NAV. |
| v | The S&P Global Infrastructure Index (NTR) is designed to track 75 companies from around the world chosen to represent the listed infrastructure industry while maintaining liquidity and tradability. |
| Legg Mason Global Infrastructure ETF 2018 Annual Report | 5 |
Investment breakdown (%) as a percent of total investments
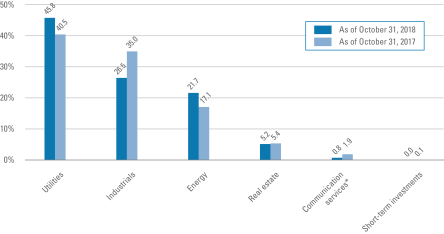
| † | The bar graph above represents the composition of the Fund’s investments as of October 31, 2018, and October 31, 2017. The composition of the Fund’s investments is subject to change at any time. |
| * | As of September 28, 2018, the Telecommunication Services sector was broadened to include some companies previously classified in the Consumer Discretionary and Information Technology sectors and renamed the Communication Services sector. |
| 6 | Legg Mason Global Infrastructure ETF 2018 Annual Report |
Example
As a shareholder of the Fund, you may incur two types of costs: (1) transaction costs, such as brokerage commissions paid on purchases and sales of Fund shares; and (2) ongoing costs, including management fees; and other Fund expenses. This example is intended to help you understand your ongoing costs (in dollars) of investing in the Fund and to compare these costs with the ongoing costs of investing in other funds.
This example is based on an investment of $1,000 invested on May 1, 2018 and held for the six months ended October 31, 2018.
Actual expenses
The table below titled “Based on Actual Total Return” provides information about actual account values and actual expenses. You may use the information provided in this table, together with the amount you invested, to estimate the expenses that you paid over the period. To estimate the expenses you paid on your account, divide your ending account value by $1,000 (for example, an $8,600 ending account value divided by $1,000 = 8.6), then multiply the result by the number under the heading entitled “Expenses Paid During the Period”.
Hypothetical example for comparison purposes
The table below titled “Based on Hypothetical Total Return” provides information about hypothetical account values and hypothetical expenses based on the actual expense ratio and an assumed rate of return of 5.00% per year before expenses, which is not the Fund’s actual return. The hypothetical account values and expenses may not be used to estimate the actual ending account balance or expenses you paid for the period. You may use the information provided in this table to compare the ongoing costs of investing in the Fund and other funds. To do so, compare the 5.00% hypothetical example relating to the Fund with the 5.00% hypothetical examples that appear in the shareholder reports of the other funds.
Please note that the expenses shown in the table below are meant to highlight your ongoing costs only and do not reflect any transactional costs, such as brokerage commissions paid on purchases and sales of Fund shares. Therefore, the table is useful in comparing ongoing costs only, and will not help you determine the relative total costs of owning different funds. In addition, if these transaction costs were included, your costs would have been higher.
| Based on actual total return1 | Based on hypothetical total return1 | |||||||||||||||||||||||||||||||||||||||||||||||||
| Actual Total Return2 | Beginning Account Value | Ending Account Value | Annualized Expense Ratio | Expenses Paid During the Period3 | Hypothetical Annualized Total Return | Beginning Account Value | Ending Account Value | Annualized Expense Ratio | Expenses Paid During the Period3 | |||||||||||||||||||||||||||||||||||||||||
| -3.80% | $ | 1,000.00 | $ | 962.00 | 0.40 | % | $ | 1.98 | 5.00 | % | $1,000.00 | $ | 1,023.19 | 0.40 | % | $ | 2.04 | |||||||||||||||||||||||||||||||||
| 1 | For the six months ended October 31, 2018. |
| 2 | Assumes the reinvestment of all distributions, including returns of capital, if any, at net asset value. Total return is not annualized, as it may not be representative of the total return for the year. Performance figures may reflect fee waivers and/or expense reimbursements. In the absence of fee waivers and/or expense reimbursements, the total return would have been lower. Past performance is no guarantee of future results. |
| 3 | Expenses (net of fee waivers and/or reimbursements) are equal to the Fund’s annualized expense ratio multiplied by the average account value over the period, multiplied by the number of days in the most recent fiscal half-year (184), then divided by 365. |
| Legg Mason Global Infrastructure ETF 2018 Annual Report | 7 |
| Net Asset Value | ||||
| Average annual total returns1 | ||||
| Twelve Months Ended 10/31/18 | -5.76 | % | ||
| Inception* through 10/31/18 | 5.97 | |||
| Cumulative total returns1 | ||||
| Inception date of 12/29/16 through 10/31/18 | 11.25 | % | ||
| Market Price | ||||
| Average annual total returns2 | ||||
| Twelve Months Ended 10/31/18 | -7.32 | % | ||
| Inception* through 10/31/18 | 5.59 | |||
| Cumulative total returns2 | ||||
| Inception date of 12/29/16 through 10/31/18 | 10.51 | % | ||
All figures represent past performance and are not a guarantee of future results. Investment returns and principal value of an investment will fluctuate so that an investor’s shares, when redeemed, may be worth more or less than their original cost. The returns shown do not reflect the deduction of brokerage commissions or taxes that investors would pay on distributions or the sale of shares. Performance figures may reflect fee waivers and/or expense reimbursements. In the absence of fee waivers and/or expense reimbursements, the total return would have been lower.
Investors buy and sell shares of the Fund at market price, not NAV, in the secondary market throughout the trading day. These shares are not individually available for direct purchase from or direct redemption to the Fund. The Fund’s per share NAV is the value of one share of the Fund and is calculated by dividing the value of total assets less total liabilities by the number of shares outstanding. The NAV return is based on the NAV of the Fund and the market price return is typically based upon the mid-point between the bid and ask on the Fund’s principal trading market when the Fund’s NAV is determined, which is typically 4:00 p.m. Eastern time (US). These returns do not represent investors’ returns had they traded shares at other times. NAV and market price returns assume that dividends and capital gain distributions have been reinvested in the Fund at NAV and market price, respectively. As with other exchange-traded funds, NAV returns and market price returns may differ because of factors such as the supply and demand for Fund shares and investors’ assessment of the underlying value of the Fund’s portfolio securities.
| 1 | Assumes the reinvestments of all distributions, including returns of capital, if any, at net asset value. |
| 2 | Assumes the reinvestment of all distributions, including returns of capital, if any, at market price. |
| * | Inception date of the Fund is December 29, 2016. |
| 8 | Legg Mason Global Infrastructure ETF 2018 Annual Report |
Historical performance
Value of $10,000 invested in
Legg Mason Global Infrastructure ETF vs. RARE Global Infrastructure Index and S&P Global Infrastructure Index (NTR)† — December 29, 2016 - October 2018
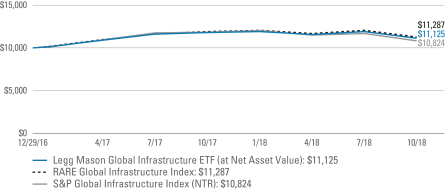
All figures represent past performance and are not a guarantee of future results. Investment returns and principal value of an investment will fluctuate so that an investor’s shares, when redeemed, may be worth more or less than their original cost. NAV returns assume that dividends and capital gain distributions have been reinvested in the Fund at NAV. The returns shown do not reflect the deduction of brokerage commissions or taxes that investors would pay on distributions or the sale of shares. Performance figures may reflect fee waivers and/or expense reimbursements. In the absence of fee waivers and/or expense reimbursements, the total return would have been lower.
| † | Hypothetical illustration of $10,000 invested in Legg Mason Global Infrastructure ETF on December 29, 2016, assuming the reinvestment of all distributions, including returns of capital, if any, at net asset value through October 31, 2018. The hypothetical illustration also assumes a $10,000 investment in the RARE Global Infrastructure Index and the S&P Global Infrastructure Index. The Fund’s per share NAV is the value of one share of the Fund and is calculated by dividing the value of total assets less total liabilities by the number of shares outstanding. The NAV return is based on the NAV of the Fund. The RARE Global Infrastructure Index (the “Underlying Index”), is constructed from global infrastructure-related equity securities. The Underlying Index utilizes a proprietary methodology created and sponsored by RARE Infrastructure (North America) Pty Limited, the Fund’s subadviser. The S&P Global Infrastructure Index (NTR) is designed to track 75 companies from around the world chosen to represent the listed infrastructure industry while maintaining liquidity and tradability. The indices are not subject to the same management and trading expenses as a fund. An index is a statistical composite that tracks a specified financial market, sector, or rules-based investment process. Unlike a fund, an index does not actually hold a portfolio of securities and therefore does not incur the expenses incurred by a fund. These expenses negatively impact fund performance. All index performance reflects no deduction for fees, expenses or taxes. Please note that an investor cannot invest directly in an index. |
| Legg Mason Global Infrastructure ETF 2018 Annual Report | 9 |
October 31, 2018
Legg Mason Global Infrastructure ETF
| Security | Shares | Value | ||||||||||||||
| Common Stocks — 98.7% | ||||||||||||||||
| Communication Services — 0.8% | ||||||||||||||||
Media — 0.8% | ||||||||||||||||
Eutelsat Communications SA | 3,374 | $ | 68,468 | |||||||||||||
SES SA FDR | 7,637 | 164,193 | ||||||||||||||
Total Communication Services | 232,661 | |||||||||||||||
| Energy — 21.1% | ||||||||||||||||
Oil, Gas & Consumable Fuels — 21.1% | ||||||||||||||||
Enagas SA | 16,862 | 447,833 | ||||||||||||||
Enbridge Inc. | 47,608 | 1,487,059 | ||||||||||||||
Enbridge Income Fund Holdings Inc. | 5,749 | 133,388 | ||||||||||||||
Gibson Energy Inc. | 3,093 | 49,083 | ||||||||||||||
Inter Pipeline Ltd. | 14,278 | 232,123 | ||||||||||||||
Kinder Morgan Inc. | 29,166 | 496,405 | ||||||||||||||
Koninklijke Vopak NV | 2,662 | 120,647 | ||||||||||||||
Kunlun Energy Co., Ltd. | 112,485 | 127,703 | ||||||||||||||
Pembina Pipeline Corp. | 23,172 | 751,315 | ||||||||||||||
Snam SpA | 114,170 | 472,682 | ||||||||||||||
TransCanada Corp. | 37,970 | 1,435,241 | ||||||||||||||
Williams Cos Inc. | 16,719 | 406,773 | ||||||||||||||
Total Energy | 6,160,252 | |||||||||||||||
| Industrials — 26.2% | ||||||||||||||||
Road & Rail — 10.0% | ||||||||||||||||
Aurizon Holdings Ltd. | 78,099 | 232,481 | ||||||||||||||
Central Japan Railway Co. | 4,996 | 958,428 | ||||||||||||||
East Japan Railway Co. | 11,751 | 1,028,232 | ||||||||||||||
Kansas City Southern | 3,133 | 319,441 | ||||||||||||||
Rumo SA | 21,336 | 95,350 | * | |||||||||||||
West Japan Railway Co. | 4,259 | 285,946 | ||||||||||||||
Total Road & Rail | 2,919,878 | |||||||||||||||
Transportation Infrastructure — 16.2% | ||||||||||||||||
Aena SME SA | 4,464 | 713,927 | ||||||||||||||
Atlantia SpA | 18,765 | 377,607 | ||||||||||||||
Atlas Arteria Ltd. | 27,193 | 131,635 | ||||||||||||||
CCR SA | 22,588 | 66,101 | ||||||||||||||
China Merchants Port Holdings Co., Ltd. | 47,329 | 80,538 | ||||||||||||||
COSCO SHIPPING Ports Ltd. | 45,911 | 46,852 | ||||||||||||||
DP World Ltd. | 6,570 | 118,194 | ||||||||||||||
Enav SpA | 15,374 | 69,365 | (a) | |||||||||||||
See Notes to Financial Statements.
| 10 | Legg Mason Global Infrastructure ETF 2018 Annual Report |
Legg Mason Global Infrastructure ETF
| Security | Shares | Value | ||||||||||||||
Transportation Infrastructure — continued | ||||||||||||||||
Flughafen Zurich AG | 1,532 | $ | 303,384 | |||||||||||||
Fraport AG Frankfurt Airport Services Worldwide | 2,254 | 174,431 | ||||||||||||||
Grupo Aeroportuario del Centro Norte SAB de CV | 13,637 | 71,643 | ||||||||||||||
Grupo Aeroportuario del Pacifico SAB de CV, Class B Shares | 19,226 | 160,389 | ||||||||||||||
Jiangsu Expressway Co., Ltd., Class H Shares | 49,481 | 66,401 | ||||||||||||||
Malaysia Airports Holdings Bhd | 29,343 | 58,202 | ||||||||||||||
Promotora y Operadora de Infraestructura SAB de CV | 11,761 | 107,121 | ||||||||||||||
Societa Iniziative Autostradali e Servizi SpA | 3,135 | 44,259 | ||||||||||||||
Sydney Airport | 135,227 | 617,223 | ||||||||||||||
Transurban Group | 189,095 | 1,519,799 | ||||||||||||||
Total Transportation Infrastructure | 4,727,071 | |||||||||||||||
Total Industrials | 7,646,949 | |||||||||||||||
| Real Estate — 5.2% | ||||||||||||||||
Equity Real Estate Investment Trusts (REITs) — 5.2% | ||||||||||||||||
Crown Castle International Corp. | 13,789 | 1,499,416 | ||||||||||||||
| Utilities — 45.4% | ||||||||||||||||
Electric Utilities — 30.0% | ||||||||||||||||
ALLETE Inc. | 774 | 57,276 | ||||||||||||||
American Electric Power Co., Inc. | 6,728 | 493,566 | ||||||||||||||
CEZ AS | 1,834 | 43,651 | ||||||||||||||
Chubu Electric Power Co. Inc. | 4,775 | 68,903 | ||||||||||||||
CK Infrastructure Holdings Ltd. | 12,087 | 88,347 | ||||||||||||||
CLP Holdings Ltd. | 36,366 | 407,757 | ||||||||||||||
Contact Energy Ltd. | 12,810 | 46,760 | ||||||||||||||
Duke Energy Corp. | 10,795 | 891,991 | ||||||||||||||
Edison International | 3,704 | 257,021 | ||||||||||||||
EDP — Energias de Portugal SA | 34,115 | 119,982 | ||||||||||||||
Emera Inc. | 3,161 | 97,773 | ||||||||||||||
Endesa SA | 5,669 | 118,702 | ||||||||||||||
Enel Americas SA | 413,346 | 65,108 | ||||||||||||||
Enel SpA | 115,968 | 569,477 | ||||||||||||||
Entergy Corp. | 2,736 | 229,687 | ||||||||||||||
Evergy Inc. | 4,112 | 230,231 | ||||||||||||||
Exelon Corp. | 13,153 | 576,233 | ||||||||||||||
FirstEnergy Corp. | 5,514 | 205,562 | ||||||||||||||
Fortis Inc. | 6,399 | 211,960 | ||||||||||||||
Hydro One Ltd. | 4,277 | 62,368 | ||||||||||||||
Iberdrola SA | 124,861 | 885,059 | ||||||||||||||
See Notes to Financial Statements.
| Legg Mason Global Infrastructure ETF 2018 Annual Report | 11 |
Schedule of investments (cont’d)
October 31, 2018
Legg Mason Global Infrastructure ETF
| Security | Shares | Value | ||||||||||||||
Electric Utilities — continued | ||||||||||||||||
IDACORP Inc. | 759 | $ | 70,784 | |||||||||||||
Korea Electric Power Corp. | 4,686 | 111,439 | ||||||||||||||
OGE Energy Corp. | 3,022 | 109,245 | ||||||||||||||
PG&E Corp. | 5,869 | 274,728 | * | |||||||||||||
Pinnacle West Capital Corp. | 1,691 | 139,085 | ||||||||||||||
Portland General Electric Co. | 1,345 | 60,633 | ||||||||||||||
Power Assets Holdings Ltd. | 25,967 | 173,403 | ||||||||||||||
PPL Corp. | 10,608 | 322,483 | ||||||||||||||
Red Electrica Corp. SA | 8,567 | 177,635 | ||||||||||||||
Southern Co. | 15,367 | 691,976 | ||||||||||||||
SSE PLC | 15,121 | 220,547 | ||||||||||||||
Tenaga Nasional Berhad | 64,695 | 227,271 | ||||||||||||||
Terna Rete Elettrica Nazionale SpA | 21,047 | 108,863 | ||||||||||||||
Xcel Energy Inc. | 6,932 | 339,737 | ||||||||||||||
Total Electric Utilities | 8,755,243 | |||||||||||||||
Gas Utilities — 1.8% | ||||||||||||||||
AltaGas Ltd. | 2,991 | 37,694 | ||||||||||||||
APA Group | 17,533 | 119,294 | ||||||||||||||
Naturgy Energy Group SA | 11,936 | 293,743 | ||||||||||||||
Tokyo Gas Co., Ltd. | 2,913 | 71,783 | ||||||||||||||
Total Gas Utilities | 522,514 | |||||||||||||||
Independent Power and Renewable Electricity Producers — 0.8% | ||||||||||||||||
AES Corp. | 5,001 | 72,914 | ||||||||||||||
Algonquin Power & Utilities Corp. | 7,156 | 71,601 | ||||||||||||||
Vistra Energy Corp. | 3,465 | 78,413 | * | |||||||||||||
Total Independent Power and Renewable Electricity Producers | 222,928 | |||||||||||||||
Multi-Utilities — 11.9% | ||||||||||||||||
Ameren Corp. | 3,685 | 237,977 | ||||||||||||||
CenterPoint Energy Inc. | 6,822 | 184,262 | ||||||||||||||
Centrica PLC | 38,860 | 73,090 | ||||||||||||||
CMS Energy Corp. | 4,269 | 211,401 | ||||||||||||||
Consolidated Edison Inc. | 4,709 | 357,884 | ||||||||||||||
Dominion Energy Inc. | 9,880 | 705,629 | ||||||||||||||
E.ON SE | 7,548 | 73,173 | ||||||||||||||
Engie SA | 25,809 | 344,335 | ||||||||||||||
Innogy SE | 1,540 | 68,051 | ||||||||||||||
National Grid PLC | 66,664 | 706,312 | ||||||||||||||
Public Service Enterprise Group Inc. | 6,120 | 326,992 | ||||||||||||||
See Notes to Financial Statements.
| 12 | Legg Mason Global Infrastructure ETF 2018 Annual Report |
Legg Mason Global Infrastructure ETF
| Security | Shares | Value | ||||||||||||||
Multi-Utilities — continued | ||||||||||||||||
RWE AG | 2,508 | $ | 48,934 | |||||||||||||
Veolia Environnement SA | 5,777 | 115,334 | ||||||||||||||
Total Multi-Utilities | 3,453,374 | |||||||||||||||
Water Utilities — 0.9% | ||||||||||||||||
Pennon Group PLC | 6,247 | 59,563 | ||||||||||||||
Severn Trent PLC | 4,693 | 111,714 | ||||||||||||||
United Utilities Group PLC | 9,995 | 92,795 | ||||||||||||||
Total Water Utilities | 264,072 | |||||||||||||||
Total Utilities | 13,218,131 | |||||||||||||||
Total Common Stocks (Cost — $31,165,081) | 28,757,409 | |||||||||||||||
| Preferred Stocks — 0.2% | ||||||||||||||||
| Energy — 0.2% | ||||||||||||||||
Oil, Gas & Consumable Fuels — 0.2% | ||||||||||||||||
Transneft PJSC (Cost — $82,054) | 28 | 72,790 | ||||||||||||||
| Shares/Units | ||||||||||||||||
| Master Limited Partnerships — 0.2% | ||||||||||||||||
| Energy — 0.2% | ||||||||||||||||
Oil & Gas Storage & Transportation — 0.2% | ||||||||||||||||
Tallgrass Energy GP LP (Cost — $49,246) | 2,059 | 44,804 | ||||||||||||||
Total Investments — 99.1% (Cost — $31,296,381) | 28,875,003 | |||||||||||||||
Other Assets in Excess of Liabilities — 0.9% | 262,164 | |||||||||||||||
Total Net Assets — 100.0% | $ | 29,137,167 | ||||||||||||||
| * | Non-income producing security. |
| (a) | Security is exempt from registration under Rule 144A of the Securities Act of 1933. This security may be resold in transactions that are exempt from registration, normally to qualified institutional buyers. This security has been deemed liquid pursuant to guidelines approved by the Board of Trustees. |
Abbreviations used in this schedule: | ||
| FDR | — Fiduciary Depositary Receipts | |
| PJSC | — Private Joint Stock Company | |
See Notes to Financial Statements.
| Legg Mason Global Infrastructure ETF 2018 Annual Report | 13 |
Schedule of investments (cont’d)
October 31, 2018
Legg Mason Global Infrastructure ETF
| Summary of Investments by Country** (unaudited) | ||||
| United States | 34.3 | % | ||
| Canada | 15.8 | |||
| Spain | 9.1 | |||
| Australia | 9.1 | |||
| Japan | 8.4 | |||
| Italy | 5.7 | |||
| United Kingdom | 4.4 | |||
| Hong Kong | 2.3 | |||
| France | 1.8 | |||
| Germany | 1.3 | |||
| Mexico | 1.2 | |||
| China | 1.1 | |||
| Switzerland | 1.0 | |||
| Malaysia | 1.0 | |||
| Luxembourg | 0.6 | |||
| Brazil | 0.6 | |||
| Netherlands | 0.4 | |||
| Portugal | 0.4 | |||
| United Arab Emirates | 0.4 | |||
| South Korea | 0.4 | |||
| Russia | 0.2 | |||
| Chile | 0.2 | |||
| New Zealand | 0.2 | |||
| Czech Republic | 0.1 | |||
| 100.0 | % | |||
| ** | As a percentage of total investments. Please note that the Fund holdings are as of October 31, 2018 and are subject to change. |
See Notes to Financial Statements.
| 14 | Legg Mason Global Infrastructure ETF 2018 Annual Report |
Statement of assets and liabilities
October 31, 2018
| Assets: | ||||
Investments, at value (Cost — $31,296,381) | $ | 28,875,003 | ||
Cash | 179,661 | |||
Foreign currency, at value (Cost — $48,609) | 48,848 | |||
Dividends and interest receivable | 43,726 | |||
Total Assets | 29,147,238 | |||
| Liabilities: | ||||
Investment management fee payable | 10,071 | |||
Total Liabilities | 10,071 | |||
| Total Net Assets | $ | 29,137,167 | ||
| Net Assets: | ||||
Par value (Note 5) | $ | 11 | ||
Paid-in capital in excess of par value | 31,866,805 | |||
Undistributed net investment income | 27,456 | |||
Accumulated net realized loss on investments and foreign currency transactions | (335,562) | |||
Net unrealized depreciation on investments and foreign currencies | (2,421,543) | |||
| Total Net Assets | $ | 29,137,167 | ||
| Shares Outstanding | 1,100,000 | |||
| Net Asset Value | $26.49 | |||
See Notes to Financial Statements.
| Legg Mason Global Infrastructure ETF 2018 Annual Report | 15 |
For the Year Ended October 31, 2018
| Investment Income: | ||||
Dividends | $ | 1,482,912 | ||
Interest | 2,129 | |||
Less: Foreign taxes withheld | (109,215) | |||
Total Investment Income | 1,375,826 | |||
| Expenses: | ||||
Investment management fee (Note 2) | 167,257 | |||
Interest expense | 57 | |||
Total Expenses | 167,314 | |||
Less: Fee waivers and/or expense reimbursements (Note 2) | (8,394) | |||
Net Expenses | 158,920 | |||
| Net Investment Income | 1,216,906 | |||
| Realized and Unrealized Gain (Loss) on Investments and Foreign Currency Transactions (Notes 1 and 3): | ||||
Net Realized Gain (Loss) From: | ||||
Investment transactions | 567,172 | |||
Foreign currency transactions | (11,825) | |||
Net Realized Gain | 555,347 | |||
Change in Net Unrealized Appreciation (Depreciation) From: | ||||
Investments | (3,394,203) | |||
Foreign currencies | 394 | |||
Change in Net Unrealized Appreciation (Depreciation) | (3,393,809) | |||
| Net Loss on Investments and Foreign Currency Transactions | (2,838,462) | |||
| Decrease in Net Assets From Operations | $ | (1,621,556) | ||
See Notes to Financial Statements.
| 16 | Legg Mason Global Infrastructure ETF 2018 Annual Report |
Statements of changes in net assets
| For the Year Ended October 31, and the Period Ended October 31, 2017 | 2018 | 20171 | ||||||
| Operations: | ||||||||
Net investment income | $ | 1,216,906 | $ | 321,715 | ||||
Net realized gain | 555,347 | 55,228 | ||||||
Change in net unrealized appreciation (depreciation) | (3,393,809) | 972,266 | ||||||
Increase (Decrease) in Net Assets From Operations | (1,621,556) | 1,349,209 | ||||||
| Distributions to Shareholders From (Note 1): | ||||||||
Net investment income | (1,219,191) | (284,001) | ||||||
Decrease in Net Assets From Distributions to Shareholders | (1,219,191) | (284,001) | ||||||
| Fund Share Transactions (Note 5): | ||||||||
Net proceeds from sale of shares (200,000 and 1,400,000 shares issued, respectively) | 5,571,855 | 39,638,764 | ||||||
Cost of shares repurchased (300,000 and 200,000 shares repurchased, respectively) | (8,568,757) | (5,729,156) | ||||||
Increase (Decrease) in Net Assets From Fund Share Transactions | (2,996,902) | 33,909,608 | ||||||
Increase (Decrease) in Net Assets | (5,837,649) | 34,974,816 | ||||||
| Net Assets: | ||||||||
Beginning of year | 34,974,816 | — | ||||||
End of year* | $ | 29,137,167 | $ | 34,974,816 | ||||
*Includes undistributed net investment income of: | $27,456 | $24,333 | ||||||
| 1 | For the period December 29, 2016 (inception date) to October 31, 2017. |
See Notes to Financial Statements.
| Legg Mason Global Infrastructure ETF 2018 Annual Report | 17 |
| For a share of beneficial interest outstanding throughout each year ended October 31, unless otherwise noted: | ||||||||
| 20181 | 20171,2 | |||||||
| Net asset value, beginning of year | $29.15 | $25.18 | ||||||
| Income (loss) from operations: | ||||||||
Net investment income | 1.01 | 0.64 | ||||||
Net realized and unrealized gain (loss) | (2.64) | 3.88 | ||||||
Total income (loss) from operations | (1.63) | 4.52 | ||||||
| Less distributions from: | ||||||||
Net investment income | (1.03) | (0.55) | ||||||
Total distributions | (1.03) | (0.55) | ||||||
| Net asset value, end of year | $26.49 | $29.15 | ||||||
Total return, based on NAV3 | (5.76) | % | 18.04 | % | ||||
| Net assets, end of year (000s) | $29,137 | $34,975 | ||||||
| Ratios to average net assets: | ||||||||
Gross expenses | 0.49 | % | 0.53 | %4 | ||||
Net expenses5 | 0.47 | 6 | 0.53 | 4 | ||||
Net investment income | 3.57 | 2.67 | 4 | |||||
| Portfolio turnover rate7 | 45 | % | 43 | % | ||||
| 1 | Per share amounts have been calculated using the average shares method. |
| 2 | For the period December 29, 2016 (inception date) to October 31, 2017. |
| 3 | Performance figures may reflect fee waivers and/or expense reimbursements. In the absence of fee waivers and/or expense reimbursements, the total return would have been lower. The total return calculation assumes that distributions are reinvested at NAV. Past performance is no guarantee of future results. Total returns for periods of less than one year are not annualized. |
| 4 | Annualized. |
| 5 | As a result of an expense limitation, effective May 4, 2018, the ratio of total annual operating expenses, other than interest expenses, taxes, brokerage expenses, future 12b-1 fees (if any), acquired fund fees and expenses, extraordinary expenses and the management fee payable to LMPFA under the investment management agreement, to average net assets did not exceed 0.40%. This expense limitation cannot be terminated prior to February 29, 2020 without the Board of Trustees’ consent. |
| 6 | Reflects fee waivers and/or expense reimbursements. |
| 7 | Portfolio turnover excludes the value of portfolio securities received or delivered as a result of in-kind fund share transactions. |
See Notes to Financial Statements.
| 18 | Legg Mason Global Infrastructure ETF 2018 Annual Report |
1. Organization and significant accounting policies
Legg Mason Global Infrastructure ETF (the “Fund”) is a separate diversified investment series of Legg Mason ETF Investment Trust (the “Trust”). The Trust, a Maryland statutory trust, is registered under the Investment Company Act of 1940, as amended (the “1940 Act”), as an open-end management investment company.
The Fund is an exchange-traded fund (“ETF”). ETFs are funds that trade like other publicly-traded securities. The Fund is designed to track an index. Similar to shares of an index mutual fund, each share of the Fund represents an ownership interest in an underlying portfolio of securities intended to track an index. Unlike shares of a mutual fund, which can be bought from and redeemed by the issuing fund by all shareholders at a price based on net asset value (“NAV”), shares of the Fund may be directly purchased from and redeemed by the Fund at NAV solely by certain large institutional investors who have entered into agreements with the Fund’s distributor (“Authorized Participants”). Also unlike shares of a mutual fund, shares of the Fund are listed on a national securities exchange and trade in the secondary market at market prices that change throughout the day.
Shares of the Fund are listed and traded at market prices on NASDAQ. The market price for the Fund’s shares may be different from the Fund’s NAV. The Fund issues and redeems shares at NAV only in blocks of a specified number of shares or multiples thereof (“Creation Units”). Only Authorized Participants may purchase or redeem Creation Units directly with the Fund at NAV. Creation Units are issued and redeemed generally in-kind for a basket of securities and/or cash. Except when aggregated in Creation Units, shares of the Fund are not redeemable securities. Shareholders who are not Authorized Participants may not redeem shares directly from the Fund at NAV.
The Fund seeks to track the investment results of the RARE Global Infrastructure Index (the “Underlying Index”). The Underlying Index is constructed from global infrastructure-related equity securities and utilizes a proprietary methodology created and sponsored by RARE Infrastructure (North America) Pty Limited (“RARE”), the Fund’s subadviser.
The following are significant accounting policies consistently followed by the Fund and are in conformity with U.S. generally accepted accounting principles (“GAAP”). Estimates and assumptions are required to be made regarding assets, liabilities and changes in net assets resulting from operations when financial statements are prepared. Changes in the economic environment, financial markets and any other parameters used in determining these estimates could cause actual results to differ. Subsequent events have been evaluated through the date the financial statements were issued.
(a) Investment valuation. Equity securities for which market quotations are available are valued at the last reported sales price or official closing price on the primary market or exchange on which they trade. The valuations for fixed income securities (which may include, but are not limited to, corporate, government, municipal, mortgage-backed, collateralized mortgage obligations and asset-backed securities) and certain derivative instruments are typically the prices supplied by independent third party pricing services,
| Legg Mason Global Infrastructure ETF 2018 Annual Report | 19 |
Notes to financial statements (cont’d)
which may use market prices or broker/dealer quotations or a variety of valuation techniques and methodologies. The independent third party pricing services use inputs that are observable such as issuer details, interest rates, yield curves, prepayment speeds, credit risks/spreads, default rates and quoted prices for similar securities. Prior to December 1, 2017, short-term fixed income securities that would mature in 60 days or less were valued at amortized cost, unless it was determined that using this method would not reflect an investment’s fair value. Investments in open-end funds are valued at the closing net asset value per share of each fund on the day of valuation. When the Fund holds securities or other assets that are denominated in a foreign currency, the Fund will use the currency exchange rates, generally determined as of 4:00 p.m. (London time) (4:00 p.m. Eastern time prior to October 1, 2018). If independent third party pricing services are unable to supply prices for a portfolio investment, or if the prices supplied are deemed by the manager to be unreliable, the market price may be determined by the manager using quotations from one or more broker/dealers or at the transaction price if the security has recently been purchased and no value has yet been obtained from a pricing service or pricing broker. When reliable prices are not readily available, such as when the value of a security has been significantly affected by events after the close of the exchange or market on which the security is principally traded, but before the Fund calculates its net asset value, the Fund values these securities as determined in accordance with procedures approved by the Fund’s Board of Trustees.
The Board of Trustees is responsible for the valuation process and has delegated the supervision of the daily valuation process to the Legg Mason North Atlantic Fund Valuation Committee (the “Valuation Committee”). The Valuation Committee, pursuant to the policies adopted by the Board of Trustees, is responsible for making fair value determinations, evaluating the effectiveness of the Fund’s pricing policies, and reporting to the Board of Trustees. When determining the reliability of third party pricing information for investments owned by the Fund, the Valuation Committee, among other things, conducts due diligence reviews of pricing vendors, monitors the daily change in prices and reviews transactions among market participants.
The Valuation Committee will consider pricing methodologies it deems relevant and appropriate when making fair value determinations. Examples of possible methodologies include, but are not limited to, multiple of earnings; discount from market of a similar freely traded security; discounted cash-flow analysis; book value or a multiple thereof; risk premium/yield analysis; yield to maturity; and/or fundamental investment analysis. The Valuation Committee will also consider factors it deems relevant and appropriate in light of the facts and circumstances. Examples of possible factors include, but are not limited to, the type of security; the issuer’s financial statements; the purchase price of the security; the discount from market value of unrestricted securities of the same class at the time of purchase; analysts’ research and observations from financial institutions; information regarding any transactions or offers with respect to the security; the existence of merger proposals or tender offers affecting the security; the price and extent of public trading in similar securities of the issuer or comparable companies; and the existence of a shelf registration for restricted securities.
| 20 | Legg Mason Global Infrastructure ETF 2018 Annual Report |
For each portfolio security that has been fair valued pursuant to the policies adopted by the Board of Trustees, the fair value price is compared against the last available and next available market quotations. The Valuation Committee reviews the results of such back testing monthly and fair valuation occurrences are reported to the Board of Trustees quarterly.
The Fund uses valuation techniques to measure fair value that are consistent with the market approach and/or income approach, depending on the type of security and the particular circumstance. The market approach uses prices and other relevant information generated by market transactions involving identical or comparable securities. The income approach uses valuation techniques to discount estimated future cash flows to present value.
GAAP establishes a disclosure hierarchy that categorizes the inputs to valuation techniques used to value assets and liabilities at measurement date. These inputs are summarized in the three broad levels listed below:
| • | Level 1 — quoted prices in active markets for identical investments |
| • | Level 2 — other significant observable inputs (including quoted prices for similar investments, interest rates, prepayment speeds, credit risk, etc.) |
| • | Level 3 — significant unobservable inputs (including the Fund’s own assumptions in determining the fair value of investments) |
The inputs or methodologies used to value securities are not necessarily an indication of the risk associated with investing in those securities.
The following is a summary of the inputs used in valuing the Fund’s assets carried at fair value:
| ASSETS | ||||||||||||||||
| Description | Quoted Prices (Level 1) | Other Significant Observable Inputs (Level 2) | Significant Unobservable Inputs (Level 3) | Total | ||||||||||||
| Long-term investments†: | ||||||||||||||||
Common stocks | $ | 28,757,409 | — | — | $ | 28,757,409 | ||||||||||
Preferred stocks | 72,790 | — | — | 72,790 | ||||||||||||
Master limited partnerships | 44,804 | — | — | 44,804 | ||||||||||||
| Total investments | $ | 28,875,003 | — | — | $ | 28,875,003 | ||||||||||
| † | See Schedule of Investments for additional detailed categorizations. |
(b) Foreign currency translation. Investment securities and other assets and liabilities denominated in foreign currencies are translated into U.S. dollar amounts based upon prevailing exchange rates on the date of valuation. Purchases and sales of investment securities and income and expense items denominated in foreign currencies are translated into U.S. dollar amounts based upon prevailing exchange rates on the respective dates of such transactions.
| Legg Mason Global Infrastructure ETF 2018 Annual Report | 21 |
Notes to financial statements (cont’d)
The Fund does not isolate that portion of the results of operations resulting from fluctuations in foreign exchange rates on investments from the fluctuations arising from changes in market prices of securities held. Such fluctuations are included with the net realized and unrealized gain or loss on investments.
Net realized foreign exchange gains or losses arise from sales of foreign currencies, including gains and losses on forward foreign currency contracts, currency gains or losses realized between the trade and settlement dates on securities transactions, and the difference between the amounts of dividends, interest, and foreign withholding taxes recorded on the Fund’s books and the U.S. dollar equivalent of the amounts actually received or paid. Net unrealized foreign exchange gains and losses arise from changes in the values of assets and liabilities, other than investments in securities, on the date of valuation, resulting from changes in exchange rates.
Foreign security and currency transactions may involve certain considerations and risks not typically associated with those of U.S. dollar denominated transactions as a result of, among other factors, the possibility of lower levels of governmental supervision and regulation of foreign securities markets and the possibility of political or economic instability.
(c) Foreign investment risks. The Fund’s investments in foreign securities may involve risks not present in domestic investments. Since securities may be denominated in foreign currencies, may require settlement in foreign currencies or pay interest or dividends in foreign currencies, changes in the relationship of these foreign currencies to the U.S. dollar can significantly affect the value of the investments and earnings of the Fund. Foreign investments may also subject the Fund to foreign government exchange restrictions, expropriation, taxation or other political, social or economic developments, all of which affect the market and/or credit risk of the investments.
(d) Security transactions and investment income. Security transactions are accounted for on a trade date basis. Interest income (including interest income from payment-in-kind securities), adjusted for amortization of premium and accretion of discount, is recorded on the accrual basis. Dividend income is recorded on the ex-dividend date for dividends received in cash and/or securities. Foreign dividend income is recorded on the ex-dividend date or as soon as practicable after the Fund determines the existence of a dividend declaration after exercising reasonable due diligence. The cost of investments sold is determined by use of the specific identification method. To the extent any issuer defaults or a credit event occurs that impacts the issuer, the Fund may halt any additional interest income accruals and consider the realizability of interest accrued up to the date of default or credit event.
(e) Distributions to shareholders. Distributions from net investment income of the Fund, if any, are declared and paid on a quarterly basis. Distributions of net realized gains, if any, are declared at least annually. Distributions to shareholders of the Fund are recorded on the ex-dividend date and are determined in accordance with income tax regulations, which may differ from GAAP.
| 22 | Legg Mason Global Infrastructure ETF 2018 Annual Report |
(f) Federal and other taxes. It is the Fund’s policy to comply with the federal income and excise tax requirements of the Internal Revenue Code of 1986 (the “Code”), as amended, applicable to regulated investment companies. Accordingly, the Fund intends to distribute its taxable income and net realized gains, if any, to shareholders in accordance with timing requirements imposed by the Code. Therefore, no federal or state income tax provision is required in the Fund’s financial statements.
Management has analyzed the Fund’s tax positions taken on income tax returns for all open tax years and has concluded that as of October 31, 2018, no provision for income tax is required in the Fund’s financial statements. The Fund’s federal and state income and federal excise tax returns for tax years for which the applicable statutes of limitations have not expired are subject to examination by the Internal Revenue Service and state departments of revenue.
Under the applicable foreign tax laws, a withholding tax may be imposed on interest, dividends and capital gains at various rates.
(g) Reclassification. GAAP requires that certain components of net assets be reclassified to reflect permanent differences between financial and tax reporting. These reclassifications have no effect on net assets or net asset value per share. During the current year, the following reclassifications have been made:
| Undistributed Net Investment Income | Accumulated Net Realized Loss | Paid-in Capital | ||||||||||
| (a) | $ | 5,408 | $ | (5,408) | — | |||||||
| (b) | — | (810,070) | $ | 810,070 | ||||||||
| (a) | Reclassifications are due to foreign currency transactions treated as ordinary income for tax purposes, book/tax differences in the treatment of passive foreign investment companies and book/tax differences in the treatment of real estate investment trusts. |
| (b) | Reclassifications are due to book/tax differences in treatment of an in-kind distribution of securities. |
2. Investment management agreement and other transactions with affiliates
Legg Mason Partners Fund Advisor, LLC (“LMPFA”) is the Fund’s investment manager and RARE is the Fund’s subadviser. Western Asset Management Company, LLC (formerly known as Western Asset Management Company) (“Western Asset”) manages the portion of the Fund’s cash and short-term instruments allocated to it. LMPFA and Western Asset are wholly-owned subsidiaries of Legg Mason, Inc. (“Legg Mason”) and RARE is a subsidiary of Legg Mason.
LMPFA provides administrative and certain oversight services to the Fund. LMPFA delegates to the subadviser the day-to-day portfolio management of the Fund. The Fund is responsible for paying interest expenses, taxes, brokerage expenses, future 12b-1 fees (if any), acquired fund fees and expenses, extraordinary expenses and the management fee payable to LMPFA under the investment management agreement.
Under the investment management agreement and subject to the general supervision of the Fund’s Board of Trustees, LMPFA provides or causes to be furnished all investment
| Legg Mason Global Infrastructure ETF 2018 Annual Report | 23 |
Notes to financial statements (cont’d)
management, supervisory, administrative and other services reasonably necessary for the operation of the Fund, including certain distribution services (provided pursuant to a separate distribution agreement) and investment advisory services (provided pursuant to separate subadvisory agreements) under a unitary fee structure. Effective May 4, 2018, the Fund pays an investment management fee, calculated daily and paid monthly, at an annual rate of 0.45% of the Fund’s average daily net assets. Prior to May 4, 2018, the Fund paid an investment management fee, calculated daily and paid monthly, at an annual rate of 0.53% of the Fund’s average daily net assets.
Effective May 4, 2018, LMPFA has agreed to waive and/or reimburse investment management fees so that the ratio of total annual fund operating expenses will not exceed 0.40% of the Fund’s average daily net assets (subject to the same exclusions as the investment management agreement). This arrangement cannot be terminated prior to February 29, 2020 without the Board of Trustees’ consent.
During the year ended October 31, 2018, fees waived and/or expenses reimbursed amounted to $8,394.
As compensation for its subadvisory services, LMPFA pays RARE monthly 90% of the management fee paid by the Fund to LMPFA, net of (i) all fees and expenses incurred by LMPFA under the investment management agreement (including without limitation any subadvisory fee paid to another subadviser to the Fund) and (ii) expense waivers, if any, and reimbursements. LMPFA pays Western Asset monthly a fee of 0.02% of the portion of the Fund’s average daily net assets allocated to Western Asset for the management of cash and other short-term instruments, net of expense waivers, if any, and reimbursements.
Legg Mason Investor Services, LLC, a wholly-owned broker-dealer subsidiary of Legg Mason, serves as the distributor of Creation Units for the Fund on an agency basis.
The Fund’s Board of Trustees has adopted a Rule 12b-1 shareholder services and distribution plan and under that plan, the Fund is authorized to pay service and/or distribution fees calculated at an annual rate of up to 0.25% of its average daily net assets. No service and/or distribution fees are currently paid by the Fund, and there are no current plans to impose these fees.
All officers and one Trustee of the Trust are employees of Legg Mason or its affiliates and do not receive compensation from the Trust.
3. Investments
During the year ended October 31, 2018, the aggregate cost of purchases and proceeds from sales of investments (excluding in-kind transactions and short-term investments) were as follows:
| Purchases | $ | 19,008,487 | ||
| Sales | 15,142,427 |
| 24 | Legg Mason Global Infrastructure ETF 2018 Annual Report |
During the year ended October 31, 2018, in-kind transactions (Note 5) were as follows:
| Contributions | $ | 0 | ||
| Redemptions | 7,104,960 | |||
| Realized gain (loss)* | 811,620 |
| * | Net realized gains on redemptions in-kind are not taxable to the remaining shareholders of the Fund. |
The in-kind contributions and in-kind redemptions shown in this table may not agree with the Fund Share Transactions on the Statement of Changes in Net Assets. This table represents the accumulation of the Fund’s daily net shareholder transactions while the Statement of Changes in Net Assets reflects gross shareholder transactions including any cash component of the transactions.
At October 31, 2018, the aggregate cost of investments and the aggregate gross unrealized appreciation and depreciation of investments for federal income tax purposes were as follows:
| Cost | Gross Unrealized Appreciation | Gross Unrealized Depreciation | Net Unrealized Depreciation | |||||||||||||
| Securities | $ | 31,329,082 | $ | 542,167 | $ | (2,996,246) | $ | (2,454,079) | ||||||||
4. Derivative instruments and hedging activities
During the year ended October 31, 2018, the Fund did not invest in derivative instruments.
5. Fund share transactions
At October 31, 2018, the Trust had an unlimited number of shares of beneficial interest authorized with a par value of $0.00001 per share. Fund shares are issued and redeemed by the Fund only in Creation Units or Creation Unit aggregations, where 100,000 shares of the Fund constitute a Creation Unit. Such transactions are generally on an in-kind basis, with a separate cash payment, which is a balancing cash component to equate the transaction to the net asset value per share of the Fund on the transaction date. Transactions in capital shares of the Fund are disclosed in detail in the Statement of Changes in Net Assets. Authorized Participants are subject to standard creation and redemption transaction fees to offset transfer and other transaction costs associated with the issuance and redemption of Creation Units. Creations and redemptions for cash (when cash creations and redemptions are available or specified) may be subject to an additional variable fee.
6. Income tax information and distributions to shareholders
The tax character of distributions paid during the fiscal period ended October 31, was as follows:
| 2018 | 2017 | |||||||
| Distributions paid from: | ||||||||
| Ordinary income | $ | 1,219,191 | $ | 284,001 | ||||
| Legg Mason Global Infrastructure ETF 2018 Annual Report | 25 |
Notes to financial statements (cont’d)
As of October 31, 2018, the components of accumulated earnings (losses) on a tax basis were as follows:
| Undistributed ordinary income — net | $ | 34,535 | ||
| Deferred capital losses* | (309,940) | |||
| Unrealized appreciation (depreciation)(a) | (2,454,244) | |||
| Total accumulated earnings (losses) — net | $ | (2,729,649) |
| * | These capital losses have been deferred in the current year as either short-term or long-term losses. The losses will be deemed to occur on the first day of the next taxable year in the same character as they were originally deferred and will be available to offset future taxable capital gains. |
| (a) | The difference between book-basis and tax-basis unrealized appreciation (depreciation) is attributable to the tax deferral of losses on wash sales and the realization for tax purposes of unrealized gains on investments in passive foreign investment companies. |
| 26 | Legg Mason Global Infrastructure ETF 2018 Annual Report |
Report of independent registered public accounting firm
To the Board of Trustees of Legg Mason ETF Investment Trust and Shareholders of Legg Mason Global Infrastructure ETF
Opinion on the financial statements
We have audited the accompanying statement of assets and liabilities, including the schedule of investments, of Legg Mason Global Infrastructure ETF (one of the funds constituting Legg Mason ETF Investment Trust, referred to hereafter as the “Fund”) as of October 31, 2018, the related statement of operations for the year ended October 31, 2018 and the statement of changes in net assets and the financial highlights for the year ended October 31, 2018 and for the period December 29, 2016 (commencement of operations) through October 31, 2017, including the related notes (collectively referred to as the “financial statements”). In our opinion, the financial statements present fairly, in all material respects, the financial position of the Fund as of October 31, 2018, the results of its operations for the year ended October 31, 2018, and the changes in its net assets and the financial highlights for the year ended October 31, 2018 and for the period December 29, 2016 (commencement of operations) through October 31, 2017 in conformity with accounting principles generally accepted in the United States of America.
Basis for opinion
These financial statements are the responsibility of the Fund’s management. Our responsibility is to express an opinion on the Fund’s financial statements based on our audits. We are a public accounting firm registered with the Public Company Accounting Oversight Board (United States) (“PCAOB”) and are required to be independent with respect to the Fund in accordance with the U.S. federal securities laws and the applicable rules and regulations of the Securities and Exchange Commission and the PCAOB.
We conducted our audits of these financial statements in accordance with the standards of the PCAOB. Those standards require that we plan and perform the audit to obtain reasonable assurance about whether the financial statements are free of material misstatement, whether due to error or fraud.
Our audits included performing procedures to assess the risks of material misstatement of the financial statements, whether due to error or fraud, and performing procedures that respond to those risks. Such procedures included examining, on a test basis, evidence regarding the amounts and disclosures in the financial statements. Our audits also included evaluating the accounting principles used and significant estimates made by management, as well as evaluating the overall presentation of the financial statements. Our procedures included confirmation of securities owned as of October 31, 2018 by correspondence with the custodian. We believe that our audits provide a reasonable basis for our opinion.
/s/PricewaterhouseCoopers LLP
Baltimore, Maryland
December 19, 2018
We have served as the auditor of one or more investment companies in Legg Mason investment company group since at least 1973. We have not determined the specific year we began serving as auditor.
| Legg Mason Global Infrastructure ETF 2018 Annual Report | 27 |
Additional information (unaudited)
Information about Trustees and Officers
The business and affairs of Legg Mason Global Infrastructure ETF (the “Fund”) are conducted by management under the supervision and subject to the direction of its Board of Trustees. The business address of each Trustee is c/o Jane Trust, Legg Mason, 100 International Drive, 11th Floor, Baltimore, Maryland 21202. Information pertaining to the Trustees and officers of the Fund is set forth below.
The Statement of Additional Information includes additional information about Trustees and is available, without charge, upon request by calling the Fund at 1-877-721-1926.
| Independent Trustees† | ||
| Paul R. Ades | ||
| Year of birth | 1940 | |
| Position(s) with Trust | Trustee | |
| Term of office1 and length of time served2 | Since 1983 | |
| Principal occupation(s) during past five years | Paul R. Ades, PLLC (law firm) (since 2000) | |
| Number of funds in fund complex overseen by Trustee | 48 | |
| Other board memberships held by Trustee during past five years | None | |
| Andrew L. Breech | ||
| Year of birth | 1952 | |
| Position(s) with Trust | Trustee | |
| Term of office1 and length of time served2 | Since 1991 | |
| Principal occupation(s) during past five years | President, Dealer Operating Control Service, Inc. (automotive retail management) (since 1985) | |
| Number of funds in fund complex overseen by Trustee | 48 | |
| Other board memberships held by Trustee during past five years | None | |
| Dwight B. Crane | ||
| Year of birth | 1937 | |
| Position(s) with Trust | Trustee | |
| Term of office1 and length of time served2 | Since 1981 | |
| Principal occupation(s) during past five years | Professor Emeritus, Harvard Business School (since 2007); formerly, Professor, Harvard Business School (1969 to 2007); Independent Consultant (since 1969) | |
| Number of funds in fund complex overseen by Trustee | 48 | |
| Other board memberships held by Trustee during past five years | None | |
| Althea L. Duersten | ||
| Year of birth | 1951 | |
| Position(s) with Trust | Trustee | |
| Term of office1 and length of time served2 | Since 2014 | |
| Principal occupation(s) during past five years | Retired (since 2011); formerly, Chief Investment Officer, North America, JPMorgan Chase (investment bank) and member of JPMorgan Executive Committee (2007 to 2011) | |
| Number of funds in fund complex overseen by Trustee | 48 | |
| Other board memberships held by Trustee during past five years | None | |
| 28 | Legg Mason Global Infrastructure ETF |
| Independent Trustees† cont’d | ||
| Frank G. Hubbard | ||
| Year of birth | 1937 | |
| Position(s) with Trust | Trustee | |
| Term of office1 and length of time served2 | Since 1993 | |
| Principal occupation(s) during past five years | President, Fealds, Inc. (business development) (since 2016); formerly, President, Avatar International Inc. (business development) (1998 to 2015) | |
| Number of funds in fund complex overseen by Trustee | 48 | |
| Other board memberships held by Trustee during past five years | None | |
| Howard J. Johnson | ||
| Year of birth | 1938 | |
| Position(s) with Trust | Trustee and Chairman | |
| Term of office1 and length of time served2 | From 1981 to 1998 and since 2000 (Chairman since 2013) | |
| Principal occupation(s) during past five years | Chief Executive Officer, Genesis Imaging LLC (technology company) (since 2003) | |
| Number of funds in fund complex overseen by Trustee | 48 | |
| Other board memberships held by Trustee during past five years | None | |
| Jerome H. Miller | ||
| Year of birth | 1938 | |
| Position(s) with Trust | Trustee | |
| Term of office1 and length of time served2 | Since 1995 | |
| Principal occupation(s) during past five years | Retired | |
| Number of funds in fund complex overseen by Trustee | 48 | |
| Other board memberships held by Trustee during past five years | None | |
| Ken Miller | ||
| Year of birth | 1942 | |
| Position(s) with Trust | Trustee | |
| Term of office1 and length of time served2 | Since 1983 | |
| Principal occupation(s) during past five years | Retired; formerly, President, Young Stuff Apparel Group, Inc. (apparel manufacturer), division of Li & Fung (1963 to 2012) | |
| Number of funds in fund complex overseen by Trustee | 48 | |
| Other board memberships held by Trustee during past five years | None | |
| Legg Mason Global Infrastructure ETF | 29 |
Additional information (unaudited) (cont’d)
Information about Trustees and Officers
| Independent Trustees† cont’d | ||
| John J. Murphy | ||
| Year of birth | 1944 | |
| Position(s) with Trust | Trustee | |
| Term of office1 and length of time served2 | Since 2002 | |
| Principal occupation(s) during past five years | President (since 2017) and formerly, Founder and Senior Principal (1983 to 2017), Murphy Capital Management (investment management); and Senior Vice President, Peapack-Gladstone Bank (commercial bank) (since 2017) | |
| Number of funds in fund complex overseen by Trustee | 48 | |
| Other board memberships held by Trustee during past five years | Trustee, UBS Funds (24 funds) (since 2008); Trustee, Consulting Group Capital Markets Funds (11 funds) (since 2002); Director, Fort Dearborn Income Securities, Inc. (2013 to 2016) | |
| Thomas F. Schlafly | ||
| Year of birth | 1948 | |
| Position(s) with Trust | Trustee | |
| Term of office1 and length of time served2 | Since 1983 | |
| Principal occupation(s) during past five years | Chairman, The Saint Louis Brewery, LLC (brewery) (since 2012); formerly, President, The Saint Louis Brewery, Inc. (1989 to 2012); Senior Counsel (since 2017) and formerly, Partner (2009 to 2016), Thompson Coburn LLP (law firm) | |
| Number of funds in fund complex overseen by Trustee | 48 | |
| Other board memberships held by Trustee during past five years | Director, Citizens National Bank of Greater St. Louis (since 2006) | |
| Interested Trustee and Officer | ||
| Jane Trust, CFA3 | ||
| Year of birth | 1962 | |
| Position(s) with Trust | Trustee, President and Chief Executive Officer | |
| Term of office1 and length of time served2 | Since 2015 | |
| Principal occupation(s) during past five years | Senior Managing Director of Legg Mason & Co., LLC (“Legg Mason & Co.”) (since 2018); Managing Director of Legg Mason & Co. (2016 to 2018); Officer and/or Trustee/ Director of 147 funds associated with Legg Mason Partners Fund Advisor, LLC (“LMPFA”) or its affiliates (since 2015); President and Chief Executive Officer of LMPFA (since 2015); formerly, Senior Vice President of LMPFA (2015); Director of ClearBridge, LLC (formerly, Legg Mason Capital Management, LLC) (2007 to 2014); Managing Director of Legg Mason Investment Counsel & Trust Co. (2000 to 2007) | |
| Number of funds in fund complex overseen by Trustee | 138 | |
| Other board memberships held by Trustee during past five years | None | |
| 30 | Legg Mason Global Infrastructure ETF |
| Additional Officers | ||
Ted P. Becker Legg Mason 620 Eighth Avenue, 49th Floor, New York, NY 10018 | ||
| Year of birth | 1951 | |
| Position(s) with Trust | Chief Compliance Officer | |
| Term of office1 and length of time served2 | Since 2007 | |
| Principal occupation(s) during past five years | Director of Global Compliance at Legg Mason (since 2006); Chief Compliance Officer of LMPFA (since 2006); Managing Director of Compliance of Legg Mason & Co. (since 2005); Chief Compliance Officer of certain mutual funds associated with Legg Mason & Co. or its affiliates (since 2006) | |
Susan Kerr Legg Mason 620 Eighth Avenue, 49th Floor, New York, NY 10018 | ||
| Year of birth | 1949 | |
| Position(s) with Trust | Chief Anti-Money Laundering Compliance Officer | |
| Term of office1 and length of time served2 | Since 2013 | |
| Principal occupation(s) during past five years | Assistant Vice President of Legg Mason & Co. and Legg Mason Investor Services, LLC (“LMIS”) (since 2010); Chief Anti-Money Laundering Compliance Officer of certain mutual funds associated with Legg Mason & Co. or its affiliates (since 2013) and Anti-Money Laundering Compliance Officer of LMIS (since 2012); Senior Compliance Officer of LMIS (since 2011); formerly, AML Consultant, DTCC (2010); AML Consultant, Rabobank Netherlands, (2009); First Vice President, Director of Marketing & Advertising Compliance and Manager of Communications Review Group at Citigroup Inc. (1996 to 2008) | |
Jenna Bailey Legg Mason 100 First Stamford Place, 5th Floor, Stamford, CT 06902 | ||
| Year of birth | 1978 | |
| Position(s) with Trust | Identity Theft Prevention Officer | |
| Term of office1 and length of time served2 | Since 2015 | |
| Principal occupation(s) during past five years | Identity Theft Prevention Officer of certain mutual funds associated with Legg Mason & Co. or its affiliates (since 2015); Compliance Officer of Legg Mason & Co. (since 2013); Assistant Vice President of Legg Mason & Co. (since 2011); formerly, Associate Compliance Officer of Legg Mason & Co. (2011 to 2013) | |
| Legg Mason Global Infrastructure ETF | 31 |
Additional information (unaudited) (cont’d)
Information about Trustees and Officers
| Additional Officers cont’d | ||
Robert I. Frenkel Legg Mason 100 First Stamford Place, 6th Floor, Stamford, CT 06902 | ||
| Year of birth | 1954 | |
| Position(s) with Trust | Secretary and Chief Legal Officer | |
| Term of office1 and length of time served2 | Since 2007 | |
| Principal occupation(s) during past five years | Vice President and Deputy General Counsel of Legg Mason (since 2006); Managing Director and General Counsel— U.S. Mutual Funds for Legg Mason & Co. (since 2006) and Legg Mason & Co. predecessors (since 1994); Secretary and Chief Legal Officer of certain mutual funds associated with Legg Mason & Co. or its affiliates (since 2006) and Legg Mason & Co. predecessors (prior to 2006) | |
Thomas C. Mandia Legg Mason 100 First Stamford Place, 6th Floor, Stamford, CT 06902 | ||
| Year of birth | 1962 | |
| Position(s) with Trust | Assistant Secretary | |
| Term of office1 and length of time served2 | Since 2007 | |
| Principal occupation(s) during past five years | Managing Director and Deputy General Counsel of Legg Mason & Co. (since 2005) and Legg Mason & Co. predecessors (prior to 2005); Secretary of LMPFA (since 2006); Assistant Secretary of certain mutual funds associated with Legg Mason & Co. or its affiliates (since 2006) and Legg Mason & Co. predecessors (prior to 2006); Secretary of LM Asset Services, LLC (“LMAS”) (since 2002) and Legg Mason Fund Asset Management, Inc. (“LMFAM”) (since 2013) (formerly registered investment advisers) | |
Richard F. Sennett Legg Mason 100 International Drive, 7th Floor, Baltimore, MD 21202 | ||
| Year of birth | 1970 | |
| Position(s) with Trust | Principal Financial Officer | |
| Term of office1 and length of time served2 | Since 2011 | |
| Principal occupation(s) during past five years | Principal Financial Officer and Treasurer of certain mutual funds associated with Legg Mason & Co. or its affiliates (since 2011 and since 2013); Managing Director of Legg Mason & Co. and Senior Manager of the Treasury Policy group for Legg Mason & Co.’s Global Fiduciary Platform (since 2011); formerly, Chief Accountant within the SEC’s Division of Investment Management (2007 to 2011); Assistant Chief Accountant within the SEC’s Division of Investment Management (2002 to 2007) | |
| 32 | Legg Mason Global Infrastructure ETF |
| Additional Officers cont’d | ||
Christopher Berarducci Legg Mason 620 Eighth Avenue, 49th Floor, New York, NY 10018 | ||
| Year of birth | 1974 | |
| Position(s) with Trust | Treasurer | |
| Term of office1 and length of time served2 | Since 2014 | |
| Principal occupation(s) during past five years | Director of Legg Mason & Co. (since 2015); Treasurer of certain mutual funds associated with Legg Mason & Co. or its affiliates (since 2010); formerly, Vice President of Legg Mason & Co. (2011 to 2015); Assistant Controller of certain mutual funds associated with Legg Mason & Co. or its affiliates (prior to 2010) | |
Jeanne M. Kelly Legg Mason 620 Eighth Avenue, 49th Floor, New York, NY 10018 | ||
| Year of birth | 1951 | |
| Position(s) with Trust | Senior Vice President | |
| Term of office1 and length of time served2 | Since 2007 | |
| Principal occupation(s) during past five years | Senior Vice President of certain mutual funds associated with Legg Mason & Co. or its affiliates (since 2007); Senior Vice President of LMPFA (since 2006); President and Chief Executive Officer of LMAS and LMFAM (since 2015); Managing Director of Legg Mason & Co. (since 2005) and Legg Mason & Co. predecessors (prior to 2005); formerly, Senior Vice President of LMFAM (2013 to 2015) | |
| † | Trustees who are not “interested persons” of the Fund within the meaning of Section 2(a)(19) of the Investment Company Act of 1940, as amended (the “1940 Act”). |
| 1 | Each Trustee and officer serves until his or her respective successor has been duly elected and qualified or until his or her earlier death, resignation, retirement or removal. |
| 2 | Indicates the earliest year in which the Trustee became a board member for a fund in the Legg Mason fund complex or the officer took such office. |
| 3 | Ms. Trust is an “interested person” of the Funds, as defined in the 1940 Act, because of her position with LMPFA and/or certain of its affiliates. |
| Legg Mason Global Infrastructure ETF | 33 |
Important tax information (unaudited)
The following information is provided with respect to the distributions paid during the taxable period ended October 31, 2018:
| Record date: | 12/27/2017 | 4/10/2018 | 7/11/2018 | 10/10/2018 | ||||||||||||
| Payable date: | 12/29/2017 | 4/12/2018 | 7/13/2018 | 10/12/2018 | ||||||||||||
| Ordinary income: | ||||||||||||||||
Qualified dividend income for individuals* | 99.71 | % | 50.97 | % | 50.97 | % | 50.97 | % | ||||||||
Dividends qualifying for the dividends | ||||||||||||||||
received deduction for corporations* | 30.21 | % | 24.08 | % | 24.08 | % | 24.08 | % | ||||||||
| Foreign source income* | 8.39 | % | 97.44 | % | 97.44 | % | 97.44 | % | ||||||||
| Foreign taxes paid per share | $ | 0.001786 | $ | 0.023181 | $ | 0.046503 | $ | 0.022396 |
| * | Expressed as a percentage of the cash distribution grossed-up for foreign taxes. |
The foreign taxes paid represent taxes incurred by the Fund on income received by the Fund from foreign sources. Foreign taxes paid may be included in taxable income with an offsetting deduction from gross income or may be taken as a credit for taxes paid to foreign governments. You should consult your tax adviser regarding the appropriate treatment of foreign taxes paid.
Please retain this information for your records.
| 34 | Legg Mason Global Infrastructure ETF |
Legg Mason
Global Infrastructure ETF
Trustees
Paul R. Ades
Andrew L. Breech
Dwight B. Crane
Althea L. Duersten
Frank G. Hubbard
Howard J. Johnson Chairman
Jerome H. Miller
Ken Miller
John J. Murphy
Thomas F. Schlafly
Jane Trust
Investment manager
Legg Mason Partners Fund Advisor, LLC
Subadviser
RARE Infrastructure (North America) Pty Limited
Custodian
The Bank of New York Mellon (“BNY”)*
Transfer agent
BNY Mellon Investment Servicing (US) Inc. (“BNY Mellon”)*
4400 Computer Drive Westborough, MA 01581
Independent registered public accounting firm
PricewaterhouseCoopers LLP Baltimore, MD
| * | Effective July 16, 2018, BNY became custodian and BNY Mellon became transfer agent. |
Legg Mason Global Infrastructure ETF
The Fund is a separate investment series of Legg Mason ETF Investment Trust, a Maryland statutory trust.
Legg Mason Global Infrastructure ETF
Legg Mason Funds
620 Eighth Avenue, 49th Floor
New York, NY 10018
The Fund files its complete schedule of portfolio holdings with the Securities and Exchange Commission (“SEC”) for the first and third quarters of each fiscal year on Form N-Q. The Fund’s Forms N-Q are available on the SEC’s website at www.sec.gov. To obtain information on Form N-Q, shareholders can call the Fund at 1-877-721-1926.
Information on how the Fund voted proxies relating to portfolio securities during the prior 12-month period ended June 30th of each year and a description of the policies and procedures that the Fund uses to determine how to vote proxies related to portfolio transactions are available (1) without charge, upon request, by calling the Fund at 1-877-721-1926, (2) at www.leggmason.com/etf and (3) on the SEC’s website at www.sec.gov.
This report is submitted for the general information of the shareholders of Legg Mason Global Infrastructure ETF. This report is not authorized for distribution to prospective investors in the Fund unless preceded or accompanied by a current prospectus.
Investors should consider the Fund’s investment objectives, risks, charges and expenses carefully before investing. The prospectus contains this and other important information about the Fund. Please read the prospectus carefully before investing.
www.leggmason.com
© 2018 Legg Mason Investors Services, LLC
Member FINRA, SIPC
ETF Index Disclaimers
The MSCI ACWI All Cap Index (the “MSCI Index”) was used by RARE Infrastructure (North America) Pty Limited (“RARE”) as the reference universe for selection of the component securities included in the RARE Global Infrastructure Index (the “Underlying Index”). MSCI Inc. does not in any way sponsor, support, promote or endorse the Underlying Index or Legg Mason Global Infrastructure ETF (the “Fund”). MSCI Inc. was not and is not involved in any way in the creation, calculation, maintenance or review of the Underlying Index. The MSCI Index was provided on an “as is” basis. MSCI Inc., its affiliates and any other person or entity involved in or related to compiling, computing or creating the MSCI Index (collectively, the “MSCI Parties”) expressly disclaim all warranties (including, without limitation, any warranties of originality, accuracy, completeness, timeliness, non-infringement, merchantability and fitness for a particular purpose). Without limiting any of the foregoing, in no event shall any MSCI Party have any liability for any direct, indirect, special, incidental, punitive, consequential (including without limitation lost profits) or any other damages in connection with the MSCI Index, the Underlying Index or the Fund.
The Fund is not sponsored, promoted, sold or supported in any other manner by Solactive AG nor does Solactive AG offer any express or implicit guarantee or assurance either with regard to the results of using the Underlying Index and/or Underlying Index trade mark or the Underlying Index Price at any time or in any other respect. The Underlying Index is calculated and published by Solactive AG. Solactive AG uses its best efforts to ensure that the Underlying Index is calculated correctly. Irrespective of its obligations towards the Fund, Solactive AG has no obligation to point out errors in the Underlying Index to third parties including but not limited to investors and/or financial intermediaries of the Fund. Neither publication of the Underlying Index by Solactive AG nor the licensing of the Underlying Index or the Underlying Index trade mark for the purpose of use in connection with the Fund constitutes a recommendation by Solactive AG to invest capital in this Fund nor does it in any way represent an assurance or opinion of Solactive AG with regard to any investment in this Fund.
RARE does not guarantee the accuracy and/or the completeness of the Underlying Index or any data included therein, and RARE shall not have any liability for any errors, omissions or interruptions therein. RARE makes no warranty, express or implied, as to results to be obtained by the Fund, owners of the shares of the Fund or any other person or entity from the use of the Underlying Index, or any data included therein, either in connection with the Fund or for any other use. RARE makes no express or implied warranties, and expressly disclaims all warranties of merchantability or fitness for a particular purpose or use with respect to the Underlying Index or any data included therein. Without limiting any of the foregoing, in no event shall RARE have any liability for any special, punitive, direct, indirect or consequential damages (including lost profits) arising out of matters relating to the use of the Underlying Index, even if notified of the possibility of such damages.
www.leggmason.com
© 2018 Legg Mason Investor Services, LLC Member FINRA, SIPC
ETFF418409 12/18 SR18-3501
| ITEM 2. | CODE OF ETHICS. |
The registrant has adopted a code of ethics that applies to the registrant’s principal executive officer, principal financial officer, principal accounting officer or controller.
| ITEM 3. | AUDIT COMMITTEE FINANCIAL EXPERT. |
The Board of Trustees of the registrant has determined that Dwight B. Crane, possess the technical attributes identified in Instruction 2(b) of Item 3 to Form N-CSR to qualify as “audit committee financial experts,” and have designated Dwight B. Crane as the Audit Committee’s financial experts. Dwight B. Crane is an “independent” Trustees pursuant to paragraph (a) (2) of Item 3 to Form N-CSR.
| ITEM 4. | PRINCIPAL ACCOUNTANT FEES AND SERVICES. |
a) Audit Fees. The aggregate fees billed in the last fiscal period ending October 31, 2017 and October 31, 2018 (the “Reporting Period”) for professional services rendered by the Registrant’s principal accountant (the “Auditor”) for the audit of the Registrant’s annual financial statements, or services that are normally provided by the Auditor in connection with the statutory and regulatory filings or engagements for the Reporting Period, were $80,000 in October 31, 2017 and $140,000 in October 31, 2018.
b) Audit-Related Fees. The aggregate fees billed in the Reporting Period for assurance and related services by the Auditor that are reasonably related to the performance of the Registrant’s financial statements were $0 in October 31, 2017 and $52,489 in October 31, 2018.
In addition, there were no Audit-Related Fees billed in the Reporting Period for assurance and related services by the Auditor to the Registrant’s investment adviser (not including any sub-adviser whose role is primarily portfolio management and is subcontracted with or overseen by another investment adviser), and any entity controlling, controlled by or under common control with the investment adviser that provides ongoing services to the Legg Mason ETF Investment Trust (“service affiliates”), that were reasonably related to the performance of the annual audit of the service affiliates. Accordingly, there were no such fees that required pre-approval by the Audit Committee for the Reporting Period.
(c) Tax Fees. The aggregate fees billed in the Reporting Period for professional services rendered by the Auditor for tax compliance, tax advice and tax planning (“Tax Services”) were $12,500 in October 31, 2017 and $0 in October 31, 2018. These services consisted of (i) review or preparation of U.S. federal, state, local and excise tax returns; (ii) U.S. federal, state and local tax planning, advice and assistance regarding statutory, regulatory or administrative developments, and (iii) tax advice regarding tax qualification matters and/or treatment of various financial instruments held or proposed to be acquired or held.
There were no fees billed for tax services by the Auditors to service affiliates during the Reporting Period that required pre-approval by the Audit Committee.
d) All Other Fees. The aggregate fees for other fees billed in the Reporting Periods for products and services provided by the Auditor were $0 in October 31, 2017 and $0 in October 31, 2018, other than the services reported in paragraphs (a) through (c) of this item for the Legg Mason ETF Investment Trust.
All Other Fees. There were no other non-audit services rendered by the Auditor to Legg Mason Partners Fund Advisors, LLC (“LMPFA”), and any entity controlling, controlled by or under common control with LMPFA that provided ongoing services to Legg Mason ETF Investment Trust requiring pre-approval by the Audit Committee in the Reporting Period.
(e) Audit Committee’s pre–approval policies and procedures described in paragraph (c) (7) of Rule 2-01 of Regulation S-X.
(1) The Charter for the Audit Committee (the “Committee”) of the Board of each registered investment company (the “Fund”) advised by LMPFA or one of their affiliates (each, an “Adviser”) requires that the Committee shall approve (a) all audit and permissible non-audit services to be provided to the Fund and (b) all permissible non-audit services to be provided by the Fund’s independent auditors to the Adviser and any Covered Service Providers if the engagement relates directly to the operations and financial reporting of the Fund. The Committee may implement policies and procedures by which such services are approved other than by the full Committee.
The Committee shall not approve non-audit services that the Committee believes may impair the independence of the auditors. As of the date of the approval of this Audit Committee Charter, permissible non-audit services include any professional services (including tax services), that are not prohibited services as described below, provided to the Fund by the independent auditors, other than those provided to the Fund in connection with an audit or a review of the financial statements of the Fund. Permissible non-audit services may not include: (i) bookkeeping or other services related to the accounting records or financial statements of the Fund; (ii) financial information systems design and implementation; (iii) appraisal or valuation services, fairness opinions or contribution-in-kind reports; (iv) actuarial services; (v) internal audit outsourcing services; (vi) management functions or human resources; (vii) broker or dealer, investment adviser or investment banking services; (viii) legal services and expert services unrelated to the audit; and (ix) any other service the Public Company Accounting Oversight Board determines, by regulation, is impermissible.
Pre-approval by the Committee of any permissible non-audit services is not required so long as: (i) the aggregate amount of all such permissible non-audit services provided to the Fund, the Adviser and any service providers controlling, controlled by or under common control with the Adviser that provide ongoing services to the Fund (“Covered Service Providers”) constitutes not more than 5% of the total amount of revenues paid to the independent auditors during the fiscal year in which the permissible non-audit services are provided to (a) the Fund, (b) the Adviser and (c) any entity controlling, controlled by or under common control with the Adviser that provides ongoing services to the Fund during the fiscal year in which the services are provided that would have to be approved by the Committee; (ii) the permissible non-audit services were not recognized by the Fund at the time of the engagement to be non-audit services; and (iii) such services are promptly brought to the attention of the Committee and approved by the Committee (or its delegate(s)) prior to the completion of the audit.
(2) For the Legg Mason ETF Investment Trust, the percentage of fees that were approved by the audit committee, with respect to: Audit-Related Fees were 100% and 100% for October 31, 2017 and October 31, 2018; Tax Fees were 100% and 100% for October 31, 2017 and October 31, 2018; and Other Fees were 100% and 100% for October 31, 2017 and October 31, 2018.
(f) N/A
(g) Non-audit fees billed by the Auditor for services rendered to Legg Mason ETF Investment Trust, LMPFA and any entity controlling, controlled by, or under common control with LMPFA that provides ongoing services to Legg Mason ETF Investment Trust during the reporting period were $160,000 in October 31, 2017 and $678,000 in October 31, 2018.
(h) Yes. Legg Mason ETF Investment Trust’s Audit Committee has considered whether the provision of non-audit services that were rendered to Service Affiliates, which were not pre-approved (not requiring pre-approval), is compatible with maintaining the Accountant’s independence. All services provided by the Auditor to the Legg Mason ETF Investment Trust or to Service Affiliates, which were required to be pre-approved, were pre-approved as required.
| ITEM 5. | AUDIT COMMITTEE OF LISTED REGISTRANTS. |
| a) | The independent board members are acting as the registrant’s audit committee as specified in Section 3(a)(58)(B) of the Exchange Act . The Audit Committee consists of the following Board members: |
Paul R. Ades
Andrew L. Breech
Dwight B. Crane
Althea L. Duersten
Frank G. Hubbard
Howard J. Johnson
Jerome H. Miller
Ken Miller
John J. Murphy
Thomas F. Schlafly
| b) | Not applicable |
| ITEM 6. | SCHEDULE OF INVESTMENTS. |
Included herein under Item 1.
| ITEM 7. | DISCLOSURE OF PROXY VOTING POLICIES AND PROCEDURES FOR CLOSED-END MANAGEMENT INVESTMENT COMPANIES. |
Not applicable.
| ITEM 8. | PORTFOLIO MANAGERS OF CLOSED-END MANAGEMENT INVESTMENT COMPANIES. |
Not applicable.
| ITEM 9. | PURCHASES OF EQUITY SECURITIES BY CLOSED-END MANAGEMENT INVESTMENT COMPANY AND AFFILIATED PURCHASERS. |
Not applicable.
| ITEM 10. | SUBMISSION OF MATTERS TO A VOTE OF SECURITY HOLDERS. |
Not applicable.
| ITEM 11. | CONTROLS AND PROCEDURES. |
| (a) | The registrant’s principal executive officer and principal financial officer have concluded that the registrant’s disclosure controls and procedures (as defined in Rule 30a- 3(c) under the Investment Company Act of 1940, as amended (the “1940 Act”)) are effective as of a date within 90 days of the filing date of this report that includes the disclosure required by this paragraph, based on their evaluation of the disclosure controls and procedures required by Rule 30a-3(b) under the 1940 Act and 15d-15(b) under the Securities Exchange Act of 1934. |
| (b) | There were no changes in the registrant’s internal control over financial reporting (as defined in Rule 30a-3(d) under the 1940 Act) that occurred during the second fiscal quarter of the period covered by this report that have materially affected, or are likely to materially affect the registrant’s internal control over financial reporting. |
| ITEM 12. | EXHIBITS. |
(a) (1) Code of Ethics attached hereto.
Exhibit 99.CODE ETH
(a) (2) Certifications pursuant to section 302 of the Sarbanes-Oxley Act of 2002 attached hereto.
Exhibit 99.CERT
(b) Certifications pursuant to Section 906 of the Sarbanes-Oxley Act of 2002 attached hereto.
Exhibit 99.906CERT
SIGNATURES
Pursuant to the requirements of the Securities Exchange Act of 1934 and the Investment Company Act of 1940, the registrant has duly caused this Report to be signed on its behalf by the undersigned, there unto duly authorized.
Legg Mason ETF Investment Trust
| By: | /s/ Jane Trust | |
| Jane Trust | ||
| Chief Executive Officer | ||
| Date: | December 27, 2018 | |
Pursuant to the requirements of the Securities Exchange Act of 1934 and the Investment Company Act of 1940, this report has been signed below by the following persons on behalf of the registrant and in the capacities and on the dates indicated.
| By: | /s/ Jane Trust | |
| Jane Trust | ||
| Chief Executive Officer | ||
| Date: | December 27, 2018 | |
| By: | /s/ Richard F. Sennett | |
| Richard F. Sennett | ||
| Principal Financial Officer | ||
| Date: | December 27, 2018 | |