UNITED STATES
SECURITIES AND EXCHANGE COMMISSION
Washington, D.C. 20549
FORMN-CSR
CERTIFIED SHAREHOLDER REPORT OF REGISTERED
MANAGEMENT INVESTMENT COMPANIES
Investment Company Act file number811-23096
Legg Mason ETF Investment Trust
(Exact name of registrant as specified in charter)
620 Eighth Avenue, 49th Floor, New York, NY 10018
(Address of principal executive offices) (Zip code)
Robert I. Frenkel, Esq.
Legg Mason & Co., LLC
100 First Stamford Place
Stamford, CT 06902
(Name and address of agent for service)
Registrant’s telephone number, including area code:1-877-721-1926
Date of fiscal year end: December 31
Date of reporting period: June 30, 2019
| ITEM 1. | REPORT TO STOCKHOLDERS. |
TheSemi-Annual Report to Stockholders is filed herewith.

| Semi-Annual Report | June 30, 2019 |
WESTERN ASSET
TOTAL RETURN ETF
WBND
Beginning in January 2021, as permitted by regulations adopted by the Securities and Exchange Commission, the Fund intends to no longer mail paper copies of the Fund’s shareholder reports like this one, unless you specifically request paper copies of the reports from your financial intermediary (such as a broker-dealer or bank). Instead, the reports will be made available on a website, and you will be notified by mail each time a report is posted and provided with a website link to access the report.
If you already elected to receive shareholder reports electronically(“e-delivery”), you will not be affected by this change and you need not take any action. If you have not already electede-delivery, you may elect to receive shareholder reports and other communications from the Fund electronically by contacting your financial intermediary.
You may elect to receive all future reports in paper free of charge by contacting your financial intermediary to request that you continue to receive paper copies of your shareholder reports. Your election to receive reports in paper will apply to all Legg Mason Funds held in your account with your financial intermediary.

| INVESTMENT PRODUCTS: NOT FDIC INSURED • NO BANK GUARANTEE • MAY LOSE VALUE |
Fund objective
The Fund seeks to maximize total return, consistent with prudent investment management and liquidity needs.

Dear Shareholder,
We are pleased to provide the semi-annual report of Western Asset Total Return ETF for thesix-month reporting period ended June 30, 2019. Please read on for Fund performance information during the Fund’s reporting period.
As always, we remain committed to providing you with excellent service and a full spectrum of investment choices. We also remain committed to supplementing the support you receive from your financial advisor. One way we accomplish this is through our website, www.leggmason.com. Here you can gain immediate access to market and investment information, including:
| • | Fund net asset value and market price, |
| • | Market insights and commentaries from our portfolio managers, and |
| • | A host of educational resources. |
We look forward to helping you meet your financial goals.
Sincerely,

Jane Trust, CFA
President and Chief Executive Officer
July 26, 2019
| ||
| II | Western Asset Total Return ETF |
For the six months ended June 30, 2019, Western Asset Total Return ETF generated a 8.85% return on a net asset value (“NAV”)1 basis and 8.48% based on its market price2 per share.
The performance table shows the Fund’s total return for the six months ended June 30, 2019 based on its NAV and market price. The Fund’s broad-based market index, the Bloomberg Barclays U.S. Aggregate Index3 returned 6.11% over the same time frame. The Lipper Core Plus Bond Funds Category Average4 returned 6.76% for the same period. Please note that Lipper performance returns are based on each fund’s NAV.
Performance Snapshot as of June 30, 2019 (unaudited) | ||||
| 6 months | ||||
| Western Asset Total Return ETF: | ||||
$ 27.01 (NAV) | 8.85 | %*† | ||
$ 27.10 (Market Price) | 8.48 | %*‡ | ||
| Bloomberg Barclays U.S. Aggregate Index | 6.11 | % | ||
| Lipper Core Plus Bond Funds Category Average | 6.76 | % | ||
The performance shown represents past performance. Past performance is no guarantee of future results and current performance may be higher or lower than the performance shown above. Principal value and investment returns will fluctuate so shares, when sold, may be worth more or less than their original cost. Performance data current to the most recentmonth-end is available at www.leggmason.com/etf.
Investors buy and sell shares of an exchange-traded fund (“ETF”) at market price (not NAV) in the secondary market throughout the trading day. These shares are not individually available for direct purchase from or direct redemption to the ETF. Market price returns shown are typically based upon themid-point between the bid and ask on the Fund’s principal trading market when the Fund’s NAV is determined, which is typically 4:00 p.m. Eastern time (US). These returns do not represent investors’ returns had they traded shares at other times. Performance figures for periods shorter than one year represent cumulative figures and are not annualized.
Information showing the number of days the market price of the Fund’s shares was greater than the Fund’s NAV and the number of days it was less than the Fund’s NAV (i.e., premium or discount) for various time periods is available by visiting the Fund’s website at www.leggmason.com/etf.
As of the Fund’s current prospectus dated April 29, 2019, the gross total
| 1 | Net Asset Value (NAV) is calculated by subtracting total liabilities from total assets and dividing the results by the number of shares outstanding. |
| 2 | Market price is determined by supply and demand. It is the price at which an investor purchases or sells shares of the Fund. The market price may differ from the Fund’s NAV. |
| 3 | The Bloomberg Barclays U.S. Aggregate Index is a broad-based bond index comprised of government, corporate, mortgage- and asset-backed issues, rated investment grade or higher, and having at least one year to maturity. |
| 4 | Lipper, Inc., a wholly-owned subsidiary of Reuters, provides independent insight on global collective investments. Returns are based on thesix-month period ended June 30, 2019, including the reinvestment of all distributions, including returns of capital, if any, calculated among the 312 funds in the Fund’s Lipper category. |
| ||
| Western Asset Total Return ETF | III |
Performance review (cont’d)
annual fund operating expense ratio for the Fund was 0.51%.
The management agreement between Legg Mason ETF Investment Trust (the “Trust”) on behalf of the Fund and Legg Mason Partners Fund Advisor, LLC (the “manager” or “LMPFA”) (the “Management Agreement”) provides that LMPFA will pay all operating expenses of the Fund, other than interest expenses, taxes, brokerage expenses, future12b-1 fees (if any), acquired fund fees and expenses, extraordinary expenses and the management fee payable to LMPFA under the Management Agreement. LMPFA will also pay all subadvisory fees of the Fund. The manager has agreed to waive and/or reimburse management fees so that the ratio of total annual fund operating expenses will not exceed 0.45% (subject to the same exclusions as the Management Agreement). Total annual fund operating expenses after waiving and/or reimbursing management fees exceed the expense cap as a result of acquired fund fees and expenses. This arrangement cannot be terminated prior to May 1, 2020 without the Board of Trustees’ consent.
* Total returns are based on changes in NAV or market price, respectively. Returns reflect the deduction of all Fund expenses. Returns do not reflect the deduction of brokerage commissions or taxes that investors pay on distributions or the sale of shares.
† Total return assumes the reinvestment of all distributions, including returns of capital, if any, at NAV.
‡ Total return assumes the reinvestment of all distributions, including returns of capital, if any, at market price.
Looking for additional information?
The Fund’s daily NAV is availableon-line at www.leggmason.com/etf. The Fund is traded under the symbol “WBND” and its closing market price is available on most financial websites. In a continuing effort to provide information concerning the Fund, shareholders may call1-877-721-1926 (toll free), Monday through Friday from 8:00 a.m. to 5:30 p.m. Eastern time, for the Fund’s current NAV, market price and other information.
As always, thank you for your confidence in our stewardship of your assets.
Sincerely,
Jane Trust, CFA
President and Chief Executive Officer
July 26, 2019
RISKS: The Fund is newly organized, with a limited history of operations. Fixed-income securities involve interest rate, credit, inflation and reinvestment risks. As interest rates rise, the value of fixed-income securities falls. High-yield securities include greater price volatility, illiquidity and possibility of default. International investments are subject to special risks, including currency fluctuations, social, economic and political uncertainties, which could increase volatility. These risks are magnified in emerging markets. Derivatives, such as options and futures, can be illiquid, may disproportionately increase losses, and have a potentially
| ||
| IV | Western Asset Total Return ETF |
large impact on fund performance. The use of leverage may increase volatility and possibility of loss. Asset-backed, mortgage-backed or mortgage-related securities are subject to prepayment and extension risks. Active management and diversification do not ensure gains or protect against market declines. Please see the Fund’s prospectus for a more complete discussion of these and other risks and the Fund’s investment strategies.
All investments are subject to risk including the possible loss of principal. Past performance is no guarantee of future results. All index performance reflects no deduction for fees, expenses or taxes. Please note that an investor cannot invest directly in an index.
| ||
| Western Asset Total Return ETF | V |
Investment breakdown(%) as a percent of total investments
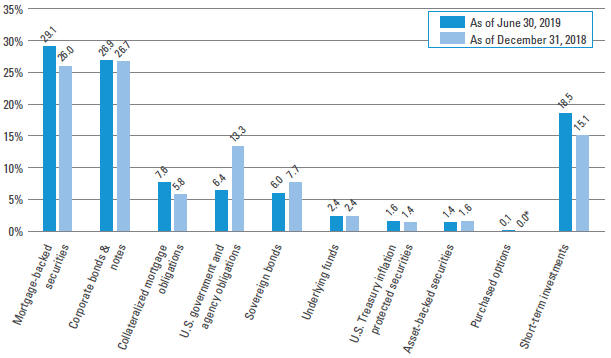
| † | The bar graph above represents the composition of the Fund’s investments as of June 30, 2019 and December 31, 2018 and does not include derivatives such as written options, futures contracts, forward foreign currency contracts and swap contracts. The composition of the Fund’s investments is subject to change at any time. |
| * | Represents less than 0.1% |
| ||
| Western Asset Total Return ETF 2019 Semi-Annual Report | 1 |
Example
As a shareholder of the Fund, you may incur two types of costs: (1) transaction costs, such as brokerage commissions paid on purchases and sales of Fund shares; and (2) ongoing costs, management fees; and other Fund expenses. This example is intended to help you understand your ongoing costs (in dollars) of investing in the Fund and to compare these costs with the ongoing costs of investing in other funds.
This example is based on an investment of $1,000 invested on January 1, 2019 and held for the six months ended June 30, 2019.
Actual expenses
The table below titled “Based on Actual Total Return” provides information about actual account values and actual expenses. You may use the information provided in this table, together with the amount you invested, to estimate the expenses that you paid over the period. To estimate the expenses you paid on your account, divide your ending account value by $1,000 (for example, an $8,600 ending account value divided by $1,000 = 8.6), then multiply the result by the number under the heading entitled “Expenses Paid During the Period”.
Hypothetical example for comparison purposes
The table below titled “Based on Hypothetical Total Return” provides information about hypothetical account values and hypothetical expenses based on the actual expense ratio and an assumed rate of return of 5.00% per year before expenses, which is not the Fund’s actual return. The hypothetical account values and expenses may not be used to estimate the actual ending account balance or expenses you paid for the period. You may use the information provided in this table to compare the ongoing costs of investing in the Fund and other funds. To do so, compare the 5.00% hypothetical example relating to the Fund with the 5.00% hypothetical examples that appear in the shareholder reports of the other funds.
Please note that the expenses shown in the table below are meant to highlight your ongoing costs only and do not reflect any transactional costs, such as brokerage commissions paid on purchases and sales of Fund shares. Therefore, the table is useful in comparing ongoing costs only, and will not help you determine the relative total costs of owning different funds. In addition, if these transaction costs were included, your costs would have been higher.
| Based on actual total return1 | Based on hypothetical total return1 | |||||||||||||||||||||||||||||||||||||||||
| Actual Total Return2 | Beginning Account Value | Ending Account Value | Annualized Expense Ratio | Expenses Paid During the Period3 | Hypothetical Annualized Total Return | Beginning Account Value | Ending Account Value | Annualized Expense Ratio | Expenses Paid During the Period3 | |||||||||||||||||||||||||||||||||
| 8.85 | % | $ | 1,000.00 | $ | 1,088.50 | 0.45 | % | $ | 2.33 | 5.00 | % | $ | 1,000.00 | $ | 1,022.56 | 0.45 | % | $ | 2.26 | |||||||||||||||||||||||
| 1 | For the six months ended June 30, 2019 |
| 2 | Assumes the reinvestment of all distributions, including returns of capital, if any, at net asset value. Total return is not annualized, as it may not be representative of the total return for the year. Performance figures may reflect fee waivers and/or expense reimbursements. In the absence of fee waivers and/or expense reimbursements, the total return would have been lower. Past performance is no guarantee of future results. |
| 3 | Expenses (net of fee waivers and/or expense reimbursements) are equal to the Fund’s annualized expense ratio multiplied by the average account value over the period, multiplied by the number of days in the most recent fiscal half-year (181), then divided by 365. |
| ||
| 2 | Western Asset Total Return ETF 2019 Semi-Annual Report |
Economic exposure —June 30, 2019
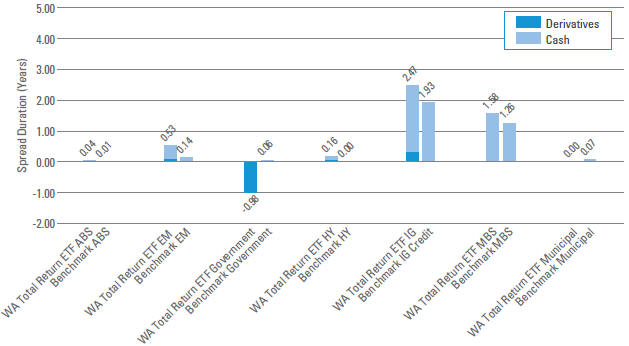
Spread duration measures the sensitivity to changes in spreads. The spread over Treasuries is the annual risk-premium demanded by investors to holdnon-Treasury securities. Spread duration is quantified as the % change in price resulting from a 100 basis points change in spreads. For a security with positive spread duration, an increase in spreads would result in a price decline and a decline in spreads would result in a price increase. This chart highlights the market sector exposure of the Fund’s sectors relative to the selected benchmark sectors as of the end of the reporting period.
| ABS | — Asset-Backed Securities | |
| Benchmark | — Bloomberg Barclays U.S. Aggregate Index | |
| EM | — Emerging Markets | |
| HY | — High Yield | |
| IG Credit | — Investment Grade Credit | |
| MBS | — Mortgage-Backed Securities | |
| WA | — Western Asset | |
| ||
| Western Asset Total Return ETF 2019 Semi-Annual Report | 3 |
Interest rate exposure —June 30, 2019
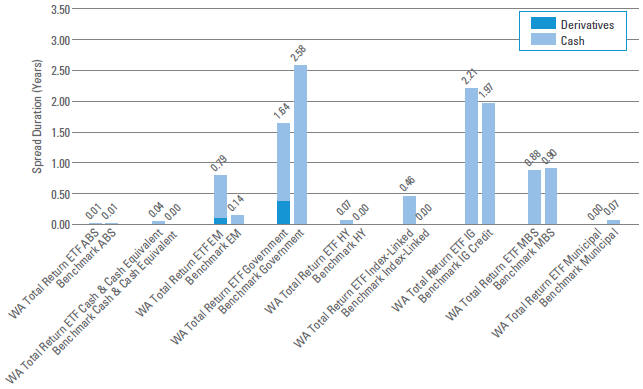
Effective duration measures the sensitivity to changes in relevant interest rates. Effective duration is quantified as the % change in price resulting from a 100 basis points change in interest rates. For a security with positive effective duration, an increase in interest rates would result in a price decline and a decline in interest rates would result in a price increase. This chart highlights the interest rate exposure of the Fund’s sectors relative to the selected benchmark sectors as of the end of the reporting period.
| ABS | — Asset-Backed Securities | |||
| Benchmark | — Bloomberg Barclays U.S. Aggregate Index | |||
| EM | — Emerging Markets | |||
| HY | — High Yield | |||
| IG Credit | — Investment Grade Credit | |||
| MBS | — Mortgage-Backed Securities | |||
| WA | — Western Asset | |||
| ||
| 4 | Western Asset Total Return ETF 2019 Semi-Annual Report |
Schedule of investments(unaudited)
June 30, 2019
Western Asset Total Return ETF
| Security | Rate | Maturity Date | Face Amount† | Value | ||||||||||||
| Mortgage-Backed Securities — 33.3% | ||||||||||||||||
FHLMC — 3.6% | ||||||||||||||||
Federal Home Loan Mortgage Corp. (FHLMC) | 3.500 | % | 9/1/47 | 86,653 | $ | 89,131 | ||||||||||
Federal Home Loan Mortgage Corp. (FHLMC) | 4.000 | % | 9/1/48-11/1/48 | 547,547 | 566,649 | |||||||||||
Federal Home Loan Mortgage Corp. (FHLMC) Gold | 3.000 | % | 10/1/46-5/1/47 | 237,209 | 241,954 | |||||||||||
Federal Home Loan Mortgage Corp. (FHLMC) Gold | 5.000 | % | 11/1/48-1/1/49 | 265,770 | 281,879 | |||||||||||
Total FHLMC | 1,179,613 | |||||||||||||||
FNMA — 18.6% | ||||||||||||||||
Federal National Mortgage Association (FNMA) | 3.525 | % | 2/1/29 | 170,000 | 183,594 | |||||||||||
Federal National Mortgage Association (FNMA) | 3.160 | % | 5/1/29 | 9,990 | 10,507 | |||||||||||
Federal National Mortgage Association (FNMA) | 3.240 | % | 5/1/29 | 10,000 | 10,569 | |||||||||||
Federal National Mortgage Association (FNMA) | 3.260 | % | 5/1/29 | 19,986 | 21,183 | |||||||||||
Federal National Mortgage Association (FNMA) | 2.500 | % | 7/15/34 | 100,000 | 100,701 | (a) | ||||||||||
Federal National Mortgage Association (FNMA) | 3.000 | % | 7/15/34-7/1/49 | 1,300,000 | 1,315,545 | (a) | ||||||||||
Federal National Mortgage Association (FNMA) | 3.500 | % | 7/15/34-7/1/49 | 1,000,000 | 1,027,287 | (a) | ||||||||||
Federal National Mortgage Association (FNMA) | 3.000 | % | 11/1/46-4/1/47 | 247,304 | 251,009 | |||||||||||
Federal National Mortgage Association (FNMA) | 3.500 | % | 2/1/47- 6/1/49 | 1,167,014 | 1,201,192 | |||||||||||
Federal National Mortgage Association (FNMA) | 4.000 | % | 11/1/48 | 572,531 | 593,920 | |||||||||||
Federal National Mortgage Association (FNMA) | 5.000 | % | 11/1/48 | 263,934 | 279,902 | |||||||||||
Federal National Mortgage Association (FNMA) | 4.500 | % | 7/1/49 | 400,000 | 417,980 | (a) | ||||||||||
Federal National Mortgage Association (FNMA) | 5.000 | % | 7/1/49 | 100,000 | 105,705 | (a) | ||||||||||
Federal National Mortgage Association (FNMA) | 4.000 | % | 7/15/49 | 500,000 | 516,768 | (a) | ||||||||||
Total FNMA | 6,035,862 | |||||||||||||||
GNMA — 11.1% | ||||||||||||||||
Government National Mortgage Association (GNMA) | 3.000 | % | 10/15/42 | 117,576 | 120,353 | |||||||||||
Government National Mortgage Association (GNMA) II | 3.000 | % | 3/20/47-12/20/47 | 558,316 | 571,334 | |||||||||||
Government National Mortgage Association (GNMA) II | 5.000 | % | 12/20/48-1/20/49 | 195,538 | 204,486 | |||||||||||
Government National Mortgage Association (GNMA) II | 4.500 | % | 1/20/49 | 490,647 | 513,305 | |||||||||||
Government National Mortgage Association (GNMA) II | 4.000 | % | 7/15/49 | 300,000 | 310,992 | (a) | ||||||||||
See Notes to Financial Statements.
| ||
| Western Asset Total Return ETF 2019 Semi-Annual Report | 5 |
Schedule of investments(unaudited) (cont’d)
June 30, 2019
Western Asset Total Return ETF
| Security | Rate | Maturity Date | Face Amount† | Value | ||||||||||||
GNMA — continued | ||||||||||||||||
Government National Mortgage Association (GNMA) II | 5.000 | % | 7/15/49 | 100,000 | $ | 104,533 | (a) | |||||||||
Government National Mortgage Association (GNMA) II | 3.000 | % | 7/20/49 | 200,000 | 204,383 | (a) | ||||||||||
Government National Mortgage Association (GNMA) II | 3.500 | % | 7/20/49 | 1,000,000 | 1,033,008 | (a) | ||||||||||
Government National Mortgage Association (GNMA) II | 4.500 | % | 7/20/49 | 500,000 | 521,167 | (a) | ||||||||||
Total GNMA | 3,583,561 | |||||||||||||||
Total Mortgage-Backed Securities (Cost — $10,637,766) | 10,799,036 | |||||||||||||||
| Corporate Bonds & Notes — 30.8% | ||||||||||||||||
| Communication Services — 2.8% | ||||||||||||||||
Diversified Telecommunication Services — 0.9% | ||||||||||||||||
AT&T Inc., Senior Notes | 3.400 | % | 5/15/25 | 50,000 | 51,400 | |||||||||||
AT&T Inc., Senior Notes | 4.350 | % | 6/15/45 | 70,000 | 69,977 | |||||||||||
Verizon Communications Inc., Senior Notes | 3.376 | % | 2/15/25 | 20,000 | 20,876 | |||||||||||
Verizon Communications Inc., Senior Notes | 4.329 | % | 9/21/28 | 90,000 | 99,738 | |||||||||||
Verizon Communications Inc., Senior Notes | 3.875 | % | 2/8/29 | 30,000 | 32,179 | |||||||||||
Verizon Communications Inc., Senior Notes | 5.250 | % | 3/16/37 | 30,000 | 35,884 | |||||||||||
Total Diversified Telecommunication Services | 310,054 | |||||||||||||||
Entertainment — 0.0% | ||||||||||||||||
Netflix Inc., Senior Notes | 5.375 | % | 2/1/21 | 10,000 | 10,338 | |||||||||||
Media — 1.7% | ||||||||||||||||
CCO Holdings LLC/CCO Holdings Capital Corp., Senior Notes | 5.125 | % | 5/1/27 | 10,000 | 10,353 | (b) | ||||||||||
Charter Communications Operating LLC/Charter Communications Operating Capital Corp., Senior Secured Notes | 4.200 | % | 3/15/28 | 50,000 | 51,939 | |||||||||||
Charter Communications Operating LLC/Charter Communications Operating Capital Corp., Senior Secured Notes | 5.050 | % | 3/30/29 | 40,000 | 44,186 | |||||||||||
Charter Communications Operating LLC/Charter Communications Operating Capital Corp., Senior Secured Notes | 5.750 | % | 4/1/48 | 80,000 | 88,482 | |||||||||||
Comcast Corp., Senior Notes | 4.150 | % | 10/15/28 | 120,000 | 132,258 | |||||||||||
Comcast Corp., Senior Notes | 4.700 | % | 10/15/48 | 60,000 | 70,273 | |||||||||||
DISH DBS Corp., Senior Notes | 5.875 | % | 11/15/24 | 40,000 | 37,850 | |||||||||||
Fox Corp., Senior Notes | 4.030 | % | 1/25/24 | 10,000 | 10,636 | (b) | ||||||||||
See Notes to Financial Statements.
| ||
| 6 | Western Asset Total Return ETF 2019 Semi-Annual Report |
Western Asset Total Return ETF
| Security | Rate | Maturity Date | Face Amount† | Value | ||||||||||||
Media — continued | ||||||||||||||||
Fox Corp., Senior Notes | 5.476 | % | 1/25/39 | 40,000 | $ | 47,202 | (b) | |||||||||
NBCUniversal Media LLC, Senior Notes | 4.375 | % | 4/1/21 | 50,000 | 51,851 | |||||||||||
Total Media | 545,030 | |||||||||||||||
Wireless Telecommunication Services — 0.2% | ||||||||||||||||
Vodafone Group PLC, Senior Notes | 4.375 | % | 5/30/28 | 30,000 | 32,429 | |||||||||||
Vodafone Group PLC, Senior Notes | 5.250 | % | 5/30/48 | 20,000 | 22,078 | |||||||||||
Total Wireless Telecommunication Services | 54,507 | |||||||||||||||
Total Communication Services | 919,929 | |||||||||||||||
| Consumer Discretionary — 1.8% | ||||||||||||||||
Automobiles — 0.2% | ||||||||||||||||
General Motors Co., Senior Notes | 5.950 | % | 4/1/49 | 10,000 | 10,477 | |||||||||||
General Motors Financial Co. Inc., Senior Notes | 3.450 | % | 4/10/22 | 50,000 | 50,709 | |||||||||||
Total Automobiles | 61,186 | |||||||||||||||
Diversified Consumer Services — 0.1% | ||||||||||||||||
Prime Security Services Borrower LLC/Prime Finance Inc., Senior Secured Notes | 5.250 | % | 4/15/24 | 30,000 | 30,525 | (b) | ||||||||||
Hotels, Restaurants & Leisure — 1.2% | ||||||||||||||||
1011778 BC ULC/New Red Finance Inc., Senior Secured Notes | 4.250 | % | 5/15/24 | 30,000 | 30,337 | (b) | ||||||||||
Hilton Worldwide Finance LLC/Hilton Worldwide Finance Corp., Senior Notes | 4.875 | % | 4/1/27 | 20,000 | 20,669 | |||||||||||
McDonald’s Corp., Senior Notes | 3.800 | % | 4/1/28 | 80,000 | 85,900 | |||||||||||
Sands China Ltd., Senior Notes | 5.125 | % | 8/8/25 | 200,000 | 214,384 | |||||||||||
VOC Escrow Ltd., Senior Secured Notes | 5.000 | % | 2/15/28 | 40,000 | 40,550 | (b) | ||||||||||
Total Hotels, Restaurants & Leisure | 391,840 | |||||||||||||||
Household Durables — 0.1% | ||||||||||||||||
Lennar Corp., Senior Notes | 4.500 | % | 4/30/24 | 40,000 | 42,050 | |||||||||||
Internet & Direct Marketing Retail — 0.2% | ||||||||||||||||
Amazon.com Inc., Senior Notes | 4.050 | % | 8/22/47 | 40,000 | 45,417 | |||||||||||
Total Consumer Discretionary | 571,018 | |||||||||||||||
| Consumer Staples — 2.4% | ||||||||||||||||
Beverages — 0.9% | ||||||||||||||||
Anheuser-Busch InBev Worldwide Inc., Senior Notes | 4.150 | % | 1/23/25 | 10,000 | 10,832 | |||||||||||
Anheuser-Busch InBev Worldwide Inc., Senior Notes | 4.000 | % | 4/13/28 | 50,000 | 54,003 | |||||||||||
Anheuser-Busch InBev Worldwide Inc., Senior Notes | 4.750 | % | 1/23/29 | 60,000 | 68,112 | |||||||||||
Anheuser-Busch InBev Worldwide Inc., Senior Notes | 4.439 | % | 10/6/48 | 50,000 | 52,255 | |||||||||||
See Notes to Financial Statements.
| ||
| Western Asset Total Return ETF 2019 Semi-Annual Report | 7 |
Schedule of investments(unaudited) (cont’d)
June 30, 2019
Western Asset Total Return ETF
| Security | Rate | Maturity Date | Face Amount† | Value | ||||||||||||
Beverages — continued | ||||||||||||||||
Anheuser-Busch InBev Worldwide Inc., Senior Notes | 5.550 | % | 1/23/49 | 40,000 | $ | 49,020 | ||||||||||
Diageo Investment Corp., Senior Notes | 2.875 | % | 5/11/22 | 50,000 | 50,904 | |||||||||||
Total Beverages | 285,126 | |||||||||||||||
Food & Staples Retailing — 0.2% | ||||||||||||||||
Walmart Inc., Senior Notes | 3.050 | % | 7/8/26 | 10,000 | 10,476 | |||||||||||
Walmart Inc., Senior Notes | 3.700 | % | 6/26/28 | 60,000 | 65,475 | |||||||||||
Total Food & Staples Retailing | 75,951 | |||||||||||||||
Food Products — 0.1% | ||||||||||||||||
Mars Inc., Senior Notes | 2.700 | % | 4/1/25 | 20,000 | 20,407 | (b) | ||||||||||
Tobacco — 1.2% | ||||||||||||||||
Altria Group Inc., Senior Notes | 3.490 | % | 2/14/22 | 10,000 | 10,284 | |||||||||||
Altria Group Inc., Senior Notes | 3.800 | % | 2/14/24 | 10,000 | 10,424 | |||||||||||
Altria Group Inc., Senior Notes | 4.400 | % | 2/14/26 | 60,000 | 64,203 | |||||||||||
Altria Group Inc., Senior Notes | 4.800 | % | 2/14/29 | 50,000 | 53,790 | |||||||||||
Altria Group Inc., Senior Notes | 5.800 | % | 2/14/39 | 10,000 | 11,236 | |||||||||||
Altria Group Inc., Senior Notes | 5.375 | % | 1/31/44 | 10,000 | 10,725 | |||||||||||
Altria Group Inc., Senior Notes | 5.950 | % | 2/14/49 | 40,000 | 45,656 | |||||||||||
Altria Group Inc., Senior Notes | 6.200 | % | 2/14/59 | 10,000 | 11,397 | |||||||||||
BAT Capital Corp., Senior Notes | 3.557 | % | 8/15/27 | 20,000 | 19,895 | |||||||||||
BAT Capital Corp., Senior Notes | 4.540 | % | 8/15/47 | 50,000 | 46,374 | |||||||||||
Philip Morris International Inc., Senior Notes | 2.500 | % | 11/2/22 | 100,000 | 100,408 | |||||||||||
Total Tobacco | 384,392 | |||||||||||||||
Total Consumer Staples | 765,876 | |||||||||||||||
| Energy — 5.9% | ||||||||||||||||
Energy Equipment & Services — 0.2% | ||||||||||||||||
Halliburton Co., Senior Notes | 3.800 | % | 11/15/25 | 50,000 | 52,427 | |||||||||||
Oil, Gas & Consumable Fuels — 5.7% | ||||||||||||||||
Anadarko Petroleum Corp., Senior Notes | 4.850 | % | 3/15/21 | 40,000 | 41,407 | |||||||||||
Anadarko Petroleum Corp., Senior Notes | 6.600 | % | 3/15/46 | 90,000 | 117,202 | |||||||||||
Apache Corp., Senior Notes | 4.250 | % | 1/15/44 | 60,000 | 54,278 | |||||||||||
Blue Racer Midstream LLC/Blue Racer Finance Corp., Senior Notes | 6.125 | % | 11/15/22 | 10,000 | 10,137 | (b) | ||||||||||
BP Capital Markets America Inc., Senior Notes | 3.410 | % | 2/11/26 | 20,000 | 20,960 | |||||||||||
BP Capital Markets PLC, Senior Notes | 3.506 | % | 3/17/25 | 50,000 | 52,598 | |||||||||||
Cimarex Energy Co., Senior Notes | 3.900 | % | 5/15/27 | 60,000 | 61,658 | |||||||||||
Concho Resources Inc., Senior Notes | 4.375 | % | 1/15/25 | 80,000 | 83,167 | |||||||||||
Continental Resources Inc., Senior Notes | 4.500 | % | 4/15/23 | 50,000 | 52,534 | |||||||||||
Continental Resources Inc., Senior Notes | 3.800 | % | 6/1/24 | 30,000 | 30,846 | |||||||||||
See Notes to Financial Statements.
| ||
| 8 | Western Asset Total Return ETF 2019 Semi-Annual Report |
Western Asset Total Return ETF
| Security | Rate | Maturity Date | Face Amount† | Value | ||||||||||||
Oil, Gas & Consumable Fuels — continued | ||||||||||||||||
Devon Energy Corp., Senior Notes | 5.850 | % | 12/15/25 | 70,000 | $ | 82,931 | ||||||||||
Devon Energy Corp., Senior Notes | 5.000 | % | 6/15/45 | 30,000 | 34,417 | |||||||||||
Ecopetrol SA, Senior Notes | 5.875 | % | 5/28/45 | 100,000 | 110,590 | |||||||||||
Energy Transfer Operating LP, Senior Notes | 4.500 | % | 4/15/24 | 30,000 | 31,924 | |||||||||||
Energy Transfer Operating LP, Senior Notes | 5.250 | % | 4/15/29 | 10,000 | 11,173 | |||||||||||
Enterprise Products Operating LLC, Senior Notes | 4.150 | % | 10/16/28 | 40,000 | 43,539 | |||||||||||
Exxon Mobil Corp., Senior Notes | 3.043 | % | 3/1/26 | 50,000 | 51,820 | |||||||||||
Kinder Morgan Energy Partners LP, Senior Notes | 3.950 | % | 9/1/22 | 50,000 | 52,053 | |||||||||||
MEG Energy Corp., Senior Notes | 6.375 | % | 1/30/23 | 30,000 | 28,575 | (b) | ||||||||||
MPLX LP, Senior Notes | 4.875 | % | 6/1/25 | 40,000 | 43,473 | |||||||||||
MPLX LP, Senior Notes | 4.800 | % | 2/15/29 | 60,000 | 66,084 | |||||||||||
MPLX LP, Senior Notes | 4.700 | % | 4/15/48 | 30,000 | 30,721 | |||||||||||
MPLX LP, Senior Notes | 5.500 | % | 2/15/49 | 10,000 | 11,358 | |||||||||||
Noble Energy Inc., Senior Notes | 3.850 | % | 1/15/28 | 50,000 | 50,985 | |||||||||||
Occidental Petroleum Corp., Senior Notes | 3.125 | % | 2/15/22 | 50,000 | 50,774 | |||||||||||
Occidental Petroleum Corp., Senior Notes | 4.200 | % | 3/15/48 | 50,000 | 50,533 | |||||||||||
Petrobras Global Finance BV, Senior Notes | 5.750 | % | 2/1/29 | 200,000 | 208,480 | |||||||||||
Petroleos Mexicanos, Senior Notes | 6.625 | % | 6/15/35 | 40,000 | 36,950 | |||||||||||
Range Resources Corp., Senior Notes | 4.875 | % | 5/15/25 | 40,000 | 35,100 | |||||||||||
Schlumberger Holdings Corp., Senior Notes | 3.900 | % | 5/17/28 | 40,000 | 41,625 | (b) | ||||||||||
Shell International Finance BV, Senior Notes | 4.000 | % | 5/10/46 | 50,000 | 55,030 | |||||||||||
Targa Resources Partners LP/Targa Resources | ||||||||||||||||
Partners Finance Corp., Senior Notes | 6.875 | % | 1/15/29 | 40,000 | 44,348 | (b) | ||||||||||
Transcontinental Gas Pipe Line Co. LLC, Senior Notes | 7.850 | % | 2/1/26 | 60,000 | 76,608 | |||||||||||
Whiting Petroleum Corp., Senior Notes | 5.750 | % | 3/15/21 | 10,000 | 10,075 | |||||||||||
Williams Cos. Inc., Senior Notes | 7.750 | % | 6/15/31 | 50,000 | 65,923 | |||||||||||
Total Oil, Gas & Consumable Fuels | 1,849,876 | |||||||||||||||
Total Energy | 1,902,303 | |||||||||||||||
| Financials — 9.5% | ||||||||||||||||
Banks — 7.5% | ||||||||||||||||
Banco Santander SA, Senior Notes | 3.848 | % | 4/12/23 | 200,000 | 207,620 | |||||||||||
Bank of America Corp., Senior Notes | 5.000 | % | 1/21/44 | 70,000 | 85,323 | |||||||||||
Bank of America Corp., Senior Notes (3.004% to 12/20/22 then 3 mo. USD LIBOR + 0.790%) | 3.004 | % | 12/20/23 | 100,000 | 101,835 | (c) | ||||||||||
Bank of America Corp., Senior Notes (3.970% to 3/5/28 then 3 mo. USD LIBOR + 1.070%) | 3.970 | % | 3/5/29 | 190,000 | 203,074 | (c) | ||||||||||
Bank of America Corp., Senior Notes (4.330% to 3/15/49 then 3 mo. USD LIBOR + 1.520%) | 4.330 | % | 3/15/50 | 40,000 | 44,594 | (c) | ||||||||||
See Notes to Financial Statements.
| ||
| Western Asset Total Return ETF 2019 Semi-Annual Report | 9 |
Schedule of investments(unaudited) (cont’d)
June 30, 2019
Western Asset Total Return ETF
| Security | Rate | Maturity Date | Face Amount† | Value | ||||||||||||
Banks — continued | ||||||||||||||||
BNP Paribas SA, Senior Notes (4.705% to 1/10/24 then 3 mo. USD LIBOR + 2.235%) | 4.705 | % | 1/10/25 | 200,000 | $ | 214,586 | (b)(c) | |||||||||
Citigroup Inc., Senior Notes | 8.125 | % | 7/15/39 | 30,000 | 47,989 | |||||||||||
Citigroup Inc., Senior Notes | 4.650 | % | 7/23/48 | 80,000 | 93,081 | |||||||||||
Citigroup Inc., Senior Notes (3.980% to 3/20/29 then 3 mo. USD LIBOR + 1.338%) | 3.980 | % | 3/20/30 | 30,000 | 32,042 | (c) | ||||||||||
Citigroup Inc., Senior Notes (4.075% to 4/23/28 then 3 mo. USD LIBOR + 1.192%) | 4.075 | % | 4/23/29 | 50,000 | 53,713 | (c) | ||||||||||
Citigroup Inc., Subordinated Notes | 5.500 | % | 9/13/25 | 70,000 | 79,288 | |||||||||||
Citigroup Inc., Subordinated Notes | 4.450 | % | 9/29/27 | 50,000 | 53,870 | |||||||||||
Fifth Third Bancorp, Senior Notes | 3.650 | % | 1/25/24 | 10,000 | 10,508 | |||||||||||
HSBC Holdings PLC, Senior Notes (4.583% to 6/19/28 then 3 mo. USD LIBOR + 1.535%) | 4.583 | % | 6/19/29 | 200,000 | 218,732 | (c) | ||||||||||
JPMorgan Chase & Co., Senior Notes (4.023% to 12/5/23 then 3 mo. USD LIBOR + 1.000%) | 4.023 | % | 12/5/24 | 40,000 | 42,512 | (c) | ||||||||||
JPMorgan Chase & Co., Senior Notes (4.203% to 7/23/28 then 3 mo. USD LIBOR + 1.260%) | 4.203 | % | 7/23/29 | 100,000 | 109,336 | (c) | ||||||||||
JPMorgan Chase & Co., Senior Notes (4.452% to 12/5/28 then 3 mo. USD LIBOR + 1.330%) | 4.452 | % | 12/5/29 | 30,000 | 33,451 | (c) | ||||||||||
JPMorgan Chase & Co., Subordinated Notes | 4.125 | % | 12/15/26 | 50,000 | 53,478 | |||||||||||
JPMorgan Chase & Co., Subordinated Notes | 4.950 | % | 6/1/45 | 70,000 | 83,119 | |||||||||||
Lloyds Banking Group PLC, Senior Notes | 4.375 | % | 3/22/28 | 200,000 | 212,489 | |||||||||||
Royal Bank of Canada, Senior Notes | 3.200 | % | 4/30/21 | 50,000 | 50,888 | |||||||||||
Toronto-Dominion Bank, Senior Notes | 3.250 | % | 6/11/21 | 50,000 | 50,991 | |||||||||||
Wells Fargo & Co., Senior Notes | 3.750 | % | 1/24/24 | 10,000 | 10,514 | |||||||||||
Wells Fargo & Co., Senior Notes | 4.150 | % | 1/24/29 | 40,000 | 43,575 | |||||||||||
Wells Fargo & Co., Senior Notes (3.584% to 5/22/27 then 3 mo. USD LIBOR + 1.310%) | 3.584 | % | 5/22/28 | 100,000 | 104,407 | (c) | ||||||||||
Wells Fargo & Co., Subordinated Notes | 4.300 | % | 7/22/27 | 50,000 | 54,017 | |||||||||||
Wells Fargo & Co., Subordinated Notes | 4.750 | % | 12/7/46 | 110,000 | 125,387 | |||||||||||
Total Banks | 2,420,419 | |||||||||||||||
Capital Markets — 1.5% | ||||||||||||||||
Goldman Sachs Group Inc., Senior Notes | 3.200 | % | 2/23/23 | 10,000 | 10,234 | |||||||||||
Goldman Sachs Group Inc., Senior Notes (2.876% to 10/31/21 then 3 mo. USD LIBOR + 0.821%) | 2.876 | % | 10/31/22 | 80,000 | 80,662 | (c) | ||||||||||
Goldman Sachs Group Inc., Senior Notes (3.814% to 4/23/28 then 3 mo. USD LIBOR + 1.158%) | 3.814 | % | 4/23/29 | 170,000 | 177,678 | (c) | ||||||||||
See Notes to Financial Statements.
| ||
| 10 | Western Asset Total Return ETF 2019 Semi-Annual Report |
Western Asset Total Return ETF
| Security | Rate | Maturity Date | Face Amount† | Value | ||||||||||||
Capital Markets — continued | ||||||||||||||||
Goldman Sachs Group Inc., Senior Notes (4.223% to 5/1/28 then 3 mo. USD LIBOR + 1.301%) | 4.223 | % | 5/1/29 | 10,000 | $ | 10,725 | (c) | |||||||||
Goldman Sachs Group Inc., Subordinated Notes | 5.150 | % | 5/22/45 | 120,000 | 137,347 | |||||||||||
Morgan Stanley, Senior Notes (3.772% to 1/24/28 then 3 mo. USD LIBOR + 1.140%) | 3.772 | % | 1/24/29 | 80,000 | 83,931 | (c) | ||||||||||
Total Capital Markets | 500,577 | |||||||||||||||
Consumer Finance — 0.2% | ||||||||||||||||
American Express Credit Corp., Senior Notes | 2.375 | % | 5/26/20 | 50,000 | 50,021 | |||||||||||
Diversified Financial Services — 0.1% | ||||||||||||||||
DAE Funding LLC, Senior Notes | 5.750 | % | 11/15/23 | 30,000 | 31,500 | (b) | ||||||||||
Park Aerospace Holdings Ltd., Senior Notes | 5.250 | % | 8/15/22 | 10,000 | 10,558 | (b) | ||||||||||
Total Diversified Financial Services | 42,058 | |||||||||||||||
Insurance — 0.2% | ||||||||||||||||
American International Group Inc., Senior Notes | 3.750 | % | 7/10/25 | 50,000 | 52,347 | |||||||||||
Berkshire Hathaway Finance Corp., Senior Notes | 4.250 | % | 1/15/49 | 20,000 | 22,512 | |||||||||||
Total Insurance | 74,859 | |||||||||||||||
Total Financials | 3,087,934 | |||||||||||||||
| Health Care — 3.5% | ||||||||||||||||
Biotechnology — 0.3% | ||||||||||||||||
Celgene Corp., Senior Notes | 3.875 | % | 8/15/25 | 30,000 | 32,144 | |||||||||||
Celgene Corp., Senior Notes | 5.000 | % | 8/15/45 | 20,000 | 23,736 | |||||||||||
Gilead Sciences Inc., Senior Notes | 4.150 | % | 3/1/47 | 30,000 | 31,368 | |||||||||||
Total Biotechnology | 87,248 | |||||||||||||||
Health Care Equipment & Supplies — 0.3% | ||||||||||||||||
Abbott Laboratories, Senior Notes | 3.750 | % | 11/30/26 | 50,000 | 54,060 | |||||||||||
Becton Dickinson and Co., Senior Notes | 3.363 | % | 6/6/24 | 60,000 | 61,796 | |||||||||||
Total Health Care Equipment & Supplies | 115,856 | |||||||||||||||
Health Care Providers & Services — 2.3% | ||||||||||||||||
Anthem Inc., Senior Notes | 3.650 | % | 12/1/27 | 70,000 | 72,767 | |||||||||||
Centene Corp., Senior Notes | 4.750 | % | 1/15/25 | 20,000 | 20,644 | |||||||||||
Cigna Corp., Senior Notes | 4.125 | % | 11/15/25 | 20,000 | 21,299 | (b) | ||||||||||
Cigna Corp., Senior Notes | 4.375 | % | 10/15/28 | 100,000 | 107,887 | (b) | ||||||||||
CVS Health Corp., Senior Notes | 3.350 | % | 3/9/21 | 50,000 | 50,695 | |||||||||||
CVS Health Corp., Senior Notes | 4.300 | % | 3/25/28 | 160,000 | 168,716 | |||||||||||
CVS Health Corp., Senior Notes | 5.050 | % | 3/25/48 | 60,000 | 63,907 | |||||||||||
DaVita Inc., Senior Notes | 5.000 | % | 5/1/25 | 30,000 | 29,618 | |||||||||||
HCA Inc., Senior Secured Notes | 5.250 | % | 6/15/26 | 40,000 | 44,288 | |||||||||||
Humana Inc., Senior Notes | 3.950 | % | 3/15/27 | 60,000 | 62,556 | |||||||||||
See Notes to Financial Statements.
| ||
| Western Asset Total Return ETF 2019 Semi-Annual Report | 11 |
Schedule of investments(unaudited) (cont’d)
June 30, 2019
Western Asset Total Return ETF
| Security | Rate | Maturity Date | Face Amount† | Value | ||||||||||||
Health Care Providers & Services — continued | ||||||||||||||||
Medtronic Global Holdings SCA, Senior Notes | 3.350 | % | 4/1/27 | 50,000 | $ | 53,133 | ||||||||||
UnitedHealth Group Inc., Senior Notes | 3.875 | % | 12/15/28 | 10,000 | 10,909 | |||||||||||
UnitedHealth Group Inc., Senior Notes | 5.700 | % | 10/15/40 | 30,000 | 38,541 | |||||||||||
Total Health Care Providers & Services | 744,960 | |||||||||||||||
Pharmaceuticals — 0.6% | ||||||||||||||||
Allergan Funding SCS, Senior Notes | 4.750 | % | 3/15/45 | 10,000 | 10,272 | |||||||||||
Bristol-Myers Squibb Co., Senior Notes | 2.600 | % | 5/16/22 | 20,000 | 20,254 | (b) | ||||||||||
Bristol-Myers Squibb Co., Senior Notes | 2.900 | % | 7/26/24 | 30,000 | 30,703 | (b) | ||||||||||
Bristol-Myers Squibb Co., Senior Notes | 3.200 | % | 6/15/26 | 20,000 | 20,780 | (b) | ||||||||||
Bristol-Myers Squibb Co., Senior Notes | 3.400 | % | 7/26/29 | 10,000 | 10,469 | (b) | ||||||||||
Johnson & Johnson, Senior Notes | 3.625 | % | 3/3/37 | 30,000 | 32,080 | |||||||||||
Teva Pharmaceutical Finance Co. BV, Senior Notes | 3.650 | % | 11/10/21 | 40,000 | 38,500 | |||||||||||
Teva Pharmaceutical Finance Netherlands III BV, Senior Notes | 2.200 | % | 7/21/21 | 20,000 | 18,975 | |||||||||||
Total Pharmaceuticals | 182,033 | |||||||||||||||
Total Health Care | 1,130,097 | |||||||||||||||
| Industrials — 1.7% | ||||||||||||||||
Aerospace & Defense — 0.5% | ||||||||||||||||
Boeing Co., Senior Notes | 3.200 | % | 3/1/29 | 40,000 | 41,416 | |||||||||||
Lockheed Martin Corp., Senior Notes | 3.550 | % | 1/15/26 | 50,000 | 53,140 | |||||||||||
Northrop Grumman Corp., Senior Notes | 3.250 | % | 1/15/28 | 50,000 | 51,327 | |||||||||||
United Technologies Corp., Senior Notes | 4.125 | % | 11/16/28 | 30,000 | 32,958 | |||||||||||
Total Aerospace & Defense | 178,841 | |||||||||||||||
Air Freight & Logistics — 0.0% | ||||||||||||||||
XPO Logistics Inc., Senior Notes | 6.500 | % | 6/15/22 | 10,000 | 10,200 | (b) | ||||||||||
Commercial Services & Supplies — 0.3% | ||||||||||||||||
Cintas Corp. No 2, Senior Notes | 2.900 | % | 4/1/22 | 50,000 | 50,850 | |||||||||||
United Rentals North America Inc., Senior Notes | 4.875 | % | 1/15/28 | 20,000 | 20,400 | |||||||||||
Waste Management Inc., Senior Notes | 3.200 | % | 6/15/26 | 10,000 | 10,403 | |||||||||||
Waste Management Inc., Senior Notes | 3.450 | % | 6/15/29 | 10,000 | 10,541 | |||||||||||
Waste Management Inc., Senior Notes | 4.000 | % | 7/15/39 | 10,000 | 10,714 | |||||||||||
Waste Management Inc., Senior Notes | 4.150 | % | 7/15/49 | 10,000 | 10,922 | |||||||||||
Total Commercial Services & Supplies | 113,830 | |||||||||||||||
Electrical Equipment — 0.2% | ||||||||||||||||
Eaton Corp., Senior Notes | 2.750 | % | 11/2/22 | 50,000 | 50,660 | |||||||||||
See Notes to Financial Statements.
| ||
| 12 | Western Asset Total Return ETF 2019 Semi-Annual Report |
Western Asset Total Return ETF
| Security | Rate | Maturity Date | Face Amount† | Value | ||||||||||||
Industrial Conglomerates — 0.5% | ||||||||||||||||
General Electric Co., Senior Notes | 6.750 | % | 3/15/32 | 40,000 | $ | 49,283 | ||||||||||
General Electric Co., Senior Notes | 6.875 | % | 1/10/39 | 80,000 | 100,308 | |||||||||||
Total Industrial Conglomerates | 149,591 | |||||||||||||||
Road & Rail — 0.2% | ||||||||||||||||
Union Pacific Corp., Senior Notes | 4.500 | % | 9/10/48 | 50,000 | 56,891 | |||||||||||
Total Industrials | 560,013 | |||||||||||||||
| Information Technology — 1.2% | ||||||||||||||||
IT Services — 0.2% | ||||||||||||||||
Visa Inc., Senior Notes | 3.150 | % | 12/14/25 | 50,000 | 52,454 | |||||||||||
Software — 0.9% | ||||||||||||||||
Microsoft Corp., Senior Notes | 2.400 | % | 2/6/22 | 20,000 | 20,210 | |||||||||||
Microsoft Corp., Senior Notes | 3.300 | % | 2/6/27 | 200,000 | 212,516 | |||||||||||
salesforce.com Inc., Senior Notes | 3.250 | % | 4/11/23 | 50,000 | 51,894 | |||||||||||
Total Software | 284,620 | |||||||||||||||
Technology Hardware, Storage & Peripherals — 0.1% | ||||||||||||||||
Apple Inc., Senior Notes | 2.450 | % | 8/4/26 | 50,000 | 49,830 | |||||||||||
Total Information Technology | 386,904 | |||||||||||||||
| Materials — 1.3% | ||||||||||||||||
Metals & Mining — 1.3% | ||||||||||||||||
ArcelorMittal, Senior Notes | 6.250 | % | 2/25/22 | 50,000 | 54,245 | |||||||||||
ArcelorMittal, Senior Notes | 4.550 | % | 3/11/26 | 40,000 | 42,280 | |||||||||||
Barrick North America Finance LLC, Senior Notes | 5.750 | % | 5/1/43 | 50,000 | 62,476 | |||||||||||
BHP Billiton Finance USA Ltd., Senior Notes | 5.000 | % | 9/30/43 | 30,000 | 37,584 | |||||||||||
Freeport-McMoRan Inc., Senior Notes | 4.000 | % | 11/14/21 | 10,000 | 10,187 | |||||||||||
Freeport-McMoRan Inc., Senior Notes | 6.875 | % | 2/15/23 | 40,000 | 42,100 | |||||||||||
Freeport-McMoRan Inc., Senior Notes | 5.450 | % | 3/15/43 | 45,000 | 41,175 | |||||||||||
Glencore Funding LLC, Senior Notes | 4.125 | % | 3/12/24 | 40,000 | 41,529 | (b) | ||||||||||
Glencore Funding LLC, Senior Notes | 4.000 | % | 3/27/27 | 50,000 | 50,489 | (b) | ||||||||||
Glencore Funding LLC, Senior Notes | 3.875 | % | 10/27/27 | 30,000 | 29,923 | (b) | ||||||||||
Total Metals & Mining | 411,988 | |||||||||||||||
Paper & Forest Products — 0.0% | ||||||||||||||||
Resolute Forest Products Inc., Senior Notes | 5.875 | % | 5/15/23 | 10,000 | 10,050 | |||||||||||
Total Materials | 422,038 | |||||||||||||||
| Utilities — 0.7% | ||||||||||||||||
Electric Utilities — 0.7% | ||||||||||||||||
Duke Energy Ohio Inc. | 3.650 | % | 2/1/29 | 20,000 | 21,470 | |||||||||||
See Notes to Financial Statements.
| ||
| Western Asset Total Return ETF 2019 Semi-Annual Report | 13 |
Schedule of investments(unaudited) (cont’d)
June 30, 2019
Western Asset Total Return ETF
| Security | Rate | Maturity Date | Face Amount† | Value | ||||||||||||
Electric Utilities — continued | ||||||||||||||||
FirstEnergy Corp., Senior Notes | 4.250 | % | 3/15/23 | 40,000 | $ | 42,022 | ||||||||||
FirstEnergy Corp., Senior Notes | 7.375 | % | 11/15/31 | 120,000 | 164,069 | |||||||||||
Total Utilities | 227,561 | |||||||||||||||
Total Corporate Bonds & Notes (Cost — $9,306,226) |
| 9,973,673 | ||||||||||||||
| Collateralized Mortgage Obligations(d)— 8.7% | ||||||||||||||||
Alternative Loan Trust,2005-81 A1 (1 mo. USD LIBOR + 0.280%) | 2.684 | % | 2/25/37 | 240,194 | 221,245 | (c) | ||||||||||
BX Commercial Mortgage Trust,2018-IND G (1 mo. USD LIBOR + 2.050%) | 4.444 | % | 11/15/35 | 154,303 | 154,883 | (b)(c) | ||||||||||
Federal Home Loan Mortgage Corp. (FHLMC) Multifamily Structured Pass-Through Certificates, K091 A2 | 3.505 | % | 3/25/29 | 30,000 | 32,521 | |||||||||||
Federal Home Loan Mortgage Corp. (FHLMC) | ||||||||||||||||
Structured Agency Credit Risk Debt Notes, 2017- DNA1 M2 (1 mo. USD LIBOR + 3.250%) | 5.654 | % | 7/25/29 | 250,000 | 264,240 | (c) | ||||||||||
Federal National Mortgage Association (FNMA) — CAS,2015-C03 1M2 (1 mo. USD LIBOR + 5.000%) | 7.404 | % | 7/25/25 | 82,980 | 90,784 | (b)(c) | ||||||||||
Federal National Mortgage Association (FNMA) — CAS,2017-C05 1M2 (1 mo. USD LIBOR + 2.200%) | 4.604 | % | 1/25/30 | 125,000 | 126,189 | (b)(c) | ||||||||||
Federal National Mortgage Association (FNMA) — CAS,2017-C07 1M2 (1 mo. USD LIBOR + 2.400%) | 4.804 | % | 5/28/30 | 500,000 | 508,134 | (b)(c) | ||||||||||
Federal National Mortgage Association (FNMA) — CAS,2018-C03 1M1 (1 mo. USD LIBOR + 0.680%) | 3.084 | % | 10/25/30 | 90,124 | 90,145 | (b)(c) | ||||||||||
Federal National Mortgage Association (FNMA) ACES,2019-M1 A2 | 3.673 | % | 9/25/28 | 100,000 | 108,348 | (c) | ||||||||||
Federal National Mortgage Association (FNMA) ACES,2019-M4 A2 | 3.610 | % | 2/25/31 | 10,000 | 10,842 | |||||||||||
Federal National Mortgage Association (FNMA) ACES,2019-M5 A2 | 3.273 | % | 1/25/29 | 30,000 | 31,583 | |||||||||||
Federal National Mortgage Association (FNMA) ACES,2019-M6 A2 | 3.450 | % | 1/1/29 | 20,000 | 21,365 | |||||||||||
Motel 6 Trust, 2017-MTL6 C (1 mo. USD LIBOR + 1.400%) | 3.794 | % | 8/15/34 | 616,507 | 616,695 | (b)(c) | ||||||||||
Wells Fargo Commercial Mortgage Trust, 2018- C44 A5 | 4.212 | % | 5/15/51 | 500,000 | 555,952 | |||||||||||
Total Collateralized Mortgage Obligations (Cost — $2,796,797) |
| 2,832,926 | ||||||||||||||
See Notes to Financial Statements.
| ||
| 14 | Western Asset Total Return ETF 2019 Semi-Annual Report |
Western Asset Total Return ETF
| Security | Rate | Maturity Date | Face Amount† | Value | ||||||||||||
| U.S. Government & Agency Obligations — 7.3% | ||||||||||||||||
U.S. Government Obligations — 7.3% | ||||||||||||||||
U.S. Treasury Bonds | 3.375 | % | 5/15/44 | 240,000 | $ | 278,888 | ||||||||||
U.S. Treasury Bonds | 3.000 | % | 5/15/45 | 730,000 | 798,295 | |||||||||||
U.S. Treasury Bonds | 3.000 | % | 2/15/48 | 210,000 | 230,057 | |||||||||||
U.S. Treasury Bonds | 3.125 | % | 5/15/48 | 350,000 | 392,738 | |||||||||||
U.S. Treasury Bonds | 3.000 | % | 8/15/48 | 290,000 | 318,048 | |||||||||||
U.S. Treasury Notes | 2.250 | % | 3/31/21 | 20,000 | 20,155 | |||||||||||
U.S. Treasury Notes | 1.750 | % | 6/30/24 | 340,000 | 339,854 | |||||||||||
Total U.S. Government & Agency Obligations (Cost — $2,124,354) |
| 2,378,035 | ||||||||||||||
| Sovereign Bonds — 6.9% | ||||||||||||||||
Argentina — 0.4% | ||||||||||||||||
Argentina POM Politica Monetaria, Bonds (Argentina Central Bank 7 Day Repo Reference Rate) | 63.705 | % | 6/21/20 | 750,000 | ARS | 17,320 | (c) | |||||||||
Argentine Republic Government International Bond, Senior Notes | 4.625 | % | 1/11/23 | 150,000 | 120,002 | |||||||||||
Total Argentina | 137,322 | |||||||||||||||
Brazil — 1.7% | ||||||||||||||||
Brazil Notas do Tesouro Nacional Serie F, Notes | 10.000 | % | 1/1/21 | 1,050,000 | BRL | 288,934 | ||||||||||
Brazilian Government International Bond, Senior Notes | 5.000 | % | 1/27/45 | 250,000 | 247,127 | |||||||||||
Total Brazil | 536,061 | |||||||||||||||
Indonesia — 0.6% | ||||||||||||||||
Indonesia Government International Bond, Senior Notes | 4.350 | % | 1/11/48 | 200,000 | 206,582 | |||||||||||
Kuwait — 0.7% | ||||||||||||||||
Kuwait International Government Bond, Senior Notes | 3.500 | % | 3/20/27 | 200,000 | 212,890 | (b) | ||||||||||
Mexico — 2.1% | ||||||||||||||||
Mexican Bonos, Bonds | 6.500 | % | 6/9/22 | 4,660,000 | MXN | 236,296 | ||||||||||
Mexican Bonos, Bonds | 8.000 | % | 11/7/47 | 2,550,000 | MXN | 134,921 | ||||||||||
Mexican Bonos, Senior Notes | 7.750 | % | 11/13/42 | 4,750,000 | MXN | 245,181 | ||||||||||
Mexico Government International Bond, Senior Notes | 4.750 | % | 3/8/44 | 60,000 | 62,625 | |||||||||||
Total Mexico | 679,023 | |||||||||||||||
Russia — 1.4% | ||||||||||||||||
Russian Federal Bond — OFZ | 7.050 | % | 1/19/28 | 20,000,000 | RUB | 312,859 | ||||||||||
See Notes to Financial Statements.
| ||
| Western Asset Total Return ETF 2019 Semi-Annual Report | 15 |
Schedule of investments(unaudited) (cont’d)
June 30, 2019
Western Asset Total Return ETF
| Security | Rate | Maturity Date | Face Amount† | Value | ||||||||||||
Russia — continued | ||||||||||||||||
Russian Federal Bond — OFZ | 6.900 | % | 5/23/29 | 3,290,000 | RUB | $ | 50,779 | |||||||||
Russian Federal Bond — OFZ | 7.650 | % | 4/10/30 | 6,220,000 | RUB | 100,931 | ||||||||||
Total Russia | 464,569 | |||||||||||||||
Total Sovereign Bonds (Cost — $2,091,285) | 2,236,447 | |||||||||||||||
| Shares | ||||||||||||||||
| Investments in Underlying Funds — 2.7% | ||||||||||||||||
Invesco Senior Loan ETF (Cost — $898,378) | 38,806 | 879,344 | ||||||||||||||
| Rate | Maturity Date | Face Amount† | ||||||||||||||
| U.S. Treasury Inflation Protected Securities — 1.9% |
| |||||||||||||||
U.S. Treasury Bonds, Inflation Indexed | 0.750 | % | 2/15/42 | 110,000 | 124,841 | |||||||||||
U.S. Treasury Bonds, Inflation Indexed | 1.375 | % | 2/15/44 | 90,000 | 111,967 | |||||||||||
U.S. Treasury Bonds, Inflation Indexed | 1.000 | % | 2/15/46 | 60,000 | 67,786 | |||||||||||
U.S. Treasury Bonds, Inflation Indexed | 1.000 | % | 2/15/49 | 290,000 | 311,446 | |||||||||||
Total U.S. Treasury Inflation Protected Securities (Cost — $581,470) |
| 616,040 | ||||||||||||||
| Asset-Backed Securities — 1.6% | ||||||||||||||||
Argent Securities Inc. Pass-Through Certificates,2004-W7 M1 (1 mo. USD LIBOR + 0.825%) | 3.229 | % | 5/25/34 | 76,476 | 76,625 | (c) | ||||||||||
Hertz Vehicle Financing II LP,2018-1A A | 3.290 | % | 2/25/24 | 125,000 | 127,177 | (b) | ||||||||||
RASC Series Trust, 2005-KS12 M1 (1 mo. USD LIBOR + 0.440%) | 2.844 | % | 1/25/36 | 152,569 | 152,819 | (c) | ||||||||||
SLM Student Loan Trust,2006-10 A6 (3 mo. USD LIBOR + 0.150%) | 2.730 | % | 3/25/44 | 125,000 | 120,634 | (c) | ||||||||||
United States Small Business Administration,2019-20D 1 | 2.980 | % | 4/1/39 | 30,000 | 30,992 | |||||||||||
Total Asset-Backed Securities (Cost — $501,188) |
| 508,247 | ||||||||||||||
| Expiration Date | Contracts | Notional Amount† | ||||||||||||||
| Purchased Options — 0.1% | ||||||||||||||||
| Exchange-Traded Purchased Options — 0.0% | ||||||||||||||||
Euro-Bund Futures, Call @ 178.00EUR | 7/26/19 | 30 | 3,000,000 | 683 | ||||||||||||
U.S. Treasury2-Year Notes, Put @ $105.50 | 7/26/19 | 11 | 22,000 | 0 | (e) | |||||||||||
U.S. Treasury5-Year Notes, Put @ $117.50 | 7/12/19 | 20 | 20,000 | 2,031 | ||||||||||||
U.S. Treasury5-Year Notes, Put @ $112.50 | 7/26/19 | 25 | 25,000 | 0 | (e) | |||||||||||
U.S. Treasury5-Year Notes, Put @ $113.75 | 7/26/19 | 15 | 15,000 | 117 | ||||||||||||
U.S. Treasury5-Year Notes, Put @ $114.25 | 7/26/19 | 15 | 15,000 | 117 | ||||||||||||
U.S. Treasury5-Year Notes, Put @ $114.50 | 7/26/19 | 15 | 15,000 | 117 | ||||||||||||
See Notes to Financial Statements.
| ||
| 16 | Western Asset Total Return ETF 2019 Semi-Annual Report |
Western Asset Total Return ETF
| Security | Expiration Date | Contracts | Notional Amount† | Value | ||||||||||||||||
| Exchange-Traded Purchased Options — continued |
| |||||||||||||||||||
U.S. Treasury10-Year Notes, Call @ $128.50 |
| 7/26/19 | 12 | 12,000 | $ | 4,875 | ||||||||||||||
U.S. Treasury10-Year Notes, Call @ $134.50 |
| 7/26/19 | 16 | 16,000 | 0 | (e) | ||||||||||||||
U.S. Treasury10-Year Notes, Call @ $135.50 |
| 7/26/19 | 25 | 25,000 | 0 | (e) | ||||||||||||||
U.S. Treasury10-Year Notes, Put @ $127.00 |
| 7/12/19 | 10 | 10,000 | 1,563 | |||||||||||||||
U.S. Treasury10-Year Notes, Put @ $126.00 |
| 7/26/19 | 12 | 12,000 | 938 | |||||||||||||||
U.S. Treasury Long-Term Bonds, Put @ $135.00 |
| 7/26/19 | 7 | 7,000 | 0 | (e) | ||||||||||||||
U.S. Treasury Long-Term Bonds, Put @ $135.50 |
| 7/26/19 | 7 | 7,000 | 0 | (e) | ||||||||||||||
U.S. Treasury Long-Term Bonds, Put @ $134.00 |
| 8/23/19 | 4 | 4,000 | 125 | |||||||||||||||
U.S. Treasury Long-Term Bonds, Put @ $135.00 |
| 8/23/19 | 4 | 4,000 | 125 | |||||||||||||||
Total Exchange-Traded Purchased Options |
| 10,691 | ||||||||||||||||||
| Counterparty | ||||||||||||||||||||
| OTC Purchased Options — 0.1% |
| |||||||||||||||||||
Credit default swaption with Bank of America N.A. to sell protection on Markit CDX- .NA.HY.32 Index, Call @ $106.50 | Bank of America N.A. | 9/18/19 | 336,000 | 336,000 | 2,873 | |||||||||||||||
Credit default swaption with Bank of America N.A. to sell protection on Markit CDX.N-A.IG.32 Index, Call @ 67.50bps | Bank of America N.A. | 9/18/19 | 630,000 | 630,000 | 3,534 | |||||||||||||||
Credit default swaption with Goldman Sachs Group Inc. to sell protection on Markit CDX.N-A.IG.32 Index, Call @ 67.50bps | Goldman Sachs Group Inc. | 9/18/19 | 680,000 | 680,000 | 3,815 | |||||||||||||||
U.S. Dollar/Chinese Offshore Yuan, Call @ 6.94CNH | BNP Paribas SA | 8/30/19 | 160,000 | 160,000 | 936 | |||||||||||||||
U.S. Dollar/Euro, Put @ $1.14 | Citibank N.A. | 7/3/19 | 260,000 | 260,000 | 412 | |||||||||||||||
U.S. Dollar/Euro, Put @ $1.13 | BNP Paribas SA | 7/24/19 | 510,000 | 510,000 | 6,546 | |||||||||||||||
Total OTC Purchased Options | �� | 18,116 | ||||||||||||||||||
Total Purchased Options (Cost — $31,627) |
| 28,807 | ||||||||||||||||||
Total Investments before Short-Term Investments (Cost — $28,969,091) |
| 30,252,555 | ||||||||||||||||||
| Rate | Maturity Date | Face Amount† | ||||||||||||||||||
| Short-Term Investments — 21.2% | ||||||||||||||||||||
| U.S. Treasury Bills — 19.5% | ||||||||||||||||||||
U.S. Treasury Bills | 2.083% | 8/6/19 | 1,700,000 | 1,696,451 | (f) | |||||||||||||||
U.S. Treasury Bills | 2.116% | 9/5/19 | 800,000 | 796,931 | (f) | |||||||||||||||
See Notes to Financial Statements.
| ||
| Western Asset Total Return ETF 2019 Semi-Annual Report | 17 |
Schedule of investments(unaudited) (cont’d)
June 30, 2019
Western Asset Total Return ETF
| Security | Rate | Maturity Date | Face Amount† | Value | ||||||||||||
| U.S. Treasury Bills — continued | ||||||||||||||||
U.S. Treasury Bills | 2.107 | % | 9/26/19 | 2,000,000 | $ | 1,989,971 | (f) | |||||||||
U.S. Treasury Bills | 2.085 | % | 10/17/19 | 800,000 | 795,086 | (f) | ||||||||||
U.S. Treasury Bills | 2.062 | % | 10/31/19 | 1,050,000 | 1,042,803 | (f) | ||||||||||
Total U.S. Treasury Bills (Cost — $6,318,093) | 6,321,242 | |||||||||||||||
| Shares | ||||||||||||||||
| Overnight Deposits — 1.7% | ||||||||||||||||
BNY Mellon Cash Reserve Fund (Cost — $544,920) | 0.850 | % | 544,920 | 544,920 | ||||||||||||
Total Short-Term Investments (Cost — $6,863,013) | 6,866,162 | |||||||||||||||
Total Investments — 114.5% (Cost — $35,832,104) | 37,118,717 | |||||||||||||||
Liabilities in Excess of Other Assets — (14.5)% | (4,701,534 | ) | ||||||||||||||
Total Net Assets — 100.0% | $ | 32,417,183 | ||||||||||||||
| † | Face amount/notional amount denominated in U.S. dollars, unless otherwise noted. |
| (a) | This security is traded on ato-be-announced (“TBA”) basis. At June 30, 2019, the Fund held TBA securities with a total cost of $5,639,715. |
| (b) | Security is exempt from registration under Rule 144A of the Securities Act of 1933. This security may be resold in transactions that are exempt from registration, normally to qualified institutional buyers. This security has been deemed liquid pursuant to guidelines approved by the Board of Trustees. |
| (c) | Variable rate security. Interest rate disclosed is as of the most recent information available. Certain variable rate securities are not based on a published reference rate and spread but are determined by the issuer or agent and are based on current market conditions. These securities do not indicate a reference rate and spread in their description above. |
| (d) | Collateralized mortgage obligations are secured by an underlying pool of mortgages or mortgage pass-through certificates that are structured to direct payments on underlying collateral to different series or classes of the obligations. The interest rate may change positively or inversely in relation to one or more interest rates, financial indices or other financial indicators and may be subject to an upper and/or lower limit. |
| (e) | Value is less than $1. |
| (f) | Rate shown representsyield-to-maturity. |
��
See Notes to Financial Statements.
| ||
| 18 | Western Asset Total Return ETF 2019 Semi-Annual Report |
Western Asset Total Return ETF
Abbreviations used in this schedule: | ||
| ACES | — Alternative Credit Enhancement Securities | |
| ARS | — Argentine Peso | |
| bps | — basis point spread (100 basis points = 1.00%) | |
| BRL | — Brazilian Real | |
| CAS | — Connecticut Avenue Securities | |
| CNH | — Chinese Offshore Yuan | |
| ETF | — Exchange-Traded Fund | |
| EUR | — Euro | |
| LIBOR | — London Interbank Offered Rate | |
| MXN | — Mexican Peso | |
| RUB | — Russian Ruble | |
| USD | — United States Dollar | |
| Schedule of Written Options | ||||||||||||||||||||||||
| Exchange-Traded Written Options | ||||||||||||||||||||||||
| Security | Expiration Date | Strike Price | Contracts | Notional Amount† | Value | |||||||||||||||||||
| U.S. Treasury5-Year Notes, Put |
| 7/26/19 | $ | 116.00 | 19 | 19,000 | $ | (297) | ||||||||||||||||
| U.S. Treasury5-Year Notes, Put |
| 8/23/19 | 114.75 | 44 | 44,000 | (1,031) | ||||||||||||||||||
| U.S. Treasury10-Year Notes, Call |
| 7/26/19 | 129.00 | 2 | 2,000 | (531) | ||||||||||||||||||
| U.S. Treasury10-Year Notes, Call |
| 8/23/19 | 129.00 | 5 | 5,000 | (2,422) | ||||||||||||||||||
| U.S. Treasury10-Year Notes, Call |
| 8/23/19 | 130.00 | 12 | 12,000 | (3,188) | ||||||||||||||||||
| U.S. Treasury10-Year Notes, Put |
| 7/26/19 | 124.50 | 14 | 14,000 | (219) | ||||||||||||||||||
| U.S. Treasury10-Year Notes, Put |
| 8/23/19 | 122.50 | 40 | 40,000 | (1,875) | ||||||||||||||||||
| U.S. Treasury10-Year Notes, Put |
| 8/23/19 | 126.50 | 14 | 14,000 | (4,375) | ||||||||||||||||||
| U.S. Treasury10-Year Notes, Put |
| 8/23/19 | 127.00 | 9 | 9,000 | (4,078) | ||||||||||||||||||
| U.S. Treasury Long-Term Bonds, Put |
| 7/26/19 | 149.00 | 8 | 8,000 | (500) | ||||||||||||||||||
| Total Exchange-Traded Written Options (Premiums received — $53,391) |
| $ | (18,516) | |||||||||||||||||||||
| OTC Written Options | ||||||||||||||||||||||||
| Counterparty | ||||||||||||||||||||||||
| Credit default swaption with Bank of America N.A. to sell protection on Markit CDX.NA.HY.32 Index, Put | Bank of America N.A. | 9/18/19 | $ | 100.38 | 320,000 | 320,000 | ‡ | $ | (454) | |||||||||||||||
| Credit default swaption with Bank of America N.A. to sell protection on Markit CDX.NA.HY.32 Index, Put | Bank of America N.A. | 9/18/19 | 101.50 | 336,000 | 336,000 | ‡ | (640) | |||||||||||||||||
| Credit default swaption with Bank of America N.A. to sell protection on Markit CDX.NA.IG.32 Index, Put | Bank of America N.A. | 9/18/19 | 95.00 | bps | 630,000 | 630,000 | ‡ | (190) | ||||||||||||||||
See Notes to Financial Statements.
| ||
| Western Asset Total Return ETF 2019 Semi-Annual Report | 19 |
Schedule of investments(unaudited) (cont’d)
June 30, 2019
Western Asset Total Return ETF
| Schedule of Written Options (cont’d) | ||||||||||||||||||||||
| Security | Counterparty | Expiration Date | Strike Price | Contracts | Notional Amount† | Value | ||||||||||||||||
| Credit default swaption with Goldman Sachs Group Inc. to sell protection on Markit CDX.NA.IG.32 Index, Put | Goldman Sachs Group Inc. | 9/18/19 | 95.00 | bps | 680,000 | 680,000 | ‡ | $ | (205) | |||||||||||||
| U.S. Dollar/Chinese Offshore Yuan, Call | BNP Paribas SA | 8/30/19 | 7.13 | CNH | 320,000 | 320,000 | (596) | |||||||||||||||
| Total OTC Written Options (Premiums received — $7,221) |
| $ | (2,085) | |||||||||||||||||||
| Total Written Options (Premiums received — $60,612) |
| $ | (20,601) | |||||||||||||||||||
| † | Notional amount denominated in U.S. dollars, unless otherwise noted. |
| ‡ | In the event an option is exercised and a credit event occurs as defined under the terms of the swap agreement, the notional amount is the maximum potential amount that could be required to be paid as a seller of credit protection or received as a buyer of credit protection. |
Abbreviations used in this schedule: | ||
| bps | — basis point spread (100 basis points = 1.00%) | |
| CNH | — Chinese Offshore Yuan | |
At June 30, 2019, the Fund had the following open futures contracts:
| Number of Contracts | Expiration Date | Notional Amount | Market Value | Unrealized Appreciation (Depreciation) | ||||||||||||||||
| Contracts to Buy: | ||||||||||||||||||||
| 90-Day EuroDollar | 39 | 12/19 | $ | 9,472,977 | $ | 9,563,775 | $ | 90,798 | ||||||||||||
| 90-Day EuroDollar | 24 | 6/20 | 5,813,519 | 5,902,800 | 89,281 | |||||||||||||||
| Euro-BTP | 4 | 9/19 | 587,356 | 611,764 | 24,408 | |||||||||||||||
| U.S. Treasury2-Year Notes | 12 | 9/19 | 2,564,789 | 2,582,156 | 17,367 | |||||||||||||||
| U.S. Treasury5-Year Notes | 91 | 9/19 | 10,589,525 | 10,752,218 | 162,693 | |||||||||||||||
| U.S. Treasury Long-Term Bonds | 29 | 9/19 | 4,439,928 | 4,512,219 | 72,291 | |||||||||||||||
| U.S. Treasury Ultra Long-Term Bonds | 15 | 9/19 | 2,560,120 | 2,663,438 | 103,318 | |||||||||||||||
| 560,156 | ||||||||||||||||||||
See Notes to Financial Statements.
| ||
| 20 | Western Asset Total Return ETF 2019 Semi-Annual Report |
Western Asset Total Return ETF
| Number of Contracts | Expiration Date | Notional Amount | Market Value | Unrealized Appreciation (Depreciation) | ||||||||||||||||
| Contracts to Sell: | ||||||||||||||||||||
| 30-Day Federal Funds | 5 | 7/19 | $ | 2,034,215 | $ | 2,034,225 | $ | (10) | ||||||||||||
| 30-Day Federal Funds | 2 | 8/19 | 815,999 | 816,357 | (358) | |||||||||||||||
| 30-Day Federal Funds | 7 | 1/20 | 2,855,861 | 2,868,625 | (12,764) | |||||||||||||||
| Canadian10-Year Bonds | 10 | 9/19 | 1,083,864 | 1,093,782 | (9,918) | |||||||||||||||
| Euro-Bund | 30 | 9/19 | 5,815,410 | 5,901,491 | (86,081) | |||||||||||||||
| Japanese10-Year Bonds | 1 | 9/19 | 1,424,998 | 1,427,975 | (2,977) | |||||||||||||||
| U.S. Treasury10-Year Notes | 33 | 9/19 | 4,168,250 | 4,222,969 | (54,719) | |||||||||||||||
| U.S. Treasury Ultra10-Year Notes | 6 | 9/19 | 814,115 | 828,750 | (14,635) | |||||||||||||||
| (181,462) | ||||||||||||||||||||
| Net unrealized appreciation on open futures contracts |
| $ | 378,694 | |||||||||||||||||
At June 30, 2019, the Fund had the following open forward foreign currency contracts:
| Currency Purchased | Currency Sold | Counterparty | Settlement Date | Unrealized Appreciation (Depreciation) | ||||||||||||||||
| CNY | 2,055,422 | USD | 299,166 | Barclays Bank PLC | 7/17/19 | $ | 104 | |||||||||||||
| USD | 2,218 | CAD | 3,001 | Barclays Bank PLC | 7/17/19 | (79) | ||||||||||||||
| USD | 2,977 | CAD | 4,001 | Barclays Bank PLC | 7/17/19 | (86) | ||||||||||||||
| USD | 5,969 | CAD | 8,001 | Barclays Bank PLC | 7/17/19 | (157) | ||||||||||||||
| USD | 17,915 | CAD | 24,001 | Barclays Bank PLC | 7/17/19 | (459) | ||||||||||||||
| USD | 159,829 | CAD | 211,946 | Barclays Bank PLC | 7/17/19 | (2,432) | ||||||||||||||
| USD | 463,327 | IDR | 6,573,226,415 | Barclays Bank PLC | 7/17/19 | (1,051) | ||||||||||||||
| USD | 312,263 | INR | 21,682,319 | Barclays Bank PLC | 7/17/19 | (1,174) | ||||||||||||||
| USD | 324,415 | MXN | 6,261,603 | Barclays Bank PLC | 7/17/19 | (591) | ||||||||||||||
| USD | 3,707 | CAD | 5,001 | BNP Paribas SA | 7/17/19 | (122) | ||||||||||||||
| USD | 3,712 | JPY | 400,000 | BNP Paribas SA | 7/17/19 | (6) | ||||||||||||||
| AUD | 4,445 | USD | 3,134 | Citibank N.A | 7/17/19 | (13) | ||||||||||||||
| AUD | 44,606 | USD | 31,789 | Citibank N.A | 7/17/19 | (467) | ||||||||||||||
| BRL | 10,000 | USD | 2,563 | Citibank N.A | 7/17/19 | 42 | ||||||||||||||
| BRL | 301,553 | USD | 75,661 | Citibank N.A | 7/17/19 | 2,896 | ||||||||||||||
| BRL | 317,386 | USD | 80,719 | Citibank N.A | 7/17/19 | 1,962 | ||||||||||||||
| BRL | 1,129,316 | USD | 289,390 | Citibank N.A | 7/17/19 | 4,804 | ||||||||||||||
| BRL | 1,430,000 | USD | 366,554 | Citibank N.A | 7/17/19 | 5,970 | ||||||||||||||
| CAD | 176,967 | USD | 132,139 | Citibank N.A | 7/17/19 | 3,342 | ||||||||||||||
| CAD | 1,783,192 | USD | 1,338,453 | Citibank N.A | 7/17/19 | 26,710 | ||||||||||||||
| COP | 28,778,831 | USD | 8,863 | Citibank N.A | 7/17/19 | 99 | ||||||||||||||
| COP | 29,813,635 | USD | 9,205 | Citibank N.A | 7/17/19 | 80 | ||||||||||||||
| COP | 300,350,000 | USD | 94,972 | Citibank N.A | 7/17/19 | (1,441) | ||||||||||||||
See Notes to Financial Statements.
| ||
| Western Asset Total Return ETF 2019 Semi-Annual Report | 21 |
Schedule of investments(unaudited) (cont’d)
June 30, 2019
Western Asset Total Return ETF
| Currency Purchased | Currency Sold | Counterparty | Settlement Date | Unrealized Appreciation (Depreciation) | ||||||||||||||||
| EUR | 7,735 | USD | 8,751 | Citibank N.A | 7/17/19 | $ | 70 | |||||||||||||
| GBP | 23,494 | USD | 30,858 | Citibank N.A | 7/17/19 | (931) | ||||||||||||||
| GBP | 190,000 | USD | 249,818 | Citibank N.A | 7/17/19 | (7,792) | ||||||||||||||
| IDR | 526,741,219 | USD | 36,511 | Citibank N.A | 7/17/19 | 702 | ||||||||||||||
| IDR | 6,058,101,815 | USD | 419,188 | Citibank N.A | 7/17/19 | 8,799 | ||||||||||||||
| INR | 1,738,165 | USD | 24,447 | Citibank N.A | 7/17/19 | 680 | ||||||||||||||
| INR | 7,213,285 | USD | 102,084 | Citibank N.A | 7/17/19 | 2,190 | ||||||||||||||
| INR | 10,930,000 | USD | 155,654 | Citibank N.A | 7/17/19 | 2,349 | ||||||||||||||
| MXN | 828,194 | USD | 42,961 | Citibank N.A | 7/17/19 | 26 | ||||||||||||||
| MXN | 1,068,072 | USD | 55,977 | Citibank N.A | 7/17/19 | (539) | ||||||||||||||
| MXN | 8,648,500 | USD | 443,524 | Citibank N.A | 7/17/19 | 5,373 | ||||||||||||||
| RUB | 565,394 | USD | 8,639 | Citibank N.A | 7/17/19 | 303 | ||||||||||||||
| RUB | 648,790 | USD | 9,928 | Citibank N.A | 7/17/19 | 333 | ||||||||||||||
| RUB | 5,900,000 | USD | 89,387 | Citibank N.A | 7/17/19 | 3,921 | ||||||||||||||
| USD | 284,759 | BRL | 1,106,999 | Citibank N.A | 7/17/19 | (3,622) | ||||||||||||||
| USD | 24,385 | CNY | 164,669 | Citibank N.A | 7/17/19 | 409 | ||||||||||||||
| USD | 255,876 | CNY | 1,720,000 | Citibank N.A | 7/17/19 | 5,443 | ||||||||||||||
| USD | 3,321 | EUR | 2,960 | Citibank N.A | 7/17/19 | (55) | ||||||||||||||
| USD | 22,636 | EUR | 20,000 | Citibank N.A | 7/17/19 | (173) | ||||||||||||||
| USD | 56,113 | EUR | 50,000 | Citibank N.A | 7/17/19 | (910) | ||||||||||||||
| USD | 56,405 | EUR | 50,000 | Citibank N.A | 7/17/19 | (617) | ||||||||||||||
| USD | 141,908 | EUR | 125,490 | Citibank N.A | 7/17/19 | (1,207) | ||||||||||||||
| USD | 39,027 | IDR | 557,690,240 | Citibank N.A | 7/17/19 | (372) | ||||||||||||||
| USD | 1,553 | JPY | 172,146 | Citibank N.A | 7/17/19 | (47) | ||||||||||||||
| USD | 4,664 | JPY | 500,000 | Citibank N.A | 7/17/19 | 17 | ||||||||||||||
| USD | 16,241 | JPY | 1,797,597 | Citibank N.A | 7/17/19 | (466) | ||||||||||||||
| USD | 19,770 | PHP | 1,039,282 | Citibank N.A | 7/17/19 | (501) | ||||||||||||||
| ZAR | 68,812 | USD | 4,724 | Citibank N.A | 7/17/19 | 146 | ||||||||||||||
| ZAR | 71,604 | USD | 4,938 | Citibank N.A | 7/17/19 | 129 | ||||||||||||||
| USD | 3,733 | CAD | 5,001 | Goldman Sachs Group Inc. | 7/17/19 | (95) | ||||||||||||||
| USD | 14,463 | RUB | 914,285 | Goldman Sachs Group Inc. | 7/17/19 | 4 | ||||||||||||||
| USD | 19,550 | RUB | 1,234,296 | Goldman Sachs Group Inc. | 7/17/19 | 30 | ||||||||||||||
| USD | 31,353 | RUB | 1,983,919 | Goldman Sachs Group Inc. | 7/17/19 | (22) | ||||||||||||||
| ZAR | 720,000 | USD | 50,262 | Goldman Sachs Group Inc. | 7/17/19 | 687 | ||||||||||||||
| ARS | 660,000 | USD | 13,298 | JPMorgan Chase & Co. | 7/17/19 | 1,882 | ||||||||||||||
| AUD | 4,267 | USD | 2,997 | JPMorgan Chase & Co. | 7/17/19 | (1) | ||||||||||||||
| BRL | 580,000 | USD | 148,636 | JPMorgan Chase & Co. | 7/17/19 | 2,458 | ||||||||||||||
| CAD | 170,761 | USD | 126,870 | JPMorgan Chase & Co. | 7/17/19 | 3,860 | ||||||||||||||
| GBP | 18,276 | USD | 23,664 | JPMorgan Chase & Co. | 7/17/19 | (384) | ||||||||||||||
See Notes to Financial Statements.
| ||
| 22 | Western Asset Total Return ETF 2019 Semi-Annual Report |
Western Asset Total Return ETF
| Currency Purchased | Currency Sold | Counterparty | Settlement Date | Unrealized Appreciation (Depreciation) | ||||||||||||||||
| IDR | 546,073,621 | USD | 37,975 | JPMorgan Chase & Co. | 7/17/19 | $ | 604 | |||||||||||||
| INR | 1,800,869 | USD | 25,584 | JPMorgan Chase & Co. | 7/17/19 | 449 | ||||||||||||||
| PHP | 12,966,316 | USD | 252,952 | JPMorgan Chase & Co. | 7/17/19 | (51) | ||||||||||||||
| USD | 3,718 | CAD | 5,001 | JPMorgan Chase & Co. | 7/17/19 | (110) | ||||||||||||||
| USD | 25,387 | CNY | 170,753 | JPMorgan Chase & Co. | 7/17/19 | 525 | ||||||||||||||
| USD | 20,700 | PHP | 1,077,034 | JPMorgan Chase & Co. | 7/17/19 | (307) | ||||||||||||||
| USD | 203,527 | PHP | 10,850,000 | JPMorgan Chase & Co. | 7/17/19 | (8,097) | ||||||||||||||
| USD | 87,743 | RUB | 5,540,010 | JPMorgan Chase & Co. | 7/17/19 | 129 | ||||||||||||||
| USD | 259,387 | EUR | 230,000 | BNP Paribas SA | 7/26/19 | (3,117) | ||||||||||||||
| CNH | 164,028 | USD | 23,652 | BNP Paribas SA | 9/3/19 | 205 | ||||||||||||||
| USD | 23,656 | CNH | 164,028 | Citibank N.A | 9/3/19 | (201) | ||||||||||||||
| IDR | 6,573,226,415 | USD | 457,714 | Barclays Bank PLC | 10/17/19 | 1,827 | ||||||||||||||
| INR | 21,682,319 | USD | 308,491 | Barclays Bank PLC | 10/17/19 | 1,260 | ||||||||||||||
| USD | 298,333 | CNY | 2,055,422 | Barclays Bank PLC | 10/17/19 | (921) | ||||||||||||||
| USD | 251,773 | PHP | 12,966,316 | JPMorgan Chase & Co. | 10/17/19 | 9 | ||||||||||||||
| ARS | 549,900 | USD | 9,506 | BNP Paribas SA | 11/4/19 | 1,347 | ||||||||||||||
| Total |
| $ | 53,559 | |||||||||||||||||
Abbreviations used in this table: | ||
| ARS | — Argentine Peso | |
| AUD | — Australian Dollar | |
| BRL | — Brazilian Real | |
| CAD | — Canadian Dollar | |
| CNH | — Chinese Offshore Yuan | |
| CNY | — Chinese Yuan Renminbi | |
| COP | — Colombian Peso | |
| EUR | — Euro | |
| GBP | — British Pound | |
| IDR | — Indonesian Rupiah | |
| INR | — Indian Rupee | |
| JPY | — Japanese Yen | |
| MXN | — Mexican Peso | |
| PHP | — Philippine Peso | |
| RUB | — Russian Ruble | |
| USD | — United States Dollar | |
| ZAR | — South African Rand | |
See Notes to Financial Statements.
| ||
| Western Asset Total Return ETF 2019 Semi-Annual Report | 23 |
Schedule of investments(unaudited) (cont’d)
June 30, 2019
Western Asset Total Return ETF
At June 30, 2019, the Fund had the following open swap contracts:
| CENTRALLY CLEARED INTEREST RATE SWAPS | ||||||||||||||||||||||
| Notional Amount* | Termination Date | Payments Made by the Fund† | Payments Received by the Fund† | Upfront Premiums Paid (Received) | Unrealized Appreciation (Depreciation) | |||||||||||||||||
| 30,500,000 | MXN | 4/5/21 | 28-Day TIIE-Banxico every 28 days | 7.351% every 28 days | $ | (18,581 | ) | $ | 11,947 | |||||||||||||
| 256,000 | GBP | 10/26/21 | 1.271% semi-annually | 6-Month GBP LIBOR semi-annually | 96 | (2,935 | ) | |||||||||||||||
| 1,257,000 | GBP | 10/30/21 | 1.385% annually | 3-Month GBP LIBOR annually | (452 | ) | (9,325 | ) | ||||||||||||||
| 1,479,000 | 4/26/22 | 3-Month LIBOR quarterly | 2.250% semi-annually | 321 | 8,895 | |||||||||||||||||
| 1,506,000 | 4/26/23 | 2.300% semi-annually | 3-Month LIBOR quarterly | 97 | (8,643 | ) | ||||||||||||||||
| 1,250,000 | 12/31/25 | 2.250% semi-annually | 3-Month LIBOR quarterly | 8,941 | (42,299 | ) | ||||||||||||||||
| 1,456,000 | 1/31/26 | 2.500% semi-annually | 3-Month LIBOR quarterly | (19,270 | ) | (42,512 | ) | |||||||||||||||
| 250,000 | 4/30/26 | 1.850% semi-annually | 3-Month LIBOR quarterly | 399 | (1,048 | ) | ||||||||||||||||
| 890,000 | 4/30/26 | 1.550% annually | U.S. Daily Federal Funds Intraday Effective Rate annually | 1,092 | (111 | ) | ||||||||||||||||
| 524,000 | 2/15/36 | 3-Month LIBOR quarterly | 3.000% semi-annually | 292 | 63,475 | |||||||||||||||||
| 740,000 | 5/15/44 | 2.875% semi-annually | 3-Month LIBOR quarterly | 1,259 | (97,083 | ) | ||||||||||||||||
| 296,000 | 5/15/44 | 3.000% semi-annually | 3-Month LIBOR quarterly | 224 | (45,874 | ) | ||||||||||||||||
| 508,000 | 8/15/44 | 2.750% semi-annually | 3-Month LIBOR quarterly | (526 | ) | (53,076 | ) | |||||||||||||||
| Total | $ | (26,108 | ) | $ | (218,589 | ) | ||||||||||||||||
| OTC INTEREST RATE SWAPS | ||||||||||||||||||||||
| Swap Counterparty | Notional Amount | Termination Date | Payments Made by the Fund† | Payments Received by the Fund† | Upfront Premiums Paid (Received) | Unrealized Appreciation | ||||||||||||||||
| Citibank N.A. | 3,450,000 | BRL | 1/2/20 | BRL-CDI ** | 8.410 | % ** | $ | 2,704 | $ | 23,146 | ||||||||||||
See Notes to Financial Statements.
| ||
| 24 | Western Asset Total Return ETF 2019 Semi-Annual Report |
Western Asset Total Return ETF
| CENTRALLY CLEARED CREDIT DEFAULT SWAPS ON CREDIT INDICES — SELL PROTECTION1 | ||||||||||||||||||||||
| Reference Entity | Notional Amount2 | Termination Date | Periodic Payments Received by the Fund† | Market Value3 | Upfront Premiums Paid (Received) | Unrealized Appreciation | ||||||||||||||||
| Markit CDX.NA.IG.32 Index | $ | 1,131,000 | 6/20/24 | 1.000% quarterly | $ | 24,426 | $ | 19,031 | $ | 5,395 | ||||||||||||
| 1 | If the Fund is a seller of protection and a credit event occurs, as defined under the terms of that particular swap agreement, the Fund will either (i) pay to the buyer of protection an amount equal to the notional amount of the swap and take delivery of the referenced obligation or underlying securities comprising the referenced index or (ii) pay a net settlement amount in the form of cash or securities equal to the notional amount of the swap less the recovery value of the referenced obligation or underlying securities comprising the referenced index. |
| 2 | The maximum potential amount the Fund could be required to pay as a seller of credit protection or receive as a buyer of credit protection if a credit event occurs as defined under the terms of that particular swap agreement. |
| 3 | The quoted market prices and resulting values for credit default swap agreements on asset-backed securities and credit indices serve as an indicator of the current status of the payment/performance risk and represent the likelihood of an expected loss (or profit) for the credit derivative had the notional amount of the swap agreement been closed/sold as of the period end. Decreasing market values (sell protection) or increasing market values (buy protection) when compared to the notional amount of the swap, represent a deterioration of the referenced entity’s credit soundness and a greater likelihood or risk of default or other credit event occurring as defined under the terms of the agreement. |
| † | Percentage shown is an annual percentage rate. |
| * | Notional amount denominated in U.S. dollars, unless otherwise noted. |
| ** | One time payment made at termination date. |
Abbreviations used in this table: | ||
| BRL | — Brazilian Real | |
| BRL-CDI | — Brazil Cetip InterBank Deposit Rate | |
| GBP | — British Pound | |
| LIBOR | — London Interbank Offered Rate | |
| MXN | — Mexican Peso | |
| TIIE | — Equilibrium Interbanking Interest Rate (Tasa de Intere’s Interbancaria de Equilibrio) | |
See Notes to Financial Statements.
| ||
| Western Asset Total Return ETF 2019 Semi-Annual Report | 25 |
Statement of assets and liabilities(unaudited)
June 30, 2019
| Assets: | ||||
Investments, at value (Cost — $35,832,104) | $ | 37,118,717 | ||
Foreign currency, at value (Cost — $44,251) | 49,416 | |||
Receivable for securities sold | 572,136 | |||
Deposits with brokers for centrally cleared swap contracts | 226,190 | |||
Deposits with brokers for open futures contracts and exchange-traded options | 184,243 | |||
Interest receivable | 183,436 | |||
Foreign currency collateral for open futures contracts and exchange traded options, at value (Cost — $132,542) | 135,185 | |||
Unrealized appreciation on forward foreign currency contracts | 92,175 | |||
OTC swaps, at value (premiums paid — $2,704) | 25,850 | |||
Receivable from broker — variation margin on centrally cleared swap contracts | 11,779 | |||
Receivable from broker — variation margin on open futures contracts | 42 | |||
Total Assets | 38,599,169 | |||
| Liabilities: | ||||
Payable for securities purchased | 6,110,925 | |||
Unrealized depreciation on forward foreign currency contracts | 38,616 | |||
Written options, at value (premiums received — $60,612) | 20,601 | |||
Investment management fee payable | 11,844 | |||
Total Liabilities | 6,181,986 | |||
| Total Net Assets | $ | 32,417,183 | ||
| Net Assets: | ||||
Par value (Note 5) | $ | 12 | ||
Paid-in capital in excess of par value | 30,227,419 | |||
Total distributable earnings (loss) | 2,189,752 | |||
| Total Net Assets | $ | 32,417,183 | ||
| Shares Outstanding | 1,200,000 | |||
| Net Asset Value | $27.01 | |||
See Notes to Financial Statements.
| ||
| 26 | Western Asset Total Return ETF 2019 Semi-Annual Report |
Statement of operations(unaudited)
For the Six Months Ended June 30, 2019
| Investment Income: | ||||
Dividends | $ | 26,766 | ||
Interest | 514,317 | |||
Total Investment Income | 541,083 | |||
| Expenses: | ||||
Investment management fee (Note 2) | 67,419 | |||
Total Expenses | 67,419 | |||
Less: Fee waivers and/or expense reimbursements (Note 2) | (5,504) | |||
Net Expenses | 61,915 | |||
| Net Investment Income | 479,168 | |||
| Realized and Unrealized Gain (Loss) on Investments, Futures Contracts, Written Options, Swap Contracts, Forward Foreign Currency Contracts and Foreign Currency Transactions (Notes 1, 3 and 4): | ||||
Net Realized Gain (Loss) From: | ||||
Investment transactions | 268,490 | |||
Futures contracts | 8,870 | |||
Written options | 92,411 | |||
Swap contracts | 64,861 | |||
Forward foreign currency contracts | (27,483) | |||
Foreign currency transactions | (3,403) | |||
Net Realized Gain | 403,746 | |||
Change in Net Unrealized Appreciation (Depreciation) From: | ||||
Investments | 1,333,513 | |||
Futures contracts | 234,157 | |||
Written options | 67,950 | |||
Swap contracts | (248,362) | |||
Forward foreign currency contracts | 137,151 | |||
Foreign currencies | 3,821 | |||
Change in Net Unrealized Appreciation (Depreciation) | 1,528,230 | |||
| Net Gain on Investments, Futures Contracts, Written Options, Swap Contracts, Forward Foreign Currency Contracts and Foreign Currency Transactions | 1,931,976 | |||
| Increase in Net Assets From Operations | $ | 2,411,144 | ||
See Notes to Financial Statements.
| ||
| Western Asset Total Return ETF 2019 Semi-Annual Report | 27 |
Statements of changes in net assets
| For the Six Months Ended June 30, 2019 (unaudited) and the Period Ended December 31, 2018 | 2019 | 2018(a) | ||||||
| Operations: | ||||||||
Net investment income | $ | 479,168 | $ | 201,420 | ||||
Net realized gain | 403,746 | 47,179 | ||||||
Change in net unrealized appreciation (depreciation) | 1,528,230 | 49,009 | ||||||
Increase in Net Assets From Operations | 2,411,144 | 297,608 | ||||||
| Distributions to Shareholders From (Note 1): | ||||||||
Total distributable earnings | (383,000) | (136,000) | ||||||
Decrease in Net Assets From Distributions to Shareholders | (383,000) | (136,000) | ||||||
| Fund Share Transactions (Note 5): | ||||||||
Net proceeds from sale of shares (200,000 and 1,000,000 shares issued, respectively) | 5,227,431 | 25,000,000 | ||||||
Increase in Net Assets From Fund Share Transactions | 5,227,431 | 25,000,000 | ||||||
Increase in Net Assets | 7,255,575 | 25,161,608 | ||||||
| Net Assets: | ||||||||
Beginning of period | 25,161,608 | — | ||||||
End of period | $ | 32,417,183 | $ | 25,161,608 | ||||
| (a) | For the period October 3, 2018 (inception date) to December 31, 2018. |
See Notes to Financial Statements.
| ||
| 28 | Western Asset Total Return ETF 2019 Semi-Annual Report |
| For a share of beneficial interest outstanding throughout each year ended December 31, unless otherwise noted: | ||||||||
| 20191,2 | 20181,3 | |||||||
| Net asset value, beginning of period | $25.16 | $25.00 | ||||||
| Income from operations: | ||||||||
Net investment income | 0.45 | 0.20 | ||||||
Net realized and unrealized gain | 1.76 | 0.10 | ||||||
Total income from operations | 2.21 | 0.30 | ||||||
| Less distributions from: | ||||||||
Net investment income | (0.36) | (0.14) | ||||||
Total distributions | (0.36) | (0.14) | ||||||
| Net asset value, end of period | $27.01 | $25.16 | ||||||
Total return, based on NAV4 | 8.85 | % | 1.19 | % | ||||
| Net assets, end of period (000s) | $32,417 | $25,162 | ||||||
| Ratios to average net assets: | ||||||||
Gross expenses5,6 | 0.49 | % | 0.49 | % | ||||
Net expenses5,6 | 0.45 | 0.45 | ||||||
Net investment income6 | 3.48 | 3.33 | ||||||
| Portfolio turnover rate7 | 14 | % | 18 | % | ||||
| 1 | Per share amounts have been calculated using the average shares method. |
| 2 | For the six months ended June 30, 2019 (unaudited). |
| 3 | For the period October 3, 2018 (inception date) to December 31, 2018. |
| 4 | Performance figures may reflect fee waivers and/or expense reimbursements. In the absence of fee waivers and/or expense reimbursements, the total return would have been lower. The total return calculation assumes that distributions are reinvested at NAV. Past performance is no guarantee of future results. Total returns for periods of less than one year are not annualized. |
| 5 | As a result of an expense limitation arrangement, the ratio of total annual fund operating expenses, other than interest expenses, taxes, brokerage expenses, future12b-1 fees (if any), acquired fund fees and expenses, extraordinary expenses and the management fee payable to LMPFA under the investment management agreement, to the average net assets did not exceed 0.45%. This expense limitation arrangement cannot be terminated prior to May 1, 2020 without the Board of Trustees’ consent. |
| 6 | Annualized. |
| 7 | Excluding mortgage dollar rolls transactions. If mortgage dollar roll transactions had been included, the portfolio turnover rate would have been 137% and 97% for the six months ended June 30, 2019, and the period ended December 31, 2018, respectively. |
See Notes to Financial Statements.
| ||
| Western Asset Total Return ETF 2019 Semi-Annual Report | 29 |
Notes to financial statements(unaudited)
1. Organization and significant accounting policies
Western Asset Total Return ETF (the “Fund”) is a separate diversified investment series of Legg Mason ETF Investment Trust (the “Trust”). The Trust, a Maryland statutory trust, is registered under the Investment Company Act of 1940, as amended (the “1940 Act”), as anopen-end management investment company.
The Fund is an actively managed exchange-traded fund (“ETF”). ETFs are funds that trade like other publicly-traded securities. Unlike shares of a mutual fund, which can be bought from and redeemed by the issuing fund by all shareholders at a price based on net asset value (“NAV”), shares of the Fund may be directly purchased from and redeemed by the Fund at NAV solely by certain large institutional investors who have entered into agreements with the Fund’s distributor (“Authorized Participants”). Also unlike shares of a mutual fund, shares of the Fund are listed on a national securities exchange and trade in the secondary market at market prices that change throughout the day.
Shares of the Fund are listed and traded at market prices on NASDAQ. The market price for the Fund’s shares may be different from the Fund’s NAV. The Fund issues and redeems shares at NAV only in blocks of a specified number of shares or multiples thereof (“Creation Units”). Only Authorized Participants may purchase or redeem Creation Units directly with the Fund at NAV. Creation Units generally are issued and redeemed in cash. However, Creation Units may also be issued and redeemed partiallyin-kind for a basket securities and partially in cash. Except when aggregated in Creation Units, shares of the Fund are not redeemable securities. Shareholders who are not Authorized Participants may not redeem shares directly from the Fund at NAV.
The following are significant accounting policies consistently followed by the Fund and are in conformity with U.S. generally accepted accounting principles (“GAAP”). Estimates and assumptions are required to be made regarding assets, liabilities and changes in net assets resulting from operations when financial statements are prepared. Changes in the economic environment, financial markets and any other parameters used in determining these estimates could cause actual results to differ. Subsequent events have been evaluated through the date the financial statements were issued.
(a) Investment valuation.The valuations for fixed income securities (which may include, but are not limited to, corporate, government, municipal, mortgage-backed, collateralized mortgage obligations and asset-backed securities) and certain derivative instruments are typically the prices supplied by independent third party pricing services, which may use market prices or broker/dealer quotations or a variety of valuation techniques and methodologies. The independent third party pricing services use inputs that are observable such as issuer details, interest rates, yield curves, prepayment speeds, credit risks/spreads, default rates and quoted prices for similar securities. Investments inopen-end funds are valued at the closing net asset value per share of each fund on the day of valuation. Futures contracts are valued daily at the settlement price established by the board of trade or exchange on
| ||
| 30 | Western Asset Total Return ETF 2019 Semi-Annual Report |
which they are traded. Equity securities for which market quotations are available are valued at the last reported sales price or official closing price on the primary market or exchange on which they trade. When the Fund holds securities or other assets that are denominated in a foreign currency, the Fund will use the currency exchange rates, generally determined as of 4:00 p.m. (London Time). If independent third party pricing services are unable to supply prices for a portfolio investment, or if the prices supplied are deemed by the manager to be unreliable, the market price may be determined by the manager using quotations from one or more broker/dealers or at the transaction price if the security has recently been purchased and no value has yet been obtained from a pricing service or pricing broker. When reliable prices are not readily available, such as when the value of a security has been significantly affected by events after the close of the exchange or market on which the security is principally traded, but before the Fund calculates its net asset value, the Fund values these securities as determined in accordance with procedures approved by the Fund’s Board of Trustees.
The Board of Trustees is responsible for the valuation process and has delegated the supervision of the daily valuation process to the Legg Mason North Atlantic Fund Valuation Committee (the “Valuation Committee”). The Valuation Committee, pursuant to the policies adopted by the Board of Trustees, is responsible for making fair value determinations, evaluating the effectiveness of the Fund’s pricing policies, and reporting to the Board of Trustees. When determining the reliability of third party pricing information for investments owned by the Fund, the Valuation Committee, among other things, conducts due diligence reviews of pricing vendors, monitors the daily change in prices and reviews transactions among market participants.
The Valuation Committee will consider pricing methodologies it deems relevant and appropriate when making fair value determinations. Examples of possible methodologies include, but are not limited to, multiple of earnings; discount from market of a similar freely traded security; discounted cash-flow analysis; book value or a multiple thereof; risk premium/yield analysis; yield to maturity; and/or fundamental investment analysis. The Valuation Committee will also consider factors it deems relevant and appropriate in light of the facts and circumstances. Examples of possible factors include, but are not limited to, the type of security; the issuer’s financial statements; the purchase price of the security; the discount from market value of unrestricted securities of the same class at the time of purchase; analysts’ research and observations from financial institutions; information regarding any transactions or offers with respect to the security; the existence of merger proposals or tender offers affecting the security; the price and extent of public trading in similar securities of the issuer or comparable companies; and the existence of a shelf registration for restricted securities.
| ||
| Western Asset Total Return ETF 2019 Semi-Annual Report | 31 |
Notes to financial statements(unaudited) (cont’d)
For each portfolio security that has been fair valued pursuant to the policies adopted by the Board of Trustees, the fair value price is compared against the last available and next available market quotations. The Valuation Committee reviews the results of such back testing monthly and fair valuation occurrences are reported to the Board of Trustees quarterly.
The Fund uses valuation techniques to measure fair value that are consistent with the market approach and/or income approach, depending on the type of security and the particular circumstance. The market approach uses prices and other relevant information generated by market transactions involving identical or comparable securities. The income approach uses valuation techniques to discount estimated future cash flows to present value.
GAAP establishes a disclosure hierarchy that categorizes the inputs to valuation techniques used to value assets and liabilities at measurement date. These inputs are summarized in the three broad levels listed below:
| • | Level 1 — quoted prices in active markets for identical investments |
| • | Level 2 — other significant observable inputs (including quoted prices for similar investments, interest rates, prepayment speeds, credit risk, etc.) |
| • | Level 3 — significant unobservable inputs (including the Fund’s own assumptions in determining the fair value of investments) |
The inputs or methodologies used to value securities are not necessarily an indication of the risk associated with investing in those securities.
The following is a summary of the inputs used in valuing the Fund’s assets and liabilities carried at fair value:
| ||
| 32 | Western Asset Total Return ETF 2019 Semi-Annual Report |
| ASSETS | ||||||||||||||||
| Description | Quoted Prices (Level 1) | Other Significant Observable Inputs (Level 2) | Significant Unobservable Inputs (Level 3) | Total | ||||||||||||
| Long-Term Investments†: | ||||||||||||||||
Mortgage-Backed Securities | — | $ | 10,799,036 | — | $ | 10,799,036 | ||||||||||
Corporate Bonds & Notes | — | 9,973,673 | — | 9,973,673 | ||||||||||||
Collateralized Mortgage Obligations | — | 2,832,926 | — | 2,832,926 | ||||||||||||
U.S. Government & Agency Obligations | — | 2,378,035 | — | 2,378,035 | ||||||||||||
Sovereign Bonds | — | 2,236,447 | — | 2,236,447 | ||||||||||||
Investments in Underlying Funds | $ | 879,344 | — | — | 879,344 | |||||||||||
U.S. Treasury Inflation Protected Securities | — | 616,040 | — | 616,040 | ||||||||||||
Asset-Backed Securities | — | 508,247 | — | 508,247 | ||||||||||||
Purchased Options: | ||||||||||||||||
Exchange-Traded Purchased Options | 10,691 | — | — | 10,691 | ||||||||||||
OTC Purchased Options | — | 18,116 | — | 18,116 | ||||||||||||
| Total Long-Term Investments | 890,035 | 29,362,520 | — | 30,252,555 | ||||||||||||
| Short-Term Investments†: | ||||||||||||||||
U.S. Treasury Bills | — | 6,321,242 | — | 6,321,242 | ||||||||||||
Overnight Deposits | — | 544,920 | — | 544,920 | ||||||||||||
| Total Short-Term Investments | — | 6,866,162 | — | 6,866,162 | ||||||||||||
| Total Investments | $ | 890,035 | $ | 36,228,682 | — | $ | 37,118,717 | |||||||||
| Other Financial Instruments: | ||||||||||||||||
Futures Contracts | $ | 560,156 | — | — | $ | 560,156 | ||||||||||
Forward Foreign Currency Contracts | — | $ | 92,175 | — | 92,175 | |||||||||||
Centrally Cleared Interest Rate Swaps | — | 84,317 | — | 84,317 | ||||||||||||
OTC Interest Rate Swaps‡ | — | 25,850 | — | 25,850 | ||||||||||||
Centrally Cleared Credit Default Swaps on Credit Indices — Sell Protection | — | 5,395 | — | 5,395 | ||||||||||||
| Total Other Financial Instruments | $ | 560,156 | $ | 207,737 | — | $ | 767,893 | |||||||||
| Total | $ | 1,450,191 | $ | 36,436,419 | — | $ | 37,886,610 | |||||||||
| ||
| Western Asset Total Return ETF 2019 Semi-Annual Report | 33 |
Notes to financial statements(unaudited) (cont’d)
| LIABILITIES | ||||||||||||||||
| Description | Quoted Prices (Level 1) | Other Significant Observable Inputs (Level 2) | Significant Unobservable Inputs (Level 3) | Total | ||||||||||||
| Other Financial Instruments: | ||||||||||||||||
Written Options: | ||||||||||||||||
Exchange-Traded Written Options | $ | 18,516 | — | — | $ | 18,516 | ||||||||||
OTC Written Options | — | $ | 2,085 | — | 2,085 | |||||||||||
Futures Contracts | 181,462 | — | — | 181,462 | ||||||||||||
Forward Foreign Currency Contracts | — | 38,616 | — | 38,616 | ||||||||||||
Centrally Cleared Interest Rate Swaps | — | 302,906 | — | 302,906 | ||||||||||||
| Total | $ | 199,978 | $ | 343,607 | — | $ | 543,585 | |||||||||
| † | See Schedule of Investments for additional detailed categorizations. |
| ‡ | Value includes any premium paid or received with respect to swap contracts. |
(b) Purchased options.When the Fund purchases an option, an amount equal to the premium paid by the Fund is recorded as an investment on the Statement of Assets and Liabilities, the value of which ismarked-to-market to reflect the current market value of the option purchased. If the purchased option expires, the Fund realizes a loss equal to the amount of premium paid. When an instrument is purchased or sold through the exercise of an option, the related premium paid is added to the basis of the instrument acquired or deducted from the proceeds of the instrument sold. The risk associated with purchasing put and call options is limited to the premium paid.
(c) Written options.When the Fund writes an option, an amount equal to the premium received by the Fund is recorded as a liability, the value of which ismarked-to-market daily to reflect the current market value of the option written. If the option expires, the premium received is recorded as a realized gain. When a written call option is exercised, the difference between the premium received plus the option exercise price and the Fund’s basis in the underlying security (in the case of a covered written call option), or the cost to purchase the underlying security (in the case of an uncovered written call option), including brokerage commission, is recognized as a realized gain or loss. When a written put option is exercised, the amount of the premium received is subtracted from the cost of the security purchased by the Fund from the exercise of the written put option to form the Fund’s basis in the underlying security purchased. The writer or buyer of an option traded on an exchange can liquidate the position before the exercise of the option by entering into a closing transaction. The cost of a closing transaction is deducted from the original premium received resulting in a realized gain or loss to the Fund.
| ||
| 34 | Western Asset Total Return ETF 2019 Semi-Annual Report |
The risk in writing a covered call option is that the Fund may forego the opportunity of profit if the market price of the underlying security increases and the option is exercised. The risk in writing a put option is that the Fund may incur a loss if the market price of the underlying security decreases and the option is exercised. The risk in writing an uncovered call option is that the Fund is exposed to the risk of loss if the market price of the underlying security increases. In addition, there is the risk that the Fund may not be able to enter into a closing transaction because of an illiquid secondary market.
(d) Options on futures contracts.An option on a futures contract gives the purchaser the right, in return for the premium paid, to assume a position in the underlying futures contract at the specified option exercise price at any time prior to the expiration date of the option. Upon exercise of an option, the delivery of the futures position by the writer of the option to the holder of the option will be accompanied by delivery of the accumulated balance in the writer’s futures margin account that represents the amount by which the market price of the futures contract exceeds (in the case of a call) or is less than (in the case of a put) the exercise price of the option on the futures contract. The potential for loss related to the purchase of an option on a futures contract is limited to the premium paid for the option plus transaction costs. Because the value of the option is fixed at the point of purchase, there are no daily cash payments by the purchaser to reflect changes in the value of the underlying contract; however, the value of the option changes daily and that change would be reflected in the net asset value of the Fund. The potential for loss related to writing call options is unlimited. The potential for loss related to writing put options is limited only by the aggregate strike price of the put option less the premium received.
(e) Futures contracts.The Fund uses futures contracts generally to gain exposure to, or hedge against, changes in interest rates or gain exposure to, or hedge against, changes in certain asset classes or in an attempt to increase the Fund’s return. A futures contract represents a commitment for the future purchase or sale of an asset at a specified price on a specified date.
Upon entering into a futures contract, the Fund is required to deposit cash or securities with a broker in an amount equal to a certain percentage of the contract amount. This is known as the ‘‘initial margin’’ and subsequent payments (‘‘variation margin’’) are made or received by the Fund each day, depending on the daily fluctuation in the value of the contract. For certain futures, including foreign denominated futures, variation margin is not settled daily, but is recorded as a net variation margin payable or receivable. The daily changes in contract value are recorded as unrealized gains or losses in the Statement of Operations and the Fund recognizes a realized gain or loss when the contract is closed.
Futures contracts involve, to varying degrees, risk of loss in excess of the amounts reflected in the financial statements. In addition, there is the risk that the Fund may not be able to enter into a closing transaction because of an illiquid secondary market.
| ||
| Western Asset Total Return ETF 2019 Semi-Annual Report | 35 |
Notes to financial statements(unaudited) (cont’d)
(f) Forward foreign currency contracts.The Fund enters into a forward foreign currency contract to hedge exposure of bond positions or in an attempt to increase the Fund’s return. A forward foreign currency contract is an agreement between two parties to buy and sell a currency at a set price with delivery and settlement at a future date. The contract ismarked-to-market daily and the change in value is recorded by the Fund as an unrealized gain or loss. When a forward foreign currency contract is closed, through either delivery or offset by entering into another forward foreign currency contract, the Fund recognizes a realized gain or loss equal to the difference between the value of the contract at the time it was opened and the value of the contract at the time it is closed.
Non-deliverable forward foreign currency exchange contracts are settled with the counter-party in cash without the delivery of foreign currency.
Forward foreign currency contracts involve elements of market risk in excess of the amounts reflected on the Statement of Assets and Liabilities. The Fund bears the risk of an unfavorable change in the foreign exchange rate underlying the forward foreign currency contract. Risks may also arise upon entering into these contracts from the potential inability of the counterparties to meet the terms of their contracts.
(g) Swap agreements.The Fund invests in swaps for the purpose of managing its exposure to interest rate, credit or market risk, or for other purposes. The use of swaps involves risks that are different from those associated with other portfolio transactions. Swap agreements are privately negotiated in theover-the-counter market and may be entered into as a bilateral contract (“OTC Swaps”) or centrally cleared (“Centrally Cleared Swaps”). Unlike Centrally Cleared Swaps, the Fund has credit exposure to the counterparties of OTC Swaps.
In a Centrally Cleared Swap, immediately following execution of the swap, the swap agreement is submitted to a clearinghouse or central counterparty (the “CCP”) and the CCP becomes the ultimate counterparty of the swap agreement. The Fund is required to interface with the CCP through a broker, acting in an agency capacity. All payments are settled with the CCP through the broker. Upon entering into a Centrally Cleared Swap, the Fund is required to deposit initial margin with the broker in the form of cash or securities.
Swap contracts aremarked-to-market daily and changes in value are recorded as unrealized appreciation (depreciation). The daily change in valuation of Centrally Cleared Swaps, if any, is recorded as a receivable or payable for variation margin on the Statement of Assets and Liabilities. Gains or losses are realized upon termination of the swap agreement. Collateral, in the form of restricted cash or securities, may be required to be held in segregated accounts with the Fund’s custodian in compliance with the terms of the swap contracts. Securities posted as collateral for swap contracts are identified in the Schedule of Investments and restricted cash, if any, is identified on the Statement of Assets and Liabilities. Risks may exceed amounts recorded in the Statement of Assets and Liabilities. These risks include changes in the returns of the underlying instruments, failure of the counterparties to
| ||
| 36 | Western Asset Total Return ETF 2019 Semi-Annual Report |
perform under the contracts’ terms, and the possible lack of liquidity with respect to the swap agreements.
OTC swap payments received or made at the beginning of the measurement period are reflected as a premium or deposit, respectively, on the Statement of Assets and Liabilities. These upfront payments are amortized over the life of the swap and are recognized as realized gain or loss in the Statement of Operations. Net periodic payments received or paid by the Fund are recognized as a realized gain or loss in the Statement of Operations.
The Fund’s maximum exposure in the event of a defined credit event on a credit default swap to sell protection is the notional amount. As of June 30, 2019, the total notional value of all credit default swaps to sell protection was $1,131,000. This amount would be offset by the value of the swap’s reference entity, upfront premiums received on the swap and any amounts received from the settlement of a credit default swap where the Fund bought protection for the same referenced entity.
For average notional amounts of swaps held during the six months ended June 30, 2019, see Note 4.
Credit default swaps
The Fund enters into credit default swap (“CDS”) contracts for investment purposes, to manage its credit risk or to add leverage. CDS agreements involve one party making a stream of payments to another party in exchange for the right to receive a specified return in the event of a default by a third party, typically corporate or sovereign issuers, on a specified obligation, or in the event of a write-down, principal shortfall, interest shortfall or default of all or part of the referenced entities comprising a credit index. The Fund may use a CDS to provide protection against defaults of the issuers (i.e., to reduce risk where the Fund has exposure to an issuer) or to take an active long or short position with respect to the likelihood of a particular issuer’s default. As a seller of protection, the Fund generally receives an upfront payment or a stream of payments throughout the term of the swap provided that there is no credit event. If the Fund is a seller of protection and a credit event occurs, as defined under the terms of that particular swap agreement, the maximum potential amount of future payments (undiscounted) that the Fund could be required to make under a credit default swap agreement would be an amount equal to the notional amount of the agreement. These amounts of potential payments will be partially offset by any recovery of values from the respective referenced obligations. As a seller of protection, the Fund effectively adds leverage to its portfolio because, in addition to its total net assets, the Fund is subject to investment exposure on the notional amount of the swap. As a buyer of protection, the Fund generally receives an amount up to the notional value of the swap if a credit event occurs.
| ||
| Western Asset Total Return ETF 2019 Semi-Annual Report | 37 |
Notes to financial statements(unaudited) (cont’d)
Implied spreads are the theoretical prices a lender receives for credit default protection. When spreads rise, market perceived credit risk rises and when spreads fall, market perceived credit risk falls. The implied credit spread of a particular referenced entity reflects the cost of buying/selling protection and may include upfront payments required to enter into the agreement. Wider credit spreads and decreasing market values, when compared to the notional amount of the swap, represent a deterioration of the referenced entity’s credit soundness and a greater likelihood or risk of default or other credit event occurring as defined under the terms of the agreement. Credit spreads utilized in determining the period end market value of credit default swap agreements on corporate or sovereign issues are disclosed in the Schedule of Investments and serve as an indicator of the current status of the payment/performance risk and represent the likelihood or risk of default for credit derivatives. For credit default swap agreements on asset-backed securities and credit indices, the quoted market prices and resulting values, particularly in relation to the notional amount of the contract as well as the annual payment rate, serve as an indication of the current status of the payment/performance risk.
The Fund’s maximum risk of loss from counterparty risk, as the protection buyer, is the fair value of the contract (this risk is mitigated by the posting of collateral by the counterparty to the Fund to cover the Fund’s exposure to the counterparty). As the protection seller, the Fund’s maximum risk is the notional amount of the contract. Credit default swaps are considered to have credit risk-related contingent features since they require payment by the protection seller to the protection buyer upon the occurrence of a defined credit event.
Entering into a CDS agreement involves, to varying degrees, elements of credit, market and documentation risk in excess of the related amounts recognized on the Statement of Assets and Liabilities. Such risks involve the possibility that there will be no liquid market for these agreements, that the counterparty to the agreement may default on its obligation to perform or disagree as to the meaning of the contractual terms in the agreement, and that there will be unfavorable changes in net interest rates.
Interest rate swaps
The Fund enters into interest rate swap contracts to manage its exposure to interest rate risk. Interest rate swaps are agreements between two parties to exchange cash flows based on a notional principal amount. The Fund may elect to pay a fixed rate and receive a floating rate, receive a fixed rate and pay a floating rate, or pay and receive a floating rate, on a notional principal amount. Interest rate swaps aremarked-to-market daily based upon quotations from market makers and the change, if any, is recorded as an unrealized gain or loss in the Statement of Operations. When a swap contract is terminated early, the Fund records a realized gain or loss equal to the difference between the original cost and the settlement amount of the closing transaction.
The risks of interest rate swaps include changes in market conditions that will affect the value of the contract or changes in the present value of the future cash flow streams and
| ||
| 38 | Western Asset Total Return ETF 2019 Semi-Annual Report |
the possible inability of the counterparty to fulfill its obligations under the agreement. The Fund’s maximum risk of loss from counterparty credit risk is the discounted net value of the cash flows to be received from the counterparty over the contract’s remaining life, to the extent that amount is positive. This risk is mitigated by the posting of collateral by the counterparty to the Fund to cover the Fund’s exposure to the counterparty.
(h) Swaptions.The Fund may purchase or write swaption contracts to manage exposure to fluctuations in interest rates or to enhance yield. The Fund may also purchase and write swaption contracts to manage exposure to an underlying instrument. Swaption contracts written by the Fund represent an option that gives the purchaser the right, but not the obligation, to enter into a previously agreed upon swap contract at a future date. Swaption contracts purchased by the Fund represent an option that gives the Fund the right, but not the obligation, to enter into a previously agreed upon swap contract at a future date.
When the Fund writes a swaption, an amount equal to the premium received by the Fund is recorded as a liability, the value of which ismarked-to-market daily to reflect the current market value of the swaption written. If the swaption expires, the Fund realizes a gain equal to the amount of the premium received.
When the Fund purchases a swaption, an amount equal to the premium paid by the Fund is recorded as an investment on the Statement of Assets and Liabilities, the value of which ismarked-to-market daily to reflect the current market value of the swaption purchased. If the swaption expires, the Fund realizes a loss equal to the amount of the premium paid.
Swaptions aremarked-to-market daily based upon quotations from market makers. Changes in the value of the swaption are reported as unrealized gains or losses in the Statement of Operations.
(i) Stripped securities.The Fund may invest in ‘‘Stripped Securities,’’ a term used collectively for components, or strips, of fixed income securities. Stripped Securities can be principal only securities (“PO”), which are debt obligations that have been stripped of unmatured interest coupons, or interest only securities (“IO”), which are unmatured interest coupons that have been stripped from debt obligations. The market value of Stripped Securities will fluctuate in response to changes in economic conditions, rates ofpre-payment, interest rates and the market’s perception of the securities. However, fluctuations in response to interest rates may be greater in Stripped Securities than for debt obligations of comparable maturities that pay interest currently. The amount of fluctuation may increase with a longer period of maturity.
The yield to maturity on IO’s is sensitive to the rate of principal repayments (including prepayments) on the related underlying debt obligation and principal payments may have a material effect on yield to maturity. If the underlying debt obligation experiences greater than anticipated prepayments of principal, the Fund may not fully recoup its initial investment in IO’s.
| ||
| Western Asset Total Return ETF 2019 Semi-Annual Report | 39 |
Notes to financial statements(unaudited) (cont’d)
(j) Securities traded on ato-be-announced basis.The Fund may trade securities on ato-be-announced (“TBA”) basis. In a TBA transaction, the Fund commits to purchasing or selling securities which have not yet been issued by the issuer and for which specific information, such as the face amount, maturity date and underlying pool of investments in U.S. government agency mortgage pass-through securities, is not announced. Securities purchased on a TBA basis are not settled until they are delivered to the Fund. Beginning on the date the Fund enters into a TBA transaction, cash, U.S. government securities or other liquid high-grade debt obligations are segregated in an amount equal in value to the purchase price of the TBA security. These securities are subject to market fluctuations and their current value is determined in the same manner as for other securities.
(k) Mortgage dollar rolls.The Fund may enter into mortgage dollar rolls in which the Fund sells mortgage-backed securities for delivery in the current month, realizing a gain or loss, and simultaneously contracts to repurchase substantially similar (same type, coupon and maturity) securities to settle on a specified future date.
The Fund executes its mortgage dollar rolls entirely in the TBA market, whereby the Fund makes a forward commitment to purchase a security and, instead of accepting delivery, the position is offset by a sale of the security with a simultaneous agreement to repurchase at a future date. The Fund accounts for mortgage dollar rolls as purchases and sales.
The risk of entering into mortgage dollar rolls is that the market value of the securities the Fund is obligated to repurchase under the agreement may decline below the repurchase price. In the event the buyer of securities under a mortgage dollar roll files for bankruptcy or becomes insolvent, the Fund’s use of the proceeds of the mortgage dollar roll may be restricted pending a determination by the counterparty, or its trustee or receiver, whether to enforce the Fund’s obligation to repurchase the securities.
(l) Inflation-indexed bonds.Inflation-indexed bonds are fixed-income securities whose principal value or interest rate is periodically adjusted according to the rate of inflation. As the index measuring inflation changes, the principal value or interest rate of inflation-indexed bonds will be adjusted accordingly. Inflation adjustments to the principal amount of inflation-indexed bonds are reflected as an increase or decrease to investment income on the Statement of Operations. Repayment of the original bond principal upon maturity (as adjusted for inflation) is guaranteed in the case of U.S. Treasury inflation-indexed bonds. For bonds that do not provide a similar guarantee, the adjusted principal value of the bond repaid at maturity may be less than the original principal.
| ||
| 40 | Western Asset Total Return ETF 2019 Semi-Annual Report |
(m) Foreign currency translation.Investment securities and other assets and liabilities denominated in foreign currencies are translated into U.S. dollar amounts based upon prevailing exchange rates on the date of valuation. Purchases and sales of investment securities and income and expense items denominated in foreign currencies are translated into U.S. dollar amounts based upon prevailing exchange rates on the respective dates of such transactions.
The Fund does not isolate that portion of the results of operations resulting from fluctuations in foreign exchange rates on investments from the fluctuations arising from changes in market prices of securities held. Such fluctuations are included with the net realized and unrealized gain or loss on investments.
Net realized foreign exchange gains or losses arise from sales of foreign currencies, including gains and losses on forward foreign currency contracts, currency gains or losses realized between the trade and settlement dates on securities transactions, and the difference between the amounts of dividends, interest, and foreign withholding taxes recorded on the Fund’s books and the U.S. dollar equivalent of the amounts actually received or paid. Net unrealized foreign exchange gains and losses arise from changes in the values of assets and liabilities, other than investments in securities, on the date of valuation, resulting from changes in exchange rates.
Foreign security and currency transactions may involve certain considerations and risks not typically associated with those of U.S. dollar denominated transactions as a result of, among other factors, the possibility of lower levels of governmental supervision and regulation of foreign securities markets and the possibility of political or economic instability.
(n) Credit and market risk.The Fund invests in high-yield and emerging market instruments that are subject to certain credit and market risks. The yields of high-yield and emerging market debt obligations reflect, among other things, perceived credit and market risks. The Fund’s investments in securities rated below investment grade typically involve risks not associated with higher rated securities including, among others, greater risk related to timely and ultimate payment of interest and principal, greater market price volatility and less liquid secondary market trading. The consequences of political, social, economic or diplomatic changes may have disruptive effects on the market prices of investments held by the Fund. The Fund’s investments innon-U.S. dollar denominated securities may also result in foreign currency losses caused by devaluations and exchange rate fluctuations.
Investments in securities that are collateralized by real estate mortgages are subject to certain credit and liquidity risks. When market conditions result in an increase in default rates of the underlying mortgages and the foreclosure values of underlying real estate properties are materially below the outstanding amount of these underlying mortgages, collection of the full amount of accrued interest and principal on these investments may be
| ||
| Western Asset Total Return ETF 2019 Semi-Annual Report | 41 |
Notes to financial statements(unaudited) (cont’d)
doubtful. Such market conditions may significantly impair the value and liquidity of these investments and may result in a lack of correlation between their credit ratings and values.
(o) Foreign investment risks.The Fund’s investments in foreign securities may involve risks not present in domestic investments. Since securities may be denominated in foreign currencies, may require settlement in foreign currencies or pay interest or dividends in foreign currencies, changes in the relationship of these foreign currencies to the U.S. dollar can significantly affect the value of the investments and earnings of the Fund. Foreign investments may also subject the Fund to foreign government exchange restrictions, expropriation, taxation or other political, social or economic developments, all of which affect the market and/or credit risk of the investments.
(p) Counterparty risk and credit-risk-related contingent features of derivative instruments.The Fund may invest in certain securities or engage in other transactions, where the Fund is exposed to counterparty credit risk in addition to broader market risks. The Fund may invest in securities of issuers, which may also be considered counterparties as trading partners in other transactions. This may increase the risk of loss in the event of default or bankruptcy by the counterparty or if the counterparty otherwise fails to meet its contractual obligations. The Fund’s subadviser attempts to mitigate counterparty risk by (i) periodically assessing the creditworthiness of its trading partners, (ii) monitoring and/or limiting the amount of its net exposure to each individual counterparty based on its assessment and (iii) requiring collateral from the counterparty for certain transactions. Market events and changes in overall economic conditions may impact the assessment of such counterparty risk by the subadviser. In addition, declines in the values of underlying collateral received may expose the Fund to increased risk of loss.
With exchange traded and centrally cleared derivatives, there is less counterparty risk to the Fund since the exchange or clearinghouse, as counterparty to such instruments, guarantees against a possible default. The clearinghouse stands between the buyer and the seller of the contract; therefore, the credit risk is limited to failure of the clearinghouse. While offset rights may exist under applicable law, the Fund does not have a contractual right of offset against a clearing broker or clearinghouse in the event of a default of the clearing broker or clearinghouse.
The Fund has entered into master agreements, such as an International Swaps and Derivatives Association, Inc. Master Agreement (“ISDA Master Agreement”) or similar agreement, with certain of its derivative counterparties that governover-the-counter derivatives and provide for general obligations, representations, agreements, collateral posting terms, netting provisions in the event of default or termination and credit related contingent features. The credit related contingent features include, but are not limited to, a percentage decrease in the Fund’s net assets or NAV over a specified period of time. If these credit related contingent features were triggered, the derivatives counterparty could terminate the positions and demand payment or require additional collateral.
| ||
| 42 | Western Asset Total Return ETF 2019 Semi-Annual Report |
Under an ISDA Master Agreement, the Fund may, under certain circumstances, offset with the counterparty certain derivative financial instruments’ payables and/or receivables with collateral held and/or posted and create one single net payment. However, absent an event of default by the counterparty or a termination of the agreement, the terms of the ISDA Master Agreements do not result in an offset of reported amounts of financial assets and financial liabilities in the Statement of Assets and Liabilities across transactions between the Fund and the applicable counterparty. The enforceability of the right to offset may vary by jurisdiction.
Collateral requirements differ by type of derivative. Collateral or margin requirements are set by the broker or exchange clearinghouse for exchange traded derivatives while collateral terms are contract specific forover-the-counter traded derivatives. Cash collateral that has been pledged to cover obligations of the Fund under derivative contracts, if any, will be reported separately in the Statement of Assets and Liabilities. Securities pledged as collateral, if any, for the same purpose are noted in the Schedule of Investments.
As of June 30, 2019, the Fund held OTC written options and forward foreign currency contracts with credit related contingent features which had a net liability position of $40,701. If a contingent feature would have been triggered, the Fund would have been required to pay this amount to its derivatives counterparties.
At June 30, 2019, the Fund heldnon-cash collateral from Citibank, N.A. in the amount of $33,566. This amount could be used to reduce the Fund’s exposure to the counterparty in the event of default.
(q) Security transactions and investment income.Security transactions are accounted for on a trade date basis. Interest income (including interest income frompayment-in-kind securities), adjusted for amortization of premium and accretion of discount, is recorded on the accrual basis. Paydown gains and losses on mortgage- and asset-backed securities are recorded as adjustments to interest income. Dividend income is recorded on theex-dividend date for dividends received in cash and/or securities. The cost of investments sold is determined by use of the specific identification method. To the extent any issuer defaults or a credit event occurs that impacts the issuer, the Fund may halt any additional interest income accruals and consider the realizability of interest accrued up to the date of default or credit event.
(r) Distributions to shareholders.Distributions from net investment income are declared and paid monthly. Distributions of net realized gains, if any, are declared at least annually. Distributions to shareholders of the Fund are recorded on theex-dividend date and are determined in accordance with income tax regulations, which may differ from GAAP.
(s) Federal and other taxes.It is the Fund’s policy to comply with the federal income and excise tax requirements of the Internal Revenue Code of 1986 (the “Code”), as amended, applicable to regulated investment companies. Accordingly, the Fund intends to distribute
| ||
| Western Asset Total Return ETF 2019 Semi-Annual Report | 43 |
Notes to financial statements(unaudited) (cont’d)
its taxable income and net realized gains, if any, to shareholders in accordance with timing requirements imposed by the Code. Therefore, no federal or state income tax provision is required in the Fund’s financial statements.
Management has analyzed the Fund’s tax positions taken on income tax returns for all open tax years and has concluded that as of December 31, 2018, no provision for income tax is required in the Fund’s financial statements. The Fund’s federal and state income and federal excise tax returns for tax years for which the applicable statutes of limitations have not expired are subject to examination by the Internal Revenue Service and state departments of revenue.
(t) Reclassification.GAAP requires that certain components of net assets be reclassified to reflect permanent differences between financial and tax reporting. These reclassifications have no effect on net assets or net asset value per share.
2. Investment management agreement and other transactions with affiliates
Legg Mason Partners Fund Advisor, LLC (“LMPFA”) is the Fund’s investment manager. Western Asset Management Company, LLC (“Western Asset”), is the Fund’s subadviser and Western Asset Management Company Pte. Ltd. in Singapore (“Western Asset Singapore”), Western Asset Management Company Ltd in Japan (“Western Asset Japan”) and Western Asset Management Company Limited in London (“Western Asset London ”) are the Fund’ssub-subadvisers. LMPFA, Western Asset, Western Asset Singapore, Western Asset Japan and Western Asset London are wholly-owned subsidiaries of Legg Mason, Inc. (“Legg Mason”).
LMPFA provides administrative and certain oversight services to the Fund. LMPFA delegates to the subadviser theday-to-day portfolio management of the Fund. The Fund is responsible for paying interest expenses, taxes, brokerage expenses, future12b-1 fees (if any), acquired fund fees and expenses, extraordinary expenses and the management fee payable to LMPFA under the investment management agreement.
Under the investment management agreement and subject to the general supervision of the Fund’s Board of Trustees, LMPFA provides or causes to be furnished all investment management, supervisory, administrative and other services reasonably necessary for the operation of the Fund, including certain distribution services (provided pursuant to a separate distribution agreement) and investment advisory services (provided pursuant to separate subadvisory agreements) under a unitary fee structure. The Fund pays an investment management fee, calculated daily and paid monthly, at an annual rate of 0.49% of the Fund’s average daily net assets.
| ||
| 44 | Western Asset Total Return ETF 2019 Semi-Annual Report |
LMPFA has agreed to waive fees and/or reimburse investment management fees, so that the ratio of total annual fund operating expenses will not exceed 0.45% of the Fund’s average daily net assets (subject to the same exclusions as the investment management agreement). This arrangement cannot be terminated prior to May 1, 2020 without the Board of Trustees consent.
During the six months ended June 30, 2019, fees waived and/or expenses reimbursed amounted to $5,504.
As compensation for its subadvisory services, LMPFA pays Western Asset monthly 70% of the management fee paid by the Fund to LMPFA, net of (i) all fees and expenses incurred by LMPFA under the investment management agreement (including without limitation any subadvisory fee paid to another subadviser to the Fund) and (ii) expense waivers, if any, and reimbursements. Western Asset pays Western Asset Singapore, Western Asset Japan and Western Asset London a monthly subadvisory fee in an amount equal to 100% of the management fee paid to Western Asset on the assets that Western Asset allocates to each suchnon-U.S. subadviser to manage.
Legg Mason Investor Services, LLC, a wholly-owned broker-dealer subsidiary of Legg Mason, serves as the distributor of Creation Units for the Fund on an agency basis.
The Fund’s Board of Trustees has adopted a Rule12b-1 shareholder services and distribution plan and under that plan, the Fund is authorized to pay service and/or distribution fees calculated at an annual rate of up to 0.25% of its average daily net assets. No service and/or distribution fees are currently paid by the Fund, and there are no current plans to impose these fees.
All officers and one Trustee of the Trust are employees of Legg Mason or its affiliates and do not receive compensation from the Trust.
3. Investments
During the six months ended June 30, 2019, the aggregate cost of purchases and proceeds from sales of investments (excluding short-term investments) and U.S. Government & Agency Obligations were as follows:
| Investments | U.S. Government & Agency Obligations | |||||||
| Purchases | $ | 5,437,571 | $ | 35,872,649 | ||||
| Sales | 3,868,314 | 33,684,405 | ||||||
| ||
| Western Asset Total Return ETF 2019 Semi-Annual Report | 45 |
Notes to financial statements(unaudited) (cont’d)
At June 30, 2019, the aggregate cost of investments and the aggregate gross unrealized appreciation and depreciation of investments for federal income tax purposes were substantially as follows:
| Cost/Premiums Paid (Received) | Gross Unrealized Appreciation | Gross Unrealized Depreciation | Net Unrealized | |||||||||||||
| Securities | $ | 35,832,104 | $ | 1,363,795 | $ | (77,182) | $ | 1,286,613 | ||||||||
| Swap contracts | (4,373) | 112,858 | (302,906) | (190,048) | ||||||||||||
| Written options | (60,612) | 40,048 | (37) | 40,011 | ||||||||||||
| Futures contracts | — | 560,156 | (181,462) | 378,694 | ||||||||||||
| Forward foreign currency contracts | — | 92,175 | (38,616) | 53,559 | ||||||||||||
4. Derivative instruments and hedging activities
Below is a table, grouped by derivative type, that provides information about the fair value and the location of derivatives within the Statement of Assets and Liabilities at June 30, 2019.
| ASSET DERIVATIVES1 | ||||||||||||||||
| Interest Rate Risk | Foreign Exchange Risk | Credit Risk | Total | |||||||||||||
| Purchased options2 | $ | 10,691 | $ | 7,894 | $ | 10,222 | $ | 28,807 | ||||||||
| Futures contracts3 | 560,156 | — | — | 560,156 | ||||||||||||
| OTC swap contracts4 | 25,850 | — | — | 25,850 | ||||||||||||
| Centrally cleared swap contracts5 | 84,317 | — | 5,395 | 89,712 | ||||||||||||
| Forward foreign currency contracts | — | 92,175 | — | 92,175 | ||||||||||||
| Total | $ | 681,014 | $ | 100,069 | $ | 15,617 | $ | 796,700 | ||||||||
| LIABILITY DERIVATIVES1 | ||||||||||||||||
| Interest Rate Risk | Foreign Exchange Risk | Credit Risk | Total | |||||||||||||
| Written options | $ | 18,516 | $ | 596 | $ | 1,489 | $ | 20,601 | ||||||||
| Futures contracts3 | 181,462 | — | — | 181,462 | ||||||||||||
| Centrally cleared swap contracts5 | 302,906 | — | — | 302,906 | ||||||||||||
| Forward foreign currency contracts | — | 38,616 | — | 38,616 | ||||||||||||
| Total | $ | 502,884 | $ | 39,212 | $ | 1,489 | $ | 543,585 | ||||||||
| 1 | Generally, the balance sheet location for asset derivatives is receivables/net unrealized appreciation (depreciation) and for liability derivatives is payables/net unrealized appreciation (depreciation). |
| 2 | Market value of purchased options is reported in Investments at value in the Statement of Assets and Liabilities. |
| 3 | Includes cumulative appreciation (depreciation) of futures contracts as reported in the Schedule of Investments. Only variation margin is reported within the receivables and/or payables on the Statement of Assets and Liabilities. |
| 4 | Values include premiums paid (received) on swap contracts which are shown separately in the Statement of Assets and Liabilities. |
| ||
| 46 | Western Asset Total Return ETF 2019 Semi-Annual Report |
| 5 | Includes cumulative appreciation (depreciation) of centrally cleared swap contracts as reported in the Schedule of Investments. Only variation margin is reported within the receivables and/or payables on the Statement of Assets and Liabilities. |
The following tables provide information about the effect of derivatives and hedging activities on the Fund’s Statement of Operations for the six months ended June 30, 2019. The first table provides additional detail about the amounts and sources of gains (losses) realized on derivatives during the period. The second table provides additional information about the change in unrealized appreciation (depreciation) resulting from the Fund’s derivatives and hedging activities during the period.
| AMOUNT OF REALIZED GAIN (LOSS) ON DERIVATIVES RECOGNIZED | ||||||||||||||||
| Interest Rate Risk | Foreign Exchange Risk | Credit Risk | Total | |||||||||||||
| Purchased options1 | $ | (84,345) | $ | (5,810) | $ | 1,392 | $ | (88,763) | ||||||||
| Written options | 90,953 | — | 1,458 | 92,411 | ||||||||||||
| Futures contracts | 8,870 | — | — | 8,870 | ||||||||||||
| Swap contracts | (315) | — | 65,176 | 64,861 | ||||||||||||
| Forward foreign currency contracts | — | (27,483) | — | (27,483) | ||||||||||||
| Total | $ | 15,163 | $ | (33,293) | $ | 68,026 | $ | 49,896 | ||||||||
| 1 | Net realized gain (loss) from purchased options is reported in net realized gain (loss) from investment transactions in the Statement of Operations. |
| CHANGE IN UNREALIZED APPRECIATION (DEPRECIATION) ON DERIVATIVES RECOGNIZED | ||||||||||||||||
| Interest Rate Risk | Foreign Exchange Risk | Credit Risk | Total | |||||||||||||
| Purchased options1 | $ | 1,862 | $ | 767 | $ | 5,884 | $ | 8,513 | ||||||||
| Written options | 63,059 | 294 | 4,597 | 67,950 | ||||||||||||
| Futures contracts | 234,157 | — | — | 234,157 | ||||||||||||
| Swap contracts | (230,437) | — | (17,925) | (248,362) | ||||||||||||
| Forward foreign currency contracts | — | 137,151 | — | 137,151 | ||||||||||||
| Total | $ | 68,641 | $ | 138,212 | $ | (7,444) | $ | 199,409 | ||||||||
| 1 | The change in unrealized appreciation (depreciation) from purchased options is reported in the change in net unrealized appreciation (depreciation) from investments in the Statement of Operations. |
| ||
| Western Asset Total Return ETF 2019 Semi-Annual Report | 47 |
Notes to financial statements(unaudited) (cont’d)
During the six months ended June 30, 2019, the volume of derivative activity for the Fund was as follows:
| Average Market Value | ||||
| Purchased options | $ | 20,274 | ||
| Written options | 25,786 | |||
| Futures contracts (to buy) | 34,318,462 | |||
| Futures contracts (to sell) | 14,615,964 | |||
| Forward foreign currency contracts (to buy) | 4,502,987 | |||
| Forward foreign currency contracts (to sell) | 1,461,589 | |||
| Average Notional Balance | ||||
| Interest rate swap contracts | $ | 13,063,544 | ||
| Credit default swap contracts (to buy protection)† | 71,429 | |||
| Credit default swap contracts (to sell protection) | 1,887,657 | |||
| † | At June 30, 2019, there were no open positions held in this derivative. |
The following table presents the Fund’s OTC derivative assets and liabilities by counterparty net of amounts available for offset under an ISDA Master Agreement and net of the related collateral pledged (received) by the Fund as of June 30, 2019.
| Counterparty | Gross Assets Subject to Master Agreements1 | Gross Liabilities Subject to Master Agreements1 | Net Assets (Liabilities) Subject to Master Agreements | Collateral Pledged (Received)2 | Net Amount3,4 | |||||||||||||||
| Bank of America N.A. | $ | 6,407 | $ | (1,284) | $ | 5,123 | — | $ | 5,123 | |||||||||||
| Barclays Bank PLC | 3,191 | (6,950) | (3,759) | — | (3,759) | |||||||||||||||
| BNP Paribas SA | 9,034 | (3,841) | 5,193 | — | 5,193 | |||||||||||||||
| Citibank N.A. | 103,057 | (19,354) | 83,703 | $ | (33,566) | 50,137 | ||||||||||||||
| Goldman Sachs Group Inc. | 4,536 | (322) | 4,214 | — | 4,214 | |||||||||||||||
| JPMorgan Chase & Co. | 9,916 | (8,950) | 966 | — | 966 | |||||||||||||||
| Total | $ | 136,141 | $ | (40,701) | $ | 95,440 | $ | (33,566) | $ | 61,874 | ||||||||||
| 1 | Absent an event of default or early termination, derivative assets and liabilities are presented gross and not offset in the Statement of Assets and Liabilities. |
| 2 | Gross amounts are not offset in the Statement of Assets and Liabilities. |
| 3 | Net amount may also include forward foreign currency exchange contracts that are not required to be collateralized. |
| 4 | Represents the net amount receivable (payable) from (to) the counterparty in the event of default. |
5. Fund share transactions
At June 30, 2019, the Trust had an unlimited number of shares of beneficial interest authorized with a par value of $0.00001 per share. Fund shares are issued and redeemed by the Fund only in Creation Units or Creation Unit aggregations, where 100,000 shares of the
| ||
| 48 | Western Asset Total Return ETF 2019 Semi-Annual Report |
Fund constitute a Creation Unit. Such transactions are generally on a cash basis. However, Creation Units may also be issued and redeemed partiallyin-kind for a basket of securities and partially in cash. Transactions in capital shares of the Fund are disclosed in detail in the Statement of Changes in Net Assets. Authorized Participants are subject to standard creation and redemption transaction fees to offset transfer and other transaction costs associated with the issuance and redemption of Creation Units. Creations and redemptions for cash (when cash creations and redemptions are available or specified) may be subject to an additional variable fee.
6. Recent accounting pronouncement
The Fund has adopted the disclosure provisions of the Financial Accounting Standards Board Accounting Standards UpdateNo. 2018-13,Fair Value Measurement (Topic 820)— Disclosure Framework—Changes to the Disclosure Requirements for Fair Value Measurement(“ASU2018-13”) which introduces new fair value disclosure requirements as well as eliminates and modifies certain existing fair value disclosure requirements. ASU2018-13 would be effective for fiscal years beginning after December 15, 2019, and interim periods within those fiscal years; however, management has elected to early adopt ASU2018-13. The impact of the Fund’s adoption was limited to changes in the Fund’s financial statement disclosures regarding fair value, primarily those disclosures related to transfers between levels of the fair value hierarchy.
| ||
| Western Asset Total Return ETF 2019 Semi-Annual Report | 49 |
Western
Asset Total Return ETF
Trustees
Paul R. Ades
Andrew L. Breech
Dwight B. Crane
Althea L. Duersten
Stephen R. Gross*
Susan M. Heilbron*
Frank G. Hubbard
Howard J. Johnson
Chairman
Jerome H.Miller
Ken Miller
Thomas F. Schlafly
Jane Trust
| * | Effective February 6, 2019, Mr. Gross and Ms. Heilbron became Trustees. |
Investment manager
Legg Mason Partners Fund Advisor, LLC
Subadvisers
Western Asset Management Company, LLC
Western Asset Management Company Limited
Western Asset Management Company Ltd
Western Asset Management Company Pte. Ltd.
Custodian
The Bank of New York Mellon
Transfer agent
BNY Mellon Investment Servicing (US) Inc.
4400 Computer Drive
Westborough, MA 01581
Independent registered public accounting firm
PricewaterhouseCoopers LLP
Baltimore, MD
Western Asset Total Return ETF
The Fund is a separate investment series of Legg Mason ETF Investment Trust, a Maryland statutory trust.
Western Asset Total Return ETF
Legg Mason Funds
620 Eighth Avenue, 49th Floor
New York, NY 10018
The Fund files its complete schedule of portfolio holdings with the Securities and Exchange Commission (“SEC”) for the first and third quarters of each fiscal year as an exhibit to its reports on FormN-PORT. Previously, the Fund filed a complete schedule of portfolio holdings with the SEC for the first and third quarters of each fiscal year on FormN-Q. The Fund’s FormsN-PORT andN-Q are available on the SEC’s website at www.sec.gov. To obtain information on FormsN-PORT andN-Q, shareholders can call the Fund at1-877-721-1926.
Information on how the Fund voted proxies relating to portfolio securities during the prior12-month period ended June 30th of each year and a description of the policies and procedures that the Fund uses to determine how to vote proxies related to portfolio transactions are available (1) without charge, upon request, by calling the Fund at1-877-721-1926, (2) at www.leggmason.com/etf and (3) on the SEC’s website at www.sec.gov.
This report is submitted for the general information of the shareholders of Western Asset Total Return ETF. This report is not authorized for distribution to prospective investors in the Fund unless preceded or accompanied by a current prospectus.
Investors should consider the Fund’s investment objectives, risks, charges and expenses carefully before investing. The prospectus contains this and other important information about the Fund. Please read the prospectus carefully before investing.
www.leggmason.com
© 2019 Legg Mason Investor Services, LLC
Member FINRA, SIPC
www.leggmason.com
© 2019 Legg Mason Investor Services, LLC Member FINRA, SIPC
ETFF531459 8/19 SR19-3690
| ITEM 2. | CODE OF ETHICS. | |
| Not applicable. | ||
| ITEM 3. | AUDIT COMMITTEE FINANCIAL EXPERT. | |
| Not applicable. | ||
| ITEM 4. | PRINCIPAL ACCOUNTANT FEES AND SERVICES. | |
| Not applicable. | ||
| ITEM 5. | AUDIT COMMITTEE OF LISTED REGISTRANTS. | |
| Not applicable. | ||
| ITEM 6. | SCHEDULE OF INVESTMENTS. | |
| Included herein under Item 1. | ||
| ITEM 7. | DISCLOSURE OF PROXY VOTING POLICIES AND PROCEDURES FOR CLOSED-END MANAGEMENT INVESTMENT COMPANIES. | |
| Not applicable. | ||
| ITEM 8. | PORTFOLIO MANAGERS OF CLOSED-END MANAGEMENT INVESTMENT COMPANIES. | |
| Not applicable. | ||
| ITEM 9. | PURCHASES OF EQUITY SECURITIES BY CLOSED-END MANAGEMENT INVESTMENT COMPANY AND AFFILIATED PURCHASERS. | |
| Not applicable. | ||
| ITEM 10. | SUBMISSION OF MATTERS TO A VOTE OF SECURITY HOLDERS. | |
| Not applicable. | ||
| ITEM 11. | CONTROLS AND PROCEDURES. | |
(a) The registrant’s principal executive officer and principal financial officer have concluded that the registrant’s disclosure controls and procedures (as defined in Rule 30a- 3(c) under the Investment Company Act of 1940, as amended (the “1940 Act”)) are effective as of a date within 90 days of the filing date of this report that includes the disclosure required by this paragraph, based on their evaluation of the disclosure controls and procedures required by Rule 30a-3(b) under the 1940 Act and 15d-15(b) under the Securities Exchange Act of 1934. | ||
(b) There were no changes in the registrant’s internal control over financial reporting (as defined in Rule 30a-3(d) under the 1940 Act) that occurred during the second fiscal quarter of the period covered by this report that have materially affected, or are likely to materially affect the registrant’s internal control over financial reporting. | ||
| ITEM 12. | DISCLOSURE OF SECURITIES LENDING ACTIVITIES FOR CLOSED-END MANAGEMENT INVESTMENT COMPANIES. | |
| Not applicable | ||
| ITEM 13. | EXHIBITS. | |
| (a) (1) Not applicable. | ||
| . | Exhibit 99.CODE ETH | |
| (a) (2) Certifications pursuant to section 302 of the Sarbanes-Oxley Act of 2002 attached hereto. | ||
| Exhibit 99.CERT | ||
| (b) Certifications pursuant to Section 906 of the Sarbanes-Oxley Act of 2002 attached hereto. | ||
| Exhibit 99.906CERT | ||
SIGNATURES
Pursuant to the requirements of the Securities Exchange Act of 1934 and the Investment Company Act of 1940, the registrant has duly caused this Report to be signed on its behalf by the undersigned, there unto duly authorized.
| Legg Mason ETF Investment Trust | ||
By: | /s/Jane Trust | |
Jane Trust | ||
Chief Executive Officer | ||
Date: | August 26, 2019 | |
Pursuant to the requirements of the Securities Exchange Act of 1934 and the Investment Company Act of 1940, this report has been signed below by the following persons on behalf of the registrant and in the capacities and on the dates indicated.
| By: | /s/Jane Trust | |
| Jane Trust | ||
| Chief Executive Officer | ||
| Date: | August 26, 2019 | |
| By: | /s/Richard F. Sennett | |
| Richard F. Sennett | ||
| Principal Financial Officer | ||
| Date: | August 26, 2019 | |