Table of Contents
UNITED STATES
SECURITIES AND EXCHANGE COMMISSION
Washington, D.C. 20549
FORMN-CSR
CERTIFIED SHAREHOLDER REPORT OF REGISTERED
MANAGEMENT INVESTMENT COMPANIES
Investment Company Act file number811-23096
Legg Mason ETF Investment Trust
(Exact name of registrant as specified in charter)
620 Eighth Avenue, 49th Floor,
New York, NY 10018
(Address of principal executive offices) (Zip code)
Robert I. Frenkel, Esq.
Legg Mason & Co., LLC
100 First Stamford Place
Stamford, CT 06902
(Name and address of agent for service)
Registrant’s telephone number, including area code:1-877-721-1926
Date of fiscal year end: July 31
Date of reporting period: January 31, 2020
Table of Contents
ITEM 1. REPORT TO STOCKHOLDERS.
TheSemi-Annual Report to Stockholders is filed herewith.
Table of Contents

| Semi-Annual Report | January 31, 2020 |
WESTERN ASSET
SHORT DURATION INCOME ETF
WINC
Beginning in January 2021, as permitted by regulations adopted by the Securities and Exchange Commission, the Fund intends to no longer mail paper copies of the Fund’s shareholder reports like this one, unless you specifically request paper copies of the reports from your financial intermediary (such as a broker-dealer or bank). Instead, the reports will be made available on a website, and you will be notified by mail each time a report is posted and provided with a website link to access the report.
If you already elected to receive shareholder reports electronically(“e-delivery”), you will not be affected by this change and you need not take any action. If you have not already electede-delivery, you may elect to receive shareholder reports and other communications from the Fund electronically by contacting your financial intermediary.
You may elect to receive all future reports in paper free of charge by contacting your financial intermediary to request that you continue to receive paper copies of your shareholder reports. Your election to receive reports in paper will apply to all Legg Mason Funds held in your account with your financial intermediary.

| INVESTMENT PRODUCTS: NOT FDIC INSURED • NO BANK GUARANTEE • MAY LOSE VALUE |
Table of Contents
Fund objective
The Fund seeks current income.

Dear Shareholder,
We are pleased to provide the semi-annual report of Western Asset Short Duration Income ETF for thesix-month reporting period ended January 31, 2020. Please read on for Fund performance information during the Fund’s reporting period.
As always, we remain committed to providing you with excellent service and a full spectrum of investment choices. We also remain committed to supplementing the support you receive from your financial advisor. One way we accomplish this is through our website, www.leggmason.com. Here you can gain immediate access to market and investment information, including:
| • | Fund net asset value and market price, |
| • | Market insights and commentaries from our portfolio managers, and |
| • | A host of educational resources. |
We look forward to helping you meet your financial goals.
Sincerely,

Jane Trust, CFA
President and Chief Executive Officer
February 28, 2020
| II | Western Asset Short Duration Income ETF |
Table of Contents
For the six months ended January 31, 2020, Western Asset Short Duration Income ETF generated a 2.96% return on a net asset value (“NAV”)i basis and 2.40% based on its market priceii per share.
The performance table shows the Fund’s total return for the six months ended January 31, 2020 based on its NAV and market price. The Fund’s broad-based market index, the Bloomberg Barclays U.S. Corporate 1 – 5 Year Indexiii, returned 2.95% over the same time frame. The Lipper Short Investment Grade Debt Funds Category Averageiv returned 1.86% for the same period. Please note that Lipper performance returns are based on each fund’s NAV.
| Performance Snapshotas of January 31, 2020 (unaudited) | ||||
| 6 months | ||||
| Western Asset Short Duration Income ETF: | ||||
$25.99 (NAV) | 2.96 | %*† | ||
$26.01 (Market Price) | 2.40 | %*‡ | ||
| Bloomberg Barclays U.S. Corporate 1 – 5 Year Index | 2.95 | % | ||
| Lipper Short Investment Grade Debt Funds Category Average | 1.86 | % | ||
The performance shown represents past performance. Past performance is no guarantee of future results and current performance may be higher or lower than the performance shown above. Principal value and investment returns will fluctuate so shares, when sold, may be worth more or less than their original cost. Performance data current to the most recentmonth-end is available at www.leggmason.com/etf.
Investors buy and sell shares of an exchange-traded fund (“ETF”) at market price (not NAV) in the secondary market throughout the trading day. These shares are not individually available for direct purchase from or direct redemption to the ETF. Market price returns shown are typically based upon themid-point between the bid and ask on the Fund’s principal trading market when the Fund’s NAV is determined, which is typically 4:00 p.m. Eastern time (US). These returns do not represent investors’ returns had they traded shares at other times. Performance figures for periods shorter than one year represent cumulative figures and are not annualized.
Information showing the number of days the market price of the Fund’s shares was greater than the Fund’s NAV and the number of days it was less than the Fund’s NAV (i.e., premium or discount) for various time periods is available by visiting the Fund’s website at www.leggmason.com/etf.
As of the Fund’s current prospectus dated November 29, 2019, the gross total annual fund operating expense ratio for the Fund was 0.29%.
* Total returns are based on changes in NAV or market price, respectively. Returns reflect the deduction of all Fund expenses. Returns do not reflect the deduction of brokerage commissions or taxes that investors pay on distributions or the sale of shares.
† Total return assumes the reinvestment of all distributions, including returns of capital, if any, at NAV.
‡ Total return assumes the reinvestment of all distributions, including returns of capital, if any, at market price.
| Western Asset Short Duration Income ETF | III |
Table of Contents
Performance review (cont’d)
Looking for additional information?
The Fund’s daily NAV is availableon-line at www.leggmason.com/etf. The Fund is traded under the symbol “WINC” and its closing market price is available on most financial websites. In a continuing effort to provide information concerning the Fund, shareholders may call1-877-721-1926 (toll free), Monday through Friday from 8:00 a.m. to 5:30 p.m. Eastern time, for the Fund’s current NAV, market price and other information.
As always, thank you for your confidence in our stewardship of your assets.
Sincerely,
Jane Trust, CFA
President and Chief Executive Officer
February 28, 2020
RISKS: The Fund is newly organized, with a limited history of operations. Fixed-income securities involve interest rate, credit, inflation and reinvestment risks; and possible loss of principal. As interest rates rise, the value of fixed-income securities falls. High-yield securities include greater price volatility, illiquidity and possibility of default. International investments are subject to special risks, including currency fluctuations, social, economic and political uncertainties, which could increase volatility. These risks are magnified in emerging markets. Derivatives, such as options and futures, can be illiquid, may disproportionately increase losses, and have a potentially large impact on fund performance. The use of leverage may increase volatility and possibility of loss. Asset-backed, mortgage-backed or mortgage related securities are subject to prepayment and extension risks. Active management and diversification do not ensure gains or protect against market declines. Please see the Fund’s prospectus for a more complete discussion of these and other risks and the Fund’s investment strategies.
All investments are subject to risk including the possible loss of principal. Past performance is no guarantee of future results. All index performance reflects no deduction for fees, expenses or taxes. Please note that an investor cannot invest directly in an index.
| i | Net Asset Value (“NAV”) is calculated by subtracting total liabilities from total assets and dividing the results by the number of shares outstanding. |
| ii | Market Price is determined by supply and demand. It is the price at which an investor purchases or sells shares of the Fund. The Market Price may differ from the Fund’s NAV. |
| iii | The Bloomberg Barclays U.S. Corporate 1-5 Year Index is an unmanaged index that measures the performance of the investment grade, fixed-rate, taxable 1-5 year maturity corporate bond market. It includes USD denominated securities publicly issued by U.S. andnon-U.S. industrial, utility and financial issuers. |
| iv | Lipper, Inc., a wholly-owned subsidiary of Reuters, provides independent insight on global collective investments. Returns are based on thesix-month period ended January 31, 2020, including the reinvestment of all distributions, including returns of capital, if any, calculated among the 379 funds in the Fund’s Lipper category. |
| IV | Western Asset Short Duration Income ETF |
Table of Contents
Investment breakdown(%) as a percent of total investments
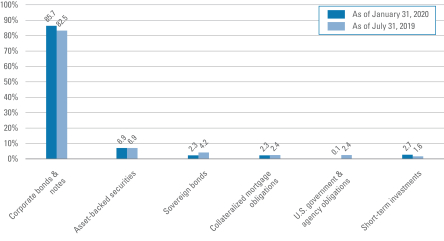
| † | The bar graph above represents the composition of the Fund’s investments as of January 31, 2020 and July 31, 2019 and does not include derivatives, such as futures contracts. The composition of the Fund’s investments is subject to change at any time. |
| Western Asset Short Duration Income ETF 2020 Semi-Annual Report | 1 |
Table of Contents
Example
As a shareholder of the Fund, you may incur two types of costs: (1) transaction costs, such as brokerage commissions paid on purchases and sales of Fund shares; and (2) ongoing costs, management fees; and other Fund expenses. This example is intended to help you understand your ongoing costs (in dollars) of investing in the Fund and to compare these costs with the ongoing costs of investing in other funds.
This example is based on an investment of $1,000 invested on August 1, 2019 and held for the six months ended January 31, 2020.
Actual expenses
The table below titled “Based on Actual Total Return” provides information about actual account values and actual expenses. You may use the information provided in this table, together with the amount you invested, to estimate the expenses that you paid over the period. To estimate the expenses you paid on your account, divide your ending account value by $1,000 (for example, an $8,600 ending account value divided by $1,000 = 8.6), then multiply the result by the number under the heading entitled “Expenses Paid During the Period”.
Hypothetical example for comparison purposes
The table below titled “Based on Hypothetical Total Return” provides information about hypothetical account values and hypothetical expenses based on the actual expense ratio and an assumed rate of return of 5.00% per year before expenses, which is not the Fund’s actual return. The hypothetical account values and expenses may not be used to estimate the actual ending account balance or expenses you paid for the period. You may use the information provided in this table to compare the ongoing costs of investing in the Fund and other funds. To do so, compare the 5.00% hypothetical example relating to the Fund with the 5.00% hypothetical examples that appear in the shareholder reports of the other funds.
Please note that the expenses shown in the table below are meant to highlight your ongoing costs only and do not reflect any transactional costs, such as brokerage commissions paid on purchases and sales of Fund shares. Therefore, the table is useful in comparing ongoing costs only, and will not help you determine the relative total costs of owning different funds. In addition, if these transaction costs were included, your costs would have been higher.
| Based on actual total return1 | Based on hypothetical total return1 | |||||||||||||||||||
| Actual Total Return2 | Beginning Account Value | Ending Account Value | Annualized Expense Ratio | Expenses Paid During the Period3 | Hypothetical Annualized Total Return | Beginning Account Value | Ending Account Value | Annualized Expense Ratio | Expenses Paid During the Period3 | |||||||||||
| 2.96% | $1,000.00 | $1,029.60 | 0.29% | $1.48 | 5.00% | $1,000.00 | $1,023.68 | 0.29% | $1.48 | |||||||||||
| 1 | For the six months ended January 31, 2020. |
| 2 | Assumes the reinvestment of all distributions, including returns of capital, if any, at net asset value. Total return is not annualized, as it may not be representative of the total return for the year. Performance figures may reflect fee waivers and/or expense reimbursements. In the absence of fee waivers and/or expense reimbursements, the total return would have been lower. Past performance is no guarantee of future results. |
| 3 | Expenses (net of fee waivers and/or expense reimbursements) are equal to the Fund’s annualized expense ratio multiplied by the average account value over the period, multiplied by the number of days in the most recent fiscal half-year (184), then divided by 366. |
| 2 | Western Asset Short Duration Income ETF 2020 Semi-Annual Report |
Table of Contents
Schedule of investments(unaudited)
January 31, 2020
Western Asset Short Duration Income ETF
| Security | Rate | Maturity Date | Face Amount | Value | ||||||||||||
| Corporate Bonds & Notes — 87.0% | ||||||||||||||||
| Communication Services — 8.5% | ||||||||||||||||
Diversified Telecommunication Services — 3.3% | ||||||||||||||||
AT&T Inc., Senior Notes | 3.600 | % | 7/15/25 | $ | 500,000 | $ | 538,249 | |||||||||
CenturyLink Inc., Senior Secured Notes | 4.000 | % | 2/15/27 | 30,000 | 30,246 | (a) | ||||||||||
Telecom Italia SpA, Senior Notes | 5.303 | % | 5/30/24 | 260,000 | 283,400 | (a) | ||||||||||
Total Diversified Telecommunication Services | 851,895 | |||||||||||||||
Media — 4.3% | ||||||||||||||||
Charter Communications Operating LLC/Charter Communications Operating Capital Corp., Senior Secured Notes | 4.464 | % | 7/23/22 | 100,000 | 105,667 | |||||||||||
Discovery Communications LLC, Senior Notes | 4.375 | % | 6/15/21 | 250,000 | 259,033 | |||||||||||
Time Warner Entertainment Co. LP, Senior Secured Notes | 8.375 | % | 3/15/23 | 640,000 | 757,811 | |||||||||||
Total Media | 1,122,511 | |||||||||||||||
Wireless Telecommunication Services — 0.9% | ||||||||||||||||
Sprint Corp., Senior Notes | 7.250 | % | 9/15/21 | 230,000 | 241,212 | |||||||||||
Total Communication Services | 2,215,618 | |||||||||||||||
| Consumer Discretionary — 5.1% | ||||||||||||||||
Automobiles — 2.5% | ||||||||||||||||
Ford Motor Credit Co. LLC, Senior Notes | 5.875 | % | 8/2/21 | 250,000 | 262,391 | |||||||||||
Ford Motor Credit Co. LLC, Senior Notes | 3.350 | % | 11/1/22 | 260,000 | 263,824 | |||||||||||
General Motors Financial Co. Inc., Senior Notes | 3.450 | % | 4/10/22 | 130,000 | 133,210 | |||||||||||
Total Automobiles | 659,425 | |||||||||||||||
Hotels, Restaurants & Leisure — 1.2% | ||||||||||||||||
Las Vegas Sands Corp., Senior Notes | 3.200 | % | 8/8/24 | 60,000 | 61,940 | |||||||||||
Melco Resorts Finance Ltd., Senior Notes | 5.375 | % | 12/4/29 | 200,000 | 199,620 | (a) | ||||||||||
NCL Corp. Ltd., Senior Notes | 3.625 | % | 12/15/24 | 40,000 | 39,700 | (a) | ||||||||||
Total Hotels, Restaurants & Leisure | 301,260 | |||||||||||||||
Household Durables — 1.1% | ||||||||||||||||
DR Horton Inc., Senior Notes | 2.500 | % | 10/15/24 | 60,000 | 61,110 | |||||||||||
Lennar Corp., Senior Notes | 2.950 | % | 11/29/20 | 60,000 | 60,150 | |||||||||||
Lennar Corp., Senior Notes | 8.375 | % | 1/15/21 | 60,000 | 63,450 | |||||||||||
Newell Brands Inc., Senior Notes | 3.850 | % | 4/1/23 | 93,000 | 96,811 | |||||||||||
Total Household Durables | 281,521 | |||||||||||||||
Multiline Retail — 0.3% | ||||||||||||||||
Dollar Tree Inc., Senior Notes | 3.700 | % | 5/15/23 | 80,000 | 84,366 | |||||||||||
Total Consumer Discretionary | 1,326,572 | |||||||||||||||
See Notes to Financial Statements
| Western Asset Short Duration Income ETF 2020 Semi-Annual Report | 3 |
Table of Contents
Schedule of investments(unaudited) (cont’d)
January 31, 2020
Western Asset Short Duration Income ETF
| Security | Rate | Maturity Date | Face Amount | Value | ||||||||||||
| Consumer Staples — 4.0% | ||||||||||||||||
Food Products — 1.0% | ||||||||||||||||
Smithfield Foods Inc., Senior Notes | 3.350 | % | 2/1/22 | $ | 260,000 | $ | 262,160 | (a) | ||||||||
Household Products — 0.1% | ||||||||||||||||
Estee Lauder Cos. Inc., Senior Notes | 2.000 | % | 12/1/24 | 30,000 | 30,392 | |||||||||||
Tobacco — 2.9% | ||||||||||||||||
Altria Group Inc., Senior Notes | 3.800 | % | 2/14/24 | 500,000 | 532,077 | |||||||||||
Imperial Brands Finance PLC, Senior Notes | 3.125 | % | 7/26/24 | 200,000 | 204,794 | (a) | ||||||||||
Total Tobacco | 736,871 | |||||||||||||||
Total Consumer Staples | 1,029,423 | |||||||||||||||
| Energy — 16.9% | ||||||||||||||||
Oil, Gas & Consumable Fuels — 16.9% | ||||||||||||||||
Cameron LNG LLC, Senior Secured Notes | 2.902 | % | 7/15/31 | 30,000 | 31,011 | (a) | ||||||||||
Chesapeake Energy Corp., Senior Notes | 7.000 | % | 10/1/24 | 250,000 | 131,255 | |||||||||||
Cimarex Energy Co., Senior Notes | 4.375 | % | 6/1/24 | 130,000 | 138,182 | |||||||||||
Cimarex Energy Co., Senior Notes | 4.375 | % | 3/15/29 | 10,000 | 10,640 | |||||||||||
Concho Resources Inc., Senior Notes | 4.375 | % | 1/15/25 | 130,000 | 134,397 | |||||||||||
Continental Resources Inc., Senior Notes | 4.500 | % | 4/15/23 | 240,000 | 253,373 | |||||||||||
Ecopetrol SA, Senior Notes | 5.875 | % | 9/18/23 | 120,000 | 133,860 | |||||||||||
Energy Transfer Operating LP, Senior Notes | 4.200 | % | 9/15/23 | 60,000 | 63,719 | |||||||||||
Energy Transfer Operating LP, Senior Notes | 4.050 | % | 3/15/25 | 250,000 | 265,371 | |||||||||||
Energy Transfer Operating LP, Senior Notes | 2.900 | % | 5/15/25 | 130,000 | 131,457 | |||||||||||
Enterprise Products Operating LLC, Senior Notes | 3.950 | % | 1/31/60 | 20,000 | 20,273 | |||||||||||
KazMunayGas National Co. JSC, Senior Notes | 4.750 | % | 4/24/25 | 250,000 | 275,875 | (a) | ||||||||||
MEG Energy Corp., Senior Notes | 7.125 | % | 2/1/27 | 40,000 | 39,612 | (a) | ||||||||||
MPLX LP, Senior Notes | 3.375 | % | 3/15/23 | 70,000 | 72,957 | |||||||||||
Oasis Petroleum Inc., Senior Notes | 6.875 | % | 3/15/22 | 80,000 | 76,800 | |||||||||||
Oasis Petroleum Inc., Senior Notes | 6.875 | % | 1/15/23 | 95,000 | 89,864 | |||||||||||
Occidental Petroleum Corp., Senior Notes | 4.850 | % | 3/15/21 | 120,000 | 123,577 | |||||||||||
Occidental Petroleum Corp., Senior Notes | 2.900 | % | 8/15/24 | 510,000 | 520,956 | |||||||||||
Range Resources Corp., Senior Notes | 5.000 | % | 8/15/22 | 130,000 | 122,876 | |||||||||||
Range Resources Corp., Senior Notes | 9.250 | % | 2/1/26 | 80,000 | 70,815 | (a) | ||||||||||
Western Midstream Operating LP, Senior Notes | 5.375 | % | 6/1/21 | 4,000 | 4,127 | |||||||||||
Western Midstream Operating LP, Senior Notes | 4.000 | % | 7/1/22 | 581,000 | 599,100 | |||||||||||
Western Midstream Operating LP, Senior Notes | 3.950 | % | 6/1/25 | 50,000 | 51,209 | |||||||||||
Western Midstream Operating LP, Senior Notes | 4.750 | % | 8/15/28 | 370,000 | 379,804 | |||||||||||
Western Midstream Operating LP, Senior Notes | 4.050 | % | 2/1/30 | 20,000 | 19,936 | |||||||||||
Western Midstream Operating LP, Senior Notes (3 mo. USD LIBOR + 0.850%) | 2.698 | % | 1/13/23 | 50,000 | 49,977 | (b) | ||||||||||
Whiting Petroleum Corp., Senior Notes | 5.750 | % | 3/15/21 | 35,000 | 32,725 | |||||||||||
See Notes to Financial Statements
| 4 | Western Asset Short Duration Income ETF 2020 Semi-Annual Report |
Table of Contents
Western Asset Short Duration Income ETF
| Security | Rate | Maturity Date | Face Amount | Value | ||||||||||||
Oil, Gas & Consumable Fuels — continued | ||||||||||||||||
Williams Cos. Inc., Senior Notes | 7.875 | % | 9/1/21 | $ | 16,000 | $ | 17,420 | |||||||||
Williams Cos. Inc., Senior Notes | 3.700 | % | 1/15/23 | 500,000 | 520,244 | |||||||||||
WPX Energy Inc., Senior Notes | 4.500 | % | 1/15/30 | 20,000 | 20,124 | |||||||||||
Total Energy | 4,401,536 | |||||||||||||||
| Financials — 24.0% | ||||||||||||||||
Banks — 17.8% | ||||||||||||||||
Banco Santander SA, Senior Notes | 3.848 | % | 4/12/23 | 200,000 | 210,682 | |||||||||||
Bank of New York Mellon Corp., Senior Notes | 1.850 | % | 1/27/23 | 50,000 | 50,327 | |||||||||||
Barclays Bank PLC, Subordinated Notes | 7.625 | % | 11/21/22 | 350,000 | 394,720 | |||||||||||
Barclays PLC, Subordinated Notes (5.088% to 6/20/29 then 3 mo. USD LIBOR + 3.054%) | 5.088 | % | 6/20/30 | 200,000 | 229,772 | (b) | ||||||||||
BPCE SA, Senior Notes | 3.000 | % | 5/22/22 | 250,000 | 255,677 | (a) | ||||||||||
Citigroup Inc., Senior Notes | 2.900 | % | 12/8/21 | 100,000 | 101,848 | |||||||||||
Credit Suisse Group Funding Guernsey Ltd., Senior Notes | 3.125 | % | 12/10/20 | 250,000 | 252,658 | |||||||||||
Danske Bank A/S, Senior Notes | 5.000 | % | 1/12/22 | 200,000 | 210,717 | (a) | ||||||||||
Danske Bank A/S, Senior Notes | 5.375 | % | 1/12/24 | 500,000 | 556,219 | (a) | ||||||||||
Danske Bank A/S, Senior Notes (3.244% to 12/20/24 then 3 mo. USD LIBOR + 1.591%) | 3.244 | % | 12/20/25 | 200,000 | 206,990 | (a)(b) | ||||||||||
HSBC Holdings PLC, Senior Notes | 3.400 | % | 3/8/21 | 200,000 | 203,562 | |||||||||||
Intesa Sanpaolo SpA, Senior Notes | 3.125 | % | 7/14/22 | 200,000 | 203,951 | (a) | ||||||||||
Intesa Sanpaolo SpA, Subordinated Notes | 5.017 | % | 6/26/24 | 200,000 | 212,374 | (a) | ||||||||||
Lloyds Banking Group PLC, Senior Notes (2.438% to 02/05/25 then 1 year Treasury Constant Maturity Rate + 1.000%) | 2.438 | % | 2/5/26 | 200,000 | 201,329 | (b) | ||||||||||
Lloyds Banking Group PLC, Senior Notes (2.907% to 11/7/22 then 3 mo. USD LIBOR + 0.810%) | 2.907 | % | 11/7/23 | 200,000 | 204,220 | (b) | ||||||||||
Morgan Stanley, Senior Notes (2.699% to 1/22/30 then Secured Overnight Financing Rate + 1.143%) | 2.699 | % | 1/22/31 | 120,000 | 121,950 | (b) | ||||||||||
Royal Bank of Scotland Group PLC, Senior Notes (3 mo. USD LIBOR + 1.470%) | 3.380 | % | 5/15/23 | 260,000 | 264,314 | (b) | ||||||||||
Royal Bank of Scotland Group PLC, Subordinated Notes (3.754% to 11/1/24 then 5 year Treasury Constant Maturity Rate + 2.100%) | 3.754 | % | 11/1/29 | 200,000 | 207,769 | (b) | ||||||||||
Sumitomo Mitsui Financial Group Inc., Senior Notes | 2.442 | % | 10/19/21 | 150,000 | 151,850 | |||||||||||
UniCredit SpA, Senior Notes | 6.572 | % | 1/14/22 | 350,000 | 376,605 | (a) | ||||||||||
Total Banks | 4,617,534 | |||||||||||||||
See Notes to Financial Statements
| Western Asset Short Duration Income ETF 2020 Semi-Annual Report | 5 |
Table of Contents
Schedule of investments(unaudited) (cont’d)
January 31, 2020
Western Asset Short Duration Income ETF
| Security | Rate | Maturity Date | Face Amount | Value | ||||||||||||
Capital Markets — 0.8% | ||||||||||||||||
Goldman Sachs Group Inc., Senior Notes | 5.750 | % | 1/24/22 | $ | 140,000 | $ | 150,565 | |||||||||
Owl Rock Capital Corp., Senior Notes | 4.000 | % | 3/30/25 | 50,000 | 51,607 | |||||||||||
Total Capital Markets | 202,172 | |||||||||||||||
Consumer Finance — 0.5% | ||||||||||||||||
Synchrony Financial, Senior Notes | 2.850 | % | 7/25/22 | 130,000 | 132,523 | |||||||||||
Diversified Financial Services — 3.9% | ||||||||||||||||
AerCap Ireland Capital DAC/AerCap Global Aviation Trust, Senior Notes | 3.950 | % | 2/1/22 | 500,000 | 517,500 | |||||||||||
GE Capital International Funding Co. Unlimited Co., Senior Notes | 3.373 | % | 11/15/25 | 260,000 | 275,811 | |||||||||||
Global Aircraft Leasing Co. Ltd., Senior Notes (6.500% Cash or 7.250% PIK) | 6.500 | % | 9/15/24 | 100,000 | 102,305 | (a)(c) | ||||||||||
Park Aerospace Holdings Ltd., Senior Notes | 5.250 | % | 8/15/22 | 125,000 | 133,715 | (a) | ||||||||||
Total Diversified Financial Services | 1,029,331 | |||||||||||||||
Insurance — 0.2% | ||||||||||||||||
Reliance Standard Life Global Funding II, Secured Notes | 2.500 | % | 10/30/24 | 60,000 | 61,019 | (a) | ||||||||||
Investment Companies — 0.8% | ||||||||||||||||
MDGH — GMTN BV, Senior Notes | 2.500 | % | 11/7/24 | 200,000 | 201,600 | (a) | ||||||||||
Total Financials | 6,244,179 | |||||||||||||||
| Health Care — 8.0% | ||||||||||||||||
Biotechnology — 0.8% | ||||||||||||||||
AbbVie Inc., Senior Notes | 2.950 | % | 11/21/26 | 210,000 | 216,902 | (a) | ||||||||||
Health Care Equipment & Supplies — 1.6% | ||||||||||||||||
Alcon Finance Corp., Senior Notes | 2.750 | % | 9/23/26 | 200,000 | 207,184 | (a) | ||||||||||
Becton Dickinson and Co., Senior Notes | 2.894 | % | 6/6/22 | 190,000 | 194,379 | |||||||||||
Total Health Care Equipment & Supplies | 401,563 | |||||||||||||||
Health Care Providers & Services — 3.2% | ||||||||||||||||
Centene Corp., Senior Notes | 4.750 | % | 1/15/25 | 50,000 | 51,604 | (a) | ||||||||||
Centene Corp., Senior Notes | 4.250 | % | 12/15/27 | 10,000 | 10,425 | (a) | ||||||||||
Centene Corp., Senior Notes | 4.625 | % | 12/15/29 | 50,000 | 53,745 | (a) | ||||||||||
CVS Health Corp., Senior Notes | 3.350 | % | 3/9/21 | 60,000 | 61,039 | |||||||||||
CVS Health Corp., Senior Notes | 3.700 | % | 3/9/23 | 460,000 | 482,733 | |||||||||||
CVS Health Corp., Senior Notes | 2.625 | % | 8/15/24 | 80,000 | 81,955 | |||||||||||
Magellan Health Inc., Senior Notes | 4.900 | % | 9/22/24 | 80,000 | 83,300 | |||||||||||
Total Health Care Providers & Services | 824,801 | |||||||||||||||
Pharmaceuticals — 2.4% | ||||||||||||||||
Bausch Health Americas Inc., Senior Notes | 9.250 | % | 4/1/26 | 250,000 | 285,313 | (a) | ||||||||||
See Notes to Financial Statements
| 6 | Western Asset Short Duration Income ETF 2020 Semi-Annual Report |
Table of Contents
Western Asset Short Duration Income ETF
| Security | Rate | Maturity Date | Face Amount | Value | ||||||||||||
Pharmaceuticals — continued | ||||||||||||||||
Teva Pharmaceutical Finance Netherlands III BV, Senior Notes | 2.200 | % | 7/21/21 | $ | 140,000 | $ | 137,410 | |||||||||
Teva Pharmaceutical Finance Netherlands III BV, Senior Notes | 7.125 | % | 1/31/25 | 200,000 | 210,504 | (a) | ||||||||||
Total Pharmaceuticals | 633,227 | |||||||||||||||
Total Health Care | 2,076,493 | |||||||||||||||
| Industrials — 6.9% | ||||||||||||||||
Aerospace & Defense — 1.3% | ||||||||||||||||
Avolon Holdings Funding Ltd., Senior Notes | 3.625 | % | 5/1/22 | 50,000 | 51,489 | (a) | ||||||||||
Avolon Holdings Funding Ltd., Senior Notes | 2.875 | % | 2/15/25 | 30,000 | 30,263 | (a) | ||||||||||
L3Harris Technologies Inc., Senior Notes | 3.832 | % | 4/27/25 | 250,000 | 270,842 | |||||||||||
Total Aerospace & Defense | 352,594 | |||||||||||||||
Airlines — 1.6% | ||||||||||||||||
America West Airlines Pass-Through Trust | 7.100 | % | 4/2/21 | 59,552 | 61,068 | |||||||||||
American Airlines Group Inc. Pass-Through Trust | 4.375 | % | 10/1/22 | 27,326 | 28,281 | |||||||||||
Continental Airlines2007-1 Class BPass-Through Trust | 6.903 | % | 4/19/22 | 174,199 | 183,514 | |||||||||||
Continental Airlines Pass-Through Trust | 6.250 | % | 4/11/20 | 92,467 | 93,004 | |||||||||||
Continental Airlines Pass-Through Trust | 9.798 | % | 4/1/21 | 33,731 | 34,643 | |||||||||||
U.S. Airways Pass-Through Trust | 6.750 | % | 6/3/21 | 6,742 | 7,085 | |||||||||||
Total Airlines | 407,595 | |||||||||||||||
Commercial Services & Supplies — 0.4% | ||||||||||||||||
Republic Services Inc., Senior Notes | 2.500 | % | 8/15/24 | 100,000 | 102,472 | |||||||||||
Industrial Conglomerates — 1.3% | ||||||||||||||||
General Electric Co., Senior Notes | 2.700 | % | 10/9/22 | 330,000 | 336,266 | |||||||||||
Trading Companies & Distributors — 2.3% | ||||||||||||||||
Air Lease Corp., Senior Notes | 3.000 | % | 9/15/23 | 250,000 | 257,620 | |||||||||||
Aviation Capital Group LLC, Senior Notes | 4.125 | % | 8/1/25 | 320,000 | 341,215 | (a) | ||||||||||
Total Trading Companies & Distributors | 598,835 | |||||||||||||||
Total Industrials | 1,797,762 | |||||||||||||||
| Information Technology — 5.6% | ||||||||||||||||
IT Services — 0.3% | ||||||||||||||||
PayPal Holdings Inc., Senior Notes | 2.400 | % | 10/1/24 | 80,000 | 81,555 | |||||||||||
Semiconductors & Semiconductor Equipment — 1.3% | ||||||||||||||||
Broadcom Corp./Broadcom Cayman Finance Ltd., Senior Notes | 2.650 | % | 1/15/23 | 70,000 | 71,005 | |||||||||||
Micron Technology Inc., Senior Notes | 4.640 | % | 2/6/24 | 250,000 | 272,839 | |||||||||||
Total Semiconductors & Semiconductor Equipment | 343,844 | |||||||||||||||
See Notes to Financial Statements
| Western Asset Short Duration Income ETF 2020 Semi-Annual Report | 7 |
Table of Contents
Schedule of investments(unaudited) (cont’d)
January 31, 2020
Western Asset Short Duration Income ETF
| Security | Rate | Maturity Date | Face Amount | Value | ||||||||||||
Software — 1.0% | ||||||||||||||||
Adobe Inc., Senior Notes | 2.150 | % | 2/1/27 | $ | 80,000 | $ | 81,091 | (d) | ||||||||
Adobe Inc., Senior Notes | 2.300 | % | 2/1/30 | 180,000 | 182,418 | (d) | ||||||||||
Total Software | 263,509 | |||||||||||||||
Technology Hardware, Storage & Peripherals — 3.0% | ||||||||||||||||
Dell International LLC/EMC Corp., Senior Secured Notes | 4.420 | % | 6/15/21 | 740,000 | 762,567 | (a) | ||||||||||
Total Information Technology | 1,451,475 | |||||||||||||||
| Materials — 6.3% | ||||||||||||||||
Metals & Mining — 5.5% | ||||||||||||||||
Anglo American Capital PLC, Senior Notes | 3.750 | % | 4/10/22 | 200,000 | 206,548 | (a) | ||||||||||
ArcelorMittal SA, Senior Notes | 6.250 | % | 2/25/22 | 151,000 | 162,249 | |||||||||||
ArcelorMittal SA, Senior Notes | 3.600 | % | 7/16/24 | 10,000 | 10,348 | |||||||||||
ArcelorMittal SA, Senior Notes | 6.125 | % | 6/1/25 | 460,000 | 529,570 | |||||||||||
First Quantum Minerals Ltd., Senior Notes | 7.500 | % | 4/1/25 | 200,000 | 197,000 | (a) | ||||||||||
Glencore Finance Canada Ltd., Senior Notes | 4.250 | % | 10/25/22 | 240,000 | 251,393 | (a) | ||||||||||
Yamana Gold Inc., Senior Notes | 4.625 | % | 12/15/27 | 60,000 | 64,099 | |||||||||||
Total Metals & Mining | 1,421,207 | |||||||||||||||
Paper & Forest Products — 0.8% | ||||||||||||||||
Suzano Austria GmbH, Senior Notes | 5.000 | % | 1/15/30 | 200,000 | 211,160 | |||||||||||
Total Materials | 1,632,367 | |||||||||||||||
| Real Estate — 1.1% | ||||||||||||||||
Equity Real Estate Investment Trusts (REITs) — 1.1% | ||||||||||||||||
CoreCivic Inc., Senior Notes | 5.000 | % | 10/15/22 | 260,000 | 266,500 | |||||||||||
VICI Properties LP/VICI Note Co. Inc., Senior Notes | 3.750 | % | 2/15/27 | 10,000 | 10,050 | (a)(d) | ||||||||||
VICI Properties LP/VICI Note Co. Inc., Senior Notes | 4.125 | % | 8/15/30 | 10,000 | 10,128 | (a)(d) | ||||||||||
Total Real Estate | 286,678 | |||||||||||||||
| Utilities — 0.6% | ||||||||||||||||
Electric Utilities — 0.4% | ||||||||||||||||
Southern California Edison Co. | 2.900 | % | 3/1/21 | 100,000 | 101,166 | |||||||||||
Multi-Utilities — 0.2% | ||||||||||||||||
DTE Energy Co., Senior Notes | 3.300 | % | 6/15/22 | 50,000 | 51,494 | |||||||||||
Total Utilities | 152,660 | |||||||||||||||
Total Corporate Bonds & Notes (Cost — $21,830,213) | 22,614,763 | |||||||||||||||
| Asset-Backed Securities — 7.0% | ||||||||||||||||
Halcyon Loan Advisors Funding Ltd.,2017-2A A2 (3 mo. USD LIBOR + 1.700%) | 3.536 | % | 1/17/30 | 250,000 | 249,109 | (a)(b) | ||||||||||
Parallel Ltd.,2018-2A A2 (3 mo. USD LIBOR + 1.850%) | 3.669 | % | 10/20/31 | 250,000 | 250,102 | (a)(b) | ||||||||||
Regatta Funding Ltd.,2016-1A BR (3 mo. USD LIBOR + 1.450%) | 3.269 | % | 7/20/28 | 250,000 | �� | 250,273 | (a)(b) | |||||||||
See Notes to Financial Statements
| 8 | Western Asset Short Duration Income ETF 2020 Semi-Annual Report |
Table of Contents
Western Asset Short Duration Income ETF
| Security | Rate | Maturity Date | Face Amount | Value | ||||||||||||
| Asset-Backed Securities — continued | ||||||||||||||||
Shackleton CLO Ltd.,2013-3A BR (3 mo. USD LIBOR + 1.550%) | 3.381 | % | 7/15/30 | $ | 250,000 | $ | 249,747 | (a)(b) | ||||||||
Symphony CLO XVIII Ltd.,2016-18A B (3 mo. USD LIBOR + 1.800%) | 3.606 | % | 1/23/28 | 250,000 | 249,873 | (a)(b) | ||||||||||
Upgrade Receivables Trust,2018-1A C | 5.170 | % | 11/15/24 | 550,000 | 561,879 | (a) | ||||||||||
Total Asset-Backed Securities (Cost — $1,790,078) | 1,810,983 | |||||||||||||||
| Sovereign Bonds — 2.4% | ||||||||||||||||
Argentina — 0.3% | ||||||||||||||||
Argentine Republic Government International Bond, Senior Notes | 5.625 | % | 1/26/22 | 140,000 | 68,880 | |||||||||||
Ghana — 0.8% | ||||||||||||||||
Ghana Government International Bond, Senior Notes | 7.875 | % | 3/26/27 | 200,000 | 213,760 | (a) | ||||||||||
Oman — 0.8% | ||||||||||||||||
Oman Government International Bond, Senior Notes | 3.875 | % | 3/8/22 | 200,000 | 202,000 | (a) | ||||||||||
South Africa — 0.5% | ||||||||||||||||
Republic of South Africa Government International Bond, Senior Notes | 5.875 | % | 5/30/22 | 120,000 | 128,400 | |||||||||||
Total Sovereign Bonds (Cost — $651,672) | 613,040 | |||||||||||||||
| Collateralized Mortgage Obligations(e)— 2.3% | ||||||||||||||||
BX Trust, 2017-APPL D (1 mo. USD LIBOR + 2.050%) | 3.726 | % | 7/15/34 | 340,000 | 340,420 | (a)(b) | ||||||||||
CSMC Trust, 2017-CHOP D (1 mo. USD LIBOR + 1.900%) | 3.576 | % | 7/15/32 | 270,000 | 269,995 | (a)(b) | ||||||||||
Total Collateralized Mortgage Obligations (Cost — $609,275) |
| 610,415 | ||||||||||||||
| U.S. Government & Agency Obligations — 0.1% | ||||||||||||||||
U.S. Government Obligations — 0.1% | ||||||||||||||||
U.S. Treasury Notes (Cost — $30,588) | 1.750 | % | 12/31/24 | 30,000 | 30,600 | |||||||||||
Total Investments before Short-Term Investments (Cost — $24,911,826) |
| 25,679,801 | ||||||||||||||
| Shares | ||||||||||||||||
| Short-Term Investments — 2.7% | ||||||||||||||||
BNY Mellon Cash Reserve Fund (Cost — $704,894) | 0.250 | % | 704,894 | 704,894 | ||||||||||||
Total Investments — 101.5% (Cost — $25,616,720) | 26,384,695 | |||||||||||||||
Liabilities in Excess of Other Assets — (1.5)% | (393,503 | ) | ||||||||||||||
Total Net Assets — 100.0% | $ | 25,991,192 | ||||||||||||||
See Notes to Financial Statements
| Western Asset Short Duration Income ETF 2020 Semi-Annual Report | 9 |
Table of Contents
Schedule of investments(unaudited) (cont’d)
January 31, 2020
Western Asset Short Duration Income ETF
| (a) | Security is exempt from registration under Rule 144A of the Securities Act of 1933. This security may be resold in transactions that are exempt from registration, normally to qualified institutional buyers. This security has been deemed liquid pursuant to guidelines approved by the Board of Trustees. |
| (b) | Variable rate security. Interest rate disclosed is as of the most recent information available. Certain variable rate securities are not based on a published reference rate and spread but are determined by the issuer or agent and are based on current market conditions. These securities do not indicate a reference rate and spread in their description above. |
| (c) | Payment-in-kind security for which the issuer has the option at each interest payment date of making interest payments in cash or additional securities. |
| (d) | Securities traded on a when-issued or delayed delivery basis. |
| (e) | Collateralized mortgage obligations are secured by an underlying pool of mortgages or mortgage pass-through certificates that are structured to direct payments on underlying collateral to different series or classes of the obligations. The interest rate may change positively or inversely in relation to one or more interest rates, financial indices or other financial indicators and may be subject to an upper and/or lower limit. |
Abbreviations used in this schedule: | ||
| CLO | — Collateralized Loan Obligation | |
| JSC | — Joint Stock Company | |
| LIBOR | — London Interbank Offered Rate | |
| PIK | —Payment-In-Kind | |
| USD | — United States Dollar | |
At January 31, 2020, the Fund had the following open futures contracts:
| Number of Contracts | Expiration Date | Notional Amount | Market Value | Unrealized Appreciation (Depreciation) | ||||||||||||||||
| Contracts to Buy: | ||||||||||||||||||||
| U.S. Treasury10-Year Notes | 10 | 3/20 | $ | 1,292,986 | $ | 1,316,562 | $ | 23,576 | ||||||||||||
| U.S. Treasury2-Year Notes | 8 | 3/20 | 1,724,389 | 1,730,875 | 6,486 | |||||||||||||||
| U.S. Treasury5-Year Notes | 127 | 3/20 | 15,127,040 | 15,280,680 | 153,640 | |||||||||||||||
| 183,702 | ||||||||||||||||||||
| Contracts to Sell: | ||||||||||||||||||||
| U.S. Treasury Long-Term Bonds | 36 | 3/20 | 5,734,831 | 5,887,125 | (152,294) | |||||||||||||||
| U.S. Treasury Ultra Long- | ||||||||||||||||||||
| Term Bonds | 1 | 3/20 | 188,311 | 193,687 | (5,376) | |||||||||||||||
| (157,670) | ||||||||||||||||||||
| Net unrealized appreciation on open futures contracts |
| $ | 26,032 | |||||||||||||||||
See Notes to Financial Statements
| 10 | Western Asset Short Duration Income ETF 2020 Semi-Annual Report |
Table of Contents
Statement of assets and liabilities(unaudited)
January 31, 2020
| Assets: | ||||
Investments, at value (Cost — $25,616,720) | $ | 26,384,695 | ||
Interest receivable | 250,992 | |||
Deposits with brokers for open futures contracts | 54,657 | |||
Receivable for securities sold | 42,013 | |||
Receivable from broker — variation margin on open futures contracts | 15,443 | |||
Total Assets | 26,747,800 | |||
| Liabilities: | ||||
Payable for securities purchased | 750,253 | |||
Investment management fee payable | 6,355 | |||
Total Liabilities | 756,608 | |||
| Total Net Assets | $ | 25,991,192 | ||
| Net Assets: | ||||
Par value (Note 5) | $ | 10 | ||
Paid-in capital in excess of par value | 24,999,990 | |||
Total distributable earnings (loss) | 991,192 | |||
Total Net Assets | $ | 25,991,192 | ||
| Shares Outstanding | 1,000,000 | |||
| Net Asset Value | $ | 25.99 | ||
See Notes to Financial Statements
| Western Asset Short Duration Income ETF 2020 Semi-Annual Report | 11 |
Table of Contents
Statement of operations(unaudited)
For the Six Months Ended January 31, 2020
| Investment Income: | ||||
Interest | $ | 543,714 | ||
| Expenses: | ||||
Investment management fee (Note 2) | 37,529 | |||
Total Expenses | 37,529 | |||
| Net Investment Income | 506,185 | |||
| Realized and Unrealized Gain (Loss) on Investments and Futures Contracts (Notes 1, 3 and 4): | ||||
Net Realized Gain (Loss) From: | ||||
Investment transactions | 185,141 | |||
Futures contracts | (122,352) | |||
Net Realized Gain | 62,789 | |||
Change in Net Unrealized Appreciation (Depreciation) From: | ||||
Investments | 170,568 | |||
Futures contracts | 12,850 | |||
Change in Net Unrealized Appreciation (Depreciation) | 183,418 | |||
| Net Gain on Investments and Futures Contracts | 246,207 | |||
| Increase in Net Assets From Operations | $ | 752,392 | ||
See Notes to Financial Statements
| 12 | Western Asset Short Duration Income ETF 2020 Semi-Annual Report |
Table of Contents
Statements of changes in net assets
| For the Six Months Ended January 31, 2020 (unaudited) and the Year Ended July 31, 2019 | 2020 | 2019 | ||||||
| Operations: | ||||||||
Net investment income | $ | 506,185 | $ | 483,262 | ||||
Net realized gain | 62,789 | 104,264 | ||||||
Change in net unrealized appreciation (depreciation) | 183,418 | 610,589 | ||||||
Increase in Net Assets From Operations | 752,392 | 1,198,115 | ||||||
| Distributions to Shareholders From (Note 1): | ||||||||
Total distributable earnings | (562,365) | (396,950) | ||||||
Decrease in Net Assets From Distributions to Shareholders | (562,365) | (396,950) | ||||||
| Fund Share Transactions (Note 5): | ||||||||
Net proceeds from sale of shares (0 and 1,000,000 shares issued, respectively) | — | 25,000,000 | ||||||
Increase in Net Assets From Fund Share Transactions | — | 25,000,000 | ||||||
Increase in Net Assets | 190,027 | 25,801,165 | ||||||
| Net Assets: | ||||||||
Beginning of period | 25,801,165 | — | ||||||
End of period | $ | 25,991,192 | $ | 25,801,165 | ||||
See Notes to Financial Statements
| Western Asset Short Duration Income ETF 2020 Semi-Annual Report | 13 |
Table of Contents
| For a share of beneficial interest outstanding throughout each year ended July 31, unless otherwise noted: | ||||||||
| 20201,2 | 20191,3 | |||||||
| Net asset value, beginning of period | $25.80 | $25.00 | ||||||
| Income from operations: | ||||||||
Net investment income | 0.51 | 0.48 | ||||||
Net realized and unrealized gain | 0.25 | 0.72 | ||||||
Total income from operations | 0.76 | 1.20 | ||||||
| Less distributions from: | ||||||||
Net investment income | (0.46) | (0.40) | ||||||
Net realized gains | (0.11) | — | ||||||
Total distributions | (0.57) | (0.40) | ||||||
| Net asset value, end of period | $25.99 | $25.80 | ||||||
Total return, based on NAV4 | 2.96 | % | 4.82 | % | ||||
| Net assets, end of period (000s) | $25,991 | $25,801 | ||||||
| Ratios to average net assets: | ||||||||
Gross expenses5 | 0.29 | % | 0.29 | % | ||||
Net expenses5 | 0.29 | 0.29 | ||||||
Net investment income5 | 3.91 | 3.99 | ||||||
| Portfolio turnover rate6 | 25 | % | 54 | % | ||||
| 1 | Per share amounts have been calculated using the average shares method. |
| 2 | For the six months ended January 31, 2020 (unaudited). |
| 3 | For the period February 7, 2019 (inception date) to July 31, 2019. |
| 4 | Performance figures may reflect fee waivers and/or expense reimbursements. In the absence of fee waivers and/or expense reimbursements, the total return would have been lower. The total return calculation assumes that distributions are reinvested at NAV. Past performance is no guarantee of future results. Total returns for periods of less than one year are not annualized. |
| 5 | Annualized. |
| 6 | Portfolio turnover excludes the value of portfolio securities received or delivered as a result ofin-kind fund share transactions. |
See Notes to Financial Statements
| 14 | Western Asset Short Duration Income ETF 2020 Semi-Annual Report |
Table of Contents
Notes to financial statements(unaudited)
1. Organization and significant accounting policies
Western Asset Short Duration Income ETF (the “Fund”) is a separate diversified investment series of Legg Mason ETF Investment Trust (the “Trust”). The Trust, a Maryland statutory trust, is registered under the Investment Company Act of 1940, as amended (the “1940 Act”), as anopen-end management investment company.
The Fund is an actively managed exchange-traded fund (“ETF”). ETFs are funds that trade like other publicly-traded securities. Unlike shares of a mutual fund, which can be bought from and redeemed by the issuing fund by all shareholders at a price based on net asset value (“NAV”), shares of the Fund may be directly purchased from and redeemed by the Fund at NAV solely by certain large institutional investors who have entered into agreements with the Fund’s distributor (“Authorized Participants”). Also unlike shares of a mutual fund, shares of the Fund are listed on a national securities exchange and trade in the secondary market at market prices that change throughout the day.
Shares of the Fund are listed and traded at market prices on NASDAQ. The market price for the Fund’s shares may be different from the Fund’s NAV. The Fund issues and redeems shares at NAV only in blocks of a specified number of shares or multiples thereof (“Creation Units”). Only Authorized Participants may purchase or redeem Creation Units directly with the Fund at NAV. Creation Units generally are issued and redeemed in cash. However, Creation Units may also be issued and redeemed partiallyin-kind for a basket of securities and partially in cash. Except when aggregated in Creation Units, shares of the Fund are not redeemable securities. Shareholders who are not Authorized Participants may not redeem shares directly from the Fund at NAV.
The following are significant accounting policies consistently followed by the Fund and are in conformity with U.S. generally accepted accounting principles (“GAAP”). Estimates and assumptions are required to be made regarding assets, liabilities and changes in net assets resulting from operations when financial statements are prepared. Changes in the economic environment, financial markets and any other parameters used in determining these estimates could cause actual results to differ. Subsequent events have been evaluated through the date the financial statements were issued.
(a) Investment valuation. The valuations for fixed income securities (which may include, but are not limited to, corporate, government, municipal, mortgage-backed, collateralized mortgage obligations and asset-backed securities) and certain derivative instruments are typically the prices supplied by independent third party pricing services, which may use market prices or broker/dealer quotations or a variety of valuation techniques and methodologies. The independent third party pricing services use inputs that are observable such as issuer details, interest rates, yield curves, prepayment speeds, credit risks/spreads, default rates and quoted prices for similar securities. Investments inopen-end funds are valued at the closing net asset value per share of each fund on the day of valuation. Futures contracts are valued daily at the settlement price established by the board of trade or exchange on which they are traded. Equity securities for which market quotations are available are
| Western Asset Short Duration Income ETF 2020 Semi-Annual Report | 15 |
Table of Contents
Notes to financial statements(unaudited) (cont’d)
valued at the last reported sales price or official closing price on the primary market or exchange on which they trade. When the Fund holds securities or other assets that are denominated in a foreign currency, the Fund will use the currency exchange rates, generally determined as of 4:00 p.m. (London Time). If independent third party pricing services are unable to supply prices for a portfolio investment, or if the prices supplied are deemed by the manager to be unreliable, the market price may be determined by the manager using quotations from one or more broker/dealers or at the transaction price if the security has recently been purchased and no value has yet been obtained from a pricing service or pricing broker. When reliable prices are not readily available, such as when the value of a security has been significantly affected by events after the close of the exchange or market on which the security is principally traded, but before the Fund calculates its net asset value, the Fund values these securities as determined in accordance with procedures approved by the Fund’s Board of Trustees.
The Board of Trustees is responsible for the valuation process and has delegated the supervision of the daily valuation process to the Legg Mason North Atlantic Fund Valuation Committee (the “Valuation Committee”). The Valuation Committee, pursuant to the policies adopted by the Board of Trustees, is responsible for making fair value determinations, evaluating the effectiveness of the Fund’s pricing policies, and reporting to the Board of Trustees. When determining the reliability of third party pricing information for investments owned by the Fund, the Valuation Committee, among other things, conducts due diligence reviews of pricing vendors, monitors the daily change in prices and reviews transactions among market participants.
The Valuation Committee will consider pricing methodologies it deems relevant and appropriate when making fair value determinations. Examples of possible methodologies include, but are not limited to, multiple of earnings; discount from market of a similar freely traded security; discounted cash-flow analysis; book value or a multiple thereof; risk premium/yield analysis; yield to maturity; and/or fundamental investment analysis. The Valuation Committee will also consider factors it deems relevant and appropriate in light of the facts and circumstances. Examples of possible factors include, but are not limited to, the type of security; the issuer’s financial statements; the purchase price of the security; the discount from market value of unrestricted securities of the same class at the time of purchase; analysts’ research and observations from financial institutions; information regarding any transactions or offers with respect to the security; the existence of merger proposals or tender offers affecting the security; the price and extent of public trading in similar securities of the issuer or comparable companies; and the existence of a shelf registration for restricted securities.
For each portfolio security that has been fair valued pursuant to the policies adopted by the Board of Trustees, the fair value price is compared against the last available and next available market quotations. The Valuation Committee reviews the results of such back testing monthly and fair valuation occurrences are reported to the Board of Trustees quarterly.
| 16 | Western Asset Short Duration Income ETF 2020 Semi-Annual Report |
Table of Contents
The Fund uses valuation techniques to measure fair value that are consistent with the market approach and/or income approach, depending on the type of security and the particular circumstance. The market approach uses prices and other relevant information generated by market transactions involving identical or comparable securities. The income approach uses valuation techniques to discount estimated future cash flows to present value.
GAAP establishes a disclosure hierarchy that categorizes the inputs to valuation techniques used to value assets and liabilities at measurement date. These inputs are summarized in the three broad levels listed below:
| • | Level 1 — quoted prices in active markets for identical investments |
| • | Level 2 — other significant observable inputs (including quoted prices for similar investments, interest rates, prepayment speeds, credit risk, etc.) |
| • | Level 3 — significant unobservable inputs (including the Fund’s own assumptions in determining the fair value of investments) |
The inputs or methodologies used to value securities are not necessarily an indication of the risk associated with investing in those securities.
The following is a summary of the inputs used in valuing the Fund’s assets and liabilities carried at fair value:
| ASSETS | ||||||||||||||||
| Description | Quoted Prices (Level 1) | Other Significant Observable Inputs (Level 2) | Significant Unobservable Inputs (Level 3) | Total | ||||||||||||
| Long-term investments†: | ||||||||||||||||
Corporate bonds & notes | — | $ | 22,614,763 | — | $ | 22,614,763 | ||||||||||
Asset-backed securities | — | 1,810,983 | — | 1,810,983 | ||||||||||||
Sovereign bonds | — | 613,040 | — | 613,040 | ||||||||||||
Collateralized mortgage obligations | — | 610,415 | — | 610,415 | ||||||||||||
U.S. government & agency obligations | — | 30,600 | — | 30,600 | ||||||||||||
| Total long-term investments | — | 25,679,801 | — | 25,679,801 | ||||||||||||
| Short-term investments† | — | 704,894 | — | 704,894 | ||||||||||||
| Total investments | — | $ | 26,384,695 | — | $ | 26,384,695 | ||||||||||
| Other financial instruments: | ||||||||||||||||
Futures contracts | $ | 183,702 | — | — | $ | 183,702 | ||||||||||
| Total | $ | 183,702 | $ | 26,384,695 | — | $ | 26,568,397 | |||||||||
| LIABILITIES | ||||||||||||||||
| Description | Quoted Prices (Level 1) | Other Significant Observable Inputs (Level 2) | Significant Unobservable Inputs (Level 3) | Total | ||||||||||||
| Other financial instruments: | ||||||||||||||||
Futures contracts | $ | 157,670 | — | — | $ | 157,670 | ||||||||||
| † | See Schedule of Investments for additional detailed categorizations. |
| Western Asset Short Duration Income ETF 2020 Semi-Annual Report | 17 |
Table of Contents
Notes to financial statements(unaudited) (cont’d)
(b) Futures contracts. The Fund uses futures contracts generally to gain exposure to, or hedge against, changes in interest rates or gain exposure to, or hedge against, changes in certain asset classes. A futures contract represents a commitment for the future purchase or sale of an asset at a specified price on a specified date.
Upon entering into a futures contract, the Fund is required to deposit cash or securities with a broker in an amount equal to a certain percentage of the contract amount. This is known as the ‘‘initial margin’’ and subsequent payments (‘‘variation margin’’) are made or received by the Fund each day, depending on the daily fluctuation in the value of the contract. For certain futures, including foreign denominated futures, variation margin is not settled daily, but is recorded as a net variation margin payable or receivable. The daily changes in contract value are recorded as unrealized gains or losses in the Statement of Operations and the Fund recognizes a realized gain or loss when the contract is closed.
Futures contracts involve, to varying degrees, risk of loss in excess of the amounts reflected in the financial statements. In addition, there is the risk that the Fund may not be able to enter into a closing transaction because of an illiquid secondary market.
(c) Loan participations. The Fund may invest in loans arranged through private negotiation between one or more financial institutions. The Fund’s investment in any such loan may be in the form of a participation in or an assignment of the loan. In connection with purchasing participations, the Fund generally will have no right to enforce compliance by the borrower with the terms of the loan agreement related to the loan, or any rights ofoff-set against the borrower and the Fund may not benefit directly from any collateral supporting the loan in which it has purchased the participation.
The Fund assumes the credit risk of the borrower, the lender that is selling the participation and any other persons interpositioned between the Fund and the borrower. In the event of the insolvency of the lender selling the participation, the Fund may be treated as a general creditor of the lender and may not benefit from anyoff-set between the lender and the borrower.
(d) Securities traded on a when-issued and delayed delivery basis. The Fund may trade securities on a when-issued or delayed delivery basis. In when-issued and delayed delivery transactions, the securities are purchased or sold by the Fund with payment and delivery taking place in the future in order to secure what is considered to be an advantageous price and yield to the Fund at the time of entering into the transaction.
Purchasing such securities involves risk of loss if the value of the securities declines prior to settlement. These securities are subject to market fluctuations and their current value is determined in the same manner as for other securities.
(e) Credit and market risk. The Fund invests in high-yield and emerging market instruments that are subject to certain credit and market risks. The yields of high-yield and emerging market debt obligations reflect, among other things, perceived credit and market risks. The Fund’s investments in securities rated below investment grade typically involve risks not
| 18 | Western Asset Short Duration Income ETF 2020 Semi-Annual Report |
Table of Contents
associated with higher rated securities including, among others, greater risk related to timely and ultimate payment of interest and principal, greater market price volatility and less liquid secondary market trading. The consequences of political, social, economic or diplomatic changes may have disruptive effects on the market prices of investments held by the Fund. The Fund’s investments innon-U.S. dollar denominated securities may also result in foreign currency losses caused by devaluations and exchange rate fluctuations.
Investments in securities that are collateralized by real estate mortgages are subject to certain credit and liquidity risks. When market conditions result in an increase in default rates of the underlying mortgages and the foreclosure values of underlying real estate properties are materially below the outstanding amount of these underlying mortgages, collection of the full amount of accrued interest and principal on these investments may be doubtful. Such market conditions may significantly impair the value and liquidity of these investments and may result in a lack of correlation between their credit ratings and values.
(f) Foreign investment risks. The Fund’s investments in foreign securities may involve risks not present in domestic investments. Since securities may be denominated in foreign currencies, may require settlement in foreign currencies or pay interest or dividends in foreign currencies, changes in the relationship of these foreign currencies to the U.S. dollar can significantly affect the value of the investments and earnings of the Fund. Foreign investments may also subject the Fund to foreign government exchange restrictions, expropriation, taxation or other political, social or economic developments, all of which affect the market and/or credit risk of the investments.
(g) Counterparty risk and credit-risk-related contingent features of derivative instruments. The Fund may invest in certain securities or engage in other transactions, where the Fund is exposed to counterparty credit risk in addition to broader market risks. The Fund may invest in securities of issuers, which may also be considered counterparties as trading partners in other transactions. This may increase the risk of loss in the event of default or bankruptcy by the counterparty or if the counterparty otherwise fails to meet its contractual obligations. The Fund’s subadviser attempts to mitigate counterparty risk by (i) periodically assessing the creditworthiness of its trading partners, (ii) monitoring and/or limiting the amount of its net exposure to each individual counterparty based on its assessment and (iii) requiring collateral from the counterparty for certain transactions. Market events and changes in overall economic conditions may impact the assessment of such counterparty risk by the subadviser. In addition, declines in the values of underlying collateral received may expose the Fund to increased risk of loss.
With exchange traded and centrally cleared derivatives, there is less counterparty risk to the Fund since the exchange or clearinghouse, as counterparty to such instruments, guarantees against a possible default. The clearinghouse stands between the buyer and the seller of the contract; therefore, the credit risk is limited to failure of the clearinghouse. While offset rights may exist under applicable law, the Fund does not have a contractual right of offset against a clearing broker or clearinghouse in the event of a default of the clearing broker or clearinghouse.
| Western Asset Short Duration Income ETF 2020 Semi-Annual Report | 19 |
Table of Contents
Notes to financial statements(unaudited) (cont’d)
The Fund has entered into master agreements, such as an International Swaps and Derivatives Association, Inc. Master Agreement (“ISDA Master Agreement”) or similar agreement, with certain of its derivative counterparties that governover-the-counter derivatives and provide for general obligations, representations, agreements, collateral posting terms, netting provisions in the event of default or termination and credit related contingent features. The credit related contingent features include, but are not limited to, a percentage decrease in the Fund’s net assets or NAV over a specified period of time. If these credit related contingent features were triggered, the derivatives counterparty could terminate the positions and demand payment or require additional collateral.
Under an ISDA Master Agreement, the Fund may, under certain circumstances, offset with the counterparty certain derivative financial instruments’ payables and/or receivables with collateral held and/or posted and create one single net payment. However, absent an event of default by the counterparty or a termination of the agreement, the terms of the ISDA Master Agreements do not result in an offset of reported amounts of financial assets and financial liabilities in the Statement of Assets and Liabilities across transactions between the Fund and the applicable counterparty. The enforceability of the right to offset may vary by jurisdiction.
Collateral requirements differ by type of derivative. Collateral or margin requirements are set by the broker or exchange clearinghouse for exchange traded derivatives while collateral terms are contract specific forover-the-counter traded derivatives. Cash collateral that has been pledged to cover obligations of the Fund under derivative contracts, if any, will be reported separately in the Statement of Assets and Liabilities. Securities pledged as collateral, if any, for the same purpose are noted in the Schedule of Investments.
As of January 31, 2020, the Fund did not have any open OTC derivative transactions with credit related contingent features in a net liability position.
(h) Security transactions and investment income. Security transactions are accounted for on a trade date basis. Interest income (including interest income frompayment-in-kind securities), adjusted for amortization of premium and accretion of discount, is recorded on the accrual basis. Paydown gains and losses on mortgage- and asset-backed securities are recorded as adjustments to interest income. Dividend income is recorded on theex-dividend date for dividends received in cash and/or securities. The cost of investments sold is determined by use of the specific identification method. To the extent any issuer defaults or a credit event occurs that impacts the issuer, the Fund may halt any additional interest income accruals and consider the realizability of interest accrued up to the date of default or credit event.
(i) Distributions to shareholders. Distributions from net investment income are declared and paid monthly. Distributions of net realized gains, if any, are declared at least annually. Distributions to shareholders of the Fund are recorded on theex-dividend date and are determined in accordance with income tax regulations, which may differ from GAAP.
| 20 | Western Asset Short Duration Income ETF 2020 Semi-Annual Report |
Table of Contents
(j) Federal and other taxes. It is the Fund’s policy to comply with the federal income and excise tax requirements of the Internal Revenue Code of 1986 (the “Code”), as amended, applicable to regulated investment companies. Accordingly, the Fund intends to distribute its taxable income and net realized gains, if any, to shareholders in accordance with timing requirements imposed by the Code. Therefore, no federal or state income tax provision is required in the Fund’s financial statements.
Management has analyzed the Fund’s tax positions taken on income tax returns for all open tax years and has concluded that as of July 31, 2019, no provision for income tax is required in the Fund’s financial statements. The Fund’s federal and state income and federal excise tax returns for tax years for which the applicable statutes of limitations have not expired are subject to examination by the Internal Revenue Service and state departments of revenue.
(k) Reclassification. GAAP requires that certain components of net assets be reclassified to reflect permanent differences between financial and tax reporting. These reclassifications have no effect on net assets or net asset value per share.
2. Investment management agreement and other transactions with affiliates
Legg Mason Partners Fund Advisor, LLC (“LMPFA”) is the Fund’s investment manager. Western Asset Management Company, LLC (“Western Asset”), is the Fund’s subadviser and Western Asset Management Company Pte. Ltd. in Singapore (“Western Asset Singapore”), Western Asset Management Company Ltd in Japan (“Western Asset Japan”) and Western Asset Management Company Limited in London (“Western Asset London”) are the Fund’ssub-subadvisers. LMPFA, Western Asset, Western Asset Singapore, Western Asset Japan and Western Asset London are wholly-owned subsidiaries of Legg Mason, Inc. (“Legg Mason”).
LMPFA provides administrative and certain oversight services to the Fund. LMPFA delegates to the subadviser theday-to-day portfolio management of the Fund. The Fund is responsible for paying interest expenses, taxes, brokerage expenses, future12b-1 fees (if any), acquired fund fees and expenses, extraordinary expenses and the management fee payable to LMPFA under the investment management agreement.
Under the investment management agreement and subject to the general supervision of the Fund’s Board of Trustees, LMPFA provides or causes to be furnished all investment management, supervisory, administrative and other services reasonably necessary for the operation of the Fund, including certain distribution services (provided pursuant to a separate distribution agreement) and investment advisory services (provided pursuant to separate subadvisory agreements) under a unitary fee structure. The Fund pays an investment management fee, calculated daily and paid monthly, at an annual rate of 0.29% of the Fund’s average daily net assets.
As compensation for its subadvisory services, LMPFA pays Western Asset monthly 70% of the management fee paid by the Fund to LMPFA, net of (i) all fees and expenses incurred by
| Western Asset Short Duration Income ETF 2020 Semi-Annual Report | 21 |
Table of Contents
Notes to financial statements(unaudited) (cont’d)
LMPFA under the investment management agreement (including without limitation any subadvisory fee paid to another subadviser to the Fund) and (ii) expense waivers, if any, and reimbursements. Western Asset pays Western Asset Singapore, Western Asset Japan and Western Asset London a monthly subadvisory fee in an amount equal to 100% of the management fee paid to Western Asset on the assets that Western Asset allocates to each suchnon-U.S. subadviser to manage.
Legg Mason Investor Services, LLC, a wholly-owned broker-dealer subsidiary of Legg Mason, serves as the distributor of Creation Units for the Fund on an agency basis.
The Fund’s Board of Trustees has adopted a Rule12b-1 shareholder services and distribution plan and under that plan, the Fund is authorized to pay service and/or distribution fees calculated at an annual rate of up to 0.25% of its average daily net assets. No service and/or distribution fees are currently paid by the Fund, and there are no current plans to impose these fees.
All officers and one Trustee of the Fund are employees of Legg Mason or its affiliates and do not receive compensation from the Fund.
3. Investments
During the six months ended January 31, 2020, the aggregate cost of purchases and proceeds from sales of investments (excludingin-kind transactions and short-term investments) and U.S. Government & Agency Obligations were as follows:
| Investments | U.S. Government & Agency Obligations | |||||||
| Purchases | $ | 4,831,794 | $ | 1,556,279 | ||||
| Sales | 4,156,436 | 2,181,490 | ||||||
During the six months ended January 31, 2020, there were noin-kind transactions (Note 5).
At January 31, 2020, the aggregate cost of investments and the aggregate gross unrealized appreciation and depreciation of investments for federal income tax purposes were substantially as follows:
| Cost | Gross Unrealized Appreciation | Gross Unrealized Depreciation | Net Unrealized Appreciation | |||||||||||||
| Securities | $ | 25,616,720 | $ | 964,528 | $ | (196,553) | $ | 767,975 | ||||||||
| Futures contracts | — | 183,702 | (157,670) | 26,032 | ||||||||||||
| 22 | Western Asset Short Duration Income ETF 2020 Semi-Annual Report |
Table of Contents
4. Derivative instruments and hedging activities
Below is a table, grouped by derivative type, that provides information about the fair value and the location of derivatives within the Statement of Assets and Liabilities at January 31, 2020.
| ASSET DERIVATIVES1 | ||||
| Interest Rate Risk | ||||
| Futures contracts2 | $ | 183,702 | ||
| LIABILITY DERIVATIVES1 | ||||
| Interest Rate Risk | ||||
| Futures contracts2 | $ | 157,670 | ||
| 1 | Generally, the balance sheet location for asset derivatives is receivables/net unrealized appreciation (depreciation) and for liability derivatives is payables/net unrealized appreciation (depreciation). |
| 2 | Includes cumulative appreciation (depreciation) of futures contracts as reported in the Schedule of Investments. Only variation margin is reported within the receivables and/or payables on the Statement of Assets and Liabilities. |
The following tables provide information about the effect of derivatives and hedging activities on the Fund’s Statement of Operations for the six months ended January 31, 2020. The first table provides additional detail about the amounts and sources of gains (losses) realized on derivatives during the period. The second table provides additional information about the change in unrealized appreciation (depreciation) resulting from the Fund’s derivatives and hedging activities during the period.
| AMOUNT OF REALIZED GAIN (LOSS) ON DERIVATIVES RECOGNIZED | ||||
| Interest Rate Risk | ||||
| Futures contracts | $ | (122,352) | ||
| CHANGE IN UNREALIZED APPRECIATION (DEPRECIATION) ON DERIVATIVES RECOGNIZED | ||||
| Interest Rate Risk | ||||
| Futures contracts | $ | 12,850 | ||
During the six months ended January 31, 2020, the volume of derivative activity for the Fund was as follows:
| Average Market Value | ||||
| Futures contracts (to buy) | $ | 17,963,504 | ||
| Futures contracts (to sell) | 5,654,922 | |||
5. Fund share transactions
At January 31, 2020, the Trust had an unlimited number of shares of beneficial interest authorized with a par value of $0.00001 per share. Fund shares are issued and redeemed by the Fund only in Creation Units or Creation Unit aggregations, where 100,000 shares of the Fund constitute a Creation Unit. Such transactions are generally on a cash basis. However,
| Western Asset Short Duration Income ETF 2020 Semi-Annual Report | 23 |
Table of Contents
Notes to financial statements(unaudited) (cont’d)
Creation Units may also be issued and redeemed partiallyin-kind for a basket of securities and partially in cash. Transactions in capital shares of the Fund are disclosed in detail in the Statement of Changes in Net Assets. Authorized Participants are subject to standard creation and redemption transaction fees to offset transfer and other transaction costs associated with the issuance and redemption of Creation Units. Creations and redemptions for cash (when cash creations and redemptions are available or specified) may be subject to an additional variable fee.
6. Subsequent event
On February 18, 2020, Franklin Resources, Inc. (“Franklin Resources”) and Legg Mason, Inc. (“Legg Mason”) announced that they have entered into a definitive agreement for Franklin Resources to acquire Legg Mason in anall-cash transaction. As part of this transaction, the Fund’s investment adviser (the “Manager”), currently a wholly owned subsidiary of Legg Mason, would become a wholly owned subsidiary of Franklin Resources. The transaction is subject to approval by Legg Mason’s shareholders and customary closing conditions, including receipt of applicable regulatory approvals. Subject to such approvals and the satisfaction of the other conditions, the transaction is expected to be consummated later this year.
Under the Investment Company Act of 1940, consummation of the transaction will result in the automatic termination of the Fund’s investment management contract with the Manager, and any relatedsub-advisory contract(s), where applicable. Therefore, the Fund’s Board is expected to be asked to approve a new investment management contract between the Fund and the Manager (and a newsub-advisory contract(s), if applicable). If approved by the Board, the new investment management contract (and the newsub-advisory contract(s), if applicable) is expected to be presented to the shareholders of the Fund for their approval.
| 24 | Western Asset Short Duration Income ETF 2020 Semi-Annual Report |
Table of Contents
Western Asset
Short Duration Income ETF
Trustees
Paul R. Ades
Andrew L. Breech
Dwight B. Crane
Althea L. Duersten
Stephen R. Gross
Susan M. Heilbron
Frank G. Hubbard
Howard J. Johnson
Chairman
Jerome H. Miller
Ken Miller
Thomas F. Schlafly
Jane Trust
Investment manager
Legg Mason Partners Fund Advisor, LLC
Subadvisers
Western Asset Management Company, LLC
Western Asset Management Company Limited
Western Asset Management Company Ltd
Western Asset Management Company Pte. Ltd.
Custodian
The Bank of New York Mellon
Transfer agent
The Bank of New York Mellon
240 Greenwich Street
New York, NY 10286
Independent registered public accounting firm
PricewaterhouseCoopers LLP
Baltimore, MD
Western Asset Short Duration Income ETF
The Fund is a separate investment series of Legg Mason ETF Investment Trust, a Maryland statutory trust.
Western Asset Short Duration Income ETF
Legg Mason Funds
620 Eighth Avenue, 49th Floor
New York, NY 10018
The Fund files its complete schedule of portfolio holdings with the Securities and Exchange Commission (“SEC”) for the first and third quarters of each fiscal year as an exhibit to its reports on FormN-PORT. The Fund’s FormsN-PORT are available on the SEC’s website at www.sec.gov. To obtain information on FormN-PORT, shareholders can call the Fund at1-877-721-1926.
Information on how the Fund voted proxies relating to portfolio securities during the prior12-month period ended June 30th of each year and a description of the policies and procedures that the Fund uses to determine how to vote proxies related to portfolio transactions are available (1) without charge, upon request, by calling the Fund at1-877-721-1926, (2) at www.leggmason.com/etf and (3) on the SEC’s website at www.sec.gov.
This report is submitted for the general information of the shareholders of Western Asset Short Duration Income ETF. This report is not authorized for distribution to prospective investors in the Fund unless preceded or accompanied by a current prospectus.
Investors should consider the Fund’s investment objectives, risks, charges and expenses carefully before investing. The prospectus contains this and other important information about the Fund. Please read the prospectus carefully before investing.
www.leggmason.com
© 2020 Legg Mason Investor Services, LLC
Member FINRA, SIPC
Table of Contents
www.leggmason.com
© 2020 Legg Mason Investor Services, LLC Member FINRA, SIPC
WASX575450 3/20 SR20-3835
Table of Contents
| ITEM 2. | CODE OF ETHICS. |
Not applicable.
| ITEM 3. | AUDIT COMMITTEE FINANCIAL EXPERT. |
Not applicable.
| ITEM 4. | PRINCIPAL ACCOUNTANT FEES AND SERVICES. |
Not applicable.
| ITEM 5. | AUDIT COMMITTEE OF LISTED REGISTRANTS. |
Not applicable.
| ITEM 6. | SCHEDULE OF INVESTMENTS. |
Included herein under Item 1.
| ITEM 7. | DISCLOSURE OF PROXY VOTING POLICIES AND PROCEDURES FORCLOSED-END MANAGEMENT INVESTMENT COMPANIES. |
Not applicable.
| ITEM 8. | PORTFOLIO MANAGERS OFCLOSED-END MANAGEMENT INVESTMENT COMPANIES. |
Not applicable.
| ITEM 9. | PURCHASES OF EQUITY SECURITIES BYCLOSED-END MANAGEMENT INVESTMENT COMPANY AND AFFILIATED PURCHASERS. |
Not applicable.
| ITEM 10. | SUBMISSION OF MATTERS TO A VOTE OF SECURITY HOLDERS. |
Not applicable.
| ITEM 11. | CONTROLS AND PROCEDURES. |
| (a) | The registrant’s principal executive officer and principal financial officer have concluded that the registrant’s disclosure controls and procedures (as defined in Rule30a- 3(c) under the Investment Company Act of 1940, as amended (the “1940 Act”)) are effective as of a date within 90 days of the filing date of this report that includes the disclosure required by this paragraph, based on their evaluation of the disclosure controls and procedures required by Rule30a-3(b) under the 1940 Act and15d-15(b) under the Securities Exchange Act of 1934. |
| (b) | There were no changes in the registrant’s internal control over financial reporting (as defined in Rule30a-3(d) under the 1940 Act) that occurred during the second fiscal quarter of the period covered by this report that have materially affected, or are likely to materially affect the registrant’s internal control over financial reporting. |
Table of Contents
| ITEM 12. | DISCLOSURE OF SECURITIES LENDING ACTIVITIES FORCLOSED-END MANAGEMENT INVESTMENT COMPANIES. |
Not applicable.
| ITEM 13. | EXHIBITS. |
(a) (1) Not applicable.
Exhibit 99.CODE ETH
(a) (2) Certifications pursuant to section 302 of the Sarbanes-Oxley Act of 2002 attached hereto.
Exhibit 99.CERT
(b) Certifications pursuant to Section 906 of the Sarbanes-Oxley Act of 2002 attached hereto.
Exhibit 99.906CERT
Table of Contents
SIGNATURES
Pursuant to the requirements of the Securities Exchange Act of 1934 and the Investment Company Act of 1940, the registrant has duly caused this Report to be signed on its behalf by the undersigned, there unto duly authorized.
Legg Mason ETF Investment Trust
| By: | /s/Jane Trust |
Jane Trust
Chief Executive Officer
| Date: | March 30, 2020 |
Pursuant to the requirements of the Securities Exchange Act of 1934 and the Investment Company Act of 1940, this report has been signed below by the following persons on behalf of the registrant and in the capacities and on the dates indicated.
| By: | /s/Jane Trust |
Jane Trust
Chief Executive Officer
| Date: | March 30, 2020 |
| By: | /s/Christopher Berarducci |
Christopher Berarducci
Principal Financial Officer
| Date: | March 30, 2020 |