Table of Contents
UNITED STATES
SECURITIES AND EXCHANGE COMMISSION
Washington, D.C. 20549
FORMN-CSR
CERTIFIED SHAREHOLDER REPORT OF REGISTERED
MANAGEMENT INVESTMENT COMPANIES
Investment Company Act file number811-23096
Legg Mason ETF Investment Trust
(Exact name of registrant as specified in charter)
620 Eighth Avenue, 49th Floor, New York, NY 10018
(Address of principal executive offices) (Zip code)
Robert I. Frenkel, Esq.
Legg Mason & Co., LLC
100 First Stamford Place
Stamford, CT 06902
(Name and address of agent for service)
Registrant’s telephone number, including area code:1-877-721-1926
Date of fiscal year end: July 31
Date of reporting period: January 31, 2020
Table of Contents
| ITEM 1. | REPORT TO STOCKHOLDERS. |
TheSemi-Annual Report to Stockholders is filed herewith.
Table of Contents

| Semi-Annual Report | January 31, 2020 |
LEGG MASON
SMALL-CAP QUALITY
VALUE ETF
SQLV
Beginning in January 2021, as permitted by regulations adopted by the Securities and Exchange Commission, the Fund intends to no longer mail paper copies of the Fund’s shareholder reports like this one, unless you specifically request paper copies of the reports from your financial intermediary (such as a broker-dealer or bank). Instead, the reports will be made available on a website, and you will be notified by mail each time a report is posted and provided with a website link to access the report.
If you already elected to receive shareholder reports electronically(“e-delivery”), you will not be affected by this change and you need not take any action. If you have not already electede-delivery, you may elect to receive shareholder reports and other communications from the Fund electronically by contacting your financial intermediary.
You may elect to receive all future reports in paper free of charge by contacting your financial intermediary to request that you continue to receive paper copies of your shareholder reports. Your election to receive reports in paper will apply to all Legg Mason Funds held in your account with your financial intermediary.

| INVESTMENT PRODUCTS: NOT FDIC INSURED • NO BANK GUARANTEE • MAY LOSE VALUE |
Table of Contents
Fund objective
The Fund seeks to track the investment results of an index composed of equity securities of small-capitalization companies that are traded in the United States.

Dear Shareholder,
We are pleased to provide the semi-annual report of Legg MasonSmall-Cap Quality Value ETF for thesix-month reporting period ended January 31, 2020. Please read on for Fund performance information during the Fund’s reporting period. As always, we remain committed to providing you with excellent service and a full spectrum of investment choices. We also remain committed to supplementing the support you receive from your financial advisor. One way we accomplish this is through our website, www.leggmason.com. Here you can gain immediate access to market and investment information, including:
| • | Fund net asset value and market price, |
| • | Market insights and commentaries from our portfolio managers, and |
| • | A host of educational resources. |
We look forward to helping you meet your financial goals.
Sincerely,

Jane Trust, CFA
President and Chief Executive Officer
February 28, 2020
II | Legg Mason Small-Cap Quality Value ETF |
Table of Contents
For the six months ended January 31, 2020, Legg MasonSmall-Cap Quality Value ETF generated a 1.19% return on a net asset value (“NAV”)i basis and 1.19% based on its market priceii per share.
The performance table shows the Fund’s total return for the six months ended January 31, 2020 based on its NAV and market price as of January 31, 2020. The Fund seeks to track the investment results of an index composed of equity securities of small-capitalization companies that are traded in the United States, the RoyceSmall-Cap Quality Value Indexiii, which returned 1.90% for the same period. The Fund’s broad-based market index, the Russell 2000 Indexiv, returned 3.26% over the same time frame. The LipperSmall-Cap Core Funds Category Averagev returned 2.30% for the period. Please note that Lipper performance returns are based on each fund’s NAV.
| Performance Snapshot as of January 31, 2020 (unaudited) | ||||
| 6 months | ||||
| Legg MasonSmall-Cap Quality Value ETF: | ||||
$26.36 (NAV) | 1.19 | %*† | ||
$26.37 (Market Price) | 1.19 | %*‡ | ||
| RoyceSmall-Cap Quality Value Index | 1.90 | % | ||
| Russell 2000 Index | 3.26 | % | ||
| LipperSmall-Cap Core Funds Category Average | 2.30 | % | ||
The performance shown represents past performance. Past performance is no guarantee of future results and current performance may be higher or lower than the performance shown above. Principal value and investment returns will fluctuate so shares, when sold, may be worth more or less than their original cost. Performance data current to the most recentmonth-end is available at www.leggmason.com/etf.
Investors buy and sell shares of an exchange-traded fund (“ETF”) at market price (not NAV) in the secondary market throughout the trading day. These shares are not individually available for direct purchase from or direct redemption to the ETF. Market price returns shown are typically based upon themid-point between the bid and ask on the Fund’s principal trading market when the Fund’s NAV is determined, which is typically 4:00 p.m. Eastern time (US). These returns do not represent investors’ returns had they traded shares at other times. Performance figures for periods shorter than one year represent cumulative figures and are not annualized.
Information showing the number of days the market price of the Fund’s shares was greater than the Fund’s NAV and the number of days it was less than the Fund’s NAV (i.e., premium or discount) for various time periods is available by visiting the Fund’s website at www.leggmason.com/etf.
As of the Fund’s current prospectus dated November 29, 2019, the gross total annual fund operating expense ratio for the Fund was 0.62%.
* Total returns are based on changes in NAV or market price, respectively. Returns reflect the deduction of all Fund expenses. Returns do not reflect the deduction of brokerage commissions or taxes that investors pay on distributions or the sale of shares.
| Legg Mason Small-Cap Quality Value ETF |
III |
Table of Contents
Performance review (cont’d)
† Total return assumes the reinvestment of all distributions, including returns of capital, if any, at NAV.
‡ Total return assumes the reinvestment of all distributions, including returns of capital, if any, at market price.
Looking for additional information?
The Fund’s daily NAV is availableon-line at www.leggmason/etf. The Fund is traded under the symbol “SQLV” and its closing market price is available on most financial websites. In a continuing effort to provide information concerning the Fund, shareholders may call1-877-721-1926 (toll free), Monday through Friday from 8:00 a.m. to 5:30 p.m. Eastern time, for the Fund’s current NAV, market price and other information.
As always, thank you for your confidence in our stewardship of your assets.
Sincerely,
Jane Trust, CFA
President and Chief Executive Officer
February 28, 2020
RISKS: Equity securities are subject to market and price fluctuations. The Fund invests primarily insmall-cap stocks, which may involve considerably more risk than investing inlarger-cap stocks. The Fund has significant exposure to U.S. issuers. A decrease in imports or exports, changes in trade regulations and/or an economic recession in the United States may have a material adverse effect on the U.S. economy and the securities listed on U.S. exchanges. There is no guarantee that the Fund will achieve a high degree of correlation to the index it seeks to track. The Fund does not seek to outperform the index it tracks and does not seek temporary defensive positions when markets decline or appear overvalued. If the Underlying Index is concentrated in a particular industry or industries, the Fund may focus its investments in these industries, increasing its vulnerability to market volatility. Diversification does not ensure gains or protect against market declines. Please see the Fund’s prospectus for a more complete discussion of these and other risks and the Fund’s investment strategies.
All investments are subject to risk including the possible loss of principal. Past performance is no guarantee of future results. An index is a statistical composite that tracks a specified financial market, sector or rules-based investment process. Unlike a fund, an index does not actually hold a portfolio of securities and therefore does not incur the expenses incurred by a fund. These expenses negatively impact fund performance. All index performance reflects no deduction for fees, expenses or taxes. Please note that an investor cannot invest directly in an index.
IV | Legg Mason Small-Cap Quality Value ETF |
Table of Contents
| i | Net Asset Value (“NAV”) is calculated by subtracting total liabilities from total assets and dividing the results by the number of shares outstanding. |
| ii | Market Price is determined by supply and demand. It is the price at which an investor purchases or sells shares of the Fund. The Market Price may differ from the Fund’s NAV. |
| iii | The RoyceSmall-Cap Quality Value Index is a proprietary index composed ofsmall-cap stocks trading in the United States with relatively low valuations, high profitability and high debt coverage compared with the average of stocks in the investment universe. |
| iv | The Russell 2000 Index measures the performance of thesmall-cap segment of the U.S. equity universe. The Russell 2000 is a subset of the Russell 3000 Index representing approximately 10% of the total market capitalization of that index. It includes approximately 2,000 of the smallest securities based on a combination of their market cap and current index membership. The Russell 3000 Index measures the performance of the 3,000 largest U.S. companies based on total market capitalization, which represents approximately 98% of the U.S. equity market. |
| v | Lipper, Inc., a wholly-owned subsidiary of Reuters, provides independent insight on global collective investments. Returns are based on thesix-month period ended January 31, 2020, including the reinvestment of all distributions, including returns of capital, if any, calculated among the 924 funds in the Fund’s Lipper category. |
| Legg Mason Small-Cap Quality Value ETF |
V |
Table of Contents
(This page intentionally left blank.)
Table of Contents
Investment breakdown (%) as a percent of total investments
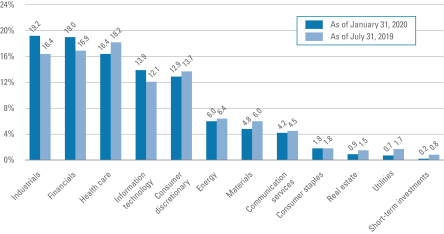
| † | The bar graph above represents the composition of the Fund’s investments as of January 31, 2020 and July 31, 2019. The composition of the Fund’s investments is subject to change at any time. |
| Legg Mason Small-Cap Quality Value ETF 2020 Semi-Annual Report |
1 |
Table of Contents
Example
As a shareholder of the Fund, you may incur two types of costs: (1) transaction costs, such as brokerage commissions paid on purchases and sales of Fund shares; and (2) ongoing costs, including management fees; and other Fund expenses. This example is intended to help you understand your ongoing costs (in dollars) of investing in the Fund and to compare these costs with the ongoing costs of investing in other funds.
This example is based on an investment of $1,000 invested on August 1, 2019 and held for the six months ended January 31, 2020.
Actual expenses
The table below titled “Based on Actual Total Return” provides information about actual account values and actual expenses. You may use the information provided in this table, together with the amount you invested, to estimate the expenses that you paid over the period. To estimate the expenses you paid on your account, divide your ending account value by $1,000 (for example, an $8,600 ending account value divided by $1,000 = 8.6), then multiply the result by the number under the heading entitled “Expenses Paid During the Period”.
Hypothetical example for comparison purposes
The table below titled “Based on Hypothetical Total Return” provides information about hypothetical account values and hypothetical expenses based on the actual expense ratio and an assumed rate of return of 5.00% per year before expenses, which is not the Fund’s actual return. The hypothetical account values and expenses may not be used to estimate the actual ending account balance or expenses you paid for the period. You may use the information provided in this table to compare the ongoing costs of investing in the Fund and other funds. To do so, compare the 5.00% hypothetical example relating to the Fund with the 5.00% hypothetical examples that appear in the shareholder reports of the other funds.
Please note that the expenses shown in the table below are meant to highlight your ongoing costs only and do not reflect any transactional costs, such as brokerage commissions paid on purchases and sales of Fund shares. Therefore, the table is useful in comparing ongoing costs only, and will not help you determine the relative total costs of owning different funds. In addition, if these transaction costs were included, your costs would have been higher.
| Based on actual total return1 | Based on hypothetical total return1 | |||||||||||||||||||||||||||||||||||||
Actual Total Return2 | Beginning Account Value | Ending Account Value | Annualized Expense Ratio | Expenses Paid During the Period3 | Hypothetical Annualized Total Return | Beginning Account Value | Ending Account Value | Annualized Expense Ratio | Expenses Paid During the Period3 | |||||||||||||||||||||||||||||
| 1.19% | $ | 1,000.00 | $ | 1,011.90 | 0.60 | % | $ | 3.03 | 5.00% | $ | 1,000.00 | $ | 1,022.12 | 0.60 | % | $ | 3.05 | |||||||||||||||||||||
| 1 | For the six months ended January 31, 2020. |
| 2 | Assumes the reinvestment of all distributions, including returns of capital, if any, at net asset value. Total return is not annualized, as it may not be representative of the total return for the year. Performance figures may reflect fee waivers and/or expense reimbursements. In the absence of fee waivers and/or expense reimbursements, the total return would have been lower. Past performance is no guarantee of future results. |
| 3 | Expenses (net of fee waivers and/or expense reimbursements) are equal to the Fund’s annualized expense ratio multiplied by the average account value over the period, multiplied by the number of days in the most recent fiscal half-year (184), then divided by 366. |
2 | Legg Mason Small-Cap Quality Value ETF 2020 Semi-Annual Report |
Table of Contents
Schedule of investments(unaudited)
January 31, 2020
Legg Mason Small-Cap Quality Value ETF
| Security | Shares | Value | ||||||||||||||
| Common Stocks — 99.8% | ||||||||||||||||
| Communication Services — 4.2% | ||||||||||||||||
Diversified Telecommunication Services — 0.7% | ||||||||||||||||
Cogent Communications Holdings Inc. | 1,112 | $ | 78,874 | |||||||||||||
Entertainment — 0.3% | ||||||||||||||||
Sciplay Corp., Class A Shares | 3,254 | 34,493 | * | |||||||||||||
Interactive Media & Services — 0.9% | ||||||||||||||||
Cars.com Inc. | 4,810 | 56,133 | * | |||||||||||||
Eventbrite Inc., Class A Shares | 2,262 | 47,841 | * | |||||||||||||
Total Interactive Media & Services | 103,974 | |||||||||||||||
Media — 2.3% | ||||||||||||||||
AMC Networks Inc., Class A Shares | 2,063 | 75,485 | * | |||||||||||||
Gannett Co. Inc. | 12,373 | 75,599 | ||||||||||||||
MSG Networks Inc., Class A Shares | 3,392 | 51,592 | * | |||||||||||||
National CineMedia Inc. | 10,270 | 75,793 | ||||||||||||||
Total Media | 278,469 | |||||||||||||||
Total Communication Services | 495,810 | |||||||||||||||
| Consumer Discretionary — 12.9% | ||||||||||||||||
Auto Components — 0.5% | ||||||||||||||||
Superior Industries International Inc. | 18,786 | 60,115 | ||||||||||||||
Diversified Consumer Services — 1.5% | ||||||||||||||||
American Public Education Inc. | 1,591 | 37,914 | * | |||||||||||||
Collectors Universe Inc. | 1,428 | 35,072 | ||||||||||||||
Houghton Mifflin Harcourt Co. | 10,270 | 56,690 | * | |||||||||||||
K12 Inc. | 2,837 | 45,789 | * | |||||||||||||
Total Diversified Consumer Services | 175,465 | |||||||||||||||
Hotels, Restaurants & Leisure — 1.8% | ||||||||||||||||
Cheesecake Factory Inc. | 1,727 | 66,317 | ||||||||||||||
Hilton Grand Vacations Inc. | 1,601 | 51,088 | * | |||||||||||||
Jack in the Box Inc. | 762 | 62,293 | ||||||||||||||
Ruth’s Hospitality Group Inc. | 1,964 | 40,262 | ||||||||||||||
Total Hotels, Restaurants & Leisure | 219,960 | |||||||||||||||
Household Durables — 2.1% | ||||||||||||||||
Ethan Allen Interiors Inc. | 3,275 | 52,891 | ||||||||||||||
La-Z-Boy Inc. | 2,054 | 62,935 | ||||||||||||||
Meritage Homes Corp. | 1,106 | 78,482 | * | |||||||||||||
Sonos Inc. | 3,627 | 49,762 | * | |||||||||||||
Total Household Durables | 244,070 | |||||||||||||||
Internet & Direct Marketing Retail — 1.7% | ||||||||||||||||
PetMed Express Inc. | 2,082 | 52,487 | ||||||||||||||
Revolve Group Inc. | 2,101 | 37,377 | * | |||||||||||||
See Notes to Financial Statements.
| Legg Mason Small-Cap Quality Value ETF 2020 Semi-Annual Report |
3 |
Table of Contents
Schedule of investments(unaudited) (cont’d)
January 31, 2020
Legg Mason Small-Cap Quality Value ETF
| Security | Shares | Value | ||||||||||||||
Internet & Direct Marketing Retail — continued | ||||||||||||||||
Shutterstock Inc. | 1,368 | $ | 59,275 | * | ||||||||||||
Stamps.com Inc. | 702 | 52,292 | * | |||||||||||||
Total Internet & Direct Marketing Retail | 201,431 | |||||||||||||||
Leisure Products — 0.8% | ||||||||||||||||
Malibu Boats Inc., Class A Shares | 1,149 | 50,315 | * | |||||||||||||
MasterCraft Boat Holdings Inc. | 2,400 | 42,168 | * | |||||||||||||
Total Leisure Products | 92,483 | |||||||||||||||
Specialty Retail — 3.6% | ||||||||||||||||
Buckle Inc. | 2,704 | 66,005 | ||||||||||||||
Michaels Cos. Inc. | 11,489 | 56,641 | * | |||||||||||||
Sally Beauty Holdings Inc. | 3,627 | 55,675 | * | |||||||||||||
Shoe Carnival Inc. | 1,326 | 47,550 | ||||||||||||||
Sleep Number Corp. | 1,067 | 55,047 | * | |||||||||||||
Urban Outfitters Inc. | 2,799 | 71,654 | * | |||||||||||||
Winmark Corp. | 157 | 31,238 | ||||||||||||||
Zumiez Inc. | 1,501 | 46,786 | * | |||||||||||||
Total Specialty Retail | 430,596 | |||||||||||||||
Textiles, Apparel & Luxury Goods — 0.9% | ||||||||||||||||
Culp Inc. | 2,711 | 34,240 | ||||||||||||||
Kontoor Brands Inc. | 1,784 | 68,042 | ||||||||||||||
Total Textiles, Apparel & Luxury Goods | 102,282 | |||||||||||||||
Total Consumer Discretionary | 1,526,402 | |||||||||||||||
| Consumer Staples — 1.8% | ||||||||||||||||
Beverages — 0.5% | ||||||||||||||||
National Beverage Corp. | 1,292 | 55,440 | * | |||||||||||||
Personal Products — 0.6% | ||||||||||||||||
Lifevantage Corp. | 1,838 | 30,107 | * | |||||||||||||
USANA Health Sciences Inc. | 722 | 44,547 | * | |||||||||||||
Total Personal Products | 74,654 | |||||||||||||||
Tobacco — 0.7% | ||||||||||||||||
Vector Group Ltd. | 6,780 | 89,089 | ||||||||||||||
Total Consumer Staples | 219,183 | |||||||||||||||
| Energy — 6.0% | ||||||||||||||||
Energy Equipment & Services — 3.1% | ||||||||||||||||
Cactus Inc., Class A Shares | 1,604 | 46,227 | ||||||||||||||
Era Group Inc. | 4,498 | 44,710 | * | |||||||||||||
Liberty Oilfield Services Inc., Class A Shares | 5,519 | 46,801 | ||||||||||||||
Matrix Service Co. | 2,514 | 50,582 | * | |||||||||||||
Patterson-UTI Energy Inc. | 7,843 | 62,274 | ||||||||||||||
Select Energy Services Inc., Class A Shares | 6,665 | 46,388 | * | |||||||||||||
See Notes to Financial Statements.
4 | Legg Mason Small-Cap Quality Value ETF 2020 Semi-Annual Report |
Table of Contents
Legg Mason Small-Cap Quality Value ETF
| Security | Shares | Value | ||||||||||||||
Energy Equipment & Services — continued | ||||||||||||||||
Smart Sand Inc. | 13,959 | $ | 28,337 | * | ||||||||||||
Solaris Oilfield Infrastructure Inc., Class A Shares | 3,176 | 36,619 | ||||||||||||||
Total Energy Equipment & Services | 361,938 | |||||||||||||||
Oil, Gas & Consumable Fuels — 2.9% | ||||||||||||||||
Arch Coal Inc., Class A Shares | 946 | 48,747 | ||||||||||||||
Bonanza Creek Energy Inc. | 2,764 | 50,277 | * | |||||||||||||
CONSOL Energy Inc. | 5,825 | 47,357 | * | |||||||||||||
Evolution Petroleum Corp. | 6,964 | 35,099 | ||||||||||||||
Falcon Minerals Corp. | 9,138 | 50,259 | ||||||||||||||
NACCO Industries Inc., Class A Shares | 926 | 43,652 | ||||||||||||||
Peabody Energy Corp. | 10,825 | 73,177 | ||||||||||||||
Total Oil, Gas & Consumable Fuels | 348,568 | |||||||||||||||
Total Energy | 710,506 | |||||||||||||||
| Financials — 19.0% | ||||||||||||||||
Banks — 6.8% | ||||||||||||||||
Bancorp Inc. | 3,826 | 45,261 | * | |||||||||||||
Boston Private Financial Holdings Inc. | 5,446 | 62,084 | ||||||||||||||
Cathay General Bancorp | 2,232 | 80,486 | ||||||||||||||
Eagle Bancorp Inc. | 1,344 | 58,733 | ||||||||||||||
First Financial Corp. | 1,188 | 49,575 | ||||||||||||||
First Internet Bancorp | 1,565 | 41,488 | ||||||||||||||
HBT Financial Inc. | 3,363 | 65,007 | * | |||||||||||||
Heritage Commerce Corp. | 4,081 | 47,340 | ||||||||||||||
Home BancShares Inc. | 4,330 | 82,790 | ||||||||||||||
Old Second Bancorp Inc. | 3,284 | 40,344 | ||||||||||||||
PCB Bancorp | 2,296 | 34,922 | ||||||||||||||
Preferred Bank | 934 | 56,143 | ||||||||||||||
RBB Bancorp | 2,175 | 42,804 | ||||||||||||||
Shore Bancshares Inc. | 2,176 | 35,360 | ||||||||||||||
Texas Capital Bancshares Inc. | 1,245 | 68,425 | * | |||||||||||||
Total Banks | 810,762 | |||||||||||||||
Capital Markets — 5.9% | ||||||||||||||||
Artisan Partners Asset Management Inc., Class A Shares | 2,741 | 91,549 | ||||||||||||||
Brightsphere Investment Group Inc. | 5,842 | 53,805 | ||||||||||||||
Cohen & Steers Inc. | 1,125 | 83,227 | ||||||||||||||
Diamond Hill Investment Group Inc. | 367 | 51,663 | ||||||||||||||
Evercore Inc., Class A Shares | 1,121 | 85,891 | ||||||||||||||
Houlihan Lokey Inc. | 1,545 | 80,108 | ||||||||||||||
Moelis & Co., Class A Shares | 2,857 | 102,852 | ||||||||||||||
Safeguard Scientifics Inc. | 2,206 | 23,472 | ||||||||||||||
See Notes to Financial Statements.
| Legg Mason Small-Cap Quality Value ETF 2020 Semi-Annual Report |
5 |
Table of Contents
Schedule of investments(unaudited) (cont’d)
January 31, 2020
Legg Mason Small-Cap Quality Value ETF
| Security | Shares | Value | ||||||||||||||
Capital Markets — continued | ||||||||||||||||
Waddell & Reed Financial Inc., Class A Shares | 4,829 | $ | 77,167 | |||||||||||||
Westwood Holdings Group Inc. | 1,644 | 46,164 | ||||||||||||||
Total Capital Markets | 695,898 | |||||||||||||||
Consumer Finance — 1.4% | ||||||||||||||||
Elevate Credit Inc. | 15,079 | 87,609 | * | |||||||||||||
Enova International Inc. | 3,193 | 80,016 | * | |||||||||||||
Total Consumer Finance | 167,625 | |||||||||||||||
Insurance — 2.0% | ||||||||||||||||
Employers Holdings Inc. | 1,556 | 66,363 | ||||||||||||||
Investors Title Co. | 270 | 42,606 | ||||||||||||||
National Western Life Group Inc., Class A Shares | 290 | 77,140 | ||||||||||||||
Universal Insurance Holdings Inc. | 2,181 | 53,086 | ||||||||||||||
Total Insurance | 239,195 | |||||||||||||||
Thrifts & Mortgage Finance — 2.9% | ||||||||||||||||
Axos Financial Inc. | 2,127 | 59,918 | * | |||||||||||||
Flagstar Bancorp Inc. | 1,659 | 58,463 | ||||||||||||||
FS Bancorp Inc. | 545 | 29,822 | ||||||||||||||
Home Bancorp Inc. | 1,109 | 39,436 | ||||||||||||||
Merchants Bancorp | 2,459 | 48,393 | ||||||||||||||
NMI Holdings Inc., Class A Shares | 1,639 | 52,317 | * | |||||||||||||
Sterling Bancorp Inc. | 6,559 | 48,078 | ||||||||||||||
Total Thrifts & Mortgage Finance | 336,427 | |||||||||||||||
Total Financials | 2,249,907 | |||||||||||||||
| Health Care — 16.4% | ||||||||||||||||
Biotechnology — 4.4% | ||||||||||||||||
Alector Inc. | 1,857 | 51,885 | * | |||||||||||||
Anika Therapeutics Inc. | 704 | 28,942 | * | |||||||||||||
Arena Pharmaceuticals Inc. | 1,235 | 56,427 | * | |||||||||||||
BioSpecifics Technologies Corp. | 513 | 30,308 | * | |||||||||||||
Catalyst Pharmaceuticals Inc. | 5,113 | 21,014 | * | |||||||||||||
Eagle Pharmaceuticals Inc. | 716 | 38,535 | * | |||||||||||||
Enanta Pharmaceuticals Inc. | 697 | 35,923 | * | |||||||||||||
Lexicon Pharmaceuticals Inc. | 6,099 | 18,846 | * | |||||||||||||
Ligand Pharmaceuticals Inc. | 506 | 44,432 | * | |||||||||||||
Morphic Holding Inc. | 2,088 | 41,969 | * | |||||||||||||
Myriad Genetics Inc. | 2,334 | 64,535 | * | |||||||||||||
Scholar Rock Holding Corp. | 2,759 | 33,908 | * | |||||||||||||
Vanda Pharmaceuticals Inc. | 2,367 | 30,179 | * | |||||||||||||
Voyager Therapeutics Inc. | 1,741 | 19,203 | * | |||||||||||||
Total Biotechnology | 516,106 | |||||||||||||||
See Notes to Financial Statements.
6 | Legg Mason Small-Cap Quality Value ETF 2020 Semi-Annual Report |
Table of Contents
Legg Mason Small-Cap Quality Value ETF
| Security | Shares | Value | ||||||||||||||
Health Care Equipment & Supplies — 6.1% | ||||||||||||||||
AngioDynamics Inc. | 3,126 | $ | 43,045 | * | ||||||||||||
Atrion Corp. | 62 | 44,590 | ||||||||||||||
FONAR Corp. | 1,598 | 33,734 | * | |||||||||||||
Heska Corp. | 332 | 33,263 | * | |||||||||||||
Inogen Inc. | 607 | 26,872 | * | |||||||||||||
iRadimed Corp. | 1,048 | 26,724 | * | |||||||||||||
Lantheus Holdings Inc. | 1,934 | 33,864 | * | |||||||||||||
LeMaitre Vascular Inc. | 1,064 | 38,288 | ||||||||||||||
Meridian Bioscience Inc. | 5,148 | 50,656 | ||||||||||||||
Merit Medical Systems Inc. | 1,837 | 66,904 | * | |||||||||||||
Natus Medical Inc. | 1,432 | 44,807 | * | |||||||||||||
OraSure Technologies Inc. | 4,924 | 34,714 | * | |||||||||||||
Orthofix Medical Inc. | 978 | 42,308 | * | |||||||||||||
Quidel Corp. | 685 | 52,608 | * | |||||||||||||
Surmodics Inc. | 771 | 30,370 | * | |||||||||||||
Tactile Systems Technology Inc. | 459 | 25,791 | * | |||||||||||||
Utah Medical Products Inc. | 322 | 29,647 | ||||||||||||||
Varex Imaging Corp. | 2,436 | 67,355 | * | |||||||||||||
Total Health Care Equipment & Supplies | 725,540 | |||||||||||||||
Health Care Providers & Services — 2.1% | ||||||||||||||||
Magellan Health Inc. | 1,001 | 73,283 | * | |||||||||||||
MEDNAX Inc. | 3,147 | 72,601 | * | |||||||||||||
National HealthCare Corp. | 708 | 59,416 | ||||||||||||||
National Research Corp. | 706 | 47,775 | ||||||||||||||
Total Health Care Providers & Services | 253,075 | |||||||||||||||
Life Sciences Tools & Services — 0.4% | ||||||||||||||||
Luminex Corp. | 2,271 | 51,518 | ||||||||||||||
Pharmaceuticals — 3.4% | ||||||||||||||||
ANI Pharmaceuticals Inc. | 631 | 39,122 | * | |||||||||||||
Collegium Pharmaceutical Inc. | 1,599 | 32,164 | * | |||||||||||||
Corcept Therapeutics Inc. | 3,407 | 43,167 | * | |||||||||||||
Innoviva Inc. | 4,048 | 55,882 | * | |||||||||||||
Lannett Co. Inc. | 5,715 | 46,520 | * | |||||||||||||
Pacira BioSciences Inc. | 918 | 39,676 | * | |||||||||||||
Phibro Animal Health Corp., Class A Shares | 2,090 | 49,575 | ||||||||||||||
SIGA Technologies Inc. | 7,247 | 37,322 | * | |||||||||||||
Supernus Pharmaceuticals Inc. | 2,348 | 53,699 | * | |||||||||||||
Total Pharmaceuticals | 397,127 | |||||||||||||||
Total Health Care | 1,943,366 | |||||||||||||||
See Notes to Financial Statements.
| Legg Mason Small-Cap Quality Value ETF 2020 Semi-Annual Report |
7 |
Table of Contents
Schedule of investments(unaudited) (cont’d)
January 31, 2020
Legg Mason Small-Cap Quality Value ETF
| Security | Shares | Value | ||||||||||||||
| Industrials — 19.2% | ||||||||||||||||
Aerospace & Defense — 1.1% | ||||||||||||||||
Aerojet Rocketdyne Holdings Inc. | 1,445 | $ | 75,241 | * | ||||||||||||
National Presto Industries Inc. | 655 | 56,455 | ||||||||||||||
Total Aerospace & Defense | 131,696 | |||||||||||||||
Air Freight & Logistics — 0.8% | ||||||||||||||||
Echo Global Logistics Inc. | 2,898 | 56,163 | * | |||||||||||||
Radiant Logistics Inc. | 7,663 | 37,012 | * | |||||||||||||
Total Air Freight & Logistics | 93,175 | |||||||||||||||
Building Products — 2.5% | ||||||||||||||||
Armstrong Flooring Inc. | 11,486 | 40,660 | * | |||||||||||||
Builders FirstSource Inc. | 3,144 | 77,956 | * | |||||||||||||
Patrick Industries Inc. | 1,160 | 60,181 | ||||||||||||||
Quanex Building Products Corp. | 2,735 | 48,464 | ||||||||||||||
Universal Forest Products Inc. | 1,503 | 71,994 | ||||||||||||||
Total Building Products | 299,255 | |||||||||||||||
Commercial Services & Supplies — 3.1% | ||||||||||||||||
ACCO Brands Corp. | 7,156 | 61,828 | ||||||||||||||
Deluxe Corp. | 1,498 | 72,204 | ||||||||||||||
Ennis Inc. | 2,522 | 52,609 | ||||||||||||||
Healthcare Services Group Inc. | 2,712 | 69,427 | ||||||||||||||
HNI Corp. | 1,734 | 62,372 | ||||||||||||||
Kimball International Inc., Class B Shares | 2,330 | 43,757 | ||||||||||||||
Total Commercial Services & Supplies | 362,197 | |||||||||||||||
Construction & Engineering — 1.6% | ||||||||||||||||
Comfort Systems USA Inc. | 1,283 | 59,531 | ||||||||||||||
Great Lakes Dredge & Dock Corp. | 4,064 | 42,550 | * | |||||||||||||
HC2 Holdings Inc. | 25,790 | 85,365 | * | |||||||||||||
Total Construction & Engineering | 187,446 | |||||||||||||||
Electrical Equipment — 0.4% | ||||||||||||||||
Encore Wire Corp. | 976 | 53,007 | ||||||||||||||
Machinery — 2.5% | ||||||||||||||||
Commercial Vehicle Group Inc. | 5,778 | 28,832 | * | |||||||||||||
Hillenbrand Inc. | 2,299 | 66,740 | ||||||||||||||
Lydall Inc. | 2,419 | 49,444 | * | |||||||||||||
Mueller Industries Inc. | 2,350 | 68,550 | ||||||||||||||
Omega Flex Inc. | 395 | 41,633 | ||||||||||||||
Wabash National Corp. | 4,023 | 46,667 | ||||||||||||||
Total Machinery | 301,866 | |||||||||||||||
Professional Services — 2.7% | ||||||||||||||||
Barrett Business Services Inc. | 578 | 47,876 | ||||||||||||||
See Notes to Financial Statements.
8 | Legg Mason Small-Cap Quality Value ETF 2020 Semi-Annual Report |
Table of Contents
Legg Mason Small-Cap Quality Value ETF
| Security | Shares | Value | ||||||||||||||
Professional Services — continued | ||||||||||||||||
Heidrick & Struggles International Inc. | 1,654 | $ | 47,007 | |||||||||||||
Kforce Inc. | 1,345 | 49,832 | ||||||||||||||
Korn Ferry | 1,776 | 72,780 | ||||||||||||||
Resources Connection Inc. | 3,199 | 48,705 | ||||||||||||||
TrueBlue Inc. | 2,622 | 57,448 | * | |||||||||||||
Total Professional Services | 323,648 | |||||||||||||||
Road & Rail — 0.9% | ||||||||||||||||
ArcBest Corp. | 2,421 | 54,012 | ||||||||||||||
Universal Logistics Holdings Inc. | 2,841 | 48,013 | ||||||||||||||
Total Road & Rail | 102,025 | |||||||||||||||
Trading Companies & Distributors — 3.6% | ||||||||||||||||
BMC Stock Holdings Inc. | 2,335 | 68,147 | * | |||||||||||||
GMS Inc. | 2,335 | 62,391 | * | |||||||||||||
H&E Equipment Services Inc. | 1,826 | 49,503 | ||||||||||||||
NOW Inc. | 5,980 | 59,860 | * | |||||||||||||
Systemax Inc. | 3,001 | 70,974 | ||||||||||||||
WESCO International Inc. | 1,550 | 75,035 | * | |||||||||||||
Willis Lease Finance Corp. | 644 | 38,189 | * | |||||||||||||
Total Trading Companies & Distributors | 424,099 | |||||||||||||||
Total Industrials | 2,278,414 | |||||||||||||||
| Information Technology — 13.9% | ||||||||||||||||
Communications Equipment — 1.0% | ||||||||||||||||
Comtech Telecommunications Corp. | 1,545 | 44,666 | ||||||||||||||
NetScout Systems Inc. | 2,907 | 74,739 | * | |||||||||||||
Total Communications Equipment | 119,405 | |||||||||||||||
Electronic Equipment, Instruments & Components — 4.7% | ||||||||||||||||
Badger Meter Inc. | 825 | 48,724 | ||||||||||||||
Benchmark Electronics Inc. | 1,896 | 58,359 | ||||||||||||||
Insight Enterprises Inc. | 1,188 | 78,254 | * | |||||||||||||
Mesa Laboratories Inc. | 155 | 40,678 | ||||||||||||||
PC Connection Inc. | 1,253 | 62,449 | ||||||||||||||
Sanmina Corp. | 2,536 | 80,746 | * | |||||||||||||
TTM Technologies Inc. | 5,112 | 73,562 | * | |||||||||||||
Vishay Intertechnology Inc. | 3,780 | 76,696 | ||||||||||||||
Vishay Precision Group Inc. | 1,142 | 39,445 | * | |||||||||||||
Total Electronic Equipment, Instruments & Components | 558,913 | |||||||||||||||
IT Services — 1.7% | ||||||||||||||||
Cass Information Systems Inc. | 809 | 43,702 | ||||||||||||||
CSG Systems International Inc. | 1,061 | 52,859 | ||||||||||||||
See Notes to Financial Statements.
| Legg Mason Small-Cap Quality Value ETF 2020 Semi-Annual Report |
9 |
Table of Contents
Schedule of investments(unaudited) (cont’d)
January 31, 2020
Legg Mason Small-Cap Quality Value ETF
| Security | Shares | Value | ||||||||||||||
IT Services — continued | ||||||||||||||||
NIC Inc. | 2,506 | $ | 49,444 | |||||||||||||
Sykes Enterprises | 1,690 | 56,767 | * | |||||||||||||
Total IT Services | 202,772 | |||||||||||||||
Semiconductors & Semiconductor Equipment — 3.3% | ||||||||||||||||
Diodes Inc. | 1,263 | 65,221 | * | |||||||||||||
Ichor Holdings Ltd. | 1,379 | 46,045 | * | |||||||||||||
NVE Corp. | 659 | 48,344 | ||||||||||||||
SMART Global Holdings Inc. | 1,731 | 52,207 | * | |||||||||||||
Synaptics Inc. | 1,066 | 71,092 | * | |||||||||||||
Ultra Clean Holdings Inc. | 2,225 | 51,197 | * | |||||||||||||
Xperi Corp. | 3,287 | 52,888 | ||||||||||||||
Total Semiconductors & Semiconductor Equipment | 386,994 | |||||||||||||||
Software — 3.0% | ||||||||||||||||
American Software Inc., Class A Shares | 2,671 | 39,878 | ||||||||||||||
Cerence Inc. | 3,588 | 76,604 | * | |||||||||||||
CommVault Systems Inc. | 1,074 | 48,352 | * | |||||||||||||
GlobalSCAPE Inc. | 2,839 | 32,762 | ||||||||||||||
Intelligent Systems Corp. | 518 | 21,989 | * | |||||||||||||
Progress Software Corp. | 1,362 | 61,467 | ||||||||||||||
Qualys Inc. | 564 | 48,357 | * | |||||||||||||
Telenav Inc. | 5,840 | 26,222 | * | |||||||||||||
Total Software | 355,631 | |||||||||||||||
Technology Hardware, Storage & Peripherals — 0.2% | ||||||||||||||||
Sonim Technologies Inc. | 9,469 | 30,395 | * | |||||||||||||
Total Information Technology | 1,654,110 | |||||||||||||||
| Materials — 4.8% | ||||||||||||||||
Chemicals — 1.0% | ||||||||||||||||
FutureFuel Corp. | 5,194 | 56,926 | ||||||||||||||
Trinseo SA | 2,176 | 62,495 | ||||||||||||||
Total Chemicals | 119,421 | |||||||||||||||
Containers & Packaging — 0.7% | ||||||||||||||||
Myers Industries Inc. | 3,060 | 49,511 | ||||||||||||||
UFP Technologies Inc. | 746 | 34,786 | * | |||||||||||||
Total Containers & Packaging | 84,297 | |||||||||||||||
Metals & Mining — 1.8% | ||||||||||||||||
Materion Corp. | 940 | 51,042 | ||||||||||||||
Warrior Met Coal Inc. | 5,003 | 94,356 | ||||||||||||||
Worthington Industries Inc. | 1,915 | 70,434 | ||||||||||||||
Total Metals & Mining | 215,832 | |||||||||||||||
See Notes to Financial Statements.
10 | Legg Mason Small-Cap Quality Value ETF 2020 Semi-Annual Report |
Table of Contents
Legg Mason Small-Cap Quality Value ETF
| Security | Shares | Value | ||||||||||||||
Paper & Forest Products — 1.3% | ||||||||||||||||
Boise Cascade Co. | 1,923 | $ | 69,613 | |||||||||||||
Domtar Corp. | 2,447 | 85,204 | ||||||||||||||
Total Paper & Forest Products | 154,817 | |||||||||||||||
Total Materials | 574,367 | |||||||||||||||
| Real Estate — 0.9% | ||||||||||||||||
Real Estate Management & Development — 0.9% | ||||||||||||||||
Marcus & Millichap Inc. | 1,370 | 48,498 | * | |||||||||||||
RMR Group Inc., Class A Shares | 1,284 | 59,154 | ||||||||||||||
Total Real Estate | 107,652 | |||||||||||||||
| Utilities — 0.7% | ||||||||||||||||
Electric Utilities — 0.7% | ||||||||||||||||
Genie Energy Ltd., Class B Shares | 4,596 | 33,229 | ||||||||||||||
Spark Energy Inc., Class A Shares | 4,673 | 44,347 | ||||||||||||||
Total Utilities | 77,576 | |||||||||||||||
Total Investments before Short-Term Investments (Cost — $12,414,004) | 11,837,293 | |||||||||||||||
| Rate | ||||||||||||||||
| Short-Term Investments — 0.2% | ||||||||||||||||
Dreyfus Treasury Cash Management, Institutional Class | 1.472 | % | 27,073 | 27,073 | ||||||||||||
Total Investments — 100.0% (Cost — $12,441,077) |
| 11,864,366 | ||||||||||||||
Liabilities in Excess of Other Assets — (0.0)% | (2,172 | ) | ||||||||||||||
Total Net Assets — 100.0% | $ | 11,862,194 | ||||||||||||||
| * | Non-income producing security. |
See Notes to Financial Statements.
| Legg Mason Small-Cap Quality Value ETF 2020 Semi-Annual Report |
11 |
Table of Contents
Statement of assets and liabilities(unaudited)
January 31, 2020
| Assets: | ||||
Investments, at value (Cost — $12,441,077) | $ | 11,864,366 | ||
Dividends and interest receivable | 4,023 | |||
Total Assets | 11,868,389 | |||
| Liabilities: | ||||
Investment management fee payable | 6,195 | |||
Total Liabilities | 6,195 | |||
| Total Net Assets | $ | 11,862,194 | ||
| Net Assets: | ||||
Par value (Note 5) | $ | 5 | ||
Paid-in capital in excess of par value | 13,511,390 | |||
Total distributable earnings (loss) | (1,649,201) | |||
| Total Net Assets | $ | 11,862,194 | ||
| Shares Outstanding | 450,000 | |||
| Net Asset Value | $ | 26.36 | ||
See Notes to Financial Statements.
12 | Legg Mason Small-Cap Quality Value ETF 2020 Semi-Annual Report |
Table of Contents
Statement of operations(unaudited)
For the Six Months Ended January 31, 2020
| Investment Income: | ||||
Dividends | $ | 114,124 | ||
Interest | 602 | |||
Total Investment Income | 114,726 | |||
| Expenses: | ||||
Investment management fee (Note 2) | 34,839 | |||
Total Expenses | 34,839 | |||
| Net Investment Income | 79,887 | |||
| Realized and Unrealized Gain (Loss) on Investments (Notes 1 and 3): | ||||
Net Realized Gain From Investment Transactions | 231,700 | |||
Change in Net Unrealized Appreciation (Depreciation) From Investments | (158,905) | |||
| Net Gain on Investments | 72,795 | |||
| Increase in Net Assets From Operations | $ | 152,682 | ||
See Notes to Financial Statements.
| Legg Mason Small-Cap Quality Value ETF 2020 Semi-Annual Report |
13 |
Table of Contents
Statements of changes in net assets
For the Six Months Ended January 31, 2020 (unaudited) and the Year Ended July 31, 2019 | 2020 | 2019 | ||||||
| Operations: | ||||||||
Net investment income | $ | 79,887 | $ | 93,987 | ||||
Net realized gain (loss) | 231,700 | (595,750) | ||||||
Change in net unrealized appreciation (depreciation) | (158,905) | (440,527) | ||||||
Increase (Decrease) in Net Assets From Operations | 152,682 | (942,290) | ||||||
| Distributions to Shareholders From (Note 1): | ||||||||
Total distributable earnings | (72,580) | (115,500) | ||||||
Decrease in Net Assets From Distributions to Shareholders | (72,580) | (115,500) | ||||||
| Fund Share Transactions (Note 5): | ||||||||
Net proceeds from sale of shares (250,000 and 450,000 shares issued, respectively) | 6,799,426 | 12,447,188 | ||||||
Cost of shares repurchased (200,000 and 200,000 shares repurchased, respectively) | (5,500,803) | (5,414,769) | ||||||
Increase in Net Assets From Fund Share Transactions | 1,298,623 | 7,032,419 | ||||||
Increase in Net Assets | 1,378,725 | 5,974,629 | ||||||
| Net Assets: | ||||||||
Beginning of period | 10,483,469 | 4,508,840 | ||||||
End of period | $ | 11,862,194 | $ | 10,483,469 | ||||
See Notes to Financial Statements.
14 | Legg Mason Small-Cap Quality Value ETF 2020 Semi-Annual Report |
Table of Contents
| For a share of beneficial interest outstanding throughout each year ended July 31, unless otherwise noted: | ||||||||||||||||
| 20201,2 | 20191 | 20181 | 20171,3 | |||||||||||||
| Net asset value, beginning of period | $26.21 | $30.06 | $24.95 | $25.14 | ||||||||||||
| Income (loss) from operations: | ||||||||||||||||
Net investment income (loss) | 0.18 | 0.35 | 0.31 | (0.00) | 4 | |||||||||||
Net realized and unrealized gain (loss) | 0.14 | (3.77) | 4.91 | (0.19) | ||||||||||||
Total income (loss) from operations | 0.32 | (3.42) | 5.22 | (0.19) | ||||||||||||
| Less distributions from: | ||||||||||||||||
Net investment income | (0.17) | (0.43) | (0.11) | — | ||||||||||||
Total distributions | (0.17) | (0.43) | (0.11) | — | ||||||||||||
| Net asset value, end of period | $26.36 | $26.21 | $30.06 | $24.95 | ||||||||||||
Total return, based on NAV5 | 1.19 | % | (11.29) | % | 20.97 | % | (0.76) | % | ||||||||
| Net assets, end of period (000s) | $11,862 | $10,483 | $4,509 | $2,495 | ||||||||||||
| Ratios to average net assets: | ||||||||||||||||
Gross expenses | 0.60 | %6 | 0.60 | % | 0.60 | % | 0.60 | %6 | ||||||||
Net expenses | 0.60 | 6 | 0.60 | 0.60 | 0.60 | 6 | ||||||||||
Net investment income (loss) | 1.38 | 6 | 1.30 | 1.12 | (0.29) | 6 | ||||||||||
| Portfolio turnover rate7 | 40 | % | 87 | % | 80 | % | 0 | % | ||||||||
| 1 | Per share amounts have been calculated using the average shares method. |
| 2 | For the six months ended January 31, 2020 (unaudited). |
| 3 | For the period July 12, 2017 (inception date) to July 31, 2017. |
| 4 | Amount represents less than $0.005 per share. |
| 5 | Performance figures may reflect fee waivers and/or expense reimbursements. In the absence of fee waivers and/or expense reimbursements, the total return would have been lower. The total return calculation assumes that distributions are reinvested at NAV. Past performance is no guarantee of future results. Total returns for periods of less than one year are not annualized. |
| 6 | Annualized. |
| 7 | Portfolio turnover excludes the value of portfolio securities received or delivered as a result ofin-kind fund share transactions. |
See Notes to Financial Statements.
| Legg Mason Small-Cap Quality Value ETF 2020 Semi-Annual Report |
15 |
Table of Contents
Notes to financial statements(unaudited)
1. Organization and significant accounting policies
Legg MasonSmall-Cap Quality Value ETF (the “Fund”) is a separate diversified investment series of Legg Mason ETF Investment Trust (the “Trust”). The Trust, a Maryland statutory trust, is registered under the Investment Company Act of 1940, as amended (the “1940 Act”), as anopen-end management investment company.
The Fund is an exchange-traded fund (“ETF”). ETFs are funds that trade like other publicly-traded securities. The Fund is designed to track an index. Similar to shares of an index mutual fund, each share of the Fund represents an ownership interest in an underlying portfolio of securities intended to track an index. Unlike shares of a mutual fund, which can be bought from and redeemed by the issuing fund by all shareholders at a price based on net asset value (“NAV”), shares of the Fund may be directly purchased from and redeemed by the Fund at NAV solely by certain large institutional investors who have entered into agreements with the Fund’s distributor (“Authorized Participants”). Also unlike shares of a mutual fund, shares of the Fund are listed on a national securities exchange and trade in the secondary market at market prices that change throughout the day.
Shares of the Fund are listed and traded at market prices on NASDAQ. The market price for the Fund’s shares may be different from the Fund’s NAV. The Fund issues and redeems shares at NAV only in blocks of a specified number of shares or multiples thereof (“Creation Units”). Only Authorized Participants may purchase or redeem Creation Units directly with the Fund at NAV. Creation Units are issued and redeemed principallyin-kind (although under some circumstances its shares are created and redeemed partially for cash). Except when aggregated in Creation Units, shares of the Fund are not redeemable securities.
Shareholders who are not Authorized Participants may not redeem shares directly from the Fund at NAV.
The Fund seeks to track the investment results of the RoyceSmall-Cap Quality Value Index (the “Underlying Index”). The Underlying Index utilizes a proprietary methodology created and sponsored by Royce & Associates, LP (“Royce”), the Fund’s subadviser.
The following are significant accounting policies consistently followed by the Fund and are in conformity with U.S. generally accepted accounting principles (“GAAP”). Estimates and assumptions are required to be made regarding assets, liabilities and changes in net assets resulting from operations when financial statements are prepared. Changes in the economic environment, financial markets and any other parameters used in determining these estimates could cause actual results to differ. Subsequent events have been evaluated through the date the financial statements were issued.
(a) Investment valuation.Equity securities for which market quotations are available are valued at the last reported sales price or official closing price on the primary market or exchange on which they trade. The valuations for fixed income securities (which may include, but are not limited to, corporate, government, municipal, mortgage-backed, collateralized mortgage obligations and asset-backed securities) and certain derivative
16 | Legg Mason Small-Cap Quality Value ETF 2020 Semi-Annual Report |
Table of Contents
instruments are typically the prices supplied by independent third party pricing services, which may use market prices or broker/dealer quotations or a variety of valuation techniques and methodologies. The independent third party pricing services use inputs that are observable such as issuer details, interest rates, yield curves, prepayment speeds, credit risks/spreads, default rates and quoted prices for similar securities. Investments inopen-end funds are valued at the closing net asset value per share of each fund on the day of valuation. When the Fund holds securities or other assets that are denominated in a foreign currency, the Fund will use the currency exchange rates, generally determined as of 4:00 p.m. (London Time). If independent third party pricing services are unable to supply prices for a portfolio investment, or if the prices supplied are deemed by the manager to be unreliable, the market price may be determined by the manager using quotations from one or more broker/dealers or at the transaction price if the security has recently been purchased and no value has yet been obtained from a pricing service or pricing broker. When reliable prices are not readily available, such as when the value of a security has been significantly affected by events after the close of the exchange or market on which the security is principally traded, but before the Fund calculates its net asset value, the Fund values these securities as determined in accordance with procedures approved by the Fund’s Board of Trustees.
The Board of Trustees is responsible for the valuation process and has delegated the supervision of the daily valuation process to the Legg Mason North Atlantic Fund Valuation Committee (the “Valuation Committee”). The Valuation Committee, pursuant to the policies adopted by the Board of Trustees, is responsible for making fair value determinations, evaluating the effectiveness of the Fund’s pricing policies, and reporting to the Board of Trustees. When determining the reliability of third party pricing information for investments owned by the Fund, the Valuation Committee, among other things, conducts due diligence reviews of pricing vendors, monitors the daily change in prices and reviews transactions among market participants.
The Valuation Committee will consider pricing methodologies it deems relevant and appropriate when making fair value determinations. Examples of possible methodologies include, but are not limited to, multiple of earnings; discount from market of a similar freely traded security; discounted cash-flow analysis; book value or a multiple thereof; risk premium/yield analysis; yield to maturity; and/or fundamental investment analysis. The Valuation Committee will also consider factors it deems relevant and appropriate in light of the facts and circumstances. Examples of possible factors include, but are not limited to, the type of security; the issuer’s financial statements; the purchase price of the security; the discount from market value of unrestricted securities of the same class at the time of purchase; analysts’ research and observations from financial institutions; information regarding any transactions or offers with respect to the security; the existence of merger proposals or tender offers affecting the security; the price and extent of public trading in similar securities of the issuer or comparable companies; and the existence of a shelf registration for restricted securities.
| Legg Mason Small-Cap Quality Value ETF 2020 Semi-Annual Report |
17 |
Table of Contents
Notes to financial statements(unaudited) (cont’d)
For each portfolio security that has been fair valued pursuant to the policies adopted by the Board of Trustees, the fair value price is compared against the last available and next available market quotations. The Valuation Committee reviews the results of such back testing monthly and fair valuation occurrences are reported to the Board of Trustees quarterly.
The Fund uses valuation techniques to measure fair value that are consistent with the market approach and/or income approach, depending on the type of security and the particular circumstance. The market approach uses prices and other relevant information generated by market transactions involving identical or comparable securities. The income approach uses valuation techniques to discount estimated future cash flows to present value.
GAAP establishes a disclosure hierarchy that categorizes the inputs to valuation techniques used to value assets and liabilities at measurement date. These inputs are summarized in the three broad levels listed below:
| • | Level 1 — quoted prices in active markets for identical investments |
| • | Level 2 — other significant observable inputs (including quoted prices for similar investments, interest rates, prepayment speeds, credit risk, etc.) |
| • | Level 3 — significant unobservable inputs (including the Fund’s own assumptions in determining the fair value of investments) |
The inputs or methodologies used to value securities are not necessarily an indication of the risk associated with investing in those securities.
The following is a summary of the inputs used in valuing the Fund’s assets carried at fair value:
| ASSETS | ||||||||||||||||
| Description | Quoted Prices (Level 1) | Other Significant Observable Inputs (Level 2) | Significant Unobservable Inputs (Level 3) | Total | ||||||||||||
| Common Stocks† | $ | 11,837,293 | — | — | $ | 11,837,293 | ||||||||||
| Short-Term Investments† | 27,073 | — | — | 27,073 | ||||||||||||
| Total Investments | $ | 11,864,366 | — | — | $ | 11,864,366 | ||||||||||
| † | See Schedule of Investments for additional detailed categorizations. |
18 | Legg Mason Small-Cap Quality Value ETF 2020 Semi-Annual Report |
Table of Contents
(b) Security transactions and investment income.Security transactions are accounted for on a trade date basis. Interest income (including interest income frompayment-in-kind securities), adjusted for amortization of premium and accretion of discount, is recorded on the accrual basis. Dividend income is recorded on theex-dividend date for dividends received in cash and/or securities. Foreign dividend income is recorded on theex-dividend date or as soon as practicable after the Fund determines the existence of a dividend declaration after exercising reasonable due diligence. The cost of investments sold is determined by use of the specific identification method. To the extent any issuer defaults or a credit event occurs that impacts the issuer, the Fund may halt any additional interest income accruals and consider the realizability of interest accrued up to the date of default or credit event.
(c) Distributions to shareholders.Distributions from net investment income of the Fund, if any, are declared and paid on a quarterly basis. Distributions of net realized gains, if any, are declared at least annually. Distributions to shareholders of the Fund are recorded on theex-dividend date and are determined in accordance with income tax regulations, which may differ from GAAP.
(d) Federal and other taxes.It is the Fund’s policy to comply with the federal income and excise tax requirements of the Internal Revenue Code of 1986 (the “Code”), as amended, applicable to regulated investment companies. Accordingly, the Fund intends to distribute its taxable income and net realized gains, if any, to shareholders in accordance with timing requirements imposed by the Code. Therefore, no federal or state income tax provision is required in the Fund’s financial statements.
Management has analyzed the Fund’s tax positions taken on income tax returns for all open tax years and has concluded that as of July 31, 2019, no provision for income tax is required in the Fund’s financial statements. The Fund’s federal and state income and federal excise tax returns for tax years for which the applicable statutes of limitations have not expired are subject to examination by the Internal Revenue Service and state departments of revenue.
(e) Reclassification.GAAP requires that certain components of net assets be reclassified to reflect permanent differences between financial and tax reporting. These reclassifications have no effect on net assets or net asset value per share.
2. Investment management agreement and other transactions with affiliates
Legg Mason Partners Fund Advisor, LLC (“LMPFA”) is the Fund’s investment manager and Royce & Associates, LP (“Royce”) is the Fund’s subadviser. Western Asset Management Company, LLC (“Western Asset”) manages the portion of the Fund’s cash and short-term instruments allocated to it. LMPFA and Western Asset are wholly-owned subsidiaries, and Royce is a majority-owned subsidiary, of Legg Mason, Inc. (“Legg Mason”).
LMPFA provides administrative and certain oversight services to the Fund. LMPFA delegates to the subadviser theday-to-day portfolio management of the Fund. The Fund is responsible for paying interest expenses, taxes, brokerage expenses, future12b-1 fees (if any), acquired fund fees and expenses, extraordinary expenses and the management fee payable to LMPFA under the investment management agreement. LMPFA has agreed to pay all of the Fund’s organization and offering costs.
| Legg Mason Small-Cap Quality Value ETF 2020 Semi-Annual Report |
19 |
Table of Contents
Notes to financial statements(unaudited) (cont’d)
Under the investment management agreement and subject to the general supervision of the Fund’s Board of Trustees, LMPFA provides or causes to be furnished all investment management, supervisory, administrative and other services reasonably necessary for the operation of the Fund, including certain distribution services (provided pursuant to a separate distribution agreement) and investment advisory services (provided pursuant to separate subadvisory agreements) under a unitary fee structure. The Fund pays an investment management fee, calculated daily and paid monthly, at an annual rate of 0.60% of the Fund’s average daily net assets.
As compensation for its subadvisory services, LMPFA pays Royce monthly 90% of the management fee paid by the Fund to LMPFA, net of (i) all fees and expenses incurred by LMPFA under the investment management agreement (including without limitation any subadvisory fee paid to another subadviser to the Fund) and (ii) expense waivers, if any, and reimbursements. LMPFA pays Western Asset monthly a fee of 0.02% of the portion of the Fund’s average daily net assets allocated to Western Asset for the management of cash and other short-term instruments, net of expense waivers, if any, and reimbursements.
Legg Mason Investor Services, LLC, a wholly-owned broker-dealer subsidiary of Legg Mason, serves as the distributor of Creation Units for the Fund on an agency basis.
The Fund’s Board of Trustees has adopted a Rule12b-1 shareholder services and distribution plan and under that plan, the Fund is authorized to pay service and/or distribution fees calculated at an annual rate of up to 0.25% of its average daily net assets. No service and/or distribution fees are currently paid by the Fund, and there are no current plans to impose these fees.
All officers and one Trustee of the Trust are employees of Legg Mason or its affiliates and do not receive compensation from the Trust.
3. Investments
During the six months ended January 31, 2020, the aggregate cost of purchases and proceeds from sales of investments (excludingin-kind transactions and short-term investments) were as follows:
| Purchases | $ | 4,529,247 | ||
| Sales | 4,489,872 |
During the six months ended January 31, 2020,in-kind transactions (Note 5) were as follows:
| Contributions | $ | 6,800,221 | ||
| Redemptions | 5,479,884 | |||
| Realized gain (loss)* | 1,071,617 |
| * | Net realized gains on redemptionsin-kind are not taxable to the remaining shareholders of the Fund. |
20 | Legg Mason Small-Cap Quality Value ETF 2020 Semi-Annual Report |
Table of Contents
Thein-kind contributions andin-kind redemptions shown in this table may not agree with the Fund Share Transactions on the Statement of Changes in Net Assets. This table represents the accumulation of the Fund’s daily net shareholder transactions while the Statement of Changes in Net Assets reflects gross shareholder transactions including any cash component of the transactions.
At January 31, 2020, the aggregate cost of investments and the aggregate gross unrealized appreciation and depreciation of investments for federal income tax purposes were substantially as follows:
| Cost | Gross Unrealized Appreciation | Gross Unrealized Depreciation | Net Unrealized Depreciation | |||||||||||||
| Securities | $ | 12,441,077 | $ | 553,800 | $ | (1,130,511) | $ | (576,711) | ||||||||
4. Derivative instruments and hedging activities
During the six months ended January 31, 2020, the Fund did not invest in derivative instruments.
5. Fund share transactions
At January 31, 2020, the Trust had an unlimited number of shares of beneficial interest authorized with a par value of $0.00001 per share. Fund shares are issued and redeemed by the Fund only in Creation Units or Creation Unit aggregations, where 50,000 shares of the Fund constitute a Creation Unit. Such transactions are generally on anin-kind basis, with a separate cash payment, which is a balancing cash component to equate the transaction to the net asset value per share of the Fund on the transaction date. Transactions in capital shares of the Fund are disclosed in detail in the Statement of Changes in Net Assets. Authorized Participants are subject to standard creation and redemption transaction fees to offset transfer and other transaction costs associated with the issuance and redemption of Creation Units. Creations and redemptions for cash (when cash creations and redemptions are available or specified) may be subject to an additional variable fee.
6. Deferred Capital Losses
As of July 31, 2019, the Fund had deferred capital losses of $1,024,711, which have no expiration date, that will be available to offset future taxable gains.
7. Subsequent event
On February 18, 2020, Franklin Resources, Inc. (“Franklin Resources”) and Legg Mason, Inc. (“Legg Mason”) announced that they have entered into a definitive agreement for Franklin Resources to acquire Legg Mason in anall-cash transaction. As part of this transaction, the Fund’s investment adviser (the “Manager”), currently a wholly owned subsidiary of Legg Mason, would become a wholly owned subsidiary of Franklin Resources. The transaction is
| Legg Mason Small-Cap Quality Value ETF 2020 Semi-Annual Report |
21 |
Table of Contents
Notes to financial statements(unaudited) (cont’d)
subject to approval by Legg Mason’s shareholders and customary closing conditions, including receipt of applicable regulatory approvals. Subject to such approvals and the satisfaction of the other conditions, the transaction is expected to be consummated later this year.
Under the Investment Company Act of 1940, consummation of the transaction will result in the automatic termination of the Fund’s investment management contract with the Manager, and any relatedsub-advisory contract(s), where applicable. Therefore, the Fund’s Board is expected to be asked to approve a new investment management contract between the Fund and the Manager (and a new sub-advisory contract(s), if applicable). If approved by the Board, the new investment management contract (and the newsub-advisory contract(s), if applicable) is expected to be presented to the shareholders of the Fund for their approval.
22 | Legg Mason Small-Cap Quality Value ETF 2020 Semi-Annual Report |
Table of Contents
Board approval of management and subadvisory agreements(unaudited)
At a meeting of the Trust’s Board of Trustees, the Board considered there-approval for an annual period of the management agreement pursuant to which Legg Mason Partners Fund Advisor, LLC (the “Manager”) provides the Fund with investment advisory and administrative services, thesub-advisory agreement pursuant to which Royce & Associates, LP (“Royce”) providesday-to-day management of the Fund’s portfolio, and thesub-advisory agreement pursuant to which Western Asset Management Company, LLC (“Western Asset” and, together with Royce, the“Sub-Advisers”) providesday-to-day management of the Fund’s cash and short-term instruments allocated to it by the Manager. (The management agreement andsub-advisory agreements are collectively referred to as the “Agreements.”) The Manager and Western Asset are wholly-owned subsidiaries, and Royce is a majority-owned subsidiary, of Legg Mason, Inc. The Trustees who are not “interested persons” (as defined in the Investment Company Act of 1940, as amended (the “Independent Trustees”)) of the Fund were assisted in their review by Fund counsel and independent legal counsel and met with independent legal counsel in executive sessions separate from representatives of the Manager and theSub-Advisers. The Independent Trustees requested and received information from the Manager and theSub-Advisers they deemed reasonably necessary for their review of the Agreements and the performance of the Manager and theSub-Advisers. Included was information about the Manager, theSub-Advisers and the Fund’s distributor, as well as the management,sub-advisory and distribution arrangements and services provided to the Fund and other funds overseen by the Board. This information was initially reviewed by a special committee of the Independent Trustees and then by the full Board.
In voting to approve the Agreements, the Independent Trustees considered whether the approval of the Agreements would be in the best interests of the Fund and its shareholders, an evaluation based on several factors including those discussed below.
Nature, extent and quality of the Services provided to the fund under the management agreement andsub-advisory agreements
The Board received and considered information regarding the nature, extent and quality of services provided to the Fund by the Manager and theSub-Advisers under the Management Agreement andSub-Advisory Agreements, respectively, during the past year. The Trustees also considered the Manager’s supervisory activities over theSub-Advisers. In addition, the Independent Trustees received and considered other information regarding the administrative and other services rendered to the Fund by the Manager, including services specific to the Fund’s operation as an exchange-traded fund. The Board noted information received at regular meetings throughout the year related to the services rendered by the Manager in its management of the Fund’s affairs and the Manager’s role in coordinating the activities of theSub-Advisers and the Fund’s other service providers. The Board’s evaluation of the services provided by the Manager and theSub-Advisers took into account the Board’s knowledge and familiarity gained as Trustees of funds in the Legg Mason fund complex,
| Legg Mason Small-Cap Quality Value ETF |
23 |
Table of Contents
Board approval of management and subadvisory agreements(unaudited) (cont’d)
including the scope and quality of the investment management and other capabilities of the Manager and theSub-Advisers and the quality of the Manager’s administrative and other services. The Board observed that the scope of services provided by the Manager had expanded over time as a result of regulatory and other developments, including maintaining and monitoring its own and the Fund’s compliance programs specific to the Fund’s operation as an exchange-traded fund. The Board reviewed information received from the Manager and the Fund’s Chief Compliance Officer regarding the Fund’s compliance policies and procedures established pursuant to Rule38a-1 under the Investment Company Act of 1940, as amended.
The Board reviewed the qualifications, backgrounds and responsibilities of the Fund’s senior personnel and the portfolio management team primarily responsible for theday-to-day portfolio management of the Fund. The Board considered the services provided to the Legg Mason fund complex and the Manager’s commitment to continue to provide effective and efficient investment management services. The Board also considered, based on its knowledge of the Manager and the Manager’s affiliates, the financial resources available to the Manager’s parent organization, Legg Mason, Inc.
The Board considered the division of responsibilities among the Manager and theSub-Advisers and the oversight provided by the Manager. The Board also considered the arrangements for communication and processing of orders for creations and redemptions of Fund shares. In addition, management also reported to the Board on, among other things, its business plans regarding exchange-traded funds, recent organizational changes, portfolio manager compensation plan and policy regarding portfolio managers’ ownership of fund shares.
The Board concluded that, overall, it was satisfied with the nature, extent and quality of services provided (and expected to be provided) under the respective Agreement by the Manager and theSub-Advisers.
Fund performance
The Board received and reviewed performance information for the Fund and for a group of institutional passively managed strategic betasmall-cap core exchange-traded funds (the “Performance Group”) selected by Broadridge Financial Solutions Inc. (“Broadridge”), an independent provider of investment company data. The Board was provided with a description of the methodology Broadridge used to determine the similarity of the Fund with the funds included in the Performance Group. The Trustees noted that they also had received and discussed with management at periodic intervals information on the investment performance of the Fund in comparison to similar exchange-traded funds and benchmark performance indices, including the RoyceSmall-Cap Quality Value Index, the Fund’s underlying index. The information comparing the Fund’s performance to that of the Performance Group was for theone-year period ended June 30, 2019 and the period since
24 | Legg Mason Small-Cap Quality Value ETF |
Table of Contents
the Fund’s inception (July 12, 2017) through June 30, 2019. The Fund performed below the median performance of the funds in the Performance Group for each period. The Board reviewed performance information provided by the Manager for periods ended September 30, 2019, which showed that the Fund’s performance was below the Broadridge category average during the third quarter. The Trustees also noted that the Fund generally performed in line with its underlying index during the periods under review. The Trustees further noted that the Manager and Royce were committed to providing the resources necessary to assist the Fund’s portfolio managers. Based on its review, and noting the limited period of performance data available, the Board directed the Independent Trustees’ performance committee to continue to periodically review Fund performance with the Manager and report to the full Board.
Management fees and expense ratios
The Board reviewed and considered the contractual management fee rate (the “Actual Management Fee”) paid by the Fund to the Manager over the Fund’s last fiscal year in light of the nature, extent and quality of the management andsub-advisory services provided by the Manager and theSub-Advisers, respectively. The Board noted that the Manager, and not the Fund, pays thesub-advisory fees to theSub-Advisers and, accordingly, that the retention of theSub-Advisers does not increase the fees and expenses incurred by the Fund. The Board also noted that the Manager pays all fund expenses, other than the Actual Management Fee and certain other expenses. Because of the Fund’s “unitary fee” structure, the Board recognized that the Fund’s fees and expenses will vary within a much smaller range and the Manager will bear the risk that Fund expenses may increase over time. On the other hand, the Board noted that it is possible that the Manager could earn a profit on the fees charged under the management agreement and would benefit from any price decreases in third-party services covered by the management agreement.
The Board noted that the Manager provides the Fund with regulatory compliance and administrative services, office facilities and Fund officers (including the Fund’s chief financial, chief legal and chief compliance officers), and that the Manager coordinates and oversees the provision of services to the Fund by other fund service providers, including theSub-Advisers. Management also discussed with the Board the Fund’s distribution arrangements.
Additionally, the Board received and considered information comparing the Fund’s Actual Management Fee and the Fund’s overall expense ratio with those of the same group of institutional passively managed strategic beta exchange-traded funds, which included 11small-cap core funds, selected by Broadridge as the Performance Group for the Fund (the “Expense Group”), and the Fund’s overall expense ratio with a broader group of funds selected by Broadridge consisting of all institutional passively managed strategic betasmall-cap core exchange-traded funds (the “Expense Universe”). This information showed
| Legg Mason Small-Cap Quality Value ETF |
25 |
Table of Contents
Board approval of management and subadvisory agreements(unaudited) (cont’d)
that the Fund’s Actual Management Fee was higher than the median of management fees paid by the funds in the Expense Group, and that the Fund’s total expense ratio was higher than the median of the total expense ratios of the funds in the Expense Group and the funds in the Expense Universe.
Manager profitability
The Board received and considered a profitability analysis of the Manager and its affiliates in providing services to the Fund. The Board also received profitability information with respect to the Legg Mason fund complex as a whole. In addition, the Board received information with respect to the Manager’s allocation methodologies used in preparing this profitability data as well as a report from an outside consultant that had reviewed the Manager’s methodology. The Board noted the profitability percentage ranges determined by appropriate court cases to be reasonable given the services rendered to investment companies. The Board determined that the Manager’s profitability was not excessive in light of the nature, extent and quality of the services provided to the Fund.
Economies of scale
The Board discussed any economies of scale or other efficiencies that may result from increases in the Fund’s assets. The Board noted that the Fund’s management agreement did not provide for any breakpoints in the Fund’s Actual Management Fee to the extent the assets of the Fund increase. The Board further noted that should material economies of scale exist in the future, a breakpoint structure for the Fund may be appropriate, and that it would continue to monitor the sharing of economies of scale to determine the appropriateness of adding breakpoints in the future. The Board also noted that there are various ways to share potential economies of scale with Fund shareholders and that it appeared that the benefits of any economies of scale would be appropriately shared with shareholders through increased investment in fund management and administration resources.
Taking all of the above into consideration, the Board determined that the management fee was reasonable in light of the comparative performance and expense information and the nature, extent and quality of the services provided to the Fund under the Agreements.
Other benefits to the manager
The Board considered other benefits received by the Manager and its affiliates, including theSub-Advisers, as a result of the Manager’s relationship with the Fund, including the opportunity to offer additional products and services such as 529 College Savings Plans and retail managed accounts.
In light of the costs of providing investment management and other services to the Fund and the Manager’s ongoing commitment to the Fund, the profits and other ancillary benefits that the Manager and its affiliates received were considered reasonable.
26 | Legg Mason Small-Cap Quality Value ETF |
Table of Contents
Based on their discussions and considerations, including those described above, the Trustees approved the Management Agreement and theSub-Advisory Agreements to continue for another year.
No single factor reviewed by the Board was identified by the Board as the principal factor in determining whether to approve the Management Agreement and theSub-Advisory Agreements.
| Legg Mason Small-Cap Quality Value ETF |
27 |
Table of Contents
(This page intentionally left blank.)
Table of Contents
(This page intentionally left blank.)
Table of Contents
(This page intentionally left blank.)
Table of Contents
(This page intentionally left blank.)
Table of Contents
Legg Mason
Small-Cap Quality Value ETF
Trustees
Paul R. Ades
Andrew L. Breech
Dwight B. Crane
Althea L. Duersten
Stephen R. Gross
Susan M. Heilbron
Frank G. Hubbard
Howard J. Johnson
Chairman
Jerome H. Miller
Ken Miller
Thomas F. Schlafly
Jane Trust
Investment manager
Legg Mason Partners Fund Advisor, LLC
Subadviser
Royce & Associates, LP
Custodian
The Bank of New York Mellon
Transfer agent
The Bank of New York Mellon
240 Greenwich Street
New York, NY 10286
Independent registered public accounting firm
PricewaterhouseCoopers LLP
Baltimore, MD
Legg MasonSmall-Cap Quality Value ETF
The Fund is a separate investment series of Legg Mason ETF Investment Trust, a Maryland statutory trust.
Legg MasonSmall-Cap Quality Value ETF
Legg Mason Funds
620 Eighth Avenue, 49th Floor
New York, NY 10018
The Fund files its complete schedule of portfolio holdings with the Securities and Exchange Commission (“SEC”) for the first and third quarters of each fiscal year as an exhibit to its reports on FormN-PORT. The Fund’s FormsN-PORT are available on the SEC’s website at www.sec.gov. To obtain information on FormN-PORT, shareholders can call the Fund at1-877-721-1926.
Information on how the Fund voted proxies relating to portfolio securities during the prior12-month period ended June 30th of each year and a description of the policies and procedures that the Fund uses to determine how to vote proxies related to portfolio transactions are available (1) without charge, upon request, by calling the Fund at1-877-721-1926, (2) at www.leggmason.com/etf and (3) on the SEC’s website at www.sec.gov.
This report is submitted for the general information of the shareholders of Legg MasonSmall-Cap Quality Value ETF. This report is not authorized for distribution to prospective investors in the Fund unless preceded or accompanied by a current prospectus.
Investors should consider the Fund’s investment objectives, risks, charges and expenses carefully before investing. The prospectus contains this and other important information about the Fund. Please read the prospectus carefully before investing.
www.leggmason.com
© 2020 Legg Mason Investor Services, LLC
Member FINRA, SIPC
Table of Contents
ETF Index Disclaimers
The RoyceSmall-Cap Quality Value Index (the “Underlying Index”) is created and sponsored by Royce & Associates, LP (“Royce”), the subadviser to Legg MasonSmall-Cap Quality Value ETF (the “Fund”). Royce is an affiliated person of Legg Mason Partners Fund Advisor, LLC, the Fund’s manager and the Fund. The Underlying Index is the exclusive property of Royce. Legg Mason ETF Investment Trust has entered into a license agreement with Royce to use the Underlying Index at no charge. Royce has retained Solactive AG, an unaffiliated third party, to calculate the Underlying Index. Solactive AG publishes information regarding the market value of the Underlying Index.
The Fund is not sponsored, promoted, sold or supported in any other manner by Solactive AG nor does Solactive AG offer any express or implicit guarantee or assurance either with regard to the results of using the Underlying Index and/or Underlying Index trade marks or the Underlying Index Price at any time or in any other respect. The Underlying Index is calculated and published by Solactive AG. Solactive AG uses its best efforts to ensure that the Underlying Index is calculated correctly. Irrespective of its obligations towards the Fund, Solactive AG has no obligation to point out errors in the Underlying Index to third parties including but not limited to investors and/or financial intermediaries of the Fund. Neither publication of the Underlying Index by Solactive AG nor the licensing of the Underlying Index or Underlying Index trade marks for the purpose of use in connection with the Fund constitutes a recommendation by Solactive AG to invest capital in the Fund nor does it in any way represent an assurance or opinion of Solactive AG with regard to any investment in the Fund.
Royce does not guarantee the accuracy and/or the completeness of the Underlying Index or any data included therein, and Royce shall not have any liability for any errors, omissions or interruptions therein. Royce makes no warranty, express or implied, as to results to be obtained by the Fund, owners of the shares of the Fund or any other person or entity from the use of the Underlying Index or any data included therein, either in connection with the Fund or for any other use. Royce makes no express or implied warranties, and expressly disclaims all warranties of merchantability or fitness for a particular purpose or use with respect to the Underlying Index or any data included therein. Without limiting any of the foregoing, in no event shall Royce have any liability for any special, punitive, direct, indirect or consequential damages (including lost profits) arising out of matters relating to the use of the Underlying Index, even if notified of the possibility of such damages.
Table of Contents
www.leggmason.com
© 2020 Legg Mason Investor Services, LLC Member FINRA, SIPC
ETFF436861 3/20 SR20-3832
Table of Contents
| ITEM 2. | CODE OF ETHICS. |
Not applicable.
| ITEM 3. | AUDIT COMMITTEE FINANCIAL EXPERT. |
Not applicable.
| ITEM 4. | PRINCIPAL ACCOUNTANT FEES AND SERVICES. |
Not applicable.
| ITEM 5. | AUDIT COMMITTEE OF LISTED REGISTRANTS. |
Not applicable.
| ITEM 6. | SCHEDULE OF INVESTMENTS. |
Included herein under Item 1.
| ITEM 7. | DISCLOSURE OF PROXY VOTING POLICIES AND PROCEDURES FORCLOSED-END MANAGEMENT INVESTMENT COMPANIES. |
Not applicable.
| ITEM 8. | PORTFOLIO MANAGERS OFCLOSED-END MANAGEMENT INVESTMENT COMPANIES. |
Not applicable.
| ITEM 9. | PURCHASES OF EQUITY SECURITIES BYCLOSED-END MANAGEMENT INVESTMENT COMPANY AND AFFILIATED PURCHASERS. |
Not applicable.
| ITEM 10. | SUBMISSION OF MATTERS TO A VOTE OF SECURITY HOLDERS. |
Not applicable.
| ITEM 11. | CONTROLS AND PROCEDURES. |
| (a) | The registrant’s principal executive officer and principal financial officer have concluded that the registrant’s disclosure controls and procedures (as defined in Rule30a- 3(c) under the Investment Company Act of 1940, as amended (the “1940 Act”)) are effective as of a date within 90 days of the filing date of this report that includes the disclosure required by this paragraph, based on their evaluation of the disclosure controls and procedures required by Rule30a-3(b) under the 1940 Act and15d-15(b) under the Securities Exchange Act of 1934. |
| (b) | There were no changes in the registrant’s internal control over financial reporting (as defined in Rule30a-3(d) under the 1940 Act) that occurred during the second fiscal quarter of the period covered by this report that have materially affected, or are likely to materially affect the registrant’s internal control over financial reporting. |
Table of Contents
| ITEM 12. | DISCLOSURE OF SECURITIES LENDING ACTIVITIES FORCLOSED-END MANAGEMENT INVESTMENT COMPANIES. |
Not applicable.
| ITEM 13. | EXHIBITS. |
(a) (1) Not applicable.
Exhibit 99.CODE ETH
(a) (2) Certifications pursuant to section 302 of the Sarbanes-Oxley Act of 2002 attached hereto.
Exhibit 99.CERT
(b) Certifications pursuant to Section 906 of the Sarbanes-Oxley Act of 2002 attached hereto.
Exhibit 99.906CERT
Table of Contents
SIGNATURES
Pursuant to the requirements of the Securities Exchange Act of 1934 and the Investment Company Act of 1940, the registrant has duly caused this Report to be signed on its behalf by the undersigned, there unto duly authorized.
| Legg Mason ETF Investment Trust | ||
| By: | /s/ Jane Trust | |
| Jane Trust | ||
| Chief Executive Officer | ||
Date: March 24, 2020
Pursuant to the requirements of the Securities Exchange Act of 1934 and the Investment Company Act of 1940, this report has been signed below by the following persons on behalf of the registrant and in the capacities and on the dates indicated.
| By: | /s/ Jane Trust | |
| Jane Trust | ||
| Chief Executive Officer | ||
Date: March 24, 2020
| By: | /s/ Christopher Berarducci | |
| Christopher Berarducci | ||
| Principal Financial Officer | ||
Date: March 24, 2020