UNITED STATES
SECURITIES AND EXCHANGE COMMISSION
Washington, D.C. 20549
FORM N-CSR
CERTIFIED SHAREHOLDER REPORT OF REGISTERED
MANAGEMENT INVESTMENT COMPANIES
| | |
| Investment Company Act file number | | 811-23075 |
Nuveen High Income November 2021 Target Term Fund
(Exact name of registrant as specified in charter)
Nuveen Investments
333 West Wacker Drive, Chicago, IL 60606
(Address of principal executive offices) (Zip code)
Gifford R. Zimmerman
Nuveen Investments
333 West Wacker Drive, Chicago, IL 60606
(Name and address of agent for service)
Registrant’s telephone number, including area code: (312) 917-7700
Date of fiscal year end: December 31
Date of reporting period: June 30, 2017
Form N-CSR is to be used by management investment companies to file reports with the Commission not later than 10 days after the transmission to stockholders of any report that is required to be transmitted to stockholders under Rule 30e-1 under the Investment Company Act of 1940 (17 CFR 270.30e-1). The Commission may use the information provided on Form N-CSR in its regulatory, disclosure review, inspection, and policy making roles.
A registrant is required to disclose the information specified by Form N-CSR, and the Commission will make this information public. A registrant is not required to respond to the collection of information contained in Form N-CSR unless the Form displays a currently valid Office of Management and Budget (“OMB”) control number. Please direct comments concerning the accuracy of the information collection burden estimate and any suggestions for reducing the burden to Secretary, Securities and Exchange Commission, 450 Fifth Street, NW, Washington, DC 20549-0609. The OMB has reviewed this collection of information under the clearance requirements of 44 U.S.C. ss.3507.
ITEM 1. REPORTS TO STOCKHOLDERS.
| | |
| | |  |
| Closed-End Funds | |
| | | | | | |
| | | | | | | Semi-Annual Report June 30, 2017 |
| | | |
| | | | | | |
| | | | | | | |
| JHY | | | | | | |
| Nuveen High Income 2020 Target Term Fund | | |
| | | | | | | |
| JHD | | | | | | |
| Nuveen High Income December 2019 Target Term Fund | | |
| | | | | | | |
| JHA | | | | | | |
| Nuveen High Income December 2018 Target Term Fund | | |
| | | | | | | |
| JHB | | | | | | |
| Nuveen High Income November 2021 Target Term Fund | | |
| | | | | | | | | | | | |
| | | | |
| | | | |
| | | | | | | | |
| |
| | Life is Complex |
| |
| | Nuveen makes things e-simple. It only takes a minute to sign up for e-Reports. Once enrolled, you’ll receive an e-mail as soon as your Nuveen Fund information is ready – no more waiting for delivery by regular mail. Just click on the link within the e-mail to see the report and save it on your computer if you wish. |
| | |
| | Free e-Reports right to your e-mail! |
| |
| | www.investordelivery.com If you receive your Nuveen Fund distributions and statements from your financial advisor or brokerage account. |
| |
| or | | www.nuveen.com/accountaccess If you receive your Nuveen Fund distributions and statements directly from Nuveen. |
Table
of Contents
Chairman’s Letter
to Shareholders

Dear Shareholders,
Some of the key assumptions driving the markets higher at the beginning of 2017 have recently come into question. Following the collapse of the health care reform bill in the Senate, progress on the rest of the White House’s pro-growth fiscal agenda, including tax reform and large infrastructure projects, is expected to be delayed. Economic growth projections, in turn, have been lowered, and with inflation recently waning, the markets are expecting fewer rate hikes from the Federal Reserve (Fed) than the Fed itself had predicted. Yet, asset prices continued to rise.
Investors have largely looked beyond policy disappointments and focused instead on the healthy profits reported by U.S. companies during the first two quarters of 2017. U.S. growth has remained slow and steady, European growth has surprised to the upside and concern that China would decelerate too rapidly has eased, further contributing to an optimistic tone in the markets. Additionally, political risk in Europe has moderated, with the election of mainstream candidates in the Dutch and French elections earlier this year.
The remainder of the year could bring challenges to this benign macro environment. The debt ceiling looms, with a vote needed from Congress to raise or suspend the nation’s borrowing limit before the Treasury is unable to pay its bills in full or on time (likely in early October). The mechanics of the U.K.’s separation from the European Union remain to be seen, as “Brexit” negotiations develop. A tightening of financial conditions in China or a more aggressive-than-expected policy action from the Fed, European Central Bank or Bank of Japan could also turn into headwinds.
Market volatility readings have been remarkably low lately, but conditions can change quickly. As market conditions evolve, Nuveen remains committed to rigorously assessing opportunities and risks. If you’re concerned about how resilient your investment portfolio might be, we encourage you to talk to your financial advisor. On behalf of the other members of the Nuveen Fund Board, we look forward to continuing to earn your trust in the months and years ahead.
Sincerely,

William J. Schneider
Chairman of the Board
August 23, 2017
Portfolio Managers’
Comments
Nuveen High Income 2020 Target Term Fund (JHY)
Nuveen High Income December 2019 Target Term Fund (JHD)
Nuveen High Income December 2018 Target Term Fund (JHA)
Nuveen High Income November 2021 Target Term Fund (JHB)
Nuveen High Income 2020 Target Term Fund (JHY), Nuveen High Income December 2019 Target Term Fund (JHD), Nuveen High Income December 2018 Target Term Fund (JHA), and Nuveen High Income November 2021 Target Term Fund (JHB) are closed-end funds that are advised by Nuveen Fund Advisors, LLC (NFAL) and feature portfolio management by Nuveen Asset Management, LLC (NAM). The Funds’ portfolio managers are John T. Fruit, CFA, and Jeffrey T. Schmitz, CFA.
Here the Fund’s portfolio management team discusses key investment strategies and the Fund’s performance for the six-month reporting period ended June 30, 2017.
Nuveen High Income 2020 Target Term Fund (JHY)
What key strategies were used to manage the Fund during this six-month reporting period ended June 30, 2017?
The Fund has an objective to provide a high level of current income and to return the original $9.85 net asset value (NAV) per common share on or about November 1, 2020. The Fund will seek to achieve its investment objectives by investing primarily in shorter maturity, high yield (below investment grade) corporate debt securities. High yield bonds typically offer higher yields than investment grade bonds, in exchange for greater credit risk. Bonds with shorter maturities have lower duration (or interest rate sensitivity) than longer maturity bonds, which may help mitigate price declines if rates rise.
The Fund may invest in other types of securities including senior loans, convertible securities and other types of debt instruments and derivatives that provide comparable economic exposure to the corporate debt market. At least 80% of its managed assets will be in corporate debt securities and separately, at least 80% in securities that, at the time of investment, are rated below investment grade or are unrated but judged by the portfolio managers to be of comparable quality. No more than 15% will be in securities rated CCC+/Caa1 or lower at the time of investment. Up to 30%
This material is not intended to be a recommendation or investment advice, does not constitute a solicitation to buy or sell securities, and is not provided in a fiduciary. The information provided does not take into account the specific objectives or circumstances of any particular investor, or suggest any specific course of action. Investment decisions should be made based on an investor’s objectives or circumstances and in consultation with his or her advisors.
Certain statements in this report are forward-looking statements. Discussions of specific investments are for illustration only and are not intended as recommendations of individual investments. The forward-looking statements and other views expressed herein are those of the portfolio managers as of the date of this report. Actual future results or occurrences may differ significantly from those anticipated in any forward-looking statements and the views expressed herein are subject to change at any time, due to numerous market and other factors. The Funds disclaim any obligation to update publicly or revise any forward-looking statements or views expressed herein.
For financial reporting purposes, the ratings disclosed are the highest rating given by one of the following national rating agencies: Standard & Poor’s (S&P), Moody’s Investors Service, Inc. (Moody’s) or Fitch, Inc. (Fitch). This treatment of split-rated securities may differ from that used for other purposes, such as for Fund investment policies. Credit ratings are subject to change. AAA, AA, A and BBB are investment grade ratings; BB, B, CCC, CC, C and D are below investment grade ratings. Certain bonds backed by U.S. Government or agency securities are regarded as having an implied rating equal to the rating of such securities. Holdings designated N/R are not rated by these national rating agencies.
Refer to the Glossary of Terms Used in this Report for further definition of the terms used within this section.
Portfolio Managers’ Comments (continued)
may be in securities of non-U.S. issuers, including up to 20% in emerging market issuers and up to 10% may be in non-U.S. dollar denominated securities.
The Fund seeks to identify securities across diverse sectors and industries that the managers believe are undervalued or mispriced. In seeking to return the original NAV on or about November 1, 2020, the Fund intends to utilize various portfolio and cash flow management techniques, including setting aside a portion of its net investment income, possibly retaining gains and limiting the longest maturity of any holding to no later than May 1, 2021. The Fund also uses leverage.
How did the Fund perform during this six-month reporting period ended June 30, 2017?
The table in the Performance Overview and Holding Summaries section of this report provides total return performance for the Fund for the six-month, one-year and since inception periods ended June 30, 2017. For the six-month reporting period ended June 30, 2017, the Fund outperformed the Bloomberg Barclays U.S. High Yield 1-5 Year Cash Pay 2% Issuer Capped Index based on the Fund’s total return at NAV.
High yield spreads continued to tighten throughout the reporting period despite a brief correction in March when a temporary spike in interest rates, coupled with a slide in oil prices, caused high yield spreads to briefly widen. By the end of the reporting period, however, credit spreads were once again supported by steady investor interest in the Treasury market combined with low financial market volatility and strengthening equity markets. During the reporting period, high yield spreads in the broader market tightened by roughly 50 basis points to levels not seen since mid-2014, ending the reporting period at 390 basis points over Treasuries. Tightening spreads helped the segment achieve solid gains as demonstrated by a 4.27% return for the benchmark Bloomberg Barclays U.S. High Yield 1-5 Year Cash Pay 2% Issuer Capped Index and a 4.93% return for the broader Bloomberg Barclays U.S. Corporate High Yield Bond Index. Several other factors continued to positively affect the market including a pickup in economic activity around the world, solid corporate earnings, ongoing support from central banks across the globe and an underwhelming supply of bonds in the market. All of these positive factors aside, the high yield market did not experience strong inflows during the reporting period. Investors appeared wary about policy risk surrounding the Trump administration, geopolitical tensions, the decline in oil prices, lofty valuations and heightened risks as we head toward the September meetings for the European Central Bank and Federal Reserve.
The Fund seeks to protect against credit losses to help ensure the goal of returning its original NAV. While the Fund is designed to own more or less a static portfolio of high yield bonds, at times we have to add new securities to replace ones that have been called away or tendered. As we replace these bonds, we seek to maximize the Fund’s yield within the maturity, diversification and credit quality constraints described at the outset of the strategy. We may also look to maximize the Fund’s yield through opportunistic sales of securities that we believe have reached their upside potential, investing the proceeds in other securities that have a more attractive yield or credit profile. Our goal is to monetize some holdings at a gain, which should help to offset any realized or mark-to-market losses that may occur elsewhere in the portfolio. We believe the Fund’s focus on shorter-dated maturities, coupled with limitations to CCC rated securities, should result in lower volatility and help buffer its NAV performance during periods of weakness for the high yield market.
During the reporting period, credit performance within the Fund continued to be strong and generally in line with the overall market, which showed little in the way of weakening credit conditions or increases in default expectations. In select cases, we harvested some price gains in the portfolio to offset some modest realized losses. This helped us to increase the overall quality of the portfolio by reducing its weight in underperforming credits or credits that we deemed were no longer suitable for the risk profile of the Fund. Again though, given the strong credit environment, we saw little in the way of credit deterioration among portfolio credits and the Fund had no defaults across its whole portfolio. The Fund was able to outperform the benchmark mainly by avoiding some of the weaker index performers, particularly in the energy industry.
The uptick in global default rates that resulted from the spike in defaults among energy and commodity companies over the past two years has run its course. By June 2017, Moody’s global speculative grade default rate had fallen to 3.2%, down from its August 2016 high of 4.8%, and the rating agency is forecasting the global default rate will decline further to 2.5% by December 2017. Tightening high yield spreads and low levels of unemployment are just two factors signaling that the default rate will trend lower over the next twelve months. Other leading indicators of future default pressures have also improved, including strong performance from financial and bank equities and lower overall equity volatility.
The Fund continued to carry below-market exposures to energy and CCC rated debt as set forth at its inception, which helped to mitigate volatility in its NAV during the reporting period. While we continue to attempt to maximize portfolio yield where achievable, we do so within the context of protecting the Fund’s credit quality and positioning the portfolio to alleviate the effects of early calls or redemptions. We expect to see some degree of call activity given the most recent downward trend in rates and the propensity for issuers to refinance their short-term debt and replace it with longer maturities. However, as a result of tightening credit spreads in the high yield market, the Fund’s NAV moved higher over the course of the reporting period. As of the end of the reporting period, the Fund was on track to return its original NAV as described in its prospectus.
Nuveen High Income December 2019 Target Term Fund (JHD)
What key strategies were used to manage the Fund during this six-month reporting period ended June 30, 2017?
The Fund has an objective to provide a high level of current income and to return the original $9.86 net asset value (NAV) per common share on or about December 1, 2019. The Fund will seek to achieve its investment objectives by investing primarily in shorter maturity, high yield (below investment grade) corporate debt securities. High yield bonds typically offer higher yields than investment grade bonds, in exchange for greater credit risk. Bonds with shorter maturities have lower duration (or interest rate sensitivity) than longer maturity bonds, which may help mitigate price declines if rates rise.
The Fund may invest in other types of securities including senior loans, convertible securities and other types of debt instruments and derivatives that provide comparable economic exposure to the corporate debt market. At least 80% of its managed assets will be in corporate debt securities and separately, at least 80% in securities that, at the time of investment, are rated below investment grade or are unrated but judged by the portfolio managers to be of comparable quality. No more than 15% will be in securities rated CCC+/Caa1 or lower at the time of investment. Up to 30% may be in securities of non-U.S. issuers, including up to 20% in emerging market issuers and up to 10% may be in non-U.S. dollar denominated securities.
The Fund seeks to identify securities across diverse sectors and industries that the managers believe are undervalued or mispriced. In seeking to return the original NAV on or about December 1, 2019, the Fund intends to utilize various portfolio and cash flow management techniques, including setting aside a portion of its net investment income, possibly retaining gains and limiting the longest maturity of any holding to no later than June 1, 2020. The Fund also uses leverage.
How did the Fund perform during this six-month reporting period ended June 30, 2017?
The table in the Performance Overview and Holding Summaries section of this report provides total return performance for the Fund for the six-month, one-year and since inception periods ended June 30, 2017. For the six-month reporting period ended June 30, 2017, the Fund outperformed the Bloomberg Barclays U.S. High Yield 1-5 Year Cash Pay 2% Issuer Capped Index based on the Fund’s total return at NAV.
Portfolio Managers’ Comments (continued)
High yield spreads continued to tighten throughout the first half of 2017 despite a brief correction in March when a temporary spike in interest rates, coupled with a slide in oil prices, caused high yield spreads to briefly widen. By the end of the reporting period, however, credit spreads were once again supported by steady investor interest in the Treasury market combined with low financial market volatility and strengthening equity markets. During the reporting period, high yield spreads in the broader market tightened by roughly 50 basis points to levels not seen since mid-2014, ending the reporting period at 390 basis points over Treasuries. Tightening spreads helped the segment achieve solid gains as demonstrated by a 4.27% return for the benchmark Bloomberg Barclays U.S. High Yield 1-5 Year Cash Pay 2% Issuer Capped Index and a 4.93% return for the broader Bloomberg Barclays U.S. Corporate High Yield Bond Index. Several other factors continued to positively affect the market including a pickup in economic activity around the world, solid corporate earnings, ongoing support from central banks across the globe and an underwhelming supply of bonds in the market. All of these positive factors aside, the high yield market did not experience strong inflows during the reporting period. Investors appeared wary about policy risk surrounding the Trump administration, geopolitical tensions, the decline in oil prices, lofty valuations and heightened risks as we head toward the September meetings for the European Central Bank and Federal Reserve.
The Fund seeks to protect against credit losses to help ensure the goal of returning its original NAV. While the Fund is designed to own more or less a static portfolio of high yield bonds, at times we have to add new securities to replace ones that have been called away or tendered. As we replace these bonds, we seek to maximize the Fund’s yield within the maturity, diversification and credit quality constraints described at the outset of the strategy. We may also look to maximize the Fund’s yield through opportunistic sales of securities that we believe have reached their upside potential, investing the proceeds in other securities that have a more attractive yield or credit profile. Our goal is to monetize some holdings at a gain, which should help to offset any realized or mark-to-market losses that may occur elsewhere in the portfolio. We believe the Fund’s focus on shorter-dated maturities, coupled with limitations to CCC rated securities, should result in lower volatility and help buffer its NAV performance during periods of weakness for the high yield market.
During the reporting period, credit performance within the Fund continued to be strong and generally in line with the overall market, which showed little in the way of weakening credit conditions or increases in default expectations. In select cases, we harvested some price gains in the portfolio to offset some modest realized losses. This helped us to increase the overall quality of the portfolio by reducing its weight in underperforming credits or credits that we deemed were no longer suitable for the risk profile of the Fund. Again though, given the strong credit environment, we saw little in the way of credit deterioration among portfolio credits and the Fund had no defaults across its whole portfolio. The Fund was able to outperform the benchmark mainly by avoiding some of the weaker index performers, particularly in the energy industry.
The uptick in global default rates that resulted from the spike in defaults among energy and commodity companies over the past two years has run its course. By June 2017, Moody’s global speculative grade default rate had fallen to 3.2%, down from its August 2016 high of 4.8% for this cycle, and the rating agency is forecasting the global default rate will decline further to 2.5% by December 2017. Tightening high yield spreads and low levels of unemployment are just two factors signaling that the default rate will trend lower over the next twelve months. Other leading indicators of future default pressures have also improved, including strong performance from financial and bank equities and lower overall equity volatility.
The Fund continued to carry below market exposures to energy and CCC rated debt as set forth at its inception, which helped to mitigate volatility in its NAV during the reporting period. While we continue to attempt to maximize portfolio yield where achievable, we do so within the context of protecting the Fund’s credit quality and positioning the portfolio to alleviate the effects of early calls or redemptions. We expect to see some degree of call activity given the most recent downward trend in rates and the propensity for issuers to refinance their short-term debt and replace it with
longer maturities. However, as a result of tightening credit spreads in the high yield market, the Fund’s NAV moved higher over the course of the reporting period. As of the end of the reporting period, the Fund was on track to return its original NAV as described in its prospectus.
Nuveen High Income December 2018 Target Term Fund (JHA)
What key strategies were used to manage the Fund during this six-month reporting period ended June 30, 2017?
The Fund has an objective to provide a high level of current income and to return the original $9.86 net asset value (NAV) per common share on or about December 1, 2018. The Fund will seek to achieve its investment objectives by investing primarily in shorter maturity, high yield (below investment grade) corporate debt securities. High yield bonds typically offer higher yields than investment grade bonds, in exchange for greater credit risk. Bonds with shorter maturities have lower duration (or interest rate sensitivity) than longer maturity bonds, which may help mitigate price declines if rates rise.
The Fund may invest in other types of securities including senior loans, convertible securities and other types of debt instruments and derivatives that provide comparable economic exposure to the corporate debt market. At least 80% of its managed assets will be in corporate debt securities and separately, at least 80% in securities that, at the time of investment, are rated below investment grade or are unrated but judged by the portfolio managers to be of comparable quality. No more than 15% will be in securities rated CCC+/Caa1 or lower at the time of investment. Up to 30% may be in securities of non-U.S. issuers, including up to 20% in emerging market issuers and up to 10% may be in non-U.S. dollar denominated securities.
The Fund seeks to identify securities across diverse sectors and industries that the managers believe are undervalued or mispriced. In seeking to return the original NAV on or about December 1, 2018, the Fund intends to utilize various portfolio and cash flow management techniques, including setting aside a portion of its net investment income, possibly retaining gains and limiting the longest maturity of any holding to no later than June 1, 2019. The Fund also uses leverage.
How did the Fund perform during this six-month reporting period ended June 30, 2017?
The table in the Performance Overview and Holding Summaries section of this report provides total return performance for the Fund for the six-month, one-year and since inception periods ended June 30, 2017. For the six-month reporting period ended June 30, 2017, the Fund underperformed the Bloomberg Barclays U.S. High Yield 1-5 Year Cash Pay 2% Issuer Capped Index based on the Fund’s total return at NAV.
High yield spreads continued to tighten throughout the reporting period despite a brief correction in March when a temporary spike in interest rates, coupled with a slide in oil prices, caused high yield spreads to briefly widen. By the end of the reporting period, however, credit spreads were once again supported by steady investor interest in the Treasury market combined with low financial market volatility and strengthening equity markets. During the reporting period, high yield spreads in the broader market tightened by roughly 50 basis points to levels not seen since mid-2014, ending the reporting period at 390 basis points over Treasuries. Tightening spreads helped the segment achieve solid gains as demonstrated by a 4.27% return for the benchmark Bloomberg Barclays U.S. High Yield 1-5 Year Cash Pay 2% Issuer Capped Index and a 4.93% return for the broader Bloomberg Barclays U.S. Corporate High Yield Bond Index. Several other factors continued to positively affect the market including a pickup in economic activity around the world, solid corporate earnings, ongoing support from central banks across the globe and an underwhelming supply of bonds in the market. All of these positive factors aside, the high yield market did not experience strong inflows during the reporting period. Investors appeared wary about policy risk surrounding the Trump administration, geopolitical tensions, the decline in oil prices, lofty valuations and heightened risks as we head toward the September meetings for the European Central Bank and Federal Reserve.
Portfolio Managers’ Comments (continued)
The Fund seeks to protect against credit losses to help ensure the goal of returning its original NAV. While the Fund is designed to own more or less a static portfolio of high yield bonds, at times we have to add new securities to replace ones that have been called away or tendered. As we replace these bonds, we seek to maximize the Fund’s yield within the maturity, diversification and credit quality constraints described at the outset of the strategy. We may also look to maximize the Fund’s yield through opportunistic sales of securities that we believe have reached their upside potential, investing the proceeds in other securities that have a more attractive yield or credit profile. Our goal is to monetize some holdings at a gain, which should help to offset any realized or mark-to-market losses that may occur elsewhere in the portfolio. We believe the Fund’s focus on shorter-dated maturities, coupled with limitations to CCC rated securities, should result in lower volatility and help buffer its NAV performance during periods of weakness for the high yield market.
During the reporting period, credit performance within the Fund continued to be strong and generally in line with the overall market, which showed little in the way of weakening credit conditions or increases in default expectations. In select cases, we harvested some price gains in the portfolio to offset some modest realized losses. This helped us to increase the overall quality of the portfolio by reducing its weight in underperforming credits or credits that we deemed were no longer suitable for the risk profile of the Fund. While the Fund marginally underperformed the benchmark due to its modest overweight exposure to some underperforming credits, by and large the Fund continued to see little in the way of credit deterioration among portfolio credits and the Fund had no defaults across its whole portfolio.
The uptick in global default rates that resulted from the spike in defaults among energy and commodity companies over the past two years has run its course. By June 2017, Moody’s global speculative grade default rate had fallen to 3.2%, down from its August 2016 high of 4.8% for this cycle, and the rating agency is forecasting the global default rate will decline further to 2.5% by December 2017. Tightening high yield spreads and low levels of unemployment are just two factors signaling that the default rate will trend lower over the next twelve months. Other leading indicators of future default pressures have also improved, including strong performance from financial and bank equities and lower overall equity volatility.
The Fund continued to carry below-market exposures to energy and CCC rated debt as set forth at its inception, which helped to mitigate volatility in its NAV during the reporting period. While we continue to attempt to maximize portfolio yield where achievable, we do so within the context of protecting the Fund’s credit quality and positioning the portfolio to alleviate the effects of early calls or redemptions. Of course, we expect to see some degree of call activity given the most recent downward trend in rates and the propensity for issuers to refinance their short-term debt and replace it with longer maturities. However, as a result of tightening credit spreads in the high yield market, the Fund’s NAV moved higher over the course of the reporting period. As of the end of the reporting period, the Fund was on track to return its original NAV as described in its prospectus.
Nuveen High Income November 2021 Target Term Fund (JHB)
What key strategies were used to manage the Fund during this six-month reporting period ended June 30, 2017?
The Fund has an objective to provide a high level of current income and to return the original $9.85 net asset value (NAV) per common share on or about November 1, 2021. The Fund will seek to achieve its investment objectives by investing primarily in shorter maturity, high yield (below investment grade) corporate debt securities. High yield bonds typically offer higher yields than investment grade bonds, in exchange for greater credit risk. Bonds with shorter maturities have lower duration (or interest rate sensitivity) than longer maturity bonds, which may help mitigate price declines if rates rise.
The Fund may invest in other types of securities including senior loans, convertible securities and other types of debt instruments and derivatives that provide comparable economic exposure to the corporate debt market. At least 80% of
its managed assets will be in corporate debt securities and separately, at least 80% in securities that, at the time of investment, are rated below investment grade or are unrated but judged by the portfolio managers to be of comparable quality. No more than 15% will be in securities rated CCC+/Caa1 or lower at the time of investment. Up to 30% may be in securities of non-U.S. issuers, including up to 20% in emerging market issuers, and up to 10% may be in non-U.S. dollar denominated securities.
The Fund seeks to identify securities across diverse sectors and industries that the managers believe are undervalued or mispriced. In seeking to return the original NAV on or about November 1, 2021, the Fund intends to utilize various portfolio and cash flow management techniques, including setting aside a portion of its net investment income, possibly retaining gains and limiting the longest maturity of any holding to no later than May 1, 2022. The Fund also uses leverage.
How did the Fund perform during this six-month reporting period ended June 30, 2017?
The table in the Performance Overview and Holding Summaries section of this report provides total return performance for the Fund for the six-month and since inception periods ended June 30, 2017. For the six-month reporting period ended June 30, 2017, the Fund outperformed the Bloomberg Barclays U.S. High Yield 1-5 Year Cash Pay 2% Issuer Capped Index based on the Fund’s total return at NAV.
High yield spreads continued to tighten throughout the reporting period despite a brief correction in March when a temporary spike in interest rates, coupled with a slide in oil prices, caused high yield spreads to briefly widen. By the end of the reporting period, however, credit spreads were once again supported by steady investor interest in the Treasury market combined with low financial market volatility and strengthening equity markets. During the reporting period, high yield spreads in the broader market tightened by roughly 50 basis points to levels not seen since mid-2014, ending the reporting period at 390 basis points over Treasuries. Tightening spreads helped the segment achieve solid gains as demonstrated by a 4.27% return for the benchmark Bloomberg Barclays U.S. High Yield 1-5 Year Cash Pay 2% Issuer Capped Index and a 4.93% return for the broader Bloomberg Barclays U.S. Corporate High Yield Bond Index. Several other factors continued to positively affect the market including a pickup in economic activity around the world, solid corporate earnings, ongoing support from central banks across the globe and an underwhelming supply of bonds in the market. All of these positive factors aside, the high yield market did not experience strong inflows during the reporting period. Investors appeared wary about policy risk surrounding the Trump administration, geopolitical tensions, the decline in oil prices, lofty valuations and heightened risks as we head toward the September meetings for the European Central Bank and Federal Reserve.
The Fund seeks to protect against credit losses to help ensure the goal of returning its original NAV. While the Fund is designed to own more or less a static portfolio of high yield bonds, at times we have to add new securities to replace ones that have been called away or tendered. As we replace these bonds, we seek to maximize the Fund’s yield within the maturity, diversification and credit quality constraints described at the outset of the strategy. We may also look to maximize the Fund’s yield through opportunistic sales of securities that we believe have reached their upside potential, investing the proceeds in other securities that have a more attractive yield or credit profile. Our goal is to monetize some holdings at a gain, which should help to offset any realized or mark-to-market losses that may occur elsewhere in the portfolio. We believe the Fund’s focus on shorter-dated maturities, coupled with limitations to CCC rated securities, should result in lower volatility and help buffer its NAV performance during periods of weakness for the high yield market.
During the reporting period, credit performance within the Fund continued to be strong and generally in line with the overall market, which showed little in the way of weakening credit conditions or increases in default expectations. In select cases, we harvested some price gains in the portfolio to offset some modest realized losses. This helped us to increase the overall quality of the portfolio by reducing its weight in underperforming credits or credits that we deemed
Portfolio Managers’ Comments (continued)
were no longer suitable for the risk profile of the Fund. Again though, given the strong credit environment, we saw little in the way of credit deterioration among portfolio credits and the Fund had no defaults across its whole portfolio. The Fund was able to outperform the benchmark mainly by avoiding some of the weaker index performers, particularly in the energy industry.
The uptick in global default rates that resulted from the spike in defaults among energy and commodity companies over the past two years has run its course. By June 2017, Moody’s global speculative grade default rate had fallen to 3.2%, down from its August 2016 high of 4.8% for this cycle, and the rating agency is forecasting the global default rate will decline further to 2.5% by December 2017. Tightening high yield spreads and low levels of unemployment are just two factors signaling that the default rate will trend lower over the next twelve months. Other leading indicators of future default pressures have also improved, including strong performance from financial and bank equities and lower overall equity volatility.
The Fund continued to carry below market exposures to energy and CCC rated debt as set forth at its inception, which helped to mitigate volatility in its NAV during the reporting period. While we continue to attempt to maximize portfolio yield where achievable, we do so within the context of protecting the Fund’s credit quality and positioning the portfolio to alleviate the effects of early calls or redemptions. Of course, we expect to see some degree of call activity given the most recent downward trend in rates and the propensity for issuers to refinance their short-term debt and replace it with longer maturities. However, as a result of tightening credit spreads in the high yield market, the Fund’s NAV moved higher over the course of the reporting period. As of the end of the reporting period, the Fund was on track to return its original NAV as described in its prospectus.
Fund
Leverage
IMPACT OF THE FUNDS’ LEVERAGE STRATEGIES ON PERFORMANCE
One important factor impacting the returns of the Funds relative to their comparative benchmarks was the Funds’ use of leverage through the use of bank borrowings. The Funds use leverage because our research has shown that, over time, leveraging provides opportunities for additional income and total return for shareholders. However, use of leverage also can expose shareholders to additional volatility. For example, as the prices of securities held by a Fund decline, the negative impact of these valuation changes on NAV and shareholder total return is magnified by the use of leverage. Conversely, leverage may enhance returns during periods when the prices of securities held by a Fund generally are rising. The Funds’ use of leverage had a positive impact on the performance in each Fund during this reporting period.
As of June 30, 2017, the Funds’ percentages of leverage are shown in the accompanying table.
| | | | | | | | | | | | | | | | |
| | | JHY | | | JHD | | | JHA | | | JHB | |
Effective Leverage* | | | 23.08 | % | | | 24.41 | % | | | 23.63 | % | | | 25.07 | % |
Regulatory Leverage* | | | 23.08 | % | | | 24.41 | % | | | 23.63 | % | | | 25.07 | % |
| * | Effective Leverage is a Fund’s effective economic leverage, and includes both regulatory leverage and the leverage effects of certain derivative and other investments in a Fund’s portfolio that increase the Fund’s investment exposure. Regulatory leverage consists of preferred shares issued or borrowings of a Fund. Both of these are part of a Fund’s capital structure. A Fund, however, may from time to time borrow on a typically transient basis in connection with its day-to-day operations, primarily in connection with the need to settle portfolio trades. Such incidental borrowings are excluded from the calculation of a Fund’s effective leverage ratio. Regulatory leverage is subject to asset coverage limits set forth in the Investment Company Act of 1940. |
THE FUNDS’ REGULATORY LEVERAGE
Bank Borrowings
As noted above, the Funds employ leverage through the use of bank borrowings. The Funds’ bank borrowing activities are as shown in the accompanying table.
| | | | | | | | | | | | | | | | | | | | | | | | | | | | | | | | | | | | |
| | | Current Reporting Period | | | | | | Subsequent to the Close of
the Reporting Period | |
| Fund | | January 1, 2017 | | | Draws | | | Paydowns | | | June 30, 2017 | | | Average Balance
Outstanding | | | | | | Draws | | | Paydowns | | | August 25,
2017 | |
JHY | | $ | 44,000,000 | | | $ | — | | | $ | — | | | $ | 44,000,000 | | | $ | 44,000,000 | | | | | | | $ | — | | | $ | — | | | $ | 44,000,000 | |
JHD | | $ | 90,000,000 | | | $ | — | | | $ | — | | | $ | 90,000,000 | | | $ | 90,000,000 | | | | | | | $ | — | | | $ | — | | | $ | 90,000,000 | |
JHA | | $ | 92,000,000 | | | $ | — | | | $ | — | | | $ | 92,000,000 | | | $ | 92,000,000 | | | | | | | $ | — | | | $ | 40,500,000 | | | $ | 51,500,000 | |
JHB | | $ | 190,000,000 | | | $ | — | | | $ | — | | | $ | 190,000,000 | | | $ | 190,000,000 | | | | | | | $ | — | | | $ | — | | | $ | 190,000,000 | |
Refer to Notes to Financial Statements, Note 8 – Borrowing Arrangements for further details.
Share
Information
DISTRIBUTION INFORMATION
The following information regarding the Funds’ distributions is current as of June 30, 2017. Each Fund’s distribution levels may vary over time based on each Fund’s investment activity and portfolio investment value changes.
During the current reporting period, the Funds’ distributions to shareholders were as shown in the accompanying table.
| | | | | | | | | | | | | | | | |
| | | Per Share Amounts | |
| Monthly Distributions (Ex-Dividend Date) | | JHY | | | JHD | | | JHA | | | JHB | |
January 2017 | | $ | 0.0555 | | | $ | 0.0505 | | | $ | 0.0505 | | | $ | 0.0500 | |
February | | | 0.0555 | | | | 0.0505 | | | | 0.0450 | | | | 0.0500 | |
March | | | 0.0555 | | | | 0.0505 | | | | 0.0450 | | | | 0.0500 | |
April | | | 0.0555 | | | | 0.0505 | | | | 0.0450 | | | | 0.0500 | |
May | | | 0.0555 | | | | 0.0505 | | | | 0.0450 | | | | 0.0500 | |
June 2017 | | | 0.0490 | | | | 0.0505 | | | | 0.0400 | | | | 0.0500 | |
Total Distributions from Net Investment Income | | $ | 0.3265 | | | $ | 0.3030 | | | $ | 0.2705 | | | $ | 0.3000 | |
| | | | |
Current Distribution Rate* | | | 5.83 | % | | | 5.93 | % | | | 4.77 | % | | | 5.93 | % |
| * | Current distribution rate is based on the Fund’s current annualized monthly distribution divided by the Fund’s current market price. The Fund’s monthly distributions to its shareholders may be comprised of ordinary income, net realized capital gains and, if at the end of the fiscal year the Fund’s cumulative net ordinary income and net realized gains are less than the amount of the Fund’s distributions, a return of capital for tax purposes. |
Each Fund seeks to pay regular monthly dividends out of its net investment income at a rate that reflects its past and projected net income performance. To permit each Fund to maintain a more stable monthly dividend, the Fund may pay dividends at a rate that may be more or less than the amount of net income actually earned by the Fund during the period. If a Fund has cumulatively earned more than it has paid in dividends, it will hold the excess in reserve as undistributed net investment income (UNII) as part of the Fund’s net asset value. Conversely, if a Fund has cumulatively paid in dividends more than it has earned, the excess will constitute a negative UNII that will likewise be reflected in the Fund’s net asset value. Each Fund will, over time, pay all its net investment income as dividends to shareholders.
As of June 30, 2017, all the Funds had positive UNII balances, based upon our best estimate, for tax purposes and positive UNII balances for financial reporting purposes.
All monthly dividends paid by the Funds during the current reporting period, were paid from net investment income. If a portion of the Funds’ monthly distributions were sourced from or comprised of elements other than net investment income, including capital gains and/or a return of capital, shareholders would have received a notice to that effect. For financial reporting purposes, the composition and per share amounts of each Fund’s dividends for the reporting period are presented in this report’s Statement of Changes in Net Assets and Financial Highlights, respectively. For income tax purposes, distribution information for each Fund as of its most recent tax year end is presented in Note 6 – Income Tax Information within the Notes to Financial Statements of this report.
EQUITY SHELF PROGRAM
During the previous reporting period, JHY filed a registration statement with the Securities and Exchange Commission to issue additional shares through an equity shelf program (“Shelf Offering”), which became effective during the current reporting period. Under this program JHY, subject to market conditions, may raise additional capital from time to time in varying amounts and offering methods at a net price at or above the Fund’s NAV per share. Under the Shelf Offering, the Fund was authorized to issue additional shares as shown in the accompanying table.
| | | | |
| | | JHY | |
Additional authorized shares | | | 3,400,000 | |
During the current reporting period, JHY sold shares through its Shelf Offering at a weighted average premium to its NAV per share as shown in the accompanying table.
| | | | |
| | | JHY | |
Shares sold through Shelf Offering | | | 1,054,058 | |
Weighted average premium to NAV per share sold | | | 2.55 | % |
Refer to the Notes to Financial Statements, Note 4 – Fund Shares, Equity Shelf Programs and Offering Costs for further details of Shelf Offerings and the Fund’s transactions.
SHARE REPURCHASES
During August 2017 (subsequent to the close of the reporting period), the Funds’ Board of Trustees reauthorized JHY, JHD and JHA and authorized JHB to participate in Nuveen’s closed-end fund complex-wide share repurchase program, allowing each Fund to repurchase an aggregate of up to approximately 10% of its outstanding shares.
As of June 30, 2017, and since the inception of the Funds’ repurchase programs, the following Funds have cumulatively repurchased and retired their outstanding shares as shown in the accompanying table.
| | | | | | | | | | | | |
| | | JHY | | | JHD | | | JHA | |
Shares cumulatively repurchased and retired | | | — | | | | — | | | | — | |
Shares authorized for repurchase | | | 1,370,000 | | | | 2,705,000 | | | | 2,930,000 | |
OTHER SHARE INFORMATION
As of June 30, 2017, and during the current reporting period, the Funds’ share prices were trading at premium/(discount) to their share NAVs as shown in the accompanying table.
| | | | | | | | | | | | | | | | |
| | | JHY | | | JHD | | | JHA | | | JHB | |
NAV | | $ | 9.93 | | | $ | 10.30 | | | $ | 10.13 | | | $ | 10.16 | |
Share price | | $ | 10.09 | | | $ | 10.22 | | | $ | 10.06 | | | $ | 10.11 | |
Premium/(Discount) to NAV | | | 1.61 | % | | | (0.78 | )% | | | (0.69 | )% | | | (0.49 | )% |
6-month average premium/(discount) to NAV | | | 2.95 | % | | | (0.41 | )% | | | 0.15 | % | | | (0.16 | )% |
JHY, JHD, JHA and JHB each have an investment objective to return $9.85, $9.86, $9.86 and $9.85, respectively (the original net asset value following each Fund’s initial public offering (the “Original NAV”)) to shareholders on or about the end of the Fund’s term. There can be no assurance that the Funds will be able to return the Original NAV to shareholders, and such return is not backed or otherwise guaranteed by the Funds’ investment adviser, Nuveen Fund Advisors, LLC (the “Adviser”), or any other entity.
Each Fund’s ability to return Original NAV to common shareholders on or about the Termination Date will depend on market conditions and the success of various portfolio and cash flow management techniques. Each Fund currently intends to set aside and retain in its net assets a portion of its net investment income and possibly all or a portion of its gains. This will reduce the amounts otherwise available for distribution prior to the liquidation of each Fund, and the Fund may incur taxes on such retained amount, which will reduce the overall amounts that the Fund would have otherwise been able to distribute. Such retained income or gains, net of any taxes, would constitute a portion of the liquidating distribution returned to investors at the end of each Fund’s term. In addition, each Fund’s investment in shorter term and lower yielding securities, especially as the Fund nears the end of its term, may reduce investment income and, therefore, the monthly dividends during the period prior to termination. Investors that purchase shares in the secondary market (particularly if their purchase price differs meaningfully from the Original NAV) may receive more or less than their original investment.
Risk
Considerations
Fund shares are not guaranteed or endorsed by any bank or other insured depository institution, and are not federally insured by the Federal Deposit Insurance Corporation.
Nuveen High Income 2020 Target Term Fund (JHY)
Investing in closed-end funds involves risk; principal loss is possible. There is no guarantee the Fund’s investment objectives will be achieved. Closed-end fund shares may frequently trade at a discount or premium to their net asset value. Debt or fixed income securities such as those held by the Fund, are subject to market risk, credit risk, interest rate risk, derivatives risk, liquidity risk, and income risk. As interest rates rise, bond prices fall. Lower credit debt securities may be more likely to fail to make timely interest or principal payments and may be subject to higher liquidity risk. Leverage increases return volatility and magnifies the Fund’s potential return and its risks; there is no guarantee a fund’s leverage strategy will be successful. Foreign investments involve additional risks, including currency fluctuation, political and economic instability, lack of liquidity and differing legal and accounting standards. The risks of foreign investments are magnified in emerging markets. These and other risk considerations including the Fund’s limited term and call risk are described in more detail on the Fund’s web page at www.nuveen.com/JHY.
Nuveen High Income December 2019 Target Term Fund (JHD)
Investing in closed-end funds involves risk; principal loss is possible. There is no guarantee the Fund’s investment objectives will be achieved. Closed-end fund shares may frequently trade at a discount or premium to their net asset value. Debt or fixed income securities such as those held by the Fund, are subject to market risk, credit risk, interest rate risk, derivatives risk, liquidity risk, and income risk. As interest rates rise, bond prices fall. Lower credit debt securities may be more likely to fail to make timely interest or principal payments and may be subject to higher liquidity risk. Leverage increases return volatility and magnifies the Fund’s potential return and its risks; there is no guarantee a fund’s leverage strategy will be successful. Foreign investments involve additional risks, including currency fluctuation, political and economic instability, lack of liquidity and differing legal and accounting standards. The risks of foreign investments are magnified in emerging markets. These and other risk considerations including the Fund’s limited term and call risk are described in more detail on the Fund’s web page at www.nuveen.com/JHD.
Nuveen High Income December 2018 Target Term Fund (JHA)
Investing in closed-end funds involves risk; principal loss is possible. There is no guarantee the Fund’s investment objectives will be achieved. Closed-end fund shares may frequently trade at a discount or premium to their net asset value. Debt or fixed income securities such as those held by the Fund, are subject to market risk, credit risk, interest rate risk, derivatives risk, liquidity risk, and income risk. As interest rates rise, bond prices fall. Lower credit debt securities may be more likely to fail to make timely interest or principal payments and may be subject to higher liquidity risk. Leverage increases return volatility and magnifies the Fund’s potential return and its risks; there is no guarantee a fund’s leverage strategy will be successful. Foreign investments involve additional risks, including currency fluctuation, political and economic instability, lack of liquidity and differing legal and accounting standards. The risks of foreign investments are magnified in emerging markets. These and other risk considerations including the Fund’s limited term and call risk are described in more detail on the Fund’s web page at nuveen.com/JHA.
Nuveen High Income November 2021 Target Term Fund (JHB)
Investing in closed-end funds involves risk; principal loss is possible. There is no guarantee the Fund’s investment objectives will be achieved. Closed-end fund shares may frequently trade at a discount or premium to their net asset value. Debt or fixed income securities such as those held by the Fund, are subject to market risk, credit risk, interest rate risk, derivatives risk, liquidity risk, and income risk. As interest rates rise, bond prices fall. Lower credit debt
Risk Considerations (continued)
securities may be more likely to fail to make timely interest or principal payments and may be subject to higher liquidity risk. Leverage increases return volatility and magnifies the Fund’s potential return and its risks; there is no guarantee a fund’s leverage strategy will be successful. Foreign investments involve additional risks, including currency fluctuation, political and economic instability, lack of liquidity and differing legal and accounting standards. The risks of foreign investments are magnified in emerging markets. These and other risk considerations including the Fund’s limited term and call risk are described in more detail on the Fund’s web page at www.nuveen.com/JHB.
JHY
Nuveen High Income 2020 Target Term Fund
Performance Overview and Holding Summaries as of June 30, 2017
Refer to the Glossary of Terms Used in this Report for further definition of the terms used within this section.
Average Annual Total Returns as of June 30, 2017
| | | | | | | | | | | | |
| | | Cumulative | | | Average Annual | |
| | | 6-Month | | | 1-Year | | | Since
Inception | |
| JHY at NAV | | | 5.24% | | | | 14.37% | | | | 7.81% | |
| JHY at Share Price | | | 2.11% | | | | (0.19)% | | | | 7.55% | |
| Bloomberg Barclays U.S. High Yield 1-5 Year Cash Pay 2% Issuer Capped Index | | | 4.27% | | | | 11.96% | | | | 7.12% | |
Since inception returns are from 7/28/15. Past performance is not predictive of future results. Current performance may be higher or lower than the data shown. Returns do not reflect the deduction of taxes that shareholders may have to pay on Fund distributions or upon the sale of Fund shares. Returns at NAV are net of Fund expenses, and assume reinvestment of distributions. Comparative index return information is provided for the Fund’s shares at NAV only. Indexes are not available for direct investment.
Share Price Performance — Weekly Closing Price

This data relates to the securities held in the Fund’s portfolio of investments as of the end of the reporting period. It should not be construed as a measure of performance for the Fund itself. Holdings are subject to change.
For financial reporting purposes, the ratings disclosed are the highest rating given by one of the following national rating agencies: Standard & Poor’s Group, Moody’s Investors Service, Inc. or Fitch, Inc. This treatment of split-rated securities may differ from that used for other purposes, such as for Fund investment policies. Credit ratings are subject to change. AAA, AA, A and BBB are investment grade ratings; BB, B, CCC, CC, C and D are below-investment grade ratings. Certain bonds backed by U.S. Government or agency securities are regarded as having an implied rating equal to the rating of such securities. Holdings designated N/R are not rated by these national rating agencies.
Fund Allocation
(% of net assets)
| | | | |
| Corporate Bonds | | | 121.1% | |
| Convertible Bonds | | | 2.3% | |
| Sovereign Debt | | | 1.3% | |
| Repurchase Agreements | | | 2.1% | |
| Other Assets Less Liabilities | | | 3.2% | |
Net Assets Plus Borrowings | | | 130.0% | |
| Borrowings | | | (30.0)% | |
Net Assets | | | 100% | |
Country Allocation
(% of total investments)1
| | | | |
| United States | | | 73.9% | |
| Canada | | | 7.6% | |
| Japan | | | 2.6% | |
| Bermuda | | | 2.3% | |
| United Kingdom | | | 2.3% | |
| Luxembourg | | | 2.0% | |
| Brazil | | | 1.7% | |
| Argentina | | | 1.5% | |
| Hong Kong | | | 1.4% | |
| Netherlands | | | 1.1% | |
| Other | | | 3.6% | |
Total | | | 100% | |
Portfolio Composition
(% of total investments)
| | | | |
| Oil, Gas & Consumable Fuels | | | 11.3% | |
| Diversified Financial Services | | | 6.3% | |
| Metals & Mining | | | 5.6% | |
| Wireless Telecommunication Services | | | 5.3% | |
| Household Durables | | | 4.9% | |
| Independent Power & Renewable Electricity Producers | | | 4.9% | |
| Consumer Finance | | | 4.0% | |
| Media | | | 3.7% | |
| Specialty Retail | | | 3.7% | |
| Machinery | | | 3.7% | |
| Commercial Services & Supplies | | | 3.4% | |
| Diversified Telecommunication Services | | | 3.1% | |
| Health Care Providers & Services | | | 2.9% | |
| Hotels, Restaurants & Leisure | | | 2.9% | |
| Airlines | | | 2.5% | |
| Aerospace & Defense | | | 2.2% | |
| Real Estate Management & Development | | | 2.0% | |
| Road & Rail | | | 1.7% | |
| Building Products | | | 1.6% | |
| Industrial Conglomerates | | | 1.4% | |
| Construction & Engineering | | | 1.2% | |
| Other | | | 19.1% | |
| Sovereign Debt | | | 1.0% | |
| Repurchase Agreements | | | 1.6% | |
Total | | | 100% | |
Credit Quality
(% of total long-term investments)
| | | | |
| BBB | | | 3.6% | |
| BB or Lower | | | 92.9% | |
| N/R (not rated) | | | 3.5% | |
Total | | | 100% | |
Top Five Issuers
(% of total investments)
| | | | |
| The Hertz Corporation | | | 1.7% | |
| Jefferies Finance LLC Corporation | | | 1.7% | |
| DPL, Inc. | | | 1.5% | |
| Titan International Inc. | | | 1.5% | |
| Clear Channel Worldwide | | | 1.5% | |
| 1 | Includes 8.9% (as a percentage of total investments) in emerging markets countries. |
JHD
Nuveen High Income December 2019 Target Term Fund
Performance Overview and Holding Summaries as of June 30, 2017
Refer to the Glossary of Terms Used in this Report for further definition of the terms used within this section.
Average Annual Total Returns as of June 30, 2017
| | | | | | | | | | | | |
| | | Cumulative | | | Average Annual | |
| | | 6-Month | | | 1-Year | | | Since
Inception | |
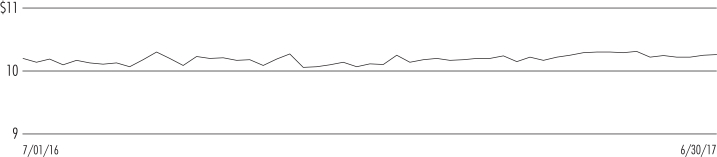
| JHD at NAV | | | 4.50% | | | | 11.07% | | | | 9.43% | |
| JHD at Share Price | | | 4.22% | | | | 4.98% | | | | 7.36% | |
| Bloomberg Barclays U.S. High Yield 1-5 Year Cash Pay 2% Issuer Capped Index | | | 4.27% | | | | 11.96% | | | | 12.92% | |
Since inception returns are from 5/10/16. Past performance is not predictive of future results. Current performance may be higher or lower than the data shown. Returns do not reflect the deduction of taxes that shareholders may have to pay on Fund distributions or upon the sale of Fund shares. Returns at NAV are net of Fund expenses, and assume reinvestment of distributions. Comparative index return information is provided for the Fund’s shares at NAV only. Indexes are not available for direct investment.
Share Price Performance — Weekly Closing Price
This data relates to the securities held in the Fund’s portfolio of investments as of the end of the reporting period. It should not be construed as a measure of performance for the Fund itself. Holdings are subject to change.
For financial reporting purposes, the ratings disclosed are the highest rating given by one of the following national rating agencies: Standard & Poor’s Group, Moody’s Investors Service, Inc. or Fitch, Inc. This treatment of split-rated securities may differ from that used for other purposes, such as for Fund investment policies. Credit ratings are subject to change. AAA, AA, A and BBB are investment grade ratings; BB, B, CCC, CC, C and D are below-investment grade ratings. Certain bonds backed by U.S. Government or agency securities are regarded as having an implied rating equal to the rating of such securities. Holdings designated N/R are not rated by these national rating agencies.
Fund Allocation
(% of net assets)
| | | | |
| Corporate Bonds | | | 125.7% | |
| Convertible Bonds | | | 2.7% | |
| Sovereign Debt | | | 1.8% | |
| Repurchase Agreements | | | 0.1% | |
| Other Assets Less Liabilities | | | 2.0% | |
Net Assets Plus Borrowings | | | 132.3% | |
| Borrowings | | | (32.3)% | |
Net Assets | | | 100% | |
Country Allocation
(% of total investments)1
| | | | |
| United States | | | 73.5% | |
| Canada | | | 4.6% | |
| United Kingdom | | | 3.9% | |
| Luxembourg | | | 3.7% | |
| Brazil | | | 3.3% | |
| Japan | | | 1.9% | |
| Germany | | | 1.3% | |
| Hong Kong | | | 1.2% | |
| Ireland | | | 1.1% | |
| Australia | | | 1.1% | |
| Other | | | 4.4% | |
Total | | | 100% | |
Portfolio Composition
(% of total investments)
| | | | |
| Oil, Gas & Consumable Fuels | | | 8.5% | |
| Household Durables | | | 6.9% | |
| Independent Power & Renewable Electricity Producers | | | 5.9% | |
| Health Care Providers & Services | | | 5.4% | |
| Metals & Mining | | | 4.7% | |
| Technology Hardware, Storage & Peripherals | | | 4.2% | |
| Diversified Financial Services | | | 4.1% | |
| Wireless Telecommunication Services | | | 3.9% | |
| Media | | | 3.7% | |
| Airlines | | | 3.5% | |
| Equity Real Estate Investment Trusts | | | 3.3% | |
| Hotels, Restaurants & Leisure | | | 3.1% | |
| Consumer Finance | | | 3.0% | |
| Diversified Telecommunication Services | | | 2.8% | |
| Banks | | | 2.7% | |
| Chemicals | | | 2.2% | |
| Commercial Services & Supplies | | | 2.1% | |
| Energy Equipment & Services | | | 1.8% | |
| Health Care Equipment & Supplies | | | 1.8% | |
| Electronic Equipment, Instruments & Components | | | 1.8% | |
| Food Products | | | 1.7% | |
| Specialty Retail | | | 1.7% | |
| | | | |
| Other | | | 19.7% | |
| Sovereign Debt | | | 1.4% | |
| Repurchase Agreements | | | 0.1% | |
Total | | | 100% | |
Credit Quality
(% of total long-term investments)
| | | | |
| A | | | 0.1% | |
| BBB | | | 15.2% | |
| BB or Lower | | | 82.4% | |
| N/R (not rated) | | | 2.3% | |
Total | | | 100% | |
Top Five Issuers
(% of total investments)
| | | | |
Tenet Healthcare Corporation | | | 1.8% | |
American Airlines Group Inc. | | | 1.6% | |
CenturyLink Inc. | | | 1.6% | |
Kindred Healthcare Inc. | | | 1.5% | |
DPL, Inc. | | | 1.5% | |
| 1 | Includes 10.0% (as a percentage of total investments) in emerging markets countries. |
JHA
Nuveen High Income December 2018 Target Term Fund
Performance Overview and Holding Summaries as of June 30, 2017
Refer to the Glossary of Terms Used in this Report for further definition of the terms used within this section.
Average Annual Total Returns as of June 30, 2017
| | | | | | | | | | | | |
| | | Cumulative | | | Average Annual | |
| | | 6-Month | | | 1-Year | | | Since
Inception | |
| JHA at NAV | | | 3.21% | | | | 7.52% | | | | 7.27% | |
| JHA at Share Price | | | 2.70% | | | | 2.66% | | | | 5.89% | |
| Bloomberg Barclays U.S. High Yield 1-5 Year Cash Pay 2% Issuer Capped Index | | | 4.27% | | | | 11.96% | | | | 9.90% | |
Since inception returns are from 11/12/15. Past performance is not predictive of future results. Current performance may be higher or lower than the data shown. Returns do not reflect the deduction of taxes that shareholders may have to pay on Fund distributions or upon the sale of Fund shares. Returns at NAV are net of Fund expenses, and assume reinvestment of distributions. Comparative index return information is provided for the Fund’s shares at NAV only. Indexes are not available for direct investment.
Share Price Performance — Weekly Closing Price
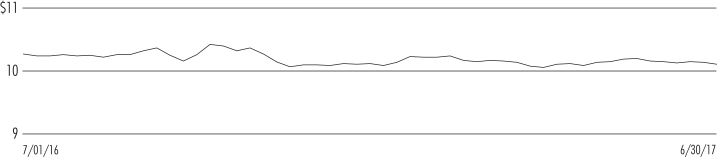
This data relates to the securities held in the Fund’s portfolio of investments as of the end of the reporting period. It should not be construed as a measure of performance for the Fund itself. Holdings are subject to change.
For financial reporting purposes, the ratings disclosed are the highest rating given by one of the following national rating agencies: Standard & Poor’s Group, Moody’s Investors Service, Inc. or Fitch, Inc. This treatment of split-rated securities may differ from that used for other purposes, such as for Fund investment policies. Credit ratings are subject to change. AAA, AA, A and BBB are investment grade ratings; BB, B, CCC, CC, C and D are below-investment grade ratings. Certain bonds backed by U.S. Government or agency securities are regarded as having an implied rating equal to the rating of such securities. Holdings designated N/R are not rated by these national rating agencies.
Fund Allocation
(% of net assets)
| | | | |
| Corporate Bonds | | | 117.4% | |
| Convertible Bonds | | | 6.2% | |
| Sovereign Debt | | | 3.0% | |
| Repurchase Agreements | | | 2.2% | |
| Other Assets Less Liabilities | | | 2.1% | |
Net Assets Plus Borrowings | | | 130.9% | |
| Borrowings | | | (30.9)% | |
Net Assets | | | 100% | |
Country Allocation
(% of total investments)1
| | | | |
| United States | | | 76.9% | |
| Canada | | | 4.5% | |
| United Kingdom | | | 2.6% | |
| Brazil | | | 2.6% | |
| Japan | | | 2.0% | |
| Luxembourg | | | 2.0% | |
| Ireland | | | 1.9% | |
| India | | | 1.7% | |
| Netherlands | | | 1.3% | |
| Germany | | | 1.2% | |
| Other | | | 3.3% | |
Total | | | 100% | |
Portfolio Composition
(% of total investments)
| | | | |
| Oil, Gas & Consumable Fuels | | | 9.9% | |
| Household Durables | | | 6.2% | |
| Metals & Mining | | | 5.6% | |
| Airlines | | | 4.6% | |
| Equity Real Estate Investment Trusts | | | 4.4% | |
| Consumer Finance | | | 4.3% | |
| Health Care Providers & Services | | | 4.2% | |
| Media | | | 3.6% | |
| Diversified Telecommunication Services | | | 3.6% | |
| Technology Hardware, Storage & Peripherals | | | 3.5% | |
| Automobiles | | | 3.3% | |
| Electronic Equipment, Instruments & Components | | | 3.0% | |
| Independent Power & Renewable Electricity Producers | | | 2.9% | |
| Machinery | | | 2.7% | |
| Health Care Equipment & Supplies | | | 2.6% | |
| Banks | | | 2.0% | |
| Capital Markets | | | 2.0% | |
| Wireless Telecommunication Services | | | 2.0% | |
| Commercial Services & Supplies | | | 1.9% | |
| Energy Equipment & Services | | | 1.9% | |
| Food Products | | | 1.7% | |
| Other | | | 20.0% | |
| | | | |
| Sovereign Debt | | | 2.4% | |
| Repurchase Agreements | | | 1.7% | |
Total | | | 100% | |
Credit Quality
(% of total long-term investments)
| | | | |
| A | | | 0.4% | |
| BBB | | | 24.5% | |
| BB or Lower | | | 72.0% | |
| N/R (not rated) | | | 3.1% | |
Total | | | 100% | |
Top Five Issuers
(% of total investments)
| | | | |
| Tenet Healthcare Corporation | | | 2.6% | |
| HCA Inc. | | | 2.0% | |
| Sprint Communications Inc. | | | 2.0% | |
| iStar Inc. | | | 1.9% | |
| Qwest Capital Funding Inc. | | | 1.8% | |
| 1 | Includes 9.3% (as a percentage of total investments) in emerging markets countries. |
JHB
Nuveen High Income November 2021 Target Term Fund
Performance Overview and Holding Summaries as of June 30, 2017
Refer to the Glossary of Terms Used in this Report for further definition of the terms used within this section.
Cumulative Total Returns as of June 30, 2017
| | | | | | | | |
| | | Cumulative | |
| | | 6-Month | | | Since
Inception | |
| JHB at NAV | | | 5.49% | | | | 7.87% | |
| JHB at Share Price | | | 5.41% | | | | 5.75% | |
| Bloomberg Barclays U.S. High Yield 1-5 Year Cash Pay 2% Issuer Capped Index | | | 4.27% | | | | 7.96% | |
Since inception returns are from 8/23/16. Past performance is not predictive of future results. Current performance may be higher or lower than the data shown. Returns do not reflect the deduction of taxes that shareholders may have to pay on Fund distributions or upon the sale of Fund shares. Returns at NAV are net of Fund expenses, and assume reinvestment of distributions. Comparative index return information is provided for the Fund’s shares at NAV only. Indexes are not available for direct investment.
Share Price Performance — Weekly Closing Price
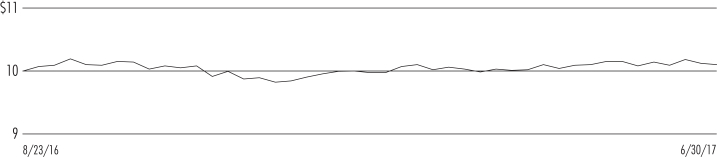
This data relates to the securities held in the Fund’s portfolio of investments as of the end of the reporting period. It should not be construed as a measure of performance for the Fund itself. Holdings are subject to change.
For financial reporting purposes, the ratings disclosed are the highest rating given by one of the following national rating agencies: Standard & Poor’s Group, Moody’s Investors Service, Inc. or Fitch, Inc. This treatment of split-rated securities may differ from that used for other purposes, such as for Fund investment policies. Credit ratings are subject to change. AAA, AA, A and BBB are investment grade ratings; BB, B, CCC, CC, C and D are below-investment grade ratings. Certain bonds backed by U.S. Government or agency securities are regarded as having an implied rating equal to the rating of such securities. Holdings designated N/R are not rated by these national rating agencies.
Fund Allocation
(% of net assets)
| | | | |
| Corporate Bonds | | | 129.1% | |
| Convertible Bonds | | | 0.7% | |
| Sovereign Debt | | | 0.6% | |
| Other Assets Less Liabilities | | | 3.0% | |
Net Assets Plus Borrowings | | | 133.4% | |
| Borrowings | | | (33.4)% | |
Net Assets | | | 100% | |
Country Allocation
(% of total investments)1
| | | | |
| United States | | | 74.7% | |
| Canada | | | 5.3% | |
| Luxembourg | | | 5.0% | |
| United Kingdom | | | 3.0% | |
| Netherlands | | | 1.5% | |
| Japan | | | 1.4% | |
| Australia | | | 1.2% | |
| Brazil | | | 1.1% | |
| Mexico | | | 1.0% | |
| Ireland | | | 0.9% | |
| Other | | | 4.9% | |
Total | | | 100% | |
Portfolio Composition
(% of total investments)
| | | | |
| Metals & Mining | | | 9.7% | |
| Oil, Gas & Consumable Fuels | | | 8.8% | |
| Media | | | 8.3% | |
| Wireless Telecommunication Services | | | 5.1% | |
| Household Durables | | | 4.7% | |
| Health Care Providers & Services | | | 4.5% | |
| Hotels, Restaurants & Leisure | | | 4.3% | |
| Diversified Financial Services | | | 4.0% | |
| Consumer Finance | | | 4.0% | |
| Independent Power & Renewable Electricity Producers | | | 3.4% | |
| Diversified Telecommunication Services | | | 2.9% | |
| Equity Real Estate Investment Trusts | | | 2.6% | |
| Chemicals | | | 2.6% | |
| Commercial Services & Supplies | | | 2.5% | |
| Real Estate Management & Development | | | 2.4% | |
| Aerospace & Defense | | | 2.0% | |
| Airlines | | | 1.7% | |
| Machinery | | | 1.7% | |
| Containers & Packaging | | | 1.6% | |
| Specialty Retail | | | 1.5% | |
| Pharmaceuticals | | | 1.5% | |
| Other | | | 19.8% | |
| Sovereign Debt | | | 0.4% | |
Total | | | 100% | |
Credit Quality
(% of total long-term investments)
| | | | |
| A | | | 0.1% | |
| BBB | | | 2.9% | |
| BB or Lower | | | 94.5% | |
| N/R (not rated) | | | 2.5% | |
Total | | | 100% | |
Top Five Issuers
(% of total investments)
| | | | |
| CenturyLink Inc. | | | 1.3% | |
| Icahn Enterprises Finance | | | 1.2% | |
| OneMain Financial Holdings, Inc. | | | 1.2% | |
| Wind Acquisition Finance SA | | | 1.2% | |
| United States Steel Corporation | | | 1.2% | |
| 1 | Includes 10.2% (as a percentage of total investments) in emerging markets countries. |
Shareholder
Meeting Report
The annual meeting of shareholders was held in the offices of Nuveen on April 6, 2017 for JHY, JHD, JHA and JHB; at this meeting the shareholders were asked to elect Board Members.
| | | | | | | | | | | | | | | | |
| | | JHY | | | JHD | | | JHA | | | JHB | |
| | | Common
Shares | | | Common
Shares | | | Common
Shares | | | Common
Shares | |
Approval of the Board Members was reached as follows: | | | | | | | | | |
William Adams IV | | | | | | | | | | | | | | | | |
For | | | 11,261,545 | | | | 21,912,145 | | | | 24,082,730 | | | | 45,982,790 | |
Withhold | | | 85,735 | | | | 263,727 | | | | 293,462 | | | | 511,377 | |
Total | | | 11,347,280 | | | | 22,175,872 | | | | 24,376,192 | | | | 46,494,167 | |
David J. Kundert | | | | | | | | | | | | | | | | |
For | | | 11,263,945 | | | | 21,907,645 | | | | 24,023,621 | | | | 45,966,826 | |
Withhold | | | 83,335 | | | | 268,227 | | | | 352,571 | | | | 527,341 | |
Total | | | 11,347,280 | | | | 22,175,872 | | | | 24,376,192 | | | | 46,494,167 | |
John K. Nelson | | | | | | | | | | | | | | | | |
For | | | 11,264,945 | | | | 21,912,645 | | | | 24,086,630 | | | | 46,002,697 | |
Withhold | | | 82,335 | | | | 263,227 | | | | 289,562 | | | | 491,470 | |
Total | | | 11,347,280 | | | | 22,175,872 | | | | 24,376,192 | | | | 46,494,167 | |
Terence J. Toth | | | | | | | | | | | | | | | | |
For | | | 11,264,445 | | | | 21,912,145 | | | | 24,040,724 | | | | 46,002,197 | |
Withhold | | | 82,835 | | | | 263,727 | | | | 335,468 | | | | 491,970 | |
Total | | | 11,347,280 | | | | 22,175,872 | | | | 24,376,192 | | | | 46,494,167 | |
JHY
| | |
Nuveen High Income 2020 Target Term Fund |
Portfolio of Investments | | June 30, 2017 (Unaudited) |
| | | | | | | | | | | | | | | | | | | | |
Principal
Amount (000) | | | Description (1) | | Coupon | | | Maturity | | | Ratings (2) | | | Value | |
| |
| | | | LONG-TERM INVESTMENTS – 124.7% (98.4% of Total Investments) | |
| | | | | |
| | | | CORPORATE BONDS – 121.1% (95.5% of Total Investments) | | | | | | | | | | | | | | | | |
| | | | | |
| | | | Aerospace & Defense – 2.7% | | | | | | | | | | | | |
| | | | | |
| $ | 1,250 | | | Bombardier Inc., 144A | | | 7.750% | | | | 3/15/20 | | | | B | | | $ | 1,343,750 | |
| | 2,700 | | | Triumph Group Inc. | | | 4.875% | | | | 4/01/21 | | | | B1 | | | | 2,683,125 | |
| | 3,950 | | | Total Aerospace & Defense | | | | | | | | | | | | | | | 4,026,875 | |
| | | | | |
| | | | Airlines – 3.2% | | | | | | | | | | | | |
| | | | | |
| | 1,524 | | | Air Canada, 144A | | | 7.750% | | | | 4/15/21 | | | | BB– | | | | 1,744,980 | |
| | 825 | | | American Airlines Group Inc., 144A | | | 4.625% | | | | 3/01/20 | | | | BB– | | | | 853,273 | |
| | 2,000 | | | Virgin Australia Holdings Limited, 144A | | | 8.500% | | | | 11/15/19 | | | | B– | | | | 2,105,000 | |
| | 4,349 | | | Total Airlines | | | | | | | | | | | | | | | 4,703,253 | |
| | | | | |
| | | | Auto Components – 1.1% | | | | | | | | | | | | |
| | | | | |
| | 1,500 | | | American & Axle Manufacturing Inc. | | | 6.250% | | | | 3/15/21 | | | | BB– | | | | 1,541,250 | |
| | | | | |
| | | | Banks – 1.4% | | | | | | | | | | | | |
| | | | | |
| | 2,000 | | | Popular Inc. | | | 7.000% | | | | 7/01/19 | | | | BB– | | | | 2,100,000 | |
| | | | | |
| | | | Building Products – 2.0% | | | | | | | | | | | | |
| | | | | |
| | 1,000 | | | Euramax International Inc., 144A | | | 12.000% | | | | 8/15/20 | | | | B– | | | | 1,090,000 | |
| | 1,750 | | | Taylor Morrison Monarch Communities, 144A | | | 5.250% | | | | 4/15/21 | | | | BB– | | | | 1,793,750 | |
| | 2,750 | | | Total Building Products | | | | | | | | | | | | | | | 2,883,750 | |
| | | | | |
| | | | Chemicals – 1.2% | | | | | | | | | | | | |
| | | | | |
| | 750 | | | CF Industries Inc. | | | 7.125% | | | | 5/01/20 | | | | BB+ | | | | 828,750 | |
| | 1,000 | | | Hexion Inc. | | | 10.000% | | | | 4/15/20 | | | | CCC+ | | | | 992,500 | |
| | 1,750 | | | Total Chemicals | | | | | | | | | | | | | | | 1,821,250 | |
| | | | | |
| | | | Commercial Services & Supplies – 4.2% | | | | | | | | | | | | |
| | | | | |
| | 1,350 | | | APX Group, Inc. | | | 8.750% | | | | 12/01/20 | | | | CCC+ | | | | 1,393,875 | |
| | 2,060 | | | GFL Environmental Corporation, 144A | | | 9.875% | | | | 2/01/21 | | | | B– | | | | 2,240,250 | |
| | 2,395 | | | R.R. Donnelley & Sons Company | | | 7.875% | | | | 3/15/21 | | | | B+ | | | | 2,592,587 | |
| | 5,805 | | | Total Commercial Services & Supplies | | | | | | | | | | | | | | | 6,226,712 | |
| | | | | |
| | | | Construction & Engineering – 1.6% | | | | | | | | | | | | |
| | | | | |
| | 1,000 | | | HC2 Holdings, Inc., 144A | | | 11.000% | | | | 12/01/19 | | | | B– | | | | 1,022,500 | |
| | 1,290 | | | Michael Baker International LLC / CDL Acquisition Company Inc., 144A | | | 8.250% | | | | 10/15/18 | | | | B– | | | | 1,283,550 | |
| | 2,290 | | | Total Construction & Engineering | | | | | | | | | | | | | | | 2,306,050 | |
| | | | | |
| | | | Consumer Finance – 5.0% | | | | | | | | | | | | |
| | | | | |
| | 920 | | | Covenant Surgical Partners Inc., 144A | | | 8.750% | | | | 8/01/19 | | | | B– | | | | 901,600 | |
| | 2,400 | | | Credit Acceptance Corporation | | | 6.125% | | | | 2/15/21 | | | | BB | | | | 2,460,000 | |
| | 2,370 | | | Navient Corporation | | | 5.000% | | | | 10/26/20 | | | | BB | | | | 2,458,875 | |
| | 1,500 | | | OneMain Financial Holdings, Inc., 144A | | | 6.750% | | | | 12/15/19 | | | | B1 | | | | 1,575,000 | |
| | 7,190 | | | Total Consumer Finance | | | | | | | | | | | | | | | 7,395,475 | |
| | | | | |
| | | | Containers & Packaging – 1.4% | | | | | | | | | | | | |
| | | | | |
| | 1,070 | | | Coveris Holdings SA, 144A | | | 7.875% | | | | 11/01/19 | | | | B– | | | | 1,053,950 | |
| | 640 | | | PaperWorks Industries Inc., 144A | | | 9.500% | | | | 8/15/19 | | | | CCC+ | | | | 473,600 | |
| | 500 | | | Reynolds Group | | | 5.750% | | | | 10/15/20 | | | | B+ | | | | 511,670 | |
| | 2,210 | | | Total Containers & Packaging | | | | | | | | | | | | | | | 2,039,220 | |
| | | | |
| JHY | | Nuveen High Income 2020 Target Term Fund |
| | Portfolio of Investments (continued) | | June 30, 2017 (Unaudited) |
| | | | | | | | | | | | | | | | | | | | |
Principal
Amount (000) | | | Description (1) | | Coupon | | | Maturity | | | Ratings (2) | | | Value | |
| | | | | |
| | | | Diversified Consumer Services – 1.4% | | | | | | | | | | | | |
| | | | | |
| $ | 2,000 | | | Regis Corporation, 144A | | | 5.500% | | | | 12/02/19 | | | | N/R | | | $ | 1,977,500 | |
| | | | | |
| | | | Diversified Financial Services – 8.0% | | | | | | | | | | | | |
| | | | | |
| | 1,350 | | | Fly Leasing Limited | | | 6.750% | | | | 12/15/20 | | | | BB– | | | | 1,414,125 | |
| | 2,000 | | | Jefferies Finance LLC Corporation, 144A | | | 7.375% | | | | 4/01/20 | | | | B1 | | | | 2,050,000 | |
| | 1,000 | | | Jefferies Finance LLC Corporation, 144A | | | 7.500% | | | | 4/15/21 | | | | B1 | | | | 1,037,500 | |
| | 2,000 | | | Lincoln Finance LTD, 144A | | | 7.375% | | | | 4/15/21 | | | | BB+ | | | | 2,120,000 | |
| | 1,960 | | | Nationstar Mortgage LLC Capital Corporation | | | 7.875% | | | | 10/01/20 | | | | B+ | | | | 2,013,900 | |
| | 2,000 | | | NewStar Financial, Inc. | | | 7.250% | | | | 5/01/20 | | | | BB– | | | | 2,047,500 | |
| | 1,000 | | | PHH Corporation | | | 7.375% | | | | 9/01/19 | | | | B1 | | | | 1,097,500 | |
| | 11,310 | | | Total Diversified Financial Services | | | | | | | | | | | | | | | 11,780,525 | |
| | | | | |
| | | | Diversified Telecommunication Services – 4.0% | | | | | | | | | | | | |
| | | | | |
| | 1,985 | | | CenturyLink Inc. | | | 5.625% | | | | 4/01/20 | | | | BB+ | | | | 2,099,753 | |
| | 2,000 | | | Frontier Communications Corporation | | | 8.500% | | | | 4/15/20 | | | | B+ | | | | 2,102,500 | |
| | 1,590 | | | Windstream Corporation | | | 7.750% | | | | 10/15/20 | | | | BB– | | | | 1,601,925 | |
| | 5,575 | | | Total Diversified Telecommunication Services | | | | | | | | | | | | | | | 5,804,178 | |
| | | | | |
| | | | Electric Utilities – 0.4% | | | | | | | | | | | | |
| | | | | |
| | 600 | | | DCP Midstream Operating LP | | | 2.700% | | | | 4/01/19 | | | | BB+ | | | | 594,750 | |
| | | | | |
| | | | Energy Equipment & Services – 1.5% | | | | | | | | | | | | |
| | | | | |
| | 2,200 | | | McDermott International Inc., 144A | | | 8.000% | | | | 5/01/21 | | | | BB– | | | | 2,216,500 | |
| | | | | |
| | | | Equity Real Estate Investment Trusts – 1.4% | | | | | | | | | | | | |
| | | | | |
| | 2,000 | | | iStar Inc. | | | 5.000% | | | | 7/01/19 | | | | BB | | | | 2,020,000 | |
| | | | | |
| | | | Food & Staples Retailing – 0.4% | | | | | | | | | | | | |
| | | | | |
| | 760 | | | Bi-Lo LLC Finance Corporation, 144A | | | 9.250% | | | | 2/15/19 | | | | B3 | | | | 649,800 | |
| | | | | |
| | | | Food Products – 1.4% | | | | | | | | | | | | |
| | | | | |
| | 2,060 | | | Marfrig Holding Europe BV, 144A | | | 6.875% | | | | 6/24/19 | | | | BB– | | | | 2,103,775 | |
| | | | | |
| | | | Gas Utilities – 0.8% | | | | | | | | | | | | |
| | | | | |
| | 1,250 | | | Ferrellgas LP | | | 6.500% | | | | 5/01/21 | | | | B | | | | 1,181,250 | |
| | | | | |
| | | | Health Care Equipment & Supplies – 1.0% | | | | | | | | | | | | |
| | | | | |
| | 1,500 | | | Tenet Healthcare Corporation | | | 4.500% | | | | 4/01/21 | | | | BB– | | | | 1,524,375 | |
| | | | | |
| | | | Health Care Providers & Services – 3.7% | | | | | | | | | | | | |
| | | | | |
| | 285 | | | Acadia Healthcare | | | 6.125% | | | | 3/15/21 | | | | B | | | | 293,906 | |
| | 1,250 | | | Community Health Systems, Inc. | | | 7.125% | | | | 7/15/20 | | | | CCC+ | | | | 1,217,187 | |
| | 1,000 | | | HCA Inc. | | | 6.500% | | | | 2/15/20 | | | | BBB– | | | | 1,091,250 | |
| | 400 | | | Iasis Healthcare Capital Corporation | | | 8.375% | | | | 5/15/19 | | | | CCC+ | | | | 402,000 | |
| | 2,270 | | | Kindred Healthcare Inc. | | | 8.000% | | | | 1/15/20 | | | | B– | | | | 2,383,500 | |
| | 5,205 | | | Total Health Care Providers & Services | | | | | | | | | | | | | | | 5,387,843 | |
| | | | | |
| | | | Hotels, Restaurants & Leisure – 3.6% | | | | | | | | | | | | |
| | | | | |
| | 1,500 | | | MGM Resorts International Inc. | | | 6.750% | | | | 10/01/20 | | | | BB | | | | 1,661,850 | |
| | 1,000 | | | Scientific Games International Inc. | | | 6.250% | | | | 9/01/20 | | | | CCC+ | | | | 991,250 | |
| | 2,500 | | | Studio City Co Ltd, 144A | | | 5.875% | | | | 11/30/19 | | | | BB– | | | | 2,637,500 | |
| | 5,000 | | | Total Hotels, Restaurants & Leisure | | | | | | | | | | | | | | | 5,290,600 | |
| | | | | |
| | | | Household Durables – 6.3% | | | | | | | | | | | | |
| | | | | |
| | 1,250 | | | Apex Tool Group, LLC (ATG), 144A | | | 7.000% | | | | 2/01/21 | | | | B– | | | | 1,162,500 | |
| | 1,570 | | | Brookfield Residential Properties Inc., 144A | | | 6.500% | | | | 12/15/20 | | | | B+ | | | | 1,621,025 | |
| | 450 | | | CalAtlantic Group Inc. | | | 8.375% | | | | 1/15/21 | | | | BB | | | | 532,125 | |
| | 1,500 | | | MDC Holdings Inc. | | | 5.625% | | | | 2/01/20 | | | | BBB– | | | | 1,601,250 | |
| | 1,879 | | | M-I Homes Inc. | | | 6.750% | | | | 1/15/21 | | | | BB– | | | | 1,968,252 | |
| | | | | | | | | | | | | | | | | | | | |
Principal
Amount (000) | | | Description (1) | | Coupon | | | Maturity | | | Ratings (2) | | | Value | |
| | | | | |
| | | | Household Durables (continued) | | | | | | | | | | | | |
| | | | | |
| $ | 750 | | | PulteGroup Inc. | | | 4.250% | | | | 3/01/21 | | | | BB+ | | | $ | 781,875 | |
| | 1,500 | | | Rialto Holdings LLC-Rialto Corporation, 144A | | | 7.000% | | | | 12/01/18 | | | | B1 | | | | 1,522,500 | |
| | 8,899 | | | Total Household Durables | | | | | | | | | | | | | | | 9,189,527 | |
| | | | | |
| | | | Independent Power & Renewable Electricity Producers – 5.2% | | | | | | | | | | | | |
| | | | | |
| | 2,750 | | | DPL, Inc. | | | 6.750% | | | | 10/01/19 | | | | Ba3 | | | | 2,873,750 | |
| | 2,400 | | | Dynegy Inc. | | | 6.750% | | | | 11/01/19 | | | | B+ | | | | 2,475,000 | |
| | 2,322 | | | Talen Energy Supply LLC, 144A | | | 4.625% | | | | 7/15/19 | | | | B– | | | | 2,263,950 | |
| | 7,472 | | | Total Independent Power & Renewable Electricity Producers | | | | | | | | | | | | | | | 7,612,700 | |
| | | | | |
| | | | Industrial Conglomerates – 1.8% | | | | | | | | | | | | |
| | | | | |
| | 1,900 | | | Icahn Enterprises Finance | | | 6.000% | | | | 8/01/20 | | | | BB+ | | | | 1,955,812 | |
| | 750 | | | Techniplas, LLC, 144A | | | 10.000% | | | | 5/01/20 | | | | B | | | | 645,000 | |
| | 2,650 | | | Total Industrial Conglomerates | | | | | | | | | | | | | | | 2,600,812 | |
| | | | | |
| | | | Insurance – 1.0% | | | | | | | | | | | | |
| | | | | |
| | 1,500 | | | Genworth Financial Inc. | | | 7.700% | | | | 6/15/20 | | | | Ba3 | | | | 1,471,050 | |
| | | | | |
| | | | Internet & Direct Marketing Retail – 0.7% | | | | | | | | | | | | |
| | | | | |
| | 1,000 | | | Netflix Incorporated | | | 5.375% | | | | 2/01/21 | | | | B+ | | | | 1,080,120 | |
| | | | | |
| | | | Machinery – 3.3% | | | | | | | | | | | | |
| | | | | |
| | 700 | | | Cleaver-Brooks Inc., 144A | | | 8.750% | | | | 12/15/19 | | | | B | | | | 721,875 | |
| | 1,250 | | | CNH Industrial Capital LLC | | | 4.375% | | | | 11/06/20 | | | | BBB– | | | | 1,310,950 | |
| | 2,750 | | | Titan International Inc. | | | 6.875% | | | | 10/01/20 | | | | B– | | | | 2,853,125 | |
| | 4,700 | | | Total Machinery | | | | | | | | | | | | | | | 4,885,950 | |
| | | | | |
| | | | Media – 4.7% | | | | | | | | | | | | |
| | | | | |
| | 2,790 | | | Clear Channel Worldwide | | | 7.625% | | | | 3/15/20 | | | | B– | | | | 2,776,050 | |
| | 2,000 | | | Dish DBS Corporation | | | 5.125% | | | | 5/01/20 | | | | Ba3 | | | | 2,087,500 | |
| | 2,001 | | | Mediacom Broadband LLC | | | 5.500% | | | | 4/15/21 | | | | B+ | | | | 2,046,022 | |
| | 6,791 | | | Total Media | | | | | | | | | | | | | | | 6,909,572 | |
| | | | | |
| | | | Metals & Mining – 7.2% | | | | | | | | | | | | |
| | | | | |
| | 1,775 | | | Aleris International Inc., 144A | | | 9.500% | | | | 4/01/21 | | | | B | | | | 1,825,215 | |
| | 1,750 | | | Allegheny Technologies Inc. | | | 5.950% | | | | 1/15/21 | | | | B | | | | 1,754,375 | |
| | 1,500 | | | ArcelorMittal | | | 6.500% | | | | 3/01/21 | | | | BB+ | | | | 1,614,375 | |
| | 1,500 | | | Eldorado Gold Corporation, 144A | | | 6.125% | | | | 12/15/20 | | | | B+ | | | | 1,535,625 | |
| | 1,500 | | | First Quantum Minerals Limited, 144A | | | 7.000% | | | | 2/15/21 | | | | B | | | | 1,537,500 | |
| | 350 | | | Freeport McMoRan, Inc. | | | 6.625% | | | | 5/01/21 | | | | BB+ | | | | 357,000 | |
| | 1,250 | | | United States Steel Corporation | | | 7.375% | | | | 4/01/20 | | | | B | | | | 1,351,750 | |
| | 500 | | | United States Steel Corporation | | | 6.875% | | | | 4/01/21 | | | | B | | | | 516,250 | |
| | 10,125 | | | Total Metals & Mining | | | | | | | | | | | | | | | 10,492,090 | |
| | | | | |
| | | | Multiline Retail – 1.2% | | | | | | | | | | | | |
| | | | | |
| | 1,850 | | | J.C. Penney Corporation Inc. | | | 5.650% | | | | 6/01/20 | | | | B+ | | | | 1,819,938 | |
| | | | | |
| | | | Oil, Gas & Consumable Fuels – 14.4% | | | | | | | | | | | | |
| | | | | |
| | 1,700 | | | Calumet Specialty Products, 144A | | | 11.500% | | | | 1/15/21 | | | | B+ | | | | 1,963,500 | |
| | 750 | | | Calumet Specialty Products | | | 6.500% | | | | 4/15/21 | | | | CCC+ | | | | 648,750 | |
| | 1,500 | | | Genesis Energy LP | | | 5.750% | | | | 2/15/21 | | | | B+ | | | | 1,496,250 | |
| | 2,650 | | | NGL Energy Partners LP/Fin Co | | | 5.125% | | | | 7/15/19 | | | | B+ | | | | 2,630,125 | |
| | 1,500 | | | Niska Gas Storage Canada ULC Finance Corporation | | | 6.500% | | | | 4/01/19 | | | | B+ | | | | 1,522,500 | |
| | 1,000 | | | Noble Energy Inc. | | | 5.625% | | | | 5/01/21 | | | | BBB | | | | 1,028,662 | |
| | 1,000 | | | Nustar Energy LP | | | 6.750% | | | | 2/01/21 | | | | BB+ | | | | 1,090,000 | |
| | 1,000 | | | NuStar Logistics LP | | | 4.800% | | | | 9/01/20 | | | | BB+ | | | | 1,040,000 | |
| | 980 | | | Petrobras International Finance Company | | | 5.375% | | | | 1/27/21 | | | | BB | | | | 996,366 | |
| | 869 | | | Rain CII Carbon LLC / CII Carbon Corporation, 144A | | | 8.250% | | | | 1/15/21 | | | | B+ | | | | 905,932 | |
| | 2,500 | | | Southwestern Energy Company | | | 5.800% | | | | 1/23/20 | | | | BB | | | | 2,561,250 | |
| | | | |
| JHY | | Nuveen High Income 2020 Target Term Fund |
| | Portfolio of Investments (continued) | | June 30, 2017 (Unaudited) |
| | | | | | | | | | | | | | | | | | | | |
Principal
Amount (000) | | | Description (1) | | Coupon | | | Maturity | | | Ratings (2) | | | Value | |
| | | | | |
| | | | Oil, Gas & Consumable Fuels (continued) | | | | | | | | | | | | |
| | | | | |
| $ | 700 | | | Sunoco LP / Sunoco Finance Corp. | | | 6.250% | | | | 4/15/21 | | | | BB– | | | $ | 731,500 | |
| | 1,500 | | | Teekay Corporation | | | 8.500% | | | | 1/15/20 | | | | B+ | | | | 1,366,875 | |
| | 1,750 | | | WPX Energy Inc. | | | 7.500% | | | | 8/01/20 | | | | B+ | | | | 1,837,500 | |
| | 1,125 | | | YPF Sociedad Anonima, 144A | | | 8.500% | | | | 3/23/21 | | | | B | | | | 1,251,383 | |
| | 20,524 | | | Total Oil, Gas & Consumable Fuels | | | | | | | | | | | | | | | 21,070,593 | |
| | | | | |
| | | | Paper & Forest Products – 1.4% | | | | | | | | | | | | |
| | | | | |
| | 2,000 | | | Tembec Industries, Inc., 144A | | | 9.000% | | | | 12/15/19 | | | | B2 | | | | 2,079,000 | |
| | | | | |
| | | | Pharmaceuticals – 1.0% | | | | | | | | | | | | |
| | | | | |
| | 1,500 | | | VRX Escrow Corp., 144A | | | 5.375% | | | | 3/15/20 | | | | B– | | | | 1,445,625 | |
| | | | | |
| | | | Real Estate Management & Development – 2.5% | | | | | | | | | | | | |
| | | | | |
| | 1,600 | | | Hunt Companies Inc., 144A | | | 9.625% | | | | 3/01/21 | | | | N/R | | | | 1,688,000 | |
| | 1,920 | | | Mattamy Group Corporation, 144A | | | 6.500% | | | | 11/15/20 | | | | BB | | | | 1,958,400 | |
| | 3,520 | | | Total Real Estate Management & Development | | | | | | | | | | | | | | | 3,646,400 | |
| | | | | |
| | | | Road & Rail – 2.2% | | | | | | | | | | | | |
| | | | | |
| | 3,350 | | | The Hertz Corporation | | | 5.875% | | | | 10/15/20 | | | | B– | | | | 3,241,125 | |
| | | | | |
| | | | Software – 0.4% | | | | | | | | | | | | |
| | | | | |
| | 500 | | | Infor Us Inc., 144A | | | 5.750% | | | | 8/15/20 | | | | BB | | | | 516,250 | |
| | | | | |
| | | | Specialty Retail – 4.7% | | | | | | | | | | | | |
| | | | | |
| | 2,500 | | | GameStop Corporation, 144A | | | 6.750% | | | | 3/15/21 | | | | Ba1 | | | | 2,597,500 | |
| | 1,500 | | | Gap, Inc. | | | 5.950% | | | | 4/12/21 | | | | Baa2 | | | | 1,625,819 | |
| | 2,378 | | | Limited Brands Inc. | | | 6.625% | | | | 4/01/21 | | | | BB+ | | | | 2,633,635 | |
| | 6,378 | | | Total Specialty Retail | | | | | | | | | | | | | | | 6,856,954 | |
| | | | | |
| | | | Technology Hardware, Storage & Peripherals – 1.6% | | | | | | | | | | | | |
| | | | | |
| | 1,500 | | | EMC Corporation | | | 2.650% | | | | 6/01/20 | | | | Ba2 | | | | 1,471,734 | |
| | 800 | | | NCR Corporation | | | 4.625% | | | | 2/15/21 | | | | BB | | | | 816,000 | |
| | 2,300 | | | Total Technology Hardware, Storage & Peripherals | | | | | | | | | | | | | | | 2,287,734 | |
| | | | | |
| | | | Tobacco – 1.4% | | | | | | | | | | | | |
| | | | | |
| | 2,000 | | | Alliance One International Inc., 144A | | | 8.500% | | | | 4/15/21 | | | | B1 | | | | 2,085,000 | |
| | | | | |
| | | | Trading Companies & Distributors – 1.2% | | | | | | | | | | | | |
| | | | | |
| | 1,750 | | | Avation Capital SA, 144A | | | 7.500% | | | | 5/27/20 | | | | B+ | | | | 1,758,750 | |
| | | | | |
| | | | Transportation Infrastructure – 0.8% | | | | | | | | | | | | |
| | | | | |
| | 1,200 | | | Navigator Holdings Limited | | | 7.750% | | | | 2/10/21 | | | | N/R | | | | 1,194,000 | |
| | | | | |
| | | | Wireless Telecommunication Services – 6.7% | | | | | | | | | | | | |
| | | | | |
| | 1,100 | | | Digicel Group, Limited, 144A | | | 8.250% | | | | 9/30/20 | | | | B– | | | | 1,028,390 | |
| | 2,000 | | | Digicel Limited, 144A | | | 6.000% | | | | 4/15/21 | | | | B1 | | | | 1,917,500 | |
| | 2,500 | | | Softbank Corporation, 144A | | | 4.500% | | | | 4/15/20 | | | | BB+ | | | | 2,598,976 | |
| | 2,000 | | | Sprint Communications Inc. | | | 7.000% | | | | 8/15/20 | | | | B+ | | | | 2,200,000 | |
| | 2,000 | | | Wind Acquisition Finance SA, 144A | | | 4.750% | | | | 7/15/20 | | | | BB | | | | 2,021,000 | |
| | 9,600 | | | Total Wireless Telecommunication Services | | | | | | | | | | | | | | | 9,765,866 | |
| $ | 172,863 | | | Total Corporate Bonds (cost $175,936,563) | | | | | | | | | | | | | | | 177,583,987 | |
| | | | | | | | | | | | | | | | | | | | |
Principal
Amount (000) | | | Description (1) | | Coupon | | | Maturity | | | Ratings (2) | | | Value | |
| | | | | |
| | | | CONVERTIBLE BONDS – 2.3% (1.9% of Total Investments) | | | | | | | | | | | | | | | | |
| | | | | |
| | | | Independent Power & Renewable Electricity Producers – 1.0% | | | | | | | | | | | | |
| | | | | |
| $ | 1,500 | | | NRG Yield Inc., 144A | | | 3.250% | | | | 6/01/20 | | | | N/R | | | $ | 1,504,688 | |
| | | | | |
| | | | Machinery – 1.3% | | | | | | | | | | | | |
| | | | | |
| | 2,000 | | | Navistar International Corporation | | | 4.750% | | | | 4/15/19 | | | | CCC | | | | 1,948,750 | |
| $ | 3,500 | | | Total Convertible Bonds (cost $3,317,589) | | | | | | | | | | | | | | | 3,453,438 | |
| | | | | |
Principal
Amount (000) | | | Description (1) | | Coupon | | | Maturity | | | Ratings (2) | | | Value | |
| | | | | |
| | | | SOVEREIGN DEBT – 1.3% (1.0% of Total Investments) | | | | | | | | | | | | | | | | |
| | | | | |
| | | | Argentina – 1.1% | | | | | | | | | | | | |
| | | | | |
| $ | 1,500 | | | Republic of Argentina | | | 6.875% | | | | 4/22/21 | | | | B | | | $ | 1,607,250 | |
| | | | | |
| | | | Egypt – 0.2% | | | | | | | | | | | | |
| | | | | |
| | 250 | | | Arab Republic of Egypt, 144A | | | 5.750% | | | | 4/29/20 | | | | B | | | | 256,517 | |
| $ | 1,750 | | | Total Sovereign Debt (cost $1,814,995) | | | | | | | | | | | | | | | 1,863,767 | |
| | | | Total Long-Term Investments (cost $181,069,147) | | | | | | | | | | | | | | | 182,901,192 | |
| | | | | |
Principal
Amount (000) | | | Description (1) | | Coupon | | | Maturity | | | | | | Value | |
| | | | | |
| | | | SHORT-TERM INVESTMENTS – 2.1% (1.6% of Total Investments) | | | | | | | | | | | | |
| | | | | |
| | | | REPURCHASE AGREEMENTS – 2.1% (1.6% of Total Investments) | | | | | | | | | | | | |
| | | | | |
| $ | 3,037 | | | Repurchase Agreement with Fixed Income Clearing Corporation,
dated 6/30/17, repurchase price $3,036,667,
collateralized by $3,125,000 U.S. Treasury Notes,
2.000%, due 6/30/24, value $3,101,563 | | | 0.120% | | | | 7/03/17 | | | | | | | $ | 3,036,637 | |
| | | | Total Short-Term Investments (cost $3,036,637) | | | | | | | | | | | | | | | 3,036,637 | |
| | | | Total Investments (cost $184,105,784) – 126.8% | | | | | | | | | | | | | | | 185,937,829 | |
| | | | Borrowings – (30.0)% (3), (4) | | | | | | | | | | | | | | | (44,000,000 | ) |
| | | | Other Assets Less Liabilities – 3.2% | | | | | | | | | | | | | | | 4,715,124 | |
| | | | Net Assets – 100% | | | | | | | | | | | | | | $ | 146,652,953 | |
For Fund portfolio compliance purposes, the Fund’s industry classifications refer to any one or more of the industry sub-classifications used by one or more widely recognized market indexes or ratings group indexes, and/or as defined by Fund management. This definition may not apply for purposes of this report, which may combine industry sub-classifications into sectors for reporting ease.
| (1) | All percentages shown in the Portfolio of Investments are based on net assets unless otherwise noted. |
| (2) | For financial reporting purposes, the ratings disclosed are the highest of Standard & Poor’s Group (“Standard & Poor’s”), Moody’s Investors Service, Inc. (“Moody’s”) or Fitch, Inc. (“Fitch”) rating. This treatment of split-rated securities may differ from that used for other purposes, such as for Fund investment policies. Ratings below BBB by Standard & Poor’s, Baa by Moody’s or BBB by Fitch are considered to be below investment grade. Holdings designated N/R are not rated by any of these national rating agencies. |
| (3) | Borrowings as a percentage of Total Investments is 23.7%. |
| (4) | The Fund may pledge up to 100% of its eligible investments (excluding any investments separately pledged as collateral for specific investments in derivatives) in the Portfolio of Investments as collateral for borrowings. |
| 144A | Investment is exempt from registration under Rule 144A of the Securities Act of 1933, as amended. These investments may only be resold in transactions exempt from registration, which are normally those transactions with qualified institutional buyers. |
See accompanying notes to financial statements.
JHD
| | |
Nuveen High Income December 2019 Target Term Fund |
Portfolio of Investments | | June 30, 2017 (Unaudited) |
| | | | | | | | | | | | | | | | | | | | |
Principal
Amount (000) | | | Description (1) | | Coupon | | | Maturity | | | Ratings (2) | | | Value | |
| | | | | |
| | | | LONG-TERM INVESTMENTS – 130.2% (99.9% of Total Investments) | | | | | | | | | | | | | | | | |
| | | | | |
| | | | CORPORATE BONDS – 125.7% (96.5% of Total Investments) | | | | | | | | | | | | | | | | |
| | | | | |
| | | | Aerospace & Defense – 1.9% | | | | | | | | | | | | |
| | | | | |
| $ | 2,000 | | | Bombardier Inc., 144A | | | 4.750% | | | | 4/15/19 | | | | B | | | $ | 2,032,420 | |
| | 3,000 | | | Bombardier Inc., 144A | | | 7.750% | | | | 3/15/20 | | | | B | | | | 3,225,000 | |
| | 5,000 | | | Total Aerospace & Defense | | | | | | | | | | | | | | | 5,257,420 | |
| | | | | |
| | | | Airlines – 4.6% | | | | | | | | | | | | |
| | | | | |
| | 1,000 | | | Air Canada 2015-1C Pass-Through Trust, 144A | | | 5.000% | | | | 3/15/20 | | | | BB | | | | 1,017,500 | |
| | 3,500 | | | American Airlines Group Inc., 144A | | | 5.500% | | | | 10/01/19 | | | | BB– | | | | 3,666,250 | |
| | 2,000 | | | American Airlines Group Inc., 144A | | | 4.625% | | | | 3/01/20 | | | | BB– | | | | 2,068,540 | |
| | 2,000 | | | United Continental Holdings Inc. | | | 6.375% | | | | 6/01/18 | | | | BB– | | | | 2,072,500 | |
| | 3,825 | | | Virgin Australia Holdings Limited, 144A | | | 8.500% | | | | 11/15/19 | | | | B– | | | | 4,025,812 | |
| | 12,325 | | | Total Airlines | | | | | | | | | | | | | | | 12,850,602 | |
| | | | | |
| | | | Auto Components – 0.1% | | | | | | | | | | | | |
| | | | | |
| | 370 | | | American & Axle Manufacturing Inc. | | | 7.750% | | | | 11/15/19 | | | | BB– | | | | 406,075 | |
| | | | | |
| | | | Automobiles – 2.2% | | | | | | | | | | | | |
| | | | | |
| | 4,050 | | | Fiat Chrysler Automobiles NV | | | 4.500% | | | | 4/15/20 | | | | BB | | | | 4,146,187 | |
| | 2,000 | | | Jaguar Land Rover Automotive PLC, 144A | | | 3.500% | | | | 3/15/20 | | | | BB+ | | | | 2,025,000 | |
| | 6,050 | | | Total Automobiles | | | | | | | | | | | | | | | 6,171,187 | |
| | | | | |
| | | | Banks – 3.6% | | | | | | | | | | | | |
| | | | | |
| | 4,500 | | | CIT Group Inc. | | | 5.375% | | | | 5/15/20 | | | | BB+ | | | | 4,843,125 | |
| | 4,897 | | | Popular Inc. | | | 7.000% | | | | 7/01/19 | | | | BB– | | | | 5,141,850 | |
| | 9,397 | | | Total Banks | | | | | | | | | | | | | | | 9,984,975 | |
| | | | | |
| | | | Chemicals – 2.9% | | | | | | | | | | | | |
| | | | | |
| | 3,900 | | | CF Industries Inc. | | | 7.125% | | | | 5/01/20 | | | | BB+ | | | | 4,309,500 | |
| | 1,000 | | | Hexion Inc. | | | 6.625% | | | | 4/15/20 | | | | CCC+ | | | | 912,500 | |
| | 2,698 | | | INVISTA Finance LLC, 144A | | | 4.250% | | | | 10/15/19 | | | | BBB– | | | | 2,779,480 | |
| | 7,598 | | | Total Chemicals | | | | | | | | | | | | | | | 8,001,480 | |
| | | | | |
| | | | Commercial Services & Supplies – 2.8% | | | | | | | | | | | | |
| | | | | |
| | 2,500 | | | AerCap Ireland Capital Limited / AerCap Global Aviation Trust | | | 3.750% | | | | 5/15/19 | | | | BBB– | | | | 2,567,922 | |
| | 3,435 | | | APX Group, Inc. | | | 6.375% | | | | 12/01/19 | | | | B1 | | | | 3,529,463 | |
| | 1,500 | | | International Lease Finance Corporation | | | 6.250% | | | | 5/15/19 | | | | BBB– | | | | 1,608,936 | |
| | 7,435 | | | Total Commercial Services & Supplies | | | | | | | | | | | | | | | 7,706,321 | |
| | | | | |
| | | | Construction Materials – 1.3% | | | | | | | | | | | | |
| | | | | |
| | 3,500 | | | Cemex SAB de CV, 144A | | | 6.500% | | | | 12/10/19 | | | | BB– | | | | 3,683,750 | |
| | | | | |
| | | | Consumer Finance – 3.9% | | | | | | | | | | | | |
| | | | | |
| | 3,000 | | | Ally Financial Inc. | | | 4.125% | | | | 3/30/20 | | | | BB+ | | | | 3,082,500 | |
| | 2,000 | | | Navient Corporation | | | 8.000% | | | | 3/25/20 | | | | BB | | | | 2,235,000 | |
| | 3,700 | | | OneMain Financial Holdings, Inc., 144A | | | 6.750% | | | | 12/15/19 | | | | B1 | | | | 3,885,000 | |
| | 1,725 | | | Springleaf Finance Corporation | | | 5.250% | | | | 12/15/19 | | | | B | | | | 1,794,172 | |
| | 10,425 | | | Total Consumer Finance | | | | | | | | | | | | | | | 10,996,672 | |
| | | | | |
| | | | Containers & Packaging – 1.0% | | | | | | | | | | | | |
| | | | | |
| | 2,700 | | | Coveris Holdings SA, 144A | | | 7.875% | | | | 11/01/19 | | | | B– | | | | 2,659,500 | |
| | | | | | | | | | | | | | | | | | | | |
Principal
Amount (000) | | | Description (1) | | Coupon | | | Maturity | | | Ratings (2) | | | Value | |
| | | | | |
| | | | Diversified Consumer Services – 0.7% | | | | | | | | | | | | |
| | | | | |
| $ | 2,000 | | | Regis Corporation, 144A | | | 5.500% | | | | 12/02/19 | | | | N/R | | | $ | 1,977,500 | |
| | | | | |
| | | | Diversified Financial Services – 5.3% | | | | | | | | | | | | |
| | | | | |
| | 4,250 | | | Jefferies Finance LLC Corporation, 144A | | | 7.375% | | | | 4/01/20 | | | | B1 | | | | 4,356,250 | |
| | 3,775 | | | Nationstar Mortgage LLC Capital Corporation | | | 9.625% | | | | 5/01/19 | | | | B+ | | | | 3,878,812 | |
| | 3,500 | | | NewStar Financial, Inc. | | | 7.250% | | | | 5/01/20 | | | | BB– | | | | 3,583,125 | |
| | 2,000 | | | Och-Ziff Finance Co LLC, 144A | | | 4.500% | | | | 11/20/19 | | | | BB– | | | | 1,875,000 | |
| | 1,000 | | | PHH Corporation | | | 7.375% | | | | 9/01/19 | | | | B1 | | | | 1,097,500 | |
| | 14,525 | | | Total Diversified Financial Services | | | | | | | | | | | | | | | 14,790,687 | |
| | | | | |
| | | | Diversified Telecommunication Services – 3.7% | | | | | | | | | | | | |
| | | | | |
| | 5,350 | | | CenturyLink Inc. | | | 5.625% | | | | 4/01/20 | | | | BB+ | | | | 5,659,283 | |
| | 4,350 | | | Frontier Communications Corporation | | | 8.500% | | | | 4/15/20 | | | | B+ | | | | 4,572,938 | |
| | 9,700 | | | Total Diversified Telecommunication Services | | | | | | | | | | | | | | | 10,232,221 | |
| | | | | |
| | | | Electric Utilities – 0.6% | | | | | | | | | | | | |
| | | | | |
| | 1,500 | | | DCP Midstream Operating LP, 144A | | | 5.350% | | | | 3/15/20 | | | | BB+ | | | | 1,560,000 | |
| | | | | |
| | | | Electronic Equipment, Instruments & Components – 2.3% | | | | | | | | | | | | |
| | | | | |
| | 4,448 | | | Anixter Inc. | | | 5.625% | | | | 5/01/19 | | | | BB+ | | | | 4,681,520 | |
| | 1,675 | | | Sanmina-SCI Corporation, 144A | | | 4.375% | | | | 6/01/19 | | | | BBB– | | | | 1,721,062 | |
| | 6,123 | | | Total Electronic Equipment, Instruments & Components | | | | | | | | | | | | | | | 6,402,582 | |
| | | | | |
| | | | Energy Equipment & Services – 2.4% | | | | | | | | | | | | |
| | | | | |
| | 1,000 | | | Noble Drilling Corporation | | | 7.500% | | | | 3/15/19 | | | | BB– | | | | 1,002,500 | |
| | 2,500 | | | Resolute Energy Corporation | | | 8.500% | | | | 5/01/20 | | | | B+ | | | | 2,487,500 | |
| | 3,100 | | | SESI, LLC | | | 6.375% | | | | 5/01/19 | | | | BB– | | | | 3,069,000 | |
| | 6,600 | | | Total Energy Equipment & Services | | | | | | | | | | | | | | | 6,559,000 | |
| | | | | |
| | | | Equity Real Estate Investment Trusts – 4.2% | | | | | | | | | | | | |
| | | | | |
| | 2,840 | | | CoreCivic, Inc. | | | 4.125% | | | | 4/01/20 | | | | Ba1 | | | | 2,918,100 | |
| | 4,000 | | | iStar Inc. | | | 5.000% | | | | 7/01/19 | | | | BB | | | | 4,040,000 | |
| | 3,000 | | | Realogy Group LLC / Realogy Co-Issuer Corporation, 144A | | | 4.500% | | | | 4/15/19 | | | | B+ | | | | 3,097,500 | |
| | 1,750 | | | Vereit Operating Partner | | | 3.000% | | | | 2/06/19 | | | | BBB– | | | | 1,766,082 | |
| | 11,590 | | | Total Equity Real Estate Investment Trusts | | | | | | | | | | | | | | | 11,821,682 | |
| | | | | |
| | | | Food Products – 2.2% | | | | | | | | | | | | |
| | | | | |
| | 2,100 | | | JBS USA LLC, 144A | | | 8.250% | | | | 2/01/20 | | | | BB | | | | 2,100,000 | |
| | 4,000 | | | Marfrig Holding Europe BV, 144A | | | 6.875% | | | | 6/24/19 | | | | BB– | | | | 4,085,000 | |
| | 6,100 | | | Total Food Products | | | | | | | | | | | | | | | 6,185,000 | |
| | | | | |
| | | | Health Care Equipment & Supplies – 2.3% | | | | | | | | | | | | |
| | | | | |
| | 3,000 | | | Tenet Healthcare Corporation | | | 6.750% | | | | 2/01/20 | | | | B– | | | | 3,120,000 | |
| | 3,300 | | | Tenet Healthcare Corporation | | | 4.750% | | | | 6/01/20 | | | | BB– | | | | 3,415,500 | |
| | 6,300 | | | Total Health Care Equipment & Supplies | | | | | | | | | | | | | | | 6,535,500 | |
| | | | | |
| | | | Health Care Providers & Services – 7.0% | | | | | | | | | | | | |
| | | | | |
| | 2,500 | | | Community Health Systems, Inc. | | | 8.000% | | | | 11/15/19 | | | | CCC+ | | | | 2,512,500 | |
| | 4,465 | | | Fresenius Medical Care II, 144A | | | 5.625% | | | | 7/31/19 | | | | BBB– | | | | 4,721,737 | |
| | 3,000 | | | HCA Inc. | | | 6.500% | | | | 2/15/20 | | | | BBB– | | | | 3,273,750 | |
| | 1,650 | | | Iasis Healthcare Capital Corporation | | | 8.375% | | | | 5/15/19 | | | | CCC+ | | | | 1,658,250 | |
| | 5,250 | | | Kindred Healthcare Inc. | | | 8.000% | | | | 1/15/20 | | | | B– | | | | 5,512,500 | |
| | 2,000 | | | Mallinckrodt International Finance SA, 144A | | | 4.875% | | | | 4/15/20 | | | | BB– | | | | 1,947,500 | |
| | 18,865 | | | Total Health Care Providers & Services | | | | | | | | | | | | | | | 19,626,237 | |
| | | | | |
| | | | Hotels, Restaurants & Leisure – 4.1% | | | | | | | | | | | | |
| | | | | |
| | 2,700 | | | International Game Technology PLC, 144A | | | 5.625% | | | | 2/15/20 | | | | BB+ | | | | 2,870,505 | |
| | 4,000 | | | MGM Resorts International Inc. | | | 5.250% | | | | 3/31/20 | | | | BB | | | | 4,235,000 | |
| | | | |
| JHD | | Nuveen High Income December 2019 Target Term Fund |
| | Portfolio of Investments (continued) | | June 30, 2017 (Unaudited) |
| | | | | | | | | | | | | | | | | | | | |
Principal
Amount (000) | | | Description (1) | | Coupon | | | Maturity | | | Ratings (2) | | | Value | |
| | | | | |
| | | | Hotels, Restaurants & Leisure (continued) | | | | | | | | | | | | |
| | | | | |
| $ | 4,000 | | | Studio City Co Ltd, 144A | | | 5.875% | | | | 11/30/19 | | | | BB– | | | $ | 4,220,000 | |
| | 10,700 | | | Total Hotels, Restaurants & Leisure | | | | | | | | | | | | | | | 11,325,505 | |
| | | | | |
| | | | Household Durables – 9.0% | | | | | | | | | | | | |
| | | | | |
| | 2,110 | | | Beazer Homes USA, Inc. | | | 5.750% | | | | 6/15/19 | | | | B– | | | | 2,211,544 | |
| | 2,350 | | | KB Home | | | 4.750% | | | | 5/15/19 | | | | B1 | | | | 2,420,500 | |
| | 2,144 | | | KB Home | | | 8.000% | | | | 3/15/20 | | | | B1 | | | | 2,412,000 | |
| | 1,000 | | | Lennar Corporation | | | 4.500% | | | | 11/15/19 | | | | Ba1 | | | | 1,037,500 | |
| | 3,500 | | | MDC Holdings Inc. | | | 5.625% | | | | 2/01/20 | | | | BBB– | | | | 3,736,250 | |
| | 925 | | | Meritage Homes Corporation | | | 7.150% | | | | 4/15/20 | | | | Ba2 | | | | 1,022,125 | |
| | 4,400 | | | Rialto Holdings LLC-Rialto Corporation, 144A | | | 7.000% | | | | 12/01/18 | | | | B1 | | | | 4,466,000 | |
| | 3,000 | | | Tri Pointe Holdings Inc. | | | 4.375% | | | | 6/15/19 | | | | BB– | | | | 3,072,600 | |
| | 4,560 | | | William Lyon Homes Incorporated | | | 5.750% | | | | 4/15/19 | | | | B– | | | | 4,617,000 | |
| | 23,989 | | | Total Household Durables | | | | | | | | | | | | | | | 24,995,519 | |
| | | | | |
| | | | Household Products – 1.6% | | | | | | | | | | | | |
| | | | | |
| | 4,390 | | | HRG Group, Inc. | | | 7.875% | | | | 7/15/19 | | | | BB– | | | | 4,499,750 | |
| | | | | |
| | | | Independent Power & Renewable Electricity Producers – 6.6% | | | | | | | | | | | | |
| | | | | |
| | 2,614 | | | Atlantica Yield PLC, 144A | | | 7.000% | | | | 11/15/19 | | | | BB– | | | | 2,770,840 | |
| | 5,152 | | | DPL, Inc. | | | 6.750% | | | | 10/01/19 | | | | Ba3 | | | | 5,383,840 | |
| | 5,135 | | | Dynegy Inc. | | | 6.750% | | | | 11/01/19 | | | | B+ | | | | 5,295,469 | |
| | 5,000 | | | Talen Energy Supply LLC, 144A | | | 4.625% | | | | 7/15/19 | | | | B– | | | | 4,875,000 | |
| | 17,901 | | | Total Independent Power & Renewable Electricity Producers | | | | | | | | | | | | | | | 18,325,149 | |
| | | | | |
| | | | Industrial Conglomerates – 1.5% | | | | | | | | | | | | |
| | | | | |
| | 3,750 | | | Icahn Enterprises Finance | | | 4.875% | | | | 3/15/19 | | | | BB+ | | | | 3,787,500 | |
| | 500 | | | Techniplas, LLC, 144A | | | 10.000% | | | | 5/01/20 | | | | B | | | | 430,000 | |
| | 4,250 | | | Total Industrial Conglomerates | | | | | | | | | | | | | | | 4,217,500 | |
| | | | | |
| | | | Insurance – 1.2% | | | | | | | | | | | | |
| | | | | |
| | 3,293 | | | Genworth Financial Inc. | | | 6.515% | | | | 5/22/18 | | | | Ba3 | | | | 3,288,884 | |
| | | | | |
| | | | Internet Software & Services – 0.7% | | | | | | | | | | | | |
| | | | | |
| | 1,850 | | | Equinix Inc. | | | 4.875% | | | | 4/01/20 | | | | BB+ | | | | 1,896,250 | |
| | | | | |
| | | | IT Services – 1.2% | | | | | | | | | | | | |
| | | | | |
| | 3,275 | | | Alliance Data Systems Corporation, 144A | | | 6.375% | | | | 4/01/20 | | | | N/R | | | | 3,315,937 | |
| | | | | |
| | | | Leisure Products – 1.0% | | | | | | | | | | | | |
| | | | | |
| | 2,551 | | | Hyatt Hotels Corporation, 144A | | | 6.875% | | | | 8/15/19 | | | | BBB | | | | 2,788,677 | |
| | | | | |
| | | | Machinery – 1.7% | | | | | | | | | | | | |
| | | | | |
| | 1,000 | | | Cleaver-Brooks Inc., 144A | | | 8.750% | | | | 12/15/19 | | | | B | | | | 1,031,250 | |
| | 3,500 | | | CNH Industrial Capital LLC | | | 3.375% | | | | 7/15/19 | | | | BBB– | | | | 3,556,875 | |
| | 4,500 | | | Total Machinery | | | | | | | | | | | | | | | 4,588,125 | |
| | | | | |
| | | | Media – 4.8% | | | | | | | | | | | | |
| | | | | |
| | 1,850 | | | Cablevision Systems Corporation | | | 8.000% | | | | 4/15/20 | | | | B– | | | | 2,060,437 | |
| | 3,350 | | | Clear Channel Worldwide | | | 7.625% | | | | 3/15/20 | | | | B– | | | | 3,333,250 | |
| | 2,500 | | | Cogeco Communications Inc., 144A | | | 4.875% | | | | 5/01/20 | | | | BB+ | | | | 2,556,250 | |
| | 1,500 | | | CSC Holdings Inc. | | | 8.625% | | | | 2/15/19 | | | | B+ | | | | 1,643,895 | |
| | 3,750 | | | Dish DBS Corporation | | | 5.125% | | | | 5/01/20 | | | | Ba3 | | | | 3,914,063 | |
| | 12,950 | | | Total Media | | | | | | | | | | | | | | | 13,507,895 | |
| | | | | |
| | | | Metals & Mining – 6.1% | | | | | | | | | | | | |
| | | | | |
| | 3,080 | | | Allegheny Technologies Inc. | | | 9.375% | | | | 6/01/19 | | | | B | | | | 3,337,950 | |
| | 3,385 | | | Anglo American PLC, 144A | | | 3.625% | | | | 5/14/20 | | | | BB+ | | | | 3,440,006 | |
| | 2,500 | | | ArcelorMittal | | | 5.125% | | | | 6/01/20 | | | | BB+ | | | | 2,643,750 | |
| | | | | | | | | | | | | | | | | | | | |
Principal
Amount (000) | | | Description (1) | | Coupon | | | Maturity | | | Ratings (2) | | | Value | |
| | | | | |
| | | | Metals & Mining (continued) | | | | | | | | | | | | |
| | | | | |
| $ | 3,635 | | | Cliffs Natural Resources Inc., 144A | | | 8.250% | | | | 3/31/20 | | | | BB– | | | $ | 3,962,150 | |
| | 1,750 | | | United States Steel Corporation | | | 7.375% | | | | 4/01/20 | | | | B | | | | 1,892,450 | |
| �� | 1,500 | | | Vale Overseas Limited | | | 5.625% | | | | 9/15/19 | | | | BBB | | | | 1,582,500 | |
| | 15,850 | | | Total Metals & Mining | | | | | | | | | | | | | | | 16,858,806 | |
| | | | | |
| | | | Multiline Retail – 1.8% | | | | | | | | | | | | |
| | | | | |
| | 1,117 | | | J.C. Penney Company Inc. | | | 8.125% | | | | 10/01/19 | | | | B+ | | | | 1,220,322 | |
| | 3,950 | | | J.C. Penney Corporation Inc. | | | 5.650% | | | | 6/01/20 | | | | B+ | | | | 3,885,813 | |
| | 5,067 | | | Total Multiline Retail | | | | | | | | | | | | | | | 5,106,135 | |
| | | | | |
| | | | Oil, Gas & Consumable Fuels – 11.0% | | | | | | | | | | | | |
| | | | | |
| | 470 | | | Canadian Oil Sands Trust, 144A | | | 7.750% | | | | 5/15/19 | | | | A– | | | | 508,999 | |
| | 2,750 | | | Cenovus Energy Inc. | | | 5.700% | | | | 10/15/19 | | | | BBB | | | | 2,902,322 | |
| | 1,500 | | | EnLink Midstream Partners LP | | | 2.700% | | | | 4/01/19 | | | | BBB– | | | | 1,496,768 | |
| | 2,500 | | | Marathon Oil Corporation | | | 2.700% | | | | 6/01/20 | | | | BBB | | | | 2,477,748 | |
| | 2,395 | | | NGL Energy Partners LP/Fin Co | | | 5.125% | | | | 7/15/19 | | | | B+ | | | | 2,377,038 | |
| | 2,125 | | | Niska Gas Storage Canada ULC Finance Corporation | | | 6.500% | | | | 4/01/19 | | | | B+ | | | | 2,156,875 | |
| | 4,000 | | | Petrobras International Finance Company | | | 5.750% | | | | 1/20/20 | | | | BB | | | | 4,150,800 | |
| | 3,500 | | | Southwestern Energy Company | | | 5.800% | | | | 1/23/20 | | | | BB | | | | 3,585,750 | |
| | 3,000 | | | Targa Resources Inc. | | | 4.125% | | | | 11/15/19 | | | | BB– | | | | 3,033,750 | |
| | 2,000 | | | Tesoro Logistics LP Finance Corporation | | | 5.500% | | | | 10/15/19 | | | | BBB– | | | | 2,110,000 | |
| | 2,750 | | | Whiting Petroleum Corporation | | | 5.000% | | | | 3/15/19 | | | | BB– | | | | 2,732,813 | |
| | 3,000 | | | Williams Partners LP | | | 5.250% | | | | 3/15/20 | | | | BBB | | | | 3,228,336 | |
| | 29,990 | | | Total Oil, Gas & Consumable Fuels | | | | | | | | | | | | | | | 30,761,199 | |
| | | | | |
| | | | Paper & Forest Products – 0.8% | | | | | | | | | | | | |
| | | | | |
| | 2,150 | | | Tembec Industries, Inc., 144A | | | 9.000% | | | | 12/15/19 | | | | B2 | | | | 2,234,925 | |
| | | | | |
| | | | Pharmaceuticals – 1.9% | | | | | | | | | | | | |
| | | | | |
| | 3,000 | | | Shire Acquisitions Investments Ireland Designated Activity Company | | | 1.900% | | | | 9/23/19 | | | | BBB– | | | | 2,986,203 | |
| | 2,500 | | | VRX Escrow Corp., 144A | | | 5.375% | | | | 3/15/20 | | | | B– | | | | 2,409,375 | |
| | 5,500 | | | Total Pharmaceuticals | | | | | | | | | | | | | | | 5,395,578 | |
| | | | | |
| | | | Road & Rail – 0.9% | | | | | | | | | | | | |
| | | | | |
| | 2,395 | | | Con-Way, Inc. | | | 7.250% | | | | 1/15/18 | | | | B– | | | | 2,442,900 | |
| | | | | |
| | | | Specialty Retail – 2.2% | | | | | | | | | | | | |
| | | | | |
| | 3,325 | | | GameStop Corporation, 144A | | | 5.500% | | | | 10/01/19 | | | | Ba1 | | | | 3,420,594 | |
| | 2,500 | | | Limited Brands Inc. | | | 7.000% | | | | 5/01/20 | | | | BB+ | | | | 2,753,125 | |
| | 5,825 | | | Total Specialty Retail | | | | | | | | | | | | | | | 6,173,719 | |
| | | | | |
| | | | Technology Hardware, Storage & Peripherals – 5.4% | | | | | | | | | | | | |
| | | | | |
| | 5,037 | | | Dell Inc. | | | 5.875% | | | | 6/15/19 | | | | Ba2 | | | | 5,315,596 | |
| | 3,000 | | | Diamond 1 Finance Corporation / Diamond 2 Finance Corporation, 144A | | | 3.480% | | | | 6/01/19 | | | | BBB– | | | | 3,070,245 | |
| | 3,000 | | | EMC Corporation | | | 2.650% | | | | 6/01/20 | | | | Ba2 | | | | 2,943,468 | |
| | 3,750 | | | Seagate HDD Cayman | | | 3.750% | | | | 11/15/18 | | | | BBB– | | | | 3,840,000 | |
| | 14,787 | | | Total Technology Hardware, Storage & Peripherals | | | | | | | | | | | | | | | 15,169,309 | |
| | | | | |
| | | | Thrifts & Mortgage Finance – 1.1% | | | | | | | | | | | | |
| | | | | |
| | 3,000 | | | Radian Group Inc. | | | 5.500% | | | | 6/01/19 | | | | BB | | | | 3,150,000 | |
| | | | | |
| | | | Trading Companies & Distributors – 1.1% | | | | | | | | | | | | |
| | | | | |
| | 100 | | | Aircastle Limited | | | 6.250% | | | | 12/01/19 | | | | BB+ | | | | 108,875 | |
| | 2,860 | | | Avation Capital SA, 144A | | | 7.500% | | | | 5/27/20 | | | | B+ | | | | 2,874,300 | |
| | 2,960 | | | Total Trading Companies & Distributors | | | | | | | | | | | | | | | 2,983,175 | |
| | | | | |
| | | | Wireless Telecommunication Services – 5.0% | | | | | | | | | | | | |
| | | | | |
| | 3,620 | | | Millicom International Cellular SA, 144A | | | 4.750% | | | | 5/22/20 | | | | BB+ | | | | 3,703,731 | |
| | | | |
| JHD | | Nuveen High Income December 2019 Target Term Fund |
| | Portfolio of Investments (continued) | | June 30, 2017 (Unaudited) |
| | | | | | | | | | | | | | | | | | | | |
Principal
Amount (000) | | | Description (1) | | Coupon | | | Maturity | | | Ratings (2) | | | Value | |
| | | | | |
| | | | Wireless Telecommunication Services (continued) | | | | | | | | | | | | |
| | | | | |
| $ | 2,650 | | | Softbank Corporation, 144A | | | 4.500% | | | | 4/15/20 | | | | BB+ | | | $ | 2,754,913 | |
| | 2,500 | | | Sprint Capital Corporation | | | 6.900% | | | | 5/01/19 | | | | B+ | | | | 2,674,350 | |
| | 1,205 | | | Sprint Communications Inc., 144A | | | 7.000% | | | | 3/01/20 | | | | BB | | | | 1,322,489 | |
| | 3,438 | | | Wind Acquisition Finance SA, 144A | | | 6.500% | | | | 4/30/20 | | | | BB | | | | 3,558,330 | |
| | 13,413 | | | Total Wireless Telecommunication Services | | | | | | | | | | | | | | | 14,013,813 | |
| $ | 338,689 | | | Total Corporate Bonds (cost $342,419,732) | | | | | | | | | | | | | | | 350,447,141 | |
| | | | | |
Principal
Amount (000) | | | Description (1) | | Coupon | | | Maturity | | | Ratings (2) | | | Value | |
| | | | | |
| | | | CONVERTIBLE BONDS – 2.7% (2.0% of Total Investments) | | | | | | | | | | | | | | | | |
| | | | | |
| | | | Capital Markets – 1.1% | | | | | | | | | | | | |
| | | | | |
| $ | 3,000 | | | Prospect Capital Corporation | | | 4.750% | | | | 4/15/20 | | | | BBB– | | | $ | 3,007,500 | |
| | | | | |
| | | | Independent Power & Renewable Electricity Producers – 1.1% | | | | | | | | | | | | |
| | | | | |
| | 3,000 | | | NRG Yield Inc., 144A | | | 3.250% | | | | 6/01/20 | | | | N/R | | | | 3,009,375 | |
| | | | | |
| | | | Machinery – 0.5% | | | | | | | | | | | | |
| | | | | |
| | 1,500 | | | Navistar International Corporation | | | 4.750% | | | | 4/15/19 | | | | CCC | | | | 1,461,563 | |
| $ | 7,500 | | | Total Convertible Bonds (cost $7,168,425) | | | | | | | | | | | | | | | 7,478,438 | |
| | | | | |
Principal
Amount (000) | | | Description (1) | | Coupon | | | Maturity | | | Ratings (2) | | | Value | |
| | | | | |
| | | | SOVEREIGN DEBT – 1.8% (1.4% of Total Investments) | | | | | | | | | | | | | | | | |
| | | | | |
| | | | Argentina – 1.1% | | | | | | | | | | | | |
| | | | | |
| $ | 3,000 | | | Republic of Argentina | | | 6.250% | | | | 4/22/19 | | | | B | | | $ | 3,142,500 | |
| | | | | |
| | | | Egypt – 0.3% | | | | | | | | | | | | |
| | | | | |
| | 750 | | | Arab Republic of Egypt, 144A | | | 5.750% | | | | 4/29/20 | | | | B | | | | 769,552 | |
| | | | | |
| | | | Sri Lanka – 0.4% | | | | | | | | | | | | |
| | | | | |
| | 1,000 | | | Republic of Sri Lanka, 144A | | | 6.000% | | | | 1/14/19 | | | | B+ | | | | 1,036,327 | |
| $ | 4,750 | | | Total Sovereign Debt (cost $4,890,141) | | | | | | | | | | | | | | | 4,948,379 | |
| | | | Total Long-Term Investments (cost $354,478,298) | | | | | | | | | | | | | | | 362,873,958 | |
| | | | | |
Principal
Amount (000) | | | Description (1) | | Coupon | | | Maturity | | | | | | Value | |
| | | | | |
| | | | SHORT-TERM INVESTMENTS – 0.1% (0.1% of Total Investments) | | | | | | | | | | | | |
| | | | | |
| | | | REPURCHASE AGREEMENTS – 0.1% (0.1% of Total Investments) | | | | | | | | | | | | |
| | | | | |
| $ | 418 | | | Repurchase Agreement with Fixed Income Clearing Corporation,
dated 6/30/17, repurchase price $418,208,
collateralized by $420,000 U.S. Treasury Notes,
0.375%, due 7/15/25 , value $431,597 | | | 0.120% | | | | 7/03/17 | | | | | | | $ | 418,204 | |
| | | | Total Short-Term Investments (cost $418,204) | | | | | | | | | | | | | | | 418,204 | |
| | | | Total Investments (cost $354,896,502) – 130.3% | | | | | | | | | | | | | | | 363,292,162 | |
| | | | Borrowings – (32.3)% (3), (4) | | | | | | | | | | | | | | | (90,000,000 | ) |
| | | | Other Assets Less Liabilities – 2.0% | | | | | | | | | | | | | | | 5,462,427 | |
| | | | Net Assets – 100% | | | | | | | | | | | | | | $ | 278,754,589 | |
For Fund portfolio compliance purposes, the Fund’s industry classifications refer to any one or more of the industry sub-classifications used by one or more widely recognized market indexes or ratings group indexes, and/or as defined by Fund management. This definition may not apply for purposes of this report, which may combine industry sub-classifications into sectors for reporting ease.
| (1) | All percentages shown in the Portfolio of Investments are based on net assets unless otherwise noted. |
| (2) | For financial reporting purposes, the ratings disclosed are the highest of Standard & Poor’s Group (“Standard & Poor’s”), Moody’s Investors Service, Inc. (“Moody’s”) or Fitch, Inc. (“Fitch”) rating. This treatment of split-rated securities may differ from that used for other purposes, such as for Fund investment policies. Ratings below BBB by Standard & Poor’s, Baa by Moody’s or BBB by Fitch are considered to be below investment grade. Holdings designated N/R are not rated by any of these national rating agencies. |
| (3) | Borrowings as a percentage of Total Investments is 24.8%. |
| (4) | The Fund may pledge up to 100% of its eligible investments (excluding any investments separately pledged as collateral for specific investments in derivatives) in the Portfolio of Investments as collateral for borrowings. |
| 144A | Investment is exempt from registration under Rule 144A of the Securities Act of 1933, as amended. These investments may only be resold in transactions exempt from registration, which are normally those transactions with qualified institutional buyers. |
See accompanying notes to financial statements.
JHA
| | |
Nuveen High Income December 2018 Target Term Fund |
Portfolio of Investments | | June 30, 2017 (Unaudited) |
| | | | | | | | | | | | | | | | | | | | |
Principal
Amount (000) | | | Description (1) | | Coupon | | | Maturity | | | Ratings (2) | | | Value | |
| | | | | |
| | | | LONG-TERM INVESTMENTS – 126.6% (98.3% of Total Investments) | | | | | | | | | | | | | | | | |
| | | | | |
| | | | CORPORATE BONDS – 117.4% (91.1% of Total Investments) | | | | | | | | | | | | | | | | |
| | | | | |
| | | | Aerospace & Defense – 1.7% | | | | | | | | | | | | |
| | | | | |
| $ | 5,000 | | | Bombardier Inc., 144A | | | 4.750% | | | | 4/15/19 | | | | B | | | $ | 5,081,050 | |
| | | | | |
| | | | Airlines – 5.9% | | | | | | | | | | | | |
| | | | | |
| | 4,000 | | | Air Canada 2013-1C Pass-Through Trust, 144A | | | 6.625% | | | | 5/15/18 | | | | BB | | | | 4,125,000 | |
| | 6,440 | | | American Airlines Group Inc. | | | 6.125% | | | | 6/01/18 | | | | BB– | | | | 6,613,880 | |
| | 1,500 | | | Continental Airlines, Inc. | | | 6.125% | | | | 4/29/18 | | | | Ba1 | | | | 1,537,500 | |
| | 5,133 | | | United Continental Holdings Inc. | | | 6.375% | | | | 6/01/18 | | | | BB– | | | | 5,319,071 | |
| | 17,073 | | | Total Airlines | | | | | | | | | | | | | | | 17,595,451 | |
| | | | | |
| | | | Auto Components – 0.2% | | | | | | | | | | | | |
| | | | | |
| | 500 | | | American & Axle Manufacturing Inc. | | | 5.125% | | | | 2/15/19 | | | | BB– | | | | 505,101 | |
| | | | | |
| | | | Automobiles – 4.3% | | | | | | | | | | | | |
| | | | | |
| | 3,000 | | | General Motors Corporation | | | 3.500% | | | | 10/02/18 | | | | BBB | | | | 3,052,749 | |
| | 3,000 | | | General Motors Financial Company Inc. | | | 2.400% | | | | 5/09/19 | | | | BBB | | | | 3,008,136 | |
| | 6,500 | | | Jaguar Land Rover Automotive PLC, 144A | | | 4.125% | | | | 12/15/18 | | | | BB+ | | | | 6,621,875 | |
| | 12,500 | | | Total Automobiles | | | | | | | | | | | | | | | 12,682,760 | |
| | | | | |
| | | | Banks – 2.6% | | | | | | | | | | | | |
| | | | | |
| | 3,000 | | | CIT Group Inc. | | | 3.875% | | | | 2/19/19 | | | | BB+ | | | | 3,075,000 | |
| | 300 | | | Royal Bank of Scotland Group PLC | | | 4.700% | | | | 7/03/18 | | | | BBB– | | | | 307,120 | |
| | 3,382 | | | Synovus Financial Corp. | | | 7.875% | | | | 2/15/19 | | | | BBB– | | | | 3,668,794 | |
| | 730 | | | UniCredito Luxembourg Finance SA, 144A | | | 6.000% | | | | 10/31/17 | | | | BBB– | | | | 739,237 | |
| | 7,412 | | | Total Banks | | | | | | | | | | | | | | | 7,790,151 | |
| | | | | |
| | | | Beverages – 0.5% | | | | | | | | | | | | |
| | | | | |
| | 1,350 | | | Carolina Beverage Group LLC, 144A | | | 10.625% | | | | 8/01/18 | | | | B– | | | | 1,353,375 | |
| | | | | |
| | | | Capital Markets – 1.4% | | | | | | | | | | | | |
| | | | | |
| | 1,450 | | | Deutsche Bank AG London | | | 2.500% | | | | 2/13/19 | | | | A– | | | | 1,455,443 | |
| | 2,500 | | | GFI Group, Inc. | | | 8.375% | | | | 7/19/18 | | | | BBB– | | | | 2,637,500 | |
| | 3,950 | | | Total Capital Markets | | | | | | | | | | | | | | | 4,092,943 | |
| | | | | |
| | | | Chemicals – 1.0% | | | | | | | | | | | | |
| | | | | |
| | 3,000 | | | CF Industries Inc. | | | 6.875% | | | | 5/01/18 | | | | BB+ | | | | 3,116,250 | |
| | | | | |
| | | | Commercial Services & Supplies – 2.5% | | | | | | | | | | | | |
| | | | | |
| | 2,000 | | | AerCap Ireland Capital Limited / AerCap Global Aviation Trust | | | 3.750% | | | | 5/15/19 | | | | BBB– | | | | 2,054,338 | |
| | 3,000 | | | International Lease Finance Corporation | | | 5.875% | | | | 4/01/19 | | | | BBB– | | | | 3,186,330 | |
| | 2,000 | | | International Lease Finance Corporation | | | 6.250% | | | | 5/15/19 | | | | BBB– | | | | 2,145,248 | |
| | 7,000 | | | Total Commercial Services & Supplies | | | | | | | | | | | | | | | 7,385,916 | |
| | | | | |
| | | | Construction & Engineering – 1.2% | | | | | | | | | | | | |
| | | | | |
| | 3,550 | | | Michael Baker International LLC / CDL Acquisition Company Inc., 144A | | | 8.250% | | | | 10/15/18 | | | | B– | | | | 3,532,250 | |
| | | | | |
| | | | Consumer Finance – 5.5% | | | | | | | | | | | | |
| | | | | |
| | 5,805 | | | Ally Financial Inc. | | | 4.750% | | | | 9/10/18 | | | | BB+ | | | | 5,964,637 | |
| | 3,000 | | | Navient Corporation | | | 8.450% | | | | 6/15/18 | | | | BB | | | | 3,159,000 | |
| | 2,750 | | | Navient Corporation | | | 5.500% | | | | 1/15/19 | | | | BB | | | | 2,863,438 | |
| | 4,450 | | | Springleaf Finance Corporation | | | 6.900% | | | | 12/15/17 | | | | B | | | | 4,516,750 | |
| | 16,005 | | | Total Consumer Finance | | | | | | | | | | | | | | | 16,503,825 | |
| | | | | | | | | | | | | | | | | | | | |
Principal
Amount (000) | | | Description (1) | | Coupon | | | Maturity | | | Ratings (2) | | | Value | |
| | | | | |
| | | | Diversified Financial Services – 1.8% | | | | | | | | | | | | |
| | | | | |
| $ | 5,000 | | | Nationstar Mortgage LLC Capital Corporation | | | 6.500% | | | | 8/01/18 | | | | B+ | | | $ | 5,012,500 | |
| | 250 | | | Nationstar Mortgage LLC Capital Corporation | | | 9.625% | | | | 5/01/19 | | | | B+ | | | | 256,875 | |
| | 5,250 | | | Total Diversified Financial Services | | | | | | | | | | | | | | | 5,269,375 | |
| | | | | |
| | | | Diversified Telecommunication Services – 4.6% | | | | | | | | | | | | |
| | | | | |
| | 4,000 | | | Frontier Communications Corporation | | | 8.125% | | | | 10/01/18 | | | | B+ | | | | 4,225,000 | |
| | 2,500 | | | Frontier Communications Corporation | | | 7.125% | | | | 3/15/19 | | | | B+ | | | | 2,606,250 | |
| | 6,500 | | | Qwest Capital Funding Inc. | | | 6.500% | | | | 11/15/18 | | | | BB+ | | | | 6,841,250 | |
| | 13,000 | | | Total Diversified Telecommunication Services | | | | | | | | | | | | | | | 13,672,500 | |
| | | | | |
| | | | Electric Utilities – 1.9% | | | | | | | | | | | | |
| | | | | |
| | 5,634 | | | DCP Midstream Operating LP | | | 2.700% | | | | 4/01/19 | | | | BB+ | | | | 5,584,703 | |
| | | | | |
| | | | Electronic Equipment, Instruments & Components – 3.8% | | | | | | | | | | | | |
| | | | | |
| | 6,250 | | | Anixter Inc. | | | 5.625% | | | | 5/01/19 | | | | BB+ | | | | 6,578,125 | |
| | 4,665 | | | Sanmina-SCI Corporation, 144A | | | 4.375% | | | | 6/01/19 | | | | BBB– | | | | 4,793,287 | |
| | 10,915 | | | Total Electronic Equipment, Instruments & Components | | | | | | | | | | | | | | | 11,371,412 | |
| | | | | |
| | | | Energy Equipment & Services – 2.4% | | | | | | | | | | | | |
| | | | | |
| | 2,000 | | | Noble Holding International Limited | | | 5.250% | | | | 3/16/18 | | | | BB– | | | | 2,012,120 | |
| | 2,605 | | | Rockies Express Pipeline Company, 144A | | | 6.850% | | | | 7/15/18 | | | | BB+ | | | | 2,712,456 | |
| | 2,400 | | | SESI, LLC | | | 6.375% | | | | 5/01/19 | | | | BB– | | | | 2,376,000 | |
| | 7,005 | | | Total Energy Equipment & Services | | | | | | | | | | | | | | | 7,100,576 | |
| | | | | |
| | | | Equity Real Estate Investment Trusts – 5.7% | | | | | | | | | | | | |
| | | | | |
| | 7,000 | | | iStar Inc. | | | 7.125% | | | | 2/15/18 | | | | BB | | | | 7,175,000 | |
| | 5,000 | | | Realogy Group LLC / Realogy Co-Issuer Corporation, 144A | | | 4.500% | | | | 4/15/19 | | | | B+ | | | | 5,162,500 | |
| | 4,500 | | | Vereit Operating Partner | | | 3.000% | | | | 2/06/19 | | | | BBB– | | | | 4,541,355 | |
| | 16,500 | | | Total Equity Real Estate Investment Trusts | | | | | | | | | | | | | | | 16,878,855 | |
| | | | | |
| | | | Food Products – 2.2% | | | | | | | | | | | | |
| | | | | |
| | 3,470 | | | Bumble Bee Holdings Inc., 144A | | | 9.000% | | | | 12/15/17 | | | | CCC | | | | 3,478,675 | |
| | 3,000 | | | Marfrig Holding Europe BV, 144A | | | 8.375% | | | | 5/09/18 | | | | BB– | | | | 3,097,500 | |
| | 6,470 | | | Total Food Products | | | | | | | | | | | | | | | 6,576,175 | |
| | | | | |
| | | | Health Care Equipment & Supplies – 3.4% | | | | | | | | | | | | |
| | | | | |
| | 3,500 | | | Tenet Healthcare Corporation | | | 6.250% | | | | 11/01/18 | | | | BB– | | | | 3,692,500 | |
| | 6,120 | | | Tenet Healthcare Corporation | | | 5.000% | | | | 3/01/19 | | | | B– | | | | 6,426,673 | |
| | 9,620 | | | Total Health Care Equipment & Supplies | | | | | | | | | | | | | | | 10,119,173 | |
| | | | | |
| | | | Health Care Providers & Services – 5.5% | | | | | | | | | | | | |
| | | | | |
| | 3,000 | | | Fresenius Medical Care II, 144A | | | 6.500% | | | | 9/15/18 | | | | Baa3 | | | | 3,151,860 | |
| | 7,500 | | | HCA Inc. | | | 3.750% | | | | 3/15/19 | | | | BBB– | | | | 7,650,000 | |
| | 3,150 | | | Iasis Healthcare Capital Corporation | | | 8.375% | | | | 5/15/19 | | | | CCC+ | | | | 3,165,750 | |
| | 2,300 | | | Mallinckrodt International Finance SA | | | 3.500% | | | | 4/15/18 | | | | B | | | | 2,300,000 | |
| | 15,950 | | | Total Health Care Providers & Services | | | | | | | | | | | | | | | 16,267,610 | |
| | | | | |
| | | | Hotels, Restaurants & Leisure – 2.0% | | | | | | | | | | | | |
| | | | | |
| | 413 | | | Brinker International, Inc. | | | 2.600% | | | | 5/15/18 | | | | BB+ | | | | 413,434 | |
| | 5,010 | | | MGM Resorts International Inc. | | | 8.625% | | | | 2/01/19 | | | | BB | | | | 5,511,000 | |
| | 5,423 | | | Total Hotels, Restaurants & Leisure | | | | | | | | | | | | | | | 5,924,434 | |
| | | | | |
| | | | Household Durables – 7.9% | | | | | | | | | | | | |
| | | | | |
| | 1,750 | | | CalAtlantic Group Inc. | | | 8.375% | | | | 5/15/18 | | | | BB | | | | 1,839,687 | |
| | 5,200 | | | KB Home | | | 4.750% | | | | 5/15/19 | | | | B1 | | | | 5,356,000 | |
| | 4,250 | | | Meritage Homes Corporation | | | 4.500% | | | | 3/01/18 | | | | Ba2 | | | | 4,281,875 | |
| | 6,130 | | | Rialto Holdings LLC-Rialto Corporation, 144A | | | 7.000% | | | | 12/01/18 | | | | B1 | | | | 6,221,950 | |
| | | | |
| JHA | | Nuveen High Income December 2018 Target Term Fund |
| | Portfolio of Investments (continued) | | June 30, 2017 (Unaudited) |
| | | | | | | | | | | | | | | | | | | | |
Principal
Amount (000) | | | Description (1) | | Coupon | | | Maturity | | | Ratings (2) | | | Value | |
| | | | | |
| | | | Household Durables (continued) | | | | | | | | | | | | |
| | | | | |
| $ | 5,880 | | | William Lyon Homes Incorporated | | | 5.750% | | | | 4/15/19 | | | | B– | | | $ | 5,953,500 | |
| | 23,210 | | | Total Household Durables | | | | | | | | | | | | | | | 23,653,012 | |
| | | | | |
| | | | Independent Power & Renewable Electricity Producers – 2.4% | | | | | | | | | | | | |
| | | | | |
| | 4,000 | | | Talen Energy Supply LLC | | | 6.500% | | | | 5/01/18 | | | | B– | | | | 4,040,000 | |
| | 2,958 | | | TransAlta Corporation | | | 6.900% | | | | 5/15/18 | | | | BBB– | | | | 3,072,661 | |
| | 6,958 | | | Total Independent Power & Renewable Electricity Producers | | | | | | | | | | | | | | | 7,112,661 | |
| | | | | |
| | | | Industrial Conglomerates – 2.0% | | | | | | | | | | | | |
| | | | | |
| | 6,000 | | | Icahn Enterprises Finance | | | 4.875% | | | | 3/15/19 | | | | BB+ | | | | 6,060,000 | |
| | | | | |
| | | | Insurance – 1.7% | | | | | | | | | | | | |
| | | | | |
| | 5,000 | | | Genworth Financial Inc. | | | 6.515% | | | | 5/22/18 | | | | Ba3 | | | | 4,993,750 | |
| | | | | |
| | | | Internet & Direct Marketing Retail – 0.3% | | | | | | | | | | | | |
| | | | | |
| | 901 | | | Expedia Inc. | | | 7.456% | | | | 8/15/18 | | | | BBB– | | | | 952,549 | |
| | | | | |
| | | | IT Services – 0.6% | | | | | | | | | | | | |
| | | | | |
| | 1,855 | | | Alliance Data Systems Corporation, 144A | | | 5.250% | | | | 12/01/17 | | | | N/R | | | | 1,868,912 | |
| | | | | |
| | | | Machinery – 1.8% | | | | | | | | | | | | |
| | | | | |
| | 5,160 | | | CNH Industrial Capital LLC | | | 3.875% | | | | 7/16/18 | | | | BBB– | | | | 5,245,140 | |
| | | | | |
| | | | Media – 4.7% | | | | | | | | | | | | |
| | | | | |
| | 2,000 | | | Cablevision Systems Corporation | | | 7.750% | | | | 4/15/18 | | | | B– | | | | 2,075,000 | |
| | 5,000 | | | CSC Holdings Inc. | | | 8.625% | | | | 2/15/19 | | | | B+ | | | | 5,479,650 | |
| | 6,302 | | | Dish DBS Corporation | | | 4.250% | | | | 4/01/18 | | | | Ba3 | | | | 6,382,792 | |
| | 13,302 | | | Total Media | | | | | | | | | | | | | | | 13,937,442 | |
| | | | | |
| | | | Metals & Mining – 7.1% | | | | | | | | | | | | |
| | | | | |
| | 2,427 | | | Alcoa Inc. | | | 5.720% | | | | 2/23/19 | | | | BBB– | | | | 2,528,643 | |
| | 5,308 | | | Allegheny Technologies Inc. | | | 9.375% | | | | 6/01/19 | | | | B | | | | 5,752,545 | |
| | 875 | | | Anglo American Capital PLC, 144A | | | 9.375% | | | | 4/08/19 | | | | BB+ | | | | 978,906 | |
| | 4,413 | | | Commercial Metals Inc. | | | 7.350% | | | | 8/15/18 | | | | BB+ | | | | 4,672,264 | |
| | 5,000 | | | Freeport McMoRan, Inc. | | | 2.375% | | | | 3/15/18 | | | | BB+ | | | | 4,975,000 | |
| | 1,500 | | | Imperial Metals Corporation, 144A | | | 7.000% | | | | 3/15/19 | | | | Caa3 | | | | 1,353,300 | |
| | 982 | | | United States Steel Corporation | | | 7.000% | | | | 2/01/18 | | | | B | | | | 1,001,640 | |
| | 20,505 | | | Total Metals & Mining | | | | | | | | | | | | | | | 21,262,298 | |
| | | | | |
| | | | Multiline Retail – 1.0% | | | | | | | | | | | | |
| | | | | |
| | 2,885 | | | J.C. Penney Corporation Inc. | | | 5.750% | | | | 2/15/18 | | | | B+ | | | | 2,924,669 | |
| | | | | |
| | | | Oil, Gas & Consumable Fuels – 12.1% | | | | | | | | | | | | |
| | | | | |
| | 2,795 | | | Energy Transfer Partners | | | 2.500% | | | | 6/15/18 | | | | BBB– | | | | 2,808,737 | |
| | 4,500 | | | Kinder Morgan Energy Partners, LP | | | 5.950% | | | | 2/15/18 | | | | BBB– | | | | 4,611,199 | |
| | 3,000 | | | Marathon Oil Corporation | | | 5.900% | | | | 3/15/18 | | | | BBB | | | | 3,076,866 | |
| | 3,500 | | | Niska Gas Storage Canada ULC Finance Corporation | | | 6.500% | | | | 4/01/19 | | | | B+ | | | | 3,552,500 | |
| | 1,755 | | | Noble Energy Inc. | | | 8.250% | | | | 3/01/19 | | | | BBB | | | | 1,925,207 | |
| | 3,750 | | | Nustar Energy LP | | | 8.150% | | | | 4/15/18 | | | | BB+ | | | | 3,918,750 | |
| | 2,000 | | | Oasis Petroleum Inc. | | | 7.250% | | | | 2/01/19 | | | | B+ | | | | 1,985,000 | |
| | 2,000 | | | Petrobras Global Finance BV | | | 3.000% | | | | 1/15/19 | | | | BB | | | | 1,988,400 | |
| | 4,500 | | | Petrobras International Finance Company | | | 7.875% | | | | 3/15/19 | | | | BB | | | | 4,828,500 | |
| | 1,500 | | | Petroleos Mexicanos | | | 5.500% | | | | 2/04/19 | | | | BBB+ | | | | 1,566,000 | |
| | 1,066 | | | Petroleos Mexicanos | | | 8.000% | | | | 5/03/19 | | | | BBB+ | | | | 1,165,938 | |
| | 4,500 | | | Whiting Petroleum Corporation | | | 5.000% | | | | 3/15/19 | | | | BB– | | | | 4,471,875 | |
| | 34,866 | | | Total Oil, Gas & Consumable Fuels | | | | | | | | | | | | | | | 35,898,972 | |
| | | | | |
| | | | Pharmaceuticals – 1.0% | | | | | | | | | | | | |
| | | | | |
| | 2,956 | | | Valeant Pharmaceuticals International, 144A | | | 6.750% | | | | 8/15/18 | | | | B– | | | | 2,967,085 | |
| | | | | | | | | | | | | | | | | | | | |
Principal
Amount (000) | | | Description (1) | | Coupon | | | Maturity | | | Ratings (2) | | | Value | |
| | | | | |
| | | | Road & Rail – 1.9% | | | | | | | | | | | | |
| | | | | |
| $ | 5,500 | | | Con-Way, Inc. | | | 7.250% | | | | 1/15/18 | | | | B– | | | $ | 5,610,000 | |
| | | | | |
| | | | Semiconductors & Semiconductor Equipment – 1.7% | | | | | | | | | | | | |
| | | | | |
| | 5,000 | | | NXP BV, 144A | | | 3.750% | | | | 6/01/18 | | | | BBB– | | | | 5,075,000 | |
| | | | | |
| | | | Specialty Retail – 1.1% | | | | | | | | | | | | |
| | | | | |
| | 3,250 | | | Best Buy Co., Inc. | | | 5.000% | | | | 8/01/18 | | | | Baa1 | | | | 3,355,683 | |
| | | | | |
| | | | Technology Hardware, Storage & Peripherals – 4.5% | | | | | | | | | | | | |
| | | | | |
| | 4,000 | | | Dell Inc. | | | 5.650% | | | | 4/15/18 | | | | Ba2 | | | | 4,090,000 | |
| | 2,800 | | | Diamond 1 Finance Corporation / Diamond 2 Finance Corporation, 144A | | | 3.480% | | | | 6/01/19 | | | | BBB– | | | | 2,865,562 | |
| | 4,000 | | | Seagate HDD Cayman | | | 3.750% | | | | 11/15/18 | | | | BBB– | | | | 4,096,000 | |
| | 2,134 | | | Xerox Corporation | | | 6.350% | | | | 5/15/18 | | | | BBB– | | | | 2,213,366 | |
| | 12,934 | | | Total Technology Hardware, Storage & Peripherals | | | | | | | | | | | | | | | 13,264,928 | |
| | | | | |
| | | | Thrifts & Mortgage Finance – 1.9% | | | | | | | | | | | | |
| | | | | |
| | 5,415 | | | Radian Group Inc. | | | 5.500% | | | | 6/01/19 | | | | BB | | | | 5,685,750 | |
| | | | | |
| | | | Trading Companies & Distributors – 1.0% | | | | | | | | | | | | |
| | | | | |
| | 3,000 | | | Aircastle Limited | | | 4.625% | | | | 12/15/18 | | | | BB+ | | | | 3,096,600 | |
| | | | | |
| | | | Wireless Telecommunication Services – 2.6% | | | | | | | | | | | | |
| | | | | |
| | 7,000 | | | Sprint Communications Inc., 144A | | | 9.000% | | | | 11/15/18 | | | | BB | | | | 7,597,171 | |
| $ | 338,804 | | | Total Corporate Bonds (cost $343,265,380) | | | | | | | | | | | | | | | 348,965,507 | |
| | | | | |
Principal
Amount (000) | | | Description (1) | | Coupon | | | Maturity | | | Ratings (2) | | | Value | |
| | | | | |
| | | | CONVERTIBLE BONDS – 6.2% (4.8% of Total Investments) | | | | | | | | | | | | | | | | |
| | | | | |
| | | | Capital Markets – 1.2% | | | | | | | | | | | | |
| | | | | |
| $ | 3,500 | | | Prospect Capital Corporation | | | 5.875% | | | | 1/15/19 | | | | BBB– | | | $ | 3,613,750 | |
| | | | | |
| | | | Electrical Equipment – 1.3% | | | | | | | | | | | | |
| | | | | |
| | 4,000 | | | SolarCity Corporation | | | 2.750% | | | | 11/01/18 | | | | N/R | | | | 3,982,500 | |
| | | | | |
| | | | Independent Power & Renewable Electricity Producers – 1.3% | | | | | | | | | | | | |
| | | | | |
| | 3,800 | | | NRG Yield Inc., 144A | | | 3.500% | | | | 2/01/19 | | | | N/R | | | | 3,845,125 | |
| | | | | |
| | | | Machinery – 1.7% | | | | | | | | | | | | |
| | | | | |
| | 5,250 | | | Navistar International Corporation | | | 4.750% | | | | 4/15/19 | | | | CCC | | | | 5,115,469 | |
| | | | | |
| | | | Oil, Gas & Consumable Fuels – 0.7% | | | | | | | | | | | | |
| | | | | |
| | 2,000 | | | Clean Energy Fuels Corporation, 144A | | | 5.250% | | | | 10/01/18 | | | | N/R | | | | 1,970,000 | |
| $ | 18,550 | | | Total Convertible Bonds (cost $18,023,729) | | | | | | | | | | | | | | | 18,526,844 | |
| | | | | |
Principal
Amount (000) | | | Description (1) | | Coupon | | | Maturity | | | Ratings (2) | | | Value | |
| | | | | |
| | | | SOVEREIGN DEBT – 3.0% (2.4% of Total Investments) | | | | | | | | | | | | | | | | |
| | | | | |
| | | | Argentina – 1.0% | | | | | | | | | | | | |
| | | | | |
| $ | 3,000 | | | Republic of Argentina | | | 6.250% | | | | 4/22/19 | | | | B | | | $ | 3,142,500 | |
| | | | | |
| | | | South Africa – 1.1% | | | | | | | | | | | | |
| | | | | |
| | 3,000 | | | Republic of South Africa | | | 6.875% | | | | 5/27/19 | | | | Baa3 | | | | 3,238,860 | |
| | | | |
| JHA | | Nuveen High Income December 2018 Target Term Fund |
| | Portfolio of Investments (continued) | | June 30, 2017 (Unaudited) |
| | | | | | | | | | | | | | | | | | | | |
Principal
Amount (000) | | | Description (1) | | Coupon | | | Maturity | | | Ratings (2) | | | Value | |
| | | | | |
| | | | Sri Lanka – 0.9% | | | | | | | | | | | | |
| | | | | |
| $ | 2,500 | | | Republic of Sri Lanka, 144A | | | 6.000% | | | | 1/14/19 | | | | B+ | | | $ | 2,590,817 | |
| $ | 8,500 | | | Total Sovereign Debt (cost $8,798,445) | | | | | | | | | | | | | | | 8,972,177 | |
| | | | Total Long-Term Investments (cost $370,087,554) | | | | | | | | | | | | | | | 376,464,528 | |
| | | | | |
Principal
Amount (000) | | | Description (1) | | Coupon | | | Maturity | | | | | | Value | |
| | | | | |
| | | | SHORT-TERM INVESTMENTS – 2.2% (1.7% of Total Investments) | | | | | | | | | | | | |
| | | | | |
| | | | REPURCHASE AGREEMENTS – 2.2% (1.7% of Total Investments) | | | | | | | | | | | | |
| | | | | |
| $ | 6,460 | | | Repurchase Agreement with Fixed Income Clearing Corporation, dated 6/30/17, repurchase price $6,460,241, collateralized by $6,640,000 U.S. Treasury Notes, 2.000%, due 6/30/24, value $6,590,200 | | | 0.120% | | | | 7/03/17 | | | | | | | $ | 6,460,176 | |
| | | | Total Short-Term Investments (cost $6,460,176) | | | | | | | | | | | | | | | 6,460,176 | |
| | | | Total Investments (cost $376,547,730) – 128.8% | | | | | | | | | | | | | | | 382,924,704 | |
| | | | Borrowings – (30.9)% (3), (4) | | | | | | | | | | | | | | | (92,000,000 | ) |
| | | | Other Assets Less Liabilities – 2.1% | | | | | | | | | | | | | | | 6,432,164 | |
| | | | Net Assets – 100% | | | | | | | | | | | | | | $ | 297,356,868 | |
For Fund portfolio compliance purposes, the Fund’s industry classifications refer to any one or more of the industry sub-classifications used by one or more widely recognized market indexes or ratings group indexes, and/or as defined by Fund management. This definition may not apply for purposes of this report, which may combine industry sub-classifications into sectors for reporting ease.
| (1) | All percentages shown in the Portfolio of Investments are based on net assets unless otherwise noted. |
| (2) | For financial reporting purposes, the ratings disclosed are the highest of Standard & Poor’s Group (“Standard & Poor’s”), Moody’s Investors Service, Inc. (“Moody’s”) or Fitch, Inc. (“Fitch”) rating. This treatment of split-rated securities may differ from that used for other purposes, such as for Fund investment policies. Ratings below BBB by Standard & Poor’s, Baa by Moody’s or BBB by Fitch are considered to be below investment grade. Holdings designated N/R are not rated by any of these national rating agencies. |
| (3) | Borrowings as a percentage of Total Investments is 24.0%. |
| (4) | The Fund may pledge up to 100% of its eligible investments (excluding any investments separately pledged as collateral for specific investments in derivatives) in the Portfolio of Investments as collateral for borrowings. |
| 144A | Investment is exempt from registration under Rule 144A of the Securities Act of 1933, as amended. These investments may only be resold in transactions exempt from registration, which are normally those transactions with qualified institutional buyers. |
See accompanying notes to financial statements.
JHB
| | |
Nuveen High Income November 2021 Target Term Fund |
Portfolio of Investments | | June 30, 2017 (Unaudited) |
| | | | | | | | | | | | | | | | | | | | |
Principal
Amount (000) | | | Description (1) | | Coupon | | | Maturity | | | Ratings (2) | | | Value | |
| |
| | | | LONG-TERM INVESTMENTS – 130.4% (100.0% of Total Investments) | |
| | | | | |
| | | | CORPORATE BONDS – 129.1% (99.0% of Total Investments) | | | | | | | | | | | | | | | | |
| | | | | |
| | | | Aerospace & Defense – 2.6% | | | | | | | | | | | | |
| | | | | |
| $ | 750 | | | Bombardier Inc., 144A | | | 7.750% | | | | 3/15/20 | | | | B | | | $ | 806,250 | |
| | 1,000 | | | Bombardier Inc., 144A | | | 8.750% | | | | 12/01/21 | | | | B | | | | 1,110,000 | |
| | 5,750 | | | Bombardier Inc., 144A | | | 5.750% | | | | 3/15/22 | | | | B | | | | 5,721,250 | |
| | 7,343 | | | Triumph Group Inc. | | | 4.875% | | | | 4/01/21 | | | | B1 | | | | 7,297,106 | |
| | 14,843 | | | Total Aerospace & Defense | | | | | | | | | | | | | | | 14,934,606 | |
| | | | | |
| | | | Airlines – 2.3% | | | | | | | | | | | | |
| | | | | |
| | 3,210 | | | Air Canada, 144A | | | 7.750% | | | | 4/15/21 | | | | BB– | | | | 3,675,450 | |
| | 2,250 | | | American Airlines Group Inc., 144A | | | 4.625% | | | | 3/01/20 | | | | BB– | | | | 2,327,107 | |
| | 1,500 | | | United Continental Holdings Inc. | | | 6.000% | | | | 12/01/20 | | | | BB | | | | 1,635,000 | |
| | 4,950 | | | Virgin Australia Holdings Limited, 144A | | | 7.875% | | | | 10/15/21 | | | | B– | | | | 5,166,563 | |
| | 11,910 | | | Total Airlines | | | | | | | | | | | | | | | 12,804,120 | |
| | | | | |
| | | | Automobiles – 1.2% | | | | | | | | | | | | |
| | | | | |
| | 3,450 | | | Aston Martin Capital Holdings Ltd, 144A | | | 6.500% | | | | 4/15/22 | | | | B– | | | | 3,588,000 | |
| | 3,350 | | | Fiat Chrysler Automobiles NV | | | 4.500% | | | | 4/15/20 | | | | BB | | | | 3,429,562 | |
| | 6,800 | | | Total Automobiles | | | | | | | | | | | | | | | 7,017,562 | |
| | | | | |
| | | | Banks – 1.5% | | | | | | | | | | | | |
| | | | | |
| | 3,000 | | | CIT Group Inc. | | | 5.375% | | | | 5/15/20 | | | | BB+ | | | | 3,228,750 | |
| | 4,850 | | | Popular Inc. | | | 7.000% | | | | 7/01/19 | | | | BB– | | | | 5,092,500 | |
| | 7,850 | | | Total Banks | | | | | | | | | | | | | | | 8,321,250 | |
| | | | | |
| | | | Building Products – 0.8% | | | | | | | | | | | | |
| | | | | |
| | 1,000 | | | Euramax International Inc., 144A | | | 12.000% | | | | 8/15/20 | | | | B– | | | | 1,090,000 | |
| | 3,325 | | | Taylor Morrison Monarch Communities, 144A | | | 5.250% | | | | 4/15/21 | | | | BB– | | | | 3,408,125 | |
| | 4,325 | | | Total Building Products | | | | | | | | | | | | | | | 4,498,125 | |
| | | | | |
| | | | Chemicals – 3.3% | | | | | | | | | | | | |
| | | | | |
| | 2,000 | | | CF Industries Inc., 144A | | | 3.400% | | | | 12/01/21 | | | | BBB– | | | | 2,021,869 | |
| | 1,500 | | | CF Industries Inc. | | | 7.125% | | | | 5/01/20 | | | | BB+ | | | | 1,657,500 | |
| | 1,250 | | | Hexion Inc., 144A | | | 10.375% | | | | 2/01/22 | | | | CCC+ | | | | 1,237,500 | |
| | 3,000 | | | Hexion Inc. | | | 6.625% | | | | 4/15/20 | | | | CCC+ | | | | 2,737,500 | |
| | 1,300 | | | Huntsman International LLC | | | 4.875% | | | | 11/15/20 | | | | B1 | | | | 1,365,000 | |
| | 500 | | | Momentive Performance Materials Inc. | | | 3.880% | | | | 10/24/21 | | | | B– | | | | 496,250 | |
| | 6,130 | | | Platform Specialty Products Corporation, 144A | | | 6.500% | | | | 2/01/22 | | | | B+ | | | | 6,329,225 | |
| | 3,000 | | | Tronox Finance LLC, 144A | | | 7.500% | | | | 3/15/22 | | | | B– | | | | 3,090,000 | |
| | 18,680 | | | Total Chemicals | | | | | | | | | | | | | | | 18,934,844 | |
| | | | | |
| | | | Commercial Services & Supplies – 3.2% | | | | | | | | | | | | |
| | | | | |
| | 5,345 | | | ADT Corporation | | | 6.250% | | | | 10/15/21 | | | | BB– | | | | 5,819,369 | |
| | 3,967 | | | APX Group, Inc. | | | 8.750% | | | | 12/01/20 | | | | CCC+ | | | | 4,095,927 | |
| | 3,000 | | | GFL Environmental Corporation, 144A | | | 5.625% | | | | 5/01/22 | | | | B– | | | | 3,067,500 | |
| | 4,500 | | | R.R. Donnelley & Sons Company | | | 7.875% | | | | 3/15/21 | | | | B+ | | | | 4,871,250 | |
| | 500 | | | R.R. Donnelley & Sons Company | | | 7.000% | | | | 2/15/22 | | | | B+ | | | | 523,125 | |
| | 17,312 | | | Total Commercial Services & Supplies | | | | | | | | | | | | | | | 18,377,171 | |
| | | | | |
| | | | Construction & Engineering – 0.7% | | | | | | | | | | | | |
| | | | | |
| | 1,328 | | | AECOM Global II LLC / URS FOX US LP | | | 5.000% | | | | 4/01/22 | | | | BB– | | | | 1,362,966 | |
| | 2,750 | | | HC2 Holdings, Inc., 144A | | | 11.000% | | | | 12/01/19 | | | | B– | | | | 2,811,875 | |
| | 4,078 | | | Total Construction & Engineering | | | | | | | | | | | | | | | 4,174,841 | |
| | | | |
| JHB | | Nuveen High Income November 2021 Target Term Fund |
| | Portfolio of Investments (continued) | | June 30, 2017 (Unaudited) |
| | | | | | | | | | | | | | | | | | | | |
Principal
Amount (000) | | | Description (1) | | Coupon | | | Maturity | | | Ratings (2) | | | Value | |
| | | | | |
| | | | Construction Materials – 0.6% | | | | | | | | | | | | |
| | | | | |
| $ | 3,000 | | | Cemex SAB de CV, 144A | | | 7.250% | | | | 1/15/21 | | | | BB– | | | $ | 3,176,250 | |
| | | | | |
| | | | Consumer Finance – 5.2% | | | | | | | | | | | | |
| | | | | |
| | 3,500 | | | Ally Financial Inc. | | | 4.125% | | | | 2/13/22 | | | | BB+ | | | | 3,587,500 | |
| | 7,752 | | | Credit Acceptance Corporation | | | 6.125% | | | | 2/15/21 | | | | BB | | | | 7,945,800 | |
| | 2,325 | | | Enova International, Inc. | | | 9.750% | | | | 6/01/21 | | | | B– | | | | 2,418,000 | |
| | 2,000 | | | Navient Corporation | | | 6.625% | | | | 7/26/21 | | | | BB | | | | 2,152,500 | |
| | 8,564 | | | OneMain Financial Holdings, Inc., 144A | | | 7.250% | | | | 12/15/21 | | | | B1 | | | | 9,020,033 | |
| | 4,000 | | | SLM Corporation | | | 7.250% | | | | 1/25/22 | | | | BB | | | | 4,370,000 | |
| | 28,141 | | | Total Consumer Finance | | | | | | | | | | | | | | | 29,493,833 | |
| | | | | |
| | | | Containers & Packaging – 2.2% | | | | | | | | | | | | |
| | | | | |
| | 3,650 | | | Ardagh Packaging Finance PLC and Ardagh MP Holdings USA, Inc., 144A | | | 6.000% | | | | 6/30/21 | | | | B | | | | 3,777,750 | |
| | 5,095 | | | Coveris Holdings SA, 144A | | | 7.875% | | | | 11/01/19 | | | | B– | | | | 5,018,575 | |
| | 3,235 | | | Owens-Brockway Glass Containers, 144A | | | 5.000% | | | | 1/15/22 | | | | BB– | | | | 3,421,012 | |
| | 11,980 | | | Total Containers & Packaging | | | | | | | | | | | | | | | 12,217,337 | |
| | | | | |
| | | | Diversified Financial Services – 5.2% | | | | | | | | | | | | |
| | | | | |
| | 6,475 | | | Fly Leasing Limited | | | 6.375% | | | | 10/15/21 | | | | BB– | | | | 6,790,656 | |
| | 4,500 | | | Jefferies Finance LLC Corporation, 144A | | | 6.875% | | | | 4/15/22 | | | | B1 | | | | 4,488,750 | |
| | 2,750 | | | Lincoln Finance LTD, 144A | | | 7.375% | | | | 4/15/21 | | | | BB+ | | | | 2,915,000 | |
| | 6,527 | | | Nationstar Mortgage LLC Capital Corporation | | | 6.500% | | | | 7/01/21 | | | | B+ | | | | 6,673,857 | |
| | 4,300 | | | NewStar Financial, Inc. | | | 7.250% | | | | 5/01/20 | | | | BB– | | | | 4,402,125 | |
| | 4,265 | | | PHH Corporation | | | 6.375% | | | | 8/15/21 | | | | B1 | | | | 4,382,288 | |
| | 28,817 | | | Total Diversified Financial Services | | | | | | | | | | | | | | | 29,652,676 | |
| | | | | |
| | | | Diversified Telecommunication Services – 3.7% | | | | | | | | | | | | |
| | | | | |
| | 9,000 | | | CenturyLink Inc. | | | 5.800% | | | | 3/15/22 | | | | BB+ | | | | 9,360,000 | |
| | 1,500 | | | Frontier Communications Corporation | | | 9.250% | | | | 7/01/21 | | | | B+ | | | | 1,471,485 | |
| | 5,750 | | | Frontier Communications Corporation | | | 8.750% | | | | 4/15/22 | | | | B+ | | | | 5,178,162 | |
| | 5,450 | | | Windstream Corporation | | | 7.750% | | | | 10/01/21 | | | | BB– | | | | 5,123,000 | |
| | 21,700 | | | Total Diversified Telecommunication Services | | | | | | | | | | | | | | | 21,132,647 | |
| | | | | |
| | | | Electric Utilities – 0.2% | | | | | | | | | | | | |
| | | | | |
| | 1,000 | | | DCP Midstream Operating LP, 144A | | | 4.750% | | | | 9/30/21 | | | | BB+ | | | | 1,020,000 | |
| | | | | |
| | | | Electronic Equipment, Instruments & Components – 0.8% | | | | | | | | | | | | |
| | | | | |
| | 4,000 | | | Anixter Inc. | | | 5.125% | | | | 10/01/21 | | | | BB+ | | | | 4,260,000 | |
| | | | | |
| | | | Energy Equipment & Services – 1.8% | | | | | | | | | | | | |
| | | | | |
| | 3,900 | | | McDermott International Inc., 144A | | | 8.000% | | | | 5/01/21 | | | | BB– | | | | 3,929,250 | |
| | 2,000 | | | Resolute Energy Corporation | | | 8.500% | | | | 5/01/20 | | | | B+ | | | | 1,990,000 | |
| | 4,416 | | | SESI, LLC | | | 7.125% | | | | 12/15/21 | | | | BB– | | | | 4,206,240 | |
| | 10,316 | | | Total Energy Equipment & Services | | | | | | | | | | | | | | | 10,125,490 | |
| | | | | |
| | | | Equity Real Estate Investment Trusts – 3.4% | | | | | | | | | | | | |
| | | | | |
| | 3,248 | | | CoreCivic, Inc. | | | 4.125% | | | | 4/01/20 | | | | Ba1 | | | | 3,337,320 | |
| | 3,604 | | | Geo Group Inc. | | | 5.875% | | | | 1/15/22 | | | | B+ | | | | 3,748,160 | |
| | 2,500 | | | Iron Mountain Inc., 144A | | | 4.375% | | | | 6/01/21 | | | | BB– | | | | 2,593,750 | |
| | 5,540 | | | iStar Inc. | | | 6.500% | | | | 7/01/21 | | | | BB | | | | 5,803,150 | |
| | 3,847 | | | Realogy Group LLC / Realogy Co-Issuer Corporation, 144A | | | 5.250% | | | | 12/01/21 | | | | B+ | | | | 4,031,656 | |
| | 18,739 | | | Total Equity Real Estate Investment Trusts | | | | | | | | | | | | | | | 19,514,036 | |
| | | | | |
| | | | Food & Staples Retailing – 1.3% | | | | | | | | | | | | |
| | | | | |
| | 3,750 | | | Rite Aid Corporation | | | 6.750% | | | | 6/15/21 | | | | B | | | | 3,851,250 | |
| | 3,500 | | | Supervalu Inc. | | | 6.750% | | | | 6/01/21 | | | | B– | | | | 3,430,000 | |
| | 7,250 | | | Total Food & Staples Retailing | | | | | | | | | | | | | | | 7,281,250 | |
| | | | | | | | | | | | | | | | | | | | |
Principal
Amount (000) | | | Description (1) | | Coupon | | | Maturity | | | Ratings (2) | | | Value | |
| | | | | |
| | | | Food Products – 0.2% | | | | | | | | | | | | |
| | | | | |
| $ | 910 | | | JBS USA LLC, 144A | | | 7.250% | | | | 6/01/21 | | | | BB | | | $ | 909,545 | |
| | | | | |
| | | | Gas Utilities – 0.6% | | | | | | | | | | | | |
| | | | | |
| | 3,885 | | | Ferrellgas LP | | | 6.750% | | | | 1/15/22 | | | | B | | | | 3,661,613 | |
| | | | | |
| | | | Health Care Equipment & Supplies – 1.8% | | | | | | | | | | | | |
| | | | | |
| | 1,550 | | | Tenet Healthcare Corporation, 144A | | | 7.500% | | | | 1/01/22 | | | | Ba3 | | | | 1,681,440 | |
| | 5,030 | | | Tenet Healthcare Corporation | | | 4.375% | | | | 10/01/21 | | | | BB– | | | | 5,105,450 | |
| | 3,000 | | | Tenet Healthcare Corporation | | | 8.125% | | | | 4/01/22 | | | | B– | | | | 3,187,500 | |
| | 9,580 | | | Total Health Care Equipment & Supplies | | | | | | | | | | | | | | | 9,974,390 | |
| | | | | |
| | | | Health Care Providers & Services – 5.9% | | | | | | | | | | | | |
| | | | | |
| | 1,650 | | | Acadia Healthcare | | | 6.125% | | | | 3/15/21 | | | | B | | | | 1,701,562 | |
| | 500 | | | Community Health Systems, Inc. | | | 7.125% | | | | 7/15/20 | | | | CCC+ | | | | 486,875 | |
| | 7,000 | | | Community Health Systems, Inc. | | | 5.125% | | | | 8/01/21 | | | | BB | | | | 7,087,500 | |
| | 7,000 | | | HCA Inc. | | | 7.500% | | | | 2/15/22 | | | | BB | | | | 8,058,750 | |
| | 6,509 | | | Kindred Healthcare Inc. | | | 6.375% | | | | 4/15/22 | | | | B– | | | | 6,411,365 | |
| | 4,886 | | | Lifepoint Health Inc. | | | 5.500% | | | | 12/01/21 | | | | Ba2 | | | | 5,057,010 | |
| | 4,395 | | | Select Medical Corporation | | | 6.375% | | | | 6/01/21 | | | | B– | | | | 4,515,863 | |
| | 31,940 | | | Total Health Care Providers & Services | | | | | | | | | | | | | | | 33,318,925 | |
| | | | | |
| | | | Hotels, Restaurants & Leisure – 5.6% | | | | | | | | | | | | |
| | | | | |
| | 2,175 | | | 1011778 BC ULC/New Red Finance Inc., 144A | | | 6.000% | | | | 4/01/22 | | | | B– | | | | 2,253,844 | |
| | 6,000 | | | International Game Technology PLC, 144A | | | 6.250% | | | | 2/15/22 | | | | BB+ | | | | 6,555,000 | |
| | 5,000 | | | MGM Resorts International Inc. | | | 6.625% | | | | 12/15/21 | | | | BB | | | | 5,612,500 | |
| | 3,000 | | | Norwegian Cruise Lines, 144A | | | 4.750% | | | | 12/15/21 | | | | BB | | | | 3,113,970 | |
| | 4,000 | | | Scientific Games Corporation | | | 7.000% | | | | 1/01/22 | | | | Ba3 | | | | 4,260,000 | |
| | 2,000 | | | Scientific Games International Inc. | | | 6.625% | | | | 5/15/21 | | | | CCC+ | | | | 1,990,000 | |
| | 2,750 | | | Studio City Co Ltd, 144A | | | 7.250% | | | | 11/30/21 | | | | BB– | | | | 2,987,188 | |
| | 5,000 | | | Wynn Macau Limited, 144A | | | 5.250% | | | | 10/15/21 | | | | B1 | | | | 5,125,000 | |
| | 29,925 | | | Total Hotels, Restaurants & Leisure | | | | | | | | | | | | | | | 31,897,502 | |
| | | | | |
| | | | Household Durables – 6.1% | | | | | | | | | | | | |
| | | | | |
| | 3,500 | | | Apex Tool Group, LLC (ATG), 144A | | | 7.000% | | | | 2/01/21 | | | | B– | | | | 3,255,000 | |
| | 7,725 | | | Beazer Homes USA, Inc. | | | 8.750% | | | | 3/15/22 | | | | B3 | | | | 8,613,375 | |
| | 3,510 | | | Brookfield Residential Properties Inc., 144A | | | 6.500% | | | | 12/15/20 | | | | B+ | | | | 3,624,075 | |
| | 1,250 | | | CalAtlantic Group Inc. | | | 6.250% | | | | 12/15/21 | | | | BB | | | | 1,400,000 | |
| | 3,960 | | | KB Home | | | 7.000% | | | | 12/15/21 | | | | B1 | | | | 4,435,200 | |
| | 2,500 | | | Lennar Corporation | | | 4.750% | | | | 4/01/21 | | | | Ba1 | | | | 2,650,000 | |
| | 1,000 | | | Lennar Corporation | | | 4.125% | | | | 1/15/22 | | | | Ba1 | | | | 1,033,750 | |
| | 3,045 | | | Meritage Homes Corporation | | | 7.000% | | | | 4/01/22 | | | | Ba2 | | | | 3,463,688 | |
| | 3,550 | | | M-I Homes Inc. | | | 6.750% | | | | 1/15/21 | | | | BB– | | | | 3,718,625 | |
| | 2,500 | | | New Home Company Inc., 144A | | | 7.250% | | | | 4/01/22 | | | | B– | | | | 2,587,500 | |
| | 32,540 | | | Total Household Durables | | | | | | | | | | | | | | | 34,781,213 | |
| | | | | |
| | | | Household Products – 1.0% | | | | | | | | | | | | |
| | | | | |
| | 5,500 | | | HRG Group, Inc. | | | 7.750% | | | | 1/15/22 | | | | B | | | | 5,775,000 | |
| | | | | |
| | | | Independent Power & Renewable Electricity Producers – 3.7% | | | | | | | | | | | | |
| | | | | |
| | 2,300 | | | Atlantica Yield PLC, 144A | | | 7.000% | | | | 11/15/19 | | | | BB– | | | | 2,438,000 | |
| | 6,750 | | | DPL, Inc. | | | 7.250% | | | | 10/15/21 | | | | Ba3 | | | | 7,222,500 | |
| | 7,250 | | | Dynegy Inc. | | | 6.750% | | | | 11/01/19 | | | | B+ | | | | 7,476,563 | |
| | 706 | | | Talen Energy Supply LLC, 144A | | | 4.625% | | | | 7/15/19 | | | | B– | | | | 688,350 | |
| | 4,500 | | | Talen Energy Supply LLC | | | 4.600% | | | | 12/15/21 | | | | B– | | | | 3,420,000 | |
| | 21,506 | | | Total Independent Power & Renewable Electricity Producers | | | | | | | | | | | | | | | 21,245,413 | |
| | | | | |
| | | | Industrial Conglomerates – 1.6% | | | | | | | | | | | | |
| | | | | |
| | 2,000 | | | Icahn Enterprises Finance | | | 6.250% | | | | 2/01/22 | | | | BB+ | | | | 2,085,000 | |
| | 7,000 | | | Icahn Enterprises Finance | | | 5.875% | | | | 2/01/22 | | | | BB+ | | | | 7,166,250 | |
| | 9,000 | | | Total Industrial Conglomerates | | | | | | | | | | | | | | | 9,251,250 | |
| | | | |
| JHB | | Nuveen High Income November 2021 Target Term Fund |
| | Portfolio of Investments (continued) | | June 30, 2017 (Unaudited) |
| | | | | | | | | | | | | | | | | | | | |
Principal
Amount (000) | | | Description (1) | | Coupon | | | Maturity | | | Ratings (2) | | | Value | |
| | | | | |
| | | | Insurance – 0.8% | | | | | | | | | | | | |
| | | | | |
| $ | 4,897 | | | Genworth Financial Inc. | | | 7.625% | | | | 9/24/21 | | | | Ba3 | | | $ | 4,725,605 | |
| | | | | |
| | | | Internet & Direct Marketing Retail – 0.8% | | | | | | | | | | | | |
| | | | | |
| | 4,230 | | | Netflix Incorporated | | | 5.500% | | | | 2/15/22 | | | | B+ | | | | 4,593,484 | |
| | | | | |
| | | | Internet Software & Services – 0.8% | | | | | | | | | | | | |
| | | | | |
| | 4,467 | | | Cimpress NV, 144A | | | 7.000% | | | | 4/01/22 | | | | B1 | | | | 4,623,345 | |
| | | | | |
| | | | IT Services – 0.8% | | | | | | | | | | | | |
| | | | | |
| | 4,500 | | | Alliance Data Systems Corporation, 144A | | | 5.875% | | | | 11/01/21 | | | | N/R | | | | 4,657,500 | |
| | | | | |
| | | | Machinery – 2.2% | | | | | | | | | | | | |
| | | | | |
| | 2,000 | | | Airxcel Incorporated, 144A | | | 8.500% | | | | 2/15/22 | | | | B | | | | 2,105,000 | |
| | 1,000 | | | CNH Industrial Capital LLC | | | 4.875% | | | | 4/01/21 | | | | BBB– | | | | 1,062,500 | |
| | 1,500 | | | CNH Industrial Capital LLC | | | 3.875% | | | | 10/15/21 | | | | BBB– | | | | 1,539,375 | |
| | 1,000 | | | Joy Global, Inc. | | | 5.125% | | | | 10/15/21 | | | | A | | | | 1,110,690 | |
| | 3,500 | | | Navistar International Corporation | | | 8.250% | | | | 11/01/21 | | | | B– | | | | 3,535,000 | |
| | 3,250 | | | Titan International Inc. | | | 6.875% | | | | 10/01/20 | | | | B– | | | | 3,371,875 | |
| | 12,250 | | | Total Machinery | | | | | | | | | | | | | | | 12,724,440 | |
| | | | | |
| | | | Media – 10.8% | | | | | | | | | | | | |
| | | | | |
| | 3,379 | | | AMC Entertainment Inc. | | | 5.875% | | | | 2/15/22 | | | | B+ | | | | 3,531,055 | |
| | 2,500 | | | Cablevision Systems Corporation | | | 8.000% | | | | 4/15/20 | | | | B– | | | | 2,784,375 | |
| | 5,325 | | | Cequel Communication Holdings I, 144A | | | 5.125% | | | | 12/15/21 | | | | B | | | | 5,418,188 | |
| | 6,580 | | | Clear Channel International BV, 144A | | | 8.750% | | | | 12/15/20 | | | | BB– | | | | 6,974,800 | |
| | 5,000 | | | CSC Holdings Inc. | | | 6.750% | | | | 11/15/21 | | | | B+ | | | | 5,537,500 | |
| | 5,000 | | | Dish DBS Corporation | | | 6.750% | | | | 6/01/21 | | | | Ba3 | | | | 5,550,000 | |
| | 4,250 | | | Lee Enterprises Inc., 144A | | | 9.500% | | | | 3/15/22 | | | | B2 | | | | 4,377,500 | |
| | 5,000 | | | Nexstar Broadcasting Inc., 144A | | | 6.125% | | | | 2/15/22 | | | | B+ | | | | 5,231,250 | |
| | 6,425 | | | Radio One Inc., 144A | | | 7.375% | | | | 4/15/22 | | | | B | | | | 6,649,875 | |
| | 3,200 | | | Regal Entertainment Group | | | 5.750% | | | | 3/15/22 | | | | B+ | | | | 3,344,000 | |
| | 8,000 | | | Time Inc., 144A | | | 5.750% | | | | 4/15/22 | | | | B | | | | 8,270,000 | |
| | 3,585 | | | WMG Acquisition Group, 144A | | | 6.750% | | | | 4/15/22 | | | | B | | | | 3,768,731 | |
| | 58,244 | | | Total Media | | | | | | | | | | | | | | | 61,437,274 | |
| | | | | |
| | | | Metals & Mining – 12.7% | | | | | | | | | | | | |
| | | | | |
| | 6,500 | | | AK Steel Corporation | | | 7.625% | | | | 10/01/21 | | | | B– | | | | 6,762,080 | |
| | 3,500 | | | Alcoa Inc. | | | 5.870% | | | | 2/23/22 | | | | BBB– | | | | 3,745,000 | |
| | 6,000 | | | Aleris International Inc., 144A | | | 9.500% | | | | 4/01/21 | | | | B | | | | 6,169,740 | |
| | 6,840 | | | Allegheny Technologies Inc. | | | 5.950% | | | | 1/15/21 | | | | B | | | | 6,857,100 | |
| | 2,500 | | | Anglo American Capital PLC, 144A | | | 4.125% | | | | 4/15/21 | | | | BB+ | | | | 2,568,750 | |
| | 2,000 | | | Anglo American PLC, 144A | | | 3.625% | | | | 5/14/20 | | | | BB+ | | | | 2,032,500 | |
| | 2,500 | | | ArcelorMittal | | | 7.000% | | | | 2/25/22 | | | | BB+ | | | | 2,812,500 | |
| | 1,475 | | | Cliffs Natural Resources Inc., 144A | | | 8.250% | | | | 3/31/20 | | | | BB– | | | | 1,607,750 | |
| | 3,645 | | | Constellium N.V, 144A | | | 7.875% | | | | 4/01/21 | | | | B+ | | | | 3,900,150 | |
| | 4,405 | | | Eldorado Gold Corporation, 144A | | | 6.125% | | | | 12/15/20 | | | | B+ | | | | 4,509,619 | |
| | 2,350 | | | First Quantum Minerals Limited, 144A | | | 7.000% | | | | 2/15/21 | | | | B | | | | 2,408,750 | |
| | 3,000 | | | FMG Resources, 144A | | | 9.750% | | | | 3/01/22 | | | | BBB– | | | | 3,416,250 | |
| | 2,000 | | | Freeport McMoRan, Inc. | | | 6.750% | | | | 2/01/22 | | | | BB+ | | | | 2,070,000 | |
| | 1,665 | | | Freeport McMoRan, Inc. | | | 3.550% | | | | 3/01/22 | | | | BB+ | | | | 1,560,405 | |
| | 1,500 | | | Glencore Finance Canada, 144A | | | 4.950% | | | | 11/15/21 | | | | BBB | | | | 1,604,250 | |
| | 3,200 | | | Gold Fields Orogen Holdings BVI Limited, 144A | | | 4.875% | | | | 10/07/20 | | | | BB+ | | | | 3,216,000 | |
| | 2,500 | | | Lundin Mining Corporation, 144A | | | 7.500% | | | | 11/01/20 | | | | BB– | | | | 2,628,500 | |
| | 3,843 | | | Teck Resources Limited | | | 4.750% | | | | 1/15/22 | | | | BB | | | | 3,977,505 | |
| | 7,935 | | | United States Steel Corporation, 144A | | | 8.375% | | | | 7/01/21 | | | | BB+ | | | | 8,728,500 | |
| | 1,300 | | | Vale Overseas Limited | | | 4.375% | | | | 1/11/22 | | | | BBB | | | | 1,323,140 | |
| | 68,658 | | | Total Metals & Mining | | | | | | | | | | | | | | | 71,898,489 | |
| | | | | |
| | | | Mortgage Real Estate Investment Trusts – 0.7% | | | | | | | | | | | | |
| | | | | |
| | 4,000 | | | Starwood Property Trust, 144A | | | 5.000% | | | | 12/15/21 | | | | BB– | | | | 4,160,000 | |
| | | | | | | | | | | | | | | | | | | | |
Principal
Amount (000) | | | Description (1) | | Coupon | | | Maturity | | | Ratings (2) | | | Value | |
| | | | | |
| | | | Multiline Retail – 1.4% | | | | | | | | | | | | |
| | | | | |
| $ | 7,868 | | | J.C. Penney Corporation Inc. | | | 5.650% | | | | 6/01/20 | | | | B+ | | | $ | 7,740,145 | |
| | | | | |
| | | | Oil, Gas & Consumable Fuels – 11.4% | | | | | | | | | | | | |
| | | | | |
| | 4,000 | | | Antero Resources Corporation | | | 5.375% | | | | 11/01/21 | | | | BB | | | | 4,040,000 | |
| | 1,210 | | | Ascent Resources – Utica LLC / AEU Finance Corporation, 144A | | | 10.000% | | | | 4/01/22 | | | | B– | | | | 1,210,000 | |
| | 2,434 | | | Calumet Specialty Products, 144A | | | 11.500% | | | | 1/15/21 | | | | B+ | | | | 2,811,270 | |
| | 5,100 | | | CONSOL Energy Inc. | | | 5.875% | | | | 4/15/22 | | | | B+ | | | | 5,010,750 | |
| | 668 | | | Denbury Resources Inc., 144A | | | 9.000% | | | | 5/15/21 | | | | B | | | | 636,270 | |
| | 1,250 | | | GasLog Limited | | | 8.875% | | | | 3/22/22 | | | | N/R | | | | 1,315,625 | |
| | 4,800 | | | Genesis Energy LP | | | 5.750% | | | | 2/15/21 | | | | B+ | | | | 4,788,000 | |
| | 2,910 | | | Martin Mid-Stream Partners LP Finance | | | 7.250% | | | | 2/15/21 | | | | B– | | | | 2,939,100 | |
| | 2,300 | | | NGL Energy Partners LP/Fin Co | | | 6.875% | | | | 10/15/21 | | | | B+ | | | | 2,282,750 | |
| | 3,000 | | | NuStar Logistics LP | | | 4.750% | | | | 2/01/22 | | | | BB+ | | | | 3,030,000 | |
| | 2,979 | | | Oasis Petroleum Inc. | | | 6.875% | | | | 3/15/22 | | | | B+ | | | | 2,889,630 | |
| | 3,250 | | | Peabody Securities Finance Corporation, 144A | | | 6.000% | | | | 3/31/22 | | | | Ba3 | | | | 3,225,625 | |
| | 2,000 | | | Petrobras Global Finance BV | | | 8.375% | | | | 5/23/21 | | | | BB | | | | 2,238,760 | |
| | 750 | | | Petrobras Global Finance BV | | | 6.125% | | | | 1/17/22 | | | | BB | | | | 774,375 | |
| | 3,000 | | | Petrobras International Finance Company | | | 5.375% | | | | 1/27/21 | | | | BB | | | | 3,050,100 | |
| | 869 | | | Rain CII Carbon LLC / CII Carbon Corporation, 144A | | | 8.250% | | | | 1/15/21 | | | | B+ | | | | 905,933 | |
| | 1,450 | | | Range Resources Corporation, 144A | | | 5.750% | | | | 6/01/21 | | | | BB+ | | | | 1,479,000 | |
| | 2,059 | | | Sabine Pass Liquefaction LLC | | | 6.250% | | | | 3/15/22 | | | | BBB– | | | | 2,331,327 | |
| | 4,000 | | | Southwestern Energy Company | | | 4.100% | | | | 3/15/22 | | | | BB | | | | 3,727,500 | |
| | 2,500 | | | Sunoco LP / Sunoco Finance Corp. | | | 6.250% | | | | 4/15/21 | | | | BB– | | | | 2,612,500 | |
| | 570 | | | Teekay Corporation | | | 8.500% | | | | 1/15/20 | | | | B+ | | | | 519,412 | |
| | 2,500 | | | Ultra Resources, Inc., 144A | | | 6.875% | | | | 4/15/22 | | | | BB | | | | 2,481,250 | |
| | 2,750 | | | Whiting Petroleum Corporation | | | 5.750% | | | | 3/15/21 | | | | BB– | | | | 2,585,000 | |
| | 500 | | | Williams Partners LP | | | 3.600% | | | | 3/15/22 | | | | BBB | | | | 510,775 | |
| | 4,000 | | | WPX Energy Inc. | | | 6.000% | | | | 1/15/22 | | | | B+ | | | | 3,960,000 | |
| | 3,000 | | | YPF Sociedad Anonima, 144A | | | 8.500% | | | | 3/23/21 | | | | B | | | | 3,337,020 | |
| | 63,849 | | | Total Oil, Gas & Consumable Fuels | | | | | | | | | | | | | | | 64,691,972 | |
| | | | | |
| | | | Pharmaceuticals – 1.9% | | | | | | | | | | | | |
| | | | | |
| | 5,500 | | | Endo Finance LLC, 144A | | | 5.750% | | | | 1/15/22 | | | | B– | | | | 4,948,900 | |
| | 3,801 | | | Valeant Pharmaceuticals International, 144A | | | 5.625% | | | | 12/01/21 | | | | B– | | | | 3,430,402 | |
| | 2,500 | | | Valeant Pharmaceuticals International, 144A | | | 6.500% | | | | 3/15/22 | | | | BB– | | | | 2,621,875 | |
| | 11,801 | | | Total Pharmaceuticals | | | | | | | | | | | | | | | 11,001,177 | |
| | | | | |
| | | | Professional Services – 0.5% | | | | | | | | | | | | | | | | |
| | | | | |
| | 3,000 | | | Nielsen Finance LLC Co, 144A | | | 5.000% | | | | 4/15/22 | | | | BB+ | | | | 3,112,500 | |
| | | | | |
| | | | Real Estate Management & Development – 3.2% | | | | | | | | | | | | |
| | | | | |
| | 4,750 | | | Crescent Communities LLC, 144A | | | 8.875% | | | | 10/15/21 | | | | B+ | | | | 4,987,500 | |
| | 5,200 | | | Hunt Companies Inc., 144A | | | 9.625% | | | | 3/01/21 | | | | N/R | | | | 5,486,000 | |
| | 7,515 | | | Mattamy Group Corporation, 144A | | | 6.500% | | | | 11/15/20 | | | | BB | | | | 7,665,300 | |
| | 17,465 | | | Total Real Estate Management & Development | | | | | | | | | | | | | | | 18,138,800 | |
| | | | | |
| | | | Road & Rail – 0.8% | | | | | | | | | | | | |
| | | | | |
| | 4,500 | | | The Hertz Corporation | | | 7.375% | | | | 1/15/21 | | | | B– | | | | 4,342,500 | |
| | | | | |
| | | | Semiconductors & Semiconductor Equipment – 0.4% | | | | | | | | | | | | |
| | | | | |
| | 2,000 | | | Micron Technology, Inc. | | | 5.875% | | | | 2/15/22 | | | | BB | | | | 2,092,500 | |
| | | | | |
| | | | Software – 0.7% | | | | | | | | | | | | |
| | | | | |
| | 4,000 | | | SixSigma Networks Mexico SA de CV, 144A | | | 8.250% | | | | 11/07/21 | | | | B+ | | | | 4,015,000 | |
| | | | | |
| | | | Specialty Retail – 2.0% | | | | | | | | | | | | |
| | | | | |
| | 7,000 | | | GameStop Corporation, 144A | | | 6.750% | | | | 3/15/21 | | | | Ba1 | | | | 7,273,000 | |
| | 3,500 | | | Gap, Inc. | | | 5.950% | | | | 4/12/21 | | | | Baa2 | | | | 3,793,577 | |
| | 10,500 | | | Total Specialty Retail | | | | | | | | | | | | | | | 11,066,577 | |
| | | | |
| JHB | | Nuveen High Income November 2021 Target Term Fund |
| | Portfolio of Investments (continued) | | June 30, 2017 (Unaudited) |
| | | | | | | | | | | | | | | | | | | | |
Principal
Amount (000) | | | Description (1) | | Coupon | | | Maturity | | | Ratings (2) | | | Value | |
| | | | | |
| | | | Technology Hardware, Storage & Peripherals – 1.5% | | | | | | | | | | | | |
| | | | | |
| $ | 6,000 | | | Diamond 1 Finance Corporation / Diamond 2 Finance Corporation, 144A | | | 5.875% | | | | 6/15/21 | | | | BB+ | | | $ | 6,285,000 | |
| | | | | |
| | 2,100 | | | NCR Corporation | | | 5.875% | | | | 12/15/21 | | | | BB | | | | 2,184,000 | |
| | 8,100 | | | Total Technology Hardware, Storage & Peripherals | | | | | | | | | | | | | | | 8,469,000 | |
| | | | | |
| | | | Thrifts & Mortgage Finance – 0.3% | | | | | | | | | | | | |
| | | | | |
| | 1,500 | | | Radian Group Inc. | | | 7.000% | | | | 3/15/21 | | | | BB | | | | 1,678,125 | |
| | | | | |
| | | | Tobacco – 0.2% | | | | | | | | | | | | |
| | | | | |
| | 1,000 | | | Alliance One International Inc., 144A | | | 8.500% | | | | 4/15/21 | | | | B1 | | | | 1,042,500 | |
| | | | | |
| | | | Trading Companies & Distributors – 1.5% | | | | | | | | | | | | |
| | | | | |
| | 3,328 | | | Aircastle Limited | | | 5.500% | | | | 2/15/22 | | | | BB+ | | | | 3,627,520 | |
| | 4,750 | | | Avation Capital SA, 144A | | | 7.500% | | | | 5/27/20 | | | | B+ | | | | 4,773,750 | |
| | 8,078 | | | Total Trading Companies & Distributors | | | | | | | | | | | | | | | 8,401,270 | |
| | | | | |
| | | | Transportation Infrastructure – 0.5% | | | | | | | | | | | | |
| | | | | |
| | 3,000 | | | Navigator Holdings Limited | | | 7.750% | | | | 2/10/21 | | | | N/R | | | | 2,985,000 | |
| | | | | |
| | | | Wireless Telecommunication Services – 6.7% | | | | | | | | | | | | |
| | | | | |
| | 4,000 | | | Altice Financing SA, 144A | | | 6.500% | | | | 1/15/22 | | | | BB– | | | | 4,180,000 | |
| | 4,700 | | | Digicel Limited, 144A | | | 6.000% | | | | 4/15/21 | | | | B1 | | | | 4,506,125 | |
| | 6,675 | | | Hughes Satellite Systems Corporation | | | 7.625% | | | | 6/15/21 | | | | BB– | | | | 7,584,469 | |
| | 3,750 | | | Millicom International Cellular SA, 144A | | | 6.625% | | | | 10/15/21 | | | | BB+ | | | | 3,900,000 | |
| | 3,500 | | | Softbank Corporation, 144A | | | 4.500% | | | | 4/15/20 | | | | BB+ | | | | 3,638,565 | |
| | 4,875 | | | Sprint Corporation | | | 7.250% | | | | 9/15/21 | | | | B+ | | | | 5,417,344 | |
| | 2,440 | | | Wind Acquisition Finance SA, 144A | | | 4.750% | | | | 7/15/20 | | | | BB | | | | 2,465,620 | |
| | 6,040 | | | Wind Acquisition Finance SA, 144A | | | 7.375% | | | | 4/23/21 | | | | B | | | | 6,281,600 | |
| | 35,980 | | | Total Wireless Telecommunication Services | | | | | | | | | | | | | | | 37,973,723 | |
| $ | 709,414 | | | Total Corporate Bonds (cost $720,093,406) | | | | | | | | | | | | | | | 733,321,815 | |
| | | | | |
Principal
Amount (000) | | | Description (1) | | Coupon | | | Maturity | | | Ratings (2) | | | Value | |
| | | | | |
| | | | CONVERTIBLE BONDS – 0.7% (0.6% of Total Investments) | | | | | | | | | | | | | | | | |
| | | | | |
| | | | Independent Power & Renewable Electricity Producers – 0.7% | | | | | | | | | | | | |
| | | | | |
| $ | 4,000 | | | NRG Yield Inc., 144A | | | 3.250% | | | | 6/01/20 | | | | N/R | | | $ | 4,012,500 | |
| $ | 4,000 | | | Total Convertible Bonds (cost $3,909,747) | | | | | | | | | | | | | | | 4,012,500 | |
| | | | | |
Principal
Amount (000) | | | Description (1) | | Coupon | | | Maturity | | | Ratings (2) | | | Value | |
| | | | | |
| | | | SOVEREIGN DEBT – 0.6% (0.4% of Total Investments) | | | | | | | | | | | | | | | | |
| | | | | |
| | | | Argentina – 0.6% | | | | | | | | | | | | |
| | | | | |
| $ | 3,000 | | | Republic of Argentina | | | 6.875% | | | | 4/22/21 | | | | B | | | $ | 3,214,500 | |
| $ | 3,000 | | | Total Sovereign Debt (cost $3,239,192) | | | | | | | | | | | | | | | 3,214,500 | |
| | | | Total Long-Term Investments (cost $727,242,345) | | | | | | | | | | | | | | | 740,548,815 | |
| | | | Borrowings – (33.4)% (3), (4) | | | | | | | | | | | | | | | (190,000,000 | ) |
| | | | Other Assets Less Liabilities – 3.0% | | | | | | | | | | | | | | | 17,208,390 | |
| | | | Net Assets – 100% | | | | | | | | | | | | | | $ | 567,757,205 | |
For Fund portfolio compliance purposes, the Fund’s industry classifications refer to any one or more of the industry sub-classifications used by one or more widely recognized market indexes or ratings group indexes, and/or as defined by Fund management. This definition may not apply for purposes of this report, which may combine industry sub-classifications into sectors for reporting ease.
| (1) | All percentages shown in the Portfolio of Investments are based on net assets unless otherwise noted. |
| (2) | For financial reporting purposes, the ratings disclosed are the highest of Standard & Poor’s Group (“Standard & Poor’s”), Moody’s Investors Service, Inc. (“Moody’s”) or Fitch, Inc. (“Fitch”) rating. This treatment of split-rated securities may differ from that used for other purposes, such as for Fund investment policies. Ratings below BBB by Standard & Poor’s, Baa by Moody’s or BBB by Fitch are considered to be below investment grade. Holdings designated N/R are not rated by any of these national rating agencies. |
| (3) | Borrowings as a percentage of Total Investments is 25.7%. |
| (4) | The Fund may pledge up to 100% of its eligible investments (excluding any investments separately pledged as collateral for specific investments in derivatives) in the Portfolio of Investments as collateral for borrowings. |
| 144A | Investment is exempt from registration under Rule 144A of the Securities Act of 1933, as amended. These investments may only be resold in transactions exempt from registration, which are normally those transactions with qualified institutional buyers. |
See accompanying notes to financial statements.
| | | | | | |
Statement of Assets and Liabilities | | June 30, 2017 (Unaudited) |
| | | | | | | | | | | | | | | | |
| | | JHY | | | JHD | | | JHA | | | JHB | |
Assets | | | | | | | | | | | | | | | | |
Long-term investments, at value (cost $181,069,147, $354,478,298, $370,087,554 and $727,242,345, respectively) | | $ | 182,901,192 | | | $ | 362,873,958 | | | $ | 376,464,528 | | | $ | 740,548,815 | |
Short-term investments, at value (cost approximates value) | | | 3,036,637 | | | | 418,204 | | | | 6,460,176 | | | | — | |
Cash | | | 200,594 | | | | — | | | | — | | | | 4,958,695 | |
Receivable for: | | | | | | | | | | | | | | | | |
Interest | | | 3,151,754 | | | | 4,648,146 | | | | 5,058,094 | | | | 11,959,931 | |
Investments sold | | | 1,940,085 | | | | 2,647,061 | | | | 2,885,364 | | | | 4,817,651 | |
Shares sold | | | 103,652 | | | | — | | | | — | | | | — | |
Deferred offering costs | | | 165,132 | | | | — | | | | — | | | | — | |
Other assets | | | 5,026 | | | | 8,169 | | | | 12,696 | | | | 16,463 | |
Total assets | | | 191,504,072 | | | | 370,595,538 | | | | 390,880,858 | | | | 762,301,555 | |
Liabilities | | | | | | | | | | | | | | | | |
Borrowings | | | 44,000,000 | | | | 90,000,000 | | | | 92,000,000 | | | | 190,000,000 | |
Payable for: | | | | | | | | | | | | | | | | |
Dividends | | | 690,913 | | | | 1,328,132 | | | | 1,151,559 | | | | 2,725,023 | |
Investments purchased | | | — | | | | 148,776 | | | | — | | | | 1,031,250 | |
Accrued expenses: | | | | | | | | | | | | | | | | |
Interest on borrowings | | | 2,071 | | | | 83,938 | | | | 74,009 | | | | 260,271 | |
Management fees | | | 103,168 | | | | 200,376 | | | | 211,579 | | | | 409,132 | |
Trustees fees | | | 2,210 | | | | 6,115 | | | | 9,069 | | | | 11,775 | |
Other | | | 52,757 | | | | 73,612 | | | | 77,774 | | | | 106,899 | |
Total liabilities | | | 44,851,119 | | | | 91,840,949 | | | | 93,523,990 | | | | 194,544,350 | |
Net assets | | $ | 146,652,953 | | | $ | 278,754,589 | | | $ | 297,356,868 | | | $ | 567,757,205 | |
Shares outstanding | | | 14,769,631 | | | | 27,064,130 | | | | 29,344,966 | | | | 55,871,646 | |
Net asset value (“NAV”) per share outstanding | | $ | 9.93 | | | $ | 10.30 | | | $ | 10.13 | | | $ | 10.16 | |
Net assets consist of: | | | | | | | | | | | | | | | | |
Shares, $.01 par value per share | | $ | 147,696 | | | $ | 270,641 | | | $ | 293,450 | | | $ | 558,716 | |
Paid-in surplus | | | 145,077,888 | | | | 265,959,733 | | | | 288,380,850 | | | | 548,971,648 | |
Undistributed (Over-distribution of) net investment income | | | 743,141 | | | | 2,978,676 | | | | 2,168,152 | | | | 2,404,265 | |
Accumulated net realized gain (loss) | | | (1,147,817 | ) | | | 1,149,879 | | | | 137,442 | | | | 2,516,106 | |
Net unrealized appreciation (depreciation) | | | 1,832,045 | | | | 8,395,660 | | | | 6,376,974 | | | | 13,306,470 | |
Net assets | | $ | 146,652,953 | | | $ | 278,754,589 | | | $ | 297,356,868 | | | $ | 567,757,205 | |
Authorized shares | | | Unlimited | | | | Unlimited | | | | Unlimited | | | | Unlimited | |
See accompanying notes to financial statements.
| | | | | | | | |
Statement of Operations | | | Six Months Ended June 30, 2017 (Unaudited) | |
| | | | | | | | | | | | | | | | |
| | | JHY | | | JHD | | | JHA | | | JHB | |
Investment Income | | $ | 5,697,977 | | | $ | 10,375,459 | | | $ | 9,714,888 | | | $ | 22,438,166 | |
Expenses | | | | | | | | | | | | | | | | |
Management fees | | | 602,066 | | | | 1,205,984 | | | | 1,276,598 | | | | 2,453,679 | |
Interest expense on borrowings | | | 342,288 | | | | 741,227 | | | | 716,555 | | | | 1,624,127 | |
Custodian fees | | | 23,953 | | | | 33,372 | | | | 31,778 | | | | 43,491 | |
Trustees fees | | | 2,751 | | | | 6,537 | | | | 5,969 | | | | 11,967 | |
Professional fees | | | 22,594 | | | | 20,689 | | | | 23,770 | | | | 76,314 | |
Shareholder reporting expenses | | | 14,841 | | | | 16,071 | | | | 27,431 | | | | 20,006 | |
Shareholder servicing agent fees | | | 103 | | | | 89 | | | | 88 | | | | 96 | |
Stock exchange listing fees | | | 6,003 | | | | 3,844 | | | | 4,183 | | | | 7,906 | |
Investor relations expenses | | | 9,188 | | | | 20,931 | | | | 17,830 | | | | 28,411 | |
Other | | | 16,729 | | | | 8,276 | | | | 20,088 | | | | 8,210 | |
Total expenses | | | 1,040,516 | | | | 2,057,020 | | | | 2,124,290 | | | | 4,274,207 | |
Net investment income (loss) | | | 4,657,461 | | | | 8,318,439 | | | | 7,590,598 | | | | 18,163,959 | |
Realized and Unrealized Gain (Loss) | | | | | | | | | | | | | | | | |
Net realized gain (loss) from investments and foreign currency | | | 1,488,011 | | | | 1,066,015 | | | | 424,298 | | | | 2,510,793 | |
Change in net unrealized appreciation (depreciation) of investments and foreign currency | | | 860,817 | | | | 2,772,541 | | | | 1,336,451 | | | | 9,760,863 | |
Net realized and unrealized gain (loss) | | | 2,348,828 | | | | 3,838,556 | | | | 1,760,749 | | | | 12,271,656 | |
Net increase (decrease) in net assets from operations | | $ | 7,006,289 | | | $ | 12,156,995 | | | $ | 9,351,347 | | | $ | 30,435,615 | |
See accompanying notes to financial statements.
| | | | | | |
Statement of Changes in Net Assets | | (Unaudited) |
| | | | | | | | | | | | | | | | | | | | | | | | | | | | | | | | |
| | | JHY | | | JHD | | | JHA | | | JHB | |
| | | Six Months
Ended
6/30/17 | | | Year Ended 12/31/16 | | | Six Months
Ended
6/30/17 | | | Year Ended 12/31/16* | | | Six Months
Ended
6/30/17 | | | Year Ended 12/31/16 | | | Six Months
Ended
6/30/17 | | | Year Ended 12/31/16** | |
Operations | | | | | | | | | | | | | | | | | | | | | | | | | | | | | | | | |
Net investment income (loss) | | $ | 4,657,461 | | | $ | 9,963,956 | | | $ | 8,318,439 | | | $ | 10,093,885 | | | $ | 7,590,598 | | | $ | 17,542,950 | | | $ | 18,163,959 | | | $ | 9,067,538 | |
Net realized gain (loss) from investments and foreign currency | | | 1,488,011 | | | | (729,271 | ) | | | 1,066,015 | | | | 961,623 | | | | 424,298 | | | | 1,228,389 | | | | 2,510,793 | | | | 288,517 | |
Change in net unrealized appreciation (depreciation) of investments and foreign currency | | | 860,817 | | | | 13,893,773 | | | | 2,772,541 | | | | 5,623,119 | | | | 1,336,451 | | | | 12,427,241 | | | | 9,760,863 | | | | 3,545,607 | |
Net increase (decrease) in net assets from operations | | | 7,006,289 | | | | 23,128,458 | | | | 12,156,995 | | | | 16,678,627 | | | | 9,351,347 | | | | 31,198,580 | | | | 30,435,615 | | | | 12,901,662 | |
Distributions to Shareholders | | | | | | | | | | | | | | | | | | | | | | | | | | | | | | | | |
From net investment income | | | (4,601,082 | ) | | | (9,277,194 | ) | | | (8,199,614 | ) | | | (7,234,034 | ) | | | (7,936,033 | ) | | | (16,162,671 | ) | | | (16,760,240 | ) | | | (8,066,992 | ) |
From accumulated net realized gains | | | — | | | | — | | | | — | | | | (963,265 | ) | | | — | | | | (1,603,806 | ) | | | — | | | | (310,956 | ) |
Decrease in net assets from distributions to shareholders | | | (4,601,082 | ) | | | (9,277,194 | ) | | | (8,199,614 | ) | | | (8,197,299 | ) | | | (7,936,033 | ) | | | (17,766,477 | ) | | | (16,760,240 | ) | | | (8,377,948 | ) |
Capital Share Transactions | | | | | | | | | | | | | | | | | | | | | | | | | | | | | | | | |
Proceeds from sale of shares, net of offering costs | | | — | | | | — | | | | — | | | | 266,073,600 | | | | — | | | | — | | | | — | | | | 549,262,636 | |
Proceeds from shelf offering, net of offering costs | | | 10,547,117 | | | | — | | | | — | | | | — | | | | — | | | | — | | | | — | | | | — | |
Proceeds from shares issued to shareholders due to reinvestment of distributions | | | 179,207 | | | | 303,481 | | | | 41,646 | | | | 100,062 | | | | 155,272 | | | | 195,017 | | | | 170,209 | | | | 24,998 | |
Net increase (decrease) in net assets from capital share transactions | | | 10,726,324 | | | | 303,481 | | | | 41,646 | | | | 266,173,662 | | | | 155,272 | | | | 195,017 | | | | 170,209 | | | | 549,287,634 | |
Net increase (decrease) in net assets | | | 13,131,531 | | | | 14,154,745 | | | | 3,999,027 | | | | 274,654,990 | | | | 1,570,586 | | | | 13,627,120 | | | | 13,845,584 | | | | 553,811,348 | |
Net assets at the beginning of period | | | 133,521,422 | | | | 119,366,677 | | | | 274,755,562 | | | | 100,572 | | | | 295,786,282 | | | | 282,159,162 | | | | 553,911,621 | | | | 100,273 | |
Net assets at the end of period | | $ | 146,652,953 | | | $ | 133,521,422 | | | $ | 278,754,589 | | | $ | 274,755,562 | | | $ | 297,356,868 | | | $ | 295,786,282 | | | $ | 567,757,205 | | | $ | 553,911,621 | |
Undistributed (Over-distribution of) net investment income at the end of period | | $ | 743,141 | | | $ | 686,762 | | | $ | 2,978,676 | | | $ | 2,859,851 | | | $ | 2,168,152 | | | $ | 2,513,587 | | | $ | 2,404,265 | | | $ | 1,000,546 | |
| * | For the period May 10, 2016 (commencement of operations) through December 31, 2016. |
| ** | For the period August 23, 2016 (commencement of operations) through December 31, 2016. |
See accompanying notes to financial statements.
| | | | | | |
Statement of Cash Flows | | Six Months Ended June 30, 2017 (Unaudited) |
| | | | | | | | | | | | | | | | |
| | | JHY | | | JHD | | | JHA | | | JHB | |
Cash Flows from Operating Activities: | | | | | | | | | | | | | |
Net Increase (Decrease) In Net Assets from Operations | | $ | 7,006,289 | | | $ | 12,156,995 | | | $ | 9,351,347 | | | $ | 30,435,615 | |
Adjustments to reconcile the net increase (decrease) in net assets from operations to net cash provided by (used in) operating activities: | | | | | | | | | | | | | | | | |
Purchases of investments | | | (96,244,004 | ) | | | (87,736,079 | ) | | | (91,808,730 | ) | | | (140,840,510 | ) |
Proceeds from sales and maturities of investments | | | 86,894,099 | | | | 87,625,582 | | | | 95,729,905 | | | | 137,864,832 | |
Proceeds from (Payments for) short-term investments, net | | | (1,169,501 | ) | | | 481,552 | | | | (6,460,176 | ) | | | — | |
Taxes paid | | | (19,499 | ) | | | (85,506 | ) | | | (44,135 | ) | | | (27,752 | ) |
Amortization (Accretion) of premiums and discounts, net | | | 182,742 | | | | 380,480 | | | | 1,409,579 | | | | 1,298,913 | |
(Increase) Decrease in: | | | | | | | | | | | | | | | | |
Receivable for interest | | | (238,735 | ) | | | 240,176 | | | | 805,126 | | | | (313,150 | ) |
Receivable for investments sold | | | (395,085 | ) | | | (2,647,061 | ) | | | (2,885,364 | ) | | | (4,817,651 | ) |
Other assets | | | (3,826 | ) | | | 33,068 | | | | (7,367 | ) | | | (15,542 | ) |
Increase (Decrease) in: | | | | | | | | | | | | | | | | |
Payable for investments purchased | | | — | | | | 148,776 | | | | — | | | | 1,031,250 | |
Accured interest on borrowings | | | (1,309 | ) | | | 76,838 | | | | 6,542 | | | | 225,356 | |
Accrued management fees | | | 4,022 | | | | (3,634 | ) | | | (5,599 | ) | | | (3,514 | ) |
Accrued Trustees fees | | | 1,208 | | | | 4,134 | | | | 3,407 | | | | 6,613 | |
Accrued other expenses | | | (14,350 | ) | | | (6,929 | ) | | | (3,734 | ) | | | (46,348 | ) |
Net realized (gain) loss from investments and foreign currency | | | (1,488,011 | ) | | | (1,066,015 | ) | | | (424,298 | ) | | | (2,510,793 | ) |
Change in net unrealized (appreciation) depreciation of investments and foreign currency | | | (860,817 | ) | | | (2,772,541 | ) | | | (1,336,451 | ) | | | (9,760,863 | ) |
Net cash provided by (used in) operating activities | | | (6,346,777 | ) | | | 6,829,836 | | | | 4,330,052 | | | | 12,526,456 | |
Cash Flows from Financing Activities: | | | | | | | | | | | | | | | | |
Cash distribution paid to shareholders | | | (3,730,962 | ) | | | (6,829,836 | ) | | | (6,629,202 | ) | | | (13,865,008 | ) |
(Payments for) deferred offering costs | | | (165,132 | ) | | | — | | | | — | | | | — | |
Proceeds from shelf offering, net of offering costs | | | 10,443,465 | | | | — | | | | — | | | | — | |
Net cash provided by (used in) financing activities | | | 6,547,371 | | | | (6,829,836 | ) | | | (6,629,202 | ) | | | (13,865,008 | ) |
Net Increase (Decrease) in Cash | | | 200,594 | | | | — | | | | (2,299,150 | ) | | | (1,338,552 | ) |
Cash at the beginning of period | | | — | | | | — | | | | 2,299,150 | | | | 6,297,247 | |
Cash at the end of period | | $ | 200,594 | | | $ | — | | | $ | — | | | $ | 4,958,695 | |
| | | | |
| Supplemental Disclosure of Cash Flow Information | | JHY | | | JHD | | | JHA | | | JHB | |
Cash paid for interest on borrowings (excluding borrowing costs) | | $ | 343,597 | | | $ | 624,936 | | | $ | 710,013 | | | $ | 1,398,771 | |
Non-cash financing activities not included herein consists of reinvestments of share distributions | | | 179,207 | | | | 41,646 | | | | 155,272 | | | | 170,209 | |
See accompanying notes to financial statements.
Financial
Highlights (Unaudited)
Selected data for a share outstanding throughout each period:
| | | | | | | | | | | | | | | | | | | | | | | | | | | | | | | | | | | | | | | | | | | | | | | | |
| | | | | | | | | | | | | | | | | | | | | | |
| | | | | | Investment Operations | | | Less Distributions | | | | | | | | | | | | | |
| | | Beginning
NAV | | | Net
Investment
Income
(Loss)(a) | | | Net
Realized/
Unrealized
Gain (Loss) | | | Total | | | From
Net
Investment
Income | | | From
Accumulated
Net
Realized
Gains | | | Return
of
Capital | | | Total | | | Offering
Costs | | | Premium from Shares
Sold
through Shelf Offering | | | Ending
NAV | | | Ending
Share
Price | |
| |
JHY | | | | | |
Year Ended 12/31: | | | | | | | | | | | | | | | | | | | | | | | | | | | | | | | | | | | | | | | | | |
2017(i) | | $ | 9.75 | | | $ | 0.33 | | | $ | 0.16 | | | $ | 0.49 | | | $ | (0.33 | ) | | $ | — | | | $ | — | | | $ | (0.33 | ) | | $ | — | * | | $ | 0.02 | | | $ | 9.93 | | | $ | 10.09 | |
2016 | | | 8.73 | | | | 0.73 | | | | 0.97 | | | | 1.70 | | | | (0.68 | ) | | | — | | | | — | | | | (0.68 | ) | | | — | | | | — | | | | 9.75 | | | | 10.21 | |
2015(b) | | | 9.85 | | | | 0.28 | | | | (1.09 | ) | | | (0.81 | ) | | | (0.28 | ) | | | — | | | | (0.01 | ) | | | (0.29 | ) | | | (0.02 | ) | | | — | | | | 8.73 | | | | 9.95 | |
| |
JHD | | | | | |
Year Ended 12/31: | | | | | | | | | | | | | | | | | | | | | | | | | | | | | | | | | | | | | | | | | |
2017(i) | | | 10.15 | | | | 0.31 | | | | 0.14 | | | | 0.45 | | | | (0.30 | ) | | | — | | | | — | | | | (0.30 | ) | | | — | | | | — | | | | 10.30 | | | | 10.22 | |
2016(c) | | | 9.86 | | | | 0.38 | | | | 0.23 | | | | 0.61 | | | | (0.27 | ) | | | (0.03 | ) | | | — | | | | (0.30 | ) | | | (0.02 | ) | | | — | | | | 10.15 | | | | 10.10 | |
| |
JHA | | | | | |
Year Ended 12/31: | | | | | | | | | | | | | | | | | | | | | | | | | | | | | | | | | | | | | | | | | |
2017(i) | | | 10.08 | | | | 0.26 | | | | 0.06 | | | | 0.32 | | | | (0.27 | ) | | | — | | | | — | | | | (0.27 | ) | | | — | | | | — | | | | 10.13 | | | | 10.06 | |
2016 | | | 9.63 | | | | 0.60 | | | | 0.46 | | | | 1.06 | | | | (0.55 | ) | | | (0.06 | ) | | | — | | | | (0.61 | ) | | | — | | | | — | | | | 10.08 | | | | 10.06 | |
2015(d) | | | 9.86 | | | | 0.04 | | | | (0.25 | ) | | | (0.21 | ) | | | — | | | | — | | | | — | | | | — | | | | (0.02 | ) | | | — | | | | 9.63 | | | | 10.08 | |
| |
JHB | | | | | |
Year Ended 12/31: | | | | | | | | | | | | | | | | | | | | | | | | | | | | | | | | | | | | | | | | | |
2017(i) | | | 9.92 | | | | 0.33 | | | | 0.21 | | | | 0.54 | | | | (0.30 | ) | | | — | | | | — | | | | (0.30 | ) | | | — | | | | — | | | | 10.16 | | | | 10.11 | |
2016(e) | | | 9.85 | | | | 0.17 | | | | 0.06 | | | | 0.23 | | | | (0.14 | ) | | | (0.01 | ) | | | — | | | | (0.15 | ) | | | (0.01 | ) | | | — | | | | 9.92 | | | | 9.88 | |
| | | | | | | | |
| | | Borrowings at the End of Period | |
| | | Aggregate
Amount
Outstanding
(000) | | | Asset
Coverage
Per $1,000 | |
|
JHY | |
Year Ended 12/31: | |
2017(i) | | $ | 44,000 | | | $ | 4,333 | |
2016 | | | 44,000 | | | | 4,035 | |
2015(b) | | | 44,000 | | | | 3,713 | |
|
JHD | |
Year Ended 12/31: | | | | | | | | |
2017(i) | | | 90,000 | | | | 4,097 | |
2016(c) | | | 90,000 | | | | 4,053 | |
|
JHA | |
Year Ended 12/31: | |
2017(i) | | | 92,000 | | | | 4,232 | |
2016 | | | 92,000 | | | | 4,215 | |
2015(d) | | | 25,000 | | | | 12,286 | |
|
JHB | |
Year Ended 12/31: | |
2017(i) | | | 190,000 | | | | 3,988 | |
2016(e) | | | 190,000 | | | | 3,915 | |
| | | | | | | | | | | | | | | | | | | | | | |
| | | | | | | Ratios/Supplemental Data | |
| Total Returns | | | | | | Ratios to Average Net Assets(g) | | | | |
Based
on
NAV(f) | | | Based
on
Share
Price(f) | | | Ending
Net
Assets
(000) | | | Expenses | | | Net
Investment
Income (Loss) | | | Portfolio
Turnover
Rate(h) | |
| | | | | |
| | | | | | | | | | | | | | | | | | | | | | | |
| | | | | | | | | | | | | | | | | | | | | | |
| | 5.24 | % | | | 2.11 | % | | $ | 146,653 | | | | 1.50 | %** | | | 6.73 | %** | | | 51 | % |
| | 20.15 | | | | 9.94 | | | | 133,521 | | | | 1.50 | | | | 7.91 | | | | 53 | |
| | (8.60 | ) | | | 2.42 | | | | 119,367 | | | | 1.34 | ** | | | 6.97 | ** | | | 11 | |
| | | | | |
| | | | | | | | | | | | | | | | | | | | | | | |
| | | | | | | | | | | | | | | | | | | | | | |
| | 4.50 | | | | 4.22 | | | | 278,755 | | | | 1.49 | ** | | | 6.04 | ** | | | 25 | |
| | 6.07 | | | | 4.06 | | | | 274,756 | | | | 1.31 | ** | | | 5.87 | ** | | | 15 | |
| | | | | |
| | | | | | | | | | | | | | | | | | | | | | | |
| | | | | | | | | | | | | | | | | | | | | | |
| | 3.21 | | | | 2.70 | | | | 297,357 | | | | 1.44 | ** | | | 5.15 | ** | | | 25 | |
| | 11.25 | | | | 6.07 | | | | 295,786 | | | | 1.33 | | | | 6.05 | | | | 34 | |
| | (2.33 | ) | | | 0.80 | | | | 282,159 | | | | 0.89 | ** | | | 3.15 | ** | | | 0 | |
| | | | | |
| | | | | | | | | | | | | | | | | | | | | | | |
| | | | | | | | | | | | | | | | | | | | | | |
| | 5.49 | | | | 5.41 | | | | 567,757 | | | | 1.53 | ** | | | 6.51 | ** | | | 19 | |
| | 2.26 | | | | 0.32 | | | | 553,912 | | | | 1.17 | ** | | | 4.79 | ** | | | 6 | |
| (a) | Per share Net Investment Income (Loss) is calculated using the average daily shares method. |
| (b) | For the period July 28, 2015 (commencement of operations) through December 31, 2015. |
| (c) | For the period May 10, 2016 (commencement of operations) through December 31, 2016. |
| (d) | For the period November 12, 2015 (commencement of operations) through December 31, 2015. |
| (e) | For the period August 23, 2016 (commencement of operations) through December 31, 2016. |
| (f) | Total Return Based on NAV is the combination of changes in NAV, reinvested dividend income at NAV and reinvested capital gains distributions at NAV, if any. The last dividend declared in the period, which is typically paid on the first business day of the following month, is assumed to be reinvested at the ending NAV. The actual reinvest price for the last dividend declared in the period may often be based on the Fund’s market price (and not its NAV), and therefore may be different from the price used in the calculation. Total returns are not annualized. |
Total Return Based on Share Price is the combination of changes in the market price per share and the effect of reinvested dividend income and reinvested capital gains distributions, if any, at the average price paid per share at the time of reinvestment. The last dividend declared in the period, which is typically paid on the first business day of the following month, is assumed to be reinvested at the ending market price. The actual reinvestment for the last dividend declared in the period may take place over several days, and in some instances may not be based on the market price, so the actual reinvestment price may be different from the price used in the calculation. Total returns are not annualized.
| (g) • | Net Investment Income (Loss) ratios reflect income earned and expenses incurred on assets attributable to borrowings (as described in Note 8 – Borrowing Arrangements). |
| | • | Each ratio includes the effect of all interest expense paid and other costs related to borrowings, as follows: |
| | | | | | |
| | | Ratios of Borrowings
Interest Expense
to Average Net Assets | |
JHY | |
Year Ended 12/31: | |
2017(i) | | | 0.49 | %** |
2016 | | | 0.43 | |
2015(b) | | | 0.27 | ** |
| | | | | | |
| | | Ratios of Borrowings
Interest Expense
to Average Net Assets | |
JHD | |
Year Ended 12/31: | |
2017(i) | | | 0.54 | %** |
2016(c) | | | 0.36 | ** |
| | | | | | |
| | | Ratios of Borrowings
Interest Expense
to Average Net Assets | |
JHA | |
Year Ended 12/31: | |
2017(i) | | | 0.49 | %** |
2016 | | | 0.38 | |
2015(d) | | | 0.03 | ** |
| | | | | | |
| | | Ratios of Borrowings
Interest Expense
to Average Net Assets | |
JHB | |
Year Ended 12/31: | |
2017(i) | | | 0.58 | %** |
2016(e) | | | 0.25 | ** |
| (h) | Portfolio Turnover Rate is calculated based on the lesser of long-term purchases or sales (as disclosed in Note 5 – Investment Transactions) divided by the average long-term market value during the period. |
| (i) | For the six months ended June 30, 2017. |
| * | Rounds to less than $0.01 per share. |
See accompanying notes to financial statements.
Notes to
Financial Statements (Unaudited)
1. General Information and Significant Accounting Policies
General Information
Fund Information
The funds covered in this report and their corresponding New York Stock Exchange (“NYSE”) symbols are as follows (each a “Fund” and collectively, the “Funds”):
| | • | | Nuveen High Income 2020 Target Term Fund (JHY) |
| | • | | Nuveen High Income December 2019 Target Term Fund (JHD) |
| | • | | Nuveen High Income December 2018 Target Term Fund (JHA) |
| | • | | Nuveen High Income November 2021 Target Term Fund (JHB) |
The Funds are registered under the Investment Company Act of 1940, as amended, as diversified, closed-end management investment companies. JHY, JHD, JHA and JHB were each organized as a Massachusetts business trust on April 13, 2015, February 10, 2016, July 13, 2015 and July 13, 2015, respectively.
The end of the reporting period for the Funds is June 30, 2017, and the period covered by these Notes to Financial Statements is the six months ended June 30, 2017 (“the current fiscal period”).
Investment Adviser
The Funds’ investment adviser is Nuveen Fund Advisors, LLC (the “Adviser”), a subsidiary of Nuveen, LLC (“Nuveen”). Nuveen is the investment management arm of Teachers Insurance and Annuity Association of America (TIAA). The Adviser has overall responsibility for management of the Funds, oversees the management of the Funds’ portfolios, manages the Funds’ business affairs and provides certain clerical, bookkeeping and other administrative services, and, if necessary, asset allocation decisions. The Adviser has entered into sub-advisory agreements with Nuveen Asset Management, LLC, (the “Sub-Adviser”), a subsidiary of the Adviser, under which the Sub-Adviser manages the investment portfolios of the Funds.
Investment Objectives and Principal Investment Strategies
JHY seeks to provide a high level of current income and return the original $9.85 net asset value (“NAV”) per share on or about November 1, 2020 (the “Termination Date”). JHD seeks to provide a high level of current income and return the original $9.86 NAV per share on or about December 1, 2019 (the “Termination Date”). JHA seeks to provide a high level of current income and return the original $9.86 NAV per share on or about December 1, 2018 (the “Termination Date”). JHB seeks to provide a high level of current income and return the original $9.85 NAV per share on or about November 1, 2021. Under normal market conditions:
| | • | | The Funds invest in at least 80% of their managed assets (as defined in Note 7 – Management Fees and Other Transactions with Affiliates) in corporate debt securities. |
| | • | | The Funds will invest at least 80% of their managed assets in securities that, at the time of investment, are rated below investment grade (those rated BB/Ba or lower) or that are unrated but judged by the Sub-Adviser to be of comparable quality. These securities generally provide high income in an effort to compensate investors for their higher risk of default, which is the failure to make required interest or principal payments. |
| | • | | The Funds will invest no more than 15% of the Funds’ managed asset in securities that, at the time of investment, are rated CCC+/Caa1 or lower, or are unrated but judged by the Sub-Adviser to be of comparable quality. |
| | • | | The Funds may invest up to 30% of their managed assets in securities of non-U.S. issuers, including up to 20% in emerging market issuers. |
| | • | | The Funds may invest up to 10% of their managed assets in non-U.S. dollar denominated securities. |
Each Fund also may invest in certain derivative instruments in pursuit of their investment objectives. Such instruments include financial futures contracts and options thereon, swaps (including interest rate and currency swaps), options on swaps and other derivative instruments. The Sub-Adviser may use derivative instruments to attempt to hedge some of the risk of each Fund’s investments or as a substitute for a position in the underlying asset.
Significant Accounting Policies
Each Fund is an investment company and follows accounting and reporting guidance under Financial Accounting Standards Board (FASB) Accounting Standards Codification (ASC) Topic 946 “Financial Services – Investment Companies.” The following is a summary of significant accounting policies followed by the Funds in the preparation of their financial statements in accordance with U.S. generally accepted accounting principles (“U.S. GAAP”).
Investment Transactions
Investment transactions are recorded on a trade date basis. Realized gains and losses from investment transactions are determined on the specific identification method, which is the same basis used for federal income tax purposes. Investments purchased on a when-issued/delayed delivery basis may have extended settlement periods. Any investments so purchased are subject to market fluctuation during this period. The Funds have earmarked securities in their portfolios with a current value at least equal to the amount of the when-issued/delayed delivery purchase commitments.
As of the end of the reporting period, the Funds did not have any when-issued/delayed delivery purchase commitments.
Investment Income
Interest income, which reflects the amortization of premiums and includes accretion of discounts for financial reporting purposes, is recorded on an accrual basis. Interest income also reflects paydown gains and losses, if any.
Professional Fees
Professional fees presented on the Statement of Operations consist of legal fees incurred in the normal course of operations, audit fees, tax consulting fees and, in some cases, workout expenditures. Workout expenditures are incurred in an attempt to protect or enhance an investment or to pursue other claims or legal actions on behalf of Fund shareholders. If a refund is received for workout expenditures paid in a prior reporting period, such amounts will be recognized as “Legal fee refund” on the Statement of Operations.
Dividends and Distributions to Shareholders
Dividends to shareholders, if any, are declared monthly. Net realized capital gains from investment transactions, if any, are declared and distributed to shareholders at least annually. However, in seeking to achieve its investment objectives, each Fund currently intends to set aside and retain in its net assets (and therefore its NAV) a portion of its net investment income, and possibly all or a portion of its gains. This will reduce the amounts otherwise available for distribution prior to the liquidation of the Funds, and the Funds may incur taxes on such retained amount. Such retained income or gains, net of any taxes, would constitute a portion of the liquidating distribution returned to investors on or about the Termination Date. Furthermore, capital gains are distributed only to the extent they exceed available capital loss carryforwards.
Distributions to shareholders are recorded on the ex-dividend date. The amount and timing of distributions are determined in accordance with federal income tax regulations, which may differ from U.S. GAAP.
Compensation
The Funds pay no compensation directly to those of its trustees who are affiliated with the Adviser or to its officers, all of whom receive remuneration for their services to the Funds from the Adviser or its affiliates. The Funds’ Board of Trustees (the “Board”) has adopted a deferred compensation plan for independent trustees that enables trustees to elect to defer receipt of all or a portion of the annual compensation they are entitled to receive from certain Nuveen-advised funds. Under the plan, deferred amounts are treated as though equal dollar amounts had been invested in shares of select Nuveen-advised funds.
Indemnifications
Under the Funds’ organizational documents, their officers and trustees are indemnified against certain liabilities arising out of the performance of their duties to the Funds. In addition, in the normal course of business, the Funds enter into contracts that provide general indemnifications to other parties. The Funds’ maximum exposure under these arrangements is unknown as this would involve future claims that may be made against the Funds that have not yet occurred. However, the Funds have not had prior claims or losses pursuant to these contracts and expect the risk of loss to be remote.
Netting Agreements
In the ordinary course of business, the Funds may enter into transactions subject to enforceable master repurchase agreements, International Swaps and Derivative Association, Inc. (“ISDA”) master agreements or other similar arrangements (“netting agreements”). Generally, the right to offset in netting agreements allows each Fund to offset certain securities and derivatives with a specific counterparty, when applicable, as well as any collateral received or delivered to that counterparty based on the terms of the agreements. Generally, each Fund manages its cash collateral and securities collateral on a counterparty basis.
The Funds’ investments subject to netting agreements as of the end of the reporting period, if any, are further described in Note 3 – Portfolio Securities and Investments in Derivatives.
Notes to Financial Statements (Unaudited) (continued)
Use of Estimates
The preparation of financial statements in conformity with U.S. GAAP requires management to make estimates and assumptions that affect the reported amounts of assets and liabilities at the date of the financial statements and the reported amounts of increases and decreases in net assets from operations during the current fiscal period. Actual results may differ from those estimates.
2. Investment Valuation and Fair Value Measurements
The fair valuation input levels as described below are for fair value measurement purposes.
Fair value is defined as the price that would be received upon selling an investment or transferring a liability in an orderly transaction to an independent buyer in the principal or most advantageous market for the investment. A three-tier hierarchy is used to maximize the use of observable market data and minimize the use of unobservable inputs and to establish classification of fair value measurements for disclosure purposes. Observable inputs reflect the assumptions market participants would use in pricing the asset or liability. Observable inputs are based on market data obtained from sources independent of the reporting entity. Unobservable inputs reflect the reporting entity’s own assumptions about the assumptions market participants would use in pricing the asset or liability. Unobservable inputs are based on the best information available in the circumstances. The following is a summary of the three-tiered hierarchy of valuation input levels.
| | |
| Level 1 – | | Inputs are unadjusted and prices are determined using quoted prices in active markets for identical securities. |
| Level 2 – | | Prices are determined using other significant observable inputs (including quoted prices for similar securities, interest rates, prepayment speeds, credit risk, etc.). |
| Level 3 – | | Prices are determined using significant unobservable inputs (including management’s assumptions in determining the fair value of investments). |
Prices of fixed-income securities are provided by an independent pricing service (“pricing service”) approved by the Board. The pricing service establishes a security’s fair value using methods that may include consideration of the following: yields or prices of investments of comparable quality, type of issue, coupon, maturity and rating, market quotes or indications of value from security dealers, evaluations of anticipated cash flows or collateral, general market conditions and other information and analysis, including the obligor’s credit characteristics considered relevant. These securities are generally classified as Level 2. In pricing certain securities, particularly less liquid and lower quality securities, the pricing service may consider information about a security, its issuer or market activity, provided by the Adviser. These securities are generally classified as Level 2 or Level 3 depending on the observability of the significant inputs.
Repurchase agreements are valued at contract amount plus accrued interest, which approximates market value. These securities are generally classified as Level 2.
Investments initially valued in currencies other than the U.S. dollar are converted to the U.S. dollar using exchange rates obtained from pricing services. As a result, the NAV of the Funds’ shares may be affected by changes in the value of currencies in relation to the U.S. dollar. The value of securities traded in markets outside the United States or denominated in currencies other than the U.S. dollar may be affected significantly on a day that the NYSE is closed and an investor is not able to purchase, redeem or exchange shares. If significant market events occur between the time of determination of the closing price of a foreign security on an exchange and the time that the Funds’ NAV is determined, or if under the Funds’ procedures, the closing price of a foreign security is not deemed to be reliable, the security would be valued at fair value as determined in accordance with procedures established in good faith by the Board. These securities are generally classified as Level 2 or Level 3 depending on the observability of the significant inputs.
Certain securities may not be able to be priced by the pre-established pricing methods as described above. Such securities may be valued by the Board and/or its appointee at fair value. These securities generally include, but are not limited to, restricted securities (securities which may not be publicly sold without registration under the Securities Act of 1933, as amended) for which a pricing service is unable to provide a market price; securities whose trading has been formally suspended; debt securities that have gone into default and for which there is no current market quotation; a security whose market price is not available from a pre-established pricing source; a security with respect to which an event has occurred that is likely to materially affect the value of the security after the market has closed but before the calculation of a Fund’s NAV (as may be the case in non-U.S. markets on which the security is primarily traded) or make it difficult or impossible to obtain a reliable market quotation; and a security whose price, as provided by the pricing service, is not deemed to reflect the security’s fair value. As a general principle, the fair value of a security would appear to be the amount that the owner might reasonably expect to receive for it in a current sale. A variety of factors may be considered in determining the fair value of such securities, which may include consideration of the following: yields or prices of investments of comparable quality, type of issue, coupon, maturity and rating, market quotes or indications of value from security dealers, evaluations of anticipated cash flows or collateral, general market conditions and other information and analysis, including the obligor’s credit characteristics considered relevant. These securities are generally classified as Level 2 or Level 3 depending on the observability of the significant inputs. Regardless of the method employed to value a particular security, all valuations are subject to review by the Board and/or its appointee.
The inputs or methodologies used for valuing securities are not an indication of the risks associated with investing in those securities. The following is a summary of each Fund’s fair value measurements as of the end of the reporting period:
| | | | | | | | | | | | | | | | |
| JHY | | Level 1 | | | Level 2 | | | Level 3 | | | Total | |
Long-Term Investments*: | | | | | | | | | | | | | | | | |
Corporate Bonds | | $ | — | | | $ | 177,583,987 | | | $ | — | | | $ | 177,583,987 | |
Convertible Bonds | | | — | | | | 3,453,438 | | | | — | | | | 3,453,438 | |
Sovereign Debt | | | — | | | | 1,863,767 | | | | — | | | | 1,863,767 | |
| | | | |
Short-Term Investments: | | | | | | | | | | | | | | | | |
Repurchase Agreements | | | — | | | | 3,036,637 | | | | — | | | | 3,036,637 | |
Total | | $ | — | | | $ | 185,937,829 | | | $ | — | | | $ | 185,937,829 | |
| JHD | | | | | | | | | | | | |
Long-Term Investments*: | | | | | | | | | | | | | | | | |
Corporate Bonds | | $ | — | | | $ | 350,447,141 | | | $ | — | | | $ | 350,447,141 | |
Convertible Bonds | | | — | | | | 7,478,438 | | | | — | | | | 7,478,438 | |
Sovereign Debt | | | — | | | | 4,948,379 | | | | — | | | | 4,948,379 | |
| | | | |
Short-Term Investments: | | | | | | | | | | | | | | | | |
Repurchase Agreements | | | — | | | | 418,204 | | | | — | | | | 418,204 | |
Total | | $ | — | | | $ | 363,292,162 | | | $ | — | | | $ | 363,292,162 | |
| JHA | | | | | | | | | | | | |
Long-Term Investments*: | | | | | | | | | | | | | | | | |
Corporate Bonds | | $ | — | | | $ | 348,965,507 | | | $ | — | | | $ | 348,965,507 | |
Convertible Bonds | | | — | | | | 18,526,844 | | | | — | | | | 18,526,844 | |
Sovereign Debt | | | — | | | | 8,972,177 | | | | — | | | | 8,972,177 | |
| | | | |
Short-Term Investments: | | | | | | | | | | | | | | | | |
Repurchase Agreements | | | — | | | | 6,460,176 | | | | — | | | | 6,460,176 | |
Total | | $ | — | | | $ | 382,924,704 | | | $ | — | | | $ | 382,924,704 | |
| JHB | | | | | | | | | | | | |
Long-Term Investments*: | | | | | | | | | | | | | | | | |
Corporate Bonds | | $ | — | | | $ | 733,321,815 | | | $ | — | | | $ | 733,321,815 | |
Convertible Bonds | | | — | | | | 4,012,500 | | | | — | | | | 4,012,500 | |
Sovereign Debt | | | — | | | | 3,214,500 | | | | — | | | | 3,214,500 | |
Total | | $ | — | | | $ | 740,548,815 | | | $ | — | | | $ | 740,548,815 | |
| * | Refer to the Fund’s Portfolio of Investments for industry and country classifications, where applicable. |
The Board is responsible for the valuation process and has appointed the oversight of the daily valuation process to the Adviser’s Valuation Committee. The Valuation Committee, pursuant to the valuation policies and procedures adopted by the Board, is responsible for making fair value determinations, evaluating the effectiveness of the Funds’ pricing policies and reporting to the Board. The Valuation Committee is aided in its efforts by the Adviser’s dedicated Securities Valuation Team, which is responsible for administering the daily valuation process and applying fair value methodologies as approved by the Valuation Committee. When determining the reliability of independent pricing services for investments owned by the Funds, the Valuation Committee, among other things, conducts due diligence reviews of the pricing services and monitors the quality of security prices received through various testing reports conducted by the Securities Valuation Team.
The Valuation Committee will consider pricing methodologies it deems relevant and appropriate when making a fair value determination, based on the facts and circumstances specific to the portfolio instrument. Fair value determinations generally will be derived as follows, using public or private market information:
| | (i) | If available, fair value determinations shall be derived by extrapolating from recent transactions or quoted prices for identical or comparable securities. |
| | (ii) | If such information is not available, an analytical valuation methodology may be used based on other available information including, but not limited to: analyst appraisals, research reports, corporate action information, issuer financial statements and shelf registration statements. Such analytical valuation methodologies may include, but are not limited to: multiple of earnings, discount from market value of a similar freely-traded security, discounted cash flow analysis, book value or a multiple thereof, risk premium/yield analysis, yield to maturity and/or fundamental investment analysis. |
The purchase price of a portfolio instrument will be used to fair value the instrument only if no other valuation methodology is available or deemed appropriate, and it is determined that the purchase price fairly reflects the instrument’s current value.
Notes to Financial Statements (Unaudited) (continued)
For each portfolio security that has been fair valued pursuant to the policies adopted by the Board, the fair value price is compared against the last available and next available market quotations. The Valuation Committee reviews the results of such testing and fair valuation occurrences are reported to the Board.
3. Portfolio Securities and Investments in Derivatives
Portfolio Securities
Foreign Currency Transactions
To the extent that the Funds may invest in securities and/or contracts that are denominated in a currency other than U.S. dollars, the Funds will be subject to currency risk, which is the risk that an increase in the U.S. dollar relative to the foreign currency will reduce returns or portfolio value. Generally, when the U.S. dollar rises in value against a foreign currency, the Funds’ investments denominated in that currency will lose value because their currency is worth fewer U.S. dollars; the opposite effect occurs if the U.S. dollar falls in relative value. Investments and other assets and liabilities denominated in foreign currencies are converted into U.S. dollars on a spot (i.e. cash) basis at the spot rate prevailing in the foreign currency exchange market at the time of valuation. Purchases and sales of investments and income denominated in foreign currencies are translated into U.S. dollars on the respective dates of such transactions.
As of the end of the reporting period, the Funds’ investments in non-U.S. securities were as follows:
| | | | | | | | |
| JHY | | Value | | | % of Total
Investments | |
Country: | | | | | | | | |
Canada | | $ | 14,045,530 | | | | 7.6 | % |
Japan | | | 4,798,975 | | | | 2.6 | |
Bermuda | | | 4,312,765 | | | | 2.3 | |
United Kingdom | | | 4,263,700 | | | | 2.3 | |
Luxembourg | | | 3,635,375 | | | | 2.0 | |
Brazil | | | 3,100,141 | | | | 1.7 | |
Argentina | | | 2,858,633 | | | | 1.5 | |
Hong Kong | | | 2,637,500 | | | | 1.4 | |
Netherlands | | | 2,120,000 | | | | 1.1 | |
Other | | | 6,730,745 | | | | 3.6 | |
Total non-U.S. securities | | $ | 48,503,364 | | | | 26.1 | % |
| JHD | | | | | | |
Country: | | | | | | | | |
Canada | | $ | 16,634,291 | | | | 4.6 | % |
United Kingdom | | | 14,017,369 | | | | 3.9 | |
Luxembourg | | | 13,610,143 | | | | 3.7 | |
Brazil | | | 11,918,300 | | | | 3.3 | |
Japan | | | 6,751,751 | | | | 1.9 | |
Germany | | | 4,721,738 | | | | 1.3 | |
Hong Kong | | | 4,220,000 | | | | 1.2 | |
Ireland | | | 4,176,859 | | | | 1.1 | |
Australia | | | 4,025,813 | | | | 1.1 | |
Other | | | 16,298,475 | | | | 4.4 | |
Total non-U.S. securities | | $ | 96,374,739 | | | | 26.5 | % |
| JHA | | | | | | |
Country: | | | | | | | | |
Canada | | $ | 17,184,511 | | | | 4.5 | % |
United Kingdom | | | 10,009,842 | | | | 2.6 | |
Brazil | | | 9,914,400 | | | | 2.6 | |
Japan | | | 7,597,170 | | | | 2.0 | |
Luxembourg | | | 7,554,650 | | | | 2.0 | |
Ireland | | | 7,385,916 | | | | 1.9 | |
India | | | 6,621,875 | | | | 1.7 | |
Netherlands | | | 5,075,000 | | | | 1.3 | |
Germany | | | 4,607,303 | | | | 1.2 | |
Other | | | 12,443,352 | | | | 3.3 | |
Total non-U.S. securities | | $ | 88,394,019 | | | | 23.1 | % |
| | | | | | | | |
| JHB | | Value | | | % of Total
Investments | |
Country: | | | | | | | | |
Canada | | $ | 39,039,293 | | | | 5.3 | % |
Luxembourg | | | 37,157,533 | | | | 5.0 | |
United Kingdom | | | 21,979,438 | | | | 3.0 | |
Netherlands | | | 11,438,495 | | | | 1.5 | |
Japan | | | 10,166,599 | | | | 1.4 | |
Australia | | | 8,582,813 | | | | 1.2 | |
Brazil | | | 8,295,920 | | | | 1.1 | |
Mexico | | | 7,191,250 | | | | 1.0 | |
Ireland | | | 6,790,656 | | | | 0.9 | |
Other | | | 36,538,858 | | | | 4.9 | |
Total non-U.S. securities | | $ | 187,180,855 | | | | 25.3 | % |
The books and records of the Funds are maintained in U.S. dollars. Foreign currencies, assets and liabilities are translated into U.S. dollars at 4:00 p.m. Eastern Time. Investment transactions, income and expenses are translated on the respective dates of such transactions. Net realized foreign currency gains and losses resulting from changes in exchange rates include foreign currency gains and losses between trade date and settlement date of the transactions, foreign currency transactions and the difference between the amounts of interest and dividends recorded on the books of a Fund and the amounts actually received.
The realized gains and losses resulting from changes in foreign currency exchange rates and changes in foreign exchange rates associated with (i) foreign currency, (ii) investments, (iii) investments in derivatives and (iv) other assets and liabilities are recognized as a component of “Net realized gain (loss) from investments and foreign currency” on the Statement of Operations, when applicable.
The unrealized gains and losses resulting from changes in foreign currency exchange rates and changes in foreign exchange rates associated with (i) investments and (ii) other assets and liabilities are recognized as a component of “Change in net unrealized appreciation (depreciation) of investments and foreign currency” on the Statement of Operations, when applicable. The unrealized gains and losses resulting from changes in foreign exchange rates associated with investments in derivatives are recognized as a component of the respective derivative’s related “Change in net unrealized appreciation (depreciation)” on the Statement of Operations, when applicable.
Repurchase Agreements
In connection with transactions in repurchase agreements, it is each Fund’s policy that its custodian take possession of the underlying collateral securities, the fair value of which exceeds the principal amount of the repurchase transaction, including accrued interest, at all times. If the counterparty defaults, and the fair value of the collateral declines, realization of the collateral may be delayed or limited.
The following table presents the repurchase agreements for the Funds that are subject to netting agreements as of the end of the reporting period, and the collateral delivered related to those repurchase agreements.
| | | | | | | | | | | | | | |
| Fund | | Counterparty | | Short-Term
Investments, at Value | | | Collateral
Pledged (From)
Counterparty* | | | Net
Exposure | |
JHY | | Fixed Income Clearing Corporation | | $ | 3,036,637 | | | $ | (3,036,637 | ) | | $ | — | |
JHD | | Fixed Income Clearing Corporation | | | 418,204 | | | | (418,204 | ) | | | — | |
| JHA | | Fixed Income Clearing Corporation | | | 6,460,176 | | | | (6,460,176 | ) | | | — | |
| * | As of the end of the reporting period, the value of the collateral pledged from the counterparty exceeded the value of the repurchase agreements. Refer to the Fund’s Portfolio of Investments for details on the repurchase agreements. |
Zero Coupon Securities
A zero coupon security does not pay a regular interest coupon to its holders during the life of the security. Income to the holder of the security comes from accretion of the difference between the original purchase price of the security at issuance and the par value of the security at maturity and is effectively paid at maturity. The market prices of zero coupon securities generally are more volatile than the market prices of securities that pay interest periodically.
Investments in Derivatives
Each Fund is authorized to invest in certain derivative instruments such as futures, options and swap contracts. Each Fund limits its investments in futures, options on futures and swap contracts to the extent necessary for the Adviser to claim the exclusion from registration by the Commodity Futures Trading Commission as a commodity pool operator with respect to the Fund. The Funds record derivative instruments at fair value, with changes in fair value
Notes to Financial Statements (Unaudited) (continued)
recognized on the Statement of Operations, when applicable. Even though the Funds’ investments in derivatives may represent economic hedges, they are not considered to be hedge transactions for financial reporting purposes.
Although the Funds are authorized to invest in derivative instruments, and may do so in the future, they did not make any such investments during the current fiscal period.
Market and Counterparty Credit Risk
In the normal course of business each Fund may invest in financial instruments and enter into financial transactions where risk of potential loss exists due to changes in the market (market risk) or failure of the other party to the transaction to perform (counterparty credit risk). The potential loss could exceed the value of the financial assets recorded on the financial statements. Financial assets, which potentially expose each Fund to counterparty credit risk, consist principally of cash due from counterparties on forward, option and swap transactions, when applicable. The extent of each Fund’s exposure to counterparty credit risk in respect to these financial assets approximates their carrying value as recorded on the Statement of Assets and Liabilities.
Each Fund helps manage counterparty credit risk by entering into agreements only with counterparties the Adviser believes have the financial resources to honor their obligations and by having the Adviser monitor the financial stability of the counterparties. Additionally, counterparties may be required to pledge collateral daily (based on the daily valuation of the financial asset) on behalf of each Fund with a value approximately equal to the amount of any unrealized gain above a pre-determined threshold. Reciprocally, when each Fund has an unrealized loss, the Funds have instructed the custodian to pledge assets of the Funds as collateral with a value approximately equal to the amount of the unrealized loss above a pre-determined threshold. Collateral pledges are monitored and subsequently adjusted if and when the valuations fluctuate, either up or down, by at least the pre-determined threshold amount.
4. Fund Shares
Equity Shelf Programs and Offering Costs
JHY has filed a registration statement with the Securities and Exchange Commission (“SEC”) authorizing the Fund to issue additional shares through one or more equity shelf programs (“Shelf Offering”), which became effective with the SEC during the current fiscal period.
Under this Shelf Offering, the Fund, subject to market conditions, may raise additional equity capital by issuing additional shares from time to time in varying amounts and by different offering methods at a net price at or above the Fund’s NAV per share. In the event the Fund’s Shelf Offering registration statement is no longer current, the Fund may not issue additional shares until a post-effective amendment to the registration statement has been filed with the SEC.
Additional authorized shares, shares sold and offering proceeds, net of offering costs under the Fund’s Shelf Offering during the Fund’s current fiscal period were as follows:
| | | | |
| | | JHY | |
| | | Six Months
Ended
6/30/17* | |
Additional authorized shares | | | 3,400,000 | |
Shares sold | | | 1,054,058 | |
Offering proceeds, net of offering costs | | $ | 10,547,117 | |
| * | Represents additional authorized shares for the period February 2, 2017 (effective date) through June 30, 2017. |
Costs incurred by the Fund in connection with its Shelf Offering were recorded as a deferred charge and recognized as a component of “Deferred offering costs” on the Statement of Assets and Liabilities. The deferred asset is reduced during the one-year period that additional shares are sold by reducing the proceeds from such sales and recognized as a component of “Proceeds from shelf offering, net of offering costs” on the Statement of Changes in Net Assets. Any remaining deferred charges at the end of the one-year life of the Shelf Offering period will be expensed accordingly, as well as any additional Shelf Offering costs the Fund may incur. As Shelf Offering costs are expensed they are recognized as a component of “Other expenses” on the Statement of Operations.
Share Transactions
Transactions in shares during the Funds’ current and prior fiscal periods were as follows:
| | | | | | | | | | | | | | | | |
| | | JHY* | | | JHD** | |
| | | Six
Months
Ended
6/30/17 | | | Year
Ended
12/31/16 | | | Six
Months
Ended
6/30/17 | | | For the Period 5/10/16
(commencement
of operations)
through 12/31/16 | |
Shares: | | | | | | | | | | | | | | | | |
Sold | | | — | | | | — | | | | — | | | | 27,040,000 | |
Sold through shelf offering | | | 1,054,058 | | | | — | | | | — | | | | — | |
Issued to shareholders due to reinvestment of distributions | | | 18,105 | | | | 31,152 | | | | 4,047 | | | | 9,883 | |
Total | | | 1,072,163 | | | | 31,152 | | | | 4,047 | | | | 27,049,883 | |
Weighted average share: | | | | | | | | | | | | | | | | |
Premium to NAV per shelf offering share sold | | | 2.55 | % | | | — | % | | | — | % | | | — | % |
| | |
| | | JHA** | | | JHB* | |
| | | Six
Months
Ended
6/30/17 | | | Year
Ended
12/31/16 | | | Six
Months
Ended
6/30/17 | | | For the Period 8/23/16
(commencement
of operations)
through 12/31/16 | |
Shares: | | | | | | | | | | | | | | | | |
Sold | | | — | | | | — | | | | — | | | | 55,841,892 | |
Issued to shareholders due to reinvestment of distributions | | | 15,318 | | | | 19,448 | | | | 17,009 | | | | 2,565 | |
Total | | | 15,318 | | | | 19,448 | | | | 17,009 | | | | 55,844,457 | |
| * | Prior to the commencement of operations, the Adviser purchased 10,180 shares, which are still held as of the end of the reporting period. |
| ** | Prior to the commencement of operations, the Adviser purchased 10,200 shares, which are still held as of the end of the reporting period. |
5. Investment Transactions
Long-term purchases and sales (including maturities) during the current fiscal period were as follows:
| | | | | | | | | | | | | | | | |
| | | JHY | | | JHD | | | JHA | | | JHB | |
Purchases | | $ | 96,244,004 | | | $ | 87,736,079 | | | $ | 91,808,730 | | | $ | 140,840,510 | |
Sales and maturities | | | 86,894,099 | | | | 87,625,582 | | | | 95,729,905 | | | | 137,864,832 | |
6. Income Tax Information
Each Fund is a separate taxpayer for federal income tax purposes. Each Fund intends to distribute substantially all of its net investment company taxable income to shareholders and to otherwise comply with the requirements of Subchapter M of the Internal Revenue Code applicable to regulated investment companies. In any year when the Funds realize net capital gains, the Funds may choose to distribute all or a portion of their net capital gains to shareholders, or alternatively, to retain all or a portion of their net capital gains and pay federal corporate income taxes on such retained gains.
For all open tax years and all major taxing jurisdictions, management of the Funds has concluded that there are no significant uncertain tax positions that would require recognition in the financial statements. Open tax years are those that are open for examination by taxing authorities (i.e., generally the last four tax year ends and the interim tax period since then). Furthermore, management of the Funds is also not aware of any tax positions for which it is reasonably possible that the total amounts of unrecognized tax benefits will significantly change in the next twelve months.
The following information is presented on an income tax basis. Differences between amounts for financial statement and federal income tax purposes are primarily due to timing differences in recognizing certain gains and losses on investment transactions. To the extent that differences arise that are permanent in nature, such amounts are reclassified within the capital accounts as detailed below. Temporary differences do not require reclassification. Temporary and permanent differences do not impact the NAVs of the Funds.
Notes to Financial Statements (Unaudited) (continued)
As of June 30, 2017, the cost and unrealized appreciation (depreciation) of investments, as determined on a federal income tax basis, were as follows:
| | | | | | | | | | | | | | | | |
| | | JHY | | | JHD | | | JHA | | | JHB | |
Cost of investments | | $ | 184,105,784 | | | $ | 354,898,144 | | | $ | 376,878,721 | | | $ | 727,264,784 | |
Gross unrealized: | | | | | | | | | | | | | | | | |
Appreciation | | $ | 3,196,717 | | | $ | 8,907,716 | | | $ | 6,592,882 | | | $ | 16,530,759 | |
Depreciation | | | (1,364,672 | ) | | | (513,698 | ) | | | (546,899 | ) | | | (3,246,728 | ) |
Net unrealized appreciation (depreciation) of investments | | $ | 1,832,045 | | | $ | 8,394,018 | | | $ | 6,045,983 | | | $ | 13,284,031 | |
Permanent differences, primarily due to federal taxes paid, resulted in reclassifications among the Funds’ components of net assets as of December 31, 2016, the Funds’ last tax year end, as follows:
| | | | | | | | | | | | | | | | |
| | | JHY | | | JHD | | | JHA | | | JHB | |
Paid-in surplus | | $ | — | | | $ | — | | | $ | (44,426 | ) | | $ | — | |
Undistributed (Over-distribution of) net investment income | | | — | | | | — | | | | — | | | | — | |
Accumulated net realized gain (loss) | | | — | | | | — | | | | 44,426 | | | | — | |
The tax components of undistributed net ordinary income and net long-term capital gains as of December 31, 2016, the Funds’ last tax year end, were as follows:
| | | | | | | | | | | | | | | | |
| | | JHY | | | JHD | | | JHA | | | JHB | |
Undistributed net ordinary income | | $ | 686,762 | | | $ | 2,860,662 | | | $ | 2,516,992 | | | $ | 1,001,467 | |
Undistributed net long-term capital gains | | | — | | | | — | | | | — | | | | — | |
The tax character of distributions paid during the Funds’ last tax year ended December 31, 2016, was designated for purposes of the dividends paid deduction as follows:
| | | | | | | | | | | | | | | | |
| | | JHY | | | JHD2 | | | JHA | | | JHB3 | |
Distributions from net ordinary income1 | | $ | 9,277,194 | | | $ | 8,197,299 | | | $ | 17,380,339 | | | $ | 8,377,948 | |
Distributions from net long-term capital gains | | | — | | | | — | | | | 386,138 | | | | — | |
Return of capital | | | — | | | | — | | | | — | | | | — | |
1 Net ordinary income consists of net taxable income derived from dividends and interest, and net short-term capital gains, if any. 2 For the period May 10, 2016 (commencement of operations) through December 31, 2016. 3 For the period August 23, 2016 (commencement of operations) through December 31, 2016. | | | | | |
As of December 31, 2016, the Funds’ last tax year end, the following Fund had unused capital losses carrying forward available for federal income tax purposes to be applied against future capital gains, if any. The capital losses are not subject to expiration.
| | | | |
| | | JHY | |
Capital losses to be carried forward – not subject to expiration | | $ | 2,655,327 | |
7. Management Fees
Management Fees
Each Fund’s management fee compensates the Adviser for overall investment advisory and administrative services and general office facilities. The Sub-Adviser is compensated for its services to the Funds from the management fees paid to the Adviser.
Each Fund’s management fee consists of two components – a fund-level fee, based only on the amount of assets within each individual Fund, and a complex-level fee, based on the aggregate amount of all eligible fund assets managed by the Adviser. This pricing structure enables Fund shareholders to benefit from growth in the assets within their respective Fund as well as from growth in the amount of complex-wide assets managed by the Adviser.
The annual Fund-level fee, payable monthly, for each Fund is calculated according to the following schedule:
| | | | |
| Average Daily Managed Assets* | | Fund-Level Fee | |
For the first $500 million | | | 0.5000 | % |
For the next $250 million | | | 0.4875 | |
For managed assets over $750 million | | | 0.4750 | |
The annual complex-level fee, payable monthly, for each Fund is calculated by multiplying the current complex-wide fee rate, determined according to the following schedule by the Funds’ daily managed assets:
| | | | |
| Complex-Level Managed Asset Breakpoint Level* | | Effective Rate at Breakpoint Level | |
$55 billion | | | 0.2000 | % |
$56 billion | | | 0.1996 | |
$57 billion | | | 0.1989 | |
$60 billion | | | 0.1961 | |
$63 billion | | | 0.1931 | |
$66 billion | | | 0.1900 | |
$71 billion | | | 0.1851 | |
$76 billion | | | 0.1806 | |
$80 billion | | | 0.1773 | |
$91 billion | | | 0.1691 | |
$125 billion | | | 0.1599 | |
$200 billion | | | 0.1505 | |
$250 billion | | | 0.1469 | |
$300 billion | | | 0.1445 | |
| * | For the complex-level fees, managed assets include closed-end fund assets managed by the Adviser that are attributable to certain types of leverage. For these purposes, leverage includes the funds’ use of preferred stock and borrowings and certain investments in the residual interest certificates (also called inverse floating rate securities) in tender option bond (TOB) trusts, including the portion of assets held by a TOB trust that has been effectively financed by the trust’s issuance of floating rate securities, subject to an agreement by the Adviser as to certain funds to limit the amount of such assets for determining managed assets in certain circumstances. The complex-level fee is calculated based upon the aggregate daily managed assets of all Nuveen funds that constitute “eligible assets.” Eligible assets do not include assets attributable to investments in other Nuveen funds or assets in excess of a determined amount (originally $2 billion) added to the Nuveen fund complex in connection with the Adviser’s assumption of the management of the former First American Funds effective January 1, 2011. As of June 30, 2017, the complex-level fee for each Fund was 0.1606%. |
8. Borrowing Arrangements
Each Fund has entered into a borrowing arrangement (“Borrowings”) as a means of leverage.
The Funds have entered into a credit agreement with a bank and its affiliate. Each Fund’s maximum commitment amount under its Borrowings is as follows:
| | | | | | | | | | | | | | | | |
| | | JHY | | | JHD | | | JHA | | | JHB | |
Maximum commitment amount | | | $46,500,000 | | | | $90,000,000 | | | | $95,000,000 | | | | $190,000,000 | |
JHY renewed its borrowing in August 2017 (subsequent to the end of the reporting period) through August 2018 while JHD renewed its borrowing in June 2017 through June 2018. All other terms remained unchanged for each Fund.
As of the end of the reporting period, each Fund’s outstanding balance on its Borrowings was as follows:
| | | | | | | | | | | | | | | | |
| | | JHY | | | JHD | | | JHA | | | JHB | |
Outstanding balance on Borrowings | | | $44,000,000 | | | | $90,000,000 | | | | $92,000,000 | | | | $190,000,000 | |
Interest is charged on these Borrowings for each Fund at the 1-Month LIBOR (London Inter-Bank Offered Rate) plus 0.65% per annum on the amounts borrowed. JHY, JHD and JHA are each charged a 0.125% per annum commitment fee on the undrawn portion of the Borrowings. JHB is charged a 0.25% per annum commitment fee on the undrawn portion of the Borrowings on any day that more than 10% of the maximum commitment amount is undrawn. JHD and JHB also accrued a one-time upfront fee of 0.10% per annum on the maximum commitment amount.
During the current fiscal period, the average daily balance outstanding and average annual interest rate on each Fund’s Borrowings were as follows:
| | | | | | | | | | | | | | | | |
| | | JHY | | | JHD | | | JHA | | | JHB | |
Average daily balance outstanding | | | $44,000,000 | | | | $90,000,000 | | | | $92,000,000 | | | | $190,000,000 | |
Average annual interest rate | | | 1.57 | % | | | 1.58 | % | | | 1.57 | % | | | 1.73 | % |
In order to maintain these Borrowings, the Funds must meet certain collateral, asset coverage and other requirements. Each Fund’s Borrowings outstanding are fully secured by eligible securities held in their Portfolio of Investments.
Each Fund’s Borrowings outstanding is recognized as “Borrowings” on the Statement of Assets and Liabilities. Interest expense incurred on the borrowed amount and undrawn balance and commitment fees are recognized as components of “Interest expense on borrowings” on the Statement of Operations.
Notes to Financial Statements (Unaudited) (continued)
Inter-Fund Borrowing and Lending
The SEC has granted an exemptive order permitting registered open-end and closed-end Nuveen funds to participate in an inter-fund lending facility whereby the Nuveen funds may directly lend to and borrow money from each other for temporary purposes (e.g., to satisfy redemption requests or when a sale of securities “fails,” resulting in an unanticipated cash shortfall) (the “Inter-Fund Program”). The closed-end Nuveen funds, including the Funds covered by this shareholder report, will participate only as lenders, and not as borrowers, in the Inter-Fund Program because such closed-end funds rarely, if ever, need to borrow cash to meet redemptions. The Inter-Fund Program is subject to a number of conditions, including, among other things, the requirements that (1) no fund may borrow or lend money through the Inter-Fund Program unless it receives a more favorable interest rate than is typically available from a bank or other financial institution for a comparable transaction; (2) no fund may borrow on an unsecured basis through the Inter-Fund Program unless the fund’s outstanding borrowings from all sources immediately after the inter-fund borrowing total 10% or less of its total assets; provided that if the borrowing fund has a secured borrowing outstanding from any other lender, including but not limited to another fund, the inter-fund loan must be secured on at least an equal priority basis with at least an equivalent percentage of collateral to loan value; (3) if a fund’s total outstanding borrowings immediately after an inter-fund borrowing would be greater than 10% of its total assets, the fund may borrow through the inter-fund loan on a secured basis only; (4) no fund may lend money if the loan would cause its aggregate outstanding loans through the Inter-Fund Program to exceed 15% of its net assets at the time of the loan; (5) a fund’s inter-fund loans to any one fund shall not exceed 5% of the lending fund’s net assets; (6) the duration of inter-fund loans will be limited to the time required to receive payment for securities sold, but in no event more than seven days; and (7) each inter-fund loan may be called on one business day’s notice by a lending fund and may be repaid on any day by a borrowing fund. In addition, a Nuveen fund may participate in the Inter-Fund Program only if and to the extent that such participation is consistent with the fund’s investment objective and investment policies. The Board is responsible for overseeing the Inter-Fund Program.
The limitations detailed above and the other conditions of the SEC exemptive order permitting the Inter-Fund Program are designed to minimize the risks associated with Inter-Fund Program for both the lending fund and the borrowing fund. However, no borrowing or lending activity is without risk. When a fund borrows money from another fund, there is a risk that the loan could be called on one day’s notice or not renewed, in which case the fund may have to borrow from a bank at a higher rate or take other actions to payoff such loan if an inter-fund loan is not available from another fund. Any delay in repayment to a lending fund could result in a lost investment opportunity or additional borrowing costs.
During May 2017, the Board approved the Nuveen funds participation in the Inter-Fund Program. During the current reporting period none of the Funds covered by this shareholder report have entered into any inter-fund loan activity.
9. New Accounting Pronouncements
Amendments to Regulation S-X
In October 2016, the SEC adopted new rules and amended existing rules (together, the “final rules”) intended to modernize the reporting and disclosure of information by registered investment companies. In part, the final rules amend Regulation S-X and require standardized, enhanced disclosure about derivatives in investment company financial statements, as well as other amendments. The compliance date of the amendments to Regulation S-X is August 1, 2017. Management is still evaluating the impact of the final rules, if any.
Accounting Standards Update (“ASU”) 2017-08 (“ASU 2017-08”) Premium Amortization on Purchased Callable Debt Securities
During March 2017, the Financial Accounting Standards Board (“FASB”) issued ASU 2017-08, which shortens the premium amortization period for purchased non-contingently callable debt securities. ASU 2017-08 specifies that the premium amortization period ends at the earliest call date, for purchased non-contingently callable debt securities. ASU 2017-08 is effective for fiscal years, and interim periods within those fiscal years, beginning after December 15, 2018. Management is currently evaluating the implications of ASU 2017-08, if any.
10. Subsequent Events
Borrowing Arrangements
Subsequent to the current fiscal period, JHA decreased the outstanding balance on its Borrowings to $51,500,000.
Additional
Fund Information
| | | | | | | | | | |
| Board of Trustees | | | | | | | | | | |
Margo Cook* | | Jack B. Evans | | William C. Hunter | | David J. Kundert | | Albin F. Moschner | | John K. Nelson |
William J. Schneider | | Judith M. Stockdale | | Carole E. Stone | | Terence J. Toth | | Margaret L. Wolff | | Robert C. Young** |
| * | Interested Board Member. |
| ** | Effective July 1, 2017. |
| | | | | | | | |
| | | | | |
Fund Manager Nuveen Fund Advisors, LLC 333 West Wacker Drive Chicago, IL 60606 | | Custodian State Street Bank
& Trust Company One Lincoln Street Boston, MA 02111 | | Legal Counsel Chapman and Cutler LLP Chicago, IL 60603 | | Independent Registered
Public Accounting Firm KPMG LLP 200 East Randolph Drive Chicago, IL 60601 | | Transfer Agent and
Shareholder Services Computershare Trust Company, N.A. 250 Royal Street Canton, MA 02021 (800) 257-8787 |
Quarterly Form N-Q Portfolio of Investments Information
The Fund is required to file its complete schedule of portfolio holdings with the Securities and Exchange Commission (SEC) for the first and third quarters of each fiscal year on Form N-Q. You may obtain this information directly from the SEC. Visit the SEC on-line at http://www.sec.gov or in person at the SEC’s Public Reference Room in Washington, D.C. Call the SEC toll-free at (800) SEC-0330 for room hours and operation.
Nuveen Funds’ Proxy Voting Information
You may obtain (i) information regarding how each fund voted proxies relating to portfolio securities held during the most recent twelve-month period ended June 30, without charge, upon request, by calling Nuveen toll-free at (800) 257-8787 or on Nuveen’s website at www.nuveen.com and (ii) a description of the policies and procedures that each fund used to determine how to vote proxies relating to portfolio securities without charge, upon request, by calling Nuveen toll free at (800) 257-8787. You may also obtain this information directly from the SEC. Visit the SEC on-line at http://www.sec.gov.
CEO Certification Disclosure
The Fund’s Chief Executive Officer (CEO) has submitted to the New York Stock Exchange (NYSE) the annual CEO certification as required by Section 303A.12(a) of the NYSE Listed Company Manual. The Fund has filed with the SEC the certification of its CEO and Chief Financial Officer required by Section 302 of the Sarbanes-Oxley Act.
Share Repurchases
JHY, JHD and JHA intends to repurchase, through its open-market share repurchase program, shares of its own common stock at such times and in such amounts as is deemed advisable. During the period covered by this report, each Fund repurchased shares of its common stock, as shown in the accompanying table. Any future repurchases will be reported to shareholders in the next annual or semi-annual report.
| | | | | | | | | | | | |
| | | JHY | | | JHD | | | JHA | |
Shares repurchased | | | — | | | | — | | | | — | |
FINRA BrokerCheck
The Financial Industry Regulatory Authority (FINRA) provides information regarding the disciplinary history of FINRA member firms and associated investment professionals. This information as well as an investor brochure describing FINRA BrokerCheck is available to the public by calling the FINRA BrokerCheck Hotline number at (800) 289-9999 or by visiting www.FINRA.org.
Glossary of Terms
Used in this Report
| ∎ | | Average Annual Total Return: This is a commonly used method to express an investment’s performance over a particular, usually multi-year time period. It expresses the return that would have been necessary each year to equal the investment’s actual cumulative performance (including change in NAV or market price and reinvested dividends and capital gains distributions, if any) over the time period being considered. |
| ∎ | | Bloomberg Barclays U.S. Corporate High Yield Bond Index: The index measures the U.S. dollar denominated, high yield, fixed-rate corporate bond market. Securities are classified as high yield if the middle rating of Moody’s, Fitch and S&P is Ba1/BB+/BB+ or below. Bonds from issuers with an emerging markets country of risk, based on Bloomberg Barclays emerging market country definition, are excluded. The U.S. Corporate High Yield Index is a component of the U.S. Universal and Global High Yield Indexes. Index returns assume reinvestment of distributions, but do not include the effects of any applicable sales charges or management fees. |
| ∎ | | Bloomberg Barclays U.S. High Yield 1-5 Year Cash Pay 2% Issuer Capped Index: An index that tracks the performance of U.S. non-investment grade bonds with maturities of one to 4.99 years and limits each issue to 2% of the index. Benchmark returns assume reinvestment of distributions, but do not reflect any applicable sales charges or management fees. |
| ∎ | | Duration: Duration is a measure of the expected period over which a bond’s principal and interest will be paid, and consequently is a measure of the sensitivity of a bond’s or bond fund’s value to changes when market interest rates change. Generally, the longer a bond’s or fund’s duration, the more the price of the bond or fund will change as interest rates change. |
| ∎ | | Effective Leverage: Effective leverage is a fund’s effective economic leverage, and includes both regulatory leverage (see below) and the leverage effects of certain derivative investments in the fund’s portfolio that increase the fund’s investment exposure. |
| ∎ | | Leverage: Leverage is created whenever a fund has investment exposure (both reward and/or risk) equivalent to more than 100% of the investment capital. |
| ∎ | | Net Asset Value (NAV) Per Share: A fund’s Net Assets is equal to its total assets (securities, cash, accrued earnings and receivables) less its total liabilities. NAV per share is equal to the fund’s Net Assets divided by its number of shares outstanding. |
| ∎ | | Regulatory Leverage: Regulatory leverage consists of preferred shares issued by or borrowings of a fund. Both of these are part of a fund’s capital structure. Regulatory leverage is subject to asset coverage limits set in the Investment Company Act of 1940. |
Reinvest Automatically,
Easily and Conveniently
Nuveen makes reinvesting easy. A phone call is all it takes to set up your reinvestment account.
Nuveen Closed-End Funds Automatic Reinvestment Plan
Your Nuveen Closed-End Fund allows you to conveniently reinvest distributions in additional Fund shares.
By choosing to reinvest, you’ll be able to invest money regularly and automatically, and watch your investment grow through the power of compounding. Just like distributions in cash, there may be times when income or capital gains taxes may be payable on distributions that are reinvested.
It is important to note that an automatic reinvestment plan does not ensure a profit, nor does it protect you against loss in a declining market.
Easy and convenient
To make recordkeeping easy and convenient, each quarter you’ll receive a statement showing your total distributions, the date of investment, the shares acquired and the price per share, and the total number of shares you own.
How shares are purchased
The shares you acquire by reinvesting will either be purchased on the open market or newly issued by the Fund. If the shares are trading at or above net asset value at the time of valuation, the Fund will issue new shares at the greater of the net asset value or 95% of the then-current market price. If the shares are trading at less than net asset value, shares for your account will be purchased on the open market. If the Plan Agent begins purchasing Fund shares on the open market while shares are trading below net asset value, but the Fund’s shares subsequently trade at or above their net asset value before the Plan Agent is able to complete its purchases, the Plan Agent may cease open-market purchases and may invest the uninvested portion of the distribution in newly-issued Fund shares at a price equal to the greater of the shares’ net asset value or 95% of the shares’ market value on the last business day immediately prior to the purchase date. Distributions received to purchase shares in the open market will normally be invested shortly after the distribution payment date. No interest will be paid on distributions awaiting reinvestment. Because the market price of the shares may increase before purchases are completed, the average purchase price per share may exceed the market price at the time of valuation, resulting in the acquisition of fewer shares than if the distribution had been paid in shares issued by the Fund. A pro rata portion of any applicable brokerage commissions on open market purchases will be paid by Plan participants. These commissions usually will be lower than those charged on individual transactions.
Flexible
You may change your distribution option or withdraw from the Plan at any time, should your needs or situation change.
You can reinvest whether your shares are registered in your name, or in the name of a brokerage firm, bank, or other nominee. Ask your investment advisor if his or her firm will participate on your behalf. Participants whose shares are registered in the name of one firm may not be able to transfer the shares to another firm and continue to participate in the Plan.
The Fund reserves the right to amend or terminate the Plan at any time. Although the Fund reserves the right to amend the Plan to include a service charge payable by the participants, there is no direct service charge to participants in the Plan at this time.
Call today to start reinvesting distributions
For more information on the Nuveen Automatic Reinvestment Plan or to enroll in or withdraw from the Plan, speak with your financial advisor or call us at (800) 257-8787.
Annual Investment
Management Agreement Approval Process
The Board of Trustees (each, a “Board,” and each Trustee, a “Board Member”) of each Fund, including the Board Members who are not parties to the applicable advisory or sub-advisory agreements or “interested persons” of any such parties (the “Independent Board Members”), oversees the management of its respective Fund, including the performance of Nuveen Fund Advisors, LLC, the Funds’ investment adviser (the “Adviser”), and Nuveen Asset Management, LLC, the Funds’ sub-adviser (the “Sub-Adviser”). As required by applicable law, after the initial term of the respective Fund following commencement of its operations, the Board is required to consider annually whether to renew the Fund’s management agreement with the Adviser (the “Investment Management Agreement”) and its sub-advisory agreement with the Sub-Adviser (the “Sub-Advisory Agreement” and, together with the Investment Management Agreement, the “Advisory Agreements”). Accordingly, the Board met in person on April 11-12, 2017 (the “April Meeting”) and May 23-25, 2017 (the “May Meeting”) to consider the approval of each Advisory Agreement that was up for renewal for an additional one-year period.
The Board considered its review of the Advisory Agreements as an ongoing process encompassing the information received and the deliberations the Board and its committees have had throughout the year. The Board met regularly during the year and received materials and discussed topics that were relevant to the annual consideration of the renewal of the Advisory Agreements, including, among other things, overall market performance and developments; fund investment performance; investment team review; valuation of securities; compliance, regulatory and risk management matters; and other developments. The Board had also established several standing committees, including the Open-end Fund Committee and Closed-end Fund Committee, which met regularly throughout the year to permit the Board Members to delve deeper into the topics particularly relevant to the respective product line. The Board further continued its practice of seeking to meet periodically with the Sub-Adviser and its investment team. The accumulated information, knowledge, and experience the Board Members had gained during their tenure on the Board governing the Funds and working with the Fund Advisers (as defined below) were taken into account in their review of the Advisory Agreements.
In addition to the materials received by the Board or its committees throughout the year, the Board reviewed extensive additional materials prepared specifically for its annual review of the Advisory Agreements in response to a request by independent legal counsel on behalf of the Independent Board Members. The materials addressed a variety of topics, including, but not limited to, a description of the services provided by the Adviser and Sub-Adviser (the Adviser and the Sub-Adviser are each a “Fund Adviser”); an analysis of fund performance including comparative industry data and a detailed focus on performance outliers; an analysis of the Sub-Adviser; an analysis of the fees and expense ratios of the Nuveen funds in absolute terms and in comparison to the fees and expenses of peers with a focus on any expense outliers; an assessment of shareholder services for the Nuveen funds and of the performance of certain service providers; a review of initiatives instituted or continued during the past year; a review of premium/discount trends and leverage management for the closed-end funds; and information regarding the profitability of the Fund Advisers, the compensation of portfolio managers, and compliance and risk matters. The materials provided in connection with the annual review included information compiled and prepared by Broadridge Financial Solutions, Inc. (“Broadridge” or “Lipper”), an independent provider of investment company data, comparing, in relevant part, each Fund’s fees and expenses with those of a comparable universe of funds (the “Peer Universe”), as selected by Broadridge (the “Broadridge Report”). The Independent Board Members also received a memorandum from independent legal counsel outlining their fiduciary duties and legal standards in reviewing the Advisory Agreements.
As part of its annual review, the Board met at the April Meeting to review the investment performance of the Funds and to consider the Adviser’s analysis of the Sub-Adviser evaluating, among other things, the Sub-Adviser’s assets under management, investment team, performance, organizational stability, and investment approach. During the review, the Independent Board Members requested and received additional information from management. At the May Meeting, the Board, including the Independent Board Members, continued its review and ultimately approved the continuation of the Advisory Agreements for an additional year. Throughout the year and throughout their review of the Advisory Agreements, the Independent Board Members were assisted by independent legal counsel and met with counsel separately without management present. In deciding to renew the Advisory Agreements, the Independent Board Members did not identify a particular factor as determinative, but rather the decision reflected
the comprehensive consideration of all the information presented, and each Board Member may have attributed different weights to the various factors and information considered in connection with the approval process. The following summarizes the principal factors, but not all the factors, the Board considered in its review of the Advisory Agreements and its conclusions.
| A. | | Nature, Extent and Quality of Services |
In evaluating the renewal of the Advisory Agreements, the Independent Board Members received and considered information regarding the nature, extent and quality of the applicable Fund Adviser’s services provided to the respective Fund and the resulting performance of each Fund. The Board recognized the myriad of services the Adviser and its affiliates provided to manage and operate the Nuveen funds, including (a) product management (such as managing distributions, positioning the product in the marketplace, maintaining and enhancing shareholder communications and reporting to the Board); (b) investment oversight, risk management and securities valuation (such as overseeing the sub-advisers and other service providers, analyzing investment performance and risks, overseeing risk management and disclosure, executing the daily valuation of securities, and analyzing trade execution); (c) fund administration (such as helping to prepare fund tax returns and complete other tax compliance matters and helping to prepare regulatory filings and shareholder reports); (d) fund board administration (such as preparing board materials and organizing and providing assistance for board meetings); (e) compliance (such as helping to devise and maintain the Nuveen funds’ compliance program and test for adherence); (f) legal support (such as helping to prepare registration statements and proxy statements, interpreting regulations and policies and overseeing fund activities); (g) with respect to certain closed-end funds, providing leverage, capital and distribution management services; and (h) with respect to certain open-end funds with portfolios that have a leverage component, providing such leverage management services.
The Board further noted the Adviser’s continued dedication to investing in its business to enhance the quality and breadth of the services provided to the Funds. The Board recognized the Adviser’s investment in staffing over recent years to support the services provided to the Nuveen funds in key areas, including in investment services, product management, retail distribution and information technology, closed-end funds and structured products, as well as in fund administration, operations and risk management. The Board further noted the Adviser’s continued commitment to enhancing its compliance program by, among other things, restructuring the compliance organization, developing a unified compliance program, adding compliance staff, and developing and/or revising policies and procedures as well as building further infrastructure to address new regulatory requirements or guidance and the growth of the complex. The Board also considered the enhancements to Nuveen’s cybersecurity capabilities, systems and processes to value securities, stress test reporting and risk and control self-assessments.
In addition, the Independent Board Members considered information highlighting the various initiatives that the Adviser had implemented or continued over recent years to benefit the open-end fund and closed-end fund product lines and/or particular Nuveen funds. The Board noted the Adviser’s continued efforts to rationalize the open-end fund and closed-end fund product lines through, among other things, mergers, liquidations and repositionings in seeking to provide enhanced shareholder value over the years through increased efficiency, reduced costs, improved performance and revised investment approaches that are more relevant to current shareholder needs. With respect to closed-end Nuveen funds, such initiatives included (a) an increased level of leverage management activities in 2016 and 2017 resulting from the rollover of existing facilities, the negotiation of improved terms and pricing to reduce leverage costs, the innovation of new leverage structures, the rebalancing of leverage of various funds as a result of mergers or new investment mandates, and the restructuring of tender option bonds to be compliant with new regulatory requirements; (b) an increased level of capital management activities (i.e., the management of the issuance and repurchase of shares of certain closed-end funds) during 2016 as a result of market demand as well as an implementation of a cross department review system for shares trading at certain discount levels; (c) continued refinements to a database to permit further analysis of the closed-end fund marketplace and shareholder base; (d) the development of enhanced secondary market board reporting and commentary; (e) the reconfiguration of the framework for determining and maintaining closed-end fund benchmarks to permit more consistency across the complex; and (f) the development of product innovations for new closed-end offerings, including target term funds. The Board also recognized the Adviser’s continued commitment to supporting the closed-end product line through its award winning investor relations support program through which Nuveen seeks to educate investors and financial advisers regarding closed-end funds.
Annual Investment Management Agreement Approval Process (continued)
In its review, the Board recognized that initiatives that attracted assets to the Nuveen family of funds generally benefited the Nuveen funds in the complex as fixed costs would be spread over a larger asset base and, as described below, through the complex-wide fee arrangement which generally provides that the management fees of the Nuveen funds (subject to limited exceptions) are reduced as asset levels in the complex reach certain breakpoints in the fee schedule.
Similarly, the Board considered the sub-advisory services provided by the Sub-Adviser to the Funds. The Sub-Adviser generally provided portfolio advisory services for the Funds. The Board reviewed the Adviser’s analysis of the Sub-Adviser which evaluated, among other things, the investment team and any changes thereto, the stability and history of the organization, the assets under management, the investment approach and the performance of the Nuveen funds it sub-advises. The Board noted that the Adviser recommended the renewal of the Sub-Advisory Agreements.
Based on its review, the Board determined, in the exercise of its reasonable business judgment, that it was satisfied with the nature, extent and quality of services provided to the respective Funds under each applicable Advisory Agreement.
| B. | | The Investment Performance of the Funds and Fund Advisers |
As part of its evaluation of the services provided by the Fund Advisers, the Board reviewed Fund performance over the quarter and one-year periods ending December 31, 2016 as well as performance data for the first quarter of 2017 ending March 31, 2017 (or for such shorter periods available for Nuveen High Income December 2019 Target Term Fund (the “2019 Fund”) and Nuveen High Income November 2021 Target Term Fund (the “2021 Fund”), which did not exist for part of the foregoing time frame). The Board reviewed performance on an absolute basis and in comparison to the performance of peer funds (the “Performance Peer Group”) and recognized and/or customized benchmarks (i.e., generally benchmarks derived from multiple recognized benchmarks). For closed-end funds, the Board (or the Closed-end Fund Committee) also reviewed, among other things, the premium or discount to net asset value of the Nuveen closed-end funds as of a specified date and over various periods as well as in comparison to the premium/discount average in their respective Lipper peer category. The Independent Board Members continued to recognize the importance of secondary market trading for the shares of the closed-end funds and the evaluation of the premium and discount levels was a continuing priority for them. The review and analysis of performance information during the annual review of Advisory Agreements incorporated the discussions and performance information the Board Members have had at each of their quarterly meetings throughout the year.
In evaluating performance data, the Independent Board Members recognized some of the limitations of such data and the difficulty in establishing appropriate peer groups and benchmarks for certain of the Nuveen funds. They recognized that each fund operates pursuant to its own investment objective(s), parameters and restrictions which may differ from that of the Performance Peer Group or benchmark. Certain funds may also utilize leverage which may provide benefits or risks to their portfolio compared to an unlevered benchmark. The Independent Board Members had noted that management had classified the Performance Peer Groups as low, medium and high in relevancy to the applicable fund as a result of these differences or other factors. The Independent Board Members recognized that the variations between the Performance Peer Group or benchmark and the applicable Fund will lead to differing performance results and may limit the value of the comparative performance data in assessing the particular Fund’s performance.
In addition, the Independent Board Members recognized that the performance data is a snapshot in time, in this case as of the end of the 2016 calendar year or end of the first quarter of 2017. A different period may generate significantly different results and longer term performance can be adversely affected by even one period of significant underperformance. Further, a shareholder’s experience in a Fund depends on his or her own holding period which may differ from that reviewed by the Independent Board Members.
In their review of performance, the Independent Board Members focused, in particular, on the Adviser’s analysis of Nuveen funds determined to be underperforming performance outliers and the factors contributing to the respective fund’s performance and any efforts to address performance concerns. With respect to any Nuveen funds for which the Board has identified performance issues, the Board monitors such funds closely until performance improves, discusses with the Adviser the reasons for such results, considers any steps necessary or appropriate to address such issues, and reviews the results of any efforts undertaken. The Board, however, acknowledged that shareholders chose to invest or remain invested in a fund knowing that the Adviser and applicable sub-adviser manage the fund, knowing the fund’s investment strategy and seeking exposure to that strategy (even if the strategy was “out of favor” in the marketplace) and knowing the fund’s fee structure.
For Nuveen High Income 2020 Target Term Fund, the Board noted that the Fund ranked in the third quartile in its Performance Peer Group in the one-year period and outperformed its benchmark during this period. Although the Board recognized that the Fund was new with too limited of a performance history available to make a meaningful assessment of performance, the Board was satisfied with the Fund’s progress.
For the 2019 Fund, the Board recognized that the Fund was new with too limited of a performance history available to make a meaningful assessment of performance.
For Nuveen High Income December 2018 Target Term Fund, the Board noted that the Fund ranked in the fourth quartile in its Performance Peer Group in the one-year period and underperformed its benchmark during this period. The Board recognized that the Fund was relatively new with only a one-year performance history available, limiting the ability for a meaningful assessment of performance. Nevertheless, the Board recognized the Adviser’s explanation that, as a target term fund, the Fund’s performance should be viewed through a different lens given the Fund’s mandate that focuses on return of net asset value. In this regard, the Fund had continued to distribute regular dividend payments to investors, had not held a defaulted security since its inception to the time of review and was on schedule to return net asset value back to investors at the end of the Fund’s term. The Independent Board Members were satisfied with the Adviser’s explanation of the performance of this Fund.
For the 2021 Fund, the Board recognized that the Fund was new with too limited of a performance history available to make a meaningful assessment of performance.
| C. | | Fees, Expenses and Profitability |
The Board evaluated the management fees and other fees and expenses of each Fund. The Board reviewed and considered, among other things, the gross and net management fees paid by the Funds. The Board further considered the net total expense ratio of each Fund (expressed as a percentage of average net assets) as the expense ratio is most reflective of the investors’ net experience in a Fund as it directly reflected the costs of investing in the respective Fund.
In addition, the Board reviewed the Broadridge Report comparing, in relevant part, each Fund’s gross and net advisory fees and net total expense ratio with those of a Peer Universe. The Independent Board Members also reviewed the methodology regarding the construction of the applicable Peer Universe by Broadridge. In reviewing the comparative data, the Board was aware that various factors may limit some of the usefulness of the data, such as differences in size of the peers; the composition of the Peer Universe; changes each year of funds comprising the Peer Universe; levels of expense reimbursements and fee waivers; and differences in the type and use of leverage. Nevertheless, in reviewing a fund’s fees and expenses compared to the fees and expenses of its peers (excluding leverage costs and leveraged assets), the Board generally considered a fund’s expenses and fees to be higher if they were over 10 basis points higher, slightly higher if they were 6 to 10 basis points higher, in line if they were within approximately 5 basis points higher than the peer average and below if they were below the peer average of the Peer Universe. The Board noted that the substantial majority of the Nuveen funds had a net expense ratio that was near or below their respective peer average.
The Independent Board Members noted that each Fund had a net management fee and a net expense ratio below its respective peer average.
In their evaluation of the management fee schedule, the Independent Board Members also reviewed the fund-level and complex-wide breakpoint schedules, as described in further detail below. With respect to closed-end funds, the Board considered the effects of leverage on fees and expenses, including the calculation of management fees for funds with tender option bonds.
Based on their review of the information provided, the Board determined that each Fund’s management fees (as applicable) to a Fund Adviser were reasonable in light of the nature, extent and quality of services provided to the Fund.
| | 2. | | Comparisons with the Fees of Other Clients |
The Board also reviewed information regarding the respective Fund Adviser’s fee rates for providing advisory services to other types of clients. For the Adviser and/or the Sub-Adviser, such other clients may include: separately managed accounts (such
Annual Investment Management Agreement Approval Process (continued)
as retail, institutional or wrap accounts), other investment companies that are not offered by Nuveen but are sub-advised by the Sub-Adviser, foreign investment companies offered by Nuveen, and collective investment trusts. The Board further noted that the Adviser also advises certain exchange-traded funds (“ETFs”) sponsored by Nuveen.
In reviewing the fee rates assessed to other clients, the Board reviewed, among other things, the range of fees assessed for managed accounts and the foreign investment companies offered by Nuveen. With respect to foreign funds, the Board noted that unlike the management fees for the Nuveen funds, the management fees for the foreign funds may include distribution fees paid to intermediaries. The Board also reviewed the average fee rate for certain strategies offered by the Sub-Adviser.
The Board recognized the inherent differences between the Nuveen funds and the other types of clients. The Board considered information regarding these various differences which included, among other things, the services required, average account sizes, types of investors targeted, legal structure and operations, and applicable laws and regulations. The Independent Board Members recognized that the foregoing variations resulted in different economics among the product structures and culminated in varying management fees among the types of clients and the Nuveen funds. In general, the Board noted that higher fee levels reflected higher levels of service provided by the Fund Adviser, increased investment management complexity, greater product management requirements and higher levels of business risk or some combination of the foregoing. The Board recognized the breadth of services the Adviser provided to support the Nuveen funds as summarized above and noted that many of such administrative services may not be required to the same extent or at all for the institutional clients or other clients. The Board further recognized the passive management of ETFs compared to the active management required of other Nuveen funds would contribute to differing fee levels.
The Independent Board Members noted that the sub-advisory fees paid by the Adviser to the Sub-Adviser, however, were generally for portfolio management services. The Board noted such sub-advisory fees were more comparable to the fees of retail wrap accounts and other external sub-advisory mandates.
Given the inherent differences in the various products, particularly the extensive services provided to the Funds, the Board concluded that such facts justify the different levels of fees.
| | 3. | | Profitability of Fund Advisers |
In conjunction with their review of fees, the Independent Board Members also considered Nuveen’s level of profitability for its advisory services to the Nuveen funds for the calendar years 2016 and 2015. In considering profitability, the Independent Board Members considered the level of profitability realized by Nuveen before the imposition of any distribution and marketing expenses incurred by the firm from its own resources. In evaluating the profitability, the Independent Board Members evaluated the analysis employed in developing the profitability figures, including the assumptions and methodology employed in allocating expenses. The Independent Board Members recognized the inherent limitations to any cost allocation methodology as different and reasonable approaches may be used and yet yield differing results. The Independent Board Members further reviewed an analysis of the history of the profitability methodology used explaining any changes to the methodology over the years. The Board has appointed two Independent Board Members, who along with independent legal counsel, helped to review and discuss the methodology employed to develop the profitability analysis each year and any proposed changes thereto and to keep the Board apprised of such changes during the year.
In their review, the Independent Board Members evaluated, among other things, Nuveen’s adjusted operating margins, the gross and net revenue margins (pre-tax and after-tax) for advisory activities for the Nuveen funds, and the revenues, expenses, and net income (pre-tax and after-tax) of Nuveen for each of the last two calendar years. The Independent Board Members also reviewed an analysis of the key drivers behind the changes in revenues and expenses that impacted profitability in 2016 versus 2015. The Board, however, observed that Nuveen’s operating margins for its advisory activities in 2016 were similar to that of 2015.
In addition to reviewing Nuveen’s profitability in absolute terms, the Independent Board Members also reviewed the adjusted total company margins of other advisory firms that had publicly available information and comparable assets under management (based on asset size and asset composition). The Independent Board Members, however, noted that the usefulness of the comparative data may be limited as the other firms may have a different business mix and their profitability data may be affected by numerous other factors such as the types of funds managed, the cost allocation methodology used,
and their capital structure. Nevertheless, the Board noted that Nuveen’s adjusted operating margins appeared comparable to the adjusted margins of the peers.
Further, the Adviser is a subsidiary of Nuveen, LLC, the investment management arm of Teachers Insurance and Annuity Association of America (“TIAA”). To have a fuller picture of the financial condition and strength of the TIAA complex, together with Nuveen, the Board reviewed a balance sheet for TIAA reflecting its assets, liabilities and capital and contingency reserves for the 2016 and 2015 calendar years.
In addition to the Adviser’s profitability, the Independent Board Members also considered the profitability of the Sub-Adviser from its relationship with the Nuveen funds. The Independent Board Members reviewed the Sub-Adviser’s revenues, expenses and revenue margins (pre- and post-tax) for its advisory activities for the calendar year ended December 31, 2016. The Independent Board Members also reviewed a profitability analysis reflecting the revenues, expenses and revenue margin (pre- and post-tax) by asset type for the Sub-Adviser for the calendar year ending December 31, 2016.
In evaluating the reasonableness of the compensation, the Independent Board Members also considered other amounts paid to a Fund Adviser for its services to the Funds as well as indirect benefits (such as soft dollar arrangements), if any, the Fund Adviser and its affiliates received or were expected to receive that were directly attributable to the management of a Fund. See Section E below for additional information on indirect benefits a Fund Adviser may receive as a result of its relationship with the Funds.
Based on a consideration of all the information provided, the Board noted that Nuveen’s and the Sub-Adviser’s level of profitability was acceptable and not unreasonable in light of the services provided.
| D. | | Economies of Scale and Whether Fee Levels Reflect These Economies of Scale |
When evaluating the level of the advisory fees, the Independent Board Members considered whether there will be any economies of scale that may be realized by the Fund Adviser as a Fund grows and the extent to which these economies were shared with the Funds and shareholders. The Board recognized that economies of scale are difficult to measure with precision; however, the Board considered that there were several ways the Fund Adviser may share the benefits of economies of scale with the Nuveen funds, including through breakpoints in the management fee schedule reducing the fee rates as asset levels grow, fee waivers and/or expense limitation agreements and the Adviser’s investment in its business which can enhance the services provided to the Nuveen funds. With respect to the fee structure, the Independent Board Members have recognized that economies of scale may be realized when a particular fund grows, but also when the total size of the fund complex grows (even if the assets of a particular fund in the complex have not changed or have decreased). Accordingly, subject to certain exceptions, the funds in the Nuveen complex pay a management fee to the Adviser which is generally comprised of a fund-level component and complex-level component, each of which has a breakpoint schedule. Subject to certain exceptions, the fund-level fee component declines as the assets of the particular fund grow and the complex-level fee component declines when eligible assets of all the Nuveen funds (except for Nuveen ETFs which are subject to a unitary fee) in the Nuveen complex combined grow. In addition, with respect to closed-end funds, the Independent Board Members noted that, although such funds may from time-to-time make additional share offerings, the growth of their assets would occur primarily through the appreciation of such funds’ investment portfolios.
The Independent Board Members reviewed the breakpoint and complex-wide schedules and any savings achieved from fee reductions as a result of the fund-level and complex-level breakpoints for the 2016 calendar year.
In addition, the Independent Board Members recognized the Adviser’s ongoing investment in its business to expand or enhance the services provided to the benefit of all of the Nuveen funds.
Based on their review, the Board concluded that the current fee structure was acceptable and reflected economies of scale to be shared with shareholders when assets under management increase.
The Independent Board Members received and considered information regarding other benefits the respective Fund Adviser or its affiliates may receive as a result of their relationship with the Nuveen funds, including compensation paid to affiliates of a Fund Adviser for services rendered to the funds and research services received by a Fund Adviser from broker-dealers that
Annual Investment Management Agreement Approval Process (continued)
execute fund trades. The Independent Board Members noted that affiliates of the Adviser may receive compensation for serving as a co-manager for initial public offerings of new Nuveen closed-end funds and as underwriter on shelf offerings for certain existing funds. The Independent Board Members considered the compensation paid for such services in 2016.
In addition to the above, the Independent Board Members considered that the Funds’ portfolio transactions are allocated by the Sub-Adviser and the Sub-Adviser may benefit from research received from broker-dealers that execute Fund portfolio transactions. The Board noted, however, that with respect to transactions in fixed income securities, such securities generally trade on a principal basis and do not generate soft dollar credits. Although the Board recognized the Sub-Adviser may benefit from a soft dollar arrangement if it does not have to pay for this research out of its own assets, the Board also recognized that the research may benefit the Funds to the extent it enhances the ability of the Sub-Adviser to manage the Funds.
Based on their review, the Board concluded that any indirect benefits received by a Fund Adviser as a result of its relationship with the Funds were reasonable and within acceptable parameters.
The Board Members did not identify any single factor discussed previously as all-important or controlling. The Board Members, including the Independent Board Members, concluded that the terms of each Advisory Agreement were fair and reasonable, that the respective Fund Adviser’s fees were reasonable in light of the services provided to each Fund and that the Advisory Agreements be renewed.
Notes
Notes
Notes
| | | | | | | | | | | | | | |
| | | | | | | | |
| | | | |
| | | | | | | | |
| | |
| | Nuveen: | | |
| | | | Serving Investors for Generations | | | | |
| | |
| | | | |
| | | |
| | | | Since 1898, financial advisors and their clients have relied on Nuveen to provide
dependable investment solutions through continued adherence to proven, long-term investing
principles. Today, we offer a range of high quality solutions designed to
be integral components of a well-diversified core portfolio.
| | |
| | | |
| | | | | | |
| | | | |
| | | | | | Focused on meeting investor needs. Nuveen is the investment management arm of TIAA. We have grown into one of the world’s premier global asset managers, with specialist knowledge across all major asset classes and particular strength in solutions that provide income for investors and that draw on our expertise in alternatives and responsible investing. Nuveen is driven not only by the independent investment processes across the firm, but also the insights, risk management, analytics and other tools and resources that a truly world-class platform provides. As a global asset manager, our mission is to work in partnership with our clients to create solutions which help them secure their financial future. | | |
| | | | | |
| | | | | | | | | | |
| | | | | | Find out how we can help you.
To learn more about how the products and services of Nuveen
may be able to help you meet your financial goals, talk to your
financial advisor, or call us at (800) 257-8787. Please read the information
provided carefully before you invest. Investors should consider the
investment objective and policies, risk considerations, charges and
expenses of any investment carefully. Where applicable, be sure to obtain a
prospectus, which contains this and other relevant information. To obtain
a prospectus, please contact your securities representative or Nuveen,
333 W. Wacker Dr., Chicago, IL 60606. Please read the
prospectus carefully before you invest or send money.
Learn more about Nuveen Funds at: www.nuveen.com/cef
| | |
| | | | | | |
| | | | | | | | | | | | |
| | Securities offered through Nuveen Securities, LLC, member FINRA and SIPC | 333 West Wacker Drive Chicago, IL 60606 | www.nuveen.com | | |
ESA-N-0617D 243991-INV-B-08/18
Item 2. Code of Ethics.
Not applicable to this filing.
Item 3. Audit Committee Financial Expert.
Not applicable to this filing.
Item 4. Principal Accountant Fees and Services.
Not applicable to this filing.
Item 5. Audit Committee of Listed Registrants.
Not applicable to this filing.
Item 6. Schedule of Investments.
(a) See Portfolio of Investments in Item 1.
(b) Not applicable.
Item 7. Disclosure of Proxy Voting Policies and Procedures for Closed-End Management Investment Companies.
Not applicable to this filing.
Item 8. Portfolio Managers of Closed-End Management Investment Companies.
Not applicable to this filing.
Item 9. Purchases of Equity Securities by Closed-End Management Investment Company and Affiliated Purchasers.
Not applicable.
Item 10. Submission of Matters to a Vote of Security Holders.
There have been no material changes to the procedures by which shareholders may recommend nominees to the registrant’s Board implemented after the registrant last provided disclosure in response to this item.
Item 11. Controls and Procedures.
| (a) | The registrant’s principal executive and principal financial officers, or persons performing similar functions, have concluded that the registrant’s disclosure controls and procedures (as defined in Rule 30a-3(c) under the Investment Company Act of 1940, as amended (the “1940 Act”) (17 CFR 270.30a-3(c))) are effective, as of a date within 90 days of the filing date of this report that includes the disclosure required by this paragraph, based on their evaluation of the controls and procedures required by Rule 30a-3(b) under the 1940 Act (17 CFR 270.30a-3(b)) and Rules 13a-15(b) or 15d-15(b) under the Securities Exchange Act of 1934, as amended (the “Exchange Act”) (17 CFR 240.13a-15(b) or 240.15d-15(b)). |
| (b) | There were no changes in the registrant’s internal control over financial reporting (as defined in Rule 30a-3(d) under the 1940 Act (17 CFR 270.30a-3(d)) that occurred during the second fiscal quarter of the period covered by this report that has materially affected, or is reasonably likely to materially affect, the registrant’s internal control over financial reporting. |
Item 12. Exhibits.
File the exhibits listed below as part of this Form.
(a)(1) Any code of ethics, or amendment thereto, that is the subject of the disclosure required by Item 2, to the extent that the registrant intends to satisfy the Item 2 requirements through filing of an exhibit: Not applicable to this filing.
(a)(2) A separate certification for each principal executive officer and principal financial officer of the registrant as required by Rule 30a-2(a) under the 1940 Act (17 CFR 270.30a-2(a)) in the exact form set forth below: See EX-99.CERT attached hereto.
(a)(3) Any written solicitation to purchase securities under Rule 23c-1 under the 1940 Act (17 CFR 270.23c-1) sent or given during the period covered by the report by or on behalf of the registrant to 10 or more persons: Not applicable.
(b) If the report is filed under Section 13(a) or 15(d) of the Exchange Act, provide the certifications required by Rule 30a-2 (b) under the 1940 Act (17 CFR 270.30a-2(b)), Rule 13a-14(b) or Rule 15d-14(b) under the Exchange Act (17 CFR 240.13a-14(b) or 240.15d-14(b)), and Section 1350 of Chapter 63 of Title 18 of the United States Code (18 U.S.C. 1350) as an Exhibit. A certification furnished pursuant to this paragraph will not be deemed “filed” for purposes of Section 18 of the Exchange Act (15 U.S.C. 78r), or otherwise subject to the liability of that section. Such certification will not be deemed to be incorporated by reference into any filing under the Securities Act of 1933 or the Exchange Act, except to the extent that the registration specifically incorporates it by reference: See EX-99.906 CERT attached hereto.
SIGNATURES
Pursuant to the requirements of the Securities Exchange Act of 1934 and the Investment Company Act of 1940, the registrant has duly caused this report to be signed on its behalf by the undersigned, thereunto duly authorized.
(Registrant) Nuveen High Income November 2021 Target Term Fund
| | | | |
| By (Signature and Title) | | /s/ Gifford R. Zimmerman | | |
| | Gifford R. Zimmerman | | |
| | Vice President and Secretary | | |
Date: September 7, 2017
Pursuant to the requirements of the Securities Exchange Act of 1934 and the Investment Company Act of 1940, this report has been signed below by the following persons on behalf of the registrant and in the capacities and on the dates indicated.
| | | | |
| By (Signature and Title) | | /s/ Cedric H. Antosiewicz | | |
| | Cedric H. Antosiewicz | | |
| | Chief Administrative Officer | | |
| | (principal executive officer) | | |
Date: September 7, 2017
| | | | |
| By (Signature and Title) | | /s/ Stephen D. Foy | | |
| | Stephen D. Foy | | |
| | Vice President and Controller | | |
| | (principal financial officer) | | |
Date: September 7, 2017