UNITED STATES
SECURITIES AND EXCHANGE COMMISSION
Washington, D.C. 20549
FORM N-CSR
CERTIFIED SHAREHOLDER REPORT OF REGISTERED
MANAGEMENT INVESTMENT COMPANIES
| | |
| Investment Company Act file number | | 811-23075 |
Nuveen High Income November 2021 Target Term Fund
(Exact name of registrant as specified in charter)
Nuveen Investments
333 West Wacker Drive, Chicago, IL 60606
(Address of principal executive offices) (Zip code)
Gifford R. Zimmerman
Nuveen Investments
333 West Wacker Drive, Chicago, IL 60606
(Name and address of agent for service)
Registrant’s telephone number, including area code: (312) 917-7700
Date of fiscal year end: December 31
Date of reporting period: June 30, 2019
Form N-CSR is to be used by management investment companies to file reports with the Commission not later than 10 days after the transmission to stockholders of any report that is required to be transmitted to stockholders under Rule 30e-1 under the Investment Company Act of 1940 (17 CFR 270.30e-1). The Commission may use the information provided on Form N-CSR in its regulatory, disclosure review, inspection, and policy making roles.
A registrant is required to disclose the information specified by Form N-CSR, and the Commission will make this information public. A registrant is not required to respond to the collection of information contained in Form N-CSR unless the Form displays a currently valid Office of Management and Budget (“OMB”) control number. Please direct comments concerning the accuracy of the information collection burden estimate and any suggestions for reducing the burden to Secretary, Securities and Exchange Commission, 450 Fifth Street, NW, Washington, DC 20549-0609. The OMB has reviewed this collection of information under the clearance requirements of 44 U.S.C. ss.3507.
ITEM 1. REPORTS TO STOCKHOLDERS.

Closed-End Funds
30 June 2019
Nuveen Closed-End Funds
| | |
| JHY | | Nuveen High Income 2020 Target Term Fund |
| JHD | | Nuveen High Income December 2019 Target Term Fund |
| JHB | | Nuveen High Income November 2021 Target Term Fund |
| JHAA | | Nuveen High Income 2023 Target Term Fund |
Beginning on January 1, 2021, as permitted by regulations adopted by the Securities and Exchange Commission, paper copies of the Funds’ annual and semi-annual shareholder reports will no longer be sent by mail, unless you specifically request paper copies of the reports. Instead, the reports will be made available on the Funds’ website (www.nuveen.com), and you will be notified by mail each time a report is posted and provided with a website link to access the report.
If you have already elected to receive shareholder reports electronically, you will not be affected by this change and you need not take any action. You may elect to receive shareholder reports and other communications from the Funds electronically anytime by contacting the financial intermediary (such as a broker-dealer or bank) through which you hold your Fund shares or, if you are a direct investor, by enrolling at www.nuveen.com/e-reports.
You may elect to receive all future shareholder reports in paper free of charge at any time by contacting your financial intermediary or, if you are a direct investor, (i) by calling 800-257-8787 and selecting option #2 or (ii) by logging into your Investor Center account at www.computershare.com/investor and clicking on “Communication Preferences.” Your election to receive reports in paper will apply to all funds held in your account with your financial intermediary or, if you are a direct investor, to all your directly held Nuveen Funds and any other directly held funds within the same group of related investment companies.
Semiannual Report
Life is Complex
Nuveen makes things e-simple.
It only takes a minute to sign up fore-Reports. Once enrolled, you’ll receive ane-mail as soon as your Nuveen Fund information is ready—no more waiting for delivery by regular mail. Just click on the link within thee-mail to see the report and save it on your computer if you wish.
Free e-Reports right to your email!
www.investordelivery.com
If you receive your Nuveen Fund dividends and statements from your financial advisor or brokerage account.
or
www.nuveen.com/client-access
If you receive your Nuveen Fund dividends and statements directly from Nuveen.
NOT FDIC INSURED MAY LOSE VALUE NO BANK GUARANTEE
Table of Contents
3
Chairman’s Letter to Shareholders

Dear Shareholders,
The worries weighing on markets at the end of 2018 appeared to dissipate in early 2019 as positive economic and corporate earnings news, more dovish signals from central banks and trade progress boosted investor confidence. However, political noise and trade disputes continue to drive short-term market volatility and weigh on longer-term outlooks. Investors are concerned that increased tariffs and a protracted stalemate between the U.S. and its trading partners could dampen business and consumer sentiment, weakening spending and potentially impacting the global economy. Acknowledging similar concerns, the U.S. Federal Reserve recently lowered its benchmark interest rate 0.25% for the first time in a decade and will stop reducing its bond portfolio sooner than planned to help stimulate the U.S. economy. As the current U.S. economic expansion has reached the 10-year mark this summer, it’s important to note that economic expansions don’t die of old age, but mature economic cycles can be more vulnerable to an exogenous shock.
Until a clearer picture on trade emerges, more bouts of market turbulence are likely in the meantime. While the downside risks warrant careful monitoring, we believe the likelihood of a near-term recession remains low. Global economic growth is moderating but still expanding, with demand driven by the historically low unemployment in the U.S., Japan and across Europe. Some central banks have begun to adjust monetary policy to help sustain growth and others continue to emphasize their readiness to act, while China’s authorities remain committed to keeping economic growth rates steady with fiscal and monetary policy.
The opportunity set may be narrower, but we believe there is still scope for gains in this environment. Patience and maintaining perspective can help you weather periodic market volatility. We encourage you to work with your financial advisor to assess short-term market movements in the context of your time horizon, risk tolerance and investment goals. On behalf of the other members of the Nuveen Fund Board, we look forward to continuing to earn your trust in the months and years ahead.
Sincerely,

Terence J. Toth
Chairman of the Board
August 23, 2019
4
Portfolio Managers’ Comments
Nuveen High Income 2020 Target Term Fund (JHY)
Nuveen High Income December 2019 Target Term Fund (JHD)
Nuveen High Income November 2021 Target Term Fund (JHB)
Nuveen High Income 2023 Target Term Fund (JHAA)
Nuveen High Income 2020 Target Term Fund (JHY), Nuveen High Income December 2019 Target Term Fund (JHD), Nuveen High Income November 2021 Target Term Fund (JHB) and Nuveen High Income 2023 Target Term Fund (JHAA) areclosed-end funds that are advised by Nuveen Fund Advisors, LLC (NFAL) and feature portfolio management by Nuveen Asset Management, LLC (NAM). Effective December 31, 2018, John Fruit and Jeff Schmitz were no longer portfolio managers on the Funds and Timothy A. Palmer, CFA, Anders Persson, CFA, and Michael Ainge, CFA, became the portfolio managers on the Funds. Effective March 26, 2019, Kevin Lorenz, CFA, was added as a portfolio manager of the Fund. Effective July 31, 2019 (subsequent to the close of the reporting period), Timothy Palmer will no longer be a portfolio manager on the Fund.
In January 2019, the Nuveen High Income December 2019 Target Term Fund (JHD) entered thewind-up period in anticipation of its termination date. The Fund is a “target term” Fund that will cease its investment operations and liquidate its portfolio on December 1, 2019 and distribute the net proceeds to shareholders, unless the term is extended for a period of up to six months by a vote of the Fund’s Board of Trustees.
During thewind-up period, the Fund may deviate from its investment objectives and policies, and may invest up to 100% of its managed assets in high quality, short-term securities. High quality, short-term securities for this Fund include securities rated investment grade(BBB-/Baa3 or higher or unrated but judged by the Fund’s subadviser to be of comparable quality) with a final or remaining maturity of 397 days or less. Consequently, for the remainder of its term, the Fund will invest at least 80% of its managed assets in below investment grade securities; and short-term investment grade securities that have a final or remaining maturity of 397 days or less, as long as the maturity does not occur later than June 1, 2020. These expanded investment parameters will provide the Fund with additional flexibility to reinvest the proceeds of matured or called portfolio securities in higher quality, short-term securities. As the Fund gets closer to its termination date, we will begin to transition its remaining below investment grade portfolio holdings to high quality, short-term securities to enhance its ability to efficiently liquidate its portfolio at termination.
Here the Funds’ portfolio management team discusses key investment strategies and the Funds’ performance for thesix-month reporting period ended June 30, 2019.
This material is not intended to be a recommendation or investment advice, does not constitute a solicitation to buy, sell or hold a security or an investment strategy and is not provided in a fiduciary capacity. The information provided does not take into account the specific objectives or circumstances of any particular investor, or suggest any specific course of action. Investment decisions should be made based on an investor’s objectives and circumstances and in consultation with his or her advisors.
Certain statements in this report are forward-looking statements. Discussions of specific investments are for illustration only and are not intended as recommendations of individual investments. The forward-looking statements and other views expressed herein are those of the portfolio managers as of the date of this report. Actual future results or occurrences may differ significantly from those anticipated in any forward-looking statements and the views expressed herein are subject to change at any time, due to numerous market and other factors. The Funds disclaim any obligation to update publicly or revise any forward-looking statements or views expressed herein.
For financial reporting purposes, the ratings disclosed are the highest rating given by one of the following national rating agencies: Standard & Poor’s (S&P), Moody’s Investors Service, Inc. (Moody’s) or Fitch, Inc. (Fitch). This treatment of split-rated securities may differ from that used for other purposes, such as for Fund investment policies. Credit ratings are subject to change. AAA, AA, A and BBB are investment grade ratings; BB, B, CCC, CC, C and D are below investment grade ratings. Holdings designated N/R are not rated by these national rating agencies.
Refer to the Glossary of Terms Used in this Report for further definition of the terms used within this section.
5
Portfolio Managers’ Comments(continued)
Nuveen High Income 2020 Target Term Fund (JHY)
What key strategies were used to manage the Fund during thissix-month reporting period ended June 30, 2019?
The Fund has an objective to provide a high level of current income and to return the original $9.85 net asset value (NAV) per common share on or about November 1, 2020. The Fund will seek to achieve its investment objectives by investing primarily in shorter maturity, high yield (below investment grade) corporate debt securities. High yield bonds typically offer higher yields than investment grade bonds, in exchange for greater credit risk. Bonds with shorter maturities have lower duration (or interest rate sensitivity) than longer maturity bonds, which may help mitigate price declines if rates rise.
The Fund may invest in other types of securities including senior loans, convertible securities and other types of debt instruments and derivatives that provide comparable economic exposure to the corporate debt market. At least 80% of its managed assets will be in corporate debt securities and separately, at least 80% in securities that, at the time of investment, are rated below investment grade or are unrated but judged by the portfolio managers to be of comparable quality. No more than 15% will be in securities rated CCC+/Caa1 or lower at the time of investment. Up to 30% may be in securities ofnon-U.S. issuers, including up to 20% in emerging market issuers and up to 10% may be innon- U.S. dollar denominated securities.
The Fund seeks to identify securities across diverse sectors and industries that the managers believe are undervalued or mispriced. In seeking to return the original NAV on or about November 1, 2020, the Fund intends to utilize various portfolio and cash flow management techniques, including setting aside a portion of its net investment income, possibly retaining gains and limiting the longest maturity of any holding to no later than May 1, 2021. The Fund also uses leverage.
How did the Fund perform during thissix-month reporting period ended June 30, 2019?
The table in the Performance Overview and Holding Summaries section of this report provides total return performance for the Fund for thesix-month,one-year and since inception periods ended June 30, 2019. For thesix-month reporting period ended June 30, 2019, the Fund underperformed the Bloomberg Barclays U.S. High Yield1-5 Year Cash Pay 2% Issuer Capped Index based on the Fund’s total return at NAV.
As 2019 got underway, the U.S. high yield market saw a swift reversal from its sharp 2018year-endsell-off, leading to the strongest first-quarter return for the sector in more than 25 years. The asset class benefited from the Federal Reserve’s (Fed’s) abrupt shift to a more dovish tone as policymakers acknowledged economic headwinds and the benign inflation environment. The policy pivot reduced the threat of a possible recession, driving a strong rally across fixed income spread sectors led by U.S. high yield. More broadly speaking, the high yield segment also continued to be supported by falling interest rates, healthy credit fundamentals and sustained low defaults, combined with technical support in the form of solid inflows and no significant increase in new issue supply. Approximately $12 billion flowed into U.S. high yield during the reporting period. In May 2019, the high yield market, along with other risk assets, sold off briefly amid a spike in market volatility as U.S./China trade tensions intensified, with the segment recording its only negative monthly returnyear-to-date in 2019. However in June 2019, Fed policymakers signaled a readiness to cut rates later this year to continue the economic expansion, which again benefited high yield as the reporting period drew to a close. The U.S. high yield sector rallied again in June to finish strongly for the first half of 2019 with spreads tightening by 149 basis points over the course of the reporting period to end at 377 basis points over Treasuries.
The Fund underperformed the benchmark during the reporting period in part as a result of its greater exposure to shorter-maturity bonds as it gets closer to the approaching target-term date. These bonds traded near their call prices and had less room to appreciate. Security selection in the industrial sector also detracted. Within the communications
6
sub-sector, weakness was fairly widespread across holdings in the wireless, cable satellite, wireline and media entertainment spaces. The Fund also underperformed in the health care and pharmaceutical areas of the consumernon-cyclicalsub-sector. In consumer cyclicals, the Fund saw negative results from holdings in the home construction and gamingsub-sectors. Select holdings in financial companies also detracted. On the other hand, the Fund’s holdings in the basic industry and energy sectors rallied and outperformed. In basic industry, the Fund benefited from holdings within the metals/mining and chemicals spaces. Within the energy sector, positions in independent energy producers aided results.
The Fund’s NAV rose fairly significantly along with the strong high yield market conditions, driven in part by a sharp decrease in yields during the reporting period. During the reporting period, the Fund’s NAV increased by $0.34 per share and ended the reporting period close to its termination target at $9.82 per share. Throughout the reporting period, Treasury yields fell with the greatest decline taking place in thethree-to-seven year maturity range, helping to drive an inversion at the front end of the Treasury yield curve (where short-term interest rates are higher than longer-terms rates). The yield onone-year Treasuries, for example, fell 71 basis points to end at 1.92%, while the yield on five-year Treasury securities ended the reporting period at 1.76%, which was 75 basis points lower than it was at the end of 2018.
We saw little in the way of fundamental credit deterioration among portfolio credits and the Fund had no defaults. While we continue to attempt to maximize portfolio yield where achievable, we do so within the context of protecting the Fund’s credit quality and positioning the portfolio to alleviate the effects of early calls or redemptions as we get closer to termination. We have seen and expect to see additional call activity given the downward trend in rates and the propensity for issuers to refinance their short-term debt and replace it with longer maturities. As of the end of the reporting period, the Fund was on track to return its original NAV as described in its prospectus.
Nuveen High Income December 2019 Target Term Fund (JHD)
What key strategies were used to manage the Fund during thissix-month reporting period ended June 30, 2019?
The Fund has an objective to provide a high level of current income and to return the original $9.86 net asset value (NAV) per common share on or about December 1, 2019. The Fund will seek to achieve its investment objectives by investing primarily in shorter maturity, high yield (below investment grade) corporate debt securities. High yield bonds typically offer higher yields than investment grade bonds, in exchange for greater credit risk. Bonds with shorter maturities have lower duration (or interest rate sensitivity) than longer maturity bonds, which may help mitigate price declines if rates rise.
The Fund may invest in other types of securities including senior loans, convertible securities and other types of debt instruments and derivatives that provide comparable economic exposure to the corporate debt market. At least 80% of its managed assets will be in corporate debt securities and separately, at least 80% in securities that, at the time of investment, are rated below investment grade or are unrated but judged by the portfolio managers to be of comparable quality. No more than 15% will be in securities rated CCC+/Caa1 or lower at the time of investment. Up to 30% may be in securities ofnon-U.S. issuers, including up to 20% in emerging market issuers and up to 10% may be innon- U.S. dollar denominated securities.
The Fund seeks to identify securities across diverse sectors and industries that the managers believe are undervalued or mispriced. In seeking to return the original NAV on or about December 1, 2019, the Fund intends to utilize various portfolio and cash flow management techniques, including setting aside a portion of its net investment income, possibly retaining gains and limiting the longest maturity of any holding to no later than June 1, 2020. The Fund also uses leverage.
7
Portfolio Managers’ Comments(continued)
How did the Fund perform during thissix-month reporting period ended June 30, 2019?
The table in the Performance Overview and Holding Summaries section of this report provides total return performance for the Fund for thesix-month,one-year and since inception periods ended June 30, 2019. For thesix-month reporting period ended June 30, 2019, the Fund underperformed the Bloomberg Barclays U.S. High Yield1-5 Year Cash Pay 2% Issuer Capped Index based on the Fund’s total return at NAV.
As 2019 got underway, the U.S. high yield market saw a swift reversal from its sharp 2018year-endsell-off, leading to the strongest first-quarter return for the sector in more than 25 years. The asset class benefited from the Federal Reserve’s (Fed’s) abrupt shift to a more dovish tone as policymakers acknowledged economic headwinds and the benign inflation environment. The policy pivot reduced the threat of a possible recession, driving a strong rally across fixed income spread sectors led by U.S. high yield. More broadly speaking, the high yield segment also continued to be supported by falling interest rates, healthy credit fundamentals and sustained low defaults, combined with technical support in the form of solid inflows and no significant increase in new issue supply. Approximately $12 billion flowed into U.S. high yield during the reporting period. In May 2019, the high yield market, along with other risk assets, sold off briefly amid a spike in market volatility as U.S./China trade tensions intensified, with the segment recording its only negative monthly returnyear-to-date in 2019. However in June 2019, Fed policymakers signaled a readiness to cut rates later this year to continue the economic expansion, which again benefited high yield as the reporting period drew to a close. The U.S. high yield sector rallied again in June to finish strongly for the first half of 2019 with spreads tightening by 149 basis points over the course of the reporting period to end at 377 basis points over Treasuries.
The Fund underperformed the benchmark during the reporting period largely as a result of its significant exposure to shorter-maturity bonds due to the approaching target-term date. These bonds traded near their call prices and had less room to appreciate. Security selection in the high yield sector, particularly in the industrial area, also detracted. In the consumer cyclicals area, the Fund saw negative results from holdings in the home construction and gamingsub-sectors. Within the communicationssub-sector, weakness was fairly widespread across holdings in the cable satellite, wireless and wireline spaces. The Fund also underperformed in the health care and pharmaceutical areas of the consumernon-cyclicalsub-sector. Select holdings in financial companies also detracted.
The Fund’s NAV rose along with the strong high yield market conditions, driven in part by a sharp decrease in yields during the reporting period. During the reporting period, the Fund’s NAV increased by $0.11 per share and ended the reporting period above its termination target at $10.00 per share. Throughout the reporting period, Treasury yields fell with the greatest decline taking place in thethree-to-seven year maturity range, helping to drive an inversion at the front end of the Treasury yield curve (where short-term interest rates are higher than longer-terms rates). The yield onone-year Treasuries, for example, fell 71 basis points to end at 1.92%, while the yield on five-year Treasury securities ended the reporting period at 1.76%, which was 75 basis points lower than it was at the end of 2018.
We began the Fund’s deleveraging process in April 2018 as yields available on suitable new investments in most cases were not attractive enough to deploy the use of leverage. Thisde-leveraging process is now complete. The elimination of leverage is also consistent with our managing the evolution of the Fund toward its termination in December 2019.
We continue to hold a portion of portfolio assets that mature within thesix-month window after the Fund’s stated termination, in accordance with prospectus guidelines, which we plan to liquidate in advance of termination. We are increasingly reinvesting the proceeds of called and matured securities into higher quality and short-dated instruments as we move closer to the termination date. These developments are consistent with our expectations and with the guidelines we set forth in the prospectus at the Fund’s inception.
We saw little in the way of fundamental credit deterioration among portfolio credits and the Fund had no defaults. While we continue to attempt to maximize portfolio yield where achievable, we do so within the context of protecting the Fund’s credit quality and positioning the portfolio to alleviate the effects of early calls or redemptions as we
8
approach termination. We have seen and expect to see additional call activity given the downward trend in rates and the propensity for issuers to refinance their short-term debt and replace it with longer maturities. As of the end of the reporting period, the Fund was on track to return its original NAV as described in its prospectus.
Nuveen High Income November 2021 Target Term Fund (JHB)
What key strategies were used to manage the Fund during thissix-month reporting period ended June 30, 2019?
The Fund has an objective to provide a high level of current income and to return the original $9.85 net asset value (NAV) per common share on or about November 1, 2021. The Fund will seek to achieve its investment objectives by investing primarily in shorter maturity, high yield (below investment grade) corporate debt securities. High yield bonds typically offer higher yields than investment grade bonds, in exchange for greater credit risk. Bonds with shorter maturities have lower duration (or interest rate sensitivity) than longer maturity bonds, which may help mitigate price declines if rates rise.
The Fund may invest in other types of securities including senior loans, convertible securities and other types of debt instruments and derivatives that provide comparable economic exposure to the corporate debt market. At least 80% of its managed assets will be in corporate debt securities and separately, at least 80% in securities that, at the time of investment, are rated below investment grade or are unrated but judged by the portfolio managers to be of comparable quality. No more than 15% will be in securities rated CCC+/Caa1 or lower at the time of investment. Up to 30% may be in securities ofnon-U.S. issuers, including up to 20% in emerging market issuers, and up to 10% may be innon- U.S. dollar denominated securities.
The Fund seeks to identify securities across diverse sectors and industries that the managers believe are undervalued or mispriced. In seeking to return the original NAV on or about November 1, 2021, the Fund intends to utilize various portfolio and cash flow management techniques, including setting aside a portion of its net investment income, possibly retaining gains and limiting the longest maturity of any holding to no later than May 1, 2022. The Fund also uses leverage.
How did the Fund perform during thissix-month reporting period ended June 30, 2019?
The table in the Performance Overview and Holding Summaries section of this report provides total return performance for the Fund for thesix-month,one-year and since inception periods ended June 30, 2019. For thesix-month reporting period ended June 30, 2019, the Fund outperformed the Bloomberg Barclays U.S. High Yield1-5 Year Cash Pay 2% Issuer Capped Index based on the Fund’s total return at NAV.
As 2019 got underway, the U.S. high yield market saw a swift reversal from its sharp 2018year-end selloff, leading to the strongest first-quarter return for the sector in more than 25 years. The asset class benefited from the Federal Reserve’s (Fed’s) abrupt shift to a more dovish tone as policymakers acknowledged economic headwinds and the benign inflation environment. The policy pivot reduced the threat of a possible recession, driving a strong rally across fixed income spread sectors led by U.S. high yield. More broadly speaking, the high yield segment also continued to be supported by falling interest rates, healthy credit fundamentals and sustained low defaults, combined with technical support in the form of solid inflows and no significant increase in new issue supply. Approximately $12 billion flowed into U.S. high yield during the reporting period. In May 2019, the high yield market, along with other risk assets, sold off briefly amid a spike in market volatility as U.S./China trade tensions intensified, with the segment recording its only negative monthly returnyear-to-date in 2019. However in June 2019, Fed policymakers signaled a readiness to cut rates later this year to continue the economic expansion, which again benefited high yield as the period drew to a close. The U.S. high yield sector rallied again in June to finish strongly for the first half of 2019 with spreads tightening by 149 basis points over the course of the period to end at 377 basis points over Treasuries.
9
Portfolio Managers’ Comments(continued)
The Fund outperformed the benchmark during the reporting period, largely as a result of the positive impact from its security selection within the high yield segment. In particular, the Fund’s high yield holdings in the industrial area rallied and outperformed with favorable results experienced from its holdings in basic industry and energy. In the basic industry area, the Fund benefited from holdings within the metals/mining space. Within energy, positions in independent energy producers aided results. On the other hand, the Fund underperformed in financial companies as well as in the consumer cyclical sector. Within the communicationssub-sector, we also saw weakness from holdings in the wireless space.
The Fund’s NAV rose fairly significantly along with the strong high yield market conditions, driven in part by a sharp decrease in yields during the reporting period. During the reporting period, the Fund’s NAV increased by $0.49 per share and ended the reporting period above its termination target at $9.99 per share. Throughout the reporting period, Treasury yields fell with the greatest decline taking place in thethree-to-seven year maturity range, helping to drive an inversion at the front end of the Treasury yield curve (where short-term interest rates are higher than longer-terms rates). The yield onone-year Treasuries, for example, fell 71 basis points to end at 1.92%, while the yield on five-year Treasury securities ended the reporting period at 1.76%, which was 75 basis points lower than it was at the end of 2018.
We saw little in the way of fundamental credit deterioration among portfolio credits and the Fund had no defaults. We continued to manage the composition of credit risk in the portfolio and adjust individual credit positions based on developing research views and valuation changes, with the objective of optimizing portfolio yield and maintaining credit discipline for the Fund’s investment horizon. We also continued to manage calls, maturities and the cash flow profile of the Fund with the target of managing yield in light of the Fund’s termination date.
Nuveen High Income 2023 Target Term Fund (JHAA)
What key strategies were used to manage the Fund during thissix-month reporting period ended June 30, 2019?
The Fund has an objective to provide a high level of current income and to return the original $9.875 net asset value (NAV) per common share on or about December 1, 2023. The Fund seeks to protect against credit losses to help ensure the goal of returning its original NAV. While the Fund is designed to own more or less a static portfolio of high yield bonds, at times we have to add new securities to replace ones that have been called away or tendered. As we replace these bonds, we will seek to maximize the Fund’s yield within the maturity, diversification and credit quality constraints described at the outset of the strategy. We may also look to maximize the Fund’s yield through opportunistic sales of securities that we believe have reached their upside potential, investing the proceeds in other securities that have a more attractive yield or credit profile. Our goal is to monetize some holdings at a gain, which should help to offset any realized ormark-to-market losses that may occur elsewhere in the portfolio. We believe the Fund’s focus on shorter dated maturities, coupled with limitations to CCC rated securities, should result in lower volatility and help buffer its NAV performance during periods of weakness for the high yield market.
How did the Fund perform during thissix-month reporting period ended June 30, 2019?
The table in the Performance Overview and Holding Summaries section of this report provides total return performance for the Fund for thesix-month and since inception periods ended June 30, 2019. For thesix-month reporting period ended June 30, 2019, the Fund performed in line with the Bloomberg Barclays U.S. High Yield1-5 Year Cash Pay 2% Issuer Capped Index based on the Fund’s total return at NAV.
The Fund was launched on December 18, 2018, less than two weeks before this reporting period began. During that time, the high yield market was selling off sharply after risk sentiment turned negative amid concerns about economic growth, Federal Reserve rate hikes, trade tensions, a slowdown in the rate of earnings growth, and questions regarding the length of the credit cycle. The high yield segment saw large investor outflows, accelerating into the end of 2018,
10
which drove prices lower despite the positive technical of limited issuance. Due to the illiquidity associated withyear-end trading conditions, as well as the significant cheapening of the high yield market amid the forced selling, we waited until early in this reporting period to invest the proceeds from the Fund’s offering in accordance with prospectus guidelines. The Fund’s portfolio was fully invested by the end of January 2019.
The primary contributor to the Fund’s performance was the positive impact from its security selection within the high yield segment. In particular, the Fund’s high yield holdings in the industrial area rallied and outperformed with favorable results in basic industry, energy, consumer cyclicals and communications sectors. In the basic industry area, the Fund benefited from holdings within the metals/mining and chemicals spaces. Within the energy sector, positions in oil field services, midstream and independent companies aided results. In the consumer cyclicals area, the Fund saw positive results from holdings in the home constructionsub-sector.
Exposure to leveraged loans was a detractor during the reporting period. Although fundamentals remained strong in the segment as default activity declined, the market was hampered by continued outflows from the retail sector amid increasingly dovish language from the Fed and renewed global growth concerns. The segment underperformed the high yield market year to date and therefore detracted on a relative basis versus the benchmark, which is comprised of all high yield securities.
We were still in the process of investing the proceeds from the Fund’s offering at the start of the reporting period. Therefore, its cash position was also a fairly significant drag on performance given the strength of returns in the high yield market.
The Fund’s NAV rose fairly significantly along with the strong high yield market conditions, driven in part by a sharp decrease in yields during the reporting period. During the reporting period, the Fund’s NAV increased by $0.45 per share and ended the reporting period well above its termination target at $10.30 per share. Throughout the reporting period, Treasury yields fell with the greatest decline taking place in thethree-to-seven year maturity range, helping to drive an inversion at the front end of the Treasury yield curve (where short-term interest rates are higher than longer-terms rates). The yield onone-year Treasuries, for example, fell 71 basis points to end at 1.92%, while the yield on five-year Treasury securities ended the reporting period at 1.76%, which was 75 basis points lower than it was at the end of 2018.
We saw little in the way of fundamental credit deterioration among portfolio credits and the Fund had no defaults. We continued to manage the composition of credit risk in the portfolio and adjust individual credit positions based on developing research views and valuation changes, with the objective of optimizing portfolio yield and maintaining credit discipline for the Fund’s investment horizon. We also continued to manage calls, maturities and the cash flow profile of the Fund with the target of managing yield in light of the Fund’s termination date.
11
Fund Leverage
IMPACT OF THE FUNDS’ LEVERAGE STRATEGIES ON PERFORMANCE
One important factor impacting the returns of JHY’s, JHB’s and JHAA’s common shares relative to their comparative benchmarks was the Funds’ use of leverage through bank borrowings and for JHAA the use of reverse repurchase agreements. The Funds use leverage because our research has shown that, over time, leveraging provides opportunities for additional income and total return, particularly in the recent market environment where short-term market rates are at or near historical lows, meaning that the short-term rates the Fund has been paying on its leveraging instruments in recent years have been much lower than the interest the Fund has been earning on its portfolio securities that it has bought with the proceeds of that leverage.
However, use of leverage can expose Fund common shares to additional price volatility. When a Fund uses leverage, the Fund common shares will experience a greater increase in their net asset value if the securities acquired through the use of leverage increase in value, but will also experience a correspondingly larger decline in their net asset value if the securities acquired through leverage decline in value, which will make the shares’ net asset value more volatile, and total return performance more variable, over time.
In addition, common share income in levered funds will typically decrease in comparison to unlevered funds when short-term interest rates increase and increase when short-term interest rates decrease. Over the last few quarters, short-term interest rates have indeed increased from their extended lows after the 2007-09 financial crisis. This increase has reduced common share net income, and also reduced potential for long-term total returns. Nevertheless, the ability to effectively borrow at current short-term rates is still resulting in enhanced common share income, and management believes that the advantages of continuation of leverage outweigh the associated increase in risk and volatility described above.
The Funds’ use of leverage had a positive impact on total return performance during this reporting period.
As of June 30, 2019, the Funds’ percentages of leverage are shown in the accompanying table.
| | | | | | | | | | | | | | | | |
| | | JHY | | | JHD | | | JHB | | | JHAA | |
Effective Leverage* | | | 28.39 | % | | | — | | | | 27.04 | % | | | 24.06 | % |
Regulatory Leverage* | | | 28.39 | % | | | — | | | | 27.04 | % | | | 24.06 | % |
| * | Effective Leverage is a Fund’s effective economic leverage, and includes both regulatory leverage and the leverage effects of reverse repurchase agreements, certain derivative and other investments in a Fund’s portfolio that increase the Fund’s investment exposure. Regulatory leverage consists of preferred shares issued or borrowings of a Fund. Both of these are part of a Fund’s capital structure. A Fund, however, may from time to time borrow on a typically transient basis in connection with its day-to-day operations, primarily in connection with the need to settle portfolio trades. Such incidental borrowings are excluded from the calculation of a Fund’s effective leverage ratio. Regulatory leverage is subject to asset coverage limits set forth in the Investment Company Act of 1940. |
THE FUNDS’ REGULATORY LEVERAGE
Bank Borrowings
As noted above, the Funds employ leverage through the use of bank borrowings. The Funds’ bank borrowing activities are as shown in the accompanying table.
| | | | | | | | | | | | | | | | | | | | | | | | | | | | | | | | | | | | |
| | | Current Reporting Period | | | | | | Subsequent to the Close of
the Reporting Period | |
| Fund | | January 1, 2019 | | | Draws | | | Paydowns | | | June 30, 2019 | | | Average Balance
Outstanding | | | | | | Draws | | | Paydowns | | | August 27, 2019 | |
JHY | | $ | 61,500,000 | | | $ | — | | | $ | — | | | $ | 61,500,000 | | | $ | 61,500,000 | | | | | | | $ | — | | | $ | — | | | $ | 61,500,000 | |
JHD | | $ | — | | | $ | — | | | $ | — | | | $ | — | | | $ | — | | | | | | | $ | — | | | $ | — | | | $ | — | |
JHB | | $ | 190,000,000 | | | $ | 17,000,000 | | | $ | — | | | $ | 207,000,000 | | | $ | 205,779,006 | | | | | | | $ | — | | | $ | — | | | $ | 207,000,000 | |
JHAA | | $ | — | | | $ | 26,500,000 | | | $ | (1,000,000 | ) | | $ | 25,500,000 | | | $ | 24,091,160 | | | | | | | $ | 1,525,000 | | | $ | — | | | $ | 27,025,000 | |
Refer to Notes to Financial Statements, Note 8 – Fund Leverage, Borrowings for further details.
12
Reverse Repurchase Agreements
As noted above, JHAA utilized reverse repurchase agreements, in which the Fund sells to a counterparty a security that it holds with a contemporaneous agreement to repurchase the same security at an agreed-upon price and date. The Fund’s transactions in reverse repurchase agreements are as shown in the accompanying table.
| | | | | | | | | | | | | | | | | | | | | | | | | | | | | | | | | | | | |
| | | Current Reporting Period | | | | | | Subsequent to the Close of
the Reporting Period | |
| Fund | | January 1, 2019 | | | Sales | | | Purchases | | | June 30, 2019 | | | Average Balance
Outstanding | | | | | | Sales | | | Purchases | | | August 27, 2019 | |
JHAA | | $ | — | | | $ | 2,000,000 | | | $ | — | | | $ | 2,000,000 | | | $ | 2,000,000 | | | | | | | $ | — | | | $ | (1,510,000 | ) | | $ | 490,000 | |
Refer to Notes to Financial Statements, Note 8 – Fund Leverage, Reverse Repurchase Agreements for further details.
13
Common Share Information
COMMON SHARE DISTRIBUTION INFORMATION
The following information regarding the Funds’ distributions is current as of June 30, 2019. Each Fund’s distribution levels may vary over time based on each Fund’s investment activity and portfolio investment value changes.
During the current reporting period, the Funds’ distributions to common shareholders were as shown in the accompanying table.
| | | | | | | | | | | | | | | | |
| | | Per Share Amounts | |
| Monthly Distributions (Ex-Dividend Date) | | JHY | | | JHD | | | JHB | | | JHAA | |
January 2019 | | $ | 0.0390 | | | $ | 0.0325 | | | $ | 0.0465 | | | $ | — | |
February | | | 0.0390 | | | | 0.0325 | | | | 0.0465 | | | | 0.0520 | |
March | | | 0.0350 | | | | 0.0325 | | | | 0.0415 | | | | 0.0520 | |
April | | | 0.0350 | | | | 0.0325 | | | | 0.0415 | | | | 0.0520 | |
May | | | 0.0350 | | | | 0.0325 | | | | 0.0415 | | | | 0.0520 | |
June 2019 | | | 0.0350 | | | | 0.0325 | | | | 0.0415 | | | | 0.0520 | |
Total Distributions from Net Investment Income | | $ | 0.2180 | | | $ | 0.1950 | | | $ | 0.2590 | | | $ | 0.2600 | |
| | | | |
Current Distribution Rate* | | | 4.26 | % | | | 3.95 | % | | | 5.03 | % | | | 6.11 | % |
| * | Current distribution rate is based on the Fund’s current annualized monthly distribution divided by the Fund’s current market price. The Fund’s monthly distributions to its shareholders may be comprised of ordinary income, net realized capital gains and, if at the end of the fiscal year the Fund’s cumulative net ordinary income and net realized gains are less than the Fund’s distributions, a return of capital for tax purposes. |
Each Fund seeks to pay regular monthly dividends out of its net investment income at a rate that reflects its past and projected net income performance. To permit each Fund to maintain a more stable monthly dividend, the Fund may pay dividends at a rate that may be more or less than the amount of net income actually earned by the Fund during the period. Distributions to shareholders are determined on a tax basis, which may differ from amounts recorded in the accounting records. In instances where the monthly dividend exceeds the earned net investment income, the Fund would report a negative undistributed net ordinary income. Refer to Note 6 – Income Tax Information for additional information regarding the amounts of undistributed net ordinary income and undistributed net long-term capital gains and the character of the actual distributions paid by the Fund during the period.
All monthly dividends paid by each Fund during the current reporting period were paid from net investment income. If a portion of the Fund’s monthly distributions is sourced or comprised of elements other than net investment income, including capital gains and/or a return of capital, shareholders will be notified of those sources. For financial reporting purposes, the per share amounts of each Fund’s distributions for the reporting period are presented in this report’s Financial Highlights. For income tax purposes, distribution information for each Fund as of its most recent tax year end is presented in Note 6 – Income Tax Information within the Notes to Financial Statements of this report.
Change in Method of Publishing Nuveen Closed-End Fund Distribution Amounts
Beginning on or about November 1, 2019, the Nuveen Closed-End Funds will be discontinuing the practice of announcing Fund distribution amounts and timing via press release. Instead, information about the Nuveen Closed-End Funds’ monthly and quarterly periodic distributions to shareholders will be posted and can be found on Nuveen’s enhanced closed-end fund resource page, which is at www.nuveen.com/closed-end-fund-distributions, along with other Nuveen closed-end fund product updates. Shareholders can expect regular distribution information to be posted on www.nuveen.com on the first business day of each month. To ensure that our shareholders have timely access to the latest information, a subscribe function can be activated at this link here, or at this web page (www.nuveen.com/en-us/people/about-nuveen/for-the-media).
14
COMMON SHARE REPURCHASES
During August 2019 (subsequent to the close of the reporting period), the Funds’ Board of Trustees reauthorized JHY, JHD and JHB and authorized JHAA to participate in Nuveen’s closed-end fund complex-wide share repurchase program, allowing each Fund to repurchase an aggregate of up to approximately 10% of its outstanding shares.
As of June 30, 2019, and since the inception of the Funds’ repurchase programs, the Funds have cumulatively repurchased and retired their outstanding common shares as shown in the accompanying table.
| | | | | | | | | | | | |
| | | JHY | | | JHD | | | JHB | |
Common shares cumulatively repurchased and retired | | | — | | | | — | | | | — | |
Common shares authorized for repurchase | | | 1,575,000 | | | | 2,705,000 | | | | 5,585,000 | |
During the current reporting period, the Funds did not repurchase any of their outstanding common shares.
OTHER COMMON SHARE INFORMATION
As of June 30, 2019, and during the current reporting period, the Funds’ common share prices were trading at premium/(discount) to their common share NAVs as shown in the accompanying table.
| | | | | | | | | | | | | | | | |
| | | JHY | | | JHD | | | JHB | | | JHAA | |
Common share NAV | | $ | 9.82 | | | $ | 10.00 | | | $ | 9.99 | | | $ | 10.30 | |
Common share price | | $ | 9.86 | | | $ | 9.87 | | | $ | 9.91 | | | $ | 10.21 | |
Premium/(Discount) to NAV | | | 0.41 | % | | | (1.30 | )% | | | (0.80 | )% | | | (0.87 | )% |
6-month average premium/(discount) to NAV | | | 2.19 | % | | | (0.91 | )% | | | (1.38 | )% | | | 0.86 | % |
JHY, JHD, JHB and JHAA each have an investment objective to return $9.85, $9.86, $9.85 and $9.875, respectively (the original net asset value following each Fund’s initial public offering (the “Original NAV”)) to shareholders on or about the end of the Fund’s term. There can be no assurance that the Funds will be able to return the Original NAV to shareholders, and such return is not backed or otherwise guaranteed by the Funds’ investment adviser, Nuveen Fund Advisors, LLC (the “Adviser”), or any other entity.
Each Fund’s ability to return Original NAV to common shareholders on or about the termination date will depend on market conditions and the success of various portfolio and cash flow management techniques. Each Fund currently intends to set aside and retain in its net assets a portion of its net investment income and possibly all or a portion of its gains. This will reduce the amounts otherwise available for distribution prior to the liquidation of each Fund, and the Fund may incur taxes on such retained amount, which will reduce the overall amounts that the Fund would have otherwise been able to distribute. Such retained income or gains, net of any taxes, would constitute a portion of the liquidating distribution returned to investors at the end of each Fund’s term. In addition, each Fund’s investment in shorter term and lower yielding securities, especially as the Fund nears the end of its term, may reduce investment income and, therefore, the monthly dividends during the period prior to termination. Investors that purchase shares in the secondary market (particularly if their purchase price differs meaningfully from the Original NAV) may receive more or less than their original investment.
15
Risk Considerations
Fund shares are not guaranteed or endorsed by any bank or other insured depository institution, and are not federally insured by the Federal Deposit Insurance Corporation.
Nuveen High Income 2020 Target Term Fund (JHY)
Investing in closed-end funds involves risk; principal loss is possible. There is no guarantee the Fund’s investment objectives will be achieved. Closed-end fund shares may frequently trade at a discount or premium to their net asset value.Debt or fixed income securities such as those held by the Fund, are subject to market risk, credit risk, interest rate risk, derivatives risk, liquidity risk, and income risk. As interest rates rise, bond prices fall.Lower credit debt securities may be more likely to fail to make timely interest or principal payments and may be subject to higher liquidity risk.Leverage increases return volatility and magnifies the Fund’s potential return and its risks; there is no guarantee a fund’s leverage strategy will be successful.Foreign investments involve additional risks, including currency fluctuation, political and economic instability, lack of liquidity and differing legal and accounting standards. The risks of foreign investments are magnified in emerging markets. These and other risk considerations including the Fund’slimited term andcall risk are described in more detail on the Fund’s web page atwww.nuveen.com/JHY.
Nuveen High Income December 2019 Target Term Fund (JHD)
Investing in closed-end funds involves risk; principal loss is possible. There is no guarantee the Fund’s investment objectives will be achieved. Closed-end fund shares may frequently trade at a discount or premium to their net asset value.Debt or fixed income securities such as those held by the Fund, are subject to market risk, credit risk, interest rate risk, derivatives risk, liquidity risk, and income risk. As interest rates rise, bond prices fall.Lower credit debt securities may be more likely to fail to make timely interest or principal payments and may be subject to higher liquidity risk.Leverage increases return volatility and magnifies the Fund’s potential return and its risks; there is no guarantee a fund’s leverage strategy will be successful.Foreign investments involve additional risks, including currency fluctuation, political and economic instability, lack of liquidity and differing legal and accounting standards. The risks of foreign investments are magnified in emerging markets. These and other risk considerations including the Fund’slimited term andcall risk are described in more detail on the Fund’s web page atwww.nuveen.com/JHD.
Nuveen High Income November 2021 Target Term Fund (JHB)
Investing in closed-end funds involves risk; principal loss is possible. There is no guarantee the Fund’s investment objectives will be achieved. Closed-end fund shares may frequently trade at a discount or premium to their net asset value.Debt or fixed income securities such as those held by the Fund, are subject to market risk, credit risk, interest rate risk, derivatives risk, liquidity risk, and income risk. As interest rates rise, bond prices fall.Lower credit debt securities may be more likely to fail to make timely interest or principal payments and may be subject to higher liquidity risk.Leverage increases return volatility and magnifies the Fund’s potential return and its risks; there is no guarantee a fund’s leverage strategy will be successful.Foreign investments involve additional risks, including currency fluctuation, political and economic instability, lack of liquidity and differing legal and accounting standards. The risks of foreign investments are magnified in emerging markets. These and other risk considerations including the Fund’slimited term andcall risk are described in more detail on the Fund’s web page atwww.nuveen.com/JHB.
Nuveen High Income 2023 Target Term Fund (JHAA)
Investing in closed-end funds involves risk; principal loss is possible. There is no guarantee the Fund’s investment objectives will be achieved. Closed-end fund shares may frequently trade at a discount or premium to their net asset value.Debt or fixed income securities such as those held by the Fund, are subject to market risk, credit risk, interest rate risk, derivatives risk, liquidity risk, and income risk. As interest rates rise, bond prices fall.Lower credit debt securities may be more likely to fail to make timely interest or principal payments and may be subject to higher liquidity risk.
16
Adjustable Rate Senior Loans may not be fully secured by collateral, generally do not trade on exchanges, and are typically issued by unrated or below-investment grade companies, and therefore are subject to greater liquidity and credit risk.Leverage increases return volatility and magnifies the Fund’s potential return and its risks; there is no guarantee a fund’s leverage strategy will be successful.Foreign investments involve additional risks, including currency fluctuation, political and economic instability, lack of liquidity and differing legal and accounting standards. The risks of foreign investments are magnified in emerging markets. These and other risk considerations including the Fund’slimited term andcall risk are described in more detail on the Fund’s web page atwww.nuveen.com/JHAA.
17
| | |
| JHY | | Nuveen High Income 2020 Target Term Fund Performance Overview and Holding Summaries as of June 30, 2019 |
Refer to the Glossary of Terms Used in this Report for further definition of the terms used within this section.
Average Annual Total Returns as of June 30, 2019
| | | | | | | | | | | | |
| | | Cumulative | | | Average Annual | |
| | | 6-Month | | | 1-Year | | | Since
Inception | |
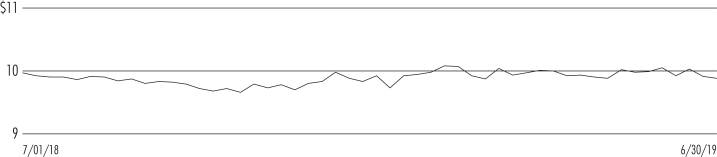
| JHY at Common Share NAV | | | 5.92% | | | | 5.56% | | | | 6.23% | |
| JHY at Common Share Price | | | 1.63% | | | | 3.24% | | | | 5.78% | |
| Bloomberg Barclays U.S. High Yield 1-5 Year Cash Pay 2% Issuer Capped Index | | | 7.24% | | | | 5.33% | | | | 5.86% | |
Since inception returns are from 7/28/15. Past performance is not predictive of future results. Current performance may be higher or lower than the data shown. Returns do not reflect the deduction of taxes that shareholders may have to pay on Fund distributions or upon the sale of Fund shares. Returns at NAV are net of Fund expenses, and assume reinvestment of distributions. Comparative index return information is provided for the Fund’s shares at NAV only. Indexes are not available for direct investment.
Common Share Price Performance —Weekly Closing Price
18
This data relates to the securities held in the Fund’s portfolio of investments as of the end of the reporting period. It should not be construed as a measure of performance for the Fund itself. Holdings are subject to change.
For financial reporting purposes, the ratings disclosed are the highest rating given by one of the following national rating agencies: Standard & Poor’s Group, Moody’s Investors Service, Inc. or Fitch, Inc. This treatment of split-rated securities may differ from that used for other purposes, such as for Fund investment policies. Credit ratings are subject to change. AAA, AA, A and BBB are investment grade ratings; BB, B, CCC, CC, C and D are below-investment grade ratings. Holdings designated N/R are not rated by these national rating agencies.
Fund Allocation
(% of net assets)
| | | | |
| Corporate Bonds | | | 115.4% | |
| Sovereign Debt | | | 4.1% | |
| Convertible Bonds | | | 3.9% | |
| Variable Rate Senior Loan Interests | | | 3.5% | |
| Repurchase Agreements | | | 10.2% | |
| Other Assets Less Liabilities | | | 2.6% | |
Net Assets Plus Borrowings | | | 139.7% | |
| Borrowings | | | (39.7)% | |
Net Assets | | | 100% | |
Country Allocation
(% of total investments)1
| | | | |
| United States | | | 83.2% | |
| Canada | | | 2.2% | |
| Turkey | | | 2.1% | |
| Japan | | | 1.7% | |
| Hong Kong | | | 1.4% | |
| Egypt | | | 1.2% | |
| United Kingdom | | | 1.2% | |
| Australia | | | 1.1% | |
| China | | | 1.1% | |
| South Africa | | | 1.0% | |
| Other | | | 3.8% | |
Total | | | 100% | |
Portfolio Composition
(% of total investments)
| | | | |
| Specialty Retail | | | 6.5% | |
| Media | | | 6.3% | |
| Oil, Gas & Consumable Fuels | | | 5.4% | |
| Containers & Packaging | | | 5.1% | |
| Health Care Providers & Services | | | 4.8% | |
| Airlines | | | 4.5% | |
| Household Durables | | | 4.5% | |
| Hotels, Restaurants & Leisure | | | 3.7% | |
| Wireless Telecommunication Services | | | 3.5% | |
| Consumer Finance | | | 3.5% | |
| Commercial Services & Supplies | | | 3.3% | |
| Banks | | | 3.0% | |
| Technology Hardware, Storage & Peripherals | | | 2.8% | |
| Metals & Mining | | | 2.5% | |
| Energy Equipment & Services | | | 2.1% | |
| Pharmaceuticals | | | 2.0% | |
| Diversified Telecommunication Services | | | 1.8% | |
| Equity Real Estate Investment Trust | | | 1.7% | |
| Internet & Direct Marketing Retail | | | 1.6% | |
| Mortgage Real Estate Investment Trust | | | 1.5% | |
| Other | | | 19.5% | |
| Sovereign Debt | | | 3.0% | |
| Repurchase Agreements | | | 7.4% | |
Total | | | 100% | |
Portfolio Credit Quality
(% of total long-term investments)
| | | | |
| BBB | | | 13.1% | |
| BB or Lower | | | 84.1% | |
| N/R (not rated) | | | 2.8% | |
Total | | | 100% | |
Top Five Issuers
(% of total long-term investments)
| | | | |
| CenturyLink Inc | | | 3.0% | |
| L Brands Inc | | | 1.9% | |
| Hertz Corp/The | | | 1.9% | |
| NuStar Logistics LP | | | 1.7% | |
| HCA Inc | | | 1.7% | |
| 1 | Includes 8.2% (as a percentage of total investments) in emerging markets countries. |
19
| | |
| JHD | | Nuveen High Income December 2019 Target Term Fund Performance Overview and Holding Summaries as of June 30, 2019 |
Refer to the Glossary of Terms Used in this Report for further definition of the terms used within this section.
Average Annual Total Returns as of June 30, 2019
| | | | | | | | | | | | |
| | | Cumulative | | | Average Annual | |
| | | 6-Month | | | 1-Year | | | Since
Inception | |
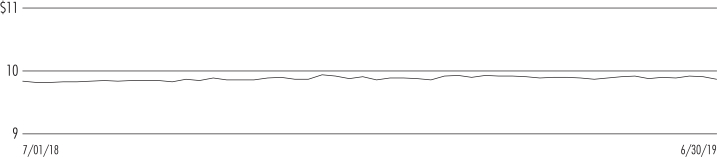
| JHD at Common Share NAV | | | 3.10% | | | | 4.35% | | | | 5.58% | |
| JHD at Common Share Price | | | 2.09% | | | | 5.03% | | | | 4.72% | |
| Bloomberg Barclays U.S. High Yield 1-5 Year Cash Pay 2% Issuer Capped Index | | | 7.24% | | | | 5.33% | | | | 7.59% | |
Since inception returns are from 5/10/16. Past performance is not predictive of future results. Current performance may be higher or lower than the data shown. Returns do not reflect the deduction of taxes that shareholders may have to pay on Fund distributions or upon the sale of Fund shares. Returns at NAV are net of Fund expenses, and assume reinvestment of distributions. Comparative index return information is provided for the Fund’s shares at NAV only. Indexes are not available for direct investment.
Common Share Price Performance —Weekly Closing Price
20
This data relates to the securities held in the Fund’s portfolio of investments as of the end of the reporting period. It should not be construed as a measure of performance for the Fund itself. Holdings are subject to change.
For financial reporting purposes, the ratings disclosed are the highest rating given by one of the following national rating agencies: Standard & Poor’s Group, Moody’s Investors Service, Inc. or Fitch, Inc. This treatment of split-rated securities may differ from that used for other purposes, such as for Fund investment policies. Credit ratings are subject to change. AAA, AA, A and BBB are investment grade ratings; BB, B, CCC, CC, C and D are below-investment grade ratings. Holdings designated N/R are not rated by these national rating agencies.
Fund Allocation
(% of net assets)
| | | | |
| Corporate Bonds | | | 56.4% | |
| Sovereign Debt | | | 7.8% | |
| Convertible Bonds | | | 5.9% | |
| Variable Rate Senior Loan Interests | | | 1.0% | |
| Commercial Paper | | | 26.9% | |
| Repurchase Agreements | | | 1.2% | |
| Other Assets Less Liabilities | | | 0.8% | |
Net Assets | | | 100% | |
Country Allocation
(% of total investments)1
| | | | |
| United States | | | 71.7% | |
| United Kingdom | | | 4.4% | |
| Brazil | | | 4.0% | |
| Japan | | | 2.4% | |
| Egypt | | | 1.9% | |
| Turkey | | | 1.9% | |
| Ireland | | | 1.8% | |
| Cayman Islands | | | 1.8% | |
| Australia | | | 1.6% | |
| Israel | | | 1.6% | |
| Other | | | 6.9% | |
Total | | | 100% | |
Portfolio Composition
(% of total investments)
| | | | |
| Diversified Financial Services | | | 14.8% | |
| Household Durables | | | 6.6% | |
| Pharmaceuticals | | | 5.2% | |
| Airlines | | | 5.0% | |
| Wireless Telecommunication Services | | | 4.7% | |
| Hotels, Restaurants & Leisure | | | 4.5% | |
| Health Care Providers & Services | | | 4.5% | |
| Oil, Gas & Consumable Fuels | | | 4.3% | |
| Automobiles | | | 4.0% | |
| Banks | | | 3.9% | |
| Equity Real Estate Investment Trust | | | 3.1% | |
| Commercial Services & Supplies | | | 3.1% | |
| Technology Hardware, Storage & Peripherals | | | 3.0% | |
| Air Freight & Logistics | | | 2.8% | |
| Chemicals | | | 2.8% | |
| Other | | | 18.7% | |
| Sovereign Debt | | | 7.8% | |
| Repurchase Agreements | | | 1.2% | |
Total | | | 100% | |
Portfolio Credit Quality
(% of total long-term investments)
| | | | |
| A | | | 0.3% | |
| BBB | | | 27.2% | |
| BB or Lower | | | 67.8% | |
| N/R (not rated) | | | 4.7% | |
Total | | | 100% | |
Top Five Issuers
(% of total long-term investments)
| | | | |
| Ally Financial Inc | | | 3.2% | |
| EMC Corp | | | 3.0% | |
| United Parcel Service Inc | | | 2.8% | |
| Brazilian Government International Bond | | | 2.7% | |
| Tenet Healthcare Corp | | | 2.4% | |
| 1 | Includes 13.7% (as a percentage of total investments) in emerging markets countries. |
21
| | |
| JHB | | Nuveen High Income November 2021 Target Term Fund Performance Overview and Holding Summaries as of June 30, 2019 |
Refer to the Glossary of Terms Used in this Report for further definition of the terms used within this section.
Average Annual Total Returns as of June 30, 2019
| | | | | | | | | | | | |
| | | Cumulative | | | Average Annual | |
| | | 6-Month | | | 1-Year | | | Since
Inception | |
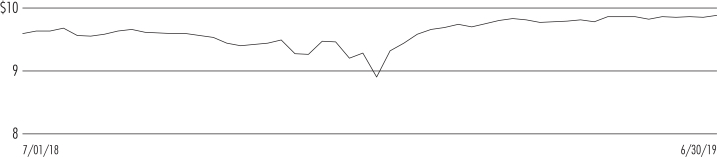
| JHB at Common Share NAV | | | 7.93% | | | | 6.55% | | | | 6.27% | |
| JHB at Common Share Price | | | 14.32% | | | | 9.84% | | | | 5.52% | |
| Bloomberg Barclays U.S. High Yield 1-5 Year Cash Pay 2% Issuer Capped Index | | | 7.24% | | | | 5.33% | | | | 6.06% | |
Since inception returns are from 8/23/16. Past performance is not predictive of future results. Current performance may be higher or lower than the data shown. Returns do not reflect the deduction of taxes that shareholders may have to pay on Fund distributions or upon the sale of Fund shares. Returns at NAV are net of Fund expenses, and assume reinvestment of distributions. Comparative index return information is provided for the Fund’s shares at NAV only. Indexes are not available for direct investment.
Common Share Price Performance —Weekly Closing Price
22
This data relates to the securities held in the Fund’s portfolio of investments as of the end of the reporting period. It should not be construed as a measure of performance for the Fund itself. Holdings are subject to change.
For financial reporting purposes, the ratings disclosed are the highest rating given by one of the following national rating agencies: Standard & Poor’s Group, Moody’s Investors Service, Inc. or Fitch, Inc. This treatment of split-rated securities may differ from that used for other purposes, such as for Fund investment policies. Credit ratings are subject to change. AAA, AA, A and BBB are investment grade ratings; BB, B, CCC, CC, C and D are below-investment grade ratings. Holdings designated N/R are not rated by these national rating agencies.
Fund Allocation
(% of net assets)
| | | | |
| Corporate Bonds | | | 118.1% | |
| Variable Rate Senior Loan Interests | | | 8.2% | |
| Sovereign Debt | | | 2.1% | |
| Convertible Bonds | | | 0.7% | |
| Other Assets Less Liabilities | | | 8.0% | |
Net Assets Plus Borrowings | | | 137.1% | |
| Borrowings | | | (37.1)% | |
Net Assets | | | 100% | |
Country Allocation
(% of total investments)1
| | | | |
| United States | | | 76.7% | |
| Canada | | | 4.5% | |
| United Kingdom | | | 3.9% | |
| Japan | | | 2.3% | |
| Italy | | | 1.3% | |
| Luxembourg | | | 1.2% | |
| South Africa | | | 1.1% | |
| Australia | | | 1.0% | |
| Ireland | | | 0.9% | |
| Israel | | | 0.8% | |
| Other | | | 6.3% | |
Total | | | 100% | |
Portfolio Composition
(% of total investments)
| | | | |
| Oil, Gas & Consumable Fuels | | | 10.7% | |
| Media | | | 9.0% | |
| Metals & Mining | | | 6.2% | |
| Health Care Providers & Services | | | 6.0% | |
| Household Durables | | | 5.7% | |
| Commercial Services & Supplies | | | 5.2% | |
| Hotels, Restaurants & Leisure | | | 3.6% | |
| Consumer Finance | | | 3.6% | |
| Airlines | | | 2.8% | |
| Specialty Retail | | | 2.8% | |
| Wireless Telecommunication Services | | | 2.7% | |
| Technology Hardware, Storage & Peripherals | | | 2.6% | |
| Containers & Packaging | | | 2.6% | |
| Diversified Telecommunication Services | | | 2.4% | |
| Trading Companies & Distributors | | | 2.3% | |
| Mortgage Real Estate Investment Trust | | | 2.1% | |
| Aerospace & Defense | | | 1.9% | |
| Software | | | 1.9% | |
| Diversified Financial Services | | | 1.7% | |
| Energy Equipment & Services | | | 1.7% | |
| Thrifts & Mortgage Finance | | | 1.6% | |
| Other | | | 19.3% | |
| Sovereign Debt | | | 1.6% | |
Total | | | 100% | |
Portfolio Credit Quality
(% of total long-term investments)
| | | | |
| A | | | —% | 2 |
| BBB | | | 13.4% | |
| BB or Lower | | | 85.2% | |
| N/R (not rated) | | | 1.4% | |
Total | | | 100% | |
Top Five Issuers
(% of total long-term investments)
| | | | |
| CSC Holdings LLC | | | 2.1% | |
| CenturyLink Inc | | | 1.6% | |
| Tenet Healthcare Corp | | | 1.4% | |
| Icahn Enterprises LP | | | 1.3% | |
| Bombardier Inc | | | 1.3% | |
| 1 | Includes 7.4% (as a percentage of total investments) in emerging markets countries. |
| 2 | Round to less than 0.1%. |
23
| | |
| JHAA | | Nuveen High Income 2023 Target Term Fund Performance Overview and Holding Summaries as of June 30, 2019 |
Refer to the Glossary of Terms Used in this Report for further definition of the terms used within this section.
Cumulative Total Returns as of June 30, 2019
| | | | | | | | |
| | | Cumulative | |
| | | 6-Month | | | Since
Inception | |
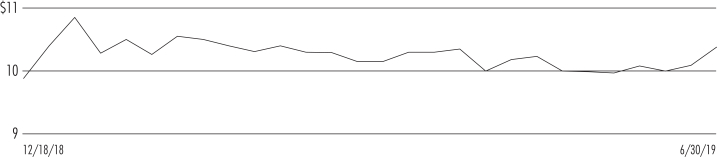
| JHAA at Common Share NAV | | | 7.25% | | | | 6.93% | |
| JHAA at Common Share Price | | | (3.47)% | | | | 4.74% | |
| Bloomberg Barclays U.S. High Yield 1-5 Year Cash Pay 2% Issuer Capped Index | | | 7.24% | | | | 5.80% | |
Since inception returns are from 12/18/18. Past performance is not predictive of future results. Current performance may be higher or lower than the data shown. Returns do not reflect the deduction of taxes that shareholders may have to pay on Fund distributions or upon the sale of Fund shares. Returns at NAV are net of Fund expenses, and assume reinvestment of distributions. Comparative index return information is provided for the Fund’s shares at NAV only. Indexes are not available for direct investment.
Common Share Price Performance —Weekly Closing Price
24
This data relates to the securities held in the Fund’s portfolio of investments as of the end of the reporting period. It should not be construed as a measure of performance for the Fund itself. Holdings are subject to change.
For financial reporting purposes, the ratings disclosed are the highest rating given by one of the following national rating agencies: Standard & Poor’s Group, Moody’s Investors Service, Inc. or Fitch, Inc. This treatment of split-rated securities may differ from that used for other purposes, such as for Fund investment policies. Credit ratings are subject to change. AAA, AA, A and BBB are investment grade ratings; BB, B, CCC, CC, C and D are below-investment grade ratings. Holdings designated N/R are not rated by these national rating agencies.
Fund Allocation
(% of net assets)
| | | | |
| Corporate Bonds | | | 79.8% | |
| Variable Rate Senior Loan Interests | | | 48.4% | |
| Convertible Bonds | | | 1.5% | |
| Repurchase Agreements | | | 2.3% | |
| Other Assets Less Liabilities | | | 2.2% | |
Net Assets Plus Borrowings and Reverse Repurchase Agreements | | | 134.2% | |
| Borrowings | | | (31.7)% | |
| Reverse Repurchase Agreements | | | (2.5)% | |
Net Assets | | | 100% | |
Country Allocation
(% of total investments)1
| | | | |
| United States | | | 82.4% | |
| Canada | | | 4.0% | |
| United Kingdom | | | 1.8% | |
| Netherlands | | | 1.6% | |
| Luxembourg | | | 1.3% | |
| United Arab Emirates | | | 1.2% | |
| Brazil | | | 1.2% | |
| Israel | | | 1.2% | |
| Zambia | | | 1.1% | |
| Australia | | | 1.1% | |
| Other | | | 3.1% | |
Total | | | 100% | |
Portfolio Composition
(% of total investments)
| | | | |
| Oil, Gas & Consumable Fuels | | | 6.7% | |
| Commercial Services & Supplies | | | 5.6% | |
| Media | | | 5.4% | |
| Metals & Mining | | | 5.3% | |
| Chemicals | | | 4.8% | |
| Household Durables | | | 4.2% | |
| Hotels, Restaurants & Leisure | | | 4.0% | |
| Machinery | | | 3.3% | |
| Health Care Providers & Services | | | 3.3% | |
| Containers & Packaging | | | 3.0% | |
| Electric Utilities | | | 2.9% | |
| Consumer Finance | | | 2.7% | |
| Airlines | | | 2.6% | |
| Diversified Consumer Services | | | 2.5% | |
| Road & Rail | | | 2.4% | |
| Software | | | 2.2% | |
| IT Services | | | 2.1% | |
| Pharmaceuticals | | | 2.1% | |
| Food & Staples Retailing | | | 1.8% | |
| Diversified Financial Services | | | 1.8% | |
| Auto Components | | | 1.7% | |
| Energy Equipment & Services | | | 1.7% | |
| Insurance | | | 1.7% | |
| Trading Companies & Distributors | | | 1.6% | |
| Specialty Retail | | | 1.5% | |
| Professional Services | | | 1.5% | |
| Other | | | 19.9% | |
| Repurchase Agreements | | | 1.7% | |
Total | | | 100% | |
Portfolio Credit Quality
(% of total long-term investments)
| | | | |
| BBB | | | 7.3% | |
| BB or Lower | | | 92.2% | |
| N/R (not rated) | | | 0.5% | |
Total | | | 100% | |
Top Five Issuers
(% of total long-term investments)
| | | | |
| Springleaf Finance Corp | | | 1.4% | |
| ADT Security Corp/The | | | 1.4% | |
| KB Home | | | 1.3% | |
| CenturyLink Inc | | | 1.3% | |
| NOVA Chemicals Corp | | | 1.2% | |
| 1 | Includes 6.9% (as a percentage of total investments) in emerging markets countries. |
25
Shareholder Meeting Report
The annual meeting of shareholders was held in the offices of Nuveen on April 10, 2019 for JHY, JHD and JHB; at this meeting the shareholders were asked to elect Board Members.
| | | | | | | | | | | | |
| | | JHY | | | JHD | | | JHB | |
| | | Common
Shares | | | Common
Shares | | | Common
Shares | |
Approval of the Board Members was reached as follows: | | | | | | | | | | | | |
Judith M. Stockdale | | | | | | | | | | | | |
For | | | 14,184,557 | | | | 23,818,216 | | | | 48,944,244 | |
Withhold | | | 135,806 | | | | 303,198 | | | | 886,096 | |
Total | | | 14,320,363 | | | | 24,121,414 | | | | 49,830,340 | |
Carole E. Stone | | | | | | | | | | | | |
For | | | 14,201,942 | | | | 23,819,108 | | | | 49,039,602 | |
Withhold | | | 118,421 | | | | 302,306 | | | | 790,738 | |
Total | | | 14,320,363 | | | | 24,121,414 | | | | 49,830,340 | |
Margaret L. Wolff | | | | | | | | | | | | |
For | | | 14,190,651 | | | | 23,818,226 | | | | 49,089,304 | |
Withhold | | | 129,712 | | | | 303,188 | | | | 741,036 | |
Total | | | 14,320,363 | | | | 24,121,414 | | | | 49,830,340 | |
William C. Hunter | | | | | | | | | | | | |
For | | | 14,205,616 | | | | 23,831,194 | | | | 49,005,079 | |
Withhold | | | 114,747 | | | | 290,220 | | | | 825,261 | |
Total | | | 14,320,363 | | | | 24,121,414 | | | | 49,830,340 | |
26
| | |
| JHY | | Nuveen High Income 2020 Target
Term Fund Portfolio of Investments June 30, 2019 |
| | | (Unaudited) |
| | | | | | | | | | | | | | | | | | | | | | | | | | | | |
Principal
Amount (000) | | | Description (1) | | | | | Coupon | | | Maturity | | | Ratings (2) | | | | | | Value | |
| | | | |
| | | | LONG-TERM INVESTMENTS – 126.9% (92.6% of Total Investments) | | | | | | | | | | | | | |
| | | | |
| | | | CORPORATE BONDS – 115.4% (84.2% of Total Investments) | | | | | | | | | | | | | |
| | | | |
| | | | Aerospace & Defense – 1.1% | | | | | | | | | | |
| | | | | | | |
| $ | 1,700 | | | Triumph Group Inc | | | | | | | 4.875% | | | | 4/01/21 | | | | CCC+ | | | | | | | $ | 1,674,500 | |
| | | | | | | |
| | | | Airlines – 6.2% | | | | | | | | | | | | | | | | | | |
| | | | | | | |
| | 2,344 | | | Air Canada, 144A | | | | | | | 7.750% | | | | 4/15/21 | | | | BB+ | | | | | | | | 2,526,832 | |
| | 250 | | | Air Canada2015-1 Class C Pass Through Trust, 144A | | | | 5.000% | | | | 3/15/20 | | | | BBB– | | | | | | | | 252,475 | |
| | 2,325 | | | American Airlines Group Inc, 144A | | | | | | | 4.625% | | | | 3/01/20 | | | | BB– | | | | | | | | 2,339,531 | |
| | 2,000 | | | Delta Air Lines Inc | | | | | | | 3.400% | | | | 4/19/21 | | | | Baa3 | | | | | | | | 2,029,592 | |
| | 2,372 | | | Virgin Australia Holdings Ltd, 144A | | | | | | | 8.500% | | | | 11/15/19 | | | | B | | | | | | | | 2,400,464 | |
| | 9,291 | | | Total Airlines | | | | | | | | | | | | | | | | | | | | | | | 9,548,894 | |
| | | | | | | |
| | | | Auto Components – 1.7% | | | | | | | | | | | | | | | | | | |
| | | | | | |
| | 2,650 | | | Icahn Enterprises LP / Icahn Enterprises Finance Corp | | | | 6.000% | | | | 8/01/20 | | | | BB+ | | | | | | | | 2,654,770 | |
| | | | | | | |
| | | | Banks – 4.1% | | | | | | | | | | | | | | | | | | |
| | | | | | | |
| | 1,900 | | | Banco Nacional de Costa Rica, 144A | | | | | | | 5.875% | | | | 4/25/21 | | | | B1 | | | | | | | | 1,938,000 | |
| | 2,415 | | | CIT Group Inc | | | | | | | 4.125% | | | | 3/09/21 | | | | BB+ | | | | | | | | 2,461,006 | |
| | 1,900 | | | Turkiye Garanti Bankasi AS, 144A | | | | | | | 6.250% | | | | 4/20/21 | | | | BB– | | | | | | | | 1,921,135 | |
| | 6,215 | | | Total Banks | | | | | | | | | | | | | | | | | | | | | | | 6,320,141 | |
| | | | | | | |
| | | | Building Products – 1.3% | | | | | | | | | | | | | | | | | | |
| | | | | | | |
| | 2,000 | | | Omnimax International Inc, 144A | | | | | | | 12.000% | | | | 8/15/20 | | | | B– | | | | | | | | 2,022,500 | |
| | | | | | | |
| | | | Chemicals – 0.9% | | | | | | | | | | | | | | | | | | |
| | | | | | | |
| | 1,200 | | | CF Industries Inc | | | | | | | 7.125% | | | | 5/01/20 | | | | BB+ | | | | | | | | 1,240,584 | |
| | 100 | | | Methanex Corp | | | | | | | 3.250% | | | | 12/15/19 | | | | Baa3 | | | | | | | | 100,104 | |
| | 1,300 | | | Total Chemicals | | | | | | | | | | | | | | | | | | | | | | | 1,340,688 | |
| | | | | | | |
| | | | Commercial Services & Supplies – 4.2% | | | | | | | | | | | | | | | | | | |
| | | | | | | |
| | 750 | | | ADT Security Corp/The | | | | | | | 5.250% | | | | 3/15/20 | | | | BB– | | | | | | | | 761,250 | |
| | 1,037 | | | APX Group Inc | | | | | | | 8.750% | | | | 12/01/20 | | | | CCC | | | | | | | | 982,557 | |
| | 2,000 | | | Pitney Bowes Inc | | | | | | | 3.875% | | | | 9/15/20 | | | | BB+ | | | | | | | | 1,996,940 | |
| | 2,645 | | | RR Donnelley & Sons Co | | | | | | | 7.875% | | | | 3/15/21 | | | | B– | | | | | | | | 2,697,900 | |
| | 6,432 | | | Total Commercial Services & Supplies | | | | | | | | | | | | | | | | | | | | | | | 6,438,647 | |
| | | | | | | |
| | | | Consumer Finance – 4.8% | | | | | | | | | | | | | | | | | | |
| | | | | | | |
| | 500 | | | Ally Financial Inc | | | | | | | 7.500% | | | | 9/15/20 | | | | BB+ | | | | | | | | 526,250 | |
| | 2,000 | | | Ally Financial Inc | | | | | | | 4.250% | | | | 4/15/21 | | | | BB+ | | | | | | | | 2,042,500 | |
| | 2,400 | | | Credit Acceptance Corp | | | | | | | 6.125% | | | | 2/15/21 | | | | BB | | | | | | | | 2,400,000 | |
| | 2,370 | | | Navient Corp | | | | | | | 5.000% | | | | 10/26/20 | | | | BB | | | | | | | | 2,417,400 | |
| | 7,270 | | | Total Consumer Finance | | | | | | | | | | | | | | | | | | | | | | | 7,386,150 | |
| | | | | | | |
| | | | Containers & Packaging – 4.9% | | | | | | | | | | | | | | | | | | |
| | | | | | | |
| | 3,455 | | | Ball Corp | | | | | | | 4.375% | | | | 12/15/20 | | | | BB+ | | | | | | | | 3,531,010 | |
| | 300 | | | Graphic Packaging International LLC | | | | | | | 4.750% | | | | 4/15/21 | | | | BB+ | | | | | | | | 305,250 | |
| | 2,786 | | | Reynolds Group Issuer Inc / Reynolds Group Issuer LLC / Reynolds Group Issuer Lu | | | | | | | 5.750% | | | | 10/15/20 | | | | B+ | | | | | | | | 2,793,150 | |
| | 451 | | | Reynolds Group Issuer Inc / Reynolds Group Issuer LLC / Reynolds Group Issuer Lu | | | | | | | 6.875% | | | | 2/15/21 | | | | B+ | | | | | | | | 451,625 | |
| | 477 | | | Sealed Air Corp, 144A | | | | | | | 6.500% | | | | 12/01/20 | | | | BB+ | | | | | | | | 493,695 | |
| | 7,469 | | | Total Containers & Packaging | | | | | | | | | | | | | | | | | | | | | | | 7,574,730 | |
27
| | |
| |
| JHY | | Nuveen High Income 2020 Target Term Fund(continued) |
| | Portfolio of Investments June 30, 2019 |
| | (Unaudited) |
| | | | | | | | | | | | | | | | | | | | | | | | | | | | |
Principal
Amount (000) | | | Description (1) | | | | | Coupon | | | Maturity | | | Ratings (2) | | | | | | Value | |
| | | | |
| | | | Diversified Consumer Services – 1.1% | | | | | | | | | | |
| | | | | | | |
| $ | 1,717 | | | Service Corp International/US | | | | | | | 4.500% | | | | 11/15/20 | | | | BB | | | | | | | $ | 1,720,219 | |
| | | | |
| | | | Diversified Financial Services – 1.5% | | | | | | | | | | |
| | | | | | | |
| | 2,375 | | | Park Aerospace Holdings Ltd, 144A | | | | | | | 3.625% | | | | 3/15/21 | | | | BBB– | | | | | | | | 2,395,900 | |
| | | | |
| | | | Diversified Telecommunication Services – 2.5% | | | | | | | | | | |
| | | | | | | |
| | 350 | | | Cogent Communications Group Inc, 144A | | | | | | | 5.625% | | | | 4/15/21 | | | | B– | | | | | | | | 354,812 | |
| | 1,000 | | | Frontier Communications Corp | | | | | | | 8.500% | | | | 4/15/20 | | | | B– | | | | | | | | 815,000 | |
| | 2,690 | | | Level 3 Financing Inc | | | | | | | 6.125% | | | | 1/15/21 | | | | BB | | | | | | | | 2,703,450 | |
| | 4,040 | | | Total Diversified Telecommunication Services | | | | | | | | | | | | | | | | 3,873,262 | |
| | | | |
| | | | Electric Utilities – 0.7% | | | | | | | | | | |
| | | | | | | |
| | 1,125 | | | Eskom Holdings SOC Ltd, 144A | | | | | | | 5.750% | | | | 1/26/21 | | | | BBB+ | | | | | | | | 1,133,982 | |
| | | | |
| | | | Energy Equipment & Services – 2.9% | | | | | | | | | | |
| | | | | | | |
| | 781 | | | Chesapeake Energy Corp | | | | | | | 6.625% | | | | 8/15/20 | | | | B+ | | | | | | | | 786,857 | |
| | 226 | | | Chesapeake Energy Corp | | | | | | | 6.875% | | | | 11/15/20 | | | | B+ | | | | | | | | 228,260 | |
| | 1,950 | | | Nabors Industries Inc | | | | | | | 5.000% | | | | 9/15/20 | | | | BB | | | | | | | | 1,954,485 | |
| | 1,500 | | | Pride International LLC | | | | | | | 6.875% | | | | 8/15/20 | | | | B | | | | | | | | 1,496,250 | |
| | 4,457 | | | Total Energy Equipment & Services | | | | | | | | | | | | | | | | | | | | | | | 4,465,852 | |
| | | | |
| | | | Equity Real Estate Investment Trust – 2.4% | | | | | | | | | | |
| | | | | | | |
| | 1,750 | | | CoreCivic Inc | | | | | | | 4.125% | | | | 4/01/20 | | | | Ba1 | | | | | | | | 1,736,875 | |
| | 1,150 | | | GLP Capital LP / GLP Financing II Inc | | | | | | | 4.875% | | | | 11/01/20 | | | | BBB– | | | | | | | | 1,169,964 | |
| | 750 | | | iStar Inc | | | | | | | 4.625% | | | | 9/15/20 | | | | BB | | | | | | | | 756,563 | |
| | 3,650 | | | Total Equity Real Estate Investment Trust | | | | | | | | | | | | | | | | | | | | | | | 3,663,402 | |
| | | | |
| | | | Food & Staples Retailing – 0.3% | | | | | | | | | | |
| | | | | | | |
| | 500 | | | Smithfield Foods Inc, 144A | | | | | | | 2.700% | | | | 1/31/20 | | | | BBB | | | | | | | | 498,949 | |
| | | | |
| | | | Gas Utilities – 1.3% | | | | | | | | | | |
| | | | | | | |
| | 2,000 | | | QEP Resources Inc | | | | | | | 6.875% | | | | 3/01/21 | | | | BB– | | | | | | | | 2,055,000 | |
| | | | |
| | | | Health Care Providers & Services – 6.6% | | | | | | | | | | |
| | | | | | | |
| | 285 | | | Acadia Healthcare Co Inc | | | | | | | 6.125% | | | | 3/15/21 | | | | B– | | | | | | | | 285,000 | |
| | 3,200 | | | Centene Corp | | | | | | | 5.625% | | | | 2/15/21 | | | | BB+ | | | | | | | | 3,260,000 | |
| | 1,000 | | | HCA Inc | | | | | | | 6.500% | | | | 2/15/20 | | | | BBB– | | | | | | | | 1,022,989 | |
| | 2,500 | | | HCA Inc | | | | | | | 6.250% | | | | 2/15/21 | | | | Ba2 | | | | | | | | 2,618,750 | |
| | 3,000 | | | Tenet Healthcare Corp | | | | | | | 4.500% | | | | 4/01/21 | | | | BB | | | | | | | | 3,041,250 | |
| | 9,985 | | | Total Health Care Providers & Services | | | | | | | | | | | | | | | | | | | | | | | 10,227,989 | |
| | | | |
| | | | Hotels, Restaurants & Leisure – 5.1% | | | | | | | | | | |
| | | | | | | |
| | 800 | | | GLP Capital LP / GLP Financing II Inc | | | | | | | 4.375% | | | | 4/15/21 | | | | BBB– | | | | | | | | 813,896 | |
| | 3,006 | | | MGM Resorts International | | | | | | | 6.750% | | | | 10/01/20 | | | | BB | | | | | | | | 3,141,270 | |
| | 1,500 | | | Scientific Games International Inc | | | | | | | 6.250% | | | | 9/01/20 | | | | CCC+ | | | | | | | | 1,500,570 | |
| | 2,500 | | | Studio City Co Ltd, 144A | | | | | | | 5.875% | | | | 11/30/19 | | | | BB– | | | | | | | | 2,512,500 | |
| | 7,806 | | | Total Hotels, Restaurants & Leisure | | | | | | | | | | | | | | | | | | | | | | | 7,968,236 | |
| | | | |
| | | | Household Durables – 6.1% | | | | | | | | | | |
| | | | | | |
| | 1,748 | | | Brookfield Residential Properties Inc, 144A | | | | 6.500% | | | | 12/15/20 | | | | B+ | | | | | | | | 1,750,185 | |
| | 1,830 | | | Lennar Corp | | | | | | | 8.375% | | | | 1/15/21 | | | | BBB– | | | | | | | | 1,967,250 | |
| | 2,299 | | | M/I Homes Inc | | | | | | | 6.750% | | | | 1/15/21 | | | | BB– | | | | | | | | 2,336,358 | |
| | 1,500 | | | MDC Holdings Inc | | | | | | | 5.625% | | | | 2/01/20 | | | | BBB– | | | | | | | | 1,511,250 | |
| | 1,500 | | | PulteGroup Inc | | | | | | | 4.250% | | | | 3/01/21 | | | | BB+ | | | | | | | | 1,528,125 | |
| | 425 | | | Toll Brothers Finance Corp | | | | | | | 6.750% | | | | 11/01/19 | | | | BBB– | | | | | | | | 428,600 | |
| | 9,302 | | | Total Household Durables | | | | | | | | | | | | | | | | | | | | | | | 9,521,768 | |
| | | | |
| | | | Independent Power & Renewable Electricity Producers – 1.0% | | | | | | | | | | |
| | | | | | | |
| | 1,500 | | | AES Corp/VA | | | | | | | 4.000% | | | | 3/15/21 | | | | BB+ | | | | | | | | 1,526,250 | |
28
| | | | | | | | | | | | | | | | | | | | | | | | | | | | |
Principal
Amount (000) | | | Description (1) | | | | | Coupon | | | Maturity | | | Ratings (2) | | | | | | Value | |
| | | | | | | |
| | | | Insurance – 1.0% | | | | | | | | | | | | | | | | | | |
| | | | | | | |
| $ | 1,500 | | | Genworth Holdings Inc | | | | | | | 7.700% | | | | 6/15/20 | | | | B | | | | | | | $ | 1,505,925 | |
| | | | |
| | | | Internet & Direct Marketing Retail – 2.2% | | | | | | | | | | |
| | | | | | | |
| | 3,370 | | | Netflix Inc | | | | | | | 5.375% | | | | 2/01/21 | | | | BB– | | | | | | | | 3,483,738 | |
| | | | |
| | | | Leisure Products – 1.6% | | | | | | | | | | |
| | | | | | | |
| | 2,400 | | | Mattel Inc | | | | | | | 4.350% | | | | 10/01/20 | | | | B+ | | | | | | | | 2,415,000 | |
| | | | |
| | | | Machinery – 1.9% | | | | | | | | | | |
| | | | | | | |
| | 2,857 | | | Briggs & Stratton Corp | | | | | | | 6.875% | | | | 12/15/20 | | | | BB– | | | | | | | | 2,971,280 | |
| | | | |
| | | | Media – 8.7% | | | | | | | | | | |
| | | | | | |
| | 1,300 | | | Cablevision Systems Corp | | | | 8.000% | | | | 4/15/20 | | | | B | | | | | | | | 1,342,679 | |
| | 2,500 | | | CCO Holdings LLC / CCO Holdings Capital Corp | | | | 5.250% | | | | 3/15/21 | | | | BB+ | | | | | | | | 2,510,937 | |
| | 350 | | | DISH DBS Corp | | | | 7.875% | | | | 9/01/19 | | | | BB– | | | | | | | | 351,313 | |
| | 2,500 | | | DISH DBS Corp | | | | 5.125% | | | | 5/01/20 | | | | BB– | | | | | | | | 2,512,475 | |
| | 500 | | | Mediacom Broadband LLC / Mediacom Broadband Corp | | | | 5.500% | | | | 4/15/21 | | | | Ba2 | | | | | | | | 497,500 | |
| | 2,000 | | | Sinclair Television Group Inc | | | | 5.375% | | | | 4/01/21 | | | | B+ | | | | | | | | 2,001,250 | |
| | 3,000 | | | TEGNA Inc | | | | 5.125% | | | | 7/15/20 | | | | BB | | | | | | | | 3,007,500 | |
| | 1,225 | | | Virgin Media Secured Finance PLC | | | | | | | 5.250% | | | | 1/15/21 | | | | BB+ | | | | | | | | 1,277,369 | |
| | 13,375 | | | Total Media | | | | | | | | | | | | | | | | | | | | 13,501,023 | |
| | | | |
| | | | Metals & Mining – 3.4% | | | | | | | | | | |
| | | | | | |
| | 3,050 | | | Allegheny Technologies Inc | | | | 5.950% | | | | 1/15/21 | | | | B | | | | | | | | 3,133,875 | |
| | 200 | | | Arconic Inc | | | | 6.150% | | | | 8/15/20 | | | | BBB– | | | | | | | | 207,006 | |
| | 850 | | | Arconic Inc | | | | 5.400% | | | | 4/15/21 | | | | BBB– | | | | | | | | 881,119 | |
| | 1,000 | | | Gold Fields Orogen Holdings BVI Ltd, 144A | | | | 4.875% | | | | 10/07/20 | | | | Baa3 | | | | | | | | 1,015,600 | |
| | 5,100 | | | Total Metals & Mining | | | | | | | | | | | | | | | | | | | | 5,237,600 | |
| | | | |
| | | | Mortgage Real Estate Investment Trust – 1.9% | | | | | | | | | | |
| | | | | | | |
| | 3,000 | | | Starwood Property Trust Inc | | | | | | | 3.625% | | | | 2/01/21 | | | | BB– | | | | | | | | 2,992,500 | |
| | | | |
| | | | Multiline Retail – 1.2% | | | | | | | | | | |
| | | | | | | |
| | 2,150 | | | JC Penney Corp Inc | | | | | | | 5.650% | | | | 6/01/20 | | | | B– | | | | | | | | 1,935,000 | |
| | | | |
| | | | Oil, Gas & Consumable Fuels – 7.4% | | | | | | | | | | |
| | | | | | |
| | 1,750 | | | Calumet Specialty Products Partners LP / Calumet Finance Corp | | | | 6.500% | | | | 4/15/21 | | | | B– | | | | | | | | 1,741,250 | |
| | 1,750 | | | DCP Midstream Operating LP, 144A | | | | 5.350% | | | | 3/15/20 | | | | BB+ | | | | | | | | 1,774,063 | |
| | 1,740 | | | NuStar Logistics LP | | | | 4.800% | | | | 9/01/20 | | | | Ba2 | | | | | | | | 1,766,100 | |
| | 1,865 | | | NuStar Logistics LP | | | | 6.750% | | | | 2/01/21 | | | | Ba2 | | | | | | | | 1,948,925 | |
| | 980 | | | Petrobras Global Finance BV | | | | 5.375% | | | | 1/27/21 | | | | Ba2 | | | | | | | | 1,013,320 | |
| | 1,250 | | | Southwestern Energy Co | | | | 5.300% | | | | 1/23/20 | | | | BB | | | | | | | | 1,258,924 | |
| | 2,000 | | | Whiting Petroleum Corp | | | | | | | 5.750% | | | | 3/15/21 | | | | BB | | | | | | | | 1,995,000 | |
| | 11,335 | | | Total Oil, Gas & Consumable Fuels | | | | | | | | | | | | | | | | | | | | 11,497,582 | |
| | | | |
| | | | Pharmaceuticals – 2.7% | | | | | | | | | | |
| | | | | | |
| | 2,250 | | | Mallinckrodt International Finance SA / Mallinckrodt CB LLC, 144A | | | | 4.875% | | | | 4/15/20 | | | | B+ | | | | | | | | 2,168,437 | |
| | 2,000 | | | Teva Pharmaceutical Finance IV LLC | | | | 2.250% | | | | 3/18/20 | | | | BBB | | | | | | | | 1,981,000 | |
| | 4,250 | | | Total Pharmaceuticals | | | | | | | | | | | | | | | | | | | | 4,149,437 | |
| | | | | | |
| | | | Professional Services – 1.6% | | | | | | | | | | | | | | | | |
| | | | | | | |
| | 2,500 | | | Nielsen Finance LLC / Nielsen Finance Co | | | | | | | 4.500% | | | | 10/01/20 | | | | BB | | | | | | | | 2,505,938 | |
| | | | | | |
| | | | Specialty Retail – 8.9% | | | | | | | | | | | | | | | | |
| | | | | | |
| | 1,500 | | | Gap Inc/The | | | | 5.950% | | | | 4/12/21 | | | | Baa2 | | | | | | | | 1,566,183 | |
| | 3,975 | | | Hertz Corp/The | | | | 5.875% | | | | 10/15/20 | | | | B– | | | | | | | | 3,979,969 | |
| | 3,878 | | | L Brands Inc | | | | 6.625% | | | | 4/01/21 | | | | Ba1 | | | | | | | | 4,095,168 | |
| | 2,240 | | | Penske Automotive Group Inc | | | | 3.750% | | | | 8/15/20 | | | | Ba3 | | | | | | | | 2,240,000 | |
| | 1,000 | | | Rent-A-Center Inc/TX | | | | 6.625% | | | | 11/15/20 | | | | B | | | | | | | | 1,001,250 | |
29
| | |
| |
| JHY | | Nuveen High Income 2020 Target Term Fund(continued) |
| | Portfolio of Investments June 30, 2019 |
| | (Unaudited) |
| | | | | | | | | | | | | | | | | | | | | | | | | | |
Principal
Amount (000) | | | Description (1) | | | | Coupon | | | Maturity | | | Ratings (2) | | | | | | Value | |
| | | | | | |
| | | | Specialty Retail(continued) | | | | | | | | | | | | | | | |
| | | | | | |
| $ | 1,000 | | | Rent-A-Center Inc/TX | | | 4.750% | | | | 5/01/21 | | | | B | | | | | | | $ | 998,750 | |
| | 13,593 | | | Total Specialty Retail | | | | | | | | | | | | | | | | | | | 13,881,320 | |
| | | | | | |
| | | | Technology Hardware, Storage & Peripherals – 3.8% | | | | | | | | | | | | | | | |
| | | | | | |
| | 2,500 | | | EMC Corp | | | 2.650% | | | | 6/01/20 | | | | Ba2 | | | | | | | | 2,486,180 | |
| | 3,430 | | | NCR Corp | | | 4.625% | | | | 2/15/21 | | | | BB | | | | | | | | 3,438,575 | |
| | 5,930 | | | Total Technology Hardware, Storage & Peripherals | | | | | | | | | | | | | | | | | | | 5,924,755 | |
| | | | | | |
| | | | Tobacco – 1.6% | | | | | | | | | | | | | | | |
| | | | | | |
| | 2,500 | | | Pyxus International Inc, 144A | | | 8.500% | | | | 4/15/21 | | | | B2 | | | | | | | | 2,553,125 | |
| | | | | | |
| | | | Trading Companies & Distributors – 1.2% | | | | | | | | | | | | | | | |
| | | | | | |
| | 1,782 | | | Aircastle Ltd | | | 5.125% | | | | 3/15/21 | | | | BBB– | | | | | | | | 1,847,749 | |
| | | | | | |
| | | | Transportation Infrastructure – 0.8% | | | | | | | | | | | | | | | |
| | | | | | |
| | 1,200 | | | Navigator Holdings Ltd, 144A, Reg S | | | 7.750% | | | | 2/10/21 | | | | N/R | | | | | | | | 1,199,994 | |
| | | | | | |
| | | | Wireless Telecommunication Services – 4.8% | | | | | | | | | | | | | | | |
| | | | | | |
| | 3,735 | | | CenturyLink Inc | | | 5.625% | | | | 4/01/20 | | | | BB | | | | | | | | 3,777,019 | |
| | 3,500 | | | Sprint Communications Inc | | | 7.000% | | | | 8/15/20 | | | | B+ | | | | | | | | 3,626,875 | |
| | 7,235 | | | Total Wireless Telecommunication Services | | | | | | | | | | | | | | | | | | | 7,403,894 | |
| $ | 176,861 | | | Total Corporate Bonds (cost $178,604,612) | | | | | | | | | | | | | | | | | | | 179,017,689 | |
| | | | | | |
Principal
Amount (000) | | | Description (1) | | Coupon | | | Maturity | | | Ratings (2) | | | | | | Value | |
| | | |
| | | | SOVEREIGN DEBT – 4.1% (3.0% of Total Investments) | | | | | | | | | |
| | | |
| | | | Argentina – 0.5% | | | | | | | |
| | | | | | |
| $ | 800 | | | Argentine Republic Government International Bond | | | 6.875% | | | | 4/22/21 | | | | B | | | | | | | $ | 702,000 | |
| | | | | | |
| | | | Egypt – 1.6% | | | | | | | | | | | | | | | |
| | | | | | |
| | 2,500 | | | Egypt Government International Bond, 144A | | | 5.750% | | | | 4/29/20 | | | | B+ | | | | | | | | 2,539,895 | |
| | | | | | |
| | | | Honduras – 0.4% | | | | | | | | | | | | | | | |
| | | | | | |
| | 500 | | | Honduras Government International Bond, 144A | | | 8.750% | | | | 12/16/20 | | | | BB– | | | | | | | | 535,005 | |
| | | | | | |
| | | | Turkey – 1.6% | | | | | | | | | | | | | | | |
| | | | | | |
| | 2,500 | | | Turkey Government International Bond | | | 5.625% | | | | 3/30/21 | | | | BB | | | | | | | | 2,534,935 | |
| $ | 6,300 | | | Total Sovereign Debt (cost $6,414,261) | | | | | | | | | | | | | | | | | | | 6,311,835 | |
| | | | | | |
Principal
Amount (000) | | | Description (1) | | Coupon | | | Maturity | | | Ratings (2) | | | | | | Value | |
| | | |
| | | | CONVERTIBLE BONDS – 3.9% (2.9% of Total Investments) | | | | | | | | | |
| | | |
| | | | Capital Markets – 1.2% | | | | | | | |
| | | | | | |
| $ | 1,780 | | | Prospect Capital Corp | | | 4.750% | | | | 4/15/20 | | | | BBB– | | | | | | | $ | 1,795,327 | |
| | | | | | |
| | | | Construction Materials – 0.3% | | | | | | | | | | | | | | | |
| | | | | | |
| | 500 | | | Cemex SAB de CV | | | 3.720% | | | | 3/15/20 | | | | N/R | | | | | | | | 498,471 | |
| | | | | | |
| | | | Electrical Equipment – 1.4% | | | | | | | | | | | | | | | |
| | | | | | |
| | 2,250 | | | Tesla Energy Operations Inc/DE | | | 1.625% | | | | 11/01/19 | | | | N/R | | | | | | | | 2,169,502 | |
| | | |
| | | | Independent Power & Renewable Electricity Producers – 0.9% | | | | | | | |
| | | | | | |
| | 1,500 | | | Clearway Energy Inc, 144A | | | 3.250% | | | | 6/01/20 | | | | N/R | | | | | | | | 1,470,000 | |
| | | | | | |
| | | | Mortgage Real Estate Investment Trust – 0.1% | | | | | | | | | | | | | | | |
| | | | | | |
| | 150 | | | Colony Capital Inc | | | 3.875% | | | | 1/15/21 | | | | N/R | | | | | | | | 146,250 | |
| $ | 6,180 | | | Total Convertible Bonds (cost $6,126,039) | | | | | | | | | | | | | | | | | | | 6,079,550 | |
30
| | | | | | | | | | | | | | | | | | | | | | | | | | | | |
Principal
Amount (000) | | | Description (1) | | Coupon (3) | | | Reference
Rate (3) | | | Spread (3) | | | Maturity (4) | | | Ratings (2) | | | Value | |
| | |
| | | | VARIABLE RATE SENIOR LOAN INTERESTS – 3.5% (2.5% of Total Investments) (3) | | | | |
| | |
| | | | Commercial Services & Supplies – 0.4% | | | | |
| | | | | | | |
| $ | 656 | | | KAR Auction Services Inc., Term Loan B4 | | | 4.625% | | | | 3-Month LIBOR | | | | 2.250% | | | | 3/11/21 | | | | BB | | | $ | 656,493 | |
| | | | | | |
| | | | Containers & Packaging – 2.1% | | | | | | | | | | | | | | | | |
| | | | | | | |
| | 3,250 | | | Berry Global, Inc., Term Loan T | | | 4.162% | | | | 1-Month LIBOR | | | | 1.750% | | | | 1/06/21 | | | | BBB– | | | | 3,243,744 | |
| | | | | | |
| | | | Software – 1.0% | | | | | | | | | | | | | | | | |
| | | | | | | |
| | 1,492 | | | TIBCO Software, Inc., Term Loan, First Lien | | | 5.910% | | | | 1-Month LIBOR | | | | 3.500% | | | | 12/04/20 | | | | BB– | | | | 1,497,249 | |
| $ | 5,398 | | | Total Variable Rate Senior Loan Interests (cost $5,379,170) | | | | | | | | | | | | 5,397,486 | |
| | | | Total Long-Term Investments (cost $196,524,082) | | | | | | | | 196,806,560 | |
| | | | | | | |
Principal
Amount (000) | | | Description (1) | | | | | | | | Coupon | | | Maturity | | | | | | Value | |
| | | |
| | | | SHORT-TERM INVESTMENTS – 10.2% (7.4% of Total Investments) | | | | | | | | | |
| | | | | |
| | | | REPURCHASE AGREEMENTS – 10.2% (7.4% of Total Investments) | | | | | | | | | | | | | | | | | |
| | | | | |
| $ | 15,812 | | | Repurchase Agreement with Fixed Income Clearing Corporation,
dated 6/28/19, repurchase price $15,813,897,
collateralized by $16,285,000 U.S. Treasury Notes,
1.625%, due 2/15/26, value $16,132,703 | | | | 1.200% | | | | 7/01/19 | | | | | | | $ | 15,812,316 | |
| | | | Total Short-Term Investments (cost $15,812,316) | | | | | | | | | | | | | | | | 15,812,316 | |
| | | | Total Investments (cost $212,336,398) – 137.1% | | | | | | | | | | | | | | | | 212,618,876 | |
| | | | Borrowings – (39.7)% (5), (6) | | | | | | | | | | | | | | | | (61,500,000 | ) |
| | | | Other Assets Less Liabilities – 2.6% | | | | | | | | | | | | | | | | 3,997,362 | |
| | | | Net Assets Applicable to Common Shares – 100% | | | | | | | | | | | | | | | $ | 155,116,238 | |
For Fund portfolio compliance purposes, the Fund’s industry classifications refer to any one or more of the industrysub-classifications used by one or more widely recognized market indexes or ratings group indexes, and/or as defined by Fund management. This definition may not apply for purposes of this report, which may combine industrysub-classifications into sectors for reporting ease.
| (1) | All percentages shown in the Portfolio of Investments are based on net assets applicable to common shares unless otherwise noted. |
| (2) | For financial reporting purposes, the ratings disclosed are the highest of Standard & Poor’s Group (“Standard & Poor’s”), Moody’s Investors Service, Inc. (“Moody’s”) or Fitch, Inc. (“Fitch”) rating. This treatment of split-rated securities may differ from that used for other purposes, such as for Fund investment policies. Ratings below BBB by Standard & Poor’s, Baa by Moody’s or BBB by Fitch are considered to be below investment grade. Holdings designated N/R are not rated by any of these national rating agencies. |
| (3) | Senior loans generally pay interest at rates which are periodically adjusted by reference to a base short-term, floating lending rate (Reference Rate) plus an assigned fixed rate (Spread). These floating lending rates are generally (i) the lending rate referenced by the London Inter-Bank Offered Rate (“LIBOR”), or (ii) the prime rate offered by one or more major United States banks. Senior loans may be considered restricted in that the Fund ordinarily is contractually obligated to receive approval from the agent bank and/or borrower prior to the disposition of a senior loan. The rate shown is the coupon as of the end of the reporting period. |
| (4) | Senior loans generally are subject to mandatory and/or optional prepayment. Because of these mandatory prepayment conditions and because there may be significant economic incentives for a borrower to prepay, prepayments of senior loans may occur. As a result, the actual remaining maturity of senior loans held may be substantially less than the stated maturities shown. |
| (5) | Borrowings as a percentage of Total Investments is 28.9%. |
| (6) | The Fund may pledge up to 100% of its eligible investments (excluding any investments separately pledged as collateral for specific investments in derivatives, when applicable) in the Portfolio of Investments as collateral for borrowings. |
| 144A | Investment is exempt from registration under Rule 144A of the Securities Act of 1933, as amended. These investments may only be resold in transactions exempt from registration, which are normally those transactions with qualified institutional buyers. |
| LIBOR | London Inter-Bank Offered Rate |
| Reg S | Regulation S allows U.S. companies to sell securities to persons or entities located outside of the United States without registering those securities with the Securities and Exchange Commission. Specifically, Regulation S provides a safe harbor from the registration requirements of the Securities Act for the offers and sales of securities by both foreign and domestic issuers that are made outside the United States. |
See accompanying notes to financial statements.
31
| | |
| JHD | | Nuveen High Income December 2019
Target Term Fund Portfolio of Investments June 30, 2019 |
| | | (Unaudited) |
| | | | | | | | | | | | | | | | | | | | | | | | | | | | |
Principal
Amount (000) | | | Description (1) | | | | | | | | Coupon | | | Maturity | | | Ratings (2) | | | Value | |
| | |
| | | | LONG-TERM INVESTMENTS – 71.1% (71.6% of Total Investments) | | | | | |
| | |
| | | | CORPORATE BONDS – 56.4% (56.9% of Total Investments) | | | | | |
| | |
| | | | Airlines – 5.0% | | | | |
| | | | | | | |
| $ | 3,600 | | | Air Canada2015-1 Class C Pass Through Trust, 144A | | | | | | | | | | | 5.000% | | | | 3/15/20 | | | | BBB– | | | $ | 3,635,640 | |
| | 3,500 | | | American Airlines Group Inc, 144A | | | | | | | | | | | 5.500% | | | | 10/01/19 | | | | BB– | | | | 3,515,750 | |
| | 2,000 | | | American Airlines Group Inc, 144A | | | | | | | | | | | 4.625% | | | | 3/01/20 | | | | BB– | | | | 2,012,500 | |
| | 4,235 | | | Virgin Australia Holdings Ltd, 144A | | | | | | | | | | | 8.500% | | | | 11/15/19 | | | | B | | | | 4,285,820 | |
| | 13,335 | | | Total Airlines | | | | | | | | | | | | | | | | | | | | | | | 13,449,710 | |
| | | | | | | |
| | | | Automobiles – 3.2% | | | | | | | | | | | | | | | | | | |
| | | | | | | |
| | 5,150 | | | Fiat Chrysler Automobiles NV | | | | | | | | | | | 4.500% | | | | 4/15/20 | | | | BBB– | | | | 5,207,680 | |
| | 972 | | | Jaguar Land Rover Automotive PLC, 144A | | | | | | | | | | | 4.250% | | | | 11/15/19 | | | | BB+ | | | | 967,140 | |
| | 2,500 | | | Jaguar Land Rover Automotive PLC, 144A | | | | | | | | | | | 3.500% | | | | 3/15/20 | | | | BB+ | | | | 2,475,000 | |
| | 8,622 | | | Total Automobiles | | | | | | | | | | | | | | | | | | | | | | | 8,649,820 | |
| | | | | | | |
| | | | Chemicals – 2.7% | | | | | | | | | | | | | | | | | | |
| | | | | | | |
| | 4,327 | | | CF Industries Inc | | | | | | | | | | | 7.125% | | | | 5/01/20 | | | | BB+ | | | | 4,473,339 | |
| | 2,910 | | | INVISTA Finance LLC, 144A | | | | | | | | | | | 4.250% | | | | 10/15/19 | | | | BBB– | | | | 2,926,604 | |
| | 7,237 | | | Total Chemicals | | | | | | | | | | | | | | | | | | | | | | | 7,399,943 | |
| | | | | | | |
| | | | Commercial Services & Supplies – 1.6% | | | | | | | | | | | | | | | | | | |
| | | | | | | |
| | 4,250 | | | ADT Security Corp/The | | | | | | | | | | | 5.250% | | | | 3/15/20 | | | | BB– | | | | 4,313,750 | |
| | | | | | | |
| | | | Consumer Finance – 4.7% | | | | | | | | | | | | | | | | | | |
| | | | | | | |
| | 5,500 | | | Ally Financial Inc | | | | | | | | | | | 3.750% | | | | 11/18/19 | | | | BB+ | | | | 5,511,000 | |
| | 3,000 | | | Ally Financial Inc | | | | | | | | | | | 4.125% | | | | 3/30/20 | | | | BB+ | | | | 3,029,010 | |
| | 500 | | | Capital One NA | | | | | | | | | | | 2.350% | | | | 1/31/20 | | | | A– | | | | 499,743 | |
| | 3,680 | | | Navient Corp | | | | | | | | | | | 8.000% | | | | 3/25/20 | | | | BB | | | | 3,808,800 | |
| | 12,680 | | | Total Consumer Finance | | | | | | | | | | | | | | | | | | | | | | | 12,848,553 | |
| | | | | | | |
| | | | Diversified Consumer Services – 0.4% | | | | | | | | | | | | | | | | | | |
| | | | | | | |
| | 1,000 | | | JC Penney Corp Inc | | | | | | | | | | | 8.125% | | | | 10/01/19 | | | | B– | | | | 997,500 | |
| | | | | | | |
| | | | Diversified Financial Services – 1.5% | | | | | | | | | | | | | | | | | | |
| | | | | | | |
| | 4,000 | | | General Electric Co | | | | | | | | | | | 5.500% | | | | 1/08/20 | | | | BBB+ | | | | 4,056,739 | |
| | | | | | | |
| | | | Electric Utilities – 1.3% | | | | | | | | | | | | | | | | | | |
| | | | | | | |
| | 3,500 | | | Centrais Eletricas Brasileiras SA, 144A | | | | | | | | | | | 6.875% | | | | 7/30/19 | | | | BB– | | | | 3,505,285 | |
| | | | | | | |
| | | | Equity Real Estate Investment Trust – 2.0% | | | | | | | | | | | | | | | | | | |
| | | | | | | |
| | 2,340 | | | CoreCivic Inc | | | | | | | | | | | 4.125% | | | | 4/01/20 | | | | Ba1 | | | | 2,322,450 | |
| | 3,000 | | | Office Properties Income Trust | | | | | | | | | | | 3.600% | | | | 2/01/20 | | | | BBB– | | | | 3,009,452 | |
| | 5,340 | | | Total Equity Real Estate Investment Trust | | | | | | | | | | | | | | | | | | | | | | | 5,331,902 | |
| | | | | | | |
| | | | Health Care Providers & Services – 4.4% | | | | | | | | | | | | | | | | | | |
| | | | | | | |
| | 5,500 | | | HCA Inc | | | | | | | | | | | 6.500% | | | | 2/15/20 | | | | BBB– | | | | 5,626,439 | |
| | 6,300 | | | Tenet Healthcare Corp | | | | | | | | | | | 4.750% | | | | 6/01/20 | | | | BB | | | | 6,363,000 | |
| | 11,800 | | | Total Health Care Providers & Services | | | | | | | | | | | | | | | | | | | | | | | 11,989,439 | |
| | | | | | | |
| | | | Hotels, Restaurants & Leisure – 4.5% | | | | | | | | | | | | | | | | | | |
| | | | | | | |
| | 5,293 | | | MGM Resorts International | | | | | | | | | | | 5.250% | | | | 3/31/20 | | | | BB | | | | 5,379,011 | |
| | 4,000 | | | Studio City Co Ltd, 144A | | | | | | | | | | | 5.875% | | | | 11/30/19 | | | | BB– | | | | 4,020,000 | |
| | 2,640 | | | Yum! Brands Inc | | | | | | | | | | | 5.300% | | | | 9/15/19 | | | | B+ | | | | 2,646,600 | |
| | 11,933 | | | Total Hotels, Restaurants & Leisure | | | | | | | | | | | | | | | | | | | | | | | 12,045,611 | |
32
| | | | | | | | | | | | | | | | | | | | | | | | | | | | |
Principal
Amount (000) | | | Description (1) | | | | | | | | Coupon | | | Maturity | | | Ratings (2) | | | Value | |
| | | | | | | |
| | | | Household Durables – 6.5% | | | | | | | | | | | | | | | | | | |
| | | | | | | |
| $ | 3,144 | | | KB Home | | | | | | | | | | | 8.000% | | | | 3/15/20 | | | | BB– | | | $ | 3,246,809 | |
| | 3,750 | | | Lennar Corp | | | | | | | | | | | 4.500% | | | | 11/15/19 | | | | BBB– | | | | 3,764,062 | |
| | 187 | | | Lennar Corp | | | | | | | | | | | 6.625% | | | | 5/01/20 | | | | BBB– | | | | 192,143 | |
| | 3,000 | | | MDC Holdings Inc | | | | | | | | | | | 5.625% | | | | 2/01/20 | | | | BBB– | | | | 3,022,500 | |
| | 2,925 | | | Meritage Homes Corp | | | | | | | | | | | 7.150% | | | | 4/15/20 | | | | BB | | | | 3,012,750 | |
| | 4,305 | | | Toll Brothers Finance Corp | | | | | | | | | | | 6.750% | | | | 11/01/19 | | | | BBB– | | | | 4,341,463 | |
| | 17,311 | | | Total Household Durables | | | | | | | | | | | | | | | | | | | | | | | 17,579,727 | |
| | | | | | | |
| | | | Media – 4.1% | | | | | | | | | | | | | | | | | | |
| | | | | | | |
| | 2,550 | | | Cablevision Systems Corp | | | | | | | | | | | 8.000% | | | | 4/15/20 | | | | B | | | | 2,633,717 | |
| | 540 | | | DISH DBS Corp | | | | | | | | | | | 7.875% | | | | 9/01/19 | | | | BB– | | | | 542,025 | |
| | 3,800 | | | DISH DBS Corp | | | | | | | | | | | 5.125% | | | | 5/01/20 | | | | BB– | | | | 3,818,962 | |
| | 4,000 | | | TEGNA Inc | | | | | | | | | | | 5.125% | | | | 10/15/19 | | | | BB | | | | 4,005,000 | |
| | 10,890 | | | Total Media | | | | | | | | | | | | | | | | | | | | | | | 10,999,704 | |
| | | | | | |
| | | | Oil, Gas & Consumable Fuels – 3.7% | | | | | | | | | | | | | | | | |
| | | | | | |
| | 2,000 | | | Andeavor Logistics LP / Tesoro Logistics Finance Corp | | | | | | | | 5.500% | | | | 10/15/19 | | | | BBB– | | | | 2,009,298 | |
| | 4,500 | | | DCP Midstream Operating LP, 144A | | | | | | | | 5.350% | | | | 3/15/20 | | | | BB+ | | | | 4,561,875 | |
| | 3,500 | | | Southwestern Energy Co | | | | | | | | 5.300% | | | | 1/23/20 | | | | BB | | | | 3,524,988 | |
| | 10,000 | | | Total Oil, Gas & Consumable Fuels | | | | | | | | | | | | | | | | | | | | 10,096,161 | |
| |
| | | | Pharmaceuticals – 2.9% | |
| | | | | | | |
| | 375 | | | Allergan Funding SCS | | | | | | | | | | | 3.000% | | | | 3/12/20 | | | | BBB | | | | 376,090 | |
| | 3,500 | | | Mallinckrodt International Finance SA / Mallinckrodt CB LLC, 144A | | | | | | | | 4.875% | | | | 4/15/20 | | | | B+ | | | | 3,373,125 | |
| | 4,250 | | | Teva Pharmaceutical Finance IV LLC | | | | | | | | 2.250% | | | | 3/18/20 | | | | BBB | | | | 4,209,625 | |
| | 8,125 | | | Total Pharmaceuticals | | | | | | | | | | | | | | | | | | | | | | | 7,958,840 | |
| |
| | | | Software – 0.4% | |
| | | | | | | |
| | 1,016 | | | CDK Global Inc | | | | | | | | | | | 3.800% | | | | 10/15/19 | | | | BB+ | | | | 1,017,270 | |
| |
| | | | Technology Hardware, Storage & Peripherals – 2.9% | |
| | | | | | | |
| | 8,000 | | | EMC Corp | | | | | | | | | | | 2.650% | | | | 6/01/20 | | | | Ba2 | | | | 7,955,775 | |
| |
| | | | Wireless Telecommunication Services – 4.6% | |
| | | | | | | |
| | 6,100 | | | CenturyLink Inc | | | | | | | | | | | 5.625% | | | | 4/01/20 | | | | BB | | | | 6,168,625 | |
| | 6,205 | | | Sprint Communications Inc, 144A | | | | | | | | | | | 7.000% | | | | 3/01/20 | | | | BB | | | | 6,360,125 | |
| | 12,305 | | | Total Wireless Telecommunication Services | | | | | | | | | | | | | | | | | | | | 12,528,750 | |
| $ | 151,344 | | | Total Corporate Bonds (cost $152,378,277) | | | | | | | | | | | | | | | | | | | | 152,724,479 | |
| | | | | | | |
Principal
Amount (000) | | | Description (1) | | | | | | | | Coupon | | | Maturity | | | Ratings (2) | | | Value | |
| |
| | | | SOVEREIGN DEBT – 7.8% (7.8% of Total Investments) | |
| |
| | | | Brazil – 2.6% | |
| | | | | | | |
| $ | 6,981 | | | Brazilian Government International Bond | | | | | | | | | | | 8.875% | | | | 10/14/19 | | | | Ba2 | | | $ | 7,120,690 | |
| |
| | | | Egypt – 1.9% | |
| | | | | | | |
| | 5,000 | | | Egypt Government International Bond, 144A | | | | | | | | | | | 5.750% | | | | 4/29/20 | | | | B+ | | | | 5,079,790 | |
| |
| | | | South Africa – 1.4% | |
| | | | | | | |
| | 3,700 | | | Republic of South Africa Government International Bond | | | | | | | | | | | 5.500% | | | | 3/09/20 | | | | Baa3 | | | | 3,758,756 | |
| |
| | | | Turkey – 1.9% | |
| | | | | | | |
| | 5,000 | | | Turkey Government International Bond | | | | | | | | | | | 7.500% | | | | 11/07/19 | | | | BB | | | | 5,055,750 | |
| $ | 20,681 | | | Total Sovereign Debt (cost $20,922,975) | | | | | | | | | | | | | | | | | | | | 21,014,986 | |
33
| | |
| |
| JHD | | Nuveen High Income December 2019 Target Term Fund(continued) |
| | Portfolio of Investments June 30, 2019 |
| | (Unaudited) |
| | | | | | | | | | | | | | | | | | | | | | | | | | | | |
| | | | | | | |
Principal
Amount (000) | | | Description (1) | | | | | | | | Coupon | | | Maturity | | | Ratings (2) | | | Value | |
| | | | |
| | | | CONVERTIBLE BONDS – 5.9% (5.9% of Total Investments) | | | | | | | | | | | | | |
| | | | | |
| | | | Capital Markets – 1.3% | | | | | | | | | | | | | |
| | | | | |
| $ | 3,500 | | | Prospect Capital Corp | | | | 4.750% | | | | 4/15/20 | | | | BBB– | | | $ | 3,530,137 | |
| | | | | |
| | | | Construction Materials – 0.4% | | | | | | | | | | | | | |
| | | | | |
| | 1,000 | | | Cemex SAB de CV | | | | 3.720% | | | | 3/15/20 | | | | N/R | | | | 996,943 | |
| | | | | |
| | | | Electrical Equipment – 1.2% | | | | | | | | | | | | | |
| | | | | |
| | 3,240 | | | Tesla Energy Operations Inc/DE | | | | 1.625% | | | | 11/01/19 | | | | N/R | | | | 3,124,083 | |
| | | | | |
| | | | Equity Real Estate Investment Trust – 1.1% | | | | | | | | | | | | | |
| | | | | |
| | 3,000 | | | Empire State Realty OP LP, 144A | | | | 2.625% | | | | 8/15/19 | | | | N/R | | | | 2,998,200 | |
| | | | | |
| | | | Metals & Mining – 1.4% | | | | | | | | | | | | | |
| | | | | |
| | 1,750 | | | AK Steel Corp | | | | 5.000% | | | | 11/15/19 | | | | B– | | | | 1,748,223 | |
| | 2,000 | | | Arconic Inc | | | | 1.625% | | | | 10/15/19 | | | | N/R | | | | 2,020,352 | |
| | 3,750 | | | Total Metals & Mining | | | | | | | | | | | | | | | | 3,768,575 | |
| | | | | |
| | | | Oil, Gas & Consumable Fuels – 0.5% | | | | | | | | | | | | | |
| | | | | |
| | 1,500 | | | Whiting Petroleum Corp | | | | 1.250% | | | | 4/01/20 | | | | BB | | | | 1,451,250 | |
| $ | 15,990 | | | Total Convertible Bonds (cost $15,879,256) | | | | | | | | | | | | 15,869,188 | |
| | | | | | | |
Principal
Amount (000) | | | Description (1) | | Coupon (3) | | | Reference
Rate (3) | | | Spread (3) | | | Maturity (4) | | | Ratings (2) | | | Value | |
| |
| | | | VARIABLE RATE SENIOR LOAN INTERESTS – 1.0% (1.0% of Total Investments) (3) | |
| |
| | | | Containers & Packaging – 1.0% | |
| | | | | | | |
| $ | 2,571 | | | Berry Global, Inc., Term Loan S | | | 4.162% | | | | 1-Month LIBOR | | | | 1.750% | | | | 2/08/20 | | | | BBB– | | | $ | 2,571,197 | |
| $ | 2,571 | | | Total Variable Rate Senior Loan Interests (cost $2,569,352) | | | | | | | | | | | | | | | | 2,571,197 | |
| | | | Total Long-Term Investments (cost $191,749,860) | | | | | | | | | | | | | | | | 192,179,850 | |
| | | | | | | |
Principal
Amount (000) | | | Description (1) | | | | | | | | Coupon | | | Maturity | | | | | | Value | |
| |
| | | | SHORT-TERM INVESTMENTS – 28.1% (28.4% of Total Investments) | |
| |
| | | | COMMERCIAL PAPER – 26.9% (27.2% of Total Investments) | |
| |
| | | | Air Freight & Logistics – 2.8% | |
| | | | | | | |
| $ | 5,000 | | | United Parcel Service Inc, 144A | | | | | | | | | | | 0.000% | | | | 11/18/19 | | | | | | | $ | 4,951,778 | |
| | 2,500 | | | United Parcel Service Inc, 144A | | | | | | | | | | | 0.000% | | | | 11/20/19 | | | | | | | | 2,478,305 | |
| | 7,500 | | | Total Air Freight & Logistics | | | | | | | | | | | | | | | | | | | | | | | 7,430,083 | |
| | | | | | | |
| | | | Automobiles – 0.7% | | | | | | | | | | | | | | | | | | |
| | | | | | | |
| | 2,000 | | | Ford Motor Credit Co LLC, 144A | | | | | | | | | | | 0.000% | | | | 11/18/19 | | | | | | | | 1,971,611 | |
| | | | | | | |
| | | | Banks – 3.7% | | | | | | | | | | | | | | | | | | |
| | | | | | | |
| | 5,000 | | | Hannover Funding Co LLC, 144A | | | | | | | | | | | 0.000% | | | | 11/06/19 | | | | | | | | 4,947,378 | |
| | 5,000 | | | Sheffield Receivables Co LLC, 144A | | | | | | | | | | | 0.000% | | | | 11/20/19 | | | | | | | | 4,955,230 | |
| | 10,000 | | | Total Banks | | | | | | | | | | | | | | | | | | | | | | | 9,902,608 | |
| | | | | | | |
| | | | Beverages – 0.3% | | | | | | | | | | | | | | | | | | |
| | | | | | | |
| | 345 | | | Coca-Cola Co, 144A | | | | | | | | | | | 0.000% | | | | 11/12/19 | | | | | | | | 342,034 | |
| | 500 | | | Coca-Cola Co, 144A | | | | | | | | | | | 0.000% | | | | 11/14/19 | | | | | | | | 495,655 | |
| | 845 | | | Total Beverages | | | | | | | | | | | | | | | | | | | | | | | 837,689 | |
34
| | | | | | | | | | | | | | | | | | | | | | | | | | | | |
| | | | | | | |
Principal
Amount (000) | | | Description (1) | | | | | | | | Coupon | | | Maturity | | | | | | Value | |
| | | | | | | |
| | | | Diversified Financial Services – 11.1% | | | | | | | | | | | | | | | | | | |
| | | | | | | |
| $ | 4,000 | | | Chesham Finance LLC, 144A | | | | | | | | | | | 0.000% | | | | 11/18/19 | | | | | | | $ | 3,959,089 | |
| | 1,000 | | | Chesham Finance LLC, 144A | | | | | | | | | | | 0.000% | | | | 11/20/19 | | | | | | | | 990,691 | |
| | 5,000 | | | Ebury Finance LLC, 144A | | | | | | | | | | | 0.000% | | | | 11/20/19 | | | | | | | | 4,953,456 | |
| | 5,000 | | | Fairway Finance Co LLC, 144A | | | | | | | | | | | 0.000% | | | | 11/20/19 | | | | | | | | 4,956,019 | |
| | 5,000 | | | Halkin Finance LLC, 144A | | | | | | | | | | | 0.000% | | | | 11/18/19 | | | | | | | | 4,948,861 | |
| | 450 | | | JP Morgan Securities LLC | | | | | | | | | | | 0.000% | | | | 11/22/19 | | | | | | | | 445,770 | |
| | 5,000 | | | LMA-Americas LLC, 144A | | | | | | | | | | | 0.000% | | | | 11/15/19 | | | | | | | | 4,956,617 | |
| | 5,000 | | | White Plains Capital Co LLC, 144A | | | | | | | | | | | 0.000% | | | | 11/20/19 | | | | | | | | 4,949,708 | |
| | 30,450 | | | Total Diversified Financial Services | | | | | | | | | | | | | | | | | | | | | | | 30,160,211 | |
| | | | | | | |
| | | | Energy Equipment & Services – 1.8% | | | | | | | | | | | | | | | | | | |
| | | | | | | |
| | 5,000 | | | Chevron Corp, 144A | | | | | | | | | | | 0.000% | | | | 11/08/19 | | | | | | | | 4,955,945 | |
| | | | | | | |
| | | | Industrial Conglomerates – 1.8% | | | | | | | | | | | | | | | | | | |
| | | | | | | |
| | 5,000 | | | Anglesea Funding LLC, 144A | | | | | | | | | | | 0.000% | | | | 11/20/19 | | | | | | | | 4,953,653 | |
| | | | | | | |
| | | | Insurance – 2.5% | | | | | | | | | | | | | | | | | | |
| | | | | | | |
| | 5,000 | | | MetLife Short Term Funding LLC, 144A | | | | | | | | | | | 0.000% | | | | 11/08/18 | | | | | | | | 4,957,931 | |
| | 1,750 | | | Prudential PLC, 144A | | | | | | | | | | | 0.000% | | | | 11/08/19 | | | | | | | | 1,733,822 | |
| | 6,750 | | | Total Insurance | | | | | | | | | | | | | | | | | | | | | | | 6,691,753 | |
| | | | | | | |
| | | | Pharmaceuticals – 2.2% | | | | | | | | | | | | | | | | | | |
| | | | | | | |
| | 6,000 | | | Pfizer Inc, 144A | | | | | | | | | | | 0.000% | | | | 11/14/19 | | | | | | | | 5,948,320 | |
| $ | 73,545 | | | Total Commercial Paper (cost $72,851,873) | | | | | | | | | | | | | | | | | | | | | | | 72,851,873 | |
| | | | | | | |
Principal
Amount (000) | | | Description (1) | | | | | | | | Coupon | | | Maturity | | | | | | Value | |
| |
| | | | REPURCHASE AGREEMENTS – 1.2% (1.2% of Total Investments) | |
| | | | | | | |
| $ | 3,295 | | | Repurchase Agreement with Fixed Income Clearing Corporation,
dated 6/28/19, repurchase price $3,294,943,
collateralized by $3,395,000 U.S. Treasury Notes,
1.625%, due 2/15/26, value $3,363,250 | | | | | | | | | | | 1.200% | | | | 7/01/19 | | | | | | | $ | 3,294,614 | |
| | | | Total Short-Term Investments (cost $76,146,487) | | | | | | | | | | | | | | | | | | | | 76,146,487 | |
| | | | Total Investments (cost $267,896,347) – 99.2% | | | | | | | | | | | | | | | | | | | | 268,326,337 | |
| | | | Other Assets Less Liabilities – 0.8% | | | | | | | | | | | | | | | | | | | | | | | 2,239,702 | |
| | | | Net Assets Applicable to Common Shares – 100% | | | | | | | | | | | | | | | | | | | $ | 270,566,039 | |
For Fund portfolio compliance purposes, the Fund’s industry classifications refer to any one or more of the industrysub-classifications used by one or more widely recognized market indexes or ratings group indexes, and/or as defined by Fund management. This definition may not apply for purposes of this report, which may combine industrysub-classifications into sectors for reporting ease.
| (1) | All percentages shown in the Portfolio of Investments are based on net assets applicable to common shares unless otherwise noted. |
| (2) | For financial reporting purposes, the ratings disclosed are the highest of Standard & Poor’s Group (“Standard & Poor’s”), Moody’s Investors Service, Inc. (“Moody’s”) or Fitch, Inc. (“Fitch”) rating. This treatment of split-rated securities may differ from that used for other purposes, such as for Fund investment policies. Ratings below BBB by Standard & Poor’s, Baa by Moody’s or BBB by Fitch are considered to be below investment grade. Holdings designated N/R are not rated by any of these national rating agencies. |
| (3) | Senior loans generally pay interest at rates which are periodically adjusted by reference to a base short-term, floating lending rate (Reference Rate) plus an assigned fixed rate (Spread). These floating lending rates are generally (i) the lending rate referenced by the London Inter-Bank Offered Rate (“LIBOR”), or (ii) the prime rate offered by one or more major United States banks. Senior loans may be considered restricted in that the Fund ordinarily is contractually obligated to receive approval from the agent bank and/or borrower prior to the disposition of a senior loan. The rate shown is the coupon as of the end of the reporting period. |
| (4) | Senior loans generally are subject to mandatory and/or optional prepayment. Because of these mandatory prepayment conditions and because there may be significant economic incentives for a borrower to prepay, prepayments of senior loans may occur. As a result, the actual remaining maturity of senior loans held may be substantially less than the stated maturities shown. |
| 144A | Investment is exempt from registration under Rule 144A of the Securities Act of 1933, as amended. These investments may only be resold in transactions exempt from registration, which are normally those transactions with qualified institutional buyers. |
| LIBOR | London Inter-Bank Offered Rate |
See accompanying notes to financial statements.
35
| | |
| JHB | | Nuveen High Income November 2021
Target Term Fund Portfolio of Investments June 30, 2019 |
| | | (Unaudited) |
| | | | | | | | | | | | | | | | | | | | | | | | |
Principal
Amount (000) | | | Description (1) | | | | | | Coupon | | | Maturity | | | Ratings (2) | | | Value | |
| |
| | | | LONG-TERM INVESTMENTS – 129.1% (100.0% of Total Investments) | |
| |
| | | | CORPORATE BONDS – 118.1% (91.5% of Total Investments) | |
| |
| | | | Aerospace & Defense – 2.5% | |
| | | | | |
| $ | 3,000 | | | Bombardier Inc, 144A | | | 8.750% | | | | 12/01/21 | | | | B | | | $ | 3,270,000 | |
| | 5,750 | | | Bombardier Inc, 144A, (8) | | | 5.750% | | | | 3/15/22 | | | | B | | | | 5,829,063 | |
| | 4,843 | | | Triumph Group Inc | | | 4.875% | | | | 4/01/21 | | | | CCC+ | | | | 4,770,355 | |
| | 13,593 | | | Total Aerospace & Defense | | | | | | | | | | | | | | | 13,869,418 | |
| | | | | |
| | | | Airlines – 2.9% | | | | | | | | | | | | |
| | | | | |
| | 5,675 | | | Air Canada, 144A, (8) | | | 7.750% | | | | 4/15/21 | | | | BB+ | | | | 6,117,650 | |
| | 909 | | | American Airlines2013-2 Class B Pass Through Trust, 144A | | | 5.600% | | | | 7/15/20 | | | | BBB– | | | | 924,992 | |
| | 1,675 | | | American Airlines Group Inc, 144A, (8) | | | 4.625% | | | | 3/01/20 | | | | BB– | | | | 1,685,469 | |
| | 31 | | | Continental Airlines2007-1 Class B Pass Through Trust | | | 6.903% | | | | 4/19/22 | | | | BBB– | | | | 32,068 | |
| | 170 | | | Continental Airlines2009-2 Class A Pass Through Trust | | | 7.250% | | | | 11/10/19 | | | | A | | | | 172,782 | |
| | 500 | | | United Continental Holdings Inc, (8) | | | 6.000% | | | | 12/01/20 | | | | BB | | | | 520,000 | |
| | 6,700 | | | Virgin Australia Holdings Ltd, 144A | | | 7.875% | | | | 10/15/21 | | | | B | | | | 6,875,875 | |
| | 15,660 | | | Total Airlines | | | | | | | | | | | | | | | 16,328,836 | |
| | | | | |
| | | | Auto Components – 1.6% | | | | | | | | | | | | |
| | | | | |
| | 7,000 | | | Icahn Enterprises LP / Icahn Enterprises Finance Corp | | | 5.875% | | | | 2/01/22 | | | | BB+ | | | | 7,070,000 | |
| | 2,000 | | | Icahn Enterprises LP / Icahn Enterprises Finance Corp, (8) | | | 6.250% | | | | 2/01/22 | | | | BB+ | | | | 2,055,000 | |
| | 9,000 | | | Total Auto Components | | | | | | | | | | | | | | | 9,125,000 | |
| | | | | |
| | | | Automobiles – 1.1% | | | | | | | | | | | | |
| | | | | |
| | 6,006 | | | Aston Martin Capital Holdings Ltd, 144A, (8) | | | 6.500% | | | | 4/15/22 | | | | B | | | | 6,021,015 | |
| | | | | |
| | | | Banks – 1.1% | | | | | | | | | | | | |
| | | | | |
| | 2,410 | | | CIT Group Inc | | | 4.125% | | | | 3/09/21 | | | | BB+ | | | | 2,455,910 | |
| | 2,000 | | | Turkiye Is Bankasi AS, 144A | | | 5.000% | | | | 4/30/20 | | | | B+ | | | | 1,990,000 | |
| | 1,844 | | | UniCredit SpA, 144A | | | 3.750% | | | | 4/12/22 | | | | Baa1 | | | | 1,865,140 | |
| | 6,254 | | | Total Banks | | | | | | | | | | | | | | | 6,311,050 | |
| | | | | |
| | | | Building Products – 0.5% | | | | | | | | | | | | |
| | | | | |
| | 2,750 | | | Omnimax International Inc, 144A | | | 12.000% | | | | 8/15/20 | | | | B– | | | | 2,780,938 | |
| | | | | |
| | | | Chemicals – 1.6% | | | | | | | | | | | | |
| | | | | |
| | 2,705 | | | CF Industries Inc, 144A | | | 3.400% | | | | 12/01/21 | | | | BBB– | | | | 2,744,655 | |
| | 2,475 | | | Methanex Corp | | | 5.250% | | | | 3/01/22 | | | | Baa3 | | | | 2,577,681 | |
| | 3,545 | | | WR Grace &Co-Conn, 144A | | | 5.125% | | | | 10/01/21 | | | | BB– | | | | 3,677,938 | |
| | 8,725 | | | Total Chemicals | | | | | | | | | | | | | | | 9,000,274 | |
| | | | | |
| | | | Commercial Services & Supplies – 5.0% | | | | | | | | | | | | |
| | | | | |
| | 7,025 | | | ADT Security Corp/The, (8) | | | 6.250% | | | | 10/15/21 | | | | BB– | | | | 7,428,937 | |
| | 2,854 | | | APX Group Inc, (8) | | | 8.750% | | | | 12/01/20 | | | | CCC | | | | 2,704,165 | |
| | 810 | | | Clean Harbors Inc | | | 5.125% | | | | 6/01/21 | | | | BB+ | | | | 810,000 | |
| | 6,250 | | | GFL Environmental Inc, 144A, (8) | | | 5.625% | | | | 5/01/22 | | | | CCC+ | | | | 6,296,875 | |
| | 3,275 | | | Iron Mountain Inc, 144A, (8) | | | 4.375% | | | | 6/01/21 | | | | BB– | | | | 3,307,750 | |
| | 1,500 | | | Pitney Bowes Inc, (8) | | | 3.875% | | | | 9/15/20 | | | | BB+ | | | | 1,497,705 | |
| | 5,450 | | | RR Donnelley & Sons Co, (8) | | | 7.875% | | | | 3/15/21 | | | | B– | | | | 5,559,000 | |
| | 500 | | | RR Donnelley & Sons Co | | | 7.000% | | | | 2/15/22 | | | | B– | | | | 505,000 | |
| | 27,664 | | | Total Commercial Services & Supplies | | | | | | | | | | | | | | | 28,109,432 | |
| | | | | |
| | | | Communications Equipment – 0.9% | | | | | | | | | | | | |
| | | | | |
| | 3,000 | | | CommScope Inc, 144A | | | 5.000% | | | | 6/15/21 | | | | B1 | | | | 2,992,500 | |
36
| | | | | | | | | | | | | | | | | | | | | | | | |
Principal
Amount (000) | | | Description (1) | | | | | | Coupon | | | Maturity | | | Ratings (2) | | | Value | |
| | | | | |
| | | | Communications Equipment(continued) | | | | | | | | | | | | |
| | | | | |
| $ | 2,000 | | | IHS Netherlands Holdco BV, Reg S | | | 9.500% | | | | 10/27/21 | | | | B+ | | | $ | 2,075,160 | |
| | 5,000 | | | Total Communications Equipment | | | | | | | | | | | | | | | 5,067,660 | |
| | | | | |
| | | | Construction & Engineering – 0.4% | | | | | | | | | | | | |
| | | | | |
| | 2,100 | | | AECOM Global II LLC / URS Fox US LP | | | 5.000% | | | | 4/01/22 | | | | B+ | | | | 2,157,750 | |
| | | | | |
| | | | Consumer Finance – 4.6% | | | | | | | | | | | | |
| | | | | |
| | 4,585 | | | Ally Financial Inc | | | 4.125% | | | | 2/13/22 | | | | BB+ | | | | 4,699,625 | |
| | 7,752 | | | Credit Acceptance Corp, (8) | | | 6.125% | | | | 2/15/21 | | | | BB | | | | 7,752,000 | |
| | 2,100 | | | Navient Corp | | | 6.625% | | | | 7/26/21 | | | | BB | | | | 2,223,375 | |
| | 6,225 | | | Navient Corp, (8) | | | 7.250% | | | | 1/25/22 | | | | BB | | | | 6,715,219 | |
| | 995 | | | SLM Corp | | | 5.125% | | | | 4/05/22 | | | | BB+ | | | | 987,537 | |
| | 3,000 | | | Springleaf Finance Corp | | | 7.750% | | | | 10/01/21 | | | | BB– | | | | 3,281,250 | |
| | 24,657 | | | Total Consumer Finance | | | | | | | | | | | | | | | 25,659,006 | |
| | | | | |
| | | | Containers & Packaging – 1.5% | | | | | | | | | | | | |
| | | | | |
| | 120 | | | Graphic Packaging International LLC | | | 4.750% | | | | 4/15/21 | | | | BB+ | | | | 122,100 | |
| | 6,995 | | | Owens-Brockway Glass Container Inc, 144A | | | 5.000% | | | | 1/15/22 | | | | BB– | | | | 7,169,875 | |
| | 920 | | | Reynolds Group Issuer Inc / Reynolds Group Issuer LLC / Reynolds Group Issuer Lu, 144A | | | 6.097% | | | | 7/15/21 | | | | B+ | | | | 920,000 | |
| | 8,035 | | | Total Containers & Packaging | | | | | | | | | | | | | | | 8,211,975 | |
| | | | | |
| | | | Diversified Financial Services – 3.6% | | | | | | | | | | | | |
| | | | | |
| | 6,000 | | | Avation Capital SA, 144A | | | 6.500% | | | | 5/15/21 | | | | BB– | | | | 6,135,000 | |
| | 6,475 | | | Fly Leasing Ltd | | | 6.375% | | | | 10/15/21 | | | | BB– | | | | 6,628,781 | |
| | 2,798 | | | Park Aerospace Holdings Ltd, 144A | | | 3.625% | | | | 3/15/21 | | | | BBB– | | | | 2,822,623 | |
| | 4,280 | | | PHH Corp | | | 6.375% | | | | 8/15/21 | | | | N/R | | | | 2,996,000 | |
| | 1,650 | | | Ukreximbank Via Biz Finance PLC, 144A | | | 9.625% | | | | 4/27/22 | | | | B– | | | | 1,714,152 | |
| | 21,203 | | | Total Diversified Financial Services | | | | | | | | | | | | | | | 20,296,556 | |
| | | | | |
| | | | Diversified Telecommunication Services – 2.5% | | | | | | | | | | | | |
| | | | | |
| | 9,195 | | | CenturyLink Inc | | | 5.800% | | | | 3/15/22 | | | | BB | | | | 9,585,788 | |
| | 4,250 | | | Cogent Communications Group Inc, 144A | | | 5.375% | | | | 3/01/22 | | | | Ba3 | | | | 4,398,750 | |
| | 175 | | | Level 3 Financing Inc | | | 6.125% | | | | 1/15/21 | | | | BB | | | | 175,875 | |
| | 13,620 | | | Total Diversified Telecommunication Services | | | | | | | | | | | | | | | 14,160,413 | |
| | | | | |
| | | | Electric Utilities – 1.4% | | | | | | | | | | | | |
| | | | | |
| | 4,098 | | | Calpine Corp, 144A, (8) | | | 6.000% | | | | 1/15/22 | | | | BB+ | | | | 4,118,490 | |
| | 1,500 | | | Eskom Holdings SOC Ltd, 144A | | | 5.750% | | | | 1/26/21 | | | | BBB+ | | | | 1,511,976 | |
| | 2,000 | | | Instituto Costarricense de Electricidad, 144A | | | 6.950% | | | | 11/10/21 | | | | B1 | | | | 2,047,500 | |
| | 7,598 | | | Total Electric Utilities | | | | | | | | | | | | | | | 7,677,966 | |
| | | | | |
| | | | Energy Equipment & Services – 2.7% | | | | | | | | | | | | |
| | | | | |
| | 3,000 | | | Chesapeake Energy Corp, (8) | | | 4.875% | | | | 4/15/22 | | | | B+ | | | | 2,835,000 | |
| | 2,559 | | | FTS International Inc | | | 6.250% | | | | 5/01/22 | | | | B | | | | 2,373,472 | |
| | 4,200 | | | Nabors Industries Inc | | | 4.625% | | | | 9/15/21 | | | | BB | | | | 4,095,000 | |
| | 4,116 | | | SESI LLC | | | 7.125% | | | | 12/15/21 | | | | B+ | | | | 2,870,910 | |
| | 2,874 | | | Unit Corp | | | 6.625% | | | | 5/15/21 | | | | BB– | | | | 2,586,600 | |
| | 16,749 | | | Total Energy Equipment & Services | | | | | | | | | | | | | | | 14,760,982 | |
| | | | | |
| | | | Entertainment – 1.3% | | | | | | | | | | | | |
| | | | | |
| | 6,655 | | | Netflix Inc | | | 5.500% | | | | 2/15/22 | | | | BB– | | | | 6,996,069 | |
| | | | | |
| | | | Equity Real Estate Investment Trust – 2.2% | | | | | | | | | | | | |
| | | | | |
| | 3,706 | | | Equinix Inc | | | 5.375% | | | | 1/01/22 | | | | BBB– | | | | 3,803,283 | |
| | 8,290 | | | iStar Inc | | | 6.500% | | | | 7/01/21 | | | | BB | | | | 8,435,075 | |
| | 11,996 | | | Total Equity Real Estate Investment Trust | | | | | | | | | | | | | | | 12,238,358 | |
| | | | | |
| | | | Food & Staples Retailing – 0.2% | | | | | | | | | | | | |
| | | | | |
| | 85 | | | Smithfield Foods Inc, 144A | | | 2.650% | | | | 10/03/21 | | | | BBB | | | | 83,759 | |
37
| | |
| |
| JHB | | Nuveen High Income November 2021 Target Term Fund(continued) |
| | Portfolio of Investments June 30, 2019 |
| | (Unaudited) |
| | | | | | | | | | | | | | | | | | | | | | | | |
Principal
Amount (000) | | | Description (1) | | | | | | Coupon | | | Maturity | | | Ratings (2) | | | Value | |
| | | | | |
| | | | Food & Staples Retailing(continued) | | | | | | | | | | | | |
| | | | | |
| $ | 1,010 | | | Smithfield Foods Inc, 144A | | | 3.350% | | | | 2/01/22 | | | | BBB | | | $ | 1,007,182 | |
| | 1,095 | | | Total Food & Staples Retailing | | | �� | | | | | | | | | | | | 1,090,941 | |
| | | | | |
| | | | Food Products – 0.4% | | | | | | | | | | | | |
| | | | | |
| | 2,150 | | | B&G Foods Inc | | | 4.625% | | | | 6/01/21 | | | | BB– | | | | 2,152,688 | |
| | | | | |
| | | | Health Care Providers & Services – 7.3% | | | | | | | | | | | | |
| | | | | |
| | 1,900 | | | Acadia Healthcare Co Inc | | | 6.125% | | | | 3/15/21 | | | | B– | | | | 1,900,000 | |
| | 4,114 | | | Centene Corp, (8) | | | 5.625% | | | | 2/15/21 | | | | BB+ | | | | 4,191,137 | |
| | 7,000 | | | CHS/Community Health Systems Inc, (8) | | | 5.125% | | | | 8/01/21 | | | | BB | | | | 6,842,500 | |
| | 310 | | | Fresenius Medical Care US Finance II Inc, 144A, (8) | | | 5.875% | | | | 1/31/22 | | | | BBB | | | | 331,111 | |
| | 8,000 | | | HCA Inc | | | 7.500% | | | | 2/15/22 | | | | Ba2 | | | | 8,820,000 | |
| | 4,325 | | | Owens & Minor Inc, (8) | | | 3.875% | | | | 9/15/21 | | | | B | | | | 3,708,688 | |
| | 4,395 | | | Select Medical Corp | | | 6.375% | | | | 6/01/21 | | | | B– | | | | 4,400,933 | |
| | 5,030 | | | Tenet Healthcare Corp, (8) | | | 4.375% | | | | 10/01/21 | | | | BB | | | | 5,105,450 | |
| | 5,000 | | | Tenet Healthcare Corp | | | 8.125% | | | | 4/01/22 | | | | B– | | | | 5,250,000 | |
| | 40,074 | | | Total Health Care Providers & Services | | | | | | | | | | | | | | | 40,549,819 | |
| | | | | |
| | | | Hotels, Restaurants & Leisure – 4.8% | | | | | | | | | | | | |
| | | | | |
| | 1,000 | | | 1011778 BC ULC / New Red Finance Inc, 144A, (8) | | | 4.625% | | | | 1/15/22 | | | | BB– | | | | 1,000,000 | |
| | 7,375 | | | International Game Technology PLC, 144A | | | 6.250% | | | | 2/15/22 | | | | BB+ | | | | 7,789,844 | |
| | 6,825 | | | MGM Resorts International | | | 6.625% | | | | 12/15/21 | | | | BB | | | | 7,371,000 | |
| | 5,922 | | | NCL Corp Ltd, 144A | | | 4.750% | | | | 12/15/21 | | | | BB+ | | | | 6,003,427 | |
| | 2,830 | | | Scientific Games International Inc | | | 6.625% | | | | 5/15/21 | | | | CCC+ | | | | 2,868,912 | |
| | 1,750 | | | Studio City Co Ltd, 144A | | | 7.250% | | | | 11/30/21 | | | | BB– | | | | 1,809,063 | |
| | 150 | | | Yum! Brands Inc | | | 3.750% | | | | 11/01/21 | | | | B+ | | | | 150,750 | |
| | 25,852 | | | Total Hotels, Restaurants & Leisure | | | | | | | | | | | | | | | 26,992,996 | |
| | | | | |
| | | | Household Durables – 7.4% | | | | | | | | | | | | |
| | | | | |
| | 7,725 | | | Beazer Homes USA Inc | | | 8.750% | | | | 3/15/22 | | | | B3 | | | | 8,034,000 | |
| | 1,510 | | | Brookfield Residential Properties Inc, 144A | | | 6.500% | | | | 12/15/20 | | | | B+ | | | | 1,511,887 | |
| | 5,460 | | | KB Home | | | 7.000% | | | | 12/15/21 | | | | BB– | | | | 5,859,945 | |
| | 2,500 | | | Lennar Corp | | | 4.750% | | | | 4/01/21 | | | | BBB– | | | | 2,565,625 | |
| | 1,250 | | | Lennar Corp | | | 6.250% | | | | 12/15/21 | | | | BBB– | | | | 1,318,750 | |
| | 450 | | | Lennar Corp | | | 4.125% | | | | 1/15/22 | | | | BBB– | | | | 461,678 | |
| | 4,000 | | | M/I Homes Inc | | | 6.750% | | | | 1/15/21 | | | | BB– | | | | 4,065,000 | |
| | 5,205 | | | Meritage Homes Corp | | | 7.000% | | | | 4/01/22 | | | | BB | | | | 5,621,400 | |
| | 4,375 | | | New Home Co Inc/The, (8) | | | 7.250% | | | | 4/01/22 | | | | B– | | | | 4,123,437 | |
| | 4,525 | | | PulteGroup Inc | | | 4.250% | | | | 3/01/21 | | | | BB+ | | | | 4,609,844 | |
| | 500 | | | Toll Brothers Finance Corp | | | 5.875% | | | | 2/15/22 | | | | BBB– | | | | 531,250 | |
| | 2,250 | | | TRI Pointe Group Inc | | | 4.875% | | | | 7/01/21 | | | | BB– | | | | 2,295,000 | |
| | 39,750 | | | Total Household Durables | | | | | | | | | | | | | | | 40,997,816 | |
| |
| | | | Independent Power & Renewable Electricity Producers – 0.2% | |
| | | | | |
| | 1,000 | | | AES Corp/VA | | | 4.000% | | | | 3/15/21 | | | | BB+ | | | | 1,017,500 | |
| | | | | |
| | | | Insurance – 0.7% | | | | | | | | | | | | |
| | | | | |
| | 3,897 | | | Genworth Holdings Inc | | | 7.625% | | | | 9/24/21 | | | | B | | | | 3,819,060 | |
| | | | | |
| | | | Leisure Products – 0.6% | | | | | | | | | | | | |
| | | | | |
| | 3,570 | | | Mattel Inc | | | 2.350% | | | | 8/15/21 | | | | B+ | | | | 3,445,050 | |
| | | | | |
| | | | Machinery – 0.3% | | | | | | | | | | | | |
| | | | | |
| | 1,850 | | | CNH Industrial Capital LLC | | | 3.875% | | | | 10/15/21 | | | | BBB | | | | 1,886,075 | |
| | | | | |
| | | | Media – 14.0% | | | | | | | | | | | | |
| | | | | |
| | 6,647 | | | Anixter Inc | | | 5.125% | | | | 10/01/21 | | | | BBB– | | | | 6,887,954 | |
| | 2,500 | | | Cablevision Systems Corp | | | 8.000% | | | | 4/15/20 | | | | B | | | | 2,582,075 | |
| | 5,000 | | | CCO Holdings LLC / CCO Holdings Capital Corp | | | 5.250% | | | | 3/15/21 | | | | BB+ | | | | 5,021,875 | |
| | 5,770 | | | CSC Holdings LLC | | | 6.750% | | | | 11/15/21 | | | | B | | | | 6,173,900 | |
| | 8,900 | | | CSC Holdings LLC, 144A | | | 5.125% | | | | 12/15/21 | | | | B | | | | 8,900,000 | |
38
| | | | | | | | | | | | | | | | | | | | | | | | |
Principal
Amount (000) | | | Description (1) | | | | | | Coupon | | | Maturity | | | Ratings (2) | | | Value | |
| | | | | |
| | | | Media(continued) | | | | | | | | | | | | |
| | | | | |
| $ | 6,985 | | | DISH DBS Corp, (8) | | | 6.750% | | | | 6/01/21 | | | | BB– | | | $ | 7,334,250 | |
| | 4,250 | | | Lee Enterprises Inc, 144A | | | 9.500% | | | | 3/15/22 | | | | B2 | | | | 4,324,375 | |
| | 5,760 | | | National CineMedia LLC | | | 6.000% | | | | 4/15/22 | | | | Ba3 | | | | 5,817,600 | |
| | 5,121 | | | Nexstar Broadcasting Inc, 144A | | | 6.125% | | | | 2/15/22 | | | | B | | | | 5,185,012 | |
| | 7,000 | | | Nielsen Finance LLC / Nielsen Finance Co, 144A | | | 5.000% | | | | 4/15/22 | | | | BB | | | | 6,991,250 | |
| | 3,534 | | | Sinclair Television Group Inc | | | 5.375% | | | | 4/01/21 | | | | B+ | | | | 3,536,209 | |
| | 6,250 | | | TEGNA Inc, 144A | | | 4.875% | | | | 9/15/21 | | | | BB | | | | 6,265,625 | |
| | 6,425 | | | Urban One Inc, 144A | | | 7.375% | | | | 4/15/22 | | | | B2 | | | | 6,408,937 | |
| | 2,500 | | | Virgin Media Secured Finance PLC | | | 5.250% | | | | 1/15/21 | | | | BB+ | | | | 2,606,875 | |
| | 76,642 | | | Total Media | | | | | | | | | | | | | | | 78,035,937 | |
| | | | | |
| | | | Metals & Mining – 8.0% | | | | | | | | | | | | |
| | | | | |
| | 6,500 | | | AK Steel Corp | | | 7.625% | | | | 10/01/21 | | | | B– | | | | 6,402,500 | |
| | 8,040 | | | Allegheny Technologies Inc, (8) | | | 5.950% | | | | 1/15/21 | | | | B | | | | 8,261,100 | |
| | 2,000 | | | Anglo American Capital PLC, 144A | | | 4.125% | | | | 4/15/21 | | | | BBB | | | | 2,045,785 | |
| | 676 | | | Arconic Inc | | | 5.400% | | | | 4/15/21 | | | | BBB– | | | | 700,749 | |
| | 3,825 | | | Arconic Inc, (8) | | | 5.870% | | | | 2/23/22 | | | | BBB– | | | | 4,074,428 | |
| | 2,000 | | | Century Aluminum Co, 144A | | | 7.500% | | | | 6/01/21 | | | | B+ | | | | 1,991,000 | |
| | 5,534 | | | Freeport-McMoRan Inc | | | 3.550% | | | | 3/01/22 | | | | Ba1 | | | | 5,540,918 | |
| | 1,500 | | | Glencore Finance Canada Ltd, 144A | | | 4.950% | | | | 11/15/21 | | | | BBB+ | | | | 1,572,570 | |
| | 3,200 | | | Gold Fields Orogen Holdings BVI Ltd, 144A | | | 4.875% | | | | 10/07/20 | | | | Baa3 | | | | 3,249,920 | |
| | 3,250 | | | Petra Diamonds US Treasury PLC, 144A, (8) | | | 7.250% | | | | 5/01/22 | | | | B– | | | | 3,217,500 | |
| | 1,500 | | | Steel Dynamics Inc | | | 5.125% | | | | 10/01/21 | | | | BB+ | | | | 1,515,630 | |
| | 5,324 | | | Teck Resources Ltd, (8) | | | 4.750% | | | | 1/15/22 | | | | BBB– | | | | 5,513,919 | |
| | 413 | | | Vale Overseas Ltd | | | 4.375% | | | | 1/11/22 | | | | BBB– | | | | 425,497 | |
| | 43,762 | | | Total Metals & Mining | | | | | | | | | | | | | | | 44,511,516 | |
| | | | | |
| | | | Mortgage Real Estate Investment Trust – 1.2% | | | | | | | | | | | | |
| | | | | |
| | 6,500 | | | Starwood Property Trust Inc | | | 5.000% | | | | 12/15/21 | | | | BB– | | | | 6,678,750 | |
| | | | | |
| | | | Multiline Retail – 0.0% | | | | | | | | | | | | |
| | | | | |
| | 37 | | | JC Penney Corp Inc | | | 5.650% | | | | 6/01/20 | | | | B– | | | | 33,300 | |
| | | | | |
| | | | Multi-Utilities – 0.7% | | | | | | | | | | | | |
| | | | | |
| | 3,604 | | | DPL Inc | | | 7.250% | | | | 10/15/21 | | | | BBB– | | | | 3,874,300 | |
| | | | | |
| | | | Oil, Gas & Consumable Fuels – 13.9% | | | | | | | | | | | | |
| | | | | |
| | 3,000 | | | Antero Resources Corp | | | 5.375% | | | | 11/01/21 | | | | BBB– | | | | 2,962,500 | |
| | 2,737 | | | Ascent Resources Utica Holdings LLC / ARU Finance Corp, 144A, (8) | | | 10.000% | | | | 4/01/22 | | | | BB– | | | | 2,897,525 | |
| | 3,655 | | | Calumet Specialty Products Partners LP / Calumet Finance Corp, (8) | | | 6.500% | | | | 4/15/21 | | | | B– | | | | 3,636,725 | |
| | 7,100 | | | CNX Resources Corp | | | 5.875% | | | | 4/15/22 | | | | BB– | | | | 6,887,000 | |
| | 1,020 | | | DCP Midstream Operating LP, 144A | | | 4.750% | | | | 9/30/21 | | | | BB+ | | | | 1,045,500 | |
| | 480 | | | DCP Midstream Operating LP | | | 4.950% | | | | 4/01/22 | | | | BB+ | | | | 498,000 | |
| | 4,500 | | | Denbury Resources Inc, 144A, (8) | | | 9.000% | | | | 5/15/21 | | | | B | | | | 4,432,500 | |
| | 3,000 | | | Enviva Partners LP / Enviva Partners Finance Corp | | | 8.500% | | | | 11/01/21 | | | | BB– | | | | 3,120,000 | |
| | 2,910 | | | Martin Midstream Partners LP / Martin Midstream Finance Corp | | | 7.250% | | | | 2/15/21 | | | | B– | | | | 2,884,392 | |
| | 2,172 | | | Newfield Exploration Co | | | 5.750% | | | | 1/30/22 | | | | BBB | | | | 2,324,015 | |
| | 5,000 | | | NuStar Logistics LP | | | 4.750% | | | | 2/01/22 | | | | Ba2 | | | | 5,025,000 | |
| | 3,000 | | | Oasis Petroleum Inc | | | 6.875% | | | | 3/15/22 | | | | BB– | | | | 2,983,125 | |
| | 4,475 | | | Peabody Energy Corp, 144A | | | 6.000% | | | | 3/31/22 | | | | BB | | | | 4,581,281 | |
| | 2,000 | | | Petrobras Global Finance BV | | | 5.375% | | | | 1/27/21 | | | | Ba2 | | | | 2,068,000 | |
| | 2,000 | | | Petrobras Global Finance BV | | | 8.375% | | | | 5/23/21 | | | | Ba2 | | | | 2,200,000 | |
| | 750 | | | Petrobras Global Finance BV | | | 6.125% | | | | 1/17/22 | | | | Ba2 | | | | 803,167 | |
| | 4,000 | | | Petroleos Mexicanos | | | 5.375% | | | | 3/13/22 | | | | BBB+ | | | | 4,030,200 | |
| | 3,000 | | | QEP Resources Inc | | | 6.875% | | | | 3/01/21 | | | | BB– | | | | 3,082,500 | |
| | 4,483 | | | Range Resources Corp | | | 5.750% | | | | 6/01/21 | | | | BB+ | | | | 4,527,830 | |
| | 2,059 | | | Sabine Pass Liquefaction LLC | | | 6.250% | | | | 3/15/22 | | | | BBB– | | | | 2,234,340 | |
| | 4,000 | | | Southwestern Energy Co, (8) | | | 4.100% | | | | 3/15/22 | | | | BB | | | | 3,890,000 | |
| | 4,500 | | | Whiting Petroleum Corp, (8) | | | 5.750% | | | | 3/15/21 | | | | BB | | | | 4,488,750 | |
| | 5,000 | | | WPX Energy Inc | | | 6.000% | | | | 1/15/22 | | | | BB– | | | | 5,181,250 | |
| | 1,500 | | | YPF SA, 144A, (8) | | | 8.500% | | | | 3/23/21 | | | | B2 | | | | 1,525,875 | |
| | 76,341 | | | Total Oil, Gas & Consumable Fuels | | | | | | | | | | | | | | | 77,309,475 | |
39
| | |
| |
| JHB | | Nuveen High Income November 2021 Target Term Fund(continued) |
| | Portfolio of Investments June 30, 2019 |
| | (Unaudited) |
| | | | | | | | | | | | | | | | | | | | | | | | |
Principal
Amount (000) | | | Description (1) | | | | | | Coupon | | | Maturity | | | Ratings (2) | | | Value | |
| | | | | |
| | | | Personal Products – 0.7% | | | | | | | | | | | | |
| | | | | |
| $ | 4,000 | | | First Quality Finance Co Inc, 144A | | | 4.625% | | | | 5/15/21 | | | | BB– | | | $ | 3,995,000 | |
| | | | | |
| | | | Pharmaceuticals – 2.0% | | | | | | | | | | | | |
| | | | | |
| | 5,000 | | | Bausch Health Cos Inc, 144A, (8) | | | 6.500% | | | | 3/15/22 | | | | Ba2 | | | | 5,181,250 | |
| | 6,199 | | | Teva Pharmaceutical Finance IV BV | | | 3.650% | | | | 11/10/21 | | | | BBB | | | | 5,985,135 | |
| | 11,199 | | | Total Pharmaceuticals | | | | | | | | | | | | | | | 11,166,385 | |
| | | | | |
| | | | Real Estate Management & Development – 1.5% | | | | | | | | | | | | |
| | | | | |
| | 2,900 | | | China Evergrande Group, Reg S | | | 8.250% | | | | 3/23/22 | | | | B2 | | | | 2,794,324 | |
| | 5,930 | | | Realogy Group LLC / RealogyCo-Issuer Corp, 144A, (8) | | | 5.250% | | | | 12/01/21 | | | | B | | | | 5,692,800 | |
| | 8,830 | | | Total Real Estate Management & Development | | | | | | | | | | | | | | | 8,487,124 | |
| | | | | |
| | | | Road & Rail – 1.2% | | | | | | | | | | | | |
| | | | | |
| | 6,750 | | | Hertz Corp/The, (8) | | | 7.375% | | | | 1/15/21 | | | | B– | | | | 6,758,438 | |
| | | | | |
| | | | Semiconductors & Semiconductor Equipment – 0.6% | | | | | | | | | | | | |
| | | | | |
| | 850 | | | Microchip Technology Inc | | | 3.922% | | | | 6/01/21 | | | | Baa3 | | | | 865,023 | |
| | 2,535 | | | NXP BV / NXP Funding LLC, 144A | | | 4.125% | | | | 6/01/21 | | | | BBB– | | | | 2,593,559 | |
| | 3,385 | | | Total Semiconductors & Semiconductor Equipment | | | | | | | | | | | | | | | 3,458,582 | |
| | | | | |
| | | | Specialty Retail – 2.9% | | | | | | | | | | | | |
| | | | | |
| | 7,000 | | | Foot Locker Inc | | | 8.500% | | | | 1/15/22 | | | | BB+ | | | | 7,770,000 | |
| | 2,000 | | | Gap Inc/The, (8) | | | 5.950% | | | | 4/12/21 | | | | Baa2 | | | | 2,088,244 | |
| | 3,755 | | | L Brands Inc | | | 6.625% | | | | 4/01/21 | | | | Ba1 | | | | 3,965,280 | |
| | 448 | | | L Brands Inc | | | 5.625% | | | | 2/15/22 | | | | Ba1 | | | | 468,209 | |
| | 2,000 | | | Rent-A-Center Inc/TX, (8) | | | 4.750% | | | | 5/01/21 | | | | B | | | | 1,997,500 | |
| | 15,203 | | | Total Specialty Retail | | | | | | | | | | | | | | | 16,289,233 | |
| | | | | |
| | | | Technology Hardware, Storage & Peripherals – 3.4% | | | | | | | | | | | | |
| | | | | |
| | 7,000 | | | Dell International LLC / EMC Corp, 144A, (8) | | | 5.875% | | | | 6/15/21 | | | | BB+ | | | | 7,116,164 | |
| | 2,750 | | | NCR Corp | | | 4.625% | | | | 2/15/21 | | | | BB | | | | 2,756,875 | |
| | 2,875 | | | NCR Corp | | | 5.875% | | | | 12/15/21 | | | | BB | | | | 2,912,346 | |
| | 6,085 | | | Seagate HDD Cayman | | | 4.250% | | | | 3/01/22 | | | | Baa3 | | | | 6,186,363 | |
| | 18,710 | | | Total Technology Hardware, Storage & Peripherals | | | | | | | | | | | | | | | 18,971,748 | |
| | | | | |
| | | | Thrifts & Mortgage Finance – 2.0% | | | | | | | | | | | | |
| | | | | |
| | 3,280 | | | Ladder Capital Finance Holdings LLLP / Ladder Capital Finance Corp, 144A | | | 5.250% | | | | 3/15/22 | | | | BB | | | | 3,345,600 | |
| | 8,027 | | | Nationstar Mortgage LLC / Nationstar Capital Corp, (8) | | | 6.500% | | | | 7/01/21 | | | | B | | | | 8,039,201 | |
| | 11,307 | | | Total Thrifts & Mortgage Finance | | | | | | | | | | | | | | | 11,384,801 | |
| | | | | |
| | | | Tobacco – 1.0% | | | | | | | | | | | | |
| | | | | |
| | 5,320 | | | Pyxus International Inc, 144A | | | 8.500% | | | | 4/15/21 | | | | B2 | | | | 5,433,050 | |
| | | | | |
| | | | Trading Companies & Distributors – 1.8% | | | | | | | | | | | | |
| | | | | |
| | 5,000 | | | Aircastle Ltd | | | 5.500% | | | | 2/15/22 | | | | BBB– | | | | 5,298,132 | |
| | 4,750 | | | Fortress Transportation & Infrastructure Investors LLC, 144A | | | 6.750% | | | | 3/15/22 | | | | B+ | | | | 4,934,062 | |
| | 9,750 | | | Total Trading Companies & Distributors | | | | | | | | | | | | | | | 10,232,194 | |
| | | | | |
| | | | Transportation Infrastructure – 0.5% | | | | | | | | | | | | |
| | | | | |
| | 3,000 | | | Navigator Holdings Ltd, 144A, Reg S | | | 7.750% | | | | 2/10/21 | | | | N/R | | | | 2,999,985 | |
| | | | | |
| | | | Wireless Telecommunication Services – 3.4% | | | | | | | | | | | | |
| | | | | |
| | 2,100 | | | CenturyLink Inc | | | 5.625% | | | | 4/01/20 | | | | BB | | | | 2,123,625 | |
| | 6,675 | | | Hughes Satellite Systems Corp | | | 7.625% | | | | 6/15/21 | | | | BB– | | | | 7,142,250 | |
| | 1,475 | | | Sprint Communications Inc | | | 9.250% | | | | 4/15/22 | | | | Ba2 | | | | 1,703,625 | |
| | 6,375 | | | Sprint Corp | | | 7.250% | | | | 9/15/21 | | | | B+ | | | | 6,773,437 | |
| | 1,429 | | | T-Mobile USA Inc | | | 4.000% | | | | 4/15/22 | | | | BB+ | | | | 1,461,153 | |
| | 529 | | | T-Mobile USA Inc, (3) | | | 4.000% | | | | 4/15/22 | | | | N/R | | | | — | |
| | 18,583 | | | Total Wireless Telecommunication Services | | | | | | | | | | | | | | | 19,204,090 | |
| $ | 649,426 | | | Total Corporate Bonds (cost $656,343,974) | | | | | | | | | | | | | | | 659,548,551 | |
40
| | | | | | | | | | | | | | | | | | | | | | | | | | | | |
| | | | | | | |
Principal
Amount (000) | | | Description (1) | | Coupon (4) | | | Reference
Rate (4) | | | Spread (4) | | | Maturity (5) | | | Ratings (2) | | | Value | |
| |
| | | | VARIABLE RATE SENIOR LOAN INTERESTS – 8.2% (6.4% of Total Investments) (4) | |
| |
| | | | Airlines – 0.7% | |
| | | | | | | |
| $ | 4,000 | | | American Airlines, Inc., Replacement Term Loan | | | 4.412% | | | | 1-Month LIBOR | | | | 2.000% | | | | 10/10/21 | | | | BB+ | | | $ | 3,991,380 | |
| | | | | | |
| | | | Commercial Services & Supplies – 1.1% | | | | | | | | | | | | | | | | |
| | | | | | | |
| | 4,992 | | | Granite Acquisition Inc., Term Loan B | | | 6.092% | | | | 3-Month LIBOR | | | | 3.500% | | | | 12/17/21 | | | | B+ | | | | 5,002,066 | |
| | 1,312 | | | KAR Auction Services, Inc., Term Loan B4 | | | 4.625% | | | | 3-Month LIBOR | | | | 2.250% | | | | 3/11/21 | | | | BB | | | | 1,312,986 | |
| | 6,304 | | | Total Commercial Services & Supplies | | | | | | | | | | | | | | | | | | | | 6,315,052 | |
| | | |
| | | | Containers & Packaging – 1.9% | | | | | �� | | |
| | | | | | | |
| | 6,000 | | | Berry Global, Inc., Term Loan T | | | 4.162% | | | | 1-Month LIBOR | | | | 1.750% | | | | 1/06/21 | | | | BBB– | | | | 5,988,450 | |
| | 4,476 | | | Pregis Holding I Corporation, Term Loan | | | 5.811% | | | | 1-Month LIBOR | | | | 3.500% | | | | 5/20/21 | | | | B | | | | 4,480,305 | |
| | 10,476 | | | Total Containers & Packaging | | | | | | | | | | | | | | | | | | | | | | | 10,468,755 | |
| | | | | | |
| | | | Health Care Providers & Services – 0.5% | | | | | | | | | | | | | | | | |
| | | | | | | |
| | 2,984 | | | DaVita HealthCare Partners, Inc., Tranche B, Term Loan | | | 5.135% | | | | 1-Week LIBOR | | | | 2.750% | | | | 6/24/21 | | | | BBB– | | | | 2,986,785 | |
| | | | | | | |
| | | | IT Services – 0.9% | | | | | | | | | | | | | | | | | | |
| | | | | | | |
| | 4,917 | | | ProQuest LLC, Term Loan B | | | 5.652% | | | | 1-Month LIBOR | | | | 3.250% | | | | 10/24/21 | | | | B | | | | 4,915,677 | |
| | | | | | | |
| | | | Software – 2.4% | | | | | | | | | | | | | | | | | | |
| | | | | | | |
| | 2,997 | | | Infor (US), Inc., Term Loan B | | | 5.080% | | | | 3-Month LIBOR | | | | 2.750% | | | | 2/01/22 | | | | Ba3 | | | | 2,994,438 | |
| | 6,707 | | | Micro Focus International PLC, Term Loan B2 | | | 4.652% | | | | 1-Month LIBOR | | | | 2.250% | | | | 11/30/21 | | | | BB– | | | | 6,652,922 | |
| | 3,980 | | | TIBCO Software, Inc., Term Loan, First Lien | | | 5.910% | | | | 1-Month LIBOR | | | | 3.500% | | | | 12/04/20 | | | | BB– | | | | 3,992,664 | |
| | 13,684 | | | Total Software | | | | | | | | | | | | | | | | | | | | | | | 13,640,024 | |
| | | | | | | |
| | | | Specialty Retail – 0.7% | | | | | | | | | | | | | | | | | | |
| | | | | | | |
| | 3,750 | | | Petsmart Inc., Term Loan B, First Lien, (WI/DD) | | | TBD | | | | TBD | | | | TBD | | | | TBD | | | | B | | | | 3,660,356 | |
| $ | 46,115 | | | Total Variable Rate Senior Loan Interests (cost $45,841,657) | | | | | | | | | | | | | | | | 45,978,029 | |
| | | | | | | |
Principal
Amount (000) | | | Description (1) | | | | | | | | Coupon | | | Maturity | | | Ratings (2) | | | Value | |
| |
| | | | SOVEREIGN DEBT – 2.1% (1.6% of Total Investments) | |
| | | | | |
| | | | Argentina – 0.3% | | | | | | | | | | | | | |
| | | | | |
| $ | 2,000 | | | Argentine Republic Government International Bond | | | | 6.875% | | | | 4/22/21 | | | | B | | | $ | 1,755,000 | |
| | | | | |
| | | | Egypt – 0.6% | | | | | | | | | | | | | |
| | | | | |
| | 3,000 | | | Egypt Government International Bond, 144A | | | | 6.125% | | | | 1/31/22 | | | | B+ | | | | 3,092,790 | |
| | | | | |
| | | | Honduras – 0.3% | | | | | | | | | | | | | |
| | | | | |
| | 1,500 | | | Honduras Government International Bond, 144A | | | | 8.750% | | | | 12/16/20 | | | | BB– | | | | 1,605,015 | |
| | | | | |
| | | | Sri Lanka – 0.3% | | | | | | | | | | | | | |
| | | | | |
| | 1,500 | | | Sri Lanka Government International Bond, 144A | | | | 5.750% | | | | 1/18/22 | | | | B | | | | 1,504,056 | |
| | | | | |
| | | | Turkey – 0.6% | | | | | | | | | | | | | |
| | | | | |
| | 3,625 | | | Turkey Government International Bond, (8) | | | | 5.125% | | | | 3/25/22 | | | | BB | | | | 3,571,024 | |
| $ | 11,625 | | | Total Sovereign Debt (cost $11,924,438) | | | | | | | | | | | | | | | | 11,527,885 | |
41
| | |
| |
| JHB | | Nuveen High Income November 2021 Target Term Fund(continued) |
| | Portfolio of Investments June 30, 2019 |
| | (Unaudited) |
| | | | | | | | | | | | | | | | | | | | | | | | |
| | | | | | | |
Principal
Amount (000) | | | Description (1) | | | | | | Coupon | | | Maturity | | | Ratings (2) | | | Value | |
| |
| | | | CONVERTIBLE BONDS – 0.7% (0.5% of Total Investments) | |
| |
| | | | Independent Power & Renewable Electricity Producers – 0.7% | |
| | | | | |
| $ | 4,000 | | | Clearway Energy Inc, 144A | | | 3.250% | | | | 6/01/20 | | | | N/R | | | $ | 3,920,000 | |
| $ | 4,000 | | | Total Convertible Bonds (cost $3,970,453) | | | | | | | | | | | | | | | 3,920,000 | |
| | | | Total Long-Term Investments (cost $718,080,522) | | | | | | | | | | | | | | | 720,974,465 | |
| | | | Borrowings – (37.1)% (6), (7) | | | | | | | | | | | | | | | (207,000,000 | ) |
| | | | Other Assets Less Liabilities – 8.0% | | | | | | | | | | | | | | | 44,441,599 | |
| | | | Net Assets Applicable to Common Shares – 100% | | | | | | | | | | | | | | $ | 558,416,064 | |
For Fund portfolio compliance purposes, the Fund’s industry classifications refer to any one or more of the industrysub-classifications used by one or more widely recognized market indexes or ratings group indexes, and/or as defined by Fund management. This definition may not apply for purposes of this report, which may combine industrysub-classifications into sectors for reporting ease.
| (1) | All percentages shown in the Portfolio of Investments are based on net assets applicable to common shares unless otherwise noted. |
| (2) | For financial reporting purposes, the ratings disclosed are the highest of Standard & Poor’s Group (“Standard & Poor’s”), Moody’s Investors Service, Inc. (“Moody’s”) or Fitch, Inc. (“Fitch”) rating. This treatment of split-rated securities may differ from that used for other purposes, such as for Fund investment policies. Ratings below BBB by Standard & Poor’s, Baa by Moody’s or BBB by Fitch are considered to be below investment grade. Holdings designated N/R are not rated by any of these national rating agencies. |
| (3) | Investment valued at fair value using methods determined in good faith by, or at the discretion of, the Board. For fair value measurement disclosure purposes, investment classified as Level 3. See Notes to Financial Statements, Note 2 – Investment Valuation and Fair Value Measurements for more information. |
| (4) | Senior loans generally pay interest at rates which are periodically adjusted by reference to a base short-term, floating lending rate (Reference Rate) plus an assigned fixed rate (Spread). These floating lending rates are generally (i) the lending rate referenced by the London Inter-Bank Offered Rate (“LIBOR”), or (ii) the prime rate offered by one or more major United States banks. Senior loans may be considered restricted in that the Fund ordinarily is contractually obligated to receive approval from the agent bank and/or borrower prior to the disposition of a senior loan. The rate shown is the coupon as of the end of the reporting period. |
| (5) | Senior loans generally are subject to mandatory and/or optional prepayment. Because of these mandatory prepayment conditions and because there may be significant economic incentives for a borrower to prepay, prepayments of senior loans may occur. As a result, the actual remaining maturity of senior loans held may be substantially less than the stated maturities shown. |
| (6) | Borrowings as a percentage of Total Investments is 26.7%. |
| (7) | The Fund may pledge up to 100% of its eligible investments (excluding any investments separately pledged as collateral for specific investments in derivatives, when applicable) in the Portfolio of Investments as collateral for borrowings. |
| (8) | Investment, or portion of investment, is hypothecated as described in the Notes to Financial Statements, Note 8 – Fund Leverage, Rehypothecation. The total value of investments hypothecated as of the end of the reporting period was $138,332,981. |
| 144A | Investment is exempt from registration under Rule 144A of the Securities Act of 1933, as amended. These investments may only be resold in transactions exempt from registration, which are normally those transactions with qualified institutional buyers. |
| LIBOR | London Inter-Bank Offered Rate |
| Reg S | Regulation S allows U.S. companies to sell securities to persons or entities located outside of the United States without registering those securities with the Securities and Exchange Commission. Specifically, Regulation S provides a safe harbor from the registration requirements of the Securities Act for the offers and sales of securities by both foreign and domestic issuers that are made outside the United States. |
| TBD | Senior Loan purchased on a when-issued or delayed-delivery basis. Certain details associated with this purchase are not known prior to the settlement date of the transaction. In addition, Senior Loans typically trade without accrued interest and therefore a coupon rate is not available prior to settlement. At settlement, if still unknown, the borrower or counterparty will provide the Fund with the final coupon rate and maturity date. |
| WI/DD | Purchased on a when-issued or delayed delivery basis. |
See accompanying notes to financial statements.
42
| | |
| JHAA | | Nuveen High Income 2023 Target
Term Fund Portfolio of Investments June 30, 2019 |
| | | (Unaudited) |
| | | | | | | | | | | | | | | | | | | | | | | | | | | | |
Principal
Amount (000) | | | Description (1) | | | | | | | | Coupon | | | Maturity | | | Ratings (2) | | | Value | |
| |
| | | | LONG-TERM INVESTMENTS – 129.7% (98.3% of Total Investments) | |
| |
| | | | CORPORATE BONDS – 79.8% (60.5% of Total Investments) | |
| |
| | | | Aerospace & Defense – 0.8% | |
| | | | | | | |
| $ | 600 | | | Bombardier Inc, 144A | | | | | | | | | | | 6.125% | | | | 1/15/23 | | | | B | | | $ | 608,250 | |
| | | | | | | |
| | | | Air Freight & Logistics – 1.5% | | | | | | | | | | | | | | | | | | |
| | | | | | | |
| | 1,200 | | | XPO Logistics Inc, 144A | | | | | | | | | | | 6.125% | | | | 9/01/23 | | | | BB– | | | | 1,243,500 | |
| | | | | | | |
| | | | Airlines – 1.9% | | | | | | | | | | | | | | | | | | |
| | | | | | | |
| | 500 | | | American Airlines Group Inc, 144A | | | | | | | | | | | 5.000% | | | | 6/01/22 | | | | BB– | | | | 515,150 | |
| | 1,000 | | | United Continental Holdings Inc | | | | | | | | | | | 5.000% | | | | 2/01/24 | | | | BB | | | | 1,035,000 | |
| | 1,500 | | | Total Airlines | | | | | | | | | | | | | | | | | | | | | | | 1,550,150 | |
| | | | | | | |
| | | | Auto Components – 2.3% | | | | | | | | | | | | | | | | | | |
| | | | | | | |
| | 800 | | | Dana Inc | | | | | | | | | | | 6.000% | | | | 9/15/23 | | | | BB+ | | | | 818,000 | |
| | 975 | | | Icahn Enterprises LP / Icahn Enterprises Finance Corp | | | | | | | | | | | 6.750% | | | | 2/01/24 | | | | BB+ | | | | 1,012,781 | |
| | 1,775 | | | Total Auto Components | | | | | | | | | | | | | | | | | | | | | | | 1,830,781 | |
| | | | | | | |
| | | | Automobiles – 1.6% | | | | | | | | | | | | | | | | | | |
| | | | | | | |
| | 375 | | | Fiat Chrysler Automobiles NV | | | | | | | | | | | 5.250% | | | | 4/15/23 | | | | BBB– | | | | 396,101 | |
| | 800 | | | Ford Motor Credit Co LLC | | | | | | | | | | | 5.584% | | | | 3/18/24 | | | | BBB | | | | 856,876 | |
| | 1,175 | | | Total Automobiles | | | | | | | | | | | | | | | | | | | | | | | 1,252,977 | |
| | | | | | | |
| | | | Building Products – 0.8% | | | | | | | | | | | | | | | | | | |
| | | | | | | |
| | 650 | | | CEMEX Finance LLC, 144A | | | | | | | | | | | 6.000% | | | | 4/01/24 | | | | BB | | | | 669,500 | |
| | | | | | | |
| | | | Chemicals – 5.2% | | | | | | | | | | | | | | | | | | |
| | | | | | | |
| | 250 | | | Blue Cube Spinco LLC | | | | | | | | | | | 9.750% | | | | 10/15/23 | | | | BB+ | | | | 276,250 | |
| | 800 | | | Chemours Co/The | | | | | | | | | | | 6.625% | | | | 5/15/23 | | | | BB– | | | | 827,496 | |
| | 1,275 | | | NOVA Chemicals Corp, 144A | | | | | | | | | | | 4.875% | | | | 6/01/24 | | | | BBB– | | | | 1,319,625 | |
| | 1,200 | | | OCI NV, 144A | | | | | | | | | | | 6.625% | | | | 4/15/23 | | | | BB | | | | 1,248,000 | |
| | 500 | | | Univar USA Inc, 144A | | | | | | | | | | | 6.750% | | | | 7/15/23 | | | | BB | | | | 509,375 | |
| | 4,025 | | | Total Chemicals | | | | | | | | | | | | | | | | | | | | | | | 4,180,746 | |
| | | | | | | |
| | | | Commercial Services & Supplies – 3.2% | | | | | | | | | | | | | | | | | | |
| | | | | | | |
| | 1,475 | | | ADT Security Corp/The | | | | | | | | | | | 4.125% | | | | 6/15/23 | | | | BB– | | | | 1,475,000 | |
| | 600 | | | Covanta Holding Corp | | | | | | | | | | | 5.875% | | | | 3/01/24 | | | | B1 | | | | 618,000 | |
| | 525 | | | GFL Environmental Inc, 144A | | | | | | | | | | | 5.375% | | | | 3/01/23 | | | | CCC+ | | | | 519,750 | |
| | 2,600 | | | Total Commercial Services & Supplies | | | | | | | | | | | | | | | | | | | | | | | 2,612,750 | |
| | | | | | | |
| | | | Communications Equipment – 0.5% | | | | | | | | | | | | | | | | | | |
| | | | | | | |
| | 375 | | | Anixter Inc | | | | | | | | | | | 5.500% | | | | 3/01/23 | | | | BBB– | | | | 398,906 | |
| | | | | | | |
| | | | Consumer Finance – 3.5% | | | | | | | | | | | | | | | | | | |
| | | | | | | |
| | 800 | | | Navient Corp | | | | | | | | | | | 7.250% | | | | 9/25/23 | | | | BB | | | | 854,000 | |
| | 1,300 | | | Springleaf Finance Corp | | | | | | | | | | | 8.250% | | | | 10/01/23 | | | | BB– | | | | 1,506,700 | |
| | 500 | | | TMX Finance LLC / TitleMax Finance Corp, 144A | | | | | | | | | | | 11.125% | | | | 4/01/23 | | | | B– | | | | 472,500 | |
| | 2,600 | | | Total Consumer Finance | | | | | | | | | | | | | | | | | | | | | | | 2,833,200 | |
| | | | | | | |
| | | | Containers & Packaging – 1.1% | | | | | | | | | | | | | | | | | | |
| | | | | | | |
| | 850 | | | Sealed Air Corp, 144A | | | | | | | | | | | 5.250% | | | | 4/01/23 | | | | BB+ | | | | 892,500 | |
43
| | |
| |
| JHAA | | Nuveen High Income 2023 Target Term Fund(continued) |
| | Portfolio of Investments June 30, 2019 |
| | (Unaudited) |
| | | | | | | | | | | | | | | | | | | | | | | | | | | | |
Principal
Amount (000) | | | Description (1) | | | | | | | | Coupon | | | Maturity | | | Ratings (2) | | | Value | |
| | | | | | | |
| | | | Diversified Financial Services – 0.8% | | | | | | | | | | | | | | | | | | |
| | | | | | | |
| $ | 300 | | | Park Aerospace Holdings Ltd, 144A | | | | | | | | | | | 4.500% | | | | 3/15/23 | | | | BBB– | | | $ | 310,368 | |
| | 350 | | | Park Aerospace Holdings Ltd, 144A | | | | | | | | | | | 5.500% | | | | 2/15/24 | | | | BBB– | | | | 377,293 | |
| | 650 | | | Total Diversified Financial Services | | | | | | | | | | | | | | | | | | | | | | | 687,661 | |
| | | | | | | |
| | | | Diversified Telecommunication Services – 1.3% | | | | | | | | | | | | | | | | | | |
| | | | | | | |
| | 1,000 | | | CenturyLink Inc, (3) | | | | | | | | | | | 6.750% | | | | 12/01/23 | | | | BB | | | | 1,078,750 | |
| | | | | | | |
| | | | Electric Utilities – 1.3% | | | | | | | | | | | | | | | | | | |
| | | | | | | |
| | 475 | | | Calpine Corp | | | | | | | | | | | 5.500% | | | | 2/01/24 | | | | BB– | | | | 470,250 | |
| | 600 | | | TerraForm Power Operating LLC, 144A | | | | | | | | | | | 4.250% | | | | 1/31/23 | | | | BB | | | | 600,750 | |
| | 1,075 | | | Total Electric Utilities | | | | | | | | | | | | | | | | | | | | | | | 1,071,000 | |
| | | | | | | |
| | | | Energy Equipment & Services – 2.7% | | | | | | | | | | | | | | | | | | |
| | | | | | | |
| | 375 | | | Chesapeake Energy Corp | | | | | | | | | | | 5.750% | | | | 3/15/23 | | | | B+ | | | | 351,562 | |
| | 500 | | | Diamond Offshore Drilling Inc | | | | | | | | | | | 3.450% | | | | 11/01/23 | | | | B | | | | 420,000 | |
| | 1,000 | | | Nabors Industries Inc | | | | | | | | | | | 5.100% | | | | 9/15/23 | | | | BB | | | | 882,500 | |
| | 500 | | | Transocean Sentry Ltd, 144A | | | | | | | | | | | 5.375% | | | | 5/15/23 | | | | B+ | | | | 500,625 | |
| | 2,375 | | | Total Energy Equipment & Services | | | | | | | | | | | | | | | | | | | | | | | 2,154,687 | |
| | | | | | | |
| | | | Equity Real Estate Investment Trust – 1.8% | | | | | | | | | | | | | | | | | | |
| | | | | | | |
| | 800 | | | iStar Inc | | | | | | | | | | | 5.250% | | | | 9/15/22 | | | | BB | | | | 819,000 | |
| | 600 | | | MPT Operating Partnership LP / MPT Finance Corp | | | | | | | | | | | 5.500% | | | | 5/01/24 | | | | BBB– | | | | 615,000 | |
| | 1,400 | | | Total Equity Real Estate Investment Trust | | | | | | | | | | | | | | | | | | | | | | | 1,434,000 | |
| | | | | | | |
| | | | Food Products – 1.6% | | | | | | | | | | | | | | | | | | |
| | | | | | | |
| | 1,250 | | | MARB BondCo PLC, 144A | | | | | | | | | | | 7.000% | | | | 3/15/24 | | | | BB– | | | | 1,304,013 | |
| | | | | | | |
| | | | Gas Utilities – 3.0% | | | | | | | | | | | | | | | | | | |
| | | | | | | |
| | 900 | | | AmeriGas Partners LP / AmeriGas Finance Corp | | | | | | | | | | | 5.625% | | | | 5/20/24 | | | | BB | | | | 958,500 | |
| | 625 | | | Rockpoint Gas Storage Canada Ltd, 144A | | | | | | | | | | | 7.000% | | | | 3/31/23 | | | | BB– | | | | 633,594 | |
| | 825 | | | Suburban Propane Partners LP/Suburban Energy Finance Corp | | | | | | | | | | | 5.500% | | | | 6/01/24 | | | | BB– | | | | 829,125 | |
| | 2,350 | | | Total Gas Utilities | | | | | | | | | | | | | | | | | | | | | | | 2,421,219 | |
| | | | | | | |
| | | | Health Care Providers & Services – 2.4% | | | | | | | | | | | | | | | | | | |
| | | | | | | |
| | 500 | | | CHS/Community Health Systems Inc, 144A | | | | | | | | | | | 8.625% | | | | 1/15/24 | | | | B– | | | | 501,555 | |
| | 850 | | | MEDNAX Inc, 144A | | | | | | | | | | | 5.250% | | | | 12/01/23 | | | | BBB– | | | | 839,375 | |
| | 600 | | | Tenet Healthcare Corp, (3) | | | | | | | | | | | 6.750% | | | | 6/15/23 | | | | B– | | | | 602,250 | |
| | 1,950 | | | Total Health Care Providers & Services | | | | | | | | | | | | | | | | | | | | | | | 1,943,180 | |
| | | | | | | |
| | | | Hotels, Restaurants & Leisure – 3.8% | | | | | | | | | | | | | | | | | | |
| | | | | | | |
| | 750 | | | Carlson Travel Inc, 144A | | | | | | | | | | | 6.750% | | | | 12/15/23 | | | | B2 | | | | 759,375 | |
| | 1,000 | | | MGM Resorts International | | | | | | | | | | | 6.000% | | | | 3/15/23 | | | | BB | | | | 1,083,750 | |
| | 600 | | | Scientific Games International Inc | | | | | | | | | | | 6.625% | | | | 5/15/21 | | | | CCC+ | | | | 608,250 | |
| | 600 | | | Wynn Las Vegas LLC / Wynn Las Vegas Capital Corp, 144A | | | | | | | | | | | 4.250% | | | | 5/30/23 | | | | BB | | | | 598,500 | |
| | 2,950 | | | Total Hotels, Restaurants & Leisure | | | | | | | | | | | | | | | | | | | | | | | 3,049,875 | |
| | | | | | | |
| | | | Household Durables – 4.8% | | | | | | | | | | | | | | | | | | |
| | | | | | | |
| | 1,250 | | | KB Home | | | | | | | | | | | 7.625% | | | | 5/15/23 | | | | BB– | | | | 1,396,875 | |
| | 650 | | | Lennar Corp | | | | | | | | | | | 4.875% | | | | 12/15/23 | | | | BBB– | | | | 684,938 | |
| | 785 | | | Taylor Morrison Communities Inc / Taylor Morrison Holdings II Inc, 144A | | | | 5.625% | | | | 3/01/24 | | | | BB | | | | 810,512 | |
| | 900 | | | Toll Brothers Finance Corp | | | | | | | | | | | 5.625% | | | | 1/15/24 | | | | BBB– | | | | 966,375 | |
| | 3,585 | | | Total Household Durables | | | | | | | | | | | | | | | | | | | | | | | 3,858,700 | |
| | | | |
| | | | Independent Power & Renewable Electricity Producers – 0.8% | | | | | | | | | | |
| | | | | | | |
| | 600 | | | Vistra Energy Corp | | | | | | | | | | | 5.875% | | | | 6/01/23 | | | | BB | | | | 613,500 | |
| | | | | | | |
| | | | Machinery – 1.8% | | | | | | | | | | | | | | | | | | |
| | | | | | | |
| | 750 | | | Apex Tool Group LLC / BC Mountain Finance Inc, 144A | | | | | | | | | | | 9.000% | | | | 2/15/23 | | | | CCC+ | | | | 669,375 | |
| | 800 | | | Cleaver-Brooks Inc, 144A | | | | | | | | | | | 7.875% | | | | 3/01/23 | | | | B | | | | 767,168 | |
| | 1,550 | | | Total Machinery | | | | | | | | | | | | | | | | | | | | | | | 1,436,543 | |
44
| | | | | | | | | | | | | | | | | | | | | | | | | | | | |
Principal
Amount (000) | | | Description (1) | | | | | | | | Coupon | | | Maturity | | | Ratings (2) | | | Value | |
| | | | | | | |
| | | | Media – 3.8% | | | | | | | | | | | | | | | | | | |
| | | | | | | |
| $ | 744 | | | Altice France SA/France, 144A | | | | | | | | | | | 6.250% | | | | 5/15/24 | | | | B | | | $ | 766,320 | |
| | 850 | | | AMC Networks Inc | | | | | | | | | | | 5.000% | | | | 4/01/24 | | | | BB | | | | 872,313 | |
| | 375 | | | CCO Holdings LLC / CCO Holdings Capital Corp, 144A | | | | | | | | 4.000% | | | | 3/01/23 | | | | BB+ | | | | 375,820 | |
| | 600 | | | CSC Holdings LLC | | | | | | | | | | | 5.250% | | | | 6/01/24 | | | | B+ | | | | 623,250 | |
| | 375 | | | Lamar Media Corp | | | | | | | | | | | 5.375% | | | | 1/15/24 | | | | BB | | | | 385,781 | |
| | 2,944 | | | Total Media | | | | | | | | | | | | | | | | | | | | | | | 3,023,484 | |
| | | | | | | |
| | | | Metals & Mining – 8.1% | | | | | | | | | | | | | | | | | | |
| | | | | | | |
| | 600 | | | Allegheny Technologies Inc | | | | | | | | | | | 7.875% | | | | 8/15/23 | | | | B | | | | 642,930 | |
| | 850 | | | Commercial Metals Co | | | | | | | | | | | 4.875% | | | | 5/15/23 | | | | BB+ | | | | 856,375 | |
| | 650 | | | Constellium NV, 144A | | | | | | | | | | | 5.750% | | | | 5/15/24 | | | | B | | | | 664,625 | |
| | 1,250 | | | First Quantum Minerals Ltd, 144A | | | | | | | | | | | 6.500% | | | | 3/01/24 | | | | B | | | | 1,168,750 | |
| | 1,125 | | | FMG Resources August 2006 Pty Ltd, 144A | | | | | | | | | | | 5.125% | | | | 5/15/24 | | | | BB+ | | | | 1,165,781 | |
| | 500 | | | Freeport-McMoRan Inc | | | | | | | | | | | 3.875% | | | | 3/15/23 | | | | Ba1 | | | | 500,000 | |
| | 650 | | | Hudbay Minerals Inc, 144A | | | | | | | | | | | 7.250% | | | | 1/15/23 | | | | B+ | | | | 669,500 | |
| | 800 | | | Kaiser Aluminum Corp | | | | | | | | | | | 5.875% | | | | 5/15/24 | | | | BB+ | | | | 832,000 | |
| | 6,425 | | | Total Metals & Mining | | | | | | | | | | | | | | | | | | | | | | | 6,499,961 | |
| | | | | | | |
| | | | Oil, Gas & Consumable Fuels – 6.1% | | | | | | | | | | | | | | | | | | |
| | | | | | |
| | 250 | | | Calumet Specialty Products Partners LP / Calumet Finance Corp | | | | | | | | 7.750% | | | | 4/15/23 | | | | B– | | | | 239,375 | |
| | 455 | | | Denbury Resources Inc, 144A | | | | | | | | | | | 7.750% | | | | 2/15/24 | | | | B3 | | | | 377,650 | |
| | 250 | | | Energy Transfer Operating LP | | | | | | | | | | | 5.875% | | | | 1/15/24 | | | | BBB– | | | | 277,845 | |
| | 625 | | | Genesis Energy LP / Genesis Energy Finance Corp | | | | | | | | 6.000% | | | | 5/15/23 | | | | B+ | | | | 620,313 | |
| | 250 | | | Oasis Petroleum Inc | | | | | | | | | | | 6.875% | | | | 1/15/23 | | | | BB– | | | | 250,000 | |
| | 750 | | | PBF Holding Co LLC / PBF Finance Corp | | | | | | | | | | | 7.000% | | | | 11/15/23 | | | | BB | | | | 778,132 | |
| | 375 | | | Range Resources Corp | | | | | | | | | | | 5.000% | | | | 3/15/23 | | | | BB+ | | | | 352,969 | |
| | 1,000 | | | SM Energy Co | | | | | | | | | | | 5.000% | | | | 1/15/24 | | | | BB– | | | | 917,500 | |
| | 1,100 | | | Sunoco LP / Sunoco Finance Corp | | | | | | | | | | | 4.875% | | | | 1/15/23 | | | | BB | | | | 1,123,375 | |
| | 5,055 | | | Total Oil, Gas & Consumable Fuels | | | | | | | | | | | | | | | | | | | | | | | 4,937,159 | |
| | | | | | | |
| | | | Pharmaceuticals – 2.7% | | | | | | | | | | | | | | | | | | |
| | | | | | | |
| | 900 | | | Bausch Health Cos Inc, 144A | | | | | | | | | | | 7.000% | | | | 3/15/24 | | | | Ba2 | | | | 956,340 | |
| | 1,300 | | | Teva Pharmaceutical Finance Netherlands III BV | | | | | | | | | | | 6.000% | | | | 4/15/24 | | | | BB | | | | 1,226,062 | |
| | 2,200 | | | Total Pharmaceuticals | | | | | | | | | | | | | | | | | | | | | | | 2,182,402 | |
| | |
| | | | Real Estate Management & Development – 1.8% | | | | |
| | | | | | | |
| | 650 | | | Kennedy-Wilson Inc | | | | | | | | | | | 5.875% | | | | 4/01/24 | | | | BB | | | | 663,000 | |
| | 850 | | | Realogy Group LLC / RealogyCo-Issuer Corp, 144A, (3) | | | | | | | | 4.875% | | | | 6/01/23 | | | | B | | | | 765,000 | |
| | 1,500 | | | Total Real Estate Management & Development | | | | | | | | | | | | | | | | | | | | | | | 1,428,000 | |
| | | | | | | |
| | | | Road & Rail – 2.8% | | | | | | | | | | | | | | | | | | |
| | | | | | |
| | 1,250 | | | Avis Budget Car Rental LLC / Avis Budget Finance Inc, 144A | | | | | | | | 6.375% | | | | 4/01/24 | | | | BB | | | | 1,309,375 | |
| | 925 | | | Hertz Corp/The, 144A | | | | | | | | | | | 7.625% | | | | 6/01/22 | | | | B+ | | | | 960,844 | |
| | 2,175 | | | Total Road & Rail | | | | | | | | | | | | | | | | | | | | | | | 2,270,219 | |
| |
| | | | Specialty Retail – 2.6% | |
| | | | | | |
| | 1,000 | | | L Brands Inc | | | | | | | | 5.625% | | | | 10/15/23 | | | | Ba1 | | | | 1,036,990 | |
| | 500 | | | PetSmart Inc, 144A | | | | | | | | 7.125% | | | | 3/15/23 | | | | CCC+ | | | | 461,250 | |
| | 600 | | | Sonic Automotive Inc | | | | | | | | 5.000% | | | | 5/15/23 | | | | B+ | | | | 605,250 | |
| | 2,100 | | | Total Specialty Retail | | | | | | | | | | | | | | | | | | | | 2,103,490 | |
| | | |
| | | | Technology Hardware, Storage & Peripherals – 0.5% | | | | | | | |
| | | | | | |
| | 375 | | | EMC Corp | | | | | | | | 3.375% | | | | 6/01/23 | | | | Ba2 | | | | 372,961 | |
| | | |
| | | | Trading Companies & Distributors – 1.0% | | | | | | | |
| | | | | | |
| | 800 | | | Beacon Roofing Supply Inc | | | | | | | | 6.375% | | | | 10/01/23 | | | | B+ | | | | 831,000 | |
45
| | |
| |
| JHAA | | Nuveen High Income 2023 Target Term Fund(continued) |
| | Portfolio of Investments June 30, 2019 |
| | (Unaudited) |
| | | | | | | | | | | | | | | | | | | | | | | | | | | | |
Principal
Amount (000) | | | Description (1) | | | | | | | | Coupon | | | Maturity | | | Ratings (2) | | | Value | |
| | | | | | |
| | | | Wireless Telecommunication Services – 1.9% | | | | | | | | | | | | | | | | |
| | | | | | |
| $ | 900 | | | Comunicaciones Celulares SA Via Comcel Trust, 144A | | | | | | | | 6.875% | | | | 2/06/24 | | | | Ba1 | | | $ | 930,375 | |
| | 525 | | | Sprint Corp | | | | | | | | 7.875% | | | | 9/15/23 | | | | B+ | | | | 570,938 | |
| | 1,425 | | | Total Wireless Telecommunication Services | | | | | | | | | | | | | | | | | | | | 1,501,313 | |
| $ | 63,084 | | | Total Corporate Bonds (cost $61,536,057) | | | | | | | | | | | | | | | | | | | | 64,276,377 | |
| | | | | | | |
Principal
Amount (000) | | | Description (1) | | Coupon (4) | | | Reference
Rate (4) | | | Spread (4) | | | Maturity (5) | | | Ratings (2) | | | Value | |
| | |
| | | | VARIABLE RATE SENIOR LOAN INTERESTS – 48.4% (36.7% of Total Investments) (4) | | | | | |
| |
| | | | Aerospace & Defense – 0.7% | |
| | | | | | | |
| $ | 597 | | | Transdigm, Inc., Term Loan F | | | 4.830% | | | | 3-Month LIBOR | | | | 2.500% | | | | 6/09/23 | | | | Ba3 | | | $ | 586,999 | |
| |
| | | | Air Freight & Logistics – 1.1% | |
| | | | | | | |
| | 995 | | | AI Mistral Holdco Limited, Term Loan B | | | 5.402% | | | | 1-Month LIBOR | | | | 3.000% | | | | 3/09/24 | | | | B | | | | 874,278 | |
| |
| | | | Airlines – 0.7% | |
| | | | | | | |
| | 600 | | | American Airlines, Inc., Term Loan B | | | 4.394% | | | | 1-Month LIBOR | | | | 2.000% | | | | 12/14/23 | | | | BB+ | | | | 591,483 | |
| |
| | | | Beverages – 0.8% | |
| | | | | | | |
| | 620 | | | Arctic Glacier U.S.A., Inc., Term Loan B | | | 5.902% | | | | 1-Month LIBOR | | | | 3.500% | | | | 3/20/24 | | | | B2 | | | | 619,364 | |
| |
| | | | Building Products – 1.4% | |
| | | | | | | |
| | 499 | | | C.H.I. Overhead Doors, Inc., First Lien Term Loan | | | 5.652% | | | | 1-Month LIBOR | | | | 3.250% | | | | 7/29/22 | | | | B | | | | 496,844 | |
| | 650 | | | Quikrete Holdings, Inc., Term Loan B | | | 5.152% | | | | 1-Month LIBOR | | | | 2.750% | | | | 11/15/23 | | | | BB– | | | | 639,619 | |
| | 1,149 | | | Total Building Products | | | | | | | | | | | | | | | | | | | | 1,136,463 | |
| |
| | | | Chemicals – 0.8% | |
| | | | | | | |
| | 647 | | | DuBois Chemicals, Inc., First Lien Term Loan B | | | 5.652% | | | | 1-Month LIBOR | | | | 3.250% | | | | 3/15/24 | | | | B1 | | | | 638,099 | |
| |
| | | | Commercial Services & Supplies – 4.2% | |
| | | | | | | |
| | 647 | | | Creative Artists Agency, LLC , Term Loan B | | | 5.404% | | | | 3-Month LIBOR | | | | 3.000% | | | | 2/15/24 | | | | BB– | | | | 645,666 | |
| | 373 | | | Granite Acquisition Inc., Term Loan B | | | 6.092% | | | | 3-Month LIBOR | | | | 3.500% | | | | 12/19/21 | | | | B+ | | | | 373,846 | |
| | 170 | | | KAR Auction Services, Inc., Term Loan B5 | | | 4.875% | | | | 3-Month LIBOR | | | | 2.500% | | | | 3/09/23 | | | | BB | | | | 170,635 | |
| | 522 | | | Protection One, Inc., Term Loan | | | 5.152% | | | | 1-Month LIBOR | | | | 2.750% | | | | 5/02/22 | | | | BB– | | | | 519,118 | |
| | 647 | | | R.R. Donnelley & Sons Company, Term Loan B | | | 7.402% | | | | 1-Month LIBOR | | | | 5.000% | | | | 1/15/24 | | | | B+ | | | | 642,708 | |
| | 995 | | | Universal Services of America, Initial Term Loan, First Lien | | | 6.152% | | | | 1-Month LIBOR | | | | 3.750% | | | | 7/28/22 | | | | BB | | | | 994,446 | |
| | 3,354 | | | Total Commercial Services & Supplies | | | | | | | | | | | | | | | | | | | | 3,346,419 | |
| |
| | | | Communications Equipment – 1.4% | |
| | | | | | | |
| | 249 | | | Colorado Buyer Inc, Term Loan B | | | 5.420% | | | | 1-Month LIBOR | | | | 3.000% | | | | 5/01/24 | | | | B1 | | | | 232,409 | |
| | 972 | | | Univision Communications, Inc., Term Loan C5 | | | 5.152% | | | | 1-Month LIBOR | | | | 2.750% | | | | 3/15/24 | | | | B | | | | 927,690 | |
| | 1,221 | | | Total Communications Equipment | | | | | | | | | | | | | | | | | | | | | | | 1,160,099 | |
| |
| | | | Containers & Packaging – 4.0% | |
| | | | | | | |
| | 643 | | | Flex Acquisition Company, Inc., First Lien Term Loan | | | 5.440% | | | | 1-Month LIBOR | | | | 3.000% | | | | 12/29/23 | | | | B | | | | 612,585 | |
| | 990 | | | PLZ Aeroscience Corporation, Term Loan | | | 5.940% | | | | 1-Month LIBOR | | | | 3.500% | | | | 7/31/22 | | | | B | | | | 987,159 | |
| | 994 | | | Pregis Holding I Corporation, Term Loan | | | 5.811% | | | | 1-Month LIBOR | | | | 3.500% | | | | 5/14/21 | | | | B | | | | 995,623 | |
| | 648 | | | TricorBraun Holdings, Inc., First Lien Term Loan | | | 6.136% | | | | 3-Month LIBOR | | | | 3.750% | | | | 11/30/23 | | | | B2 | | | | 639,996 | |
| | 3,275 | | | Total Containers & Packaging | | | | | | | | | | | | | | | | | | | | | | | 3,235,363 | |
| |
| | | | Distributors – 1.4% | |
| | | | | | | |
| | 498 | | | American Builders & Contractors Supply Co., Inc., Term Loan B | | | 4.402% | | | | 1-Month LIBOR | | | | 2.000% | | | | 10/31/23 | | | | BB+ | | | | 490,874 | |
| | 648 | | | Spin Holdco Inc., Term Loan B | | | 5.851% | | | | 3-Month LIBOR | | | | 3.250% | | | | 11/14/22 | | | | B | | | | 636,599 | |
| | 1,146 | | | Total Distributors | | | | | | | | | | | | | | | | | | | | | | | 1,127,473 | |
46
| | | | | | | | | | | | | | | | | | | | | | | | | | | | |
| | | | | | | |
Principal
Amount (000) | | | Description (1) | | Coupon (4) | | | Reference
Rate (4) | | | Spread (4) | | | Maturity (5) | | | Ratings (2) | | | Value | |
| |
| | | | Diversified Consumer Services – 1.2% | |
| | | | | | | |
| $ | 1,000 | | | Cortes NP Acquisition Corporation, Term Loan B | | | 6.330% | | | | 3-Month LIBOR | | | | 4.000% | | | | 11/30/23 | | | | B | | | $ | 952,500 | |
| |
| | | | Diversified Financial Services – 0.8% | |
| | | | | | | |
| | 647 | | | NFP Corp., Term Loan B | | | 5.402% | | | | 1-Month LIBOR | | | | 3.000% | | | | 1/08/24 | | | | B | | | | 629,909 | |
| |
| | | | Diversified Telecommunication Services – 0.4% | |
| | | | | | | |
| | 300 | | | Level 3 Financing, Inc., Tranche B, Term Loan | | | 4.652% | | | | 1-Month LIBOR | | | | 2.250% | | | | 2/22/24 | | | | BBB– | | | | 298,012 | |
| |
| | | | Electric Utilities – 1.9% | |
| | | | | | | |
| | 298 | | | Calpine Corporation, Term Loan B5 | | | 4.830% | | | | 3-Month LIBOR | | | | 2.500% | | | | 1/15/24 | | | | BB+ | | | | 297,313 | |
| | 1,245 | | | Talen Energy Supply, LLC, Term Loan B2 | | | 6.402% | | | | 1-Month LIBOR | | | | 4.000% | | | | 4/15/24 | | | | BB | | | | 1,246,230 | |
| | 1,543 | | | Total Electric Utilities | | | | | | | | | | | | | | | | | | | | | | | 1,543,543 | |
| |
| | | | Entertainment – 0.6% | |
| | | | | | | |
| | 499 | | | Sesac Holdco II, LLC, First Lien Term Loan | | | 5.402% | | | | 1-Month LIBOR | | | | 3.000% | | | | 2/23/24 | | | | B+ | | | | 489,685 | |
| |
| | | | Food & Staples Retailing – 0.8% | |
| | | | | | | |
| | 647 | | | Albertson’s LLC, Term Loan B5 | | | 5.311% | | | | 3-Month LIBOR | | | | 3.000% | | | | 12/21/22 | | | | BB | | | | 647,509 | |
| |
| | | | Food Products – 0.9% | |
| | | | | | | |
| | 696 | | | Hostess Brands, LLC, Term Loan | | | 4.595% | | | | 2-Month LIBOR | | | | 2.250% | | | | 8/03/22 | | | | BB– | | | | 693,129 | |
| |
| | | | Health Care Equipment & Supplies – 1.2% | |
| | | | | | | |
| | 1,000 | | | Onex TSG Intermediate Corp., First Lien Term Loan | | | 6.402% | | | | 1-Month LIBOR | | | | 4.000% | | | | 7/31/22 | | | | B1 | | | | 998,750 | |
| |
| | | | Health Care Providers & Services – 1.9% | |
| | | | | | | |
| | 647 | | | Pharmaceutical Product Development, Inc., Term Loan B | | | 4.902% | | | | 1-Month LIBOR | | | | 2.500% | | | | 8/18/22 | | | | Ba3 | | | | 643,842 | |
| | 995 | | | Team Health, Initial Term Loan | | | 5.152% | | | | 1-Month LIBOR | | | | 2.750% | | | | 2/06/24 | | | | B+ | | | | 883,605 | |
| | 1,642 | | | Total Health Care Providers & Services | | | | | | | | | | | | | | | | | | | | | | | 1,527,447 | |
| |
| | | | Health Care Technology – 1.4% | |
| | | | | | | |
| | 597 | | | Emdeon, Inc., Term Loan | | | 5.152% | | | | 1-Month LIBOR | | | | 2.750% | | | | 3/01/24 | | | | B+ | | | | 593,305 | |
| | 497 | | | Press Ganey Holdings, Inc., First Lien Term Loan | | | 5.152% | | | | 1-Month LIBOR | | | | 2.750% | | | | 10/23/23 | | | | B | | | | 497,481 | |
| | 1,094 | | | Total Health Care Technology | | | | | | | | | | | | | | | | | | | | | | | 1,090,786 | |
| |
| | | | Hotels, Restaurants & Leisure – 1.5% | |
| | | | | | | |
| | 715 | | | Boyd Gaming Corporation, Term Loan B3 | | | 4.622% | | | | 1-Week LIBOR | | | | 2.250% | | | | 9/15/23 | | | | BB | | | | 712,389 | |
| | 498 | | | Travel Leaders Group, LLC, Term Loan B | | | 6.383% | | | | 1-Month LIBOR | | | | 4.000% | | | | 1/25/24 | | | | N/R | | | | 499,144 | |
| | 1,213 | | | Total Hotels, Restaurants & Leisure | | | | | | | | | | | | | | | | | | | | | | | 1,211,533 | |
| |
| | | | Household Durables – 0.8% | |
| | | | | | | |
| | 647 | | | Wilsonart LLC, Term Loan B | | | 5.580% | | | | 3-Month LIBOR | | | | 3.250% | | | | 12/19/23 | | | | B+ | | | | 633,120 | |
| | | | | | | |
| | | | Insurance – 2.2% | | | | | | | | | | | | | | | | | | |
| | | | | | | |
| | 648 | | | Acrisure LLC, Term Loan B | | | 6.772% | | | | 3-Month LIBOR | | | | 4.250% | | | | 11/22/23 | | | | B | | | | 646,601 | |
| | 497 | | | Broadstreet Partners, Inc., Term Loan B | | | 5.652% | | | | 3-Month LIBOR | | | | 3.250% | | | | 11/08/23 | | | | B | | | | 496,904 | |
| | 647 | | | USI, Inc., Term Loan | | | 5.330% | | | | 3-Month LIBOR | | | | 3.000% | | | | 5/16/24 | | | | B | | | | 631,637 | |
| | 1,792 | | | Total Insurance | | | | | | | | | | | | | | | | | | | | | | | 1,775,142 | |
| |
| | | | Internet & Direct Marketing Retail – 1.2% | |
| | | | | | | |
| | 995 | | | CNT Holdings III Corp, Term Loan | | | 5.450% | | | | 6-Month LIBOR | | | | 3.250% | | | | 1/22/23 | | | | B1 | | | | 986,501 | |
| | | | | | | |
| | | | Internet Software & Services – 0.4% | | | | | | | | | | | | | | | | | | |
| | | | | | | |
| | 285 | | | Camelot UK Holdco Limited, Term Loan | | | 5.652% | | | | 1-Month LIBOR | | | | 3.250% | | | | 10/03/23 | | | | BB– | | | | 286,244 | |
| |
| | | | IT Services – 2.7% | |
| | | | | | | |
| | 995 | | | DTI Holdings, Inc., Replacement Term Loan B1 | | | 7.333% | | | | 3-Month LIBOR | | | | 4.750% | | | | 9/30/23 | | | | B– | | | | 921,711 | |
| | 646 | | | ProQuest LLC, New Term Loan B | | | 5.652% | | | | 1-Month LIBOR | | | | 3.250% | | | | 10/24/21 | | | | B | | | | 646,349 | |
47
| | |
| |
| JHAA | | Nuveen High Income 2023 Target Term Fund(continued) |
| | Portfolio of Investments June 30, 2019 |
| | (Unaudited) |
| | | | | | | | | | | | | | | | | | | | | | | | | | | | |
| | | | | | | |
Principal
Amount (000) | | | Description (1) | | Coupon (4) | | | Reference
Rate (4) | | | Spread (4) | | | Maturity (5) | | | Ratings (2) | | | Value | |
| |
| | | | IT Services(continued) | |
| | | | | | | |
| $ | 647 | | | Tempo Acquisition LLC, Term Loan B | | | 5.402% | | | | 1-Month LIBOR | | | | 3.000% | | | | 5/01/24 | | | | B1 | | | $ | 645,084 | |
| | 2,288 | | | Total IT Services | | | | | | | | | | | | | | | | | | | | | | | 2,213,144 | |
| |
| | | | Machinery – 1.5% | |
| | | | | | | |
| | 597 | | | Gates Global LLC, Term Loan B | | | 5.152% | | | | 1-Month LIBOR | | | | 2.750% | | | | 4/01/24 | | | | B+ | | | | 594,350 | |
| | 596 | | | Milacron LLC, Term Loan B | | | 4.902% | | | | 1-Month LIBOR | | | | 2.500% | | | | 9/28/23 | | | | B+ | | | | 581,508 | |
| | 1,193 | | | Total Machinery | | | | | | | | | | | | | | | | | | | | | | | 1,175,858 | |
| |
| | | | Media – 2.8% | |
| | | | | | | |
| | 987 | | | Array Canada Inc., Term Loan B | | | 7.330% | | | | 3-Month LIBOR | | | | 5.000% | | | | 2/10/23 | | | | B | | | | 944,372 | |
| | 249 | | | CDS U.S. Intermediate Holdings, Inc., First Lien Term Loan | | | 6.080% | | | | 3-Month LIBOR | | | | 3.750% | | | | 7/08/22 | | | | B+ | | | | 241,181 | |
| | 500 | | | Gray Television, Inc., Term Loan B2 | | | 4.681% | | | | 1-Month LIBOR | | | | 2.250% | | | | 2/07/24 | | | | BB+ | | | | 498,625 | |
| | 96 | | | Nexstar Broadcasting, Inc., Term Loan B3 | | | 4.690% | | | | 1-Month LIBOR | | | | 2.250% | | | | 1/17/24 | | | | BB | | | | 94,945 | |
| | 478 | | | Nexstar Broadcasting, Inc., Term Loan B3 | | | 4.652% | | | | 1-Month LIBOR | | | | 2.250% | | | | 1/17/24 | | | | BB | | | | 475,418 | |
| | 2,310 | | | Total Media | | | | | | | | | | | | | | | | | | | | | | | 2,254,541 | |
| |
| | | | Oil, Gas & Consumable Fuels – 1.1% | |
| | | | | | | |
| | 525 | | | California Resources Corporation, Term Loan B | | | 7.152% | | | | 1-Month LIBOR | | | | 4.750% | | | | 12/31/22 | | | | B | | | | 503,344 | |
| | 524 | | | Ultra Resources, Inc., First Lien Term Loan, (cash 6.154%, PIK 0.250%) | | | 6.154% | | | | 1-Month LIBOR | | | | 3.750% | | | | 4/12/24 | | | | B+ | | | | 405,248 | |
| | 1,049 | | | Total Oil, Gas & Consumable Fuels | | | | | | | | | | | | | | | | | | | | | | | 908,592 | |
| |
| | | | Professional Services – 2.0% | |
| | | | | | | |
| | 647 | | | AlixPartners, LLP, Term Loan B | | | 5.152% | | | | 1-Month LIBOR | | | | 2.750% | | | | 4/04/24 | | | | B+ | | | | 646,065 | |
| | 482 | | | ON Assignment, Inc., Term Loan B1 | | | 4.402% | | | | 1-Month LIBOR | | | | 2.000% | | | | 6/03/22 | | | | BB | | | | 481,636 | |
| | 493 | | | CHG Healthcare Services Inc., First Lien Term Loan B | | | 5.402% | | | | 1-Month LIBOR | | | | 3.000% | | | | 6/07/23 | | | | B | | | | 491,247 | |
| | 1,622 | | | Total Professional Services | | | | | | | | | | | | | | | | | | | | | | | 1,618,948 | |
| |
| | | | Road & Rail – 0.4% | |
| | | | | | | |
| | 297 | | | Hertz Corporation/The, Term Loan B | | | 5.160% | | | | 1-Month LIBOR | | | | 2.750% | | | | 6/30/23 | | | | BB | | | | 296,257 | |
| |
| | | | Semiconductors & Semiconductor Equipment – 0.9% | |
| | | | | | | |
| | 249 | | | Micron Technology, Inc., Term Loan B | | | 4.152% | | | | 1-Month LIBOR | | | | 1.750% | | | | 4/26/22 | | | | Baa2 | | | | 249,437 | |
| | 519 | | | Xperi Corporation, Term Loan B1 | | | 4.902% | | | | 1-Month LIBOR | | | | 2.500% | | | | 12/01/23 | | | | BB– | | | | 512,589 | |
| | 768 | | | Total Semiconductors & Semiconductor Equipment | | | | | | | | | | | | | | | | | | | | 762,026 | |
| |
| | | | Software – 2.9% | |
| | | | | | | |
| | 600 | | | Infor (US), Inc., Term Loan B6 | | | 5.080% | | | | 3-Month LIBOR | | | | 2.750% | | | | 2/01/22 | | | | Ba3 | | | | 598,888 | |
| | 771 | | | nThrive, Inc., First Lien Term Loan | | | 6.902% | | | | 1-Month LIBOR | | | | 4.500% | | | | 10/20/22 | | | | B2 | | | | 731,511 | |
| | 497 | | | RP Crown Parent LLC, Term Loan B | | | 5.152% | | | | 1-Month LIBOR | | | | 2.750% | | | | 10/12/23 | | | | B1 | | | | 495,894 | |
| | 497 | | | TIBCO Software, Inc., Term Loan, First Lien | | | 5.910% | | | | 1-Month LIBOR | | | | 3.500% | | | | 12/04/20 | | | | BB– | | | | 499,083 | |
| | 2,365 | | | Total Software | | | | | | | | | | | | | | | | | | | | | | | 2,325,376 | |
| |
| | | | Wireless Telecommunication Services – 0.4% | |
| | | | | | | |
| | 323 | | | Sprint Corporation, Term Loan, First Lien | | | 4.938% | | | | 1-Month LIBOR | | | | 2.500% | | | | 2/02/24 | | | | BB+ | | | | 319,034 | |
| $ | 39,819 | | | Total Variable Rate Senior Loan Interests (cost $38,924,139) | | | | | | | | | | | | 38,953,626 | |
| | | | | | | |
Principal
Amount (000) | | | Description (1) | | | | | | | | Coupon | | | Maturity | | | Ratings (2) | | | Value | |
| |
| | | | CONVERTIBLE BONDS – 1.5% (1.1% of Total Investments) | |
| |
| | | | Media – 1.5% | |
| | | | | | | |
| $ | 1,275 | | | DISH Network Corp | | | | | | | | | | | 2.375% | | | | 3/15/24 | | | | Ba3 | | | $ | 1,177,801 | |
| $ | 1,275 | | | Total Convertible Bonds (cost $1,066,046) | | | | | | | | | | | | | | | | | | | | 1,177,801 | |
| | | | Total Long-Term Investments (cost $101,526,242) | | | | | | | | | | | | | | | | | | | | 104,407,804 | |
48
| | | | | | | | | | | | | | | | | | | | | | | | |
| | | | | | | |
Principal
Amount (000) | | | Description (1) | | | | | | Coupon | | | Maturity | | | | | | Value | |
| |
| | | | SHORT-TERM INVESTMENTS – 2.3% (1.7% of Total Investments) | |
| |
| | | | REPURCHASE AGREEMENTS – 2.3% (1.7% of Total Investments) | |
| | | | | |
| $ | 1,845 | | | Repurchase Agreement with Fixed Income Clearing Corporation,
dated 6/28/19, repurchase price $1,845,234,
collateralized by $1,900,000 U.S. Treasury Notes,
1.625%, due 2/15/26, value $1,882,231 | | | 1.200% | | | | 7/01/19 | | | | | | | $ | 1,845,049 | |
| | | | Total Short-Term Investments (cost $1,845,049) | | | | | | | | | | | | | | | 1,845,049 | |
| | | | Total Investments (cost $103,371,291) – 132.0% | | | | | | | | | | | | | | | 106,252,853 | |
| | | | Borrowings – (31.7)% (6), (7) | | | | | | | | | | | | | | | (25,500,000 | ) |
| | | | Reverse Repurchase Agreements – (2.5)% (8) | | | | | | | | | | | | | | | (2,000,000 | ) |
| | | | Other Assets Less Liabilities – 2.2% | | | | | | | | | | | | | | | 1,742,817 | |
| | | | Net Assets Applicable to Common Shares – 100% | | | | | | | | | | | | | | $ | 80,495,670 | |
For Fund portfolio compliance purposes, the Fund’s industry classifications refer to any one or more of the industrysub-classifications used by one or more widely recognized market indexes or ratings group indexes, and/or as defined by Fund management. This definition may not apply for purposes of this report, which may combine industrysub-classifications into sectors for reporting ease.
| (1) | All percentages shown in the Portfolio of Investments are based on net assets applicable to common shares unless otherwise noted. |
| (2) | For financial reporting purposes, the ratings disclosed are the highest of Standard & Poor’s Group (“Standard & Poor’s”), Moody’s Investors Service, Inc. (“Moody’s”) or Fitch, Inc. (“Fitch”) rating. This treatment of split-rated securities may differ from that used for other purposes, such as for Fund investment policies. Ratings below BBB by Standard & Poor’s, Baa by Moody’s or BBB by Fitch are considered to be below investment grade. Holdings designated N/R are not rated by any of these national rating agencies. |
| (3) | Investment, or portion of investment, has been pledged to collateralize the net payment obligations for investments in reverse repurchase agreements. As of the end of the reporting period, investments with a value of $2,239,025 have been pledged as collateral for reverse repurchase agreements. |
| (4) | Senior loans generally pay interest at rates which are periodically adjusted by reference to a base short-term, floating lending rate (Reference Rate) plus an assigned fixed rate (Spread). These floating lending rates are generally (i) the lending rate referenced by the London Inter-Bank Offered Rate (“LIBOR”), or (ii) the prime rate offered by one or more major United States banks. Senior loans may be considered restricted in that the Fund ordinarily is contractually obligated to receive approval from the agent bank and/or borrower prior to the disposition of a senior loan. The rate shown is the coupon as of the end of the reporting period. |
| (5) | Senior loans generally are subject to mandatory and/or optional prepayment. Because of these mandatory prepayment conditions and because there may be significant economic incentives for a borrower to prepay, prepayments of senior loans may occur. As a result, the actual remaining maturity of senior loans held may be substantially less than the stated maturities shown. |
| (6) | Borrowings as a percentage of Total Investments is 24.0%. |
| (7) | The Fund may pledge up to 100% of its eligible investments (excluding any investments separately pledged as collateral for specific investments in derivatives, when applicable) in the Portfolio of Investments as collateral for borrowings. |
| (8) | Reverse Repurchase Agreements as a percentage of Total Investments is 1.9%. |
| 144A | Investment is exempt from registration under Rule 144A of the Securities Act of 1933, as amended. These investments may only be resold in transactions exempt from registration, which are normally those transactions with qualified institutional buyers. |
| LIBOR | London Inter-Bank Offered Rate |
| PIK | Payment-in-kind (“PIK”) security. Depending on the terms of the security, income may be received in the form of cash, securities, or a combination of both. The PIK rate shown, where applicable, represents the annualized rate of the last PIK payment made by the issuer as of the end of the reporting period. |
See accompanying notes to financial statements.
49
Statement of Assets and Liabilities
June 30, 2019
(Unaudited)
| | | | | | | | | | | | | | | | |
| | | JHY | | | JHD | | | JHB | | | JHAA | |
Assets | | | | | | | | | | | | | | | | |
Long-term investments, at value (cost $196,524,082, $191,749,860, $718,080,522 and $101,526,242, respectively) | | $ | 196,806,560 | | | $ | 192,179,850 | | | $ | 720,974,465 | | | $ | 104,407,804 | |
Short-term investments, at value (cost approximates value) | | | 15,812,316 | | | | 76,146,487 | | | | — | | | | 1,845,049 | |
Cash | | | 1,155,508 | | | | — | | | | 34,790,266 | | | | — | |
Receivable for: | | | | | | | | | | | | | | | | |
Interest | | | 2,977,163 | | | | 2,444,378 | | | | 10,830,314 | | | | 1,208,806 | |
Investments sold | | | 1,840,476 | | | | 857,143 | | | | 10,438,228 | | | | 1,540,288 | |
Reclaims | | | — | | | | — | | | | 3,945 | | | | — | |
Other assets | | | 4,728 | | | | 12,448 | | | | 25,507 | | | | 6,933 | |
Total assets | | | 218,596,751 | | | | 271,640,306 | | | | 777,062,725 | | | | 109,008,880 | |
Liabilities | | | | | | | | | | | | | | | | |
Cash overdraft | | | — | | | | — | | | | — | | | | 3,641 | |
Borrowings | | | 61,500,000 | | | | — | | | | 207,000,000 | | | | 25,500,000 | |
Reverse repurchase agreements | | | — | | | | — | | | | — | | | | 2,000,000 | |
Payable for: | | | | | | | | | | | | | | | | |
Dividends | | | 534,144 | | | | 854,999 | | | | 2,249,767 | | | | 394,741 | |
Investments purchased | | | 1,155,508 | | | | — | | | | 8,384,167 | | | | 471,443 | |
Accrued expenses: | | | | | | | | | | | | | | | | |
Interest | | | 110,185 | | | | — | | | | 465,290 | | | | 46,440 | |
Management fees | | | 116,738 | | | | 146,163 | | | | 409,220 | | | | 58,080 | |
Trustees fees | | | 1,269 | | | | 9,171 | | | | 20,960 | | | | 4,626 | |
Other | | | 62,669 | | | | 63,934 | | | | 117,257 | | | | 34,239 | |
Total liabilities | | | 63,480,513 | | | | 1,074,267 | | | | 218,646,661 | | | | 28,513,210 | |
Net assets applicable to common shares | | $ | 155,116,238 | | | $ | 270,566,039 | | | $ | 558,416,064 | | | $ | 80,495,670 | |
Common shares outstanding | | | 15,789,562 | | | | 27,064,130 | | | | 55,871,646 | | | | 7,813,162 | |
Net asset value (“NAV”) per common share outstanding | | $ | 9.82 | | | $ | 10.00 | | | $ | 9.99 | | | $ | 10.30 | |
Net assets applicable to common shares consist of: | | | | | | | | | | | | | | | | |
Common shares, $0.01 par value per share | | $ | 157,896 | | | $ | 270,641 | | | $ | 558,716 | | | $ | 78,132 | |
Paid-in surplus | | | 155,068,743 | | | | 265,687,868 | | | | 548,615,269 | | | | 76,894,415 | |
Total distributable earnings | | | (110,401 | ) | | | 4,607,530 | | | | 9,242,079 | | | | 3,523,123 | |
Net assets applicable to common shares | | $ | 155,116,238 | | | $ | 270,566,039 | | | $ | 558,416,064 | | | $ | 80,495,670 | |
Authorized shares | | | Unlimited | | | | Unlimited | | | | Unlimited | | | | Unlimited | |
See accompanying notes to financial statements.
50
Statement of Operations
Six Months Ended June 30, 2019
(Unaudited)
| | | | | | | | | | | | | | | | |
| | | JHY | | | JHD | | | JHB | | | JHAA | |
Investment Income | | $ | 5,227,862 | | | $ | 5,698,200 | | | $ | 20,590,140 | | | $ | 3,152,247 | |
Expenses | | | | | | | | | | | | | | | | |
Management fees | | | 703,085 | | | | 882,682 | | | | 2,457,914 | | | | 336,444 | |
Interest expense | | | 972,715 | | | | — | | | | 2,989,861 | | | | 381,942 | |
Custodian fees | | | 31,199 | | | | 28,223 | | | | 62,261 | | | | 17,347 | |
Trustees fees | | | 3,247 | | | | 4,088 | | | | 11,393 | | | | 9,684 | |
Professional fees | | | 19,445 | | | | 19,910 | | | | 96,278 | | | | 34,969 | |
Shareholder reporting expenses | | | 15,374 | | | | 19,548 | | | | 36,814 | | | | 4,102 | |
Shareholder servicing agent fees | | | 73 | | | | 64 | | | | 60 | | | | 52 | |
Stock exchange listing fees | | | 3,659 | | | | 3,776 | | | | 7,795 | | | | — | |
Investor relations expenses | | | 3,624 | | | | 1,197 | | | | 10,660 | | | | 3,976 | |
Other | | | 7,477 | | | | 7,917 | | | | 12,806 | | | | 4,872 | |
Total expenses | | | 1,759,898 | | | | 967,405 | | | | 5,685,842 | | | | 793,388 | |
Net investment income (loss) | | | 3,467,964 | | | | 4,730,795 | | | | 14,904,298 | | | | 2,358,859 | |
Realized and Unrealized Gain (Loss) | | | | | | | | | | | | | | | | |
Net realized gain (loss) from investments and foreign currency | | | (460,417 | ) | | | 506,413 | | | | (455,460 | ) | | | 314,018 | |
Change in net unrealized appreciation (depreciation) of investments and foreign currency | | | 5,921,642 | | | | 2,943,803 | | | | 27,746,305 | | | | 2,881,562 | |
Net realized and unrealized gain (loss) | | | 5,461,225 | | | | 3,450,216 | | | | 27,290,845 | | | | 3,195,580 | |
Net increase (decrease) in net assets applicable to common shares from operations | | $ | 8,929,189 | | | $ | 8,181,011 | | | $ | 42,195,143 | | | $ | 5,554,439 | |
See accompanying notes to financial statements.
51
Statement of Changes in Net Assets
(Unaudited)
| | | | | | | | | | | | | | | | | | | | | | | | | | | | | | | | |
| | | JHY | | | JHD | | | JHB | | | JHAA | |
| | | Six Months
Ended
6/30/19 | | | Year
Ended
12/31/18 | | | Six Months
Ended
6/30/19 | | | Year
Ended
12/31/18 | | | Six Months
Ended
6/30/19 | | | Year
Ended
12/31/18 | | | Six Months
Ended
6/30/19 | | | For the period
December 18, 2018
(commencement
of operations)
through
December 31, 2018 | |
Operations | | | | | | | | | | | | | | | | | | | | | | | | | | | | | | | | |
Net investment income (loss) | | $ | 3,467,964 | | | $ | 7,901,868 | | | $ | 4,730,795 | | | $ | 11,545,089 | | | $ | 14,904,298 | | | $ | 32,982,574 | | | $ | 2,358,859 | | | $ | (42,844 | ) |
Net realized gain (loss) from investments and foreign currency | | | (460,417 | ) | | | (237,540 | ) | | | 506,413 | | | | 1,218,890 | | | | (455,460 | ) | | | 1,103,617 | | | | 314,018 | | | | — | |
Change in net unrealized appreciation (depreciation) of investments and foreign currency | | | 5,921,642 | | | | (6,325,661 | ) | | | 2,943,803 | | | | (7,696,716 | ) | | | 27,746,305 | | | | (36,099,694 | ) | | | 2,881,562 | | | | — | |
Net increase (decrease) in net assets applicable to common shares from operations | | | 8,929,189 | | | | 1,338,667 | | | | 8,181,011 | | | | 5,067,263 | | | | 42,195,143 | | | | (2,013,503 | ) | | | 5,554,439 | | | | (42,844 | ) |
Distributions to Common Shareholders | | | | | | | | | | | | | | | | | | | | | | | | | | | | | | | | |
Dividends | | | (3,441,041 | ) | | | (7,972,415 | ) | | | (5,277,505 | ) | | | (13,028,672 | ) | | | (14,470,756 | ) | | | (32,679,326 | ) | | | (2,031,316 | ) | | | — | |
Decrease in net assets applicable to common shares from distributions to common shareholders | | | (3,441,041 | ) | | | (7,972,415 | ) | | | (5,277,505 | ) | | | (13,028,672 | ) | | | (14,470,756 | ) | | | (32,679,326 | ) | | | (2,031,316 | ) | | | — | |
Capital Share Transactions | | | | | | | | | | | | | | | | | | | | | | | | | | | | | | | | |
Proceeds from sale of common shares, net of offering costs | | | — | | | | — | | | | — | | | | — | | | | — | | | | — | | | | 7,917,202 | | | | 68,985,000 | |
Proceeds from shelf offering, net of offering costs | | | — | | | | 1,270,140 | | | | — | | | | — | | | | — | | | | — | | | | — | | | | — | |
Net proceeds from common shares issued to shareholders due to reinvestment of distributions | | | 118,814 | | | | 277,604 | | | | — | | | | — | | | | — | | | | — | | | | 13,175 | | | | — | |
Net increase (decrease) in net assets applicable to common shares from capital share transactions | | | 118,814 | | | | 1,547,744 | | | | — | | | | — | | | | — | | | | — | | | | 7,930,377 | | | | 68,985,000 | |
Net increase (decrease) in net assets applicable to common shares | | | 5,606,962 | | | | (5,086,004 | ) | | | 2,903,506 | | | | (7,961,409 | ) | | | 27,724,387 | | | | (34,692,829 | ) | | | 11,453,500 | | | | 68,942,156 | |
Net assets applicable to common shares at the beginning of period | | | 149,509,276 | | | | 154,595,280 | | | | 267,662,533 | | | | 275,623,942 | | | | 530,691,677 | | | | 565,384,506 | | | | 69,042,170 | | | | 100,014 | |
Net assets applicable to common shares at the end of period | | $ | 155,116,238 | | | $ | 149,509,276 | | | $ | 270,566,039 | | | $ | 267,662,533 | | | $ | 558,416,064 | | | $ | 530,691,677 | | | $ | 80,495,670 | | | $ | 69,042,170 | |
See accompanying notes to financial statements.
52
Statement of Cash Flows
Six Months Ended June 30, 2019
(Unaudited)
| | | | | | | | | | | | |
| | | JHY | | | JHB | | | JHAA | |
Cash Flows from Operating Activities: | | | | | | | | | | | | |
Net Increase (Decrease) In Net Assets Applicable to Common Shares from Operations | | $ | 8,929,189 | | | $ | 42,195,143 | | | $ | 5,554,439 | |
Adjustments to reconcile the net increase (decrease) in net assets applicable to common shares from operations to net cash provided by (used in) operating activities: | | | | | | | | | | | | |
Purchases of investments | | | (43,060,289 | ) | | | (136,176,502 | ) | | | (111,321,668 | ) |
Proceeds from sales and maturities of investments | | | 56,516,652 | | | | 149,219,392 | | | | 10,410,649 | |
Proceeds from (Purchases of) short-term investments, net | | | (13,260,626 | ) | | | — | | | | (1,845,049 | ) |
Taxes paid | | | (22,566 | ) | | | (235,825 | ) | | | — | |
Amortization (Accretion) of premiums and discounts, net | | | 688,733 | | | | 1,619,660 | | | | (250,462 | ) |
(Increase) Decrease in: | | | | | | | | | | | | |
Receivable for interest | | | 234,392 | | | | 801,598 | | | | (1,208,806 | ) |
Receivable for investments sold | | | (1,840,476 | ) | | | (10,438,228 | ) | | | (1,540,288 | ) |
Other assets | | | 286 | | | | (6,824 | ) | | | (6,933 | ) |
Increase (Decrease) in: | | | | | | | | | | | | |
Payable for investments purchased | | | 1,155,508 | | | | 7,504,123 | | | | 471,443 | |
Accrued interest | | | 79,139 | | | | 32,785 | | | | 46,440 | |
Accrued management fees | | | (2,202 | ) | | | 3,434 | | | | 44,311 | |
Accrued Trustees fees | | | (81 | ) | | | 719 | | | | 4,540 | |
Accrued professional fees | | | (16,174 | ) | | | (15,999 | ) | | | (5,688 | ) |
Accrued shareholder reporting expenses | | | (6,867 | ) | | | (13,558 | ) | | | (1,893 | ) |
Accrued other expenses | | | 13,584 | | | | 20,052 | | | | 12,831 | |
Net realized (gain) loss from: | | | | | | | | | | | | |
Investments and foreign currency | | | 460,417 | | | | 455,460 | | | | (314,018 | ) |
Paydowns | | | (3,386 | ) | | | (53,173 | ) | | | (50,743 | ) |
Change in net unrealized (appreciation) depreciation of investments and foreign currency | | | (5,921,642 | ) | | | (27,746,305 | ) | | | (2,881,562 | ) |
Net cash provided by (used in) operating activities | | | 3,943,591 | | | | 27,165,952 | | | | (102,882,457 | ) |
Cash Flows from Financing Activities: | | | | | | | | | | | | |
Increase (Decrease) in cash overdraft | | | — | | | | — | | | | 3,641 | |
Proceeds from reverse repurchase agreements | | | — | | | | — | | | | 2,000,000 | |
Proceeds from borrowings | | | — | | | | 17,000,000 | | | | 26,500,000 | |
Repayments of borrowings | | | — | | | | — | | | | (1,000,000 | ) |
Cash distribution paid to common shareholders | | | (2,788,083 | ) | | | (12,220,989 | ) | | | (1,623,400 | ) |
Proceeds from sale of shares, net of offering costs | | | — | | | | — | | | | 7,917,202 | |
Net cash provided by (used in) financing activities | | | (2,788,083 | ) | | | 4,779,011 | | | | 33,797,443 | |
Net Increase (Decrease) in Cash | | | 1,155,508 | | | | 31,944,963 | | | | (69,085,014 | ) |
Cash at the beginning of period | | | — | | | | 2,845,303 | | | | 69,085,014 | |
Cash at the end of period | | $ | 1,155,508 | | | $ | 34,790,266 | | | $ | — | |
| | | |
| Supplemental Disclosure of Cash Flow Information | | JHY | | | JHB | | | JHAA | |
Cash paid for interest (excluding costs) | | $ | 893,576 | | | $ | 2,957,076 | | | $ | 335,502 | |
Non-cash financing activities not included herein consists of reinvestments of common
share distributions | | | 118,814 | | | | — | | | | 13,175 | |
See accompanying notes to financial statements.
53
Financial Highlights
(Unaudited)
Selected data for a common share outstanding throughout each period:
| | | | | | | | | | | | | | | | | | | | | | | | | | | | | | | | | | | | | | | | | | | | | | | | |
| | | | | | | | | | | | | | | | | | | | | | |
| | | | | | Investment Operations | | | Less Distributions to
Common Shareholders | | | Common Share | |
| | | Beginning
Common
Share
NAV | | | Net
Investment
Income
(Loss)(a) | | | Net
Realized/
Unrealized
Gain (Loss) | | | Total | | | From
Net
Investment
Income | | | From
Accumulated
Net
Realized
Gains | | | Return
of
Capital | | | Total | | | Offering
Costs | | | Premium from
Shares
Sold
through Shelf Offering | | | Ending
NAV | | | Ending
Share
Price | |
| |
JHY | | | | | |
Year Ended 12/31: | | | | | | | | | | | | | | | | | | | | | | | | | | | | | | | | | | | | | | | | | |
2019(i) | | $ | 9.48 | | | $ | 0.22 | | | $ | 0.34 | | | $ | 0.56 | | | $ | (0.22 | ) | | $ | — | | | $ | — | | | $ | (0.22 | ) | | $ | — | | | $ | — | | | $ | 9.82 | | | $ | 9.86 | |
2018 | | | 9.89 | | | | 0.50 | | | | (0.41 | ) | | | 0.09 | | | | (0.51 | ) | | | — | | | | — | | | | (0.51 | ) | | | 0.01 | | | | — | * | | | 9.48 | | | | 9.92 | |
2017 | | | 9.75 | | | | 0.62 | | | | 0.13 | | | | 0.75 | | | | (0.62 | ) | | | — | | | | — | | | | (0.62 | ) | | | (0.02 | ) | | | 0.03 | | | | 9.89 | | | | 9.91 | |
2016 | | | 8.73 | | | | 0.73 | | | | 0.97 | | | | 1.70 | | | | (0.68 | ) | | | — | | | | — | | | | (0.68 | ) | | | — | | | | — | | | | 9.75 | | | | 10.21 | |
2015(b) | | | 9.85 | | | | 0.28 | | | | (1.09 | ) | | | (0.81 | ) | | | (0.28 | ) | | | — | | | | (0.01 | ) | | | (0.29 | ) | | | (0.02 | ) | | | — | | | | 8.73 | | | | 9.95 | |
| |
JHD | | | | | |
Year Ended 12/31: | | | | | | | | | | | | | | | | | | | | | | | | | | | | | | | | | | | | | | | | | |
2019(i) | | | 9.89 | | | | 0.17 | | | | 0.14 | | | | 0.31 | | | | (0.20 | ) | | | — | | | | — | | | | (0.20 | ) | | | — | | | | — | | | | 10.00 | | | | 9.87 | |
2018 | | | 10.18 | | | | 0.43 | | | | (0.24 | ) | | | 0.19 | | | | (0.44 | ) | | | (0.04 | ) | | | — | | | | (0.48 | ) | | | — | | | | — | | | | 9.89 | | | | 9.86 | |
2017 | | | 10.15 | | | | 0.57 | | | | 0.07 | | | | 0.64 | | | | (0.55 | ) | | | (0.06 | ) | | | — | | | | (0.61 | ) | | | — | | | | — | | | | 10.18 | | | | 10.02 | |
2016(c) | | | 9.86 | | | | 0.38 | | | | 0.23 | | | | 0.61 | | | | (0.27 | ) | | | (0.03 | ) | | | — | | | | (0.30 | ) | | | (0.02 | ) | | | — | | | | 10.15 | | | | 10.10 | |
| |
JHB | | | | | |
Year Ended 12/31: | | | | | | | | | | | | | | | | | | | | | | | | | | | | | | | | | | | | | | | | | |
2019(i) | | | 9.50 | | | | 0.27 | | | | 0.48 | | | | 0.75 | | | | (0.26 | ) | | | — | | | | — | | | | (0.26 | ) | | | — | | | | — | | | | 9.99 | | | | 9.91 | |
2018 | | | 10.12 | | | | 0.59 | | | | (0.62 | ) | | | (0.03 | ) | | | (0.57 | ) | | | (0.02 | ) | | | — | | | | (0.59 | ) | | | — | | | | — | | | | 9.50 | | | | 8.90 | |
2017 | | | 9.92 | | | | 0.64 | | | | 0.16 | | | | 0.80 | | | | (0.58 | ) | | | (0.02 | ) | | | — | | | | (0.60 | ) | | | — | | | | — | | | | 10.12 | | | | 9.96 | |
2016(d) | | | 9.85 | | | | 0.17 | | | | 0.06 | | | | 0.23 | | | | (0.14 | ) | | | (0.01 | ) | | | — | | | | (0.15 | ) | | | (0.01 | ) | | | — | | | | 9.92 | | | | 9.88 | |
| |
JHAA | | | | | |
Year Ended 12/31: | | | | | | | | | | | | | | | | | | | | | | | | | | | | | | | | | | | | | | | | | |
2019(i) | | | 9.85 | | | | 0.30 | | | | 0.41 | | | | 0.71 | | | | (0.26 | ) | | | — | | | | — | | | | (0.26 | ) | | | — | * | | | — | | | | 10.30 | | | | 10.21 | |
2018(h) | | | 9.88 | | | | (0.01 | ) | | | — | | | | (0.01 | ) | | | — | | | | — | | | | — | | | | — | | | | (0.02 | ) | | | — | | | | 9.85 | | | | 10.85 | |
| | | | | | | | |
| | | Borrowings at the End of Period | |
| | | Aggregate
Amount
Outstanding
(000) | | | Asset
Coverage
Per $1,000 | |
|
JHY | |
Year Ended 12/31: | |
2019(i) | | $ | 61,500 | | | $ | 3,522 | |
2018 | | | 61,500 | | | | 3,431 | |
2017 | | | 44,000 | | | | 4,514 | |
2016 | | | 44,000 | | | | 4,035 | |
2015(b) | | | 44,000 | | | | 3,713 | |
|
JHD | |
Year Ended 12/31: | | | | | | | | |
2019(i) | | | — | | | | — | |
2018 | | | — | | | | — | |
2017 | | | 63,500 | | | | 5,341 | |
2016(c) | | | 90,000 | | | | 4,053 | |
|
JHB | |
Year Ended 12/31: | |
2019(i) | | | 207,000 | | | | 3,698 | |
2018 | | | 190,000 | | | | 3,793 | |
2017 | | | 190,000 | | | | 3,976 | |
2016(d) | | | 190,000 | | | | 3,915 | |
|
JHAA | |
Year Ended 12/31: | | | | | | | | |
2019(i) | | | 25,500 | | | | 4,157 | |
54
| | | | | | | | | | | | | | | | | | | | | | |
| | | | | | | Common Share Supplemental Data/
Ratios Applicable to Common Shares | |
Common Shares
Total Returns | | | | | | Ratios to Average Net Assets(f) | | | | |
Based
on
NAV(e) | | | Based
on
Share
Price(e) | | | Ending
Net Assets
(000) | | | Expenses | | | Net
Investment
Income (Loss) | | | Portfolio
Turnover
Rate(g) | |
| | | | | |
| | | | | | | | | | | | | | | | | | | | | | | |
| | | | | | | | | | | | | | | | | | | | | | |
| | 5.92 | % | | | 1.63 | % | | $ | 155,116 | | | | 2.31 | %** | | | 4.55 | %** | | | 21 | % |
| | 0.97 | | | | 5.42 | | | | 149,509 | | | | 2.14 | | | | 5.16 | | | | 32 | |
| | 7.94 | | | | 3.28 | | | | 154,595 | | | | 1.54 | | | | 6.29 | | | | 72 | |
| | 20.15 | | | | 9.94 | | | | 133,521 | | | | 1.50 | | | | 7.91 | | | | 53 | |
| | (8.60 | ) | | | 2.42 | | | | 119,367 | | | | 1.34 | ** | | | 6.97 | ** | | | 11 | |
| | | | | |
| | | | | | | | | | | | | | | | | | | | | | | |
| | | | | | | | | | | | | | | | | | | | | | |
| | 3.10 | | | | 2.09 | | | | 270,566 | | | | 0.72 | ** | | | 3.53 | ** | | | 22 | |
| | 1.92 | | | | 3.31 | | | | 267,663 | | | | 1.01 | | | | 4.24 | | | | 40 | |
| | 6.42 | | | | 5.32 | | | | 275,624 | | | | 1.50 | | | | 5.57 | | | | 43 | |
| | 6.07 | | | | 4.06 | | | | 274,756 | | | | 1.31 | ** | | | 5.87 | ** | | | 15 | |
| | | | | |
| | | | | | | | | | | | | | | | | | | | | | | |
| | | | | | | | | | | | | | | | | | | | | | |
| | 7.93 | | | | 14.32 | | | | 558,416 | | | | 2.08 | ** | | | 5.45 | ** | | | 19 | |
| | (0.43 | ) | | | (4.99 | ) | | | 530,692 | | | | 1.86 | | | | 5.94 | | | | 27 | |
| | 8.22 | | | | 6.98 | | | | 565,385 | | | | 1.57 | | | | 6.37 | | | | 37 | |
| | 2.26 | | | | 0.32 | | | | 553,912 | | | | 1.17 | ** | | | 4.79 | ** | | | 6 | |
| | | | | |
| | | | | | | | | | | | | | | | | | | | | | | |
| | | | | | | | | | | | | | | | | | | | | | |
| | 7.25 | | | | (3.47 | ) | | | 80,496 | | | | 2.05 | ** | | | 6.09 | ** | | | 12 | |
| | (0.30 | ) | | | 8.50 | | | | 69,042 | | | | 1.74 | ** | | | (1.74 | )** | | | — | |
| (a) | Per share Net Investment Income (Loss) is calculated using the average daily shares method. |
| (b) | For the period July 28, 2015 (commencement of operations) through December 31, 2015. |
| (c) | For the period May 10, 2016 (commencement of operations) through December 31, 2016. |
| (d) | For the period August 23, 2016 (commencement of operations) through December 31, 2016. |
| (e) | Total Return Based on Common Share NAV is the combination of changes in common share NAV, reinvested dividend income at NAV and reinvested capital gains distributions at NAV, if any. The last dividend declared in the period, which is typically paid on the first business day of the following month, is assumed to be reinvested at the ending NAV. The actual reinvest price for the last dividend declared in the period may often be based on the Fund’s market price (and not its NAV), and therefore may be different from the price used in the calculation. Total returns are not annualized. |
Total Return Based on Common Share Price is the combination of changes in the market price per share and the effect of reinvested dividend income and reinvested capital gains distributions, if any, at the average price paid per share at the time of reinvestment. The last dividend declared in the period, which is typically paid on the first business day of the following month, is assumed to be reinvested at the ending market price. The actual reinvestment for the last dividend declared in the period may take place over several days, and in some instances may not be based on the market price, so the actual reinvestment price may be different from the price used in the calculation. Total returns are not annualized.
| | | | |
| (f) | | • | | Net Investment Income (Loss) ratios reflect income earned and expenses incurred on assets attributable to borrowings and/or reverse repurchase agreements, where applicable, (as described in Note 8 – Fund Leverage). |
| | • | | Each ratio includes the effect of all interest expense paid and other costs related to borrowings and/or reverse repurchase agreements, where applicable, as follows: |
| | | | | | | | |
Ratios of
Interest Expense
to Average Net Assets Applicable
to Common Shares | |
JHY | |
Year Ended 12/31: | |
2019(i) | | | | | | | 1.28 | %** |
2018 | | | | | | | 1.01 | |
2017 | | | | 0.53 | |
2016 | | | | 0.43 | |
2015(b) | | | | 0.27 | ** |
| | | | | | | | |
| | | Ratios of
Interest Expense
to Average Net Assets Applicable
to Common Shares | |
JHD | |
Year Ended 12/31: | |
2019(i) | | | | | | | — | % |
2018 | | | | | | | 0.22 | |
2017 | | | | 0.55 | |
2016(c) | | | | 0.36 | ** |
| | | | | | | | |
| | | Ratios of
Interest Expense
to Average Net Assets Applicable
to Common Shares | |
JHB | |
Year Ended 12/31: | |
2019(i) | | | | | | | 1.09 | %** |
2018 | | | | | | | 0.92 | |
2017 | | | | 0.62 | |
2016(d) | | | | 0.25 | ** |
| | | | | | |
| | | | | Ratios of Interest Expense
to Average Net Assets Applicable
to Common Shares | |
JHAA | |
Year Ended 12/31: | |
2019(i) | | | 0.99 | %** |
| (g) | Portfolio Turnover Rate is calculated based on the lesser of long-term purchases or sales (as disclosed in Note 5 – Investment Transactions) divided by the average long-term market value during the period. |
| (h) | For the period December 18, 2018 (commencement of operations) through December 31, 2018. |
| (i) | For the six months ended June 30, 2019. |
| * | Rounds to less than $0.01 per share. |
See accompanying notes to financial statements.
55
Notes to Financial Statements
(Unaudited)
1. General Information and Significant Accounting Policies
General Information
Fund Information
The funds covered in this report and their corresponding New York Stock Exchange (“NYSE”) symbols are as follows (each a “Fund” and collectively, the “Funds”):
| | • | | Nuveen High Income 2020 Target Term Fund (JHY) |
| | • | | Nuveen High Income December 2019 Target Term Fund (JHD) |
| | • | | Nuveen High Income November 2021 Target Term Fund (JHB) |
| | • | | Nuveen High Income 2023 Target Term Fund (JHAA) |
The Funds are registered under the Investment Company Act of 1940 (the “1940 Act”), as amended, as diversified, closed-end management investment companies. JHY, JHD, JHB and JHAA were each organized as a Massachusetts business trust on April 13, 2015, February 10, 2016, July 13, 2015 and September 20, 2018, respectively.
The end of the reporting period for the Funds is June 30, 2019, and the period covered by these Notes to Financial Statements is the six months ended June 30, 2019 (the “current fiscal period”).
Investment Adviser
The Funds’ investment adviser is Nuveen Fund Advisors, LLC (the “Adviser”), a subsidiary of Nuveen, LLC (“Nuveen”). Nuveen is the investment management arm of Teachers Insurance and Annuity Association of America (TIAA). The Adviser has overall responsibility for management of the Funds, oversees the management of the Funds’ portfolios, manages the Funds’ business affairs and provides certain clerical, bookkeeping and other administrative services, and, if necessary, asset allocation decisions. The Adviser has entered into sub-advisory agreements with Nuveen Asset Management, LLC, (the “Sub-Adviser”), a subsidiary of the Adviser, under which the Sub-Adviser manages the investment portfolios of the Funds.
Investment Objectives and Principal Investment Strategies
Each Fund seeks to provide a high level of current income and return its original net asset value (“NAV”) per share on or about its termination date as noted in the following table.
| | | | | | | | |
| | | Original NAV
Per Share | | | Termination Date | |
JHY | | $ | 9.85 | | | | November 1, 2020 | |
JHD | | $ | 9.86 | | | | December 1, 2019 | |
JHB | | $ | 9.85 | | | | November 1, 2021 | |
JHAA | | $ | 9.88 | | | | December 1, 2023 | |
Under normal market conditions:
| | • | | The Funds invest at least 80% of their managed assets (as defined in Note 7 – Management Fees and Other Transactions with Affiliates) in corporate debt securities. |
| | • | | The Funds will invest at least 80% of their managed assets in securities that, at the time of investment, are rated below investment grade (those rated BB/Ba or lower) or that are unrated but judged by the Sub-Adviser to be of comparable quality. These securities generally provide high income in an effort to compensate investors for their higher risk of default, which is the failure to make required interest or principal payments. |
| | • | | The Funds will invest no more than 15% of the Funds’ managed assets in securities that, at the time of investment, are rated CCC+/Caa1 or lower, or are unrated but judged by the Sub-Adviser to be of comparable quality. |
| | • | | The Funds may invest up to 30% of their managed assets in securities of non-U.S. issuers, including up to 20% in emerging market issuers. |
| | • | | The Funds may invest up to 10% of their managed assets in non-U.S. dollar denominated securities. |
56
Each Fund also may invest in certain derivative instruments in pursuit of its investment objectives. Such instruments include financial futures contracts and options thereon, swaps (including interest rate and currency swaps), options on swaps and other derivative instruments. The Sub-Adviser may use derivative instruments to attempt to hedge some of the risk of each Fund’s investments or as a substitute for a position in the underlying asset.
During the current fiscal period, JHD entered the wind-up period in anticipation of its Termination Date. The Fund is a “target term” Fund that will cease its investment operations and liquidate its portfolio on December 1, 2019 and distribute the net proceeds to shareholders, unless the term is extended for a period of up to six months by a vote of the Board. Consequently, for the remainder of its term, the Fund will invest at least 80% of its managed assets in below investment grade securities; and short-term investment grade securities that have a final or remaining maturity of 397 days or less, as long as the maturity does not occur later than June 1, 2020.
Significant Accounting Policies
Each Fund is an investment company and follows accounting and reporting guidance under Financial Accounting Standards Board (“FASB”) Accounting Standards Codification (ASC) Topic 946 “Financial Services – Investment Companies.” The following is a summary of significant accounting policies followed by the Funds in the preparation of their financial statements in accordance with U.S. generally accepted accounting principles (“U.S. GAAP”).
Investment Transactions
Investment transactions are recorded on a trade date basis. Trade date for senior and subordinated loans purchased in the “primary market” is considered the date on which the loan allocations are determined. Trade date for senior and subordinated loans purchased in the “secondary market” is the date on which the transaction is entered into. Realized gains and losses from investment transactions are determined on the specific identification method, which is the same basis used for federal income tax purposes. Investments purchased on a when-issued/delayed delivery basis may have extended settlement periods. Any investments so purchased are subject to market fluctuation during this period. The Funds have earmarked securities in their portfolios with a current value at least equal to the amount of the when-issued/delayed delivery purchase commitments.
As of the end of the reporting period, the following Fund's outstanding when-issued/delayed delivery purchase commitments were as follows:
| | | | |
| | | JHB | |
Outstanding when-issued/delayed delivery purchase commitments | | $ | 3,628,125 | |
Investment Income
Investment income is comprised of interest income, which reflects the amortization of premiums and includes accretion of discounts for financial reporting purposes, and is recorded on an accrual basis. Interest income also reflects payment-in-kind (“PIK”) interest and paydown gains and losses, if any. PIK interest represents income received in the form of securities in lieu of cash.
Professional Fees
Professional fees presented on the Statement of Operations consist of legal fees incurred in the normal course of operations, audit fees, tax consulting fees and, in some cases, workout expenditures. Workout expenditures are incurred in an attempt to protect or enhance an investment or to pursue other claims or legal actions on behalf of Fund shareholders. If a refund is received for workout expenditures paid in a prior reporting period, such amounts will be recognized as “Legal fee refund” on the Statement of Operations.
Dividends and Distributions to Common Shareholders
Dividends to shareholders, if any, are declared monthly. Net realized capital gains from investment transactions, if any, are declared and distributed to shareholders at least annually. However, in seeking to achieve its investment objectives, each Fund currently intends to set aside and retain in its net assets (and therefore its NAV) a portion of its net investment income, and possibly all or a portion of its gains. This will reduce the amounts otherwise available for distribution prior to the liquidation of the Funds, and the Funds may incur taxes on such retained amount. Such retained income or gains, net of any taxes, would constitute a portion of the liquidating distribution returned to investors on or about the Termination Date. Furthermore, capital gains are distributed only to the extent they exceed available capital loss carryforwards.
Distributions to common shareholders are recorded on the ex-dividend date. The amount and timing of distributions are determined in accordance with federal income tax regulations, which may differ from U.S. GAAP.
Compensation
The Funds pay no compensation directly to those of its trustees who are affiliated with the Adviser or to its officers, all of whom receive remuneration for their services to the Funds from the Adviser or its affiliates. The Funds’ Board of Trustees (the “Board”) has adopted a deferred compensation plan for independent trustees that enables trustees to elect to defer receipt of all or a portion of the annual compensation they are entitled to receive from certain Nuveen-advised funds. Under the plan, deferred amounts are treated as though equal dollar amounts had been invested in shares of select Nuveen-advised funds.
57
Notes to Financial Statements(continued)
(Unaudited)
Indemnifications
Under the Funds’ organizational documents, their officers and trustees are indemnified against certain liabilities arising out of the performance of their duties to the Funds. In addition, in the normal course of business, the Funds enter into contracts that provide general indemnifications to other parties. The Funds’ maximum exposure under these arrangements is unknown as this would involve future claims that may be made against the Funds that have not yet occurred. However, the Funds have not had prior claims or losses pursuant to these contracts and expect the risk of loss to be remote.
Netting Agreements
In the ordinary course of business, the Funds may enter into transactions subject to enforceable master repurchase agreements, International Swaps and Derivatives Association, Inc. (ISDA) master agreements or other similar arrangements (“netting agreements”). Generally, the right to offset in netting agreements allows each Fund to offset certain securities and derivatives with a specific counterparty, when applicable, as well as any collateral received or delivered to that counterparty based on the terms of the agreements. Generally, each Fund manages its cash collateral and securities collateral on a counterparty basis.
The Funds’ investments subject to netting agreements as of the end of the reporting period, if any, are further described in Note 3 – Portfolio Securities and Investments in Derivatives.
Use of Estimates
The preparation of financial statements in conformity with U.S. GAAP requires management to make estimates and assumptions that affect the reported amounts of assets and liabilities at the date of the financial statements and the reported amounts of increases and decreases in net assets applicable to common shares from operations during the current fiscal period. Actual results may differ from those estimates.
2. Investment Valuation and Fair Value Measurements
The fair valuation input levels as described below are for fair value measurement purposes.
Fair value is defined as the price that would be received upon selling an investment or transferring a liability in an orderly transaction to an independent buyer in the principal or most advantageous market for the investment. A three-tier hierarchy is used to maximize the use of observable market data and minimize the use of unobservable inputs and to establish classification of fair value measurements for disclosure purposes. Observable inputs reflect the assumptions market participants would use in pricing the asset or liability. Observable inputs are based on market data obtained from sources independent of the reporting entity. Unobservable inputs reflect the reporting entity’s own assumptions about the assumptions market participants would use in pricing the asset or liability. Unobservable inputs are based on the best information available in the circumstances. The following is a summary of the three-tiered hierarchy of valuation input levels.
| | |
| Level 1 – | | Inputs are unadjusted and prices are determined using quoted prices in active markets for identical securities. |
| Level 2 – | | Prices are determined using other significant observable inputs (including quoted prices for similar securities, interest rates, credit spreads, etc.). |
| Level 3 – | | Prices are determined using significant unobservable inputs (including management’s assumptions in determining the fair value of investments). |
Prices of fixed-income securities are provided by an independent pricing service (“pricing service”) approved by the Board. The pricing service establishes a security’s fair value using methods that may include consideration of the following: yields or prices of investments of comparable quality, type of issue, coupon, maturity and rating, market quotes or indications of value from security dealers, evaluations of anticipated cash flows or collateral, general market conditions and other information and analysis, including the obligor’s credit characteristics considered relevant. These securities are generally classified as Level 2. In pricing certain securities, particularly less liquid and lower quality securities, the pricing service may consider information about a security, its issuer or market activity, provided by the Adviser. These securities are generally classified as Level 2 or Level 3 depending on the observability of the significant inputs.
Like most fixed-income securities, the senior and subordinated loans in which the Funds invest are not listed on an organized exchange. The secondary market of such investments may be less liquid relative to markets for other fixed-income securities. Consequently, the value of senior and subordinated loans, determined as described above, may differ significantly from the value that would have been determined had there been an active market for that senior loan. These securities are generally classified as Level 2.
Repurchase agreements are valued at contract amount plus accrued interest, which approximates market value. These securities are generally classified as Level 2.
Investments initially valued in currencies other than the U.S. dollar are converted to the U.S. dollar using exchange rates obtained from pricing services. As a result, the NAV of the Funds’ shares may be affected by changes in the value of currencies in relation to the U.S. dollar. The value of securities traded in markets outside the United States or denominated in currencies other than the U.S. dollar may be affected significantly on a day that the NYSE is closed and an investor is not able to purchase, redeem or exchange shares. If significant market events occur between the time of determination of the closing price of a foreign security on an exchange and the time that the Funds’ NAV is determined, or if under the Funds’ procedures, the closing price of a foreign security is not deemed to be reliable, the security would be valued at fair value as determined in accordance with procedures established in good faith by the Board. These securities are generally classified as Level 2 or Level 3 depending on the observability of the significant inputs.
58
Certain securities may not be able to be priced by the pre-established pricing methods as described above. Such securities may be valued by the Board and/or its appointee at fair value. These securities generally include, but are not limited to, restricted securities (securities which may not be publicly sold without registration under the Securities Act of 1933, as amended) for which a pricing service is unable to provide a market price; securities whose trading has been formally suspended; debt securities that have gone into default and for which there is no current market quotation; a security whose market price is not available from a pre-established pricing source; a security with respect to which an event has occurred that is likely to materially affect the value of the security after the market has closed but before the calculation of a Fund’s NAV (as may be the case in non-U.S. markets on which the security is primarily traded) or make it difficult or impossible to obtain a reliable market quotation; and a security whose price, as provided by the pricing service, is not deemed to reflect the security’s fair value. As a general principle, the fair value of a security would appear to be the amount that the owner might reasonably expect to receive for it in a current sale. A variety of factors may be considered in determining the fair value of such securities, which may include consideration of the following: yields or prices of investments of comparable quality, type of issue, coupon, maturity and rating, market quotes or indications of value from security dealers, evaluations of anticipated cash flows or collateral, general market conditions and other information and analysis, including the obligor’s credit characteristics considered relevant. These securities are generally classified as Level 2 or Level 3 depending on the observability of the significant inputs. Regardless of the method employed to value a particular security, all valuations are subject to review by the Board and/or its appointee.
The inputs or methodologies used for valuing securities are not an indication of the risks associated with investing in those securities. The following is a summary of each Fund’s fair value measurements as of the end of the reporting period:
| | | | | | | | | | | | | | | | |
| JHY | | Level 1 | | | Level 2 | | | Level 3 | | | Total | |
Long-Term Investments*: | | | | | | | | | | | | | | | | |
Corporate Bonds | | $ | — | | | $ | 179,017,689 | | | $ | — | | | $ | 179,017,689 | |
Sovereign Debt | | | — | | | | 6,311,835 | | | | — | | | | 6,311,835 | |
Convertible Bonds | | | — | | | | 6,079,550 | | | | — | | | | 6,079,550 | |
Variable Rate Senior Loan Interests | | | — | | | | 5,397,486 | | | | — | | | | 5,397,486 | |
| | | | |
Short-Term Investments: | | | | | | | | | | | | | | | | |
Repurchase Agreements | | | — | | | | 15,812,316 | | | | — | | | | 15,812,316 | |
Total | | $ | — | | | $ | 212,618,876 | | | $ | — | | | $ | 212,618,876 | |
| | | | |
| JHD | | | | | | | | | | | | |
Long-Term Investments*: | | | | | | | | | | | | | | | | |
Corporate Bonds | | $ | — | | | $ | 152,724,479 | | | $ | — | | | $ | 152,724,479 | |
Sovereign Debt | | | — | | | | 21,014,986 | | | | — | | | | 21,014,986 | |
Convertible Bonds | | | — | | | | 15,869,188 | | | | — | | | | 15,869,188 | |
Variable Rate Senior Loan Interests | | | — | | | | 2,571,197 | | | | — | | | | 2,571,197 | |
| | | | |
Short-Term Investments: | | | | | | | | | | | | | | | | |
Commercial Paper* | | | — | | | | 72,851,873 | | | | — | | | | 72,851,873 | |
Repurchase Agreements | | | — | | | | 3,294,614 | | | | — | | | | 3,294,614 | |
Total | | $ | — | | | $ | 268,326,337 | | | $ | — | | | $ | 268,326,337 | |
| | | | |
| JHB | | | | | | | | | | | | |
Long-Term Investments*: | | | | | | | | | | | | | | | | |
Corporate Bonds** | | $ | — | | | $ | 659,548,551 | | | $ | — | *** | | $ | 659,548,551 | |
Variable Rate Senior Loan Interests | | | — | | | | 45,978,029 | | | | — | | | | 45,978,029 | |
Sovereign Debt | | | — | | | | 11,527,885 | | | | — | | | | 11,527,885 | |
Convertible Bonds | | | — | | | | 3,920,000 | | | | — | | | | 3,920,000 | |
Total | | $ | — | | | $ | 720,974,465 | | | $ | — | | | $ | 720,974,465 | |
| | | | |
| JHAA | | | | | | | | | | | | |
Long-Term Investments*: | | | | | | | | | | | | | | | | |
Corporate Bonds | | $ | — | | | $ | 64,276,377 | | | $ | — | | | $ | 64,276,377 | |
Variable Rate Senior Loan Interests | | | — | | | | 38,953,626 | | | | — | | | | 38,953,626 | |
Convertible Bonds | | | — | | | | 1,177,801 | | | | — | | | | 1,177,801 | |
| | | | |
Short-Term Investments: | | | | | | | | | | | | | | | | |
Repurchase Agreements | | | — | | | | 1,845,049 | | | | — | | | | 1,845,049 | |
Total | | $ | — | | | $ | 106,252,853 | | | $ | — | | | $ | 106,252,853 | |
| * | Refer to the Fund’s Portfolio of Investments for industry and country classifications, where applicable. |
| ** | Refer to the Fund’s Portfolio of Investments for securities classified as Level 3. |
| *** | Value equals zero as of the end of the reporting period. |
59
Notes to Financial Statements(continued)
(Unaudited)
3. Portfolio Securities and Investments in Derivatives
Portfolio Securities
Foreign Currency Transactions
To the extent that the Funds may invest in securities and/or contracts that are denominated in a currency other than U.S. dollars, the Funds will be subject to currency risk, which is the risk that an increase in the U.S. dollar relative to the foreign currency will reduce returns or portfolio value. Generally, when the U.S. dollar rises in value against a foreign currency, the Funds’ investments denominated in that currency will lose value because their currency is worth fewer U.S. dollars; the opposite effect occurs if the U.S. dollar falls in relative value. Investments and other assets and liabilities denominated in foreign currencies are converted into U.S. dollars on a spot (i.e. cash) basis at the spot rate prevailing in the foreign currency exchange market at the time of valuation. Purchases and sales of investments and income denominated in foreign currencies are translated into U.S. dollars on the respective dates of such transactions.
As of the end of the reporting period, the Funds’ investments in non-U.S. securities were as follows:
| | | | | | | | |
| JHY | | Value | | | % of Total
Investments | |
Country: | | | | | | | | |
Canada | | $ | 4,629,596 | | | | 2.2 | % |
Turkey | | | 4,456,071 | | | | 2.1 | |
Japan | | | 3,626,875 | | | | 1.7 | |
Hong Kong | | | 3,011,449 | | | | 1.4 | |
Egypt | | | 2,539,895 | | | | 1.2 | |
United Kingdom | | | 2,477,363 | | | | 1.2 | |
Australia | | | 2,400,464 | | | | 1.1 | |
China | | | 2,395,900 | | | | 1.1 | |
South Africa | | | 2,149,582 | | | | 1.0 | |
Other | | | 8,010,475 | | | | 3.8 | |
Totalnon-U.S. securities | | $ | 35,697,670 | | | | 16.8 | % |
| | |
| JHD | | | | | | |
Country: | | | | | | | | |
United Kingdom | | $ | 11,896,733 | | | | 4.4 | % |
Brazil | | | 10,625,975 | | | | 4.0 | |
Japan | | | 6,360,125 | | | | 2.4 | |
Egypt | | | 5,079,790 | | | | 1.9 | |
Turkey | | | 5,055,750 | | | | 1.9 | |
Ireland | | | 4,953,653 | | | | 1.8 | |
Cayman Islands | | | 4,953,456 | | | | 1.8 | |
Australia | | | 4,285,820 | | | | 1.6 | |
Israel | | | 4,209,625 | | | | 1.6 | |
Other | | | 18,487,195 | | | | 6.9 | |
Totalnon-U.S. securities | | $ | 75,908,122 | | | | 28.3 | % |
| | |
| JHB | | | | | | |
Country: | | | | | | | | |
Canada | | $ | 32,117,075 | | | | 4.5 | % |
United Kingdom | | | 28,347,657 | | | | 3.9 | |
Japan | | | 16,516,264 | | | | 2.3 | |
Italy | | | 9,654,984 | | | | 1.3 | |
Luxembourg | | | 8,755,975 | | | | 1.2 | |
South Africa | | | 7,979,396 | | | | 1.1 | |
Australia | | | 6,875,875 | | | | 1.0 | |
Ireland | | | 6,628,781 | | | | 0.9 | |
Israel | | | 5,985,135 | | | | 0.8 | |
Other | | | 44,882,779 | | | | 6.3 | |
Totalnon-U.S. securities | | $ | 167,743,921 | | | | 23.3 | % |
60
| | | | | | | | |
| JHAA | | Value | | | % of Total
Investments | |
Country: | | | | | | | | |
Canada | | $ | 4,262,460 | | | | 4.0 | % |
United Kingdom | | | 1,906,978 | | | | 1.8 | |
Netherlands | | | 1,745,481 | | | | 1.6 | |
Luxembourg | | | 1,389,570 | | | | 1.3 | |
United Arab Emirates | | | 1,319,625 | | | | 1.2 | |
Brazil | | | 1,304,013 | | | | 1.2 | |
Israel | | | 1,226,063 | | | | 1.2 | |
Zambia | | | 1,168,750 | | | | 1.1 | |
Australia | | | 1,165,781 | | | | 1.1 | |
Other | | | 3,177,507 | | | | 3.1 | |
Totalnon-U.S. securities | | $ | 18,666,228 | | | | 17.6 | % |
The books and records of the Funds are maintained in U.S. dollars. Foreign currencies, assets and liabilities are translated into U.S. dollars at 4:00 p.m. Eastern Time. Investment transactions, income and expenses are translated on the respective dates of such transactions. Net realized foreign currency gains and losses resulting from changes in exchange rates include foreign currency gains and losses between trade date and settlement date of the transactions, foreign currency transactions and the difference between the amounts of interest and dividends recorded on the books of a Fund and the amounts actually received.
The realized gains and losses resulting from changes in foreign currency exchange rates and changes in foreign exchange rates associated with (i) foreign currency, (ii) investments, (iii) investments in derivatives and (iv) other assets and liabilities are recognized as a component of “Net realized gain (loss) from investments and foreign currency” on the Statement of Operations, when applicable.
The unrealized gains and losses resulting from changes in foreign currency exchange rates and changes in foreign exchange rates associated with (i) investments and (ii) other assets and liabilities are recognized as a component of “Change in net unrealized appreciation (depreciation) of investments and foreign currency” on the Statement of Operations, when applicable. The unrealized gains and losses resulting from changes in foreign exchange rates associated with investments in derivatives are recognized as a component of the respective derivative’s related “Change in net unrealized appreciation (depreciation)” on the Statement of Operations, when applicable.
Repurchase Agreements
In connection with transactions in repurchase agreements, it is each Fund’s policy that its custodian take possession of the underlying collateral securities, the fair value of which exceeds the principal amount of the repurchase transaction, including accrued interest, at all times. If the counterparty defaults, and the fair value of the collateral declines, realization of the collateral may be delayed or limited.
The following table presents the repurchase agreements for the Funds that are subject to netting agreements as of the end of the reporting period, and the collateral delivered related to those repurchase agreements.
| | | | | | | | | | | | | | |
| Fund | | Counterparty | | Short-Term
Investments, at Value | | | Collateral
Pledged (From)
Counterparty* | | | Net
Exposure | |
JHY | | Fixed Income Clearing Corporation | | $ | 15,812,316 | | | $ | (15,812,316 | ) | | $ | — | |
| JHD | | Fixed Income Clearing Corporation | | | 3,294,614 | | | | (3,294,614 | ) | | | — | |
JHAA | | Fixed Income Clearing Corporation | | | 1,845,049 | | | | (1,845,049 | ) | | | — | |
| * | As of the end of the reporting period, the value of the collateral pledged from the counterparty exceeded the value of the repurchase agreements. Refer to the Fund’s Portfolio of Investments for details on the repurchase agreements. |
Zero Coupon Securities
A zero coupon security does not pay a regular interest coupon to its holders during the life of the security. Income to the holder of the security comes from accretion of the difference between the original purchase price of the security at issuance and the par value of the security at maturity and is effectively paid at maturity. The market prices of zero coupon securities generally are more volatile than the market prices of securities that pay interest periodically.
Investments in Derivatives
Each Fund is authorized to invest in certain derivative instruments such as futures, options and swap contracts. Each Fund limits its investments in futures, options on futures and swap contracts to the extent necessary for the Adviser to claim the exclusion from registration by the Commodity Futures Trading
61
Notes to Financial Statements(continued)
(Unaudited)
Commission as a commodity pool operator with respect to the Fund. The Funds record derivative instruments at fair value, with changes in fair value recognized on the Statement of Operations, when applicable. Even though the Funds’ investments in derivatives may represent economic hedges, they are not considered to be hedge transactions for financial reporting purposes.
Although the Funds are authorized to invest in derivative instruments, and may do so in the future, they did not make any such investments during the current fiscal period.
Market and Counterparty Credit Risk
In the normal course of business each Fund may invest in financial instruments and enter into financial transactions where risk of potential loss exists due to changes in the market (market risk) or failure of the other party to the transaction to perform (counterparty credit risk). The potential loss could exceed the value of the financial assets recorded on the financial statements. Financial assets, which potentially expose each Fund to counterparty credit risk, consist principally of cash due from counterparties on forward, option and swap transactions, when applicable. The extent of each Fund’s exposure to counterparty credit risk in respect to these financial assets approximates their carrying value as recorded on the Statement of Assets and Liabilities.
Each Fund helps manage counterparty credit risk by entering into agreements only with counterparties the Adviser believes have the financial resources to honor their obligations and by having the Adviser monitor the financial stability of the counterparties. Additionally, counterparties may be required to pledge collateral daily (based on the daily valuation of the financial asset) on behalf of each Fund with a value approximately equal to the amount of any unrealized gain above a pre-determined threshold. Reciprocally, when each Fund has an unrealized loss, the Funds have instructed the custodian to pledge assets of the Funds as collateral with a value approximately equal to the amount of the unrealized loss above a pre-determined threshold. Collateral pledges are monitored and subsequently adjusted if and when the valuations fluctuate, either up or down, by at least the pre-determined threshold amount.
4. Fund Shares
Common Shares
Common Shares Equity Shelf Programs and Offering Costs
JHY had filed a registration statement with the Securities and Exchange Commission (“SEC”) authorizing the Fund to issue additional common shares through one or more equity shelf programs (“Shelf Offering”), which became effective with the SEC during a prior fiscal period.
Under this Shelf Offering, the Fund, subject to market conditions, may raise additional equity capital by issuing additional common shares from time to time in varying amounts and by different offering methods at a net price at or above the Fund’s NAV per common share. In the event the Fund’s Shelf Offering registration statement is no longer current, the Fund may not issue additional common shares until a post-effective amendment to the registration statement has been filed with the SEC.
Additional authorized common shares, common shares sold and offering proceeds, net of offering costs under the Fund’s Shelf Offering during the Fund’s current and prior fiscal period were as follows:
| | | | | | | | |
| | | JHY | |
| | | Six Months
Ended
6/30/19 | | | Year Ended
12/31/18* | |
Additional authorized common shares | | | — | | | | 3,400,000 | |
Common shares sold | | | — | | | | 119,829 | |
Offering proceeds, net of offering costs | | $ | — | | | $ | 1,270,140 | |
| * | Represents additional authorized shares for the period January 1, 2018 through October 31, 2018. |
Costs incurred by the Fund in connection with its initial shelf registrations were recorded as a prepaid expense and recognized as a component of
“Deferred offering costs” on the Statement of Assets and Liabilities. These costs are amortized pro rata as shares are sold and are recognized as a component of “Proceeds from shelf offering, net of offering costs” on the Statement of Changes in Net Assets. Any deferred offering costs remaining one year after the effectiveness of the initial shelf registration will be expensed. Costs incurred by the Fund to keep the shelf registration current are expensed as incurred and recognized as a component of “other expenses” on the Statement of Operations.
62
Common Share Transactions
Transactions in common shares during the Funds’ current and prior fiscal period were as follows:
| | | | | | | | | | | | | | | | |
| | | JHY | | | JHD | |
| | | Six Months
Ended
6/30/19 | | | Year Ended
12/31/18 | | | Six Months
Ended
6/30/19 | | | Year Ended 12/31/18 | |
Common shares: | | | | | | | | | | | | | | | | |
Sold through shelf offering | | | — | | | | 119,829 | | | | — | | | | — | |
Issued to shareholders due to reinvestment of distributions | | | 12,239 | | | | 28,375 | | | | — | | | | — | |
Total | | | 12,239 | | | | 148,204 | | | | — | | | | — | |
| | | | |
Weighted average common share: | | | | | | | | | | | | | | | | |
Premium to NAV per shelf offering share sold | | | — | % | | | 1.29 | % | | | — | % | | | — | % |
| | |
| | | JHB | | | JHAA* | |
| | | Six Months
Ended
6/30/19 | | | Year Ended
12/31/18 | | | Six Months
Ended
6/30/19 | | | For the Period 12/18/18
(commencement of operations)
through 12/31/18 | |
Common shares: | | | | | | | | | | | | | | | | |
Sold | | | — | | | | — | | | | 801,742 | | | | 7,000,000 | |
Issued to shareholders due to reinvestment of distributions | | | — | | | | — | | | | 1,292 | | | | — | |
Total | | | — | | | | — | | | | 803,034 | | | | 7,000,000 | |
| * | Prior to the commencement of operations, the Adviser purchased 10,128 shares, which are still held as of the end of the reporting period. |
5. Investment Transactions
Long-term purchases and sales (including maturities) during the current fiscal period were as follows:
| | | | | | | | | | | | | | | | |
| | | JHY | | | JHD | | | JHB | | | JHAA | |
Purchases | | $ | 43,060,289 | | | $ | 52,033,904 | | | $ | 136,176,502 | | | $ | 111,321,668 | |
Sales and maturities | | | 56,516,652 | | | | 126,112,078 | | | | 149,219,392 | | | | 10,410,649 | |
6. Income Tax Information
Each Fund is a separate taxpayer for federal income tax purposes. Each Fund intends to distribute substantially all of its net investment company taxable income to shareholders and to otherwise comply with the requirements of Subchapter M of the Internal Revenue Code applicable to regulated investment companies. In any year when the Funds realize net capital gains, the Funds may choose to distribute all or a portion of their net capital gains to shareholders, or alternatively, to retain all or a portion of their net capital gains and pay federal corporate income taxes on such retained gains.
For all open tax years and all major taxing jurisdictions, management of the Funds has concluded that there are no significant uncertain tax positions that would require recognition in the financial statements. Open tax years are those that are open for examination by taxing authorities (i.e., generally the last four tax year ends and the interim tax period since then). Furthermore, management of the Funds is also not aware of any tax positions for which it is reasonably possible that the total amounts of unrecognized tax benefits will significantly change in the next twelve months.
The following information is presented on an income tax basis. Differences between amounts for financial statement and federal income tax purposes are primarily due to timing differences in recognizing certain gains and losses on investment transactions. To the extent that differences arise that are permanent in nature, such amounts are reclassified within the capital accounts as detailed below. Temporary differences do not require reclassification. Temporary and permanent differences do not impact the NAVs of the Funds.
The table below presents the cost and unrealized appreciation (depreciation) of each Fund’s investment portfolio, as determined on a federal income tax basis, as of June 30, 2019.
| | | | | | | | | | | | | | | | |
| | | JHY | | | JHD | | | JHB | | | JHAA | |
Tax cost of investments | | $ | 212,337,162 | | | $ | 267,909,369 | | | $ | 718,175,239 | | | $ | 103,371,291 | |
Gross unrealized: | | | | | | | | | | | | | | | | |
Appreciation | | $ | 1,369,505 | | | $ | 753,999 | | | $ | 9,079,759 | | | $ | 3,388,462 | |
Depreciation | | | (1,087,791 | ) | | | (337,031 | ) | | | (6,280,533 | ) | | | (506,900 | ) |
Net unrealized appreciation (depreciation) of investments | | $ | 281,714 | | | $ | 416,968 | | | $ | 2,799,226 | | | $ | 2,881,562 | |
63
Notes to Financial Statements(continued)
(Unaudited)
Permanent differences, primarily due to net operating losses, distribution reallocations and federal taxes paid, resulted in reclassifications among the Funds’ components of common share net assets as of December 31, 2018, the Funds’ last tax year end.
The tax components of undistributed net ordinary income and net long-term capital gains as of December 31, 2018, the Funds’ last tax year end, were as follows:
| | | | | | | | | | | | | | | | |
| | | JHY | | | JHD | | | JHB | | | JHAA | |
Undistributed net ordinary income1 | | $ | 722,208 | | | $ | 3,252,376 | | | $ | 6,113,267 | | | $ | — | |
Undistributed net long-term capital gains | | | — | | | | 839,441 | | | | 131,241 | | | | — | |
| 1 | Net ordinary income consists of net taxable income derived from dividends, interest, and net short-term capital gains, if any. |
The tax character of distributions paid during the Funds’ last tax year ended December 31, 2018 was designated for purposes of the dividends paid deduction as follows:
| | | | | | | | | | | | | | | | |
| | | JHY | | | JHD | | | JHB | | | JHAA2 | |
Distributions from net ordinary income1 | | $ | 7,972,415 | | | $ | 11,854,089 | | | $ | 31,567,480 | | | $ | — | |
Distributions from net long-term capital gains | | | — | | | | 1,174,583 | | | | 1,111,846 | | | | — | |
| 1 | Net ordinary income consists of net taxable income derived from dividends, interest, and net short-term capital gains, if any. |
| 2 | For the period December 18, 2018 (commencement of operations) through December 31, 2018. |
As of December 31, 2018, the Funds’ last tax year end, the following Fund had unused capital losses carrying forward available for federal income tax purposes to be applied against future capital gains, if any. The capital losses are not subject to expiration.
| | | | |
| | | JHY | |
Not subject to expiration: | | | | |
Short-term | | $ | 355,491 | |
Long-term | | | 347,904 | |
Total | | $ | 703,395 | |
7. Management Fees
Management Fees
Each Fund’s management fee compensates the Adviser for overall investment advisory and administrative services and general office facilities. The Sub-Adviser is compensated for its services to the Funds from the management fees paid to the Adviser.
Each Fund’s management fee consists of two components – a fund-level fee, based only on the amount of assets within each individual Fund, and a complex-level fee, based on the aggregate amount of all eligible fund assets managed by the Adviser. This pricing structure enables Fund shareholders to benefit from growth in the assets within their respective Fund as well as from growth in the amount of complex-wide assets managed by the Adviser.
The annual fund-level fee, payable monthly, for each Fund is calculated according to the following schedule:
| | | | |
| Average Daily Managed Assets* | | Fund-Level Fee Rate | |
For the first $500 million | | | 0.5000 | % |
For the next $250 million | | | 0.4875 | |
For managed assets over $750 million | | | 0.4750 | |
64
The annual complex-level fee, payable monthly, for each Fund is calculated by multiplying the current complex-wide fee rate, determined according to the following schedule by the Funds’ daily managed assets:
| | | | |
| Complex-Level Eligible Asset Breakpoint Level* | | Effective Complex-Level
Fee Rate at Breakpoint Level | |
$55 billion | | | 0.2000 | % |
$56 billion | | | 0.1996 | |
$57 billion | | | 0.1989 | |
$60 billion | | | 0.1961 | |
$63 billion | | | 0.1931 | |
$66 billion | | | 0.1900 | |
$71 billion | | | 0.1851 | |
$76 billion | | | 0.1806 | |
$80 billion | | | 0.1773 | |
$91 billion | | | 0.1691 | |
$125 billion | | | 0.1599 | |
$200 billion | | | 0.1505 | |
$250 billion | | | 0.1469 | |
$300 billion | | | 0.1445 | |
| * | For the complex-level fees, managed assets include closed-end fund assets managed by the Adviser that are attributable to certain types of leverage. For these purposes, leverage includes the funds’ use of preferred stock and borrowings and certain investments in the residual interest certificates (also called inverse floating rate securities) in tender option bond (TOB) trusts, including the portion of assets held by a TOB trust that has been effectively financed by the trust’s issuance of floating rate securities, subject to an agreement by the Adviser as to certain funds to limit the amount of such assets for determining managed assets in certain circumstances. The complex-level fee is calculated based upon the aggregate daily managed assets of all Nuveen open-end and closed-end Funds that constitute “eligible assets.” Eligible assets do not include assets attributable to investments in other Nuveen funds or assets in excess of a determined amount (originally $2 billion) added to the Nuveen fund complex in connection with the Adviser’s assumption of the management of the former First American Funds effective January 1, 2011. As of June 30, 2019, the complex-level fee for each Fund was 0.1577%. |
8. Fund Leverage
Borrowings
During the current fiscal period, JHY, JHB and JHAA entered into borrowing arrangements (“Borrowings”) as a means of leverage.
The following Funds have entered into a credit agreement with a bank. As of the end of the reporting period each Fund’s maximum commitment amount under its Borrowings is as follows:
| | | | | | | | | | | | |
| | | JHY | | | JHB | | | JHAA | |
Maximum commitment amount | | | $61,500,000 | | | | $215,000,000 | | | | $27,500,000 | |
JHY renewed its Borrowings in April 2019 through April 2020, while JHB renewed its Borrowings in January 2019 through January 2020. In addition the interest charged on JHB’s Borrowings was changed from one-month LIBOR plus 0.40% to one-month LIBOR plus 0.45%. All other terms remained unchanged for each Fund.
As of the end of the reporting period, each Fund’s outstanding balance on its Borrowings was as follows:
| | | | | | | | | | | | |
| | | JHY | | | JHB | | | JHAA | |
Outstanding balance on Borrowings | | | $61,500,000 | | | | $207,000,000 | | | | $25,500,000 | |
Interest is charged on these Borrowings for JHY at the 1-Month LIBOR (London Inter-Bank Offered Rate) plus 0.65% per annum on the amounts borrowed and a 0.125% per annum commitment fee on the undrawn portion of the Borrowings. JHB is charged at the 1-Month LIBOR plus 0.45% (0.40% prior to January 9, 2019) per annum and a 0.25% per annum commitment fee on the undrawn portion of the Borrowings on any day that more than 10% of the maximum commitment amount is undrawn. JHAA is charged at the1-Month LIBOR plus 0.60% per annum on the amounts borrowed and accrues a 0.125% per annum commitment fee on the undrawn portion of the Borrowings and aone-time upfront fee of 0.05% per annum on the maximum commitment amount.
During the current fiscal period, the average daily balance outstanding and average annual interest rate on each Fund’s Borrowings were as follows:
| | | | | | | | | | | | |
| | | JHY | | | JHB | | | JHAA* | |
Average daily balance outstanding | | | $61,500,000 | | | | $205,779,006 | | | | $24,091,160 | |
Average annual interest rate | | | 3.13 | % | | | 2.93 | % | | | 3.08 | % |
| * | For the period January 8, 2019 (initial draw) through June 30, 2019. |
65
Notes to Financial Statements(continued)
(Unaudited)
In order to maintain these Borrowings, the Funds must meet certain collateral, asset coverage and other requirements. Each Fund’s Borrowings outstanding are secured by assets in the Fund’s portfolio of investments.
Each Fund’s Borrowings outstanding is recognized as “Borrowings” on the Statement of Assets and Liabilities. Interest expense incurred on the borrowed amount and undrawn balance and amendment fees are recognized as components of “Interest expense” on the Statement of Operations.
Reverse Repurchase Agreements
During the current fiscal period, JHAA used reverse repurchase agreements as a means of leverage.
In a reverse repurchase agreement, the Fund sells to the counterparty a security that it holds with a contemporaneous agreement to repurchase the same security at an agreed-upon price and date, with the Fund retaining the risk of loss that is associated with that security. The Fund will pledge assets determined to be liquid by the Adviser to cover its obligations under reverse repurchase agreements. Securities sold under reverse repurchase agreements are recorded as a liability and recognized as “Reverse repurchase agreements” on the Statement of Assets and Liabilities.
Payments made on reverse repurchase agreements are recognized as a component of “Interest expense” on the Statement of Operations.
As of the end of the reporting period, the Fund’s outstanding balances on its reverse repurchase agreements were as follows:
| | | | | | | | | | | | | | | | | | |
| Counterparty | | Coupon | | Principal
Amount | | | Maturity | | | Value | | | Value and
Accrued Interest | |
RBC Capital Markets | | 1.250% | | $ | (885,000 | ) | | | N/A | | | $ | (885,000 | ) | | $ | (888,096 | ) |
RBC Capital Markets | | 1.000% | | | (625,000 | ) | | | N/A | | | | (625,000 | ) | | | (626,749 | ) |
RBC Capital Markets | | 2.250% | | | (490,000 | ) | | | N/A | | | | (490,000 | ) | | | (493,086 | ) |
| | | | | $ | (2,000,000 | ) | | | | | | $ | (2,000,000 | ) | | $ | (2,007,931 | ) |
| N/A – | Maturity is not applicable. The final repurchase date will be established followingpre-specified advance notice by the Fund or the counterparty to the reverse repurchase agreement. |
During the current fiscal period, the average daily balance outstanding and weighted average interest rate on the Fund’s reverse repurchase agreements were as follows:
| | | | |
Average daily balance outstanding | | | $2,000,000 | * |
Weighted average interest rate | | | 1.50 | % |
| * | For the period March 20, 2019 (initial purchase of reverse repurchase agreements) through June, 30, 2019. |
The following table presents the reverse repurchase agreements subject to netting agreements and the collateral delivered related to those reverse repurchase agreements.
| | | | | | | | | | | | |
| Counterparty | | Reverse Repurchase
Agreements** | | | Collateral
Pledged to
counterparty*** | | | Net
Exposure | |
RBC Capital Markets | | $ | (2,007,931 | ) | | $ | 2,007,931 | | | $ | — | |
| ** | Represents gross value and accrued interest for the counterparty as reported in the preceding table. |
| *** | As of the end of the reporting period, the value of the collateral pledged to the counterparty exceeded the value of the reverse repurchase agreements. |
Rehypothecation
JHB has entered into a Rehypothecation Side Letter (“Side Letter”) with its credit agreement lender, allowing it to re-register a portion of its collateral in its own name or in a name other than the Fund’s to pledge, repledge, hypothecate, rehyphothecate, sell, lend or otherwise transfer or use the collateral (the “Hypothecated Securities”) with all rights of ownership as described in the Side Letter. Subject to certain conditions, the total value of the outstanding Hypothecated Securities shall not exceed 98% of the outstanding balance on the Borrowings. The Fund may designate any collateral as ineligible for rehypothecation. The Fund may also recall Hypothecated Securities on demand.
The Fund also has the right to apply and set-off an amount equal to one-hundred percent (100%) of the then-current fair market value of such Hypothecated Securities against the current Borrowings under the Side Letter in the event that the lender fails to timely return the Hypothecated Securities and in certain other circumstances. In such circumstances, however, the Fund may not be able to obtain replacement financing required to purchase replacement securities and, consequently, the Fund’s income generating potential may decrease. Even if the Fund is able to obtain replacement financing, it might not be able to purchase replacement securities at favorable prices.
66
Upon execution of the Rehypothecation Side Letter, the Fund lowered the drawn rate on its credit agreement. The Fund will receive any principal, interest, dividends and other distributions paid on the Hypothecated Securities.
As of the end of the reporting period, the Fund had Hypothecated Securities totaling $138,332,981.
9. Inter-Fund Lending
Inter-Fund Borrowing and Lending
The SEC has granted an exemptive order permitting registered open-end and closed-end Nuveen funds to participate in an inter-fund lending facility whereby the Nuveen funds may directly lend to and borrow money from each other for temporary purposes (e.g., to satisfy redemption requests or when a sale of securities “fails,” resulting in an unanticipated cash shortfall) (the “Inter-Fund Program”). The closed-end Nuveen funds, including the Funds covered by this shareholder report, will participate only as lenders, and not as borrowers, in the Inter-Fund Program because such closed-end funds rarely, if ever, need to borrow cash to meet redemptions. The Inter-Fund Program is subject to a number of conditions, including, among other things, the requirements that (1) no fund may borrow or lend money through the Inter-Fund Program unless it receives a more favorable interest rate than is typically available from a bank or other financial institution for a comparable transaction; (2) no fund may borrow on an unsecured basis through the Inter-Fund Program unless the fund’s outstanding borrowings from all sources immediately after the inter-fund borrowing total 10% or less of its total assets; provided that if the borrowing fund has a secured borrowing outstanding from any other lender, including but not limited to another fund, the inter-fund loan must be secured on at least an equal priority basis with at least an equivalent percentage of collateral to loan value; (3) if a fund’s total outstanding borrowings immediately after an inter-fund borrowing would be greater than 10% of its total assets, the fund may borrow through the inter-fund loan on a secured basis only; (4) no fund may lend money if the loan would cause its aggregate outstanding loans through the Inter-Fund Program to exceed 15% of its net assets at the time of the loan; (5) a fund’s inter-fund loans to any one fund shall not exceed 5% of the lending fund’s net assets; (6) the duration of inter-fund loans will be limited to the time required to receive payment for securities sold, but in no event more than seven days; and (7) each inter-fund loan may be called on one business day’s notice by a lending fund and may be repaid on any day by a borrowing fund. In addition, a Nuveen fund may participate in the Inter-Fund Program only if and to the extent that such participation is consistent with the fund’s investment objective and investment policies. The Board is responsible for overseeing the Inter-Fund Program.
The limitations detailed above and the other conditions of the SEC exemptive order permitting the Inter-Fund Program are designed to minimize the risks associated with Inter-Fund Program for both the lending fund and the borrowing fund. However, no borrowing or lending activity is without risk. When a fund borrows money from another fund, there is a risk that the loan could be called on one day’s notice or not renewed, in which case the fund may have to borrow from a bank at a higher rate or take other actions to payoff such loan if an inter-fund loan is not available from another fund. Any delay in repayment to a lending fund could result in a lost investment opportunity or additional borrowing costs.
During the current reporting period, none of the Funds covered by this shareholder report have entered into any inter-fund loan activity.
10. New Accounting Pronouncements
FASB Accounting Standards Update (“ASU”) 2017-08 (“ASU 2017-08”) Premium Amortization on Purchased Callable Debt Securities
The FASB has issued ASU 2017-08, which shortens the premium amortization period for purchased non-contingently callable debt securities.ASU 2017-08 specifies that the premium amortization period ends at the earliest call date, for purchased non-contingently callable debt securities. ASU 2017-08 is effective for fiscal years, and interim periods within those fiscal years, beginning after December 15, 2018. During the current fiscal period, ASU 2017-08 became effective for the Fund and it did not have a material impact on the Fund’s financial statements.
Fair Value Measurement: Disclosure Framework
During August 2018, the FASB issued ASU 2018-13 (“ASU 2018-13”), Fair Value Measurement: Disclosure Framework – Changes to the Disclosure Requirements for Fair Value Measurements. ASU 2018-13 modifies the disclosures required by Topic 820,Fair Value Measurements. The amendments in ASU 2018-13 are effective for all entities for fiscal years, and interim periods within those fiscal years, beginning after December 15, 2019. Management has early implemented this guidance and it did not have a material impact on the Fund’s financial statements.
11. Subsequent Events
Borrowings
During July 2019, JHAA renewed its Borrowings through January 2020. All other terms remained unchanged.
During July and August 2019, JHAA increased its borrowings amount to $27,025,000.
Complex-Level Management Fee
Effective August 1, 2019 (subsequent to the close of the reporting period), “eligible assets” of the complex-level management fee will include certain assets of certain Nuveen funds that were reorganized into funds advised by an affiliate of the Adviser during the 2019 calendar year.
Reverse Repurchase Agreements
During July and August 2019, JHAA reduced its reverse repurchase agreement amount to $490,000.
67
Additional Fund Information
| | | | | | | | |
| Board of Trustees | | | | | | | | |
| Margo Cook* | | Jack B. Evans | | William C. Hunter | | Albin F. Moschner | | John K. Nelson |
| Judith M. Stockdale | | Carole E. Stone | | Terence J. Toth | | Margaret L. Wolff | | Robert C. Young |
| * | Interested Board Member. |
| | | | | | | | |
| | | | | |
Fund Manager Nuveen Fund Advisors, LLC 333 West Wacker Drive Chicago, IL 60606 | | Custodian State Street Bank
& Trust Company One Lincoln Street Boston, MA 02111 | | Legal Counsel Chapman and Cutler LLP Chicago, IL 60603 | | Independent Registered
Public Accounting Firm KPMG LLP 200 East Randolph Street Chicago, IL 60601 | | Transfer Agent and
Shareholder Services Computershare Trust Company, N.A. 250 Royall Street Canton, MA 02021 (800) 257-8787 |
Portfolio of Investments Information
Each Fund is required to file its complete schedule of portfolio holdings with the Securities and Exchange Commission (SEC) for the first and third quarters of each fiscal year as an exhibit to its report on Form N-PORT. You may obtain this information on the SEC’s website at http://www.sec.gov.
Nuveen Funds’ Proxy Voting Information
You may obtain (i) information regarding how each fund voted proxies relating to portfolio securities held during the most recent twelve-month period ended June 30, without charge, upon request, by calling Nuveen toll-free at (800) 257-8787 or on Nuveen’s website at www.nuveen.com and (ii) a description of the policies and procedures that each fund used to determine how to vote proxies relating to portfolio securities without charge, upon request, by calling Nuveen toll free at (800) 257-8787. You may also obtain this information directly from the SEC. Visit the SEC on-line at http://www.sec.gov.
CEO Certification Disclosure
The Fund’s Chief Executive Officer (CEO) has submitted to the New York Stock Exchange (NYSE) the annual CEO certification as required by Section 303A.12(a) of the NYSE Listed Company Manual. The Fund has filed with the SEC the certification of its CEO and Chief Financial Officer required by Section 302 of the Sarbanes-Oxley Act.
Common Share Repurchases
JHY, JHD and JHB intend to repurchase, through their open-market share repurchase program, shares of their own common stock at such times and in such amounts as is deemed advisable. During the period covered by this report, each Fund repurchased shares of its common stock, as shown in the accompanying table. Any future repurchases will be reported to shareholders in the next annual or semi-annual report.
| | | | | | | | | | | | |
| | | JHY | | | JHD | | | JHB | |
Common shares repurchased | | | — | | | | — | | | | — | |
FINRA BrokerCheck
The Financial Industry Regulatory Authority (FINRA) provides information regarding the disciplinary history of FINRA member firms and associated investment professionals. This information as well as an investor brochure describing FINRA BrokerCheck is available to the public by calling the FINRA BrokerCheck Hotline number at (800) 289-9999 or by visiting www.FINRA.org.
68
Glossary of Terms Used in this Report
| ∎ | | Average Annual Total Return: This is a commonly used method to express an investment’s performance over a particular, usually multi-year time period. It expresses the return that would have been necessary each year to equal the investment’s actual cumulative performance (including change in NAV or market price and reinvested dividends and capital gains distributions, if any) over the time period being considered. |
| ∎ | | Bloomberg Barclays U.S. High Yield 1-5 Year Cash Pay 2% Issuer Capped Index: An index that tracks the performance of U.S. non-investment grade bonds with maturities of one to 4.99 years and limits each issue to 2% of the index. Benchmark returns assume reinvestment of distributions, but do not reflect any applicable sales charges or management fees. |
| ∎ | | Duration: Duration is a measure of the expected period over which a bond’s principal and interest will be paid, and consequently is a measure of the sensitivity of a bond’s or bond fund’s value to changes when market interest rates change. Generally, the longer a bond’s or fund’s duration, the more the price of the bond or fund will change as interest rates change. |
| ∎ | | Effective Leverage: Effective leverage is a fund’s effective economic leverage, and includes both regulatory leverage (see below) and the leverage effects of certain derivative investments in the fund’s portfolio. |
| ∎ | | Leverage: Leverage is created whenever a fund has investment exposure (both reward and/or risk) equivalent to more than 100% of the investment capital. |
| ∎ | | Net Asset Value (NAV) Per Share: A fund’s Net Assets is equal to its total assets (securities, cash, accrued earnings and receivables) less its total liabilities. NAV per share is equal to the fund’s Net Assets divided by its number of shares outstanding. |
| ∎ | | Regulatory Leverage: Regulatory leverage consists of preferred shares issued by or borrowings of a fund. Both of these are part of a fund’s capital structure. Regulatory leverage is subject to asset coverage limits set in the Investment Company Act of 1940. |
69
Reinvest Automatically, Easily and Conveniently
Nuveen makes reinvesting easy. A phone call is all it takes to set up your reinvestment account.
Nuveen Closed-End Funds Automatic Reinvestment Plan
Your Nuveen Closed-End Fund allows you to conveniently reinvest distributions in additional Fund shares.
By choosing to reinvest, you’ll be able to invest money regularly and automatically, and watch your investment grow through the power of compounding. Just like distributions in cash, there may be times when income or capital gains taxes may be payable on distributions that are reinvested.
It is important to note that an automatic reinvestment plan does not ensure a profit, nor does it protect you against loss in a declining market.
Easy and convenient
To make recordkeeping easy and convenient, each quarter you’ll receive a statement showing your total distributions, the date of investment, the shares acquired and the price per share, and the total number of shares you own.
How shares are purchased
The shares you acquire by reinvesting will either be purchased on the open market or newly issued by the Fund. If the shares are trading at or above net asset value at the time of valuation, the Fund will issue new shares at the greater of the net asset value or 95% of the then-current market price. If the shares are trading at less than net asset value, shares for your account will be purchased on the open market. If the Plan Agent begins purchasing Fund shares on the open market while shares are trading below net asset value, but the Fund’s shares subsequently trade at or above their net asset value before the Plan Agent is able to complete its purchases, the Plan Agent may cease open-market purchases and may invest the uninvested portion of the distribution in newly-issued Fund shares at a price equal to the greater of the shares’ net asset value or 95% of the shares’ market value on the last business day immediately prior to the purchase date. Distributions received to purchase shares in the open market will normally be invested shortly after the distribution payment date. No interest will be paid on distributions awaiting reinvestment. Because the market price of the shares may increase before purchases are completed, the average purchase price per share may exceed the market price at the time of valuation, resulting in the acquisition of fewer shares than if the distribution had been paid in shares issued by the Fund. A pro rata portion of any applicable brokerage commissions on open market purchases will be paid by Plan participants. These commissions usually will be lower than those charged on individual transactions.
Flexible
You may change your distribution option or withdraw from the Plan at any time, should your needs or situation change.
You can reinvest whether your shares are registered in your name, or in the name of a brokerage firm, bank, or other nominee. Ask your investment advisor if his or her firm will participate on your behalf. Participants whose shares are registered in the name of one firm may not be able to transfer the shares to another firm and continue to participate in the Plan.
The Fund reserves the right to amend or terminate the Plan at any time. Although the Fund reserves the right to amend the Plan to include a service charge payable by the participants, there is no direct service charge to participants in the Plan at this time.
Call today to start reinvesting distributions
For more information on the Nuveen Automatic Reinvestment Plan or to enroll in or withdraw from the Plan, speak with your financial advisor or call us at (800) 257-8787.
70
Annual Investment Management Agreement Approval Process
(Unaudited)
NUVEEN HIGH INCOME 2020 TARGET TERM FUND (JHY)
NUVEEN HIGH INCOME DECEMBER 2019 TARGET TERM FUND (JHD)
NUVEEN HIGH INCOME NOVEMBER 2021 TARGET TERM FUND (JHB)
NUVEEN HIGH INCOME 2023 TARGET TERM FUND (JHAA)
The Board of Trustees (the“Board,” and each Trustee, a“Board Member”) of a Nuveen fund, including the Board Members who are not “interested persons” (as defined under the Investment Company Act of 1940 (the“1940 Act”)) (the“Independent Board Members”), is responsible for determining whether to initially approve or, after an initial term, to renew, such fund’s advisory agreements. A discussion of the Board’s approval of the renewal of the advisory arrangements for Nuveen High Income 2020 Target Term Fund (the“2020 Target Term Fund”), Nuveen High Income December 2019 Target Term Fund (the“2019 Target Term Fund”) and Nuveen High Income November 2021 Target Term Fund (the“2021 Target Term Fund”) is set forth below. The advisory arrangements for Nuveen High Income 2023 Target Term Fund (the“2023 Target Term Fund”) have not yet been up for renewal. A discussion of the Board’s initial approval of the advisory arrangements for the 2023 Target Term Fund is set forth in such fund’s December 31, 2018 annual report.
2020 TARGET TERM FUND
2019 TARGET TERM FUND
2021 TARGET TERM FUND
At a meeting held onMay 21-23, 2019 (the“May Meeting”), the Board of each of the 2020 Target Term Fund, the 2019 Target Term Fund and the 2021 Target Term Fund (for purposes of this discussion each, a“Fund” and collectively, the“Funds”), including the Independent Board Members, approved, for its respective Fund, the renewal of the management agreement (each, an“Investment Management Agreement”) with Nuveen Fund Advisors, LLC (the“Adviser”) pursuant to which the Adviser serves as investment adviser to such Fund and thesub-advisory agreement (each, a“Sub-Advisory Agreement”) with Nuveen Asset Management, LLC (the“Sub-Adviser”) pursuant to which the Sub-Adviser serves as thesub-adviser to such Fund. Following an initialtwo-year period, the Board, including the Independent Board Members, is required under the 1940 Act to review and approve each Investment Management Agreement andSub-Advisory Agreement on behalf of the applicable Fund on an annual basis. The Investment Management Agreements andSub-Advisory Agreements are collectively referred to as the“Advisory Agreements” and the Adviser and theSub-Adviser are collectively, the“Fund Advisers” and each, a“Fund Adviser.”
In response to a request on behalf of the Independent Board Members by independent legal counsel, the Board received and reviewed prior to the May Meeting extensive materials specifically prepared for the annual review of Advisory Agreements by the Adviser as well as by Broadridge Financial Solutions, Inc. (“Broadridge”), an independent provider of investment company data. The materials provided in connection with the annual review covered a breadth of subject matter including, but not limited to, a description of the nature, extent and quality of services provided by the Fund Advisers; a review of theSub-Adviser and investment team; an analysis of fund performance in absolute terms and as compared to the performance of certain peer funds and benchmarks with a focus on any performance outliers; an analysis of the fees and expense ratios of the Nuveen funds in absolute terms and as compared to those of certain peer funds with a focus on any expense outliers; a description of portfolio manager compensation; a review of the secondary market trading of shares of the Nuveenclosed-end funds (including, among other things, an analysis of performance, distribution and valuation and capital raising trends in the broaderclosed-end fund market and in particular with respect to Nuveenclosed-end funds; a review of the leverage management actions taken on behalf of the Nuveenclosed-end funds and their resulting impact on performance; and a description of the distribution management process and any capital management activities); a review of the performance of various service providers; a description of various initiatives Nuveen had undertaken or continued during the year for the benefit of particular fund(s) and/or the complex; a description of the profitability or financial data of Nuveen and theSub-Adviser; and a description of indirect benefits received by the Fund Advisers as a result of their relationships with the Nuveen funds. The Board Members held anin-person meeting on
71
Annual Investment Management Agreement Approval Process(continued)
(Unaudited)
April 17-18, 2019 (the“April Meeting”), in part, to review and discuss the performance of the Nuveen funds and the Adviser’s evaluation of the varioussub-advisers to the Nuveen funds. The Independent Board Members asked questions and requested additional information that was provided for the May Meeting.
The information prepared specifically for the annual review of the Advisory Agreements supplemented the information provided to the Board and its committees throughout the year. The Board and its committees met regularly during the year and the information provided and topics discussed were relevant to the review of the Advisory Agreements. Some of these reports and other data included, among other things, materials that outlined the investment performance of the Nuveen funds; strategic plans of the Adviser which may impact the services it provides to the Nuveen funds; the review of the Nuveen funds and applicable investment teams; the management of leverage financing forclosed-end funds; the secondary market trading of theclosed-end funds and any actions to address discounts; compliance, regulatory and risk management matters; the trading practices of the varioussub-advisers; valuation of securities; fund expenses; and overall market and regulatory developments. The Board further continued its practice of seeking to meet periodically with the varioussub-advisers to the Nuveen funds and their investment teams, when feasible. The Independent Board Members considered the review of the Advisory Agreements to be an ongoing process and employed the accumulated information, knowledge, and experience the Board Members had gained during their tenure on the boards governing the Nuveen funds and working with the Fund Advisers in their review of the Advisory Agreements. The contractual arrangements are a result of multiple years of review, negotiation and information provided in connection with the boards’ annual review of the Nuveen funds’ advisory arrangements and oversight of the Nuveen funds.
The Independent Board Members were advised by independent legal counsel during the annual review process as well as throughout the year, including meeting in executive sessions with such counsel at which no representatives from the Adviser or theSub-Adviser were present. In connection with their annual review, the Independent Board Members also received a memorandum from independent legal counsel outlining their fiduciary duties and legal standards in reviewing the Advisory Agreements.
In deciding to renew the Advisory Agreements, the Independent Board Members did not identify a particular factor or information as determinative or controlling, but rather the decision reflected the comprehensive consideration of all the information provided, and each Board Member may have attributed different levels of importance to the various factors and information considered in connection with the approval process. The following summarizes the principal factors and information, but not all the factors, the Board considered in deciding to renew the Advisory Agreements and its conclusions.
| A. | | Nature, Extent and Quality of Services |
In evaluating the renewal of the Advisory Agreements, the Independent Board Members received and considered information regarding the nature, extent and quality of the applicable Fund Adviser’s services provided to the respective Fund with particular focus on the services and enhancements to such services provided during the last year. The Board recognized that the Adviser provides a comprehensive set of services necessary to operate the Nuveen funds in a highly regulated industry and noted that the scope of such services has expanded over the years as a result of regulatory, market and other developments, such as the development of the liquidity management program and expanded compliance programs. Some of the functions the Adviser is responsible for include, but are not limited to: product management (such as analyzing a fund’s position in the marketplace, setting dividends, preparing shareholder and intermediary communications and other due diligence support); investment oversight (such as analyzing fund performance,sub-advisers and investment teams and analyzing trade executions of portfolio transactions, soft dollar practices and securities lending activities); securities valuation services (such as executing the daily valuation process for portfolio securities and developing and recommending changes to valuation policies and procedures); risk management (such as overseeing operational and investment risks, including stress testing); fund administration (such as preparing fund tax returns and other tax compliance services, overseeing the Nuveen funds’ independent public accountants and other service providers; managing fund budgets and expenses; and helping to fulfill the funds’ regulatory filing requirements); oversight of shareholder services and transfer agency functions (such as oversight and liaison of transfer agent service providers which include registered shareholder customer service and transaction processing); Board relations services (such as organizing and administering Board and committee meetings, preparing various reports to the Board and committees and providing other support services); compliance and regulatory
72
oversight services (such as developing and maintaining a compliance program to ensure compliance with applicable laws and regulations, monitoring compliance with applicable fund policies and procedures and adherence to investment restrictions, and evaluating the compliance programs of the Nuveen fundsub-advisers and certain other service providers); legal support and oversight of outside law firms (such as with respect to filing and updating registration statements; maintaining various regulatory registrations; and providing legal interpretations regarding fund activities, applicable regulations and implementation of policies and procedures); and leverage, capital and distribution management services. In reviewing the scope and quality of services, the Board recognized the continued efforts and resources the Adviser and its affiliates have employed to continue to enhance their services for the benefit of the complex as well as particular Nuveen funds over recent years. Such service enhancements have included, but are not limited to:
| | • | | Fund Improvements and Product Management Initiatives – continuing to proactively manage the Nuveen fund complex as a whole and at the individual fund level with an aim to enhance the shareholder outcomes through, among other things, repositioning funds, merging funds, reviewing and updating investment policies and benchmarks, modifying the composition of certain portfolio management teams and analyzing various data to help devise such improvements; |
| | • | | Capital Initiatives – continuing to invest capital to support new funds with initial capital as well as to facilitate modifications to the strategies or structure of existing funds; |
| | • | | Compliance Program Initiatives – continuing efforts to enhance the compliance program through, among other things, internally integrating various portfolio management teams and aligning compliance support accordingly, completing a comprehensive review of existing policies and procedures and revising such policies and procedures as appropriate, enhancingcompliance-related technologies and workflows, and optimizing compliance shared services across the organization and affiliates; |
| | • | | Risk Management and Valuation Services – continuing efforts to strengthen the risk management functions, including through, among other things, enhancing the interaction and reporting between the investment risk management team and various affiliates, increasing the efficiency of risk monitoring performed on the Nuveen funds through improved reporting, continuing to implement risk programs designed to provide a more disciplined and consistent approach to identifying and mitigating operational risks, continuing progress on implementing a liquidity program that complies with the new liquidity regulatory requirements and continuing to oversee the daily valuation process; |
| | • | | Additional Compliance Services – continuing investment of time and resources necessary to develop the compliance policies and procedures and other related tools necessary to meet the various new regulatory requirements affecting the Nuveen funds that have been adopted over recent years; |
| | • | | Government Relations – continuing efforts of various Nuveen teams and affiliates to advocate and communicate their positions with lawmakers and other regulatory bodies on issues that will impact the Nuveen funds; |
| | • | | Business Continuity, Disaster Recovery and Information Services – establishing an information security program to help identify and manage information security risks, periodically testing disaster recovery plans, maintaining and updating business continuity plans and providing reports to the Board, at least annually, addressing, among other things, management’s security risk assessment, cyber risk profile, incident tracking and other relevant information technology risk-related reports; |
| | • | | Expanded Dividend Management Services – continuing to expand the services necessary to manage the dividends among the varying types of Nuveen funds that have developed as the Nuveen complex has grown in size and scope; and |
| | • | | with respect specifically toclosed-end funds, such initiatives also included: |
| | • | | Leverage Management Services – continuing to actively manage leverage including developing new leverage instruments, refinancing existing leverage and negotiating reductions in associated leverage expenses; |
| | • | | Capital Management Services – ongoing capital management efforts through a share repurchase program as well as a shelf offering program that raises additional equity capital in seeking to enhance shareholder value; |
73
Annual Investment Management Agreement Approval Process(continued)
(Unaudited)
| | • | | Data and Market Analytics – continuing focus on analyzing data and market analytics to better understand the ownership cycles and secondary market experience ofclosed-end funds; and |
| | • | | Closed-end Fund Investor Relations Program – maintaining theclosed-end fund investor relations program which, among other things, raises awareness, provides educational materials and cultivates advocacy forclosed-end funds and the Nuveenclosed-end fund product line. |
In addition to the services provided by the Adviser, the Board also considered the risks borne by the Adviser and its affiliates in managing the Nuveen funds, including entrepreneurial, operational, reputational, regulatory and litigation risks.
The Board further considered the division of responsibilities between the Adviser and theSub-Adviser and recognized that theSub-Adviser and its investment personnel generally are responsible for the management of each Fund’s portfolio. The Board noted that the Adviser oversees theSub-Adviser and considered an analysis of theSub-Adviser provided by the Adviser which included, among other things, theSub-Adviser’s assets under management and changes thereto, a summary of the investment team and changes thereto, the investment approach of the team and the performance of the fundssub-advised by theSub-Adviser over various periods. The Board further considered at the May Meeting or prior meetings evaluations of theSub-Adviser’s compliance program and trade execution. The Board noted that the Adviser recommended the renewal of theSub-Advisory Agreements.
Based on its review, the Board determined, in the exercise of its reasonable business judgment, that it was satisfied with the nature, extent and quality of services provided to the respective Funds under each applicable Advisory Agreement.
| B. | | The Investment Performance of the Funds and Fund Advisers |
In evaluating the quality of the services provided by the Fund Advisers, the Board also received and considered the investment performance of the Nuveen funds they advise. In this regard, the Board reviewed Fund performance over the quarter,one- andthree-year periods ending December 31, 2018 (or for shorter periods available in the case of Funds that were not in existence for part of the foregoing timeframe) as well as performance data for the first quarter of 2019 ending March 29, 2019. Unless otherwise indicated, the performance data referenced below reflects the periods ended December 31, 2018. The Board considered the Adviser’s analysis of each fund’s performance, with particular focus on funds that were considered performance outliers and the factors contributing to their performance. The Board also noted that it received performance data of the Nuveen funds during its quarterly meetings throughout the year and took into account the discussions that occurred at these Board meetings regarding fund performance. In this regard, in its evaluation of Nuveen fund performance at meetings throughout the year, the Board considered performance information for the funds for different time periods, both absolute and relative to appropriate benchmarks and peers, with particular attention to information indicating underperformance of the respective funds and discussed with the Adviser the reasons for such underperformance.
The Board reviewed both absolute and relative fund performance during the annual review. With respect to the latter, the Board considered fund performance in comparison to the performance of peer funds (the“Performance Peer Group”) and recognized and/or customized benchmarks (i.e., generally benchmarks derived from multiple recognized benchmarks). In considering performance data, the Board is aware of certain inherent limitations with such data, including that differences between the objective(s), strategies and other characteristics of the Nuveen funds compared to the respective Performance Peer Group and/or benchmark(s) (such as differences in the use of leverage) will necessarily contribute to differences in performance results and limit the value of the comparative information. To assist the Board in its review of the comparability of the relative performance, the Adviser has ranked the relevancy of the peer group to the funds as low, medium or high. Depending on the facts and circumstances, however, the Board may be satisfied with a fund’s performance notwithstanding that its performance may be below its benchmark or peer group for certain periods. In addition, the performance data may vary significantly depending on the end date selected, and shareholders may evaluate fund performance based on their own holding period which may differ from the performance periods reviewed by the Board leading to different results. Further, the Board considered a fund’s performance in light of the overall financial market conditions during the respective periods. As noted above, the Board reviewed, among other things, Nuveen fund performance over various periods ended December 31, 2018, and the Board was aware of the market decline in the fourth quarter of 2018 and considered performance from the first quarter of 2019 as well. The Board also noted that a shorter period of underperformance may significantly impact longer term performance.
74
In addition to the foregoing, the Board recognized the importance of secondary market trading to shareholders and considered the evaluation of premiums and discounts at which the shares of the Nuveenclosed-end funds trade to be a continuing priority for the Board. The Board and/or itsClosed-end Fund committee consider premium and discount data at each quarterly meeting throughout the year as well as during the annual review.
In their review of performance, the Independent Board Members focused, in particular, on the Adviser’s analysis of Nuveen funds determined to be underperforming performance outliers. The Board recognized that some periods of underperformance may only be temporary while other periods of underperformance may indicate a broader issue that may require a corrective action. Accordingly, with respect to any Nuveen funds for which the Board had identified performance issues, the Board monitors such funds closely until performance improves, discusses with the Adviser the reasons for such results, considers whether any steps are necessary or appropriate to address such issues, and reviews the results of any efforts undertaken.
The Board’s determinations with respect to each Fund are summarized below.
For the 2020 Target Term Fund, the Board noted that the Fund ranked in the first quartile of its Performance Peer Group in theone-year period and second quartile in thethree-year period. The Fund also outperformed its benchmark during these periods. In its review, the Board noted that the Performance Peer Group was classified as low for relevancy. The Board also recognized that the Fund was a target term fund with investment objectives which seek to provide a high level of current income and to return its original net asset value per common share on or about its termination date. The Board noted that as of March 31, 2019, the Fund was on track to return the original net asset value to investors and provided current income consistent with expectations. The Board was satisfied with the Fund’s overall performance.
For the 2019 Target Term Fund, the Board recognized that the Fund ranked in the first quartile of its Performance Peer Group in theone-year period and outperformed its benchmark during this period. In its review, the Board recognized that the Performance Peer Group was classified as low for relevancy. The Board further recognized that the Fund was a target term fund with investment objectives which seek to provide a high level of current income and to return its original net asset value per common share on or about its termination date. The Board noted that as of March 31, 2019, the Fund was on track to return the original net asset value to investors and provided current income consistent with expectations. The Board also considered that the Fund was relatively new with only a limited performance history available, limiting the ability to make a meaningful assessment of performance. Nevertheless, the Board was satisfied with the Fund’s overall performance.
For the 2021 Target Term Fund, the Board recognized that although the Fund’s performance was below the performance of its benchmark in theone-year period, the Fund ranked in the first quartile of its Performance Peer Group for such period. In its review, the Board recognized that the Performance Peer Group was classified as low for relevancy. The Board further recognized that the Fund was a target term fund with investment objectives which seek to provide a high level of current income and to return its original net asset value per common share on or about its termination date. The Board noted that as of March 31, 2019, the Fund was on track to return the original net asset value to investors and provided current income consistent with expectations. The Board also considered that the Fund was relatively new with only a limited performance history available, limiting the ability to make a meaningful assessment of performance. Nevertheless, the Board was satisfied with the Fund’s overall performance.
| C. | | Fees, Expenses and Profitability |
In its annual review, the Board considered the fees paid to the Fund Advisers and the total operating expense ratio of each Nuveen fund. More specifically, the Independent Board Members reviewed, among other things, each fund’s gross and net management fee rates and net total expense ratio in relation to those of a comparable universe of funds (the“Peer Universe”) established by Broadridge. The Independent Board Members reviewed the methodology Broadridge employed to establish its Peer Universe and recognized that differences between the applicable fund and its respective Peer Universe as well as changes to the composition of the Peer Universe from year to year may limit some of the value of the comparative data. The Independent Board Members also considered a fund’s operating expense ratio as it more directly reflected the shareholder’s costs in investing in the respective fund.
75
Annual Investment Management Agreement Approval Process(continued)
(Unaudited)
In their review, the Independent Board Members considered, in particular, each fund with a net expense ratio (excluding investment-related costs of leverage) of six basis points or higher compared to that of its peer average (each, an“Expense Outlier Fund”), and an analysis as to the factors contributing to each such fund’s higher relative net expense ratio. In addition, although the Board reviewed a fund’s total net expenses both including and excludinginvestment-related expenses (i.e., leverage costs) and taxes for certain of theclosed-end funds, the Board recognized that leverage expenses will vary across the Nuveen funds and in comparison to peers because of differences in the forms and terms of leverage employed by the respective fund. Accordingly, in reviewing the comparative data between a fund and its peers, the Board generally considered the fund’s net expense ratio and fees (excluding leverage costs and leveraged assets) to be higher if they were over 10 basis points higher, slightly higher if they were 6 to 10 basis points higher, in line if they were within approximately 5 basis points higher than the peer average and below if they were below the peer average of the Peer Universe. The Independent Board Members also considered, in relevant part, a fund’s net management fee and net total expense ratio in light of its performance history.
In their review of the fee arrangements for the Nuveen funds, the Independent Board Members considered the management fee schedules, including thecomplex-wide andfund-level breakpoint schedules, as applicable. The Board noted that across the Nuveen fund complex, the complex-wide fee breakpoints reduced fees by $51.5 million and fund-level breakpoints reduced fees by $55.1 million in 2018.
With respect to theSub-Adviser, the Board considered thesub-advisory fee paid to theSub-Adviser, including any breakpoint schedule, and as described below, comparative data of the fees theSub-Adviser charges to other clients, if any.
The Independent Board Members noted that the Funds each had a net management fee and a net expense ratio below the respective peer averages. Based on its review of the information provided, the Board determined that each Fund’s management fees (as applicable) to a Fund Adviser were reasonable in light of the nature, extent and quality of services provided to the Fund.
| | 2. | | Comparisons with the Fees of Other Clients |
In determining the appropriateness of fees, the Board also reviewed information regarding the fee rates the respective Fund Advisers charged to certain other types of clients and the type of services provided to these other clients. For the Adviser and/or theSub-Adviser, such other clients may include retail and institutional managed accounts;sub-advised funds outside the Nuveen family; foreign investment companies offered by Nuveen; and collective investment trusts. The Board further noted that the Adviser also advised certain exchange-traded funds (“ETFs”) sponsored by Nuveen.
The Board recognized that each Fund had an affiliatedsub-adviser and, with respect to affiliatedsub-advisers, reviewed, among other things, the range of fees assessed for managed accounts and foreign investment companies offered by Nuveen. The Board also reviewed the fee range and average fee rate of certain selected investment strategies offered in retail and institutional managed accounts by theSub-Adviser and of thenon-Nuveen investment companiessub-advised by affiliatedsub-advisers.
In addition to the comparative fee data, the Board also reviewed, among other things, a description of the different levels of services provided to certain other clients compared to the services provided to the Nuveen funds as well as the differences in portfolio investment policies, investor profiles, account sizes and regulatory requirements, all of which contribute to the variations in the fee schedules. The Board noted, among other things, the wide range of services in addition to investment management services provided to the Nuveen funds when the Adviser is principally responsible for all aspects of operating the funds, including the increased regulatory requirements that must be met in managing the funds, the larger account sizes of managed accounts and the increased entrepreneurial, legal and regulatory risks that the Adviser incurs in sponsoring and managing the funds. Further, with respect to ETFs, the Board considered that Nuveen ETFs are passively managed compared to the active management of other Nuveen funds which contributed to the differences in fee levels between the Nuveen ETFs and other Nuveen funds. In general, higher fee levels reflect higher levels of service provided by the Adviser, increased investment management complexity, greater product management requirements, and higher levels of business risk or some combination of these factors. The Board further considered that theSub-Adviser’s fee is essentially for portfolio management services and therefore more comparable to the fees it receives for retail wrap accounts and other externalsub-advisory
76
mandates. The Board concluded the varying levels of fees were justified given, among other things, the inherent differences in the products and the level of services provided to the Nuveen funds versus other clients, the differing regulatory requirements and legal liabilities and the entrepreneurial, legal and regulatory risks incurred in sponsoring and advising a registered investment company.
| | 3. | | Profitability of Fund Advisers |
In conjunction with their review of fees, the Independent Board Members considered information regarding Nuveen’s level of profitability for its advisory services to the Nuveen funds for the calendar years 2018 and 2017. The Board reviewed, among other things, Nuveen’s net margins(pre-tax) (both including and excluding distribution expenses); gross and net revenue margins(pre- andpost-tax); revenues, expenses, and net income(pre-tax andafter-tax and before distribution) of Nuveen for fund advisory services; and comparative profitability data comparing the adjusted margins of Nuveen compared to the adjusted margins of certain peers with publicly available data and with the most comparable assets under management (based on asset size and asset composition) for each of the last two calendar years. The Board also reviewed the revenues and expenses the Adviser derived from its ETF product line that was launched in 2016. The Independent Board Members noted that Nuveen’s net margins were higher in 2018 than the previous year and considered the key drivers behind the revenue and expense changes that impacted Nuveen’s net margins between the years. The Board considered the costs of investments in the Nuveen business, including the investment of seed capital in certain Nuveen funds and additional investments in infrastructure and technology. The Independent Board Members also noted that Nuveen’s adjusted margins from its relationships with the Nuveen funds were on the low range compared to the adjusted margins of the peers; however, the Independent Board Members recognized the inherent limitations of the comparative data of other publicly traded peers given that the calculation of profitability is rather subjective and numerous factors (such as types of funds, business mix, cost of capital, methodology to allocate expenses and other factors) can have a significant impact on the results.
The Independent Board Members also reviewed a description of the expense allocation methodology employed to develop the financial information and a summary of the history of changes to the methodology over theten-year period from 2008 to 2018, and recognized that other reasonable allocation methodologies could be employed and lead to significantly different results. The Board noted that two Independent Board Members, along with independent counsel, serve as the Board’s liaisons to review profitability and discuss any proposed changes to the methodology prior to the full Board’s review.
Aside from Nuveen’s profitability, the Board recognized that the Adviser is a subsidiary of Nuveen, LLC, the investment management arm of Teachers Insurance and Annuity Association of America (“TIAA”). As such, the Board also reviewed a balance sheet for TIAA reflecting its assets, liabilities and capital and contingency reserves for the 2018 and 2017 calendar years to consider the financial strength of TIAA having recognized the importance of having an adviser with significant resources.
In addition to Nuveen, the Independent Board Members also considered the profitability of theSub-Adviser from its relationships with the Nuveen funds. In this regard, the Independent Board Members reviewed theSub-Adviser’s revenues, expenses and revenue margins(pre- andpost-tax) for its advisory activities for the calendar year ended December 31, 2018. The Independent Board Members also reviewed a profitability analysis reflecting the revenues, expenses and revenue margin(pre- andpost-tax) by asset type for theSub-Adviser for the calendar year ending December 31, 2018 and thepre- andpost-tax revenue margin from 2018 and 2017.
In evaluating the reasonableness of the compensation, the Independent Board Members also considered any other ancillary benefits derived by the respective Fund Adviser from its relationship with the Nuveen funds as discussed in further detail below.
Based on a consideration of all the information provided, the Board noted that Nuveen’s and theSub-Adviser’s level of profitability was acceptable and not unreasonable in light of the services provided.
| D. | | Economies of Scale and Whether Fee Levels Reflect These Economies of Scale |
With respect to economies of scale, the Independent Board Members noted that although economies of scale are difficult to measure, the Adviser shares the benefits of economies of scale in various ways including breakpoints in the management fee
77
Annual Investment Management Agreement Approval Process(continued)
(Unaudited)
schedule (subject to limited exceptions), fee waivers and/or expense limitations, the pricing of Nuveen funds at scale at inception and investments in its business which can enhance the services provided to the funds for the fees paid. With respect to breakpoint schedules, because the Board had previously recognized that economies of scale may occur not only when the assets of a particular Nuveen fund grow but also when the assets in the complex grow, the Nuveen funds generally pay the Adviser a management fee comprised of afund-level component and acomplex-level component each with its own breakpoint schedule, subject to certain exceptions. In general terms, the breakpoint schedule at the fund level reduces fees as assets in the particular fund pass certain thresholds and the breakpoint schedule at the complex level reduces fees on the Nuveen funds as the eligible assets in the complex pass certain thresholds. The Independent Board Members reviewed, among other things, the fund-level and complex-level fee schedules. With respect to the Nuveenclosed-end funds, the Independent Board Members noted that, although such funds may fromtime-to-time make additional share offerings, the growth of their assets would occur primarily through the appreciation of such funds’ investment portfolios.
In addition, the Independent Board Members recognized the Adviser’s continued reinvestment in its business through, among other things, investments in its business infrastructure and information technology, portfolio accounting system as well as other systems and platforms that will, among other things, support growth, simplify and enhance information sharing, and enhance the investment process to the benefit of all of the Nuveen funds.
Based on its review, the Board concluded that the current fee arrangements together with the Adviser’s reinvestment in its business appropriately shared any economies of scale with shareholders.
The Independent Board Members received and considered information regarding other benefits the respective Fund Adviser or its affiliates may receive as a result of their relationship with the Nuveen funds. The Board considered that an affiliate of the Adviser serves asco-manager in the initial public offerings of newclosed-end funds for which it may receive revenue and serves as an underwriter on shelf offerings of existingclosed-end funds for which it receives compensation. In addition, the Independent Board Members also noted that theSub-Adviser engages in soft dollar transactions pursuant to which it may receive the benefit of research products and other services provided by broker-dealers executing portfolio transactions on behalf of the applicable Nuveen funds.
The Board, however, noted that the benefits for theSub-Adviser when transacting in fixed-income securities may be more limited as such securities generally trade on a principal basis and therefore do not generate brokerage commissions. Further, the Board noted that although theSub-Adviser may benefit from the receipt of research and other services that it may otherwise have to pay for out of its own resources, the research may also benefit the Nuveen funds to the extent it enhances the ability of theSub-Adviser to manage such funds or is acquired through the commissions paid on portfolio transactions of other clients.
Based on their review, the Board concluded that any indirect benefits received by a Fund Adviser as a result of its relationship with the Funds were reasonable and within acceptable parameters.
The Board Members did not identify any single factor discussed previously asall-important or controlling. The Board Members, including the Independent Board Members, concluded that the terms of each Advisory Agreement were fair and reasonable, that the respective Fund Adviser’s fees were reasonable in light of the services provided to each Fund and that the Advisory Agreements be renewed.
78
Notes
79
Nuveen:
Serving Investors for Generations
Since 1898, financial advisors and their clients have relied on Nuveen to provide
dependable investment solutions through continued adherence to proven, long-term investing
principles. Today, we offer a range of high quality solutions designed to
be integral components of a well-diversified core portfolio.
Focused on meeting investor needs.
Nuveen is the investment manager of TIAA. We have grown into one of the world’s premier global asset managers, with specialist knowledge across all major asset classes and particular strength in solutions that provide income for investors and that draw on our expertise in alternatives and responsible investing. Nuveen is driven not only by the independent investment processes across the firm, but also the insights, risk management, analytics and other tools and resources that a truly world-class platform provides. As a global asset manager, our mission is to work in partnership with our clients to create solutions which help them secure their financial future.
Find out how we can help you.
To learn more about how the products and services of Nuveen may be able to help you meet your financial goals, talk to your financial advisor, or call us at(800) 257-8787. Please read the information provided carefully before you invest. Investors should consider the investment objective and policies, risk considerations, charges and expenses of any investment carefully. Where applicable, be sure to obtain a prospectus, which contains this and other relevant information. To obtain a prospectus, please contact your securities representative or Nuveen, 333 W. Wacker Dr., Chicago, IL 60606. Please read the prospectus carefully before you invest or send money.
Learn more about Nuveen Funds at:www.nuveen.com/closed-end-funds
| | | | |
| Nuveen Securities, LLC, member FINRA and SIPC | 333 West Wacker Drive Chicago, IL 60606 | www.nuveen.com | | | | ESA-J-0619D 915396-INV-B-08/20 |
Item 2. Code of Ethics.
Not applicable to this filing.
Item 3. Audit Committee Financial Expert.
Not applicable to this filing.
Item 4. Principal Accountant Fees and Services.
Not applicable to this filing.
Item 5. Audit Committee of Listed Registrants.
Not applicable to this filing.
Item 6. Schedule of Investments.
(a) See Portfolio of Investments in Item 1.
(b) Not applicable.
Item 7. Disclosure of Proxy Voting Policies and Procedures for Closed-End Management Investment Companies.
Not applicable to this filing.
Item 8. Portfolio Managers of Closed-End Management Investment Companies.
Not applicable to this filing.
Item 9. Purchases of Equity Securities by Closed-End Management Investment Company and Affiliated Purchasers.
Not applicable.
Item 10. Submission of Matters to a Vote of Security Holders.
There have been no material changes to the procedures by which shareholders may recommend nominees to the registrant’s Board implemented after the registrant last provided disclosure in response to this item.
Item 11. Controls and Procedures.
| (a) | The registrant’s principal executive and principal financial officers, or persons performing similar functions, have concluded that the registrant’s disclosure controls and procedures (as defined in Rule 30a-3(c) under the Investment Company Act of 1940, as amended (the “1940 Act”) (17 CFR 270.30a-3(c))) are effective, as of a date within 90 days of the filing date of this report that includes the disclosure required by this paragraph, based on their evaluation of the controls and procedures required by Rule 30a-3(b) under the 1940 Act (17 CFR 270.30a-3(b)) and Rules 13a-15(b) or 15d-15(b) under the Securities Exchange Act of 1934, as amended (the “Exchange Act”) (17 CFR 240.13a-15(b) or 240.15d-15(b)). |
| (b) | There were no changes in the registrant’s internal control over financial reporting (as defined in Rule 30a-3(d) under the 1940 Act (17 CFR 270.30a-3(d)) that occurred during the period covered by this report that has materially affected, or is reasonably likely to materially affect, the registrant’s internal control over financial reporting. |
Item 12. Disclosure of Securities Lending Activities for Closed-End Management Investment Companies.
Not applicable.
Item 13. Exhibits.
File the exhibits listed below as part of this Form.
(a)(1) Any code of ethics, or amendment thereto, that is the subject of the disclosure required by Item 2, to the extent that the registrant intends to satisfy the Item 2 requirements through filing of an exhibit: Not applicable to this filing.
(a)(2) A separate certification for each principal executive officer and principal financial officer of the registrant as required by Rule 30a-2(a) under the 1940 Act (17 CFR 270.30a-2(a)) in the exact form set forth below: See EX-99.CERT attached hereto.
(a)(3) Any written solicitation to purchase securities under Rule 23c-1 under the 1940 Act (17 CFR 270.23c-1) sent or given during the period covered by the report by or on behalf of the registrant to 10 or more persons: Not applicable.
(a)(4) Change in the registrant’s independent public accountant. Not applicable.
(b) If the report is filed under Section 13(a) or 15(d) of the Exchange Act, provide the certifications required by Rule 30a-2 (b) under the 1940 Act (17 CFR 270.30a-2(b)), Rule 13a-14(b) or Rule 15d-14(b) under the Exchange Act (17 CFR 240.13a-14(b) or 240.15d-14(b)), and Section 1350 of Chapter 63 of Title 18 of the United States Code (18 U.S.C. 1350) as an Exhibit. A certification furnished pursuant to this paragraph will not be deemed “filed” for purposes of Section 18 of the Exchange Act (15 U.S.C. 78r), or otherwise subject to the liability of that section. Such certification will not be deemed to be incorporated by reference into any filing under the Securities Act of 1933 or the Exchange Act, except to the extent that the registration specifically incorporates it by reference: See EX-99.906 CERT attached hereto.
SIGNATURES
Pursuant to the requirements of the Securities Exchange Act of 1934 and the Investment Company Act of 1940, the registrant has duly caused this report to be signed on its behalf by the undersigned, thereunto duly authorized.
(Registrant) Nuveen High Income November 2021 Target Term Fund
| | | | |
| By (Signature and Title) | | /s/ Gifford R. Zimmerman | | |
| | Gifford R. Zimmerman | | |
| | Vice President and Secretary | | |
Date: September 5, 2019
Pursuant to the requirements of the Securities Exchange Act of 1934 and the Investment Company Act of 1940, this report has been signed below by the following persons on behalf of the registrant and in the capacities and on the dates indicated.
| | | | |
| By (Signature and Title) | | /s/ Cedric H. Antosiewicz | | |
| | Cedric H. Antosiewicz | | |
| | Chief Administrative Officer | | |
| | (principal executive officer) | | |
Date: September 5, 2019
| | | | |
| By (Signature and Title) | | /s/ E. Scott Wickerham | | |
| | E. Scott Wickerham | | |
| | Vice President and Controller | | |
| | (principal financial officer) | | |
Date: September 5, 2019