UNITED STATES
SECURITIES AND EXCHANGE COMMISSION
Washington, D.C. 20549
FORM N-CSR
CERTIFIED SHAREHOLDER REPORT OF REGISTERED
MANAGEMENT INVESTMENT COMPANIES
| | |
| Investment Company Act file number | | 811-23075 |
Nuveen High Income November 2021 Target Term Fund
(Exact name of registrant as specified in charter)
Nuveen Investments
333 West Wacker Drive, Chicago, IL 60606
(Address of principal executive offices) (Zip code)
Gifford R. Zimmerman
Nuveen Investments
333 West Wacker Drive, Chicago, IL 60606
(Name and address of agent for service)
Registrant’s telephone number, including area code: (312) 917-7700
Date of fiscal year end: December 31
Date of reporting period: June 30, 2018
Form N-CSR is to be used by management investment companies to file reports with the Commission not later than 10 days after the transmission to stockholders of any report that is required to be transmitted to stockholders under Rule 30e-1 under the Investment Company Act of 1940 (17 CFR 270.30e-1). The Commission may use the information provided on Form N-CSR in its regulatory, disclosure review, inspection, and policy making roles.
A registrant is required to disclose the information specified by Form N-CSR, and the Commission will make this information public. A registrant is not required to respond to the collection of information contained in Form N-CSR unless the Form displays a currently valid Office of Management and Budget (“OMB”) control number. Please direct comments concerning the accuracy of the information collection burden estimate and any suggestions for reducing the burden to Secretary, Securities and Exchange Commission, 450 Fifth Street, NW, Washington, DC 20549-0609. The OMB has reviewed this collection of information under the clearance requirements of 44 U.S.C. ss.3507.
ITEM 1. REPORTS TO STOCKHOLDERS.

Closed-End Funds
30 June 2018
Nuveen Closed-End Funds
| | |
| JHY | | Nuveen High Income 2020 Target Term Fund |
| JHD | | Nuveen High Income December 2019 Target Term Fund |
| JHA | | Nuveen High Income December 2018 Target Term Fund |
| JHB | | Nuveen High Income November 2021 Target Term Fund |
Semiannual Report
Life is Complex
Nuveen makes things e-simple.
It only takes a minute to sign up for e-Reports. Once enrolled, you’ll receive an e-mail as soon as your Nuveen Fund information is ready—no more waiting for delivery by regular mail. Just click on the link within the e-mail to see the report and save it on your computer if you wish.
Free e-Reports right to your email!
www.investordelivery.com
If you receive your Nuveen Fund dividends and statements from your financial advisor or brokerage account.
or
www.nuveen.com/client-access
If you receive your Nuveen Fund dividends and statements directly from Nuveen.
Table of Contents
3
Chairman’s Letter to Shareholders
Dear Shareholders,
I am honored to serve as the new independent chairman of the Nuveen Fund Board, effective July 1, 2018. I’d like to gratefully acknowledge the stewardship of my predecessor William J. Schneider and, on behalf of my fellow Board members, reinforce our commitment to the legacy of strong, independent oversight of your Funds.
The increase in market volatility this year reflects greater uncertainty among investors. The global economic outlook is less clear cut than it was in 2017. U.S. growth is again decoupling from that of the rest of the world, and the U.S. dollar and interest rates have risen in response. Trade concern rhetoric and the imposition of tariffs between the U.S. and its major trading partners has recently dampened business sentiment and could pose a risk to growth expectations going forward. A host of other geopolitical concerns, including the ongoing Brexit and North American Free Trade Agreement negotiations, North Korea relations and rising populism around the world, remain on the horizon.
Despite these risks, global growth remains intact, albeit at a slower pace, providing support to corporate earnings. Fiscal stimulus, an easing regulatory environment and robust consumer spending recently helped boost the U.S. economy’s momentum. Subdued inflation pressures have kept central bank policy accommodative, even as Europe moves closer to winding down its monetary stimulus and the Federal Reserve remains on a moderate tightening course.
Headlines and political noise will continue to obscure underlying fundamentals at times and cause temporary bouts of volatility. We encourage you to work with your financial advisor to evaluate your goals, timeline and risk tolerance if short-term market fluctuations are a concern. On behalf of the other members of the Nuveen Fund Board, we look forward to continuing to earn your trust in the months and years ahead.
Sincerely,

Terence J. Toth
Chairman of the Board
August 24, 2018
4
Portfolio Managers’ Comments
Nuveen High Income 2020 Target Term Fund (JHY)
Nuveen High Income December 2019 Target Term Fund (JHD)
Nuveen High Income December 2018 Target Term Fund (JHA)
Nuveen High Income November 2021 Target Term Fund (JHB)
Nuveen High Income 2020 Target Term Fund (JHY), Nuveen High Income December 2019 Target Term Fund (JHD), Nuveen High Income December 2018 Target Term Fund (JHA), and Nuveen High Income November 2021 Target Term Fund (JHB) are closed-end funds that are advised by Nuveen Fund Advisors, LLC (NFAL) and feature portfolio management by Nuveen Asset Management, LLC (NAM). The Funds’ portfolio managers are John T. Fruit, CFA, and Jeffrey T. Schmitz, CFA.
On January 16, 2018, the Nuveen High Income December 2018 Target Term Fund (JHA) entered the wind-up period in anticipation of its termination date. The Fund is a “target term” Fund that will cease its investment operations and liquidate its portfolio on December 1, 2018 and distribute the net proceeds to shareholders, unless the term is extended for a period of up to six months by a vote of the Fund’s Board of Trustees.
During the wind-up period, the Fund may deviate from its investment objectives and policies, and may invest up to 100% of its managed assets in high quality, short-term securities. High quality, short-term securities for this Fund include securities rated investment grade (BBB-/Baa3 or higher or unrated but judged by the Fund’s subadviser to be of comparable quality) with a final or remaining maturity of 397 days or less. Consequently, for the remainder of its term, the Fund will invest at least 80% of its managed assets in below investment grade securities; and short-term investment grade securities that have a final or remaining maturity of 397 days or less, as long as the maturity does not occur later than June 1, 2019. These expanded investment parameters will provide the Fund with additional flexibility to reinvest the proceeds of matured or called portfolio securities in higher quality, short-term securities. As the Fund gets closer to its termination date, we will begin to transition its remaining below investment grade portfolio holdings to high quality, short-term securities to enhance its ability to efficiently liquidate its portfolio at termination.
Here the Funds’ portfolio management team discusses key investment strategies and the Fund’s performance for the six-month reporting period ended June 30, 2018.
This material is not intended to be a recommendation or investment advice, does not constitute a solicitation to buy or sell securities, and is not provided in a fiduciary capacity. The information provided does not take into account the specific objectives or circumstances of any particular investor, or suggest any specific course of action. Investment decisions should be made based on an investor’s objectives and circumstances and in consultation with his or her advisors.
Certain statements in this report are forward-looking statements. Discussions of specific investments are for illustration only and are not intended as recommendations of individual investments. The forward-looking statements and other views expressed herein are those of the portfolio managers as of the date of this report. Actual future results or occurrences may differ significantly from those anticipated in any forward-looking statements and the views expressed herein are subject to change at any time, due to numerous market and other factors. The Funds disclaim any obligation to update publicly or revise any forward-looking statements or views expressed herein.
For financial reporting purposes, the ratings disclosed are the highest rating given by one of the following national rating agencies: Standard & Poor’s (S&P), Moody’s Investors Service, Inc. (Moody’s) or Fitch, Inc. (Fitch). This treatment of split-rated securities may differ from that used for other purposes, such as for Fund investment policies. Credit ratings are subject to change. AAA, AA, A and BBB are investment grade ratings; BB, B, CCC, CC, C and D are below investment grade ratings. Holdings designated N/R are not rated by these national rating agencies.
Refer to the Glossary of Terms Used in this Report for further definition of the terms used within this section.
5
Portfolio Managers’ Comments (continued)
Nuveen High Income 2020 Target Term Fund (JHY)
What key strategies were used to manage the Fund during this six-month reporting period ended June 30, 2018?
The Fund has an objective to provide a high level of current income and to return the original $9.85 net asset value (NAV) per common share on or about November 1, 2020. The Fund will seek to achieve its investment objectives by investing primarily in shorter maturity, high yield (below investment grade) corporate debt securities. High yield bonds typically offer higher yields than investment grade bonds, in exchange for greater credit risk. Bonds with shorter maturities have lower duration (or interest rate sensitivity) than longer maturity bonds, which may help mitigate price declines if rates rise.
The Fund may invest in other types of securities including senior loans, convertible securities and other types of debt instruments and derivatives that provide comparable economic exposure to the corporate debt market. At least 80% of its managed assets will be in corporate debt securities and separately, at least 80% in securities that, at the time of investment, are rated below investment grade or are unrated but judged by the portfolio managers to be of comparable quality. No more than 15% will be in securities rated CCC+/Caa1 or lower at the time of investment. Up to 30% may be in securities of non-U.S. issuers, including up to 20% in emerging market issuers and up to 10% may be in non-U.S. dollar denominated securities.
The Fund seeks to identify securities across diverse sectors and industries that the managers believe are undervalued or mispriced. In seeking to return the original NAV on or about November 1, 2020, the Fund intends to utilize various portfolio and cash flow management techniques, including setting aside a portion of its net investment income, possibly retaining gains and limiting the longest maturity of any holding to no later than May 1, 2021. The Fund also uses leverage.
How did the Fund perform during this six-month reporting period ended June 30, 2018?
The table in the Performance Overview and Holding Summaries section of this report provides total return performance for the Fund for the six-month, one-year and since inception periods ended June 30, 2018. For the six-month reporting period ended June 30, 2018, the Fund underperformed the Bloomberg Barclays U.S. High Yield 1-5 Year Cash Pay 2% Issuer Capped Index based on the Fund’s total return at NAV.
High yield bonds traded in a fairly tight range during the first half of the reporting period, despite the mostly rate induced sell-off at the end of the first quarter. The yield for the benchmark index (as measured by yield-to-worst) bounced between 6.35% and 6.75% on the back of modest interest rate volatility and a generally supportive technical backdrop. After surging to more than 2.90% in mid-May, the 5-year Treasury yield rallied back to around 2.70% toward the end of the reporting period after the sell-off in emerging markets and slowing growth concerns in Europe and China created a bid for dollar assets. Strong U.S. economic and employment data was also supportive of U.S. corporate debt, easing spread pressure on high yield bonds.
Spreads for lower quality issues (CCCs) tightened modestly since the beginning of the reporting period due to improving fundamentals and less sensitivity to rates, while spreads for single-B and BB rated securities were marginally wider. This led to much better performance out of the CCC rated segment during the reporting period. However, the size of the CCC index has been shrinking since the bottom of the last credit cycle and represents just 14% of the high yield index, thereby making it hard for the segment to drive returns in the overall market.
Overall, thin supply, stabilizing fund flows and a small rally in rates helped high yield hold its ground in the face of escalating trade friction and deterioration of the global growth story. Demand for short-duration high yield also remained strong in the context of the Federal Reserve raising its expectations for the federal funds rate. Despite the shift in central bank policy that represents a reversal of the friendly monetary backdrop, the global yield environment has remained
6
under pressure from demand for yield outstripping supply. This backdrop has contributed to a period of heavy refinancing activity, due to the high level of portfolio securities being called or tendered as companies looked to take advantage of the strong credit environment and nominally low all-in yields to extend maturities.
The Fund seeks to protect against credit losses to help ensure the goal of returning its original NAV. While the Fund is designed to own more or less a static portfolio of high yield bonds, at times we have to add new securities to replace ones that have been called away or tendered. As we replace these bonds, we seek to maximize the Fund’s yield within the maturity, diversification and credit quality constraints described at the outset of the strategy. We may also look to maximize the Fund’s yield through opportunistic sales of securities that we believe have reached their upside potential, investing the proceeds in other securities that have a more attractive yield or credit profile. Our goal is to monetize some holdings at a gain, which should help to offset any realized or mark-to-market losses that may occur elsewhere in the portfolio. We believe the Fund’s focus on shorter-dated maturities, coupled with limitations to CCC rated securities, should result in lower volatility and help buffer its NAV performance during periods of weakness for the high yield market.
The Fund underperformed the benchmark during the reporting period, largely as a result of having a higher average quality rating and shorter duration than the index. More importantly, credit performance within the Fund continued to be strong and suffered little in the way of credit deterioration. The Fund’s NAV declined marginally during the reporting period as an increase in interest rates caused some minor mark-to-market declines in Fund holdings. Given the strong credit environment, however, we saw little in the way of credit deterioration among portfolio credits and the Fund had no defaults across the entire portfolio.
While we continue to attempt to maximize portfolio yield where achievable, we do so within the context of protecting the Fund’s credit quality and positioning the portfolio to alleviate the effects of early calls or redemptions. We have seen and expect to see additional call activity given the most recent downward trend in rates and the propensity for issuers to refinance their short-term debt and replace it with longer maturities. However, as a result of tightening credit spreads in the high yield market, the Fund’s NAV has stayed stable and remains near the original NAV at inception. As of the end of the reporting period, the Fund was on track to return its original NAV as described in its prospectus.
Nuveen High Income December 2019 Target Term Fund (JHD)
What key strategies were used to manage the Fund during this six-month reporting period ended June 30, 2018?
The Fund has an objective to provide a high level of current income and to return the original $9.86 net asset value (NAV) per common share on or about December 1, 2019. The Fund will seek to achieve its investment objectives by investing primarily in shorter maturity, high yield (below investment grade) corporate debt securities. High yield bonds typically offer higher yields than investment grade bonds, in exchange for greater credit risk. Bonds with shorter maturities have lower duration (or interest rate sensitivity) than longer maturity bonds, which may help mitigate price declines if rates rise.
The Fund may invest in other types of securities including senior loans, convertible securities and other types of debt instruments and derivatives that provide comparable economic exposure to the corporate debt market. At least 80% of its managed assets will be in corporate debt securities and separately, at least 80% in securities that, at the time of investment, are rated below investment grade or are unrated but judged by the portfolio managers to be of comparable quality. No more than 15% will be in securities rated CCC+/Caa1 or lower at the time of investment. Up to 30% may be in securities of non-U.S. issuers, including up to 20% in emerging market issuers and up to 10% may be in non-U.S. dollar denominated securities.
7
Portfolio Managers’ Comments (continued)
The Fund seeks to identify securities across diverse sectors and industries that the managers believe are undervalued or mispriced. In seeking to return the original NAV on or about December 1, 2019, the Fund intends to utilize various portfolio and cash flow management techniques, including setting aside a portion of its net investment income, possibly retaining gains and limiting the longest maturity of any holding to no later than June 1, 2020. The Fund also uses leverage.
How did the Fund perform during this six-month reporting period ended June 30, 2018?
The table in the Performance Overview and Holding Summaries section of this report provides total return performance for the Fund for the six-month, one-year and since inception periods ended June 30, 2018. For the six-month reporting period ended June 30, 2018, the Fund underperformed the Bloomberg Barclays U.S. High Yield 1-5 Year Cash Pay 2% Issuer Capped Index based on the Fund’s total return at NAV.
High yield bonds traded in a fairly tight range during the first half of the reporting period, despite the mostly rate induced sell-off at the end of the first quarter. The yield for the benchmark index (as measured by yield-to-worst) bounced between 6.35% and 6.75% on the back of modest interest rate volatility and a generally supportive technical backdrop. After surging to more than 2.90% in mid-May, the 5-year Treasury yield rallied back to around 2.70% toward the end of the reporting period after the sell-off in emerging markets and slowing growth concerns in Europe and China created a bid for dollar assets. Strong U.S. economic and employment data was also supportive of U.S. corporate debt, easing spread pressure on high yield bonds.
Spreads for lower quality issues (CCCs) tightened modestly since the beginning of the reporting period due to improving fundamentals and less sensitivity to rates, while spreads for single-B and BB rated securities were marginally wider. This led to much better performance out of the CCC rated segment during reporting period. However, the size of the CCC index has been shrinking since the bottom of the last credit cycle and represents just 14% of the high yield index, thereby making it hard for the segment to drive returns in the overall market.
Overall, thin supply, stabilizing fund flows and a small rally in rates helped high yield hold its ground in the face of escalating trade friction and deterioration of the global growth story. Demand for short-duration high yield also remained strong in the context of the Federal Reserve raising its expectations for the federal funds rate. Despite the shift in central bank policy that represents a reversal of the friendly monetary backdrop, the global yield environment has remained under pressure from demand for yield outstripping supply. This backdrop has contributed to a period of heavy refinancing activity, which surely had knock-on effects for our Fund due to the high level of portfolio securities being called or tendered as companies looked to take advantage of the strong credit environment and nominally low all-in yields to extend maturities. But it has also resulted in strong credit conditions, and by extension a continued period of low realized and projected default rates, which are estimated to remain around 2.5% for the foreseeable future.
The Fund seeks to protect against credit losses to help ensure the goal of returning its original NAV. While the Fund is designed to own more or less a static portfolio of high yield bonds, at times we have to add new securities to replace ones that have been called away or tendered. As we replace these bonds, we seek to maximize the Fund’s yield within the maturity, diversification and credit quality constraints described at the outset of the strategy. We may also look to maximize the Fund’s yield through opportunistic sales of securities that we believe have reached their upside potential, investing the proceeds in other securities that have a more attractive yield or credit profile. Our goal is to monetize some holdings at a gain, which should help to offset any realized or mark-to-market losses that may occur elsewhere in the portfolio. We believe the Fund’s focus on shorter-dated maturities, coupled with limitations to CCC rated securities, should result in lower volatility and help buffer its NAV performance during periods of weakness for the high yield market.
The Fund underperformed the benchmark during the reporting period, largely as a result of having a higher average quality rating and shorter duration than the index. More importantly, credit performance within the Fund continued to
8
be strong and suffered little in the way of credit deterioration. We began the Fund’s deleveraging process in April 2018 as current yields available on suitable new investments in most cases were not attractive enough to deploy the use of leverage. The elimination of leverage is also consistent with the wind-up period and the systematic liquidation of assets in anticipation of the Fund’s termination in December 2019.
We continue to hold a modest percentage of portfolio assets that mature within the three-month window after the Fund’s stated maturity, in accordance with prospectus guidelines, that we plan to liquidate shortly before the Fund’s maturity date. We may continue to reinvest the proceeds of called and matured securities into higher quality and short-dated instruments as we get closer to the stated maturity date. Reinvesting in shorter-duration and higher quality securities also resulted in a lower portfolio yield and concurrently a reduction in the dividend being paid by the Fund, which will continue as we approach the termination date. All of these outcomes are consistent with our expectations and with the guidelines we set forth in the prospectus at the Fund’s inception.
While we continue to attempt to maximize portfolio yield where achievable, we do so within the context of protecting the Fund’s credit quality and positioning the portfolio to alleviate the effects of early calls or redemptions. We have seen and expect to see additional call activity given the most recent downward trend in rates and the propensity for issuers to refinance their short-term debt and replace it with longer maturities. However, as a result of tightening credit spreads in the high yield market, the Fund’s NAV has remained stable and remains above the original NAV at inception. As of the end of the reporting period, the Fund was on track to return its original NAV as described in its prospectus.
Nuveen High Income December 2018 Target Term Fund (JHA)
What key strategies were used to manage the Fund during this six-month reporting period ended June 30, 2018?
The Fund has an objective to provide a high level of current income and to return the original $9.86 net asset value (NAV) per common share on or about December 1, 2018. The Fund will seek to achieve its investment objectives by investing primarily in shorter maturity, high yield (below investment grade) corporate debt securities. High yield bonds typically offer higher yields than investment grade bonds, in exchange for greater credit risk. Bonds with shorter maturities have lower duration (or interest rate sensitivity) than longer maturity bonds, which may help mitigate price declines if rates rise.
The Fund may invest in other types of securities including senior loans, convertible securities and other types of debt instruments and derivatives that provide comparable economic exposure to the corporate debt market. At least 80% of its managed assets will be in corporate debt securities and separately, at least 80% in securities that, at the time of investment, are rated below investment grade or are unrated but judged by the portfolio managers to be of comparable quality. No more than 15% will be in securities rated CCC+/Caa1 or lower at the time of investment. Up to 30% may be in securities of non-U.S. issuers, including up to 20% in emerging market issuers and up to 10% may be in non-U.S. dollar denominated securities.
The Fund seeks to identify securities across diverse sectors and industries that the managers believe are undervalued or mispriced. In seeking to return the original NAV on or about December 1, 2018, the Fund intends to utilize various portfolio and cash flow management techniques, including setting aside a portion of its net investment income, possibly retaining gains and limiting the longest maturity of any holding to no later than June 1, 2019.
How did the Fund perform during this six-month reporting period ended June 30, 2018?
The table in the Performance Overview and Holding Summaries section of this report provides total return performance for the Fund for the six-month, one-year and since inception periods ended June 30, 2018. For the six-month reporting period ended June 30, 2018, the Fund underperformed the Bloomberg Barclays U.S. High Yield 1-5 Year Cash Pay 2% Issuer Capped Index based on the Fund’s total return at NAV.
9
Portfolio Managers’ Comments (continued)
High yield bonds traded in a fairly tight range during the first half of the reporting period, despite the mostly rate induced sell-off at the end of the first quarter. The yield for the benchmark index (as measured by yield-to-worst) bounced between 6.35% and 6.75% on the back of modest interest rate volatility and a generally supportive technical backdrop. After surging to more than 2.90% in mid-May, the 5-year Treasury yield rallied back to around 2.70% toward the end of the reporting period after the sell-off in emerging markets and slowing growth concerns in Europe and China created a bid for dollar assets. Strong U.S. economic and employment data was also supportive of U.S. corporate debt, easing spread pressure on high yield bonds.
Spreads for lower quality issues (CCCs) tightened modestly since the beginning of the reporting period due to improving fundamentals and less sensitivity to rates, while spreads for single-B and BB rated securities were marginally wider. This led to much better performance out of the CCC rated segment during the reporting period. However, the size of the CCC index has been shrinking since the bottom of the last credit cycle and represents just 14% of the high yield index, thereby making it hard for the segment to drive returns in the overall market.
Overall, thin supply, stabilizing fund flows and a small rally in rates helped high yield hold its ground in the face of escalating trade friction and deterioration of the global growth story. Demand for short-duration high yield also remained strong in the context of the Federal Reserve raising its expectations for the federal funds rate. Despite the shift in central bank policy that represents a reversal of the friendly monetary backdrop, the global yield environment has remained under pressure from demand for yield outstripping supply. This backdrop has contributed to a period of heavy refinancing activity, which surely had knock-on effects for our Fund due to the high level of portfolio securities being called or tendered as companies looked to take advantage of the strong credit environment and nominally low all-in yields to extend maturities. But it has also resulted in strong credit conditions, and by extension a continued period of low realized and projected default rates, which are estimated to remain around 2.5% for the foreseeable future.
The Fund seeks to protect against credit losses to help ensure the goal of returning its original NAV. While the Fund is designed to own more or less a static portfolio of high yield bonds, at times we have to add new securities to replace ones that have been called away or tendered. As we replace these bonds, we seek to maximize the Fund’s yield within the maturity, diversification and credit quality constraints described at the outset of the strategy. We may also look to maximize the Fund’s yield through opportunistic sales of securities that we believe have reached their upside potential, investing the proceeds in other securities that have a more attractive yield or credit profile. Our goal is to monetize some holdings at a gain, which should help to offset any realized or mark-to-market losses that may occur elsewhere in the portfolio. We believe the Fund’s focus on shorter-dated maturities, coupled with limitations to CCC rated securities, should result in lower volatility and help buffer its NAV performance during periods of weakness for the high yield market.
The Fund underperformed the benchmark during the reporting period, largely as a result of the wind-up process we began early in the reporting period, which has resulted in a much higher average quality and shorter duration than the index. More importantly, credit performance within the Fund continued to be strong and suffered little in the way of credit deterioration. We have completed the Fund’s deleveraging process with an eye toward better protecting the Fund’s NAV in light of the approaching December 2018 maturity date. This has largely entailed moving into securities that are higher quality in nature and with maturities that largely coincide with the Fund’s stated maturity date. We continue to hold a modest percentage of portfolio assets that mature within a three-month window after the stated maturity, in accordance with prospectus guidelines, which we plan to liquidate shortly before the Fund’s maturity date. As of June 30, 2018, more than 65% of the portfolio’s assets were invested in investment grade securities, and we anticipate that figure will increase as we get closer to the stated maturity date and as other securities mature, get called or are sold.
10
As a result of stable credit spreads in the high yield market, the Fund’s NAV has stayed stable and remains near the original NAV at inception. As of the end of the reporting period, the Fund was on track to return its original NAV as described in its prospectus.
Nuveen High Income November 2021 Target Term Fund (JHB)
What key strategies were used to manage the Fund during this six-month reporting period ended June 30, 2018?
The Fund has an objective to provide a high level of current income and to return the original $9.85 net asset value (NAV) per common share on or about November 1, 2021. The Fund will seek to achieve its investment objectives by investing primarily in shorter maturity, high yield (below investment grade) corporate debt securities. High yield bonds typically offer higher yields than investment grade bonds, in exchange for greater credit risk. Bonds with shorter maturities have lower duration (or interest rate sensitivity) than longer maturity bonds, which may help mitigate price declines if rates rise.
The Fund may invest in other types of securities including senior loans, convertible securities and other types of debt instruments and derivatives that provide comparable economic exposure to the corporate debt market. At least 80% of its managed assets will be in corporate debt securities and separately, at least 80% in securities that, at the time of investment, are rated below investment grade or are unrated but judged by the portfolio managers to be of comparable quality. No more than 15% will be in securities rated CCC+/Caa1 or lower at the time of investment. Up to 30% may be in securities of non-U.S. issuers, including up to 20% in emerging market issuers, and up to 10% may be in non-U.S. dollar denominated securities.
The Fund seeks to identify securities across diverse sectors and industries that the managers believe are undervalued or mispriced. In seeking to return the original NAV on or about November 1, 2021, the Fund intends to utilize various portfolio and cash flow management techniques, including setting aside a portion of its net investment income, possibly retaining gains and limiting the longest maturity of any holding to no later than May 1, 2022. The Fund also uses leverage.
How did the Fund perform during this six-month reporting period ended June 30, 2018?
The table in the Performance Overview and Holding Summaries section of this report provides total return performance for the Fund for the six-month, one-year and since inception periods ended June 30, 2018. For the six-month reporting period ended June 30, 2018, the Fund underperformed the Bloomberg Barclays U.S. High Yield 1-5 Year Cash Pay 2% Issuer Capped Index based on the Fund’s total return at NAV.
High yield bonds traded in a fairly tight range during the first half of the reporting period, despite the mostly rate induced sell-off at the end of the first quarter. The yield for the benchmark index (as measured by yield-to-worst) bounced between 6.35% and 6.75% on the back of modest interest rate volatility and a generally supportive technical backdrop. After surging to more than 2.90% in mid-May, the 5-year Treasury yield rallied back to around 2.70% toward the end of the reporting period after the sell-off in emerging markets and slowing growth concerns in Europe and China created a bid for dollar assets. Strong U.S. economic and employment data was also supportive of U.S. corporate debt, easing spread pressure on high yield bonds.
Spreads for lower quality issues (CCCs) tightened modestly since the beginning of the reporting period due to improving fundamentals and less sensitivity to rates, while spreads for single-B and BB rated securities were marginally wider. This led to much better performance out of the CCC rated segment during the reporting period. However, the size of the CCC index has been shrinking since the bottom of the last credit cycle and represents just 14% of the high yield index, thereby making it hard for the segment to drive returns in the overall market.
11
Portfolio Managers’ Comments (continued)
Overall, thin supply, stabilizing fund flows and a small rally in rates helped high yield hold its ground in the face of escalating trade friction and deterioration of the global growth story. Demand for short-duration high yield also remained strong in the context of the Federal Reserve raising its expectations for the federal funds rate. Despite the shift in central bank policy that represents a reversal of the friendly monetary backdrop, the global yield environment has remained under pressure from demand for yield outstripping supply. This backdrop has contributed to a period of heavy refinancing activity, which surely had knock-on effects for our Fund due to the high level of portfolio securities being called or tendered as companies looked to take advantage of the strong credit environment and nominally low all-in yields to extend maturities. But it has also resulted in strong credit conditions, and by extension a continued period of low realized and projected default rates, which are estimated to remain around 2.5% for the foreseeable future.
The Fund seeks to protect against credit losses to help ensure the goal of returning its original NAV. While the Fund is designed to own more or less a static portfolio of high yield bonds, at times we have to add new securities to replace ones that have been called away or tendered. As we replace these bonds, we seek to maximize the Fund’s yield within the maturity, diversification and credit quality constraints described at the outset of the strategy. We may also look to maximize the Fund’s yield through opportunistic sales of securities that we believe have reached their upside potential, investing the proceeds in other securities that have a more attractive yield or credit profile. Our goal is to monetize some holdings at a gain, which should help to offset any realized or mark-to-market losses that may occur elsewhere in the portfolio. We believe the Fund’s focus on shorter-dated maturities, coupled with limitations to CCC rated securities, should result in lower volatility and help buffer its NAV performance during periods of weakness for the high yield market.
The Fund underperformed the benchmark during the reporting period, largely due to a higher average quality and shorter duration than the index. More importantly, credit performance within the Fund continued to be strong and suffered little in the way of credit deterioration. The Fund’s NAV declined marginally during the reporting period as an increase in interest rates caused some minor mark-to-market declines in Fund holdings.
While we continue to attempt to maximize portfolio yield where achievable, we do so within the context of protecting the Fund’s credit quality and positioning the portfolio to alleviate the effects of early calls or redemptions. We have seen and expect to see additional call activity given the most recent downward trend in rates and the propensity for issuers to refinance their short-term debt and replace it with longer maturities. However, as a result of tightening credit spreads in the high yield market, the Fund’s NAV has stayed stable and remains near the original NAV at inception. As of the end of the reporting period, the Fund was on track to return its original NAV as described in its prospectus.
12
Fund Leverage
IMPACT OF THE FUNDS’ LEVERAGE STRATEGIES ON PERFORMANCE
One important factor impacting the returns of JHY’s, JHD’s and JHB’s common shares relative to their comparative benchmarks was the Funds’ use of leverage through bank borrowings. JHA no longer use leverage. The Funds use leverage because our research has shown that, over time, leveraging provides opportunities for additional income and total return, particularly in the recent market environment where short-term market rates are at or near historical lows, meaning that the short-term rates the Fund has been paying on its leveraging instruments in recent years have been much lower than the interest the Fund has been earning on its portfolio securities that it has bought with the proceeds of that leverage.
However, use of leverage can expose Fund common shares to additional price volatility. When a Fund uses leverage, the Fund common shares will experience a greater increase in their net asset value if the securities acquired through the use of leverage increase in value, but will also experience a correspondingly larger decline in their net asset value if the securities acquired through leverage decline in value, which will make the shares’ net asset value more volatile, and total return performance more variable, over time.
In addition, common share income in levered funds will typically decrease in comparison to unlevered funds when short-term interest rates increase and increase when short-term interest rates decrease. Over the last few quarters, short-term interest rates have indeed increased from their extended lows after the 2007-09 financial crisis. This increase has reduced common share net income, and also reduced potential for long-term total returns. Nevertheless, the ability to effectively borrow at current short-term rates is still resulting in enhanced common share income, and management believes that the advantages of continuation of leverage outweigh the associated increase in risk and volatility described above.
The Funds’ use of leverage had a positive impact on performance during this reporting period.
As of June 30, 2018, the Funds’ percentages of leverage are shown in the accompanying table.
| | | | | | | | | | | | | | | | |
| | | JHY | | | JHD | | | JHA | | | JHB | |
Effective Leverage* | | | 28.72 | % | | | 6.71 | % | | | — | | | | 25.52 | % |
Regulatory Leverage* | | | 28.72 | % | | | 6.71 | % | | | — | | | | 25.52 | % |
| * | Effective Leverage is a Fund’s effective economic leverage, and includes both regulatory leverage and the leverage effects of certain derivative and other investments in a Fund’s portfolio that increase the Fund’s investment exposure. Regulatory leverage consists of preferred shares issued or borrowings of a Fund. Both of these are part of a Fund’s capital structure. A Fund, however, may from time to time borrow on a typically transient basis in connection with its day-to-day operations, primarily in connection with the need to settle portfolio trades. Such incidental borrowings are excluded from the calculation of a Fund’s effective leverage ratio. Regulatory leverage is subject to asset coverage limits set forth in the Investment Company Act of 1940. |
THE FUNDS’ REGULATORY LEVERAGE
Bank Borrowings
As noted above, the following Funds employ leverage through the use of bank borrowings. The Funds’ bank borrowing activities are as shown in the accompanying table.
| | | | | | | | | | | | | | | | | | | | | | | | | | | | | | | | | | | | |
| | | Current Reporting Period | | | | | | Subsequent to the Close of
the Reporting Period | |
| Fund | | January 1, 2018 | | | Draws | | | Paydowns | | | June 30, 2018 | | | Average Balance
Outstanding | | | | | | Draws | | | Paydowns | | | August 27,
2018 | |
JHY | | $ | 44,000,000 | | | $ | 17,500,000 | | | $ | — | | | $ | 61,500,000 | | | $ | 52,301,105 | | | | | | | $ | — | | | $ | — | | | $ | 61,500,000 | |
JHD | | $ | 63,500,000 | | | $ | — | | | $ | (44,000,000 | ) | | $ | 19,500,000 | | | $ | 44,969,613 | | | | | | | $ | — | | | $ | (7,300,000 | ) | | $ | 12,200,000 | |
JHB | | $ | 190,000,000 | | | $ | — | | | $ | — | | | $ | 190,000,000 | | | $ | 190,000,000 | | | | | | | $ | — | | | $ | — | | | $ | 190,000,000 | |
Refer to Notes to Financial Statements, Note 8 – Borrowing Arrangements for further details.
13
Share Information
DISTRIBUTION INFORMATION
The following information regarding the Funds’ distributions is current as of June 30, 2018. Each Fund’s distribution levels may vary over time based on each Fund’s investment activity and portfolio investment value changes.
During the current reporting period, the Funds’ distributions to shareholders were as shown in the accompanying table.
| | | | | | | | | | | | | | | | |
| | | Per Share Amounts | |
| Monthly Distributions (Ex-Dividend Date) | | JHY | | | JHD | | | JHA | | | JHB | |
January 2018 | | $ | 0.0470 | | | $ | 0.0415 | | | $ | 0.0325 | | | $ | 0.0500 | |
February | | | 0.0470 | | | | 0.0415 | | | | 0.0325 | | | | 0.0500 | |
March | | | 0.0440 | | | | 0.0375 | | | | 0.0300 | | | | 0.0465 | |
April | | | 0.0440 | | | | 0.0375 | | | | 0.0300 | | | | 0.0465 | |
May | | | 0.0440 | | | | 0.0375 | | | | 0.0300 | | | | 0.0465 | |
June 2018 | | | 0.0420 | | | | 0.0350 | | | | 0.0270 | | | | 0.0465 | |
Total Distributions from Net Investment Income | | $ | 0.2680 | | | $ | 0.2305 | | | $ | 0.1820 | | | $ | 0.2860 | |
| | | | |
Current Distribution Rate* | | | 5.03 | % | | | 4.27 | % | | | 3.28 | % | | | 5.84 | % |
| * | Current distribution rate is based on the Fund’s current annualized monthly distribution divided by the Fund’s current market price. The Fund’s monthly distributions to its shareholders may be comprised of ordinary income, net realized capital gains and, if at the end of the fiscal year the Fund’s cumulative net ordinary income and net realized gains are less than the Fund’s distributions, a return of capital for tax purposes. |
Each Fund in this report seeks to pay regular monthly dividends out of its net investment income at a rate that reflects its past and projected net income performance. To permit each Fund to maintain a more stable monthly dividend, the Fund may pay dividends at a rate that may be more or less than the amount of net income actually earned by the Fund during the period. If a Fund has cumulatively earned more than it has paid in dividends, it will hold the excess in reserve as undistributed net investment income (UNII) as part of the Fund’s net asset value. Conversely, if a Fund has cumulatively paid in dividends more than it has earned, the excess will constitute a negative UNII that will likewise be reflected in the Fund’s net asset value. Each Fund will, over time, pay all its net investment income as dividends to shareholders.
As of June 30, 2018, the Funds had positive UNII balances, based upon our best estimate, for tax purposes and positive UNII balances for financial reporting purposes.
All monthly dividends paid by each Fund during the current reporting period were paid from net investment income. If a portion of the Fund’s monthly distributions was sourced from or comprised of elements other than net investment income, including capital gains and/or a return of capital, shareholders would have received a notice to that effect. For financial reporting purposes the composition and per share amounts of each Fund’s dividends for the reporting period are presented in this report’s Statement of Changes in Net Assets and Financial Highlights, respectively. For income tax purposes, distribution information for each Fund as of its most recent tax year end is presented in Note 6 – Income Tax Information within the Notes to Financial Statements of this report.
14
EQUITY SHELF PROGRAM
During the current reporting period, JHY was authorized by the Securities and Exchange Commission to issue additional shares through an equity shelf program (“Shelf Offering”). Under this program JHY, subject to market conditions, may raise additional capital from time to time in varying amounts and offering methods at a net price at or above the Fund’s NAV per share. Under the Shelf Offering, the Fund was authorized to issue additional shares as shown in the accompanying table.
| | | | |
| | | JHY | |
Additional authorized shares | | | 3,400,000 | |
During the current reporting period, JHY sold shares through its Shelf Offering at a weighted average premium to its NAV per share as shown in the accompanying table.
| | | | |
| | | JHY | |
Shares sold through Shelf Offering | | | 15,181 | |
Weighted average premium to NAV per share sold | | | 1.20 | % |
Refer to the Notes to Financial Statements, Note 4 – Fund Shares, Equity Shelf Programs and Offering Costs for further details of Shelf Offerings and the Fund’s transactions.
SHARE REPURCHASES
During August 2018 (subsequent to the close of the reporting period), the Funds’ Board of Trustees reauthorized an open-market share repurchase program, allowing each Fund to repurchase an aggregate of up to approximately 10% of its outstanding shares.
As of June 30, 2018, and since the inception of the Funds’ repurchase programs, the Funds have cumulatively repurchased and retired their outstanding shares as shown in the accompanying table.
| | | | | | | | | | | | | | | | |
| | | JHY | | | JHD | | | JHA | | | JHB | |
Shares cumulatively repurchased and retired | | | — | | | | — | | | | — | | | | — | |
Shares authorized for repurchase | | | 1,495,000 | | | | 2,705,000 | | | | 2,930,000 | | | | 5,585,000 | |
OTHER SHARE INFORMATION
As of June 30, 2018, and during the current reporting period, the Funds’ share prices were trading at premium/(discount) to their NAVs as shown in the accompanying table.
| | | | | | | | | | | | | | | | |
| | | JHY | | | JHD | | | JHA | | | JHB | |
NAV | | $ | 9.75 | | | $ | 10.02 | | | $ | 9.96 | | | $ | 9.92 | |
Share price | | $ | 10.01 | | | $ | 9.83 | | | $ | 9.88 | | | $ | 9.56 | |
Premium/(Discount) to NAV | | | 2.67 | % | | | (1.90 | )% | | | (0.80 | )% | | | (3.63 | )% |
6-month average premium/(discount) to NAV | | | 0.22 | % | | | (2.30 | )% | | | (1.48 | )% | | | (3.80 | )% |
JHY, JHD, JHA and JHB each have an investment objective to return $9.85, $9.86, $9.86 and $9.85, respectively (the original net asset value following each Fund’s initial public offering (the “Original NAV”)) to shareholders on or about the end of the Fund’s term. There can be no assurance that the Funds will be able to return the Original NAV to shareholders, and such return is not backed or otherwise guaranteed by the Funds’ investment adviser, Nuveen Fund Advisors, LLC (the “Adviser”), or any other entity.
Each Fund’s ability to return Original NAV to common shareholders on or about the termination date will depend on market conditions and the success of various portfolio and cash flow management techniques. Each Fund currently
15
Share Information (continued)
intends to set aside and retain in its net assets a portion of its net investment income and possibly all or a portion of its gains. This will reduce the amounts otherwise available for distribution prior to the liquidation of each Fund, and the Fund may incur taxes on such retained amount, which will reduce the overall amounts that the Fund would have otherwise been able to distribute. Such retained income or gains, net of any taxes, would constitute a portion of the liquidating distribution returned to investors at the end of each Fund’s term. In addition, each Fund’s investment in shorter term and lower yielding securities, especially as the Fund nears the end of its term, may reduce investment income and, therefore, the monthly dividends during the period prior to termination. Investors that purchase shares in the secondary market (particularly if their purchase price differs meaningfully from the Original NAV) may receive more or less than their original investment.
16
Risk Considerations
Fund shares are not guaranteed or endorsed by any bank or other insured depository institution, and are not federally insured by the Federal Deposit Insurance Corporation.
Nuveen High Income 2020 Target Term Fund (JHY)
Investing in closed-end funds involves risk; principal loss is possible. There is no guarantee the Fund’s investment objectives will be achieved. Closed-end fund shares may frequently trade at a discount or premium to their net asset value. Debt or fixed income securities such as those held by the Fund, are subject to market risk, credit risk, interest rate risk, derivatives risk, liquidity risk, and income risk. As interest rates rise, bond prices fall. Lower credit debt securities may be more likely to fail to make timely interest or principal payments and may be subject to higher liquidity risk. Leverage increases return volatility and magnifies the Fund’s potential return and its risks; there is no guarantee a fund’s leverage strategy will be successful. Foreign investments involve additional risks, including currency fluctuation, political and economic instability, lack of liquidity and differing legal and accounting standards. The risks of foreign investments are magnified in emerging markets. These and other risk considerations including the Fund’s limited term and call risk are described in more detail on the Fund’s web page at www.nuveen.com/JHY.
Nuveen High Income December 2019 Target Term Fund (JHD)
Investing in closed-end funds involves risk; principal loss is possible. There is no guarantee the Fund’s investment objectives will be achieved. Closed-end fund shares may frequently trade at a discount or premium to their net asset value. Debt or fixed income securities such as those held by the Fund, are subject to market risk, credit risk, interest rate risk, derivatives risk, liquidity risk, and income risk. As interest rates rise, bond prices fall. Lower credit debt securities may be more likely to fail to make timely interest or principal payments and may be subject to higher liquidity risk. Leverage increases return volatility and magnifies the Fund’s potential return and its risks; there is no guarantee a fund’s leverage strategy will be successful. Foreign investments involve additional risks, including currency fluctuation, political and economic instability, lack of liquidity and differing legal and accounting standards. The risks of foreign investments are magnified in emerging markets. These and other risk considerations including the Fund’s limited term and call risk are described in more detail on the Fund’s web page at www.nuveen.com/JHD.
Nuveen High Income December 2018 Target Term Fund (JHA)
Investing in closed-end funds involves risk; principal loss is possible. There is no guarantee the Fund’s investment objectives will be achieved. Closed-end fund shares may frequently trade at a discount or premium to their net asset value. Debt or fixed income securities such as those held by the Fund, are subject to market risk, credit risk, interest rate risk, derivatives risk, liquidity risk, and income risk. As interest rates rise, bond prices fall. Lower credit debt securities may be more likely to fail to make timely interest or principal payments and may be subject to higher liquidity risk. Leverage increases return volatility and magnifies the Fund’s potential return and its risks; there is no guarantee a fund’s leverage strategy will be successful. Foreign investments involve additional risks, including currency fluctuation, political and economic instability, lack of liquidity and differing legal and accounting standards. The risks of foreign investments are magnified in emerging markets. These and other risk considerations including the Fund’s limited term and call risk are described in more detail on the Fund’s web page at nuveen.com/JHA.
Nuveen High Income November 2021 Target Term Fund (JHB)
Investing in closed-end funds involves risk; principal loss is possible. There is no guarantee the Fund’s investment objectives will be achieved. Closed-end fund shares may frequently trade at a discount or premium to their net asset value. Debt or fixed income securities such as those held by the Fund, are subject to market risk, credit risk, interest rate risk, derivatives risk, liquidity risk, and income risk. As interest rates rise, bond prices fall. Lower credit debt
17
Risk Considerations (continued)
securities may be more likely to fail to make timely interest or principal payments and may be subject to higher liquidity risk. Leverage increases return volatility and magnifies the Fund’s potential return and its risks; there is no guarantee a fund’s leverage strategy will be successful. Foreign investments involve additional risks, including currency fluctuation, political and economic instability, lack of liquidity and differing legal and accounting standards. The risks of foreign investments are magnified in emerging markets. These and other risk considerations including the Fund’s limited term and call risk are described in more detail on the Fund’s web page at www.nuveen.com/JHB.
18
THIS PAGE INTENTIONALLY LEFT BLANK
19
| | |
| JHY | | Nuveen High Income 2020 Target Term Fund Performance Overview and Holding Summaries as of June 30, 2018 |
Refer to the Glossary of Terms Used in this Report for further definition of the terms used within this section.
Average Annual Total Returns as of June 30, 2018
| | | | | | | | | | | | |
| | | Cumulative | | | Average Annual | |
| | | 6-Month | | | 1-Year | | | Since
Inception | |
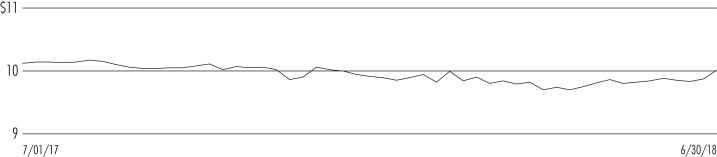
| JHY at NAV | | | 1.31% | | | | 3.90% | | | | 6.46% | |
| JHY at Share Price | | | 3.79% | | | | 4.97% | | | | 6.66% | |
| Bloomberg Barclays U.S. High Yield 1-5 Year Cash Pay 2% Issuer Capped Index | | | 1.93% | | | | 4.00% | | | | 6.04% | |
Since inception returns are from 7/28/15. Past performance is not predictive of future results. Current performance may be higher or lower than the data shown. Returns do not reflect the deduction of taxes that shareholders may have to pay on Fund distributions or upon the sale of Fund shares. Returns at NAV are net of Fund expenses, and assume reinvestment of distributions. Comparative index return information is provided for the Fund’s shares at NAV only. Indexes are not available for direct investment.
Share Price Performance — Weekly Closing Price
20
This data relates to the securities held in the Fund’s portfolio of investments as of the end of the reporting period. It should not be construed as a measure of performance for the Fund itself. Holdings are subject to change.
For financial reporting purposes, the ratings disclosed are the highest rating given by one of the following national rating agencies: Standard & Poor’s Group, Moody’s Investors Service, Inc. or Fitch, Inc. This treatment of split-rated securities may differ from that used for other purposes, such as for Fund investment policies. Credit ratings are subject to change. AAA, AA, A and BBB are investment grade ratings; BB, B, CCC, CC, C and D are below-investment grade ratings. Holdings designated N/R are not rated by these national rating agencies.
Fund Allocation
(% of net assets)
| | | | |
| Corporate Bonds | | | 130.5% | |
| Convertible Bonds | | | 3.6% | |
| Sovereign Debt | | | 3.0% | |
| Repurchase Agreements | | | 0.6% | |
| Other Assets Less Liabilities | | | 2.6% | |
Net Assets Plus Borrowings | | | 140.3% | |
| Borrowings | | | (40.3)% | |
Net Assets | | | 100% | |
Country Allocation
(% of total investments)1
| | | | |
| United States | | | 76.9% | |
| Canada | | | 4.3% | |
| Japan | | | 1.9% | |
| Bermuda | | | 1.9% | |
| Netherlands | | | 1.5% | |
| Brazil | | | 1.5% | |
| Hong Kong | | | 1.4% | |
| Luxembourg | | | 1.4% | |
| Argentina | | | 1.2% | |
| Zambia | | | 1.2% | |
| Other | | | 6.8% | |
Total | | | 100% | |
Portfolio Composition
(% of total investments)
| | | | |
| Oil, Gas & Consumable Fuels | | | 7.1% | |
| Metals & Mining | | | 6.3% | |
| Specialty Retail | | | 5.1% | |
| Airlines | | | 5.0% | |
| Diversified Financial Services | | | 4.9% | |
| Media | | | 4.5% | |
| Household Durables | | | 4.3% | |
| Independent Power & Renewable Electricity Producers | | | 4.0% | |
| Hotels, Restaurants & Leisure | | | 3.8% | |
| Diversified Telecommunication Services | | | 3.7% | |
| Health Care Providers & Services | | | 3.6% | |
| Consumer Finance | | | 3.5% | |
| Equity Real Estate Investment Trusts | | | 3.4% | |
| Commercial Services & Supplies | | | 3.1% | |
| Aerospace & Defense | | | 2.9% | |
| Technology Hardware, Storage & Peripherals | | | 2.8% | |
| Building Products | | | 2.3% | |
| Banks | | | 2.1% | |
| Wireless Telecommunication Services | | | 2.1% | |
| Road & Rail | | | 1.8% | |
| Internet & Direct Marketing Retail | | | 1.6% | |
| Other | | | 19.5% | |
| Sovereign Debt | | | 2.2% | |
| Repurchase Agreements | | | 0.4% | |
Total | | | 100% | |
Portfolio Credit Quality
(% of total long-term investments)
| | | | |
| A | | | 0.1% | |
| BBB | | | 9.3% | |
| BB or Lower | | | 88.3% | |
| N/R (not rated) | | | 2.3% | |
Total | | | 100% | |
Top Five Issuers
(% of total investments)
| | | | |
| CenturyLink Inc. | | | 2.4% | |
| L Brands Inc. | | | 1.9% | |
| Hertz Global Holdings Inc. | | | 1.8% | |
| NuStar Logistics LP | | | 1.8% | |
| HCA Healthcare Inc. | | | 1.7% | |
| 1 | Includes 10.2% (as a percentage of total investments) in emerging markets countries. |
21
| | |
| JHD | | Nuveen High Income December 2019 Target Term Fund Performance Overview and Holding Summaries as of June 30, 2018 |
Refer to the Glossary of Terms Used in this Report for further definition of the terms used within this section.
Average Annual Total Returns as of June 30, 2018
| | | | | | | | | | | | |
| | | Cumulative | | | Average Annual | |
| | | 6-Month | | | 1-Year | | | Since
Inception | |
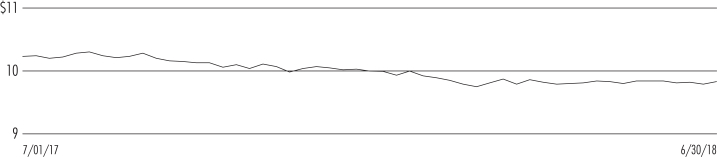
| JHD at NAV | | | 0.70% | | | | 2.55% | | | | 6.17% | |
| JHD at Share Price | | | 0.42% | | | | 1.48% | | | | 4.58% | |
| Bloomberg Barclays U.S. High Yield 1-5 Year Cash Pay 2% Issuer Capped Index | | | 1.93% | | | | 4.00% | | | | 8.66% | |
Since inception returns are from 5/10/16. Past performance is not predictive of future results. Current performance may be higher or lower than the data shown. Returns do not reflect the deduction of taxes that shareholders may have to pay on Fund distributions or upon the sale of Fund shares. Returns at NAV are net of Fund expenses, and assume reinvestment of distributions. Comparative index return information is provided for the Fund’s shares at NAV only. Indexes are not available for direct investment.
Share Price Performance — Weekly Closing Price
22
This data relates to the securities held in the Fund’s portfolio of investments as of the end of the reporting period. It should not be construed as a measure of performance for the Fund itself. Holdings are subject to change.
For financial reporting purposes, the ratings disclosed are the highest rating given by one of the following national rating agencies: Standard & Poor’s Group, Moody’s Investors Service, Inc. or Fitch, Inc. This treatment of split-rated securities may differ from that used for other purposes, such as for Fund investment policies. Credit ratings are subject to change. AAA, AA, A and BBB are investment grade ratings; BB, B, CCC, CC, C and D are below-investment grade ratings. Holdings designated N/R are not rated by these national rating agencies.
Fund Allocation
(% of net assets)
| | | | |
| Corporate Bonds | | | 96.5% | |
| Convertible Bonds | | | 3.9% | |
| Sovereign Debt | | | 2.9% | |
| Repurchase Agreements | | | 0.2% | |
| Other Assets Less Liabilities | | | 3.7% | |
Net Assets Plus Borrowings | | | 107.2% | |
| Borrowings | | | (7.2)% | |
Net Assets | | | 100% | |
Country Allocation
(% of total investments)1
| | | | |
| United States | | | 69.6% | |
| Canada | | | 4.7% | |
| Japan | | | 3.5% | |
| United Kingdom | | | 3.2% | |
| Luxembourg | | | 2.5% | |
| Italy | | | 2.2% | |
| Israel | | | 2.2% | |
| Spain | | | 2.0% | |
| Hong Kong | | | 1.8% | |
| Australia | | | 1.5% | |
| Other | | | 6.8% | |
Total | | | 100% | |
Portfolio Composition
(% of total investments)
| | | | |
| Oil, Gas & Consumable Fuels | | | 11.4% | |
| Independent Power & Renewable Electricity Producers | | | 5.7% | |
| Household Durables | | | 5.5% | |
| Technology Hardware, Storage & Peripherals | | | 5.2% | |
| Hotels, Restaurants & Leisure | | | 5.0% | |
| Equity Real Estate Investment Trusts | | | 4.9% | |
| Media | | | 4.8% | |
| Airlines | | | 4.8% | |
| Health Care Providers & Services | | | 4.3% | |
| Metals & Mining | | | 3.5% | |
| Banks | | | 3.4% | |
| Consumer Finance | | | 3.1% | |
| Automobiles | | | 3.0% | |
| Diversified Financial Services | | | 2.9% | |
| Diversified Telecommunication Services | | | 2.8% | |
| Pharmaceuticals | | | 2.8% | |
| Chemicals | | | 2.7% | |
| Specialty Retail | | | 2.4% | |
| Other | | | 18.8% | |
| Sovereign Debt | | | 2.9% | |
| Repurchase Agreements | | | 0.1% | |
Total | | | 100% | |
Portfolio Credit Quality
(% of total long-term investments)
| | | | |
| A | | | 0.2% | |
| BBB | | | 20.2% | |
| BB or Lower | | | 77.5% | |
| N/R (not rated) | | | 2.1% | |
Total | | | 100% | |
Top Five Issuers
(% of total investments)
| | | | |
| EMC Corporation | | | 2.8% | |
| Tenet Healthcare Corporation | | | 2.3% | |
| CenturyLink Inc. | | | 2.2% | |
| Sprint Corporation | | | 2.1% | |
| HCA Healthcare Inc. | | | 2.0% | |
| 1 | Includes 8.4% (as a percentage of total investments) in emerging markets countries. |
23
| | |
| JHA | | Nuveen High Income December 2018 Target Term Fund Performance Overview and Holding Summaries as of June 30, 2018 |
Refer to the Glossary of Terms Used in this Report for further definition of the terms used within this section.
Average Annual Total Returns as of June 30, 2018
| | | | | | | | | | | | |
| | | Cumulative | | | Average Annual | |
| | | 6-Month | | | 1-Year | | | Since
Inception | |
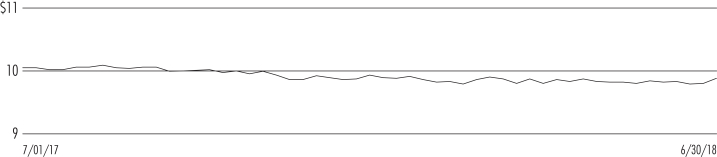
| JHA at NAV | | | 0.92% | | | | 2.45% | | | | 5.41% | |
| JHA at Share Price | | | 1.55% | | | | 2.38% | | | | 4.55% | |
| Bloomberg Barclays U.S. High Yield 1-5 Year Cash Pay 2% Issuer Capped Index | | | 1.93% | | | | 4.00% | | | | 7.62% | |
Since inception returns are from 11/12/15. Past performance is not predictive of future results. Current performance may be higher or lower than the data shown. Returns do not reflect the deduction of taxes that shareholders may have to pay on Fund distributions or upon the sale of Fund shares. Returns at NAV are net of Fund expenses, and assume reinvestment of distributions. Comparative index return information is provided for the Fund’s shares at NAV only. Indexes are not available for direct investment.
Share Price Performance — Weekly Closing Price
24
This data relates to the securities held in the Fund’s portfolio of investments as of the end of the reporting period. It should not be construed as a measure of performance for the Fund itself. Holdings are subject to change.
For financial reporting purposes, the ratings disclosed are the highest rating given by one of the following national rating agencies: Standard & Poor’s Group, Moody’s Investors Service, Inc. or Fitch, Inc. This treatment of split-rated securities may differ from that used for other purposes, such as for Fund investment policies. Credit ratings are subject to change. AAA, AA, A and BBB are investment grade ratings; BB, B, CCC, CC, C and D are below-investment grade ratings. Holdings designated N/R are not rated by these national rating agencies.
Fund Allocation
(% of net assets)
| | | | |
| Corporate Bonds | | | 87.7% | |
| Convertible Bonds | | | 6.5% | |
| Sovereign Debt | | | 2.4% | |
| Repurchase Agreements | | | 0.5% | |
| Other Assets Less Liabilities | | | 2.9% | |
Net Assets | | | 100% | |
Country Allocation
(% of total investments)1
| | | | |
| United States | | | 73.5% | |
| Japan | | | 4.9% | |
| Germany | | | 3.0% | |
| United Kingdom | | | 2.8% | |
| Ireland | | | 2.6% | |
| India | | | 2.4% | |
| Luxembourg | | | 1.9% | |
| Switzerland | | | 1.5% | |
| Mexico | | | 1.1% | |
| South Africa | | | 1.1% | |
| Other | | | 5.2% | |
Total | | | 100% | |
Portfolio Composition
(% of total investments)
| | | | |
| Oil, Gas & Consumable Fuels | | | 7.6% | |
| Automobiles | | | 6.9% | |
| Diversified Telecommunication Services | | | 5.8% | |
| Banks | | | 5.3% | |
| Consumer Finance | | | 4.8% | |
| Electronic Equipment, Instruments & Components | | | 4.8% | |
| Equity Real Estate Investment Trusts | | | 4.8% | |
| Health Care Providers & Services | | | 3.9% | |
| Media | | | 3.9% | |
| Household Durables | | | 3.7% | |
| Machinery | | | 3.7% | |
| Capital Markets | | | 3.6% | |
| Electric Utilities | | | 3.2% | |
| Technology Hardware, Storage & Peripherals | | | 2.9% | |
| Hotels, Restaurants & Leisure | | | 2.6% | |
| Commercial Services & Supplies | | | 2.6% | |
| Wireless Telecommunication Services | | | 2.5% | |
| Diversified Financial Services | | | 2.5% | |
| Trading Companies & Distributors | | | 2.1% | |
| Other | | | 19.7% | |
| Sovereign Debt | | | 2.5% | |
| Repurchase Agreements | | | 0.6% | |
Total | | | 100% | |
Portfolio Credit Quality
(% of total long-term investments)
| | | | |
| AA | | | 4.9% | |
| A | | | 15.1% | |
| BBB | | | 45.1% | |
| BB or Lower | | | 31.4% | |
| N/R (not rated) | | | 3.5% | |
Total | | | 100% | |
Top Five Issuers
(% of total investments)
| | | | |
| HCA Healthcare Inc. | | | 2.7% | |
| Sprint Corporation | | | 2.5% | |
| AerCap Holdings NV | | | 2.5% | |
| Jaguar Land Rover Automotive PLC | | | 2.4% | |
| Qwest Communications International Inc. | | | 2.3% | |
| 1 | Includes 10.0% (as a percentage of total investments) in emerging markets countries. |
25
| | |
| JHB | | Nuveen High Income November 2021 Target Term Fund Performance Overview and Holding Summaries as of June 30, 2018 |
Refer to the Glossary of Terms Used in this Report for further definition of the terms used within this section.
Average Annual Total Returns as of June 30, 2018
| | | | | | | | | | | | |
| | | Cumulative | | | Average Annual | |
| | | 6-Month | | | 1-Year | | | Since
Inception | |
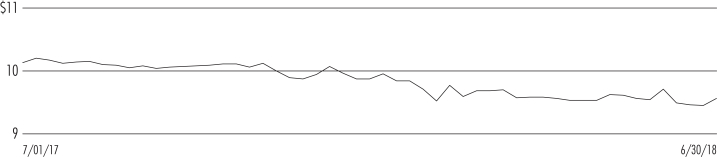
| JHB at NAV | | | 0.86% | | | | 3.47% | | | | 6.11% | |
| JHB at Share Price | | | (1.13)% | | | | 0.34% | | | | 3.25% | |
| Bloomberg Barclays U.S. High Yield 1-5 Year Cash Pay 2% Issuer Capped Index | | | 1.93% | | | | 4.00% | | | | 6.46% | |
Since inception returns are from 8/23/16. Past performance is not predictive of future results. Current performance may be higher or lower than the data shown. Returns do not reflect the deduction of taxes that shareholders may have to pay on Fund distributions or upon the sale of Fund shares. Returns at NAV are net of Fund expenses, and assume reinvestment of distributions. Comparative index return information is provided for the Fund’s shares at NAV only. Indexes are not available for direct investment.
Share Price Performance — Weekly Closing Price
26
This data relates to the securities held in the Fund’s portfolio of investments as of the end of the reporting period. It should not be construed as a measure of performance for the Fund itself. Holdings are subject to change.
For financial reporting purposes, the ratings disclosed are the highest rating given by one of the following national rating agencies: Standard & Poor’s Group, Moody’s Investors Service, Inc. or Fitch, Inc. This treatment of split-rated securities may differ from that used for other purposes, such as for Fund investment policies. Credit ratings are subject to change. AAA, AA, A and BBB are investment grade ratings; BB, B, CCC, CC, C and D are below-investment grade ratings. Holdings designated N/R are not rated by these national rating agencies.
Fund Allocation
(% of net assets)
| | | | |
| Corporate Bonds | | | 129.6% | |
| Sovereign Debt | | | 1.6% | |
| Convertible Bonds | | | 0.7% | |
| Other Assets Less Liabilities | | | 2.4% | |
Net Assets Plus Borrowings | | | 134.3% | |
| Borrowings | | | (34.3)% | |
Net Assets | | | 100% | |
Country Allocation
(% of total investments)1
| | | | |
| United States | | | 73.8% | |
| Canada | | | 4.4% | |
| Luxembourg | | | 2.9% | |
| United Kingdom | | | 2.7% | |
| Japan | | | 2.1% | |
| China | | | 1.5% | |
| Brazil | | | 1.4% | |
| Italy | | | 1.3% | |
| Israel | | | 0.9% | |
| Bermuda | | | 0.9% | |
| Other | | | 8.1% | |
Total | | | 100% | |
Portfolio Composition
(% of total investments)
| | | | |
| Oil, Gas & Consumable Fuels | | | 11.9% | |
| Media | | | 7.8% | |
| Metals & Mining | | | 6.1% | |
| Diversified Financial Services | | | 5.5% | |
| Health Care Providers & Services | | | 5.2% | |
| Household Durables | | | 4.8% | |
| Equity Real Estate Investment Trusts | | | 3.9% | |
| Hotels, Restaurants & Leisure | | | 3.6% | |
| Specialty Retail | | | 3.4% | |
| Consumer Finance | | | 3.3% | |
| Independent Power & Renewable Electricity Producers | | | 3.2% | |
| Commercial Services & Supplies | | | 3.1% | |
| Aerospace & Defense | | | 2.9% | |
| Wireless Telecommunication Services | | | 2.6% | |
| Technology Hardware, Storage & Peripherals | | | 2.4% | |
| Chemicals | | | 2.3% | |
| Airlines | | | 2.2% | |
| Pharmaceuticals | | | 2.0% | |
| Diversified Telecommunication Services | | | 2.0% | |
| Banks | | | 1.5% | |
| Other | | | 19.1% | |
| Sovereign Debt | | | 1.2% | |
Total | | | 100% | |
Portfolio Credit Quality
(% of total long-term investments)
| | | | |
| BBB | | | 7.0% | |
| BB or Lower | | | 90.7% | |
| N/R (not rated) | | | 2.3% | |
Total | | | 100% | |
Top Five Issuers
(% of total investments)
| | | | |
| CenturyLink Inc. | | | 1.6% | |
| Bombardier Inc. | | | 1.2% | |
| Icahn Enterprises LP | | | 1.2% | |
| iStar Inc. | | | 1.2% | |
| Cequel Communications Holdings I LLC | | | 1.2% | |
| 1 | Includes 10.1% (as a percentage of total investments) in emerging markets countries. |
27
Shareholder Meeting Report
The annual meeting of shareholders was held in the offices of Nuveen on April 11, 2018 for JHY, JHD, JHA and JHB; at this meeting the shareholders were asked to elect Board Members.
| | | | | | | | | | | | | | | | |
| | | JHY | | | JHD | | | JHA | | | JHB | |
| | | Common
Shares | | | Common
Shares | | | Common
Shares | | | Common
Shares | |
Approval of the Board Members was reached as follows: | | | | | | | | | | | | | | | | |
Margo L. Cook | | | | | | | | | | | | | | | | |
For | | | 13,817,130 | | | | 23,455,104 | | | | 24,496,648 | | | | 48,981,010 | |
Withhold | | | 134,545 | | | | 652,872 | | | | 1,463,578 | | | | 723,361 | |
Total | | | 13,951,675 | | | | 24,107,976 | | | | 25,960,226 | | | | 49,704,371 | |
Jack B. Evans | | | | | | | | | | | | | | | | |
For | | | 13,831,408 | | | | 23,471,008 | | | | 24,516,862 | | | | 48,966,316 | |
Withhold | | | 120,267 | | | | 636,968 | | | | 1,443,364 | | | | 738,055 | |
Total | | | 13,951,675 | | | | 24,107,976 | | | | 25,960,226 | | | | 49,704,371 | |
Albin F. Moschner | | | | | | | | | | | | | | | | |
For | | | 13,830,929 | | | | 23,484,288 | | | | 24,534,562 | | | | 48,972,573 | |
Withhold | | | 120,746 | | | | 623,688 | | | | 1,425,664 | | | | 731,798 | |
Total | | | 13,951,675 | | | | 24,107,976 | | | | 25,960,226 | | | | 49,704,371 | |
William J. Schneider | | | | | | | | | | | | | | | | |
For | | | 13,831,408 | | | | 23,463,806 | | | | 24,524,721 | | | | 48,957,796 | |
Withhold | | | 120,267 | | | | 644,170 | | | | 1,435,505 | | | | 746,575 | |
Total | | | 13,951,675 | | | | 24,107,976 | | | | 25,960,226 | | | | 49,704,371 | |
28
| | |
| JHY | | Nuveen High Income 2020 Target Term
Fund Portfolio of Investments June 30, 2018 |
| | | (Unaudited) |
| | | | | | | | | | | | | | | | | | | | |
Principal
Amount (000) | | | Description (1) | | Coupon | | | Maturity | | | Ratings (2) | | | Value | |
| |
| | | | LONG-TERM INVESTMENTS – 137.1% (99.6% of Total Investments) | |
| |
| | | | CORPORATE BONDS – 130.5% (94.8% of Total Investments) | |
| |
| | | | Aerospace & Defense – 4.1% | |
| | | | | |
| $ | 200 | | | Alcoa Inc. | | | 6.150% | | | | 8/15/20 | | | | BBB– | | | $ | 208,100 | |
| | 550 | | | Alcoa Inc. | | | 5.400% | | | | 4/15/21 | | | | BBB– | | | | 565,125 | |
| | 1,250 | | | Bombardier Inc., 144A | | | 7.750% | | | | 3/15/20 | | | | B | | | | 1,318,750 | |
| | 1,500 | | | TransDigm Inc. | | | 5.500% | | | | 10/15/20 | | | | B– | | | | 1,500,000 | |
| | 2,700 | | | Triumph Group Inc. | | | 4.875% | | | | 4/01/21 | | | | B– | | | | 2,598,750 | |
| | 6,200 | | | Total Aerospace & Defense | | | | | | | | | | | | | | | 6,190,725 | |
| |
| | | | Airlines – 6.9% | |
| | | | | |
| | 250 | | | Air Canada 2015-1C Pass-Through Trust, 144A | | | 5.000% | | | | 3/15/20 | | | | BB+ | | | | 251,700 | |
| | 2,344 | | | Air Canada, 144A | | | 7.750% | | | | 4/15/21 | | | | BB | | | | 2,502,220 | |
| | 2,325 | | | American Airlines Group Inc., 144A | | | 4.625% | | | | 3/01/20 | | | | BB– | | | | 2,313,375 | |
| | 128 | | | Continental Airlines 1999-1 Class A Pass-Through Trust | | | 6.545% | | | | 2/02/19 | | | | A+ | | | | 128,895 | |
| | 3,000 | | | Delta Air Lines Inc. | | | 3.400% | | | | 4/19/21 | | | | Baa3 | | | | 2,986,272 | |
| | 2,372 | | | Virgin Australia Holdings Limited, 144A | | | 8.500% | | | | 11/15/19 | | | | B– | | | | 2,395,720 | |
| | 10,419 | | | Total Airlines | | | | | | | | | | | | | | | 10,578,182 | |
| |
| | | | Banks – 2.8% | |
| | | | | |
| | 2,315 | | | CIT Group Inc. | | | 4.125% | | | | 3/09/21 | | | | BB+ | | | | 2,300,531 | |
| | 2,000 | | | Popular Inc. | | | 7.000% | | | | 7/01/19 | | | | BB– | | | | 2,030,000 | |
| | 4,315 | | | Total Banks | | | | | | | | | | | | | | | 4,330,531 | |
| |
| | | | Building Products – 3.1% | |
| | | | | |
| | 2,000 | | | Euramax International Inc., 144A | | | 12.000% | | | | 8/15/20 | | | | B– | | | | 2,100,000 | |
| | 2,655 | | | Taylor Morrison Monarch Communities, 144A | | | 5.250% | | | | 4/15/21 | | | | BB | | | | 2,655,000 | |
| | 4,655 | | | Total Building Products | | | | | | | | | | | | | | | 4,755,000 | |
| |
| | | | Chemicals – 1.8% | |
| | | | | |
| | 200 | | | CF Industries Inc. | | | 7.125% | | | | 5/01/20 | | | | BB+ | | | | 211,250 | |
| | 1,000 | | | Hexion Inc. | | | 10.000% | | | | 4/15/20 | | | | CCC+ | | | | 990,000 | |
| | 1,500 | | | Huntsman International LLC | | | 4.875% | | | | 11/15/20 | | | | BB+ | | | | 1,522,500 | |
| | 2,700 | | | Total Chemicals | | | | | | | | | | | | | | | 2,723,750 | |
| |
| | | | Commercial Services & Supplies – 4.3% | |
| | | | | |
| | 400 | | | APX Group, Inc. | | | 6.375% | | | | 12/01/19 | | | | B1 | | | | 400,500 | |
| | 1,550 | | | APX Group, Inc. | | | 8.750% | | | | 12/01/20 | | | | CCC | | | | 1,483,505 | |
| | 2,000 | | | Pitney Bowes Inc. | | | 3.625% | | | | 9/15/20 | | | | BBB– | | | | 1,950,000 | |
| | 2,645 | | | R.R. Donnelley & Sons Company | | | 7.875% | | | | 3/15/21 | | | | B | | | | 2,684,675 | |
| | 6,595 | | | Total Commercial Services & Supplies | | | | | | | | | | | | | | | 6,518,680 | |
| |
| | | | Construction & Engineering – 1.0% | |
| | | | | |
| | 1,500 | | | HC2 Holdings, Inc., 144A | | | 11.000% | | | | 12/01/19 | | | | B– | | | | 1,522,500 | |
| |
| | | | Consumer Finance – 4.8% | |
| | | | | |
| | 500 | | | Ally Financial Inc. | | | 7.500% | | | | 9/15/20 | | | | BB+ | | | | 535,000 | |
| | 2,000 | | | Ally Financial Inc. | | | 4.250% | | | | 4/15/21 | | | | BB+ | | | | 2,000,000 | |
| | 2,400 | | | Credit Acceptance Corporation | | | 6.125% | | | | 2/15/21 | | | | BB | | | | 2,409,000 | |
| | 2,370 | | | Navient Corporation | | | 5.000% | | | | 10/26/20 | | | | BB | | | | 2,364,075 | |
| | 7,270 | | | Total Consumer Finance | | | | | | | | | | | | | | | 7,308,075 | |
29
| | |
| JHY | | Nuveen High Income 2020 Target Term Fund (continued) |
| | Portfolio of Investments June 30, 2018 |
| | (Unaudited) |
| | | | | | | | | | | | | | | | | | | | |
Principal
Amount (000) | | | Description (1) | | Coupon | | | Maturity | | | Ratings (2) | | | Value | |
| |
| | | | Containers & Packaging – 1.2% | |
| | | | | |
| $ | 1,333 | | | Reynolds Group | | | 5.750% | | | | 10/15/20 | | | | B+ | | | $ | 1,337,520 | |
| | 450 | | | Reynolds Group | | | 6.875% | | | | 2/15/21 | | | | B+ | | | | 456,130 | |
| | 1,783 | | | Total Containers & Packaging | | | | | | | | | | | | | | | 1,793,650 | |
| |
| | | | Diversified Financial Services – 6.8% | |
| | | | | |
| | 2,000 | | | Jefferies Finance LLC Corporation, 144A | | | 7.375% | | | | 4/01/20 | | | | BB– | | | | 2,009,460 | |
| | 1,000 | | | Jefferies Finance LLC Corporation, 144A | | | 7.500% | | | | 4/15/21 | | | | BB– | | | | 1,015,000 | |
| | 3,000 | | | Lincoln Finance LTD, 144A | | | 7.375% | | | | 4/15/21 | | | | BB+ | | | | 3,097,125 | |
| | 1,960 | | | Nationstar Mortgage LLC Capital Corporation | | | 7.875% | | | | 10/01/20 | | | | B+ | | | | 1,967,350 | |
| | 2,375 | | | Park Aerospace Holdings Limited., 144A | | | 3.625% | | | | 3/15/21 | | | | BB | | | | 2,300,781 | |
| | 10,335 | | | Total Diversified Financial Services | | | | | | | | | | | | | | | 10,389,716 | |
| |
| | | | Diversified Telecommunication Services – 5.1% | |
| | | | | |
| | 3,735 | | | CenturyLink Inc. | | | 5.625% | | | | 4/01/20 | | | | BB | | | | 3,777,019 | |
| | 2,000 | | | Frontier Communications Corporation | | | 8.500% | | | | 4/15/20 | | | | B | | | | 2,043,780 | |
| | 1,190 | | | Level 3 Financing Inc. | | | 6.125% | | | | 1/15/21 | | | | BB | | | | 1,197,438 | |
| | 840 | | | Windstream Corporation | | | 7.750% | | | | 10/15/20 | | | | B | | | | 753,900 | |
| | 7,765 | | | Total Diversified Telecommunication Services | | | | | | | | | | | | | | | 7,772,137 | |
| |
| | | | Energy Equipment & Services – 1.3% | |
| | | | | |
| | 2,025 | | | Resolute Energy Corporation | | | 8.500% | | | | 5/01/20 | | | | B+ | | | | 2,023,734 | |
| |
| | | | Equity Real Estate Investment Trusts – 4.6% | |
| | | | | |
| | 2,750 | | | CoreCivic, Inc. | | | 4.125% | | | | 4/01/20 | | | | Ba1 | | | | 2,743,125 | |
| | 800 | | | Gaming and Leisure Products Inc., GLP Capital LP Financing II Inc. | | | 4.875% | | | | 11/01/20 | | | | BBB– | | | | 809,000 | |
| | 800 | | | Gaming and Leisure Products Inc., GLP Capital LP Financing II Inc. | | | 4.375% | | | | 4/15/21 | | | | BBB– | | | | 800,000 | |
| | 2,000 | | | iStar Inc. | | | 5.000% | | | | 7/01/19 | | | | BB | | | | 1,995,000 | |
| | 750 | | | iStar Inc. | | | 4.625% | | | | 9/15/20 | | | | BB | | | | 738,750 | |
| | 7,100 | | | Total Equity Real Estate Investment Trusts | | | | | | | | | | | | | | | 7,085,875 | |
| |
| | | | Food Products – 1.7% | |
| | | | | |
| | 2,060 | | | Marfrig Holding Europe BV, 144A | | | 6.875% | | | | 6/24/19 | | | | BB– | | | | 2,093,475 | |
| | 500 | | | Smithfield Foods Inc., 144A | | | 2.700% | | | | 1/31/20 | | | | BBB | | | | 492,810 | |
| | 2,560 | | | Total Food Products | | | | | | | | | | | | | | | 2,586,285 | |
| |
| | | | Gas Utilities – 1.1% | |
| | | | | |
| | 1,860 | | | Ferrellgas LP | | | 6.500% | | | | 5/01/21 | | | | B– | | | | 1,706,550 | |
| |
| | | | Health Care Providers & Services – 5.0% | |
| | | | | |
| | 285 | | | Acadia Healthcare | | | 6.125% | | | | 3/15/21 | | | | B | | | | 287,850 | |
| | 650 | | | Centene Corporation | | | 5.625% | | | | 2/15/21 | | | | BB+ | | | | 663,731 | |
| | 2,500 | | | HCA Holdings Inc. | | | 6.250% | | | | 2/15/21 | | | | Ba2 | | | | 2,593,750 | |
| | 1,000 | | | HCA Inc. | | | 6.500% | | | | 2/15/20 | | | | BBB– | | | | 1,041,250 | |
| | 3,000 | | | Tenet Healthcare Corporation | | | 4.500% | | | | 4/01/21 | | | | BB– | | | | 2,970,000 | |
| | 7,435 | | | Total Health Care Providers & Services | | | | | | | | | | | | | | | 7,556,581 | |
| |
| | | | Hotels, Restaurants & Leisure – 5.2% | |
| | | | | |
| | 750 | | | International Game Technology PLC, 144A | | | 5.625% | | | | 2/15/20 | | | | BB+ | | | | 759,375 | |
| | 3,006 | | | MGM Resorts International Inc. | | | 6.750% | | | | 10/01/20 | | | | BB | | | | 3,148,785 | |
| | 1,500 | | | Scientific Games International Inc. | | | 6.250% | | | | 9/01/20 | | | | CCC+ | | | | 1,500,000 | |
| | 2,500 | | | Studio City Co Ltd, 144A | | | 5.875% | | | | 11/30/19 | | | | BB– | | | | 2,525,000 | |
| | 7,756 | | | Total Hotels, Restaurants & Leisure | | | | | | | | | | | | | | | 7,933,160 | |
| |
| | | | Household Durables – 5.9% | |
| | | | | |
| | 1,748 | | | Brookfield Residential Properties Inc., 144A | | | 6.500% | | | | 12/15/20 | | | | B+ | | | | 1,769,850 | |
| | 1,830 | | | Lennar Corp | | | 8.375% | | | | 1/15/21 | | | | BB+ | | | | 1,999,275 | |
| | 1,500 | | | MDC Holdings Inc. | | | 5.625% | | | | 2/01/20 | | | | BBB– | | | | 1,542,000 | |
| | 2,299 | | | M-I Homes Inc. | | | 6.750% | | | | 1/15/21 | | | | BB– | | | | 2,370,361 | |
| | 1,000 | | | PulteGroup Inc. | | | 4.250% | | | | 3/01/21 | | | | BB+ | | | | 1,000,700 | |
| | 250 | | | Tri Pointe Holdings Inc. | | | 4.375% | | | | 6/15/19 | | | | BB– | | | | 251,300 | |
| | 8,627 | | | Total Household Durables | | | | | | | | | | | | | | | 8,933,486 | |
30
| | | | | | | | | | | | | | | | | | | | |
Principal
Amount (000) | | | Description (1) | | Coupon | | | Maturity | | | Ratings (2) | | | Value | |
| |
| | | | Independent Power & Renewable Electricity Producers – 4.5% | |
| | | | | |
| $ | 1,500 | | | AES Corp/VA | | | 4.000% | | | | 3/15/21 | | | | BB+ | | | $ | 1,492,500 | |
| | 2,000 | | | Atlantica Yield PLC, 144A | | | 7.000% | | | | 11/15/19 | | | | BB+ | | | | 2,070,000 | |
| | 1,361 | | | DPL, Inc. | | | 6.750% | | | | 10/01/19 | | | | BBB– | | | | 1,403,531 | |
| | 2,000 | | | Talen Energy Supply LLC, 144A | | | 4.625% | | | | 7/15/19 | | | | B– | | | | 1,962,073 | |
| | 6,861 | | | Total Independent Power & Renewable Electricity Producers | | | | | | | | | | | | | | | 6,928,104 | |
| |
| | | | Industrial Conglomerates – 2.1% | |
| | | | | |
| | 2,650 | | | Icahn Enterprises Finance | | | 6.000% | | | | 8/01/20 | | | | BB+ | | | | 2,683,125 | |
| | 500 | | | Techniplas, LLC, 144A | | | 10.000% | | | | 5/01/20 | | | | B– | | | | 445,000 | |
| | 3,150 | | | Total Industrial Conglomerates | | | | | | | | | | | | | | | 3,128,125 | |
| |
| | | | Insurance – 0.3% | |
| | | | | |
| | 500 | | | Genworth Financial Inc. | | | 7.700% | | | | 6/15/20 | | | | B | | | | 515,000 | |
| |
| | | | Internet & Direct Marketing Retail – 2.3% | |
| | | | | |
| | 3,370 | | | Netflix Incorporated | | | 5.375% | | | | 2/01/21 | | | | Ba3 | | | | 3,463,686 | |
| |
| | | | Leisure Products – 1.6% | |
| | | | | |
| | 2,400 | | | Mattel Inc. | | | 4.350% | | | | 10/01/20 | | | | B+ | | | | 2,388,000 | |
| |
| | | | Machinery – 1.9% | |
| | | | | |
| | 2,697 | | | Briggs & Stratton Corp | | | 6.875% | | | | 12/15/20 | | | | BB | | | | 2,865,563 | |
| |
| | | | Media – 6.2% | |
| | | | | |
| | 1,300 | | | Cablevision Systems Corporation | | | 8.000% | | | | 4/15/20 | | | | B– | | | | 1,364,610 | |
| | 2,790 | | | Clear Channel Worldwide | | | 7.625% | | | | 3/15/20 | | | | CCC+ | | | | 2,773,372 | |
| | 350 | | | Dish DBS Corporation | | | 7.875% | | | | 9/01/19 | | | | BB | | | | 363,125 | |
| | 2,500 | | | Dish DBS Corporation | | | 5.125% | | | | 5/01/20 | | | | BB | | | | 2,475,000 | |
| | 2,001 | | | Mediacom Broadband LLC | | | 5.500% | | | | 4/15/21 | | | | B+ | | | | 2,021,010 | |
| | 400 | | | Sinclair Television Group | | | 5.375% | | | | 4/01/21 | | | | B+ | | | | 403,000 | |
| | 9,341 | | | Total Media | | | | | | | | | | | | | | | 9,400,117 | |
| |
| | | | Metals & Mining – 8.6% | |
| | | | | |
| | 3,050 | | | Allegheny Technologies Inc. | | | 5.950% | | | | 1/15/21 | | | | B | | | | 3,065,250 | |
| | 1,500 | | | ArcelorMittal | | | 5.750% | | | | 3/01/21 | | | | BBB– | | | | 1,563,000 | |
| | 3,250 | | | Eldorado Gold Corporation, 144A | | | 6.125% | | | | 12/15/20 | | | | B | | | | 3,136,250 | |
| | 2,500 | | | First Quantum Minerals Limited, 144A | | | 7.000% | | | | 2/15/21 | | | | B | | | | 2,525,000 | |
| | 1,000 | | | Gold Fields Orogen Holdings BVI Limited, 144A | | | 4.875% | | | | 10/07/20 | | | | Baa3 | | | | 997,320 | |
| | 1,750 | | | United States Steel Corporation | | | 7.375% | | | | 4/01/20 | | | | BB– | | | | 1,855,000 | |
| | 13,050 | | | Total Metals & Mining | | | | | | | | | | | | | | | 13,141,820 | |
| |
| | | | Mortgage Real Estate Investment Trusts – 1.9% | |
| | | | | |
| | 3,000 | | | Starwood Property Trust Inc., 144A | | | 3.625% | | | | 2/01/21 | | | | BB– | | | | 2,932,500 | |
| |
| | | | Multiline Retail – 1.4% | |
| | | | | |
| | 2,150 | | | J.C. Penney Corporation Inc. | | | 5.650% | | | | 6/01/20 | | | | B+ | | | | 2,112,375 | |
| |
| | | | Oil, Gas & Consumable Fuels – 9.8% | |
| | | | | |
| | 2,000 | | | Calumet Specialty Products | | | 6.500% | | | | 4/15/21 | | | | B– | | | | 1,990,000 | |
| | 225 | | | DCP Midstream Operating LP | | | 2.700% | | | | 4/01/19 | | | | BB+ | | | | 222,750 | |
| | 1,750 | | | DCP Midstream Operating LP, 144A | | | 5.350% | | | | 3/15/20 | | | | BB+ | | | | 1,782,813 | |
| | 2,650 | | | NGL Energy Partners LP/Fin Co | | | 5.125% | | | | 7/15/19 | | | | B+ | | | | 2,653,313 | |
| | 1,865 | | | Nustar Energy LP | | | 6.750% | | | | 2/01/21 | | | | BB | | | | 1,953,588 | |
| | 1,740 | | | NuStar Logistics LP | | | 4.800% | | | | 9/01/20 | | | | BB | | | | 1,744,350 | |
| | 980 | | | Petrobras International Finance Company | | | 5.375% | | | | 1/27/21 | | | | Ba2 | | | | 987,154 | |
| | 1,710 | | | Teekay Corporation | | | 8.500% | | | | 1/15/20 | | | | B+ | | | | 1,761,300 | |
| | 750 | | | Whiting Petroleum Corporation | | | 5.750% | | | | 3/15/21 | | | | BB– | | | | 766,478 | |
| | 1,125 | | | YPF Sociedad Anonima, 144A | | | 8.500% | | | | 3/23/21 | | | | B2 | | | | 1,143,563 | |
| | 14,795 | | | Total Oil, Gas & Consumable Fuels | | | | | | | | | | | | | | | 15,005,309 | |
| |
| | | | Pharmaceuticals – 0.9% | |
| | | | | |
| | 1,500 | | | Teva Pharmaceuticals IV BV | | | 2.250% | | | | 3/18/20 | | | | BB | | | | 1,445,849 | |
31
| | |
| JHY | | Nuveen High Income 2020 Target Term Fund (continued) |
| | Portfolio of Investments June 30, 2018 |
| | (Unaudited) |
| | | | | | | | | | | | | | | | | | | | |
Principal
Amount (000) | | | Description (1) | | Coupon | | | Maturity | | | Ratings (2) | | | Value | |
| |
| | | | Professional Services – 1.3% | |
| | | | | |
| $ | 2,000 | | | Nielsen Finance LLC / Nielsen Finance Co | | | 4.500% | | | | 10/01/20 | | | | BB+ | | | $ | 2,000,000 | |
| |
| | | | Road & Rail – 2.5% | |
| | | | | |
| | 3,975 | | | The Hertz Corporation | | | 5.875% | | | | 10/15/20 | | | | B– | | | | 3,885,563 | |
| |
| | | | Software – 1.0% | |
| | | | | |
| | 1,540 | | | Infor Us Inc., 144A | | | 5.750% | | | | 8/15/20 | | | | BB | | | | 1,558,288 | |
| |
| | | | Specialty Retail – 7.0% | |
| | | | | |
| | 3,200 | | | GameStop Corporation, 144A | | | 6.750% | | | | 3/15/21 | | | | Ba1 | | | | 3,240,000 | |
| | 1,500 | | | Gap, Inc. | | | 5.950% | | | | 4/12/21 | | | | Baa2 | | | | 1,570,808 | |
| | 3,878 | | | Limited Brands Inc. | | | 6.625% | | | | 4/01/21 | | | | BB+ | | | | 4,091,290 | |
| | 1,830 | | | Rent-A-Center, Inc. | | | 4.750% | | | | 5/01/21 | | | | B3 | | | | 1,830,000 | |
| | 10,408 | | | Total Specialty Retail | | | | | | | | | | | | | | | 10,732,098 | |
| | | | | |
| | | | Technology Hardware, Storage & Peripherals – 3.8% | | | | | | | | | | | | |
| | | | | |
| | 2,500 | | | EMC Corporation | | | 2.650% | | | | 6/01/20 | | | | Ba2 | | | | 2,427,749 | |
| | 3,430 | | | NCR Corporation | | | 4.625% | | | | 2/15/21 | | | | BB | | | | 3,404,275 | |
| | 5,930 | | | Total Technology Hardware, Storage & Peripherals | | | | | | | | | | | | | | | 5,832,024 | |
| |
| | | | Thrifts & Mortgage Finance – 0.2% | |
| | | | | |
| | 100 | | | Radian Group Inc. | | | 5.250% | | | | 6/15/20 | | | | BB+ | | | | 101,000 | |
| | 143 | | | Radian Group Inc. | | | 7.000% | | | | 3/15/21 | | | | BB+ | | | | 151,580 | |
| | 243 | | | Total Thrifts & Mortgage Finance | | | | | | | | | | | | | | | 252,580 | |
| |
| | | | Tobacco – 1.7% | |
| | | | | |
| | 2,500 | | | Alliance One International Inc., 144A | | | 8.500% | | | | 4/15/21 | | | | B2 | | | | 2,575,000 | |
| |
| | | | Trading Companies & Distributors – 1.2% | |
| | | | | |
| | 1,782 | | | Aircastle Limited | | | 5.125% | | | | 3/15/21 | | | | BBB– | | | | 1,819,618 | |
| |
| | | | Transportation Infrastructure – 0.8% | |
| | | | | |
| | 1,200 | | | Navigator Holdings Limited, 144A, Reg S | | | 7.750% | | | | 2/10/21 | | | | N/R | | | | 1,172,882 | |
| |
| | | | Wireless Telecommunication Services – 2.8% | |
| | | | | |
| | 2,500 | | | Digicel Limited, 144A | | | 6.000% | | | | 4/15/21 | | | | B1 | | | | 2,256,250 | |
| | 2,000 | | | Sprint Communications Inc. | | | 7.000% | | | | 8/15/20 | | | | B+ | | | | 2,070,000 | |
| | 4,500 | | | Total Wireless Telecommunication Services | | | | | | | | | | | | | | | 4,326,250 | |
| $ | 197,792 | | | Total Corporate Bonds (cost $200,827,965) | | | | | | | | | | | | | | | 199,189,368 | |
| | | | | |
Principal
Amount (000) | | | Description (1) | | Coupon | | | Maturity | | | Ratings (2) | | | Value | |
| |
| | | | CONVERTIBLE BONDS – 3.6% (2.6% of Total Investments) | |
| |
| | | | Capital Markets – 1.1% | |
| | | | | |
| $ | 1,780 | | | Prospect Capital Corporation | | | 4.750% | | | | 4/15/20 | | | | BBB– | | | $ | 1,777,606 | |
| |
| | | | Electrical Equipment – 1.4% | |
| | | | | |
| | 2,250 | | | SolarCity Corporation | | | 1.625% | | | | 11/01/19 | | | | N/R | | | | 2,093,578 | |
| |
| | | | Independent Power & Renewable Electricity Producers – 1.0% | |
| | | | | |
| | 1,500 | | | NRG Yield Inc., 144A | | | 3.250% | | | | 6/01/20 | | | | N/R | | | | 1,488,201 | |
| |
| | | | Mortgage Real Estate Investment Trusts – 0.1% | |
| | | | | |
| | 150 | | | Colony Financial Inc. | | | 3.875% | | | | 1/15/21 | | | | N/R | | | | 142,500 | |
| $ | 5,680 | | | Total Convertible Bonds (cost $5,540,939) | | | | | | | | | | | | | | | 5,501,885 | |
32
| | | | | | | | | | | | | | | | | | | | |
Principal
Amount (000) | | | Description (1) | | Coupon | | | Maturity | | | Ratings (2) | | | Value | |
| |
| | | | SOVEREIGN DEBT – 3.0% (2.2% of Total Investments) | |
| |
| | | | Argentina – 1.0% | |
| | | | | |
| $ | 1,500 | | | Republic of Argentina | | | 6.875% | | | | 4/22/21 | | | | B+ | | | $ | 1,477,500 | |
| |
| | | | Egypt – 1.0% | |
| | | | | |
| | 1,500 | | | Arab Republic of Egypt, 144A | | | 5.750% | | | | 4/29/20 | | | | B | | | | 1,518,435 | |
| |
| | | | Honduras – 0.4% | |
| | | | | |
| | 500 | | | Honduras Government, 144A | | | 8.750% | | | | 12/16/20 | | | | BB– | | | | 540,475 | |
| |
| | | | Turkey – 0.6% | |
| | | | | |
| | 1,000 | | | Republic of Turkey | | | 5.625% | | | | 3/30/21 | | | | BB+ | | | | 994,030 | |
| $ | 4,500 | | | Total Sovereign Debt (cost $4,689,341) | | | | | | | | | | | | | | | 4,530,440 | |
| | | | Total Long-Term Investments (cost $211,058,245) | | | | | | | | | | | | | | | 209,221,693 | |
| | | | | |
Principal
Amount (000) | | | Description (1) | | Coupon | | | Maturity | | | | | | Value | |
| |
| | | | SHORT-TERM INVESTMENTS – 0.6% (0.4% of Total Investments) | |
| |
| | | | REPURCHASE AGREEMENTS – 0.6% (0.4% of Total Investments) | |
| | | | | |
| $ | 900 | | | Repurchase Agreement with Fixed Income Clearing Corporation, dated 6/29/18, repurchase price $899,841, collateralized by $960,000 U.S. Treasury Notes, 2.000%, due 2/15/25, value $920,079 | | | 0.900% | | | | 7/02/18 | | | | | | | $ | 899,774 | |
| | | | Total Short-Term Investments (cost $899,774) | | | | | | | | | | | | | | | 899,774 | |
| | | | Total Investments (cost $211,958,019) – 137.7% | | | | | | | | | | | | | | | 210,121,467 | |
| | | | Borrowings – (40.3)% (3), (4) | | | | | | | | | | | | | | | (61,500,000 | ) |
| | | | Other Assets Less Liabilities – 2.6% | | | | | | | | | | | | | | | 3,978,885 | |
| | | | Net Assets – 100% | | | | | | | | | | | | | | $ | 152,600,352 | |
For Fund portfolio compliance purposes, the Fund’s industry classifications refer to any one or more of the industry sub-classifications used by one or more widely recognized market indexes or ratings group indexes, and/or as defined by Fund management. This definition may not apply for purposes of this report, which may combine industry sub-classifications into sectors for reporting ease.
| (1) | All percentages shown in the Portfolio of Investments are based on net assets unless otherwise noted. |
| (2) | For financial reporting purposes, the ratings disclosed are the highest of Standard & Poor’s Group (“Standard & Poor’s”), Moody’s Investors Service, Inc. (“Moody’s”) or Fitch, Inc. (“Fitch”) rating. This treatment of split-rated securities may differ from that used for other purposes, such as for Fund investment policies. Ratings below BBB by Standard & Poor’s, Baa by Moody’s or BBB by Fitch are considered to be below investment grade. Holdings designated N/R are not rated by any of these national rating agencies. |
| (3) | Borrowings as a percentage of Total Investments is 29.3%. |
| (4) | The Fund may pledge up to 100% of its eligible investments (excluding any investments separately pledged as collateral for specific investments in derivatives) in the Portfolio of Investments as collateral for borrowings. |
| 144A | Investment is exempt from registration under Rule 144A of the Securities Act of 1933, as amended. These investments may only be resold in transactions exempt from registration, which are normally those transactions with qualified institutional buyers. |
| Reg S | Regulation S allows U.S. companies to sell securities to persons or entities located outside of the United States without registering those securities with the Securities and Exchange Commission. Specifically, Regulation S provides a safe harbor from the registration requirements of the Securities Act for the offers and sales of securities by both foreign and domestic issuers that are made outside the United States. |
See accompanying notes to financial statements.
33
| | |
| JHD | | Nuveen High Income December 2019
Target Term Fund Portfolio of Investments June 30, 2018 |
| | | (Unaudited) |
| | | | | | | | | | | | | | | | | | | | |
Principal
Amount (000) | | | Description (1) | | Coupon | | | Maturity | | | Ratings (2) | | | Value | |
| |
| | | | LONG-TERM INVESTMENTS – 103.3% (99.9% of Total Investments) | |
| |
| | | | CORPORATE BONDS – 96.5% (93.3% of Total Investments) | |
| |
| | | | Aerospace & Defense – 1.8% | |
| | | | | |
| $ | 4,600 | | | Bombardier Inc., 144A | | | 7.750% | | | | 3/15/20 | | | | B | | | $ | 4,853,000 | |
| |
| | | | Airlines – 4.9% | |
| | | | | |
| | 3,580 | | | Air Canada 2015-1C Pass-Through Trust, 144A | | | 5.000% | | | | 3/15/20 | | | | BB+ | | | | 3,604,344 | |
| | 3,500 | | | American Airlines Group Inc., 144A | | | 5.500% | | | | 10/01/19 | | | | BB– | | | | 3,535,000 | |
| | 2,000 | | | American Airlines Group Inc., 144A | | | 4.625% | | | | 3/01/20 | | | | BB– | | | | 1,990,000 | |
| | 4,235 | | | Virgin Australia Holdings Limited, 144A | | | 8.500% | | | | 11/15/19 | | | | B– | | | | 4,277,350 | |
| | 13,315 | | | Total Airlines | | | | | | | | | | | | | | | 13,406,694 | |
| |
| | | | Auto Components – 0.9% | |
| | | | | |
| | 2,205 | | | American & Axle Manufacturing Inc. | | | 7.750% | | | | 11/15/19 | | | | BB– | | | | 2,315,250 | |
| |
| | | | Automobiles – 3.1% | |
| | | | | |
| | 5,150 | | | Fiat Chrysler Automobiles NV | | | 4.500% | | | | 4/15/20 | | | | BB+ | | | | 5,148,404 | |
| | 722 | | | Jaguar Land Rover Automotive PLC, 144A | | | 4.250% | | | | 11/15/19 | | | | BB+ | | | | 722,000 | |
| | 2,500 | | | Jaguar Land Rover Automotive PLC, 144A | | | 3.500% | | | | 3/15/20 | | | | BB+ | | | | 2,462,500 | |
| | 8,372 | | | Total Automobiles | | | | | | | | | | | | | | | 8,332,904 | |
| |
| | | | Banks – 3.5% | |
| | | | | |
| | 3,900 | | | CIT Group Inc. | | | 5.375% | | | | 5/15/20 | | | | BB+ | | | | 4,002,375 | |
| | 5,082 | | | Popular Inc. | | | 7.000% | | | | 7/01/19 | | | | BB– | | | | 5,158,230 | |
| | 250 | | | Royal Bank of Scotland Group PLC | | | 6.400% | | | | 10/21/19 | | | | BBB+ | | | | 259,356 | |
| | 9,232 | | | Total Banks | | | | | | | | | | | | | | | 9,419,961 | |
| |
| | | | Capital Markets – 0.1% | |
| | | | | |
| | 220 | | | Prospect Capital Corporation | | | 5.000% | | | | 7/15/19 | | | | BBB– | | | | 222,728 | |
| |
| | | | Chemicals – 2.8% | |
| | | | | |
| | 4,425 | | | CF Industries Inc. | | | 7.125% | | | | 5/01/20 | | | | BB+ | | | | 4,673,906 | |
| | 2,910 | | | INVISTA Finance LLC, 144A | | | 4.250% | | | | 10/15/19 | | | | BBB– | | | | 2,911,455 | |
| | 75 | | | Methanex Corporation | | | 3.250% | | | | 12/15/19 | | | | Baa3 | | | | 74,741 | |
| | 7,410 | | | Total Chemicals | | | | | | | | | | | | | | | 7,660,102 | |
| |
| | | | Commercial Services & Supplies – 2.4% | |
| | | | | |
| | 2,500 | | | AerCap Ireland Capital Limited / AerCap Global Aviation Trust | | | 3.750% | | | | 5/15/19 | | | | BBB– | | | | 2,514,920 | |
| | 4,110 | | | APX Group, Inc. | | | 6.375% | | | | 12/01/19 | | | | B1 | | | | 4,115,138 | |
| | 6,610 | | | Total Commercial Services & Supplies | | | | | | | | | | | | | | | 6,630,058 | |
| |
| | | | Construction & Engineering – 0.9% | |
| | | | | |
| | 2,500 | | | HC2 Holdings, Inc., 144A | | | 11.000% | | | | 12/01/19 | | | | B– | | | | 2,537,500 | |
| |
| | | | Consumer Finance – 3.3% | |
| | | | | |
| | 3,000 | | | Ally Financial Inc. | | | 4.125% | | | | 3/30/20 | | | | BB+ | | | | 3,003,750 | |
| | 3,680 | | | Navient Corporation | | | 8.000% | | | | 3/25/20 | | | | BB | | | | 3,882,400 | |
| | 1,925 | | | Springleaf Finance Corporation | | | 5.250% | | | | 12/15/19 | | | | B1 | | | | 1,949,063 | |
| | 8,605 | | | Total Consumer Finance | | | | | | | | | | | | | | | 8,835,213 | |
| |
| | | | Containers & Packaging – 0.3% | |
| | | | | |
| | 891 | | | Greif Inc. | | | 7.750% | | | | 8/01/19 | | | | BB– | | | | 922,185 | |
34
| | | | | | | | | | | | | | | | | | | | |
Principal
Amount (000) | | | Description (1) | | Coupon | | | Maturity | | | Ratings (2) | | | Value | |
| |
| | | | Diversified Financial Services – 3.0% | |
| | | | | |
| $ | 4,250 | | | Jefferies Finance LLC Corporation, 144A | | | 7.375% | | | | 4/01/20 | | | | BB– | | | $ | 4,270,103 | |
| | 3,775 | | | Nationstar Mortgage LLC Capital Corporation | | | 9.625% | | | | 5/01/19 | | | | B+ | | | | 3,803,313 | |
| | 8,025 | | | Total Diversified Financial Services | | | | | | | | | | | | | | | 8,073,416 | |
| |
| | | | Diversified Telecommunication Services – 2.9% | |
| | | | | |
| | 6,100 | | | CenturyLink Inc. | | | 5.625% | | | | 4/01/20 | | | | BB | | | | 6,168,625 | |
| | 1,775 | | | Telecom Italia Capital | | | 7.175% | | | | 6/18/19 | | | | BBB– | | | | 1,825,499 | |
| | 7,875 | | | Total Diversified Telecommunication Services | | | | | | | | | | | | | | | 7,994,124 | |
| |
| | | | Electronic Equipment, Instruments & Components – 0.3% | |
| | | | | |
| | 875 | | | Sanmina-SCI Corporation, 144A | | | 4.375% | | | | 6/01/19 | | | | BBB– | | | | 875,000 | |
| |
| | | | Energy Equipment & Services – 0.9% | |
| | | | | |
| | 2,500 | | | Resolute Energy Corporation | | | 8.500% | | | | 5/01/20 | | | | B+ | | | | 2,498,438 | |
| | | | | |
| | | | Equity Real Estate Investment Trusts – 5.1% | | | | | | | | | | | | |
| | | | | |
| | 3,840 | | | CoreCivic, Inc. | | | 4.125% | | | | 4/01/20 | | | | Ba1 | | | | 3,830,400 | |
| | 4,000 | | | iStar Inc. | | | 5.000% | | | | 7/01/19 | | | | BB | | | | 3,990,000 | |
| | 3,000 | | | Realogy Group LLC / Realogy Co-Issuer Corporation, 144A | | | 4.500% | | | | 4/15/19 | | | | B1 | | | | 3,007,500 | |
| | 3,000 | | | Select Income REIT | | | 3.600% | | | | 2/01/20 | | | | BBB– | | | | 2,983,930 | |
| | 13,840 | | | Total Equity Real Estate Investment Trusts | | | | | | | | | | | | | | | 13,811,830 | |
| | | | | |
| | | | Food Products – 1.9% | | | | | | | | | | | | |
| | | | | |
| | 4,000 | | | Marfrig Holding Europe BV, 144A | | | 6.875% | | | | 6/24/19 | | | | BB– | | | | 4,065,000 | |
| | 1,135 | | | Smithfield Foods Inc., 144A | | | 2.700% | | | | 1/31/20 | | | | BBB | | | | 1,118,679 | |
| | 5,135 | | | Total Food Products | | | | | | | | | | | | | | | 5,183,679 | |
| | | | | |
| | | | Health Care Providers & Services – 4.5% | | | | | | | | | | | | |
| | | | | |
| | 5,500 | | | HCA Inc. | | | 6.500% | | | | 2/15/20 | | | | BBB– | | | | 5,726,875 | |
| | 3,000 | | | Tenet Healthcare Corporation | | | 6.750% | | | | 2/01/20 | | | | B– | | | | 3,078,750 | |
| | 3,300 | | | Tenet Healthcare Corporation | | | 4.750% | | | | 6/01/20 | | | | BB– | | | | 3,308,250 | |
| | 11,800 | | | Total Health Care Providers & Services | | | | | | | | | | | | | | | 12,113,875 | |
| | | | | |
| | | | Hotels, Restaurants & Leisure – 5.1% | | | | | | | | | | | | |
| | | | | |
| | 4,410 | | | International Game Technology PLC, 144A | | | 5.625% | | | | 2/15/20 | | | | BB+ | | | | 4,465,125 | |
| | 5,293 | | | MGM Resorts International Inc. | | | 5.250% | | | | 3/31/20 | | | | BB | | | | 5,392,244 | |
| | 4,000 | | | Studio City Co Ltd, 144A | | | 5.875% | | | | 11/30/19 | | | | BB– | | | | 4,040,000 | |
| | 13,703 | | | Total Hotels, Restaurants & Leisure | | | | | | | | | | | | | | | 13,897,369 | |
| | | | | |
| | | | Household Durables – 5.7% | | | | | | | | | | | | |
| | | | | |
| | 2,110 | | | Beazer Homes USA, Inc. | | | 5.750% | | | | 6/15/19 | | | | B– | | | | 2,150,512 | |
| | 1,600 | | | KB Home | | | 4.750% | | | | 5/15/19 | | | | BB– | | | | 1,606,560 | |
| | 2,144 | | | KB Home | | | 8.000% | | | | 3/15/20 | | | | BB– | | | | 2,283,360 | |
| | 187 | | | Lennar Corp | | | 6.625% | | | | 5/01/20 | | | | Baa1 | | | | 196,350 | |
| | 132 | | | Lennar Corporation | | | 4.500% | | | | 6/15/19 | | | | BB+ | | | | 132,330 | |
| | 3,750 | | | Lennar Corporation | | | 4.500% | | | | 11/15/19 | | | | BB+ | | | | 3,773,438 | |
| | 2,925 | | | Meritage Homes Corporation | | | 7.150% | | | | 4/15/20 | | | | BB | | | | 3,085,875 | |
| | 300 | | | Toll Brothers Finance Corp | | | 6.750% | | | | 11/01/19 | | | | BBB– | | | | 312,375 | |
| | 1,968 | | | Tri Pointe Holdings Inc. | | | 4.375% | | | | 6/15/19 | | | | BB– | | | | 1,978,234 | |
| | 15,116 | | | Total Household Durables | | | | | | | | | | | | | | | 15,519,034 | |
| |
| | | | Independent Power & Renewable Electricity Producers – 4.8% | |
| | | | | |
| | 5,364 | | | Atlantica Yield PLC, 144A | | | 7.000% | | | | 11/15/19 | | | | BB+ | | | | 5,551,740 | |
| | 2,550 | | | DPL, Inc. | | | 6.750% | | | | 10/01/19 | | | | BBB– | | | | 2,629,684 | |
| | 5,000 | | | Talen Energy Supply LLC, 144A | | | 4.625% | | | | 7/15/19 | | | | B– | | | | 4,905,190 | |
| | 12,914 | | | Total Independent Power & Renewable Electricity Producers | | | | | | | | | | | | | | | 13,086,614 | |
| | | | | |
| | | | Machinery – 1.3% | | | | | | | | | | | | |
| | | | | |
| | 3,500 | | | CNH Industrial Capital LLC | | | 3.375% | | | | 7/15/19 | | | | BBB– | | | | 3,502,800 | |
35
| | |
| JHD | | Nuveen High Income December 2019 Target Term Fund (continued) |
| | Portfolio of Investments June 30, 2018 |
| | (Unaudited) |
| | | | | | | | | | | | | | | | | | | | |
Principal
Amount (000) | | | Description (1) | | Coupon | | | Maturity | | | Ratings (2) | | | Value | |
| | | | | |
| | | | Media – 5.0% | | | | | | | | | | | | |
| | | | | |
| $ | 2,050 | | | Cablevision Systems Corporation | | | 8.000% | | | | 4/15/20 | | | | B– | | | $ | 2,151,885 | |
| | 3,350 | | | Clear Channel Worldwide | | | 7.625% | | | | 3/15/20 | | | | CCC+ | | | | 3,330,034 | |
| | 2,275 | | | CSC Holdings Inc. | | | 8.625% | | | | 2/15/19 | | | | B2 | | | | 2,340,406 | |
| | 540 | | | Dish DBS Corporation | | | 7.875% | | | | 9/01/19 | | | | BB | | | | 560,250 | |
| | 3,800 | | | Dish DBS Corporation | | | 5.125% | | | | 5/01/20 | | | | BB | | | | 3,762,000 | |
| | 1,250 | | | Hughes Satellite Systems Corporation | | | 6.500% | | | | 6/15/19 | | | | BBB– | | | | 1,279,313 | |
| | 13,265 | | | Total Media | | | | | | | | | | | | | | | 13,423,888 | |
| | | | | |
| | | | Metals & Mining – 3.6% | | | | | | | | | | | | |
| | | | | |
| | 2,500 | | | ArcelorMittal | | | 5.125% | | | | 6/01/20 | | | | BBB– | | | | 2,562,500 | |
| | 2,825 | | | Freeport McMoRan, Inc. | | | 3.100% | | | | 3/15/20 | | | | BB+ | | | | 2,768,500 | |
| | 4,250 | | | United States Steel Corporation | | | 7.375% | | | | 4/01/20 | | | | BB– | | | | 4,505,000 | |
| | 9,575 | | | Total Metals & Mining | | | | | | | | | | | | | | | 9,836,000 | |
| | | | | |
| | | | Multiline Retail – 0.4% | | | | | | | | | | | | |
| | | | | |
| | 1,000 | | | J.C. Penney Company Inc. | | | 8.125% | | | | 10/01/19 | | | | B+ | | | | 1,032,500 | |
| | | | | |
| | | | Oil, Gas & Consumable Fuels – 11.8% | | | | | | | | | | | | |
| | | | | |
| | 670 | | | Canadian Oil Sands Trust, 144A | | | 7.750% | | | | 5/15/19 | | | | A– | | | | 690,038 | |
| | 3,750 | | | Cenovus Energy Inc. | | | 5.700% | | | | 10/15/19 | | | | BBB | | | | 3,846,000 | |
| | 4,500 | | | DCP Midstream Operating LP, 144A | | | 5.350% | | | | 3/15/20 | | | | BB+ | | | | 4,584,375 | |
| | 2,000 | | | Ithaca Energy Inc., 144A | | | 8.125% | | | | 7/01/19 | | | | CCC+ | | | | 1,985,000 | |
| | 2,500 | | | Marathon Oil Corporation | | | 2.700% | | | | 6/01/20 | | | | BBB | | | | 2,462,080 | |
| | 4,245 | | | NGL Energy Partners LP/Fin Co | | | 5.125% | | | | 7/15/19 | | | | B+ | | | | 4,250,306 | |
| | 3,500 | | | Southwestern Energy Company | | | 5.800% | | | | 1/23/20 | | | | BB | | | | 3,552,500 | |
| | 4,000 | | | Targa Resources Inc. | | | 4.125% | | | | 11/15/19 | | | | BB– | | | | 4,000,000 | |
| | 1,475 | | | Teekay Corporation | | | 8.500% | | | | 1/15/20 | | | | B+ | | | | 1,519,250 | |
| | 2,000 | | | Tesoro Logistics LP Finance Corporation | | | 5.500% | | | | 10/15/19 | | | | BBB– | | | | 2,050,000 | |
| | 3,000 | | | Williams Partners LP | | | 5.250% | | | | 3/15/20 | | | | BBB | | | | 3,092,548 | |
| | 31,640 | | | Total Oil, Gas & Consumable Fuels | | | | | | | | | | | | | | | 32,032,097 | |
| | | | | |
| | | | Pharmaceuticals – 2.9% | | | | | | | | | | | | |
| | | | | |
| | 375 | | | Actavis Funding SCS | | | 3.000% | | | | 3/12/20 | | | | BBB | | | | 373,123 | |
| | 3,500 | | | Mallinckrodt International Finance SA, 144A | | | 4.875% | | | | 4/15/20 | | | | B+ | | | | 3,438,750 | |
| | 4,250 | | | Teva Pharmaceuticals IV BV | | | 2.250% | | | | 3/18/20 | | | | BB | | | | 4,096,573 | |
| | 8,125 | | | Total Pharmaceuticals | | | | | | | | | | | | | | | 7,908,446 | |
| | | | | |
| | | | Specialty Retail – 2.5% | | | | | | | | | | | | |
| | | | | |
| | 3,350 | | | GameStop Corporation, 144A | | | 5.500% | | | | 10/01/19 | | | | Ba1 | | | | 3,358,375 | |
| | 3,200 | | | Limited Brands Inc. | | | 7.000% | | | | 5/01/20 | | | | BB+ | | | | 3,360,000 | |
| | 6,550 | | | Total Specialty Retail | | | | | | | | | | | | | | | 6,718,375 | |
| | | | | |
| | | | Technology Hardware, Storage & Peripherals – 5.4% | | | | | | | | | | | | |
| | | | | |
| | 3,000 | | | Diamond 1 Finance Corporation / Diamond 2 Finance Corporation, 144A | | | 3.480% | | | | 6/01/19 | | | | BBB– | | | | 3,007,574 | |
| | 8,000 | | | EMC Corporation | | | 2.650% | | | | 6/01/20 | | | | Ba2 | | | | 7,768,798 | |
| | 3,750 | | | Seagate HDD Cayman | | | 3.750% | | | | 11/15/18 | | | | Baa3 | | | | 3,759,551 | |
| | 14,750 | | | Total Technology Hardware, Storage & Peripherals | | | | | | | | | | | | | | | 14,535,923 | |
| | | | | |
| | | | Thrifts & Mortgage Finance – 1.2% | | | | | | | | | | | | |
| | | | | |
| | 3,247 | | | Radian Group Inc. | | | 5.500% | | | | 6/01/19 | | | | BB+ | | | | 3,275,411 | |
| | | | | |
| | | | Trading Companies & Distributors – 2.0% | | | | | | | | | | | | |
| | | | | |
| | 3,137 | | | Aircastle Limited | | | 6.250% | | | | 12/01/19 | | | | BBB– | | | | 3,238,670 | |
| | 2,073 | | | Aircastle Ltd | | | 7.625% | | | | 4/15/20 | | | | BBB– | | | | 2,187,015 | |
| | 5,210 | | | Total Trading Companies & Distributors | | | | | | | | | | | | | | | 5,425,685 | |
| | | | | |
| | | | Wireless Telecommunication Services – 2.2% | | | | | | | | | | | | |
| | | | | |
| | 2,500 | | | Sprint Capital Corporation | | | 6.900% | | | | 5/01/19 | | | | B+ | | | | 2,550,500 | |
| | 3,205 | | | Sprint Communications Inc., 144A | | | 7.000% | | | | 3/01/20 | | | | BB | | | | 3,325,188 | |
| | 5,705 | | | Total Wireless Telecommunication Services | | | | | | | | | | | | | | | 5,875,688 | |
| $ | 258,310 | | | Total Corporate Bonds (cost $261,392,491) | | | | | | | | | | | | | | | 261,755,787 | |
36
| | | | | | | | | | | | | | | | | | | | |
Principal
Amount (000) | | | Description (1) | | Coupon | | | Maturity | | | Ratings (2) | | | Value | |
| |
| | | | CONVERTIBLE BONDS – 3.9% (3.7% of Total Investments) | |
| | | | | |
| | | | Capital Markets – 1.3% | | | | | | | | | | | | |
| | | | | |
| $ | 3,500 | | | Prospect Capital Corporation | | | 4.750% | | | | 4/15/20 | | | | BBB– | | | $ | 3,495,292 | |
| | | | | |
| | | | Electrical Equipment – 1.1% | | | | | | | | | | | | |
| | | | | |
| | 3,240 | | | SolarCity Corporation | | | 1.625% | | | | 11/01/19 | | | | N/R | | | | 3,014,752 | |
| |
| | | | Independent Power & Renewable Electricity Producers – 1.1% | |
| | | | | |
| | 3,000 | | | NRG Yield Inc., 144A | | | 3.250% | | | | 6/01/20 | | | | N/R | | | | 2,976,402 | |
| | | | | |
| | | | Machinery – 0.4% | | | | | | | | | | | | |
| | | | | |
| | 1,000 | | | Navistar International Corporation | | | 4.750% | | | | 4/15/19 | | | | CCC | | | | 1,030,580 | |
| $ | 10,740 | | | Total Convertible Bonds (cost $10,452,547) | | | | | | | | | | | | | | | 10,517,026 | |
| | | | | |
Principal
Amount (000) | | | Description (1) | | Coupon | | | Maturity | | | Ratings (2) | | | Value | |
| | | | | |
| | | | SOVEREIGN DEBT – 2.9% (2.9% of Total Investments) | | | | | | | | | | | | | | | | |
| | | | | |
| | | | Argentina – 1.1% | | | | | | | | | | | | |
| | | | | |
| $ | 3,000 | | | Republic of Argentina | | | 6.250% | | | | 4/22/19 | | | | B+ | | | $ | 3,012,030 | |
| | | | | |
| | | | Egypt – 0.9% | | | | | | | | | | | | |
| | | | | |
| | 2,500 | | | Arab Republic of Egypt, 144A | | | 5.750% | | | | 4/29/20 | | | | B | | | | 2,530,725 | |
| | | | | |
| | | | Sri Lanka – 0.9% | | | | | | | | | | | | |
| | | | | |
| | 1,000 | | | Republic of Sri Lanka, 144A | | | 6.000% | | | | 1/14/19 | | | | B+ | | | | 1,003,765 | |
| | | | | |
| | 1,500 | | | Republic of Sri Lanka, 144A | | | 5.125% | | | | 4/11/19 | | | | B+ | | | | 1,497,189 | |
| | 2,500 | | | Total Sri Lanka | | | | | | | | | | | | | | | 2,500,954 | |
| $ | 8,000 | | | Total Sovereign Debt (cost $8,126,644) | | | | | | | | | | | | | | | 8,043,709 | |
| | | | Total Long-Term Investments (cost $279,971,682) | | | | | | | | | | | | | | | 280,316,522 | |
| | | | | |
Principal
Amount (000) | | | Description (1) | | Coupon | | | Maturity | | | | | | Value | |
| |
| | | | SHORT-TERM INVESTMENTS – 0.2% (0.1% of Total Investments) | |
| |
| | | | REPURCHASE AGREEMENTS – 0.2% (0.1% of Total Investments) | |
| | | | | |
| $ | 380 | | | Repurchase Agreement with Fixed Income Clearing Corporation, dated 6/29/18, repurchase price $379,578, collateralized by $390,000 U.S. Treasury Notes, 2.750%, due 2/28/25, value $392,154 | | | 0.900% | | | | 7/02/18 | | | | | | | $ | 379,550 | |
| | | | Total Short-Term Investments (cost $379,550) | | | | | | | | | | | | | | | 379,550 | |
| | | | Total Investments (cost $280,351,232) – 103.5% | | | | | | | | | | | | | | | 280,696,072 | |
| | | | Borrowings – (7.2)% (3), (4) | | | | | | | | | | | | | | | (19,500,000 | ) |
| | | | Other Assets Less Liabilities – 3.7% | | | | | | | | | | | | | | | 10,101,337 | |
| | | | Net Assets – 100% | | | | | | | | | | | | | | $ | 271,297,409 | |
For Fund portfolio compliance purposes, the Fund’s industry classifications refer to any one or more of the industry sub-classifications used by one or more widely recognized market indexes or ratings group indexes, and/or as defined by Fund management. This definition may not apply for purposes of this report, which may combine industry sub-classifications into sectors for reporting ease.
| (1) | All percentages shown in the Portfolio of Investments are based on net assets unless otherwise noted. |
| (2) | For financial reporting purposes, the ratings disclosed are the highest of Standard & Poor’s Group (“Standard & Poor’s”), Moody’s Investors Service, Inc. (“Moody’s”) or Fitch, Inc. (“Fitch”) rating. This treatment of split-rated securities may differ from that used for other purposes, such as for Fund investment policies. Ratings below BBB by Standard & Poor’s, Baa by Moody’s or BBB by Fitch are considered to be below investment grade. Holdings designated N/R are not rated by any of these national rating agencies. |
| (3) | Borrowings as a percentage of Total Investments is 6.9%. |
| (4) | The Fund may pledge up to 100% of its eligible investments (excluding any investments separately pledged as collateral for specific investments in derivatives) in the Portfolio of Investments as collateral for borrowings. |
| 144A | Investment is exempt from registration under Rule 144A of the Securities Act of 1933, as amended. These investments may only be resold in transactions exempt from registration, which are normally those transactions with qualified institutional buyers. |
| REIT | Real Estate Investment Trust |
See accompanying notes to financial statements.
37
| | |
| JHA | | Nuveen High Income December 2018
Target Term Fund Portfolio of Investments June 30, 2018 |
| | | (Unaudited) |
| | | | | | | | | | | | | | | | | | | | |
Principal
Amount (000) | | | Description (1) | | Coupon | | | Maturity | | | Ratings (2) | | | Value | |
| |
| | | | LONG-TERM INVESTMENTS – 96.6% (99.4% of Total Investments) | |
| |
| | | | CORPORATE BONDS – 87.7% (90.3% of Total Investments) | |
| | | | | |
| | | | Aerospace & Defense – 0.8% | | | | | | | | | | | | |
| | | | | |
| $ | 2,350 | | | Lockheed Martin Corporation | | | 1.850% | | | | 11/23/18 | | | | BBB+ | | | $ | 2,342,678 | |
| | | | | |
| | | | Automobiles – 6.7% | | | | | | | | | | | | |
| | | | | |
| | 314 | | | American Honda Finance Limited | | | 2.125% | | | | 10/10/18 | | | | A+ | | | | 313,725 | |
| | 730 | | | American Honda Finance Limited | | | 1.500% | | | | 11/19/18 | | | | A+ | | | | 727,044 | |
| | 3,300 | | | General Motors Corporation | | | 3.500% | | | | 10/02/18 | | | | BBB | | | | 3,306,261 | |
| | 3,000 | | | General Motors Financial Company Inc. | | | 2.400% | | | | 5/09/19 | | | | BBB | | | | 2,986,052 | |
| | 750 | | | Harley-Davidson Financial Services Inc., 144A | | | 2.250% | | | | 1/15/19 | | | | A | | | | 747,965 | |
| | 1,163 | | | Hyundai Capital America, 144A | | | 2.875% | | | | 8/09/18 | | | | A– | | | | 1,162,832 | |
| | 150 | | | Hyundai Capital America, 144A | | | 2.550% | | | | 2/06/19 | | | | A– | | | | 149,447 | |
| | 6,810 | | | Jaguar Land Rover Automotive PLC, 144A | | | 4.125% | | | | 12/15/18 | | | | BB+ | | | | 6,818,512 | |
| | 3,307 | | | Volkswagen International Finance NV, 144A | | | 2.125% | | | | 11/20/18 | | | | A3 | | | | 3,299,089 | |
| | 19,524 | | | Total Automobiles | | | | | | | | | | | | | | | 19,510,927 | |
| | | | | |
| | | | Banks – 5.2% | | | | | | | | | | | | |
| | | | | |
| | 1,000 | | | Banque Federative du Credit Mutuel SA, 144A | | | 2.500% | | | | 10/29/18 | | | | Aa3 | | | | 999,730 | |
| | 250 | | | BPCE SA | | | 2.500% | | | | 12/10/18 | | | | A1 | | | | 249,862 | |
| | 2,075 | | | CIT Group Inc. | | | 3.875% | | | | 2/19/19 | | | | BB+ | | | | 2,080,706 | |
| | 500 | | | Citigroup Inc. | | | 2.050% | | | | 12/07/18 | | | | A | | | | 499,051 | |
| | 380 | | | Citizens Bank NA/Providence RI | | | 2.300% | | | | 12/03/18 | | | | A– | | | | 379,475 | |
| | 500 | | | Credit Agricole SA/Londo, 144A | | | 2.625% | | | | 10/03/18 | | | | A1 | | | | 500,072 | |
| | 625 | | | HSBC USA Inc. | | | 2.625% | | | | 9/24/18 | | | | AA– | | | | 625,065 | |
| | 1,080 | | | Huntington National Bank/The | | | 2.200% | | | | 11/06/18 | | | | A– | | | | 1,078,554 | |
| | 200 | | | ING Bank NV, 144A | | | 2.000% | | | | 11/26/18 | | | | Aa3 | | | | 199,475 | |
| | 150 | | | ING Bank NV, Reg S | | | 2.000% | | | | 11/26/18 | | | | Aa3 | | | | 149,606 | |
| | 295 | | | JPMorgan Chase Bank NA | | | 1.450% | | | | 9/21/18 | | | | AA | | | | 294,242 | |
| | 970 | | | Lloyds Bank PLC | | | 2.300% | | | | 11/27/18 | | | | Aa3 | | | | 968,820 | |
| | 2,300 | | | Merrill Lynch & Co | | | 6.875% | | | | 11/15/18 | | | | A+ | | | | 2,335,737 | |
| | 150 | | | Regions Bank/Birmingham AL | | | 2.250% | | | | 9/14/18 | | | | A– | | | | 149,928 | |
| | 100 | | | Royal Bank of Canada | | | 2.000% | | | | 12/10/18 | | | | AA | | | | 99,773 | |
| | 1,868 | | | Royal Bank of Scotland Group PLC | | | 4.700% | | | | 7/03/18 | | | | BBB– | | | | 1,868,000 | |
| | 130 | | | SunTrust Banks Inc. | | | 2.350% | | | | 11/01/18 | | | | A– | | | | 129,929 | |
| | 555 | | | Union Bank NA | | | 2.625% | | | | 9/26/18 | | | | A | | | | 554,875 | |
| | 95 | | | US Bancorp, (3-Month LIBOR reference rate + 0.490% spread), (3) | | | 2.833% | | | | 11/15/18 | | | | AA– | | | | 95,130 | |
| | 800 | | | Wells Fargo Bank NA | | | 1.800% | | | | 11/28/18 | | | | Aa2 | | | | 797,413 | |
| | 1,000 | | | Westpac Banking Corporation | | | 1.950% | | | | 11/23/18 | | | | AA– | | | | 997,643 | |
| | 15,023 | | | Total Banks | | | | | | | | | | | | | | | 15,053,086 | |
| | | | | |
| | | | Beverages – 0.2% | | | | | | | | | | | | |
| | | | | |
| | 650 | | | Molson Coors Brewing Co | | | 1.900% | | | | 3/15/19 | | | | BBB– | | | | 645,373 | |
| | | | | |
| | | | Biotechnology – 0.3% | | | | | | | | | | | | |
| | | | | |
| | 772 | | | Amgen Inc. | | | 5.700% | | | | 2/01/19 | | | | A | | | | 784,676 | |
| | | | | |
| | | | Capital Markets – 2.3% | | | | | | | | | | | | |
| | | | | |
| | 700 | | | Ares Capital Corporation | | | 4.875% | | | | 11/30/18 | | | | BBB | | | | 705,005 | |
| | 25 | | | Deutsche Bank AG, (3-Month LIBOR reference rate + 1.450% spread), (3) | | | 3.809% | | | | 1/18/19 | | | | BBB+ | | | | 25,017 | |
| | 2,700 | | | Deutsche Bank AG London | | | 2.500% | | | | 2/13/19 | | | | BBB+ | | | | 2,681,276 | |
| | 2,500 | | | GFI Group, Inc. | | | 8.375% | | | | 7/19/18 | | | | BBB– | | | | 2,500,000 | |
| | 870 | | | State Street Bank & Trust | | | 5.250% | | | | 10/15/18 | | | | Aa3 | | | | 876,321 | |
| | 6,795 | | | Total Capital Markets | | | | | | | | | | | | | | | 6,787,619 | |
38
| | | | | | | | | | | | | | | | | | | | |
Principal
Amount (000) | | | Description (1) | | Coupon | | | Maturity | | | Ratings (2) | | | Value | |
| | | | | |
| | | | Chemicals – 1.1% | | | | | | | | | | | | |
| | | | | |
| $ | 290 | | | EI du Pont de Nemours & Co | | | 6.000% | | | | 7/15/18 | | | | A | | | $ | 290,306 | |
| | 2,675 | | | Monsanto Co | | | 1.850% | | | | 11/15/18 | | | | A– | | | | 2,667,618 | |
| | 400 | | | Praxair Inc. | | | 1.250% | | | | 11/07/18 | | | | A | | | | 398,118 | |
| | 3,365 | | | Total Chemicals | | | | | | | | | | | | | | | 3,356,042 | |
| | | | | |
| | | | Commercial Services & Supplies – 2.5% | | | | | | | | | | | | |
| | | | | |
| | 2,000 | | | AerCap Ireland Capital Limited / AerCap Global Aviation Trust | | | 3.750% | | | | 5/15/19 | | | | BBB– | | | | 2,011,936 | |
| | 150 | | | International Lease Finance Corporation, 144A | | | 7.125% | | | | 9/01/18 | | | | Baa2 | | | | 150,979 | |
| | 3,000 | | | International Lease Finance Corporation | | | 5.875% | | | | 4/01/19 | | | | BBB– | | | | 3,061,414 | |
| | 2,000 | | | International Lease Finance Corporation | | | 6.250% | | | | 5/15/19 | | | | BBB– | | | | 2,050,557 | |
| | 7,150 | | | Total Commercial Services & Supplies | | | | | | | | | | | | | | | 7,274,886 | |
| | | | | |
| | | | Consumer Finance – 4.6% | | | | | | | | | | | | |
| | | | | |
| | 5,805 | | | Ally Financial Inc. | | | 4.750% | | | | 9/10/18 | | | | BB+ | | | | 5,815,884 | |
| | 250 | | | Ally Financial Inc. | | | 8.000% | | | | 12/31/18 | | | | BB | | | | 254,687 | |
| | 120 | | | American Express Credit Corporation | | | 1.875% | | | | 11/05/18 | | | | A2 | | | | 119,740 | |
| | 750 | | | Capital One Bank USA NA | | | 2.150% | | | | 11/21/18 | | | | A– | | | | 748,681 | |
| | 350 | | | Capital One NA/Mclean VA. | | | 2.350% | | | | 8/17/18 | | | | A– | | | | 349,887 | |
| | 1,700 | | | Discover Bank | | | 2.600% | | | | 11/13/18 | | | | BBB+ | | | | 1,699,026 | |
| | 215 | | | Ford Motor Credit Co LLC | | | 2.875% | | | | 10/01/18 | | | | BBB | | | | 215,047 | |
| | 1,519 | | | Ford Motor Credit Co LLC | | | 2.551% | | | | 10/05/18 | | | | BBB | | | | 1,518,046 | |
| | 20 | | | Ford Motor Credit Co LLC, (3-Month LIBOR reference rate + 1.250% spread), (3) | | | 3.135% | | | | 11/20/18 | | | | BBB | | | | 20,043 | |
| | 2,750 | | | Navient Corporation | | | 5.500% | | | | 1/15/19 | | | | BB | | | | 2,772,000 | |
| | 13,479 | | | Total Consumer Finance | | | | | | | | | | | | | | | 13,513,041 | |
| | | | | |
| | | | Diversified Financial Services – 2.4% | | | | | | | | | | | | |
| | | | | |
| | 865 | | | LeasePlan Corp NV, 144A | | | 2.875% | | | | 1/22/19 | | | | Baa1 | | | | 863,563 | |
| | 868 | | | National Rural Utilities Cooperative Finance Corporation | | | 10.375% | | | | 11/01/18 | | | | A1 | | | | 890,228 | |
| | 5,000 | | | Nationstar Mortgage LLC Capital Corporation | | | 6.500% | | | | 8/01/18 | | | | B+ | | | | 5,006,000 | |
| | 250 | | | Nationstar Mortgage LLC Capital Corporation | | | 9.625% | | | | 5/01/19 | | | | B+ | | | | 251,875 | |
| | 6,983 | | | Total Diversified Financial Services | | | | | | | | | | | | | | | 7,011,666 | |
| | | | | |
| | | | Diversified Telecommunication Services – 5.6% | | | | | | | | | | | | |
| | | | | |
| | 2,135 | | | AT&T, Inc. | | | 2.375% | | | | 11/27/18 | | | | A– | | | | 2,132,845 | |
| | 929 | | | Deutsche Telekom International Finance BV | | | 6.750% | | | | 8/20/18 | | | | BBB+ | | | | 934,187 | |
| | 4,000 | | | Frontier Communications Corporation | | | 8.125% | | | | 10/01/18 | | | | B | | | | 4,020,000 | |
| | 2,500 | | | Frontier Communications Corporation | | | 7.125% | | | | 3/15/19 | | | | B | | | | 2,518,750 | |
| | 6,500 | | | Qwest Capital Funding Inc. | | | 6.500% | | | | 11/15/18 | | | | BB | | | | 6,563,050 | |
| | 173 | | | Verizon Communications, (3-Month LIBOR reference rate + 1.750% spread), (3) | | | 4.086% | | | | 9/14/18 | | | | A– | | | | 173,598 | |
| | 16,237 | | | Total Diversified Telecommunication Services | | | | | | | | | | | | | | | 16,342,430 | |
| | | | | |
| | | | Electric Utilities – 3.1% | | | | | | | | | | | | |
| | | | | |
| | 415 | | | Cleveland Electric Illuminating Co/The | | | 8.875% | | | | 11/15/18 | | | | A– | | | | 423,747 | |
| | 275 | | | Commonwealth Edison Company | | | 2.150% | | | | 1/15/19 | | | | A1 | | | | 274,342 | |
| | 1,950 | | | Duke Energy Carolinas LLC | | | 7.000% | | | | 11/15/18 | | | | Aa2 | | | | 1,980,276 | |
| | 250 | | | Entergy Louisiana LLC | | | 6.500% | | | | 9/01/18 | | | | A | | | | 251,459 | |
| | 620 | | | Georgia Power Co | | | 1.950% | | | | 12/01/18 | | | | A | | | | 617,467 | |
| | 1,450 | | | Jersey Central Power & Light Co | | | 7.350% | | | | 2/01/19 | | | | Baa2 | | | | 1,484,503 | |
| | 981 | | | NextEra Energy Capital Holdings Inc. | | | 1.649% | | | | 9/01/18 | | | | A– | | | | 978,847 | |
| | 570 | | | Oncor Electric Delivery Co LLC | | | 6.800% | | | | 9/01/18 | | | | A+ | | | | 573,582 | |
| | 200 | | | Pacific Gas & Electric Co (3-Month LIBOR reference rate + 0.230% spread), (3) | | | 2.549% | | | | 11/28/18 | | | | A– | | | | 199,215 | |
| | 604 | | | Progress Energy Inc. | | | 7.050% | | | | 3/15/19 | | | | BBB+ | | | | 621,325 | |
| | 869 | | | Southern California Edison Company | | | 5.500% | | | | 8/15/18 | | | | Aa3 | | | | 871,859 | |
| | 870 | | | Southern Co/The | | | 2.450% | | | | 9/01/18 | | | | BBB+ | | | | 869,426 | |
| | 9,054 | | | Total Electric Utilities | | | | | | | | | | | | | | | 9,146,048 | |
| |
| | | | Electronic Equipment, Instruments & Components – 4.6% | |
| | | | | |
| | 175 | | | Amphenol Corporation | | | 2.550% | | | | 1/30/19 | | | | BBB+ | | | | 174,860 | |
39
| | |
| JHA | | Nuveen High Income December 2018 Target Term Fund (continued) |
| | Portfolio of Investments June 30, 2018 |
| | (Unaudited) |
| | | | | | | | | | | | | | | | | | | | |
Principal
Amount (000) | | | Description (1) | | Coupon | | | Maturity | | | Ratings (2) | | | Value | |
| |
| | | | Electronic Equipment, Instruments & Components (continued) | |
| | | | | |
| $ | 6,250 | | | Anixter Inc. | | | 5.625% | | | | 5/01/19 | | | | BBB– | | | $ | 6,359,375 | |
| | 5,252 | | | Sanmina-SCI Corporation, 144A | | | 4.375% | | | | 6/01/19 | | | | BBB– | | | | 5,252,000 | |
| | 1,704 | | | Tyco Electronics Group. SA | | | 2.375% | | | | 12/17/18 | | | | A– | | | | 1,701,242 | |
| | 13,381 | | | Total Electronic Equipment, Instruments & Components | | | | | | | | | | | | | | | 13,487,477 | |
| | | | | |
| | | | Energy Equipment & Services – 1.3% | | | | | | | | | | | | |
| | | | | |
| | 750 | | | Halliburton Company | | | 2.000% | | | | 8/01/18 | | | | A– | | | | 749,657 | |
| | 25 | | | Nabors Industries Inc. | | | 9.250% | | | | 1/15/19 | | | | BB | | | | 25,875 | |
| | 2,605 | | | Rockies Express Pipeline Company, 144A | | | 6.850% | | | | 7/15/18 | | | | BB+ | | | | 2,608,256 | |
| | 500 | | | TransCanada PipeLines Ltd | | | 6.500% | | | | 8/15/18 | | | | A3 | | | | 502,363 | |
| | 3,880 | | | Total Energy Equipment & Services | | | | | | | | | | | | | | | 3,886,151 | |
| | | | | |
| | | | Equity Real Estate Investment Trusts – 4.5% | | | | | | | | | | | | |
| | | | | |
| | 2,584 | | | Gaming and Leisure Products Inc., GLP Capital LP Financing II Inc. | | | 4.375% | | | | 11/01/18 | | | | BBB– | | | | 2,586,067 | |
| | 5,325 | | | Realogy Group LLC / Realogy Co-Issuer Corporation, 144A | | | 4.500% | | | | 4/15/19 | | | | B1 | | | | 5,338,312 | |
| | 5,365 | | | Vereit Operating Partnership LP | | | 3.000% | | | | 2/06/19 | | | | BBB– | | | | 5,362,559 | |
| | 13,274 | | | Total Equity Real Estate Investment Trusts | | | | | | | | | | | | | | | 13,286,938 | |
| | | | | |
| | | | Food & Staples Retailing – 0.6% | | | | | | | | | | | | |
| | | | | |
| | 1,065 | | | Kroger Co. | | | 6.800% | | | | 12/15/18 | | | | Baa1 | | | | 1,084,153 | |
| | 127 | | | Kroger Co. | | | 2.300% | | | | 1/15/19 | | | | Baa1 | | | | 126,575 | |
| | 500 | | | Kroger Co. | | | 2.000% | | | | 1/15/19 | | | | Baa1 | | | | 497,611 | |
| | 1,692 | | | Total Food & Staples Retailing | | | | | | | | | | | | | | | 1,708,339 | |
| | | | | |
| | | | Food Products – 0.6% | | | | | | | | | | | | |
| | | | | |
| | 875 | | | General Mills, Inc. | | | 5.650% | | | | 2/15/19 | | | | BBB | | | | 889,629 | |
| | 787 | | | Kraft Foods Group Inc. | | | 6.125% | | | | 8/23/18 | | | | BBB | | | | 791,014 | |
| | 1,662 | | | Total Food Products | | | | | | | | | | | | | | | 1,680,643 | |
| | | | | |
| | | | Health Care Equipment & Supplies – 1.0% | | | | | | | | | | | | |
| | | | | |
| | 1,560 | | | Abbott Laboratories | | | 2.000% | | | | 9/15/18 | | | | BBB | | | | 1,557,586 | |
| | 450 | | | Danaher Corp | | | 1.650% | | | | 9/15/18 | | | | A | | | | 449,385 | |
| | 1,060 | | | Edwards Lifesciences Corporation | | | 2.875% | | | | 10/15/18 | | | | Baa2 | | | | 1,060,289 | |
| | 3,070 | | | Total Health Care Equipment & Supplies | | | | | | | | | | | | | | | 3,067,260 | |
| | | | | |
| | | | Health Care Providers & Services – 3.8% | | | | | | | | | | | | |
| | | | | |
| | 95 | | | Anthem Inc. | | | 2.300% | | | | 7/15/18 | | | | A | | | | 94,988 | |
| | 1,695 | | | CVS Health Corporation | | | 2.250% | | | | 12/05/18 | | | | Baa1 | | | | 1,690,388 | |
| | 1,605 | | | Fresenius Medical Care II, 144A | | | 6.500% | | | | 9/15/18 | | | | BBB– | | | | 1,615,432 | |
| | 7,500 | | | HCA Inc. | | | 3.750% | | | | 3/15/19 | | | | BBB– | | | | 7,528,125 | |
| | 250 | | | Laboratory Corporation of America Holdings. | | | 2.500% | | | | 11/01/18 | | | | BBB | | | | 249,726 | |
| | 11,145 | | | Total Health Care Providers & Services | | | | | | | | | | | | | | | 11,178,659 | |
| | | | | |
| | | | Hotels, Restaurants & Leisure – 2.5% | | | | | | | | | | | | |
| | | | | |
| | 2,000 | | | McDonald’s Corporation | | | 2.100% | | | | 12/07/18 | | | | BBB+ | | | | 1,996,191 | |
| | 5,260 | | | MGM Resorts International Inc. | | | 8.625% | | | | 2/01/19 | | | | BB | | | | 5,391,500 | |
| | 7,260 | | | Total Hotels, Restaurants & Leisure | | | | | | | | | | | | | | | 7,387,691 | |
| | | | | |
| | | | Household Durables – 3.6% | | | | | | | | | | | | |
| | | | | |
| | 5,200 | | | KB Home | | | 4.750% | | | | 5/15/19 | | | | BB– | | | | 5,221,320 | |
| | 725 | | | Lennar Corporation | | | 4.125% | | | | 12/01/18 | | | | BB+ | | | | 725,362 | |
| | 655 | | | Newell Brands Inc. | | | 2.150% | | | | 10/15/18 | | | | BBB– | | | | 653,533 | |
| | 2,730 | | | Newell Brands Inc. | | | 2.600% | | | | 3/29/19 | | | | BBB– | | | | 2,720,413 | |
| | 1,085 | | | Toll Brothers Finance Corporation | | | 4.000% | | | | 12/31/18 | | | | BBB– | | | | 1,084,864 | |
| | 10,395 | | | Total Household Durables | | | | | | | | | | | | | | | 10,405,492 | |
| | | | | |
| | | | Industrial Conglomerates – 0.8% | | | | | | | | | | | | |
| | | | | |
| | 330 | | | General Electric Capital Corporation, (3-Month LIBOR reference rate + 0.270% spread), (3) | | | 2.633% | | | | 8/07/18 | | | | A | | | | 330,006 | |
| | 1,450 | | | General Electric Co | | | 2.300% | | | | 1/14/19 | | | | A | | | | 1,446,732 | |
40
| | | | | | | | | | | | | | | | | | | | |
Principal
Amount (000) | | | Description (1) | | Coupon | | | Maturity | | | Ratings (2) | | | Value | |
| | | | | |
| | | | Industrial Conglomerates (continued) | | | | | | | | | | | | |
| | | | | |
| $ | 495 | | | Roper Technologies Inc. | | | 2.050% | | | | 10/01/18 | | | | BBB+ | | | $ | 494,382 | |
| | 2,275 | | | Total Industrial Conglomerates | | | | | | | | | | | | | | | 2,271,120 | |
| | | | | |
| | | | Insurance – 1.1% | | | | | | | | | | | | |
| | | | | |
| | 420 | | | MetLife Inc. | | | 6.817% | | | | 8/15/18 | | | | A– | | | | 422,161 | |
| | 1,650 | | | Metropolitan Life Global Funding I, 144A | | | 1.950% | | | | 12/03/18 | | | | AA– | | | | 1,646,190 | |
| | 1,170 | | | XLIT Ltd | | | 2.300% | | | | 12/15/18 | | | | A– | | | | 1,165,285 | |
| | 3,240 | | | Total Insurance | | | | | | | | | | | | | | | 3,233,636 | |
| | | | | |
| | | | Internet & Direct Marketing Retail – 1.4% | | | | | | | | | | | | |
| | | | | |
| | 4,150 | | | Expedia Inc. | | | 7.456% | | | | 8/15/18 | | | | BBB | | | | 4,170,127 | |
| | | | | |
| | | | Internet Software & Services – 0.4% | | | | | | | | | | | | |
| | | | | |
| | 1,200 | | | Baidu Inc. | | | 3.250% | | | | 8/06/18 | | | | A | | | | 1,200,256 | |
| | | | | |
| | | | IT Services – 0.1% | | | | | | | | | | | | |
| | | | | |
| | 155 | | | International Business Machines Corporation (IBM) | | | 7.625% | | | | 10/15/18 | | | | A+ | | | | 157,207 | |
| | | | | |
| | | | Machinery – 1.7% | | | | | | | | | | | | |
| | | | | |
| | 144 | | | Caterpillar Financial Services Corporation | | | 7.050% | | | | 10/01/18 | | | | A | | | | 145,606 | |
| | 150 | | | Caterpillar Financial Services Corporation | | | 1.800% | | | | 11/13/18 | | | | A | | | | 149,589 | |
| | 2,515 | | | Caterpillar Financial Services Corporation | | | 7.150% | | | | 2/15/19 | | | | A | | | | 2,584,874 | |
| | 625 | | | John Deere Capital Corporation | | | 5.750% | | | | 9/10/18 | | | | A | | | | 628,835 | |
| | 250 | | | Parker-Hannifin Corporation | | | 6.550% | | | | 7/15/18 | | | | A | | | | 250,274 | |
| | 1,226 | | | Stanley Black & Decker Inc. | | | 2.451% | | | | 11/17/18 | | | | A– | | | | 1,224,424 | |
| | 4,910 | | | Total Machinery | | | | | | | | | | | | | | | 4,983,602 | |
| | | | | |
| | | | Media – 3.8% | | | | | | | | | | | | |
| | | | | |
| | 195 | | | CSC Holdings Inc. | | | 7.625% | | | | 7/15/18 | | | | B2 | | | | 195,097 | |
| | 5,000 | | | CSC Holdings Inc. | | | 8.625% | | | | 2/15/19 | | | | B2 | | | | 5,143,750 | |
| | 3,000 | | | Sky PLC, 144A | | | 9.500% | | | | 11/15/18 | | | | BBB | | | | 3,071,305 | |
| | 1,515 | | | Time Warner Cable Inc. | | | 6.750% | | | | 7/01/18 | | | | BBB– | | | | 1,515,000 | |
| | 1,000 | | | Time Warner Cable Inc. | | | 8.750% | | | | 2/14/19 | | | | BBB– | | | | 1,033,375 | |
| | 10,710 | | | Total Media | | | | | | | | | | | | | | | 10,958,527 | |
| | | | | |
| | | | Metals & Mining – 0.8% | | | | | | | | | | | | |
| | | | | |
| | 1,480 | | | Glencore Funding LLC, 144A | | | 2.500% | | | | 1/15/19 | | | | BBB+ | | | | 1,471,827 | |
| | 1,000 | | | Glencore Funding LLC, 144A, (3-Month LIBOR reference rate + 1.360% spread), (3) | | | 3.715% | | | | 1/15/19 | | | | BBB+ | | | | 1,003,672 | |
| | 2,480 | | | Total Metals & Mining | | | | | | | | | | | | | | | 2,475,499 | |
| | | | | |
| | | | Multi-Utilities – 1.2% | | | | | | | | | | | | |
| | | | | |
| | 325 | | | Consolidated Edison Co of New York Inc. | | | 7.125% | | | | 12/01/18 | | | | A2 | | | | 330,876 | |
| | 1,805 | | | Dominion Energy Inc., 144A | | | 1.500% | | | | 9/30/18 | | | | BBB | | | | 1,799,751 | |
| | 500 | | | Dominion Energy Inc., 144A | | | 1.875% | | | | 12/15/18 | | | | BBB | | | | 498,067 | |
| | 762 | | | Sempra Energy | | | 9.800% | | | | 2/15/19 | | | | BBB+ | | | | 792,894 | |
| | 120 | | | South Carolina Electric & Gas Co | | | 5.250% | | | | 11/01/18 | | | | A– | | | | 120,892 | |
| | 3,512 | | | Total Multi-Utilities | | | | | | | | | | | | | | | 3,542,480 | |
| | | | | |
| | | | Oil, Gas & Consumable Fuels – 6.7% | | | | | | | | | | | | |
| | | | | |
| | 1,890 | | | Apache Corporation | | | 6.900% | | | | 9/15/18 | | | | BBB | | | | 1,903,449 | |
| | 3,350 | | | Buckeye Partners LP | | | 2.650% | | | | 11/15/18 | | | | BBB– | | | | 3,346,394 | |
| | 5,634 | | | DCP Midstream Operating LP | | | 2.700% | | | | 4/01/19 | | | | BB+ | | | | 5,577,660 | |
| | 949 | | | Energy Transfer Partners LP | | | 6.700% | | | | 7/01/18 | | | | BBB– | | | | 949,000 | |
| | 500 | | | Sinopec Group Overseas Development 2013 Ltd, Reg S | | | 2.500% | | | | 10/17/18 | | | | A+ | | | | 499,220 | |
| | 180 | | | Petroleos Mexicanos, (3-Month LIBOR reference rate + 2.020% spread), (3) | | | 4.375% | | | | 7/18/18 | | | | BBB+ | | | | 180,108 | |
| | 1,800 | | | Petroleos Mexicanos | | | 5.500% | | | | 2/04/19 | | | | BBB+ | | | | 1,822,500 | |
| | 1,066 | | | Petroleos Mexicanos | | | 8.000% | | | | 5/03/19 | | | | BBB+ | | | | 1,105,048 | |
| | 3,175 | | | Schlumberger Holdings Corporation, 144A | | | 2.350% | | | | 12/21/18 | | | | AA– | | | | 3,168,797 | |
| | 385 | | | Spectra Energy Partners LP | | | 2.950% | | | | 9/25/18 | | | | BBB+ | | | | 385,091 | |
41
| | |
| JHA | | Nuveen High Income December 2018 Target Term Fund (continued) |
| | Portfolio of Investments June 30, 2018 |
| | (Unaudited) |
| | | | | | | | | | | | | | | | | | | | |
Principal
Amount (000) | | | Description (1) | | Coupon | | | Maturity | | | Ratings (2) | | | Value | |
| | | | | |
| | | | Oil, Gas & Consumable Fuels (continued) | | | | | | | | | | | | |
| | | | | |
| $ | 382 | | | Western Gas Partners LP | | | 2.600% | | | | 8/15/18 | | | | BBB– | | | $ | 381,798 | |
| | 225 | | | YPF SA, 144A | | | 8.875% | | | | 12/19/18 | | | | B2 | | | | 228,375 | |
| | 19,536 | | | Total Oil, Gas & Consumable Fuels | | | | | | | | | | | | | | | 19,547,440 | |
| | | | | |
| | | | Pharmaceuticals – 0.3% | | | | | | | | | | | | |
| | | | | |
| | 625 | | | AstraZeneca PLC | | | 1.750% | | | | 11/16/18 | | | | A3 | | | | 622,997 | |
| | 190 | | | Pharmacia LLC | | | 6.500% | | | | 12/01/18 | | | | AA | | | | 192,940 | |
| | 815 | | | Total Pharmaceuticals | | | | | | | | | | | | | | | 815,937 | |
| | | | | |
| | | | Professional Services – 0.3% | | | | | | | | | | | | |
| | | | | |
| | 740 | | | RELX Capital, Inc. | | | 8.625% | | | | 1/15/19 | | | | BBB+ | | | | 761,992 | |
| | | | | |
| | | | Road & Rail – 0.1% | | | | | | | | | | | | |
| | | | | |
| | 75 | | | Ryder System, Inc. | | | 2.450% | | | | 11/15/18 | | | | A– | | | | 74,956 | |
| | 200 | | | Union Pacific Corporation | | | 5.700% | | | | 8/15/18 | | | | A– | | | | 200,694 | |
| | 275 | | | Total Road & Rail | | | | | | | | | | | | | | | 275,650 | |
| | | | | |
| | | | Semiconductors & Semiconductor Equipment – 0.2% | | | | | | | | | | | | |
| | | | | |
| | 585 | | | Maxim Integrated Products Inc. | | | 2.500% | | | | 11/15/18 | | | | BBB+ | | | | 584,807 | |
| | | | | |
| | | | Specialty Retail – 1.7% | | | | | | | | | | | | |
| | | | | |
| | 3,250 | | | Best Buy Co., Inc. | | | 5.000% | | | | 8/01/18 | | | | Baa1 | | | | 3,255,193 | |
| | 1,570 | | | Hyundai Capital America, 144A | | | 2.400% | | | | 10/30/18 | | | | A– | | | | 1,567,690 | |
| | 4,820 | | | Total Specialty Retail | | | | | | | | | | | | | | | 4,822,883 | |
| | | | | |
| | | | Technology Hardware, Storage & Peripherals – 2.8% | | | | | | | | | | | | |
| | | | | |
| | 2,800 | | | Diamond 1 Finance Corporation / Diamond 2 Finance Corporation, 144A | | | 3.480% | | | | 6/01/19 | | | | BBB– | | | | 2,807,069 | |
| | 749 | | | Hewlett Packard Enterprise Co | | | 2.850% | | | | 10/05/18 | | | | BBB+ | | | | 750,090 | |
| | 4,650 | | | Seagate HDD Cayman | | | 3.750% | | | | 11/15/18 | | | | Baa3 | | | | 4,661,843 | |
| | 8,199 | | | Total Technology Hardware, Storage & Peripherals | | | | | | | | | | | | | | | 8,219,002 | |
| | | | | |
| | | | Textiles, Apparel & Luxury Goods – 0.1% | | | | | | | | | | | | |
| | | | | |
| | 175 | | | Ralph Lauren Corporation | | | 2.125% | | | | 9/26/18 | | | | A2 | | | | 174,778 | |
| | | | | |
| | | | Thrifts & Mortgage Finance – 1.9% | | | | | | | | | | | | |
| | | | | |
| | 5,415 | | | Radian Group Inc. | | | 5.500% | | | | 6/01/19 | | | | BB+ | | | | 5,462,381 | |
| | | | | |
| | | | Tobacco – 0.6% | | | | | | | | | | | | |
| | | | | |
| | 1,670 | | | Altria Group Inc. | | | 9.700% | | | | 11/10/18 | | | | A– | | | | 1,710,936 | |
| | | | | |
| | | | Trading Companies & Distributors – 2.0% | | | | | | | | | | | | |
| | | | | |
| | 905 | | | Air Lease Corporation | | | 2.625% | | | | 9/04/18 | | | | BBB | | | | 904,632 | |
| | 900 | | | Air Lease Corporation | | | 3.375% | | | | 1/15/19 | | | | BBB | | | | 901,741 | |
| | 4,001 | | | Aircastle Limited | | | 4.625% | | | | 12/15/18 | | | | BBB– | | | | 4,021,005 | |
| | 5,806 | | | Total Trading Companies & Distributors | | | | | | | | | | | | | | | 5,827,378 | |
| | | | | |
| | | | Wireless Telecommunication Services – 2.4% | | | | | | | | | | | | |
| | | | | |
| | 7,000 | | | Sprint Communications Inc., 144A | | | 9.000% | | | | 11/15/18 | | | | BB | | | | 7,140,000 | |
| $ | 254,809 | | | Total Corporate Bonds (cost $256,171,747) | | | | | | | | | | | | | | | 256,192,760 | |
| | | | | |
Principal
Amount (000) | | | Description (1) | | Coupon | | | Maturity | | | Ratings (2) | | | Value | |
| |
| | | | CONVERTIBLE BONDS – 6.5% of (6.6% of Total Investments) | |
| | | | | |
| | | | Capital Markets – 1.2% | | | | | | | | | | | | |
| | | | | |
| $ | 3,500 | | | Prospect Capital Corporation | | | 5.875% | | | | 1/15/19 | | | | BBB– | | | $ | 3,555,486 | |
| | | | | |
| | | | Electrical Equipment – 1.4% | | | | | | | | | | | | |
| | | | | |
| | 4,000 | | | SolarCity Corporation | | | 2.750% | | | | 11/01/18 | | | | N/R | | | | 3,959,908 | |
42
| | | | | | | | | | | | | | | | | | | | |
Principal
Amount (000) | | | Description (1) | | Coupon | | | Maturity | | | Ratings (2) | | | Value | |
| | | | | |
| | | | Equity Real Estate Investment Trusts – 0.1% | | | | | | | | | | | | |
| | | | | |
| $ | 200 | | | VEREIT, Inc. | | | 3.000% | | | | 8/01/18 | | | | BBB– | | | $ | 200,003 | |
| |
| | | | Independent Power & Renewable Electricity Producers – 1.3% | |
| | | | | |
| | 3,800 | | | NRG Yield Inc., 144A | | | 3.500% | | | | 2/01/19 | | | | N/R | | | | 3,780,601 | |
| | | | | |
| | | | Machinery – 1.8% | | | | | | | | | | | | |
| | | | | |
| | 5,250 | | | Navistar International Corporation | | | 4.750% | | | | 4/15/19 | | | | CCC | | | | 5,410,545 | |
| | | | | |
| | | | Oil, Gas & Consumable Fuels – 0.7% | | | | | | | | | | | | |
| | | | | |
| | 2,000 | | | Clean Energy Fuels Corporation, 144A | | | 5.250% | | | | 10/01/18 | | | | N/R | | | | 1,999,768 | |
| $ | 18,750 | | | Total Convertible Bonds (cost $18,556,238) | | | | | | | | | | | | | | | 18,906,311 | |
| | | | | |
Principal
Amount (000) | | | Description (1) | | Coupon | | | Maturity | | | Ratings (2) | | | Value | |
| | | | | |
| | | | SOVEREIGN DEBT – 2.4% (2.5% of Total Investments) | | | | | | | | | | | | | | | | |
| | | | | |
| | | | Argentina – 0.5% | | | | | | | | | | | | |
| | | | | |
| $ | 1,500 | | | Republic of Argentina | | | 6.250% | | | | 4/22/19 | | | | B+ | | | $ | 1,506,015 | |
| | | | | |
| | | | South Africa – 1.0% | | | | | | | | | | | | |
| | | | | |
| | 3,000 | | | Republic of South Africa | | | 6.875% | | | | 5/27/19 | | | | Baa3 | | | | 3,081,000 | |
| | | | | |
| | | | Sri Lanka – 0.9% | | | | | | | | | | | | |
| | | | | |
| | 2,500 | | | Republic of Sri Lanka, 144A | | | 6.000% | | | | 1/14/19 | | | | B+ | | | | 2,509,412 | |
| $ | 7,000 | | | Total Sovereign Debt (cost $7,134,421) | | | | | | | | | | | | | | | 7,096,427 | |
| | | | Total Long-Term Investments (cost $281,862,406) | | | | | | | | | | | | | | | 282,195,498 | |
| | | | | |
Principal
Amount (000) | | | Description (1) | | Coupon | | | Maturity | | | | | | Value | |
| |
| | | | SHORT-TERM INVESTMENTS – 0.5% (0.6% of Total Investments) | |
| |
| | | | REPURCHASE AGREEMENTS – 0.5% (0.6% of Total Investments) | |
| | | | | |
| $ | 1,631 | | | Repurchase Agreement with Fixed Income Clearing Corporation, dated 6/29/18, repurchase price $1,631,351, collateralized by $1,740,000 U.S. Treasury Notes, 2.000%, due 2/15/25, value $1,667,644 | | | 0.900% | | | | 7/02/18 | | | | | | | $ | 1,631,229 | |
| | | | Total Short-Term Investments (cost $1,631,229) | | | | | | | | | | | | | | | 1,631,229 | |
| | | | Total Investments (cost $283,493,635) – 97.1% | | | | | | | | | | | | | | | 283,826,727 | |
| | | | Other Assets Less Liabilities – 2.9% | | | | | | | | | | | | | | | 8,418,173 | |
| | | | Net Assets – 100% | | | | | | | | | | | | | | $ | 292,244,900 | |
For Fund portfolio compliance purposes, the Fund’s industry classifications refer to any one or more of the industry sub-classifications used by one or more widely recognized market indexes or ratings group indexes, and/or as defined by Fund management. This definition may not apply for purposes of this report, which may combine industry sub-classifications into sectors for reporting ease.
| (1) | All percentages shown in the Portfolio of Investments are based on net assets unless otherwise noted. |
| (2) | For financial reporting purposes, the ratings disclosed are the highest of Standard & Poor’s Group (“Standard & Poor’s”), Moody’s Investors Service, Inc. (“Moody’s”) or Fitch, Inc. (“Fitch”) rating. This treatment of split-rated securities may differ from that used for other purposes, such as for Fund investment policies. Ratings below BBB by Standard & Poor’s, Baa by Moody’s or BBB by Fitch are considered to be below investment grade. Holdings designated N/R are not rated by any of these national rating agencies. |
| (3) | Variable rate security. The rate shown is the coupon as of the end of the reporting period. |
| 144A | Investment is exempt from registration under Rule 144A of the Securities Act of 1933, as amended. These investments may only be resold in transactions exempt from registration, which are normally those transactions with qualified institutional buyers. |
| LIBOR | London Inter-Bank Offered Rate |
| Reg S | Regulation S allows U.S. companies to sell securities to persons or entities located outside of the United States without registering those securities with the Securities and Exchange Commission. Specifically, Regulation S provides a safe harbor from the registration requirements of the Securities Act for the offers and sales of securities by both foreign and domestic issuers that are made outside the United States. |
See accompanying notes to financial statements.
43
| | |
| JHB | | Nuveen High Income November 2021
Target Term Fund Portfolio of Investments June 30, 2018 |
| | | (Unaudited) |
| | | | | | | | | | | | | | | | | | | | |
Principal
Amount (000) | | | Description (1) | | Coupon | | | Maturity | | | Ratings (2) | | | Value | |
| |
| | | | LONG-TERM INVESTMENTS – 131.9% (100.0% of Total Investments) | |
| |
| | | | CORPORATE BONDS – 129.6% (98.2% of Total Investments) | |
| | | | | |
| | | | Aerospace & Defense – 3.8% | | | | | | | | | | | | |
| | | | | |
| $ | 676 | | | Alcoa Inc. | | | 5.400% | | | | 4/15/21 | | | | BBB– | | | $ | 694,590 | |
| | 3,500 | | | Alcoa Inc. | | | 5.870% | | | | 2/23/22 | | | | BBB– | | | | 3,652,250 | |
| | 3,000 | | | Bombardier Inc., 144A | | | 8.750% | | | | 12/01/21 | | | | B | | | | 3,300,000 | |
| | 5,750 | | | Bombardier Inc., 144A | | | 5.750% | | | | 3/15/22 | | | | B | | | | 5,771,563 | |
| | 500 | | | TransDigm Inc. | | | 5.500% | | | | 10/15/20 | | | | B– | | | | 500,000 | |
| | 7,343 | | | Triumph Group Inc. | | | 4.875% | | | | 4/01/21 | | | | B– | | | | 7,067,638 | |
| | 20,769 | | | Total Aerospace & Defense | | | | | | | | | | | | | | | 20,986,041 | |
| | | | | |
| | | | Airlines – 2.9% | | | | | | | | | | | | |
| | | | | |
| | 5,675 | | | Air Canada, 144A | | | 7.750% | | | | 4/15/21 | | | | BB | | | | 6,058,063 | |
| | 1,675 | | | American Airlines Group Inc., 144A | | | 4.625% | | | | 3/01/20 | | | | BB– | | | | 1,666,625 | |
| | 48 | | | Continental Airlines 2007-1 Class B Pass-Through Trust | | | 6.903% | | | | 4/19/22 | | | | BBB– | | | | 50,204 | |
| | 1,500 | | | United Continental Holdings Inc. | | | 6.000% | | | | 12/01/20 | | | | BB | | | | 1,561,875 | |
| | 6,700 | | | Virgin Australia Holdings Limited, 144A | | | 7.875% | | | | 10/15/21 | | | | B– | | | | 6,666,500 | |
| | 15,598 | | | Total Airlines | | | | | | | | | | | | | | | 16,003,267 | |
| | | | | |
| | | | Automobiles – 1.1% | | | | | | | | | | | | |
| | | | | |
| | 6,006 | | | Aston Martin Capital Holdings Ltd, 144A | | | 6.500% | | | | 4/15/22 | | | | B | | | | 6,129,123 | |
| | | | | |
| | | | Banks – 1.9% | | | | | | | | | | | | |
| | | | | |
| | 4,185 | | | CIT Group Inc. | | | 4.125% | | | | 3/09/21 | | | | BB+ | | | | 4,158,844 | |
| | 1,000 | | | Curo Financial Technologies Corporation, 144A | | | 12.000% | | | | 3/01/22 | | | | B– | | | | 1,085,000 | |
| | 3,600 | | | Popular Inc. | | | 7.000% | | | | 7/01/19 | | | | BB– | | | | 3,654,000 | |
| | 1,844 | | | UniCredit SpA, 144A | | | 3.750% | | | | 4/12/22 | | | | Baa1 | | | | 1,759,439 | |
| | 10,629 | | | Total Banks | | | | | | | | | | | | | | | 10,657,283 | |
| | | | | |
| | | | Building Products – 1.6% | | | | | | | | | | | | |
| | | | | |
| | 2,750 | | | Euramax International Inc., 144A | | | 12.000% | | | | 8/15/20 | | | | B– | | | | 2,887,500 | |
| | 5,825 | | | Taylor Morrison Monarch Communities, 144A | | | 5.250% | | | | 4/15/21 | | | | BB | | | | 5,825,000 | |
| | 8,575 | | | Total Building Products | | | | | | | | | | | | | | | 8,712,500 | |
| | | | | |
| | | | Chemicals – 3.0% | | | | | | | | | | | | |
| | | | | |
| | 2,425 | | | CF Industries Inc., 144A | | | 3.400% | | | | 12/01/21 | | | | BBB– | | | | 2,383,192 | |
| | 1,250 | | | Hexion Inc., 144A | | | 10.375% | | | | 2/01/22 | | | | CCC+ | | | | 1,225,000 | |
| | 3,000 | | | Hexion Inc. | | | 6.625% | | | | 4/15/20 | | | | CCC+ | | | | 2,809,200 | |
| | 250 | | | Huntsman International LLC | | | 4.875% | | | | 11/15/20 | | | | BB+ | | | | 253,750 | |
| | 6,230 | | | Platform Specialty Products Corporation, 144A | | | 6.500% | | | | 2/01/22 | | | | B+ | | | | 6,339,025 | |
| | 3,545 | | | WR Grace & Co-Conn, 144A | | | 5.125% | | | | 10/01/21 | | | | BB– | | | | 3,624,763 | |
| | 16,700 | | | Total Chemicals | | | | | | | | | | | | | | | 16,634,930 | |
| | | | | |
| | | | Commercial Services & Supplies – 4.1% | | | | | | | | | | | | |
| | | | | |
| | 6,345 | | | ADT Corporation | | | 6.250% | | | | 10/15/21 | | | | BB– | | | | 6,567,075 | |
| | 4,267 | | | APX Group, Inc. | | | 8.750% | | | | 12/01/20 | | | | CCC | | | | 4,083,946 | |
| | 6,250 | | | GFL Environmental Corporation, 144A | | | 5.625% | | | | 5/01/22 | | | | B– | | | | 6,015,625 | |
| | 5,450 | | | R.R. Donnelley & Sons Company | | | 7.875% | | | | 3/15/21 | | | | B | | | | 5,531,750 | |
| | 500 | | | R.R. Donnelley & Sons Company | | | 7.000% | | | | 2/15/22 | | | | B | | | | 507,500 | |
| | 22,812 | | | Total Commercial Services & Supplies | | | | | | | | | | | | | | | 22,705,896 | |
| | | | | |
| | | | Construction & Engineering – 1.0% | | | | | | | | | | | | |
| | | | | |
| | 1,578 | | | AECOM Global II LLC / URS FOX US LP | | | 5.000% | | | | 4/01/22 | | | | B+ | | | | 1,601,354 | |
44
| | | | | | | | | | | | | | | | | | | | |
Principal
Amount (000) | | | Description (1) | | Coupon | | | Maturity | | | Ratings (2) | | | Value | |
| | | | | |
| | | | Construction & Engineering (continued) | | | | | | | | | | | | |
| | | | | |
| $ | 4,000 | | | HC2 Holdings, Inc., 144A | | | 11.000% | | | | 12/01/19 | | | | B– | | | $ | 4,060,000 | |
| | 5,578 | | | Total Construction & Engineering | | | | | | | | | | | | | | | 5,661,354 | |
| | | | | |
| | | | Consumer Finance – 4.4% | | | | | | | | | | | | |
| | | | | |
| | 4,585 | | | Ally Financial Inc. | | | 4.125% | | | | 2/13/22 | | | | BB+ | | | | 4,503,387 | |
| | 7,752 | | | Credit Acceptance Corporation | | | 6.125% | | | | 2/15/21 | | | | BB | | | | 7,781,070 | |
| | 2,874 | | | Enova International, Inc. | | | 9.750% | | | | 6/01/21 | | | | B– | | | | 3,024,668 | |
| | 2,100 | | | Navient Corporation | | | 6.625% | | | | 7/26/21 | | | | BB | | | | 2,157,120 | |
| | 465 | | | SLM Corp | | | 5.125% | | | | 4/05/22 | | | | BB+ | | | | 462,675 | |
| | 6,225 | | | SLM Corporation | | | 7.250% | | | | 1/25/22 | | | | BB | | | | 6,512,906 | |
| | 24,001 | | | Total Consumer Finance | | | | | | | | | | | | | | | 24,441,826 | |
| | | | | |
| | | | Containers & Packaging – 1.9% | | | | | | | | | | | | |
| | | | | |
| | 4,015 | | | Ardagh Packaging Finance PLC and Ardagh MP Holdings USA, Inc., 144A | | | 6.000% | | | | 6/30/21 | | | | B | | | | 4,060,169 | |
| | 6,245 | | | Owens-Brockway Glass Containers, 144A | | | 5.000% | | | | 1/15/22 | | | | BB– | | | | 6,221,581 | |
| | 10,260 | | | Total Containers & Packaging | | | | | | | | | | | | | | | 10,281,750 | |
| | | | | |
| | | | Diversified Financial Services – 7.2% | | | | | | | | | | | | |
| | | | | |
| | 6,000 | | | Avation Capital SA, 144A | | | 6.500% | | | | 5/15/21 | | | | BB– | | | | 6,030,000 | |
| | 6,475 | | | Fly Leasing Limited | | | 6.375% | | | | 10/15/21 | | | | BB– | | | | 6,677,344 | |
| | 4,500 | | | Jefferies Finance LLC Corporation, 144A | | | 6.875% | | | | 4/15/22 | | | | BB– | | | | 4,488,750 | |
| | 3,080 | | | Ladder Capital Finance Holdings LLLP/ Ladder Capital Finance Corp., 144A | | | 5.250% | | | | 3/15/22 | | | | BB | | | | 3,080,000 | |
| | 4,625 | | | Lincoln Finance LTD, 144A | | | 7.375% | | | | 4/15/21 | | | | BB+ | | | | 4,774,734 | |
| | 8,027 | | | Nationstar Mortgage LLC Capital Corporation | | | 6.500% | | | | 7/01/21 | | | | B+ | | | | 8,004,524 | |
| | 2,798 | | | Park Aerospace Holdings Limited., 144A | | | 3.625% | | | | 3/15/21 | | | | BB | | | | 2,710,563 | |
| | 4,280 | | | PHH Corporation | | | 6.375% | | | | 8/15/21 | | | | N/R | | | | 4,322,800 | |
| | 39,785 | | | Total Diversified Financial Services | | | | | | | | | | | | | | | 40,088,715 | |
| | | | | |
| | | | Diversified Telecommunication Services – 2.6% | | | | | | | | | | | | |
| | | | | |
| | 2,100 | | | CenturyLink Inc. | | | 5.625% | | | | 4/01/20 | | | | BB | | | | 2,123,625 | |
| | 9,195 | | | CenturyLink Inc. | | | 5.800% | | | | 3/15/22 | | | | BB | | | | 9,103,046 | |
| | 3,000 | | | Cogent Communications Group Inc., 144A | | | 5.375% | | | | 3/01/22 | | | | Ba3 | | | | 3,075,000 | |
| | 175 | | | Level 3 Financing Inc. | | | 6.125% | | | | 1/15/21 | | | | BB | | | | 176,094 | |
| | 14,470 | | | Total Diversified Telecommunication Services | | | | | | | | | | | | | | | 14,477,765 | |
| |
| | | | Electronic Equipment, Instruments & Components – 1.1% | |
| | | | | |
| | 6,137 | | | Anixter Inc. | | | 5.125% | | | | 10/01/21 | | | | BBB– | | | | 6,244,398 | |
| | | | | |
| | | | Energy Equipment & Services – 1.6% | | | | | | | | | | | | |
| | | | | |
| | 2,500 | | | Resolute Energy Corporation | | | 8.500% | | | | 5/01/20 | | | | B+ | | | | 2,498,438 | |
| | 4,116 | | | SESI, LLC | | | 7.125% | | | | 12/15/21 | | | | BB– | | | | 4,188,030 | |
| | 1,974 | | | Unit Corp | | | 6.625% | | | | 5/15/21 | | | | BB– | | | | 1,969,065 | |
| | 8,590 | | | Total Energy Equipment & Services | | | | | | | | | | | | | | | 8,655,533 | |
| | | | | |
| | | | Equity Real Estate Investment Trusts – 5.2% | | | | | | | | | | | | |
| | | | | |
| | 3,248 | | | CoreCivic, Inc. | | | 4.125% | | | | 4/01/20 | | | | Ba1 | | | | 3,239,880 | |
| | 3,706 | | | Equinix Inc. | | | 5.375% | | | | 1/01/22 | | | | BB+ | | | | 3,817,180 | |
| | 4,221 | | | Geo Group Inc. | | | 5.875% | | | | 1/15/22 | | | | B+ | | | | 4,273,763 | |
| | 2,925 | | | Iron Mountain Inc., 144A | | | 4.375% | | | | 6/01/21 | | | | BB– | | | | 2,920,437 | |
| | 250 | | | iStar Inc. | | | 4.625% | | | | 9/15/20 | | | | BB | | | | 246,250 | |
| | 8,290 | | | iStar Inc. | | | 6.500% | | | | 7/01/21 | | | | BB | | | | 8,403,986 | |
| | 5,930 | | | Realogy Group LLC / Realogy Co-Issuer Corporation, 144A | | | 5.250% | | | | 12/01/21 | | | | B1 | | | | 5,915,175 | |
| | 28,570 | | | Total Equity Real Estate Investment Trusts | | | | | | | | | | | | | | | 28,816,671 | |
| | | | | |
| | | | Food & Staples Retailing – 0.3% | | | | | | | | | | | | |
| | | | | |
| | 1,575 | | | Supervalu Inc. | | | 6.750% | | | | 6/01/21 | | | | B | | | | 1,602,090 | |
45
| | |
| JHB | | Nuveen High Income November 2021 Target Term Fund (continued) |
| | Portfolio of Investments June 30, 2018 |
| | (Unaudited) |
| | | | | | | | | | | | | | | | | | | | |
Principal
Amount (000) | | | Description (1) | | Coupon | | | Maturity | | | Ratings (2) | | | Value | |
| | | | | |
| | | | Food Products – 1.2% | | | | | | | | | | | | |
| | | | | |
| $ | 2,150 | | | B&G Foods Inc. | | | 4.625% | | | | 6/01/21 | | | | B+ | | | $ | 2,117,750 | |
| | 2,000 | | | JBS USA LLC, 144A | | | 7.250% | | | | 6/01/21 | | | | BB– | | | | 2,020,000 | |
| | 1,700 | | | JBS USA LUX SA / JBA USA Finance Inc., 144A | | | 7.250% | | | | 6/01/21 | | | | BB– | | | | 1,717,000 | |
| | 1,010 | | | Smithfield Foods Inc., 144A | | | 3.350% | | | | 2/01/22 | | | | BBB | | | | 975,039 | |
| | 6,860 | | | Total Food Products | | | | | | | | | | | | | | | 6,829,789 | |
| | | | | |
| | | | Gas Utilities – 0.6% | | | | | | | | | | | | |
| | | | | |
| | 3,980 | | | Ferrellgas LP | | | 6.750% | | | | 1/15/22 | | | | B– | | | | 3,601,900 | |
| | | | | |
| | | | Health Care Providers & Services – 6.9% | | | | | | | | | | | | |
| | | | | |
| | 1,900 | | | Acadia Healthcare | | | 6.125% | | | | 3/15/21 | | | | B | | | | 1,919,000 | |
| | 7,000 | | | Community Health Systems, Inc. | | | 5.125% | | | | 8/01/21 | | | | B | | | | 6,475,000 | |
| | 7,000 | | | HCA Inc. | | | 7.500% | | | | 2/15/22 | | | | Ba2 | | | | 7,612,500 | |
| | 6,886 | | | Lifepoint Health Inc. | | | 5.500% | | | | 12/01/21 | | | | Ba2 | | | | 6,877,393 | |
| | 4,325 | | | Owens & Minor Inc. | | | 3.875% | | | | 9/15/21 | | | | BB | | | | 4,108,750 | |
| | 4,395 | | | Select Medical Corporation | | | 6.375% | | | | 6/01/21 | | | | B– | | | | 4,454,882 | |
| | 1,550 | | | Tenet Healthcare Corporation, 144A | | | 7.500% | | | | 1/01/22 | | | | Ba3 | | | | 1,612,000 | |
| | 5,030 | | | Tenet Healthcare Corporation | | | 4.375% | | | | 10/01/21 | | | | BB– | | | | 4,948,263 | |
| | 38,086 | | | Total Health Care Providers & Services | | | | | | | | | | | | | | | 38,007,788 | |
| | | | | |
| | | | Hotels, Restaurants & Leisure – 4.7% | | | | | | | | | | | | |
| | | | | |
| | 7,375 | | | International Game Technology PLC, 144A | | | 6.250% | | | | 2/15/22 | | | | BB+ | | | | 7,559,375 | |
| | 6,825 | | | MGM Resorts International Inc. | | | 6.625% | | | | 12/15/21 | | | | BB | | | | 7,183,313 | |
| | 4,422 | | | Norwegian Cruise Lines, 144A | | | 4.750% | | | | 12/15/21 | | | | BB | | | | 4,410,945 | |
| | 2,000 | | | Scientific Games International Inc. | | | 6.625% | | | | 5/15/21 | | | | CCC+ | | | | 2,025,000 | |
| | 4,750 | | | Studio City Co Ltd, 144A | | | 7.250% | | | | 11/30/21 | | | | BB– | | | | 4,904,375 | |
| | 25,372 | | | Total Hotels, Restaurants & Leisure | | | | | | | | | | | | | | | 26,083,008 | |
| | | | | |
| | | | Household Durables – 6.3% | | | | | | | | | | | | |
| | | | | |
| | 7,725 | | | Beazer Homes USA, Inc. | | | 8.750% | | | | 3/15/22 | | | | B3 | | | | 8,207,811 | |
| | 1,510 | | | Brookfield Residential Properties Inc., 144A | | | 6.500% | | | | 12/15/20 | | | | B+ | | | | 1,528,875 | |
| | 3,960 | | | KB Home | | | 7.000% | | | | 12/15/21 | | | | BB– | | | | 4,158,000 | |
| | 1,250 | | | Lennar Corp | | | 6.250% | | | | 12/15/21 | | | | BB+ | | | | 1,309,375 | |
| | 2,500 | | | Lennar Corporation | | | 4.750% | | | | 4/01/21 | | | | BB+ | | | | 2,535,625 | |
| | 450 | | | Lennar Corporation | | | 4.125% | | | | 1/15/22 | | | | BB+ | | | | 445,500 | |
| | 5,205 | | | Meritage Homes Corporation | | | 7.000% | | | | 4/01/22 | | | | BB | | | | 5,608,388 | |
| | 4,000 | | | M-I Homes Inc. | | | 6.750% | | | | 1/15/21 | | | | BB– | | | | 4,124,160 | |
| | 4,375 | | | New Home Company Inc. | | | 7.250% | | | | 4/01/22 | | | | B– | | | | 4,500,038 | |
| | 500 | | | Toll Brothers Finance Corp | | | 5.875% | | | | 2/15/22 | | | | BBB– | | | | 518,750 | |
| | 2,000 | | | TRI Pointe Group Inc. | | | 4.875% | | | | 7/01/21 | | | | BB– | | | | 2,012,500 | |
| | 33,475 | | | Total Household Durables | | | | | | | | | | | | | | | 34,949,022 | |
| | | | | |
| | | | Household Products – 1.2% | | | | | | | | | | | | |
| | | | | |
| | 6,325 | | | HRG Group, Inc. | | | 7.750% | | | | 1/15/22 | | | | B | | | | 6,498,938 | |
| |
| | | | Independent Power & Renewable Electricity Producers – 3.5% | |
| | | | | |
| | 1,000 | | | AES Corp/VA | | | 4.000% | | | | 3/15/21 | | | | BB+ | | | | 995,000 | |
| | 3,550 | | | Atlantica Yield PLC, 144A | | | 7.000% | | | | 11/15/19 | | | | BB+ | | | | 3,674,250 | |
| | 1,000 | | | Calpine Corporation, 144A | | | 6.000% | | | | 1/15/22 | | | | BB+ | | | | 1,020,000 | |
| | 7,397 | | | DPL, Inc. | | | 7.250% | | | | 10/15/21 | | | | BBB– | | | | 7,987,650 | |
| | 6,675 | | | Talen Energy Supply LLC | | | 4.600% | | | | 12/15/21 | | | | B– | | | | 5,757,188 | |
| | 19,622 | | | Total Independent Power & Renewable Electricity Producers | | | | | | | | | | | | | | | 19,434,088 | |
| | | | | |
| | | | Industrial Conglomerates – 1.7% | | | | | | | | | | | | |
| | | | | |
| | 2,000 | | | Icahn Enterprises Finance | | | 6.250% | | | | 2/01/22 | | | | BB+ | | | | 2,040,000 | |
| | 7,000 | | | Icahn Enterprises Finance | | | 5.875% | | | | 2/01/22 | | | | BB+ | | | | 7,001,400 | |
| | 500 | | | Techniplas, LLC, 144A | | | 10.000% | | | | 5/01/20 | | | | B– | | | | 445,000 | |
| | 9,500 | | | Total Industrial Conglomerates | | | | | | | | | | | | | | | 9,486,400 | |
| | | | | |
| | | | Insurance – 0.7% | | | | | | | | | | | | |
| | | | | |
| | 3,897 | | | Genworth Financial Inc. | | | 7.625% | | | | 9/24/21 | | | | B | | | | 3,979,305 | |
46
| | | | | | | | | | | | | | | | | | | | |
Principal
Amount (000) | | | Description (1) | | Coupon | | | Maturity | | | Ratings (2) | | | Value | |
| | | | | |
| | | | Internet & Direct Marketing Retail – 1.0% | | | | | | | | | | | | |
| | | | | |
| $ | 5,155 | | | Netflix Incorporated | | | 5.500% | | | | 2/15/22 | | | | Ba3 | | | $ | 5,303,206 | |
| | | | | |
| | | | IT Services – 0.8% | | | | | | | | | | | | |
| | | | | |
| | 4,500 | | | Alliance Data Systems Corporation, 144A | | | 5.875% | | | | 11/01/21 | | | | N/R | | | | 4,590,000 | |
| | | | | |
| | | | Leisure Products – 0.6% | | | | | | | | | | | | |
| | | | | |
| | 3,570 | | | Mattel Inc. | | | 2.350% | | | | 8/15/21 | | | | B+ | | | | 3,239,775 | |
| | | | | |
| | | | Machinery – 0.5% | | | | | | | | | | | | |
| | | | | |
| | 1,000 | | | CNH Industrial Capital LLC | | | 4.875% | | | | 4/01/21 | | | | BBB– | | | | 1,026,250 | |
| | 1,500 | | | CNH Industrial Capital LLC | | | 3.875% | | | | 10/15/21 | | | | BBB– | | | | 1,492,500 | |
| | 2,500 | | | Total Machinery | | | | | | | | | | | | | | | 2,518,750 | |
| | | | | |
| | | | Media – 10.3% | | | | | | | | | | | | |
| | | | | |
| | 4,824 | | | AMC Entertainment Inc. | | | 5.875% | | | | 2/15/22 | | | | B+ | | | | 4,908,420 | |
| | 2,500 | | | Cablevision Systems Corporation | | | 8.000% | | | | 4/15/20 | | | | B– | | | | 2,624,250 | |
| | 8,650 | | | Cequel Communication Holdings I, 144A | | | 5.125% | | | | 12/15/21 | | | | B | | | | 8,595,936 | |
| | 6,580 | | | Clear Channel International BV, 144A | | | 8.750% | | | | 12/15/20 | | | | B+ | | | | 6,802,075 | |
| | 5,770 | | | CSC Holdings Inc. | | | 6.750% | | | | 11/15/21 | | | | B2 | | | | 6,044,075 | |
| | 6,985 | | | Dish DBS Corporation | | | 6.750% | | | | 6/01/21 | | | | BB | | | | 6,993,731 | |
| | 4,250 | | | Lee Enterprises Inc., 144A | | | 9.500% | | | | 3/15/22 | | | | B2 | | | | 4,435,938 | |
| | 4,160 | | | National CineMedia LLC | | | 6.000% | | | | 4/15/22 | | | | Ba3 | | | | 4,227,600 | |
| | 5,121 | | | Nexstar Broadcasting Inc., 144A | | | 6.125% | | | | 2/15/22 | | | | B+ | | | | 5,236,223 | |
| | 6,425 | | | Radio One Inc., 144A | | | 7.375% | | | | 4/15/22 | | | | B | | | | 6,216,188 | |
| | 1,100 | | | Sinclair Television Group | | | 5.375% | | | | 4/01/21 | | | | B+ | | | | 1,108,250 | |
| | 56,365 | | | Total Media | | | | | | | | | | | | | | | 57,192,686 | |
| | | | | |
| | | | Metals & Mining – 8.0% | | | | | | | | | | | | |
| | | | | |
| | 6,500 | | | AK Steel Corporation | | | 7.625% | | | | 10/01/21 | | | | B– | | | | 6,628,050 | |
| | 8,040 | | | Allegheny Technologies Inc. | | | 5.950% | | | | 1/15/21 | | | | B | | | | 8,080,198 | |
| | 2,000 | | | Anglo American Capital PLC, 144A | | | 4.125% | | | | 4/15/21 | | | | BBB– | | | | 2,017,440 | |
| | 2,000 | | | Century Aluminum Company, 144A | | | 7.500% | | | | 6/01/21 | | | | B+ | | | | 2,015,000 | |
| | 5,705 | | | Eldorado Gold Corporation, 144A | | | 6.125% | | | | 12/15/20 | | | | B | | | | 5,505,325 | |
| | 2,600 | | | Ferroglobe PLC / Globe Specialty Metals Inc., 144A | | | 9.375% | | | | 3/01/22 | | | | B+ | | | | 2,691,000 | |
| | 6,350 | | | First Quantum Minerals Limited, 144A | | | 7.000% | | | | 2/15/21 | | | | B | | | | 6,413,500 | |
| | 2,165 | | | Freeport McMoRan, Inc. | | | 3.550% | | | | 3/01/22 | | | | BB+ | | | | 2,056,750 | |
| | 1,500 | | | Glencore Finance Canada, 144A | | | 4.950% | | | | 11/15/21 | | | | BBB+ | | | | 1,556,850 | |
| | 3,200 | | | Gold Fields Orogen Holdings BVI Limited, 144A | | | 4.875% | | | | 10/07/20 | | | | Baa3 | | | | 3,191,424 | |
| | 3,963 | | | Teck Resources Limited | | | 4.750% | | | | 1/15/22 | | | | BB+ | | | | 3,971,283 | |
| | 413 | | | Vale Overseas Limited | | | 4.375% | | | | 1/11/22 | | | | BBB+ | | | | 417,952 | |
| | 44,436 | | | Total Metals & Mining | | | | | | | | | | | | | | | 44,544,772 | |
| | | | | |
| | | | Mortgage Real Estate Investment Trusts – 1.2% | | | | | | | | | | | | |
| | | | | |
| | 6,500 | | | Starwood Property Trust | | | 5.000% | | | | 12/15/21 | | | | BB– | | | | 6,548,750 | |
| | | | | |
| | | | Multiline Retail – 0.0% | | | | | | | | | | | | |
| | | | | |
| | 37 | | | J.C. Penney Corporation Inc. | | | 5.650% | | | | 6/01/20 | | | | B+ | | | | 36,353 | |
| | | | | |
| | | | Oil, Gas & Consumable Fuels – 15.7% | | | | | | | | | | | | |
| | | | | |
| | 4,210 | | | Ascent Resources – Utica LLC / AEU Finance Corporation, 144A | | | 10.000% | | | | 4/01/22 | | | | B– | | | | 4,631,000 | |
| | 3,000 | | | Calumet Specialty Products | | | 6.500% | | | | 4/15/21 | | | | B– | | | | 2,985,000 | |
| | 2,512 | | | Chesapeake Energy Corporation. | | | 5.375% | | | | 6/15/21 | | | | CCC+ | | | | 2,461,760 | |
| | 7,100 | | | CONSOL Energy Inc. | | | 5.875% | | | | 4/15/22 | | | | BB– | | | | 7,136,849 | |
| | 1,020 | | | DCP Midstream Operating LP, 144A | | | 4.750% | | | | 9/30/21 | | | | BB+ | | | | 1,030,200 | |
| | 480 | | | DCP Midstream Operating LP | | | 4.950% | | | | 4/01/22 | | | | BB+ | | | | 485,400 | |
| | 2,000 | | | Denbury Resources Inc., 144A | | | 9.000% | | | | 5/15/21 | | | | B | | | | 2,114,400 | |
| | 3,000 | | | Enviva Partners LP / Enviva Partners Finance Corp. | | | 8.500% | | | | 11/01/21 | | | | BB– | | | | 3,120,000 | |
| | 5,559 | | | FTS International Inc. | | | 6.250% | | | | 5/01/22 | | | | B | | | | 5,607,363 | |
| | 1,250 | | | GasLog Limited | | | 8.875% | | | | 3/22/22 | | | | N/R | | | | 1,296,875 | |
| | 2,000 | | | Ithaca Energy Inc., 144A | | | 8.125% | | | | 7/01/19 | | | | CCC+ | | | | 1,985,000 | |
| | 2,910 | | | Martin Mid-Stream Partners LP Finance | | | 7.250% | | | | 2/15/21 | | | | B– | | | | 2,873,625 | |
| | 2,172 | | | Newfield Exploration Company | | | 5.750% | | | | 1/30/22 | | | | BB+ | | | | 2,261,595 | |
47
| | |
| JHB | | Nuveen High Income November 2021 Target Term Fund (continued) |
| | Portfolio of Investments June 30, 2018 |
| | (Unaudited) |
| | | | | | | | | | | | | | | | | | | | |
Principal
Amount (000) | | | Description (1) | | Coupon | | | Maturity | | | Ratings (2) | | | Value | |
| | | | | |
| | | | Oil, Gas & Consumable Fuels (continued) | | | | | | | | | | | | |
| | | | | |
| $ | 2,600 | | | NGL Energy Partners LP/Fin Co | | | 6.875% | | | | 10/15/21 | | | | B+ | | | $ | 2,632,500 | |
| | 5,000 | | | NuStar Logistics LP | | | 4.750% | | | | 2/01/22 | | | | BB | | | | 4,887,500 | |
| | 4,171 | | | Oasis Petroleum Inc. | | | 6.875% | | | | 3/15/22 | | | | BB– | | | | 4,242,783 | |
| | 4,475 | | | Peabody Securities Finance Corporation, 144A | | | 6.000% | | | | 3/31/22 | | | | BB | | | | 4,530,938 | |
| | 2,000 | | | Petrobras Global Finance BV | | | 8.375% | | | | 5/23/21 | | | | Ba2 | | | | 2,173,000 | |
| | 750 | | | Petrobras Global Finance BV | | | 6.125% | | | | 1/17/22 | | | | Ba2 | | | | 762,750 | |
| | 3,000 | | | Petrobras International Finance Company | | | 5.375% | | | | 1/27/21 | | | | Ba2 | | | | 3,021,900 | |
| | 3,483 | | | Range Resources Corporation | | | 5.750% | | | | 6/01/21 | | | | BB+ | | | | 3,570,075 | |
| | 2,059 | | | Sabine Pass Liquefaction LLC | | | 6.250% | | | | 3/15/22 | | | | BBB– | | | | 2,214,467 | |
| | 4,000 | | | Southwestern Energy Company | | | 4.100% | | | | 3/15/22 | | | | BB | | | | 3,820,000 | |
| | 3,070 | | | Teekay Corporation | | | 8.500% | | | | 1/15/20 | | | | B+ | | | | 3,162,100 | |
| | 2,500 | | | Ultra Resources, Inc., 144A | | | 6.875% | | | | 4/15/22 | | | | BB | | | | 1,893,750 | |
| | 4,500 | | | Whiting Petroleum Corporation | | | 5.750% | | | | 3/15/21 | | | | BB– | | | | 4,598,865 | |
| | 500 | | | Williams Partners LP | | | 3.600% | | | | 3/15/22 | | | | BBB | | | | 497,425 | |
| | 4,000 | | | WPX Energy Inc. | | | 6.000% | | | | 1/15/22 | | | | BB– | | | | 4,160,000 | |
| | 3,000 | | | YPF Sociedad Anonima, 144A | | | 8.500% | | | | 3/23/21 | | | | B2 | | | | 3,049,500 | |
| | 86,321 | | | Total Oil, Gas & Consumable Fuels | | | | | | | | | | | | | | | 87,206,620 | |
| | | | | |
| | | | Pharmaceuticals – 2.7% | | | | | | | | | | | | |
| | | | | |
| | 4,000 | | | Endo Finance LLC, 144A | | | 5.750% | | | | 1/15/22 | | | | B3 | | | | 3,580,000 | |
| | 5,199 | | | Teva Pharmaceuticals IV BV | | | 3.650% | | | | 11/10/21 | | | | BB | | | | 4,978,655 | |
| | 3,801 | | | Valeant Pharmaceuticals International, 144A | | | 5.625% | | | | 12/01/21 | | | | B– | | | | 3,739,234 | |
| | 2,500 | | | Valeant Pharmaceuticals International, 144A | | | 6.500% | | | | 3/15/22 | | | | BB– | | | | 2,587,500 | |
| | 15,500 | | | Total Pharmaceuticals | | | | | | | | | | | | | | | 14,885,389 | |
| | | | | |
| | | | Professional Services – 1.1% | | | | | | | | | | | | |
| | | | | |
| | 6,000 | | | Nielsen Finance LLC Co, 144A | | | 5.000% | | | | 4/15/22 | | | | BB+ | | | | 5,895,600 | |
| | | | | |
| | | | Real Estate Management & Development – 1.2% | | | | | | | | | | | | |
| | | | | |
| | 3,579 | | | Crescent Communities LLC, 144A | | | 8.875% | | | | 10/15/21 | | | | B+ | | | | 3,775,845 | |
| | 3,250 | | | Yuzhou Properties Co Limited, Reg S | | | 6.000% | | | | 1/25/22 | | | | BB– | | | | 3,026,319 | |
| | 6,829 | | | Total Real Estate Management & Development | | | | | | | | | | | | | | | 6,802,164 | |
| | | | | |
| | | | Road & Rail – 0.8% | | | | | | | | | | | | |
| | | | | |
| | 4,500 | | | The Hertz Corporation | | | 7.375% | | | | 1/15/21 | | | | B– | | | | 4,410,000 | |
| | | | | |
| | | | Semiconductors & Semiconductor Equipment – 0.3% | | | | | | | | | | | | |
| | | | | |
| | 1,635 | | | NXP BV / NXP Funding LLC, 144A | | | 4.125% | | | | 6/01/21 | | | | BBB– | | | | 1,630,913 | |
| | | | | |
| | | | Software – 0.2% | | | | | | | | | | | | |
| | | | | |
| | 872 | | | Curo Financial Technologies Corporation, 144A | | | 12.000% | | | | 3/01/22 | | | | Caa1 | | | | 928,680 | |
| | | | | |
| | | | Sovereign – 0.4% | | | | | | | | | | | | |
| | | | | |
| | 2,000 | | | Instituto Costarricense de Electricidad, 144A | | | 6.950% | | | | 11/10/21 | | | | Ba2 | | | | 2,070,000 | |
| | | | | |
| | | | Specialty Retail – 4.4% | | | | | | | | | | | | |
| | | | | |
| | 7,000 | | | Foot Locker, Inc. | | | 8.500% | | | | 1/15/22 | | | | BB+ | | | | 7,997,500 | |
| | 7,000 | | | GameStop Corporation, 144A | | | 6.750% | | | | 3/15/21 | | | | Ba1 | | | | 7,087,500 | |
| | 2,000 | | | Gap, Inc. | | | 5.950% | | | | 4/12/21 | | | | Baa2 | | | | 2,094,410 | |
| | 3,000 | | | Limited Brands Inc. | | | 6.625% | | | | 4/01/21 | | | | BB+ | | | | 3,165,000 | |
| | 448 | | | Limited Brands Inc. | | | 5.625% | | | | 2/15/22 | | | | BB+ | | | | 454,720 | |
| | 3,815 | | | Rent-A-Center, Inc. | | | 4.750% | | | | 5/01/21 | | | | B3 | | | | 3,815,000 | |
| | 23,263 | | | Total Specialty Retail | | | | | | | | | | | | | | | 24,614,130 | |
| | | | | |
| | | | Technology Hardware, Storage & Peripherals – 3.1% | | | | | | | | | | | | |
| | | | | |
| | 7,000 | | | Diamond 1 Finance Corporation / Diamond 2 Finance Corporation, 144A | | | 5.875% | | | | 6/15/21 | | | | BB+ | | | | 7,094,996 | |
| | 1,750 | | | NCR Corporation | | | 4.625% | | | | 2/15/21 | | | | BB | | | | 1,736,875 | |
| | 2,875 | | | NCR Corporation | | | 5.875% | | | | 12/15/21 | | | | BB | | | | 2,918,125 | |
| | 5,585 | | | Seagate HDD Cayma | | | 4.250% | | | | 3/01/22 | | | | Baa3 | | | | 5,530,301 | |
| | 17,210 | | | Total Technology Hardware, Storage & Peripherals | | | | | | | | | | | | | | | 17,280,297 | |
48
| | | | | | | | | | | | | | | | | | | | |
Principal
Amount (000) | | | Description (1) | | Coupon | | | Maturity | | | Ratings (2) | | | Value | |
| | | | | |
| | | | Thrifts & Mortgage Finance – 0.5% | | | | | | | | | | | | |
| | | | | |
| $ | 2,553 | | | Radian Group Inc. | | | 7.000% | | | | 3/15/21 | | | | BB+ | | | $ | 2,706,180 | |
| | | | | |
| | | | Tobacco – 1.0% | | | | | | | | | | | | |
| | | | | |
| | 5,320 | | | Alliance One International Inc., 144A | | | 8.500% | | | | 4/15/21 | | | | B2 | | | | 5,479,600 | |
| | | | | |
| | | | Trading Companies & Distributors – 1.3% | | | | | | | | | | | | |
| | | | | |
| | 5,000 | | | Aircastle Limited | | | 5.500% | | | | 2/15/22 | | | | BBB– | | | | 5,129,150 | |
| | 2,150 | | | Fortress Transportation & Infrastructure Investors LLC, 144A | | | 6.750% | | | | 3/15/22 | | | | B+ | | | | 2,198,375 | |
| | 7,150 | | | Total Trading Companies & Distributors | | | | | | | | | | | | | | | 7,327,525 | |
| | | | | |
| | | | Transportation Infrastructure – 0.5% | | | | | | | | | | | | |
| | | | | |
| | 3,000 | | | Navigator Holdings Limited, 144A, Reg S | | | 7.750% | | | | 2/10/21 | | | | N/R | | | | 2,932,206 | |
| | | | | |
| | | | Wireless Telecommunication Services – 3.5% | | | | | | | | | | | | |
| | | | | |
| | 4,200 | | | Digicel Limited, 144A | | | 6.000% | | | | 4/15/21 | | | | B1 | | | | 3,790,500 | |
| | 6,675 | | | Hughes Satellite Systems Corporation | | | 7.625% | | | | 6/15/21 | | | | BB– | | | | 7,100,531 | |
| | 1,475 | | | Sprint Communications Inc. | | | 9.250% | | | | 4/15/22 | | | | BB+ | | | | 1,659,375 | |
| | 5,375 | | | Sprint Corporation | | | 7.250% | | | | 9/15/21 | | | | B+ | | | | 5,590,000 | |
| | 1,029 | | | T-Mobile USA Inc. | | | 4.000% | | | | 4/15/22 | | | | BB+ | | | | 1,018,504 | |
| | 18,754 | | | Total Wireless Telecommunication Services | | | | | | | | | | | | | | | 19,158,910 | |
| $ | 711,142 | | | Total Corporate Bonds (cost $720,724,654) | | | | | | | | | | | | | | | 718,271,886 | |
| | | | | |
Principal
Amount (000) | | | Description (1) | | Coupon | | | Maturity | | | Ratings (2) | | | Value | |
| | | | | |
| | | | SOVEREIGN DEBT – 1.6% (1.2% of Total Investments) | | | | | | | | | | | | | | | | |
| | | | | |
| | | | Argentina – 0.5% | | | | | | | | | | | | |
| | | | | |
| $ | 3,000 | | | Republic of Argentina | | | 6.875% | | | | 4/22/21 | | | | B+ | | | $ | 2,955,000 | |
| | | | | |
| | | | Egypt – 0.3% | | | | | | | | | | | | |
| | | | | |
| | 1,500 | | | Arab Republic of Egypt, 144A | | | 6.125% | | | | 1/31/22 | | | | B | | | | 1,474,578 | |
| | | | | |
| | | | Honduras – 0.3% | | | | | | | | | | | | |
| | | | | |
| | 1,500 | | | Honduras Government, 144A | | | 8.750% | | | | 12/16/20 | | | | BB– | | | | 1,621,425 | |
| | | | | |
| | | | Sri Lanka – 0.3% | | | | | | | | | | | | |
| | | | | |
| | 1,500 | | | Republic of Sri Lanka, 144A | | | 5.750% | | | | 1/18/22 | | | | B+ | | | | 1,473,557 | |
| | | | | |
| | | | Turkey – 0.2% | | | | | | | | | | | | |
| | | | | |
| | 1,500 | | | Republic of Turkey | | | 5.125% | | | | 3/25/22 | | | | BB+ | | | | 1,452,096 | |
| $ | 9,000 | | | Total Sovereign Debt (cost $9,536,637) | | | | | | | | | | | | | | | 8,976,656 | |
| | | | | |
Principal
Amount (000) | | | Description (1) | | Coupon | | | Maturity | | | Ratings (2) | | | Value | |
| |
| | | | CONVERTIBLE BONDS – 0.7% (0.6% of Total Investments) | |
| |
| | | | Independent Power & Renewable Electricity Producers – 0.7% | |
| | | | | |
| $ | 4,000 | | | NRG Yield Inc., 144A | | | 3.250% | | | | 6/01/20 | | | | N/R | | | $ | 3,968,536 | |
| $ | 4,000 | | | Total Convertible Bonds (cost $3,939,479) | | | | | | | | | | | | | | | 3,968,536 | |
| | | | Total Long-Term Investments (cost $734,200,770) | | | | | | | | | | | | | | | 731,217,078 | |
| | | | Borrowings – (34.3)% (3), (4) | | | | | | | | | | | | | | | (190,000,000 | ) |
| | | | Other Assets Less Liabilities – 2.4% | | | | | | | | | | | | | | | 13,246,421 | |
| | | | Net Assets – 100% | | | | | | | | | | | | | | $ | 554,463,499 | |
49
| | |
| JHB | | Nuveen High Income November 2021 Target Term Fund (continued) |
| | Portfolio of Investments June 30, 2018 |
| | (Unaudited) |
For Fund portfolio compliance purposes, the Fund’s industry classifications refer to any one or more of the industry sub-classifications used by one or more widely recognized market indexes or ratings group indexes, and/or as defined by Fund management. This definition may not apply for purposes of this report, which may combine industry sub-classifications into sectors for reporting ease.
| (1) | All percentages shown in the Portfolio of Investments are based on net assets unless otherwise noted. |
| (2) | For financial reporting purposes, the ratings disclosed are the highest of Standard & Poor’s Group (“Standard & Poor’s”), Moody’s Investors Service, Inc. (“Moody’s”) or Fitch, Inc. (“Fitch”) rating. This treatment of split-rated securities may differ from that used for other purposes, such as for Fund investment policies. Ratings below BBB by Standard & Poor’s, Baa by Moody’s or BBB by Fitch are considered to be below investment grade. Holdings designated N/R are not rated by any of these national rating agencies. |
| (3) | Borrowings as a percentage of Total Investments is 26.0%. |
| (4) | The Fund may pledge up to 100% of its eligible investments (excluding any investments separately pledged as collateral for specific investments in derivatives) in the Portfolio of Investments as collateral for borrowings. |
| 144A | Investment is exempt from registration under Rule 144A of the Securities Act of 1933, as amended. These investments may only be resold in transactions exempt from registration, which are normally those transactions with qualified institutional buyers. |
| Reg S | Regulation S allows U.S. companies to sell securities to persons or entities located outside of the United States without registering those securities with the Securities and Exchange Commission. Specifically, Regulation S provides a safe harbor from the registration requirements of the Securities Act for the offers and sales of securities by both foreign and domestic issuers that are made outside the United States. |
See accompanying notes to financial statements.
50
Statement of Assets and Liabilities
June 30, 2018
(Unaudited)
| | | | | | | | | | | | | | | | |
| | | JHY | | | JHD | | | JHA | | | JHB | |
Assets | | | | | | | | | | | | | | | | |
Long-term investments, at value (cost $211,058,245, $279,971,682, $281,862,406 and $734,200,770, respectively) | | $ | 209,221,693 | | | $ | 280,316,522 | | | $ | 282,195,498 | | | $ | 731,217,078 | |
Short-term investments, at value (cost approximates value) | | | 899,774 | | | | 379,550 | | | | 1,631,229 | | | | — | |
Cash | | | — | | | | — | | | | — | | | | 5,489,022 | |
Receivable for: | | | | | | | | | | | | | | | | |
Interest | | | 3,262,814 | | | | 3,629,087 | | | | 3,451,681 | | | | 11,794,077 | |
Investments sold | | | 2,316,185 | | | | 10,129,096 | | | | 7,375,740 | | | | 4,850,146 | |
Reclaims | | | — | | | | — | | | | — | | | | 20,245 | |
Other assets | | | 18,486 | | | | 10,415 | | | | 13,717 | | | | 37,117 | |
Total assets | | | 215,718,952 | | | | 294,464,670 | | | | 294,667,865 | | | | 753,407,685 | |
Liabilities | | | | | | | | | | | | | | | | |
Borrowings | | | 61,500,000 | | | | 19,500,000 | | | | — | | | | 190,000,000 | |
Payable for: | | | | | | | | | | | | | | | | |
Dividends | | | 631,857 | | | | 918,060 | | | | 777,402 | | | | 2,526,911 | |
Investments purchased | | | 746,020 | | | | 2,446,892 | | | | 1,368,511 | | | | 5,387,162 | |
Accrued expenses: | | | | | | | | | | | | | | | | |
Interest on borrowings | | | 46,054 | | | | 28,737 | | | | — | | | | 434,388 | |
Management fees | | | 116,256 | | | | 158,249 | | | | 158,450 | | | | 402,040 | |
Trustees fees | | | 1,226 | | | | 8,229 | | | | 10,978 | | | | 16,707 | |
Other | | | 77,187 | | | | 107,094 | | | | 107,624 | | | | 176,978 | |
Total liabilities | | | 63,118,600 | | | | 23,167,261 | | | | 2,422,965 | | | | 198,944,186 | |
Net assets | | $ | 152,600,352 | | | $ | 271,297,409 | | | $ | 292,244,900 | | | $ | 554,463,499 | |
Shares outstanding | | | 15,657,860 | | | | 27,064,130 | | | | 29,344,966 | | | | 55,871,646 | |
Net asset value (“NAV”) per share outstanding | | $ | 9.75 | | | $ | 10.02 | | | $ | 9.96 | | | $ | 9.92 | |
Net assets consist of: | | | | | | | | | | | | | | | | |
Shares, $0.01 par value per share | | $ | 156,579 | | | $ | 270,641 | | | $ | 293,450 | | | $ | 558,716 | |
Paid-in surplus | | | 153,805,809 | | | | 265,834,533 | | | | 288,292,545 | | | | 548,851,094 | |
Undistributed (Over-distribution of) net investment income | | | 702,154 | | | | 3,356,170 | | | | 2,237,046 | | | | 5,664,044 | |
Accumulated net realized gain (loss) | | | (227,638 | ) | | | 1,491,225 | | | | 1,088,767 | | | | 2,373,337 | |
Net unrealized appreciation (depreciation) | | | (1,836,552 | ) | | | 344,840 | | | | 333,092 | | | | (2,983,692 | ) |
Net assets | | $ | 152,600,352 | | | $ | 271,297,409 | | | $ | 292,244,900 | | | $ | 554,463,499 | |
Authorized shares | | | Unlimited | | | | Unlimited | | | | Unlimited | | | | Unlimited | |
See accompanying notes to financial statements.
51
Statement of Operations
Six Months Ended June 30, 2018
(Unaudited)
| | | | | | | | | | | | | | | | |
| | | JHY | | | JHD | | | JHA | | | JHB | |
Investment Income | | $ | 5,668,043 | | | $ | 7,733,221 | | | $ | 5,955,199 | | | $ | 21,953,714 | |
Expenses | | | | | | | | | | | | | | | | |
Management fees | | | 673,133 | | | | 1,040,432 | | | | 958,615 | | | | 2,435,755 | |
Interest expense on borrowings | | | 641,754 | | | | 536,263 | | | | — | | | | 2,368,317 | |
Custodian fees | | | 32,234 | | | | 37,271 | | | | 34,949 | | | | 63,660 | |
Trustees fees | | | 2,353 | | | | 3,679 | | | | 3,245 | | | | 8,742 | |
Professional fees | | | 23,168 | | | | 19,862 | | | | 22,093 | | | | 29,348 | |
Shareholder reporting expenses | | | 44,094 | | | | 21,483 | | | | 24,090 | | | | 40,230 | |
Shareholder servicing agent fees | | | 73 | | | | 62 | | | | 62 | | | | 62 | |
Shelf offering expenses | | | 123,442 | | | | — | | | | — | | | | — | |
Stock exchange listing fees | | | 6,715 | | | | 3,732 | | | | 4,067 | | | | 7,721 | |
Investor relations expenses | | | 7,005 | | | | 10,800 | | | | 10,107 | | | | 23,579 | |
Other | | | 10,747 | | | | 11,884 | | | | 8,061 | | | | 13,902 | |
Total expenses | | | 1,564,718 | | | | 1,685,468 | | | | 1,065,289 | | | | 4,991,316 | |
Net investment income (loss) | | | 4,103,325 | | | | 6,047,753 | | | | 4,889,910 | | | | 16,962,398 | |
Realized and Unrealized Gain (Loss) | | | | | | | | | | | | | | | | |
Net realized gain (loss) from investments and foreign currency | | | 237,731 | | | | 702,059 | | | | 542,065 | | | | 2,326,910 | |
Change in net unrealized appreciation (depreciation) of investments and foreign currency | | | (2,523,049 | ) | | | (4,838,063 | ) | | | (2,618,775 | ) | | | (14,231,024 | ) |
Net realized and unrealized gain (loss) | | | (2,285,318 | ) | | | (4,136,004 | ) | | | (2,076,710 | ) | | | (11,904,114 | ) |
Net increase (decrease) in net assets from operations | | $ | 1,818,007 | | | $ | 1,911,749 | | | $ | 2,813,200 | | | $ | 5,058,284 | |
See accompanying notes to financial statements.
52
Statement of Changes in Net Assets
(Unaudited)
| | | | | | | | | | | | | | | | | | | | | | | | | | | | | | | | |
| | | JHY | | | JHD | | | JHA | | | JHB | |
| | | Six Months
Ended
6/30/18 | | | Year Ended 12/31/17 | | | Six Months
Ended
6/30/18 | | | Year Ended 12/31/17 | | | Six Months
Ended
6/30/18 | | | Year Ended 12/31/17 | | | Six Months
Ended
6/30/18 | | | Year Ended 12/31/17 | |
Operations | | | | | | | | | | | | | | | | | | | | | | | | | | | | | | | | |
Net investment income (loss) | | $ | 4,103,325 | | | $ | 9,164,932 | | | $ | 6,047,753 | | | $ | 15,470,386 | | | $ | 4,889,910 | | | $ | 13,796,308 | | | $ | 16,962,398 | | | $ | 36,015,784 | |
Net realized gain (loss) from investments and foreign currency | | | 237,731 | | | | 2,146,131 | | | | 702,059 | | | | 2,315,692 | | | | 542,065 | | | | 1,873,212 | | | | 2,326,910 | | | | 1,106,900 | |
Change in net unrealized appreciation (depreciation) of investments and foreign currency | | | (2,523,049 | ) | | | (284,731 | ) | | | (4,838,063 | ) | | | (440,216 | ) | | | (2,618,775 | ) | | | (2,088,656 | ) | | | (14,231,024 | ) | | | 7,701,725 | |
Net increase (decrease) in net assets from operations | | | 1,818,007 | | | | 11,026,332 | | | | 1,911,749 | | | | 17,345,862 | | | | 2,813,200 | | | | 13,580,864 | | | | 5,058,284 | | | | 44,824,409 | |
Distributions to Shareholders | | | | | | | | | | | | | | | | | | | | | | | | | | | | | | | | |
From net investment income | | | (4,192,676 | ) | | | (9,060,189 | ) | | | (6,238,282 | ) | | | (14,783,538 | ) | | | (5,340,784 | ) | | | (13,621,975 | ) | | | (15,979,291 | ) | | | (32,335,393 | ) |
From accumulated net realized gains | | | — | | | | — | | | | — | | | | (1,735,590 | ) | | | — | | | | (1,127,959 | ) | | | — | | | | (1,186,340 | ) |
Decrease in net assets from distributions to shareholders | | | (4,192,676 | ) | | | (9,060,189 | ) | | | (6,238,282 | ) | | | (16,519,128 | ) | | | (5,340,784 | ) | | | (14,749,934 | ) | | | (15,979,291 | ) | | | (33,521,733 | ) |
Capital Share Transactions | | | | | | | | | | | | | | | | | | | | | | | | | | | | | | | | |
Proceeds from shelf offering, net of offering costs | | | 246,323 | | | | 18,758,425 | | | | — | | | | — | | | | — | | | | — | | | | — | | | | — | |
Proceeds from shares issued to shareholders due to reinvestment of distributions | | | 133,418 | | | | 349,290 | | | | — | | | | 41,646 | | | | — | | | | 155,272 | | | | — | | | | 170,209 | |
Net increase (decrease) in net assets from capital share transactions | | | 379,741 | | | | 19,107,715 | | | | — | | | | 41,646 | | | | — | | | | 155,272 | | | | — | | | | 170,209 | |
Net increase (decrease) in net assets | | | (1,994,928 | ) | | | 21,073,858 | | | | (4,326,533 | ) | | | 868,380 | | | | (2,527,584 | ) | | | (1,013,798 | ) | | | (10,921,007 | ) | | | 11,472,885 | |
Net assets at the beginning of period | | | 154,595,280 | | | | 133,521,422 | | | | 275,623,942 | | | | 274,755,562 | | | | 294,772,484 | | | | 295,786,282 | | | | 565,384,506 | | | | 553,911,621 | |
Net assets at the end of period | | $ | 152,600,352 | | | $ | 154,595,280 | | | $ | 271,297,409 | | | $ | 275,623,942 | | | $ | 292,244,900 | | | $ | 294,772,484 | | | $ | 554,463,499 | | | $ | 565,384,506 | |
Undistributed (Over-distribution of) net investment income at the end of period | | $ | 702,154 | | | $ | 791,505 | | | $ | 3,356,170 | | | $ | 3,546,699 | | | $ | 2,237,046 | | | $ | 2,687,920 | | | $ | 5,664,044 | | | $ | 4,680,937 | |
See accompanying notes to financial statements.
53
Statement of Cash Flows
Six Months Ended June 30, 2018
(Unaudited)
| | | | | | | | | | | | |
| | | JHY | | | JHD | | | JHB | |
Cash Flows from Operating Activities: | | | | | | | | | | | | |
Net Increase (Decrease) In Net Assets from Operations | | $ | 1,818,007 | | | $ | 1,911,749 | | | $ | 5,058,284 | |
Adjustments to reconcile the net increase (decrease) in net assets from operations to net cash provided by (used in) operating activities: | | | | | | | | | | | | |
Purchases of investments | | | (70,388,297 | ) | | | (50,633,802 | ) | | | (147,640,005 | ) |
Proceeds from sales and maturities of investments | | | 44,129,632 | | | | 88,019,630 | | | | 127,294,884 | |
Proceeds from (Purchases of) short-term investments, net | | | 4,675,164 | | | | 4,713,451 | | | | — | |
Taxes paid | | | (24,328 | ) | | | (125,200 | ) | | | (120,554 | ) |
Amortization (Accretion) of premiums and discounts, net | | | 609,178 | | | | 907,368 | | | | 1,436,391 | |
(Increase) Decrease in: | | | | | | | | | | | | |
Receivable for interest | | | (68,257 | ) | | | 489,513 | | | | 144,606 | |
Receivable for investments sold | | | 1,910,084 | | | | (2,477,327 | ) | | | 8,788,598 | |
Receivable for reclaims | | | — | | | | — | | | | (20,245 | ) |
Other assets | | | (17,286 | ) | | | (4,354 | ) | | | 37,047 | |
Increase (Decrease) in: | | | | | | | | | | | | |
Payable for investments purchased | | | 746,020 | | | | 2,446,892 | | | | 5,387,162 | |
Accured interest on borrowings | | | 9,423 | | | | (24,201 | ) | | | 105,417 | |
Accrued management fees | | | 5,037 | | | | (34,672 | ) | | | (18,115 | ) |
Accrued Trustees fees | | | (259 | ) | | | 1,138 | | | | 2,936 | |
Accrued other expenses | | | (8,358 | ) | | | (5,967 | ) | | | 1,557 | |
Net realized (gain) loss from investments and foreign currency | | | (237,731 | ) | | | (702,059 | ) | | | (2,326,910 | ) |
Change in net unrealized (appreciation) depreciation of investments and foreign currency | | | 2,523,049 | | | | 4,838,063 | | | | 14,231,024 | |
Net cash provided by (used in) operating activities | | | (14,318,922 | ) | | | 49,320,222 | | | | 12,362,077 | |
Cash Flows from Financing Activities: | | | | | | | | | | | | |
Proceeds from borrowings | | | 17,500,000 | | | | — | | | | — | |
Repayments of borrowings | | | — | | | | (44,000,000 | ) | | | — | |
Cash distribution paid to shareholders | | | (3,427,401 | ) | | | (5,320,222 | ) | | | (13,452,380 | ) |
Proceeds from shelf offering, net of offering costs | | | 246,323 | | | | — | | | | — | |
Net cash provided by (used in) financing activities | | | 14,318,922 | | | | (49,320,222 | ) | | | (13,452,380 | ) |
Net Increase (Decrease) in Cash | | | — | | | | — | | | | (1,090,303 | ) |
Cash at the beginning of period | | | — | | | | — | | | | 6,579,325 | |
Cash at the end of period | | $ | — | | | $ | — | | | $ | 5,489,022 | |
| | | |
| Supplemental Disclosure of Cash Flow Information | | JHY | | | JHD | | | JHB | |
Cash paid for interest on borrowings (excluding borrowing costs) | | $ | 628,435 | | | $ | 558,422 | | | $ | 2,215,790 | |
Non-cash financing activities not included herein consists of reinvestments of share distributions | | | 133,418 | | | | — | | | | — | |
See accompanying notes to financial statements.
54
THIS PAGE INTENTIONALLY LEFT BLANK
55
Financial Highlights
(Unaudited)
Selected data for a share outstanding throughout each period:
| | | | | | | | | | | | | | | | | | | | | | | | | | | | | | | | | | | | | | | | | | | | | | | | |
| | | | | | | | | | | | | | | | | | | | | | |
| | | | | | Investment Operations | | | Less Distributions | | | | | | | | | | | | | |
| | | Beginning
NAV | | | Net
Investment
Income
(Loss)(a) | | | Net
Realized/
Unrealized
Gain (Loss) | | | Total | | | From
Net
Investment
Income | | | From
Accumulated
Net
Realized
Gains | | | Return
of
Capital | | | Total | | | Offering
Costs | | | Premium from Shares
Sold
through Shelf Offering | | | Ending
NAV | | | Ending
Share
Price | |
| |
JHY | | | | | |
Year Ended 12/31: | | | | | | | | | | | | | | | | | | | | | | | | | | | | | | | | | | | | | | | | | |
2018(i) | | $ | 9.89 | | | $ | 0.26 | | | $ | (0.13 | ) | | $ | 0.13 | | | $ | (0.27 | ) | | $ | — | | | $ | — | | | $ | (0.27 | ) | | $ | — | | | $ | — | * | | $ | 9.75 | | | $ | 10.01 | |
2017 | | | 9.75 | | | | 0.62 | | | | 0.13 | | | | 0.75 | | | | (0.62 | ) | | | — | | | | — | | | | (0.62 | ) | | | (0.02 | ) | | | 0.03 | | | | 9.89 | | | | 9.91 | |
2016 | | | 8.73 | | | | 0.73 | | | | 0.97 | | | | 1.70 | | | | (0.68 | ) | | | — | | | | — | | | | (0.68 | ) | | | — | | | | — | | | | 9.75 | | | | 10.21 | |
2015(b) | | | 9.85 | | | | 0.28 | | | | (1.09 | ) | | | (0.81 | ) | | | (0.28 | ) | | | — | | | | (0.01 | ) | | | (0.29 | ) | | | (0.02 | ) | | | — | | | | 8.73 | | | | 9.95 | |
| |
JHD | | | | | |
Year Ended 12/31: | | | | | | | | | | | | | | | | | | | | | | | | | | | | | | | | | | | | | | | | | |
2018(i) | | | 10.18 | | | | 0.22 | | | | (0.15 | ) | | | 0.07 | | | | (0.23 | ) | | | — | | | | — | | | | (0.23 | ) | | | — | | | | — | | | | 10.02 | | | | 9.83 | |
2017 | | | 10.15 | | | | 0.57 | | | | 0.07 | | | | 0.64 | | | | (0.55 | ) | | | (0.06 | ) | | | — | | | | (0.61 | ) | | | — | | | | — | | | | 10.18 | | | | 10.02 | |
2016(c) | | | 9.86 | | | | 0.38 | | | | 0.23 | | | | 0.61 | | | | (0.27 | ) | | | (0.03 | ) | | | — | | | | (0.30 | ) | | | (0.02 | ) | | | — | | | | 10.15 | | | | 10.10 | |
| |
JHA | | | | | |
Year Ended 12/31: | | | | | | | | | | | | | | | | | | | | | | | | | | | | | | | | | | | | | | | | | |
2018(i) | | | 10.05 | | | | 0.17 | | | | (0.08 | ) | | | 0.09 | | | | (0.18 | ) | | | — | | | | — | | | | (0.18 | ) | | | — | | | | — | | | | 9.96 | | | | 9.88 | |
2017 | | | 10.08 | | | | 0.47 | | | | — | * | | | 0.47 | | | | (0.46 | ) | | | (0.04 | ) | | | — | | | | (0.50 | ) | | | — | | | | — | | | | 10.05 | | | | 9.91 | |
2016 | | | 9.63 | | | | 0.60 | | | | 0.46 | | | | 1.06 | | | | (0.55 | ) | | | (0.06 | ) | | | — | | | | (0.61 | ) | | | — | | | | — | | | | 10.08 | | | | 10.06 | |
2015(d) | | | 9.86 | | | | 0.04 | | | | (0.25 | ) | | | (0.21 | ) | | | — | | | | — | | | | — | | | | — | | | | (0.02 | ) | | | — | | | | 9.63 | | | | 10.08 | |
| |
JHB | | | | | |
Year Ended 12/31: | | | | | | | | | | | | | | | | | | | | | | | | | | | | | | | | | | | | | | | | | |
2018(i) | | | 10.12 | | | | 0.30 | | | | (0.21 | ) | | | 0.09 | | | | (0.29 | ) | | | — | | | | — | | | | (0.29 | ) | | | — | | | | — | | | | 9.92 | | | | 9.56 | |
2017 | | | 9.92 | | | | 0.64 | | | | 0.16 | | | | 0.80 | | | | (0.58 | ) | | | (0.02 | ) | | | — | | | | (0.60 | ) | | | — | | | | — | | | | 10.12 | | | | 9.96 | |
2016(e) | | | 9.85 | | | | 0.17 | | | | 0.06 | | | | 0.23 | | | | (0.14 | ) | | | (0.01 | ) | | | — | | | | (0.15 | ) | | | (0.01 | ) | | | — | | | | 9.92 | | | | 9.88 | |
| | | | | | | | |
| | | Borrowings at the End of Period | |
| | | Aggregate
Amount
Outstanding
(000) | | | Asset
Coverage
Per $1,000 | |
|
JHY | |
Year Ended 12/31: | |
2018(i) | | $ | 61,500 | | | $ | 3,481 | |
2017 | | | 44,000 | | | | 4,514 | |
2016 | | | 44,000 | | | | 4,035 | |
2015(b) | | | 44,000 | | | | 3,713 | |
|
JHD | |
Year Ended 12/31: | | | | | | | | |
2018(i) | | | 19,500 | | | | 14,913 | |
2017 | | | 63,500 | | | | 5,341 | |
2016(c) | | | 90,000 | | | | 4,053 | |
|
JHA | |
Year Ended 12/31: | |
2018(i) | | | — | | | | — | |
2017 | | | — | | | | — | |
2016 | | | 92,000 | | | | 4,215 | |
2015(d) | | | 25,000 | | | | 12,286 | |
|
JHB | |
Year Ended 12/31: | |
2018(i) | | | 190,000 | | | | 3.918 | |
2017 | | | 190,000 | | | | 3,976 | |
2016(e) | | | 190,000 | | | | 3,915 | |
56
| | | | | | | | | | | | | | | | | | | | | | |
| | | | | | | Ratios/Supplemental Data | |
| Total Returns | | | | | | Ratios to Average Net Assets(g) | | | | |
Based
on
NAV(f) | | | Based
on
Share
Price(f) | | | Ending
Net
Assets
(000) | | | Expenses | | | Net
Investment
Income (Loss) | | | Portfolio
Turnover
Rate(h) | |
| | | | | |
| | | | | | | | | | | | | | | | | | | | | | | |
| | | | | | | | | | | | | | | | | | | | | | |
| | 1.31 | % | | | 3.79 | % | | $ | 152,600 | | | | 2.05 | %** | | | 5.38 | %** | | | 22 | % |
| | 7.94 | | | | 3.28 | | | | 154,595 | | | | 1.54 | | | | 6.29 | | | | 72 | |
| | 20.15 | | | | 9.94 | | | | 133,521 | | | | 1.50 | | | | 7.91 | | | | 53 | |
| | (8.60 | ) | | | 2.42 | | | | 119,367 | | | | 1.34 | ** | | | 6.97 | ** | | | 11 | |
| | | | | |
| | | | | | | | | | | | | | | | | | | | | | | |
| | | | | | | | | | | | | | | | | | | | | | |
| | 0.70 | | | | 0.42 | | | | 271,297 | | | | 1.25 | ** | | | 4.47 | ** | | | 17 | |
| | 6.42 | | | | 5.32 | | | | 275,624 | | | | 1.50 | | | | 5.57 | | | | 43 | |
| | 6.07 | | | | 4.06 | | | | 274,756 | | | | 1.31 | ** | | | 5.87 | ** | | | 15 | |
| | | | | |
| | | | | | | | | | | | | | | | | | | | | | | |
| | | | | | | | | | | | | | | | | | | | | | |
| | 0.92 | | | | 1.55 | | | | 292,245 | | | | 0.73 | ** | | | 3.36 | ** | | | 53 | |
| | 4.77 | | | | 3.54 | | | | 294,772 | | | | 1.25 | | | | 4.65 | | | | 29 | |
| | 11.25 | | | | 6.07 | | | | 295,786 | | | | 1.33 | | | | 6.05 | | | | 34 | |
| | (2.33 | ) | | | 0.80 | | | | 282,159 | | | | 0.89 | ** | | | 3.15 | ** | | | 0 | |
| | | | | |
| | | | | | | | | | | | | | | | | | | | | | | |
| | | | | | | | | | | | | | | | | | | | | | |
| | 0.86 | | | | (1.13 | ) | | | 554,463 | | | | 1.80 | ** | | | 6.11 | ** | | | 18 | |
| | 8.22 | | | | 6.98 | | | | 565,385 | | | | 1.57 | | | | 6.37 | | | | 37 | |
| | 2.26 | | | | 0.32 | | | | 553,912 | | | | 1.17 | ** | | | 4.79 | ** | | | 6 | |
| (a) | Per share Net Investment Income (Loss) is calculated using the average daily shares method. |
| (b) | For the period July 28, 2015 (commencement of operations) through December 31, 2015. |
| (c) | For the period May 10, 2016 (commencement of operations) through December 31, 2016. |
| (d) | For the period November 12, 2015 (commencement of operations) through December 31, 2015. |
| (e) | For the period August 23, 2016 (commencement of operations) through December 31, 2016. |
| (f) | Total Return Based on NAV is the combination of changes in NAV, reinvested dividend income at NAV and reinvested capital gains distributions at NAV, if any. The last dividend declared in the period, which is typically paid on the first business day of the following month, is assumed to be reinvested at the ending NAV. The actual reinvest price for the last dividend declared in the period may often be based on the Fund’s market price (and not its NAV), and therefore may be different from the price used in the calculation. Total returns are not annualized. |
Total Return Based on Share Price is the combination of changes in the market price per share and the effect of reinvested dividend income and reinvested capital gains distributions, if any, at the average price paid per share at the time of reinvestment. The last dividend declared in the period, which is typically paid on the first business day of the following month, is assumed to be reinvested at the ending market price. The actual reinvestment for the last dividend declared in the period may take place over several days, and in some instances may not be based on the market price, so the actual reinvestment price may be different from the price used in the calculation. Total returns are not annualized.
| (g) • | Net Investment Income (Loss) ratios reflect income earned and expenses incurred on assets attributable to borrowings, where applicable, (as described in Note 8 – Borrowing Arrangements). |
| | • | Each ratio includes the effect of all interest expense paid and other costs related to borrowings, where applicable, as follows: |
| | | | | | | | |
| | | Ratios of Borrowings
Interest Expense
to Average Net Assets | |
JHY | |
Year Ended 12/31: | |
2018(i) | | | | | | | 0.84 | %** |
2017 | | | | 0.53 | |
2016 | | | | 0.43 | |
2015(b) | | | | 0.27 | ** |
| | | | | | | | |
| | | Ratios of Borrowings
Interest Expense
to Average Net Assets | |
JHD | |
Year Ended 12/31: | |
2018(i) | | | | | | | 0.40 | %** |
2017 | | | | 0.55 | |
2016(c) | | | | 0.36 | ** |
| | | | | | | | |
| | | Ratios of Borrowings
Interest Expense
to Average Net Assets | |
JHA | |
Year Ended 12/31: | |
2018(i) | | | | | | | — | % |
2017 | | | | 0.36 | |
2016 | | | | 0.38 | |
2015(d) | | | | 0.03 | ** |
| | | | | | | | |
| | | Ratios of Borrowings
Interest Expense
to Average Net Assets | |
JHB | |
Year Ended 12/31: | |
2018(i) | | | | | | | 0.85 | %** |
2017 | | | | 0.62 | |
2016(e) | | | | 0.25 | ** |
| (h) | Portfolio Turnover Rate is calculated based on the lesser of long-term purchases or sales (as disclosed in Note 5 – Investment Transactions) divided by the average long-term market value during the period. |
| (i) | For the six months ended June 30, 2018. |
| * | Rounds to less than $0.01 per share. |
See accompanying notes to financial statements.
57
Notes to Financial Statements
(Unaudited)
1. General Information and Significant Accounting Policies
General Information
Fund Information
The funds covered in this report and their corresponding New York Stock Exchange (“NYSE”) symbols are as follows (each a “Fund” and collectively, the “Funds”):
| | • | | Nuveen High Income 2020 Target Term Fund (JHY) |
| | • | | Nuveen High Income December 2019 Target Term Fund (JHD) |
| | • | | Nuveen High Income December 2018 Target Term Fund (JHA) |
| | • | | Nuveen High Income November 2021 Target Term Fund (JHB) |
The Funds are registered under the Investment Company Act of 1940, as amended, as diversified, closed-end management investment companies. JHY, JHD, JHA and JHB were each organized as a Massachusetts business trust on April 13, 2015, February 10, 2016, July 13, 2015 and July 13, 2015, respectively.
The end of the reporting period for the Funds is June 30, 2018, and the period covered by these Notes to Financial Statements is the six months ended June 30, 2018 (“the current fiscal period”).
Investment Adviser
The Funds’ investment adviser is Nuveen Fund Advisors, LLC (the “Adviser”), a subsidiary of Nuveen, LLC (“Nuveen”). Nuveen is the investment management arm of Teachers Insurance and Annuity Association of America (TIAA). The Adviser has overall responsibility for management of the Funds, oversees the management of the Funds’ portfolios, manages the Funds’ business affairs and provides certain clerical, bookkeeping and other administrative services, and, if necessary, asset allocation decisions. The Adviser has entered into sub-advisory agreements with Nuveen Asset Management, LLC, (the “Sub-Adviser”), a subsidiary of the Adviser, under which the Sub-Adviser manages the investment portfolios of the Funds.
Investment Objectives and Principal Investment Strategies
JHY seeks to provide a high level of current income and return the original $9.85 net asset value (“NAV”) per share on or about November 1, 2020 (the “Termination Date”). JHD seeks to provide a high level of current income and return the original $9.86 NAV per share on or about December 1, 2019 (the “Termination Date”). JHA seeks to provide a high level of current income and return the original $9.86 NAV per share on or about December 1, 2018 (the “Termination Date”). JHB seeks to provide a high level of current income and return the original $9.85 NAV per share on or about November 1, 2021. Under normal market conditions:
| | • | | The Funds invest at least 80% of their managed assets (as defined in Note 7 – Management Fees and Other Transactions with Affiliates) in corporate debt securities. |
| | • | | The Funds will invest at least 80% of their managed assets in securities that, at the time of investment, are rated below investment grade (those rated BB/Ba or lower) or that are unrated but judged by the Sub-Adviser to be of comparable quality. These securities generally provide high income in an effort to compensate investors for their higher risk of default, which is the failure to make required interest or principal payments. |
| | • | | The Funds will invest no more than 15% of the Funds’ managed asset in securities that, at the time of investment, are rated CCC+/Caa1 or lower, or are unrated but judged by the Sub-Adviser to be of comparable quality. |
| | • | | The Funds may invest up to 30% of their managed assets in securities of non-U.S. issuers, including up to 20% in emerging market issuers. |
| | • | | The Funds may invest up to 10% of their managed assets in non-U.S. dollar denominated securities. |
Each Fund also may invest in certain derivative instruments in pursuit of their investment objectives. Such instruments include financial futures contracts and options thereon, swaps (including interest rate and currency swaps), options on swaps and other derivative instruments. The Sub-Adviser may use derivative instruments to attempt to hedge some of the risk of each Fund’s investments or as a substitute for a position in the underlying asset.
During the current reporting period, JHA entered the wind-up period in anticipation of its Termination Date. The Fund is a “target term” Fund that will cease its investment operations and liquidate its portfolio on December 1, 2018 and distribute the net proceeds to shareholders, unless the term is
58
extended for a period of up to six months by a vote of the Funds’ Board of Trustees (the “Board”). Consequently, for the remainder of its term, the Fund may deviate from its investment objectives and policies, and may invest up to 100% of its managed assets in high quality, short-term securities. High quality, short-term securities for this Fund include securities rated investment grade (BBB-/Baa3 or higher or unrated but judged by the Sub-Adviser to be of comparable quality) with a final or remaining maturity of 397 days or less. Consequently, for the remainder of its term, the Fund may invest at least 80% of its managed assets in below investment grade securities as well as short-term investment grade securities that have a final or remaining maturity of 397 days or less, as long as the maturity does not occur later than June 1, 2019.
Significant Accounting Policies
Each Fund is an investment company and follows accounting and reporting guidance under Financial Accounting Standards Board (“FASB”) Accounting Standards Codification (ASC) Topic 946 “Financial Services – Investment Companies.” The following is a summary of significant accounting policies followed by the Funds in the preparation of their financial statements in accordance with U.S. generally accepted accounting principles (“U.S. GAAP”).
Investment Transactions
Investment transactions are recorded on a trade date basis. Realized gains and losses from investment transactions are determined on the specific identification method, which is the same basis used for federal income tax purposes. Investments purchased on a when-issued/delayed delivery basis may have extended settlement periods. Any investments so purchased are subject to market fluctuation during this period. The Funds have earmarked securities in their portfolios with a current value at least equal to the amount of the when-issued/delayed delivery purchase commitments.
As of the end of the reporting period, the Funds did not have any when-issued/delayed delivery purchase commitments.
Investment Income
Investment income is comprised of interest income, which reflects the amortization of premiums and includes accretion of discounts for financial reporting purposes, and is recorded on an accrual basis. Interest income also reflects payment-in-kind (“PIK”) interest and paydown gains and losses, if any. PIK Interest represents income received in the form of securities in lieu of cash.
Professional Fees
Professional fees presented on the Statement of Operations consist of legal fees incurred in the normal course of operations, audit fees, tax consulting fees and, in some cases, workout expenditures. Workout expenditures are incurred in an attempt to protect or enhance an investment or to pursue other claims or legal actions on behalf of Fund shareholders. If a refund is received for workout expenditures paid in a prior reporting period, such amounts will be recognized as “Legal fee refund” on the Statement of Operations.
Dividends and Distributions to Shareholders
Dividends to shareholders, if any, are declared monthly. Net realized capital gains from investment transactions, if any, are declared and distributed to shareholders at least annually. However, in seeking to achieve its investment objectives, each Fund currently intends to set aside and retain in its net assets (and therefore its NAV) a portion of its net investment income, and possibly all or a portion of its gains. This will reduce the amounts otherwise available for distribution prior to the liquidation of the Funds, and the Funds may incur taxes on such retained amount. Such retained income or gains, net of any taxes, would constitute a portion of the liquidating distribution returned to investors on or about the Termination Date. Furthermore, capital gains are distributed only to the extent they exceed available capital loss carryforwards.
Distributions to shareholders are recorded on the ex-dividend date. The amount and timing of distributions are determined in accordance with federal income tax regulations, which may differ from U.S. GAAP.
Compensation
The Funds pay no compensation directly to those of its trustees who are affiliated with the Adviser or to its officers, all of whom receive remuneration for their services to the Funds from the Adviser or its affiliates. The Board has adopted a deferred compensation plan for independent trustees that enables trustees to elect to defer receipt of all or a portion of the annual compensation they are entitled to receive from certain Nuveen-advised funds. Under the plan, deferred amounts are treated as though equal dollar amounts had been invested in shares of select Nuveen-advised funds.
Indemnifications
Under the Funds’ organizational documents, their officers and trustees are indemnified against certain liabilities arising out of the performance of their duties to the Funds. In addition, in the normal course of business, the Funds enter into contracts that provide general indemnifications to other parties.
59
Notes to Financial Statements (continued)
(Unaudited)
The Funds’ maximum exposure under these arrangements is unknown as this would involve future claims that may be made against the Funds that have not yet occurred. However, the Funds have not had prior claims or losses pursuant to these contracts and expect the risk of loss to be remote.
Netting Agreements
In the ordinary course of business, the Funds may enter into transactions subject to enforceable master repurchase agreements, International Swaps and Derivative Association, Inc. (ISDA) master agreements or other similar arrangements (“netting agreements”). Generally, the right to offset in netting agreements allows each Fund to offset certain securities and derivatives with a specific counterparty, when applicable, as well as any collateral received or delivered to that counterparty based on the terms of the agreements. Generally, each Fund manages its cash collateral and securities collateral on a counterparty basis.
The Funds’ investments subject to netting agreements as of the end of the reporting period, if any, are further described in Note 3 – Portfolio Securities and Investments in Derivatives.
Use of Estimates
The preparation of financial statements in conformity with U.S. GAAP requires management to make estimates and assumptions that affect the reported amounts of assets and liabilities at the date of the financial statements and the reported amounts of increases and decreases in net assets from operations during the current fiscal period. Actual results may differ from those estimates.
2. Investment Valuation and Fair Value Measurements
The fair valuation input levels as described below are for fair value measurement purposes.
Fair value is defined as the price that would be received upon selling an investment or transferring a liability in an orderly transaction to an independent buyer in the principal or most advantageous market for the investment. A three-tier hierarchy is used to maximize the use of observable market data and minimize the use of unobservable inputs and to establish classification of fair value measurements for disclosure purposes. Observable inputs reflect the assumptions market participants would use in pricing the asset or liability. Observable inputs are based on market data obtained from sources independent of the reporting entity. Unobservable inputs reflect the reporting entity’s own assumptions about the assumptions market participants would use in pricing the asset or liability. Unobservable inputs are based on the best information available in the circumstances. The following is a summary of the three-tiered hierarchy of valuation input levels.
| | |
| Level 1 – | | Inputs are unadjusted and prices are determined using quoted prices in active markets for identical securities. |
| Level 2 – | | Prices are determined using other significant observable inputs (including quoted prices for similar securities, interest rates, prepayment speeds, credit risk, etc.). |
| Level 3 – | | Prices are determined using significant unobservable inputs (including management’s assumptions in determining the fair value of investments). |
Prices of fixed-income securities are provided by an independent pricing service (“pricing service”) approved by the Board. The pricing service establishes a security’s fair value using methods that may include consideration of the following: yields or prices of investments of comparable quality, type of issue, coupon, maturity and rating, market quotes or indications of value from security dealers, evaluations of anticipated cash flows or collateral, general market conditions and other information and analysis, including the obligor’s credit characteristics considered relevant. These securities are generally classified as Level 2. In pricing certain securities, particularly less liquid and lower quality securities, the pricing service may consider information about a security, its issuer or market activity, provided by the Adviser. These securities are generally classified as Level 2 or Level 3 depending on the observability of the significant inputs.
Repurchase agreements are valued at contract amount plus accrued interest, which approximates market value. These securities are generally classified as Level 2.
Investments initially valued in currencies other than the U.S. dollar are converted to the U.S. dollar using exchange rates obtained from pricing services. As a result, the NAV of the Funds’ shares may be affected by changes in the value of currencies in relation to the U.S. dollar. The value of securities traded in markets outside the United States or denominated in currencies other than the U.S. dollar may be affected significantly on a day that the NYSE is closed and an investor is not able to purchase, redeem or exchange shares. If significant market events occur between the time of determination of the closing price of a foreign security on an exchange and the time that the Funds’ NAV is determined, or if under the Funds’ procedures, the closing price of a foreign security is not deemed to be reliable, the security would be valued at fair value as determined in accordance with procedures established in good faith by the Board. These securities are generally classified as Level 2 or Level 3 depending on the observability of the significant inputs.
Certain securities may not be able to be priced by the pre-established pricing methods as described above. Such securities may be valued by the Board and/or its appointee at fair value. These securities generally include, but are not limited to, restricted securities (securities which may not be publicly sold
60
without registration under the Securities Act of 1933, as amended) for which a pricing service is unable to provide a market price; securities whose trading has been formally suspended; debt securities that have gone into default and for which there is no current market quotation; a security whose market price is not available from a pre-established pricing source; a security with respect to which an event has occurred that is likely to materially affect the value of the security after the market has closed but before the calculation of a Fund’s NAV (as may be the case in non-U.S. markets on which the security is primarily traded) or make it difficult or impossible to obtain a reliable market quotation; and a security whose price, as provided by the pricing service, is not deemed to reflect the security’s fair value. As a general principle, the fair value of a security would appear to be the amount that the owner might reasonably expect to receive for it in a current sale. A variety of factors may be considered in determining the fair value of such securities, which may include consideration of the following: yields or prices of investments of comparable quality, type of issue, coupon, maturity and rating, market quotes or indications of value from security dealers, evaluations of anticipated cash flows or collateral, general market conditions and other information and analysis, including the obligor’s credit characteristics considered relevant. These securities are generally classified as Level 2 or Level 3 depending on the observability of the significant inputs. Regardless of the method employed to value a particular security, all valuations are subject to review by the Board and/or its appointee.
The inputs or methodologies used for valuing securities are not an indication of the risks associated with investing in those securities. The following is a summary of each Fund’s fair value measurements as of the end of the reporting period:
| | | | | | | | | | | | | | | | |
| JHY | | Level 1 | | | Level 2 | | | Level 3 | | | Total | |
Long-Term Investments*: | | | | | | | | | | | | | | | | |
Corporate Bonds | | $ | — | | | $ | 199,189,368 | | | $ | — | | | $ | 199,189,368 | |
Convertible Bonds | | | — | | | | 5,501,885 | | | | — | | | | 5,501,885 | |
Sovereign Debt | | | — | | | | 4,530,440 | | | | — | | | | 4,530,440 | |
| | | | |
Short-Term Investments: | | | | | | | | | | | | | | | | |
Repurchase Agreements | | | — | | | | 899,774 | | | | — | | | | 899,774 | |
Total | | $ | — | | | $ | 210,121,467 | | | $ | — | | | $ | 210,121,467 | |
| JHD | | | | | | | | | | | | |
Long-Term Investments*: | | | | | | | | | | | | | | | | |
Corporate Bonds | | $ | — | | | $ | 261,755,787 | | | $ | — | | | $ | 261,755,787 | |
Convertible Bonds | | | — | | | | 10,517,026 | | | | — | | | | 10,517,026 | |
Sovereign Debt | | | — | | | | 8,043,709 | | | | — | | | | 8,043,709 | |
| | | | |
Short-Term Investments: | | | | | | | | | | | | | | | | |
Repurchase Agreements | | | — | | | | 379,550 | | | | — | | | | 379,550 | |
Total | | $ | — | | | $ | 280,696,072 | | | $ | — | | | $ | 280,696,072 | |
| JHA | | | | | | | | | | | | |
Long-Term Investments*: | | | | | | | | | | | | | | | | |
Corporate Bonds | | $ | — | | | $ | 256,192,760 | | | $ | — | | | $ | 256,192,760 | |
Convertible Bonds | | | — | | | | 18,906,311 | | | | — | | | | 18,906,311 | |
Sovereign Debt | | | — | | | | 7,096,427 | | | | — | | | | 7,096,427 | |
| | | | |
Short-Term Investments: | | | | | | | | | | | | | | | | |
Repurchase Agreements | | | — | | | | 1,631,229 | | | | — | | | | 1,631,229 | |
Total | | $ | — | | | $ | 283,826,727 | | | $ | — | | | $ | 283,826,727 | |
| JHB | | | | | | | | | | | | |
Long-Term Investments*: | | | | | | | | | | | | | | | | |
Corporate Bonds | | $ | — | | | $ | 718,271,886 | | | $ | — | | | $ | 718,271,886 | |
Sovereign Debt | | | — | | | | 8,976,656 | | | | — | | | | 8,976,656 | |
Convertible Bonds | | | — | | | | 3,968,536 | | | | — | | | | 3,968,536 | |
Total | | $ | — | | | $ | 731,217,078 | | | $ | — | | | $ | 731,217,078 | |
| * | Refer to the Fund’s Portfolio of Investments for industry and country classifications, where applicable. |
The Board is responsible for the valuation process and has appointed the oversight of the daily valuation process to the Adviser’s Valuation Committee. The Valuation Committee, pursuant to the valuation policies and procedures adopted by the Board, is responsible for making fair value determinations, evaluating the effectiveness of the Funds’ pricing policies and reporting to the Board. The Valuation Committee is aided in its efforts by the Adviser’s dedicated Securities Valuation Team, which is responsible for administering the daily valuation process and applying fair value methodologies as approved by the Valuation Committee. When determining the reliability of independent pricing services for investments owned by the Funds, the Valuation Committee, among other things, conducts due diligence reviews of the pricing services and monitors the quality of security prices received through various testing reports conducted by the Securities Valuation Team.
61
Notes to Financial Statements (continued)
(Unaudited)
The Valuation Committee will consider pricing methodologies it deems relevant and appropriate when making a fair value determination, based on the facts and circumstances specific to the portfolio instrument. Fair value determinations generally will be derived as follows, using public or private market information:
| | (i) | If available, fair value determinations shall be derived by extrapolating from recent transactions or quoted prices for identical or comparable securities. |
| | (ii) | If such information is not available, an analytical valuation methodology may be used based on other available information including, but not limited to: analyst appraisals, research reports, corporate action information, issuer financial statements and shelf registration statements. Such analytical valuation methodologies may include, but are not limited to: multiple of earnings, discount from market value of a similar freely-traded security, discounted cash flow analysis, book value or a multiple thereof, risk premium/yield analysis, yield to maturity and/or fundamental investment analysis. |
The purchase price of a portfolio instrument will be used to fair value the instrument only if no other valuation methodology is available or deemed appropriate, and it is determined that the purchase price fairly reflects the instrument’s current value.
For each portfolio security that has been fair valued pursuant to the policies adopted by the Board, the fair value price is compared against the last available and next available market quotations. The Valuation Committee reviews the results of such testing and fair valuation occurrences are reported to the Board.
3. Portfolio Securities and Investments in Derivatives
Portfolio Securities
Foreign Currency Transactions
To the extent that the Funds may invest in securities and/or contracts that are denominated in a currency other than U.S. dollars, the Funds will be subject to currency risk, which is the risk that an increase in the U.S. dollar relative to the foreign currency will reduce returns or portfolio value. Generally, when the U.S. dollar rises in value against a foreign currency, the Funds’ investments denominated in that currency will lose value because their currency is worth fewer U.S. dollars; the opposite effect occurs if the U.S. dollar falls in relative value. Investments and other assets and liabilities denominated in foreign currencies are converted into U.S. dollars on a spot (i.e. cash) basis at the spot rate prevailing in the foreign currency exchange market at the time of valuation. Purchases and sales of investments and income denominated in foreign currencies are translated into U.S. dollars on the respective dates of such transactions.
As of the end of the reporting period, the Funds’ investments in non-U.S. securities were as follows:
| | | | | | | | |
| JHY | | Value | | | % of Total
Investments | |
Country: | | | | | | | | |
Canada | | $ | 8,978,770 | | | | 4.3 | % |
Japan | | | 4,037,350 | | | | 1.9 | |
Bermuda | | | 4,017,550 | | | | 1.9 | |
Netherlands | | | 3,097,125 | | | | 1.5 | |
Brazil | | | 3,080,629 | | | | 1.5 | |
Hong Kong | | | 3,017,810 | | | | 1.4 | |
Luxembourg | | | 2,927,610 | | | | 1.4 | |
Argentina | | | 2,621,063 | | | | 1.2 | |
Zambia | | | 2,525,000 | | | | 1.2 | |
Other | | | 14,194,868 | | | | 6.8 | |
Total non-U.S. securities | | $ | 48,497,775 | | | | 23.1 | % |
| JHD | | | | | | |
Country: | | | | | | | | |
Canada | | $ | 13,068,123 | | | | 4.7 | % |
Japan | | | 9,679,000 | | | | 3.5 | |
United Kingdom | | | 8,910,560 | | | | 3.2 | |
Luxembourg | | | 7,054,791 | | | | 2.5 | |
Italy | | | 6,290,624 | | | | 2.2 | |
Israel | | | 6,081,573 | | | | 2.2 | |
Spain | | | 5,551,740 | | | | 2.0 | |
Hong Kong | | | 5,158,679 | | | | 1.8 | |
Australia | | | 4,277,350 | | | | 1.5 | |
Other | | | 19,327,379 | | | | 6.8 | |
Total non-U.S. securities | | $ | 85,399,819 | | | | 30.4 | % |
62
| | | | | | | | |
| JHA | | Value | | | % of Total
Investments | |
Country: | | | | | | | | |
Japan | | $ | 13,993,519 | | | | 4.9 | % |
Germany | | | 8,555,001 | | | | 3.0 | |
United Kingdom | | | 7,918,178 | | | | 2.8 | |
Ireland | | | 7,274,886 | | | | 2.6 | |
India | | | 6,818,512 | | | | 2.4 | |
Luxembourg | | | 5,338,848 | | | | 1.9 | |
Switzerland | | | 4,176,741 | | | | 1.5 | |
Mexico | | | 3,107,656 | | | | 1.1 | |
South Africa | | | 3,081,000 | | | | 1.1 | |
Other | | | 14,935,710 | | | | 5.2 | |
Total non-U.S. securities | | $ | 75,200,051 | | | | 26.5 | % |
| JHB | | | | | | |
Country: | | | | | | | | |
Canada | | $ | 32,150,733 | | | | 4.4 | % |
Luxembourg | | | 21,324,431 | | | | 2.9 | |
United Kingdom | | | 19,627,519 | | | | 2.7 | |
Japan | | | 15,253,899 | | | | 2.1 | |
China | | | 10,645,301 | | | | 1.5 | |
Brazil | | | 10,112,602 | | | | 1.4 | |
Italy | | | 9,318,814 | | | | 1.3 | |
Israel | | | 6,963,655 | | | | 0.9 | |
Bermuda | | | 6,952,600 | | | | 0.9 | |
Other | | | 59,567,464 | | | | 8.1 | |
Total non-U.S. securities | | $ | 191,917,018 | | | | 26.2 | % |
The books and records of the Funds are maintained in U.S. dollars. Foreign currencies, assets and liabilities are translated into U.S. dollars at 4:00 p.m. Eastern Time. Investment transactions, income and expenses are translated on the respective dates of such transactions. Net realized foreign currency gains and losses resulting from changes in exchange rates include foreign currency gains and losses between trade date and settlement date of the transactions, foreign currency transactions and the difference between the amounts of interest and dividends recorded on the books of a Fund and the amounts actually received.
The realized gains and losses resulting from changes in foreign currency exchange rates and changes in foreign exchange rates associated with (i) foreign currency, (ii) investments, (iii) investments in derivatives and (iv) other assets and liabilities are recognized as a component of “Net realized gain (loss) from investments and foreign currency” on the Statement of Operations, when applicable.
The unrealized gains and losses resulting from changes in foreign currency exchange rates and changes in foreign exchange rates associated with (i) investments and (ii) other assets and liabilities are recognized as a component of “Change in net unrealized appreciation (depreciation) of investments and foreign currency” on the Statement of Operations, when applicable. The unrealized gains and losses resulting from changes in foreign exchange rates associated with investments in derivatives are recognized as a component of the respective derivative’s related “Change in net unrealized appreciation (depreciation)” on the Statement of Operations, when applicable.
Repurchase Agreements
In connection with transactions in repurchase agreements, it is each Fund’s policy that its custodian take possession of the underlying collateral securities, the fair value of which exceeds the principal amount of the repurchase transaction, including accrued interest, at all times. If the counterparty defaults, and the fair value of the collateral declines, realization of the collateral may be delayed or limited.
The following table presents the repurchase agreements for the Funds that are subject to netting agreements as of the end of the reporting period, and the collateral delivered related to those repurchase agreements.
| | | | | | | | | | | | | | |
| Fund | | Counterparty | | Short-Term
Investments, at Value | | | Collateral
Pledged (From)
Counterparty* | | | Net
Exposure | |
JHY | | Fixed Income Clearing Corporation | | $ | 899,774 | | | $ | (899,774 | ) | | $ | — | |
JHD | | Fixed Income Clearing Corporation | | | 379,550 | | | | (379,550 | ) | | | — | |
| JHA | | Fixed Income Clearing Corporation | | | 1,631,229 | | | | (1,631,229 | ) | | | — | |
| * | As of the end of the reporting period, the value of the collateral pledged from the counterparty exceeded the value of the repurchase agreements. Refer to the Fund’s Portfolio of Investments for details on the repurchase agreements. |
63
Notes to Financial Statements (continued)
(Unaudited)
Zero Coupon Securities
A zero coupon security does not pay a regular interest coupon to its holders during the life of the security. Income to the holder of the security comes from accretion of the difference between the original purchase price of the security at issuance and the par value of the security at maturity and is effectively paid at maturity. The market prices of zero coupon securities generally are more volatile than the market prices of securities that pay interest periodically.
Investments in Derivatives
Each Fund is authorized to invest in certain derivative instruments such as futures, options and swap contracts. Each Fund limits its investments in futures, options on futures and swap contracts to the extent necessary for the Adviser to claim the exclusion from registration by the Commodity Futures Trading Commission as a commodity pool operator with respect to the Fund. The Funds record derivative instruments at fair value, with changes in fair value recognized on the Statement of Operations, when applicable. Even though the Funds’ investments in derivatives may represent economic hedges, they are not considered to be hedge transactions for financial reporting purposes.
Although the Funds are authorized to invest in derivative instruments, and may do so in the future, they did not make any such investments during the current fiscal period.
Market and Counterparty Credit Risk
In the normal course of business each Fund may invest in financial instruments and enter into financial transactions where risk of potential loss exists due to changes in the market (market risk) or failure of the other party to the transaction to perform (counterparty credit risk). The potential loss could exceed the value of the financial assets recorded on the financial statements. Financial assets, which potentially expose each Fund to counterparty credit risk, consist principally of cash due from counterparties on forward, option and swap transactions, when applicable. The extent of each Fund’s exposure to counterparty credit risk in respect to these financial assets approximates their carrying value as recorded on the Statement of Assets and Liabilities.
Each Fund helps manage counterparty credit risk by entering into agreements only with counterparties the Adviser believes have the financial resources to honor their obligations and by having the Adviser monitor the financial stability of the counterparties. Additionally, counterparties may be required to pledge collateral daily (based on the daily valuation of the financial asset) on behalf of each Fund with a value approximately equal to the amount of any unrealized gain above a pre-determined threshold. Reciprocally, when each Fund has an unrealized loss, the Funds have instructed the custodian to pledge assets of the Funds as collateral with a value approximately equal to the amount of the unrealized loss above a pre-determined threshold. Collateral pledges are monitored and subsequently adjusted if and when the valuations fluctuate, either up or down, by at least the pre-determined threshold amount.
4. Fund Shares
Equity Shelf Programs and Offering Costs
JHY has filed a registration statement with the Securities and Exchange Commission (“SEC”) authorizing the Fund to issue additional shares through one or more equity shelf programs (“Shelf Offering”), which became effective with the SEC during the prior fiscal period.
Under this Shelf Offering, the Fund, subject to market conditions, may raise additional equity capital by issuing additional shares from time to time in varying amounts and by different offering methods at a net price at or above the Fund’s NAV per share. In the event the Fund’s Shelf Offering registration statement is no longer current, the Fund may not issue additional shares until a post-effective amendment to the registration statement has been filed with the SEC.
Additional authorized shares, shares sold and offering proceeds, net of offering costs under the Fund’s Shelf Offering during the Fund’s current and prior fiscal period were as follows:
| | | | | | | | |
| | | JHY | |
| | | Six Months
Ended
6/30/18 | | | Year
Ended
12/31/17* | |
Additional authorized shares | | | 3,400,000 | | | | 3,400,000 | |
Shares sold | | | 15,181 | | | | 1,896,443 | |
Offering proceeds, net of offering costs | | $ | 246,323 | | | $ | 18,758,425 | |
| * | Represents additional authorized shares for the period February 2, 2017 (effective date) through December 31, 2017. |
Costs incurred by the Fund in connection with its initial shelf registrations are recorded as a prepaid expense and recognized as a component of
“Deferred offering costs” on the Statement of Assets and Liabilities. These costs are amortized pro rata as shares are sold and are recognized as a
64
component of “Proceeds from shelf offering, net of offering costs” on the Statement of Changes in Net Assets. Any deferred offering costs remaining one year after the effectiveness of the initial shelf registration will be expensed. Costs incurred by the Fund to keep the shelf registration current are expensed as incurred and recognized as a component of “Other expenses” on the Statement of Operations.
Share Transactions
Transactions in shares during the Funds’ current and prior fiscal period were as follows:
| | | | | | | | | | | | | | | | |
| | | JHY* | | | JHD** | |
| | | Six Months
Ended
6/30/18 | | | Year
Ended
12/31/17 | | | Six Months
Ended
6/30/18 | | | Year Ended 12/31/17 | |
Shares: | | | | | | | | | | | | | | | | |
Sold through shelf offering | | | 15,181 | | | | 1,896,443 | | | | — | | | | — | |
Issued to shareholders due to reinvestment of distributions | | | 13,560 | | | | 35,208 | | | | — | | | | 4,047 | |
Total | | | 28,741 | | | | 1,931,651 | | | | — | | | | 4,047 | |
Weighted average share: | | | | | | | | | | | | | | | | |
Premium to NAV per shelf offering share sold | | | 1.20 | % | | | 2.19 | % | | | — | % | | | — | % |
| | |
| | | JHA** | | | JHB* | |
| | | Six Months
Ended
6/30/18 | | | Year
Ended
12/31/17 | | | Six Months
Ended
6/30/18 | | | Year Ended 12/31/17 | |
Shares: | | | | | | | | | | | | | | | | |
Issued to shareholders due to reinvestment of distributions | | | — | | | | 15,318 | | | | — | | | | 17,009 | |
Total | | | — | | | | 15,318 | | | | — | | | | 17,009 | |
| * | Prior to the commencement of operations, the Adviser purchased 10,180 shares, which are still held as of the end of the reporting period. |
| ** | Prior to the commencement of operations, the Adviser purchased 10,200 shares, which are still held as of the end of the reporting period. |
5. Investment Transactions
Long-term purchases and sales (including maturities) during the current fiscal period were as follows:
| | | | | | | | | | | | | | | | |
| | | JHY | | | JHD | | | JHA | | | JHB | |
Purchases | | $ | 70,388,297 | | | $ | 50,633,802 | | | $ | 152,110,857 | | | $ | 147,640,005 | |
Sales and maturities | | | 44,129,632 | | | | 88,019,630 | | | | 144,140,341 | | | | 127,294,884 | |
6. Income Tax Information
Each Fund is a separate taxpayer for federal income tax purposes. Each Fund intends to distribute substantially all of its net investment company taxable income to shareholders and to otherwise comply with the requirements of Subchapter M of the Internal Revenue Code applicable to regulated investment companies. In any year when the Funds realize net capital gains, the Funds may choose to distribute all or a portion of their net capital gains to shareholders, or alternatively, to retain all or a portion of their net capital gains and pay federal corporate income taxes on such retained gains.
For all open tax years and all major taxing jurisdictions, management of the Funds has concluded that there are no significant uncertain tax positions that would require recognition in the financial statements. Open tax years are those that are open for examination by taxing authorities (i.e., generally the last four tax year ends and the interim tax period since then). Furthermore, management of the Funds is also not aware of any tax positions for which it is reasonably possible that the total amounts of unrecognized tax benefits will significantly change in the next twelve months.
The following information is presented on an income tax basis. Differences between amounts for financial statement and federal income tax purposes are primarily due to timing differences in recognizing certain gains and losses on investment transactions. To the extent that differences arise that are permanent in nature, such amounts are reclassified within the capital accounts as detailed below. Temporary differences do not require reclassification. Temporary and permanent differences do not impact the NAVs of the Funds.
65
Notes to Financial Statements (continued)
(Unaudited)
The table below presents the cost and unrealized appreciation (depreciation) of each Fund’s investment portfolio, as determined on a federal income tax basis, as of June 30, 2018.
| | | | | | | | | | | | | | | | |
| | | JHY | | | JHD | | | JHA | | | JHB | |
Tax cost of investments | | $ | 211,959,991 | | | $ | 280,352,874 | | | $ | 283,493,635 | | | $ | 734,274,897 | |
Gross unrealized: | | | | | | | | | | | | | | | | |
Appreciation | | $ | 733,746 | | | $ | 1,709,317 | | | $ | 688,625 | | | $ | 6,788,936 | |
Depreciation | | | (2,572,270 | ) | | | (1,366,119 | ) | | | (355,533 | ) | | | (9,846,755 | ) |
Net unrealized appreciation (depreciation) of investments | | $ | (1,838,524 | ) | | $ | 343,198 | | | $ | 333,092 | | | $ | (3,057,819 | ) |
Permanent differences, primarily due to federal taxes paid, resulted in reclassifications among the Funds’ components of net assets as of December 31, 2017, the Funds’ last tax year end, as follows:
| | | | | | | | | | | | | | | | |
| | | JHY | | | JHD | | | JHA | | | JHB | |
Paid-in surplus | | $ | (19,499 | ) | | $ | (85,506 | ) | | $ | (44,135 | ) | | $ | (27,752 | ) |
Undistributed (Over-distribution of) net investment income | | | — | | | | — | | | | — | | | | — | |
Accumulated net realized gain (loss) | | | 19,499 | | | | 85,506 | | | | 44,135 | | | | 27,752 | |
The tax components of undistributed net ordinary income and net long-term capital gains as of December 31, 2017, the Funds’ last tax year end, were as follows:
| | | | | | | | | | | | | | | | |
| | | JHY | | | JHD | | | JHA | | | JHB | |
Undistributed net ordinary income1 | | $ | 791,505 | | | $ | 3,550,991 | | | $ | 2,695,187 | | | $ | 4,688,950 | |
Undistributed net long-term capital gains | | | — | | | | 665,608 | | | | 458,397 | | | | — | |
| 1 | Net ordinary income consists of net taxable income derived from dividends, interest, and net short-term capital gains, if any. |
The tax character of distributions paid during the Funds’ last tax year ended December 31, 2017 was designated for purposes of the dividends paid deduction as follows:
| | | | | | | | | | | | | | | | |
| | | JHY | | | JHD | | | JHA | | | JHB | |
Distributions from net ordinary income1 | | $ | 9,060,189 | | | $ | 15,628,718 | | | $ | 14,318,563 | | | $ | 33,521,733 | |
Distributions from net long-term capital gains | | | — | | | | 890,410 | | | | 431,371 | | | | — | |
| 1 | Net ordinary income consists of net taxable income derived from dividends, interest, and net short-term capital gains, if any. |
As of December 31, 2017, the Funds’ last tax year end, the following Fund had unused capital losses carrying forward available for federal income tax purposes to be applied against future capital gains, if any. The capital losses are not subject to expiration.
| | | | |
| | | JHY | |
Capital losses to be carried forward – not subject to expiration | | $ | 487,725 | |
During the Funds’ last tax year ended December 31, 2017, JHY utilized $2,167,602 of its capital loss carryforward.
7. Management Fees
Management Fees
Each Fund’s management fee compensates the Adviser for overall investment advisory and administrative services and general office facilities. The Sub-Adviser is compensated for its services to the Funds from the management fees paid to the Adviser.
Each Fund’s management fee consists of two components – a fund-level fee, based only on the amount of assets within each individual Fund, and a complex-level fee, based on the aggregate amount of all eligible fund assets managed by the Adviser. This pricing structure enables Fund shareholders to benefit from growth in the assets within their respective Fund as well as from growth in the amount of complex-wide assets managed by the Adviser.
66
The annual fund-level fee, payable monthly, for each Fund is calculated according to the following schedule:
| | | | |
| Average Daily Managed Assets* | | Fund-Level Fee Rate | |
For the first $500 million | | | 0.5000 | % |
For the next $250 million | | | 0.4875 | |
For managed assets over $750 million | | | 0.4750 | |
The annual complex-level fee, payable monthly, for each Fund is calculated by multiplying the current complex-wide fee rate, determined according to the following schedule by the Funds’ daily managed assets:
| | | | |
| Complex-Level Eligible Asset Breakpoint Level* | | Effective Complex-Level
Fee Rate at Breakpoint Level | |
$55 billion | | | 0.2000 | % |
$56 billion | | | 0.1996 | |
$57 billion | | | 0.1989 | |
$60 billion | | | 0.1961 | |
$63 billion | | | 0.1931 | |
$66 billion | | | 0.1900 | |
$71 billion | | | 0.1851 | |
$76 billion | | | 0.1806 | |
$80 billion | | | 0.1773 | |
$91 billion | | | 0.1691 | |
$125 billion | | | 0.1599 | |
$200 billion | | | 0.1505 | |
$250 billion | | | 0.1469 | |
$300 billion | | | 0.1445 | |
| * | For the complex-level fees, managed assets include closed-end fund assets managed by the Adviser that are attributable to certain types of leverage. For these purposes, leverage includes the funds’ use of preferred stock and borrowings and certain investments in the residual interest certificates (also called inverse floating rate securities) in tender option bond (TOB) trusts, including the portion of assets held by a TOB trust that has been effectively financed by the trust’s issuance of floating rate securities, subject to an agreement by the Adviser as to certain funds to limit the amount of such assets for determining managed assets in certain circumstances. The complex-level fee is calculated based upon the aggregate daily managed assets of all Nuveen open-end and closed-end Funds that constitute “eligible assets.” Eligible assets do not include assets attributable to investments in other Nuveen funds or assets in excess of a determined amount (originally $2 billion) added to the Nuveen fund complex in connection with the Adviser’s assumption of the management of the former First American Funds effective January 1, 2011. As of June 30, 2018, the complex-level fee for each Fund was 0.1591%. |
8. Borrowing Arrangements
JHY, JHD and JHB have entered into a borrowing arrangement (“Borrowings”) as a means of leverage.
The Funds have entered into a credit agreement with a bank and its affiliate. As of the end of the reporting period each Fund’s maximum commitment amount under its Borrowings is as follows:
| | | | | | | | | | | | |
| | | JHY | | | JHD | | | JHB | |
Maximum commitment amount | | | $61,500,000 | | | | $19,500,000 | | | | $190,000,000 | |
JHY renewed its borrowing in August 2018 through August 2019 while JHD renewed its borrowing in June 2018 through June 2019. JHY incurred a 0.10% amendment fee based on the maximum commitment amount of the Borrowings. All other terms remained unchanged for each Fund.
As of the end of the reporting period, each Fund’s outstanding balance on its Borrowings was as follows:
| | | | | | | | | | | | |
| | | JHY | | | JHD | | | JHB | |
Outstanding balance on Borrowings | | | $61,500,000 | | | | $19,500,000 | | | | $190,000,000 | |
Interest is charged on these Borrowings for each Fund at the 1-Month LIBOR (London Inter-Bank Offered Rate) plus 0.65% per annum on the amounts borrowed. JHY, JHD and JHA are each charged a 0.125% per annum commitment fee on the undrawn portion of the Borrowings. JHB is charged a 0.25% per annum commitment fee on the undrawn portion of the Borrowings on any day that more than 10% of the maximum commitment amount is undrawn.
67
Notes to Financial Statements (continued)
(Unaudited)
During the current fiscal period, the average daily balance outstanding and average annual interest rate on each Fund’s Borrowings were as follows:
| | | | | | | | | | | | |
| | | JHY | | | JHD | | | JHB | |
Average daily balance outstanding | | | $52,301,105 | | | | $44,969,613 | | | | $190,000,000 | |
Average annual interest rate | | | 2.47 | % | | | 2.40 | % | | | 2.51 | % |
In order to maintain these Borrowings, the Funds must meet certain collateral, asset coverage and other requirements. Each Fund’s Borrowings outstanding are fully secured by eligible securities held in their Portfolio of Investments.
Each Fund’s Borrowings outstanding is recognized as “Borrowings” on the Statement of Assets and Liabilities. Interest expense incurred on the borrowed amount and undrawn balance and amendment fees are recognized as components of “Interest expense on borrowings” on the Statement of Operations.
Inter-Fund Borrowing and Lending
The SEC has granted an exemptive order permitting registered open-end and closed-end Nuveen funds to participate in an inter-fund lending facility whereby the Nuveen funds may directly lend to and borrow money from each other for temporary purposes (e.g., to satisfy redemption requests or when a sale of securities “fails,” resulting in an unanticipated cash shortfall) (the “Inter-Fund Program”). The closed-end Nuveen funds, including the Funds covered by this shareholder report, will participate only as lenders, and not as borrowers, in the Inter-Fund Program because such closed-end funds rarely, if ever, need to borrow cash to meet redemptions. The Inter-Fund Program is subject to a number of conditions, including, among other things, the requirements that (1) no fund may borrow or lend money through the Inter-Fund Program unless it receives a more favorable interest rate than is typically available from a bank or other financial institution for a comparable transaction; (2) no fund may borrow on an unsecured basis through the Inter-Fund Program unless the fund’s outstanding borrowings from all sources immediately after the inter-fund borrowing total 10% or less of its total assets; provided that if the borrowing fund has a secured borrowing outstanding from any other lender, including but not limited to another fund, the inter-fund loan must be secured on at least an equal priority basis with at least an equivalent percentage of collateral to loan value; (3) if a fund’s total outstanding borrowings immediately after an inter-fund borrowing would be greater than 10% of its total assets, the fund may borrow through the inter-fund loan on a secured basis only; (4) no fund may lend money if the loan would cause its aggregate outstanding loans through the Inter-Fund Program to exceed 15% of its net assets at the time of the loan; (5) a fund’s inter-fund loans to any one fund shall not exceed 5% of the lending fund’s net assets; (6) the duration of inter-fund loans will be limited to the time required to receive payment for securities sold, but in no event more than seven days; and (7) each inter-fund loan may be called on one business day’s notice by a lending fund and may be repaid on any day by a borrowing fund. In addition, a Nuveen fund may participate in the Inter-Fund Program only if and to the extent that such participation is consistent with the fund’s investment objective and investment policies. The Board is responsible for overseeing the Inter-Fund Program.
The limitations detailed above and the other conditions of the SEC exemptive order permitting the Inter-Fund Program are designed to minimize the risks associated with Inter-Fund Program for both the lending fund and the borrowing fund. However, no borrowing or lending activity is without risk. When a fund borrows money from another fund, there is a risk that the loan could be called on one day’s notice or not renewed, in which case the fund may have to borrow from a bank at a higher rate or take other actions to payoff such loan if an inter-fund loan is not available from another fund. Any delay in repayment to a lending fund could result in a lost investment opportunity or additional borrowing costs.
During the current reporting period, none of the Funds covered by this shareholder report have entered into any inter-fund loan activity.
9. New Accounting Pronouncements
FASB Accounting Standards Update (“ASU”) 2017-08 (“ASU 2017-08”) Premium Amortization on Purchased Callable Debt Securities
The FASB has issued ASU 2017-08, which shortens the premium amortization period for purchased non-contingently callable debt securities. ASU 2017-08 specifies that the premium amortization period ends at the earliest call date, for purchased non-contingently callable debt securities. ASU 2017-08 is effective for fiscal years, and interim periods within those fiscal years, beginning after December 15, 2018. Management is currently evaluating the implications of ASU 2017-08, if any.
68
Additional Fund Information
| | | | | | | | | | |
| Board of Trustees | | | | | | | | | | |
Margo Cook* | | Jack B. Evans | | William C. Hunter | | Albin F. Moschner | | John K. Nelson | | William J. Schneider |
Judith M. Stockdale | | Carole E. Stone | | Terence J. Toth | | Margaret L. Wolff | | Robert C. Young | | |
| * | Interested Board Member. |
| | | | | | | | |
| | | | | |
Fund Manager Nuveen Fund Advisors, LLC 333 West Wacker Drive Chicago, IL 60606 | | Custodian State Street Bank
& Trust Company One Lincoln Street Boston, MA 02111 | | Legal Counsel Chapman and Cutler LLP Chicago, IL 60603 | | Independent Registered
Public Accounting Firm KPMG LLP 200 East Randolph Street Chicago, IL 60601 | | Transfer Agent and
Shareholder Services Computershare Trust Company, N.A. 250 Royal Street Canton, MA 02021 (800) 257-8787 |
Quarterly Form N-Q Portfolio of Investments Information
The Fund is required to file its complete schedule of portfolio holdings with the Securities and Exchange Commission (SEC) for the first and third quarters of each fiscal year on Form N-Q. You may obtain this information directly from the SEC. Visit the SEC on-line at http://www.sec.gov or in person at the SEC’s Public Reference Room in Washington, D.C. Call the SEC toll-free at (800) SEC-0330 for room hours and operation.
Nuveen Funds’ Proxy Voting Information
You may obtain (i) information regarding how each fund voted proxies relating to portfolio securities held during the most recent twelve-month period ended June 30, without charge, upon request, by calling Nuveen toll-free at (800) 257-8787 or on Nuveen’s website at www.nuveen.com and (ii) a description of the policies and procedures that each fund used to determine how to vote proxies relating to portfolio securities without charge, upon request, by calling Nuveen toll free at (800) 257-8787. You may also obtain this information directly from the SEC. Visit the SEC on-line at http://www.sec.gov.
CEO Certification Disclosure
The Fund’s Chief Executive Officer (CEO) has submitted to the New York Stock Exchange (NYSE) the annual CEO certification as required by Section 303A.12(a) of the NYSE Listed Company Manual. The Fund has filed with the SEC the certification of its CEO and Chief Financial Officer required by Section 302 of the Sarbanes-Oxley Act.
Share Repurchases
Each Fund intends to repurchase, through its open-market share repurchase program, shares of its own common stock at such times and in such amounts as is deemed advisable. During the period covered by this report, each Fund repurchased shares of its common stock, as shown in the accompanying table. Any future repurchases will be reported to shareholders in the next annual or semi-annual report.
| | | | | | | | | | | | | | | | |
| | | JHY | | | JHD | | | JHA | | | JHB | |
Shares repurchased | | | — | | | | — | | | | — | | | | — | |
FINRA BrokerCheck
The Financial Industry Regulatory Authority (FINRA) provides information regarding the disciplinary history of FINRA member firms and associated investment professionals. This information as well as an investor brochure describing FINRA BrokerCheck is available to the public by calling the FINRA BrokerCheck Hotline number at (800) 289-9999 or by visiting www.FINRA.org.
69
Glossary of Terms Used in this Report
| ∎ | | Average Annual Total Return: This is a commonly used method to express an investment’s performance over a particular, usually multi-year time period. It expresses the return that would have been necessary each year to equal the investment’s actual cumulative performance (including change in NAV or market price and reinvested dividends and capital gains distributions, if any) over the time period being considered. |
| ∎ | | Bloomberg Barclays U.S. High Yield 1-5 Year Cash Pay 2% Issuer Capped Index: An index that tracks the performance of U.S. non-investment grade bonds with maturities of one to 4.99 years and limits each issue to 2% of the index. Benchmark returns assume reinvestment of distributions, but do not reflect any applicable sales charges or management fees. |
| ∎ | | Duration: Duration is a measure of the expected period over which a bond’s principal and interest will be paid, and consequently is a measure of the sensitivity of a bond’s or bond fund’s value to changes when market interest rates change. Generally, the longer a bond’s or fund’s duration, the more the price of the bond or fund will change as interest rates change. |
| ∎ | | Effective Leverage: Effective leverage is a fund’s effective economic leverage, and includes both regulatory leverage (see below) and the leverage effects of certain derivative investments in the fund’s portfolio. |
| ∎ | | Leverage: Leverage is created whenever a fund has investment exposure (both reward and/or risk) equivalent to more than 100% of the investment capital. |
| ∎ | | Net Asset Value (NAV) Per Share: A fund’s Net Assets is equal to its total assets (securities, cash, accrued earnings and receivables) less its total liabilities. NAV per share is equal to the fund’s Net Assets divided by its number of shares outstanding. |
| ∎ | | Regulatory Leverage: Regulatory leverage consists of preferred shares issued by or borrowings of a fund. Both of these are part of a fund’s capital structure. Regulatory leverage is subject to asset coverage limits set in the Investment Company Act of 1940. |
70
Reinvest Automatically, Easily and Conveniently
Nuveen makes reinvesting easy. A phone call is all it takes to set up your reinvestment account.
Nuveen Closed-End Funds Automatic Reinvestment Plan
Your Nuveen Closed-End Fund allows you to conveniently reinvest distributions in additional Fund shares.
By choosing to reinvest, you’ll be able to invest money regularly and automatically, and watch your investment grow through the power of compounding. Just like distributions in cash, there may be times when income or capital gains taxes may be payable on distributions that are reinvested.
It is important to note that an automatic reinvestment plan does not ensure a profit, nor does it protect you against loss in a declining market.
Easy and convenient
To make recordkeeping easy and convenient, each quarter you’ll receive a statement showing your total distributions, the date of investment, the shares acquired and the price per share, and the total number of shares you own.
How shares are purchased
The shares you acquire by reinvesting will either be purchased on the open market or newly issued by the Fund. If the shares are trading at or above net asset value at the time of valuation, the Fund will issue new shares at the greater of the net asset value or 95% of the then-current market price. If the shares are trading at less than net asset value, shares for your account will be purchased on the open market. If the Plan Agent begins purchasing Fund shares on the open market while shares are trading below net asset value, but the Fund’s shares subsequently trade at or above their net asset value before the Plan Agent is able to complete its purchases, the Plan Agent may cease open-market purchases and may invest the uninvested portion of the distribution in newly-issued Fund shares at a price equal to the greater of the shares’ net asset value or 95% of the shares’ market value on the last business day immediately prior to the purchase date. Distributions received to purchase shares in the open market will normally be invested shortly after the distribution payment date. No interest will be paid on distributions awaiting reinvestment. Because the market price of the shares may increase before purchases are completed, the average purchase price per share may exceed the market price at the time of valuation, resulting in the acquisition of fewer shares than if the distribution had been paid in shares issued by the Fund. A pro rata portion of any applicable brokerage commissions on open market purchases will be paid by Plan participants. These commissions usually will be lower than those charged on individual transactions.
Flexible
You may change your distribution option or withdraw from the Plan at any time, should your needs or situation change.
You can reinvest whether your shares are registered in your name, or in the name of a brokerage firm, bank, or other nominee. Ask your investment advisor if his or her firm will participate on your behalf. Participants whose shares are registered in the name of one firm may not be able to transfer the shares to another firm and continue to participate in the Plan.
The Fund reserves the right to amend or terminate the Plan at any time. Although the Fund reserves the right to amend the Plan to include a service charge payable by the participants, there is no direct service charge to participants in the Plan at this time.
Call today to start reinvesting distributions
For more information on the Nuveen Automatic Reinvestment Plan or to enroll in or withdraw from the Plan, speak with your financial advisor or call us at (800) 257-8787.
71
Annual Investment Management Agreement Approval Process
(Unaudited)
At a meeting held on May 22-24, 2018 (the “May Meeting”), the Board of Trustees (each, a “Board,” and each Trustee, a “Board Member”) of each Fund, including the Board Members who are not “interested persons” (as defined under the Investment Company Act of 1940 (the “1940 Act”)) (the “Independent Board Members”), approved, for its respective Fund, the renewal of the management agreement (the “Investment Management Agreement”) with Nuveen Fund Advisors, LLC (the “Adviser”) pursuant to which the Adviser serves as investment adviser to such Fund and the sub-advisory agreement (the “Sub-Advisory Agreement”) with Nuveen Asset Management, LLC (the “Sub-Adviser”) pursuant to which the Sub-Adviser serves as investment sub-adviser to such Fund. Following an initial two-year period, the Board, including the Independent Board Members, is required under the 1940 Act to review and approve each Investment Management Agreement and Sub-Advisory Agreement on behalf of the applicable Fund on an annual basis. The Investment Management Agreements and Sub-Advisory Agreements are collectively referred to as the “Advisory Agreements” and the Adviser and the Sub-Adviser are collectively, the “Fund Advisers” and each, a “Fund Adviser.”
In response to a request on behalf of the Independent Board Members by independent legal counsel, the Board received and reviewed prior to the May Meeting extensive materials specifically prepared for the annual review of Advisory Agreements by the Adviser as well as by Broadridge Financial Solutions, Inc. (“Broadridge” or “Lipper”), an independent provider of investment company data. The materials provided in connection with the annual review covered a breadth of subject matter including, but not limited to, a description of the nature, extent and quality of services provided by each Fund Adviser; a review of the Sub-Adviser and the applicable investment team(s); an analysis of fund performance in absolute terms and as compared to the performance of certain peer funds and benchmarks with a focus on any performance outliers; an analysis of the fees and expense ratios of the Nuveen funds in absolute terms and as compared to those of certain peer funds with a focus on any expense outliers; a description of portfolio manager compensation; a review of the secondary market for Nuveen closed-end funds (including, among other things an analysis of performance, distribution and valuation and capital raising trends in the broader closed-end fund market and in particular to Nuveen closed-end funds; a review of the leverage management actions taken on behalf of the Nuveen closed-end funds and the resulting impact on performance; and a description of the distribution management process and any capital management activities); a review of the performance of various service providers; a description of various initiatives Nuveen had undertaken or continued during the year for the benefit of particular Nuveen fund(s) and/or the complex; a description of the profitability or financial data of Nuveen and the various sub-advisers to the Nuveen funds; and a description of indirect benefits received by the Fund Advisers as a result of their relationships with the Nuveen funds. The Independent Board Members also received a memorandum from independent legal counsel outlining their fiduciary duties and legal standards in reviewing the Advisory Agreements. The Board Members held an in-person meeting on April 10-11, 2018 (the “April Meeting”), in part, to review and discuss the performance of the Nuveen funds and the Adviser’s evaluation of the various sub-advisers to the Nuveen funds. Prior to the May Meeting, the Board Members also received and reviewed supplemental information provided in response to questions posed by the Board Members.
The information prepared specifically for the annual review of the Advisory Agreements supplemented the information provided to the Board and its committees throughout the year. The Board and its committees met regularly during the year and the information provided and topics discussed were relevant to the review of the Advisory Agreements. Some of these reports and other data included, among other things, materials that outlined the investment performance of the Nuveen funds; strategic plans of the Adviser which may impact the services it provides to the Nuveen funds; the review of the Nuveen funds and applicable investment teams; the management of leveraging financing for the Nuveen closed-end funds; the secondary market trading of the Nuveen closed-end funds and any actions to address discounts; compliance, regulatory and risk management matters; the trading practices of the various sub-advisers; valuation of securities; fund expenses; and overall market and regulatory developments. The Board further continued its practice of seeking to meet periodically with the various sub-advisers to the Nuveen funds and their investment teams, when feasible. As a result, the Independent Board Members considered the review of the Advisory Agreements to be an ongoing process and employed the accumulated information, knowledge, and experience the Board Members had gained during their tenure on the boards governing the Nuveen funds and working with the Fund Advisers in their review of the Advisory Agreements. Throughout the year and during the annual review of Advisory Agreements, the Independent Board Members met in executive sessions with independent legal counsel and had the benefit of counsel’s advice.
72
In deciding to renew the Advisory Agreements, the Independent Board Members did not identify a particular factor as determinative, but rather the decision reflected the comprehensive consideration of all the information provided, and each Board Member may have attributed different levels of importance to the various factors and information considered in connection with the approval process. The following summarizes the principal factors, but not all the factors, the Board considered in deciding to renew the Advisory Agreements and its conclusions.
| A. | | Nature, Extent and Quality of Services |
In evaluating the renewal of the Advisory Agreements, the Independent Board Members received and considered information regarding the nature, extent and quality of the applicable Fund Adviser’s services provided to the respective Fund and the resulting performance of each Fund. With respect to the Adviser, the Board recognized the comprehensive set of management, oversight and administrative services the Adviser and its affiliates provided to manage and operate the Nuveen funds in a highly regulated industry. As illustrative, these services included, but were not limited to, product management; investment oversight, risk management and securities valuation services; fund accounting and administration services; board support and administration services; compliance and regulatory oversight services; legal support; and with respect to closed-end funds, leverage, capital and distribution management services.
In addition to the services necessary to operate and maintain the Nuveen funds, the Board recognized the Adviser’s continued program of improvements and innovations to make the Nuveen fund complex more relevant and attractive to existing and new investors and to accommodate the new and changing regulatory requirements in an increasingly complex regulatory environment. The Board noted that some of the initiatives the Adviser had taken over recent years to benefit the complex and particular Nuveen funds included, among other things:
| | • | | Fund Rationalizations – continuing efforts to rationalize the product line through mergers, liquidations and repositionings in seeking to enhance shareholder value over the years through increased efficiency, reduced costs, improved performance and revised investment approaches more relevant to current shareholder needs; |
| | • | | Product Innovations – developing product innovations and launching new products that will help the Nuveen fund complex offer a variety of products that will attract new investors and retain existing investors, such as launching the target term funds, exchange-traded funds (“ETFs”) and multi-asset class funds; |
| | • | | Risk Management Enhancements – continuing efforts to enhance risk management, including enhancing reporting to increase the efficiency of risk monitoring, implementing programs to strengthen the ability to detect and mitigate operational risks, dedicating resources and staffing necessary to create standards to help ensure compliance with new liquidity requirements, and implementing a price verification system; |
| | • | | Additional Compliance Services – the continuing investment of significant resources, time and additional staffing to meet the various new regulatory requirements affecting the Nuveen funds over the past several years, the further implementation of unified compliance policies and processes, the development of additional compliance training modules, and the reorganization of the compliance team adding further depth to its senior leadership; |
| | • | | Expanded Dividend Management Services – as the Nuveen fund complex has grown, the additional services necessary to manage the distributions of the varied funds offered and investing in automated systems to assist in this process; and |
| | • | | with respect specifically to closed-end funds, such initiatives also included: |
| | •• | Leverage Management Services – continuing activities to expand financing relationships and develop new product structures to lower fund leverage expenses and to manage associated risks, particularly in an interest rate increasing environment; |
| | •• | Capital Management Services – continuing capital management activities through the share repurchase program and additional equity offerings in seeking to increase net asset value and/or improve fund performance for the respective Nuveen funds; |
73
Annual Investment Management Agreement Approval Process (continued)
(Unaudited)
| | •• | Data and Market Analytics – continuing development of databases that help with obtaining and analyzing ownership data of closed-end funds; |
| | •• | Enhanced Secondary Market Reporting – providing enhanced reporting and commentary on the secondary market trading of closed-end funds which permit more efficient analysis of the performance of the Nuveen funds compared to peers and of trends in the marketplace; and |
| | •• | Tender Option Bond Services – providing the additional support services necessary for Nuveen funds that seek to use tender option bonds to meet new regulatory requirements. |
The Board also recognized the Adviser’s investor relations program which seeks to advance the Nuveen closed-end funds through, among other things, raising awareness and delivering education regarding closed-end funds to investors and financial advisors and promoting the Nuveen closed-end funds with such investors.
In addition to the services provided by the Adviser, the Board also noted the business related risks the Adviser incurred in managing the Nuveen funds, including entrepreneurial, legal and litigation risks.
The Board further considered the division of responsibilities between the Adviser and the Sub-Adviser and the investment and compliance oversight over the Sub-Adviser provided by the Adviser. The Board recognized that the Sub-Adviser generally provided the portfolio advisory services for the Funds. The Board reviewed the Adviser’s analysis of the Sub-Adviser which evaluated, among other things, the investment team, the members’ experience and any changes to the team during the year, the team’s assets under management, the stability and history of the organization, the team’s investment approach and the performance of the Funds over various periods. The Board noted that the Adviser recommended the renewal of the Sub-Advisory Agreements.
Based on its review, the Board determined, in the exercise of its reasonable business judgment, that it was satisfied with the nature, extent and quality of services provided to the respective Funds under each applicable Advisory Agreement.
| B. | | The Investment Performance of the Funds and Fund Advisers |
As part of its evaluation of the services provided by the Fund Advisers, the Board considered the investment performance of each Fund. In this regard, the Board reviewed fund performance over the quarter and one-year periods ending December 31, 2017 as well as performance data for the first quarter of 2018 ending March 31, 2018. The Independent Board Members noted that they reviewed and discussed fund performance over various time periods with management at their quarterly meetings throughout the year and their review and analysis of performance during the annual review of Advisory Agreements incorporated such discussions.
The Board reviewed performance on an absolute basis and in comparison to the performance of peer funds (the “Performance Peer Group”) and recognized and/or customized benchmarks (i.e., generally benchmarks derived from multiple recognized benchmarks). The Board considered the Adviser’s analysis of each Nuveen fund’s performance, including, in particular, an analysis of the Nuveen funds determined to be performance outliers and the factors contributing to their underperformance. In addition to the foregoing, in recognizing the importance of secondary market trading to shareholders of closed-end funds, the Board reviewed, among other things, the premium or discount to net asset value of the Nuveen closed-end funds as of a specified date as well as relative to the premiums or discounts of certain peers and the funds’ total return based on net asset value and market price over various periods. The Board considers the review of premiums and discounts of the closed-end funds to be a continuing priority and as such, the Board and/or its Closed-end Fund Committee also receives an update on the secondary closed-end fund market and evaluates the premiums and discounts of the Nuveen closed-end funds at each quarterly meeting, reviewing, among other things, the premium and discount trends in the broader closed-end fund market, by asset category and by closed-end fund; the historical total return performance data for the Nuveen closed-end funds based on net asset value and price over various periods; the volatility trends in the market; the distribution data of the Nuveen closed-end funds and as compared to peer averages; and a summary of the common share shelf offerings and share repurchase activity during the applicable quarter. As the Board’s Closed-end Fund Committee oversees matters particularly impacting the closed-end fund product line, the committee further engages in more in-depth discussions of the premiums and discounts of the Nuveen closed-end funds at each of its quarterly meetings.
74
In reviewing performance data, the Independent Board Members appreciated some of the inherent limitations of such data. In this regard, the Independent Board Members recognized that there may be limitations with the comparative data of certain peer groups or benchmarks as they may pursue objective(s), strategies or have other characteristics that are different from the respective Nuveen fund and therefore the performance results necessarily are different and limit the value of the comparisons. As an example, some funds may utilize leverage which may add to or detract from performance compared to an unlevered benchmark. The Independent Board Members also noted that management had ranked the relevancy of the peer group as low, medium or high to help the Board evaluate the value of the comparative peer performance data. The Board was aware that the performance data was measured as of a specific date and a different time period may reflect significantly different results and a period of underperformance can significantly impact long term performance figures. The Board further recognized that a shareholder’s experience in a Fund depends on his or her own holding period which may differ from that reviewed by the Independent Board Members.
In their review of performance, the Independent Board Members focused, in particular, on the Adviser’s analysis of Nuveen funds determined to be underperforming performance outliers. The Independent Board Members noted that only a limited number of the Nuveen funds appeared to be underperforming performance outliers at the end of 2017 and considered the factors contributing to the respective fund’s performance and whether there were any performance concerns that needed to be addressed. The Board recognized that some periods of underperformance may only be temporary while other periods of underperformance may indicate a broader issue that may require a corrective action. Accordingly, with respect to any Nuveen funds for which the Board had identified performance issues, the Board monitors such funds closely until performance improves, discusses with the Adviser the reasons for such results, considers whether any steps are necessary or appropriate to address such issues, and reviews the results of any efforts undertaken.
For Nuveen High Income 2020 Target Term Fund, the Board noted that the Fund ranked in the third quartile of its Performance Peer Group in the one-year period and outperformed its benchmark during this period. In its review, the Board noted that the Performance Peer Group was classified as low for relevancy. The Board also recognized that the Fund was relatively new with only a limited performance history available, limiting the ability to make a meaningful assessment of performance. Nevertheless, the Board recognized that the Fund was a target term fund designed to return its original net asset value per common share at the end of its term, and the Fund was on track to return the original net asset value to investors and provided current income consistent with expectations. The Board was satisfied with the Fund’s overall performance.
For Nuveen High Income December 2018 Target Term Fund, the Board noted that the Fund ranked in the fourth quartile of its Performance Peer Group in the one-year period, and the Fund’s performance was below its benchmark during this period. In its review, the Board noted that the Performance Peer Group was classified as low for relevancy. The Board also recognized that the Fund was relatively new with only a limited performance history available, limiting the ability to make a meaningful assessment of performance. Nevertheless, the Board recognized that the Fund was a target term fund designed to return its original net asset value per common share at the end of its term, and the Fund was on track to return the original net asset value to investors and provided current income consistent with expectations. The Independent Board Members were satisfied with the Adviser’s explanation of the performance of the Fund.
For Nuveen High Income December 2019 Target Term Fund, the Board recognized that the Fund ranked in the fourth quartile of its Performance Peer Group in the one-year period and outperformed its benchmark during this period. In its review, the Board recognized that the Performance Peer Group was classified as low for relevancy. The Board also recognized that the Fund was relatively new with only a limited performance history available, limiting the ability to make a meaningful assessment of performance. Nevertheless, the Board recognized that the Fund was a target term fund designed to return its original net asset value per common share at the end of its term and the Fund was on track to return the original net asset value to investors and provided current income consistent with expectations. The Independent Board Members were satisfied with the Adviser’s explanation of the performance of the Fund.
For Nuveen High Income November 2021 Target Term Fund, the Board recognized that the Fund ranked in the third quartile of its Performance Peer Group in the one-year period and outperformed its benchmark during this period. In its review, the
75
Annual Investment Management Agreement Approval Process (continued)
(Unaudited)
Board recognized that the Performance Peer Group was classified as low for relevancy. The Board also recognized that the Fund was relatively new with a limited performance history available, limiting the ability for a meaningful assessment of performance. Nevertheless, the Board recognized that the Fund was a target term fund designed to return its original net asset value per common share at the end of its term, and the Fund was on track to return the original net asset value to investors and provided current income consistent with expectations. The Independent Board Members were satisfied with the Adviser’s explanation of the performance of the Fund.
| C. | | Fees, Expenses and Profitability |
In its annual review, the Board considered the fees paid to the Fund Advisers and the total operating expense ratio of each Fund. More specifically, the Independent Board Members reviewed, among other things, each Fund’s gross and net management fee rates and net total expense ratio in relation to those of a comparable universe of funds (the “Peer Universe”) established by Broadridge. The Independent Board Members reviewed the methodology Broadridge employed to establish its Peer Universe and recognized that differences between the applicable fund and its respective Peer Universe may limit some of the value of the comparative data. The Independent Board Members also considered a fund’s operating expense ratio as it more directly reflected the shareholder’s costs in investing in the respective fund. In their review, the Independent Board Members considered, in particular, each fund with a net expense ratio (excluding investment-related costs of leverage for closed-end funds) of six basis points or higher compared to that of its peer average (each an “Expense Outlier Fund”). The Board noted that the number of Nuveen funds classified as an Expense Outlier Fund pursuant to the foregoing criteria had decreased over the past few years with only a limited number of the Nuveen funds identified as Expense Outlier Funds in 2017. The Independent Board Members reviewed an analysis as to the factors contributing to each such fund’s higher relative net expense ratio. In addition, although the Board reviewed a fund’s total net expenses both including and excluding investment-related expenses (i.e., leverage costs) and taxes for certain of the Nuveen closed-end funds, the Board recognized that leverage expenses will vary across funds and in comparison to peers because of differences in the forms and terms of leverage employed by the respective fund. Accordingly, in reviewing the comparative data between a fund and its peers, the Board generally considered the fund’s net expense ratio and fees (excluding leverage costs and leveraged assets for the closed-end funds) to be higher if they were over 10 basis points higher, slightly higher if they were 6 to 10 basis points higher, in line if they were within approximately 5 basis points higher than the peer average and below if they were below the peer average of the Peer Universe.
In their review of the fee arrangements for the Nuveen funds, the Independent Board Members considered the management fee schedules, including the complex-wide and fund-level breakpoint schedules, as applicable. The Board considered that across the Nuveen fund complex, the complex-wide fee breakpoints reduced fees by $47.4 million and fund-level breakpoints reduced fees by $54.6 million in 2017.
The Board considered the sub-advisory fees paid to the Sub-Adviser, including any breakpoint schedule, and as described below, comparative data of the fees the Sub-Adviser charges to other clients.
The Independent Board Members noted that each Fund had a net management fee and a net expense ratio below the respective peer averages.
Based on their review of the information provided, the Board determined that each Fund’s management fees (as applicable) to a Fund Adviser were reasonable in light of the nature, extent and quality of services provided to the Fund.
| | 2. | | Comparisons with the Fees of Other Clients |
In determining the appropriateness of fees, the Board also reviewed information regarding the fee rates the respective Fund Advisers charged for certain other types of clients and the type of services provided to these other clients. With respect to the Adviser and/or the Sub-Adviser, such other clients may include retail and institutional managed accounts, investment companies outside the Nuveen family, foreign investment companies offered by Nuveen, and collective investment trusts. The Board further noted that the Adviser also advised certain ETFs sponsored by Nuveen.
76
The Board recognized that each Fund had an affiliated sub-adviser and reviewed, among other things, the range of fees assessed for managed accounts and foreign investment companies. The Board also reviewed the fee range and average fee rate of certain selected investment strategies offered in retail and institutional managed accounts by the Sub-Adviser and of the non-Nuveen investment companies sub-advised by affiliated sub-advisers. In addition to the comparative fee data, the Board also reviewed, among other things, a description of the different levels of services provided to other clients compared to the services provided to the Nuveen funds as well as the differences in portfolio investment policies, investor profiles, account sizes and regulatory requirements, all of which contribute to the variations in the fee schedules. With respect to ETFs, the Board considered the differences in the passive management of Nuveen’s Nushares ETFs compared to the active management of other Nuveen funds which also contributed to differing management fee levels compared to the other Nuveen funds. In general, the Board noted that the higher fee levels reflect higher levels of services provided by Nuveen, increased investment management complexity, greater product management requirements and higher levels of business risk or some combination of these factors. The Board further considered that the Sub-Adviser’s fee is essentially for portfolio management services and therefore more comparable to the fees it receives for retail wrap accounts and other external sub-advisory mandates. The Board concluded the varying levels of fees were justified given, among other things, the inherent differences in the products and the level of services provided to the Nuveen funds versus other clients, the differing regulatory requirements and legal liabilities and the entrepreneurial risks incurred in sponsoring and advising a registered investment company.
| | 3. | | Profitability of Fund Advisers |
In conjunction with their review of fees, the Independent Board Members considered Nuveen’s level of profitability for its advisory services to the Nuveen funds for the calendar years 2017 and 2016. In considering profitability, the Independent Board Members reviewed the level of profitability realized by Nuveen including and excluding any distribution expenses incurred by Nuveen from its own resources. The Independent Board Members also reviewed a description of the expense allocation methodology employed to develop the financial information and a summary of the history of changes to the methodology over the years. For comparability purposes, the Board recognized that a prior year’s profitability would be restated to reflect any refinements to the methodology. The Independent Board Members were aware of the inherent limitations in calculating profitability as the use of different reasonable allocation methodologies may lead to significantly different results and in reviewing profitability margins over extended periods given the refinements to the methodology over time. The Board noted that two Independent Board Members, along with independent counsel, serve as the Board’s liaisons to review and discuss any proposed changes to the methodology prior to the full Board’s review.
In their review, the Independent Board Members evaluated, among other things, Nuveen’s adjusted operating margins, gross and net revenue margins (pre-tax and after-tax) for advisory activities for the Nuveen funds, and the revenues, expenses, and net income (pre-tax and after-tax and before distribution) of Nuveen for fund advisory services for each of the last two calendar years. The Independent Board Members also reviewed an analysis of the key drivers behind the changes in revenues and expenses that impacted profitability in 2017 versus 2016. The Board noted that Nuveen recently launched its ETF product line in 2016 and reviewed the revenues, expenses and operating margin from this product line.
In addition to reviewing Nuveen’s profitability in absolute terms, the Independent Board Members also examined comparative profitability data reviewing, among other things, the revenues, expenses and adjusted total company margins of other advisory firms that had publicly available information and comparable assets under management (based on asset size and asset composition) for 2017 and as compared to their adjusted operating margins for 2016. The Independent Board Members, however, recognized the difficulty in comparing the profitability of various fund managers given the limited public information available and the subjective nature of calculating profitability which may be affected by numerous factors including the fund manager’s organizational structure, types of funds, other lines of business, methodology used to allocate expenses and cost of capital. Nevertheless, considering such limitations and based on the information provided, the Board noted that Nuveen’s adjusted operating margins appeared reasonable when compared to the adjusted margins of the peers.
Aside from Nuveen’s profitability, the Board recognized that the Adviser is a subsidiary of Nuveen, LLC, the investment management arm of Teachers Insurance and Annuity Association of America (“TIAA”). As such, the Board also reviewed a
77
Annual Investment Management Agreement Approval Process (continued)
(Unaudited)
balance sheet for TIAA reflecting its assets, liabilities and capital and contingency reserves for the 2017 and 2016 calendar years to consider the financial strength of TIAA.
In reviewing profitability, the Independent Board Members also considered the profitability of the various sub-advisers from their relationships with the respective Nuveen fund(s). The Independent Board Members reviewed the Sub-Adviser’s revenues, expenses and revenue margins (pre- and post-tax) for its advisory activities for the calendar year ended December 31, 2017. The Independent Board Members also reviewed a profitability analysis reflecting the revenues, expenses and revenue margin (pre- and post-tax) by asset type for the Sub-Adviser for the calendar year ending December 31, 2017 and the pre- and post-tax revenue margin from 2017 and 2016.
In evaluating the reasonableness of the compensation, the Independent Board Members also considered any other ancillary benefits derived by the respective Fund Adviser from its relationship with the Nuveen funds as discussed in further detail below.
Based on a consideration of all the information provided, the Board noted that Nuveen’s and the Sub-Adviser’s level of profitability was acceptable and not unreasonable in light of the services provided.
| D. | | Economies of Scale and Whether Fee Levels Reflect These Economies of Scale |
The Independent Board Members considered the extent to which economies of scale may be achieved as a Fund grows and whether these economies of scale have been shared with shareholders. Although the Board recognized that economies of scale are difficult to measure, the Independent Board Members noted that there are several methods that may be used in seeking to share economies of scale, including through breakpoints in the management fee schedule reducing the fee rates as asset levels grow, fee waivers and/or expense limitation agreements and the Adviser’s investment in its business which can enhance the services provided to the Nuveen funds. With respect to breakpoint schedules, because the Board had previously recognized that economies of scale may occur not only when the assets of a particular fund grow but also when the assets in the complex grow, the Nuveen funds generally pay the Adviser a management fee comprised of a fund-level component and a complex-level component each with its own breakpoint schedule, subject to certain exceptions. In general terms, the breakpoint schedule at the fund level reduces fees as assets in the particular fund pass certain thresholds and the breakpoint schedule at the complex level reduces fees on certain funds as the eligible assets in the complex pass certain thresholds. Subject to exceptions for certain Nuveen funds, the Independent Board Members reviewed the fund-level and complex-level fee schedules and any resulting savings in fees. In addition, with respect to closed-end funds, the Independent Board Members noted that, although such funds may from time-to-time make additional share offerings, the growth of their assets would occur primarily through the appreciation of such funds’ investment portfolios. Further, the Independent Board Members recognized the Adviser’s continued reinvestment in its business through, among other things, improvements in technology, additional staffing, product innovations and other organizational changes designed to expand or enhance the services provided to the benefit of all of the Nuveen funds.
Based on its review, the Board concluded that the current fee arrangements together with the Adviser’s reinvestment in its business appropriately shared any economies of scale with shareholders.
The Independent Board Members received and considered information regarding other benefits the respective Fund Adviser or its affiliates may receive as a result of their relationship with the Nuveen funds. The Independent Board Members reviewed the revenues that an affiliate of the Adviser received in 2017 as a result of serving as co-manager in the initial public offerings of new closed-end funds and as the underwriter on shelf offerings of existing closed-end funds.
In addition to the above, the Independent Board Members considered whether the Sub-Adviser uses commissions paid by the Funds on portfolio transactions to obtain research products and other services (“soft dollar transactions”). The Board recognized that the Sub-Adviser may benefit from research received from broker-dealers that execute Fund portfolio transactions. The Board, however, noted that the benefits for sub-advisers transacting in fixed-income securities may be more limited as such securities generally trade on a principal basis and therefore do not generate brokerage commissions. Further,
78
the Board noted that although the Sub-Adviser may benefit from the receipt of research and other services that it may otherwise have to pay for out of its own resources, the research may also benefit the Funds to the extent it enhances the ability of the Sub-Adviser to manage the Funds or is acquired through the commissions paid on portfolio transactions of other funds or clients.
Based on their review, the Board concluded that any indirect benefits received by a Fund Adviser as a result of its relationship with the Funds were reasonable and within acceptable parameters.
The Board Members did not identify any single factor discussed previously as all-important or controlling. The Board Members, including the Independent Board Members, concluded that the terms of each Advisory Agreement were fair and reasonable, that the respective Fund Adviser’s fees were reasonable in light of the services provided to each Fund and that the Advisory Agreements be renewed.
79
Nuveen:
Serving Investors for Generations
Since 1898, financial advisors and their clients have relied on Nuveen to provide
dependable investment solutions through continued adherence to proven, long-term investing
principles. Today, we offer a range of high quality solutions designed to
be integral components of a well-diversified core portfolio.
Focused on meeting investor needs.
Nuveen is the investment manager of TIAA. We have grown into one of the world’s premier global asset managers, with specialist knowledge across all major asset classes and particular strength in solutions that provide income for investors and that draw on our expertise in alternatives and responsible investing. Nuveen is driven not only by the independent investment processes across the firm, but also the insights, risk management, analytics and other tools and resources that a truly world-class platform provides. As a global asset manager, our mission is to work in partnership with our clients to create solutions which help them secure their financial future.
Find out how we can help you.
To learn more about how the products and services of Nuveen may be able to help you meet your financial goals, talk to your financial advisor, or call us at (800) 257-8787. Please read the information provided carefully before you invest. Investors should consider the investment objective and policies, risk considerations, charges and expenses of any investment carefully. Where applicable, be sure to obtain a prospectus, which contains this and other relevant information. To obtain a prospectus, please contact your securities representative or Nuveen, 333 W. Wacker Dr., Chicago, IL 60606. Please read the prospectus carefully before you invest or send money.
Learn more about Nuveen Funds at: www.nuveen.com/closed-end-funds
| | | | |
| Securities offered through Nuveen Securities, LLC, member FINRA and SIPC | 333 West Wacker Drive Chicago, IL 60606 | www.nuveen.com | |  | | ESA-N-0618D 569777-INV-B-08/19 |
Item 2. Code of Ethics.
Not applicable to this filing.
Item 3. Audit Committee Financial Expert.
Not applicable to this filing.
Item 4. Principal Accountant Fees and Services.
Not applicable to this filing.
Item 5. Audit Committee of Listed Registrants.
Not applicable to this filing.
Item 6. Schedule of Investments.
(a) See Portfolio of Investments in Item 1.
(b) Not applicable.
Item 7. Disclosure of Proxy Voting Policies and Procedures for Closed-End Management Investment Companies.
Not applicable to this filing.
Item 8. Portfolio Managers of Closed-End Management Investment Companies.
Not applicable to this filing.
Item 9. Purchases of Equity Securities by Closed-End Management Investment Company and Affiliated Purchasers.
Not applicable.
Item 10. Submission of Matters to a Vote of Security Holders.
There have been no material changes to the procedures by which shareholders may recommend nominees to the registrant’s Board implemented after the registrant last provided disclosure in response to this item.
Item 11. Controls and Procedures.
| (a) | The registrant’s principal executive and principal financial officers, or persons performing similar functions, have concluded that the registrant’s disclosure controls and procedures (as defined in Rule 30a-3(c) under the Investment Company Act of 1940, as amended (the “1940 Act”) (17 CFR 270.30a-3(c))) are effective, as of a date within 90 days of the filing date of this report that includes the disclosure required by this paragraph, based on their evaluation of the controls and procedures required by Rule 30a-3(b) under the 1940 Act (17 CFR 270.30a-3(b)) and Rules 13a-15(b) or 15d-15(b) under the Securities Exchange Act of 1934, as amended (the “Exchange Act”) (17 CFR 240.13a-15(b) or 240.15d-15(b)). |
| (b) | There were no changes in the registrant’s internal control over financial reporting (as defined in Rule 30a-3(d) under the 1940 Act (17 CFR 270.30a-3(d)) that occurred during the second fiscal quarter of the period covered by this report that has materially affected, or is reasonably likely to materially affect, the registrant’s internal control over financial reporting. |
Item 12. Disclosure of Securities Lending Activities for Closed-End Management Investment Companies.
Not applicable.
Item 13. Exhibits.
File the exhibits listed below as part of this Form.
(a)(1) Any code of ethics, or amendment thereto, that is the subject of the disclosure required by Item 2, to the extent that the registrant intends to satisfy the Item 2 requirements through filing of an exhibit: Not applicable to this filing.
(a)(2) A separate certification for each principal executive officer and principal financial officer of the registrant as required by Rule 30a-2(a) under the 1940 Act (17 CFR 270.30a-2(a)) in the exact form set forth below: See EX-99.CERT attached hereto.
(a)(3) Any written solicitation to purchase securities under Rule 23c-1 under the 1940 Act (17 CFR 270.23c-1) sent or given during the period covered by the report by or on behalf of the registrant to 10 or more persons: Not applicable.
(b) If the report is filed under Section 13(a) or 15(d) of the Exchange Act, provide the certifications required by Rule 30a-2 (b) under the 1940 Act (17 CFR 270.30a-2(b)), Rule 13a-14(b) or Rule 15d-14(b) under the Exchange Act (17 CFR 240.13a-14(b) or 240.15d-14(b)), and Section 1350 of Chapter 63 of Title 18 of the United States Code (18 U.S.C. 1350) as an Exhibit. A certification furnished pursuant to this paragraph will not be deemed “filed” for purposes of Section 18 of the Exchange Act (15 U.S.C. 78r), or otherwise subject to the liability of that section. Such certification will not be deemed to be incorporated by reference into any filing under the Securities Act of 1933 or the Exchange Act, except to the extent that the registration specifically incorporates it by reference: See EX-99.906 CERT attached hereto.
SIGNATURES
Pursuant to the requirements of the Securities Exchange Act of 1934 and the Investment Company Act of 1940, the registrant has duly caused this report to be signed on its behalf by the undersigned, thereunto duly authorized.
(Registrant) Nuveen High Income November 2021 Target Term Fund
| | | | |
| By (Signature and Title) | | /s/ Gifford R. Zimmerman | | |
| | Gifford R. Zimmerman | | |
| | Vice President and Secretary | | |
Date: September 6, 2018
Pursuant to the requirements of the Securities Exchange Act of 1934 and the Investment Company Act of 1940, this report has been signed below by the following persons on behalf of the registrant and in the capacities and on the dates indicated.
| | | | |
| By (Signature and Title) | | /s/ Cedric H. Antosiewicz | | |
| | Cedric H. Antosiewicz | | |
| | Chief Administrative Officer | | |
| | (principal executive officer) | | |
Date: September 6, 2018
| | | | |
| By (Signature and Title) | | /s/ Stephen D. Foy | | |
| | Stephen D. Foy | | |
| | Vice President and Controller | | |
| | (principal financial officer) | | |
Date: September 6, 2018