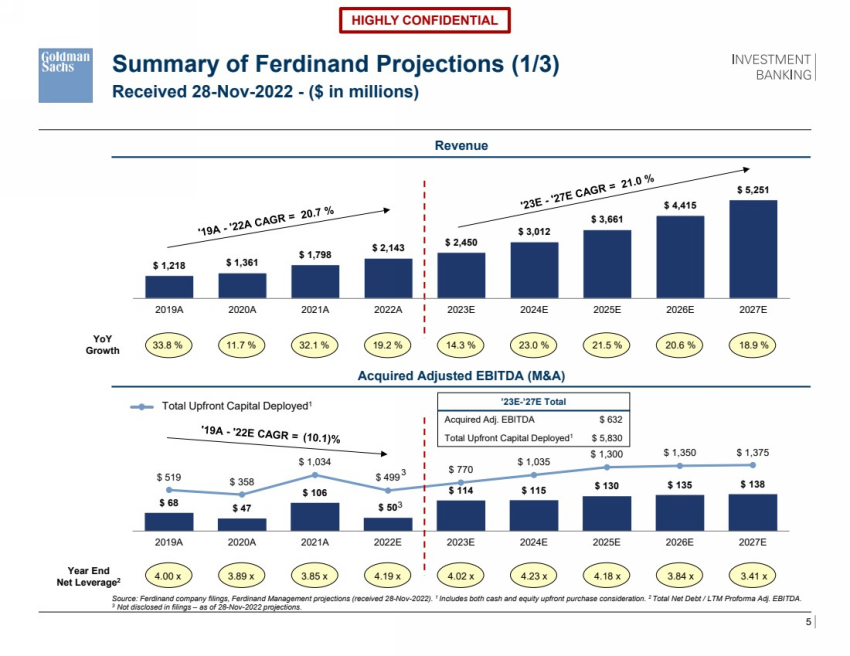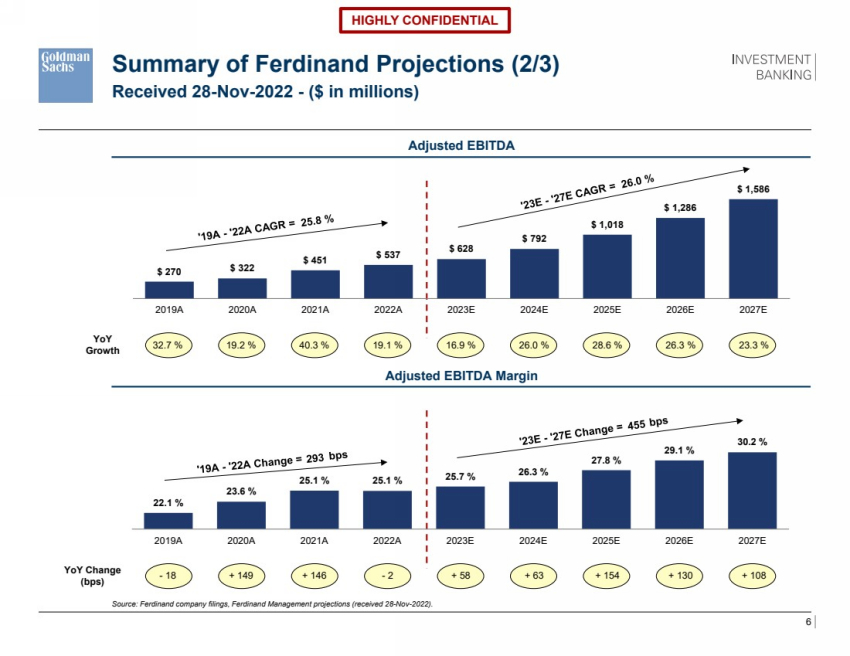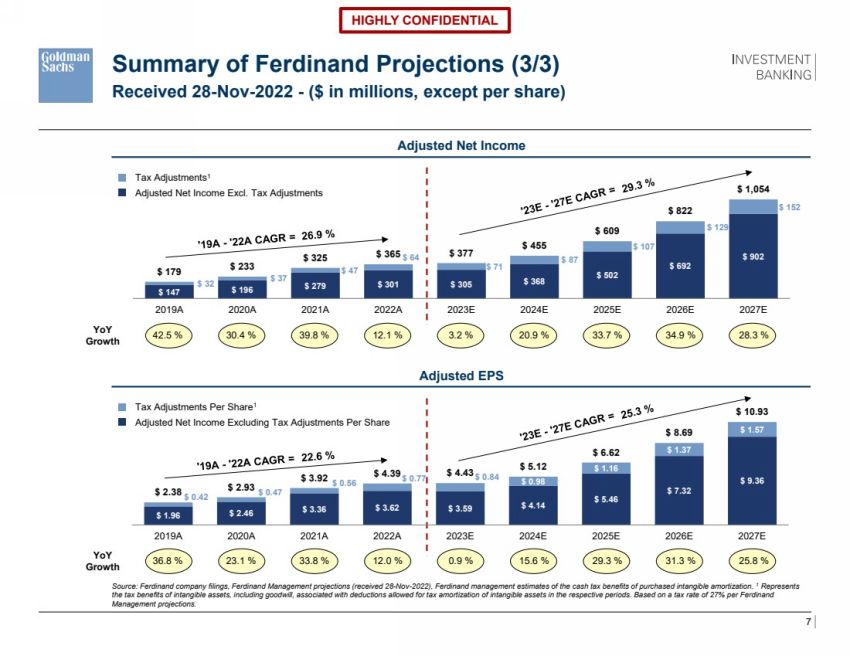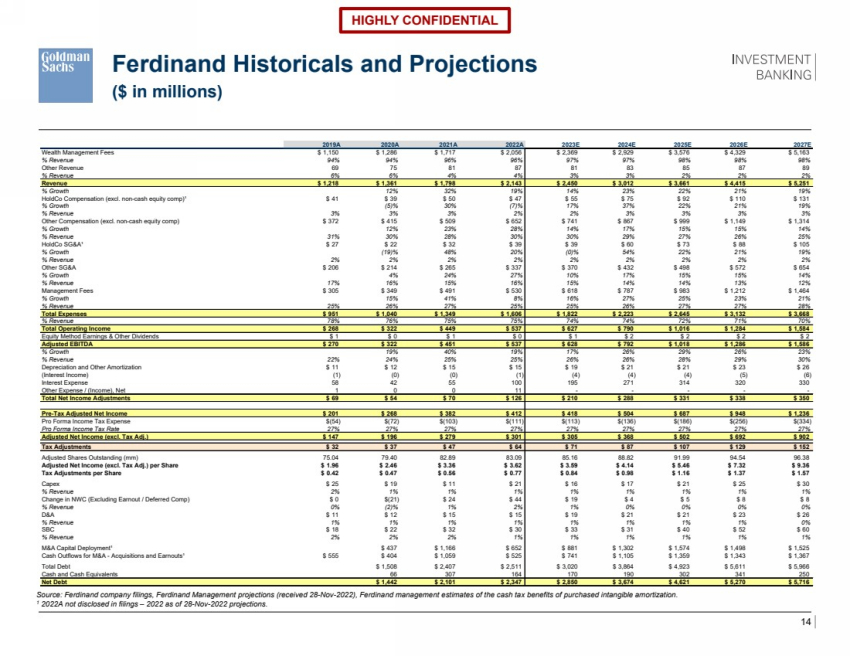
| 14 HIGHLY CONFIDENTIAL Ferdinand Historicals and Projections ($ in millions) Source: Ferdinand company filings, Ferdinand Management projections (received 28-Nov-2022), Ferdinand management estimates of the cash tax benefits of purchased intangible amortization. 1 2022A not disclosed in filings – 2022 as of 28-Nov-2022 projections. 2019A 2020A 2021A 2022A 2023E 2024E 2025E 2026E 2027E Wealth Management Fees $ 1,150 $ 1,286 $ 1,717 $ 2,056 $ 2,369 $ 2,929 $ 3,576 $ 4,329 $ 5,163 % Revenue 94% 94% 96% 96% 97% 97% 98% 98% 98% Other Revenue 69 75 81 87 81 83 85 87 89 % Revenue 6% 6% 4% 4% 3% 3% 2% 2% 2% Revenue $ 1,218 $ 1,361 $ 1,798 $ 2,143 $ 2,450 $ 3,012 $ 3,661 $ 4,415 $ 5,251 % Growth 12% 32% 19% 14% 23% 22% 21% 19% HoldCo Compensation (excl. non-cash equity comp)¹ $ 41 $ 39 $ 50 $ 47 $ 55 $ 75 $ 92 $ 110 $ 131 % Growth (5)% 30% (7)% 17% 37% 22% 21% 19% % Revenue 3% 3% 3% 2% 2% 3% 3% 3% 3% Other Compensation (excl. non-cash equity comp) $ 372 $ 415 $ 509 $ 652 $ 741 $ 867 $ 999 $ 1,149 $ 1,314 % Growth 12% 23% 28% 14% 17% 15% 15% 14% % Revenue 31% 30% 28% 30% 30% 29% 27% 26% 25% HoldCo SG&A¹ $ 27 $ 22 $ 32 $ 39 $ 39 $ 60 $ 73 $ 88 $ 105 % Growth (19)% 48% 20% (0)% 54% 22% 21% 19% % Revenue 2% 2% 2% 2% 2% 2% 2% 2% 2% Other SG&A $ 206 $ 214 $ 265 $ 337 $ 370 $ 432 $ 498 $ 572 $ 654 % Growth 4% 24% 27% 10% 17% 15% 15% 14% % Revenue 17% 16% 15% 16% 15% 14% 14% 13% 12% Management Fees $ 305 $ 349 $ 491 $ 530 $ 618 $ 787 $ 983 $ 1,212 $ 1,464 % Growth 15% 41% 8% 16% 27% 25% 23% 21% % Revenue 25% 26% 27% 25% 25% 26% 27% 27% 28% Total Expenses $ 951 $ 1,040 $ 1,349 $ 1,606 $ 1,822 $ 2,223 $ 2,645 $ 3,132 $ 3,668 % Revenue 78% 76% 75% 75% 74% 74% 72% 71% 70% Total Operating Income $ 268 $ 322 $ 449 $ 537 $ 627 $ 790 $ 1,016 $ 1,284 $ 1,584 Equity Method Earnings & Other Dividends $ 1 $ 0 $ 1 $ 0 $ 1 $ 2 $ 2 $ 2 $ 2 Adjusted EBITDA $ 270 $ 322 $ 451 $ 537 $ 628 $ 792 $ 1,018 $ 1,286 $ 1,586 % Growth 19% 40% 19% 17% 26% 29% 26% 23% % Revenue 22% 24% 25% 25% 26% 26% 28% 29% 30% Depreciation and Other Amortization $ 11 $ 12 $ 15 $ 15 $ 19 $ 21 $ 21 $ 23 $ 26 (Interest Income) (1) (0) (0) (1) (4) (4) (4) (5) (6) Interest Expense 58 42 55 100 195 271 314 320 330 Other Expense / (Income), Net 1 0 0 11 - - - - - Total Net Income Adjustments $ 69 $ 54 $ 70 $ 126 $ 210 $ 288 $ 331 $ 338 $ 350 Pre-Tax Adjusted Net Income $ 201 $ 268 $ 382 $ 412 $ 418 $ 504 $ 687 $ 948 $ 1,236 Pro Forma Income Tax Expense $(54) $(72) $(103) $(111) $(113) $(136) $(186) $(256) $(334) Pro Forma Income Tax Rate 27% 27% 27% 27% 27% 27% 27% 27% 27% Adjusted Net Income (excl. Tax Adj.) $ 147 $ 196 $ 279 $ 301 $ 305 $ 368 $ 502 $ 692 $ 902 Tax Adjustments $ 32 $ 37 $ 47 $ 64 $ 71 $ 87 $ 107 $ 129 $ 152 Adjusted Shares Outstanding (mm) 75.04 79.40 82.89 83.09 85.16 88.82 91.99 94.54 96.38 Adjusted Net Income (excl. Tax Adj.) per Share $ 1.96 $ 2.46 $ 3.36 $ 3.62 $ 3.59 $ 4.14 $ 5.46 $ 7.32 $ 9.36 Tax Adjustments per Share $ 0.42 $ 0.47 $ 0.56 $ 0.77 $ 0.84 $ 0.98 $ 1.16 $ 1.37 $ 1.57 Capex $ 25 $ 19 $ 11 $ 21 $ 16 $ 17 $ 21 $ 25 $ 30 % Revenue 2% 1% 1% 1% 1% 1% 1% 1% 1% Change in NWC (Excluding Earnout / Deferred Comp) $ 0 $(21) $ 24 $ 44 $ 19 $ 4 $ 5 $ 8 $ 8 % Revenue 0% (2)% 1% 2% 1% 0% 0% 0% 0% D&A $ 11 $ 12 $ 15 $ 15 $ 19 $ 21 $ 21 $ 23 $ 26 % Revenue 1% 1% 1% 1% 1% 1% 1% 1% 0% SBC $ 18 $ 22 $ 32 $ 30 $ 33 $ 31 $ 40 $ 52 $ 60 % Revenue 2% 2% 2% 1% 1% 1% 1% 1% 1% M&A Capital Deployment¹ $ 437 $ 1,166 $ 652 $ 881 $ 1,302 $ 1,574 $ 1,498 $ 1,525 Cash Outflows for M&A - Acquisitions and Earnouts¹ $ 555 $ 404 $ 1,059 $ 525 $ 741 $ 1,105 $ 1,359 $ 1,343 $ 1,367 Total Debt $ 1,508 $ 2,407 $ 2,511 $ 3,020 $ 3,864 $ 4,923 $ 5,611 $ 5,966 Cash and Cash Equivalents 66 307 164 170 190 302 341 250 Net Debt $ 1,442 $ 2,101 $ 2,347 $ 2,850 $ 3,674 $ 4,621 $ 5,270 $ 5,716 |