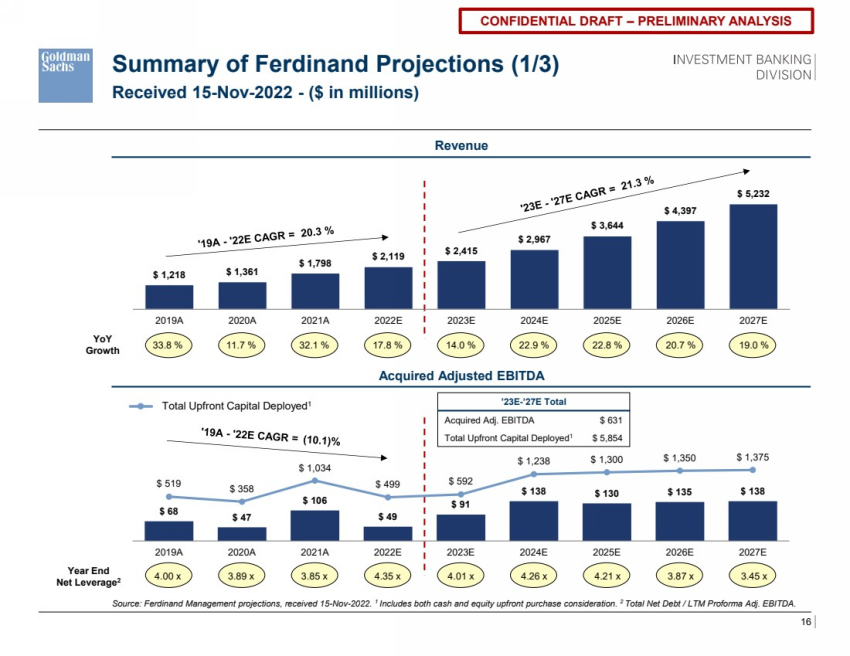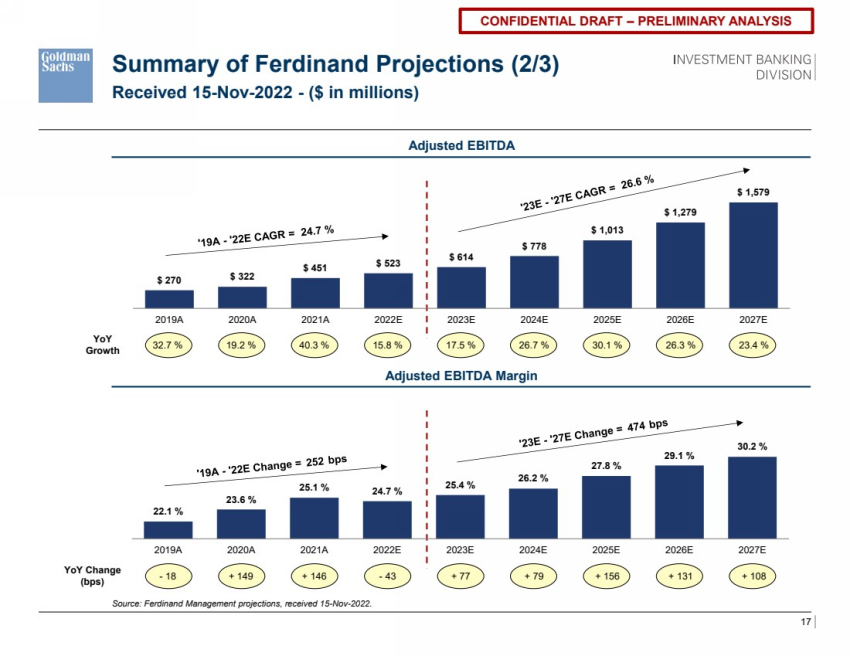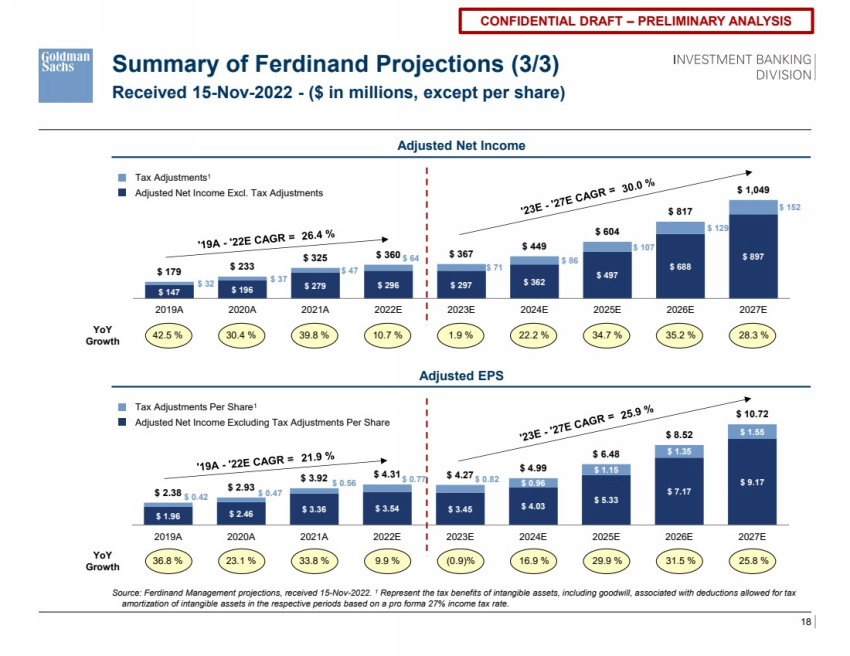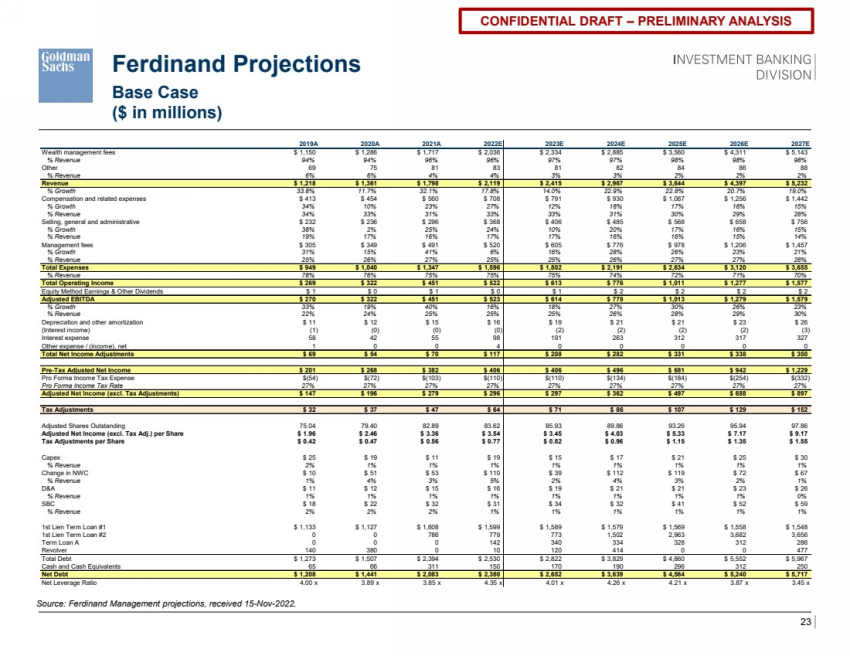
| 23 CONFIDENTIAL DRAFT – PRELIMINARY ANALYSIS Ferdinand Projections Base Case ($ in millions) Source: Ferdinand Management projections, received 15-Nov-2022. 2019A 2020A 2021A 2022E 2023E 2024E 2025E 2026E 2027E Wealth management fees $ 1,150 $ 1,286 $ 1,717 $ 2,036 $ 2,334 $ 2,885 $ 3,560 $ 4,311 $ 5,143 % Revenue 94% 94% 96% 96% 97% 97% 98% 98% 98% Other 69 75 81 83 81 82 84 86 88 % Revenue 6% 6% 4% 4% 3% 3% 2% 2% 2% Revenue $ 1,218 $ 1,361 $ 1,798 $ 2,119 $ 2,415 $ 2,967 $ 3,644 $ 4,397 $ 5,232 % Growth 33.8% 11.7% 32.1% 17.8% 14.0% 22.9% 22.8% 20.7% 19.0% Compensation and related expenses $ 413 $ 454 $ 560 $ 708 $ 791 $ 930 $ 1,087 $ 1,256 $ 1,442 % Growth 34% 10% 23% 27% 12% 18% 17% 16% 15% % Revenue 34% 33% 31% 33% 33% 31% 30% 29% 28% Selling, general and administrative $ 232 $ 236 $ 296 $ 368 $ 406 $ 485 $ 568 $ 658 $ 756 % Growth 38% 2% 25% 24% 10% 20% 17% 16% 15% % Revenue 19% 17% 16% 17% 17% 16% 16% 15% 14% Management fees $ 305 $ 349 $ 491 $ 520 $ 605 $ 776 $ 978 $ 1,206 $ 1,457 % Growth 31% 15% 41% 6% 16% 28% 26% 23% 21% % Revenue 25% 26% 27% 25% 25% 26% 27% 27% 28% Total Expenses $ 949 $ 1,040 $ 1,347 $ 1,596 $ 1,802 $ 2,191 $ 2,634 $ 3,120 $ 3,655 % Revenue 78% 76% 75% 75% 75% 74% 72% 71% 70% Total Operating Income $ 269 $ 322 $ 451 $ 522 $ 613 $ 776 $ 1,011 $ 1,277 $ 1,577 Equity Method Earnings & Other Dividends $ 1 $ 0 $ 1 $ 0 $ 1 $ 2 $ 2 $ 2 $ 2 Adjusted EBITDA $ 270 $ 322 $ 451 $ 523 $ 614 $ 778 $ 1,013 $ 1,279 $ 1,579 % Growth 33% 19% 40% 16% 18% 27% 30% 26% 23% % Revenue 22% 24% 25% 25% 25% 26% 28% 29% 30% Depreciation and other amortization $ 11 $ 12 $ 15 $ 16 $ 19 $ 21 $ 21 $ 23 $ 26 (Interest income) (1) (0) (0) (0) (2) (2) (2) (2) (3) Interest expense 58 42 55 98 191 263 312 317 327 Other expense / (income), net 1 0 0 4 0 0 0 0 0 Total Net Income Adjustments $ 69 $ 54 $ 70 $ 117 $ 208 $ 282 $ 331 $ 338 $ 350 Pre-Tax Adjusted Net Income $ 201 $ 268 $ 382 $ 406 $ 406 $ 496 $ 681 $ 942 $ 1,229 Pro Forma Income Tax Expense $(54) $(72) $(103) $(110) $(110) $(134) $(184) $(254) $(332) Pro Forma Income Tax Rate 27% 27% 27% 27% 27% 27% 27% 27% 27% Adjusted Net Income (excl. Tax Adjustments) $ 147 $ 196 $ 279 $ 296 $ 297 $ 362 $ 497 $ 688 $ 897 Tax Adjustments $ 32 $ 37 $ 47 $ 64 $ 71 $ 86 $ 107 $ 129 $ 152 Adjusted Shares Outstanding 75.04 79.40 82.89 83.62 85.93 89.86 93.26 95.94 97.86 Adjusted Net Income (excl. Tax Adj.) per Share $ 1.96 $ 2.46 $ 3.36 $ 3.54 $ 3.45 $ 4.03 $ 5.33 $ 7.17 $ 9.17 Tax Adjustments per Share $ 0.42 $ 0.47 $ 0.56 $ 0.77 $ 0.82 $ 0.96 $ 1.15 $ 1.35 $ 1.55 Capex $ 25 $ 19 $ 11 $ 19 $ 15 $ 17 $ 21 $ 25 $ 30 % Revenue 2% 1% 1% 1% 1% 1% 1% 1% 1% Change in NWC $ 10 $ 51 $ 53 $ 110 $ 39 $ 112 $ 119 $ 72 $ 67 % Revenue 1% 4% 3% 5% 2% 4% 3% 2% 1% D&A $ 11 $ 12 $ 15 $ 16 $ 19 $ 21 $ 21 $ 23 $ 26 % Revenue 1% 1% 1% 1% 1% 1% 1% 1% 0% SBC $ 18 $ 22 $ 32 $ 31 $ 34 $ 32 $ 41 $ 52 $ 59 % Revenue 2% 2% 2% 1% 1% 1% 1% 1% 1% 1st Lien Term Loan #1 $ 1,133 $ 1,127 $ 1,608 $ 1,599 $ 1,589 $ 1,579 $ 1,569 $ 1,558 $ 1,548 1st Lien Term Loan #2 0 0 786 779 773 1,502 2,963 3,682 3,656 Term Loan A 0 0 0 142 340 334 328 312 286 Revolver 140 380 0 10 120 414 0 0 477 Total Debt $ 1,273 $ 1,507 $ 2,394 $ 2,530 $ 2,822 $ 3,829 $ 4,860 $ 5,552 $ 5,967 Cash and Cash Equivalents 65 66 311 150 170 190 296 312 250 Net Debt $ 1,208 $ 1,441 $ 2,083 $ 2,380 $ 2,652 $ 3,639 $ 4,564 $ 5,240 $ 5,717 Net Leverage Ratio 4.00 x 3.89 x 3.85 x 4.35 x 4.01 x 4.26 x 4.21 x 3.87 x 3.45 x |