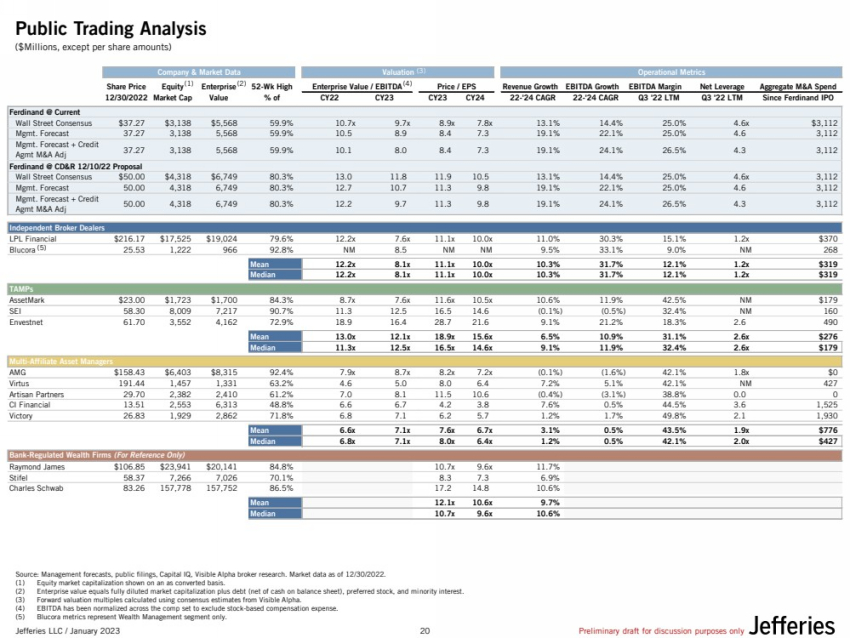
| Jefferies LLC / January 2023 Preliminary draft for discussion purposes only Company & Market Data Valuation Operational Metrics Share Price Equity Enterprise 52-Wk High Enterprise Value / EBITDA Price / EPS Revenue Growth EBITDA Growth EBITDA Margin Net Leverage Aggregate M&A Spend 12/30/2022 Market Cap Value % of CY22 CY23 CY23 CY24 22-'24 CAGR 22-'24 CAGR Q3 '22 LTM Q3 '22 LTM Since Ferdinand IPO Ferdinand @ Current Wall Street Consensus $37.27 $3,138 $5,568 59.9% 10.7x 9.7x 8.9x 7.8x 13.1% 14.4% 25.0% 4.6x $3,112 Mgmt. Forecast 37.27 3,138 5,568 59.9% 10.5 8.9 8.4 7.3 19.1% 22.1% 25.0% 4.6 3,112 37.27 3,138 5,568 59.9% 10.1 8.0 8.4 7.3 19.1% 24.1% 26.5% 4.3 3,112 Ferdinand @ CD&R 12/10/22 Proposal Wall Street Consensus $50.00 $4,318 $6,749 80.3% 13.0 11.8 11.9 10.5 13.1% 14.4% 25.0% 4.6x 3,112 Mgmt. Forecast 50.00 4,318 6,749 80.3% 12.7 10.7 11.3 9.8 19.1% 22.1% 25.0% 4.6 3,112 50.00 4,318 6,749 80.3% 12.2 9.7 11.3 9.8 19.1% 24.1% 26.5% 4.3 3,112 Independent Broker Dealers LPL Financial $216.17 $17,525 $19,024 79.6% 12.2x 7.6x 11.1x 10.0x 11.0% 30.3% 15.1% 1.2x $370 Blucora 25.53 1,222 966 92.8% NM 8.5 NM NM 9.5% 33.1% 9.0% NM 268 Mean 12.2x 8.1x 11.1x 10.0x 10.3% 31.7% 12.1% 1.2x $319 Median 12.2x 8.1x 11.1x 10.0x 10.3% 31.7% 12.1% 1.2x $319 TAMPs AssetMark $23.00 $1,723 $1,700 84.3% 8.7x 7.6x 11.6x 10.5x 10.6% 11.9% 42.5% NM $179 SEI 58.30 8,009 7,217 90.7% 11.3 12.5 16.5 14.6 (0.1%) (0.5%) 32.4% NM 160 Envestnet 61.70 3,552 4,162 72.9% 18.9 16.4 28.7 21.6 9.1% 21.2% 18.3% 2.6 490 Mean 13.0x 12.1x 18.9x 15.6x 6.5% 10.9% 31.1% 2.6x $276 Median 11.3x 12.5x 16.5x 14.6x 9.1% 11.9% 32.4% 2.6x $179 Multi-Affiliate Asset Managers AMG $158.43 $6,403 $8,315 92.4% 7.9x 8.7x 8.2x 7.2x (0.1%) (1.6%) 42.1% 1.8x $0 Virtus 191.44 1,457 1,331 63.2% 4.6 5.0 8.0 6.4 7.2% 5.1% 42.1% NM 427 Artisan Partners 29.70 2,382 2,410 61.2% 7.0 8.1 11.5 10.6 (0.4%) (3.1%) 38.8% 0.0 0 CI Financial 13.51 2,553 6,313 48.8% 6.6 6.7 4.2 3.8 7.6% 0.5% 44.5% 3.6 1,525 Victory 26.83 1,929 2,862 71.8% 6.8 7.1 6.2 5.7 1.2% 1.7% 49.8% 2.1 1,930 Mean 6.6x 7.1x 7.6x 6.7x 3.1% 0.5% 43.5% 1.9x $776 Median 6.8x 7.1x 8.0x 6.4x 1.2% 0.5% 42.1% 2.0x $427 Bank-Regulated Wealth Firms (For Reference Only) Raymond James $106.85 $23,941 $20,141 84.8% 10.7x 9.6x 11.7% Stifel 58.37 7,266 7,026 70.1% 8.3 7.3 6.9% Charles Schwab 83.26 157,778 157,752 86.5% 17.2 14.8 10.6% Mean 12.1x 10.6x 9.7% Median 10.7x 9.6x 10.6% Mgmt. Forecast + Credit Agmt M&A Adj Mgmt. Forecast + Credit Agmt M&A Adj Public Trading Analysis Source: Management forecasts, public filings, Capital IQ, Visible Alpha broker research. Market data as of 12/30/2022. (1) Equity market capitalization shown on an as converted basis. (2) Enterprise value equals fully diluted market capitalization plus debt (net of cash on balance sheet), preferred stock, and minority interest. (3) Forward valuation multiples calculated using consensus estimates from Visible Alpha. (4) EBITDA has been normalized across the comp set to exclude stock-based compensation expense. (5) Blucora metrics represent Wealth Management segment only. (1) (2) (3) (4) (5) ($Millions, except per share amounts) 20 |