SHAREHOLDER LETTER
Dear Shareholder,
We are pleased to provide the Gallery Trust annual report for the Mondrian Funds for the fiscal year ending October 31, 2019. Following an extended period of comparatively calm markets, the past 12 months have brought greater volatility driven by swings in geopolitical uncertainty and economic outlook. Following a sharply negative environment over the last two months of 2018, most equity and fixed income markets have been strongly positive YTD 2019 supported by dovish central banks around the globe. Mondrian’s commitment to our defensive value philosophy and process produced positive absolute returns for our Funds and we believe it continues to be the best approach for long-term success. Please see our portfolio managers’ discussions of the Funds’ performance in the pages that follow.
We would also like to highlight that this past December, the Gallery Trust Fund Family expanded through the launch of three Funds: Mondrian U.S. Small Cap Equity Fund (MPUSX), Mondrian Global Listed Infrastructure Fund (MGIFX), and the Rothko Emerging Markets Equity Fund (RKEMX). Mondrian has a long history of managing U.S. equity assets and small cap strategies. We also believe that listed infrastructure investments match well with our discounted cash flow analysis process. Rothko Investment Strategies is a separate investment division operating within Mondrian Investment Partners which uses fundamentally grounded rules in an actively managed systematic process. By expanding our mutual fund offerings to include U.S. Small Cap, Global Listed Infrastructure, and a systematic emerging market strategy, we continue to position ourselves to meet the growing needs of our clients.
For more information about the Mondrian Funds, please continue reading this report or visit http://www.mondrian.com/mutualfunds/. For the Rothko Emerging Markets Equity Fund, please refer to the Rothko Annual Report and www.rothko.com/mutualfunds. We would also be happy to speak with you at 888-832-4386.
Thank you,
Mondrian Investment Partners
PORTFOLIO PERFORMANCE REVIEW
Mondrian International Value Equity Fund
(all returns in U.S. dollars)
Twelve months ended October 31, 2019
Despite geopolitical and economic uncertainty, international equities generated positive returns over twelve months, supported by dovish central banks. Asia Pacific markets led European markets as political uncertainty weighed on the UK. Defensive sectors led returns as investors favoured safe havens amid increased economic uncertainty. Growth outperformed value as central banks committed to further monetary easing, which favours growth-oriented investments by potentially suppressing investors’ discount rates.
In a challenging period for value investors, the Mondrian International Value Equity Fund (the “Fund”) saw a return of 7.93% and exceeded the returns of the value sub-index whilst lagging the broader benchmark. The Fund was defensive in the very weak fourth quarter of 2018 and year-to-date has captured most but not all of the upside in very strong markets led by growth stocks.
Country allocation added to relative returns
Country allocation effects added to relative returns in Asia Pacific markets, led by the underweight position in Japan. The Japanese equity market lagged as economically-sensitive sectors were held back by increased global trade tensions, slowing growth and yen appreciation, while investors began to worry about October’s planned consumption tax hike. The Fund’s underweight position in Japan added to relative returns. The Australian equity market posted strong returns, supported by the unexpected re-election of the centre-right Liberal-National coalition, a spike in the iron ore price on supply concerns, and a cut in interest rates. The Fund’s underweight position in the market slightly weighed on relative returns. However, with household balance sheets stretched, house prices elevated and wage growth stagnant; we still have concerns over the medium-term outlook for the Australian economy.
European markets were held back by political uncertainty in the UK and Spain, while the German market lagged on stalling industrial production and the implementation of a new autos emissions testing regime. The Swiss equity market rose strongly, bolstered by gains from index heavyweights Nestlé and Roche. The UK equity market was held back by declines from stocks in the weak energy sector, as demand concerns led the oil price lower. The Fund’s overweight position in the UK market was broadly offset by the overweight position in the Italian market.
Stock selection held back relative returns, driven by holdings in the UK
Strong stock selection in Italy and Spain was more than offset by stock selection in the UK, where holdings of domestically-exposed stocks weighed on relative returns. Despite the ongoing political uncertainty, we continue to believe that the
PORTFOLIO PERFORMANCE REVIEW (continued)
skew of outcomes looks attractive for a basket of undervalued domestically-oriented UK stocks.
Fund relative returns were supported by the strong returns of Spanish utility Iberdrola, which was boosted by solid operational performance and a robust growth outlook, particularly in renewables and networks. Gains from Italian integrated utility Enel also supported relative returns, as the company published an updated strategic plan which anticipated sustained attractive dividend growth.
However, Fund relative returns were held back by the position in Wood Group, the UK engineering services company which was held back by weakness in the oil price and the broader oil and gas sector’s constrained state of capital investment. CK Hutchison, the Hong Kong listed conglomerate, was held back by a number of factors, including its exposure to the weak euro and British pound, and weak sentiment towards Hong Kong despite the group’s very limited exposure to Hong Kong itself. In Denmark, weak returns for ISS, the facilities services company, were driven by the loss of a contract with health care conglomerate Novartis and ongoing restructuring costs.
Sector allocation held back relative returns
The defensive utilities sector led returns as investors sought stocks with stable earnings profiles amid global growth concerns and geopolitical tensions. The sector also benefitted from the ongoing need for network investments and from monetization of renewable assets at attractive valuations. The energy sector was the weakest over twelve months as demand concerns more than offset supply tightening and drove oil price volatility. The Fund’s overweight position in the utilities sector was more than offset by the overweight position in the energy sector.
Stock selection within sectors held back relative returns, driven by stock selection in the consumer discretionary sector, which saw a divergence in returns between the outperforming luxury brands and the autos, which struggled following the new autos emissions testing regime, weak global sales data and China’s reintroduction of tariffs on US autos. The Fund’s exposure to autos held back relative returns. We continue to believe that selected auto-related stocks look cheap even with conservative assumptions which reflect the challenges faced by companies in the sector. This was partly offset by strong stock selection in the utilities sector, with positive returns from Iberdrola, Enel and SSE.
International currencies strengthened against the US dollar; currency allocation slightly added to relative investment returns
In a turbulent period for equity markets, the Japanese yen appreciated against the US dollar, and the Fund’s underweight position held back relative returns. This was more than offset, however, by the benefit from the underweight position in the weak Australian dollar.
PORTFOLIO PERFORMANCE REVIEW (continued)
Definition of Comparative Index
The MSCI EAFE (Europe, Australasia, Far East) Index is a free float-adjusted market capitalization index that is designed to measure the equity market performance of developed markets, excluding the U.S. & Canada.
PORTFOLIO PERFORMANCE REVIEW (continued)
Mondrian Emerging Markets Value Equity Fund
(all returns in U.S. dollars)
Twelve months ended October 31, 2019
Despite a volatile market environment, the MSCI Emerging Markets Index (“the Index”) recovered sharply from the weakness during 2018 to post a positive return of 11.9% in USD terms over the last twelve months ended October 31, 2019. Markets remained resilient during this period despite a clear escalation in global geo-political tensions. The US-China trade dispute continues to remain unresolved, and has resulted in the introduction of wide ranging tariffs and retaliatory counter measures from both governments. Given this backdrop, market volatility was also impacted by concerns over the outlook for global economic growth. The sustainability of tighter monetary policy was questioned and indeed the US Federal Reserve did reverse course and announced three separate interest rate cuts from July 2019 onwards. The last twelve months witnessed a pronounced divergence between the performance of value and growth stocks; as the value sub-index gained only 6.0% in comparison to an 18.0% return for the growth sub-index.
Although China remained the focal point for the majority of trade headlines, the Chinese market actually outperformed the index return posting a return of 12.9% demonstrating the domestic resilience of the market during this period. The majority of the other major Asian markets also outperformed, with the exception being Korea which only gained 5.2%. Both EMEA (Europe, the Middle East, and Africa) and Latin America underperformed the index return on a relative basis. EMEA was held back by the performance of South Africa, Turkey and the Middle East, despite Russia (+34.3%) being the best performing market in the Index. Mexico lagged within Latin America, and both Argentina and Chile suffered from political crises.
From a sector perspective, interest-rate sensitive utilities and real estate sectors outperformed, while materials and industrials reacted negatively to a weaker economic outlook. Health care was also weak, underperforming on drug pricing pressure and concerns over the regulatory outlook across several countries.
The Mondrian Emerging Markets Value Equity Fund (“the Fund”) narrowly underperformed the strong positive return of the MSCI Emerging Markets Index over the last twelve months. The Fund underperformed the broad index by 74 basis points but outperformed the value sub-index by approximately 480 basis points.
Top-down allocation contributed positively to investment returns
The Fund benefitted from positioning in EMEA and Latin America. Within EMEA relative returns were aided by zero exposure to the Middle Eastern markets of Qatar and Saudi Arabia, the latter of which was officially included in the Index for the first time during the course of the year. Equally in Latin America no exposure
PORTFOLIO PERFORMANCE REVIEW (continued)
to Argentina and Chile was a positive factor, and although overweight allocation to the outperforming Brazilian market supported relative returns, this impact was largely offset by the corresponding exposure to the depreciating Brazilian real. Top-down attribution in Asia was largely neutral, with the positive contribution from an overweight to allocation to India offset by overweight positioning in the weak Malaysian market.
Sector allocation detracted from relative returns
The Fund’s overweight to the materials sector was the primary detractor from relative sector returns. A further small negative contribution stemmed from the Fund’s overweight allocation to the weak health care sector however this was more than offset by very positive stock selection within the sector, led by the Fund’s Chinese health care names. Investment performance was supported by the underweight allocation to the communication services sector, which now contains a number of the Chinese internet related companies, as well as narrow overweight positioning in the consumer discretionary and information technology sectors which both strongly outperformed over the period.
Stock selection negative overall; held back significantly by Indiabulls Housing Finance
Stock selection in India was the key factor that weighed on the Fund’s investment performance, primarily due to the sharp decline in the share price of Indiabulls Housing Finance which fell heavily during the year and detracted approximately 270bps from relative returns by itself. The stock has endured allegations of misappropriation of public funds which were promptly withdrawn. Despite this, and the continued complete denial of wrongdoing by the company, these allegations resurfaced and the share price reacted very negatively after the Delhi High Court agreed to set a date to hear the claims later this year. Indiabulls aside, stock selection across the rest of the Fund was mostly positive, particularly in China and Taiwan. Chinese stock selection was driven by the outperformance of holdings in food group WH Group, white goods manufacturer Midea Group, life insurance provider Ping An Insurance, and health care name CSPC Pharmaceutical. In Taiwan, positive stock selection was driven by semiconductor names TSMC and ASE Technology given signs of improving semiconductor demand from 5G related activities. Elsewhere, REIT Fibra Uno recovered in anticipation of lower interest rates, and the share price of Russian energy producer Gazprom rose sharply following the declaration of an improved capital allocation policy for shareholders. Stock selection in Brazil was negative as aircraft manufacturer Embraer lagged following the announcement of the final terms of its upcoming merger with Boeing that disappointed market expectations. In South Africa, chemical producer Sasol underperformed following cost overruns at their US based ethane cracker project.
PORTFOLIO PERFORMANCE REVIEW (continued)
Investment Strategy
The Fund’s investment strategy focuses on stocks we believe are fundamentally undervalued with overweight positions to the attractively valued markets of China, India and Korea; as well as an overweight position in the financials, materials and health care sectors. The Fund holds an underweight allocation to the communication services sector, primarily driven by an underweight exposure to Chinese internet related companies, where valuations mostly remained challenged. The Fund also holds an underweight allocation to the energy sector, and underweight positioning in EMEA given unattractive risk adjusted valuations.
Definition of Comparative Index
The MSCI Emerging Markets Index is a free float-adjusted market capitalization index that is designed to measure equity market performance of emerging markets.
PORTFOLIO PERFORMANCE REVIEW (continued)
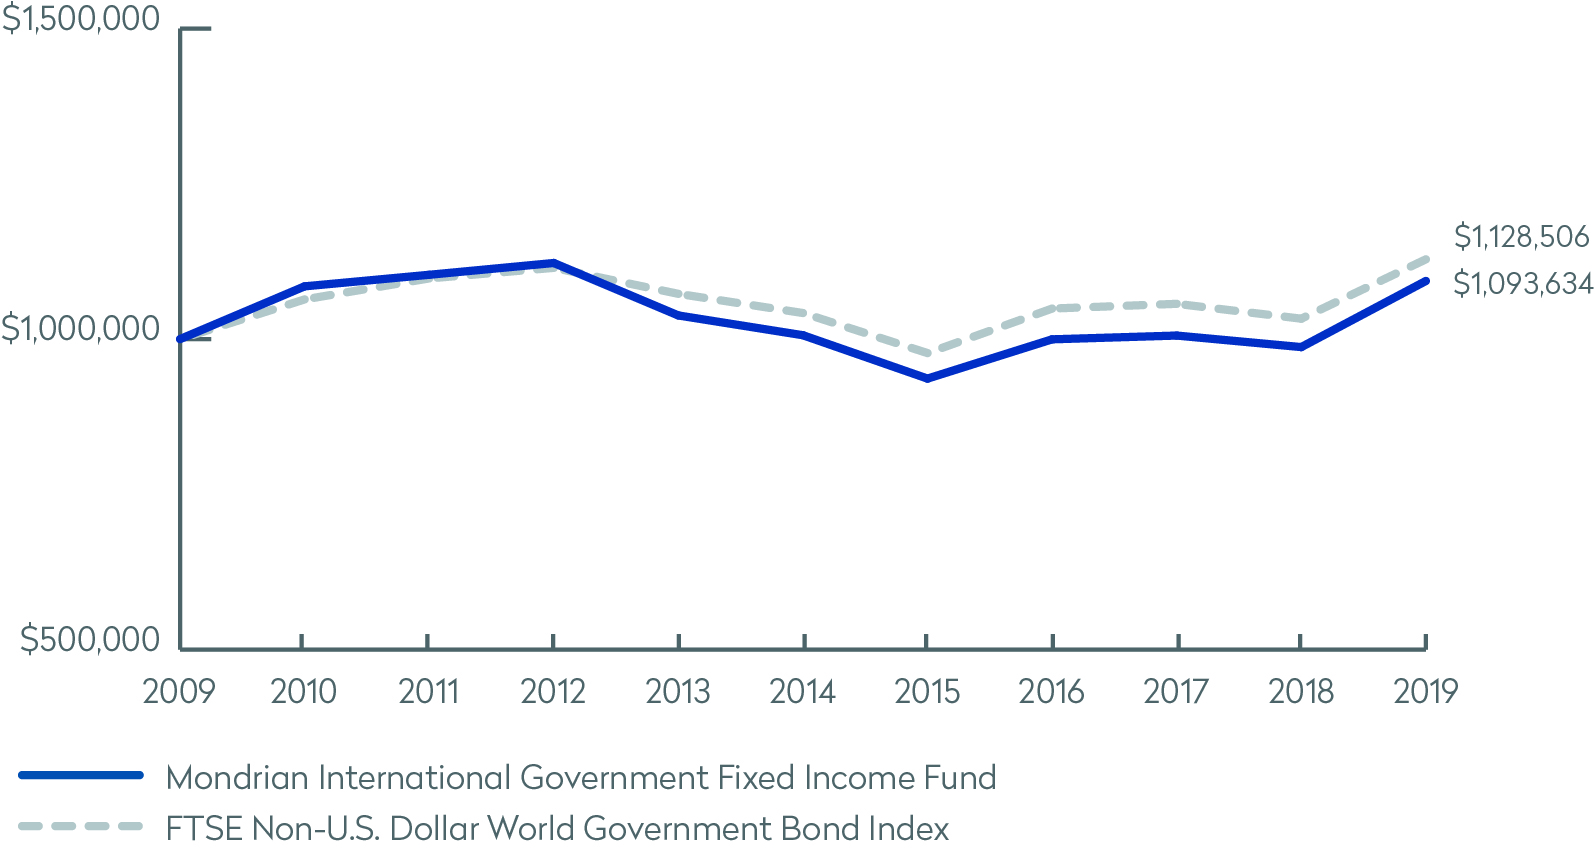
Mondrian International Government Fixed Income Fund
(all returns in U.S. dollars)
Twelve months ended October 31, 2019
The FTSE Non-U.S. Dollar World Government Bond Index was up 9.3% in U.S. dollar unhedged terms over the 12 months to October 31, 2019. The strongest performing markets were Mexico (up 26.9%) and the UK (up 13.0%). Mexico was strong over the period, as investors became more comfortable about the policies of the relatively new administration, following a period of heightened concern in late 2018. The weakest performing markets were Norway (down 5.2%) and Sweden (down 0.9%). The Swedish krona was weak over the year, as currency traders focused on relatively weak inflation out-turns over the period.
The Mondrian International Government Fixed Income Fund outperformed the benchmark by 1.5% in NAV terms, leaving it up 10.8% in absolute terms. Overweight positions to Mexico, to the British pound and to the Japanese yen benefitted performance. An overweight to Australia fully hedged also added to relative performance over the 12 month period. These positions were partially offset by the underweight positon to the relatively strong UK market.
The Fund maintains exposure to those countries where Prospective Real Yields are highest, such as Australia, New Zealand and Mexico. We continue to believe that selected currencies are extremely undervalued versus the U.S. dollar – the British pound and Swedish krona in particular, so maintain overweight positions to these currencies. We also deem international currencies to be undervalued versus the U.S. dollar on average, based on our Purchasing Power Parity analysis. The Fund continues to maintain a zero weight to corporate credit, as we deem corporate credit (and many other forms of credit) to be very overvalued versus treasuries, and are concerned about a number of potential catalysts that could lead to wider credit spreads going forward.
Definition of Comparative Index
The FTSE Non-U.S. Dollar World Government Bond Index (WGBI) measures the performance of fixed-rate, local currency, investment-grade sovereign bonds. The WGBI is a widely used benchmark that currently includes sovereign debt from over 20 countries, denominated in a variety of currencies, and has more than 30 years of history available. The WGBI provides a broad benchmark for the global sovereign fixed income market.
PORTFOLIO PERFORMANCE REVIEW (continued)
Mondrian U.S. Small Cap Equity Fund
(all returns in U.S. dollars)
Since Inception (December 17, 2018) ended October 31, 2019
The Russell 2000 Index gained 14.8% in the period December 17, 2018 to October 31, 2019. After rebounding strongly through January and February from the mid-December 2018 market weakness the benchmark trended sideways, although it exhibited volatility. Competing forces underlay the latter. On the upside was continued strength in the domestic economy. While friction within the global economy, due to the ongoing Sino-US trade tensions, weighed on the downside.
In December, slowing global economic growth suppressed yields of longer-dated treasuries. Concurrently the Federal Reserve raised its main policy tool – the Federal Funds rate. As a result the treasury yield curve approached an inversion, which was seen by some as an indication of a looming recession. Investors cut their exposure to equities as they adopted a risk-off stance, precipitating a marked decline. That position that was quickly reversed – the index gained 25.8% from trough to peak – after the Chinese government enacted stimulus measures and the Federal Reserve held interest rates flat at its January and March meetings. Growing expectations of trade resolution also positively influenced the market.
Prospects of a trade deal ebbed and flowed after and the yield curve inverted and then corrected. In October, tentative signs of a trade deal and improving leading economic indicators helped the market to once again return to the level it had reached in February.
From a sector perspective, the information technology sector delivered a stand-out return of 31.3%. Leading the sector was the semiconductors industry group, which was a particular beneficiary of the improved trade outlook given these companies often feature Sino-US cross-border supply chains. Rising 22.5%, Industrials was another sector that gained from the potential removal of tariffs. The energy sector was the notable underperformer, falling 23.9%. Aside from episodic strength arising due to supply disruptions, the oil price has reflected a supply demand misalignment, as evidenced by burgeoning US oil inventories.
The Mondrian U.S. Small Cap Equity Fund outperformed the benchmark index by 4.02%. Robust stock selection drove returns and was broad-based. Positive selector allocation bolstered performance. Contributions to stock selection from materials, energy, information technology and communication services were noteworthy. With the exception of materials, the Fund’s positioning relative to each of these sectors was positive. Holding back returns was stock selection within the health care, consumer discretionary and consumer staples sectors.
Definition of Comparative Index
The Russell 2000 Index is an unmanaged market index that measures the performance of the 2,000 smallest companies in the Russell 3000® Index.
PORTFOLIO PERFORMANCE REVIEW (continued)
Mondrian Global Listed Infrastructure Fund
(all returns in U.S. dollars)
Since Inception (December 17, 2018) ended October 31, 2019
After suffering sharp declines in the fourth quarter of 2018 due to macro-economic concerns, global equity markets rebounded strongly in the first half of 2019 and continued to edge higher through October. This can largely be attributed to more dovish central banks, optimism over a potential US-China trade settlement, and increased confidence that the US was not entering a recession.
Since inception in mid-December 2018 through to the end of October 2019 the Mondrian Global Listed Infrastructure Fund has achieved both a high absolute return and significant outperformance of the MSCI ACWI Core Infrastructure Index. This outperformance stems mainly from stock selection.
Mexican airport operator Grupo Aeroportuario del Centro Norte was the fund’s top performing investment during this period. Shares in the company had been hit hard in the market sell-off in the final quarter of 2018 and rebounded from low levels, helped by continued strong passenger growth. Also in Latin America, CCR, the Brazilian toll road operator, contributed strongly to the fund’s return, helped by a decline in Brazilian government bond yields and growing appreciation of opportunities for the company from the new government’s infrastructure policies. Although listed in the US, Kansas City Southern is a railroad operator with significant operations in Mexico where reform of energy markets is supporting volume growth. Furthermore, it has shown good progress in improving efficiency, leading to margin expansion and helping the shares rally.
BBA Aviation, the UK-listed business and general aviation fixed-base operator, announced that they would sell their Ontic business, which manufactures aircraft aftermarket parts and provides maintenance services, and return the proceeds to shareholders. This decision to focus on their core business and the price achieved were taken positively by the market, making the company a strong contributor to performance. Also in the UK, Pennon Group, a water utility, outperformed thanks to the diminished probability of a Labour government. The Labour party would like to nationalize water companies with uncertain compensation for existing shareholders.
Detracting from the Fund’s return was Jiangsu Expressway, the Chinese toll road operator. Moves by the government to accelerate electronic toll collection via increased discounts combined with more general fears over the strength of the Chinese economy to drive down its share price. These fears also weighed on the share price of Beijing Capital International Airport, but of greater negative impact was the Chinese government’s release of its slot allocation plan for the new Daxing Airport. This was more favourable to the new airport than expected. Subsequent to this announcement we sold the investment.
PORTFOLIO PERFORMANCE REVIEW (concluded)
Outside China, Naturgy, the Portuguese gas utility, saw its share price suffer when the regulator published proposals for lower-than-expected remuneration of gas networks. However, our recent meeting with the company confirmed that new management is focused on disciplined capital allocation, which should help unlock the value we see.
In the US, certain electric utility investments were a drag on performance. Investors in Edison International became spooked by news of wildfires in southern California. Despite a step-up in readiness and prevention efforts and new legislation that helps to reduce risks to shareholders, investors remain fearful of a repeat of the freak 2017 and 2018 fire seasons. Eversource Energy performed poorly in early 2019 as they announced an unexpected equity raise to fund their investment plans. We divested shortly after, investing the proceeds in Kansas City Southern (see above).
The Fund is positioned to take advantage of the particularly attractive risk-adjusted returns we find in infrastructure stocks in the UK and Europe and the electric utilities sector.
Definition of Comparative Index
The MSCI ACWI Core Infrastructure Index captures large and mid-cap securities across the 23 Developed Markets (DM) countries*. The Index is designed to represent the performance of listed companies within the developed markets that are engaged in core industrial infrastructure activities.
Growth of a $1,000,000 Investment
| | AVERAGE ANNUAL TOTAL RETURN
FOR THE YEAR ENDED OCTOBER 31, 2019* | |
| | 1 Year | 3 Years | 5 Years | 10 Years | |
| Mondrian International Value Equity Fund | 7.93% | 6.97% | 3.24% | 5.04% | |
| MSCI EAFE Index (Net) | 11.04% | 8.48% | 4.31% | 5.41% | |
| * | On March 14, 2016, The International Equity Portfolio, a series of Delaware Pooled Trust (the “International Equity Predecessor Fund”) was reorganized into the Mondrian International Equity Fund. Inception date of the Predecessor Fund was February 4, 1992. Information presented from February 4, 1992 to March 14, 2016 is that of the International Equity Predecessor Fund. |
The performance data quoted herein represents past performance and the return and value of an investment in the Fund will fluctuate so that, when redeemed, it may be worth less than its original cost. Past performance is no guarantee of future performance and should not be considered as a representation of the future results of the Fund. The Fund’s performance assumes the reinvestment of dividends and capital gains. Index returns assume reinvestment of dividends and, unlike a fund’s returns, do not reflect any fees or expenses. If such fees and expenses were included in the index returns, the performance would have been lower. Please note that one cannot invest directly in an unmanaged index.
There are no assurances that the Fund will meet its stated objectives. The Fund’s holdings and allocations are subject to change because it is actively managed and should not be considered recommendations to buy individual securities.
Returns shown do not reflect the deduction of taxes that a shareholder would pay on Fund distributions or the redemption of Fund shares. If the Adviser had not limited certain expenses, the Fund’s total return would have been lower.
See definition of the comparative index on page 4.
Growth of a $1,000,000 Investment
| | AVERAGE ANNUAL TOTAL RETURN
FOR THE YEAR ENDED OCTOBER 31, 2019* | |
| | 1 Year | 3 Years | 5 Years | 10 Years | |
| Mondrian Emerging Markets Value Equity Fund | 11.12% | 4.92% | -0.47% | 1.74% | |
| MSCI Emerging Markets Index (Net) | 11.86% | 7.36% | 2.93% | 3.78% | |
| * | On September 24, 2018, the Laudus Mondrian Emerging Markets Fund (the “Emerging Markets Predecessor Fund”) was reorganized into the Mondrian Emerging Markets Equity Fund. Inception date of the Emerging Markets Predecessor Fund was November 2, 2007. Information presented from November 2, 2007 to September 24, 2018 is that of the Emerging Markets Predecessor Fund. |
The performance data quoted herein represents past performance and the return and value of an investment in the Fund will fluctuate so that, when redeemed, it may be worth less than its original cost. Past performance is no guarantee of future performance and should not be considered as a representation of the future results of the Fund. The Fund’s performance assumes the reinvestment of dividends and capital gains. Index returns assume reinvestment of dividends and, unlike a fund’s returns, do not reflect any fees or expenses. If such fees and expenses were included in the index returns, the performance would have been lower. Please note that one cannot invest directly in an unmanaged index.
There are no assurances that the Fund will meet its stated objectives. The Fund’s holdings and allocations are subject to change because it is actively managed and should not be considered recommendations to buy individual securities.
Returns shown do not reflect the deduction of taxes that a shareholder would pay on Fund distributions or the redemption of Fund shares. If the Adviser had not limited certain expenses, the Fund’s total return would have been lower.
See definition of the comparative index on page 7.
Growth of a $1,000,000 Investment
| | AVERAGE ANNUAL TOTAL RETURN
FOR THE YEAR ENDED OCTOBER 31, 2019* | |
| | 1 Year | 3 Years | 5 Years | 10 Years | |
| Mondrian International Government Fixed Income Fund | 10.79% | 3.04% | 1.68% | 0.90% | |
| FTSE Non-U.S. Dollar World Government Bond Index | 9.25% | 2.46% | 1.61% | 1.22% | |
| * | On September 24, 2018, the Laudus Mondrian International Government Fixed Income Fund (the “Fixed Income Predecessor Fund”) was reorganized into the Mondrian International Government Fixed Income Fund. Inception date of the Fixed Income Predecessor Fund was November 2, 2007. Information presented from November 2, 2007 to September 24, 2018 is that of the Fixed Income Predecessor Fund. |
The performance data quoted herein represents past performance and the return and value of an investment in the Fund will fluctuate so that, when redeemed, it may be worth less than its original cost. Past performance is no guarantee of future performance and should not be considered as a representation of the future results of the Fund. The Fund’s performance assumes the reinvestment of dividends and capital gains. Index returns assume reinvestment of dividends and, unlike a fund’s returns, do not reflect any fees or expenses. If such fees and expenses were included in the index returns, the performance would have been lower. Please note that one cannot invest directly in an unmanaged index.
There are no assurances that the Fund will meet its stated objectives. The Fund’s holdings and allocations are subject to change because it is actively managed and should not be considered recommendations to buy individual securities.
Returns shown do not reflect the deduction of taxes that a shareholder would pay on Fund distributions or the redemption of Fund shares. If the Adviser had not limited certain expenses, the Fund’s total return would have been lower.
See definition of the comparative index on page 8.
Growth of a $1,000,000 Investment
| | TOTAL RETURN
FOR THE PERIOD ENDED OCTOBER 31, 2019 | |
| | Cumulative Inception to Date* | |
| Mondrian U.S. Small Cap Equity Fund | 18.80% | |
| Russell 2000 Index | 14.78% | |
| * | The fund commenced operations on December 17, 2018. |
The performance data quoted herein represents past performance and the return and value of an investment in the Fund will fluctuate so that, when redeemed, it may be worth less than its original cost. Past performance is no guarantee of future performance and should not be considered as a representation of the future results of the Fund. The Fund’s performance assumes the reinvestment of dividends and capital gains. Index returns assume reinvestment of dividends and, unlike a fund’s returns, do not reflect any fees or expenses. If such fees and expenses were included in the index returns, the performance would have been lower. Please note that one cannot invest directly in an unmanaged index.
There are no assurances that the Fund will meet its stated objectives. The Fund’s holdings and allocations are subject to change because it is actively managed and should not be considered recommendations to buy individual securities.
Returns shown do not reflect the deduction of taxes that a shareholder would pay on Fund distributions or the redemption of Fund shares. If the Adviser had not limited certain expenses, the Fund’s total return would have been lower.
See definition of the comparative index on page 9.
Growth of a $1,000,000 Investment
| | TOTAL RETURN
FOR THE PERIOD ENDED OCTOBER 31, 2019 | |
| | Cumulative Inception to Date* | |
| Mondrian Global Listed Infrastructure Fund | 21.49% | |
| MSCI ACWI Core Infrastructure Index | 17.79% | |
| * | The fund commenced operations on December 17, 2018. |
The performance data quoted herein represents past performance and the return and value of an investment in the Fund will fluctuate so that, when redeemed, it may be worth less than its original cost. Past performance is no guarantee of future performance and should not be considered as a representation of the future results of the Fund. The Fund’s performance assumes the reinvestment of dividends and capital gains. Index returns assume reinvestment of dividends and, unlike a fund’s returns, do not reflect any fees or expenses. If such fees and expenses were included in the index returns, the performance would have been lower. Please note that one cannot invest directly in an unmanaged index.
There are no assurances that the Fund will meet its stated objectives. The Fund’s holdings and allocations are subject to change because it is actively managed and should not be considered recommendations to buy individual securities.
Returns shown do not reflect the deduction of taxes that a shareholder would pay on Fund distributions or the redemption of Fund shares. If the Adviser had not limited certain expenses, the Fund’s total return would have been lower.
See definition of the comparative index on page 11.
| SCHEDULE OF INVESTMENTS |
Sector Weightings† (unaudited): |
† Percentages based on total investments. |
| COMMON STOCK — 98.7% | | | | | | |
| | | | | | | |
| AUSTRALIA — 1.2% | | | | | | |
QBE Insurance Group Ltd | | | 846,170 | | | | | |
| Total Australia | | | | | | | | |
| | | | | | | | | |
| CHINA — 1.7% | | | | | | | | |
China Mobile Ltd | | | 1,236,500 | | | | | |
| Total China | | | | | | | | |
| | | | | | | | | |
| DENMARK — 1.7% | | | | | | | | |
ISS A/S | | | 401,919 | | | | | |
| Total Denmark | | | | | | | | |
| | | | | | | | | |
| FRANCE — 7.0% | | | | | | | | |
Cie de Saint-Gobain SA | | | 423,009 | | | | 17,205,882 | |
Sanofi SA | | | 172,264 | | | | 15,873,449 | |
Societe Generale SA | | | 329,681 | | | | | |
| Total France | | | | | | | | |
| | | | | | | | | |
The accompanying notes are an integral part of the financial statements.
| COMMON STOCK — continued | | | | | | | | |
| | | | | | | |
| GERMANY — 10.6% | | | | | | | | |
Allianz SE | | | 64,356 | | | $ | 15,718,994 | |
Continental AG | | | 99,118 | | | | 13,252,287 | |
Daimler AG | | | 244,555 | | | | 14,294,938 | |
Deutsche Telekom AG | | | 641,588 | | | | 11,282,996 | |
Evonik Industries AG | | | 373,088 | | | | | |
| Total Germany | | | | | | | | |
| | | | | | | | | |
| HONG KONG — 5.9% | | | | | | | | |
CK Hutchison Holdings Ltd | | | 1,904,500 | | | | 17,620,869 | |
Jardine Matheson Holdings Ltd | | | 85,015 | | | | 4,856,057 | |
WH Group Ltd | | | 12,758,000 | | | | | |
| Total Hong Kong | | | | | | | | |
| | | | | | | | | |
| ITALY — 4.7% | | | | | | | | |
Enel SpA | | | 1,739,963 | | | | 13,467,626 | |
Eni SpA | | | 988,108 | | | | | |
| Total Italy | | | | | | | | |
| | | | | | | | | |
| JAPAN — 24.8% | | | | | | | | |
| Coca-Cola Bottlers Japan Holdings Inc | | | 496,000 | | | | 11,330,975 | |
FUJIFILM Holdings Corp | | | 345,700 | | | | 15,301,843 | |
Fujitsu Ltd | | | 115,300 | | | | 10,272,260 | |
Honda Motor Co Ltd | | | 561,300 | | | | 15,291,644 | |
Isuzu Motors Ltd | | | 452,200 | | | | 5,307,561 | |
Kyocera Corp | | | 191,200 | | | | 12,645,156 | |
Mitsubishi Electric Corp | | | 752,200 | | | | 10,841,738 | |
| Nippon Telegraph & Telephone Corp | | | 157,000 | | | | 7,815,835 | |
Otsuka Holdings Co Ltd | | | 252,400 | | | | 10,606,456 | |
Secom Co Ltd | | | 37,000 | | | | 3,448,514 | |
Sekisui Chemical Co Ltd | | | 509,600 | | | | 8,961,296 | |
| Sumitomo Electric Industries Ltd | | | 605,100 | | | | 8,385,333 | |
Takeda Pharmaceutical Co Ltd | | | 464,100 | | | | 16,881,052 | |
Tokio Marine Holdings Inc | | | 245,352 | | | | | |
| Total Japan | | | | | | | | |
The accompanying notes are an integral part of the financial statements.
| COMMON STOCK — continued | | | | | | | | |
| | | | | | | |
| NETHERLANDS — 3.5% | | | | | | | | |
Ahold Delhaize NV | | | 164,445 | | | $ | 4,094,527 | |
Royal Dutch Shell PLC Class B^ | | | 597,720 | | | | | |
| Total Netherlands | | | | | | | | |
| | | | | | | | | |
| SINGAPORE — 4.4% | | | | | | | | |
| Singapore Telecommunications Ltd | | | 3,235,002 | | | | 7,847,041 | |
United Overseas Bank Ltd | | | 945,040 | | | | | |
| Total Singapore | | | | | | | | |
| | | | | | | | | |
| SPAIN — 2.8% | | | | | | | | |
Banco Santander SA | | | 3,820,426 | | | | 15,313,746 | |
Iberdrola SA | | | 137,256 | | | | | |
| Total Spain | | | | | | | | |
| | | | | | | | | |
| SWEDEN — 2.6% | | | | | | | | |
Telia Co AB | | | 3,659,421 | | | | | |
| Total Sweden | | | | | | | | |
| | | | | | | | | |
| SWITZERLAND — 5.5% | | | | | | | | |
ABB Ltd | | | 670,157 | | | | 14,055,295 | |
Novartis AG | | | 129,780 | | | | 11,325,657 | |
Zurich Insurance Group AG | | | 21,131 | | | | | |
| Total Switzerland | | | | | | | | |
| | | | | | | | | |
| TAIWAN — 1.6% | | | | | | | | |
| Taiwan Semiconductor Manufacturing Co Ltd | | | 764,000 | | | | 7,491,795 | |
| Taiwan Semiconductor Manufacturing Co Ltd ADR | | | 48,317 | | | | | |
| Total Taiwan | | | | | | | | |
| | | | | | | | | |
| UNITED KINGDOM — 20.7% | | | | | | | | |
BP PLC | | | 1,870,567 | | | | 11,855,962 | |
G4S PLC | | | 3,443,450 | | | | 9,224,284 | |
GlaxoSmithKline PLC | | | 723,169 | | | | 16,567,529 | |
John Wood Group PLC | | | 1,325,561 | | | | 5,808,848 | |
Kingfisher PLC | | | 4,007,521 | | | | 10,756,077 | |
The accompanying notes are an integral part of the financial statements.
| COMMON STOCK — continued | | | | | | | | |
| | | | | | | |
| UNITED KINGDOM — continued | | | | | | | | |
Lloyds Banking Group PLC | | | 23,401,663 | | | $ | 17,218,027 | |
National Grid PLC | | | 471,397 | | | | 5,503,570 | |
SSE PLC | | | 1,072,330 | | | | 17,828,412 | |
Tesco PLC | | | 4,763,737 | | | | 14,513,542 | |
Travis Perkins PLC | | | 254,416 | | | | 4,722,576 | |
WPP PLC | | | 938,642 | | | | | |
| Total United Kingdom | | | | | | | | |
| | | | | | | | | |
| Total Common Stock | | | | | | | | |
(Cost $596,022,962) | | | | | | | | |
| | | | | | | | | |
| PREFERRED STOCK — 0.2% | | | | | | | | |
| | | | | | | | | |
| GERMANY — 0.2% | | | | | | | | |
| Bayerische Motoren Werke AG, 4.66% | | | 13,304 | | | | | |
| | | | | | | | | |
| Total Preferred Stock | | | | | | | | |
(Cost $963,310) | | | | | | | | |
| Total Value of Securities — 98.9% | | | | | | | | |
(Cost $596,986,272) | | | | | | | | |
Percentages are based on Net Assets of $607,301,863.
| ^ | Security traded on the London Stock Exchange. |
ADR — American Depositary Receipt
Ltd. — Limited
PLC — Public Limited Company
As of October 31, 2019, all of the Fund’s investments were considered Level 1, in accordance with the authoritative guidance on fair value measurements and disclosure under U.S. GAAP.
For the year ended October 31, 2019, there were no transfers in or out of Level 3.
For more information on valuation inputs, see Note 2 in Notes to Financial Statements.
The accompanying notes are an integral part of the financial statements.
| SCHEDULE OF INVESTMENTS |
Sector Weightings (unaudited)†: |
† Percentages based on total investments. |
| COMMON STOCK — 98.6% | | | | | | |
| | | | | | | |
| BRAZIL — 8.5% | | | | | | |
Embraer SA ADR | | | 60,222 | | | $ | 1,046,056 | |
Hypera SA * | | | 138,300 | | | | 1,186,956 | |
Itau Unibanco Holding SA ADR | | | 127,172 | | | | 1,148,363 | |
Suzano Papel e Celulose SA | | | 83,000 | | | | | |
| Total Brazil | | | | | | | | |
| | | | | | | | | |
| CHINA — 29.3% | | | | | | | | |
| Alibaba Group Holding Ltd ADR * | | | 9,223 | | | | 1,629,427 | |
| Brilliance China Automotive Holdings Ltd | | | 254,000 | | | | 281,360 | |
| China Medical System Holdings Ltd | | | 609,000 | | | | 828,481 | |
China Merchants Bank Class H | | | 363,000 | | | | 1,737,186 | |
China Mobile Ltd | | | 134,000 | | | | 1,091,023 | |
CSPC Pharmaceutical Group | | | 600,000 | | | | 1,542,889 | |
| Hengan International Group Co Ltd | | | 91,500 | | | | 639,897 | |
Midea Group Co Ltd Class A | | | 152,203 | | | | 1,200,680 | |
NetEase ADR | | | 3,385 | | | | 967,636 | |
| Ping An Insurance Group Co of China Ltd Class H | | | 233,500 | | | | 2,704,219 | |
The accompanying notes are an integral part of the financial statements.
| COMMON STOCK — continued | | | | | | | | |
| | | | | | | |
| CHINA — continued | | | | | | | | |
SAIC Motor Corp Ltd Class A | | | 131,610 | | | $ | 439,610 | |
| Tingyi Cayman Islands Holding Corp Class H | | | 650,000 | | | | | |
| Total China | | | | | | | | |
| | | | | | | | | |
| HONG KONG — 5.7% | | | | | | | | |
Sands China Ltd | | | 250,800 | | | | 1,240,245 | |
WH Group Ltd | | | 1,390,500 | | | | | |
| Total Hong Kong | | | | | | | | |
| | | | | | | | | |
| INDIA — 11.5% | | | | | | | | |
Bajaj Auto Ltd | | | 13,979 | | | | 640,004 | |
HCL Technologies Ltd | | | 64,199 | | | | 1,052,428 | |
| Housing Development Finance Corp Ltd | | | 17,988 | | | | 540,664 | |
Indiabulls Housing Finance Ltd | | | 149,300 | | | | 434,984 | |
Infosys Ltd Sponsored ADR | | | 74,435 | | | | 713,831 | |
Larsen & Toubro Ltd GDR | | | 21,866 | | | | 454,113 | |
Lupin Ltd | | | 58,388 | | | | 613,361 | |
Vedanta Ltd | | | 492,701 | | | | | |
| Total India | | | | | | | | |
| | | | | | | | | |
| INDONESIA — 1.5% | | | | | | | | |
| Bank Rakyat Indonesia Persero Tbk PT | | | 2,297,900 | | | | | |
| Total Indonesia | | | | | | | | |
| | | | | | | | | |
| MALAYSIA — 2.7% | | | | | | | | |
Genting Malaysia Bhd | | | 606,000 | | | | 465,540 | |
Malayan Banking Bhd | | | 385,045 | | | | | |
| Total Malaysia | | | | | | | | |
| | | | | | | | | |
| MEXICO — 3.3% | | | | | | | | |
| Fibra Uno Administracion SA de CV REIT | | | 693,444 | | | | 1,054,054 | |
| Grupo Financiero Banorte SAB de CV Class O | | | 90,967 | | | | | |
| Total Mexico | | | | | | | | |
| | | | | | | | | |
The accompanying notes are an integral part of the financial statements.
| COMMON STOCK — continued | | | | | | | | |
| | | | | | | |
| PERU — 0.9% | | | | | | | | |
Credicorp Ltd | | | 1,980 | | | | | |
| Total Peru | | | | | | | | |
| | | | | | | | | |
| RUSSIA — 5.0% | | | | | | | | |
Gazprom PJSC ADR | | | 180,124 | | | | 1,443,244 | |
LUKOIL PJSC ADR | | | 10,240 | | | | | |
| Total Russia | | | | | | | | |
| | | | | | | | | |
| SOUTH AFRICA — 3.5% | | | | | | | | |
Mondi | | | 54,082 | | | | 1,119,134 | |
Sasol Ltd | | | 28,745 | | | | | |
| Total South Africa | | | | | | | | |
| | | | | | | | | |
| SOUTH KOREA — 12.8% | | | | | | | | |
Korea Zinc Co Ltd | | | 730 | | | | 272,624 | |
LG Chem Ltd | | | 6,270 | | | | 1,657,162 | |
Samsung Electronics Co Ltd | | | 17,587 | | | | 761,859 | |
| Samsung Electronics Co Ltd GDR | | | 1,578 | | | | 1,708,952 | |
| Samsung Fire & Marine Insurance Co Ltd | | | 3,050 | | | | 567,558 | |
Shinhan Financial Group Co Ltd | | | 30,944 | | | | | |
| Total South Korea | | | | | | | | |
| | | | | | | | | |
| TAIWAN — 11.0% | | | | | | | | |
| ASE Technology Holding Co Ltd | | | 390,000 | | | | 1,018,544 | |
CTBC Financial Holding | | | 1,014,000 | | | | 706,191 | |
Mega Financial Holding Co Ltd | | | 469,000 | | | | 460,672 | |
| Taiwan Semiconductor Manufacturing Co Ltd ADR | | | 59,046 | | | | | |
| Total Taiwan | | | | | | | | |
| | | | | | | | | |
| THAILAND — 1.3% | | | | | | | | |
Kasikornbank PCL NVDR | | | 131,400 | | | | | |
| Total Thailand | | | | | | | | |
The accompanying notes are an integral part of the financial statements.
| COMMON STOCK — continued | | | | | | | | |
| | | | | | | |
| UNITED ARAB EMIRATES — 1.2% | | | | | | | | |
First Abu Dhabi Bank PJSC | | | 138,118 | | | | | |
| Total United Arab Emirates | | | | | | | | |
| | | | | | | | | |
| UNITED KINGDOM — 0.4% | | | | | | | | |
Anglo American PLC | | | 7,468 | | | | | |
| Total United Kingdom | | | | | | | | |
| | | | | | | | | |
| Total Common Stock | | | | | | | | |
(Cost $45,230,466) | | | | | | | | |
| | | | | | | | | |
| PREFERRED STOCK — 1.0% | | | | | | | | |
| | | | | | | | | |
| SOUTH KOREA — 1.0% | | | | | | | | |
Samsung Electronics Co Ltd** | | | 12,779 | | | | | |
| | | | | | | | | |
| Total Preferred Stock | | | | | | | | |
(Cost $398,164) | | | | | | | | |
| Total Value of Securities — 99.6% | | | | | | | | |
(Cost $45,628,630) | | | | | | | | |
Percentages are based on Net Assets of $47,496,389.
| * | Non-income producing security. |
| ** | There is currently no rate available. |
ADR — American Depositary Receipt
GDR — Global Depositary Receipt
Ltd. — Limited
NVDR — Non-Voting Depositary Receipt
PJSC — Public Joint Stock Company
PLC — Public Limited Company
REIT — Real Estate Investment Trust
As of October 31, 2019, all of the Fund’s investments were considered Level 1, in accordance with the authoritative guidance on fair value measurements and disclosure under U.S. GAAP.
For the year ended October 31, 2019, there were no transfers in or out of Level 3.
For more information on valuation inputs, see Note 2 in Notes to Financial Statements.
The accompanying notes are an integral part of the financial statements.
| SCHEDULE OF INVESTMENTS |
Sector Weightings† (unaudited): |
† Percentages based on total investments. |
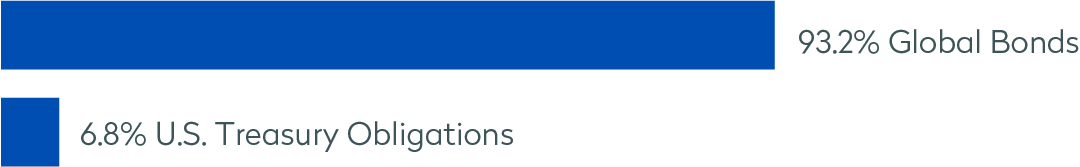
| GLOBAL BONDS — 91.7% | | | | | | | |
| Face Amount (Local Currency) | | | | |
| AUSTRALIA — 4.0% | | | | | | | |
| Australia Government Bond | | | | | | | |
5.750%, 05/15/21 | AUD | | | 155,000 | | | $ | 114,790 | |
4.750%, 04/21/27 | AUD | | | 480,000 | | | | 418,695 | |
3.250%, 04/21/25 | AUD | | | 325,000 | | | | 251,816 | |
3.000%, 03/21/47 | AUD | | | 385,000 | | | | | |
| Total Australia | | | | | | | | | |
| | | | | | | | | | |
| AUSTRIA — 4.7% | | | | | | | | | |
| Republic of Austria Government Bond | | | | | | | | | |
6.250%, 07/15/27 | EUR | | | 785,000 | | | | | |
| Total Austria | | | | | | | | | |
| | | | | | | | | | |
| BELGIUM — 4.1% | | | | | | | | | |
| Kingdom of Belgium Government Bond | | | | | | | | | |
1.000%, 06/22/26 (A) | EUR | | | 950,000 | | | | | |
| Total Belgium | | | | | | | | | |
| | | | | | | | | | |
| CANADA — 2.1% | | | | | | | | | |
| Canadian Government Bond | | | | | | | | | |
5.000%, 06/01/37 | CAD | | | 224,000 | | | | 259,208 | |
1.500%, 06/01/26 | CAD | | | 200,000 | | | | 152,651 | |
0.750%, 09/01/21 | CAD | | | 224,000 | | | | | |
| Total Canada | | | | | | | | | |
| | | | | | | | | | |
| FINLAND — 4.6% | | | | | | | | | |
| Finland Government Bond | | | | | | | | | |
0.500%, 09/15/27 (A) | EUR | | | 1,099,000 | | | | | |
| Total Finland | | | | | | | | | |
The accompanying notes are an integral part of the financial statements.
| GLOBAL BONDS — continued | | | | | | | | | |
| Face Amount (Local Currency) | | | | |
| FRANCE — 2.7% | | | | | | | | | |
| French Republic Government Bond OAT | | | | | | | | | |
1.500%, 05/25/31 | EUR | | | 300,000 | | | $ | 393,319 | |
0.500%, 05/25/25 | EUR | | | 315,000 | | | | | |
| Total France | | | | | | | | | |
| | | | | | | | | | |
| GERMANY — 4.9% | | | | | | | | | |
| Bundesrepublik Deutschland Bundesanleihe | | | | | | | | | |
2.500%, 07/04/44 | EUR | | | 100,000 | | | | 180,167 | |
| Kreditanstalt fuer Wiederaufbau | | | | | | | | | |
2.050%, 02/16/26 | JPY | | | 112,000,000 | | | | | |
| Total Germany | | | | | | | | | |
| | | | | | | | | | |
| ITALY — 10.7% | | | | | | | | | |
| Italy Buoni Poliennali Del Tesoro | | | | | | | | | |
4.750%, 09/01/44 (A) | EUR | | | 100,000 | | | | 173,988 | |
2.950%, 09/01/38 (A) | EUR | | | 500,000 | | | | 673,710 | |
2.000%, 02/01/28 | EUR | | | 850,000 | | | | 1,043,185 | |
1.450%, 05/15/25 | EUR | | | 308,000 | | | | 362,165 | |
0.050%, 04/15/21 | EUR | | | 685,000 | | | | | |
| Total Italy | | | | | | | | | |
| | | | | | | | | | |
| JAPAN — 18.7% | | | | | | | | | |
| Japan Government Thirty Year Bond | | | | | | | | | |
2.400%, 12/20/34 | JPY | | | 110,000,000 | | | | 1,373,436 | |
0.300%, 06/20/46 | JPY | | | 80,000,000 | | | | 731,609 | |
| Japan Government Twenty Year Bond | | | | | | | | | |
1.600%, 06/20/30 | JPY | | | 175,000,000 | | | | 1,914,775 | |
0.200%, 06/20/36 | JPY | | | 131,400,000 | | | | | |
| Total Japan | | | | | | | | | |
| | | | | | | | | | |
| MALAYSIA — 2.0% | | | | | | | | | |
| Malaysia Government Bond | | | | | | | | | |
4.254%, 05/31/35 | MYR | | | 900,000 | | | | 227,379 | |
4.181%, 07/15/24 | MYR | | | 1,350,000 | | | | | |
| Total Malaysia | | | | | | | | | |
The accompanying notes are an integral part of the financial statements.
| GLOBAL BONDS — continued | | | | | | | | | |
| Face Amount (Local Currency) | | | | |
| MEXICO — 3.1% | | | | | | | | | |
| Mexican Bonos | | | | | | | | | |
8.500%, 11/18/38 | MXN | | | 1,263,000 | | | $ | 75,303 | |
8.000%, 11/07/47 | MXN | | | 12,000,000 | | | | 686,900 | |
7.750%, 11/23/34 | MXN | | | 1,750,000 | | | | | |
| Total Mexico | | | | | | | | | |
| | | | | | | | | | |
| NETHERLANDS — 4.6% | | | | | | | | | |
| Netherlands Government Bond | | | | | | | | | |
5.500%, 01/15/28 | EUR | | | 250,000 | | | | 415,339 | |
2.750%, 01/15/47 (A) | EUR | | | 250,000 | | | | 474,946 | |
0.500%, 01/15/40 (A) | EUR | | | 250,000 | | | | 302,074 | |
0.250%, 07/15/29 (A) | EUR | | | 100,000 | | | | | |
| Total Netherlands | | | | | | | | | |
| | | | | | | | | | |
| NEW ZEALAND — 8.0% | | | | | | | | | |
| New Zealand Government Bond | | | | | | | | | |
5.500%, 04/15/23 | NZD | | | 975,000 | | | | 722,126 | |
4.500%, 04/15/27 | NZD | | | 1,000,000 | | | | 792,268 | |
2.750%, 04/15/37 | NZD | | | 986,000 | | | | | |
| Total New Zealand | | | | | | | | | |
| | | | | | | | | | |
| SUPRANATIONAL — 13.4% | | | | | | | | | |
| Asian Development Bank | | | | | | | | | |
2.350%, 06/21/27 | JPY | | | 110,000,000 | | | | 1,231,090 | |
| European Financial Stability Facility | | | | | | | | | |
0.950%, 02/14/28 | EUR | | | 1,100,000 | | | | 1,341,121 | |
| European Investment Bank | | | | | | | | | |
2.150%, 01/18/27 | JPY | | | 109,000,000 | | | | | |
| Total Supranational | | | | | | | | | |
| | | | | | | | | | |
| UNITED KINGDOM — 4.1% | | | | | | | | | |
| United Kingdom Gilt | | | | | | | | | |
4.500%, 09/07/34 | GBP | | | 200,000 | | | | 390,273 | |
The accompanying notes are an integral part of the financial statements.
| GLOBAL BONDS — continued | | | | | | | | | |
| Face Amount (Local Currency) | | | | |
| UNITED KINGDOM — continued | | | | | | | | | |
4.250%, 09/07/39 | GBP | | | 370,000 | | | | | |
| Total United Kingdom | | | | | | | | | |
| | | | | | | | | | |
| Total Global Bonds | | | | | | | | | |
(Cost $24,172,887) | | | | | | | | | |
| | | | | | | | | | |
| U.S. TREASURY OBLIGATIONS — 6.7% | | | | | | | | | |
| | | | | | | | | | |
| United States Treasury Bond | | | | | | | | | |
2.750%, 08/15/42 | $ | |
| 575,000 | | | $ | 637,846 | |
| United States Treasury Notes | | | | | | | | | |
1.625%, 02/15/26 | | | | 1,125,000 | | | | 1,126,933 | |
1.250%, 03/31/21 | | | | 119,800 | | | | | |
| | | | | | | | | | |
| Total U.S. Treasury Obligations | | | | | | | | | |
(Cost $1,682,855) | | | | | | | | | |
| Total Value of Securities — 98.4% | | | | | | | | | |
(Cost $25,855,742) | | | | | | | | | |
A list of the open forward foreign currency exchange contracts held by the Fund at October 31, 2019 is as follows:
| Counterparty | Maturity Date | Currency to Deliver | | Currency to Receive | | | Unrealized
Appreciation
(Depreciation) | |
| Brown Brothers Harriman | 01/31/20 | EUR | | | 113,000 | | USD | | | 126,897 | | | $ | 50 | |
| Brown Brothers Harriman | 01/31/20 | USD | | | 1,817,250 | | EUR | | | 1,627,500 | | | | 9,691 | |
| Brown Brothers Harriman | 01/31/20 | USD | | | 2,513,526 | | GBP | | | 1,948,500 | | | | 18,096 | |
| Brown Brothers Harriman | 01/31/20 | USD | | | 382,490 | | JPY | | | 41,382,000 | | | | 3,124 | |
| Brown Brothers Harriman | 01/31/20 | USD | | | 840,404 | | SEK | | | 8,135,500 | | | | 6,628 | |
| Brown Brothers Harriman | 01/31/20 | NZD | | | 3,506,000 | | USD | | | 2,229,308 | | | | (22,310 | ) |
| Brown Brothers Harriman | 01/31/20 | AUD | | | 1,629,500 | | USD | | | 1,119,972 | | | | | |
| Net Unrealized Appreciation on Forward Foreign Currency Exchange Contracts | | | | | |
The accompanying notes are an integral part of the financial statements.
Percentages are based on Net Assets of $28,117,086.
| (A) | Securities sold within terms of a private placement memorandum, exempt from registration under Section 144A of the Securities Act of 1933, as amended, and may be sold only to dealers in that program or other “accredited investors.” The total value of securities as of October 31, 2019 was $4,197,832 and represents 14.9% of Net Assets. |
AUD — Australian Dollar
CAD — Canadian Dollar
EUR — Euro
GBP — Pound Sterling
JPY — Japanese Yen
MXN — Mexican Peso
MYR — Malaysian Ringgit
NZD — New Zealand Dollar
SEK — Swedish Krona
USD — United States Dollar
The following is a list of the inputs used as of October 31, 2019, in valuing the Fund’s investments carried at market value:
| Investments in Securities | | Level 1 | | | Level 2 | | | Level 3 | | | Total | |
| Global Bonds | | $ | — | | | $ | 25,791,479 | | | $ | — | | | $ | 25,791,479 | |
| U.S. Treasury Obligations | | | | | | | | | | | | | | | | |
| Total Investments in Securities | | | | | | | | | | | | | | | | |
| Other Financial Instruments | | Level 1 | | | Level 2 | | | Level 3 | | | Total | |
| Forward Contracts* | | | | | | | | | | | | |
| Unrealized Appreciation | | $ | — | | | $ | 37,589 | | | $ | — | | | $ | 37,589 | |
| Unrealized Depreciation | | | | | | | | | | | | | | | | |
| Total Other Financial Instruments | | | | | | | | | | | | | | | | |
| * | Forward foreign currency exchange contracts are valued at the unrealized appreciation (depreciation) on the instrument. |
For the year ended October 31, 2019, there were no transfers in or out of Level 3.
Amounts designated as “—” are $0 or have been rounded to $0.
For more information on valuation inputs, see Note 2 in Notes to Financial Statements.
The accompanying notes are an integral part of the financial statements.
| SCHEDULE OF INVESTMENTS |
Sector Weightings† (unaudited): |
† Percentages based on total investments. |
| COMMON STOCK — 100.8% | | | | | | |
| | | | | | | |
| UNITED STATES — 100.8% | | | | | | |
| Communication Services — 2.9% | | | | | | |
National CineMedia Inc | | | 5,076 | | | | | |
| | | | | | | | | |
| Consumer Discretionary — 3.1% | | | | | | | | |
Cedar Fair LP | | | 824 | | | | | |
| | | | | | | | | |
| Consumer Staples — 1.7% | | | | | | | | |
Cal-Maine Foods Inc * | | | 654 | | | | | |
| | | | | | | | | |
| Energy — 2.3% | | | | | | | | |
Green Plains Partners LP | | | 2,538 | | | | | |
| | | | | | | | | |
| Financials — 3.3% | | | | | | | | |
Moelis Class A | | | 1,389 | | | | | |
| | | | | | | | | |
| Health Care — 13.3% | | | | | | | | |
Acadia Healthcare Co Inc * | | | 1,281 | | | | 38,417 | |
AMN Healthcare Services Inc * | | | 798 | | | | 46,890 | |
| Computer Programs & Systems Inc | | | 1,058 | | | | 24,408 | |
iRadimed Corp * | | | 1,402 | | | | 35,401 | |
Meridian Bioscience Inc * | | | 1,509 | | | | 14,773 | |
Tivity Health Inc * | | | 2,361 | | | | | |
| | | | | | | | | |
The accompanying notes are an integral part of the financial statements.
| COMMON STOCK — continued | | | | | | | | |
| | | | | | | |
| UNITED STATES — continued | | | | | | | | |
| Industrials — 35.9% | | | | | | | | |
AAR Corp | | | 1,117 | | | $ | 46,635 | |
Astronics Corp * | | | 1,303 | | | | 37,709 | |
Barnes Group Inc | | | 855 | | | | 49,975 | |
Donaldson Co Inc | | | 744 | | | | 39,239 | |
Douglas Dynamics Inc | | | 770 | | | | 36,059 | |
EnerSys | | | 607 | | | | 40,584 | |
Graco Inc | | | 296 | | | | 13,379 | |
Luxfer Holdings PLC | | | 2,693 | | | | 45,404 | |
McGrath RentCorp | | | 149 | | | | 11,370 | |
Regal Beloit | | | 520 | | | | 38,506 | |
SP Plus Corp * | | | 814 | | | | 35,954 | |
Tetra Tech Inc | | | 444 | | | | 38,837 | |
Timken Company | | | 722 | | | | 35,378 | |
Triumph Group Inc | | | 947 | | | | 19,669 | |
US Ecology Inc | | | 711 | | | | | |
| | | | | | | | | |
| Information Technology — 16.5% | | | | | | | | |
Cabot Microelectronics Corp | | | 289 | | | | 43,674 | |
| Comtech Telecommunications Corp | | | 1,070 | | | | 37,396 | |
FLIR Systems Inc | | | 786 | | | | 40,526 | |
MAXIMUS Inc | | | 513 | | | | 39,368 | |
NIC Inc | | | 1,818 | | | | 42,759 | |
Vishay Intertechnology Inc | | | 2,065 | | | | | |
| | | | | | | | | |
| Materials — 12.9% | | | | | | | | |
AptarGroup Inc | | | 213 | | | | 25,166 | |
Greif Inc Class A | | | 983 | | | | 38,504 | |
Innospec Inc | | | 533 | | | | 48,695 | |
PH Glatfelter Co | | | 2,306 | | | | 41,508 | |
PolyOne Corp | | | 1,163 | | | | | |
| | | | | | | | | |
The accompanying notes are an integral part of the financial statements.
| COMMON STOCK — continued | | | | | | | | |
| | | | | | | |
| UNITED STATES — continued | | | | | | | | |
| Real Estate — 8.9% | | | | | | | | |
| American Campus Communities Inc REIT | | | 831 | | | $ | 41,533 | |
| Landmark Infrastructure Partners LP | | | 2,450 | | | | 44,639 | |
Outfront Media Inc REIT | | | 1,726 | | | | | |
| | | | | | | | | |
| | | | | | | | | |
| Total Common Stock | | | | | | | | |
(Cost $1,320,994) | | | | | | | | |
| Total Value of Securities — 100.8% | | | | | | | | |
(Cost $1,320,994) | | | | | | | | |
Percentages are based on Net Assets of $1,485,312.
| * | Non-income producing security. |
L.P. — Limited Partnership
PLC — Public Limited Company
REIT — Real Estate Investment Trust
As of October 31, 2019, all of the Fund’s investments were considered Level 1, in accordance with the authoritative guidance on fair value measurements and disclosure under U.S. GAAP.
For the period ended October 31, 2019, there were no transfers in or out of Level 3.
For more information on valuation inputs, see Note 2 in Notes to Financial Statements.
The accompanying notes are an integral part of the financial statements.
| SCHEDULE OF INVESTMENTS |
Sector Weightings† (unaudited): |
† Percentages based on total investments. |
| COMMON STOCK — 101.5% | | | | | | |
| | | | | | | |
| BRAZIL — 3.0% | | | | | | |
CCR SA | | | 10,800 | | | | | |
| Total Brazil | | | | | | | | |
| | | | | | | | | |
| CANADA — 8.7% | | | | | | | | |
Emera Inc | | | 1,499 | | | | 62,061 | |
Enbridge Inc | | | 1,921 | | | | | |
| Total Canada | | | | | | | | |
| | | | | | | | | |
| CHINA — 2.8% | | | | | | | | |
| Jiangsu Expressway Co Ltd Class H | | | 32,000 | | | | | |
| Total China | | | | | | | | |
| | | | | | | | | |
| FRANCE — 4.6% | | | | | | | | |
Veolia Environnement SA | | | 2,676 | | | | | |
| Total France | | | | | | | | |
| | | | | | | | | |
| GERMANY — 3.9% | | | | | | | | |
| Fraport AG Frankfurt Airport Services Worldwide | | | 712 | | | | | |
| Total Germany | | | | | | | | |
| | | | | | | | | |
| INDIA — 3.3% | | | | | | | | |
Power Grid Corp of India Ltd | | | 18,022 | | | | | |
| Total India | | | | | | | | |
The accompanying notes are an integral part of the financial statements.
| COMMON STOCK — continued | | | | | | | | |
| | | | | | | |
| ITALY — 8.7% | | | | | | | | |
Atlantia SpA | | | 2,754 | | | $ | 68,004 | |
Snam SpA | | | 12,416 | | | | | |
| Total Italy | | | | | | | | |
| | | | | | | | | |
| JAPAN — 4.6% | | | | | | | | |
West Japan Railway Co | | | 800 | | | | | |
| Total Japan | | | | | | | | |
| | | | | | | | | |
| MEXICO — 3.2% | | | | | | | | |
| Grupo Aeroportuario del Centro Norte SAB de CV Class B | | | 7,065 | | | | | |
| Total Mexico | | | | | | | | |
| | | | | | | | | |
| PORTUGAL — 3.9% | | | | | | | | |
EDP - Energias de Portugal SA | | | 14,191 | | | | | |
| Total Portugal | | | | | | | | |
| | | | | | | | | |
| SPAIN — 4.7% | | | | | | | | |
Naturgy Energy Group SA | | | 2,643 | | | | | |
| Total Spain | | | | | | | | |
| | | | | | | | | |
| UNITED ARAB EMIRATES — 3.1% | | | | | | | | |
DP World PLC | | | 3,591 | | | | | |
| Total United Arab Emirates | | | | | | | | |
| | | | | | | | | |
| UNITED KINGDOM — 15.7% | | | | | | | | |
BBA Aviation PLC | | | 16,012 | | | | 62,970 | |
National Grid PLC | | | 5,017 | | | | 58,573 | |
Pennon Group PLC | | | 5,180 | | | | 60,269 | |
SSE PLC | | | 3,425 | | | | | |
| Total United Kingdom | | | | | | | | |
The accompanying notes are an integral part of the financial statements.
| COMMON STOCK — continued | | | | | | | | |
| | | | | | | |
| UNITED STATES — 31.3% | | | | | | | | |
| Industrials — 4.0% | | | | | | | | |
Kansas City Southern | | | 430 | | | | | |
| | | | | | | | | |
| Utilities — 27.3% | | | | | | | | |
Dominion Energy | | | 756 | | | | 62,408 | |
Duke Energy Corp | | | 738 | | | | 69,564 | |
Edison International | | | 867 | | | | 54,534 | |
Evergy Inc | | | 829 | | | | 52,981 | |
PPL Corp | | | 1,932 | | | | 64,703 | |
Southern Co/The | | | 920 | | | | 57,647 | |
Xcel Energy Inc | | | 831 | | | | | |
| | | | | | | | | |
| Total United States | | | | | | | | |
| | | | | | | | | |
| Total Common Stock | | | | | | | | |
(Cost $1,357,347) | | | | | | | | |
| | | | | | | | | |
| Total Value of Securities — 101.5% | | | | | | | | |
(Cost $1,357,347) | | | | | | | | |
Percentages are based on Net Assets of $1,518,889.
Ltd. — Limited
PLC — Public Limited Company
As of October 31, 2019, all of the Fund’s investments were considered Level 1, in accordance with the authoritative guidance on fair value measurements and disclosure under U.S. GAAP
For the period ended October 31, 2019, there were no transfers in or out of Level 3.
For more information on valuation inputs, see Note 2 in Notes to Financial Statements.
The accompanying notes are an integral part of the financial statements.
| STATEMENTS OF ASSETS AND LIABILITIES | |
| | | Mondrian International Value Equity Fund | | | Mondrian Emerging Markets Value Equity Fund | | | Mondrian International Government Fixed Income Fund | |
| Assets: | | | | | | | | | |
| Investments (Cost $596,986,272, $45,628,630 and $25,855,742) | | $ | 600,347,551 | | | $ | 47,286,499 | | | $ | 27,675,487 | |
Foreign currency (Cost $210,082, $127,336 and $631) | | | 213,636 | | | | 127,364 | | | | 638 | |
Cash | | | 1,870,952 | | | | 484,347 | | | | 305,522 | |
Reclaims receivable | | | 2,690,816 | | | | 917 | | | | — | |
| Dividends and interest receivable | | | 2,436,847 | | | | 57,233 | | | | 159,425 | |
| Receivable for capital shares sold | | | 361,405 | | | | 19 | | | | 263 | |
| Unrealized appreciation on forward foreign currency contracts | | | — | | | | — | | | | 37,589 | |
| Receivable for investment securities sold | | | — | | | | 299,792 | | | | — | |
Prepaid expenses | | | | | | | | | | | | |
Total assets | | | | | | | | | | | | |
| Liabilities: | | | | | | | | | | | | |
| Payable due to Investment Adviser | | | 286,629 | | | | 45,673 | | | | 5,769 | |
| Payable for capital shares redeemed | | | 260,730 | | | | — | | | | 1,361 | |
| Payable due to Administrator | | | 51,275 | | | | 3,994 | | | | 2,442 | |
Audit fees payable | | | 12,200 | | | | 12,200 | | | | 13,300 | |
| Chief Compliance Officer fees payable | | | 5,234 | | | | 411 | | | | 259 | |
Payable due to Trustees | | | 95 | | | | 7 | | | | 5 | |
| Payable for investment securities purchased | | | — | | | | 650,031 | | | | — | |
| Unrealized depreciation on forward foreign currency contracts | | | — | | | | — | | | | 28,231 | |
| Unrealized depreciation on spot foreign currency contracts | | | — | | | | 549 | | | | — | |
| Accrued foreign capital gains tax | | | — | | | | 6,754 | | | | — | |
Other accrued expenses | | | | | | | | | | | | |
Total liabilities | | | | | | | | | | | | |
Net assets | | | | | | | | | | | | |
| | | | | | | | | | | | | |
| Net assets consist of: | | | | | | | | | | | | |
Paid-in capital | | $ | 576,989,568 | | | $ | 153,755,543 | | | $ | 27,803,915 | |
| Total distributable earnings/(loss) | | | | | | | | | | | | |
Net assets | | | | | | | | | | | | |
| | | | | | | | | | | | | |
Outstanding Shares of Beneficial Interest
(unlimited authorization - no par value) | | | | | | | | | | | | |
Net Asset Value, Offering and Redemption Price Per Share | | | | | | | | | | | | |
The accompanying notes are an integral part of the financial statements.
| STATEMENTS OF ASSETS AND LIABILITIES | | | | | | |
| | | Mondrian
U.S. Small Cap Equity Fund | | | Mondrian Global Listed Infrastructure Fund | |
| Assets: | | | | | | |
| Investments (Cost $1,320,994 and $1,357,347) | | $ | 1,497,798 | | | $ | 1,542,012 | |
| Foreign currency (Cost $ — and $6,779) | | | — | | | | 7,026 | |
Cash | | | 29,637 | | | | 10,289 | |
| Receivable for investment securities sold | | | 14,844 | | | | 48,357 | |
| Receivable from Investment Adviser | | | 5,752 | | | | 9,276 | |
Deferred offering costs | | | 4,375 | | | | 4,375 | |
Dividends receivable | | | 2,073 | | | | 1,901 | |
Reclaims receivable | | | — | | | | 481 | |
Prepaid expenses | | | | | | | | |
Total assets | | | | | | | | |
| Liabilities: | | | | | | | | |
Offering costs payable to Adviser | | | 37,627 | | | | 37,627 | |
| Payable for investment securities purchased | | | 15,514 | | | | 48,578 | |
Audit fees payable | | | 12,300 | | | | 13,450 | |
Accrued foreign capital gains tax | | | — | | | | 702 | |
Payable due to Administrator | | | 130 | | | | 130 | |
| Chief Compliance Officer fees payable | | | 13 | | | | 13 | |
Other accrued expenses | | | | | | | | |
Total liabilities | | | | | | | | |
Net assets | | | | | | | | |
| | | | | | | | | |
| Net assets consist of: | | | | | | | | |
Paid-in capital | | $ | 1,249,980 | | | $ | 1,250,925 | |
Total distributable earnings | | | | | | | | |
Net assets | | | | | | | | |
| | | | | | | | | |
Outstanding Shares of Beneficial Interest
(unlimited authorization - no par value) | | | | | | | | |
Net Asset Value, Offering and Redemption Price Per Share | | | | | | | | |
The accompanying notes are an integral part of the financial statements.
| STATEMENTS OF OPERATIONS | | | |
| | | Mondrian International Value Equity Fund | |
| Investment income | | | |
Dividends | | $ | 26,328,319 | |
Less: foreign taxes withheld | | | | |
Total investment income | | | | |
| | | | | |
| Expenses | | | | |
Investment advisory fees | | | 4,012,068 | |
Accounting and administration fees | | | 586,195 | |
Legal fees | | | 143,448 | |
Custodian fees | | | 70,711 | |
Printing fees | | | 69,277 | |
Registration fees | | | 59,620 | |
| Dividend disbursing and transfer agent fees and expenses | | | 58,748 | |
Other | | | 46,989 | |
Trustees’ fees and expenses | | | 33,597 | |
Audit and tax | | | 32,957 | |
Chief Compliance Officer fees | | | | |
Total expenses | | | | |
| Less: | | | | |
Investment advisory fees waived | | | | |
Net expenses | | | | |
| | | | | |
Net investment income | | | | |
| | | | | |
| Net realized gain on: | | | | |
Investments | | | 15,309,662 | |
Foreign currency transactions | | | | |
Net realized gain | | | | |
| Net change in unrealized appreciation/(depreciation) on: | | | | |
Investments | | | 8,330,654 | |
| Foreign currency transactions and translation of other assets and liabilities denominated in foreign currency | | | | |
| Net change in unrealized appreciation/(depreciation) | | | | |
Net realized and unrealized gain | | | | |
| | | | | |
| Net increase in net assets resulting from operations | | | | |
The accompanying notes are an integral part of the financial statements.
| STATEMENTS OF OPERATIONS | | | |
| | | Mondrian Emerging Markets Value Equity Fund | |
| Investment income | | | |
Dividends | | $ | 2,115,540 | |
Less: foreign taxes withheld | | | | |
Total investment income | | | | |
| | | | | |
| Expenses | | | | |
Investment advisory fees | | | 470,088 | |
Accounting and administration fees | | | 64,124 | |
Audit and tax | | | 32,956 | |
Custodian fees | | | 32,324 | |
Registration fees | | | 30,798 | |
| Dividend disbursing and transfer agent fees and expenses | | | 26,275 | |
Legal fees | | | 17,321 | |
Printing fees | | | 13,146 | |
Other | | | 12,729 | |
Trustees’ fees and expenses | | | 4,012 | |
Chief Compliance Officer fees | | | | |
Total expenses | | | | |
| Less: | | | | |
Investment advisory fees waived | | | | |
Net expenses | | | | |
| | | | | |
Net investment income | | | | |
| | | | | |
| Net realized gain(loss) on: | | | | |
Investments | | | 251,224 | |
Foreign currency transactions | | | | |
Net realized gain | | | | |
| Net change in unrealized appreciation/(depreciation) on: | | | | |
Investments | | | 7,194,495 | |
| Accrued foreign capital gains tax on appreciated securities | | | (6,754 | ) |
| Foreign currency transactions and translation of other assets and liabilities denominated in foreign currency | | | | |
| Net change in unrealized appreciation/(depreciation) | | | | |
Net realized and unrealized gain | | | | |
| | | | | |
| Net increase in net assets resulting from operations | | | | |
The accompanying notes are an integral part of the financial statements.
STATEMENTS OF OPERATIONS | | | |
| | | Mondrian International Government Fixed Income Fund | |
| Investment income | | | |
Interest | | $ | 540,181 | |
Less: foreign taxes withheld | | | | |
Total investment income | | | | |
| | | | | |
| Expenses | | | | |
Investment advisory fees | | | 150,399 | |
Audit and tax | | | 35,157 | |
Accounting and administration fees | | | 30,786 | |
Registration fees | | | 28,420 | |
| Dividend disbursing and transfer agent fees and expenses | | | 22,945 | |
Custodian fees | | | 16,244 | |
Legal fees | | | 8,051 | |
Printing fees | | | 6,451 | |
Other | | | 6,360 | |
Trustees’ fees and expenses | | | 1,773 | |
Chief Compliance Officer fees | | | | |
Total expenses | | | | |
| Less: | | | | |
Investment advisory fees waived | | | | |
Net expenses | | | | |
| | | | | |
Net investment income | | | | |
| | | | | |
| Net realized gain(loss) on: | | | | |
Investments | | | 697,203 | |
Foreign currency transactions | | | 166,319 | |
Foreign currency exchange contracts | | | | |
Net realized gain | | | | |
| Net change in unrealized appreciation/(depreciation) on: | | | | |
Investments | | | 2,251,577 | |
| Foreign currency transactions and translation of other assets and liabilities denominated in foreign currency | | | 8,481 | |
Foreign currency exchange contracts | | | | |
| Net change in unrealized appreciation/(depreciation) | | | | |
Net realized and unrealized gain | | | | |
| | | | | |
| Net increase in net assets resulting from operations | | | | |
The accompanying notes are an integral part of the financial statements.
| STATEMENTS OF OPERATIONS | | | |
| | | Mondrian
U.S. Small Cap Equity Fund(1) | |
| Investment income | | | |
Dividends | | | | |
Total investment income | | | | |
| | | | | |
| Expenses | | | | |
Offering costs | | | 33,252 | |
Audit and tax | | | 24,600 | |
| Dividend disbursing and transfer agent fees and expenses | | | 20,293 | |
Investment advisory fees | | | 9,457 | |
Registration fees | | | 1,365 | |
Accounting and administration fees | | | 1,278 | |
Custodian fees | | | 609 | |
Other | | | 389 | |
Legal fees | | | 275 | |
Printing fees | | | 199 | |
Trustees’ fees and expenses | | | 66 | |
Chief compliance officer fees | | | | |
Total expenses | | | | |
| Less: | | | | |
Investment advisory fees waived | | | (9,457 | ) |
Reimbursement from Investment Adviser | | | | |
Net expenses | | | | |
| | | | | |
Net investment income | | | | |
| | | | | |
| Net realized gain on: | | | | |
Investments | | | | |
Net realized gain | | | | |
| Net change in unrealized appreciation/(depreciation) on: | | | | |
Investments | | | | |
| Net change in unrealized appreciation/(depreciation) | | | | |
Net realized and unrealized gain | | | | |
| | | | | |
| Net increase in net assets resulting from operations | | | | |
| (1) | The fund commenced operations on December 17, 2018. |
The accompanying notes are an integral part of the financial statements.
| STATEMENTS OF OPERATIONS | | | |
| | | Mondrian Global Listed Infrastructure Fund(1) | |
| Investment income | | | |
Dividends | | $ | 54,360 | |
Less: foreign taxes withheld | | | | |
Total investment income | | | | |
| | | | | |
| Expenses | | | | |
Offering costs | | | 33,252 | |
Audit and tax | | | 26,900 | |
| Dividend disbursing and transfer agent fees and expenses | | | 20,291 | |
Investment advisory fees | | | 10,171 | |
Other | | | 5,341 | |
Custodian fees | | | 4,887 | |
Registration fees | | | 1,361 | |
Accounting and administration fees | | | 1,277 | |
Legal fees | | | 280 | |
Printing fees | | | 203 | |
Trustees’ fees and expenses | | | 66 | |
Chief compliance officer fees | | | | |
Total expenses | | | | |
| Less: | | | | |
Investment advisory fees waived | | | (10,171 | ) |
Reimbursement from Investment Adviser | | | | |
Net expenses | | | | |
| | | | | |
Net investment income | | | | |
| | | | | |
| Net realized gain (loss) on: | | | | |
Investments | | | 48,787 | |
Foreign currency transactions | | | | |
Net realized gain | | | | |
| Net change in unrealized appreciation/(depreciation) on: | | | | |
Investments | | | 184,665 | |
| Accrued foreign capital gains tax on appreciated securities | | | (702 | ) |
| Foreign currency transactions and translation of other assets and liabilities denominated in foreign currency | | | | |
| Net change in unrealized appreciation/(depreciation) | | | | |
Net realized and unrealized gain | | | | |
| | | | | |
| Net increase in net assets resulting from operations | | | | |
| (1) | The fund commenced operations on December 17, 2018. |
The accompanying notes are an integral part of the financial statements.
| STATEMENTS OF CHANGES IN NET ASSETS | | | | | | |
| | | Year ended October 31, 2019 | | | Year ended October 31, 2018 | |
| Operations: | | | | | | |
Net investment income | | $ | 19,461,922 | | | $ | 15,426,689 | |
| Net realized gain on investments and foreign currency transactions | | | 15,329,820 | | | | 29,467,944 | |
| Net change in unrealized appreciation/(depreciation) on investments, foreign currency transactions and translation of other assets and liabilities denominated in foreign currency | | | | | | | | |
| Net increase/(decrease) in net assets resulting from operations | | | | | | | | |
Distribution of Income | | | | | | | | |
Capital share transactions(1): | | | | | | | | |
Issued | | | 147,191,874 | | | | 63,514,902 | |
Reinvestment of dividends | | | 22,992,279 | | | | 12,352,316 | |
Redeemed | | | (112,863,109 | ) | | | (145,812,176 | ) |
Merger(2) | | | | | | | | |
| Net increase/(decrease) in net assets from capital share transactions | | | | | | | | |
Total increase/(decrease) in net assets | | | | | | | | |
| Net assets: | | | | | | | | |
Beginning of period | | | | | | | | |
End of period | | | | | | | | |
| (1) | See Note 8 – Share transactions in Notes to Financial Statements. |
| (2) | See Note 13 in Notes to Financial Statements. |
The accompanying notes are an integral part of the financial statements.
| STATEMENTS OF CHANGES IN NET ASSETS | |
| | | Year ended October 31, 2019 | | | Period ended October 31, 2018(1) | | | | |
| Operations: | | | | | | | | | |
Net investment income | | $ | 1,355,460 | | | $ | 4,162,702 | | | $ | 7,460,054 | |
| Net realized gain on investments and foreign currency transactions | | | 207,871 | | | | 7,166,275 | | | | 9,866,867 | |
| Net change in unrealized appreciation/(depreciation) on investments, accrued foreign capital gains tax on appreciated securities, foreign currency transactions and translation of other assets and liabilities denominated in foreign currency | | | | | | | | | | | | |
| Net increase in net assets resulting from operations | | | | | | | | | | | | |
Distribution of Income | | | | | | | | | | | | |
Capital share transactions(2): | | | | | | | | | | | | |
Issued | | | 2,317,599 | | | | 4,528,240 | | | | 39,445,892 | |
Reinvestment of dividends | | | 4,403,015 | | | | 2,844,738 | | | | 8,123,300 | |
Redeemed | | | | | | | | | | | | |
| Net decrease in net assets from capital share transactions | | | | | | | | | | | | |
Total decrease in net assets | | | | | | | | | | | | |
| Net assets: | | | | | | | | | | | | |
Beginning of period | | | | | | | | | | | | |
End of period | | | | | | | | | | | | |
| (1) | For the period April 1, 2018 to October 31, 2018. On September 24, 2018, the Laudus Mondrian Emerging Markets Fund (the “Emerging Markets Predecessor Fund”) was reorganized into the Gallery Trust Mondrian Emerging Markets Equity Fund (the “Emerging Markets Fund”). Information presented prior to September 24, 2018 is that of the Emerging Markets Predecessor Fund. Effective October 31, 2018, the Emerging Markets Fund changed its fiscal year end to October 31. See Note 1 in Notes to Financial Statements. |
| (2) | See Note 8 – Share transactions in Notes to Financial Statements. |
The accompanying notes are an integral part of the financial statements.
| STATEMENTS OF CHANGES IN NET ASSETS | |
| | | Year ended October 31, 2019 | | | Period ended October 31, 2018(1) | | | | |
| Operations: | | | | | | | | | |
Net investment income | | $ | 358,660 | | | $ | 381,610 | | | $ | 750,412 | |
| Net realized gain on investments, foreign currency transactions, and foreign currency exchange contracts | | | 616,366 | | | | 469,236 | | | | 842,379 | |
| Net change in unrealized appreciation/(depreciation) on investments, foreign currency transactions and translation of other assets and liabilities denominated in foreign currency, and foreign currency exchange contracts | | | | | | | | | | | | |
| Net increase in net assets resulting from operations | | | | | | | | | | | | |
Distribution of Income | | | | | | | | | | | | |
Capital share transactions(2): | | | | | | | | | | | | |
Issued | | | 5,272,964 | | | | 4,598,270 | | | | 6,608,676 | |
Reinvestment of dividends | | | 1,097,262 | | | | 276,836 | | | | 9,308 | |
Redeemed | | | | | | | | | | | | |
| Net decrease in net assets from capital share transactions | | | | | | | | | | | | |
Total decrease in net assets | | | | | | | | | | | | |
| Net assets: | | | | | | | | | | | | |
Beginning of period | | | | | | | | | | | | |
End of period | | | | | | | | | | | | |
| (1) | For the period April 1, 2018 to October 31, 2018. On September 24, 2018, the Laudus Mondrian International Government Fixed Income Fund (the “Fixed Income Predecessor Fund”) was reorganized into the Gallery Trust Mondrian International Government Fixed Income Fund (the “Fixed Income Fund”). Information presented prior to September 24, 2018 is that of the Fixed Income Predecessor Fund. Effective October 31, 2018, the Fixed Income Fund changed its fiscal year end to October 31. See Note 1 in Notes to Financial Statements. |
| (2) | See Note 8 – Share transactions in Notes to Financial Statements. |
The accompanying notes are an integral part of the financial statements.
| STATEMENTS OF CHANGES IN NET ASSETS | | | |
| | | Period ended October 31, 2019(1) | |
| Operations: | | | |
Net investment income | | $ | 19,051 | |
Net realized gain on investments | | | 39,457 | |
| Net change in unrealized appreciation/(depreciation) on investments | | | | |
| Net increase in net assets resulting from operations | | | | |
Capital share transactions(2): | | | | |
Issued | | | 1,250,000 | |
Redeemed | | | | |
| Net increase in net assets from capital share transactions | | | | |
Total increase in net assets | | | | |
| Net assets: | | | �� | |
Beginning of period | | | | |
End of period | | | | |
| (1) | The fund commenced operations on December 17, 2018. |
| (2) | See Note 8 – Share transactions in Notes to Financial Statements. |
The accompanying notes are an integral part of the financial statements.
| STATEMENTS OF CHANGES IN NET ASSETS | | | |
| | | Period ended October 31, 2019(1) | |
| Operations: | | | |
Net investment income | | $ | 37,842 | |
| Net realized gain on investments and foreign currency transactions | | | 46,807 | |
| Net change in unrealized appreciation/(depreciation) on investments, accrued foreign capital gains tax on appreciated securities, foreign currency transactions and translation of other assets and liabilities denominated in foreign currency | | | | |
| Net increase in net assets resulting from operations | | | | |
Distribution of Income | | | | |
Capital share transactions(2): | | | | |
Issued | | | 1,250,000 | |
Reinvestment of dividends | | | 925 | |
Redeemed | | | | |
| Net increase in net assets from capital share transactions | | | | |
Total increase in net assets | | | | |
| Net assets: | | | | |
Beginning of period | | | | |
End of period | | | | |
| (1) | The fund commenced operations on December 17, 2018. |
| (2) | See Note 8 – Share transactions in Notes to Financial Statements. |
The accompanying notes are an integral part of the financial statements.
| FINANCIAL HIGHLIGHTS | |
Selected per share data & ratios
for a share outstanding throughout the year | |
| | | Year
Ended
10/31/19 | | | Year
Ended
10/31/18 | | | Year
Ended
10/31/17 | | | Year
Ended
10/31/16(2) | | | Year
Ended
10/31/15(2) | |
| | | | | | | | | | | | | | | | | | | | | |
| Net asset value, beginning of period | | | | | | | | | | | | | | | | | | | | |
Income/(loss) from operations:(1) | | | | | | | | | | | | | | | | | | | | |
| Net investment income | | | 0.48 | | | | 0.47 | | | | 0.42 | | | | 0.43 | | | | 0.38 | |
| Net realized and unrealized gain/(loss) on investments | | | | | | | | | | | | | | | | | | | | |
| Total gain/(loss) from operations | | | | | | | | | | | | | | | | | | | | |
Redemption Fees | | | | | | | | | | | | | | | | | | | | |
| Dividends and distributions from: | | | | | | | | | | | | | | | | | | | | |
| Net investment income | | | (0.39 | ) | | | (0.48 | ) | | | (0.31 | ) | | | (0.37 | ) | | | (0.68 | ) |
Net realized gains | | | | | | | | | | | | | | | | | | | | |
| Total dividends and distributions | | | | | | | | | | | | | | | | | | | | |
| Net asset value, end of period | | | | | | | | | | | | | | | | | | | | |
Total return† | | | | | | | | | | | | | | | | | | | | |
| Ratios and supplemental data | | | | | | | | | | | | | | | | | | | | |
Net assets, end of period ($ Thousands) | | $ | 607,302 | | | $ | 537,587 | | | $ | 580,798 | | | $ | 420,277 | | | $ | 358,381 | |
| Ratio of expenses to average net assets (including waivers and reimbursements) | | | 0.79 | % | | | 0.79 | % | | | 0.79 | % | | | 0.82 | % | | | 0.88 | % |
| Ratio of expenses to average net assets (excluding waivers and reimbursements) | | | 0.89 | % | | | 0.88 | % | | | 0.85 | % | | | 0.89 | % | | | 0.88 | % |
| Ratio of net investment income to average net assets | | | 3.40 | % | | | 2.96 | % | | | 2.91 | % | | | 3.20 | % | | | 2.54 | % |
| Portfolio turnover rate | | | 23 | % | | | 23 | %(4) | | | 28 | %(4) | | | 20 | % | | | 28 | %(4) |
| † | Returns shown do not reflect the deductions of taxes that a shareholder would pay on Fund distributions or the redemption of Fund shares. Total return may have been lower had the Adviser not waived its fee and/or reimbursed other expenses. |
| (1) | Per share calculations were performed using average shares for the period. |
| (2) | On March 14, 2016, The International Equity Portfolio, a series of Delaware Pooled Trust (the “Predecessor Fund”) was reorganized into the Mondrian International Equity Fund. Information presented prior to March 14, 2016 is that of the Predecessor Fund. See Note 1 in Notes to Financial Statements. |
| (3) | Value is less than $0.005 per share. |
| (4) | Excludes the value of Portfolio securities received or delivered as a result of in-kind purchases or redemptions of the Portfolio’s capital shares. |
Amounts designated as “—” are $0 or have been rounded to $0.
The accompanying notes are an integral part of the financial statements.
| FINANCIAL HIGHLIGHTS | |
Selected per share data & ratios
for a share outstanding throughout the year or period | |
| | | Year
ended
10/31/19 | | | Period
ended
10/31/18(2) | | | Year
Ended
3/31/18(3) | | | Year
Ended
3/31/17 | | | Year
Ended
3/31/16 | | | Year
Ended
3/31/15 | |
| | | | | | | | | | | | | | | | | | | | | | | | | |
| Net asset value, beginning of period | | | | | | | | | | | | | | | | | | | | | | | | |
Income/(loss) from operations:(1) | | | | | | | | | | | | | | | | | | | | | | | | |
| Net investment income | | | 0.16 | | | | 0.15 | | | | 0.19 | | | | 0.14 | | | | 0.14 | | | | 0.12 | |
| Net realized and unrealized gain/(loss) on investments | | | | | | | | | | | | | | | | | | | | | | | | |
| Total gain/(loss) from operations | | | | | | | | | | | | | | | | | | | | | | | | |
| Dividends and distributions from: | | | | | | | | | | | | | | | | | | | | | |
| Net investment income | | | (0.41 | ) | | | (0.22 | ) | | | (0.23 | ) | | | (0.18 | ) | | | (0.09 | ) | | | (0.24 | ) |
| Net realized gains | | | | | | | | | | | | | | | | | | | | | | | | |
| Total dividends and distributions | | | | | | | | | | | | | | | | | | | | | | | | |
| Net asset value, end of period | | | | | | | | | | | | | | | | | | | | | | | | |
Total return† | | | | | | | | | | | | | | | | | | | | | | | | |
| Ratios and supplemental data | | | | | | | | | | | | | | | | | | | | | | | | |
Net assets, end of period ($ Thousands) | | $ | 47,496 | | | $ | 89,378 | | | $ | 314,259 | | | $ | 336,896 | | | $ | 406,462 | | | $ | 559,347 | |
| Ratio of expenses to average net assets (including waivers and reimbursements) | | | 0.92 | % | | | 1.18 | %* | | | 1.19 | %(4) | | | 1.20 | % | | | 1.20 | % | | | 1.29 | %(5) |
| Ratio of expenses to average net assets (excluding waivers and reimbursements) | | | 1.13 | % | | | 1.26 | %* | | | 1.21 | %(4) | | | 1.22 | % | | | 1.21 | % | | | 1.31 | % |
| Ratio of net investment income to average net assets | | | 2.16 | % | | | 3.25 | %* | | | 2.30 | %(4) | | | 1.92 | % | | | 1.87 | % | | | 1.42 | % |
| Portfolio turnover rate | | | 37 | % | | | 62 | %** | | | 39 | % | | | 32 | % | | | 28 | % | | | 30 | %(6) |
| ** | Portfolio turnover is for the period indicated and has not been annualized. |
| † | Total return is for the period indicated and has not been annualized. Returns shown do not reflect the deductions of taxes that a shareholder would pay on Fund distributions or the redemption of Fund shares. Total return may have been lower had the Adviser not waived its fee and/or reimbursed other expenses. |
| (1) | Per share calculations were performed using average shares for the period. |
| (2) | For the period April 1, 2018 to October 31, 2018. On September 24, 2018, the Laudus Mondrian Emerging Markets Fund (the “Emerging Markets Predecessor Fund”) was reorganized into the Gallery Trust Mondrian Emerging Markets Equity Fund (the “Emerging Markets Fund”). Information presented prior to September 24, 2018 is that of the Emerging Markets Predecessor Fund. Effective October 31, 2018, the Emerging Markets Fund changed its fiscal year end to October 31. See Note 1 in Notes to Financial Statements. |
| (3) | Effective July 25, 2017, the Investor Share class, the Select Share class, and the Institutional Share class were consolidated into a single class of shares of the fund. The financial history as shown in the financial highlights is that of the former Institutional Shares. |
| (4) | The ratio of net operating expenses and gross operating expenses would have been 1.20% and 1.22%, respectively, and the ratio of net investment income would have been 2.29%, if the custody out-of-pocket fee reimbursement had not been included. |
| (5) | Effective October 1, 2014, the annual operating expense was reduced. The ratio presented for period ended 3/31/15 is a blended ratio. |
| (6) | Portfolio turnover excludes the impact of investment activity from a merger with another fund. |
Amounts designated as “—” are $0 or have been rounded to $0.
The accompanying notes are an integral part of the financial statements.
| FINANCIAL HIGHLIGHTS | |
Selected per share data & ratios
for a share outstanding throughout the year or period | |
| | | Year
ended
10/31/19 | | | Period
ended
10/31/18(2) | | | Year
Ended
3/31/18 | | | Year
Ended
3/31/17 | | | Year
Ended
3/31/16 | | | Year
Ended
3/31/15 | |
| | | | | | | | | | | | | | | | | | | | | | | | | |
| Net asset value, beginning of period | | | | | | | | | | | | | | | | | | | | | | | | |
Income/(loss) from operations:(1) | | | | | | | | | | | | | | | | | | | | | | | | |
| Net investment income | | | 0.12 | | | | 0.06 | | | | 0.08 | | | | 0.09 | | | | 0.11 | | | | 0.15 | |
| Net realized and unrealized gain/(loss) on investments | | | | | | | | | | | | | | | | | | | | | | | | |
| Total gain/(loss) from operations | | | | | | | | | | | | | | | | | | | | | | | | |
| Dividends and distributions from: | | | | | | | | | | | | | | | | | | | | | |
| Net investment income | | | (0.37 | ) | | | — | | | | (0.00 | )(3) | | | (0.00 | )(3) | | | — | | | | — | |
| Net realized gains | | | | | | | | | | | | | | | | | | | | | | | | |
| Total dividends and distributions | | | | | | | | | | | | | | | | | | | | | | | | |
| Net asset value, end of period | | | | | | | | | | | | | | | | | | | | | | | | |
Total return† | | | | | | | | | | | | | | | | | | | | | | | | |
| Ratios and supplemental data | | | | | | | | | | | | | | | | | | | | | | | | |
Net assets, end of period ($ Thousands) | | $ | 28,117 | | | $ | 37,126 | | | $ | 84,330 | | | $ | 95,565 | | | $ | 119,938 | | | $ | 187,388 | |
| Ratio of expenses to average net assets (including waivers and reimbursements) | | | 0.60 | % | | | 0.74 | %* | | | 0.74 | %(4) | | | 0.75 | % | | | 0.75 | % | | | 0.74 | % |
| Ratio of expenses to average net assets (excluding waivers and reimbursements) | | | 1.02 | % | | | 0.86 | %* | | | 0.81 | %(4) | | | 0.79 | % | | | 0.81 | % | | | 0.76 | % |
| Ratio of net investment income to average net assets | | | 1.19 | % | | | 0.96 | %* | | | 0.84 | %(4) | | | 0.87 | % | | | 1.21 | % | | | 1.39 | % |
| Portfolio turnover rate | | | 42 | % | | | 32 | %** | | | 52 | % | | | 98 | % | | | 31 | % | | | 50 | % |
| ** | Portfolio turnover is for the period indicated and has not been annualized. |
| † | Total return is for the period indicated and has not been annualized. Returns shown do not reflect the deductions of taxes that a shareholder would pay on Fund distributions or the redemption of Fund shares. Total return may have been lower had the Adviser not waived its fee and/or reimbursed other expenses. |
| (1) | Per share calculations were performed using average shares for the period. |
| (2) | For the period April 1, 2018 to October 31, 2018. On September 24, 2018, the Laudus Mondrian International Government Fixed Income Fund (the “Fixed Income Predecessor Fund”) was reorganized into the Gallery Trust Mondrian International Government Fixed Income Fund (the “Fixed Income Fund”). Information presented prior to September 24, 2018 is that of the Fixed Income Predecessor Fund. Effective October 31, 2018, the Fixed Income Fund changed its fiscal year end to October 31. See Note 1 in Notes to Financial Statements. |
| (3) | Value is less than ($0.005) per share. |
| (4) | The ratio of net operating expenses and gross operating expenses would have been 0.75% and 0.82%, respectively, and the ratio of net investment income would have been 0.83%, if the custody out-of-pocket fee reimbursement had not been included. |
Amounts designated as “—” are $0 or have been rounded to $0.
The accompanying notes are an integral part of the financial statements.
| FINANCIAL HIGHLIGHTS | | | |
Selected per share data & ratios
for a share outstanding throughout the period | | | |
| | | Period Ended 10/31/19‡ | |
| | | | | |
Net asset value, beginning of period | | | | |
Income/(loss) from operations:(1) | | | | |
Net investment income | | | 0.15 | |
| Net realized and unrealized gain on investments | | | | |
Total gain from operations | | | | |
Net asset value, end of period | | | | |
Total return† | | | | |
| Ratios and supplemental data | | | | |
Net assets, end of period ($ Thousands) | | $ | 1,485 | |
| Ratio of expenses to average net assets (including waivers and reimbursements) | | | 0.90 | %* |
| Ratio of expenses to average net assets (excluding waivers and reimbursements) | | | 7.74 | %* |
| Ratio of net investment income to average net assets | | | 1.61 | %* |
Portfolio turnover rate | | | 32 | %** |
| ** | Portfolio turnover is for the period indicated and has not been annualized. |
| ‡ | The Fund commenced operations on December 17, 2018. |
| † | Total return is for the period indicated and has not been annualized. Returns shown do not reflect the deductions of taxes that a shareholder would pay on Fund distributions or the redemption of Fund shares. Total return may have been lower had the Adviser not waived its fee and/or reimbursed other expenses. |
| (1) | Per share calculations were performed using average shares for the period. |
Amounts designated as “—” are $0 or have been rounded to $0.
The accompanying notes are an integral part of the financial statements.
| FINANCIAL HIGHLIGHTS | | | |
Selected per share data & ratios
for a share outstanding throughout the period | | | |
| | | Period Ended 10/31/19‡ | |
| | | | | |
Net asset value, beginning of period | | | | |
Income/(loss) from operations:(1) | | | | |
Net investment income | | | 0.30 | |
| Net realized and unrealized gain on investments | | | | |
Total gain from operations | | | | |
| Dividends and distributions from: | |
Net investment income | | | | |
Total dividends and distributions | | | | |
Net asset value, end of period | | | | |
Total return† | | | | |
| Ratios and supplemental data | | | | |
Net assets, end of period ($ Thousands) | | $ | 1,519 | |
| Ratio of expenses to average net assets (including waivers and reimbursements) | | | 0.95 | %* |
| Ratio of expenses to average net assets (excluding waivers and reimbursements) | | | 8.67 | %* |
| Ratio of net investment income to average net assets | | | 3.15 | %* |
Portfolio turnover rate | | | 31 | %** |
| ** | Portfolio turnover is for the period indicated and has not been annualized. |
| ‡ | The Fund commenced operations on December 17, 2018. |
| † | Total return is for the period indicated and has not been annualized. Returns shown do not reflect the deductions of taxes that a shareholder would pay on Fund distributions or the redemption of Fund shares. Total return may have been lower had the Adviser not waived its fee and/or reimbursed other expenses. |
| (1) | Per share calculations were performed using average shares for the period. |
Amounts designated as “—” are $0 or have been rounded to $0.
The accompanying notes are an integral part of the financial statements.
NOTES TO FINANCIAL STATEMENTS
Gallery Trust (the “Trust”), is organized as a Delaware statutory trust under an Agreement and Declaration of Trust dated August 25, 2015. The Trust is registered under the Investment Company Act of 1940 (the “1940 Act”), as amended, as an open-end investment management company with six funds. The financial statements herein are those of the Mondrian International Value Equity Fund (formerly, Mondrian International Equity Fund) (the “International Fund”), Mondrian Emerging Markets Value Equity Fund (formerly, the Mondrian Emerging Markets Equity Fund) (the “Emerging Markets Fund”) the Mondrian International Government Fixed Income Fund (the “International Government Fixed Income Fund”), the Mondrian U.S. Small Cap Equity Fund (the “U.S. Small Cap Equity Fund”), and the Mondrian Global Listed Infrastructure Fund (the “Global Listed Infrastructure Fund”) (each a “Fund” and collectively the “Funds”). The International Fund, Emerging Markets Fund, U.S. Small Cap Fund, and Global Listed Infrastructure Fund are classified as diversified, and the Fixed Income Fund is classified as “non-diversified” under the 1940 Act. The investment objective of the International Fund is to seek long-term total return by investing at least 80% of its net assets, plus any borrowings for investment purposes, in equity securities. The investment objective of the Emerging Markets Fund is to seek long-term capital appreciation. The investment objective of the Fixed Income Fund is to seek long-term total return consistent with its value-oriented investment approach. The investment objective of the U.S. Small Cap Equity Fund is to seek long-term total return by investing at least 80% of its net assets, plus any borrowings for investment purposes, in equity securities of U.S. small-capitalization companies. The investment objective of the Global Listed Infrastructure Fund is to seek long-term total return by investing at least 80% of its net assets, plus any borrowings for investment purposes, in equity securities of infrastructure companies listed on a domestic or foreign exchange. Mondrian Investment Partners Limited, a limited company organized under the laws of England and Wales in 1990, serves as the Funds’ investment adviser (“Mondrian” or the “Adviser”). The Adviser makes investment decisions for the Funds and reviews, supervises and administers the investment program of the Funds, subject to the supervision of, and policies established by, the Trustees of the Trust.
The International Fund operated as The International Equity Portfolio, a series of Delaware Pooled Trust (the “International Predecessor Fund”), prior to the International Fund’s acquisition of the assets and assumption of the liabilities of the International Predecessor Fund (the “Reorganization”) on March 14, 2016 in a tax-free transaction. The International Fund had no operations prior
NOTES TO FINANCIAL STATEMENTS (continued)
to the Reorganization. The International Predecessor Fund was managed by Delaware Management Company, a series of Delaware Management Business Trust (the “Delaware Predecessor Adviser”), and sub-advised by Mondrian Investment Partners Limited. The International Predecessor Fund had substantially similar investment objectives and strategies as those of the International Fund. The financial statements and financial highlights reflect the financial information of the International Predecessor Fund for periods prior to March 14, 2016.
The Emerging Markets Fund and Fixed Income Fund operated as Laudus Mondrian Emerging Markets Fund (the “Emerging Markets Predecessor Fund”) and Laudus Mondrian International Government Fixed Income Fund (the “Fixed Income Predecessor Fund”) and, together, were a series of Laudus Trust. Each Predecessor Fund was managed by Charles Schwab Investment Management, Inc. (the “Predecessor Adviser”), and sub-advised by Mondrian. Each Fund has the same objective and substantially similar investment strategies as those of its Predecessor Fund. Each Fund acquired the assets and assumed all of the liabilities of its Predecessor Fund (the “Reorganization”) on September 24, 2018 in a tax-free transaction. The Funds had no operations prior to the Reorganization. The financial statements and financial highlights reflect the financial information of the Predecessor Funds for periods prior to September 24, 2018.
Effective October 31, 2018, the Emerging Markets Fund and International Government Fixed Income Fund changed their fiscal year end from March 31 to October 31.
The U.S. Small Cap Equity Fund and Global Listed Infrastructure Fund commenced operations on December 17, 2018.
| 2. | Significant accounting policies |
The following are significant accounting policies, which are consistently followed in the preparation of the financial statements of the Funds. The Funds are investment companies that apply the accounting and reporting guidance issued in Topic 946 by the U.S. Financial Accounting Standards Board (“FASB”).
Use of estimates — The preparation of financial statements, in conformity with U.S. generally accepted accounting principles (“U.S. GAAP”), requires management to make estimates and assumptions that affect the fair value of assets, the reported amounts of assets and liabilities and disclosure of contingent assets and liabilities at the date of the financial statements and the reported amount of increases and decreases in net assets from operations during the reporting period. Actual results could differ from those estimates and such differences could be material.
NOTES TO FINANCIAL STATEMENTS (continued)
Valuation of investments — Securities listed on a securities exchange, market or automated quotation system for which quotations are readily available (except for securities traded on NASDAQ), including securities traded over the counter, are valued at the last quoted sale price on an exchange or market (foreign or domestic) on which they are traded on valuation date (or at approximately 4:00 pm ET if a security’s primary exchange is normally open at that time), or, if there is no such reported sale on the valuation date, at the most recent quoted bid price. For securities traded on NASDAQ, the NASDAQ Official Closing Price will be used. If available, debt securities are priced based upon valuations provided by recognized independent, third-party pricing agents. Such values generally reflect the last reported sales price if the security is actively traded. The third-party pricing agents may also value debt securities by employing methodologies that utilize actual market transactions, broker-supplied valuations, or other methodologies designed to identify the market value for such securities. Such methodologies generally consider such factors as security prices, yields, maturities, call features, ratings and developments relating to specific securities in arriving at valuations. Debt securities with remaining maturities of sixty days or less may be valued at their amortized cost, which approximates market value. If such prices are not available or determined to not represent the fair value of the security as of each Fund’s pricing time, the security will be valued at fair value as determined in good faith using methods approved by the Board of Trustees (the “Board”). The prices for foreign securities will be reported in local currency and converted to U.S. dollars using currency exchange rates.
Securities for which market prices are not “readily available” are valued in accordance with fair value procedures established by the Funds’ Board. The Funds’ fair value procedures are implemented through a fair value pricing committee (the “Committee”) designated by the Board. Some of the more common reasons that may necessitate that a security be valued using fair value procedures include: the security’s trading has been halted or suspended; the security has been de-listed from a national exchange; the security’s primary trading market is temporarily closed at a time when under normal conditions it would be open; or the security’s primary pricing source is not able or willing to provide a price. When a security is valued in accordance with the fair value procedures, the Committee will determine the value after taking into consideration relevant information reasonably available to the Committee.
NOTES TO FINANCIAL STATEMENTS (continued)
For securities that principally trade on a foreign market or exchange, a significant gap in time can exist between the time of a particular security’s last trade and the time at which the Fund calculates its net asset value. The closing prices of such securities may no longer reflect their market value at the time the Fund calculates net asset value if an event that could materially affect the value of those securities (a “Significant Event”) has occurred between the time of the security’s last close and the time that the Fund calculates net asset value. A Significant Event may relate to a single issuer or to an entire market sector. If the Funds’ Adviser becomes aware of a Significant Event that has occurred with respect to a security or group of securities after the closing of the exchange or market on which the security or securities principally trade, but before the time at which the Fund calculates net asset value, it may request that a Committee meeting be called.
The Funds use MarkIt Fair Value (“MarkIt”) as a third party fair valuation vendor. MarkIt provides a fair value for foreign securities held by the Funds based on certain factors and methodologies (involving, generally, tracking valuation correlations between the U.S. market and each non-U.S. security) applied by MarkIt in the event that there is a movement in the U.S. market that exceeds a specific threshold that has been established by the Committee. The Committee has also established a “confidence interval” which is used to determine the level of correlation between the value of a foreign security and movements in the U.S. market before a particular security is fair valued when the threshold is exceeded. In the event that the threshold established by the Committee is exceeded on a specific day, the Funds value the non-U.S. securities in their portfolios that exceed the applicable “confidence interval” based upon the fair values provided by MarkIt. In such event, it is not necessary to hold a Committee meeting. In the event that the Adviser believes that the fair values provided by MarkIt are not reliable, the Adviser contacts the Funds’ Administrator and requests that a meeting of the Committee be held.
If a local market in which the Funds own securities is closed for one or more days, the Funds shall value all securities held in the corresponding currency based on the fair value prices provided by MarkIt using the predetermined confidence interval discussed above.
In accordance with the authoritative guidance on fair value measurements and disclosure under U.S. GAAP, the Funds disclose the fair value of their investments in a hierarchy that prioritizes the inputs to valuation techniques used to measure the fair value. The objective of a fair value
NOTES TO FINANCIAL STATEMENTS (continued)
measurement is to determine the price that would be received to sell an asset or paid to transfer a liability in an orderly transaction between market participants at the measurement date (an exit price). Accordingly, the fair value hierarchy gives the highest priority to quoted prices (unadjusted) in active markets for identical assets or liabilities (Level 1) and the lowest priority to unobservable inputs (Level 3). The three levels of the fair value hierarchy are described below:
Level 1 — Inputs are unadjusted, quoted prices in active markets for identical assets or liabilities at the measurement date.
Level 2 — Inputs other than quoted prices included in Level 1 that are observable for the asset or liability, either directly or indirectly. Level 2 inputs include quoted prices for similar instruments in active markets, and inputs other than quoted prices that are observable for the asset or liability.
Level 3 — Inputs are unobservable inputs for the asset or liability, and include situations where there is little, if any, market activity for the asset or liability.
Investments are classified within the level of the lowest significant input considered in determining fair value. Investments classified within Level 3 whose fair value measurement considers several inputs may include Level 1 or Level 2 inputs as components of the overall fair value measurement.
Fair value measurement classifications are summarized in the Funds’ Schedule of Investments.
For the year ended October 31, 2019, there have been no significant changes to the Funds’ fair valuation methodology.
Federal income taxes — It is each Fund’s intention to continue to qualify as a regulated investment company for Federal income tax purposes by complying with the appropriate provisions of Subchapter M of the Internal Revenue Code of 1986. Accordingly, no provision for Federal income taxes has been made in the financial statements.
The Funds evaluate tax positions taken or expected to be taken in the course of preparing the Funds’ tax returns to determine whether it is “more-likely-than-not” (i.e., greater than 50-percent) that each tax position will be sustained upon examination by a taxing authority based on the technical merits of the position. Tax positions not deemed to meet the more-likely-than-not threshold are recorded as a tax benefit or expense in the current year. The Funds did not record any tax provision in the current
NOTES TO FINANCIAL STATEMENTS (continued)
period. However, management’s conclusions regarding tax positions taken may be subject to review and adjustment at a later date based on factors including, but not limited to, examination by tax authorities (i.e., the last three tax year ends, as applicable), on-going analysis of and changes to tax laws, regulations and interpretations thereof.
As of and during the year/period ended October 31, 2019, the Funds did not have a liability for any unrecognized tax benefits. The Funds recognize interest and penalties, if any, related to unrecognized tax benefits as income tax expense in the Statement of Operations. During the year/period ended October 31, 2019, the Funds did not incur any interest or penalties.
Security transactions, dividend and investment income — Security transactions are accounted for on trade date basis for financial reporting purposes. Costs used in determining realized gains and losses on the sale of investment securities are based on the specific identification method. Dividend income is recognized on the ex-dividend date. Interest income is recognized on the accrual basis from settlement date. Purchase discounts and premiums on debt securities are accreted and amortized to maturity and included in interest income. Certain dividends from foreign securities will be recorded as soon as the Funds are informed of the dividend, net of withholding taxes, if such information is obtained subsequent to the ex-dividend date.
Foreign currency translation — The books and records of the Funds are maintained in U.S. dollars. Investment securities and other assets and liabilities denominated in a foreign currency are translated into U.S. dollars on the date of valuation. The Funds do not isolate that portion of realized or unrealized gains and losses resulting from changes in the foreign exchange rate from fluctuations arising from changes in the market prices of the securities. These gains and losses are included in net realized and unrealized gains and losses on investments on the Statement of Operations.
Net realized and unrealized gains and losses on foreign currency transactions represent net foreign exchange gains or losses from foreign currency exchange contracts, disposition of foreign currencies, currency gains or losses realized between trade and settlement dates on securities transactions and the difference between the amount of the investment income and foreign withholding taxes recorded on the Funds’ books and the U.S. dollar equivalent of the amounts actually received or paid.
NOTES TO FINANCIAL STATEMENTS (continued)
Forward Foreign Currency Contracts — The Funds may enter into forward foreign currency contracts as hedges against either specific transactions, fund positions or anticipated fund positions. The Funds may also engage in currency transactions to enhance the Funds’ returns. All commitments are “marked-to-market” daily at the applicable foreign exchange rate, and any resulting unrealized gains or losses are recorded currently. The Funds realize gains and losses at the time forward contracts are closed. Unrealized gains or losses on outstanding positions in forward foreign currency contracts held at the close of the period are recognized as ordinary income or loss for Federal income tax purposes. The Funds could be exposed to risk if the counterparties to the contracts are unable to meet the terms of the contract and from unanticipated movements in the value of a foreign currency relative to the U.S. dollar. Finally, the risk exists that losses could exceed amounts disclosed on the Statement of Assets and Liabilities. Refer to each Fund’s Schedule of Investments for details regarding open forward foreign currency contracts as of October 31, 2019 if applicable.
For the year ended October 31, 2019, the average balances of forward foreign currency exchange contracts for the International Government Fixed Income Fund were as follows:
| Average Quarterly Notional Contracts Purchased | | $ | (5,485,362 | ) |
| Average Quarterly Notional Contracts Sold | | | 3,803,566 | |
To reduce counterparty risk with respect to Over-the-Counter (“OTC”) transactions, the Funds have entered into netting arrangements, established within the Funds’ International Swap and Derivatives Association, Inc. (“ISDA”) master agreements, which allow the Funds to make (or to have an entitlement to receive) a single net payment in the event of default (close-out netting) for outstanding payables and receivables with respect to certain OTC positions in forward foreign currency contracts for each individual counterparty. In addition, the Funds may require that certain counterparties post cash and/or securities in collateral accounts to cover their net payment obligations for those derivative contracts subject to ISDA master agreements. If the counterparty fails to perform under these contracts and agreements, the cash and/or securities will be made available to the Funds.
For financial reporting purposes, the Funds do not offset derivative assets and derivative liabilities that are subject to netting arrangements in the Statement of Assets and Liabilities. Bankruptcy or insolvency laws of a
NOTES TO FINANCIAL STATEMENTS (continued)
particular jurisdiction may impose restrictions on or prohibitions against the right of offset in bankruptcy, insolvency or other events.
Collateral terms are contract specific for OTC derivatives. For derivatives traded under an ISDA master agreement, the collateral requirements are typically calculated by netting the mark to market amount of each transaction under such agreement and comparing that amount to the value of any collateral currently pledged by the Funds or the counterparty.
For financial reporting purposes, cash collateral that has been pledged to cover obligations of the Funds, if any, is reported separately on the Statement of Assets and Liabilities as cash pledged as collateral. Non-cash collateral pledged by the Funds, if any, is noted in the Schedule of Investments. Generally, the amount of collateral due from or to a party must exceed a minimum transfer amount threshold before a transfer has to be made. To the extent amounts due to the Funds from their counterparties are not fully collateralized, contractually or otherwise, the Funds bear the risk of loss from counterparty nonperformance.
The following is a summary by counterparty of the market value of OTC financial derivative instruments and collateral (received)/pledged for the Fixed Income Fund as of October 31, 2019
| Counterparty | | Gross
Assets Recognized
in the Statement of Assets and Liabilities | | | Gross
Liabilities Recognized
in the Statement of Assets and Liabilities | | | Net
Amount Available
to be Offset | | | Cash Collateral Pledged or (Received) | | | Net
Amount† | |
| Brown Brothers Harriman | | | | | | | | | | | | | | | | | | | | |
| Total | | | | | | | | | | | | | | | | | | | | |
| † | Represents the net receivable/(payable) that would be due from/to the counterparty in the event of default. Exposure from OTC financial derivative instruments can only be netted across transactions governed under the same master agreement with the same legal entity. |
Dividends and distributions to shareholders — The International Fund, Emerging Markets Fund, U.S. Small Cap Equity Fund and Global Listed Infrastructure Fund distribute their net investment income at least annually. The Fixed Income Fund distributes its net investment income quarterly. For each Fund, net realized capital gains, if any, are distributed at least annually. All distributions are recorded on ex-dividend date.
NOTES TO FINANCIAL STATEMENTS (continued)
Offering Costs — During the year ended October 31, 2019, the U.S. Small Cap Equity Fund and the Global Listed Infrastructure Fund commenced operations and incurred offering costs each in the amount of $38,167, which are being amortized to expense over a twelve month period. As of October 31, 2019, the U.S. Small Cap Equity Fund and the Global Listed Infrastructure Fund had $4,375, each, remaining to be amortized.
Expenses — Expenses that are directly related to the Fund are charged to the Fund. Other operating expenses of the Trust are prorated to the funds based on the number of funds and/or relative daily net assets.
| 3. | Transactions with affiliates |
Certain officers of the Trust are also employees of SEI Investments Global Funds Services (the “Administrator”), a wholly owned subsidiary of SEI Investments Company, and/or SEI Investments Distribution Co. (the “Distributor”). Such officers are paid no fees by the Trust, other than the Chief Compliance Officer (“CCO”) as described below, for serving as officers of the Trust.
A portion of the services provided by the CCO and his staff, who are employees of the Administrator, are paid for by the Trust as incurred. The services include regulatory oversight of the Trust’s advisors and service providers, as required by SEC regulations. The CCO’s services and fees have been approved by and are reviewed by the Board.
| 4. | Administration, Custodian, Transfer Agent and Distribution Agreements |
The Funds and the Administrator are parties to an Administration Agreement under which the Administrator provides administrative services to the Funds. For these services, the Administrator is paid an asset based fee, which will vary depending on the number of share classes and the average daily net assets of the Funds. For the year/period ended October 31, 2019, the amounts paid for these services are represented in the table below:
| | | Accounting and Administration Fees | |
International Value Equity Fund | | $ | 586,195 | |
| Emerging Markets Value Equity Fund | | | 64,124 | |
| International Government Fixed Income Fund | | | 30,786 | |
U.S. Small Cap Equity Fund | | | 1,278 | |
Global Listed Infrastructure Fund | | | 1,277 | |
NOTES TO FINANCIAL STATEMENTS (continued)
Expenses incurred under the agreements are shown on the Statement of Operations as “Accounting and administration fees”.
Brown Brothers Harriman & Co., (the “Custodian”) serves as the Funds’ Custodian pursuant to a custody agreement. Apex Fund Services (the “Transfer Agent”) serves as the Funds’ Transfer Agent pursuant to a transfer agency agreement.
| 5. | Investment Advisory Agreement |
Under the terms of an investment advisory agreement, the Adviser provides investment advisory services to the Funds. The Adviser is entitled to a fee, which is calculated daily and paid monthly, at an annual rate for each fund. The table below shows the rate of each Fund’s investment advisory fee.
| | |
International Value Equity Fund | 0.70% |
| Emerging Markets Value Equity Fund | 0.75% |
| International Government Fixed Income Fund | 0.50% |
U.S. Small Cap Equity Fund | 0.80% |
Global Listed Infrastructure Fund | 0.85% |
Prior to September 24, 2018, the Delaware Predecessor Adviser was paid a fee at an annual rate of 1.00% of the Emerging Markets Predecessor Fund’s average daily net assets and 0.60% of the average daily net assets of the Fixed Income Predecessor Fund’s average daily net assets. The Predecessor Adviser paid Mondrian a sub-advisory fee for its services as sub-adviser to each Predecessor Fund out of the advisory fees that the Predecessor Adviser received from the Predecessor Fund.
The Adviser has contractually agreed to reduce its fees and/or reimburse expenses to the extent necessary to keep total annual Fund operating expenses (excluding interest, taxes, brokerage commissions, acquired fund fees and expenses, and non-routine (collectively “excluded expenses”)) from exceeding the below percentages of the average daily net assets of the Funds until February 28, 2021 (the “Expense Limitation”).
| | |
International Value Equity Fund | 0.79% |
| Emerging Markets Value Equity Fund | 0.92% |
| International Government Fixed Income Fund | 0.60% |
U.S. Small Cap Equity Fund | 0.90% |
Global Listed Infrastructure Fund | 0.95% |
NOTES TO FINANCIAL STATEMENTS (continued)
This agreement may be terminated: (i) by the Board for any reason at any time, or (ii) by the Adviser, upon ninety (90) days’ prior written notice to the Trust, effective as of the close of business on February 28, 2021.
Prior to September 24, 2018, the Delaware Predecessor Adviser had contractually agreed through July 30, 2019, to limit the total annual fund operating expenses charged, excluding interest, taxes and certain non-routine expenses to 1.20% and 0.75% of the average daily net assets of the Emerging Markets Predecessor Fund and Fixed Income Predecessor Fund respectively.
| 6. | Investment transactions |
The cost of purchases and proceeds from security sales other than long-term U.S. Government and short-term securities for the year/period ended October 31, 2019, are as follows:
| | | | | | | |
International Value Equity Fund | | $ | 175,619,793 | | | $ | 129,387,409 | |
| Emerging Markets Value Equity Fund | | | 23,436,360 | | | | 71,176,039 | |
| International Government Fixed Income Fund | | | 11,506,249 | | | | 21,619,563 | |
U.S. Small Cap Equity Fund | | | 1,723,634 | | | | 441,833 | |
Global Listed Infrastructure Fund | | | 1,740,567 | | | | 432,008 | |
The Fixed Income Fund had purchases and sales of long-term U.S. Government securities of $873,792 and $1,827,878, respectively.
| 7. | Federal tax information |
The amount and character of income and capital gain distributions to be paid, if any, are determined in accordance with Federal income tax regulations, which may differ from U.S. GAAP. As a result, net investment income/(loss) and net realized gain/(loss) on investment transactions for a reporting period may differ significantly from distributions during such period. These book/tax differences may be temporary or permanent. To the extent these differences are permanent in nature, they are charged or credited to distributable earnings or paid-in capital, as appropriate, in the period that the differences arise.
The following permanent differences primarily attributable distributions in excess, investments in publicly traded partnerships, and non-deductible expenses have been reclassified to/from the following accounts:
NOTES TO FINANCIAL STATEMENTS (continued)
| | | Distributable Earnings (Loss) | | | | |
| International Government Fixed Income Fund | | $ | 251,636 | | | $ | (251,636 | ) |
U.S. Small Cap Equity Fund | | | 20 | | | | (20 | ) |
These reclassifications have no impact on net assets or net asset value per share.
The character of distributions made during the year from net investment income or net realized gains may differ from their ultimate characterization for federal income tax purposes. Also, due to the timing of dividend distributions, the fiscal year in which amounts are distributed may differ from the year that the income or realized gains (losses) were recorded by the Funds. Income dividends and capital gain distributions are determined in accordance with federal income tax regulations, which may differ from U.S. GAAP. These differences are primarily due to differing treatments for forwards, foreign currency transactions, wash sale loss deferrals, investments in REIT’s and investments in PFICs. Distributions during the years ended October 31, 2019 and October 31, 2018, unless otherwise noted, were as follows:
| | | | | | | | | | | | | | | |
| International Value Equity Fund | 2019 | | | $ | 14,825,938 | | | $ | 15,990,373 | | | $ | — | | | $ | 30,816,311 | |
| | 2018 | | | | 17,091,536 | | | | — | | | | — | | | | 17,091,536 | |
| | | | | | | | | | | | | | | | | | | |
| Emerging Markets Value Equity Fund | 2019 | | | | 4,415,213 | | | | — | | | | — | | | | 4,415,213 | |
| | 2018 | * | | | 2,885,248 | | | | — | | | | — | | | | 2,885,248 | |
| | 2018 | ** | | | 8,413,005 | | | | — | | | | — | | | | 8,413,005 | |
| | | | | | | | | | | | | | | | | | | |
| International Government Fixed Income Fund | 2019 | | | | 1,319,302 | | | | 94,932 | | | | — | | | | 1,414,234 | |
| | 2018 | * | | | — | | | | 357,037 | | | | — | | | | 357,037 | |
| | 2018 | ** | | | 12,784 | | | | — | | | | — | | | | 12,784 | |
| | | | | | | | | | | | | | | | | | | |
| U.S. Small Cap Equity Fund | 2019 | *** | | | — | | | | — | | | | — | | | | — | |
| | | | | | | | | | | | | | | | | | | |
| Global Listed Infrastructure Fund | 2019 | *** | | | 925 | | | | — | | | | — | | | | 925 | |
| * | Period ended October 31, 2018. |
| ** | Year ended March 31, 2018. |
| *** | Period ended October 31, 2019. |
NOTES TO FINANCIAL STATEMENTS (continued)
As of October 31, 2019, the components of Distributable Earnings on a tax basis were as follows:
| | | International Value Equity Fund | | | Emerging
Markets Value Equity Fund | | | International Government Fixed Income Fund | | | | | | Global Listed Infrastructure Fund | |
| Undistributed ordinary income | | $ | 20,564,540 | | | $ | 1,319,956 | | | $ | — | | | $ | 51,202 | | | $ | 83,724 | |
| Undistributed long-term capital gains | | | 15,373,629 | | | | — | | | | — | | | | — | | | | — | |
| Capital loss carryforwards | | | — | | | | (107,755,243 | ) | | | — | | | | — | | | | — | |
| Net unrealized appreciation (depreciation) on investments | | | (5,625,866 | ) | | | 176,134 | | | | 1,381,510 | | | | 184,130 | | | | 184,240 | |
| Other temporary differences | | | | | | | | | | | | | | | | | | | | |
| Total distributable earnings | | | | | | | | | | | | | | | | | | | | |
| * | These differences relate to FX Straddle deferrals. |
Under the Regulated Investment Company Modernization Act of 2010, the Funds are permitted to carry forward capital losses incurred in taxable years beginning after December 22, 2010 for an unlimited period. Capital losses that are carried forward will retain their character as either short-term or long-term capital losses. The capital loss carryforwards are noted below:
| | | | | | | | | | |
| Emerging Markets Value Equity Fund | | $ | 26,321,469 | | | $ | 81,433,774 | | | $ | 107,755,243 | |
| * | The utilization of this amount is subject to limitation under IRC section 382-384. |
For Federal income tax purposes the difference between Federal tax cost and book cost primarily relates to passive foreign investment companies, investments in publicly traded partnerships, and wash sales which cannot be used for Federal income tax purposes in the current year and have been deferred for use in future years. The Federal tax cost and aggregate gross unrealized appreciation and depreciation for the investments held by the Funds at October 31, 2019, were as follows:
NOTES TO FINANCIAL STATEMENTS (continued)
| | | | | | Aggregate Gross Unrealized Appreciation | | | Aggregate Gross Unrealized Depreciation | | | Net Unrealized Appreciation (Depreciation) | |
| International Value Equity Fund | | $ | 605,943,357 | | | $ | 51,088,552 | | | $ | (56,714,419 | ) | | $ | (5,625,867 | ) |
| Emerging Markets Value Equity Fund | | | 47,100,007 | | | | 6,100,610 | | | | (5,914,118 | ) | | | 186,492 | |
| International Government Fixed Income Fund | | | 26,300,928 | | | | 1,903,814 | | | | (522,304 | ) | | | 1,381,510 | |
| U.S. Small Cap Equity Fund | | | 1,313,668 | | | | 216,392 | | | | (32,262 | ) | | | 184,130 | |
| Global Listed Infrastructure Fund | | | 1,357,347 | | | | 195,183 | | | | (10,518 | ) | | | 184,665 | |
The share transactions are shown below:
Mondrian International Value Equity Fund | |
| | | Year ended October 31, 2019 | | | Year ended October 31, 2018 | |
| Shares transactions: | | | | | | |
| Institutional Class shares | | | | | | |
Issued | | | 10,607,837 | | | | 4,042,576 | |
Reinvestment of dividends | | | 1,743,360 | | | | 787,273 | |
Redeemed | | | (8,143,825 | ) | | | (9,064,192 | ) |
Merger(1) | | | | | | | | |
| Net increase in shares outstanding | | | | | | | | |
Mondrian Emerging Markets Value Equity Fund | |
| | | Year ended October 31, 2019 | | | Period ended October 31, 2018(2) | | | Year ended March 31, 2018(3) | |
| Shares transactions: | | | | | | | | | |
| Institutional Class shares | | | | | | | | | |
Issued | | | 322,000 | | | | 563,003 | | | | 4,763,454 | |
| Reinvestment of dividends | | | 660,122 | | | | 382,872 | | | | 990,646 | |
Redeemed | | | | | | | | | | | | |
| Net decrease in shares outstanding | | | | | | | | | | | | |
NOTES TO FINANCIAL STATEMENTS (continued)
Mondrian International Government Fixed Income Fund | |
| | | Year ended October 31, 2019 | | | Period ended October 31, 2018(4) | | | | |
| Shares transactions: | | | | | | | | | |
| Institutional Class shares | | | | | | | | | |
Issued | | | 549,721 | | | | 452,240 | | | | 665,839 | |
| Reinvestment of dividends | | | 114,895 | | | | 28,105 | | | | 938 | |
Redeemed | | | | | | | | | | | | |
| Net decrease in shares outstanding | | | | | | | | | | | | |
Mondrian U.S. Small Cap Equity Fund | |
| | | For the period ended October 31, 2019(5) | |
| Shares transactions: | | | |
| Institutional Class shares | | | |
Issued | | | | |
Net increase in shares outstanding | | | | |
Mondrian Global Listed Infrastructure Fund | |
| | | For the period ended
October 31, 2019(5) | |
| Shares transactions: | | | |
| Institutional Class shares | | | |
Issued | | | 125,000 | |
Reinvestment of dividends | | | | |
Net increase in shares outstanding | | | | |
| (2) | For the period April 1, 2018 to October 31, 2018. On September 24, 2018, the Laudus Mondrian Emerging Markets Fund (the “Emerging Markets Predecessor Fund”) was reorganized into the Gallery Trust Mondrian Emerging Markets Equity Fund (the “Emerging Markets Fund”). Information presented prior to September 24, 2018 is that of the Emerging Markets Predecessor Fund. Effective October 31, 2018, the Emerging Markets Fund changed its fiscal year end to October 31. See Note 1. |
| (3) | Effective July 25, 2017, the Investor Share class, the Select Share class, and the Institutional Share class were consolidated into a single class of shares of the Fund. |
NOTES TO FINANCIAL STATEMENTS (continued)
| (4) | For the period April 1, 2018 to October 31, 2018. On September 24, 2018, the Laudus Mondrian International Government Fixed Income Fund (the “Fixed Income Predecessor Fund”) was reorganized into the Gallery Trust Mondrian International Government Fixed Income Fund (the “Fixed Income Fund”). Information presented prior to September 24, 2018 is that of the Fixed Income Predecessor Fund. Effective October 31, 2018, the Fixed Income Fund changed its fiscal year end to October 31. See Note 1. |
| (5) | The Fund commenced operations December 17, 2018. |
| 9. | Risks associated with financial instruments |
As with all mutual funds, a shareholder of a Fund is subject to the risk that his or her investment could lose money. The Funds are subject to the principal risks noted below, any of which may adversely affect the Funds’ net asset value and ability to meet its investment objective. A more complete description of risks associated with each Fund is included in the prospectus.
Active management risk
The Funds are subject to the risk that the Adviser’s judgments about the attractiveness, value, or potential appreciation of the Funds’ investments may prove to be incorrect. If the investments selected and strategies employed by the Funds fail to produce the intended results, the Funds could underperform in comparison to its benchmark index or other funds with similar objectives and investment strategies.
Equity risk
Since it purchases equity securities, the Funds are subject to the risk that stock prices may fall over short or extended periods of time. Historically, the equity markets have moved in cycles, and the value of the Funds’ equity securities may fluctuate from day to day. Individual companies may report poor results or be negatively affected by industry and/or economic trends and developments. The prices of securities issued by such companies may suffer a decline in response. These factors contribute to price volatility, which is the principal risk of investing in the Funds.
Convertible securities risk
The value of a convertible security is influenced by changes in interest rates (with investment value declining as interest rates increase and increasing as interest rates decline) and the credit standing of the issuer. The price of a convertible security will also normally vary in some proportion to changes in the price of the underlying common stock because of the conversion or exercise feature.
NOTES TO FINANCIAL STATEMENTS (continued)
Large capitalization company risk
The large capitalization companies in which the Funds may invest may lag the performance of smaller capitalization companies because large capitalization companies may experience slower rates of growth than smaller capitalization companies and may not respond as quickly to market changes and opportunities.
Preferred stocks risk
Preferred stocks are sensitive to interest rate changes, and are also subject to equity risk, which is the risk that stock prices will fall over short or extended periods of time. The rights of preferred stocks on the distribution of a company’s assets in the event of a liquidation are generally subordinate to the rights associated with a company’s debt securities.
Foreign company risk
Investing in foreign companies, including direct investments and investments through depositary receipts, poses additional risks since political and economic events unique to a country or region will affect those markets and their issuers. These risks will not necessarily affect the U.S. economy or similar issuers located in the U.S. Securities of foreign companies may not be registered with the SEC and foreign companies are generally not subject to the regulatory controls imposed on U.S. issuers and, as a consequence, there is generally less publically available information about foreign securities than is available about domestic securities. Income from foreign securities owned by the Funds may be reduced by a withholding tax at the source, which tax would reduce income received from the securities comprising the portfolio. Foreign securities may also be more difficult to value than securities of U.S. issuers. While depositary receipts provide an alternative to directly purchasing the underlying foreign securities in their respective national markets and currencies, investments in depositary receipts continue to be subject to many of the risks associated with investing directly in foreign securities.
Emerging markets securities risk
The Funds’ investments in emerging markets securities are considered speculative and subject to heightened risks in addition to the general risks of investing in foreign securities. Unlike more established markets, emerging markets may have governments that are less stable, markets that are less liquid and economies that are less developed. In addition, the securities markets of emerging market countries may consist of companies with smaller market capitalizations and may suffer periods of relative illiquidity; significant price volatility; restrictions on foreign investment; and possible restrictions on
NOTES TO FINANCIAL STATEMENTS (continued)
repatriation of investment income and capital. Furthermore, foreign investors may be required to register the proceeds of sales, and future economic or political crises could lead to price controls, forced mergers, expropriation or confiscatory taxation, seizure, nationalization or creation of government monopolies.
Foreign currency risk
As a result of the Funds’ investments in securities denominated in, and/or receiving revenues in, foreign currencies, the Funds will be subject to currency risk. Currency risk is the risk that foreign currencies will decline in value relative to the U.S. dollar or, in the case of hedging positions, that the U.S. dollar will decline in value relative to the currency hedged. In either event, the dollar value of an investment in the Funds would be adversely affected.
Depositary receipts risk
Investments in depositary receipts may be less liquid and more volatile than the underlying securities in their primary trading market. If a depositary receipt is denominated in a different currency than its underlying securities, the Funds will be subject to the currency risk of both the investment in the depositary receipt and the underlying security. Holders of depositary receipts may have limited or no rights to take action with respect to the underlying securities or to compel the issuer of the receipts to take action. The prices of depositary receipts may differ from the prices of securities upon which they are based. Certain of the depositary receipts in which the Fund invests may be unsponsored depositary receipts. Unsponsored depositary receipts may not provide as much information about the underlying issuer and may not carry the same voting privileges as sponsored depositary receipts. Unsponsored depositary receipts are issued by one or more depositaries in response to market demand, but without a formal agreement with the company that issues the underlying securities.
Derivatives risk
The Funds’ use of forward contracts and participatory notes is subject to market risk, correlation risk, credit risk, valuation risk and liquidity risk. Market risk is the risk that the market value of an investment may move up and down, sometimes rapidly and unpredictably. Correlation risk is the risk that changes in the value of the derivative may not correlate perfectly or at all with the underlying asset, rate or index. Credit risk is the risk that the counterparty to a derivative contract will default or otherwise become unable to honor a financial obligation. Valuation risk is the risk that the derivative may be difficult to value. Liquidity risk is described below. The Funds’ use of forwards is also
NOTES TO FINANCIAL STATEMENTS (continued)
subject to leverage risk and hedging risk. Leverage risk is the risk that the use of leverage may amplify the effects of market volatility on the Fund’s share price and may also cause the Fund to liquidate portfolio positions when it would not be advantageous to do so in order to satisfy its obligations. Hedging risk is the risk that derivatives instruments used for hedging purposes may also limit any potential gain that may result from the increase in value of the hedged asset. To the extent that the Funds engage in hedging strategies, there can be no assurance that such strategy will be effective or that there will be a hedge in place at any given time. Each of these risks could cause the Funds to lose more than the principal amount invested in a derivative instrument.
Liquidity risk
Certain securities may be difficult or impossible to sell at the time and the price that the Funds would like. The Funds may have to lower the price, sell other securities instead or forgo an investment opportunity, any of which could have a negative effect on Fund management or performance.
Portfolio turnover risk
Due to their investment strategies, the Funds may buy and sell securities frequently. This may result in higher transaction costs and additional capital gains tax liabilities.
Large purchase and redemption risk
Large purchases or redemptions of the Fund’s shares may force the Fund to purchase or sell securities at times when it would not otherwise do so, and may cause the Fund’s portfolio turnover rate and transaction costs to rise, which may negatively affect the Fund’s performance and have adverse tax consequences for Fund shareholders.
Fixed income risk
Fixed income securities are subject to a number of risks, including credit and interest rate risks. Credit risk is the risk that the issuer or obligor will not make timely payments of principal and interest. Changes in an issuer’s credit rating or the market’s perception of an issuer’s creditworthiness may also affect the value of the Fund’s investment in that issuer. Interest rate risk is the risk that the value of a fixed income security will fall when interest rates rise. In general, the longer the maturity of a fixed income security, the more likely its value will decline when interest rates rise. Risks associated with rising interest rates are heightened given that interest rates in the U.S. are at, or near, historic lows.
NOTES TO FINANCIAL STATEMENTS (continued)
Zero-coupon bond risk
The market value of a zero-coupon bond is generally more volatile than the market value of other fixed income securities with similar maturities that pay interest periodically. In addition, federal income tax law requires that the holder of a zero coupon bond accrue a portion of the discount at which the bond was purchased as taxable income each year. The Fund may consequently have to dispose of portfolio securities under disadvantageous circumstances to generate cash to satisfy its requirement as a regulated investment company to distribute all of its net income (including non-cash income attributable to zero-coupon securities). These actions may reduce the assets to which the Fund’s expenses could otherwise be allocated and may reduce the Fund’s rate of return.
Foreign sovereign debt securities risk
The Funds’ investments in foreign sovereign debt securities are subject to the risks that: (i) the governmental entity that controls the repayment of sovereign debt may not be willing or able to repay the principal and/or interest when it becomes due, due to factors such as debt service burden, political constraints, cash flow problems and other national economic factors; (ii) governments may default on their debt securities, which may require holders of such securities to participate in debt rescheduling or additional lending to defaulting govern-ments; and (iii) there is no bankruptcy proceeding by which defaulted sovereign debt may be collected in whole or in part.
Foreign government agencies risk
Bonds issued by government agencies, subdivisions or instrumentalities of foreign governments are generally backed only by the general creditworthiness and reputation of the entity issuing the bonds and may not be backed by the full faith and credit of the foreign government. Moreover, a foreign government that explicitly provides its full faith and credit to a particular entity may be, due to changed circumstances, unable or unwilling to provide that support. A foreign government agency’s operations and financial condition are influenced by the foreign government’s economic and other policies.
Supranational entities risk
Government members, or “stockholders,” usually make initial capital contributions to a supranational entity and in many cases are committed to make additional capital contributions if the supranational entity is unable to repay its borrowings. There is no guarantee, however, that one or more stockholders of the supranational entity will continue to make any necessary additional capital contributions. If such contributions are not made, the entity
NOTES TO FINANCIAL STATEMENTS (continued)
may be unable to pay interest or repay principal on its debt securities, and the Funds may lose money on such investments.
Corporate fixed income securities risk
Corporate fixed income securities respond to economic developments, especially changes in interest rates, as well as perceptions of the creditworthiness and business prospects of individual issuers.
Non-diversification risk
The Fixed Income Fund is classified as “non-diversified,” which means it may invest a larger percentage of its assets in a smaller number of issuers than a diversified fund. To the extent the Fund invests its assets in a smaller number of issuers, the Fund will be more susceptible to negative events affecting those issuers than a diversified fund.
New Fund Risk
Because the U.S. Small Cap Equity Fund and the Global Listed Infrastructure Fund are both new, investors in the Funds bear the risk that the Funds may not be successful in implementing their investment strategy, may not employ a successful investment strategy, or may fail to attract sufficient assets under management to realize economies of scale, any of which could result in the Funds being liquidated at any time without shareholder approval and at a time that may not be favorable for all shareholders. Such liquidation could have negative tax consequences for shareholders and will cause shareholders to incur expenses of liquidation.
In the normal course of business, the Funds enter into contracts that provide general indemnifications. The Funds’ maximum exposure under these arrangements is dependent on future claims that may be made against the Funds and, therefore, cannot be established; however, based on experience, the risk of loss from such claims is considered remote.
The Funds have access to custodian overdraft facilities. A Fund may have utilized the overdraft facility and incurred an interest expense, which is disclosed on the fund’s Statement of Operations, if any. The interest expense is determined based on a negotiated rate above the current Federal Funds Rate. For the year or period ended October 31, 2019, none of the Funds incurred any interest expense.
NOTES TO FINANCIAL STATEMENTS (continued)
At October 31, 2019, the percentage of total shares outstanding held by a limited number of shareholders for each Fund, which were comprised of omnibus accounts that were held on behalf of various individual shareholders was as follows:
| | | |
International Value Equity Fund | 6 | 67% |
| Emerging Markets Value Equity Fund | 3 | 94% |
| International Government Fixed Income Fund | 2 | 80% |
U.S. Small Cap Equity Fund | 1 | 100% |
Global Listed Infrastructure Fund | 1 | 100% |
At a meeting held on June 13, 2018, the Board approved an Agreement and Plan of Reorganization (the “Plan of Reorganization”) that provided for the reorganization of the Laudus Mondrian International Equity Fund (“Acquired Fund”) into the Mondrian International Equity Fund (“Surviving Fund”). The transaction was tax-free, meaning that the Laudus Mondrian International Equity Fund’s shareholders became shareholders of the Mondrian International Equity Fund without realizing any gain or loss for federal income tax purposes.
The Reorganization occurred as of the close of business on September 24, 2018, whereby all of the assets of the Acquired Fund were transferred to the corresponding Surviving Fund and shareholders of Institutional Shares of the Acquired Fund received Institutional Shares of the Surviving Fund, in exchange for their shares as follows.
| Acquired Fund | | Net
Assets | | | Shares | | | Undistributed Net Investment Income | | | Undistributed Net Realized Loss on Investments | | | Unrealized Appreciation on
Investments | |
| Laudus Mondrian International Equity Fund | | $ | 77,683,607 | | | | 13,423,307 | | | $ | 21,223 | | | $ | (1,723,842 | ) | | $ | 13,436,246 | |
| Surviving Fund | | Shares
Issued | | | Net Assets
Prior to Merger | | | Net Assets
After Merger | |
| Mondrian International Equity Fund | | | 5,007,561 | | | $ | 500,636,933 | | | $ | 578,320,540 | |
NOTES TO FINANCIAL STATEMENTS (continued)
Assuming the Reorganization had been completed on November 1, 2017, the beginning of the annual reporting period, the Acquired Fund pro forma results of operations for the period ended October 31, 2018 are as follows:
| Acquired Fund | | Net Investment Income | | | Net Realized Gain on Investments | | | Unrealized Depreciation on Investments | |
| Laudus Mondrian International Equity Fund | | $ | 18,209,526 | | | $ | 37,147,932 | | | $ | (89,838,343 | ) |
Because the combined investment portfolios have been managed as a single integrated portfolio since the acquisition was completed, it is not practicable to separate the amounts of revenue and earnings of Laudus Mondrian International Equity Fund that have been included in the Fund’s Statement of Operations since September 24, 2018.
For financial reporting purposes, assets received and shares issued by the Fund were recorded at fair value; however, the cost basis of the investments received from Laudus Mondrian International Equity Fund, in the amount of $63,713,337, was carried forward to align ongoing reporting of the Fund’s realized and unrealized gains and losses with amounts distributable to shareholders for tax purposes. The Fund acquired capital loss carryovers of $5,199,265.
On August 17, 2018, the SEC adopted amendments to Regulation S-X. These changes are effective for periods after November 5, 2018. The updates to Registered Investment Companies were mainly focused on simplifying the presentation of distributable earnings by eliminating the need to present the components of distributable earnings on a book basis in the Statement of Assets & Liabilities. The update also impacted the presentation of undistributed net investment income and distribution to shareholders on the Statement of Changes in Net Assets. The amounts presented in the current Statement of Changes in Net Assets represent the aggregated total distributions of net investment income and realized capital gains, except for distributions classified as return of capital which are still presented separately.
| 15. | New accounting pronouncement |
In August 2018, the FASB issued Accounting Standards Update 2018-13, Fair Value Measurement (Topic 820). The new guidance includes additions and modifications to disclosures requirements for fair value measurements. For public entities, the amendments are effective for financial statements issued
NOTES TO FINANCIAL STATEMENTS (continued)
for fiscal years beginning after December 15, 2019, and interim periods within those fiscal years. Management elected to early adopt the removal of certain disclosures and delay the adoption of additional disclosure until the effective date.
The Funds have evaluated the need for disclosures and/or adjustments resulting from subsequent events through the date the financials were issued. Based on this evaluation, no disclosures and/or adjustments were required to the financial statements as of October 31, 2019.
REPORT OF INDEPENDENT REGISTERED PUBLIC ACCOUNTING FIRM
To the Board of Trustees of Gallery Trust and Shareholders of Mondrian International Value Equity Fund, Mondrian Emerging Markets Value Equity Fund, Mondrian International Government Fixed Income Fund, Mondrian U.S. Small Cap Equity Fund and Mondrian Global Listed Infrastructure Fund
Opinions on the Financial Statements
We have audited the accompanying statements of assets and liabilities, including the schedules of investments, of each of the funds listed in the table below (five of the funds constituting Gallery Trust, hereafter collectively referred to as the “Funds”) as of October 31, 2019, the related statements of operations and of changes in net assets for each of the periods indicated in the table below, including the related notes, and the financial highlights for each of the periods indicated therein (collectively referred to as the “financial statements”). In our opinion, the financial statements present fairly, in all material respects, the financial position of each of the Funds as of October 31, 2019, the results of each of their operations and changes in each of their net assets for the periods indicated in the table below, and each of the financial highlights for each of the periods indicated therein in conformity with accounting principles generally accepted in the United States of America.
| Mondrian International Value Equity Fund (1) | Mondrian Emerging Markets Value Equity Fund (2) | Mondrian International Government Fixed Income Fund (2) |
| Mondrian Global Listed Infrastructure Fund (3) | Mondrian U.S. Small Cap Equity Fund (3) | |
| (1) | Statement of operations for the year ended October 31, 2019 and statement of changes in net assets for the years ended October 31, 2019 and 2018 |
| (2) | Statement of operations for the year ended October 31, 2019 and statement of changes in net assets for the year ended October 31, 2019, for the period April 1, 2018 to October 31, 2018, and for the year ended March 31, 2018 |
| (3) | Statement of operations and statement of changes in net assets for the period December 17, 2018 (commencement of operations) through October 31, 2019 |
Basis for Opinions
These financial statements are the responsibility of the Funds’ management. Our responsibility is to express an opinion on the Funds’ financial statements based on our audits. We are a public accounting firm registered with the Public Company Accounting Oversight Board (United States) (PCAOB) and are required to be independent with respect to the Funds in accordance with the U.S. federal securities laws and the applicable rules and regulations of the Securities and Exchange Commission and the PCAOB.
We conducted our audits of these financial statements in accordance with the standards of the PCAOB. Those standards require that we plan and perform the audit to obtain reasonable assurance about whether the financial statements are free of material misstatement, whether due to error or fraud.
Our audits included performing procedures to assess the risks of material misstatement of the financial statements, whether due to error or fraud, and performing procedures that respond to those risks. Such procedures included examining, on a test basis, evidence regarding the amounts and disclosures in the financial statements. Our audits also included evaluating the accounting principles used and significant estimates made by management, as well as evaluating the overall presentation of the financial statements. Our procedures included confirmation of securities owned as of October 31, 2019 by correspondence with the custodian and brokers; when replies were not received from brokers, we performed other auditing procedures. We believe that our audits provide a reasonable basis for our opinions.
/s/ PricewaterhouseCoopers LLP
Philadelphia, Pennsylvania
December 27, 2019
We have served as the auditor of one or more investment companies in Mondrian Investment Partners Limited since 2016.
DISCLOSURE OF FUND EXPENSES
All mutual funds have operating expenses. As a shareholder of a mutual fund, your investment is affected by these ongoing costs, which include (among others) costs for fund management, administrative services, and shareholder reports like this one. It is important for you to understand the impact of these costs on your investment returns.
Operating expenses such as these are deducted from the mutual fund’s gross income and directly reduce its final investment return. These expenses are expressed as a percentage of the mutual fund’s average net assets; this percentage is known as the mutual fund’s expense ratio.
The following examples use the expense ratio and are intended to help you understand the ongoing costs (in dollars) of investing in your Fund and to compare these costs with those of other mutual funds. The examples are based on an investment of $1,000 made at the beginning of the period shown and held for the entire period from May 1, 2019 to October 31, 2019.
The table on the next page illustrates your Fund’s costs in two ways:
Actual Fund Return. This section helps you to estimate the actual expenses after fee waivers that your Fund incurred over the period. The “Expenses Paid During Period” column shows the actual dollar expense cost incurred by a $1,000 investment in the Fund, and the “Ending Account Value” number is derived from deducting that expense cost from the Fund’s gross investment return.
You can use this information, together with the actual amount you invested in the Fund, to estimate the expenses you paid over that period. Simply divide your ending starting account value by $1,000 to arrive at a ratio (for example, an $8,600 account value divided by $1,000 = 8.6), then multiply that ratio by the number shown for your Fund under “Expenses Paid During Period.”
Hypothetical 5% Return. This section helps you compare your Fund’s costs with those of other mutual funds. It assumes that the Fund had an annual 5% return before expenses during the year, but that the expense ratio (Column 3) for the period is unchanged. This example is useful in making comparisons because the Securities and Exchange Commission requires all mutual funds to make this 5% calculation. You can assess your Fund’s comparative cost by comparing the hypothetical result for your Fund in the “Expenses Paid During Period” column with those that appear in the same charts in the shareholder reports for other mutual funds.
DISCLOSURE OF FUND EXPENSES
Note: Because the return is set at 5% for comparison purposes — NOT your Fund’s actual return — the account values shown may not apply to your specific investment.
| | | Beginning
Account
Value
5/1/19 | | | Ending
Account
Value
10/31/19 | | | Annualized Expense
Ratios | | | Expenses
Paid
During
Period* | |
| Mondrian International Value Equity Fund | |
| Actual Fund Return | | $ | 1,000.00 | | | $ | 1,006.20 | | | | 0.79 | % | | $ | 3.99 | |
| Hypothetical 5% Return | | $ | 1,000.00 | | | $ | 1,021.22 | | | | 0.79 | % | | $ | 4.02 | |
| Mondrian Emerging Markets Value Equity Fund | |
| Actual Fund Return | | $ | 1,000.00 | | | $ | 985.40 | | | | 0.92 | % | | $ | 4.60 | |
| Hypothetical 5% Return | | $ | 1,000.00 | | | $ | 1,020.57 | | | | 0.92 | % | | $ | 4.69 | |
| Mondrian International Government Fixed Income Fund | |
| Actual Fund Return | | $ | 1,000.00 | | | $ | 1,057.20 | | | | 0.60 | % | | $ | 3.11 | |
| Hypothetical 5% Return | | $ | 1,000.00 | | | $ | 1,022.18 | | | | 0.60 | % | | $ | 3.06 | |
| Mondrian U.S. Small Cap Equity Fund | |
| Actual Fund Return | | $ | 1,000.00 | | | $ | 1,060.70 | | | | 0.90 | % | | $ | 4.67 | |
| Hypothetical 5% Return | | $ | 1,000.00 | | | $ | 1,020.67 | | | | 0.90 | % | | $ | 4.58 | |
| Mondrian Global Listed Infrastructure Fund | |
| Actual Fund Return | | $ | 1,000.00 | | | $ | 1,111.70 | | | | 0.95 | % | | $ | 5.06 | |
| Hypothetical 5% Return | | $ | 1,000.00 | | | $ | 1,020.42 | | | | 0.95 | % | | $ | 4.84 | |
| * | Expenses are equal to the Fund’s annualized expense ratio multiplied by the average account value over the period, multiplied by 184/365 (to reflect the one-half year period). |
TRUSTEES AND OFFICERS OF THE GALLERY TRUST
Set forth below are the names, years of birth, positions with the Trust, length of term of office, and the principal occupations for the last five years of each of the persons currently serving as Trustees and Officers of the Trust. Unless otherwise noted, the business address of each Trustee is SEI Investments Company, 1 Freedom Valley Drive, Oaks, Pennsylvania 19456. Trustees who are deemed not to be “interested persons” of the Trust are referred to as “Independent Trustees.” Mr. Doran is a Trustee who may be deemed to be “interested” persons of the Trust as that term is defined in the 1940 Act by virtue of their affiliation with the Trust’s Distributor. The Trust’s Statement of Additional Information (“SAI”) includes additional information about the Trustees and Officers. The SAI may be obtained without charge by calling 1-888-832-4386.
The following chart lists Trustees and Officers as of October 31, 2019.
Name
and Year
of Birth | Position
With Trust
and Length of Time Served1 | Principal
Occupations
in the Past
Five Years | Other Directorships
Held in the Past Five Years2 |
INTERESTED TRUSTEE 3 4 |
WILLIAM M. DORAN (Born: 1940) | Chairman of the Board of Trustees (Since 2014) | Self-Employed Consultant since 2003. Partner at Morgan, Lewis & Bockius LLP (law firm) from 1976 to 2003. Counsel to the Trust, SEI Investments, SIMC, the Administrator and the Distributor. Secretary of SEI Investments since 1978. | Current Directorships: Trustee of The Advisors’ Inner Circle Fund III, Schroder Series Trust, Schroder Global Series Trust, SEI Daily Income Trust, SEI Institutional International Trust, SEI Institutional Investments Trust, SEI Institutional Managed Trust, SEI Asset Allocation Trust, SEI Tax Exempt Trust, Adviser Managed Trust, New Covenant Funds, SEI Insurance Products Trust and SEI Catholic Values Trust. Director of SEI Investments, SEI Investments (Europe), Limited, SEI Investments—Global Funds Services, Limited, SEI Investments Global, Limited, SEI Investments (Asia), Limited, SEI Global Nominee Ltd., SEI Investments – Unit Trust Management (UK) Limited and SEI Investments Co. Director of the Distributor. Former Directorships: Trustee of O’Connor EQUUS (closed-end investment company) to 2016. Trustee of SEI Liquid Asset Trust to 2016. Trustee of Winton Series Trust to 2017. Trustee of The Advisors’ Inner Circle Fund, The Advisors’ Inner Circle Fund II, Bishop Street Funds, The KP Funds and Winton Diversified Opportunities Fund (closed-end investment company) to 2018. |
| 1 | Each Trustee shall hold office during the lifetime of this Trust until the election and qualification of his or her successor, or until he or she dies, resigns, or is removed in accordance with the Declaration of Trust. |
| 2 | Directorships of Companies required to report to the Securities and Exchange Commission under the Securities Exchange Act of 1934 (i.e., “public companies”) or other investment companies under the 1940 Act. |
| 3 | Trustees oversee 6 Funds in the Trust. |
| 4 | Mr. Doran may be deemed to be an “interested” person of the Fund as that term is defined in the 1940 Act by virtue of his affiliation with the Distributor and/or its affiliates |
TRUSTEES AND OFFICERS OF THE GALLERY TRUST
Name
and Year
of Birth | Position with Trust and Length of
Time Served 1 | Principal
Occupations
In the Past
Five Years | Other Directorships
Held in the Past Five Years 2 |
INDEPENDENT TRUSTEES 3 |
JON C.
HUNT (Born: 1951) | Trustee and Lead Independent Trustee (Since 2014) | Retired since 2013. Consultant to Management, Convergent Capital Management, LLC (“CCM”) from 2012 to 2013. Managing Director and Chief Operating Officer, CCM from 1998 to 2012. | Current Directorships: Trustee of City National Rochdale Funds, The Advisors’ Inner Circle Fund III, Schroder Series Trust and Schroder Global Series Trust. Former Directorships: Trustee of O’Connor EQUUS (closed-end investment company) to 2016. Member of Independent Committee of Nuveen Commodities Asset Management to 2016. Trustee of Winton Series Trust to 2017. Trustee of Winton Diversified Opportunities Fund (closed-end investment company) to 2018. |
THOMAS P. LEMKE (Born: 1954) | Trustee (Since 2014) | Retired since 2013. Executive Vice President and General Counsel, Legg Mason, Inc. from 2005 to 2013. | Current Directorships: Trustee of The Advisors’ Inner Circle Fund III, Schroder Series Trust, Schroder Global Series Trust, JP Morgan Active Exchange-Traded Funds and Symmetry Panoramic Trust. Former Directorships: Trustee of Munder Funds to 2014. Trustee of Victory Funds to 2015. Trustee of O’Connor EQUUS (closed-end investment company) to 2016. Trustee of Winton Series Trust and AXA Premier VIP Trust to 2017. Trustee of Winton Diversified Opportunities Fund (closed-end investment company) to 2018. |
JAY C. NADEL (Born: 1958) | Trustee (Since 2016) | Self-Employed Consultant since 2004. Executive Vice President, Bank of New York Broker Dealer from 2002 to 2004. Partner/Managing Director, Weiss Peck & Greer/ Robeco from 1986 - 2001. | Current Directorships: Trustee of City National Rochdale Funds, The Advisors’ Inner Circle Fund III, Schroder Series Trust and Schroder Global Series Trust. Former Directorships: Trustee of Winton Series Trust to 2017. Director of Lapolla Industries, Inc. to 2017. Trustee of Winton Diversified Opportunities Fund (closed-end investment company) to 2018. |
RANDALL S. YANKER (Born: 1960) | Trustee (Since 2014) | Co-Founder and Senior Partner, Alternative Asset Managers, L.P. since 2004. | Current Directorships: Trustee of The Advisors’ Inner Circle Fund III, Schroder Series Trust and Schroder Global Series Trust. Independent Non-Executive Director of HFA Holdings Limited. Former Directorships: Trustee of O’Connor EQUUS (closed-end investment company) to 2016. Trustee of Winton Series Trust to 2017. Trustee of Winton Diversified Opportunities Fund (closed-end investment company) to 2018. |
| 1 | Each Trustee shall hold office during the lifetime of this Trust until the election and qualification of his or her successor, or until he or she dies, resigns, or is removed in accordance with the Declaration of Trust. |
| 2 | Directorships of Companies required to report to the Securities and Exchange Commission under the Securities Exchange Act of 1934 (i.e., “public companies”) or other investment companies under the 1940 Act. |
| 3 | Trustees oversee 6 Funds in the Trust. |
TRUSTEES AND OFFICERS OF THE GALLERY TRUST
Name
and Year
of Birth | Position(s)
Held with the
Trust and Length
of Time Served | Principal Occupation
in the Past Five Years |
| OFFICERS | | |
MICHAEL BEATTIE (Born: 1965) | President (Since 2014) | Director of Client Service, SEI Investments Company, since 2004. |
JAMES BERNSTEIN (Born: 1962) | Vice President and Assistant Secretary (Since 2017) | Attorney, SEI Investments, since 2017. Prior Positions: Self-employed consultant, 2017. Associate General Counsel & Vice President, Nationwide Funds Group and Nationwide Mutual Insurance Company, from 2002 to 2016. Assistant General Counsel & Vice President, Market Street Funds and Provident Mutual Insurance Company, from 1999 to 2002. |
JOHN BOURGEOIS (Born: 1973) | Assistant Treasurer (Since 2017) | Fund Accounting Manager, SEI Investments, since 2000. |
STEPHEN CONNORS (Born: 1984) | Treasurer, Controller and Chief Financial Officer (Since 2015) | Director, SEI Investments, Fund Accounting, since 2014. Audit Manager, Deloitte & Touche LLP, from 2011 to 2014. |
DIANNE M. DESCOTEAUX (Born: 1977) | Vice President and Secretary (Since 2014) | Counsel at SEI Investments since 2010. Associate at Morgan, Lewis & Bockius LLP, from 2006 to 2010. |
RUSSELL
EMERY (Born: 1962) | Chief Compliance Officer (Since 2014) | Chief Compliance Officer of SEI Structured Credit Fund, LP since 2007. Chief Compliance Officer of The Advisors’ Inner Circle Fund, The Advisors’ Inner Circle Fund II, Bishop Street Funds, The KP Funds, The Advisors’ Inner Circle Fund III, Gallery Trust, Schroder Series Trust, Schroder Global Series Trust, SEI Institutional Managed Trust, SEI Asset Allocation Trust, SEI Institutional International Trust, SEI Institutional Investments Trust, SEI Daily Income Trust, SEI Tax Exempt Trust, Adviser Managed Trust, New Covenant Funds, SEI Insurance Products Trust and SEI Catholic Values Trust. Chief Compliance Officer of O’Connor EQUUS (closed-end investment company) to 2016. Chief Compliance Officer of SEI Liquid Asset Trust to 2016. Chief Compliance Officer of Winton Series Trust to 2017. Chief Compliance Officer of Winton Diversified Opportunities Fund (closed-end investment company) to 2018. |
MATTHEW M. MAHER (Born: 1975) | Vice President and Assistant Secretary (Since 2018) | Counsel at SEI Investments since 2018. Attorney, Blank Rome LLP, from 2015 to 2018. Assistant Counsel & Vice President, Bank of New York Mellon, from 2013 to 2014. Attorney, Dilworth Paxson LLP, from 2006 to 2013. |
TRUSTEES AND OFFICERS OF THE GALLERY TRUST
Name
and Year
of Birth | Position(s)
Held with the
Trust and Length
of Time Served | Principal Occupation
in the Past Five Years |
| OFFICERS — continued | |
ROBERT MORROW (Born: 1968) | Vice President (Since 2017) | Account Manager, SEI Investments, since 2007. |
BRIDGET E. SUDALL (Born: 1980) | Privacy Officer (Since 2015) Anti-Money Laundering Officer (Since 2015) | Senior Associate and AML Officer, Morgan Stanley Alternative Investment Partners, from 2011 to 2015. Investor Services Team Lead, Morgan Stanley Alternative Investment Partners, from 2007 to 2011. |
For shareholders that do not have an October 31, 2019 tax year end, this notice is for informational purposes only. For shareholders with an October 31, 2019 tax year end, please consult your tax advisor as to the pertinence of this notice. For the fiscal year ended October 31, 2019, the Funds are designating the following items with regard to distributions paid during the year.
| | | | | | | | Foreign Investors |
Return
of
Capital | Ordinary Income
Distributions | Long-Term Capital Gain
Distributions | Total
Distributions | Qualifying for Corporate Dividends Received Deduction
(1) | Qualifying Dividend Income
(2) | U.S. Government Interest
(3) | Interest Related Dividends
(4) | Short-Term Capital
Gain Dividends
(5) | Foreign Tax Credit
(6) |
| Mondrian International Value Equity Fund |
| 0.00% | 51.24% | 48.76% | 100.00% | 1.00% | 98.86% | 0.00% | 0.00% | 0.00% | 6.04% |
| Mondrian Emerging Markets Value Equity Fund |
| 0.00% | 100.00% | 0.00% | 100.00% | 0.00% | 0.00% | 0.00% | 0.00% | 0.00% | 0.00% |
| Mondrian International Government Fixed Income Fund |
| 11.12% | 82.17% | 6.71% | 100.00% | 0.00% | 0.00% | 0.00% | 0.00% | 100.00% | 0.00% |
| Mondrian U.S. Small Cap Equity Fund |
| 0.00% | 0.00% | 0.00% | 0.00% | 0.00% | 0.00% | 0.00% | 0.00% | 0.00% | 0.00% |
| Mondrian Global Listed Infrastructure Fund |
| 0.00% | 100.00% | 0.00% | 100.00% | 13.80% | 57.85% | 0.00% | 0.00% | 0.00% | 0.00% |
| (1) | Qualifying dividends represent dividends which qualify for the corporate dividends received deduction and is reflected as a percentage of ordinary income distributions (the total of short-term capital gain and net investment income distributions). |
| (2) | The percentage in this column represents the amount of “Qualifying Dividend Income” as created by the Jobs and Growth Tax Relief Reconciliation Act of 2003 and is reflected as a percentage of ordinary income distributions (the total of short-term capital gain and net investment income distributions). It is the intention of the Fund to designate the maximum amount permitted by law. |
| (3) | “U.S. Government Interest” represents the amount of interest that was derived from direct U.S. Government obligations and distributed during the fiscal year. This amount is reflected as a percentage of ordinary income. Generally, interest from direct U.S. Government obligations is exempt from state income tax. However, for shareholders of the Fund who are residents of California, Connecticut and New York, the statutory threshold requirements were not satisfied to permit exemption of these amounts from state income. |
| (4) | The percentage in this column represents the amount of “Interest Related Dividends” and is reflected as a percentage of ordinary income distributions. Interest related dividends are exempted from U.S. withholding tax when paid to foreign investors. |
| (5) | The percentage in this column represents the amount of “Short-Term Capital Gain Dividends” and is reflected as a percentage of short-term capital gain distributions that is exempted from U.S. withholding tax when paid to foreign investors. |
| (6) | The percentage in this column represents the amount of “Qualifying Foreign Taxes” as a percentage of ordinary distributions during the fiscal year ended October 31, 2019. The International Fund intends to pass through a Foreign Tax Credit to shareholders for fiscal year ended 2019. The total amount of foreign source income is $21,788,604. The total amount of foreign tax paid is $1,979,728. Your allocation share of the foreign tax credit will be reported on form 1099-DIV. |
| The information reported herein may differ from the information and distributions taxable to the shareholders for the calendar year ending December 31, 2019. Complete information will be computed and reported in conjunction with your 2019 Form 1099-DIV. |
FUND INFORMATION
| Registered office | P.O. Box 588 | |
| | Portland, ME 04112 | |
| | | |
| Adviser | Mondrian Investment Partners Limited | |
| | 10 Gresham Street, 5th Floor | |
| | London, England EC2V 7JD | |
| | | |
| Distributor | SEI Investments Distribution Co. | |
| | One Freedom Valley Drive | |
| | Oaks, PA 19456 | |
| | | |
| Administrator | SEI Investments Global Funds Services | |
| | One Freedom Valley Drive | |
| | Oaks, PA 19456 | |
| | | |
| Legal Counsel | Morgan, Lewis & Bockius LLP | |
| | 1701 Market Street | |
| | Philadelphia, PA 19103 | |
| | | |
| Custodian | Brown Brothers Harriman & Co | |
| | 40 Water Street | |
| | Boston, Massachusetts 02109 | |
| | | |
| Transfer Agent | Apex Fund Services | |
| | Three Canal Plaza | |
| | Portland, ME 04101 | |
| | | |
| Independent Registered | PricewaterhouseCoopers LLP | |
| Public Accounting Firm | 2001 Market Street | |
| | Philadelphia, PA 19103 | |
[This Page Intentionally Left Blank]
[This Page Intentionally Left Blank]
[This Page Intentionally Left Blank]
MON-AR-001-0400
Rothko Emerging Markets Equity Fund
Annual Report
October 31, 2019
| | |
| Investment Adviser: Rothko Investment Strategies, a division of
Mondrian Investment Partners Limited Beginning on March 1, 2021, as permitted by regulations adopted by the Securities and Exchange Commission, paper copies of the Fund’s shareholder reports will no longer be sent by mail, unless you specifically request paper copies of the reports from the Fund or from your financial intermediary, such as a broker-dealer or bank. Instead, the reports will be made available on a website, and you will be notified by mail each time a report is posted and provided with a website link to access the report. If you already elected to receive shareholder reports electronically, you will not be affected by this change and you need not take any action. You may elect to receive shareholder reports and other communications from the Fund electronically by contacting your financial intermediary or, if you are a direct investor, by calling 833-810-7344. You may elect to receive all future reports in paper free of charge. If you invest through a financial intermediary, you can follow the instructions included with this disclosure, if applicable, or you can contact your financial intermediary to inform it that you wish to continue receiving paper copies of your shareholder reports. If you invest directly with the Fund, you can inform the Fund that you wish to continue receiving paper copies of your shareholder reports by calling 833-810-7344. Your election to receive reports in paper will apply to all funds held with your financial intermediary if you invest through a financial intermediary or Mondrian Investment Partners Limited if you invest directly with the Fund. | |
| | |
TABLE OF CONTENTS
| Shareholder Letter | 1 |
| Portfolio Performance Review | 2 |
| Schedule of Investments | 5 |
| Statement of Assets and Liabilities | 13 |
| Statement of Operations | 14 |
| Statement of Changes in Net Assets | 15 |
| Financial Highlights | 16 |
| Notes to Financial Statements | 17 |
| Report of Independent Registered Public Accounting Firm | 31 |
| Disclosure of Fund Expenses | 33 |
| Trustees and Officers of the Gallery Trust | 35 |
| Notice to Shareholders | 39 |
| Fund Information | 40 |
| | |
The Fund files its complete schedule of investments of fund holdings with the Securities and Exchange Commission (the “Commission”) for the first and third quarters of each fiscal year on Form N-Q or as an exhibit to its reports on Form N-PORT within sixty days of the period end. The Fund’s Form N-Q and Form N-PORT are available on the Commission’s website at http://www.sec.gov, and may be reviewed and copied at the Commission’s Public Reference Room in Washington, DC. Information on the operation of the Public Reference Room may be obtained by calling 1-800-SEC-0330.
A description of the policies and procedures that the Fund uses to determine how to vote proxies relating to fund securities, as well as information relating to how a Fund voted proxies relating to fund securities will be available (i) without charge, upon request, by calling 1-833-810-7344; and (ii) on the Commission’s website at http://www.sec.gov.
This report has been prepared for shareholders and may be distributed to others only if preceded or accompanied by an effective prospectus.
SHAREHOLDER LETTER
Dear Shareholder,
We are pleased to provide the Rothko Emerging Markets Equity Fund (the “Fund”) annual report for the period ended October 31st, 2019. In the following pages we provide our portfolio manager discussion of the Fund’s performance since the Fund’s launch on December 18th, 2018. While it has been a challenging 10 1/2 months, especially for a value-oriented investment strategy, we are committed to defensive, value stocks with a strong potential for future income growth. Our ultimate goal is to participate in market upswings and strongly defend in market downturns — the key characteristics, we believe, in exploiting the ‘saw-toothed’ growth potential of emerging markets over the long-term.
For more information about the Rothko Mutual Fund please continue reading this report or visit www.rothko.com/mutualfunds. We would also be happy to speak with you at 833-810-7344.
Thank you,
Rothko Investment Strategies
PORTFOLIO PERFORMANCE REVIEW
Rothko Emerging Markets Equity Fund
(all returns in U.S. dollars)
Since Inception (December 18, 2018) ended October 31, 2019
The Rothko Emerging Markets Equity Fund (the “Fund”) launched during the last two weeks of 2018, a benign two week period for emerging markets where the MSCI Emerging Markets (“EM”) Index only returned 0.03%. The following ten months to October 31, 2019 were anything but... Over this period the MSCI EM Index bounced back from a weak 2018 rising by 10.4%. The index fell in only 3 out of the 10 months posted.
Major countries leading the charge the first ten months of 2019 included Russia (+40.4%), Taiwan (+25.0%), Brazil (+17.6%), and China (+12.0%). Russia’s performance presented a contradiction. Although the change in dividend policy at Gazprom was a positive sign for Russia’s otherwise highly challenged reputation for governance, Russia’s problematic geopolitical posture risks antagonizing more, and economically damaging, sanctions. We feel it best to stay well clear for now.
All sectors produced positive returns in the first ten months of 2019 with the exception of Materials (-4.2%). Information Technology (“Tech”) (+27.4%), Consumer Discretionary (+21.6%), and Energy (+16.7%) were the strongest performing sectors. Most notable was activity in Tech, specifically the two semi-conductor behemoths, TSMC and Samsung Electronics. TSMC’s profit guidance in September indicated to the market that the demand from 4G and the Internet of Things (“IoT”) – a term to describe how a refrigerator might communicate with a washing machine – was far higher than most people (including TSMC management themselves) had thought, which sent both names’ stock prices up by double digits. Our modelling framework considered both names to be trading at stretched valuations given past earnings. However, should IoT take off, as it appears it might, earnings of these names may see a material increase to the level that it is probably now priced in.
2019 through the end of October played out to the tune of trade war rhetoric. January to April saw, relatively benign trading conditions, with China and India performing well. However, May saw renewed concerns over the US-China trade war, resulting in a sharp sell-off of Chinese names. June through August saw Emerging Markets in range bound territory, as President Trump’s rhetoric both concerned and then relieved markets. However, this relief rally disproportionately benefitted more speculative names into September and beyond.
The Fund fared well in the darker months of 2019, specifically in May, when the MSCI EM Index fell by more than 7%. (The Fund outperformed index weakness in May by +2.7%.) However, the low quality rally in what we consider to be more speculative positions caused the index to outperform the Fund by +5% over the entire period under review (December 18th, 2018 – October 31st, 2019). This rally in mainly growth oriented names in China and South Korea detracted from Fund performance along with our underweight to Consumer Discretionary and Energy companies. Our underweight to Russia, where we remain extremely cautious of governance risks and sanctions, also detracted. Our expectation is for returns in many of these areas to unwind in favour of names with stronger intrinsic value. On the positive side, strong stock selection in Latin America (specifically, Brazil and Mexico) and within both the Healthcare and Industrials sectors benefited performance, as did an active overweight position to Taiwan and both Communication Services and Information Technology sectors.
Definition of Comparative Index
The MSCI Emerging Markets Index is a free float-adjusted market capitalization index designed to measure the equity market performance of emerging markets.
Growth of a $1,000,000 Investment
| | TOTAL RETURN
FOR THE PERIOD ENDED OCTOBER 31, 2019* |
| | Cumulative Inception to Date* |
| Rothko Emerging Markets Equity Fund | 5.76% |
| MSCI Emerging Markets Index | 10.93% |
| * | Commenced operations on December 18, 2018. |
The performance data quoted herein represents past performance and the return and value of an investment in the Fund will fluctuate so that, when redeemed, it may be worth less than its original cost. Past performance is no guarantee of future performance and should not be considered as a representation of the future results of the Fund. The Fund’s performance assumes the reinvestment of dividends and capital gains. Index returns assume reinvestment of dividends and, unlike a fund’s returns, do not reflect any fees or expenses. If such fees and expenses were included in the index returns, the performance would have been lower. Please note that one cannot invest directly in an unmanaged index.
There are no assurances that the Fund will meet its stated objectives. The Fund’s holdings and allocations are subject to change because it is actively managed and should not be considered recommendations to buy individual securities.
Returns shown do not reflect the deduction of taxes that a shareholder would pay on Fund distributions or the redemption of Fund shares. If the Adviser had not limited certain expenses, the Fund’s total return would have been lower.
See definition of the comparative index on page 3.
SCHEDULE OF INVESTMENTS
Sector Weightings† (unaudited):
† Percentages based on total investments.
| COMMON STOCK — 100.0% | | | | | | |
| | | | | | | |
| BRAZIL — 8.2% | | | | | | |
| BB Seguridade Participacoes SA | | | 7,100 | | | $ | 60,104 | |
CCR SA | | | 4,500 | | | | 18,626 | |
Cielo SA | | | 23,100 | | | | 43,199 | |
Cogna Educacao SA | | | 3,700 | | | | 8,940 | |
Hypera SA * | | | 6,200 | | | | 53,211 | |
| LOG Commercial Properties e Participacoes SA | | | 259 | | | | 1,625 | |
| MRV Engenharia e Participacoes SA | | | 3,600 | | | | 15,834 | |
Odontoprev SA | | | 3,600 | | | | 13,384 | |
Porto Seguro SA | | | 2,200 | | | | 31,454 | |
Qualicorp SA | | | 11,400 | | | | 91,047 | |
Smiles Fidelidade SA | | | 3,600 | | | | 33,087 | |
| Wiz Solucoes e Corretagem de Seguros SA | | | 23,700 | | | | | |
| Total Brazil | | | | | | | | |
| | | | | | | | | |
| CHILE — 1.1% | | | | | | | | |
Aguas Andinas SA | | | 84,443 | | | | 38,715 | |
CAP SA | | | 1,310 | | | | 9,609 | |
Enel Chile SA | | | 119,374 | | | | | |
| Total Chile | | | | | | | | |
The accompanying notes are an integral part of the financial statements.
| COMMON STOCK — continued | | | | | | | | |
| | | | | | | |
| CHINA — 26.9% | | | | | | | | |
361 Degrees International Ltd | | | 46,000 | | | $ | 9,451 | |
| Agricultural Bank of China Ltd Class H | | | 54,000 | | | | 22,259 | |
| Anhui Expressway Co Ltd Class H | | | 22,000 | | | | 12,943 | |
Bank of China Ltd Class H | | | 80,000 | | | | 32,772 | |
| Beijing Enterprises Water Group Ltd | | | 26,000 | | | | 13,604 | |
| Beijing Jingneng Clean Energy Co Ltd Class H | | | 234,000 | | | | 41,509 | |
| China Communications Services Corp Ltd Class H | | | 24,000 | | | | 14,855 | |
| China Construction Bank Corp Class H | | | 26,000 | | | | 20,937 | |
China Dongxiang Group Co Ltd | | | 299,000 | | | | 33,579 | |
China Everbright Ltd | | | 4,000 | | | | 5,942 | |
| China Galaxy Securities Co Ltd Class H | | | 24,000 | | | | 12,282 | |
China Lilang Ltd | | | 37,000 | | | | 29,842 | |
| China Merchants Port Holdings Co Ltd | | | 6,331 | | | | 9,922 | |
China Mobile Ltd | | | 1,500 | | | | 12,213 | |
| China Pioneer Pharma Holdings Ltd * | | | 106,000 | | | | 8,387 | |
| China Sanjiang Fine Chemicals Co Ltd | | | 188,000 | | | | 38,867 | |
| China Suntien Green Energy Corp Ltd Class H | | | 111,000 | | | | 32,297 | |
| Chongqing Machinery & Electric Co Ltd Class H | | | 156,000 | | | | 11,348 | |
| Chu Kong Shipping Enterprises Group Co Ltd | | | 62,000 | | | | 10,365 | |
| COSCO Shipping International Hong Kong Co Ltd | | | 38,000 | | | | 9,650 | |
CPMC Holdings Ltd | | | 28,000 | | | | 11,220 | |
| Dongfeng Motor Group Co Ltd Class H | | | 14,000 | | | | 14,079 | |
Fufeng Group Ltd | | | 27,000 | | | | 12,473 | |
| Great Wall Motor Co Ltd Class H | | | 15,500 | | | | 12,620 | |
| Greatview Aseptic Packaging Co Ltd | | | 74,000 | | | | 37,303 | |
Guangdong Investment Ltd | | | 10,000 | | | | 21,695 | |
| Guangzhou RF Properties Class H | | | 32,000 | | | | 49,741 | |
Guorui Properties Ltd | | | 183,000 | | | | 35,264 | |
| Hengan International Group Co Ltd | | | 1,500 | | | | 10,490 | |
| Hisense Home Appliances Group Co Ltd Class H | | | 26,000 | | | | 24,056 | |
| Huabao International Holdings Ltd | | | 129,000 | | | | 47,248 | |
| Industrial & Commercial Bank of China Ltd Class H | | | 19,000 | | | | 13,675 | |
| Jiangsu Expressway Co Ltd Class H | | | 12,000 | | | | 15,957 | |
Kingboard Holdings Ltd | | | 20,500 | | | | 54,808 | |
| Kingboard Laminates Holdings Ltd | | | 57,500 | | | | 52,833 | |
The accompanying notes are an integral part of the financial statements.
| COMMON STOCK — continued | | | | | | | | |
| | | | | | | |
| CHINA — continued | | | | | | | | |
| Lee Man Paper Manufacturing Ltd | | | 47,000 | | | $ | 26,211 | |
Lenovo Group Ltd | | | 120,000 | | | | 83,921 | |
Qingling Motors Co Ltd Class H | | | 178,000 | | | | 43,160 | |
Seaspan Corp | | | 3,654 | | | | 39,609 | |
| Shanghai Industrial Holdings Ltd | | | 7,000 | | | | 13,042 | |
| Sichuan Expressway Co Ltd Class H | | | 46,000 | | | | 13,443 | |
| Sihuan Pharmaceutical Holdings Group Ltd | | | 223,000 | | | | 29,312 | |
| Sinopec Shanghai Petrochemical Co Ltd Class H | | | 136,000 | | | | 37,836 | |
Texhong Textile Group Ltd | | | 11,000 | | | | 11,146 | |
Wasion Group Holdings Ltd | | | 82,000 | | | | 40,707 | |
| Xingda International Holdings Ltd | | | 146,909 | | | | 41,058 | |
Xinhua Winshare Publishing and Media Co Ltd
Class H | | | 72,000 | | | | 51,180 | |
Xinyi Solar Holdings Ltd | | | 85,948 | | | | 48,700 | |
Xtep International Holdings Ltd | | | 28,299 | | | | 16,468 | |
Yuexiu REIT | | | 84,000 | | | | 55,850 | |
| Yuexiu Transport Infrastructure Ltd | | | 22,000 | | | | 20,327 | |
Yuzhou Properties Co Ltd | | | 99,267 | | | | 42,058 | |
| Zhejiang Expressway Co Ltd Class H | | | 14,000 | | | | | |
| Total China | | | | | | | | |
| | | | | | | | | |
| CZECH REPUBLIC — 0.2% | | | | | | | | |
O2 Czech Republic AS | | | 1,271 | | | | | |
| Total Czech Republic | | | | | | | | |
| | | | | | | | | |
| HONG KONG — 0.0% | | | | | | | | |
| Shanghai Industrial Urban Development Group | | | 7,000 | | | | | |
| Total Hong Kong | | | | | | | | |
| | | | | | | | | |
| INDIA — 5.0% | | | | | | | | |
HDFC Bank Ltd Sponsored ADR | | | 1,182 | | | | 72,208 | |
ICICI Bank Ltd Sponsored ADR | | | 6,688 | | | | 87,145 | |
Infosys Ltd Sponsored ADR | | | 6,636 | | | | 63,639 | |
| Mahindra and Mahindra Ltd Sponsored GDR | | | 4,501 | | | | | |
| Total India | | | | | | | | |
The accompanying notes are an integral part of the financial statements.
| COMMON STOCK — continued | | | | | | | | |
| | | | | | | |
| INDONESIA — 3.0% | | | | | | | | |
| Bank Pembangunan Daerah Jawa Timur Tbk PT Class B | | | 1,179,200 | | | $ | 57,964 | |
Bukit Asam Tbk PT | | | 301,800 | | | | 48,376 | |
Tunas Baru Lampung Tbk PT | | | 432,900 | | | | 28,990 | |
Waskita Beton Precast Tbk PT | | | 993,700 | | | | | |
| Total Indonesia | | | | | | | | |
| | | | | | | | | |
| MALAYSIA — 3.1% | | | | | | | | |
AirAsia Group Bhd | | | 58,700 | | | | 26,832 | |
| Alliance Bank Malaysia Group Bhd | | | 14,100 | | | | 9,718 | |
CIMB Group Holdings Bhd | | | 8,706 | | | | 10,939 | |
Gas Malaysia Bhd | | | 20,700 | | | | 13,871 | |
Inari Amertron Bhd | | | 32,300 | | | | 15,228 | |
| Lingkaran Trans Kota Holdings Bhd | | | 10,300 | | | | 11,364 | |
| Malaysian Pacific Industries Bhd | | | 7,400 | | | | 18,949 | |
OSK Holdings Bhd | | | 78,000 | | | | 17,827 | |
Petronas Chemicals Group Bhd | | | 7,100 | | | | 12,693 | |
| Syarikat Takaful Malaysia Keluarga Bhd | | | 18,300 | | | | | |
| Total Malaysia | | | | | | | | |
| | | | | | | | | |
| MEXICO — 3.0% | | | | | | | | |
Bolsa Mexicana de Valores SAB | | | 8,851 | | | | 19,375 | |
| Concentradora Fibra Danhos SA de CV REIT | | | 17,324 | | | | 26,117 | |
| Concentradora Hipotecaria SAPI de CV REIT | | | 50,495 | | | | 49,611 | |
Gentera SAB de CV | | | 19,052 | | | | 18,818 | |
| Grupo Aeroportuario Pacifico Class B | | | 1,463 | | | | 15,335 | |
| Grupo Financiero Banorte SAB de CV | | | 2,510 | | | | 13,724 | |
Wal-Mart de Mexico SAB de CV | | | 5,824 | | | | | |
| Total Mexico | | | | | | | | |
| | | | | | | | | |
| PHILIPPINES — 1.9% | | | | | | | | |
Globe Telecom | | | 1,975 | | | | 70,990 | |
Manila Electric Co | | | 4,520 | | | | | |
| Total Philippines | | | | | | | | |
| | | | | | | | | |
The accompanying notes are an integral part of the financial statements.
| COMMON STOCK — continued | | | | | | | | |
| | | | | | | |
| POLAND — 1.7% | | | | | | | | |
Asseco Poland SA | | | 4,355 | | | $ | 58,475 | |
Budimex SA | | | 312 | | | | 10,779 | |
| Polskie Gornictwo Naftowe i Gazownictwo SA | | | 16,538 | | | | | |
| Total Poland | | | | | | | | |
| | | | | | | | | |
| QATAR — 1.0% | | | | | | | | |
| Almeera Consumer Goods Co QSC | | | 12,250 | | | | | |
| Total Qatar | | | | | | | | |
| | | | | | | | | |
| SOUTH AFRICA — 8.3% | | | | | | | | |
Absa Group Ltd | | | 4,033 | | | | 41,338 | |
AECI Ltd | | | 1,654 | | | | 10,689 | |
Assore Ltd | | | 2,228 | | | | 37,443 | |
Astral Foods Ltd | | | 2,089 | | | | 22,298 | |
AVI Ltd Class Y | | | 5,415 | | | | 31,041 | |
EOH Holdings Ltd * | | | 11,717 | | | | 12,050 | |
FirstRand Ltd | | | 3,157 | | | | 13,643 | |
Foschini Group Ltd | | | 916 | | | | 10,548 | |
Investec Ltd | | | 1,812 | | | | 10,303 | |
JSE Ltd | | | 2,855 | | | | 24,562 | |
Liberty Holdings Ltd | | | 5,559 | | | | 42,811 | |
Metair Investments Ltd | | | 9,296 | | | | 15,103 | |
Nedbank Group Ltd | | | 645 | | | | 9,783 | |
Peregrine Holdings Ltd | | | 28,763 | | | | 35,405 | |
RMB Holdings Ltd | | | 2,463 | | | | 12,954 | |
Sanlam Ltd | | | 2,364 | | | | 12,449 | |
Spar Group Ltd | | | 860 | | | | 11,555 | |
Telkom SA SOC Ltd | | | 12,408 | | | | 56,774 | |
Truworths International Ltd | | | 1,893 | | | | 6,711 | |
Tsogo Sun Gaming Ltd | | | 8,611 | | | | 7,083 | |
Tsogo Sun Hotels Ltd * | | | 8,611 | | | | 2,086 | |
Woolworths Holdings Ltd | | | 2,930 | | | | | |
| Total South Africa | | | | | | | | |
| | | | | | | | | |
| | | | | | | | | |
The accompanying notes are an integral part of the financial statements.
| COMMON STOCK — continued | | | | | | | | |
| | | | | | | |
| SOUTH KOREA — 11.2% | | | | | | | | |
Cheil Worldwide Inc | | | 3,239 | | | $ | 68,903 | |
Daekyo Co Ltd | | | 2,109 | | | | 11,130 | |
DB Insurance Co Ltd | | | 262 | | | | 11,372 | |
GS Home Shopping Inc | | | 93 | | | | 11,894 | |
Hana Financial Group Inc | | | 561 | | | | 16,250 | |
Huchems Fine Chemical Corp | | | 2,335 | | | | 44,354 | |
| Hyosung Advanced Materials Corp * | | | 25 | | | | 2,353 | |
Hyosung Chemical Corp | | | 18 | | | | 2,560 | |
Hyosung Corp | | | 378 | | | | 26,869 | |
| Hyosung Heavy Industries Corp * | | | 53 | | | | 1,289 | |
Hyosung TNC Co Ltd | | | 24 | | | | 3,311 | |
| Hyundai Marine & Fire Insurance Co Ltd | | | 1,626 | | | | 35,289 | |
Kangwon Land Inc | | | 558 | | | | 15,036 | |
KB Financial Group Inc | | | 270 | | | | 9,735 | |
Korea Autoglass Corp | | | 1,619 | | | | 23,448 | |
KT&G Corp | | | 624 | | | | 53,634 | |
Kyobo Securities Co Ltd | | | 1,644 | | | | 12,830 | |
Lotte Food Co Ltd | | | 23 | | | | 8,530 | |
| Meritz Fire & Marine Insurance Co Ltd | | | 2,965 | | | | 47,147 | |
| Mirae Asset Life Insurance Co Ltd | | | 3,026 | | | | 10,417 | |
Poongsan Holdings Corp | | | 342 | | | | 9,803 | |
| Samsung Fire & Marine Insurance Co Ltd | | | 61 | | | | 11,351 | |
Seah Besteel Corp | | | 639 | | | | 8,788 | |
SFA Engineering Corp | | | 496 | | | | 17,820 | |
Shinhan Financial Group Co Ltd | | | 352 | | | | 12,858 | |
SK Telecom Co Ltd | | | 273 | | | | 55,611 | |
Tongyang Life Insurance Co Ltd | | | 7,260 | | | | 22,870 | |
Woonglin Coway Co Ltd | | | 182 | | | | 14,360 | |
Woori Financial Group | | | 2,166 | | | | | |
| Total South Korea | | | | | | | | |
| | | | | | | | | |
| SPAIN — 0.9% | | | | | | | | |
Banco Santander SA | | | 11,918 | | | | | |
| Total Spain | | | | | | | | |
| | | | | | | | | |
The accompanying notes are an integral part of the financial statements.
| COMMON STOCK — continued | | | | | | | | |
| | | | | | | |
| TAIWAN — 20.3% | | | | | | | | |
| Cayman Engley Industrial Co Ltd | | | 3,000 | | | $ | 9,510 | |
| Charoen Pokphand Enterprise Co Ltd | | | 22,000 | | | | 47,338 | |
Chunghwa Telecom Co Ltd | | | 5,000 | | | | 18,397 | |
First Financial Holding Co Ltd | | | 82,820 | | | | 60,808 | |
Flytech Technology Co Ltd | | | 11,000 | | | | 25,476 | |
Getac Technology Corp | | | 40,000 | | | | 65,701 | |
Hiroca Holdings Ltd | | | 4,000 | | | | 8,384 | |
Inventec Corp | | | 74,000 | | | | 53,724 | |
| Lien Hwa Industrial Holdings Corp | | | 51,450 | | | | 58,565 | |
Merry Electronics Co Ltd | | | 12,193 | | | | 59,682 | |
Mitac Holdings Corp | | | 67,850 | | | | 59,736 | |
Namchow Holdings Co Ltd | | | 21,000 | | | | 34,218 | |
Pegatron Corp | | | 25,000 | | | | 48,702 | |
Quanta Computer Inc | | | 31,000 | | | | 59,575 | |
Rechi Precision Co Ltd | | | 40,000 | | | | 31,340 | |
| San Fang Chemical Industry Co Ltd | | | 14,000 | | | | 11,084 | |
Senao International Co Ltd | | | 21,000 | | | | 21,110 | |
Sitronix Technology Corp | | | 10,000 | | | | 59,789 | |
Supreme Electronics Co Ltd | | | 43,000 | | | | 41,036 | |
Systex Corp | | | 21,000 | | | | 51,050 | |
Taiwan Mobile Co Ltd | | | 16,000 | | | | 59,657 | |
Taiwan Styrene Monomer Corp | | | 42,000 | | | | 29,802 | |
TXC Corp | | | 25,000 | | | | 30,716 | |
TYC Brother Industrial Co Ltd | | | 15,000 | | | | 14,808 | |
| United Integrated Services Co Ltd | | | 16,000 | | | | 83,310 | |
Zeng Hsing Industrial Co Ltd | | | 6,000 | | | | | |
| Total Taiwan | | | | | | | | |
| | | | | | | | | |
| THAILAND — 2.2% | | | | | | | | |
Bangchak Corp PCL Foreign | | | 47,100 | | | | 38,529 | |
| Siamgas & Petrochemicals PCL Foreign | | | 168,200 | | | | 48,463 | |
Thai Vegetable Oil PCL Foreign | | | 36,600 | | | | | |
| Total Thailand | | | | | | | | |
| | | | | | | | | |
| | | | | | | | | |
The accompanying notes are an integral part of the financial statements.
| COMMON STOCK — continued | | | | | | | | |
| | | | | | | |
| TURKEY — 0.9% | | | | | | | | |
| Borusan Mannesmann Boru Sanayi | | | 5,673 | | | $ | 8,801 | |
Petkim Petrokimya Holding AS * | | | 11,713 | | | | 7,048 | |
Soda Sanayii AS | | | 13,460 | | | | 12,902 | |
| Tofas Turk Otomobil Fabrikasi AS | | | 2,400 | | | | 9,395 | |
| Turk Traktor ve Ziraat Makineleri AS * | | | 1,362 | | | | | |
| Total Turkey | | | | | | | | |
| | | | | | | | | |
| UNITED ARAB EMIRATES — 1.1% | | | | | | | | |
Dubai Islamic Bank PJSC | | | 38,793 | | | | | |
| Total United Arab Emirates | | | | | | | | |
| | | | | | | | | |
| Total Common Stock | | | | | | | | |
(Cost $5,215,436) | | | | | | | | |
| Total Value of Securities — 100.0% | | | | | | | | |
(Cost $5,215,436) | | | | | | | | |
Percentages are based on Net Assets of $5,286,228.
| * | Non-income producing security. |
ADR — American Depositary Receipt
GDR — Global Depositary Receipt
Ltd. — Limited
PJSC — Public Joint Stock Company
REIT — Real Estate Investment Trust
As of October 31, 2019, all of the Fund’s investments in securities were considered Level 1, in accordance with the authoritative guidance on fair value measurements and disclosure under U.S. GAAP.
For the period ended October 31, 2019, there were no transfers in or out of Level 3.
For more information on valuation inputs, see Note 2 in Notes to Financial Statements.
The accompanying notes are an integral part of the financial statements.
STATEMENT OF ASSETS AND LIABILITIES
| | | Rothko Emerging Markets Equity Fund | |
| Assets: | | | |
Investments (Cost $5,215,436) | | $ | 5,284,167 | |
Foreign currency (Cost $18,126) | | | 18,256 | |
Cash | | | 6,401 | |
Dividends receivable | | | 20,108 | |
Receivable from Investment Adviser | | | 9,464 | |
Deferred offering costs | | | 5,305 | |
Reclaims receivable | | | 1,189 | |
Prepaid expenses | | | | |
Total assets | | | | |
| | | | | |
| Liabilities: | | | | |
Offering costs payable to Adviser | | | 38,452 | |
Audit fees payable | | | 12,300 | |
Payable due to Administrator | | | 454 | |
Chief Compliance Officer fees payable | | | 47 | |
Payable due to Trustees | | | 1 | |
Other accrued expenses | | | | |
Total liabilities | | | | |
Net assets | | | | |
| | | | | |
| Net assets consist of: | | | | |
Paid-in capital | | $ | 5,007,153 | |
Total distributable earnings | | | | |
Net assets | | | | |
| | | | | |
| Outstanding Shares of Beneficial Interest | | | | |
(unlimited authorization - no par value) | | | | |
Net Asset Value, Offering and Redemption Price Per Share | | | | |
The accompanying notes are an integral part of the financial statements.
STATEMENT OF OPERATIONS
| | | Rothko Emerging Markets Equity Fund* | |
| Investment income | | | |
Dividends | | $ | 288,179 | |
Less: foreign taxes withheld | | | | |
Total investment income | | | | |
| Expenses | | | | |
Investment advisory fees | | | 34,397 | |
Offering costs | | | 33,148 | |
Audit and tax | | | 24,600 | |
| Dividend disbursing and transfer agent fees and expenses | | | 20,387 | |
Other | | | 14,359 | |
Custodian fees | | | 13,055 | |
Accounting and administration fees | | | 4,920 | |
Printing fees | | | 3,220 | |
Registration fees | | | 1,428 | |
Legal fees | | | 1,078 | |
Trustees’ fees and expenses | | | | |
Total expenses | | | | |
| Less: | | | | |
Investment advisory fees waived | | | (34,397 | ) |
Reimbursement from Investment Adviser | | | | |
Net expenses | | | | |
Net investment income | | | | |
| Net realized gain(loss) on: | | | | |
Investments | | | 15,812 | |
Foreign currency transactions | | | | |
Net realized gain | | | | |
| Net change in unrealized appreciation/(depreciation) on: | | | | |
Investments | | | 68,731 | |
| Foreign currency transactions and translation of other assets and liabilities denominated in foreign currency | | | | |
Net change in unrealized appreciation | | | | |
Net realized and unrealized gain | | | | |
| Net increase in net assets resulting from operations | | | | |
| * | Commenced Operations on December 18, 2018. |
The accompanying notes are an integral part of the financial statements.
STATEMENT OF CHANGES IN NET ASSETS
| | | Period Ended October 31, 2019* | |
| Operations: | | | |
Net investment income | | $ | 214,151 | |
Net realized gain on investments and foreign currency transactions | | | 3,103 | |
Net change in unrealized appreciation on investments,
foreign currency transactions and translation of other assets
and liabilities denominated in foreign currency | | | | |
| Net increase in net assets resulting from operations | | | | |
Distribution of Income | | | (7,700 | ) |
Capital share transactions(1): | | | | |
Issued | | | 5,000,000 | |
Reinvestment of dividends | | | 7,700 | |
Redeemed | | | | |
| Net increase in net assets from capital share transactions | | | | |
Total increase in net assets | | | | |
| Net assets: | | | | |
Beginning of period | | | | |
End of period | | | | |
| * | Commenced operations on December 18, 2018. |
| (1) | See Note 9 – Share Transactions in Notes to Financial Statements. |
Amounts designated as “—” are $0 or have been rounded to $0.
The accompanying notes are an integral part of the financial statements.
FINANCIAL HIGHLIGHTS
Selected per share data & ratios
for a share outstanding throughout the period
| | | Period Ended
October 31, 2019* | |
| | | | |
Net asset value, beginning of period | | | | |
Income from operations:(1) | | | | |
Net investment income | | | 0.43 | |
| Net realized and unrealized gain on investments | | | | |
Total gain from operations | | | | |
| Dividends and distributions from: | | | | |
Net investment income | | | | |
Total dividends and distributions | | | | |
Net asset value, end of period | | | | |
Total return† | | | | |
| Ratios and supplemental data | | | | |
Net assets, end of period ($ Thousands) | | $ | 5,286 | |
| Ratio of expenses to average net assets (including waivers and reimbursements) | | | 0.92 | %†† |
| Ratio of expenses to average net assets (excluding waivers and reimbursements) | | | 3.28 | %†† |
| Ratio of net investment income to average net assets | | | 4.65 | %†† |
Portfolio turnover rate | | | 1.33 | %‡ |
| * | Commenced operations December 18, 2018. |
| † | Total Return is for the period indicated and has not been annualized. Returns shown do not reflect the deductions of taxes that a shareholder would pay on Fund distributions or the redemption of Fund shares. Total return may have been lower had the Adviser not waived its fee and/or reimbursed other expenses. |
| ‡ | Portfolio turnover is for the period indicated and has not been annualized. |
| (1) | Per share calculations were performed using average shares for the period. |
The accompanying notes are an integral part of the financial statements.
NOTES TO FINANCIAL STATEMENTS
Gallery Trust (the “Trust”), is organized as a Delaware statutory trust under an Agreement and Declaration of Trust dated August 25, 2015. The Trust is registered under the Investment Company Act of 1940 (the “1940 Act”), as amended, as an open-end investment management company with six funds. The financial statements herein are those of the Rothko Emerging Markets Equity Fund (the “Fund”). The Fund is classified as diversified, under the 1940 Act. The investment objective of the Fund is to seek long-term total return by investing at least 80% of its net assets, plus any borrowings for investment purposes, in equity securities of emerging market companies. Rothko Investment Strategies, a division of Mondrian Investment Partners Limited, a limited company organized under the laws of England and Wales in 1990, serves as the Fund’s investment adviser (the “Adviser”). The Adviser makes investment decisions for the Fund and reviews, supervises and administers the investment program of the Fund, subject to the supervision of, and policies established by, the Trustees of the Trust. The Fund commenced operations on December 18, 2018.
| 2. | Significant accounting policies |
The following are significant accounting policies, which are consistently followed in the preparation of the financial statements of the Fund. The Fund is an investment company that applies the accounting and reporting guidance issued in Topic 946 by the U.S. Financial Accounting Standards Board (“FASB”).
Use of estimates — The preparation of financial statements in conformity with U.S. generally accepted accounting principles (“U.S. GAAP”) requires management to make estimates and assumptions that affect the fair value of assets, the reported amounts of assets and liabilities and disclosure of contingent assets and liabilities at the date of the financial statements and the reported amount of increases and decreases in net assets from operations during the reporting period. Actual results could differ from those estimates and such differences could be material.
Valuation of investments — Securities listed on a securities exchange, market or automated quotation system for which quotations are readily available (except for securities traded on NASDAQ), including securities traded over the counter, are valued at the last quoted sale price on an exchange or market (foreign or domestic) on which they are traded on valuation date (or at approximately 4:00 pm ET if a security’s primary
NOTES TO FINANCIAL STATEMENTS (continued)
exchange is normally open at that time), or, if there is no such reported sale on the valuation date, at the most recent quoted bid price. For securities traded on NASDAQ, the NASDAQ Official Closing Price will be used. If available, debt securities are priced based upon valuations provided by recognized independent, third-party pricing agents. Such values generally reflect the last reported sales price if the security is actively traded. The third-party pricing agents may also value debt securities by employing methodologies that utilize actual market transactions, broker-supplied valuations, or other methodologies designed to identify the market value for such securities. Such methodologies generally consider such factors as security prices, yields, maturities, call features, ratings and developments relating to specific securities in arriving at valuations. Debt securities with remaining maturities of sixty days or less may be valued at their amortized cost, which approximates market value. If such prices are not available or determined to not represent the fair value of the security as of the Fund’s pricing time, the security will be valued at fair value as determined in good faith using methods approved by the Board of Trustees (the “Board”). The prices for foreign securities will be reported in local currency and converted to U.S. dollars using currency exchange rates.
Securities for which market prices are not “readily available” are valued in accordance with fair value procedures established by the Fund’s Board. The Fund’s fair value procedures are implemented through a fair value pricing committee (the “Committee”) designated by the Board. Some of the more common reasons that may necessitate that a security be valued using fair value procedures include: the security’s trading has been halted or suspended; the security has been de-listed from a national exchange; the security’s primary trading market is temporarily closed at a time when under normal conditions it would be open; or the security’s primary pricing source is not able or willing to provide a price. When a security is valued in accordance with the fair value procedures, the Committee will determine the value after taking into consideration relevant information reasonably available to the Committee.
For securities that principally trade on a foreign market or exchange, a significant gap in time can exist between the time of a particular security’s last trade and the time at which the Fund calculates its net asset value. The closing prices of such securities may no longer reflect their market value at the time the Fund calculates net asset value if an event that could materially affect the value of those securities (a “Significant Event”) has
NOTES TO FINANCIAL STATEMENTS (continued)
occurred between the time of the security’s last close and the time that the Fund calculates net asset value. A Significant Event may relate to a single issuer or to an entire market sector. If the Fund’s Adviser becomes aware of a Significant Event that has occurred with respect to a security or group of securities after the closing of the exchange or market on which the security or securities principally trade, but before the time at which the Fund calculates net asset value, it may request that a Committee meeting be called.
The Fund uses MarkIt Fair Value (“MarkIt”) as a third party fair valuation vendor. MarkIt provides a fair value for foreign securities held by the Fund based on certain factors and methodologies (involving, generally, tracking valuation correlations between the U.S. market and each non-U.S. security) applied by MarkIt in the event that there is a movement in the U.S. market that exceeds a specific threshold that has been established by the Committee. The Committee has also established a “confidence interval” which is used to determine the level of correlation between the value of a foreign security and movements in the U.S. market before a particular security is fair valued when the threshold is exceeded. In the event that the threshold established by the Committee is exceeded on a specific day, the Fund values the non-U.S. securities in their portfolios that exceed the applicable “confidence interval” based upon the fair values provided by MarkIt. In such event, it is not necessary to hold a Committee meeting. In the event that the Adviser believes that the fair values provided by MarkIt are not reliable, the Adviser contacts the Fund’s Administrator and requests that a meeting of the Committee be held.
If a local market in which the Fund owns securities is closed for one or more days, the Fund shall value all securities held in the corresponding currency based on the fair value prices provided by MarkIt using the predetermined confidence interval discussed above.
In accordance with the authoritative guidance on fair value measurements and disclosure under U.S. GAAP, the Fund discloses the fair value of their investments in a hierarchy that prioritizes the inputs to valuation techniques used to measure the fair value. The objective of a fair value measurement is to determine the price that would be received to sell an asset or paid to transfer a liability in an orderly transaction between market participants at the measurement date (an exit price). Accordingly, the fair value hierarchy gives the highest priority to quoted prices
NOTES TO FINANCIAL STATEMENTS (continued)
(unadjusted) in active markets for identical assets or liabilities (Level 1) and the lowest priority to unobservable inputs (Level 3). The three levels of the fair value hierarchy are described below:
Level 1 — Inputs are unadjusted, quoted prices in active markets for identical assets or liabilities at the measurement date.
Level 2 — Inputs other than quoted prices included in Level 1 that are observable for the asset or liability, either directly or indirectly. Level 2 inputs include quoted prices for similar instruments in active markets, and inputs other than quoted prices that are observable for the asset or liability.
Level 3 — Inputs are unobservable inputs for the asset or liability, and include situations where there is little, if any, market activity for the asset or liability.
Investments are classified within the level of the lowest significant input considered in determining fair value. Investments classified within Level 3 whose fair value measurement considers several inputs may include Level 1 or Level 2 inputs as components of the overall fair value measurement.
Fair value measurement classifications are summarized in the Fund’s Schedule of Investments.
For the period ended October 31, 2019, there have been no significant changes to the Fund’s fair valuation methodology.
Federal income taxes — It is the Fund’s intention to continue to qualify as a regulated investment company for Federal income tax purposes by complying with the appropriate provisions of Subchapter M of the Internal Revenue Code of 1986. Accordingly, no provision for Federal income taxes has been made in the financial statements.
The Fund evaluates tax positions taken or expected to be taken in the course of preparing the Fund’s tax returns to determine whether it is “more-likely-than-not” (i.e., greater than 50-percent) that each tax position will be sustained upon examination by a taxing authority based on the technical merits of the position. Tax positions not deemed to meet the more-likely-than-not threshold are recorded as a tax benefit or expense in the current year. The Fund did not record any tax provision in the current period. However, management’s conclusions regarding tax positions taken may be subject to review and adjustment at a later date based on factors
NOTES TO FINANCIAL STATEMENTS (continued)
including, but not limited to, examination by tax authorities (i.e., the last three tax year ends, as applicable), on-going analysis of and changes to tax laws, regulations and interpretations thereof.
As of and during the period ended October 31, 2019, the Fund did not have a liability for any unrecognized tax benefits. The Fund recognizes interest and penalties, if any, related to unrecognized tax benefits as income tax expense in the Statement of Operations. During the period ended October 31, 2019, the Fund did not incur any interest or penalties.
Security transactions, dividend and investment income — Security transactions are accounted for on trade date basis for financial reporting purposes. Costs used in determining realized gains and losses on the sale of investment securities are based on the specific identification method. Dividend income is recognized on the ex-dividend date. Certain dividends from foreign securities will be recorded as soon as the Fund is informed of the dividend, net of withholding taxes, if such information is obtained subsequent to the ex-dividend date.
Foreign currency translation — The books and records of the Fund are maintained in U.S. dollars. Investment securities and other assets and liabilities denominated in a foreign currency are translated into U.S. dollars on the date of valuation. The Fund does not isolate that portion of realized or unrealized gains and losses resulting from changes in the foreign exchange rate from fluctuations arising from changes in the market prices of the securities. These gains and losses are included in net realized and unrealized gains and losses on investments on the Statement of Operations.
Net realized and unrealized gains and losses on foreign currency transactions represent net foreign exchange gains or losses from foreign currency exchange contracts, disposition of foreign currencies, currency gains or losses realized between trade and settlement dates on securities transactions and the difference between the amount of the investment income and foreign withholding taxes recorded on the Fund’s books and the U.S. dollar equivalent of the amounts actually received or paid.
Dividends and distributions to shareholders — The Fund distributes its net investment income at least annually. Net realized capital gains, if any, are also distributed at least annually. All distributions are recorded on ex-dividend date.
NOTES TO FINANCIAL STATEMENTS (continued)
Expenses — Expenses that are directly related to the Fund are charged to the Fund. Other operating expenses of the Trust are prorated to the fund based on the number of funds and/or relative daily net assets.
Offering Costs — During the period ended October 31, 2019, the Fund commenced operations and incurred offering costs in the amount of $38,167, which are being amortized to expense over a twelve month period. As of October 31, 2019, the Fund had $5,305 remaining to be amortized.
| 3. | Transactions with affiliates |
Certain officers of the Trust are also employees of SEI Investments Global Funds Services (the “Administrator”), a wholly owned subsidiary of SEI Investments Company, and/or SEI Investments Distribution Co. (the “Distributor”). Such officers are paid no fees by the Trust, other than the Chief Compliance Officer (“CCO”) as described below, for serving as officers of the Trust.
A portion of the services provided by the CCO and his staff, who are employees of the Administrator, are paid for by the Trust as incurred. The services include regulatory oversight of the Trust’s advisors and service providers, as required by SEC regulations. The CCO’s services and fees have been approved by and are reviewed by the Board.
| 4. | Administration, Custodian, Transfer Agent and Distribution Agreements |
The Fund and the Administrator are parties to an Administration Agreement under which the Administrator provides administrative services to the Fund. For these services, the Administrator is paid an asset based fee, which will vary depending on the number of share classes and the average daily net assets of the Fund. For the period ended October 31, 2019, the Fund paid $4,920 for these services. Expenses incurred under the agreements are shown on the Statement of Operations as “Accounting and administration fees”.
Brown Brothers Harriman & Co., (the “Custodian”) serves as the Fund’s Custodian pursuant to a custody agreement. Apex Fund Services (the “Transfer Agent”) serves as the Fund’s Transfer Agent pursuant to a transfer agency agreement.
NOTES TO FINANCIAL STATEMENTS (continued)
| 5. | Investment Advisory Agreement |
Under the terms of an investment advisory agreement, the Adviser provides investment advisory services to the Fund. The Adviser is entitled to a fee, which is calculated daily and paid monthly, at an annual rate of 0.75% of the average daily net assets of the Fund.
The Adviser has contractually agreed to reduce its fees and/or reimburse expenses to the extent necessary to keep total annual Fund operating expenses (excluding interest, taxes, brokerage commissions, acquired fund fees and expenses, and non-routine (collectively “excluded expenses”)) from exceeding 0.92% of the average daily net assets of the Fund until February 28, 2021 (the “Expense Limitation”). This agreement may be terminated: (i) by the Board of Trustees of the Fund for any reason at any time, or (ii) by the Adviser, upon ninety (90) days’ prior written notice to the Trust, effective as of the close of business on February 28, 2021.
| 6. | Investment transactions |
The cost of purchases and proceeds from security sales other than long-term U.S. Government and short-term securities for the period ended October 31, 2019, are as follows:
| 7. | Federal tax information |
The amount and character of income and capital gain distributions to be paid, if any, are determined in accordance with Federal income tax regulations, which may differ from U.S. GAAP. As a result, net investment income/(loss) and net realized gain/(loss) on investment transactions for a reporting period may differ significantly from distributions during such period. These book/tax differences may be temporary or permanent. To the extent these differences are permanent in nature, they are charged or credited to distributable earnings or paid-in capital, as appropriate, in the period that the differences arise.
The following permanent differences primarily attributable to non-deductible expenses have been reclassified to/from the following accounts:
NOTES TO FINANCIAL STATEMENTS (continued)
Distributable Earnings (Loss) | | |
| $ 547 | | $ (547) |
These reclassifications have no impact on net assets or net asset value per share.
The character of distributions made during the year from net investment income or net realized gains may differ from their ultimate characterization for federal income tax purposes. Also, due to the timing of dividend distributions, the fiscal year in which amounts are distributed may differ from the year that the income or realized gains (losses) were recorded by the Funds. Income dividends and capital gain distributions are determined in accordance with federal income tax regulations, which may differ from U.S. GAAP. These differences are primarily due to differing treatments for foreign currency transactions, and investments in PFICs. Distributions during the period ended October 31, 2019 were as follows:
As of October 31, 2019, the components of Distributable Earnings on a tax basis were as follows:
Undistributed ordinary income | | $ | 241,616 | |
Undistributed long-term capital gains | | | — | |
Capital loss carryforwards | | | — | |
| Net unrealized appreciation (depreciation) on investments | | | 37,460 | |
Other temporary differences | | | | |
Total distributable earnings | | | | |
Under the Regulated Investment Company Modernization Act of 2010, the Fund is permitted to carry forward capital losses incurred in taxable years beginning after December 22, 2010 for an unlimited period. Capital losses that are carried forward will retain their character as either short-term or long-term capital losses. For the period ended October 31, 2019, there were no capital loss carryforwards for the Fund.
NOTES TO FINANCIAL STATEMENTS (continued)
For Federal income tax purposes the difference between Federal tax cost and book cost primarily relates to passive foreign investment companies which cannot be used for Federal income tax purposes in the current year and have been deferred for use in future years. The Federal tax cost and aggregate gross unrealized appreciation and depreciation for the investments held by the Fund at October 31, 2019, were as follows:
| | Aggregate Gross Unrealized Appreciation | | Aggregate Gross Unrealized Depreciation | | Net
Unrealized
Appreciation |
| $ 5,246,950 | | $ 482,233 | | $ (444,773) | | $ 37,460 |
The share transactions are shown below:
| | | For the
period ended
October 31, 2019* | |
| Shares transactions: | | | |
| Institutional Class shares | | | |
Issued | | | 500,000 | |
Reinvestment of dividends | | | | |
Net increase in shares outstanding | | | | |
| * | Commenced operations on December 18, 2018. |
| 9. | Risks associated with financial instruments |
As with all mutual funds, a shareholder of a Fund is subject to the risk that his or her investment could lose money. The Fund is subject to the principal risks noted below, any of which may adversely affect the Fund’s net asset value and ability to meet its investment objective. A more complete description of risks associated with each Fund is included in the prospectus.
Active management risk
The Fund is subject to the risk that the Adviser’s judgments about the attractiveness, value, or potential appreciation of the Fund’s investments may prove to be incorrect. If the investments selected and strategies employed by
NOTES TO FINANCIAL STATEMENTS (continued)
the Fund fail to produce the intended results, the Fund could underperform in comparison to its benchmark index or other funds with similar objectives and investment strategies.
Equity risk
Since it purchases equity securities, the Fund is subject to the risk that stock prices may fall over short or extended periods of time. Historically, the equity markets have moved in cycles, and the value of the Fund’s equity securities may fluctuate from day to day. Individual companies may report poor results or be negatively affected by industry and/or economic trends and developments. The prices of securities issued by such companies may suffer a decline in response. These factors contribute to price volatility, which is the principal risk of investing in the Fund.
Large capitalization company risk
The large capitalization companies in which the Fund may invest may lag the performance of smaller capitalization companies because large capitalization companies may experience slower rates of growth than smaller capitalization companies and may not respond as quickly to market changes and opportunities.
Preferred stock risk
Preferred stocks are sensitive to interest rate changes, and are also subject to equity risk, which is the risk that stock prices will fall over short or extended periods of time. The rights of preferred stocks on the distribution of a company’s assets in the event of a liquidation are generally subordinate to the rights associated with a company’s debt securities.
Foreign company risk
Investing in foreign companies, including direct investments and investments through depositary receipts, poses additional risks since political and economic events unique to a country or region will affect those markets and their issuers. These risks will not necessarily affect the U.S. economy or similar issuers located in the U.S. Securities of foreign companies may not be registered with the SEC and foreign companies are generally not subject to the regulatory controls imposed on U.S. issuers and, as a consequence, there is generally less publically available information about foreign securities than is available about domestic securities. Income from foreign securities owned by the Fund may be reduced by a withholding tax at the source, which tax would reduce
NOTES TO FINANCIAL STATEMENTS (continued)
income received from the securities comprising the portfolio. Foreign securities may also be more difficult to value than securities of U.S. issuers. While depositary receipts provide an alternative to directly purchasing the underlying foreign securities in their respective national markets and currencies, investments in depositary receipts continue to be subject to many of the risks associated with investing directly in foreign securities.
Emerging markets securities risk
The Fund’s investments in emerging markets securities are considered speculative and subject to heightened risks in addition to the general risks of investing in foreign securities. Unlike more established markets, emerging markets may have governments that are less stable, markets that are less liquid and economies that are less developed. In addition, the securities markets of emerging market countries may consist of companies with smaller market capitalizations and may suffer periods of relative illiquidity; significant price volatility; restrictions on foreign investment; and possible restrictions on repatriation of investment income and capital. Furthermore, foreign investors may be required to register the proceeds of sales, and future economic or political crises could lead to price controls, forced mergers, expropriation or confiscatory taxation, seizure, nationalization or creation of government monopolies.
Foreign currency risk
As a result of the Fund’s investments in securities denominated in, and/or receiving revenues in, foreign currencies, the Fund will be subject to currency risk. Currency risk is the risk that foreign currencies will decline in value relative to the U.S. dollar or, in the case of hedging positions, that the U.S. dollar will decline in value relative to the currency hedged. In either event, the dollar value of an investment in the Fund would be adversely affected.
Depositary receipts risk
Investments in depositary receipts may be less liquid and more volatile than the underlying securities in their primary trading market. If a depositary receipt is denominated in a different currency than its underlying securities, the Fund will be subject to the currency risk of both the investment in the depositary receipt and the underlying security. Holders of depositary receipts may have limited or no rights to take action with respect to the underlying securities or to compel the issuer of the receipts to take action. The prices of depositary receipts may differ from the prices of securities upon which they are
NOTES TO FINANCIAL STATEMENTS (continued)
based. Certain of the depositary receipts in which the Fund invests may be unsponsored depositary receipts. Unsponsored depositary receipts may not provide as much information about the underlying issuer and may not carry the same voting privileges as sponsored depositary receipts. Unsponsored depositary receipts are issued by one or more depositaries in response to market demand, but without a formal agreement with the company that issues the underlying securities.
Liquidity risk
Certain securities may be difficult or impossible to sell at the time and the price that the Fund would like. The Fund may have to lower the price, sell other securities instead or forgo an investment opportunity, any of which could have a negative effect on Fund management or performance.
Portfolio turnover risk
Due to its investment strategies, the Fund may buy and sell securities frequently. This may result in higher transaction costs and additional capital gains tax liabilities.
Large purchase and redemption risk
Large purchases or redemptions of the Fund’s shares may force the Fund to purchase or sell securities at times when it would not otherwise do so, and may cause the Fund’s portfolio turnover rate and transaction costs to rise, which may negatively affect the Fund’s performance and have adverse tax consequences for Fund shareholders.
REITs Risk
REITs are pooled investment vehicles that own, and usually operate, income-producing real estate. REITs are susceptible to the risks associated with direct ownership of real estate, such as the following: declines in property values; increases in property taxes, operating expenses, interest rates or competition; overbuilding; zoning changes; and losses from casualty or condemnation. REITs typically incur fees that are separate from those of the Fund. Accordingly, the Fund’s investments in REITs will result in the layering of expenses such that shareholders will indirectly bear a proportionate share of the REITs’ operating expenses, in addition to paying Fund expenses. REIT operating expenses are not reflected in the fee table and example in this prospectus.
NOTES TO FINANCIAL STATEMENTS (continued)
Small- and Mid-Capitalization Company Risk
The small- and mid-capitalization companies in which the Fund may invest may be more vulnerable to adverse business or economic events than larger, more established companies. In particular, investments in these small- and mid-sized companies may pose additional risks, including liquidity risk, because these companies tend to have limited product lines, markets and financial resources, and may depend upon a relatively small management group. Therefore, small- and mid-cap stocks may be more volatile than those of larger companies. These securities may be traded over-the-counter or listed on an exchange.
Geographic Focus Risk
To the extent that it focuses its investments in a particular country or geographic region, the Fund may be more susceptible to economic, political, regulatory or other events or conditions affecting issuers and countries within that country or geographic region. As a result, the Fund may be subject to greater price volatility and risk of loss than a fund holding more geographically diverse investments.
New Fund Risk
Because the Fund is new, investors in the Fund bear the risk that the Fund may not be successful in implementing its investment strategy, may not employ a successful investment strategy, or may fail to attract sufficient assets under management to realize economies of scale, any of which could result in the Fund being liquidated at any time without shareholder approval and at a time that may not be favorable for all shareholders. Such liquidation could have negative tax consequences for shareholders and will cause shareholders to incur expenses of liquidation.
In the normal course of business, the Fund enters into contracts that provide general indemnifications. The Fund’s maximum exposure under these arrangements is dependent on future claims that may be made against the Fund and, therefore, cannot be established; however, based on experience, the risk of loss from such claims is considered remote.
NOTES TO FINANCIAL STATEMENTS (continued)
| 11. | Concentration of Shareholders |
At October 31, 2019, the percentage of total shares outstanding held by a limited number of shareholders for the Fund, which were comprised of omnibus accounts that were held on behalf of various individual shareholders was as follows:
| 12. | New accounting pronouncement |
In August 2018, the FASB issued Accounting Standards Update 2018-13, Fair Value Measurement (Topic 820). The new guidance includes additions and modifications to disclosures requirements for fair value measurements. For public entities, the amendments are effective for financial statements issued for fiscal years beginning after December 15, 2019, and interim periods within those fiscal years. Management elected to early adopt the removal of certain disclosures and delay the adoption of additional disclosure until the effective date.
The Fund has evaluated the need for disclosures and/or adjustments resulting from subsequent events through the date the financials were issued. Based on this evaluation, no disclosures and/or adjustments were required to the financial statements as of October 31, 2019.
REPORT OF INDEPENDENT REGISTERED PUBLIC ACCOUNTING FIRM
To the Board of Trustees of Gallery Trust and Shareholders of Rothko Emerging Markets Equity Fund.
Opinion on the Financial Statements
We have audited the accompanying statement of assets and liabilities, including the schedule of investments, of Rothko Emerging Markets Equity Fund (one of the Funds constituting Gallery Trust, hereafter referred to as the “Fund”) as of October 31, 2019, and the related statements of operations and changes in net assets, including the related notes, and the financial highlights for the period December 18, 2018 (commencement of operations) through October 31, 2019 (collectively referred to as the “financial statements”). In our opinion, the financial statements present fairly, in all material respects, the financial position of the Fund as of October 31, 2019, and the results of its operations, changes in its net assets, and the financial highlights for the period December 18, 2018 (commencement of operations) through October 31, 2019 in conformity with accounting principles generally accepted in the United States of America.
Basis for Opinion
These financial statements are the responsibility of the Fund’s management. Our responsibility is to express an opinion on the Fund’s financial statements based on our audit. We are a public accounting firm registered with the Public Company Accounting Oversight Board (United States) (PCAOB) and are required to be independent with respect to the Fund in accordance with the U.S. federal securities laws and the applicable rules and regulations of the Securities and Exchange Commission and the PCAOB.
We conducted our audit of these financial statements in accordance with the standards of the PCAOB. Those standards require that we plan and perform the audit to obtain reasonable assurance about whether the financial statements are free of material misstatement, whether due to error or fraud.
Our audit included performing procedures to assess the risks of material misstatement of the financial statements, whether due to error or fraud, and performing procedures that respond to those risks. Such procedures included examining, on a test basis, evidence regarding the amounts and disclosures in the financial statements. Our audit also included evaluating the accounting principles used and significant estimates made by management, as well as evaluating the overall presentation of the financial statements. Our
procedures included confirmation of securities owned as of October 31, 2019 by correspondence with the custodian. We believe that our audit provides a reasonable basis for our opinion.
/s/ PricewaterhouseCoopers LLP
Philadelphia, Pennsylvania
December 27, 2019
We have served as the auditor of one or more investment companies in Mondrian Investment Partners Limited since 2016.
DISCLOSURE OF FUND EXPENSES
All mutual funds have operating expenses. As a shareholder of a mutual fund, your investment is affected by these ongoing costs, which include (among others) costs for fund management, administrative services, and shareholder reports like this one. It is important for you to understand the impact of these costs on your investment returns.
Operating expenses such as these are deducted from the mutual fund’s gross income and directly reduce its final investment return. These expenses are expressed as a percentage of the mutual fund’s average net assets; this percentage is known as the mutual fund’s expense ratio.
The following examples use the expense ratio and are intended to help you understand the ongoing costs (in dollars) of investing in your Fund and to compare these costs with those of other mutual funds. The examples are based on an investment of $1,000 made at the beginning of the period shown and held for the entire period from May 1, 2019 to October 31, 2019.
The table on the next page illustrates your Fund’s costs in two ways:
Actual Fund Return. This section helps you to estimate the actual expenses after fee waivers that your Fund incurred over the period. The “Expenses Paid During Period” column shows the actual dollar expense cost incurred by a $1,000 investment in the Fund, and the “Ending Account Value” number is derived from deducting that expense cost from the Fund’s gross investment return.
You can use this information, together with the actual amount you invested in the Fund, to estimate the expenses you paid over that period. Simply divide your ending starting account value by $1,000 to arrive at a ratio (for example, an $8,600 account value divided by $1,000 = 8.6), then multiply that ratio by the number shown for your Fund under “Expenses Paid During Period.”
Hypothetical 5% Return. This section helps you compare your Fund’s costs with those of other mutual funds. It assumes that the Fund had an annual 5% return before expenses during the year, but that the expense ratio (Column 3) for the period is unchanged. This example is useful in making comparisons because the Securities and Exchange Commission requires all mutual funds to make this 5% calculation. You can assess your Fund’s comparative cost by comparing the hypothetical result for your Fund in the “Expenses Paid During Period” column with those that appear in the same charts in the shareholder reports for other mutual funds.
DISCLOSURE OF FUND EXPENSES
Note: Because the return is set at 5% for comparison purposes — NOT your Fund’s actual return — the account values shown may not apply to your specific investment.
| | Beginning
Account
Value
5/1/19 | Ending
Account
Value
10/31/19 | Annualized Expense Ratios | Expenses
Paid During Period* |
| | | | | |
| Actual Fund Return | $1,000.00 | $ 961.70 | 0.92% | $4.55 |
| Hypothetical 5% Return | $1,000.00 | $1,020.57 | 0.92% | $4.69 |
| * | Expenses are equal to the Fund’s annualized expense ratio multiplied by the average account value over the period, multiplied by 184/365 (to reflect the one-half year period). |
TRUSTEES AND OFFICERS OF THE GALLERY TRUST
Set forth below are the names, years of birth, positions with the Trust, length of term of office, and the principal occupations for the last five years of each of the persons currently serving as Trustees and Officers of the Trust. Unless otherwise noted, the business address of each Trustee is SEI Investments Company, 1 Freedom Valley Drive, Oaks, Pennsylvania 19456. Trustees who are deemed not to be “interested persons” of the Trust are referred to as “Independent Trustees.” Mr. Doran is a Trustee who may be deemed to be “interested” persons of the Trust as that term is defined in the 1940 Act by virtue of their affiliation with the Trust’s Distributor. The Trust’s Statement of Additional Information (“SAI”) includes additional information about the Trustees and Officers. The SAI may be obtained without charge by calling 1-833-810-7344.
The following chart lists Trustees and Officers as of October 31, 2019.
Name and
Year of Birth | Position
With Trust
and Length of
Time Served 1 | Principal
Occupations
in the Past Five Years | Other Directorships
Held in the Past Five Years 2 |
INTERESTED TRUSTEE 3 4 |
WILLIAM M. DORAN (Born: 1940) | Chairman of the Board of Trustees (Since 2014) | Self-Employed Consultant since 2003. Partner at Morgan, Lewis & Bockius LLP (law firm) from 1976 to 2003. Counsel to the Trust, SEI Investments, SIMC, the Administrator and the Distributor. Secretary of SEI Investments since 1978. | Current Directorships: Trustee of The Advisors’ Inner Circle Fund III, Schroder Series Trust, Schroder Global Series Trust, SEI Daily Income Trust, SEI Institutional International Trust, SEI Institutional Investments Trust, SEI Institutional Managed Trust, SEI Asset Allocation Trust, SEI Tax Exempt Trust, Adviser Managed Trust, New Covenant Funds, SEI Insurance Products Trust and SEI Catholic Values Trust. Director of SEI Investments, SEI Investments (Europe), Limited, SEI Investments—Global Funds Services, Limited, SEI Investments Global, Limited, SEI Investments (Asia), Limited, SEI Global Nominee Ltd., SEI Investments – Unit Trust Management (UK) Limited and SEI Investments Co. Director of the Distributor.
Former Directorships: Trustee of O’Connor EQUUS (closed-end investment company) to 2016. Trustee of SEI Liquid Asset Trust to 2016. Trustee of Winton Series Trust to 2017. Trustee of The Advisors’ Inner Circle Fund, The Advisors’ Inner Circle Fund II, Bishop Street Funds, The KP Funds and Winton Diversified Opportunities Fund (closed-end investment company) to 2018. |
| 1 | Each Trustee shall hold office during the lifetime of this Trust until the election and qualification of his or her successor, or until he or she dies, resigns, or is removed in accordance with the Declaration of Trust. |
| 2 | Directorships of Companies required to report to the Securities and Exchange Commission under the Securities Exchange Act of 1934 (i.e., “public companies”) or other investment companies under the 1940 Act. |
| 3 | Trustees oversee 6 Funds in the Trust. |
| 4 | Mr. Doran may be deemed to be an “interested” person of the Fund as that term is defined in the 1940 Act by virtue of his affiliation with the Distributor and/or its affiliates. |
TRUSTEES AND OFFICERS OF THE GALLERY TRUST
Name and Year of Birth | Position
with Trust
and Length of
Time Served 1 | Principal
Occupations
In the Past Five Years | Other Directorships
Held in the Past Five Years 2 |
INDEPENDENT TRUSTEES 3 |
JON C. HUNT (Born: 1951) | Trustee and Lead Independent Trustee (Since 2014) | Retired since 2013. Consultant to Management, Convergent Capital Management, LLC (“CCM”) from 2012 to 2013. Managing Director and Chief Operating Officer, CCM from 1998 to 2012. | Current Directorships: Trustee of City National Rochdale Funds, The Advisors’ Inner Circle Fund III, Schroder Series Trust and Schroder Global Series Trust.
Former Directorships: Trustee of O’Connor EQUUS (closed-end investment company) to 2016. Member of Independent Committee of Nuveen Commodities Asset Management to 2016. Trustee of Winton Series Trust to 2017. Trustee of Winton Diversified Opportunities Fund (closed-end investment company) to 2018. |
THOMAS P. LEMKE (Born: 1954) | Trustee (Since 2014) | Retired since 2013. Executive Vice President and General Counsel, Legg Mason, Inc. from 2005 to 2013. | Current Directorships: Trustee of The Advisors’ Inner Circle Fund III, Schroder Series Trust, Schroder Global Series Trust, JP Morgan Active Exchange-Traded Funds and Symmetry Panoramic Trust.
Former Directorships: Trustee of Munder Funds to 2014. Trustee of Victory Funds to 2015. Trustee of O’Connor EQUUS (closed-end investment company) to 2016. Trustee of Winton Series Trust and AXA Premier VIP Trust to 2017. Trustee of Winton Diversified Opportunities Fund (closed-end investment company) to 2018. |
JAY C. NADEL (Born: 1958) | Trustee (Since 2016) | Self-Employed Consultant since 2004. Executive Vice President, Bank of New York Broker Dealer from 2002 to 2004. Partner/Managing Director, Weiss Peck & Greer/ Robeco from 1986 - 2001. | Current Directorships: Trustee of City National Rochdale Funds, The Advisors’ Inner Circle Fund III, Schroder Series Trust and Schroder Global Series Trust.
Former Directorships: Trustee of Winton Series Trust to 2017. Director of Lapolla Industries, Inc. to 2017. Trustee of Winton Diversified Opportunities Fund (closed-end investment company) to 2018. |
RANDALL S. YANKER (Born: 1960) | Trustee (Since 2014) | Co-Founder and Senior Partner, Alternative Asset Managers, L.P. since 2004. | Current Directorships: Trustee of The Advisors’ Inner Circle Fund III, Schroder Series Trust and Schroder Global Series Trust. Independent Non-Executive Director of HFA Holdings Limited.
Former Directorships: Trustee of O’Connor EQUUS (closed-end investment company) to 2016. Trustee of Winton Series Trust to 2017. Trustee of Winton Diversified Opportunities Fund (closed-end investment company) to 2018. |
| 1 | Each Trustee shall hold office during the lifetime of this Trust until the election and qualification of his or her successor, or until he or she dies, resigns, or is removed in accordance with the Declaration of Trust. |
| 2 | Directorships of Companies required to report to the Securities and Exchange Commission under the Securities Exchange act of 1934 (i.e., “public companies”) or other investment companies under the 1940 Act. |
| 3 | Trustees oversee 6 Funds in the Trust. |
TRUSTEES AND OFFICERS OF THE GALLERY TRUST
Name and Year of Birth | Position(s) Held with the Trust and Length of Time Served | Principal Occupation in
the Past Five Years |
| OFFICERS | | |
MICHAEL BEATTIE (Born: 1965) | President (Since 2014) | Director of Client Service, SEI Investments Company, since 2004. |
JAMES BERNSTEIN (Born: 1962) | Vice President and Assistant Secretary (Since 2017) | Attorney, SEI Investments, since 2017.
Prior Positions: Self-employed consultant, 2017. Associate General Counsel & Vice President, Nationwide Funds Group and Nationwide Mutual Insurance Company, from 2002 to 2016. Assistant General Counsel & Vice President, Market Street Funds and Provident Mutual Insurance Company, from 1999 to 2002. |
JOHN BOURGEOIS (Born: 1973) | Assistant Treasurer (Since 2017) | Fund Accounting Manager, SEI Investments, since 2000. |
STEPHEN CONNORS (Born: 1984) | Treasurer, Controller and Chief Financial Officer (Since 2015) | Director, SEI Investments, Fund Accounting, since 2014. Audit Manager, Deloitte & Touche LLP, from 2011 to 2014. |
DIANNE M. DESCOTEAUX (Born: 1977) | Vice President and Secretary (Since 2014) | Counsel at SEI Investments since 2010. Associate at Morgan, Lewis & Bockius LLP, from 2006 to 2010. |
RUSSELL
EMERY (Born: 1962) | Chief Compliance Officer (Since 2014) | Chief Compliance Officer of SEI Structured Credit Fund, LP since 2007. Chief Compliance Officer of The Advisors’ Inner Circle Fund, The Advisors’ Inner Circle Fund II, Bishop Street Funds, The KP Funds, The Advisors’ Inner Circle Fund III, Gallery Trust, Schroder Series Trust, Schroder Global Series Trust, SEI Institutional Managed Trust, SEI Asset Allocation Trust, SEI Institutional International Trust, SEI Institutional Investments Trust, SEI Daily Income Trust, SEI Tax Exempt Trust, Adviser Managed Trust, New Covenant Funds, SEI Insurance Products Trust and SEI Catholic Values Trust. Chief Compliance Officer of O’Connor EQUUS (closed-end investment company) to 2016. Chief Compliance Officer of SEI Liquid Asset Trust to 2016. Chief Compliance Officer of Winton Series Trust to 2017. Chief Compliance Officer of Winton Diversified Opportunities Fund (closed-end investment company) to 2018. |
MATTHEW M. MAHER (Born: 1975) | Vice President and Assistant Secretary (Since 2018) | Counsel at SEI Investments since 2018. Attorney, Blank Rome LLP, from 2015 to 2018. Assistant Counsel & Vice President, Bank of New York Mellon, from 2013 to 2014. Attorney, Dilworth Paxson LLP, from 2006 to 2013. |
TRUSTEES AND OFFICERS OF THE GALLERY TRUST
Name and Year of Birth | Position(s) Held with the Trust and Length of Time Served | Principal Occupation in
the Past Five Years |
| OFFICERS — continued | |
ROBERT MORROW (Born: 1968) | Vice President (Since 2017) | Account Manager, SEI Investments, since 2007. |
BRIDGET E. SUDALL (Born: 1980) | Privacy Officer (Since 2015)
Anti-Money Laundering Officer (Since 2015) | Senior Associate and AML Officer, Morgan Stanley Alternative Investment Partners, from 2011 to 2015. Investor Services Team Lead, Morgan Stanley Alternative Investment Partners, from 2007 to 2011. |
For shareholders that do not have an October 31, 2019 tax year end, this notice is for informational purposes only. For shareholders with an October 31, 2019 tax year end, please consult your tax advisor as to the pertinence of this notice. For the fiscal period ended October 31, 2019, the Funds are designating the following items with regard to distributions paid during the year.
| | | | | | | Foreign Investors |
Ordinary Income Distributions | Long-Term Capital Gain Distributions | Total Distributions | Qualifying for Corporate Dividends Received Deduction (1) | Qualifying Dividend Income
(2) | U.S. Government Interest
(3) | Interest Related Dividends
(4) | Short-Term Capital Gain Dividends
(5) | Foreign
Tax
Credit |
| 100.00% | 0.00% | 100.00% | 0.00% | 34.70% | 0.00% | 0.00% | 0.00% | 0.00% |
| (1) | Qualifying dividends represent dividends which qualify for the corporate dividends received deduction and is reflected as a percentage of ordinary income distributions (the total of short-term capital gain and net investment income distributions). |
| (2) | The percentage in this column represents the amount of “Qualifying Dividend Income” as created by the Jobs and Growth Tax Relief Reconciliation Act of 2003 and is reflected as a percentage of ordinary income distributions (the total of short-term capital gain and net investment income distributions). It is the intention of the Fund to designate the maximum amount permitted by law. |
| (3) | “U.S. Government Interest” represents the amount of interest that was derived from direct U.S. Government obligations and distributed during the fiscal year. This amount is reflected as a percentage of ordinary income. Generally, interest from direct U.S. Government obligations is exempt from state income tax. However, for shareholders of the Fund who are residents of California, Connecticut and New York, the statutory threshold requirements were not satisfied to permit exemption of these amounts from state income. |
| (4) | The percentage in this column represents the amount of “Interest Related Dividends” and is reflected as a percentage of ordinary income distributions. Interest related dividends are exempted from U.S. withholding tax when paid to foreign investors. |
| (5) | The percentage in this column represents the amount of “Short-Term Capital Gain Dividends” and is reflected as a percentage of short-term capital gain distributions that is exempted from U.S. withholding tax when paid to foreign investors. |
| The information reported herein may differ from the information and distributions taxable to the shareholders for the calendar year ending December 31, 2019. Complete information will be computed and reported in conjunction with your 2018 Form 1099-DIV. |
| FUND INFORMATION | | |
| | | |
| Registered office | P.O. Box 588 | |
| | Portland, ME 04112 | |
| | | |
| Adviser | Rothko Investment Strategies, a division | |
| | of Mondrian Investment Partners Limited | |
| | 10 Gresham Street, 5th Floor | |
| | London, England EC2V 7JD | |
| | | |
| Distributor | SEI Investments Distribution Co. | |
| | One Freedom Valley Drive | |
| | Oaks, PA 19456 | |
| | | |
| Administrator | SEI Investments Global Funds Services | |
| | One Freedom Valley Drive | |
| | Oaks, PA 19456 | |
| | | |
| Legal Counsel | Morgan, Lewis & Bockius LLP | |
| | 1701 Market Street | |
| | Philadelphia, PA 19103 | |
| | | |
| Custodian | Brown Brothers Harriman & Co | |
| | 40 Water Street | |
| | Boston, Massachusetts 02109 | |
| | | |
| Transfer Agent | Apex Fund Services | |
| | Three Canal Plaza | |
| | Portland, ME 04101 | |
| | | |
| Independent Registered | PricewaterhouseCoopers LLP | |
| Public Accounting Firm | 2001 Market Street | |
| | Philadelphia, PA 19103 | |
[This Page Intentionally Left Blank]
MON-AR-003-0100
Item 2. Code of Ethics.
The Registrant has adopted a code of ethics that applies to the Registrant’s principal executive officer, principal financial officer, controller or principal accounting officer, and any person who performs a similar function. There have been no amendments to or waivers granted to this code of ethics.
Item 3. Audit Committee Financial Expert.
(a)(1) The Registrant’s board of trustees has determined that the Registrant has at least one audit committee financial expert serving on the audit committee.
(a)(2) The audit committee financial experts are Thomas Lemke and Jay Nadel, and each of Mr. Lemke and Mr. Nadel is considered to be “independent,” as that term is defined in Form N-CSR Item 3(a)(2).
Item 4. Principal Accountant Fees and Services.
Fees billed by PricewaterhouseCoopers LLP (“PwC”) relate to the Gallery Trust (the “Trust”).
PwC billed the Trust aggregate fees for services rendered to the Trust for the last two fiscal years as follows:
| | 2019 | 2018 |
| | | All fees and services to the Trust that were pre-approved | All fees and services to service affiliates that were pre-approved | All other fees and services to service affiliates that did not require pre-approval | All fees and services to the Trust that were pre-approved | All fees and services to service affiliates that were pre-approved | All other fees and services to service affiliates that did not require pre-approval |
| (a) | Audit Fees(1) | $151,300 | None | None | $75,400 | None | None |
| (b) | Audit-Related Fees | None | None | $128,689 | $22,500 | None | $136,057 |
| (c) | Tax Fees | None | None | $335,148(2)(3) | None | None | $164,500(2)(3) |
| (d) | All Other Fees | None | None | None | None | None | None |
Notes:
| (1) | Audit fees include amounts related to the audit of the Trust’s annual financial statements and services normally provided by the accountant in connection with statutory and regulatory filings. |
| (2) | Contains tax return preparation fees for affiliates of the Funds. |
| (3) | Contains tax compliance services provided to service affiliates of the Funds |
(e)(1) The Trust’s Audit Committee has adopted and the Board of Trustees has ratified an Audit and Non-Audit Services Pre-Approval Policy (the “Policy”), which sets forth the procedures and the conditions pursuant to which services proposed to be performed by the independent auditor of the Funds may be pre-approved.
The Policy provides that all requests or applications for proposed services to be provided by the independent auditor must be submitted to the Registrant’s Chief Financial Officer (“CFO”) and must include a detailed description of the services proposed to be rendered. The CFO will determine whether such services:
1. require specific pre-approval;
2. are included within the list of services that have received the general pre-approval of the Audit Committee pursuant to the Policy; or
3. have been previously pre-approved in connection with the independent auditor’s annual engagement letter for the applicable year or otherwise. In any instance where services require pre-approval, the Audit Committee will consider whether these services are consistent with SEC’s rules and whether the provision of these services would impair the auditor’s independence.
Requests or applications to provide services that require specific pre-approval by the Audit Committee will be submitted to the Audit Committee by the CFO. The Audit Committee will be informed by the CFO on a quarterly basis of all services rendered by the independent auditor. The Audit Committee has delegated specific pre-approval authority to either the Audit Committee Chair or financial expert, provided that the estimated fee for any said proposed pre-approved service does not exceed $100,000 and any pre-approval decisions are reported to the Audit Committee at the Audit Committee’s next regularly-scheduled meeting.
Services that have received the general pre-approval of the Audit Committee are identified and described in the Policy. In addition, the Policy sets forth a maximum fee per engagement with respect to each identified service that has received general pre-approval.
All services to be provided by the independent auditor shall be provided pursuant to a signed written engagement letter with the Registrant, the investment adviser or applicable control affiliate (except that matters as to which an engagement letter would be impractical because of timing issues or because the matter is small may not be the subject of an engagement letter) that sets forth both the services to be provided by the independent auditor and the total fees to be paid to the independent auditor for those services.
In addition, the Audit Committee has determined to take additional measures on an annual basis to meet the Audit Committee’s responsibility to oversee the work of the independent auditor and to assure the auditor's independence from the Registrant, such as (a) reviewing a formal written statement from the independent auditor delineating all relationships between the independent auditor and the Registrant, and (b) discussing with the independent auditor the independent auditor’s methods and procedures for ensuring independence.
| (e)(2) | Percentage of fees billed by PwC applicable to non-audit services pursuant to the “de minimis” exception of Rule 2-01(c)(7)(i)(C) were as follows: |
| | 2019 | 2018 |
| Audit-Related Fees | None | None |
| Tax Fees | None | None |
| All Other Fees | None | None |
(f) Not applicable.
(g) The aggregate non-audit fees and services billed by PwC for services rendered to the Registrant, and rendered to the Registrant’s investment adviser (not including any sub-adviser whose role is primarily portfolio management and is subcontracted with or overseen by another investment adviser), and any entity controlling, controlled by, or under common control with the adviser that provides ongoing services to the Registrant for the last fiscal-years-ended October 31st were $463,837 and $300,557 for 2019 and 2018, respectively.
(h) During the past fiscal year, all non-audit services provided by Registrant’s principal accountant to either Registrant’s investment adviser or to any entity controlling, controlled by, or under common control with Registrant’s investment adviser that provides ongoing services to Registrant were pre-approved by the Audit Committee of Registrant’s Board of Trustees. Included in the Audit Committee’s pre-approval of these non-audit services was the review and consideration as to whether the provision of these non-audit services is compatible with maintaining the principal accountant’s independence.
Item 5. Audit Committee of Listed Registrants.
Not applicable to open-end management investment companies.
Item 6. Schedule of Investments
Schedule of Investments is included as part of the Report to Shareholders filed under Item 1 of this form.
Item 7. Disclosure of Proxy Voting Policies and Procedures for Closed-End Management Investment Companies.
Not applicable to open-end management investment companies.
Item 8. Portfolio Managers of Closed-End Management Investment Companies
Not applicable to open-end management investment companies. Effective for closed-end management investment companies for fiscal years ending on or after December 31, 2005
Item 9. Purchases of Equity Securities by Closed-End Management Company and Affiliated Purchasers.
Not applicable to open-end management investment companies.
Item 10. Submission of Matters to a Vote of Security Holders.
There have been no changes to the procedures by which shareholders may recommend nominees to the Registrant’s Board of Trustees during the period covered by this report.
Item 11. Controls and Procedures.
(a) The Registrant's principal executive and principal financial officers, or persons performing similar functions have concluded that the Registrant's disclosure controls and procedures, as defined in Rule 30a-3(c) under the Act (17 CFR § 270.30a-3(c)), as of a date within 90 days of the filing date of the report, are effective based on the evaluation of these controls and procedures required by Rule 30a-3(b) under the Act (17 CFR § 270.30a-3(b)) and Rules 13a-15(b) or 15d-15(b) under the Securities Exchange Act, as amended (17 CFR § 270.30a-15(b) or § 240.15d-15(b)).
(b) There has been no change in the Registrant's internal control over financial reporting (as defined in Rule 30a-3(d) under the Act (17 CFR § 270.3a-3(d)) that occurred during the period covered by this report that has materially affected, or is reasonably likely to materially affect, the Registrant's internal control over financial reporting.
Items 12. Disclosure of Securities Lending Activities for Closed-End Management Investment Companies.
Not applicable to open-end management investment companies.
Items 13. Exhibits.
(a)(1) A copy of the Registrant's Code of Ethics, as required by Item 2 of this Form, accompanies this filing as an exhibit.
(a)(2) A separate certification for the principal executive officer and the principal financial officer of the Registrant, as required by Rule 30a-2(a) under the Act (17 CFR § 270.30a-2(a)), is filed herewith.
(b) Officer certifications as required by Rule 30a-2(b) under the Act (17 CFR § 270.30a-2(b)), also accompany this filing as an exhibit.
SIGNATURES
Pursuant to the requirements of the Securities Exchange Act of 1934 and the Investment Company Act of 1940, the Registrant has duly caused this report to be signed on its behalf by the undersigned, thereunto duly authorized.
| (Registrant) | | Gallery Trust | |
| | | | |
By (Signature and Title)
| | /s/ Michael Beattie | |
| | | Michael Beattie | |
| | President | |
Pursuant to the requirements of the Securities Exchange Act of 1934 and the Investment Company Act of 1940, this report has been signed below by the following persons on behalf of the Registrant and in the capacities and on the dates indicated.
By (Signature and Title)
| | /s/ Michael Beattie | |
| | | Michael Beattie | |
| | President | |
| | | | |
By (Signature and Title)
| | /s/ Stephen Connors | |
| | | Stephen Connors | |
| | Treasurer, Controller, and CFO | |