| Gallery Trust | October 31, 2022 |
| | |
| NOTES TO FINANCIAL STATEMENTS | |
1. Organization
Gallery Trust (the “Trust”), is organized as a Delaware statutory trust under an Agreement and Declaration of Trust dated August 25, 2015. The Trust is registered under the Investment Company Act of 1940 (the “1940 Act”), as amended, as an open-end investment management company with five funds. The financial statements herein are those of the Mondrian International Value Equity Fund (formerly, Mondrian International Equity Fund) (the “International Fund”), Mondrian Emerging Markets Value Equity Fund (formerly, the Mondrian Emerging Markets Equity Fund) (the “Emerging Markets Fund”) the Mondrian International Government Fixed Income Fund (the “International Government Fixed Income Fund”), the Mondrian Global Listed Infrastructure Fund (the “Global Listed Infrastructure Fund”), and the Mondrian Global Equity Value Fund (the “Global Equity Value Fund”) (each a “Fund” and collectively the “Funds”). The International Fund, Emerging Markets Fund and Global Listed Infrastructure Fund are classified as diversified, and the Fixed Income Fund and Global Equity Value Fund are classified as “non-diversified” under the 1940 Act. The investment objective of the International Fund is to seek longterm total return by investing at least 80% of its net assets, plus any borrowings for investment purposes, in equity securities. The investment objective of the Emerging Markets Fund is to seek long-term capital appreciation. The investment objective of the Fixed Income Fund is to seek long-term total return consistent with its value-oriented investment approach. The investment objective of the Global Listed Infrastructure Fund is to seek long-term total return by investing at least 80% of its net assets, plus any borrowings for investment purposes, in equity securities of infrastructure companies listed on a domestic or foreign exchange. The investment objective of the Global Equity Value Fund is to seek long-term total return. Mondrian Investment Partners Limited, a limited company organized under the laws of England and Wales in 1990, serves as the Funds’ investment adviser (“Mondrian” or the “Adviser”). The Adviser makes investment decisions for the Funds and reviews, supervises and administers the investment program of the Funds, subject to the supervision of, and policies established by, the Trustees of the Trust.
The International Fund operated as The International Equity Portfolio, a series of Delaware Pooled Trust (the “International Predecessor Fund”), prior to the International Fund’s acquisition of the assets and assumption of the liabilities of the International Predecessor Fund (the “Reorganization”) on March 14, 2016 in a tax-free transaction. The International Fund had no operations prior to the Reorganization. The International Predecessor Fund was managed by Delaware Management Company, a series of Delaware Management Business Trust (the
56
| Gallery Trust | October 31, 2022 |
| | |
| NOTES TO FINANCIAL STATEMENTS (continued) | |
“Delaware Predecessor Adviser”), and sub-advised by Mondrian Investment Partners Limited. The International Predecessor Fund had substantially similar investment objectives and strategies as those of the International Fund. The financial statements and financial highlights reflect the financial information of the International Predecessor Fund for periods prior to March 14, 2016.
The Emerging Markets Fund and Fixed Income Fund operated as Laudus Mondrian Emerging Markets Fund (the “Emerging Markets Predecessor Fund”) and Laudus Mondrian International Government Fixed Income Fund (the “Fixed Income Predecessor Fund”) and, together, were a series of Laudus Trust. Each Predecessor Fund was managed by Charles Schwab Investment Management, Inc. (the “Predecessor Adviser”), and sub-advised by Mondrian. Each Fund has the same objective and substantially similar investment strategies as those of its Predecessor Fund. Each Fund acquired the assets and assumed all of the liabilities of its Predecessor Fund (the “Reorganization”) on September 24, 2018 in a tax-free transaction. The Funds had no operations prior to the Reorganization. The financial statements and financial highlights reflect the financial information of the Predecessor Funds for periods prior to September 24, 2018.
Effective October 31, 2018, the Emerging Markets Fund and International Government Fixed Income Fund changed their fiscal year end from March 31 to October 31.
The Global Listed Infrastructure Fund commenced operations on December 17, 2018.
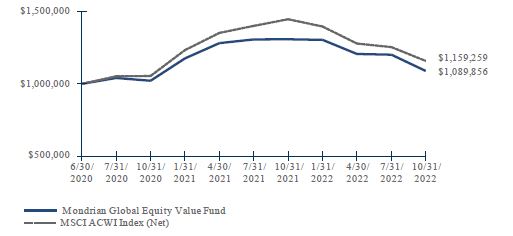
The Global Equity Value Fund commenced operations on June 30, 2020.
On June 23, 2022, the Trust’s Board of Trustees approved the closing of Mondrian U.S. Small Cap Equity Fund to new investors and the subsequent liquidation of the Fund on July 11, 2022.
2. Significant accounting policies
The following are significant accounting policies, which are consistently followed in the preparation of the financial statements of the Funds. The Funds are investment companies that apply the accounting and reporting guidance issued in Topic 946 by the U.S. Financial Accounting Standards Board (“FASB”).
Use of estimates — The preparation of financial statements, in conformity with U.S. generally accepted accounting principles (“U.S. GAAP”), requires
57
| Gallery Trust | October 31, 2022 |
| | |
| NOTES TO FINANCIAL STATEMENTS (continued) | |
management to make estimates and assumptions that affect the fair value of assets, the reported amounts of assets and liabilities and disclosure of contingent assets and liabilities at the date of the financial statements and the reported amount of increases and decreases in net assets from operations during the reporting period. Actual results could differ from those estimates and such differences could be material.
Valuation of investments — Securities listed on a securities exchange, market or automated quotation system for which quotations are readily available (except for securities traded on NASDAQ ), including securities traded over the counter, are valued at the last quoted sale price on an exchange or market (foreign or domestic) on which they are traded on valuation date (or at approximately 4:00 pm ET if a security’s primary exchange is normally open at that time), or, if there is no such reported sale on the valuation date, at the most recent quoted bid price. For securities traded on NASDAQ , the NASDAQ Official Closing Price will be used. If available, debt securities are priced based upon valuations provided by recognized independent, third-party pricing agents. Such values generally reflect the last reported sales price if the security is actively traded. The third-party pricing agents may also value debt securities by employing methodologies that utilize actual market transactions, broker-supplied valuations, or other methodologies designed to identify the market value for such securities. Such methodologies generally consider such factors as security prices, yields, maturities, call features, ratings and developments relating to specific securities in arriving at valuations. Debt securities with remaining maturities of sixty days or less may be valued at their amortized cost, which approximates market value. If such prices are not available or determined to not represent the fair value of the security as of each Fund’s pricing time, the security will be valued at fair value as determined in good faith using methods approved by the Board of Trustees (the “Board”). The prices for foreign securities will be reported in local currency and converted to U.S. dollars using currency exchange rates.
Securities for which market prices are not “readily available” are required to be fair valued under the 1940 Act.
In December 2020, the SEC adopted Rule 2a-5 under the 1940 Act, establishing requirements to determine fair value in good faith for purposes of the 1940 Act. The rule permits fund boards to designate a fund’s investment adviser to perform fair-value determinations, subject to board oversight and certain other conditions. The rule also defines when market
58
| Gallery Trust | October 31, 2022 |
| | |
| NOTES TO FINANCIAL STATEMENTS (continued) | |
quotations are “readily available” for purposes of the 1940 Act and requires a fund to fair value a portfolio investment when a market quotation is not readily available. The SEC also adopted new Rule 31a-4 under the 1940 Act, which sets forth recordkeeping requirements associated with fair-value determinations. The compliance date for Rule 2a-5 and Rule 31a-4 was September 8, 2022.
Effective September 8, 2022, and pursuant to the requirements of Rule 2a-5, the Board designated the Adviser as the Board’s valuation designee to perform fair-value determinations for the Funds through a Fair Value Committee (the “Committee”) established by the Adviser and approved new Adviser Fair Value Procedures for the Funds. Prior to September 8, 2022, fair-value determinations were performed in accordance with the Trust’s Fair Value Procedures established by the Board and were implemented through a Fair Value Committee designated by the Board.
Some of the more common reasons that may necessitate that a security be valued using fair value procedures include: the security’s trading has been halted or suspended; the security has been de-listed from a national exchange; the security’s primary trading market is temporarily closed at a time when under normal conditions it would be open; or the security’s primary pricing source is not able or willing to provide a price. When a security is valued in accordance with the fair value procedures, the Committee will determine the value after taking into consideration relevant information reasonably available to the Committee.
For securities that principally trade on a foreign market or exchange, a significant gap in time can exist between the time of a particular security’s last trade and the time at which the Fund calculates its net asset value. The closing prices of such securities may no longer reflect their market value at the time the Fund calculates net asset value if an event that could materially affect the value of those securities (a “Significant Event”) has occurred between the time of the security’s last close and the time that the Fund calculates net asset value. A Significant Event may relate to a single issuer or to an entire market sector. If the Funds’ Adviser becomes aware of a Significant Event that has occurred with respect to a security or group of securities after the closing of the exchange or market on which the security or securities principally trade, but before the time at which the Fund calculates net asset value, it may request that a Committee meeting be called.
The Funds use Intercontinental Exchange Data Pricing & Reference Data, LLC. (“ICE”) as a third party fair valuation vendor. ICE provides a fair
59
| Gallery Trust | October 31, 2022 |
| | |
| NOTES TO FINANCIAL STATEMENTS (continued) | |
value for foreign securities held by the Funds based on certain factors and methodologies (involving, generally, tracking valuation correlations between the U.S. market and each non-U.S. security) applied by ICE in the event that there is a movement in the U.S. market that exceeds a specific threshold that has been established by the Committee. The Committee has also established a “confidence interval” which is used to determine the level of correlation between the value of a foreign security and movements in the U.S. market before a particular security is fair valued when the threshold is exceeded. In the event that the threshold established by the Committee is exceeded on a specific day, the Funds value the non-U.S. securities in their portfolios that exceed the applicable “confidence interval” based upon the fair values provided by ICE. In such event, it is not necessary to hold a Committee meeting. In the event that the Adviser believes that the fair values provided by ICE are not reliable, the Adviser contacts the Funds’ Administrator and requests that a meeting of the Committee be held.
If a local market in which the Funds own securities is closed for one or more days, the Funds shall value all securities held in the corresponding currency based on the fair value prices provided by ICE using the predetermined confidence interval discussed above.
In accordance with the authoritative guidance on fair value measurements and disclosure under U.S. GAAP, the Funds disclose the fair value of their investments in a hierarchy that prioritizes the inputs to valuation techniques used to measure the fair value. The objective of a fair value measurement is to determine the price that would be received to sell an asset or paid to transfer a liability in an orderly transaction between market participants at the measurement date (an exit price). Accordingly, the fair value hierarchy gives the highest priority to quoted prices (unadjusted) in active markets for identical assets or liabilities (Level 1) and the lowest priority to unobservable inputs (Level 3). The three levels of the fair value hierarchy are described below:
Level 1 — Inputs are unadjusted, quoted prices in active markets for identical assets or liabilities at the measurement date.
Level 2 — Inputs other than quoted prices included in Level 1 that are observable for the asset or liability, either directly or indirectly. Level 2 inputs include quoted prices for similar instruments in active markets, and inputs other than quoted prices that are observable for the asset or liability.
Level 3 — Inputs are unobservable inputs for the asset or liability, and
60
| Gallery Trust | October 31, 2022 |
| | |
| NOTES TO FINANCIAL STATEMENTS (continued) | |
include situations where there is little, if any, market activity for the asset or liability.
Investments are classified within the level of the lowest significant input considered in determining fair value. Investments classified within Level 3 whose fair value measurement considers several inputs may include Level 1 or Level 2 inputs as components of the overall fair value measurement.
Fair value measurement classifications are summarized in the Funds’ Schedule of Investments.
Federal income taxes — It is each Fund’s intention to continue to qualify as a regulated investment company for Federal income tax purposes by complying with the appropriate provisions of Subchapter M of the Internal Revenue Code of 1986. Accordingly, no provision for Federal income taxes has been made in the financial statements.
The Funds evaluate tax positions taken or expected to be taken in the course of preparing the Funds’ tax returns to determine whether it is “morelikely- than-not” (i.e., greater than 50-percent) that each tax position will be sustained upon examination by a taxing authority based on the technical merits of the position. Tax positions not deemed to meet the more-likelythan- not threshold are recorded as a tax benefit or expense in the current year. The Funds did not record any tax provision in the current period. However, management’s conclusions regarding tax positions taken may be subject to review and adjustment at a later date based on factors including, but not limited to, examination by tax authorities (i.e., the last three tax year ends, as applicable), on-going analysis of and changes to tax laws, regulations and interpretations thereof.
As of and during the year ended October 31, 2022, the Funds did not have a liability for any unrecognized tax benefits. The Funds recognize interest and penalties, if any, related to unrecognized tax benefits as income tax expense in the Statement of Operations. During the year ended October 31, 2022, the Funds did not incur any interest or penalties.
Security transactions, dividend and investment income — Security transactions are accounted for on trade date basis for financial reporting purposes. Costs used in determining realized gains and losses on the sale of investment securities are based on the specific identification method. Dividend income is recognized on the ex-dividend date. Interest income is recognized on the accrual basis from settlement date. Purchase discounts and premiums on debt securities are accreted and amortized to maturity
61
| Gallery Trust | October 31, 2022 |
| | |
| NOTES TO FINANCIAL STATEMENTS (continued) | |
and included in interest income. Certain dividends from foreign securities will be recorded as soon as the Funds are informed of the dividend, net of withholding taxes, if such information is obtained subsequent to the exdividend date.
Foreign currency translation — The books and records of the Funds are maintained in U.S. dollars. Investment securities and other assets and liabilities denominated in a foreign currency are translated into U.S. dollars on the date of valuation. The Funds do not isolate that portion of realized or unrealized gains and losses resulting from changes in the foreign exchange rate from fluctuations arising from changes in the market prices of the securities. These gains and losses are included in net realized and unrealized gains and losses on investments on the Statement of Operations.
Net realized and unrealized gains and losses on foreign currency transactions represent net foreign exchange gains or losses from foreign currency exchange contracts, disposition of foreign currencies, currency gains or losses realized between trade and settlement dates on securities transactions and the difference between the amount of the investment income and foreign withholding taxes recorded on the Funds’ books and the U.S. dollar equivalent of the amounts actually received or paid.
Forward Foreign Currency Contracts — The Funds may enter into forward foreign currency contracts as hedges against either specific transactions, fund positions or anticipated fund positions. The Funds may also engage in currency transactions to enhance the Funds’ returns. All commitments are “marked-to-market” daily at the applicable foreign exchange rate, and any resulting unrealized gains or losses are recorded currently. The Funds realize gains and losses at the time forward contracts are closed. Unrealized gains or losses on outstanding positions in forward foreign currency contracts held at the close of the period are recognized as ordinary income or loss for Federal income tax purposes. The Funds could be exposed to risk if the counterparties to the contracts are unable to meet the terms of the contract and from unanticipated movements in the value of a foreign currency relative to the U.S. dollar. Finally, the risk exists that losses could exceed amounts disclosed on the Statement of Assets and Liabilities. Refer to each Fund’s Schedule of Investments for details regarding open forward foreign currency contracts as of October 31, 2022, if applicable.
For the year ended October 31, 2022, the average balances of forward foreign currency exchange contracts for the International Government Fixed Income Fund were as follows:
62
| Gallery Trust | October 31, 2022 |
| | |
| NOTES TO FINANCIAL STATEMENTS (continued) | |
| Average Monthly Notional Contracts Purchased | | $ | (1,568,990 | ) |
| Average Monthly Notional Contracts Sold | | | 1,556,778 | |
To reduce counterparty risk with respect to Over-the-Counter (“OTC”) transactions, the Funds have entered into netting arrangements, established within the Funds’ International Swap and Derivatives Association, Inc. (“ISDA”) master agreements, which allow the Funds to make (or to have an entitlement to receive) a single net payment in the event of default (close-out netting) for outstanding payables and receivables with respect to certain OTC positions in forward foreign currency contracts for each individual counterparty. In addition, the Funds may require that certain counterparties post cash and/or securities in collateral accounts to cover their net payment obligations for those derivative contracts subject to ISDA master agreements. If the counterparty fails to perform under these contracts and agreements, the cash and/or securities will be made available to the Funds.
For financial reporting purposes, the Funds do not offset derivative assets and derivative liabilities that are subject to netting arrangements in the Statement of Assets and Liabilities. Bankruptcy or insolvency laws of a particular jurisdiction may impose restrictions on or prohibitions against the right of offset in bankruptcy, insolvency or other events.
Collateral terms are contract specific for OTC derivatives. For derivatives traded under an ISDA master agreement, the collateral requirements are typically calculated by netting the mark to market amount of each transaction under such agreement and comparing that amount to the value of any collateral currently pledged by the Funds or the counterparty.
For financial reporting purposes, cash collateral that has been pledged to cover obligations of the Funds, if any, is reported separately on the Statement of Assets and Liabilities as cash pledged as collateral. Noncash collateral pledged by the Funds, if any, is noted in the Schedule of Investments. Generally, the amount of collateral due from or to a party must exceed a minimum transfer amount threshold before a transfer has to be made. To the extent amounts due to the Funds from their counterparties are not fully collateralized, contractually or otherwise, the Funds bear the risk of loss from counterparty nonperformance.
The following is a summary by counterparty of the market value of OTC financial derivative instruments and collateral (received)/pledged for the International Government Fixed Income Fund as of October 31, 2022:
63
| Gallery Trust | October 31, 2022 |
| | |
| NOTES TO FINANCIAL STATEMENTS (continued) | |
| Counterparty | | Gross Assets Recognized in the Statement of Assets and Liabilities | | | Gross Liabilities Recognized in the Statement of Assets and Liabilities | | | Net Amount Available be Offset | | | Cash Collateral Pledged or (Received) | | | Net Amount † | |
| Brown Brothers Harriman | | $ | 226 | | | $ | (13,719 | ) | | $ | (13,493 | ) | | $ | — | | | $ | (13,493 | ) |
| Total | | $ | 226 | | | $ | (13,719 | ) | | $ | (13,493 | ) | | $ | — | | | $ | (13,493 | ) |
| † | Represents the net receivable/(payable) that would be due from/to the counterparty in the event of default. Exposure from OTC financial derivative instruments can only be netted across transactions governed under the same master agreement with the same legal entity. |
Dividends and distributions to shareholders — The International Fund, Emerging Markets Fund and Global Listed Infrastructure Fund distribute their net investment income at least annually. The Fixed Income Fund distributes its net investment income quarterly. For each Fund, net realized capital gains, if any, are distributed at least annually. All distributions are recorded on ex-dividend date.
Expenses — Expenses that are directly related to the Fund are charged to the Fund. Other operating expenses of the Trust are prorated to the funds based on the number of funds and/or relative daily net assets.
Investments in REITs — Dividend income from Real Estate Investment Trusts (“REIT”) is recorded based on the income included in distributions received from the REIT investments using published REIT reclassifications, including some management estimates when actual amounts are not available. Distributions received in excess of this estimated amount are recorded as a reduction of the cost of investments or reclassified to capital gains. The actual amounts of income, return of capital, and capital gains are determined by each REIT only after its fiscal year-end, and may differ from the estimated amounts.
3. Transactions with affiliates
Certain officers of the Trust are also employees of SEI Investments Global Funds Services (the “Administrator”), a wholly owned subsidiary of SEI Investments Company, and/or SEI Investments Distribution Co. (the “Distributor”). Such
64
| Gallery Trust | October 31, 2022 |
| | |
| NOTES TO FINANCIAL STATEMENTS (continued) | |
officers are paid no fees by the Trust, other than the Chief Compliance Officer (“CCO”) as described below, for serving as officers of the Trust.
A portion of the services provided by the CCO and his staff, who are employees of the Administrator, are paid for by the Trust as incurred. The services include regulatory oversight of the Trust’s advisors and service providers, as required by SEC regulations. The CCO’s services and fees have been approved by and are reviewed by the Board.
4. Administration, Custodian and Transfer Agent Agreements
The Funds and the Administrator are parties to an Administration Agreement under which the Administrator provides administrative services to the Funds. For these services, the Administrator is paid an asset based fee, which will vary depending on the number of share classes and the average daily net assets of the Funds. For the year ended October 31, 2022, the amounts paid for these services are represented in the table below:
| | | Accounting and Administration Fees | |
| International Value Equity Fund | | $ | 670,561 | |
| Emerging Markets Value Equity Fund | | | 22,493 | |
| International Government Fixed Income Fund | | | 2,365 | |
| Global Listed Infrastructure Fund | | | 1,642 | |
| Global Equity Value Fund | | | 111,059 | |
Expenses incurred under the agreements are shown on the Statement of Operations as “Accounting and administration fees”.
Brown Brothers Harriman & Co., (the “Custodian”) serves as the Funds’ Custodian pursuant to a custody agreement. Apex Fund Services (the “Transfer Agent”) serves as the Funds’ Transfer Agent pursuant to a transfer agency agreement.
5. Investment Advisory Agreement
Under the terms of an investment advisory agreement, the Adviser provides investment advisory services to the Funds. The Adviser is entitled to a fee, which is calculated daily and paid monthly, at an annual rate for each fund. The table
65
| Gallery Trust | October 31, 2022 |
| | |
| NOTES TO FINANCIAL STATEMENTS (continued) | |
below shows the rate of each Fund’s investment advisory fee.
| | Advisory Fee |
| International Value Equity Fund | 0.65% |
| Emerging Markets Value Equity Fund | 0.75% |
| International Government Fixed Income Fund | 0.50% |
| Global Listed Infrastructure Fund | 0.85% |
| Global Equity Value Fund | 0.65% |
Prior to September 24, 2018, the Predecessor Adviser was paid a fee at an annual rate of 1.00% of the Emerging Markets Predecessor Fund’s average daily net assets and 0.60% of the average daily net assets of the Fixed Income Predecessor Fund’s average daily net assets. The Predecessor Adviser paid Mondrian a subadvisory fee for its services as sub-adviser to each Predecessor Fund out of the advisory fees that the Predecessor Adviser received from the Predecessor Fund.
The Adviser has contractually agreed to reduce its fees and/or reimburse expenses to the extent necessary to keep total annual Fund operating expenses (excluding interest, taxes, brokerage commissions, acquired fund fees and expenses, and non-routine (collectively “excluded expenses”)) from exceeding the below percentages of the average daily net assets of the Funds until February 28, 2023 (the “Expense Limitation”). Refer to waiver of investment advisory fees and the Reimbursement from Investment Advisor on the Statement of Operations for fees waived and expenses reimbursed for the year ended October 31, 2022.
| | Expense Limitation |
| International Value Equity Fund | 0.74% |
| Emerging Markets Value Equity Fund | 0.92% |
| International Government Fixed Income Fund | 0.60% |
| Global Listed Infrastructure Fund | 0.95% |
| Global Equity Value Fund | 0.74% |
This agreement may be terminated: (i) by the Board for any reason at any time, or (ii) by the Adviser, upon ninety (90) days’ prior written notice to the Trust, effective as of the close of business on February 28, 2023.
Prior to September 24, 2018, the Predecessor Adviser had contractually agreed through July 30, 2019, to limit the total annual fund operating expenses charged, excluding interest, taxes and certain non-routine expenses to 1.20% and 0.75%
66
| Gallery Trust | October 31, 2022 |
| | |
| NOTES TO FINANCIAL STATEMENTS (continued) | |
of the average daily net assets of the Emerging Markets Predecessor Fund and Fixed Income Predecessor Fund respectively.
6. Investment transactions
The cost of purchases and proceeds from security sales other than long-term U.S. Government and short-term securities for the year ended October 31, 2022, are as follows:
| | | Purchases | | | Sales and Maturities | | | U.S. Government Purchases | | | U.S. Government Sales and Maturities | |
| International Value Equity Fund | | $ | 219,988,117 | | | $ | 153,852,440 | | | $ | — | | | $ | — | |
| Emerging Markets Value Equity Fund | | | 10,096,683 | | | | 8,713,191 | | | | — | | | | — | |
| International Government Fixed Income Fund | | | 4,933,399 | | | | 7,527,248 | | | | — | | | | — | |
| Global Listed Infrastructure Fund | | | 472,008 | | | | 428,808 | | | | — | | | | — | |
| Global Equity Value Fund | | | 110,850,663 | | | | 51,156,578 | | | | — | | | | — | |
7. Federal tax information
The amount and character of income and capital gain distributions to be paid, if any, are determined in accordance with Federal income tax regulations, which may differ from U.S. GAAP. As a result, net investment income/(loss) and net realized gain/(loss) on investment transactions for a reporting period may differ significantly from distributions during such period. These book/tax differences may be temporary or permanent. To the extent these differences are permanent in nature, they are charged or credited to distributable earnings or paid-in capital, as appropriate, in the period that the differences arise.
The permanent differences primarily consist of foreign currency translations, reclassification of long term capital gain distribution on REITs, investments in PFICs, net operating losses offset to short-term capital gain and distribution reclassification. The permanent difference that is credited or charged to Paid-in Capital and Distributable Earnings as of October 31, 2022, is primarily related to net operating loss and distribution in excess:
67
| Gallery Trust | October 31, 2022 |
| | |
| NOTES TO FINANCIAL STATEMENTS (continued) | |
| | | Distributable Earnings | | | Paid-in Capital | |
| International Government Fixed Income Fund | | $ | 1,402,115 | | | $ | (1,402,115 | ) |
These reclassifications have no impact on net assets or net asset value per share.
The character of distributions made during the year from net investment income or net realized gains may differ from their ultimate characterization for federal income tax purposes. Also, due to the timing of dividend distributions, the fiscal year in which amounts are distributed may differ from the year that the income or realized gains (losses) were recorded by the Funds. Income dividends and capital gain distributions are determined in accordance with federal income tax regulations, which may differ from U.S. GAAP. These differences are primarily due to differing treatments for forwards, foreign currency transactions, wash sale loss deferrals, investments in REIT’s and investments in PFICs. Distributions during the years ended October 31, 2022 and October 31, 2021, unless otherwise noted, were as follows:
| | | Ordinary Income | | | Long-Term Capital Gain | | | Total | |
| International Value Equity Fund | | | | | | | | | |
| 2022 | | $ | 22,825,062 | | | $ | – | | | $ | 22,825,062 | |
| 2021 | | | 13,339,486 | | | | – | | | | 13,339,486 | |
| Emerging Markets Value Equity Fund | | | | | | | | | | | | |
| 2022 | | | 299,357 | | | | – | | | | 299,357 | |
| 2021 | | | 480,237 | | | | – | | | | 480,237 | |
| International Government Fixed Income Fund | | | | | | | | | | | | |
| 2022 | | | 67,421 | | | | – | | | | 67,421 | |
| 2021 | | | 993,720 | | | | – | | | | 993,720 | |
| Global Listed Infrastructure Fund | | | | | | | | | | | | |
| 2022 | | | 61,287 | | | | 57,367 | | | | 118,654 | |
| 2021 | | | 43,672 | | | | 49,270 | | | | 92,942 | |
| Global Equity Value Fund | | | | | | | | | | | | |
| 2022 | | | 1,358,775 | | | | 96,405 | | | | 1,455,180 | |
| 2021 | | | 48,411 | | | | – | | | | 48,411 | |
As of October 31, 2022, the components of Distributable Earnings on a tax basis were as follows:
68
| Gallery Trust | October 31, 2022 |
| | |
| NOTES TO FINANCIAL STATEMENTS (continued) | |
| | | International Value Equity Fund | | | Emerging Markets Value Equity Fund | | | International Government Fixed Income Fund | |
| Undistributed Ordinary Income | | $ | 13,862,633 | | | $ | 532,675 | | | $ | – | |
| Undistributed Long-Term Capital Gain | | | 3,827,644 | | | | – | | | | – | |
| Capital Loss Carryforwards | | | – | | | | (105,909,447 | ) | | | (263,398 | ) |
| Late-Year Loss Deferral | | | – | | | | – | | | | – | |
| Unrealized Depreciation | | | (147,733,362 | ) | | | (6,575,602 | ) | | | (2,878,257 | ) |
| Other Temporary Differences | | | (6 | ) | | | (3 | ) | | | (6,013 | )* |
| Total Accumulated Losses | | $ | (130,043,091 | ) | | $ | (111,952,377 | ) | | $ | (3,147,668 | ) |
| | | Global Listed Infrastructure Fund | | | Global Equity Value Fund | |
| Undistributed Ordinary Income | | $ | 51,842 | | | $ | 2,671,934 | |
| Undistributed Long-Term Capital Gain | | | 81,985 | | | | 416,797 | |
| Capital Loss Carryforwards | | | – | | | | – | |
| Late-Year Loss Deferral | | | – | | | | – | |
| Unrealized Depreciation | | | (184,262 | ) | | | (24,916,293 | ) |
| Other Temporary Differences | | | (1 | ) | | | 1 | |
| Total Accumulated Losses | | $ | (50,436 | ) | | $ | (21,827,561 | ) |
| * | Other Temporary Difference relates primarily to foreign currency straddles. |
Capital losses that are carried forward will retain their character as either shortterm or long-term capital losses. The Funds have capital losses carried forward as follows:
| | | Total | |
| Emerging Markets Value Equity Fund | | $ | 105,909,447 | * |
| International Government Fixed Income Fund | | | 263,398 | |
| * | The utilization of this amount is subject to significant limitation under IRC section 382-384. |
During the fiscal year ended October 31, 2022, the following Funds utilized capital loss carryforward to offset capital gains:
| | | Amount Utilized | |
| International Value Equity Fund | | $ | 957,022 | |
For Federal income tax purposes the difference between Federal tax cost and
69
| Gallery Trust | October 31, 2022 |
| | |
| NOTES TO FINANCIAL STATEMENTS (continued) | |
book cost primarily relates to passive foreign investment companies, foreign capital gains tax, forwards and wash sales which cannot be used for Federal income tax purposes in the current year and have been deferred for use in future years. The Federal tax cost and aggregate gross unrealized appreciation and depreciation for the investments held by the Funds at October 31, 2022, were as follows:
| | | Federal Tax Cost | | | Aggregate Gross Unrealized Appreciation | | | Aggregate Gross Unrealized Depreciation | | | Net Unrealized Appreciation (Depreciation) | |
| International Value Equity Fund | | $ | 740,523,668 | | | $ | 16,652,979 | | | $ | (164,386,341 | ) | | $ | (147,733,362 | ) |
| Emerging Markets Value Equity Fund | | | 24,973,013 | | | | 1,192,190 | | | | (7,767,792 | ) | | | (6,575,602 | ) |
| International Government Fixed Income Fund | | | 12,226,590 | | | | 6,008 | | | | (2,884,265 | ) | | | (2,878,257 | ) |
| Global Listed Infrastructure Fund | | | 1,687,644 | | | | 110,599 | | | | (294,861 | ) | | | (184,262 | ) |
| Global Equity Value Fund | | | 142,727,474 | | | | 5,362,818 | | | | (30,279,111 | ) | | | (24,916,293 | ) |
8. Share transactions
The share transactions are shown below:
| | | Mondrian International Value Equity Fund | |
| | | Year ended October 31, 2022 | | | Year ended October 31, 2021 | |
| Shares transactions: | | | | | | |
| Institutional Class shares | | | | | | |
| Issued | | | 14,067,418 | | | | 12,624,378 | |
| Reinvestment of dividends | | | 1,267,192 | | | | 795,503 | |
| Redeemed | | | (10,437,988 | ) | | | (7,437,597 | ) |
| Net increase in shares outstanding | | | 4,896,622 | | | | 5,982,284 | |
70
| Gallery Trust | October 31, 2022 |
| | |
| NOTES TO FINANCIAL STATEMENTS (continued) | |
| | | Mondrian Emerging Markets Value Equity Fund | |
| | | Year ended October 31, 2022 | | | Year ended October 31, 2021 | |
| Shares transactions: | | | | | | |
| Institutional Class shares | | | | | | |
| Issued | | | 913,090 | | | | 1,728,950 | |
| Reinvestment of dividends | | | 36,910 | | | | 55,324 | |
| Redeemed | | | (780,254 | ) | | | (511,777 | ) |
| Net increase in shares outstanding | | | 169,746 | | | | 1,272,497 | |
| | | Mondrian International Government Fixed Income Fund | |
| | | Year ended October 31, 2022 | | | Year ended October 31, 2021 | |
| Shares transactions: | | | | | | |
| Institutional Class shares | | | | | | |
| Issued | | | 11,623 | | | | 175,808 | |
| Reinvestment of dividends | | | 7,246 | | | | 95,085 | |
| Redeemed | | | (328,301 | ) | | | (923,881 | ) |
| Net decrease in shares outstanding | | | (309,432 | ) | | | (652,988 | ) |
| | | Mondrian Global Listed Infrastructure Fund | |
| | | Year ended October 31, 2022 | | | Year ended October 31, 2021 | |
| Shares transactions: | | | | | | |
| Institutional Class shares | | | | | | |
| Issued | | | — | | | | — | |
| Reinvestment of dividends | | | 10,291 | | | | 8,368 | |
| Net increase in shares outstanding | | | 10,291 | | | | 8,368 | |
| | | Mondrian Global Equity Value Fund | |
| | | Year ended October 31, 2022 | | | Year ended October 31, 2021 | |
| Shares transactions: | | | | | | |
| Institutional Class shares | | | | | | |
| Issued | | | 7,716,287 | | | | 7,121,513 | |
| Reinvestment of dividends | | | 105,994 | | | | 4,212 | |
| Redeemed | | | (2,722,996 | ) | | | (894,422 | ) |
| Net increase in shares outstanding | | | 5,099,285 | | | | 6,231,303 | |
71
| Gallery Trust | October 31, 2022 |
| | |
| NOTES TO FINANCIAL STATEMENTS (continued) | |
9. Risks associated with financial instruments
As with all mutual funds, a shareholder of a Fund is subject to the risk that his or her investment could lose money. The Funds are subject to the principal risks noted below, any of which may adversely affect the Funds’ net asset value and ability to meet its investment objective. A more complete description of risks associated with each Fund is included in the prospectus.
Active management risk
The Funds are subject to the risk that the Adviser’s judgments about the attractiveness, value, or potential appreciation of the Funds’ investments may prove to be incorrect. If the investments selected and strategies employed by the Funds fail to produce the intended results, the Funds could underperform in comparison to its benchmark index or other funds with similar objectives and investment strategies.
Equity risk
Since it purchases equity securities, the Funds are subject to the risk that stock prices may fall over short or extended periods of time. Historically, the equity markets have moved in cycles, and the value of the Funds’ equity securities may fluctuate from day to day. Individual companies may report poor results or be negatively affected by industry and/or economic trends and developments. The prices of securities issued by such companies may suffer a decline in response. These factors contribute to price volatility, which is the principal risk of investing in the Funds.
Convertible securities risk
The value of a convertible security is influenced by changes in interest rates (with investment value declining as interest rates increase and increasing as interest rates decline) and the credit standing of the issuer. The price of a convertible security will also normally vary in some proportion to changes in the price of the underlying common stock because of the conversion or exercise feature.
Large capitalization company risk
The large capitalization companies in which the Funds may invest may lag the performance of smaller capitalization companies because large capitalization companies may experience slower rates of growth than smaller capitalization companies and may not respond as quickly to market changes and opportunities.
72
| Gallery Trust | October 31, 2022 |
| | |
| NOTES TO FINANCIAL STATEMENTS (continued) | |
Preferred stocks risk
Preferred stocks are sensitive to interest rate changes, and are also subject to equity risk, which is the risk that stock prices will fall over short or extended periods of time. The rights of preferred stocks on the distribution of a company’s assets in the event of a liquidation are generally subordinate to the rights associated with a company’s debt securities.
Foreign company risk
Investing in foreign companies, including direct investments and investments through depositary receipts, poses additional risks since political and economic events unique to a country or region will affect those markets and their issuers. These risks will not necessarily affect the U.S. economy or similar issuers located in the U.S. Securities of foreign companies may not be registered with the SEC and foreign companies are generally not subject to the regulatory controls imposed on U.S. issuers and, as a consequence, there is generally less publically available information about foreign securities than is available about domestic securities. Income from foreign securities owned by the Funds may be reduced by a withholding tax at the source, which tax would reduce income received from the securities comprising the portfolio. Foreign securities may also be more difficult to value than securities of U.S. issuers. While depositary receipts provide an alternative to directly purchasing the underlying foreign securities in their respective national markets and currencies, investments in depositary receipts continue to be subject to many of the risks associated with investing directly in foreign securities.
Emerging markets securities risk
The Funds’ investments in emerging markets securities are considered speculative and subject to heightened risks in addition to the general risks of investing in foreign securities. Unlike more established markets, emerging markets may have governments that are less stable, markets that are less liquid and economies that are less developed. In addition, the securities markets of emerging market countries may consist of companies with smaller market capitalizations and may suffer periods of relative illiquidity; significant price volatility; restrictions on foreign investment; and possible restrictions on repatriation of investment income and capital. Furthermore, foreign investors may be required to register the proceeds of sales, and future economic or political crises could lead to price controls, forced mergers, expropriation or confiscatory taxation, seizure, nationalization or creation of government monopolies.
73
| Gallery Trust | October 31, 2022 |
| | |
| NOTES TO FINANCIAL STATEMENTS (continued) | |
Foreign currency risk
As a result of the Funds’ investments in securities denominated in, and/or receiving revenues in, foreign currencies, the Funds will be subject to currency risk. Currency risk is the risk that foreign currencies will decline in value relative to the U.S. dollar or, in the case of hedging positions, that the U.S. dollar will decline in value relative to the currency hedged. In either event, the dollar value of an investment in the Funds would be adversely affected.
Depositary receipts risk
Investments in depositary receipts may be less liquid and more volatile than the underlying securities in their primary trading market. If a depositary receipt is denominated in a different currency than its underlying securities, the Funds will be subject to the currency risk of both the investment in the depositary receipt and the underlying security. Holders of depositary receipts may have limited or no rights to take action with respect to the underlying securities or to compel the issuer of the receipts to take action. The prices of depositary receipts may differ from the prices of securities upon which they are based. Certain of the depositary receipts in which the Fund invests may be unsponsored depositary receipts. Unsponsored depositary receipts may not provide as much information about the underlying issuer and may not carry the same voting privileges as sponsored depositary receipts. Unsponsored depositary receipts are issued by one or more depositaries in response to market demand, but without a formal agreement with the company that issues the underlying securities.
Derivatives risk
The Funds’ use of forward contracts and participatory notes is subject to market risk, correlation risk, credit risk, valuation risk and liquidity risk. Market risk is the risk that the market value of an investment may move up and down, sometimes rapidly and unpredictably. Correlation risk is the risk that changes in the value of the derivative may not correlate perfectly or at all with the underlying asset, rate or index. Credit risk is the risk that the counterparty to a derivative contract will default or otherwise become unable to honor a financial obligation. Valuation risk is the risk that the derivative may be difficult to value. Liquidity risk is described below. The Funds’ use of forwards is also subject to leverage risk and hedging risk. Leverage risk is the risk that the use of leverage may amplify the effects of market volatility on the Fund’s share price and may also cause the Fund to liquidate portfolio positions when it would not be advantageous to do so in order to satisfy its obligations. Hedging risk is the risk that derivatives instruments used for hedging purposes may also limit any
74
| Gallery Trust | October 31, 2022 |
| | |
| NOTES TO FINANCIAL STATEMENTS (continued) | |
potential gain that may result from the increase in value of the hedged asset. To the extent that the Funds engage in hedging strategies, there can be no assurance that such strategy will be effective or that there will be a hedge in place at any given time. Each of these risks could cause the Funds to lose more than the principal amount invested in a derivative instrument.
Liquidity risk
Certain securities may be difficult or impossible to sell at the time and the price that the Funds would like. The Funds may have to lower the price, sell other securities instead or forgo an investment opportunity, any of which could have a negative effect on Fund management or performance.
Portfolio turnover risk
Due to their investment strategies, the Funds may buy and sell securities frequently. This may result in higher transaction costs and additional capital gains tax liabilities.
Large purchase and redemption risk
Large purchases or redemptions of the Fund’s shares may force the Fund to purchase or sell securities at times when it would not otherwise do so, and may cause the Fund’s portfolio turnover rate and transaction costs to rise, which may negatively affect the Fund’s performance and have adverse tax consequences for Fund shareholders.
Fixed income risk
Fixed income securities are subject to a number of risks, including credit and interest rate risks. Credit risk is the risk that the issuer or obligor will not make timely payments of principal and interest. Changes in an issuer’s credit rating or the market’s perception of an issuer’s creditworthiness may also affect the value of the Fund’s investment in that issuer. Interest rate risk is the risk that the value of a fixed income security will fall when interest rates rise. In general, the longer the maturity of a fixed income security, the more likely its value will decline when interest rates rise. Risks associated with rising interest rates are heightened given that interest rates in the U.S. are at, or near, historic lows.
Zero-coupon bond risk
The market value of a zero-coupon bond is generally more volatile than the market value of other fixed income securities with similar maturities that pay interest periodically. In addition, federal income tax law requires that the holder
75
| Gallery Trust | October 31, 2022 |
| | |
| NOTES TO FINANCIAL STATEMENTS (continued) | |
of a zero coupon bond accrue a portion of the discount at which the bond was purchased as taxable income each year. The Fund may consequently have to dispose of portfolio securities under disadvantageous circumstances to generate cash to satisfy its requirement as a regulated investment company to distribute all of its net income (including non-cash income attributable to zero-coupon securities). These actions may reduce the assets to which the Fund’s expenses could otherwise be allocated and may reduce the Fund’s rate of return.
Foreign sovereign debt securities risk
The Funds’ investments in foreign sovereign debt securities are subject to the risks that: (i) the governmental entity that controls the repayment of sovereign debt may not be willing or able to repay the principal and/or interest when it becomes due, due to factors such as debt service burden, political constraints, cash flow problems and other national economic factors; (ii) governments may default on their debt securities, which may require holders of such securities to participate in debt rescheduling or additional lending to defaulting governments; and (iii) there is no bankruptcy proceeding by which defaulted sovereign debt may be collected in whole or in part.
Foreign government agencies risk
Bonds issued by government agencies, subdivisions or instrumentalities of foreign governments are generally backed only by the general creditworthiness and reputation of the entity issuing the bonds and may not be backed by the full faith and credit of the foreign government. Moreover, a foreign government that explicitly provides its full faith and credit to a particular entity may be, due to changed circumstances, unable or unwilling to provide that support. A foreign government agency’s operations and financial condition are influenced by the foreign government’s economic and other policies.
Supranational entities risk
Government members, or “stockholders,” usually make initial capital contributions to a supranational entity and in many cases are committed to make additional capital contributions if the supranational entity is unable to repay its borrowings. There is no guarantee, however, that one or more stockholders of the supranational entity will continue to make any necessary additional capital contributions. If such contributions are not made, the entity may be unable to pay interest or repay principal on its debt securities, and the Funds may lose money on such investments.
76
| Gallery Trust | October 31, 2022 |
| | |
| NOTES TO FINANCIAL STATEMENTS (continued) | |
Corporate fixed income securities risk
Corporate fixed income securities respond to economic developments, especially changes in interest rates, as well as perceptions of the creditworthiness and business prospects of individual issuers.
Investment Style Risk
The Mondrian Global Equity Value Fund pursues a “value style” of investing. Value investing focuses on companies with stocks that appear undervalued to the Adviser in light of factors such as the company’s earnings, book value, revenues or cash flow. The Adviser’s methodology for analyzing value may differ from other market approaches. If the Adviser’s assessment of market conditions, or a company’s value or its prospects for exceeding earnings expectations is inaccurate, the Fund could suffer losses or produce poor performance relative to other funds. In addition, “value stocks” can continue to be undervalued by the market for long periods of time.
Small- and Mid-Capitalization Company Risk
The small- and mid-capitalization companies in which a Fund may invest may be more vulnerable to adverse business or economic events than larger, more established companies. In particular, investments in these small- and mid-sized companies may pose additional risks, including liquidity risk, because these companies tend to have limited product lines, markets and financial resources, and may depend upon a relatively small management group. Therefore, smalland mid-cap stocks may be more volatile than those of larger companies. These securities may be traded over-the-counter or listed on an exchange.
Rights and Warrants Risk
Investments in rights or warrants involve the risk of loss of the purchase value of a right or warrant if the right to subscribe to additional shares is not exercised prior to the right’s or warrant’s expiration. Also, the purchase of rights and/ or warrants involves the risk that the effective price paid for the right and/or warrant added to the subscription price of the underlying security may exceed the market price of the underlying security in instances such as those where there is no movement in the price of the underlying security.
Private Placements Risk
Investment in privately placed securities may be less liquid than in publicly traded securities. Although these securities may be resold in privately negotiated
77
| Gallery Trust | October 31, 2022 |
| | |
| NOTES TO FINANCIAL STATEMENTS (continued) | |
transactions, the prices realized from these sales could be less than those originally paid by the Fund or less than what may be considered the fair value of such securities. Further, companies whose securities are not publicly traded may not be subject to the disclosure and other investor protection requirements that might be applicable if their securities were publicly traded.
Risks of Investing in Other Investment Companies
To the extent a Fund invests in other investment companies, such as open-end funds, closed-end funds and ETFs, the Fund will be subject to substantially the same risks as those associated with the direct ownership of the securities held by such other investment companies. As a shareholder of another investment company, the Fund relies on that investment company to achieve its investment objective. If the investment company fails to achieve its objective, the value of the Fund’s investment could decline, which could adversely affect the Fund’s performance. By investing in another investment company, Fund shareholders indirectly bear the Fund’s proportionate share of the fees and expenses of the other investment company, in addition to the fees and expenses that Fund shareholders directly bear in connection with the Fund’s own operations.
Because ETFs and certain closed-end funds are listed on national stock exchanges and are traded like stocks listed on an exchange, their shares potentially may trade at a discount or premium. Investments in ETFs and certain closed-end funds are also subject to brokerage and other trading costs, which could result in greater expenses to the Fund. In addition, because the value of ETF and certain closed-end fund shares depends on the demand in the market, the Adviser may not be able to liquidate the Fund’s holdings at the most optimal time, which could adversely affect Fund performance.
REITs Risk
REITs are pooled investment vehicles that own, and usually operate, incomeproducing real estate. REITs are susceptible to the risks associated with direct ownership of real estate, such as the following: declines in property values; increases in property taxes, operating expenses, interest rates or competition; overbuilding; zoning changes; and losses from casualty or condemnation. REITs typically incur fees that are separate from those of the Fund. Accordingly, the Fund’s investments in REITs will result in the layering of expenses such that shareholders will indirectly bear a proportionate share of the REITs’ operating expenses, in addition to paying Fund expenses. REIT operating expenses are not reflected in the fee table and example in this prospectus.
78
| Gallery Trust | October 31, 2022 |
| | |
| NOTES TO FINANCIAL STATEMENTS (continued) | |
MLPs Risk
MLPs are limited partnerships in which the ownership units are publicly traded. MLPs often own several properties or businesses (or own interests) that are related to oil and gas industries or other natural resources, but they also may finance other projects. To the extent that an MLP’s interests are all in a particular industry, such as the energy industry, the MLP will be negatively impacted by economic events adversely impacting that industry. Additional risks of investing in an MLP also include those involved in investing in a partnership as opposed to a corporation. For example, state law governing partnerships is often less restrictive than state law governing corporations. Accordingly, there may be fewer protections afforded to investors in an MLP than investors in a corporation; for example, investors in MLPs may have limited voting rights or be liable under certain circumstances for amounts greater than the amount of their investment. In addition, MLPs may be subject to state taxation in certain jurisdictions which will have the effect of reducing the amount of income paid by the MLP to its investors. A Fund’s investment in MLPs may result in the layering of expenses, such that shareholders will indirectly bear a proportionate share of the MLPs’ operating expenses, in addition to paying Fund expenses. MLP operating expenses are not reflected in the fee table and example in this prospectus.
Energy companies are affected by worldwide energy prices and costs related to energy production. These companies may have significant operations in areas at risk for natural disasters, social unrest and environmental damage. These companies may also be at risk for increased government regulation and intervention, energy conservation efforts, litigation and negative publicity and perception.
Geographic Focus Risk
To the extent that a Fund focuses its investments in a particular country or geographic region, the Fund may be more susceptible to economic, political, regulatory or other events or conditions affecting issuers and countries within that country or geographic region. As a result, the Fund may be subject to greater price volatility and risk of loss than a fund holding more geographically diverse investments.
Stock Connect Investing Risk
Trading through Stock Connect is subject to a number of restrictions that may affect a Fund’s investments and returns, including a daily quota that limits
79
| Gallery Trust | October 31, 2022 |
| | |
| NOTES TO FINANCIAL STATEMENTS (continued) | |
the maximum net purchases under Stock Connect each day. In addition, investments made through Stock Connect are subject to relatively untested trading, clearance and settlement procedures. Moreover, A-Shares purchased through Stock Connect generally may only be sold or otherwise transferred through Stock Connect. The Fund’s investments in A-Shares purchased through Stock Connect are generally subject to Chinese securities regulations and listing rules. While overseas investors currently are exempt from paying capital gains or value added taxes on income and gains from investments in A-Shares purchased through Stock Connect, these tax rules could be changed, which could result in unexpected tax liabilities for the Fund. Stock Connect operates only on days when both the Chinese and Hong Kong markets are open for trading and when banks in both markets are open on the corresponding settlement days. Therefore, the Fund may be subject to the risk of price fluctuations of A-Shares when Stock Connect is not trading.
U.S. Government Securities Risk
A Fund’s investment in U.S. government obligations may include securities issued or guaranteed as to principal and interest by the U.S. government, or its agencies or instrumentalities. Payment of principal and interest on U.S. government obligations may be backed by the full faith and credit of the United States or may be backed solely by the issuing or guaranteeing agency or instrumentality itself. There can be no assurance that the U.S. government would provide financial support to its agencies or instrumentalities (including government-sponsored enterprises) where it is not obligated to do so. In addition, U.S. government securities are not guaranteed against price movements due to changing interest rates.
High Yield Bond Risk
High yield, or “junk,” bonds are debt securities rated below investment grade. High yield bonds are speculative, involve greater risks of default, downgrade, or price declines and are more volatile and tend to be less liquid than investmentgrade securities. Companies issuing high yield bonds are less financially strong, are more likely to encounter financial difficulties, and are more vulnerable to adverse market events and negative sentiments than companies with higher credit ratings.
Non-diversification risk
The Fixed Income Fund and Global Equity Value Fund are classified as “nondiversified,” which means they may invest a larger percentage of their assets in a
80
| Gallery Trust | October 31, 2022 |
| | |
| NOTES TO FINANCIAL STATEMENTS (continued) | |
smaller number of issuers than diversified funds. To the extent the Funds invest their assets in a smaller number of issuers, the Funds will be more susceptible to negative events affecting those issuers than diversified funds.
Market Risk
The prices of and the income generated by a Fund’s securities may decline in response to, among other things, investor sentiment, general economic and market conditions, regional or global instability, and currency and interest rate fluctuations. In addition, the impact of any epidemic, pandemic or natural disaster, or widespread fear that such events may occur, could negatively affect the global economy, as well as the economies of individual countries, the financial performance of individual companies and sectors, and the markets in general in significant and unforeseen ways. Any such impact could adversely affect the prices and liquidity of the securities and other instruments in which a Fund invests, which in turn could negatively impact the Fund’s performance and cause losses on your investment in the Fund. Similarly, the impact of any epidemic, pandemic or natural disaster, or widespread fear that such events may occur, could negatively affect the global economy, as well as the economies of individual countries, the financial performance of individual companies and sectors, and the markets in general in significant and unforeseen ways. Any such impact could adversely affect the prices and liquidity of the securities and other instruments in which the Fund invests, which in turn could negatively impact the Fund’s performance and cause losses on your investment in the Fund.
10. Indemnifications
In the normal course of business, the Funds enter into contracts that provide general indemnifications. The Funds’ maximum exposure under these arrangements is dependent on future claims that may be made against the Funds and, therefore, cannot be established; however, based on experience, the risk of loss from such claims is considered remote.
11. Borrowing from banks
The Funds have access to custodian overdraft facilities. A Fund may have utilized the overdraft facility and incurred an interest expense, which is disclosed on the fund’s Statement of Operations, if any. The interest expense is determined based on a negotiated rate above the current Federal Funds Rate. For the year ended October 31, 2022, none of the Funds incurred any interest expense.
81
| Gallery Trust | October 31, 2022 |
| | |
| NOTES TO FINANCIAL STATEMENTS (continued) | |
12. Other
At October 31, 2022, the percentage of total shares outstanding held by a limited number of shareholders for each Fund, which were comprised of omnibus accounts that were held on behalf of various individual shareholders was as follows:
| | No. of Shareholders | | % Ownership |
| International Value Equity Fund | 3 | | 60% |
| Emerging Markets Value Equity Fund | 2 | | 89% |
| International Government Fixed Income Fund | 2 | | 82% |
| Global Listed Infrastructure Fund | 1 | | 100% |
| Global Equity Value Fund | 2 | | 74% |
13. Subsequent events
The Funds have evaluated the need for disclosures and/or adjustments resulting from subsequent events through the date the financials were issued. Based on this evaluation, no disclosures and/or adjustments were required to the financial statements as of October 31, 2022.
82
| Gallery Trust | October 31, 2022 |
| | |
| REPORT OF INDEPENDENT REGISTERED PUBLIC ACCOUNTING FIRM | |
To the Board of Trustees of Gallery Trust and Shareholders of Mondrian International Value Equity Fund, Mondrian Emerging Markets Value Equity Fund, Mondrian International Government Fixed Income Fund, Mondrian Global Listed Infrastructure Fund and Mondrian Global Equity Value Fund
Opinions on the Financial Statements
We have audited the accompanying statements of assets and liabilities, including the schedules of investments, of Mondrian International Value Equity Fund, Mondrian Emerging Markets Value Equity Fund, Mondrian International Government Fixed Income Fund, Mondrian Global Listed Infrastructure Fund and Mondrian Global Equity Value Fund (constituting Gallery Trust, hereafter collectively referred to as the “Funds”) as of October 31, 2022, the related statements of operations for the year ended October 31, 2022, the statements of changes in net assets for each of the two years in the period ended October 31, 2022, including the related notes, and the financial highlights for each of the periods indicated therein (collectively referred to as the “financial statements”). In our opinion, the financial statements present fairly, in all material respects, the financial position of each of the Funds as of October 31, 2022, the results of each of their operations for the year then ended, the changes in each of their net assets for each of the two years in the period ended October 31, 2022 and each of the financial highlights for each of the periods indicated therein in conformity with accounting principles generally accepted in the United States of America.
Basis for Opinions
These financial statements are the responsibility of the Funds’ management. Our responsibility is to express an opinion on the Funds’ financial statements based on our audits. We are a public accounting firm registered with the Public Company Accounting Oversight Board (United States) (PCAOB) and are required to be independent with respect to the Funds in accordance with the U.S. federal securities laws and the applicable rules and regulations of the Securities and Exchange Commission and the PCAOB.
We conducted our audits of these financial statements in accordance with the standards of the PCAOB. Those standards require that we plan and perform the audit to obtain reasonable assurance about whether the financial statements are free of material misstatement, whether due to error or fraud.
83
| Gallery Trust | October 31, 2022 |
| | |
| REPORT OF INDEPENDENT REGISTERED PUBLIC ACCOUNTING FIRM | |
Our audits included performing procedures to assess the risks of material misstatement of the financial statements, whether due to error or fraud, and performing procedures that respond to those risks. Such procedures included examining, on a test basis, evidence regarding the amounts and disclosures in the financial statements. Our audits also included evaluating the accounting principles used and significant estimates made by management, as well as evaluating the overall presentation of the financial statements. Our procedures included confirmation of securities owned as of October 31, 2022 by correspondence with the custodian and brokers; when replies were not received from brokers, we performed other auditing procedures. We believe that our audits provide a reasonable basis for our opinions.
/s/ PricewaterhouseCoopers LLP
Philadelphia, Pennsylvania
December 30, 2022
We have served as the auditor of one or more investment companies in Mondrian Investment Partners Limited since 2016.
84
| Gallery Trust | October 31, 2022 |
| | (Unaudited) |
| | |
| DISCLOSURE OF FUND EXPENSES | |
All mutual funds have operating expenses. As a shareholder of a mutual fund, your investment is affected by these ongoing costs, which include (among others) costs for fund management, administrative services, and shareholder reports like this one. It is important for you to understand the impact of these costs on your investment returns.
Operating expenses such as these are deducted from the mutual fund’s gross income and directly reduce its final investment return. These expenses are expressed as a percentage of the mutual fund’s average net assets; this percentage is known as the mutual fund’s expense ratio.
The following examples use the expense ratio and are intended to help you understand the ongoing costs (in dollars) of investing in your Fund and to compare these costs with those of other mutual funds. The examples are based on an investment of $1,000 made at the beginning of the period shown and held for the entire period from May 1, 2022 to October 31, 2022.
The table on the next page illustrates your Fund’s costs in two ways:
Actual Fund Return. This section helps you to estimate the actual expenses after fee waivers that your Fund incurred over the period. The “Expenses Paid During Period” column shows the actual dollar expense cost incurred by a $1,000 investment in the Fund, and the “Ending Account Value” number is derived from deducting that expense cost from the Fund’s gross investment return.
You can use this information, together with the actual amount you invested in the Fund, to estimate the expenses you paid over that period. Simply divide your ending starting account value by $1,000 to arrive at a ratio (for example, an $8,600 account value divided by $1,000 = 8.6), then multiply that ratio by the number shown for your Fund under “Expenses Paid During Period.”
Hypothetical 5% Return. This section helps you compare your Fund’s costs with those of other mutual funds. It assumes that the Fund had an annual 5% return before expenses during the year, but that the expense ratio (Column 3) for the period is unchanged. This example is useful in making comparisons because the Securities and Exchange Commission requires all mutual funds to make this 5% calculation. You can assess your Fund’s comparative cost by comparing the hypothetical result for your Fund in the “Expenses Paid During Period” column with those that appear in the same charts in the shareholder reports for other mutual funds.
85
| Gallery Trust | October 31, 2022 |
| | (Unaudited) |
| | |
| DISCLOSURE OF FUND EXPENSES | |
Note: Because the return is set at 5% for comparison purposes — NOT your Fund’s actual return — the account values shown may not apply to your specific investment.
| | | Beginning Account Value 5/1/22 | | | Ending Account Value 10/31/22 | | | Annualized Expense Ratios | | | Expenses Paid During Period* | |
| Mondrian International Value Equity Fund | | | | | | | | | | | | |
| Actual Fund Return | | $ | 1,000.00 | | | $ | 851.30 | | | | 0.74 | % | | $ | 3.45 | |
| Hypothetical 5% Return | | $ | 1,000.00 | | | $ | 1,021.48 | | | | 0.74 | % | | $ | 3.77 | |
| Mondrian Emerging Markets Value Equity Fund | | | | | | | | | | | | | | | | |
| Actual Fund Return | | $ | 1,000.00 | | | $ | 837.60 | | | | 0.92 | % | | $ | 4.26 | |
| Hypothetical 5% Return | | $ | 1,000.00 | | | $ | 1,020.57 | | | | 0.92 | % | | $ | 4.69 | |
| Mondrian International Government Fixed Income Fund | | | | | | | | | | | | | | | | |
| Actual Fund Return | | $ | 1,000.00 | | | $ | 851.90 | | | | 0.60 | % | | $ | 2.80 | |
| Hypothetical 5% Return | | $ | 1,000.00 | | | $ | 1,022.18 | | | | 0.60 | % | | $ | 3.06 | |
| Mondrian Global Listed Infrastructure Fund | | | | | | | | | | | | | | | | |
| Actual Fund Return | | $ | 1,000.00 | | | $ | 879.60 | | | | 0.95 | % | | $ | 4.50 | |
| Hypothetical 5% Return | | $ | 1,000.00 | | | $ | 1,020.42 | | | | 0.95 | % | | $ | 4.84 | |
| Mondrian Global Equity Value Fund | | | | | | | | | | | | | | | | |
| Actual Fund Return | | $ | 1,000.00 | | | $ | 902.60 | | | | 0.74 | % | | $ | 3.55 | |
| Hypothetical 5% Return | | $ | 1,000.00 | | | $ | 1,021.48 | | | | 0.74 | % | | $ | 3.77 | |
| * | Expenses are equal to the Fund’s annualized expense ratio multiplied by the average account value over the period, multiplied by 184/365 (to reflect the one-half year period). |
86
[This Page Intentionally Left Blank]
| Gallery Trust | October 31, 2022 |
| | (Unaudited) |
| | |
| TRUSTEES AND OFFICERS OF THE GALLERY TRUST | |
Set forth below are the names, age, position with the Trust, length of term of office, and the principal occupations for the last five years of each of the persons currently serving as Trustees and Officers of the Trust. Trustees who are deemed not to be “interested persons” of the Trust are referred to as “Independent Trustees.” Mr. Doran is a Trustee who may be deemed to be “interested” persons of the
| Name and Year of Birth | Position with Trust and Length of Time Served1 | Principal Occupation in the Past Five Years |
INTERESTED TRUSTEES MEMBER3,4 | | |
WILLIAM DORAN
1701 Market Street
Philadelphia, PA 19103
(Born: 1940) | Chairman of the Board of Trustees
(Since 2014) | Self-Employed Consultant since 2003. Partner at Morgan, Lewis & Bockius LLP (law firm) from 1976 to 2003. Counsel to the Trust, SEI Investments, SIMC, the Administrator and the Distributor. Secretary of SEI Investments since 1978 |
INDEPENDENT TRUSTEES 4 | | |
JON HUNT
(Born: 1951) | Trustee and Lead Independent Trustee
(Since 2014) | Retired since 2013. Consultant to Management, Convergent Capital Management, LLC (“CCM”) from 2012 to 2013. Managing Director and Chief Operating Officer, CCM from 1998 to 2012. |
THOMAS P. LEMKE
(Born: 1954) | Trustee
(Since 2014) | Retired since 2013. Executive Vice President and General Counsel, Legg Mason, Inc. from 2005 to 2013. |
| 1 | Each Trustee shall hold office during the lifetime of this trust until the election and qualification of his or her successor, or until he or she dies, resigns, or is removed in accordance with the Declaration of Trust. |
| 2 | Directorships of Companies required to report to the Securities and Exchange Commission under the Securities Exchange act of1934 (i.e., “public companies”) or other investment companies under the 1940 act. |
| 3 | Trustees oversee 5 Funds in the Trust. |
| 4 | Mr. Doran may be deemed to be an “interested” person of the Fund as that term is defined in the 1940 Act by virtue of his affiliation with the Distributor and/or its affiliates. |
88
| Gallery Trust | October 31, 2022 |
| | (Unaudited) |
| | |
| TRUSTEES AND OFFICERS OF THE GALLERY TRUST | |
Trust as that term is defined in the 1940 Act by virtue of their affiliation with the Trust’s Distributor. The Trust’s Statement of Additional Information (“SAI”) includes additional information about the Trustees and Officers. The SAI may be obtained without charge by calling 1-888-832-4386.
The following chart lists Trustees and Officers as of October 31, 2022.
Other Directorships Held in the Past Five Years2 |
| |
Current Directorships: Trustee of The Advisors’ Inner Circle Fund III, Delaware Wilshire Private Markets Master Fund, Delaware Wilshire Private Markets Fund, Delaware Wilshire Private Markets Tender Fund, SEI Daily Income Trust, SEI Institutional International Trust, SEI Institutional Investments Trust, SEI Institutional Managed Trust, SEI Asset Allocation Trust, SEI Tax Exempt Trust, Adviser Managed Trust, New Covenant Funds, SEI Insurance Products Trust and SEI Catholic Values Trust. Director of SEI Investments, SEI Investments (Europe), Limited, SEI Investments—Global Funds Services, Limited, SEI Investments Global, Limited, SEI Investments (Asia), Limited, SEI Global Nominee Ltd., SEI Investments – Unit Trust Management (UK) Limited and SEI Investments Co. Director of the Distributor. Former Directorships: Trustee of Winton Series Trust to 2017. Trustee of The Advisors’ Inner Circle Fund, The Advisors’ Inner Circle Fund II, Bishop Street Funds, The KP Funds and Winton Diversified Opportunities Fund (closed-end investment company) to 2018. Trustee of Schroder Global Series Trust to 2021. Trustee of Schroder Series Trust to 2022. |
| |
Current Directorships: Trustee of The Advisors’ Inner Circle Fund III, City National Rochdale Funds, Delaware Wilshire Private Markets Master Fund, Delaware Wilshire Private Markets Fund and Delaware Wilshire Private Markets Tender Fund. Director of Chiron Capital Allocation Fund Ltd. Former Directorships: Trustee of Winton Series Trust to 2017. Trustee of Winton Diversified Opportunities Fund (closed-end investment company) to 2018. Trustee of Schroder Global Series Trust to 2021. Trustee of Schroder Series Trust to 2022. |
Current Directorships: Trustee of The Advisor’s’ Inner Circle Fund III, Delaware Wilshire Private Markets Master Fund, Delaware Wilshire Private Markets Fund, Delaware Wilshire Private Markets Tender Fund, J.P. Morgan Funds (171 Portfolios) and Symmetry Panoramic Trust (16 Portfolios). Director of Chiron Capital Allocation Fund Ltd. Former Directorships: Trustee of Winton Series Trust and AXA Premier VIP Trust to 2017. Trustee of Winton Diversified Opportunities Fund (closed-end investment company) to 2018. Trustee of Schroder Global Series Trust to 2021. Trustee of Schroder Series Trust to 2022. |
89
| Gallery Trust | October 31, 2022 |
| | (Unaudited) |
| | |
| TRUSTEES AND OFFICERS OF THE GALLERY TRUST | |
| Name and Year of Birth | Position with the Trust and Length of Time Served1 | Principal Occupation During the Past Five Years |
INDEPENDENT TRUSTEES (continued)3 | | |
NICHELLE MAYNARD-ELLIOTT
(Born: 1968) | Trustee
(Since 2021) | Independent Director since 2018. Executive Director, M&A at Praxair Inc. from 2011-2019. |
JAY C. NADEL
(Born: 1958) | Trustee
(Since 2016) | Self-Employed Consultant since 2004. Executive Vice President, Bank of New York Broker Dealer from 2002 to 2004. Partner/ Managing Director, Weiss & Greer/Robeco from 1986 to 2001. |
RANDALL S. YANKER
(Born: 1960) | Trustee
(Since 2014) | Co-Founder and Senior Partner, Alternative Asset Managers, L.P. since 2004. |
| OFFICERS | | |
MICHAEL BEATTIE
(Born: 1965) | President
(Since 2014) | Director of Client Service, SEI Investments Company, since 2004. |
| 1 | Each Trustee shall hold office during the lifetime of this trust until the election and qualification of his or her successor, or until he or she dies, resigns, or is removed in accordance with the Declaration of Trust. |
| 2 | Directorships of Companies required to report to the Securities and Exchange Commission under the Securities Exchange act of1934 (i.e., “public companies”) or other investment companies under the 1940 act. |
| 3 | Mr. Doran may be deemed to be an “interested” person of the Fund as that term is defined in the 1940 Act by virtue of his affiliation with the Distributor and/or its affiliates. |
90
| Gallery Trust | October 31, 2022 |
| | (Unaudited) |
| | |
| TRUSTEES AND OFFICERS OF THE GALLERY TRUST | |
Other Directorships Held in the Past Five Years2 |
| |
Current Directorships: Trustee of The Advisors’ Inner Circle Fund III, Delaware Wilshire Private Markets Master Fund, Delaware Wilshire Private Markets Fund, Delaware Wilshire Private Markets Tender Fund. Director of Chiron Capital Allocation Fund Ltd. Director of Element Solutions Inc., Director of Xerox Holdings Corporation, and Director of Lucid Group, Inc. Former Directorships: Trustee of Schroder Global Series Trust to 2021. Trustee of Schroder Series Trust to 2022. |
Current Directorships: Chairman of the Board of Trustees of City National Rochdale Funds. Trustee of The Advisors’ Inner Circle Fund III, Delaware Wilshire Private Markets Master Fund, Delaware Wilshire Private Markets Fund and Delaware Wilshire Private Markets Tender Fund. Director of Chiron Capital Allocation Fund Ltd. Former Directorships: Trustee of Winton Series Trust to 2017. Director of Lapolla Industries, Inc. to 2017. Trustee of Winton Diversified Opportunities Fund (closed-end investment company) to 2018. Trustee of Schroder Global Series Trust to 2021. Trustee of Schroder Series Trust to 2022. |
Current Directorships: Trustee of The Advisors’ Inner Circle Fund III, Delaware Wilshire Private Markets Master Fund, Delaware Wilshire Private Markets Fund and Delaware Wilshire Private Markets Tender Fund. Independent Non-Executive Director of HFA Holdings Limited. Director of Chiron Capital Allocation Fund Ltd. Former Directorships: Trustee of Winton Series Trust to 2017. Trustee of Winton Diversified Opportunities Fund (closed-end investment company) to 2018. Trustee of Schroder Global Series Trust to 2021. Trustee of Schroder Series Trust to 2022. |
| |
| None. |
91
| Gallery Trust | October 31, 2022 |
| | (Unaudited) |
| | |
| TRUSTEES AND OFFICERS OF THE GALLERY TRUST | |
| Name and Year of Birth | Position with Trust and Length of Time Served | Principal Occupation During the Past Five Years |
| OFFICERS (continued) | | |
JAMES BERNSTEIN
(Born: 1962) | Vice Chairman
(Since 2014)
Secretary
(Since 2020) | Attorney, SEI Investments, since 2017. Prior Positions: Self-employed consultant, 2017. Associate General Counsel & Vice President, Nationwide Funds Group and Nationwide Mutual Insurance Company, from 2002 to 2016. Assistance General Counsel & Vice President, Market Street Funds and Provident Mutual Insurance Company, from 1999 to 2002. |
JOHN BOURGEOIS
(Born: 1973) | Assistant Treasurer
(Since 2017) | Fund Accounting Manager, SEI Investments, since 2000. |
STEPHEN F. PANNER
(Born: 1970) | Chief Compliance Officer
(Since 2022) | Chief Compliance Officer of SEI Asset Allocation Trust, SEI Daily Income Trust, SEI Institutional Investments Trust, SEI Institutional International Trust, SEI Institutional Managed Trust, SEI Tax Exempt Trust, Adviser Managed Trust, New Covenant Funds, SEI Catholic Values Trust, SEI Exchange Traded Funds, SEI Structured Credit Fund LP, The Advisors’ Inner Circle Fund, The Advisors’ Inner Circle Fund II, The Advisors’ Inner Circle Fund III, Bishop Street Funds, Frost Family of Funds, Gallery Trust, Delaware Wilshire Private Markets Fund, Delaware Wilshire Private Markets Master Fund, Delaware Wilshire Private Markets Tender Fund and Catholic Responsible Investments Funds since September 2022. Fund Compliance Officer of SEI Investments Company from February 2011 to September 2022. Fund Accounting Director and CFO and Controller for the SEI Funds from July 2005 to February 2011. |
ERIC C. GRIFFITH
(Born: 1969) | Vice President and Assistant
Secretary (Since 2020) | Counsel at SEI Investments since 2019. Vice President and Assistant General Counsel, JPMorgan Chase & Co., from 2012 to 2018. |
92
| Gallery Trust | October 31, 2022 |
| | (Unaudited) |
| | |
| TRUSTEES AND OFFICERS OF THE GALLERY TRUST | |
| Other Directorships Held in the Past Five Years |
| |
| None. |
| None. |
| None. |
| None. |
93
| Gallery Trust | October 31, 2022 |
| | (Unaudited) |
| | |
| TRUSTEES AND OFFICERS OF THE GALLERY TRUST | |
| Name and Year of Birth | Position with Trust and Length of Time Served | Principal Occupation During the Past Five Years |
| OFFICERS (continued) | | |
MATTHEW M. MAHER
(Born: 1975) | Vice President and Assistant Secretary
(Since 2018) | Counsel at SEI Investments since 2018. Attorney, Blank Rome LLP, from 2015 to 2018. Assistant Counsel & Vice President, Bank of New York Mellon, from 2013 to 2014. Attorney, Dilworth Paxon LLP. from 2006 to 2013. |
ALEXANDER F. SMITH
(Born: 1977) | Vice President and Assistant Secretary
(Since 2020) | Counsel at SEI Investments since 2020. Associate Counsel & Manager, Vanguard, 2012 to 2020. Attorney, Stradley Ronon Stevens & Young, LLP, 2008 to 2012. |
ROBERT MORROW
(Born: 1968) | Vice President
(Since 2017) | Account Manager, SEI Investments, since 2007. |
BRIDGET E. SUDALL
(Born: 1980) | Privacy Officer
(Since 2015)
Anti-Money Laundering Officer
(Since 2015) | Senior Associate and AML Officer, Morgan Stanley Alternative Investment Partners, from 2011 to March 2015. Investor Services Team Lead, Morgan Stanley Alternative Investment Partners, July 2007 to April 2011. |
94
| Gallery Trust | October 31, 2022 |
| | (Unaudited) |
| | |
| TRUSTEES AND OFFICERS OF THE GALLERY TRUST | |
| Other Directorships Held in the Past Five Years |
| |
| None. |
| None. |
| None. |
| None. |
95
| Gallery Trust | October 31, 2022 |
| | (Unaudited) |
| | |
For shareholders that do not have an October 31, 2022 tax year end, this notice is for informational purposes only. For shareholders with an October 31, 2022 tax year end, please consult your tax advisor as to the pertinence of this notice. For the fiscal year ended October 31, 2022, the Funds are designating the following items with regard to distributions paid during the year.
| | | | | | | | | Foreign Investors |
| | Return of Capital | Ordinary Income Distributions | Long-Term Capital Gain Distributions | Total Distributions | Qualifying for Corporate Dividends Received Deduction
(1) | Qualifying Dividend Income
(2) | U.S. Government Interest
(3) | Interest Related Dividends
(4) | Short-Term Capital Gain Dividends
(5) | Foreign Tax Credit
(6) |
| Mondrian International Value Equity Fund | 0.00% | 100.00% | 0.00% | 100.00% | 0.00% | 89.06% | 0.00% | 0.00% | 0.00% | 7.23% |
| Mondrian Emerging Markets Value Equity Fund | 0.00% | 100.00% | 0.00% | 100.00% | 0.07% | 71.94% | 0.00% | 0.00% | 0.00% | 21.29% |
| Mondrian International Government Fixed Income Fund | 0.00% | 100.00% | 0.00% | 100.00% | 0.00% | 0.00% | 0.00% | 0.00% | 0.00% | 0.00% |
| Mondrian Global Listed Infrastructure Fund | 0.00% | 53.57% | 46.43% | 100.00% | 26.10% | 87.16% | 0.00% | 0.00% | 100.00% | 3.96% |
| Mondrian Global Equity Value Fund | 0.00% | 93.38% | 6.62% | 100.00% | 2.99% | 8.42% | 0.00% | 0.00% | 100.00% | 0.00% |
| (1) | Qualifying dividends represent dividends which qualify for the corporate dividends received deduction and is reflected as a percentage of ordinary income distributions (the total of short-term capital gain and net investment income distributions). |
| (2) | The percentage in this column represents the amount of “Qualifying Dividend Income” as created by the Jobs and Growth Tax Relief Reconciliation Act of 2003 and is reflected as a percentage of ordinary income distributions (the total of short-term capital gain and net investment income distributions). It is the intention of the Fund to designate the maximum amount permitted by law. |
| (3) | “U.S. Government Interest” represents the amount of interest that was derived from direct U.S. Government obligations and distributed during the fiscal year. This amount is reflected as a percentage of ordinary income. Generally, interest from direct U.S. Government obligations is exempt from state income tax. However, for shareholders of the Fund who are residents of California, Connecticut and New York, the statutory threshold requirements were not satisfied to permit exemption of these amounts from state income. |
| (4) | The percentage in this column represents the amount of “Interest Related Dividends” and is reflected as a percentage of ordinary income distributions. Interest related dividends are exempted from U.S. withholding tax when paid to foreign investors. |
| (5) | The percentage in this column represents the amount of “Short-Term Capital Gain Dividends” and is reflected as a percentage of short-term capital gain distributions that is exempted from U.S. withholding tax when paid to foreign investors. |
| (6) | The percentage in this column represents the amount of “Qualifying Foreign Taxes” as a percentage of ordinary distributions during the fiscal year ended October 31, 2022. The International Value Equity Fund, Emerging Markets Value Equity Fund and Global Listed Infrastructure Fund intend to pass through a Foreign Tax Credit to shareholders for fiscal year ended 2022. The total amounts of foreign source income are $20,096,189, $484,351 and $54,448, respectively. The total amounts of foreign tax paid are $1,779,985, $80,952 and $4,893, respectively. Your allocation share of the foreign tax credit will be reported on form |
96
| Gallery Trust | October 31, 2022 |
| | (Unaudited) |
| | |
| NOTICE TO SHAREHOLDERS (continued) | |
| | 1099-DIV. |
| | |
| The information reported herein may differ from the information and distributions taxable to the shareholders for the calendar year ending December 31, 2022. Complete information will be computed and reported in conjunction with your 2022 Form 1099-DIV. |
97
FUND INFORMATION
| Registered office | P.O. Box 588
Portland, ME 04112 |
| | |
| Adviser | Mondrian Investment Partners Limited
10 Gresham Street, 5th Floor
London, England EC2V 7JD |
| | |
| Distributor | SEI Investments Distribution Co.
One Freedom Valley Drive
Oaks, PA 19456 |
| | |
| Administrator | SEI Investments Global Funds Services
One Freedom Valley Drive
Oaks, PA 19456 |
| | |
| Legal Counsel | Morgan, Lewis & Bockius LLP
1701 Market Street
Philadelphia, PA 19103 |
| | |
| Custodian | Brown Brothers Harriman & Co
40 Water Street
Boston, Massachusetts 02109 |
| | |
| Transfer Agent | Apex Fund Services
Three Canal Plaza
Portland, ME 04101 |
| | |
Independent Registered
Public Accounting Firm | PricewaterhouseCoopers LLP
2001 Market Street
Philadelphia, PA 19103 |
98
[This Page Intentionally Left Blank]
[This Page Intentionally Left Blank]
[This Page Intentionally Left Blank]
MON-AR-001-0700