UNITED STATES
SECURITIES AND EXCHANGE COMMISSION
Washington, D.C. 20549
________
FORM N-CSR
________
CERTIFIED SHAREHOLDER REPORT OF REGISTERED MANAGEMENT
INVESTMENT COMPANIES
Investment Company Act File Number 811-23091
Gallery Trust
(Exact name of registrant as specified in charter)
________
SEI Investments
One Freedom Valley Drive
Oaks, PA 19456
(Address of principal executive offices) (Zip code)
Michael Beattie
C/O SEI Investments
One Freedom Valley Drive
Oaks, PA 19456
(Name and address of agent for service)
Registrant’s telephone number, including area code: 1-888-832-4386
Date of fiscal year end: October 31, 2024
Date of reporting period: October 31, 2024
Item 1. Reports to Stockholders.
| (a) | A copy of the report transmitted to stockholders pursuant to Rule 30e-1 under the Investment Company Act of 1940, as amended (the “Act”) (17 CFR § 270.30e-1), is attached hereto. |
Mondrian Emerging Markets Value Equity Fund
Institutional Shares - MPEMX
Annual Shareholder Report: October 31, 2024
This annual shareholder report contains important information about Institutional Shares of the Mondrian Emerging Markets Value Equity Fund (the "Fund") for the period from November 1, 2023 to October 31, 2024. You can find additional information about the Fund at https://www.mondrian.com/mutualfunds/emerging-markets-value-equity-fund/. You can also request this information by contacting us at 888-832-4386.
What were the Fund costs for the last year?
(based on a hypothetical $10,000 investment)
| Fund Name | Costs of a $10,000 investment | Costs paid as a percentage of a $10,000 investment |
|---|
| Mondrian Emerging Markets Value Equity Fund, Institutional Shares | $102 | 0.92% |
|---|
How did the Fund perform in the last year?
The Emerging Markets (EM) Asset Class delivered strong returns over the twelve-month period, as the MSCI EM Index gained 25.3%. The key theme that has dominated global equity market moves has been the increasing expectations for the current and future monetisation of Artificial Intelligence (AI). The most notable beneficiary in US markets has been Nvidia, gaining over 150% during 2024 alone. Although the largest EM stocks exposed to the AI theme haven’t risen as much, several have produced excellent returns, particularly in Taiwan. The likes of TSMC, Hon Hai, and MediaTek led MSCI Taiwan to rise 61.0%, which in turn was the primary driver for the outperformance of Asia (+28.9%) over EMEA (+18.8%) and Latin America (+2.4%). Despite China’s headline return of +21.7%, the market had been a clear laggard for most of the year, with ongoing stresses in the property sector and weak domestic consumption dragging on economic growth. This prompted the Chinese authorities to unveil a co-ordinated set of stimulus measures in late September ’24 that sparked an immediate 35%+ rally in Chinese equities. Market returns across Europe, Middle East, and Africa (EMEA) were broadly positive, despite lagging the returns of the likes of Taiwan and India. South Africa (+35.7%) was the best performing market in the region. Latin America’s underperformance was led by Brazil (+0.8%), and Mexico (-2.1%). In both cases investor concern over the outlook under left-wing governments led to relative underperformance and currency depreciation. The Mondrian Emerging Markets Equity Fund (“the Fund”) returned +21.2%. The Fund’s relative returns lagged the Index return over the period, driven by a combination of negative top-down allocation and a smaller negative impact from stock selection. From a top-down perspective, the overweight allocation to Latin America as well as the underperformance of South Korea and Indonesia hindered investment performance. An important offsetting factor was the Fund’s overweight positioning in China leading into the sharp rally experienced in September ’24. The overall contribution from stock selection to investment returns was balanced. Positioning in Taiwan was a significant positive, with Fund holdings in TSMC, Hon Hai, MediaTek, and CTBC Financial contributing the majority of the 315bps gained from the market. This was offset by headwinds from stock selection in China, India, Indonesia and Brazil. Within Latin America, the Fund benefitted from the holdings in Peruvian financial services provider Credicorp and a recovery in Mexican airport operator GAP following the favourable renewal of its operating agreement for the next 5 years. At the sector level, relative underperformance stemmed primarily from negative stock selection within the health care and consumer discretionary sectors. At the beginning of the reporting period the Fund held an overweight allocation to IT, however due to the material outperformance of several IT holdings throughout the course of the year and the subsequent realization of profits by reducing these positions, the Fund now holds an underweight to IT. Across the remaining sectors, stock selection in energy and positioning in the utilities sector added value.
How did the Fund perform during the last 10 years?
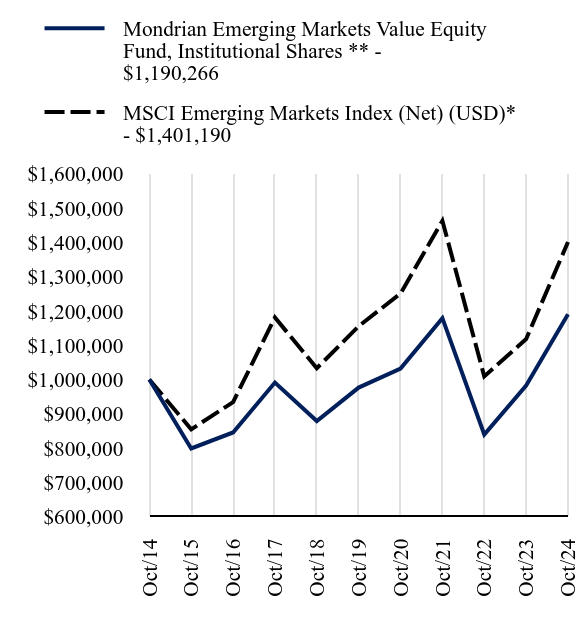
Total Return Based on $1,000,000 Investment
| Mondrian Emerging Markets Value Equity Fund, Institutional Shares ** - $1190266 | MSCI Emerging Markets Index (Net) (USD)* - $1401190 |
|---|
| Oct/14 | $1000000 | $1000000 |
|---|
| Oct/15 | $798887 | $854675 |
|---|
| Oct/16 | $845448 | $933881 |
|---|
| Oct/17 | $991112 | $1180900 |
|---|
| Oct/18 | $878775 | $1033096 |
|---|
| Oct/19 | $976539 | $1155579 |
|---|
| Oct/20 | $1031923 | $1250933 |
|---|
| Oct/21 | $1179173 | $1463095 |
|---|
| Oct/22 | $839534 | $1009149 |
|---|
| Oct/23 | $982362 | $1118131 |
|---|
| Oct/24 | $1190266 | $1401190 |
|---|
Since its inception on September 24, 2018. The line graph represents historical performance of a hypothetical investment of $1,000,000 in the Fund since inception. Returns shown are total returns, which assume the reinvestment of dividends and capital gains. The table and graph presented above do not reflect the deduction of taxes a shareholder would pay on Fund distributions or the redemption of Fund shares. Past performance is not indicative of future performance.Call 888-832-4386 or visit https://www.mondrian.com/mutualfunds/emerging-markets-value-equity-fund/ for current month-end performance.
*As of October 2024, pursuant to the new regulatory requirements, this index has been added to represent the broad-based securities market index.
** The financial statements include the financial information of the Predecessor Fund through September 24, 2018 (See Note 1 in Notes to Financial Statements).
Average Annual Total Returns as of October 31, 2024
| Fund/Index Name | 1 Year | 5 Years | 10 Years |
|---|
| Mondrian Emerging Markets Value Equity Fund, Institutional Shares ** | 21.16% | 4.04% | 1.76% |
|---|
| MSCI Emerging Markets Index (Net) (USD)* | 25.32% | 3.93% | 3.43% |
|---|
On September 24, 2018, the Laudus Mondrian Emerging Markets Fund (the “Emerging Markets Predecessor Fund”) was reorganized into the Mondrian Emerging Markets Equity Fund. Inception date of the Emerging Markets Predecessor Fund was November 2, 2007. Information presented from November 2, 2007 to September 24, 2018 is that of the Emerging Markets Predecessor Fund.
Key Fund Statistics as of October 31, 2024
| Total Net Assets | Number of Holdings | Total Advisory Fees Paid | Portfolio Turnover Rate |
|---|
| $20,623,182 | 60 | $32,916 | 40% |
|---|
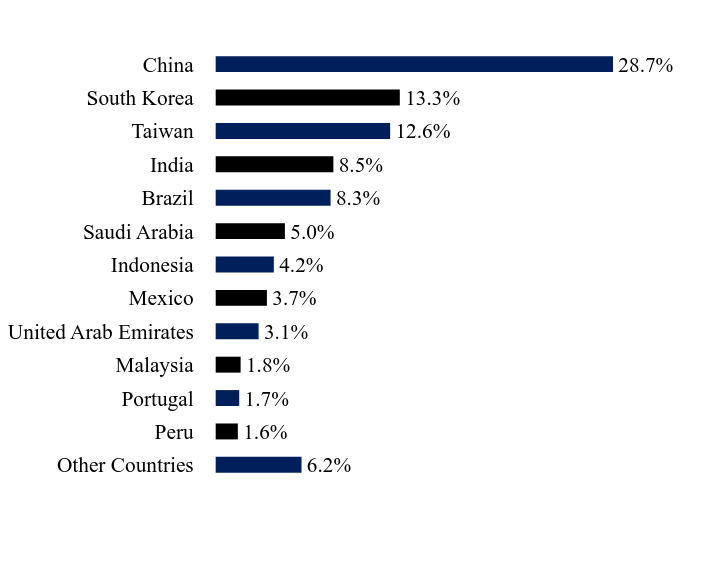
What did the Fund invest in?
| Value | Value |
|---|
| Other Countries | 6.2% |
| Peru | 1.6% |
| Portugal | 1.7% |
| Malaysia | 1.8% |
| United Arab Emirates | 3.1% |
| Mexico | 3.7% |
| Indonesia | 4.2% |
| Saudi Arabia | 5.0% |
| Brazil | 8.3% |
| India | 8.5% |
| Taiwan | 12.6% |
| South Korea | 13.3% |
| China | 28.7% |
| Holding Name | | | Percentage of Total Net Assets |
|---|
| Taiwan Semiconductor Manufacturing Co Ltd | | | 9.4% |
| Alibaba Group Holding Ltd | | | 5.2% |
| Samsung Electronics Co Ltd, Preference | | | 3.5% |
| Tencent Holdings Ltd | | | 3.4% |
| HDFC Bank Ltd | | | 3.4% |
| Axis Bank Ltd | | | 3.0% |
| Shinhan Financial Group Co Ltd | | | 2.8% |
| Bank Rakyat Indonesia Persero Tbk PT | | | 2.6% |
| Yum China Holdings Inc | | | 2.3% |
| Petroleo Brasileiro ADR | | | 2.3% |
* Percentages are calculated based on total net assets.
There were no material changes during the reporting period.
Changes in and Disagreements with Accountants
There were no changes in or disagreements with accountants during the reporting period.
For additional information about the Fund, including its prospectus, financial information, holdings, and proxy voting information, call or visit:
Rule 30e-1 of the Investment Company Act of 1940 permits funds to transmit only one copy of a proxy statement, annual report or semi-annual report to shareholders (who need not be related) with the same residential, commercial or electronic address, provided that the shareholders have consented in writing and the reports are addressed either to each shareholder individually or to the shareholders as a group. This process is known as “householding” and is designed to reduce the duplicate copies of materials that shareholders receive and to lower printing and mailing costs for funds. Once implemented, if you would like to discontinue householding for your accounts, please call toll-free at 888-832-4386 to request individual copies of these documents. Once the Fund receives notice to stop householding, we will begin sending individual copies 30 days after receiving your request.
Mondrian Emerging Markets Value Equity Fund / Institutional Shares - MPEMX
Annual Shareholder Report - October 31, 2024
MON-AR-TSR-2024-1
Mondrian Global Equity Value Fund
Institutional Shares - MPGVX
Annual Shareholder Report: October 31, 2024
This annual shareholder report contains important information about Institutional Shares of the Mondrian Global Equity Value Fund (the "Fund") for the period from November 1, 2023 to October 31, 2024. You can find additional information about the Fund at https://www.mondrian.com/mutualfunds/global-equity-value-fund/. You can also request this information by contacting us at 888-832-4386.
What were the Fund costs for the last year?
(based on a hypothetical $10,000 investment)
| Fund Name | Costs of a $10,000 investment | Costs paid as a percentage of a $10,000 investment |
|---|
| Mondrian Global Equity Value Fund, Institutional Shares | $83 | 0.74% |
|---|
How did the Fund perform in the last year?
Global markets got off to a strong start in the period after data released in November 2023 showed US inflation had fallen by more than expected; bond yields fell, and equities recorded one of their best months since the arrival of COVID-19 vaccines. Global markets continued their strong performance through the end of the year after the Federal Reserve adopted a more dovish stance. Markets continued to rise in the first half of 2024 as macroeconomic data surprised to the upside and as excitement continued to grow over the potential for artificial intelligence. Markets fell at the beginning of August 2024 as the Bank of Japan unexpectedly raised interest rates, triggering a sharp appreciation in the Japanese yen as market participants unwound some of the ‘yen carry trade’. This coupled with the renewed fears of a US recession led to a sharp selloff in equity markets. However, markets rebounded strongly from this later in the third quarter as more encouraging macro data was reported in the US and softening inflation led the Fed to cut interest rates by 50bps in September. Sectoral performance saw a partial reversal of the trends seen through the first half of the year with IT underperforming and defensive sectors outperforming. Global markets fell in October 2024, after a strong run through the first nine months of the year, in part because of the gyrations in the US bond market. The Fund gained 24.8% over the twelve months, a challenging period for a defensive value manager, underperforming the strongly rising MSCI AC World Index which gained 32.8%, while providing a very solid absolute return. Negative stock selection, in particular in the US, drove the majority of relative returns while overweight exposure to the weaker Japanese market and underweight exposure to the stronger US market also held back returns. Country allocation was a headwind for performance: Overweight exposure to the Japanese, UK, and South Korean markets, as well as underweight exposure to the stronger US market, held back returns in the period. These negative effects were only slightly offset by underweight exposure to the relatively weaker Swiss market. Sector allocation also held back returns: The Fund’s sector allocation held back returns as defensive sectors like consumer staples and health care lagged while growth-oriented sectors like information technology and communication services outperformed strongly. This was only partly offset by underweight exposure to the relatively weaker energy sector. Stock selection at the country level was the main detractor from relative performance in the period: Stock selection was strong in the UK and the Netherlands. However, this was more than offset by weaker selections in the US: Dollar Tree lagged, after the company announced it was contemplating strategic alternatives for its struggling Family Dollar stores. Currency allocation was a small positive contributor: The Fund’s overweight exposure to the Japanese yen held back returns, as did the overweight to the relatively weaker Brazilian real. However, these effects were more than offset by overweight exposure to UK sterling and underweight exposure to the US dollar.
How did the Fund perform since inception?
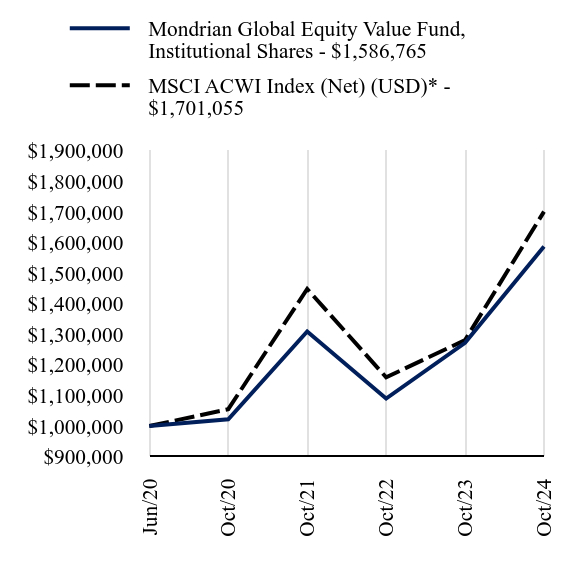
Total Return Based on $1,000,000 Investment
| Mondrian Global Equity Value Fund, Institutional Shares - $1586765 | MSCI ACWI Index (Net) (USD)* - $1701055 |
|---|
| Jun/20 | $1000000 | $1000000 |
|---|
| Oct/20 | $1022000 | $1055018 |
|---|
| Oct/21 | $1309106 | $1448301 |
|---|
| Oct/22 | $1089856 | $1159259 |
|---|
| Oct/23 | $1271982 | $1281003 |
|---|
| Oct/24 | $1586765 | $1701055 |
|---|
Since its inception on June 30, 2020. The line graph represents historical performance of a hypothetical investment of $1,000,000 in the Fund since inception. Returns shown are total returns, which assume the reinvestment of dividends and capital gains. The table and graph presented above do not reflect the deduction of taxes a shareholder would pay on Fund distributions or the redemption of Fund shares. Past performance is not indicative of future performance.Call 888-832-4386 or visit https://www.mondrian.com/mutualfunds/global-equity-value-fund/ for current month-end performance.
*As of October 2024, pursuant to the new regulatory requirements, this index has been added to represent the broad-based securities market index.
Average Annual Total Returns as of October 31, 2024
| Fund/Index Name | 1 Year | Annualized Since Inception |
|---|
| Mondrian Global Equity Value Fund, Institutional Shares | 24.75% | 11.23% |
|---|
| MSCI ACWI Index (Net) (USD)* | 32.79% | 13.02% |
|---|
Key Fund Statistics as of October 31, 2024
| Total Net Assets | Number of Holdings | Total Advisory Fees Paid | Portfolio Turnover Rate |
|---|
| $231,258,212 | 55 | $1,085,825 | 48% |
|---|
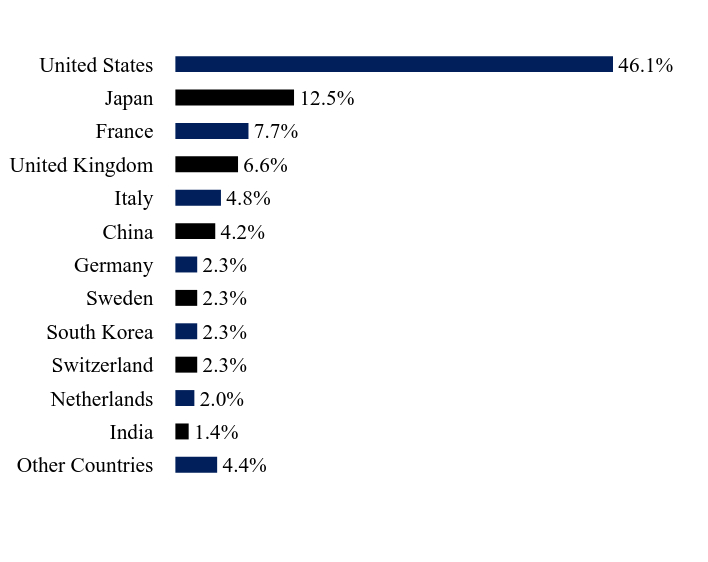
What did the Fund invest in?
| Value | Value |
|---|
| Other Countries | 4.4% |
| India | 1.4% |
| Netherlands | 2.0% |
| Switzerland | 2.3% |
| South Korea | 2.3% |
| Sweden | 2.3% |
| Germany | 2.3% |
| China | 4.2% |
| Italy | 4.8% |
| United Kingdom | 6.6% |
| France | 7.7% |
| Japan | 12.5% |
| United States | 46.1% |
| Holding Name | | | Percentage of Total Net Assets |
|---|
| Enel SpA | | | 3.0% |
| L3Harris Technologies Inc | | | 2.8% |
| UnitedHealth Group Inc | | | 2.8% |
| Wells Fargo & Co | | | 2.8% |
| Kenvue Inc | | | 2.8% |
| Sony Corp Group | | | 2.7% |
| British American Tobacco PLC | | | 2.6% |
| Meta Platforms Inc, Cl A | | | 2.6% |
| Charles Schwab Corp | | | 2.6% |
| DuPont de Nemours | | | 2.6% |
* Percentages are calculated based on total net assets.
There were no material changes during the reporting period.
Changes in and Disagreements with Accountants
There were no changes in or disagreements with accountants during the reporting period.
For additional information about the Fund, including its prospectus, financial information, holdings, and proxy voting information, call or visit:
Rule 30e-1 of the Investment Company Act of 1940 permits funds to transmit only one copy of a proxy statement, annual report or semi-annual report to shareholders (who need not be related) with the same residential, commercial or electronic address, provided that the shareholders have consented in writing and the reports are addressed either to each shareholder individually or to the shareholders as a group. This process is known as “householding” and is designed to reduce the duplicate copies of materials that shareholders receive and to lower printing and mailing costs for funds. Once implemented, if you would like to discontinue householding for your accounts, please call toll-free at 888-832-4386 to request individual copies of these documents. Once the Fund receives notice to stop householding, we will begin sending individual copies 30 days after receiving your request.
Mondrian Global Equity Value Fund / Institutional Shares - MPGVX
Annual Shareholder Report - October 31, 2024
MON-AR-TSR-2024-2
Mondrian Global Listed Infrastructure Fund
Institutional Shares - MGIFX
Annual Shareholder Report: October 31, 2024
This annual shareholder report contains important information about Institutional Shares of the Mondrian Global Listed Infrastructure Fund (the "Fund") for the period from November 1, 2023 to October 31, 2024. You can find additional information about the Fund at https://www.mondrian.com/mutualfunds/global-listed-infrastructure-fund/. You can also request this information by contacting us at 888-832-4386.
What were the Fund costs for the last year?
(based on a hypothetical $10,000 investment)
| Fund Name | Costs of a $10,000 investment | Costs paid as a percentage of a $10,000 investment |
|---|
| Mondrian Global Listed Infrastructure Fund, Institutional Shares | $106 | 0.95% |
|---|
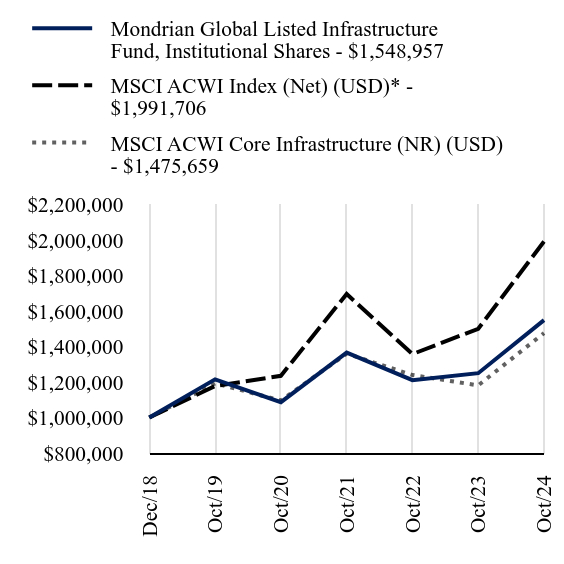
How did the Fund perform in the last year?
Global equity markets rallied strongly over the year on the back of promising macroeconomic data that continued to show a healthy US economy with inflation slowing, as well as growing excitement over the potential for artificial intelligence (AI). The MSCI ACW index rose 32.8%. The MSCI ACW Core Infrastructure index underperformed this index due to a lack of exposure to AI-related sectors like Information Technology and relatively lower returns from infrastructure stocks, such as railroads and airports, within the industrials sector. The fund’s performance was broadly in line with this index. HCA, the US hospital operator, was the largest contributor to the fund’s return, with the company showing steady growth in patient admissions and strong pricing, as well as margin expansion as a result of improving labor availability. Medical procedures had been slow to recover post-COVID and labor shortages had pushed up costs for hospital operators, but these issues have now normalized. Rubis, the French energy infrastructure company, saw its share price rise after posting strong financial results. In addition, an activist investor disclosed a significant position and wrote a letter to the company’s board pushing for strategy and governance changes. As the shares approached our assessment of fair value we divested from the company. Shares in TC Energy, the natural-gas focused pipeline company, rose as investors became increasingly confident of a successful outcome of the spin-off of its oil pipelines business. There is also growing expectation of significant electricity demand from data centers, with gas better able to deliver the steady, uninterrupted power required than renewable alternatives. Enel Americas, the Chilean-listed electric utility, saw it shares decline as adverse weather patterns impacted hydroelectric generation operations in the company’s main markets. In Colombia, very dry conditions caused by the El Niño weather phenomenon has contributed to low reservoir levels and low output from Enel Americas’ hydro assets. As a result, the company had to purchase electricity on the sport market at elevated prices to deliver contracted volumes. Meanwhile in Brazil, heavy rainfall led to unusually-high reservoir levels, bringing down power prices and squeezing power generation margins. Guangdong Investment, the Chinese water utility, was one of the weaker investments over the period as confidence in China’s troubled property sector remained depressed. Although the company’s real estate development operations have grown significantly in recent years, we believe that the challenges there are overshadowing the stable cash flows of its core water utility business, resulting in material undervaluation of the company by the market. Another weak performer during the year was Prologis, the US industrial real estate company. The company lowered their full year guidance due to soft demand in key markets, particularly Southern California. A significant proportion of Prologis’ portfolio is earning rents below market rates and as these contracts expire and roll onto market rates, the company will see strong revenue growth in the coming years.
How did the Fund perform since inception?
Total Return Based on $1,000,000 Investment
| Mondrian Global Listed Infrastructure Fund, Institutional Shares - $1548957 | MSCI ACWI Index (Net) (USD)* - $1991706 | MSCI ACWI Core Infrastructure (NR) (USD) - $1475659 |
|---|
| Dec/18 | $1000000 | $1000000 | $1000000 |
|---|
| Oct/19 | $1214932 | $1177720 | $1192352 |
|---|
| Oct/20 | $1086633 | $1235284 | $1095897 |
|---|
| Oct/21 | $1365905 | $1695766 | $1359639 |
|---|
| Oct/22 | $1210436 | $1357337 | $1239464 |
|---|
| Oct/23 | $1249867 | $1499883 | $1181160 |
|---|
| Oct/24 | $1548957 | $1991706 | $1475659 |
|---|
Since its inception on December 17, 2018. The line graph represents historical performance of a hypothetical investment of $1,000,000 in the Fund since inception. Returns shown are total returns, which assume the reinvestment of dividends and capital gains. The table and graph presented above do not reflect the deduction of taxes a shareholder would pay on Fund distributions or the redemption of Fund shares. Past performance is not indicative of future performance.Call 888-832-4386 or visit https://www.mondrian.com/mutualfunds/global-listed-infrastructure-fund/ for current month-end performance.
*As of October 2024, pursuant to the new regulatory requirements, this index has been added to represent the broad-based securities market index.
Average Annual Total Returns as of October 31, 2024
| Fund/Index Name | 1 Year | 5 Years | Annualized Since Inception |
|---|
| Mondrian Global Listed Infrastructure Fund, Institutional Shares | 23.93% | 4.98% | 7.73% |
|---|
| MSCI ACWI Index (Net) (USD)* | 32.79% | 11.08% | 12.44% |
|---|
| MSCI ACWI Core Infrastructure (NR) (USD) | 24.93% | 4.36% | 6.85% |
|---|
Key Fund Statistics as of October 31, 2024
| Total Net Assets | Number of Holdings | Total Advisory Fees Paid | Portfolio Turnover Rate |
|---|
| $1,936,395 | 26 | $- | 18% |
|---|
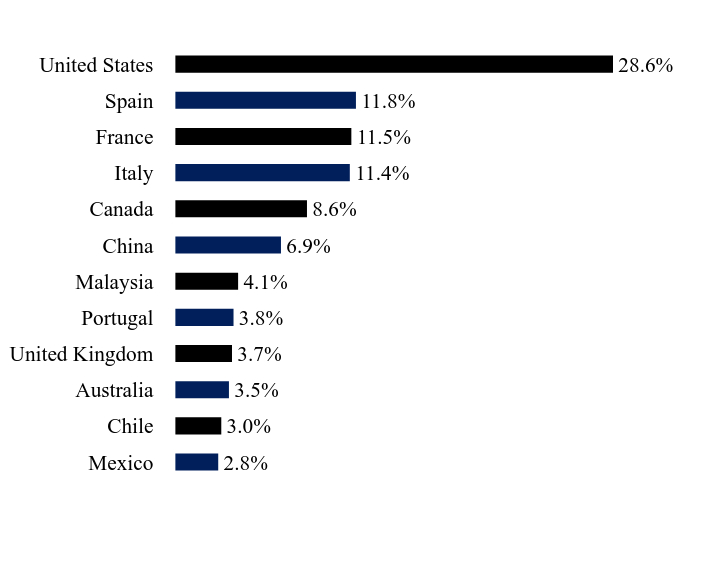
What did the Fund invest in?
| Value | Value |
|---|
| Mexico | 2.8% |
| Chile | 3.0% |
| Australia | 3.5% |
| United Kingdom | 3.7% |
| Portugal | 3.8% |
| Malaysia | 4.1% |
| China | 6.9% |
| Canada | 8.6% |
| Italy | 11.4% |
| France | 11.5% |
| Spain | 11.8% |
| United States | 28.6% |
| Holding Name | | | Percentage of Total Net Assets |
|---|
| Edison International | | | 4.7% |
| Prologis Inc | | | 4.4% |
| Enav SpA | | | 4.4% |
| Enbridge Inc | | | 4.3% |
| Enel SpA | | | 4.3% |
| South Bow, Cl W | | | 4.2% |
| Cellnex Telecom | | | 4.2% |
| Eversource Energy | | | 4.2% |
| Westports Holdings | | | 4.1% |
| Iberdrola SA | | | 4.0% |
* Percentages are calculated based on total net assets.
There were no material changes during the reporting period.
Changes in and Disagreements with Accountants
There were no changes in or disagreements with accountants during the reporting period.
For additional information about the Fund, including its prospectus, financial information, holdings, and proxy voting information, call or visit:
Rule 30e-1 of the Investment Company Act of 1940 permits funds to transmit only one copy of a proxy statement, annual report or semi-annual report to shareholders (who need not be related) with the same residential, commercial or electronic address, provided that the shareholders have consented in writing and the reports are addressed either to each shareholder individually or to the shareholders as a group. This process is known as “householding” and is designed to reduce the duplicate copies of materials that shareholders receive and to lower printing and mailing costs for funds. Once implemented, if you would like to discontinue householding for your accounts, please call toll-free at 888-832-4386 to request individual copies of these documents. Once the Fund receives notice to stop householding, we will begin sending individual copies 30 days after receiving your request.
Mondrian Global Listed Infrastructure Fund / Institutional Shares - MGIFX
Annual Shareholder Report - October 31, 2024
MON-AR-TSR-2024-3
Mondrian International Value Equity Fund
Institutional Shares - MPIEX
Annual Shareholder Report: October 31, 2024
This annual shareholder report contains important information about Institutional Shares of the Mondrian International Value Equity Fund (the "Fund") for the period from November 1, 2023 to October 31, 2024. You can find additional information about the Fund at https://www.mondrian.com/mutualfunds/international-value-equity-fund/. You can also request this information by contacting us at 888-832-4386.
What were the Fund costs for the last year?
(based on a hypothetical $10,000 investment)
| Fund Name | Costs of a $10,000 investment | Costs paid as a percentage of a $10,000 investment |
|---|
| Mondrian International Value Equity Fund, Institutional Shares | $82 | 0.74% |
|---|
How did the Fund perform in the last year?
International equity markets rose strongly over the last twelve months. Equity markets were supported by slowing inflation and better-than-expected economic and employment data. The Hong Kong equity market was a notable laggard as the Chinese economy slowed and slid into deflation and was further weighed down by a growing property crisis. The financials sector led returns on more robust economic data. The IT sector outperformed as global technology companies were buoyed by AI optimism. Most major international currencies appreciated against the US dollar as the Fed delivered a larger-than-expected interest rate cut of 50bps. The Fund generated strong absolute returns in the past twelve months, but slightly lagged index returns. Country allocation to Taiwan and Singapore added to relative returns: The overweight position in the strong Singaporean equity market and the exposure to Taiwan added to relative returns. Strong returns in Singapore were driven by the banks. Stock selection in France held back relative returns: Strong stock selection in the Netherlands was driven by Philips, the Dutch health care technology company, which was buoyed by the settlement of litigation concerning their sleep apnea devices. The costs were lower, and the settlement came sooner than expected. Philips’ order intake and margins also continued to improve from the COVID-related supply chain disruptions. This was more than offset by stock selection in France where Kering, the French luxury goods company, is undergoing a brand transformation at its largest design house, Gucci. The broader luxury goods segment underperformed on Chinese consumer weakness. Relative returns were held back by the underweight position in the financials sector: The positive impact of the overweight position in the strong industrials sector was more than offset by the underweight position in the strong financials sector and the overweight position in the weak energy sector. Stock selection within the consumer staples and IT sectors added to relative returns. Currency allocation held back relative returns: The positive impact of the overweight position in the strong British pound was more than offset by the underweight position in the strong Swiss franc and the overweight position in the weak Japanese yen. The Japanese yen lagged other international currencies as the Bank of Japan’s new governor, Kazuo Ueda, maintained Japan’s ultra-loose monetary policy throughout 2023. The Bank of Japan did eventually raise its policy rate for the first time in 17 years in March 2024, and then again in July 2024, which led to a sharp rally in the yen in the third quarter of 2024.
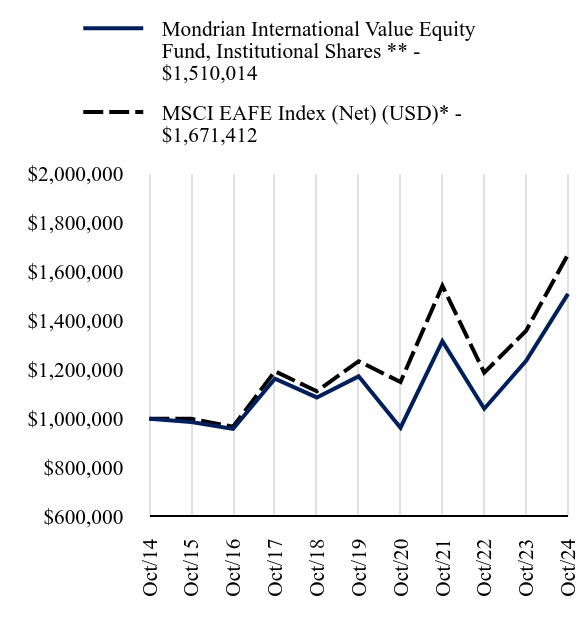
How did the Fund perform during the last 10 years?
Total Return Based on $1,000,000 Investment
| Mondrian International Value Equity Fund, Institutional Shares ** - $1510014 | MSCI EAFE Index (Net) (USD)* - $1671412 |
|---|
| Oct/14 | $1000000 | $1000000 |
|---|
| Oct/15 | $986114 | $999325 |
|---|
| Oct/16 | $958230 | $967080 |
|---|
| Oct/17 | $1163148 | $1193741 |
|---|
| Oct/18 | $1086816 | $1111917 |
|---|
| Oct/19 | $1172980 | $1234715 |
|---|
| Oct/20 | $963267 | $1149960 |
|---|
| Oct/21 | $1317020 | $1543021 |
|---|
| Oct/22 | $1040737 | $1188144 |
|---|
| Oct/23 | $1236598 | $1359247 |
|---|
| Oct/24 | $1510014 | $1671412 |
|---|
Since its inception on March 14, 2016. The line graph represents historical performance of a hypothetical investment of $1,000,000 in the Fund since inception. Returns shown are total returns, which assume the reinvestment of dividends and capital gains. The table and graph presented above do not reflect the deduction of taxes a shareholder would pay on Fund distributions or the redemption of Fund shares. Past performance is not indicative of future performance.Call 888-832-4386 or visit https://www.mondrian.com/mutualfunds/international-value-equity-fund/ for current month-end performance.
*As of October 2024, pursuant to the new regulatory requirements, this index has been added to represent the broad-based securities market index.
** The financial statements include the financial information of the Predecessor Fund through March 14, 2016 (See Note 1 in Notes to Financial Statements).
Average Annual Total Returns as of October 31, 2024
| Fund/Index Name | 1 Year | 5 Years | 10 Years |
|---|
| Mondrian International Value Equity Fund, Institutional Shares ** | 22.11% | 5.18% | 4.21% |
|---|
| MSCI EAFE Index (Net) (USD)* | 22.97% | 6.24% | 5.27% |
|---|
On March 14, 2016, The International Equity Portfolio, a series of Delaware Pooled Trust (the “International Equity Predecessor Fund”) was reorganized into the Mondrian International Equity Fund. Inception date of the Predecessor Fund was February 4, 1992. Information presented from February 4, 1992 to March 14, 2016 is that of the International Equity Predecessor Fund.
Key Fund Statistics as of October 31, 2024
| Total Net Assets | Number of Holdings | Total Advisory Fees Paid | Portfolio Turnover Rate |
|---|
| $883,324,004 | 53 | $5,084,122 | 34% |
|---|
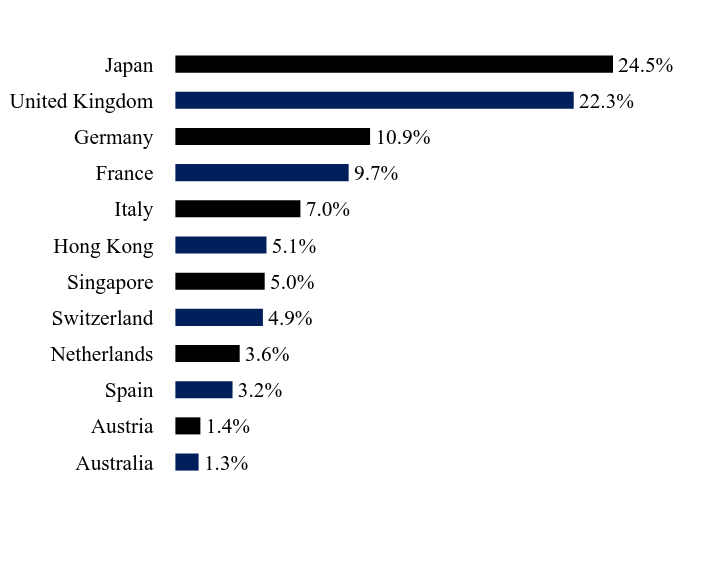
What did the Fund invest in?
| Value | Value |
|---|
| Australia | 1.3% |
| Austria | 1.4% |
| Spain | 3.2% |
| Netherlands | 3.6% |
| Switzerland | 4.9% |
| Singapore | 5.0% |
| Hong Kong | 5.1% |
| Italy | 7.0% |
| France | 9.7% |
| Germany | 10.9% |
| United Kingdom | 22.3% |
| Japan | 24.5% |
| Holding Name | | | Percentage of Total Net Assets |
|---|
| Lloyds Banking Group PLC | | | 3.3% |
| Enel SpA | | | 3.3% |
| Allianz SE | | | 3.2% |
| Banco Santander SA | | | 3.2% |
| United Overseas Bank Ltd | | | 3.1% |
| Fujitsu Ltd | | | 3.1% |
| SSE PLC | | | 3.0% |
| Imperial Brands PLC | | | 3.0% |
| Sony Corp Group | | | 2.9% |
| FUJIFILM Holdings Corp | | | 2.9% |
* Percentages are calculated based on total net assets.
There were no material changes during the reporting period.
Changes in and Disagreements with Accountants
There were no changes in or disagreements with accountants during the reporting period.
For additional information about the Fund, including its prospectus, financial information, holdings, and proxy voting information, call or visit:
Rule 30e-1 of the Investment Company Act of 1940 permits funds to transmit only one copy of a proxy statement, annual report or semi-annual report to shareholders (who need not be related) with the same residential, commercial or electronic address, provided that the shareholders have consented in writing and the reports are addressed either to each shareholder individually or to the shareholders as a group. This process is known as “householding” and is designed to reduce the duplicate copies of materials that shareholders receive and to lower printing and mailing costs for funds. Once implemented, if you would like to discontinue householding for your accounts, please call toll-free at 888-832-4386 to request individual copies of these documents. Once the Fund receives notice to stop householding, we will begin sending individual copies 30 days after receiving your request.
Mondrian International Value Equity Fund / Institutional Shares - MPIEX
Annual Shareholder Report - October 31, 2024
MON-AR-TSR-2024-4
Item 2. Code of Ethics.
The Registrant (also referred to as the “Trust”) has adopted a code of ethics that applies to the Registrant’s principal executive officer, principal financial officer, controller or principal accounting officer, and any person who performs a similar function. There have been no amendments to or waivers granted to this code of ethics during the period covered by this report.
Item 3. Audit Committee Financial Expert.
(a)(1) The Registrant’s board of trustees has determined that the Registrant has at least one audit committee financial expert serving on the audit committee.
(a) (2) The Registrant’s audit committee financial experts are Thomas P. Lemke and Jay Nadel, and each of Mr. Lemke and Mr. Nadel is “independent” as that term is defined in Form N-CSR Item 3 (a)(2).
Item 4. Principal Accountant Fees and Services.
Fees billed by PricewaterhouseCoopers LLP (“PwC”) related to the Trust.
PwC billed the Trust aggregate fees for services rendered to the Trust for the last two fiscal years as follows:
| | 2024 | 2023 |
| | | All fees and services to the Trust that were pre-approved | All fees and services to service affiliates that were pre-approved | All other fees and services to service affiliates that did not require pre-approval | All fees and services to the Trust that were pre-approved | All fees and services to service affiliates that were pre-approved | All other fees and services to service affiliates that did not require pre-approval |
| (a) | Audit Fees(1) | $109,059 | None | None | $103,760 | None | None |
| (b) | Audit-Related Fees | None | None | None | None | None | None |
| (c) | Tax Fees | None | None | $65,000(3) | $17,583(2) | None | $125,000(3) |
| (d) | All Other Fees | None | None | $146,757(4) | None | None | $149,452(4) |
Notes:
| (1) | Audit fees include amounts related to the audit of the Trust’s annual financial statements and services normally provided by the accountant in connection with statutory and regulatory filings. |
| (2) | Contains tax compliance services for Mondrian International Value Equity Fund. |
| (3) | Contains tax compliance services provided to service affiliates of the Funds. |
| (4) | Non-audit assurance engagements for service affiliates of the Funds. |
(e)(1) The Trust’s Audit Committee has adopted and the Board of Trustees has ratified an Audit and Non-Audit Services Pre-Approval Policy (the “Policy”), which sets forth the procedures and the conditions pursuant to which services proposed to be performed by the independent auditor of the Funds may be pre-approved.
The Policy provides that all requests or applications for proposed services to be provided by the independent auditor must be submitted to the Registrant’s Chief Financial Officer (“CFO”) and must include a detailed description of the services proposed to be rendered. The CFO will determine whether such services:
| (1) | require specific pre-approval; |
| (2) | are included within the list of services that have received the general pre-approval of the Audit Committee pursuant to the Policy; or |
| (3) | have been previously pre-approved in connection with the independent auditor’s annual engagement letter for the applicable year or otherwise. In any instance where services require pre-approval, the Audit Committee will consider whether such services are consistent with SEC’s rules and whether the provision of such services would impair the auditor’s independence |
Requests or applications to provide services that require specific pre-approval by the Audit Committee will be submitted to the Audit Committee by the CFO. The Audit Committee will be informed by the CFO on a quarterly basis of all services rendered by the independent auditor. The Audit Committee has delegated specific pre-approval authority to either the Audit Committee Chair or financial expert, provided that the estimated fee for any said proposed pre-approved service does not exceed $100,000 and any pre-approval decisions are reported to the Audit Committee at the Audit Committee’s next regularly-scheduled meeting.
Services that have received the general pre-approval of the Audit Committee are identified and described in the Policy. In addition, the Policy sets forth a maximum fee per engagement with respect to each identified service that has received general pre-approval.
All services to be provided by the independent auditor shall be provided pursuant to a signed written engagement letter with the Registrant, the investment adviser or applicable control affiliate (except that matters as to which an engagement letter would be impractical because of timing issues or because the matter is small may not be the subject of an engagement letter) that sets forth both the services to be provided by the independent auditor and the total fees to be paid to the independent auditor for those services.
In addition, the Audit Committee has determined to take additional measures on an annual basis to meet the Audit Committee’s responsibility to oversee the work of the independent auditor and to assure the auditor's independence from the Registrant, such as (a) reviewing a formal written statement from the independent auditor delineating all relationships between the independent auditor and the Registrant, and (b) discussing with the independent auditor the independent auditor’s methods and procedures for ensuring independence.
| (e)(2) | Percentage of fees billed applicable to non-audit services pursuant to waiver of pre-approval requirement were as follows (PwC): |
| | 2024 | 2023 |
Audit-Related Fees | None | None |
| Tax Fees | None | None |
All Other Fees | None | None |
(f) Not applicable.
(g) The aggregate non-audit fees and services billed by PwC for services rendered to the Registrant, and rendered to the Registrant’s investment adviser (not including any sub-adviser whose role is primarily portfolio management and is subcontracted with or overseen by another investment adviser), and any entity controlling, controlled by, or under common control with the adviser that provides ongoing services to the Registrant for the last fiscal-years-ended October 31st were $211,757 and $274,452 for 2024 and 2023, respectively.
(h) During the past fiscal year, all non-audit services provided by Registrant’s principal accountant to either Registrant’s investment adviser or to any entity controlling, controlled by, or under common control with Registrant’s investment adviser that provides ongoing services to Registrant were pre-approved by the Audit Committee of Registrant’s Board of Trustees. Included in the Audit Committee’s pre-approval of these non-audit services was the review and consideration as to whether the provision of these non-audit services is compatible with maintaining the principal accountant’s independence.
(i) Not Applicable. The Registrant has not retained, for the preparation of the audit report on the financial statements included in the Form N-CSR, a registered public accounting firm that has a branch or office that is located in a foreign jurisdiction and that the Public Company Accounting Oversight Board (the “PCAOB”) has determined that the PCAOB is unable to inspect or investigate completely because of a position taken by an authority in the foreign jurisdiction.
(j) Not Applicable. The Registrant is not a “foreign issuer,” as defined in 17 CFR § 240.3b-4.
Item 5. Audit Committee of Listed Registrants.
Not applicable to open-end management investment companies.
Item 6. Schedule of Investments.
| (a) | The Schedule of Investments is included as part of the Financial Statements and Other Information filed under Item 7 of this form. |
Item 7. Financial Statements and Financial Highlights for Open-End Management Investment Companies.
Financial statements and financial highlights are filed herein.
Gallery Trust
TABLE OF CONTENTS
| Financial Statements (Form N-CSR Item 7) | |
| Schedules of Investments | 1 |
| Statements of Assets and Liabilities | 16 |
| Statements of Operations | 18 |
| Statements of Changes in Net Assets | 22 |
| Financial Highlights | 26 |
| Notes to Financial Statements | 30 |
| Report of Independent Registered Public Accounting Firm | 53 |
| Notice to Shareholders (Unaudited) | 55 |
| Fund Information | 57 |
This report has been prepared for shareholders and may be distributed to others only if preceded or accompanied by an effective prospectus.
| Gallery Trust | Mondrian International Value Equity Fund October 31, 2024 |
| | |
| SCHEDULE OF INVESTMENTS | | | | | | |
| | | | | | | |
| COMMON STOCK — 98.9% | | | | | | |
| | | | | | | |
| | | Number of
Shares | | | Value
(U.S. $) | |
| AUSTRALIA — 1.3% | | | | | | | | |
| Aurizon Holdings Ltd | | | 5,052,062 | | | $ | 11,201,741 | |
| Total Australia | | | | | | | 11,201,741 | |
| | | | | | | | | |
| AUSTRIA — 1.4% | | | | | | | | |
| ANDRITZ | | | 207,480 | | | | 12,526,190 | |
| Total Austria | | | | | | | 12,526,190 | |
| | | | | | | | | |
| FRANCE — 9.7% | | | | | | | | |
| Bouygues SA | | | 650,946 | | | | 20,922,382 | |
| Kering SA | | | 52,222 | | | | 13,043,508 | |
| Pernod Ricard SA | | | 66,820 | | | | 8,337,032 | |
| Sanofi SA | | | 225,337 | | | | 23,813,545 | |
| Vinci SA | | | 173,036 | | | | 19,383,594 | |
| Total France | | | | | | | 85,500,061 | |
| | | | | | | | | |
| GERMANY — 10.9% | | | | | | | | |
| Allianz SE | | | 91,169 | | | | 28,700,455 | |
| Continental AG | | | 160,857 | | | | 10,039,131 | |
| Deutsche Post | | | 549,120 | | | | 22,057,866 | |
| Evonik Industries AG | | | 1,052,781 | | | | 23,202,407 | |
| HeidelbergMaterials AG | | | 111,637 | | | | 12,295,592 | |
| Total Germany | | | | | | | 96,295,451 | |
| | | | | | | | | |
| HONG KONG — 5.1% | | | | | | | | |
| CK Hutchison Holdings Ltd | | | 3,391,500 | | | | 17,836,334 | |
| Jardine Matheson Holdings Ltd | | | 337,215 | | | | 12,957,171 | |
| WH Group Ltd | | | 18,710,639 | | | | 14,562,798 | |
| Total Hong Kong | | | | | | | 45,356,303 | |
| | | | | | | | | |
| ITALY — 7.0% | | | | | | | | |
| Enel SpA | | | 3,785,767 | | | | 28,711,513 | |
| Eni SpA | | | 504,913 | | | | 7,691,426 | |
| Snam SpA | | | 5,194,466 | | | | 24,953,710 | |
| Total Italy | | | | | | | 61,356,649 | |
The accompanying notes are an integral part of the financial statements.
| Gallery Trust | Mondrian International Value Equity Fund October 31, 2024 |
| | |
| COMMON STOCK — continued | | | | | | |
| | | Number of
Shares | | | Value
(U.S. $) | |
| JAPAN — 24.5% | | | | | | | | |
| FUJIFILM Holdings Corp | | | 1,076,400 | | | $ | 25,605,749 | |
| Fujitsu Ltd | | | 1,407,800 | | | | 27,066,139 | |
| Hitachi Ltd | | | 478,100 | | | | 12,012,196 | |
| Honda Motor Co Ltd | | | 1,354,100 | | | | 13,618,337 | |
| Kao Corp | | | 122,900 | | | | 5,416,865 | |
| KDDI Corp | | | 325,400 | | | | 10,145,776 | |
| Kyocera Corp | | | 842,600 | | | | 8,545,404 | |
| MINEBEA MITSUMI | | | 698,900 | | | | 12,303,770 | |
| Mitsubishi Electric Corp | | | 637,900 | | | | 11,222,276 | |
| Nippon Telegraph & Telephone Corp | | | 13,554,000 | | | | 13,077,381 | |
| Panasonic Holdings | | | 1,347,900 | | | | 11,093,270 | |
| Secom Co Ltd | | | 452,100 | | | | 16,077,991 | |
| Sony Corp Group | | | 1,476,300 | | | | 25,979,214 | |
| Sumitomo Metal Mining | | | 362,500 | | | | 10,022,614 | |
| Toyota Industries Corp | | | 198,300 | | | | 13,746,563 | |
| Total Japan | | | | | | | 215,933,545 | |
| | | | | | | | | |
| NETHERLANDS — 3.6% | | | | | | | | |
| Koninklijke Ahold Delhaize NV | | | 401,019 | | | | 13,232,944 | |
| Koninklijke Philips NV * | | | 710,670 | | | | 18,696,866 | |
| Total Netherlands | | | | | | | 31,929,810 | |
| | | | | | | | |
| SINGAPORE — 5.0% | | | | | | | | |
| Singapore Telecommunications Ltd | | | 7,180,802 | | | | 16,941,184 | |
| United Overseas Bank Ltd | | | 1,131,340 | | | | 27,501,802 | |
| Total Singapore | | | | | | | 44,442,986 | |
| | | | | | | | | |
| SPAIN — 3.2% | | | | | | | | |
| Banco Santander SA | | | 5,817,379 | | | | 28,420,155 | |
| Total Spain | | | | | | | 28,420,155 | |
| | | | | | | | | |
| SWITZERLAND — 4.9% | | | | | | | | |
| Nestle SA | | | 91,729 | | | | 8,667,716 | |
| Novartis AG | | | 123,410 | | | | 13,390,760 | |
| Roche Holding AG | | | 34,590 | | | | 10,719,563 | |
| Sandoz Group AG | | | 232,400 | | | | 10,594,715 | |
| Total Switzerland | | | | | | | 43,372,754 | |
The accompanying notes are an integral part of the financial statements.
| Gallery Trust | Mondrian International Value Equity Fund October 31, 2024 |
| | |
| COMMON STOCK — continued | | | | | | |
| | | Number of
Shares | | | Value
(U.S. $) | |
| UNITED KINGDOM — 22.3% | | | | | | | | |
| Associated British Foods PLC | | | 421,322 | | | $ | 12,109,588 | |
| BP PLC | | | 2,892,750 | | | | 14,147,999 | |
| British American Tobacco PLC | | | 272,347 | | | | 9,523,787 | |
| GSK PLC | | | 1,246,856 | | | | 22,516,573 | |
| Imperial Brands PLC | | | 865,344 | | | | 26,114,525 | |
| Kingfisher PLC | | | 3,403,011 | | | | 12,869,588 | |
| Lloyds Banking Group PLC | | | 42,788,275 | | | | 29,370,041 | |
| Shell PLC | | | 530,627 | | | | 17,716,315 | |
| SSE PLC | | | 1,183,055 | | | | 26,883,171 | |
| Tesco PLC | | | 781,261 | | | | 3,449,811 | |
| WPP PLC | | | 2,123,535 | | | | 22,320,444 | |
| Total United Kingdom | | | | | | | 197,021,842 | |
| | | | | | | | | |
| Total Common Stock | | | | | | | | |
| (Cost $813,187,374) | | | | | | | 873,357,487 | |
| | | | | | | | | |
| Total Value of Securities — 98.9% | | | | | | | | |
| (Cost $813,187,374) | | | | | | $ | 873,357,487 | |
Percentages are based on Net Assets of $883,324,004.
| * | Non-income producing security. |
Ltd — Limited
PLC — Public Limited Company
As of October 31, 2024, all of the Fund's investments were considered Level 2, in accordance the authoritative guidance on fair value measurements and disclosure under U.S. GAAP.
For more information on valuation inputs, see Note 2 in Notes to Financial Statements.
The accompanying notes are an integral part of the financial statements.
| Gallery Trust | Mondrian Emerging Markets Value Equity Fund October 31, 2024 |
| | |
| SCHEDULE OF INVESTMENTS | | | | | | |
| | | | | | | |
| COMMON STOCK — 92.3% | | | | | | |
| | | Number of
Shares | | | Value
(U.S. $) | |
| BRAZIL — 6.6% | | | | | | | | |
| Ambev SA | | | 117,900 | | | $ | 256,974 | |
| Hypera SA | | | 67,500 | | | | 258,982 | |
| Petroleo Brasileiro ADR | | | 34,706 | | | | 466,796 | |
| Vale Sponsored ADR Class B | | | 35,406 | | | | 378,844 | |
| Total Brazil | | | | | | | 1,361,596 | |
| | | | | | | | | |
| CANADA — 1.3% | | | | | | | | |
| Barrick Gold Corp US | | | 14,309 | | | | 276,450 | |
| Total Canada | | | | | | | 276,450 | |
| | | | | | | | | |
| CHILE — 0.7% | | | | | | | | |
| Sociedad Quimica y Minera de Chile Sponsored ADR | | | 3,777 | | | | 144,999 | |
| Total Chile | | | | | | | 144,999 | |
| | | | | | | | | |
| CHINA — 28.7% | | | | | | | | |
| Alibaba Group Holding Ltd | | | 87,384 | | | | 1,068,909 | |
| Autohome Inc Sponsored ADR | | | 10,742 | | | | 301,850 | |
| Baidu Inc Sponsored ADR * | | | 1,995 | | | | 182,004 | |
| China Medical System Holdings Ltd | | | 108,000 | | | | 108,027 | |
| China Merchants Bank Class A | | | 58,800 | | | | 309,062 | |
| China Tower Class H | | | 2,828,000 | | | | 381,585 | |
| CSPC Pharmaceutical Group Ltd | | | 525,520 | | | | 389,060 | |
| Gree Electric Appliances Inc Class A | | | 31,596 | | | | 193,311 | |
| Midea Group Co Ltd Class A | | | 22,003 | | | | 220,566 | |
| PetroChina Class H | | | 476,000 | | | | 357,435 | |
| Ping An Insurance Group Co of China Ltd Class H | | | 67,000 | | | | 415,118 | |
| Sinotruk Hong Kong Ltd | | | 100,500 | | | | 271,257 | |
| Tencent Holdings Ltd | | | 13,600 | | | | 709,133 | |
| Tingyi Cayman Islands Holding Corp Class H | | | 158,000 | | | | 230,505 | |
| Wuliangye Yibin Class A | | | 10,200 | | | | 210,603 | |
| Xinyi Solar Holdings Ltd | | | 178,000 | | | | 91,290 | |
| Yum China Holdings Inc | | | 10,680 | | | | 471,095 | |
| Total China | | | | | | | 5,910,810 | |
The accompanying notes are an integral part of the financial statements.
| Gallery Trust | Mondrian Emerging Markets Value Equity Fund October 31, 2024 |
| | |
| COMMON STOCK — continued | | | | | | |
| | | Number of
Shares | | | Value
(U.S. $) | |
| FINLAND — 1.3% | | | | | | | | |
| Metso Corp | | | 28,276 | | | $ | 269,107 | |
| Total Finland | | | | | | | 269,107 | |
| | | | | | | | | |
| HONG KONG — 1.4% | | | | | | | | |
| WH Group Ltd | | | 370,728 | | | | 288,544 | |
| Total Hong Kong | | | | | | | 288,544 | |
| | | | | | | | | |
| INDIA — 8.5% | | | | | | | | |
| Axis Bank Ltd | | | 45,076 | | | | 619,216 | |
| HDFC Bank | | | 33,767 | | | | 694,071 | |
| HDFC Bank Ltd Sponsored ADR | | | 2,304 | | | | 145,221 | |
| Indus Towers Ltd * | | | 71,916 | | | | 290,177 | |
| Total India | | | | | | | 1,748,685 | |
| | | | | | | | | |
| INDONESIA — 4.2% | | | | | | | | |
| Bank Rakyat Indonesia Persero Tbk PT | | | 1,781,539 | | | | 543,109 | |
| Telkom Indonesia Persero Tbk PT | | | 1,846,400 | | | | 330,031 | |
| Total Indonesia | | | | | | | 873,140 | |
| | | | | | | | | |
| KAZAKHSTAN — 0.6% | | | | | | | | |
| Kaspi.KZ JSC ADR | | | 1,174 | | | | 129,304 | |
| Total Kazakhstan | | | | | | | 129,304 | |
| | | | | | | | | |
| MALAYSIA — 1.8% | | | | | | | | |
| Malayan Banking Bhd | | | 152,000 | | | | 364,012 | |
| Total Malaysia | | | | | | | 364,012 | |
| | | | | | | | | |
| MEXICO — 3.7% | | | | | | | | |
| Grupo Aeroportuario Pacifico Class B | | | 22,634 | | | | 394,267 | |
| Grupo Financiero Banorte SAB de CV Sponsored Class O | | | 44,944 | | | | 313,672 | |
| Wal-Mart de Mexico SAB de CV | | | 16,716 | | | | 46,156 | |
| Total Mexico | | | | | | | 754,095 | |
The accompanying notes are an integral part of the financial statements.
| Gallery Trust | Mondrian Emerging Markets Value Equity Fund October 31, 2024 |
| | |
| COMMON STOCK — continued | | | | | | |
| | | Number of
Shares | | | Value
(U.S. $) | |
| PERU — 1.6% | | | | | | | | |
| Credicorp Ltd | | | 1,813 | | | $ | 333,828 | |
| Total Peru | | | | | | | 333,828 | |
| | | | | | | | | |
| PORTUGAL — 1.7% | | | | | | | | |
| Jeronimo Martins SGPS | | | 18,175 | | | | 353,287 | |
| Total Portugal | | | | | | | 353,287 | |
| | | | | | | | | |
| SAUDI ARABIA — 5.0% | | | | | | | | |
| Saudi Arabian Oil Co | | | 52,753 | | | | 378,928 | |
| Saudi National Bank | | | 40,934 | | | | 359,848 | |
| Saudi Telecom Co | | | 25,827 | | | | 289,863 | |
| Total Saudi Arabia | | | | | | | 1,028,639 | |
| | | | | | | | | |
| SOUTH KOREA — 8.6% | | | | | | | | |
| Kia Corp | | | 3,591 | | | | 237,469 | |
| KT Corp | | | 1,223 | | | | 38,996 | |
| KT Corp ADR * | | | 10,429 | | | | 164,048 | |
| LG Chem Ltd | | | 468 | | | | 105,227 | |
| Samsung Electronics Co Ltd | | | 9,066 | | | | 384,951 | |
| Samsung Fire & Marine Insurance Co Ltd | | | 1,135 | | | | 275,170 | |
| Shinhan Financial Group Co Ltd | | | 15,335 | | | | 571,232 | |
| Total South Korea | | | | | | | 1,777,093 | |
| | | | | | | | | |
| TAIWAN — 12.6% | | | | | | | | |
| Hon Hai Precision Industry Co Ltd | | | 26,000 | | | | 166,653 | |
| Lite-On Technology Corp | | | 118,000 | | | | 369,906 | |
| MediaTek Inc | | | 3,000 | | | | 116,785 | |
| Taiwan Semiconductor Manufacturing Co Ltd | | | 62,000 | | | | 1,944,288 | |
| Total Taiwan | | | | | | | 2,597,632 | |
| | | | | | | | | |
| UNITED ARAB EMIRATES — 3.1% | | | | | | | | |
| Adnoc Gas Plc | | | 348,506 | | | | 313,679 | |
The accompanying notes are an integral part of the financial statements.
| Gallery Trust | Mondrian Emerging Markets Value Equity Fund October 31, 2024 |
| | |
| COMMON STOCK — continued | | | | | | |
| | | Number of
Shares | | | Value
(U.S. $) | |
| UNITED ARAB EMIRATES (continued) | | | | | | | | |
| First Abu Dhabi Bank PJSC | | | 88,699 | | | $ | 316,981 | |
| Total United Arab Emirates | | | | | | | 630,660 | |
| | | | | | | | | |
| UNITED KINGDOM — 0.9% | | | | | | | | |
| Mondi PLC | | | 11,385 | | | $ | 184,361 | |
| Total United Kingdom | | | | | | | 184,361 | |
| | | | | | | | | |
| Total Common Stock | | | | | | | | |
| (Cost $17,680,722) | | | | | | | 19,026,242 | |
| | | | | | | | | |
| PREFERRED STOCK — 6.4% | | | | | | | | |
| | | | | | | | | |
| BRAZIL — 1.7% | | | | | | | | |
| Itau Unibanco Holding SA Sponsored ADR^ | | | 13,827 | | | | 83,653 | |
| Itausa SA^ | | | 145,289 | | | | 266,406 | |
| | | | | | | | 350,059 | |
| SOUTH KOREA — 4.7% | | | | | | | | |
| Hyundai Motor^ | | | 1,284 | | | | 148,348 | |
| LG Chem Ltd^ | | | 646 | | | | 97,259 | |
| Samsung Electronics Co Ltd^ | | | 21,088 | | | | 725,433 | |
| | | | | | | | 971,040 | |
| Total Preferred Stock | | | | | | | | |
| (Cost $1,430,064) | | | | | | | 1,321,099 | |
| | | | | | | | | |
| Total Value of Securities — 98.7% | | | | | | | | |
| (Cost $19,110,786) | | | | | | $ | 20,347,341 | |
Percentages are based on Net Assets of $20,623,182.
| * | Non-income producing security. |
| ^ | There is currently no rate available. |
ADR — American Depositary Receipt
Ltd — Limited
The accompanying notes are an integral part of the financial statements.
| Gallery Trust | Mondrian Emerging Markets Value Equity Fund October 31, 2024 |
| | |
PJSC — Public Joint Stock Company
PLC — Public Limited Company
SGPS — Sociedade Gestora de Participações Sociais
The following is a summary of the level of the inputs used as of October 31, 2024, in valuing the Fund’s investments carried at value:
| Investments in Securities | | Level 1 | | | Level 2 | | | Level 3 | | | Total | |
| Common Stock | | $ | 4,617,777 | | | $ | 14,408,465 | | | $ | — | | | $ | 19,026,242 | |
| Preferred Stock | | | 350,059 | | | | 971,040 | | | | — | | | | 1,321,099 | |
| Total Investments in Securities | | $ | 4,967,836 | | | $ | 15,379,505 | | | $ | — | | | $ | 20,347,341 | |
For more information on valuation inputs, see Note 2 in Notes to Financial Statements.
The accompanying notes are an integral part of the financial statements.
| Gallery Trust | Mondrian Global Listed |
| | Infrastructure Fund |
| | October 31, 2024 |
SCHEDULE OF INVESTMENTS
COMMON STOCK — 99.7%
| | | Number of | | | Value | |
| | | Shares | | | (U.S. $) | |
| AUSTRALIA — 3.5% | | | | | | | | |
| Aurizon Holdings Ltd | | | 30,734 | | | $ | 68,145 | |
| Total Australia | | | | | | | 68,145 | |
| | | | | | | | | |
| CANADA — 8.6% | | | | | | | | |
| Enbridge Inc | | | 2,074 | | | | 83,773 | |
| South Bow Class W * | | | 3,279 | | | | 81,884 | |
| Total Canada | | | | | | | 165,657 | |
| | | | | | | | | |
| CHILE — 3.0% | | | | | | | | |
| Enel Americas SA | | | 625,163 | | | | 58,555 | |
| Total Chile | | | | | | | 58,555 | |
| | | | | | | | | |
| CHINA — 6.9% | | | | | | | | |
| Guangdong Investment Ltd | | | 104,000 | | | | 66,204 | |
| Jiangsu Expressway Co Ltd Class H | | | 68,000 | | | | 68,426 | |
| Total China | | | | | | | 134,630 | |
| | | | | | | | | |
| FRANCE — 11.5% | | | | | | | | |
| Eiffage SA | | | 834 | | | | 77,624 | |
| Veolia Environnement SA | | | 2,124 | | | | 67,436 | |
| Vinci SA | | | 686 | | | | 76,846 | |
| Total France | | | | | | | 221,906 | |
| | | | | | | | | |
| ITALY — 11.4% | | | | | | | | |
| Enav SpA | | | 20,221 | | | | 85,671 | |
| Enel SpA | | | 11,002 | | | | 83,440 | |
| Snam SpA | | | 10,742 | | | | 51,603 | |
| Total Italy | | | | | | | 220,714 | |
| | | | | | | | | |
| MALAYSIA — 4.1% | | | | | | | | |
| Westports Holdings | | | 82,400 | | | | 79,220 | |
| Total Malaysia | | | | | | | 79,220 | |
The accompanying notes are an integral part of the financial statements.
| Gallery Trust | Mondrian Global Listed |
| | Infrastructure Fund |
| | October 31, 2024 |
| COMMON STOCK — continued | | | | | | |
| | | Number of | | | Value | |
| | | Shares | | | (U.S. $) | |
| MEXICO — 2.8% | | | | | | | | |
| Promotora y Operadora de Infraestructura | | | 6,119 | | | $ | 53,314 | |
| Total Mexico | | | | | | | 53,314 | |
| | | | | | | | | |
| PORTUGAL — 3.8% | | | | | | | | |
| EDP Energias de Portugal SA | | | 18,568 | | | | 73,100 | |
| Total Portugal | | | | | | | 73,100 | |
| | | | | | | | | |
| SPAIN — 11.8% | | | | | | | | |
| Cellnex Telecom | | | 2,220 | | | | 81,531 | |
| Iberdrola SA | | | 5,236 | | | | 77,778 | |
| Redeia Corp SA | | | 3,763 | | | | 69,675 | |
| Total Spain | | | | | | | 228,984 | |
| | | | | | | | | |
| UNITED KINGDOM — 3.7% | | | | | | | | |
| SSE PLC | | | 3,194 | | | | 72,579 | |
| Total United Kingdom | | | | | | | 72,579 | |
| | | | | | | | | |
| UNITED STATES — 28.6% | | | | | | | | |
| American Tower REIT | | | 361 | | | | 77,088 | |
| CSX Corp | | | 2,312 | | | | 77,776 | |
| Edison International | | | 1,095 | | | | 90,228 | |
| Eversource Energy | | | 1,238 | | | | 81,522 | |
| HCA Healthcare Inc | | | 197 | | | | 70,672 | |
| Norfolk Southern Corp | | | 283 | | | | 70,872 | |
| Prologis Inc | | | 760 | | | | 85,834 | |
| Total United States | | | | | | | 553,992 | |
| | | | | | | | | |
| Total Common Stock | | | | | | | | |
| (Cost $1,860,116) | | | | | | | 1,930,796 | |
| | | | | | | | | |
| Total Value of Securities — 99.7% | | | | | | | | |
| (Cost $1,860,116) | | | | | | $ | 1,930,796 | |
Percentages are based on Net Assets of $1,936,395.
| * | Non-income producing security. |
The accompanying notes are an integral part of the financial statements.
| Gallery Trust | Mondrian Global Listed |
| | Infrastructure Fund |
| | October 31, 2024 |
Ltd — Limited
PLC — Public Limited Company
REIT — Real Estate Investment Trust
The following is a summary of the level of the inputs used as of October 31, 2024, in valuing the Fund’s investments carried at value:
| Investments in Securities | | Level 1 | | | Level 2 | | | Level 3 | | | Total | |
| Common Stock | | $ | 910,738 | | | $ | 1,020,058 | | | $ | — | | | $ | 1,930,796 | |
| Total Investments in Securities | | $ | 910,738 | | | $ | 1,020,058 | | | $ | — | | | $ | 1,930,796 | |
For more information on valuation inputs, see Note 2 in Notes to Financial Statements.
The accompanying notes are an integral part of the financial statements.
| Gallery Trust | Mondrian Global Equity |
| | Value Fund |
| | October 31, 2024 |
SCHEDULE OF INVESTMENTS
COMMON STOCK — 97.0%
| | | Number of | | | Value | |
| | | Shares | | | (U.S. $) | |
| AUSTRALIA — 1.2% | | | | | | | | |
| Aurizon Holdings Ltd | | | 1,206,220 | | | $ | 2,674,505 | |
| Total Australia | | | | | | | 2,674,505 | |
| | | | | | | | | |
| BRAZIL — 0.9% | | | | | | | | |
| Hypera SA | | | 528,900 | | | | 2,029,269 | |
| Total Brazil | | | | | | | 2,029,269 | |
| | | | | | | | | |
| CHINA — 4.2% | | | | | | | | |
| Alibaba Group Holding Ltd | | | 357,700 | | | | 4,375,499 | |
| Midea Group Co Ltd Class A | | | 228,055 | | | | 2,286,104 | |
| Ping An Insurance Group Co of China Ltd Class H | | | 225,000 | | | | 1,394,052 | |
| Yum China Holdings Inc | | | 39,265 | | | | 1,731,979 | |
| Total China | | | | | | | 9,787,634 | |
| | | | | | | | | |
| FRANCE — 7.7% | | | | | | | | |
| Kering SA | | | 16,549 | | | | 4,133,450 | |
| Pernod Ricard SA | | | 24,056 | | | | 3,001,431 | |
| Sanofi SA | | | 51,604 | | | | 5,453,495 | |
| Vinci SA | | | 46,109 | | | | 5,165,157 | |
| Total France | | | | | | | 17,753,533 | |
| | | | | | | | | |
| GERMANY — 2.3% | | | | | | | | |
| Deutsche Post | | | 134,707 | | | | 5,411,111 | |
| Total Germany | | | | | | | 5,411,111 | |
| | | | | | | | | |
| INDIA — 1.4% | | | | | | | | |
| HDFC Bank Ltd | | | 163,766 | | | | 3,366,163 | |
| Total India | | | | | | | 3,366,163 | |
| | | | | | | | | |
| INDONESIA — 1.3% | | | | | | | | |
| Bank Rakyat Indonesia Persero Tbk PT | | | 9,656,300 | | | | 2,943,763 | |
| Total Indonesia | | | | | | | 2,943,763 | |
| | | | | | | | | |
| ITALY — 4.8% | | | | | | | | |
| Enel SpA | | | 908,368 | | | | 6,889,124 | |
The accompanying notes are an integral part of the financial statements.
| Gallery Trust | Mondrian Global Equity |
| | Value Fund |
| | October 31, 2024 |
COMMON STOCK — continued
| | | Number of | | | Value | |
| | | Shares | | | (U.S. $) | |
| ITALY (continued) | | | | | | | | |
| Snam SpA | | | 889,208 | | | $ | 4,271,669 | |
| Total Italy | | | | | | | 11,160,793 | |
| | | | | | | | | |
| JAPAN — 12.5% | | | | | | | | |
| Fujitsu Ltd | | | 290,300 | | | | 5,581,262 | |
| Hitachi Ltd | | | 94,600 | | | | 2,376,812 | |
| MatsukiyoCocokara & Co | | | 299,200 | | | | 4,073,514 | |
| SCSK Corp | | | 161,400 | | | | 3,011,674 | |
| Sony Corp Group | | | 355,600 | | | | 6,257,677 | |
| Sundrug Co Ltd | | | 171,000 | | | | 4,229,489 | |
| Toyota Industries Corp | | | 49,800 | | | | 3,452,238 | |
| Total Japan | | | | | | | 28,982,666 | |
| | | | | | | | | |
| NETHERLANDS — 2.0% | | | | | | | | |
| Koninklijke Philips NV * | | | 174,192 | | | | 4,582,780 | |
| Total Netherlands | | | | | | | 4,582,780 | |
| | | | | | | | | |
| SOUTH KOREA — 0.4% | | | | | | | | |
| Samsung Electronics Co Ltd | | | 20,767 | | | | 881,788 | |
| Total South Korea | | | | | | | 881,788 | |
| | | | | | | | | |
| SWEDEN — 2.3% | | | | | | | | |
| Autoliv | | | 57,725 | | | | 5,361,498 | |
| Total Sweden | | | | | | | 5,361,498 | |
| | | | | | | | | |
| SWITZERLAND — 2.3% | | | | | | | | |
| Roche Holding | | | 16,870 | | | | 5,228,072 | |
| Total Switzerland | | | | | | | 5,228,072 | |
| | | | | | | | | |
| TAIWAN — 1.0% | | | | | | | | |
| Taiwan Semiconductor Manufacturing Co Ltd | | | 74,000 | | | | 2,320,602 | |
| Total Taiwan | | | | | | | 2,320,602 | |
| | | | | | | | | |
| UNITED KINGDOM — 6.6% | | | | | | | | |
| Associated British Foods PLC | | | 145,826 | | | | 4,191,314 | |
| British American Tobacco PLC | | | 173,266 | | | | 6,058,992 | |
The accompanying notes are an integral part of the financial statements.
| Gallery Trust | Mondrian Global Equity |
| | Value Fund |
| | October 31, 2024 |
COMMON STOCK — continued
| | | Number of | | | Value | |
| | | Shares | | | (U.S. $) | |
| UNITED KINGDOM (continued) | | | | | | | | |
| Lloyds Banking Group PLC | | | 7,373,212 | | | $ | 5,061,002 | |
| Total United Kingdom | | | | | | | 15,311,308 | |
| | | | | | | | | |
| UNITED STATES — 46.1% | | | | | | | | |
| AbbVie Inc | | | 8,994 | | | | 1,833,607 | |
| Amazon.com Inc * | | | 21,068 | | | | 3,927,075 | |
| American Tower REIT | | | 4,859 | | | | 1,037,591 | |
| CDW Corp | | | 23,067 | | | | 4,341,902 | |
| Centene Corp * | | | 34,714 | | | | 2,161,294 | |
| Charles Schwab Corp | | | 84,306 | | | | 5,971,394 | |
| CNH Industrial | | | 316,153 | | | | 3,550,398 | |
| Dollar Tree Inc * | | | 43,939 | | | | 2,840,217 | |
| DuPont de Nemours | | | 71,463 | | | | 5,930,714 | |
| Exxon Mobil Corp | | | 29,932 | | | | 3,495,459 | |
| HCA Healthcare Inc | | | 15,291 | | | | 5,485,493 | |
| Kenvue Inc | | | 278,184 | | | | 6,378,759 | |
| L3Harris Technologies Inc | | | 26,604 | | | | 6,583,692 | |
| Labcorp Holdings | | | 23,293 | | | | 5,317,093 | |
| McDonald's | | | 17,239 | | | | 5,035,684 | |
| Meta Platforms Inc Class A | | | 10,604 | | | | 6,018,618 | |
| Micron Technology Inc | | | 10,812 | | | | 1,077,416 | |
| Microsoft Corp | | | 12,435 | | | | 5,052,962 | |
| NNN REIT Class REIT | | | 70,420 | | | | 3,059,045 | |
| Prologis Inc | | | 28,950 | | | | 3,269,613 | |
| Sysco | | | 72,584 | | | | 5,440,171 | |
| Texas Instruments Inc | | | 28,812 | | | | 5,853,446 | |
| UnitedHealth Group Inc | | | 11,589 | | | | 6,541,991 | |
| Wells Fargo & Co | | | 98,861 | | | | 6,418,056 | |
| Total United States | | | | | | | 106,621,690 | |
| | | | | | | | | |
| Total Common Stock | | | | | | | | |
| (Cost $198,090,593) | | | | | | | 224,417,175 | |
The accompanying notes are an integral part of the financial statements.
| Gallery Trust | Mondrian Global Equity |
| | Value Fund |
| | October 31, 2024 |
PREFERRED STOCK — 1.9%
| | | Number of | | | Value | |
| | | Shares | | | (U.S. $) | |
| SOUTH KOREA — 1.9% | | | | | | | | |
| Samsung Electronics Co Ltd^ | | | 128,007 | | | | 4,403,477 | |
| | | | | | | | | |
| Total Preferred Stock | | | | | | | | |
| (Cost $5,834,128) | | | | | | | 4,403,477 | |
| | | | | | | | | |
| Total Value of Securities — 98.9% | | | | | | | | |
| (Cost $203,924,721) | | | | | | $ | 228,820,652 | |
Percentages are based on Net Assets of $231,258,212.
| * | Non-income producing security. |
| ^ | There is currently no rate available. |
Ltd — Limited
PLC — Public Limited Company
REIT — Real Estate Investment Trust
The following is a summary of the level of the inputs used as of October 31, 2024, in valuing the Fund’s investments carried at value:
| Investments in Securities | | Level 1 | | | Level 2 | | | Level 3 | | | Total | |
| Common Stock | | $ | 115,744,436 | | | $ | 108,672,739 | | | $ | — | | | $ | 224,417,175 | |
| Preferred Stock | | | — | | | | 4,403,477 | | | | — | | | | 4,403,477 | |
| Total Investments in Securities | | $ | 115,744,436 | | | $ | 113,076,216 | | | $ | — | | | $ | 228,820,652 | |
For more information on valuation inputs, see Note 2 in Notes to Financial Statements.
The accompanying notes are an integral part of the financial statements.
| Gallery Trust | October 31, 2024 |
STATEMENTS OF ASSETS AND LIABILITIES
| | | Mondrian | | | Mondrian | |
| | | International | | | Emerging | |
| | | Value Equity | | | Markets Value | |
| | | Fund | | | Equity Fund | |
| Assets: | | | | | | | | |
| Investments (Cost $813,187,374 and $19,110,786) | | $ | 873,357,487 | | | $ | 20,347,341 | |
| Foreign currency (Cost $61 and $771) | | | 61 | | | | 763 | |
| Cash | | | 2,661,537 | | | | 313,194 | |
| Receivable for investment securities sold | | | 7,925,588 | | | | 32,028 | |
| Reclaims receivable | | | 3,420,541 | | | | 2,081 | |
| Dividends receivable | | | 3,222,543 | | | | 63,454 | |
| Receivable for capital shares sold | | | 839,623 | | | | 2,540 | |
| Unrealized appreciation on spot foreign currency contracts | | | 21,309 | | | | — | |
| Receivable from Investment Adviser | | | — | | | | 2,556 | |
| Prepaid expenses | | | 43,558 | | | | 13,350 | |
| Total assets | | | 891,492,247 | | | | 20,777,307 | |
| | | | | | | | | |
| Liabilities: | | | | | | | | |
| Payable for investment securities purchased | | | 7,467,228 | | | | 46,069 | |
| Payable due to Investment Adviser | | | 447,913 | | | | — | |
| Payable due to Administrator | | | 69,734 | | | | 1,647 | |
| Payable for capital shares redeemed | | | 48,719 | | | | — | |
| Audit fees payable | | | 26,389 | | | | 26,389 | |
| Chief Compliance Officer fees payable | | | 9,203 | | | | 220 | |
| Transfer Agent Fees Payable | | | 8,258 | | | | 5,564 | |
| Payable due to Trustees | | | 645 | | | | 15 | |
| Accrued foreign capital gains tax | | | — | | | | 61,961 | |
| Other accrued expenses | | | 90,154 | | | | 12,260 | |
| Total liabilities | | | 8,168,243 | | | | 154,125 | |
| | | | | | | | | |
| Commitments and Contingencies† | | | | | | | | |
| Net assets | | $ | 883,324,004 | | | $ | 20,623,182 | |
| | | | | | | | | |
| Net assets consist of: | | | | | | | | |
| Paid-in capital | | $ | 786,022,968 | | | $ | 126,602,792 | |
| Total distributable earnings/(accumulated loss) | | | 97,301,036 | | | | (105,979,610 | ) |
| Net assets | | $ | 883,324,004 | | | $ | 20,623,182 | |
| | | | | | | | | |
| Outstanding Shares of Beneficial Interest | | | | | | | | |
| (unlimited authorization - no par value) | | | 55,944,902 | | | | 2,594,365 | |
| Net Asset Value, Offering and Redemption Price Per Share | | $ | 15.79 | | | $ | 7.95 | |
| † | See Note 5 in the Notes to Financial Statements. |
The accompanying notes are an integral part of the financial statements.
| Gallery Trust | October 31, 2024 |
STATEMENTS OF ASSETS AND LIABILITIES
| | | Mondrian | | | | |
| | | Global Listed | | | Mondrian | |
| | | Infrastructure | | | Global Equity | |
| | | Fund | | | Value Fund | |
| Assets: | | | | | | | | |
| Investments (Cost $1,860,116 and $203,924,721) | | $ | 1,930,796 | | | $ | 228,820,652 | |
| Foreign currency (Cost $6,320 and $12,544) | | | 6,268 | | | | 12,440 | |
| Cash | | | 15,591 | | | | 1,880,180 | |
| Receivable from Investment Adviser | | | 9,579 | | | | — | |
| Receivable for investment securities sold | | | 9,568 | | | | 562,649 | |
| Reclaims receivable | | | 8,259 | | | | 235,964 | |
| Receivable for capital shares sold | | | — | | | | 27,200 | |
| Dividends receivable | | | — | | | | 561,108 | |
| Prepaid expenses | | | 3,276 | | | | 15,519 | |
| Total assets | | | 1,983,337 | | | | 232,115,712 | |
| | | | | | | | | |
| Liabilities: | | | | | | | | |
| Audit fees payable | | | 27,707 | | | | 26,389 | |
| Payable for investment securities purchased | | | 10,399 | | | | 569,325 | |
| Transfer Agent Fees Payable | | | 5,412 | | | | 5,958 | |
| Payable due to Administrator | | | 151 | | | | 18,017 | |
| Chief Compliance Officer fees payable | | | 20 | | | | 2,377 | |
| Unrealized depreciation on spot foreign currency contracts | | | 4 | | | | 2,744 | |
| Payable due to Trustees | | | 1 | | | | 167 | |
| Payable for capital shares redeemed | | | — | | | | 3 | |
| Payable due to Investment Adviser | | | — | | | | 102,027 | |
| Accrued foreign capital gains tax | | | — | | | | 104,286 | |
| Other accrued expenses | | | 3,248 | | | | 26,207 | |
| Total liabilities | | | 46,942 | | | | 857,500 | |
| | | | | | | | | |
| Commitments and Contingencies† | | | | | | | | |
| Net assets | | $ | 1,936,395 | | | $ | 231,258,212 | |
| | | | | | | | | |
| Net assets consist of: | | | | | | | | |
| Paid-in capital | | $ | 1,795,981 | | | $ | 201,268,458 | |
| Total distributable earnings | | | 140,414 | | | | 29,989,754 | |
| Net assets | | $ | 1,936,395 | | | $ | 231,258,212 | |
| | | | | | | | | |
| Outstanding Shares of Beneficial Interest | | | | | | | | |
| (unlimited authorization - no par value) | | | 174,275 | | | | 15,699,450 | |
| Net Asset Value, Offering and Redemption Price Per Share | | $ | 11.11 | | | $ | 14.73 | |
| † | See Note 5 in the Notes to Financial Statements. |
The accompanying notes are an integral part of the financial statements.
| Gallery Trust | For the Year Ended
October 31, 2024 |
STATEMENTS OF OPERATIONS
| | | Mondrian | |
| | | International | |
| | | Value Equity | |
| | | Fund | |
| Investment income | | | | |
| Dividends | | $ | 35,239,463 | |
| Less: foreign taxes withheld | | | (2,706,540 | ) |
| Total investment income | | | 32,532,923 | |
| | | | | |
| Expenses | | | | |
| Investment advisory fees | | | 5,580,213 | |
| Accounting and administration fees – Note 4 | | | 793,453 | |
| Custodian fees | | | 91,103 | |
| Registration fees | | | 86,821 | |
| Dividend disbursing and transfer agent fees and expenses | | | 50,165 | |
| Trustees' fees and expenses | | | 47,922 | |
| Printing fees | | | 46,820 | |
| Legal fees | | | 43,670 | |
| Audit fees | | | 28,502 | |
| Chief Compliance Officer fees | | | 15,057 | |
| Other | | | 65,223 | |
| Total expenses | | | 6,848,949 | |
| | | | | |
| Less: | | | | |
| Investment advisory fees waived – Note 5 | | | (496,091 | ) |
| Net expenses | | | 6,352,858 | |
| | | | | |
| Net investment income | | | 26,180,065 | |
| | | | | |
| Net realized gain/(loss) on: | | | | |
| Investments | | | 40,338,193 | |
| Foreign currency transactions | | | 309,041 | |
| Net realized gain | | | 40,647,234 | |
| | | | | |
| Net change in unrealized appreciation/(depreciation) on: | | | | |
| Investments | | | 98,555,786 | |
| Foreign currency transactions and translation of other assets and liabilities denominated in foreign currency | | | 970 | |
| Net change in unrealized appreciation/(depreciation) | | | 98,556,756 | |
| Net realized and unrealized gain | | | 139,203,990 | |
| | | | | |
| Net increase in net assets resulting from operations | | $ | 165,384,055 | |
The accompanying notes are an integral part of the financial statements.
| Gallery Trust | For the Year Ended October 31, 2024 |
STATEMENTS OF OPERATIONS
| | | Mondrian Emerging Markets Value Equity Fund | |
| Investment income | | | | |
| Dividends | | $ | 868,433 | |
| Less: foreign taxes withheld | | | (72,710 | ) |
| Total investment income | | | 795,723 | |
| | | | | |
| Expenses | | | | |
| Investment advisory fees | | | 152,195 | |
| Dividend disbursing and transfer agent fees and expenses | | | 33,972 | |
| Audit fees | | | 28,517 | |
| Custodian fees | | | 25,960 | |
| Accounting and administration fees – Note 4 | | | 18,776 | |
| Registration fees | | | 18,520 | |
| Printing fees | | | 4,380 | |
| Legal fees | | | 1,552 | |
| Trustees' fees and expenses | | | 1,180 | |
| Chief Compliance Officer fees | | | 879 | |
| Other | | | 20,006 | |
| Total expenses | | | 305,937 | |
| | | | | |
| Less: | | | | |
| Investment advisory fees waived – Note 5 | | | (119,279 | ) |
| Net expenses | | | 186,658 | |
| | | | | |
| Net investment income | | | 609,065 | |
| | | | | |
| Net realized gain/(loss) on: | | | | |
| Investments | | | 894,046 | |
| Foreign currency transactions | | | (16,174 | ) |
| Foreign Capital Gains Tax on Appreciated Securities | | | 7 | |
| Net realized gain | | | 877,879 | |
| | | | | |
| Net change in unrealized appreciation/(depreciation) on: | | | | |
| Investments | | | 2,381,800 | |
| Accrued foreign capital gains tax on appreciated securities | | | (2,583 | ) |
| Foreign currency transactions and translation of other assets and liabilities denominated in foreign currency | | | (1,895 | ) |
| Net change in unrealized appreciation/(depreciation) | | | 2,377,322 | |
| Net realized and unrealized gain | | | 3,255,201 | |
| | | | | |
| Net increase in net assets resulting from operations | | $ | 3,864,266 | |
The accompanying notes are an integral part of the financial statements.
| Gallery Trust | For the Year Ended October 31, 2024 |
STATEMENTS OF OPERATIONS
| | | Mondrian Global Listed Infrastructure Fund | |
| Investment income | | | |
| Dividends | | $ | 79,331 | |
| Less: foreign taxes withheld | | | (7,294 | ) |
| Total investment income | | | 72,037 | |
| | | | | |
| Expenses | | | | |
| Dividend disbursing and transfer agent fees and expenses | | | 33,043 | |
| Audit fees | | | 30,728 | |
| Investment advisory fees | | | 15,602 | |
| Registration fees | | | 6,997 | |
| Printing fees | | | 4,051 | |
| Custodian fees | | | 2,746 | |
| Accounting and administration fees – Note 4 | | | 1,698 | |
| Legal fees | | | 636 | |
| Chief Compliance Officer fees | | | 560 | |
| Trustees' fees and expenses | | | 103 | |
| Other | | | 9,573 | |
| Total expenses | | | 105,737 | |
| | | | | |
| Less: | | | | |
| Investment advisory fees waived – Note 5 | | | (15,602 | ) |
| Reimbursement from Investment Adviser | | | (72,697 | ) |
| Net expenses | | | 17,438 | |
| | | | | |
| Net investment income | | | 54,599 | |
| | | | | |
| Net realized gain/(loss) on: | | | | |
| Investments | | | 21,602 | |
| Foreign currency transactions | | | (20 | ) |
| Net realized gain | | | 21,582 | |
| | | | | |
| Net change in unrealized appreciation/(depreciation) on: | | | | |
| Investments | | | 297,242 | |
| Foreign currency transactions and translation of other assets and liabilities denominated in foreign currency | | | 166 | |
| Net change in unrealized appreciation/(depreciation) | | | 297,408 | |
| Net realized and unrealized gain | | | 318,990 | |
| | | | | |
| Net increase in net assets resulting from operations | | $ | 373,589 | |
The accompanying notes are an integral part of the financial statements.
| Gallery Trust | For the Year Ended October 31, 2024 |
STATEMENTS OF OPERATIONS
| | | Mondrian Global Equity Value Fund | |
| Investment income | | | | |
| Dividends | | $ | 5,132,470 | |
| Less: foreign taxes withheld | | | (316,917 | ) |
| Total investment income | | | 4,815,553 | |
| | | | | |
| Expenses | | | | |
| Investment advisory fees | | | 1,270,075 | |
| Accounting and administration fees – Note 4 | | | 180,343 | |
| Dividend disbursing and transfer agent fees and expenses | | | 36,266 | |
| Audit fees | | | 28,474 | |
| Custodian fees | | | 25,679 | |
| Registration fees | | | 23,848 | |
| Printing fees | | | 11,572 | |
| Legal fees | | | 10,687 | |
| Trustees' fees and expenses | | | 10,328 | |
| Chief Compliance Officer fees | | | 4,089 | |
| Other | | | 28,821 | |
| Total expenses | | | 1,630,182 | |
| | | | | |
| Less: | | | | |
| Investment advisory fees waived – Note 5 | | | (184,250 | ) |
| Net expenses | | | 1,445,932 | |
| | | | | |
| Net investment income | | | 3,369,621 | |
| | | | | |
| Net realized gain/(loss) on: | | | | |
| Investments | | | 12,280,896 | |
| Foreign currency transactions | | | (12,980 | ) |
| Foreign Capital Gains Tax on Appreciated Securities | | | (2,999 | ) |
| Net realized gain | | | 12,264,917 | |
| | | | | |
| Net change in unrealized appreciation/(depreciation) on: | | | | |
| Investments | | | 22,571,186 | |
| Accrued foreign capital gains tax on appreciated securities | | | (85,980 | ) |
| Foreign currency transactions and translation of other assets and liabilities denominated in foreign currency | | | (26,701 | ) |
| Net change in unrealized appreciation/(depreciation) | | | 22,458,505 | |
| Net realized and unrealized gain | | | 34,723,422 | |
| | | | | |
| Net increase in net assets resulting from operations | | $ | 38,093,043 | |
The accompanying notes are an integral part of the financial statements.
| Gallery Trust | Mondrian International Value Equity Fund |
STATEMENTS OF CHANGES IN NET ASSETS
| | | Year Ended | | | Year Ended | |
| | | October 31, 2024 | | | October 31, 2023 | |
| Operations: | | | | | | |
| Net investment income | | $ | 26,180,065 | | | $ | 21,884,063 | |
| Net realized gain/(loss) | | | 40,647,234 | | | | (2,038,413 | ) |
| Net change in unrealized appreciation/(depreciation) | | | 98,556,756 | | | | 89,870,825 | |
| Net increase in net assets resulting from operations | | | 165,384,055 | | | | 109,716,475 | |
| Distributions | | | (29,037,803 | ) | | | (18,718,600 | ) |
| | | | | | | | | |
| Capital share transactions: (1) | | | | | | | | |
| Issued | | | 184,192,515 | | | | 149,803,720 | |
| Reinvestment of dividends | | | 22,864,636 | | | | 15,618,601 | |
| Redeemed | | | (196,017,913 | ) | | | (120,538,587 | ) |
| Net increase in net assets from capital share transactions | | | 11,039,238 | | | | 44,883,734 | |
| Total increase in net assets | | | 147,385,490 | | | | 135,881,609 | |
| | | | | | | | | |
| Net assets: | | | | | | | | |
| Beginning of year | | | 735,938,514 | | | | 600,056,905 | |
| End of year | | $ | 883,324,004 | | | $ | 735,938,514 | |
| (1) | See Note 8- Share transactions in the Notes to Financial Statements. |
The accompanying notes are an integral part of the financial statements.
| Gallery Trust | Mondrian Emerging Markets Value Equity Fund |
STATEMENTS OF CHANGES IN NET ASSETS
| | | Year Ended | | | Year Ended | |
| | | October 31, 2024 | | | October 31, 2023 | |
| Operations: | | | | | | |
| Net investment income | | $ | 609,065 | | | $ | 605,718 | |
| Net realized gain/(loss) | | | 877,879 | | | | (1,346,469 | ) |
| Net change in unrealized appreciation/(depreciation) | | | 2,377,322 | | | | 3,992,759 | |
| Net increase in net assets resulting from operations | | | 3,864,266 | | | | 3,252,008 | |
| Distributions | | | (610,646 | ) | | | (532,861 | ) |
| | | | | | | | | |
| Capital share transactions: (1) | | | | | | | | |
| Issued | | | 1,200,590 | | | | 3,169,803 | |
| Reinvestment of dividends | | | 609,811 | | | | 532,193 | |
| Redeemed | | | (3,477,393 | ) | | | (6,126,718 | ) |
| Net decrease in net assets from capital share transactions | | | (1,666,992 | ) | | | (2,424,722 | ) |
| Total increase in net assets | | | 1,586,628 | | | | 294,425 | |
| | | | | | | | | |
| Net assets: | | | | | | | | |
| Beginning of year | | | 19,036,554 | | | | 18,742,129 | |
| End of year | | $ | 20,623,182 | | | $ | 19,036,554 | |
| (1) | See Note 8- Share transactions in the Notes to Financial Statements. |
The accompanying notes are an integral part of the financial statements.
| Gallery Trust | Mondrian Global Listed Infrastructure Fund |
STATEMENTS OF CHANGES IN NET ASSETS
| | | Year Ended | | | Year Ended | |
| | | October 31, 2024 | | | October 31, 2023 | |
| Operations: | | | | | | |
| Net investment income | | $ | 54,599 | | | $ | 55,031 | |
| Net realized gain | | | 21,582 | | | | 38,835 | |
| Net change in unrealized appreciation/(depreciation) | | | 297,408 | | | | (44,821 | ) |
| Net increase in net assets resulting from operations | | | 373,589 | | | | 49,045 | |
| Distributions | | | (94,957 | ) | | | (136,827 | ) |
| | | | | | | | | |
| Capital share transactions: (1) | | | | | | | | |
| Reinvestment of dividends | | | 94,957 | | | | 136,827 | |
| Net increase in net assets from capital share transactions | | | 94,957 | | | | 136,827 | |
| Total increase in net assets | | | 373,589 | | | | 49,045 | |
| | | | | | | | | |
| Net assets: | | | | | | | | |
| Beginning of year | | | 1,562,806 | | | | 1,513,761 | |
| End of year | | $ | 1,936,395 | | | $ | 1,562,806 | |
| (1) | See Note 8- Share transactions in the Notes to Financial Statements. |
The accompanying notes are an integral part of the financial statements.
| Gallery Trust | Mondrian Global Equity Value Fund |
STATEMENTS OF CHANGES IN NET ASSETS
| | | Year Ended | | | Year Ended | |
| | | October 31, 2024 | | | October 31, 2023 | |
| Operations: | | | | | | |
| Net investment income | | $ | 3,369,621 | | | $ | 2,165,570 | |
| Net realized gain/(loss) | | | 12,264,917 | | | | (5,068,842 | ) |
| Net change in unrealized appreciation/(depreciation) | | | 22,458,505 | | | | 22,919,346 | |
| Net increase in net assets resulting from operations | | | 38,093,043 | | | | 20,016,074 | |
| Distributions | | | (3,041,860 | ) | | | (3,249,942 | ) |
| | | | | | | | | |
| Capital share transactions: (1) | | | | | | | | |
| Issued | | | 75,947,655 | | | | 38,796,402 | |
| Reinvestment of dividends | | | 2,940,418 | | | | 3,042,564 | |
| Redeemed | | | (29,705,570 | ) | | | (33,893,928 | ) |
| Net increase in net assets from capital share transactions | | | 49,182,503 | | | | 7,945,038 | |
| Total increase in net assets | | | 84,233,686 | | | | 24,711,170 | |
| | | | | | | | | |
| Net assets: | | | | | | | | |
| Beginning of year | | | 147,024,526 | | | | 122,313,356 | |
| End of year | | $ | 231,258,212 | | | $ | 147,024,526 | |
| (1) | See Note 8- Share transactions in the Notes to Financial Statements. |
The accompanying notes are an integral part of the financial statements.
| Gallery Trust | Mondrian International Value
Equity Fund |
FINANCIAL HIGHLIGHTS
Selected per share data & ratios
for a share outstanding throughout the year
| | | Year
Ended
10/31/24 | | | Year
Ended
10/31/23 | | | Year
Ended
10/31/22 | | | Year
Ended
10/31/21 | | | Year Ended 10/31/20 | |
| Net asset value, beginning of year | | $ | 13.41 | | | $ | 11.62 | | | $ | 15.19 | | | $ | 11.37 | | | $ | 14.69 | |
| | | | | | | | | | | | | | | | | | | | | |
| Income/(loss) from operations:(1) | | | | | | | | | | | | | | | | | | | | |
| Net investment income | | | 0.46 | | | | 0.41 | | | | 0.39 | | | | 0.43 | | | | 0.28 | |
| Net realized and unrealized gain/(loss) | | | 2.46 | | | | 1.75 | | | | (3.48 | ) | | | 3.71 | | | | (2.72 | ) |
| Total from operations | | | 2.92 | | | | 2.16 | | | | (3.09 | ) | | | 4.14 | | | | (2.44 | ) |
| Dividends and distributions from: | | | | | | | | | | | | | | | | | | | | |
| Net investment income | | | (0.47 | ) | | | (0.29 | ) | | | (0.48 | ) | | | (0.32 | ) | | | (0.51 | ) |
| Net realized gains | | | (0.07 | ) | | | (0.08 | ) | | | — | | | | — | | | | (0.37 | ) |
| Total dividends and distributions | | | (0.54 | ) | | | (0.37 | ) | | | (0.48 | ) | | | (0.32 | ) | | | (0.88 | ) |
| Net asset value, end of year | | $ | 15.79 | | | $ | 13.41 | | | $ | 11.62 | | | $ | 15.19 | | | $ | 11.37 | |
| Total return* | | | 22.11 | % | | | 18.82 | % | | | (20.98 | )% | | | 36.72 | %(2) | | | (17.88 | )% |
| | | | | | | | | | | | | | | | | | | | | |
| Ratios and supplemental data | | | | | | | | | | | | | | | | | | | | |
| Net assets, end of year ($ Thousands) | | $ | 883,324 | | | $ | 735,939 | | | $ | 600,057 | | | $ | 710,402 | | | $ | 463,697 | |
| Ratio of expenses to average net assets (including waivers and reimbursements) | | | 0.74 | % | | | 0.74 | % | | | 0.74 | % | | | 0.73 | % | | | 0.79 | % |
| Ratio of expenses to average net assets (excluding waivers and reimbursements) | | | 0.80 | % | | | 0.81 | % | | | 0.83 | % | | | 0.85 | % | | | 0.94 | % |
| Ratio of net investment income to average net assets | | | 3.05 | % | | | 3.03 | % | | | 2.85 | % | | | 2.97 | % | | | 2.26 | % |
| Portfolio turnover rate | | | 34 | % | | | 19 | % | | | 23 | % | | | 19 | % | | | 24 | % |
| * | Returns shown do not reflect the deductions of taxes that a shareholder would pay on Fund distributions or the redemption of Fund shares. Total return may have been lower had the Adviser not waived its fee and/or reimbursed other expenses. |
| (1) | Per share data calculated using average shares method. |
| (2) | If not for the one-time Fortis Group litigation payment, the Total return would have been 36.42%. |
Amounts designated as “—” are $0 or have been rounded to $0.
The accompanying notes are an integral part of the financial statements.
| Gallery Trust | Mondrian Emerging Markets Value
Equity Fund |
FINANCIAL HIGHLIGHTS
Selected per share data & ratios
for a share outstanding throughout the year
| | | Year
Ended
10/31/24 | | | Year
Ended
10/31/23 | | | Year
Ended
10/31/22 | | | Year
Ended
10/31/21 | | | Year Ended 10/31/20 | |
| Net asset value, beginning of year | | $ | 6.76 | | | $ | 5.93 | | | $ | 8.43 | | | $ | 7.62 | | | $ | 7.40 | |
| | | | | | | | | | | | | | | | | | | | | |
| Income/(loss) from operations:(1) | | | | | | | | | | | | | | | | | | | | |
| Net investment income | | | 0.23 | | | | 0.20 | | | | 0.14 | | | | 0.14 | | | | 0.12 | |
| Net realized and unrealized gain/(loss) | | | 1.18 | | | | 0.81 | | | | (2.54 | ) | | | 0.95 | | | | 0.30 | |
| Total from operations | | | 1.41 | | | | 1.01 | | | | (2.40 | ) | | | 1.09 | | | | 0.42 | |
| Dividends and distributions from: | | | | | | | | | | | | | | | | | | | | |
| Net investment income | | | (0.22 | ) | | | (0.18 | ) | | | (0.10 | ) | | | (0.28 | ) | | | (0.20 | ) |
| Total dividends and distributions | | | (0.22 | ) | | | (0.18 | ) | | | (0.10 | ) | | | (0.28 | ) | | | (0.20 | ) |
| Net asset value, end of year | | $ | 7.95 | | | $ | 6.76 | | | $ | 5.93 | | | $ | 8.43 | | | $ | 7.62 | |
| Total return* | | | 21.16 | % | | | 17.01 | % | | | (28.80 | )% | | | 14.27 | % | | | 5.67 | % |
| | | | | | | | | | | | | | | | | | | | | |
| Ratios and supplemental data | | | | | | | | | | | | | | | | | | | | |
| Net assets, end of year ($ Thousands) | | $ | 20,623 | | | $ | 19,037 | | | $ | 18,742 | | | $ | 25,180 | | | $ | 13,068 | |
| Ratio of expenses to average net assets (including waivers and reimbursements) | | | 0.92 | % | | | 0.92 | % | | | 0.92 | % | | | 0.92 | % | | | 0.92 | % |
| Ratio of expenses to average net assets (excluding waivers and reimbursements) | | | 1.51 | % | | | 1.32 | % | | | 1.35 | % | | | 1.39 | % | | | 1.41 | % |
| Ratio of net investment income to average net assets | | | 3.00 | % | | | 2.90 | % | | | 1.96 | % | | | 1.57 | % | | | 1.67 | % |
| Portfolio turnover rate | | | 40 | % | | | 32 | % | | | 39 | % | | | 49 | % | | | 48 | % |
| * | Total Return is for the period indicated and has not been annualized. Returns shown do not reflect the deductions of taxes that a shareholder would pay on Fund distributions or the redemption of Fund shares. Total return may have been lower had the Adviser not waived its fee and/or reimbursed other expenses. |
| (1) | Per share data calculated using average shares method. |
The accompanying notes are an integral part of the financial statements.
| Gallery Trust | Mondrian Global Listed
Infrastructure Fund |
FINANCIAL HIGHLIGHTS
Selected per share data & ratios
for a share outstanding throughout the year
| | | Year
Ended
10/31/24 | | | Year
Ended
10/31/23 | | | Year
Ended
10/31/22 | | | Year
Ended
10/31/21 | | | Year Ended 10/31/20 | |
| Net asset value, beginning of year | | $ | 9.45 | | | $ | 9.94 | | | $ | 12.03 | | | $ | 10.17 | | | $ | 12.14 | |
| | | | | | | | | | | | | | | | | | | | | |
| Income/(loss) from operations:(1) | | | | | | | | | | | | | | | | | | | | |
| Net investment income | | | 0.32 | | | | 0.34 | | | | 0.39 | | | | 0.28 | | | | 0.41 | |
| Net realized and unrealized gain/(loss) | | | 1.91 | | | | 0.05 | | | | (1.66 | ) | | | 2.27 | | | | (1.58 | ) |
| Total from operations | | | 2.23 | | | | 0.39 | | | | (1.27 | ) | | | 2.55 | | | | (1.17 | ) |
| Dividends and distributions from: | | | | | | | | | | | | | | | | | | | | |
| Net investment income | | | (0.33 | ) | | | (0.34 | ) | | | (0.27 | ) | | | (0.32 | ) | | | (0.41 | ) |
| Net realized gains | | | (0.24 | ) | | | (0.54 | ) | | | (0.55 | ) | | | (0.37 | ) | | | (0.39 | ) |
| Total dividends and distributions | | | (0.57 | ) | | | (0.88 | ) | | | (0.82 | ) | | | (0.69 | ) | | | (0.80 | ) |
| Net asset value, end of year | | $ | 11.11 | | | $ | 9.45 | | | $ | 9.94 | | | $ | 12.03 | | | $ | 10.17 | |
| Total return* | | | 23.93 | % | | | 3.26 | % | | | (11.38 | )% | | | 25.70 | % | | | (10.56 | )% |
| | | | | | | | | | | | | | | | | | | | | |
| Ratios and supplemental data | | | | | | | | | | | | | | | | | | | | |
| Net assets, end of year ($ Thousands) | | $ | 1,936 | | | $ | 1,563 | | | $ | 1,514 | | | $ | 1,707 | | | $ | 1,358 | |
| Ratio of expenses to average net assets (including waivers and reimbursements) | | | 0.95 | % | | | 0.95 | % | | | 0.95 | % | | | 0.95 | % | | | 0.95 | % |
| Ratio of expenses to average net assets (excluding waivers and reimbursements) | | | 5.76 | % | | | 6.68 | % | | | 6.32 | % | | | 5.08 | % | | | 7.42 | % |
| Ratio of net investment income to average net assets | | | 2.97 | % | | | 3.18 | % | | | 3.51 | % | | | 2.36 | % | | | 3.76 | % |
| Portfolio turnover rate | | | 18 | % | | | 17 | % | | | 26 | % | | | 39 | % | | | 44 | % |
| * | Returns shown do not reflect the deductions of taxes that a shareholder would pay on Fund distributions or the redemption of Fund shares. Total return may have been lower had the Adviser not waived its fee and/or reimbursed other expenses. |
| (1) | Per share data calculated using average shares method. |
The accompanying notes are an integral part of the financial statements.
| Gallery Trust | Mondrian Global Equity
Value Fund |
FINANCIAL HIGHLIGHTS
Selected per share data & ratios
for a share outstanding throughout the year or period
| | | Year
Ended
10/31/24 | | | Year
Ended
10/31/23 | | | Year
Ended
10/31/22 | | | Year
Ended
10/31/21 | | | Period Ended 10/31/20* | |
| Net asset value, beginning of period | | $ | 12.02 | | | $ | 10.56 | | | $ | 12.88 | | | $ | 10.22 | | | $ | 10.00 | |
| | | | | | | | | | | | | | | | | | | | | |
| Income/(loss) from operations:(1) | | | | | | | | | | | | | | | | | | | | |
| Net investment income | | | 0.24 | | | | 0.18 | | | | 0.16 | | | | 0.16 | | | | 0.05 | |
| Net realized and unrealized gain/(loss) | | | 2.71 | | | | 1.57 | | | | (2.29 | ) | | | 2.68 | | | | 0.17 | |
| Total from operations | | | 2.95 | | | | 1.75 | | | | (2.13 | ) | | | 2.84 | | | | 0.22 | |
| Dividends and distributions from: | | | | | | | | | | | | | | | | | | | | |
| Net investment income | | | (0.24 | ) | | | (0.14 | ) | | | (0.08 | ) | | | (0.18 | ) | | | — | |
| Net realized gains | | | — | | | | (0.15 | ) | | | (0.11 | ) | | | — | | | | — | |
| Total dividends and distributions | | | (0.24 | ) | | | (0.29 | ) | | | (0.19 | ) | | | (0.18 | ) | | | — | |
| Net asset value, end of period | | $ | 14.73 | | | $ | 12.02 | | | $ | 10.56 | | | $ | 12.88 | | | $ | 10.22 | |
| Total return† | | | 24.75 | % | | | 16.71 | % | | | (16.75 | )% | | | 28.09 | % | | | 2.20 | % |
| | | | | | | | | | | | | | | | | | | | | |
| Ratios and supplemental data | | | | | | | | | | | | | | | | | | | | |
| Net assets, end of period ($Thousands) | | $ | 231,258 | | | $ | 147,025 | | | $ | 122,313 | | | $ | 83,522 | | | $ | 2,604 | |
| Ratio of expenses to average net assets (including waivers and reimbursements) | | | 0.74 | % | | | 0.74 | % | | | 0.74 | % | | | 0.74 | % | | | 0.74 | %‡ |
| Ratio of expenses to average net assets (excluding waivers and reimbursements) | | | 0.83 | % | | | 0.86 | % | | | 0.89 | % | | | 1.17 | % | | | 9.16 | %‡ |
| Ratio of net investment income to average net assets | | | 1.72 | % | | | 1.51 | % | | | 1.36 | % | | | 1.29 | % | | | 1.42 | %‡ |
| Portfolio turnover rate | | | 48 | % | | | 42 | % | | | 46 | % | | | 64 | % | | | 10 | %§ |
| * | Commenced operations June 30, 2020. |
| † | Returns shown do not reflect the deductions of taxes that a shareholder would pay on Fund distributions or the redemption of Fund shares. Total return may have been lower had the Adviser not waived its fee and/or reimbursed other expenses. |
| § | Portfolio turnover rate is for the period indicated and has not been annualized. |
| (1) | Per share data calculated using average shares method. |
Amounts designated as “—” are $0 or have been rounded to $0.
The accompanying notes are an integral part of the financial statements.
| Gallery Trust | October 31, 2024 |
NOTES TO FINANCIAL STATEMENTS
1. Organization
Gallery Trust (the “Trust”), is organized as a Delaware statutory trust under an Agreement and Declaration of Trust dated August 25, 2015. The Trust is registered under the Investment Company Act of 1940 (the “1940 Act”), as amended, as an open-end investment management company with four funds. The financial statements herein are those of the Mondrian International Value Equity Fund (formerly, Mondrian International Equity Fund) (the “International Fund”), Mondrian Emerging Markets Value Equity Fund (formerly, the Mondrian Emerging Markets Equity Fund) (the “Emerging Markets Fund”), the Mondrian Global Listed Infrastructure Fund (the “Global Listed Infrastructure Fund”), and the Mondrian Global Equity Value Fund (the “Global Equity Value Fund”) (each a “Fund” and collectively the “Funds”). The International Fund, Emerging Markets Fund and Global Listed Infrastructure Fund are classified as diversified, and the Global Equity Value Fund are classified as “non-diversified” under the 1940 Act. The investment objective of the International Fund is to seek long-term total return by investing at least 80% of its net assets, plus any borrowings for investment purposes, in equity securities. The investment objective of the Emerging Markets Fund is to seek long-term capital appreciation. The investment objective of the Global Listed Infrastructure Fund is to seek long-term total return by investing at least 80% of its net assets, plus any borrowings for investment purposes, in equity securities of infrastructure companies listed on a domestic or foreign exchange. The investment objective of the Global Equity Value Fund is to seek long-term total return. Mondrian Investment Partners Limited, a limited company organized under the laws of England and Wales in 1990, serves as the Funds’ investment adviser (“Mondrian” or the “Adviser”). The Adviser makes investment decisions for the Funds and reviews, supervises and administers the investment program of the Funds, subject to the supervision of, and policies established by, the Trustees of the Trust.
The Global Equity Value Fund commenced operations on June 30, 2020.
2. Significant accounting policies
The following are significant accounting policies, which are consistently followed in the preparation of the financial statements of the Funds. The Funds are investment companies that apply the accounting and reporting guidance issued in Topic 946 by the U.S. Financial Accounting Standards Board (“FASB”).
Use of estimates — The preparation of financial statements, in conformity with U.S. generally accepted accounting principles (“U.S. GAAP”), requires management to make estimates and assumptions that affect the fair value of assets, the reported amounts of assets and liabilities and disclosure of contingent assets and liabilities at the date of the financial statements and the reported amount of increases and decreases in net assets from operations during the reporting period. Actual results could differ from those estimates and such differences could be material.
| Gallery Trust | October 31, 2024 |
NOTES TO FINANCIAL STATEMENTS (continued)
Valuation of investments — Securities listed on a securities exchange, market or automated quotation system for which quotations are readily available (except for securities traded on NASDAQ ), including securities traded over the counter, are valued at the last quoted sale price on an exchange or market (foreign or domestic) on which they are traded on valuation date (or at approximately 4:00 pm ET if a security’s primary exchange is normally open at that time), or, if there is no such reported sale on the valuation date, at the most recent quoted bid price. For securities traded on NASDAQ , the NASDAQ Official Closing Price will be used. If available, debt securities are priced based upon valuations provided by recognized independent, third-party pricing agents. Such values generally reflect the last reported sales price if the security is actively traded. The third-party pricing agents may also value debt securities by employing methodologies that utilize actual market transactions, broker-supplied valuations, or other methodologies designed to identify the market value for such securities. Such methodologies generally consider such factors as security prices, yields, maturities, call features, ratings and developments relating to specific securities in arriving at valuations. Debt securities with remaining maturities of sixty days or less may be valued at their amortized cost, which approximates market value. If such prices are not available or determined to not represent the fair value of the security as of each Fund’s pricing time, the security will be valued at fair value as determined in good faith using methods approved by the Board of Trustees (the “Board”). The prices for foreign securities will be reported in local currency and converted to U.S. dollars using currency exchange rates.
Securities for which market prices are not “readily available” are valued in accordance with fair value procedures (the "Fair Value Procedures") established by the Adviser and approved by the Trust's Board of Trustees (the “Board”). Pursuant to Rule 2a-5 under the 1940 Act, the Board has designated the Adviser as the "valuation designee" to determine the fair value of securities and other instruments for which no readily available market quotations are available. The Fair Value Procedures are implemented through a Fair Value Committee (the “Committee”) of the Adviser.
| Gallery Trust | October 31, 2024 |
NOTES TO FINANCIAL STATEMENTS (continued)
Some of the more common reasons that may necessitate that a security be valued using fair value procedures include: the security’s trading has been halted or suspended; the security has been de-listed from a national exchange; the security’s primary trading market is temporarily closed at a time when under normal conditions it would be open; or the security’s primary pricing source is not able or willing to provide a price. When a security is valued in accordance with the fair value procedures, the Committee will determine the value after taking into consideration relevant information reasonably available to the Committee.
For securities that principally trade on a foreign market or exchange, a significant gap in time can exist between the time of a particular security’s last trade and the time at which the Fund calculates its net asset value. The closing prices of such securities may no longer reflect their market value at the time the Fund calculates net asset value if an event that could materially affect the value of those securities (a “Significant Event”) has occurred between the time of the security’s last close and the time that the Fund calculates net asset value. A Significant Event may relate to a single issuer or to an entire market sector. If the Funds’ Adviser becomes aware of a Significant Event that has occurred with respect to a security or group of securities after the closing of the exchange or market on which the security or securities principally trade, but before the time at which the Fund calculates net asset value, it may request that a Committee meeting be called.
The Funds use Intercontinental Exchange Data Pricing & Reference Data, LLC. (“ICE”) as a third party fair valuation vendor. ICE provides a fair value for foreign securities held by the Funds based on certain factors and methodologies (involving, generally, tracking valuation correlations between the U.S. market and each non-U.S. security) applied by ICE in the event that there is a movement in the U.S. market that exceeds a specific threshold that has been established by the Committee. The Committee has also established a “confidence interval” which is used to determine the level of correlation between the value of a foreign security and movements in the U.S. market before a particular security is fair valued when the threshold is exceeded. In the event that the threshold established by the Committee is exceeded on a specific day, the Funds value the non-U.S. securities in their portfolios that exceed the applicable “confidence interval” based upon the fair values provided by ICE. In such event, it is not necessary to hold a Committee meeting. In the event that the Adviser believes that the fair values provided by ICE are not reliable, the Adviser contacts the Funds’ Administrator and requests that a meeting of the Committee be held.
| Gallery Trust | October 31, 2024 |
NOTES TO FINANCIAL STATEMENTS (continued)
If a local market in which the Funds own securities is closed for one or more days, the Funds shall value all securities held in the corresponding currency based on the fair value prices provided by ICE using the predetermined confidence interval discussed above.
In accordance with the authoritative guidance on fair value measurements and disclosure under U.S. GAAP, the Funds disclose the fair value of their investments in a hierarchy that prioritizes the inputs to valuation techniques used to measure the fair value. The objective of a fair value measurement is to determine the price that would be received to sell an asset or paid to transfer a liability in an orderly transaction between market participants at the measurement date (an exit price). Accordingly, the fair value hierarchy gives the highest priority to quoted prices (unadjusted) in active markets for identical assets or liabilities (Level 1) and the lowest priority to unobservable inputs (Level 3). The three levels of the fair value hierarchy are described below:
Level 1 — Inputs are unadjusted, quoted prices in active markets for identical assets or liabilities at the measurement date.
Level 2 — Inputs other than quoted prices included in Level 1 that are observable for the asset or liability, either directly or indirectly. Level 2 inputs include quoted prices for similar instruments in active markets, and inputs other than quoted prices that are observable for the asset or liability.
Level 3 — Inputs are unobservable inputs for the asset or liability, and include situations where there is little, if any, market activity for the asset or liability.
Investments are classified within the level of the lowest significant input considered in determining fair value. Investments classified within Level 3 whose fair value measurement considers several inputs may include Level 1 or Level 2 inputs as components of the overall fair value measurement.
Fair value measurement classifications are summarized in the Funds’ Schedule of Investments.
Federal income taxes — It is each Fund’s intention to continue to qualify as a regulated investment company for Federal income tax purposes by complying with the appropriate provisions of Subchapter M of the Internal Revenue Code of 1986. Accordingly, no provision for Federal income taxes has been made in the financial statements.
The Funds evaluate tax positions taken or expected to be taken in the course of preparing the Funds’ tax returns to determine whether it is “more-likely-than-not” (i.e., greater than 50-percent) that each tax position will be sustained upon examination by a taxing authority based on the technical merits of the position. Tax positions not deemed to meet the more-likely-than-not threshold are recorded as a tax benefit or expense in the current year. The Funds did not record any tax provision in the current period. However, management’s conclusions regarding tax positions taken may be subject to review and adjustment at a later date based on factors including, but not limited to, examination by tax authorities (i.e., the last three tax year ends, as applicable), on-going analysis of and changes to tax laws, regulations and interpretations thereof.
| Gallery Trust | October 31, 2024 |
NOTES TO FINANCIAL STATEMENTS (continued)
As of and during the year ended October 31, 2024, the Funds did not have a liability for any unrecognized tax benefits. The Funds recognize interest and penalties, if any, related to unrecognized tax benefits as income tax expense in the Statement of Operations. During the year ended October 31, 2024, the Funds did not incur any interest or penalties.
Withholding taxes on foreign dividends have been provided for in accordance with the Funds' understanding of the applicable country’s tax rules and rates. The Funds or its agent file withholding tax reclaims in certain jurisdictions to recover certain amounts previously withheld. The Funds may record a reclaim receivable based on collectability, which includes factors such as the jurisdiction’s applicable laws, payment history and market convention. Professional fees paid to those that provide assistance in receiving the tax reclaims, which generally are contingent upon successful receipt of reclaimed amounts, are recorded in Professional Fees on the Statement of Operations once the amounts are due. The professional fees related to pursuing these tax reclaims are not subject to the Adviser’s expense limitation agreement.
Security transactions, dividend and investment income — Security transactions are accounted for on trade date basis for financial reporting purposes. Costs used in determining realized gains and losses on the sale of investment securities are based on the specific identification method. Dividend income is recognized on the ex-dividend date. Interest income is recognized on the accrual basis from settlement date. Purchase discounts and premiums on debt securities are accreted and amortized to maturity and included in interest income. Certain dividends from foreign securities will be recorded as soon as the Funds are informed of the dividend, net of withholding taxes, if such information is obtained subsequent to the ex-dividend date.
| Gallery Trust | October 31, 2024 |
| | |
NOTES TO FINANCIAL STATEMENTS (continued)
Foreign currency translation — The books and records of the Funds are maintained in U.S. dollars. Investment securities and other assets and liabilities denominated in a foreign currency are translated into U.S. dollars on the date of valuation. The Funds do not isolate that portion of realized or unrealized gains and losses resulting from changes in the foreign exchange rate from fluctuations arising from changes in the market prices of the securities. These gains and losses are included in net realized and unrealized gains and losses on investments on the Statements of Operations.
Net realized and unrealized gains and losses on foreign currency transactions represent net foreign exchange gains or losses from foreign currency exchange contracts, disposition of foreign currencies, currency gains or losses realized between trade and settlement dates on securities transactions and the difference between the amount of the investment income and foreign withholding taxes recorded on the Funds’ books and the U.S. dollar equivalent of the amounts actually received or paid.
Forward Foreign Currency Contracts — The Funds may enter into forward foreign currency contracts as hedges against either specific transactions, fund positions or anticipated fund positions. The Funds may also engage in currency transactions to enhance the Funds’ returns. All commitments are “marked-to-market” daily at the applicable foreign exchange rate, and any resulting unrealized gains or losses are recorded currently. The Funds realize gains and losses at the time forward contracts are closed. Unrealized gains or losses on outstanding positions in forward foreign currency contracts held at the close of the period are recognized as ordinary income or loss for Federal income tax purposes. The Funds could be exposed to risk if the counterparties to the contracts are unable to meet the terms of the contract and from unanticipated movements in the value of a foreign currency relative to the U.S. dollar. Finally, the risk exists that losses could exceed amounts disclosed on the Statement of Assets and Liabilities. Refer to each Fund’s Schedule of Investments for details regarding open forward foreign currency contracts as of October 31, 2024, if applicable.
To reduce counterparty risk with respect to Over-the-Counter (“OTC”) transactions, the Funds have entered into netting arrangements, established within the Funds’ International Swap and Derivatives Association, Inc. (“ISDA”) master agreements, which allow the Funds to make (or to have an entitlement to receive) a single net payment in the event of default (close-out netting) for outstanding payables and receivables with respect to certain OTC positions in forward foreign currency contracts for each individual counterparty. In addition, the Funds may require that certain counterparties post cash and/or securities in collateral accounts to cover their net payment obligations for those derivative contracts subject to ISDA master agreements. If the counterparty fails to perform under these contracts and agreements, the cash and/or securities will be made available to the Funds.
| Gallery Trust | October 31, 2024 |
NOTES TO FINANCIAL STATEMENTS (continued)
For financial reporting purposes, the Funds do not offset derivative assets and derivative liabilities that are subject to netting arrangements in the Statement of Assets and Liabilities. Bankruptcy or insolvency laws of a particular jurisdiction may impose restrictions on or prohibitions against the right of offset in bankruptcy, insolvency or other events.
Collateral terms are contract specific for OTC derivatives. For derivatives traded under an ISDA master agreement, the collateral requirements are typically calculated by netting the mark to market amount of each transaction under such agreement and comparing that amount to the value of any collateral currently pledged by the Funds or the counterparty.
For financial reporting purposes, cash collateral that has been pledged to cover obligations of the Funds, if any, is reported separately on the Statement of Assets and Liabilities as cash pledged as collateral. Non-cash collateral pledged by the Funds, if any, is noted in the Schedule of Investments. Generally, the amount of collateral due from or to a party must exceed a minimum transfer amount threshold before a transfer has to be made. To the extent amounts due to the Funds from their counterparties are not fully collateralized, contractually or otherwise, the Funds bear the risk of loss from counterparty nonperformance.
Dividends and distributions to shareholders — The International Fund, Emerging Markets Fund, Global Listed Infrastructure Fund, and Global Equity Value Fund distribute their net investment income at least annually. For each Fund, net realized capital gains, if any, are distributed at least annually. All distributions are recorded on ex-dividend date.
Expenses — Expenses that are directly related to the Fund are charged to the Fund. Other operating expenses of the Trust are prorated to the funds based on the number of funds and/or relative daily net assets.
Investments in REITs — Dividend income from Real Estate Investment Trusts (“REIT”) is recorded based on the income included in distributions received from the REIT investments using published REIT reclassifications, including some management estimates when actual amounts are not available. Distributions received in excess of this estimated amount are recorded as a reduction of the cost of investments or reclassified to capital gains. The actual amounts of income, return of capital, and capital gains are determined by each REIT only after its fiscal year-end, and may differ from the estimated amounts.
| Gallery Trust | October 31, 2024 |
NOTES TO FINANCIAL STATEMENTS (continued)
3. Transactions with affiliates
Certain officers of the Trust are also employees of SEI Investments Global Funds Services (the “Administrator”), a wholly owned subsidiary of SEI Investments Company, and/or SEI Investments Distribution Co. (the “Distributor”). Such officers are paid no fees by the Trust, other than the Chief Compliance Officer (“CCO”) as described below, for serving as officers of the Trust.
A portion of the services provided by the CCO and his staff, who are employees of the Administrator, are paid for by the Trust as incurred. The services include regulatory oversight of the Trust’s advisors and service providers, as required by SEC regulations. The CCO’s services and fees have been approved by and are reviewed by the Board.
4. Administration, Custodian and Transfer Agent Agreements
The Funds and the Administrator are parties to an Administration Agreement under which the Administrator provides administrative services to the Funds. For these services, the Administrator is paid an asset based fee, which will vary depending on the number of share classes and the average daily net assets of the Funds. For the year ended October 31, 2024, the amounts paid for these services are represented in the table below:
| | Accounting and Administration Fees |
| International Value Equity Fund | $ 793,453 |
| Emerging Markets Value Equity Fund | 18,776 |
| Global Listed Infrastructure Fund | 1,698 |
| Global Equity Value Fund | 180,343 |
Expenses incurred under the agreements are shown on the Statement of Operations as “Accounting and administration fees”.
Brown Brothers Harriman & Co., (the “Custodian”) serves as the Funds’ Custodian pursuant to a custody agreement. Apex Fund Services (the “Transfer Agent”) serves as the Funds’ Transfer Agent pursuant to a transfer agency agreement.
| Gallery Trust | October 31, 2024 |
NOTES TO FINANCIAL STATEMENTS (continued)
5. Investment Advisory Agreement
Under the terms of an investment advisory agreement, the Adviser provides investment advisory services to the Funds. The Adviser is entitled to a fee, which is calculated daily and paid monthly, at an annual rate for each fund. The table below shows the rate of each Fund’s investment advisory fee.
| | Advisory Fee |
| International Value Equity Fund | 0.65% |
| Emerging Markets Value Equity Fund | 0.75% |
| Global Listed Infrastructure Fund | 0.85% |
| Global Equity Value Fund | 0.65% |
The Adviser has contractually agreed to reduce its fees and/or reimburse expenses to the extent necessary to keep total annual Fund operating expenses (excluding interest, taxes, brokerage commissions, acquired fund fees and expenses, and non-routine (collectively “excluded expenses”)) from exceeding the below percentages of the average daily net assets of the Funds until February 28, 2026 (the “Expense Limitation”). Refer to waiver of investment advisory fees and the Reimbursement from Investment Advisor on the Statements of Operations for fees waived and expenses reimbursed for the year ended October 31, 2024.
| | Expense Limitation |
| International Value Equity Fund | 0.74% |
| Emerging Markets Value Equity Fund | 0.92% |
| Global Listed Infrastructure Fund | 0.95% |
| Global Equity Value Fund | 0.74% |
This agreement may be terminated: (i) by the Board for any reason at any time, or (ii) by the Adviser, upon ninety (90) days’ prior written notice to the Trust, effective as of the close of business on February 28, 2026.
Refer to waiver of investment advisory fees on the Statements of Operations for fees waived for the year ended October 31, 2024. The Adviser may recover all or a portion of its fee reductions or expense reimbursements, up to the expense cap in place at the time the expenses were waived, within a three-year period from the year in which it reduced its fee or reimbursed expenses if the Funds’ total annual fund operating expenses are below the Expense Limitation. This agreement may be terminated by the Board for any reason at any time, or by the Adviser, upon ninety (90) days’ prior written notice to the Trust, effective as of the close of business on February 28, 2026. During the year ended October 31, 2024, there has been no recoupment of previously waived and reimbursed fees. As of October 31, 2024, the fees which were previously waived by the Adviser which may be subject to possible future reimbursement, are as follows:
| Gallery Trust | October 31, 2024 |
NOTES TO FINANCIAL STATEMENTS (continued)
| | | Expiring 2025 | | | Expiring 2026 | | | Expiring 2027 | | | Total | |
| International Value Equity Fund | | $ | 599,537 | | | $ | 562,648 | | | $ | 496,091 | | | $ | 1,658,276 | |
| Emerging Markets Value Equity Fund | | | 88,134 | | | | 94,196 | | | | 119,279 | | | | 301,609 | |
| Global Listed Infrastructure Fund | | | 78,787 | | | | 110,506 | | | | 88,299 | | | | 277,592 | |
| Global Equity Value Fund | | | 153,133 | | | | 184,675 | | | | 184,250 | | | | 522,058 | |
6. Investment transactions
The cost of purchases and proceeds from security sales other than long-term U.S. Government and short-term securities for the year ended October 31, 2024, are as follows:
| | | Purchases | | | Sales and Maturities | | U.S. Government Purchases | | | U.S. Government Sales and Maturities | |
| International Value Equity Fund | | $ | 291,643,838 | | | $ | 283,920,841 | | $ | — | | | $ | — | |
| Emerging Markets Value Equity Fund | | | 7,966,230 | | | | 9,780,053 | | | — | | | | — | |
| Global Listed Infrastructure Fund | | | 375,977 | | | | 324,497 | | | — | | | | — | |
| Global Equity Value Fund | | | 140,084,054 | | | | 92,594,081 | | | — | | | | — | |
7. Federal tax information
The amount and character of income and capital gain distributions to be paid, if any, are determined in accordance with Federal income tax regulations, which may differ from U.S. GAAP. As a result, net investment income/(loss) and net realized gain/(loss) on investment transactions for a reporting period may differ significantly from distributions during such period. These book/tax differences may be temporary or permanent. To the extent these differences are permanent in nature, they are charged or credited to distributable earnings or paid-in capital, as appropriate, in the period that the differences arise.
| Gallery Trust | October 31, 2024 |
NOTES TO FINANCIAL STATEMENTS (continued)
The permanent differences primarily consist of foreign currency translations, reclassification of long term capital gain distribution on REITs and investments in PFICs. There are no permanent differences that are credited or charged to Paid-in Capital and Distributable Earnings as of October 31, 2024.
The character of distributions made during the year from net investment income or net realized gains may differ from their ultimate characterization for federal income tax purposes. Also, due to the timing of dividend distributions, the fiscal year in which amounts are distributed may differ from the year that the income or realized gains (losses) were recorded by the Funds. Income dividends and capital gain distributions are determined in accordance with federal income tax regulations, which may differ from U.S. GAAP. These differences are primarily due to differing treatments for wash sale loss deferrals, investments in PFICs and forwards. Distributions during the years ended October 31, 2024 and October 31, 2023, unless otherwise noted, were as follows:
| | | | Ordinary Income | | | Long-Term Capital Gain | | | Total | |
| International Value Equity Fund | | | | | | | | | | | | | |
| 2024 | | | $ | 26,360,330 | | | $ | 2,677,473 | | | $ | 29,037,803 | |
| 2023 | | | | 14,886,290 | | | | 3,832,310 | | | | 18,718,600 | |
| Emerging Markets Value Equity Fund | | | | | | | | | | | | | |
| 2024 | | | | 610,646 | | | | – | | | | 610,646 | |
| 2023 | | | | 532,861 | | | | – | | | | 532,861 | |
| Global Listed Infrastructure Fund | | | | | | | | | | | | | |
| 2024 | | | | 59,032 | | | | 35,925 | | | | 94,957 | |
| 2023 | | | | 54,827 | | | | 82,000 | | | | 136,827 | |
| Global Equity Value Fund | | | | | | | | | | | | | |
| 2024 | | | | 3,041,860 | | | | – | | | | 3,041,860 | |
| 2023 | | | | 2,833,146 | | | | 416,796 | | | | 3,249,942 | |
| Gallery Trust | October 31, 2024 |
NOTES TO FINANCIAL STATEMENTS (continued)
As of October 31, 2024, the components of Distributable Earnings on a tax basis were as follows:
| | | International Value Equity Fund | | | Emerging Markets Value Equity Fund | |
| Undistributed Ordinary Income | | $ | 33,890,893 | | | $ | 627,492 | |
| Undistributed Long-Term Capital Gain | | | 30,659,858 | | | | – | |
| Capital Loss Carryforwards | | | – | | | | (106,736,011 | ) |
| Unrealized Appreciation | | | 32,750,930 | | | | 128,913 | |
| Other Temporary Differences | | | (645 | ) | | | (4 | ) |
| Total Distributable Earnings | | | | | | | | |
| (Accumulated Losses) | | $ | 97,301,036 | | | $ | (105,979,610 | ) |
| | | | Global Listed Infrastructure Fund | | | | Global Equity Value Fund | |
| Undistributed Ordinary Income | | $ | 52,664 | | | $ | 2,971,675 | |
| Undistributed Long-Term Capital Gain | | | 19,428 | | | | 8,299,553 | |
| Unrealized Appreciation | | | 68,325 | | | | 18,715,780 | |
| Other Temporary Differences | | | (3 | ) | | | 2,746 | |
| Total Distributable Earnings | | $ | 140,414 | | | $ | 29,989,754 | |
Capital losses that are carried forward will retain their character as either short-term or long-term capital losses. The Funds have capital losses carried forward as follows:
| | | | Total* | |
| Emerging Markets Value Equity Fund | | | $ | 106,736,011 | |
| * | The utilization of this amount is subject to significant limitation under IRC section 382-384. |
During the year ended October 31, 2024, the Funds utilized capital loss carryforwards to offset capital gains amounting to:
| | | | Total | |
| Emerging Markets Value Equity Fund | | | $ | 584,709 | |
| Global Equity Value Fund | | | | 2,887,722 | |
For Federal income tax purposes the difference between Federal tax cost and book cost primarily relates to passive foreign investment companies, foreign capital gains tax, and wash sales. The Federal tax cost and aggregate gross unrealized appreciation and depreciation for the investments held by the Funds at October 31, 2024, were as follows:
| Gallery Trust | October 31, 2024 |
NOTES TO FINANCIAL STATEMENTS (continued)
| | | Federal Tax Cost | | | Aggregate Gross Unrealized Appreciation | | | Aggregate Gross Unrealized Depreciation | | | Net Unrealized Appreciation (Depreciation) | |
| | | | | | | | | | | | | | | | |
| International Value Equity Fund | | $ | 840,462,251 | | | $ | 104,484,897 | | | ($ | 71,733,967 | ) | | $ | 32,750,930 | |
| Emerging Markets Value Equity Fund | | | 20,213,899 | | | | 2,986,163 | | | | (2,857,250) | | | | 128,913 | |
| Global Listed Infrastructure Fund | | | 1,862,367 | | | | 190,140 | | | | (121,815) | | | | 68,325 | |
| Global Equity Value Fund | | | 210,072,045 | | | | 17,940,410 | | | | 775,370 | | | | 18,715,780 | |
8. Share transactions
The share transactions are shown below:
| | | Mondrian International Value
Equity Fund | |
| | | Year Ended October 31, 2024 | | | Year Ended October 31, 2023 | |
| Shares transactions: | | | | | | |
| | | | | | | |
| Institutional Class shares | | | | | | |
| Issued | | | 12,284,447 | | | | 10,979,248 | |
| Reinvestment of dividends | | | 1,567,968 | | | | 1,227,939 | |
| Redeemed | | | (12,770,615 | ) | | | (8,993,119 | ) |
| Net increase in shares outstanding | | | 1,081,800 | | | | 3,214,068 | |
| | | | Mondrian Emerging Markets Value Equity Fund | |
| | | | Year Ended October 31, 2024 | | | | Year Ended October 31, 2023 | |
| Shares transactions: | | | | | | | | |
| | | | | | | | | |
| Institutional Class shares | | | | | | | | |
| Issued | | | 157,443 | | | | 441,938 | |
| Reinvestment of dividends | | | 83,194 | | | | 79,195 | |
| Redeemed | | | (462,516 | ) | | | (862,893 | ) |
| Net decrease in shares outstanding | | | (221,879 | ) | | | (341,760 | ) |
| Gallery Trust | October 31, 2024 |
NOTES TO FINANCIAL STATEMENTS (continued)
| | | Mondrian Global Listed Infrastructure Fund | |
| | | Year Ended | | | Year Ended | |
| | | October 31, 2024 | | | October 31, 2023 | |
| Shares transactions: | | | | | | | | |
| | | | | | | | | |
| Institutional Class shares | | | | | | | | |
| Reinvestment of dividends | | | 8,949 | | | | 13,109 | |
| Net increase in shares outstanding | | | 8,949 | | | | 13,109 | |
| | | Mondrian Global Equity Value Fund | |
| | | Year Ended | | | Year Ended | |
| | | October 31, 2024 | | | October 31, 2023 | |
| Shares transactions: | | | | | | |
| | | | | | | |
| Institutional Class shares | | | | | | |
| Issued | | | 5,324,390 | | | | 3,298,760 | |
| Reinvestment of dividends | | | 218,294 | | | | 270,440 | |
| Redeemed | | | (2,071,829 | ) | | | (2,926,035 | ) |
| Net increase in shares outstanding | | | 3,470,855 | | | | 643,165 | |
9. Risks associated with financial instruments
As with all mutual funds, a shareholder of a Fund is subject to the risk that his or her investment could lose money. The Funds are subject to the principal risks noted below, any of which may adversely affect the Funds’ net asset value and ability to meet its investment objective. A more complete description of risks associated with each Fund is included in the prospectus.
Active Management Risk
The Funds are subject to the risk that the Adviser’s judgments about the attractiveness, value, or potential appreciation of the Funds’ investments may prove to be incorrect. If the investments selected and strategies employed by the Funds fail to produce the intended results, the Funds could underperform in comparison to its benchmark index or other funds with similar objectives and investment strategies.
Equity Risk
Since it purchases equity securities, the Funds are subject to the risk that stock prices may fall over short or extended periods of time. Historically, the equity markets have moved in cycles, and the value of the Funds’ equity securities may fluctuate from day to day. Individual companies may report poor results or be negatively affected by industry and/or economic trends and developments. The prices of securities issued by such companies may suffer a decline in response. These factors contribute to price volatility, which is the principal risk of investing in the Funds.
| Gallery Trust | October 31, 2024 |
NOTES TO FINANCIAL STATEMENTS (continued)
Convertible Securities Risk
The value of a convertible security is influenced by changes in interest rates (with investment value declining as interest rates increase and increasing as interest rates decline) and the credit standing of the issuer. The price of a convertible security will also normally vary in some proportion to changes in the price of the underlying common stock because of the conversion or exercise feature.
Large Capitalization Company Risk
The large capitalization companies in which the Funds may invest may lag the performance of smaller capitalization companies because large capitalization companies may experience slower rates of growth than smaller capitalization companies and may not respond as quickly to market changes and opportunities.
Preferred Stocks Risk
Preferred stocks are sensitive to interest rate changes, and are also subject to equity risk, which is the risk that stock prices will fall over short or extended periods of time. The rights of preferred stocks on the distribution of a company’s assets in the event of a liquidation are generally subordinate to the rights associated with a company’s debt securities.
Foreign Company Risk
Investing in foreign companies, including direct investments and investments through depositary receipts, poses additional risks since political and economic events unique to a country or region will affect those markets and their issuers. These risks will not necessarily affect the U.S. economy or similar issuers located in the U.S. Securities of foreign companies may not be registered with the SEC and foreign companies are generally not subject to the regulatory controls imposed on U.S. issuers and, as a consequence, there is generally less publically available information about foreign securities than is available about domestic securities. Income from foreign securities owned by the Funds may be reduced by a withholding tax at the source, which tax would reduce income received from the securities comprising the portfolio. Foreign securities may also be more difficult to value than securities of U.S. issuers. While depositary receipts provide an alternative to directly purchasing the underlying foreign securities in their respective national markets and currencies, investments in depositary receipts continue to be subject to many of the risks associated with investing directly in foreign securities.
| Gallery Trust | October 31, 2024 |
NOTES TO FINANCIAL STATEMENTS (continued)
Emerging Markets Securities Risk
The Funds’ investments in emerging markets securities are considered speculative and subject to heightened risks in addition to the general risks of investing in foreign securities. Unlike more established markets, emerging markets may have governments that are less stable, markets that are less liquid and economies that are less developed. In addition, the securities markets of emerging market countries may consist of companies with smaller market capitalizations and may suffer periods of relative illiquidity; significant price volatility; restrictions on foreign investment; and possible restrictions on repatriation of investment income and capital. Furthermore, foreign investors may be required to register the proceeds of sales, and future economic or political crises could lead to price controls, forced mergers, expropriation or confiscatory taxation, seizure, nationalization or creation of government monopolies.
Foreign Currency Risk
As a result of the Funds’ investments in securities denominated in, and/or receiving revenues in, foreign currencies, the Funds will be subject to currency risk. Currency risk is the risk that foreign currencies will decline in value relative to the U.S. dollar or, in the case of hedging positions, that the U.S. dollar will decline in value relative to the currency hedged. In either event, the dollar value of an investment in the Funds would be adversely affected.
Depositary Receipts Risk
Investments in depositary receipts may be less liquid and more volatile than the underlying securities in their primary trading market. If a depositary receipt is denominated in a different currency than its underlying securities, the Funds will be subject to the currency risk of both the investment in the depositary receipt and the underlying security. Holders of depositary receipts may have limited or no rights to take action with respect to the underlying securities or to compel the issuer of the receipts to take action. The prices of depositary receipts may differ from the prices of securities upon which they are based. Certain of the depositary receipts in which the Fund invests may be unsponsored depositary receipts. Unsponsored depositary receipts may not provide as much information about the underlying issuer and may not carry the same voting privileges as sponsored depositary receipts. Unsponsored depositary receipts are issued by one or more depositaries in response to market demand, but without a formal agreement with the company that issues the underlying securities.
| Gallery Trust | October 31, 2024 |
NOTES TO FINANCIAL STATEMENTS (continued)
Derivatives Risk
The Funds’ use of forward contracts and participatory notes is subject to market risk, correlation risk, credit risk, valuation risk and liquidity risk. Market risk is the risk that the market value of an investment may move up and down, sometimes rapidly and unpredictably. Correlation risk is the risk that changes in the value of the derivative may not correlate perfectly or at all with the underlying asset, rate or index. Credit risk is the risk that the counterparty to a derivative contract will default or otherwise become unable to honor a financial obligation. Valuation risk is the risk that the derivative may be difficult to value. Liquidity risk is described below. The Funds’ use of forwards is also subject to leverage risk and hedging risk. Leverage risk is the risk that the use of leverage may amplify the effects of market volatility on the Fund’s share price and may also cause the Fund to liquidate portfolio positions when it would not be advantageous to do so in order to satisfy its obligations. Hedging risk is the risk that derivatives instruments used for hedging purposes may also limit any potential gain that may result from the increase in value of the hedged asset. To the extent that the Funds engage in hedging strategies, there can be no assurance that such strategy will be effective or that there will be a hedge in place at any given time. Each of these risks could cause the Funds to lose more than the principal amount invested in a derivative instrument.
Liquidity Risk
Certain securities may be difficult or impossible to sell at the time and the price that the Funds would like. The Funds may have to lower the price, sell other securities instead or forgo an investment opportunity, any of which could have a negative effect on Fund management or performance.
Portfolio Turnover Risk
Due to their investment strategies, the Funds may buy and sell securities frequently. This may result in higher transaction costs and additional capital gains tax liabilities.
Large Purchase and Redemption Risk
Large purchases or redemptions of the Fund’s shares may force the Fund to purchase or sell securities at times when it would not otherwise do so, and may cause the Fund’s portfolio turnover rate and transaction costs to rise, which may negatively affect the Fund’s performance and have adverse tax consequences for Fund shareholders.
| Gallery Trust | October 31, 2024 |
NOTES TO FINANCIAL STATEMENTS (continued)
Investment Style Risk
The Mondrian Global Equity Value Fund pursues a “value style” of investing. Value investing focuses on companies with stocks that appear undervalued to the Adviser in light of factors such as the company’s earnings, book value, revenues or cash flow. The Adviser’s methodology for analyzing value may differ from other market approaches. If the Adviser’s assessment of market conditions, or a company’s value or its prospects for exceeding earnings expectations is inaccurate, the Fund could suffer losses or produce poor performance relative to other funds. In addition, “value stocks” can continue to be undervalued by the market for long periods of time.
Small- and Mid-Capitalization Company Risk
The small- and mid-capitalization companies in which a Fund may invest may be more vulnerable to adverse business or economic events than larger, more established companies. In particular, investments in these small- and mid-sized companies may pose additional risks, including liquidity risk, because these companies tend to have limited product lines, markets and financial resources, and may depend upon a relatively small management group. Therefore, small- and mid-cap stocks may be more volatile than those of larger companies. These securities may be traded over-the-counter or listed on an exchange.
Rights and Warrants Risk
Investments in rights or warrants involve the risk of loss of the purchase value of a right or warrant if the right to subscribe to additional shares is not exercised prior to the right’s or warrant’s expiration. Also, the purchase of rights and/or warrants involves the risk that the effective price paid for the right and/or warrant added to the subscription price of the underlying security may exceed the market price of the underlying security in instances such as those where there is no movement in the price of the underlying security.
Private Placements Risk
Investment in privately placed securities may be less liquid than in publicly traded securities. Although these securities may be resold in privately negotiated transactions, the prices realized from these sales could be less than those originally paid by the Fund or less than what may be considered the fair value of such securities. Further, companies whose securities are not publicly traded may not be subject to the disclosure and other investor protection requirements that might be applicable if their securities were publicly traded.
| Gallery Trust | October 31, 2024 |
NOTES TO FINANCIAL STATEMENTS (continued)
Risks of Investing in Other Investment Companies
To the extent a Fund invests in other investment companies, such as open-end funds, closed-end funds and ETFs, the Fund will be subject to substantially the same risks as those associated with the direct ownership of the securities held by such other investment companies. As a shareholder of another investment company, the Fund relies on that investment company to achieve its investment objective. If the investment company fails to achieve its objective, the value of the Fund’s investment could decline, which could adversely affect the Fund’s performance. By investing in another investment company, Fund shareholders indirectly bear the Fund’s proportionate share of the fees and expenses of the other investment company, in addition to the fees and expenses that Fund shareholders directly bear in connection with the Fund’s own operations.
Because ETFs and certain closed-end funds are listed on national stock exchanges and are traded like stocks listed on an exchange, their shares potentially may trade at a discount or premium. Investments in ETFs and certain closed-end funds are also subject to brokerage and other trading costs, which could result in greater expenses to the Fund. In addition, because the value of ETF and certain closed-end fund shares depends on the demand in the market, the Adviser may not be able to liquidate the Fund’s holdings at the most optimal time, which could adversely affect Fund performance.
REITs Risk
REITs are pooled investment vehicles that own, and usually operate, income-producing real estate. REITs are susceptible to the risks associated with direct ownership of real estate, such as the following: declines in property values; increases in property taxes, operating expenses, interest rates or competition; overbuilding; zoning changes; and losses from casualty or condemnation. REITs typically incur fees that are separate from those of the Fund. Accordingly, the Fund’s investments in REITs will result in the layering of expenses such that shareholders will indirectly bear a proportionate share of the REITs’ operating expenses, in addition to paying Fund expenses. REIT operating expenses are not reflected in the fee table and example in this prospectus.
MLPs Risk
MLPs are limited partnerships in which the ownership units are publicly traded. MLPs often own several properties or businesses (or own interests) that are related to oil and gas industries or other natural resources, but they also may finance other projects. To the extent that an MLP’s interests are all in a particular industry, such as the energy industry, the MLP will be negatively impacted by economic events adversely impacting that industry. Additional risks of investing in an MLP also include those involved in investing in a partnership as opposed to a corporation. For example, state law governing partnerships is often less restrictive than state law governing corporations. Accordingly, there may be fewer protections afforded to investors in an MLP than investors in a corporation; for example, investors in MLPs may have limited voting rights or be liable under certain circumstances for amounts greater than the amount of their investment. In addition, MLPs may be subject to state taxation in certain jurisdictions which will have the effect of reducing the amount of income paid by the MLP to its investors. A Fund’s investment in MLPs may result in the layering of expenses, such that shareholders will indirectly bear a proportionate share of the MLPs’ operating expenses, in addition to paying Fund expenses. MLP operating expenses are not reflected in the fee table and example in this prospectus.
| Gallery Trust | October 31, 2024 |
NOTES TO FINANCIAL STATEMENTS (continued)
Energy companies are affected by worldwide energy prices and costs related to energy production. These companies may have significant operations in areas at risk for natural disasters, social unrest and environmental damage. These companies may also be at risk for increased government regulation and intervention, energy conservation efforts, litigation and negative publicity and perception.
Geographic Focus Risk
To the extent that a Fund focuses its investments in a particular country or geographic region, the Fund may be more susceptible to economic, political, regulatory or other events or conditions affecting issuers and countries within that country or geographic region. As a result, the Fund may be subject to greater price volatility and risk of loss than a fund holding more geographically diverse investments.
Stock Connect Investing Risk
Trading through Stock Connect is subject to a number of restrictions that may affect a Fund’s investments and returns, including a daily quota that limits the maximum net purchases under Stock Connect each day. In addition, investments made through Stock Connect are subject to relatively untested trading, clearance and settlement procedures. Moreover, A-Shares purchased through Stock Connect generally may only be sold or otherwise transferred through Stock Connect. The Fund’s investments in A-Shares purchased through Stock Connect are generally subject to Chinese securities regulations and listing rules. While overseas investors currently are exempt from paying capital gains or value added taxes on income and gains from investments in A-Shares purchased through Stock Connect, these tax rules could be changed, which could result in unexpected tax liabilities for the Fund. Stock Connect operates only on days when both the Chinese and Hong Kong markets are open for trading and when banks in both markets are open on the corresponding settlement days. Therefore, the Fund may be subject to the risk of price fluctuations of A-Shares when Stock Connect is not trading.
| Gallery Trust | October 31, 2024 |
NOTES TO FINANCIAL STATEMENTS (continued)
Non-diversification Risk
The Global Equity Value Fund is classified as “non-diversified,” which means it may invest a larger percentage of its assets in a smaller number of issuers than diversified funds. To the extent the Fund invests its assets in a smaller number of issuers, the Fund will be more susceptible to negative events affecting those issuers than diversified funds.
Market Risk
The prices of and the income generated by a Fund’s securities may decline in response to, among other things, investor sentiment, general economic and market conditions, regional or global instability, and currency and interest rate fluctuations. In addition, the impact of any epidemic, pandemic or natural disaster, or widespread fear that such events may occur, could negatively affect the global economy, as well as the economies of individual countries, the financial performance of individual companies and sectors, and the markets in general in significant and unforeseen ways. Any such impact could adversely affect the prices and liquidity of the securities and other instruments in which a Fund invests, which in turn could negatively impact the Fund’s performance and cause losses on your investment in the Fund. Similarly, the impact of any epidemic, pandemic or natural disaster, or widespread fear that such events may occur, could negatively affect the global economy, as well as the economies of individual countries, the financial performance of individual companies and sectors, and the markets in general in significant and unforeseen ways. Any such impact could adversely affect the prices and liquidity of the securities and other instruments in which the Fund invests, which in turn could negatively impact the Fund’s performance and cause losses on your investment in the Fund.
| Gallery Trust | October 31, 2024 |
NOTES TO FINANCIAL STATEMENTS (continued)
10. Indemnifications
In the normal course of business, the Funds enter into contracts that provide general indemnifications. The Funds’ maximum exposure under these arrangements is dependent on future claims that may be made against the Funds and, therefore, cannot be established; however, based on experience, the risk of loss from such claims is considered remote.
11. Borrowing from banks
The Funds have access to custodian overdraft facilities. A Fund may have utilized the overdraft facility and incurred an interest expense, which is disclosed on the fund’s Statement of Operations, if any. The interest expense is determined based on a negotiated rate above the current Federal Funds Rate. For the year ended October 31, 2024, none of the Funds incurred any interest expense.
12. Concentration of Shareholders
At October 31, 2024, the percentage of total shares outstanding held by a limited number of shareholders owning 10% or greater aggregate total shares for each Fund, which were comprised of omnibus accounts that were held on behalf of various individual shareholders was as follows:
| | No. of Shareholders | % Ownership |
| International Value Equity Fund | 3 | 63% |
| Emerging Markets Value Equity Fund | 2 | 83% |
| Global Listed Infrastructure Fund | 1 | 100% |
| Global Equity Value Fund | 2 | 84% |
13. New Accounting Pronouncement
In November 2023, the Financial Accounting Standards Board issued Accounting Standards Update No. 2023-07 (“ASU 2023-07”), Segment Reporting (“Topic 280”). ASU 2023-07 clarifies the guidance in Topic 280, which requires public entities to provide disclosures of significant segment expenses and other segment items. The guidance requires public entities to provide in interim periods all disclosures about a reportable segment’s profit or loss and assets that are currently required annually and also applies to public entities with a single reportable segment. Entities are permitted to disclose more than one measure of a segment’s profit or loss if such measures are used by the Chief Operating Decision Maker to allocate resources and assess performance, as long as at least one of those measures is determined in a way that is most consistent with the measurement principles used to measure the corresponding amounts in the consolidated financial statements. The amendments in ASU 2023-07 are effective for fiscal years beginning after December 15, 2023, and interim periods within fiscal years beginning after December 15, 2024. Early adoption is permitted. Management is currently evaluating the implications, if any, of the additional requirements and their impact on a Fund’s financial statements.
| Gallery Trust | October 31, 2024 |
NOTES TO FINANCIAL STATEMENTS (continued)
14. Subsequent events
The Funds have evaluated the need for disclosures and/or adjustments resulting from subsequent events through the date the financials were issued. Based on this evaluation, no disclosures and/or adjustments were required to the financial statements.
| Gallery Trust | October 31, 2024 |
REPORT OF INDEPENDENT REGISTERED PUBLIC ACCOUNTING FIRM
To the Board of Trustees of Gallery Trust and Shareholders of Mondrian International Value Equity Fund, Mondrian Emerging Markets Value Equity Fund, Mondrian Global Listed Infrastructure Fund and Mondrian Global Equity Value Fund
Opinions on the Financial Statements
We have audited the accompanying statements of assets and liabilities, including the schedules of investments, of Mondrian International Value Equity Fund, Mondrian Emerging Markets Value Equity Fund, Mondrian Global Listed Infrastructure Fund and Mondrian Global Equity Value Fund (constituting Gallery Trust, hereafter collectively referred to as the "Funds") as of October 31, 2024, the related statements of operations for the year ended October 31, 2024, the statements of changes in net assets for each of the two years in the period ended October 31, 2024, including the related notes, and the financial highlights for each of the periods indicated therein (collectively referred to as the “financial statements”). In our opinion, the financial statements present fairly, in all material respects, the financial position of each of the Funds as of October 31, 2024, the results of each of their operations for the year then ended, the changes in each of their net assets for each of the two years in the period ended October 31, 2024 and each of the financial highlights for each of the periods indicated therein in conformity with accounting principles generally accepted in the United States of America.
Basis for Opinions
These financial statements are the responsibility of the Funds’ management. Our responsibility is to express an opinion on the Funds’ financial statements based on our audits. We are a public accounting firm registered with the Public Company Accounting Oversight Board (United States) (PCAOB) and are required to be independent with respect to the Funds in accordance with the U.S. federal securities laws and the applicable rules and regulations of the Securities and Exchange Commission and the PCAOB.
We conducted our audits of these financial statements in accordance with the standards of the PCAOB. Those standards require that we plan and perform the audits to obtain reasonable assurance about whether the financial statements are free of material misstatement, whether due to error or fraud.
Our audits included performing procedures to assess the risks of material misstatement of the financial statements, whether due to error or fraud, and performing procedures that respond to those risks. Such procedures included examining, on a test basis, evidence regarding the amounts and disclosures in the financial statements. Our audits also included evaluating the accounting principles used and significant estimates made by management, as well as evaluating the overall presentation of the financial statements. Our procedures included confirmation of securities owned as of October 31, 2024 by correspondence with the custodian and brokers; when replies were not received from brokers, we performed other auditing procedures. We believe that our audits provide a reasonable basis for our opinions.
| Gallery Trust | October 31, 2024 |
REPORT OF INDEPENDENT REGISTERED PUBLIC ACCOUNTING FIRM
/s/ PricewaterhouseCoopers LLP
Philadelphia, Pennsylvania
December 23, 2024
We have served as the auditor of one or more investment companies in Mondrian Investment Partners Limited since 2016.
| Gallery Trust | October 31, 2024
(Unaudited) |
NOTICE TO SHAREHOLDERS
For shareholders that do not have an October 31, 2024 tax year end, this notice is for informational purposes only. For shareholders with an October 31, 2024 tax year end, please consult your tax advisor as to the pertinence of this notice. For the fiscal year ended October 31, 2024, the Funds are designating the following items with regard to distributions paid during the year.
Return of Capital | Ordinary Income Distributions | Long-Term Capital Gain Distributions | Total Distributions | Qualifying for Corporate Dividends Received Deduction (1) | Qualifying Dividend Income (2) | U.S. Government Interest (3) | Foreign Investors |
Interest Related Dividends (4) | Short-Term Capital Gain Dividends (5) | Foreign Tax Credit (6) |
| Mondrian International Value Equity Fund | | | | | | |
| 0.00% | 91.44% | 8.56% | 100.00% | 0.00% | 84.77% | 0.00% | 0.00% | 100.00% | 7.16% |
| Mondrian Emerging Markets Value Equity Fund | | | | | | |
| 0.00% | 100.00% | 0.00% | 100.00% | 0.13% | 81.47% | 0.00% | 0.00% | 0.00% | 9.92% |
| Mondrian Global Listed Infrastructure Fund | | | | | | |
| 0.00% | 64.37% | 35.63% | 100.00% | 14.72% | 97.94% | 0.00% | 0.00% | 100.00% | 5.83% |
| Mondrian Global Equity Value Fund | | | | | | | |
| 0.00% | 100.00% | 0.00% | 100.00% | 34.97% | 100.00% | 0.00% | 0.00% | 0.00% | 0.00% |
| (1) | Qualifying dividends represent dividends which qualify for the corporate dividends received deduction and is reflected as a percentage of ordinary income distributions (the total of short-term capital gain and net investment income distributions). |
| (2) | The percentage in this column represents the amount of “Qualifying Dividend Income” as created by the Jobs and Growth Tax Relief Reconciliation Act of 2003 and is reflected as a percentage of ordinary income distributions (the total of short-term capital gain and net investment income distributions). It is the intention of the Fund to designate the maximum amount permitted by law. |
| (3) | “U.S. Government Interest” represents the amount of interest that was derived from direct U.S. Government obligations and distributed during the fiscal year. This amount is reflected as a percentage of ordinary income. Generally, interest from direct U.S. Government obligations is exempt from state income tax. However, for shareholders of the Fund who are residents of California, Connecticut and New York, the statutory threshold requirements were not satisfied to permit exemption of these amounts from state income. |
| (4) | The percentage in this column represents the amount of “Interest Related Dividends” and is reflected as a percentage of ordinary income distributions. Interest related dividends are exempted from U.S. withholding tax when paid to foreign investors. |
| (5) | The percentage in this column represents the amount of “Short-Term Capital Gain Dividends” and is reflected as a percentage of short-term capital gain distributions that is exempted from U.S. withholding tax when paid to foreign investors. |
| (6) | The percentage in this column represents the amount of “Qualifying Foreign Taxes” as a percentage of ordinary distributions during the fiscal year ended October 31, 2024. The International Value Equity Fund, Emerging Markets Value Equity Fund, and Global Listed Infrastructure Fund intend to pass through a Foreign Tax Credit to shareholders for fiscal year ended 2024. The total amounts of foreign source income are $29,805,506, $680,415 and $50,199 respectively. The total amounts of foreign tax paid are $2,240,371, $67,247 and $5,877, respectively. Your allocation share of the foreign tax credit will be reported on form 1099-DIV. |
| Gallery Trust | October 31, 2024
(Unaudited) |
NOTICE TO SHAREHOLDERS (continued)
The information reported herein may differ from the information and distributions taxable to the shareholders for the calendar year ending December 31, 2024. Complete information will be computed and reported in conjunction with your 2024 Form 1099-DIV.
| FUND INFORMATION | |
| | |
| Registered office | P.O. Box 588 |
| | Portland, ME 04112 |
| | |
| Adviser | Mondrian Investment Partners Limited |
| | 10 Gresham Street, 5th Floor |
| | London, England EC2V 7JD |
| | |
| Distributor | SEI Investments Distribution Co. |
| | One Freedom Valley Drive |
| | Oaks, PA 19456 |
| | |
| Administrator | SEI Investments Global Funds Services |
| | One Freedom Valley Drive |
| | Oaks, PA 19456 |
| | |
| Legal Counsel | Morgan, Lewis & Bockius LLP |
| | 2222 Market Street |
| | Philadelphia, PA 19103 |
| | |
| Custodian | Brown Brothers Harriman & Co |
| | 40 Water Street |
| | Boston, MA 02109 |
| | |
| Transfer Agent | Apex Fund Services |
| | Three Canal Plaza |
| | Portland, ME 04101 |
| | |
| Independent Registered | PricewaterhouseCoopers LLP |
| Public Accounting Firm | 2001 Market Street |
| | Philadelphia, PA 19103 |
;
MON-AR-001-0900
Item 8. Changes in and Disagreements with Accountants for Open-End Management Investment Companies.
There were no changes in or disagreements with accountants on accounting and financial disclosure during the period covered by the report.
Item 9. Proxy Disclosures for Open-End Management Investment Companies.
There were no matters submitted to a vote of shareholders during the period covered by this report.
Item 10. Remuneration Paid to Directors, Officers, and Others of Open-End Management Investment Companies.
No remuneration was paid by the company during the period covered by the report to any Officers of the Trust, other than as disclosed as part of the financial statements included above in Item 7.
Item 11. Statement Regarding Basis for Approval of Investment Advisory Contract.
The disclosure regarding the Approval of Advisory Agreement, if applicable, is included as part of the financial statements included above in Item 7.
Item 12. Disclosure of Proxy Voting Policies and Procedures for Closed-End Management Investment Companies.
Not applicable to open-end management investment companies.
Item 13. Portfolio Managers of Closed-End Management Investment Companies.
Not applicable to open-end management investment companies.
Item 14. Purchases of Equity Securities by Closed-End Management Company and Affiliated Purchasers.
Not applicable to open-end management investment companies.
Item 15. Submission of Matters to a Vote of Security Holders.
There have been no changes to the procedures by which shareholders may recommend nominees to the Registrant’s Board of Trustees during the period covered by this report.
Item 16. Controls and Procedures.
(a) The Registrant's principal executive and principal financial officers, or persons performing similar functions, have concluded that the Registrant's disclosure controls and procedures, as defined in Rule 30a-3(c) under the Act (17 CFR § 270.30a-3(c)), as of a date within 90 days of the filing date of the report, are effective based on the evaluation of these controls and procedures required by Rule 30a-3(b) under the Act (17 CFR § 270.30a-3(b)) and Rule 13a-15(b) or Rule 15d-15(b) under the Securities Exchange Act of 1934, as amended (17 CFR § 240.13a-15(b) or § 240.15d-15(b)).
(b) There has been no change in the Registrant's internal control over financial reporting (as defined in Rule 30a-3(d) under the Act (17 CFR § 270.30a-3(d)) that occurred during the period covered by this report that has materially affected, or is reasonably likely to materially affect, the Registrant's internal control over financial reporting.
Item 17. Disclosure of Securities Lending Activities for Closed-End Management Investment Companies.
Not applicable to open-end management investment companies.
Item 18. Recovery of Erroneously Awarded Compensation.
Item 19. Exhibits.
(a)(1) Code of Ethics attached hereto.
(a)(2) Not applicable.
(a)(3) A separate certification for the principal executive officer and the principal financial officer of the Registrant, as required by Rule 30a-2(a) under the Act (17 CFR § 270.30a-2(a)), are filed herewith.
(a)(4) Not applicable.
(b) Officer certifications, as required by Rule 30a-2(b) under the Act (17 CFR § 270.30a-2(b)), also accompany this filing as exhibits.
SIGNATURES
Pursuant to the requirements of the Securities Exchange Act of 1934 and the Investment Company Act of 1940, the Registrant has duly caused this report to be signed on its behalf by the undersigned, thereunto duly authorized.
| (Registrant) | | Gallery Trust | |
| | | | |
| By (Signature and Title) | | /s/ Michael Beattie | |
| | | Michael Beattie | |
| | | President | |
| Date: January 7, 2025 | | | |
Pursuant to the requirements of the Securities Exchange Act of 1934 and the Investment Company Act of 1940, this report has been signed below by the following persons on behalf of the Registrant and in the capacities and on the dates indicated.
| By (Signature and Title) | | /s/ Michael Beattie | |
| | | Michael Beattie | |
| | | President | |
| Date: January 7, 2025 | | | |
| By (Signature and Title) | | /s/ Andrew Metzger | |
| | | Andrew Metzger | |
| | | Treasurer, Controller, and CFO | |
| Date: January 7, 2025 | | | |