* On March 14, 2016, The International Equity Portfolio, a series of Delaware Pooled Trust (the “International Equity Predecessor Fund”) was reorganized into the Mondrian International Equity Fund. Inception date of the Predecessor Fund was February 4, 1992. Information presented from February 4, 1992 to March 14, 2016 is that of the International Equity Predecessor Fund.
The performance data quoted herein represents past performance and the return and value of an investment in the Fund will fluctuate so that, when redeemed, it may be worth less than its original cost. Past performance is no guarantee of future performance and should not be considered as a representation of the future results of the Fund. The Fund’s performance assumes the reinvestment of dividends and capital gains. Index returns assume reinvestment of dividends and, unlike a fund’s returns, do not reflect any fees or expenses. If such fees and expenses were included in the index returns, the performance would have been lower. Please note that one cannot invest directly in an unmanaged index.
There are no assurances that the Fund will meet its stated objectives. The Fund’s holdings and allocations are subject to change because it is actively managed and should not be considered recommendations to buy individual securities.
Returns shown do not reflect the deduction of taxes that a shareholder would pay on Fund distributions or the redemption of Fund shares. If the Adviser had not limited certain expenses, the Fund’s total return would have been lower.
See definition of the comparative index on page 3.
| Gallery Trust | | Mondrian Emerging Markets Value |
| | | |
| | October 31, 2021 (Unaudited) |
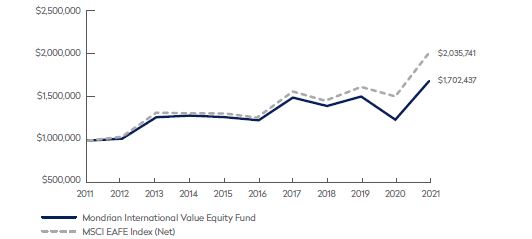
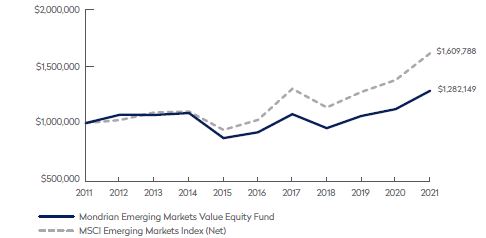
Growth of a $1,000,000 Investment
| | AVERAGE ANNUAL TOTAL RETURN FOR
THE YEAR ENDED OCTOBER 31, 2021* |
| | 1 Year | 3 Years | 5 Years | 10 Years |
| Mondrian Emerging Market Value Equity Fund | 14.27% | 10.30% | 6.88% | 2.52% |
| MSCI Emerging Markets Index (Net) | 16.96% | 12.30% | 9.39% | 4.88% |
* On September 24, 2018, the Laudus Mondrian Emerging Markets Fund (the “Emerging Markets Predecessor Fund”) was reorganized into the Mondrian Emerging Markets Equity Fund. Inception date of the Emerging Markets Predecessor Fund was November 2, 2007. Information presented from November 2, 2007 to September 24, 2018 is that of the Emerging Markets Predecessor Fund.
The performance data quoted herein represents past performance and the return and value of an investment in the Fund will fluctuate so that, when redeemed, it may be worth less than its original cost. Past performance is no guarantee of future performance and should not be considered as a representation of the future results of the Fund. The Fund’s performance assumes the reinvestment of dividends and capital gains. Index returns assume reinvestment of dividends and, unlike a fund’s returns, do not reflect any fees or expenses. If such fees and expenses were included in the index returns, the performance would have been lower. Please note that one cannot invest directly in an unmanaged index.
There are no assurances that the Fund will meet its stated objectives. The Fund’s holdings and allocations are subject to change because it is actively managed and should not be considered recommendations to buy individual securities.
Returns shown do not reflect the deduction of taxes that a shareholder would pay on Fund distributions or the redemption of Fund shares. If the Adviser had not limited certain expenses, the Fund’s total return would have been lower.
See definition of the comparative index on page 5.
| Gallery Trust | | Mondrian International Government |
| | | |
| | October 31, 2021 (Unaudited) |
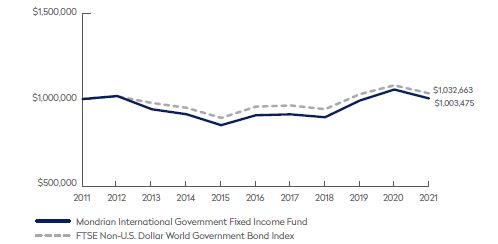
Growth of a $1,000,000 Investment
| | AVERAGE ANNUAL TOTAL RETURN FOR THE YEAR ENDED OCTOBER 31, 2021* |
| | 1 Year | 3 Years | 5 Years | 10 Years |
| Mondrian International Government Fixed Income Fund | -4.88% | 3.91% | 2.07% | 0.03% |
| FTSE Non-U.S. Dollar World Government Bond | -4.32% | 3.15% | 1.56% | 0.32% |
* On September 24, 2018, the Laudus Mondrian International Government Fixed Income Fund (the “Fixed Income Predecessor Fund”) was reorganized into the Mondrian International Government Fixed Income Fund. Inception date of the Fixed Income Predecessor Fund was November 2, 2007. Information presented from November 2, 2007 to September 24, 2018 is that of the Fixed Income Predecessor Fund.
The performance data quoted herein represents past performance and the return and value of an investment in the Fund will fluctuate so that, when redeemed, it may be worth less than its original cost. Past performance is no guarantee of future performance and should not be considered as a representation of the future results of the Fund. The Fund’s performance assumes the reinvestment of dividends and capital gains. Index returns assume reinvestment of dividends and, unlike a fund’s returns, do not reflect any fees or expenses. If such fees and expenses were included in the index returns, the performance would have been lower. Please note that one cannot invest directly in an unmanaged index.
There are no assurances that the Fund will meet its stated objectives. The Fund’s holdings and allocations are subject to change because it is actively managed and should not be considered recommendations to buy individual securities.
Returns shown do not reflect the deduction of taxes that a shareholder would pay on Fund distributions or the redemption of Fund shares. If the Adviser had not limited certain expenses, the Fund’s total return would have been lower.
See definition of the comparative index on page 6.
| Gallery Trust | | Mondrian U.S. Small Cap Equity Fund |
| | | October 31, 2021 (Unaudited) |
| | |
Growth of a $1,000,000 Investment
| | AVERAGE TOTAL RETURN FOR THE YEAR ENDED OCTOBER 31, 2021* |
| | 1 Year | Cumulative Inception to Date* |
| Mondrian U.S. Small Cap Equity Fund | 41.58% | 9.27% |
| Russell 2000 Index | 50.80% | 20.98% |

* The fund commenced operations on December 17, 2018.
The performance data quoted herein represents past performance and the return and value of an investment in the Fund will fluctuate so that, when redeemed, it may be worth less than its original cost. Past performance is no guarantee of future performance and should not be considered as a representation of the future results of the Fund. The Fund’s performance assumes the reinvestment of dividends and capital gains. Index returns assume reinvestment of dividends and, unlike a fund’s returns, do not reflect any fees or expenses. If such fees and expenses were included in the index returns, the performance would have been lower. Please note that one cannot invest directly in an unmanaged index.
There are no assurances that the Fund will meet its stated objectives. The Fund’s holdings and allocations are subject to change because it is actively managed and should not be considered recommendations to buy individual securities.
Returns shown do not reflect the deduction of taxes that a shareholder would pay on Fund distributions or the redemption of Fund shares. If the Adviser had not limited certain expenses, the Fund’s total return would have been lower.
See definition of the comparative index on page 7.
| Gallery Trust | | |
| | | |
| | October 31, 2021 (Unaudited) |
Growth of a $1,000,000 Investment
| | AVERAGE TOTAL RETURN FOR THE YEAR ENDED OCTOBER 31, 2021* |
| | 1 Year | Cumulative Inception to Date* |
| Mondrian Global Listed Infrastructure Fund | 25.70% | 11.47% |
| MSCI ACWI Core Infrastructure Index | 37.28% | 20.17% |
* The fund commenced operations on December 17, 2018.
The performance data quoted herein represents past performance and the return and value of an investment in the Fund will fluctuate so that, when redeemed, it may be worth less than its original cost. Past performance is no guarantee of future performance and should not be considered as a representation of the future results of the Fund. The Fund’s performance assumes the reinvestment of dividends and capital gains. Index returns assume reinvestment of dividends and, unlike a fund’s returns, do not reflect any fees or expenses. If such fees and expenses were included in the index returns, the performance would have been lower. Please note that one cannot invest directly in an unmanaged index.
There are no assurances that the Fund will meet its stated objectives. The Fund’s holdings and allocations are subject to change because it is actively managed and should not be considered recommendations to buy individual securities.
Returns shown do not reflect the deduction of taxes that a shareholder would pay on Fund distributions or the redemption of Fund shares. If the Adviser had not limited certain expenses, the Fund’s total return would have been lower.
See definition of the comparative index on page 9.
| Gallery Trust | | |
| | | |
| | October 31, 2021 (Unaudited) |
Growth of a $1,000,000 Investment
| | AVERAGE TOTAL RETURN FOR THE YEAR ENDED OCTOBER 31, 2021* |
| | 1 Year | Cumulative Inception to Date* |
| Mondrian Global Equity Value Fund | 28.09% | 22.39% |
| MSCI ACWI Index (Net) | 37.28% | 31.92% |
* The fund commenced operations on June 30, 2020.
The performance data quoted herein represents past performance and the return and value of an investment in the Fund will fluctuate so that, when redeemed, it may be worth less than its original cost. Past performance is no guarantee of future performance and should not be considered as a representation of the future results of the Fund. The Fund’s performance assumes the reinvestment of dividends and capital gains. Index returns assume reinvestment of dividends and, unlike a fund’s returns, do not reflect any fees or expenses. If such fees and expenses were included in the index returns, the performance would have been lower. Please note that one cannot invest directly in an unmanaged index.
There are no assurances that the Fund will meet its stated objectives. The Fund’s holdings and allocations are subject to change because it is actively managed and should not be considered recommendations to buy individual securities.
Returns shown do not reflect the deduction of taxes that a shareholder would pay on Fund distributions or the redemption of Fund shares. If the Adviser had not limited certain expenses, the Fund’s total return would have been lower.
See definition of the comparative index on page 11.
| Gallery Trust | | Mondrian International Value |
| | | |
| | |
| COMMON STOCK — 98.9% | | | | | | |
| | | | | | | |
| DENMARK — 1.1% | | | | | | |
ISS A/S * | | | 388,556 | | | | | |
| Total Denmark | | | | | | | | |
| FRANCE — 8.5% | | | | | | | | |
Bouygues SA | | | 69,477 | | | | 2,811,046 | |
Cie de Saint-Gobain SA | | | 208,006 | | | | 14,321,528 | |
Dassault Aviation SA | | | 75,616 | | | | 7,888,959 | |
Sanofi SA | | | 251,472 | | | | 25,125,397 | |
Societe Generale SA | | | 315,750 | | | | | |
| Total France | | | | | | | | |
| GERMANY — 7.2% | | | | | | | | |
Allianz SE | | | 73,503 | | | | 17,091,646 | |
Continental AG * | | | 139,665 | | | | 16,390,718 | |
Evonik Industries AG | | | 496,427 | | | | 16,079,862 | |
Vitesco Technologies Group * | | | 27,684 | | | | | |
| Total Germany | | | | | | | | |
The accompanying notes are an integral part of the financial statements.
| Gallery Trust | | Mondrian International Value |
| | | |
| | |
| COMMON STOCK — continued | | | | | | |
| | | | | | | |
| HONG KONG — 5.8% | | | | | | |
CK Hutchison Holdings Ltd | | | 3,074,500 | | | $ | 20,686,341 | |
Jardine Matheson Holdings Ltd | | | 165,815 | | | | 9,605,663 | |
WH Group Ltd | | | 15,432,639 | | | | | |
| Total Hong Kong | | | | | | | | |
| ITALY — 7.3% | | | | | | | | |
Enel SpA | | | 2,815,250 | | | | 23,549,100 | |
Eni SpA | | | 889,647 | | | | 12,756,698 | |
Snam SpA | | | 2,722,966 | | | | | |
| Total Italy | | | | | | | | |
| JAPAN — 28.0% | | | | | | | | |
| Coca-Cola Bottlers Japan Holdings Inc | | | 561,700 | | | | 7,707,820 | |
FUJIFILM Holdings Corp | | | 245,400 | | | | 18,949,466 | |
Fujitsu Ltd | | | 49,300 | | | | 8,488,813 | |
Hitachi Ltd | | | 122,900 | | | | 7,067,222 | |
Honda Motor Co Ltd | | | 693,100 | | | | 20,365,799 | |
Kyocera Corp | | | 288,200 | | | | 16,827,997 | |
Mitsubishi Electric Corp | | | 904,000 | | | | 12,095,635 | |
| Nippon Telegraph & Telephone Corp | | | 654,500 | | | | 18,307,050 | |
Otsuka Holdings Co Ltd | | | 238,600 | | | | 9,407,926 | |
Sekisui Chemical Co Ltd | | | 748,600 | | | | 12,249,519 | |
Sony Corp Group | | | 197,600 | | | | 22,780,996 | |
Takeda Pharmaceutical Co Ltd | | | 594,800 | | | | 16,715,459 | |
Tokio Marine Holdings Inc | | | 244,152 | | | | 12,848,640 | |
Toyota Industries Corp | | | 177,800 | | | | | |
| Total Japan | | | | | | | | |
| NETHERLANDS — 3.2% | | | | | | | | |
Royal Dutch Shell PLC Class B | | | 973,564 | | | | | |
| Total Netherlands | | | | | | | | |
The accompanying notes are an integral part of the financial statements.
| Gallery Trust | | Mondrian International Value |
| | | |
| | |
| COMMON STOCK — continued | | | | | | |
| | | | | | | |
| SINGAPORE — 4.0% | | | | | | |
| Singapore Telecommunications Ltd | | | 3,141,602 | | | $ | 5,824,253 | |
United Overseas Bank Ltd | | | 1,147,040 | | | | | |
| Total Singapore | | | | | | | | |
| SPAIN — 3.6% | | | | | | | | |
Banco Santander SA | | | 6,042,829 | | | | 22,888,075 | |
Red Electrica Corp SA | | | 134,012 | | | | | |
| Total Spain | | | | | | | | |
| SWEDEN — 1.8% | | | | | | | | |
Telia Co AB | | | 3,168,799 | | | | | |
| Total Sweden | | | | | | | | |
| SWITZERLAND — 3.4% | | | | | | | | |
Novartis AG | | | 225,748 | | | | 18,649,605 | |
Zurich Insurance Group AG | | | 12,350 | | | | | |
| Total Switzerland | | | | | | | | |
| TAIWAN — 2.1% | | | | | | | | |
| Taiwan Semiconductor Manufacturing Co Ltd | | | 696,000 | | | | | |
| Total Taiwan | | | | | | | | |
| UNITED KINGDOM — 22.9% | | | | | | | | |
BP PLC | | | 3,447,515 | | | | 16,522,783 | |
GlaxoSmithKline PLC | | | 1,246,533 | | | | 25,735,865 | |
Imperial Brands PLC | | | 681,010 | | | | 14,371,389 | |
Kingfisher PLC | | | 3,205,162 | | | | 14,694,530 | |
Lloyds Banking Group PLC | | | 35,537,811 | | | | 24,424,646 | |
SSE PLC | | | 1,059,120 | | | | 23,821,866 | |
Tesco PLC | | | 4,373,921 | | | | 16,156,032 | |
The accompanying notes are an integral part of the financial statements.
| Gallery Trust | | Mondrian International Value |
| | | |
| | |
| COMMON STOCK — continued | | | | | | |
| | | | | | | |
| UNITED KINGDOM (continued) | | | | | | |
Travis Perkins PLC | | | 304,555 | | | $ | 6,431,208 | |
Wickes Group PLC | | | 358,131 | | | | 1,050,818 | |
WPP PLC | | | 1,364,461 | | | | | |
| Total United Kingdom | | | | | | | | |
| Total Common Stock | | | | | | | | |
(Cost $654,057,990) | | | | | | | | |
| Total Value of Securities — 98.9% | | | | | | | | |
(Cost $654,057,990) | | | | | | | | |
Percentages are based on Net Assets of $710,401,988.
| * | Non-income producing security. |
Ltd. — Limited
PLC — Public Limited Company
As of October 31, 2021, all of the Fund’s investments were considered Level 1, in accordance the authoritative guidance on fair value measurements and disclosure under U.S. GAAP.
For the year ended October 31, 2021, there were no transfers in or out of Level 3.
For more information on valuation inputs, see Note 2 in Notes to Financial Statements.
The accompanying notes are an integral part of the financial statements.
| Gallery Trust | | Mondrian Emerging Markets Value |
| | | |
| | |
SCHEDULE OF INVESTMENTS
| COMMON STOCK — 92.1% | | | | | | |
| | | | | | | |
| BRAZIL — 3.4% | | | | | | |
Hypera SA | | | 74,900 | | | $ | 371,859 | |
Itau Unibanco Holding SA ADR | | | 42,355 | | | | 172,385 | |
Suzano Papel e Celulose SA * | | | 36,600 | | | | | |
| Total Brazil | | | | | | | | |
| CHINA — 36.8% | | | | | | | | |
Alibaba Group Holding Ltd * | | | 86,192 | | | | 1,805,706 | |
Autohome ADR | | | 13,876 | | | | 546,021 | |
Baidu Inc ADR * | | | 5,156 | | | | 836,509 | |
| China Medical System Holdings Ltd | | | 102,000 | | | | 173,835 | |
| China Merchants Bank Co Ltd Class H | | | 90,500 | | | | 762,454 | |
| CSPC Pharmaceutical Group Ltd | | | 557,520 | | | | 583,280 | |
| Gree Electric Appliances Inc Class A | | | 83,200 | | | | 476,502 | |
| Hengan International Group Co Ltd | | | 56,500 | | | | 295,190 | |
| Jiangsu Yanghe Brewery Joint-Stock Class A | | | 1,312 | | | | 38,171 | |
| LONGi Green Energy Tech Co Ltd Class A | | | 29,000 | | | | 442,706 | |
Midea Group Co Ltd Class A | | | 61,803 | | | | 664,165 | |
| Ping An Insurance Group Co of China Ltd Class H | | | 183,500 | | | | 1,318,379 | |
Tencent Holdings Ltd | | | 13,600 | | | | 840,769 | |
The accompanying notes are an integral part of the financial statements.
| Gallery Trust | | Mondrian Emerging Markets Value |
| | | |
| | |
| COMMON STOCK — continued | | | | | | |
| | | | | | | |
| CHINA (continued) | | | | | | |
| Tingyi Cayman Islands Holding Corp Class H | | | 254,000 | | | | | |
| Total China | | | | | | | | |
| HONG KONG — 3.6% | | | | | | | | |
NetEase Inc | | | 26,986 | | | | 533,095 | |
WH Group Ltd | | | 545,228 | | | | | |
| Total Hong Kong | | | | | | | | |
| INDIA — 9.2% | | | | | | | | |
HCL Technologies Ltd | | | 21,700 | | | | 331,450 | |
| Housing Development Finance Corp Ltd | | | 22,716 | | | | 862,969 | |
Infosys Ltd Sponsored ADR | | | 12,040 | | | | 268,251 | |
Reliance Industries Ltd | | | 25,260 | | | | | |
| Total India | | | | | | | | |
| INDONESIA — 2.8% | | | | | | | | |
| Bank Rakyat Indonesia Persero Tbk PT | | | 2,353,239 | | | | | |
| Total Indonesia | | | | | | | | |
| MEXICO — 1.3% | | | | | | | | |
| Grupo Financiero Banorte SAB de CV Class O | | | 50,147 | | | | | |
| Total Mexico | | | | | | | | |
| PERU — 2.5% | | | | | | | | |
Credicorp Ltd | | | 4,895 | | | | | |
| Total Peru | | | | | | | | |
| RUSSIA — 3.1% | | | | | | | | |
LUKOIL PJSC Sponsored ADR | | | 5,078 | | | | 518,108 | |
Polymetal International PLC | | | 14,512 | | | | | |
| Total Russia | | | | | | | | |
| SOUTH AFRICA — 2.3% | | | | | | | | |
Mondi PLC | | | 22,962 | | | | | |
| Total South Africa | | | | | | | | |
The accompanying notes are an integral part of the financial statements.
| Gallery Trust | | Mondrian Emerging Markets Value |
| | | |
| | |
| COMMON STOCK — continued | | | | | | |
| | | | | | | |
| SOUTH KOREA — 6.6% | | | | | | |
LG Chem Ltd | | | 171 | | | $ | 122,336 | |
Samsung Electronics Co Ltd | | | 2,597 | | | | 155,124 | |
| Samsung Fire & Marine Insurance Co Ltd | | | 2,032 | | | | 401,688 | |
Shinhan Financial Group Co Ltd | | | 12,977 | | | | 424,775 | |
SK Hynix Inc | | | 6,320 | | | | | |
| Total South Korea | | | | | | | | |
| TAIWAN — 16.9% | | | | | | | | |
Alchip Technologies Ltd | | | 9,000 | | | | 333,351 | |
| ASE Technology Holding Co Ltd | | | 55,000 | | | | 197,386 | |
CTBC Financial Holding Co Ltd | | | 361,000 | | | | 301,174 | |
Delta Electronics Inc | | | 53,000 | | | | 466,943 | |
| Hon Hai Precision Industry Co Ltd | | | 244,000 | | | | 938,850 | |
| Taiwan Semiconductor Manufacturing Co Ltd | | | 95,000 | | | | | |
| Total Taiwan | | | | | | | | |
| UNITED KINGDOM — 2.1% | | | | | | | | |
Unilever PLC | | | 9,884 | | | | | |
| Total United Kingdom | | | | | | | | |
| UNITED STATES — 1.5% | | | | | | | | |
| Financials — 0.1% | | | | | | | | |
XP Class A * | | | 977 | | | | | |
| Materials — 1.4% | | | | | | | | |
Barrick Gold Corp US | | | 18,849 | | | | | |
| Total United States | | | | | | | | |
| Total Common Stock | | | | | | | | |
(Cost $21,694,369) | | | | | | | | |
| PREFERRED STOCK — 6.9% | | | | | | | | |
| BRAZIL — 0.8% | | | | | | | | |
Itausa SA Pref** | | | 112,900 | | | | | |
The accompanying notes are an integral part of the financial statements.
| Gallery Trust | | Mondrian Emerging Markets Value |
| | | |
| | |
| PREFERRED STOCK — continued | | | | | | |
| | | | | | | |
| SOUTH KOREA — 6.1% | | | | | | |
LG Chem Ltd Pref** | | | 1,349 | | | $ | 442,721 | |
Samsung Electronics Co Ltd** | | | 19,993 | | | | | |
| | | | | | | | | |
| Total Preferred Stock | | | | | | | | |
(Cost $1,534,965) | | | | | | | | |
| Total Value of Securities — 99.0% | | | | | | | | |
(Cost $23,229,334) | | | | | | | | |
Percentages are based on Net Assets of $25,180,181.
| * | Non-income producing security. |
| ** | There is currently no rate available. |
ADR — American Depositary Receipt
Ltd. — Limited
PLC — Public Limited Company
As of October 31, 2021, all of the Fund’s investments were considered Level 1, in accordance the authoritative guidance on fair value measurements and disclosure under U.S. GAAP.
For the year ended October 31, 2021, there were no transfers in or out of Level 3.
For more information on valuation inputs, see Note 2 in Notes to Financial Statements.
The accompanying notes are an integral part of the financial statements.
| Gallery Trust | | Mondrian International Government |
| | | |
| | |
SCHEDULE OF INVESTMENTS
| GLOBAL BONDS — 98.7% | | | | | |
| | Face Amount
| | Value | |
| | (Local Currency)
| | (U.S. $)
| |
| AUSTRALIA — 3.0% | | | | |
| Australia Government Bond | | | | |
4.750%, 04/21/27 | AUD | 211,000 | | $ | 184,681 | |
3.250%, 04/21/25 | AUD | 226,000 | | | 180,942 | |
3.000%, 03/21/47 | AUD | 150,000 | | | | |
| Total Australia | | | | | | |
| AUSTRIA — 3.5% | | | | | | |
| Republic of Austria Government Bond | | | | | | |
6.250%, 07/15/27 | EUR | 355,000 | | | | |
| Total Austria | | | | | | |
| BELGIUM — 4.1% | | | | | | |
| Kingdom of Belgium Government Bond | | | | | | |
1.000%, 06/22/26 (A) | EUR | 530,000 | | | | |
| Total Belgium | | | | | | |
| CANADA — 4.7% | | | | | | |
| Canadian Government Bond | | | | | | |
2.000%, 09/01/23 | CAD | 502,000 | | | 412,587 | |
1.000%, 06/01/27 | CAD | 440,000 | | | | |
| Total Canada | | | | | | |
| FINLAND — 4.1% | | | | | | |
| Finland Government Bond | | | | | | |
0.500%, 09/15/27 (A) | EUR | 539,000 | | | | |
| Total Finland | | | | | | |
| FRANCE — 5.4% | | | | | | |
| French Republic Government Bond OAT | | | | | | |
1.500%, 05/25/31 | EUR | 440,000 | | | 570,449 | |
0.500%, 05/25/25 | EUR | 250,000 | | | | |
| Total France | | | | | | |
The accompanying notes are an integral part of the financial statements.
| Gallery Trust | | Mondrian International Government |
| | | |
| | |
GLOBAL BONDS — continued
| | | | | | |
| | Face Amount | | | Value | |
| | (Local Currency) | | | (U.S. $) | |
GERMANY — 15.5%
| | | | | | |
| Bundesrepublik Deutschland Bundesanleihe | | | | | | |
2.500%, 07/04/44 | EUR | 225,000 | | $
| 407,531 | |
0.250%, 02/15/29 | EUR | 400,000 | | | 479,638 | |
0.000%, 08/15/30 | EUR | 586,000 | | | 690,801 | |
| Bundesschatzanweisungen | | | | | | |
0.000%, 09/16/22 | EUR | 225,000 | | | 261,564 | |
| Kreditanstalt fuer Wiederaufbau | | | | | | |
2.050%, 02/16/26 | JPY | 67,000,000 | | | | |
| Total Germany | | | | | | |
| ITALY — 11.4% | | | | | | |
| Italy Buoni Poliennali Del Tesoro | | | | | | |
2.950%, 09/01/38 (A) | EUR | 550,000 | | | 766,395 | |
2.000%, 02/01/28 | EUR | 550,000 | | | 687,543 | |
1.450%, 05/15/25 | EUR | 308,000 | | | | |
| Total Italy | | | | | | |
| JAPAN — 17.6% | | | | | | |
| Japan Government Thirty Year Bond | | | | | | |
2.400%, 12/20/34 | JPY | 47,500,000 | | | 533,542 | |
0.300%, 06/20/46 | JPY | 94,800,000 | | | 780,084 | |
| Japan Government Twenty Year Bond | | | | | | |
1.600%, 06/20/30 | JPY | 60,000,000 | | | 597,842 | |
0.200%, 06/20/36 | JPY | 105,550,000 | | | | |
| Total Japan | | | | | | |
| MALAYSIA — 2.0% | | | | | | |
| Malaysia Government Bond | | | | | | |
4.254%, 05/31/35 | MYR | 900,000 | | | 221,473 | |
4.181%, 07/15/24 | MYR | 417,000 | | | | |
| Total Malaysia | | | | | | |
| MEXICO — 2.9% | | | | | | |
| Mexican Bonos | | | | | | |
8.000%, 11/07/47 | MXN | 9,590,000 | | | | |
| Total Mexico | | | | | | |
The accompanying notes are an integral part of the financial statements.
| Gallery Trust | | Mondrian International Government |
| | | |
| | |
| GLOBAL BONDS — continued | | | | | |
| | Face Amount | | Value | |
| | (Local Currency) | | (U.S. $) | |
| NETHERLANDS — 4.9% | | | | | |
| Netherlands Government Bond | | | | | |
2.750%, 01/15/47 (A) | EUR | 250,000 | | $ | 471,843 | |
0.500%, 01/15/40 (A) | EUR | 250,000 | | | | |
| Total Netherlands | | | | | | |
| SINGAPORE — 3.0% | | | | | | |
| Singapore Government Bond | | | | | | |
2.875%, 09/01/30 | SGD | 107,000 | | | 85,695 | |
2.250%, 08/01/36 | SGD | 200,000 | | | 150,836 | |
0.500%, 11/01/25 | SGD | 345,000 | | | | |
| Total Singapore | | | | | | |
| SUPRANATIONAL — 12.4% | | | | | | |
| Asian Development Bank | | | | | | |
2.350%, 06/21/27 | JPY | 70,000,000 | | | 700,145 | |
| European Financial Stability Facility | | | | | | |
0.950%, 02/14/28 | EUR | 526,000 | | | 645,392 | |
| European Investment Bank | | | | | | |
2.150%, 01/18/27 | JPY | 65,500,000 | | | | |
| Total Supranational | | | | | | |
| UNITED KINGDOM — 4.2% | | | | | | |
| United Kingdom Gilt | | | | | | |
4.250%, 09/07/39 | GBP | 268,000 | | | 550,066 | |
1.500%, 07/22/47 | GBP | 80,000 | | | | |
| Total United Kingdom | | | | | | |
| Total Global Bonds | | | | | | |
(Cost $15,439,306) | | | | | | |
| Total Value of Securities — 98.7% | | | | | | |
(Cost $15,439,306) | | | | | | |
The accompanying notes are an integral part of the financial statements.
| Gallery Trust | | Mondrian International Government |
| | | |
| | |
A list of the open forward foreign currency exchange contracts held by the Fund at October 31, 2021 is as follows:
| Counterparty | Maturity Date | Currency to Deliver | | Currency to Receive | | | Unrealized Appreciation (Depreciation) | |
| Brown Brothers Harriman | 01/31/22
| USD | 347,712 | | EUR | 298,500 | | | $ | (1,835 | ) |
| Brown Brothers Harriman | 01/31/22 | USD | 954,559 | | GBP | 694,500 | | | | (3,919 | ) |
| Brown Brothers Harriman | 01/31/22 | USD | 322,354 | | NOK | 2,706,500 | | | | (2,306 | ) |
| Brown Brothers Harriman | 01/31/22 | USD | 322,816 | | PLN | 1,286,000 | | | | (1,239 | ) |
| Brown Brothers Harriman | 01/31/22 | JPY | 9,356,000 | | USD | 82,414 | | | | 230 | |
| Brown Brothers Harriman | 01/31/22 | AUD | 218,000 | | USD | 163,832 | | | | (196 | )
|
| Brown Brothers Harriman | 01/31/22 | MXN | 6,591,000 | | USD | 322,021 | | | | 6,625 | |
| Brown Brothers Harriman | 01/31/22 | CAD | 937,500 | | USD | 755,288 | | | | (2,285 | ) |
Brown Brothers Harriman
| 01/31/22 | SGD | 654,500 | | USD | 485,208
| | | | 44 | |
| Net Unrealized Depreciation on Forward Foreign Currency Exchange Contracts | | | | (4,881 | |
Percentages are based on Net Assets of $16,029,353.
| (A) | Securities sold within terms of a private placement memorandum, exempt from registration under Section 144A of the Securities Act of 1933, as amended, and may be sold only to dealers in that program or other “accredited investors.” The total value of securities as of October 31, 2021 was $2,841,969 and represents 17.7% of Net Assets. |
AUD — Australian Dollar
CAD — Canadian Dollar
EUR — Euro
GBP — Pound Sterling
JPY — Japanese Yen
MXN — Mexican Peso
MYR — Malaysian Ringgit
NOK — Norwegian Krone
PLN — Polish Zloty
SGD — Singapore Dollar
USD — United States Dollar
The accompanying notes are an integral part of the financial statements.
| Gallery Trust | | Mondrian International Government |
| | | |
| | |
The following is a list of the inputs used as of October 31, 2021, in valuing the Fund’s investments carried at market value:
| Investments in Securities | | Level 1 | | | Level 2 | | | Level 3 | | | Total | |
| Global Bonds | | | | | | | | | | | | | | | | |
| Total Investments in Securities | | | | | | | | | | | | | | | | |
| Other Financial Instruments | | Level 1 | | | Level 2 | | | Level 3 | | | Total | |
| Forwards Contracts* | | | | | | | | | | | | |
| Unrealized Appreciation | | $ | — | | | $ | 6,899 | | | $ | — | | | $ | 6,899 | |
| Unrealized Depreciation | | | | | | | | | | | | | | | | |
| Total Other Financial Instruments | | | | | | | | | | | | | | | | |
| * | Forward foreign currency exchange contracts are valued at the unrealized appreciation (depreciation) on the instrument. |
For the year ended October 31, 2021, there were no transfers in or out of Level 3.
Amounts designated as “—” are $0 or have been rounded to $0.
For more information on valuation inputs, see Note 2 in Notes to Financial Statements.
The accompanying notes are an integral part of the financial statements.
| Gallery Trust | | Mondrian U.S. Small Cap Equity Fund |
| | | |
| | |
SCHEDULE OF INVESTMENTS
| COMMON STOCK — 98.9% | | | | | | |
| | | | | | | |
| UNITED STATES — 98.9% | | | | | | |
| Consumer Discretionary — 1.8% | | | | | | |
MDC Holdings | | | 652 | | | | | |
| Financials — 12.7% | | | | | | | | |
Houlihan Lokey Inc Class A | | | 536 | | | | 60,075 | |
Main Street Capital | | | 656 | | | | 28,746 | |
Moelis & Company Class A | | | 502 | | | | 36,515 | |
Prog Holdings * | | | 991 | | | | 40,086 | |
Umpqua Holdings | | | 1,441 | | | | 29,468 | |
Wintrust Financial | | | 353 | | | | | |
| | | | | | | | | |
| Health Care — 6.3% | | | | | | | | |
AMN Healthcare Services Inc * | | | 265 | | | | 26,156 | |
iRadimed Corp * | | | 1,274 | | | | 47,546 | |
Supernus Pharmaceuticals * | | | 1,307 | | | | | |
| | | | | | | | | |
| Industrials — 35.1% | | | | | | | | |
AAR Corp * | | | 895 | | | | 31,656 | |
Astronics Corp * | | | 1,913 | | | | 24,678 | |
Barnes Group Inc | | | 801 | | | | 33,594 | |
The accompanying notes are an integral part of the financial statements.
| Gallery Trust | | Mondrian U.S. Small Cap Equity Fund |
| | | |
| | |
| COMMON STOCK — continued | | | | | | |
| | | | | | | |
| UNITED STATES (continued) | | | | | | |
| Industrials (continued) | | | | | | |
Curtiss-Wright | | | 305 | | | $ | 38,942 | |
Douglas Dynamics Inc | | | 1,003 | | | | 42,427 | |
EnerSys | | | 688 | | | | 55,067 | |
GrafTech International Ltd | | | 3,823 | | | | 40,906 | |
Great Lakes Dredge & Dock * | | | 2,266 | | | | 34,489 | |
Kforce Inc | | | 686 | | | | 44,425 | |
Luxfer Holdings PLC | | | 1,649 | | | | 33,161 | |
McGrath RentCorp | | | 445 | | | | 32,102 | |
MSC Industrial Direct Class A | | | 482 | | | | 40,522 | |
Parsons Corp * | | | 1,100 | | | | 38,104 | |
Timken Company | | | 518 | | | | 36,752 | |
TPI Composites * | | | 920 | | | | 30,940 | |
US Ecology Inc * | | | 1,050 | | | | 33,800 | |
Wabash National | | | 2,096 | | | | | |
| | | | | | | | | |
| Information Technology — 24.8% | | | | | | | | |
Advanced Energy Industries Inc | | | 395 | | | | 36,269 | |
Amkor Technology | | | 1,530 | | | | 33,538 | |
Avnet Inc | | | 1,210 | | | | 46,113 | |
CMC Materials Inc | | | 360 | | | | 46,213 | |
Cohu Inc * | | | 1,005 | | | | 32,200 | |
| Comtech Telecommunications Corp | | | 1,640 | | | | 35,375 | |
FormFactor Inc * | | | 905 | | | | 36,001 | |
Knowles * | | | 1,728 | | | | 36,011 | |
Maximus Inc | | | 528 | | | | 44,653 | |
MaxLinear Class A * | | | 338 | | | | 21,294 | |
| Science Applications International | | | 354 | | | | 31,782 | |
Vishay Intertechnology Inc | | | 2,148 | | | | | |
| | | | | | | | | |
| Materials — 12.8% | | | | | | | | |
Avient Corp | | | 813 | | | | 43,804 | |
Glatfelter Corp | | | 2,346 | | | | 38,545 | |
The accompanying notes are an integral part of the financial statements.
| Gallery Trust | | Mondrian U.S. Small Cap Equity Fund |
| | | |
| | |
| COMMON STOCK — continued | | | | | | |
| | | | | | | |
| UNITED STATES (continued) | | | | | | |
| Materials (continued) | | | | | | |
Graphic Packaging Holding Co | | | 2,678 | | | $ | 53,372 | |
Greif Class A | | | 666 | | | | 43,077 | |
Innospec Inc | | | 541 | | | | | |
| | | | | | | | | |
| Real Estate — 5.4% | | | | | | | | |
| Easterly Government Properties Class A REIT | | | 395 | | | | 8,307 | |
Global Medical Inc REIT | | | 2,643 | | | | 43,821 | |
Physicians Realty Trust REIT | | | 2,262 | | | | | |
| | | | | | | | | |
| Total United States | | | | | | | | |
| Total Common Stock | | | | | | | | |
(Cost $1,504,293) | | | | | | | | |
| Total Value of Securities — 98.9% | | | | | | | | |
(Cost $1,504,293) | | | | | | | | |
Percentages are based on Net Assets of $1,777,628.
| * | Non-income producing security. |
Ltd. — Limited
PLC — Public Limited Company
REIT — Real Estate Investment Trust
As of October 31, 2021, all of the Fund’s investments were considered Level 1, in accordance the authoritative guidance on fair value measurements and disclosure under U.S. GAAP.
For the year ended October 31, 2021, there were no transfers in or out of Level 3.
For more information on valuation inputs, see Note 2 in Notes to Financial Statements.
The accompanying notes are an integral part of the financial statements.
SCHEDULE OF INVESTMENTS
| COMMON STOCK — 100.4% | | | | | | |
| | | | | | | |
| CANADA — 4.8% | | | | | | |
Enbridge Inc | | | 1,965 | | | | | |
| Total Canada | | | | | | | | |
| CHILE — 3.2% | | | | | | | | |
Enel Americas SA | | | 483,776 | | | | | |
| Total Chile | | | | | | | | |
| CHINA — 6.4% | | | | | | | | |
Guangdong Investment Ltd | | | 40,000 | | | | 50,383 | |
| Jiangsu Expressway Co Ltd Class H | | | 62,000 | | | | | |
| Total China | | | | | | | | |
| FRANCE — 11.9% | | | | | | | | |
Eiffage SA | | | 670 | | | | 68,901 | |
Rubis SCA | | | 1,953 | | | | 62,515 | |
Veolia Environnement SA | | | 2,210 | | | | | |
| Total France | | | | | | | | |
| INDIA — 4.0% | | | | | | | | |
Power Grid Corp of India Ltd | | | 27,388 | | | | | |
| Total India | | | | | | | | |
| ITALY — 11.0% | | | | | | | | |
Atlantia SpA | | | 3,297 | | | | 63,668 | |
Enel SpA | | | 7,597 | | | | 63,548 | |
The accompanying notes are an integral part of the financial statements.
| COMMON STOCK — continued | | | | | | |
| | | | | | | |
| ITALY (continued) | | | | | | |
Snam SpA | | | 10,770 | | | | | |
| Total Italy | | | | | | | | |
| MALAYSIA — 4.5% | | | | | | | | |
Westports Holdings | | | 70,600 | | | | | |
| Total Malaysia | | | | | | | | |
| MEXICO — 6.9% | | | | | | | | |
| Aeroportuario Centro Norte SAB de CV B Class B * | | | 9,506 | | | | 57,489 | |
| Promotora y Operadora de Infraestructura | | | 8,276 | | | | | |
| Total Mexico | | | | | | | | |
| PORTUGAL — 4.0% | | | | | | | | |
EDP - Energias de Portugal SA | | | 11,991 | | | | | |
| Total Portugal | | | | | | | | |
| SPAIN — 7.1% | | | | | | | | |
Iberdrola SA | | | 3,910 | | | | 46,172 | |
Red Electrica Corp SA | | | 3,647 | | | | | |
| Total Spain | | | | | | | | |
| UNITED KINGDOM — 4.1% | | | | | | | | |
SSE PLC | | | 3,120 | | | | | |
| Total United Kingdom | | | | | | | | |
| UNITED STATES — 32.5% | | | | | | | | |
| Energy — 2.9% | | | | | | | | |
Williams Co Inc | | | 1,736 | | | | | |
| Health Care — 3.9% | | | | | | | | |
HCA Healthcare | | | 267 | | | | | |
| Real Estate — 3.8% | | | | | | | | |
American Tower REIT | | | 228 | | | | | |
| Utilities — 21.9% | | | | | | | | |
Edison International | | | 1,088 | | | | 68,468 | |
Evergy Inc | | | 966 | | | | 61,583 | |
The accompanying notes are an integral part of the financial statements.
| COMMON STOCK — continued | | | | | | |
| | | | | | | |
| UNITED STATES (continued) | | | | | | |
| Utilities (continued) | | | | | | |
Eversource Energy | | | 599 | | | $ | 50,855 | |
OGE Energy | | | 2,034 | | | | 69,299 | |
Portland General Electric Co | | | 1,101 | | | | 54,290 | |
PPL Corporation | | | 2,399 | | | | | |
| | | | | | | | | |
| Total United States | | | | | | | | |
| Total Common Stock | | | | | | | | |
(Cost $1,559,616) | | | | | | | | |
| Total Value of Securities — 100.4% | | | | | | | | |
(Cost $1,559,616) | | | | | | | | |
Percentages are based on Net Assets of $1,707,464.
| * | Non-income producing security. |
Ltd. — Limited
PLC — Public Limited Company
REIT — Real Estate Investment Trust
As of October 31, 2021, all of the Fund’s investments were considered Level 1, in accordance the authoritative guidance on fair value measurements and disclosure under U.S. GAAP.
For the year ended October 31, 2021, there were no transfers in or out of Level 3.
For more information on valuation inputs, see Note 2 in Notes to Financial Statements.
The accompanying notes are an integral part of the financial statements.
| Gallery Trust | | Mondrian Global Equity Value Fund |
| | | |
| | |
SCHEDULE OF INVESTMENTS
| COMMON STOCK — 97.6% | | | | | | |
| | | | | | | |
| BRAZIL — 0.7% | | | | | | |
Hypera SA | | | 116,000 | | | | | |
| Total Brazil | | | | | | | | |
| CHINA — 5.6% | | | | | | | | |
Alibaba Group Holding Ltd * | | | 75,900 | | | | 1,590,091 | |
Autohome ADR | | | 21,151 | | | | 832,292 | |
Midea Group Co Ltd Class A | | | 117,055 | | | | 1,257,930 | |
| Ping An Insurance Group Co of China Ltd Class H | | | 137,500 | | | | | |
| Total China | | | | | | | | |
| FRANCE — 6.6% | | | | | | | | |
Sanofi SA | | | 22,691 | | | | 2,267,133 | |
Thales SA | | | 22,120 | | | | 2,036,968 | |
Ubisoft Entertainment * | | | 23,701 | | | | | |
| Total France | | | | | | | | |
The accompanying notes are an integral part of the financial statements.
| Gallery Trust | | Mondrian Global Equity Value Fund |
| | | |
| | |
| COMMON STOCK — continued | | | | | | |
| | | | | | | |
| GERMANY — 1.8% | | | | | | |
Continental AG | | | 11,761 | | | $ | 1,380,240 | |
Vitesco Technologies Group * | | | 2,241 | | | | | |
| Total Germany | | | | | | | | |
| HONG KONG — 1.5% | | | | | | | | |
WH Group Ltd | | | 1,782,457 | | | | | |
| Total Hong Kong | | | | | | | | |
| INDIA — 0.9% | | | | | | | | |
Reliance Industries Ltd | | | 23,038 | | | | | |
| Total India | | | | | | | | |
| ITALY — 2.1% | | | | | | | | |
Enel SpA | | | 204,737 | | | | | |
| Total Italy | | | | | | | | |
| JAPAN — 15.7% | | | | | | | | |
Hitachi Ltd | | | 20,400 | | | | 1,173,078 | |
Kyocera Corp | | | 29,200 | | | | 1,704,988 | |
| Matsumotokiyoshi Holdings Co Ltd | | | 11,100 | | | | 489,871 | |
Mitsubishi Electric Corp | | | 130,000 | | | | 1,739,417 | |
Otsuka Holdings Co Ltd | | | 9,400 | | | | 370,639 | |
SCSK | | | 77,400 | | | | 1,561,921 | |
Sekisui Chemical Co Ltd | | | 48,500 | | | | 793,617 | |
Sony Corp | | | 13,500 | | | | 1,556,394 | |
Sundrug Co Ltd | | | 71,600 | | | | 2,095,073 | |
Toyota Industries Corp | | | 18,900 | | | | | |
| Total Japan | | | | | | | | |
| PERU — 0.9% | | | | | | | | |
Credicorp Ltd | | | 5,585 | | | | | |
| Total Peru | | | | | | | | |
| SPAIN — 1.7% | | | | | | | | |
Red Electrica Corp SA | | | 69,089 | | | | | |
| Total Spain | | | | | | | | |
The accompanying notes are an integral part of the financial statements.
| Gallery Trust | | Mondrian Global Equity Value Fund |
| | | |
| | |
| COMMON STOCK — continued | | | | | | |
| | | | | | | |
| TAIWAN — 2.0% | | | | | | |
| Taiwan Semiconductor Manufacturing Co Ltd | | | 79,000 | | | | | |
| Total Taiwan | | | | | | | | |
| UNITED KINGDOM — 11.5% | | | | | | | | |
GlaxoSmithKline PLC | | | 125,319 | | | | 2,587,330 | |
Imperial Brands PLC | | | 36,437 | | | | 768,932 | |
Kingfisher PLC | | | 140,728 | | | | 645,188 | |
Lloyds Banking Group PLC | | | 3,544,771 | | | | 2,436,272 | |
SSE PLC | | | 59,593 | | | | 1,340,374 | |
Unilever PLC | | | 34,724 | | | | | |
| Total United Kingdom | | | | | | | | |
| UNITED STATES — 46.6% | | | | | | | | |
| Communication Services — 2.4% | | | | | | | | |
Alphabet Class A * | | | 681 | | | | | |
| Consumer Discretionary — 3.5% | | | | | | | | |
Dollar Tree * | | | 20,144 | | | | 2,170,717 | |
Ulta Beauty * | | | 2,108 | | | | | |
| | | | | | | | | |
| Consumer Staples — 5.6% | | | | | | | | |
Colgate-Palmolive | | | 29,189 | | | | 2,223,910 | |
PepsiCo Inc | | | 15,176 | | | | | |
| | | | | | | | | |
| Energy — 1.1% | | | | | | | | |
Exxon Mobil Corp | | | 14,482 | | | | | |
| Financials — 9.2% | | | | | | | | |
New York Community Bancorp | | | 38,765 | | | | 481,849 | |
Pinnacle Financial Partners | | | 5,240 | | | | 506,027 | |
Progressive | | | 23,196 | | | | 2,200,836 | |
S&P Global Inc | | | 3,852 | | | | 1,826,464 | |
Wells Fargo & Co | | | 52,400 | | | | | |
| | | | | | | | | |
The accompanying notes are an integral part of the financial statements.
| Gallery Trust | | Mondrian Global Equity Value Fund |
| | | |
| | |
| COMMON STOCK — continued | | | | | | |
| | | | | | | |
| UNITED STATES (continued) | | | | | | |
| Health Care — 9.3% | | | | | | |
AbbVie Inc | | | 6,911 | | | $ | 792,484 | |
Centene Corp * | | | 39,132 | | | | 2,787,764 | |
HCA Healthcare | | | 6,775 | | | | 1,696,867 | |
Johnson & Johnson | | | 14,623 | | | | | |
| | | | | | | | | |
| Industrials — 3.4% | | | | | | | | |
L3Harris Technologies | | | 5,041 | | | | 1,162,152 | |
Stericycle Inc * | | | 25,282 | | | | | |
| | | | | | | | | |
| Information Technology — 10.0% | | | | | | | | |
Cisco Systems Inc | | | 31,520 | | | | 1,764,174 | |
Maximus Inc | | | 20,590 | | | | 1,741,297 | |
Microsoft Corp | | | 9,284 | | | | 3,078,760 | |
Sabre * | | | 56,368 | | | | 585,100 | |
Visa Inc Class A | | | 5,427 | | | | | |
| | | | | | | | | |
| Real Estate — 2.1% | | | | | | | | |
American Tower REIT | | | 6,319 | | | | | |
| Total United States | | | | | | | | |
| Total Common Stock | | | | | | | | |
(Cost $79,406,818) | | | | | | | | |
| | | | | | | |
| PREFERRED STOCK — 0.7% | | | | | | |
| SOUTH KOREA — 0.7% | | | | | | |
Samsung Electronics Co Ltd** | | | 11,435 | | | | | |
| Total Preferred Stock | | | | | | | | |
(Cost $704,242) | | | | | | | | |
| Total Value of Securities — 98.3% | | | | | | | | |
(Cost $80,111,060) | | | | | | | | |
The accompanying notes are an integral part of the financial statements.
| Gallery Trust | | Mondrian Global Equity Value Fund |
| | | |
| | |
Percentages are based on Net Assets of $83,521,642.
| * | Non-income producing security. |
| ** | There is currently no rate available. |
ADR — American Depositary Receipt
Ltd. — Limited
PLC — Public Limited Company
REIT — Real Estate Investment Trust
As of October 31, 2021, all of the Fund’s investments were considered Level 1, in accordance the authoritative guidance on fair value measurements and disclosure under U.S. GAAP.
For the year ended October 31, 2021, there were no transfers in or out of Level 3.
For more information on valuation inputs, see Note 2 in Notes to Financial Statements.
The accompanying notes are an integral part of the financial statements.
STATEMENTS OF ASSETS AND LIABILITIES
| | | Mondrian International Value Equity Fund | | | Mondrian Emerging Markets Value Equity Fund | | | Mondrian International Government Fixed Income Fund | |
| Assets: | | | | | | | | | |
| Investments (Cost $654,057,990, $23,229,334 and $15,439,306) | | $ | 702,276,160 | | | $ | 24,939,192 | | | $ | 15,817,896 | |
Foreign currency (Cost $487,259, $550 and $—) | | | 482,546 | | | | 528 | | | | — | |
Cash | | | 1,512,700 | | | | 313,193 | | | | 153,442 | |
Reclaims receivable | | | 3,490,928 | | | | 907 | | | | — | |
| Dividends and interest receivable | | | 3,172,310 | | | | 20,927 | | | | 85,087 | |
| Receivable for investment securities sold | | | 1,033,551 | | | | 100,507 | | | | — | |
| Receivable for capital shares sold | | | 392,558 | | | | 89,974 | | | | — | |
| Receivable from Investment Adviser | | | — | | | | 349 | | | | 2,397 | |
| Unrealized appreciation on forward foreign currency contracts | | | — | | | | — | | | | 6,899 | |
Prepaid expenses | | | | | | | | | | | | |
Total assets | | | | | | | | | | | | |
| Liabilities: | | | | | | | | | | | | |
| Payable for investment securities purchased | | | 1,456,193 | | | | 133,902 | | | | — | |
| Payable due to Investment Adviser | | | 280,866 | | | | — | | | | — | |
| Payable for capital shares redeemed | | | 99,296 | | | | — | | | | 9,973 | |
| Payable due to Administrator | | | 58,890 | | | | 2,091 | | | | 1,353 | |
| Payable due to Custodian | | | — | | | | — | | | | 1 | |
Audit fees payable | | | 31,400 | | | | 12,200 | | | | 13,300 | |
| Chief Compliance Officer fees payable | | | 7,633 | | | | 262 | | | | 178 | |
Payable due to Trustees | | | 518 | | | | 18 | | | | 12 | |
| Unrealized depreciation on spot foreign currency contracts | | | 29 | | | | 29 | | | | — | |
| Unrealized depreciation on forward foreign currency contracts | | | — | | | | — | | | | 11,780 | |
| Accrued foreign capital gains tax | | | — | | | | 100,313 | | | | — | |
Other accrued expenses | | | | | | | | | | | | |
Total liabilities | | | | | | | | | | | | |
Net assets | | | | | | | | | | | | |
| Net assets consist of: | | | | | | | | | | | | |
Paid-in capital | | $ | 661,002,805 | | | $ | 129,399,411 | | | $ | 16,533,820 | |
| Total distributable earnings/(loss) | | | | | | | | | | | | |
Net assets | | | | | | | | | | | | |
| Outstanding Shares of Beneficial Interest (unlimited authorization - no par value) | | | | | | | | | | | | |
| Net Asset Value, Offering and Redemption Price Per Share | | | | | | | | | | | | |
The accompanying notes are an integral part of the financial statements.
STATEMENTS OF ASSETS AND LIABILITIES
| | | Mondrian U.S. Small Cap Equity Fund | | | Mondrian Global Listed Infrastructure Fund | | | Mondrian Global Equity Value Fund | |
| Assets: | | | | | | | | | |
Investments (Cost $1,504,293, $1,559,616 and $80,111,060 ) | | $ | 1,758,578 | | | $ | 1,713,900 | | | $ | 82,109,535 | |
Foreign currency (Cost $—, $16 and $283,077) | | | — | | | | 17 | | | | 284,808 | |
Cash | | | 28,098 | | | | 4,438 | | | | 726,217 | |
| Receivable from Investment Adviser | | | 6,096 | | | | 6,673 | | | | — | |
Dividends receivable | | | 1,002 | | | | 721 | | | | 142,750 | |
| Receivable for capital shares sold | | | — | | | | — | | | | 321,165 | |
Reclaims receivable | | | — | | | | 1,835 | | | | 6,838 | |
Prepaid expenses | | | | | | | | | | | | |
Total assets | | | | | | | | | | | | |
| Liabilities: | | | | | | | | | | | | |
Audit fees payable | | | 12,400 | | | | 13,450 | | | | 12,200 | |
| Payable due to Administrator | | | 145 | | | | 141 | | | | 6,797 | |
| Chief Compliance Officer fees payable | | | 19 | | | | 18 | | | | 837 | |
Payable due to Trustees | | | 1 | | | | 1 | | | | 59 | |
| Payable due to Investment Adviser | | | — | | | | — | | | | 22,816 | |
| Accrued foreign capital gains tax | | | — | | | | 1,898 | | | | 9,166 | 0 |
Other accrued expenses | | | | | | | | | | | | |
Total liabilities | | | | | | | | | | | | |
Net assets | | | | | | | | | | | | |
| Net assets consist of: | | | | | | | | | | | | |
Paid-in capital | | $ | 1,474,635 | | | $ | 1,445,543 | | | $ | 81,379,027 | |
| Total distributable earnings | | | | | | | | | | | | |
Net assets | | | | | | | | | | | | |
| Outstanding Shares of Beneficial Interest (unlimited authorization - no par value) | | | | | | | | | | | | |
| Net Asset Value, Offering and Redemption Price Per Share | | | | | | | | | | | | |
The accompanying notes are an integral part of the financial statements.
| | | Mondrian International Value Equity Fund | |
| Investment income | | | |
Dividends | | $ | 26,359,323 | |
Less: foreign taxes withheld | | | | |
Total investment income | | | | |
| Expenses | | | | |
Investment advisory fees | | | 4,199,121 | |
Accounting and administration fees | | | 674,802 | |
Legal fees | | | 181,834 | |
Other | | | 142,861 | |
Registration fees | | | 116,962 | |
Custodian fees | | | 92,564 | |
Audit fees | | | 57,549 | |
| Dividend disbursing and transfer agent fees and expenses | | | 44,784 | |
Trustees’ fees and expenses | | | 42,094 | |
Printing fees | | | 39,931 | |
Chief Compliance Officer fees | | | | |
Total expenses | | | | |
| Less: | | | | |
Investment advisory fees waived | | | | |
Net expenses | | | | |
Net investment income | | | | |
| Net realized gain/(loss) on: | | | | |
Investments*
| | | 19,713,960 | |
Foreign currency transactions | | | | |
Net realized gain | | | | |
| Net change in unrealized appreciation/(depreciation) on: | | | | |
Investments | | | 135,398,868 | |
| Foreign currency transactions and translation of other assets and liabilities denominated in foreign currency | | | | |
| Net change in unrealized appreciation/(depreciation) | | | | |
Net realized and unrealized gain | | | | |
| Net increase in net assets resulting from operations | | | | |
* Realized gains contains one-time Fortis Group litigation payment.
STATEMENTS OF OPERATIONS
| | | Mondrian Emerging
Markets Value Equity Fund | |
| Investment income | | | |
Dividends | | $ | 574,015 | |
Less: foreign taxes withheld | | | | |
Total investment income | | | | |
| Expenses | | | | |
Investment advisory fees | | | 154,699 | |
| Dividend disbursing and transfer agent fees and expenses | | | 29,463 | |
Audit fees | | | 27,249 | |
Custodian fees | | | 25,617 | |
Accounting and administration fees | | | 20,982 | |
Other | | | 10,106 | |
Registration fees | | | 9,181 | |
Legal fees | | | 6,214 | |
Printing fees | | | 2,119 | |
Trustees’ fees and expenses | | | 1,435 | |
Chief Compliance Officer fees | | | | |
Total expenses | | | | |
| Less: | | | | |
Investment advisory fees waived | | | | |
Net expenses | | | | |
Net investment income | | | | |
| Net realized gain/(loss) on: | | | | |
Investments | | | 1,437,159 | |
Foreign currency transactions | | | | |
Net realized gain | | | | |
| Net change in unrealized appreciation/(depreciation) on: | | | | |
Investments | | | (802,617 | ) |
| Accrued foreign capital gains tax on appreciated securities | | | (45,731 | ) |
| Foreign currency transactions and translation of other assets and liabilities denominated in foreign currency | | | | |
| Net change in unrealized appreciation/(depreciation) | | | | |
Net realized and unrealized gain | | | | |
| Net increase in net assets resulting from operations | | | | |
The accompanying notes are an integral part of the financial statements.
STATEMENTS OF OPERATIONS
| | | Mondrian International Government
Fixed Income Fund | |
| Investment income | | | |
Interest | | $ | 255,650 | |
Less: foreign taxes withheld | | | | |
Total investment income | | | | |
| Expenses | | | | |
Investment advisory fees | | | 120,479 | |
| Dividend disbursing and transfer agent fees and expenses | | | 29,672 | |
Audit fees | | | 29,462 | |
Accounting and administration fees | | | 24,884 | |
Registration fees | | | 9,376 | |
Legal fees | | | 7,416 | |
Other | | | 7,264 | |
Custodian fees | | | 3,002 | |
Printing fees | | | 2,580 | |
Trustees’ fees and expenses | | | 1,684 | |
Chief Compliance Officer fees | | | | |
Total expenses | | | | |
| Less: | | | | |
Investment advisory fees waived | | | | |
Net expenses | | | | |
Net investment income | | | | |
| Net realized gain/(loss) on: | | | | |
Investments | | | 524,123 | |
Foreign currency transactions | | | (9,011 | ) |
Foreign currency exchange contracts | | | | |
Net realized gain | | | | |
| Net change in unrealized appreciation/(depreciation) on: | | | | |
Investments | | | (1,818,563 | ) |
| Foreign currency transactions and translation of other assets and liabilities denominated in foreign currency | | | (2,954 | ) |
Foreign currency exchange contracts | | | | |
| Net change in unrealized appreciation/(depreciation) | | | | |
Net realized and unrealized loss | | | | |
| Net decrease in net assets resulting from operations | | | | |
The accompanying notes are an integral part of the financial statements.
STATEMENTS OF OPERATIONS
| | | Mondrian U.S. Small Cap
Equity Fund | |
| Investment income | | | |
Dividends | | | | |
Total investment income | | | | |
| Expenses | | | | |
| Dividend disbursing and transfer agent fees and expenses | | | 28,706 | |
Audit fees | | | 27,659 | |
Investment advisory fees | | | 12,638 | |
Registration fees | | | 3,701 | |
Accounting and administration fees | | | 1,620 | |
Printing fees | | | 947 | |
Custodian fees | | | 710 | |
Legal fees | | | 435 | |
Other | | | 368 | |
Trustees’ fees and expenses | | | 101 | |
Chief Compliance Officer fees | | | | |
Total expenses | | | | |
| Less: | | | | |
Investment advisory fees waived | | | (12,638 | ) |
Reimbursement from Investment Adviser | | | | |
Net expenses | | | | |
Net investment income | | | | |
| Net realized gain on: | | | | |
Investments | | | | |
Net realized gain | | | | |
| Net change in unrealized appreciation on: | | | | |
Investments | | | | |
Net change in unrealized appreciation | | | | |
Net realized and unrealized gain | | | | |
| Net increase in net assets resulting from operations | | | | |
The accompanying notes are an integral part of the financial statements.
STATEMENTS OF OPERATIONS
| | | Mondrian Global Listed Infrastructure Fund | |
| Investment income | | | |
Dividends | | $ | 61,457 | |
Less: foreign taxes withheld | | | | |
Total investment income | | | | |
| Expenses | | | | |
Audit fees | | | 30,155 | |
| Dividend disbursing and transfer agent fees and expenses | | | 28,705 | |
Investment advisory fees | | | 13,975 | |
Registration fees | | | 3,741 | |
Custodian fees | | | 2,786 | |
Accounting and administration fees | | | 1,662 | |
Printing fees | | | 1,253 | |
Other | | | 717 | |
Legal fees | | | 469 | |
Trustees’ fees and expenses | | | 108 | |
Chief Compliance Officer fees | | | | |
Total expenses | | | | |
| Less: | | | | |
Investment advisory fees waived | | | (13,975 | ) |
Reimbursement from Investment Adviser | | | | |
Net expenses | | | | |
Net investment income | | | | |
| Net realized gain on: | | | | |
Investments | | | 78,196 | |
Foreign currency transactions | | | | |
Net realized gain | | | | |
| Net change in unrealized appreciation/(depreciation) on: | | | | |
Investments | | | 233,545 | |
| Accrued foreign capital gains tax on appreciated securities | | | (1,899 | ) |
| Foreign currency transactions and translation of other assets and liabilities denominated in foreign currency | | | | |
| Net change in unrealized appreciation/(depreciation) | | | | |
Net realized and unrealized gain | | | | |
| Net increase in net assets resulting from operations | | | | |
The accompanying notes are an integral part of the financial statements.
STATEMENTS OF OPERATIONS
| | | Mondrian
Global Equity Value Fund | |
| Investment income | | | |
Dividends | | $ | 797,514 | |
Less: foreign taxes withheld | | | | |
Total investment income | | | | |
| Expenses | | | | |
Investment advisory fees | | | 240,613 | |
Offering costs | | | 44,699 | |
Accounting and administration fees | | | 36,532 | |
Custodian fees | | | 33,631 | |
| Dividend disbursing and transfer agent fees and expenses | | | 29,627 | |
Audit fees | | | 23,820 | |
Other | | | 9,785 | |
Legal fees | | | 6,282 | |
Printing fees | | | 4,153 | |
Registration fees | | | 2,287 | |
Trustees’ fees and expenses | | | 1,648 | |
Chief Compliance Officer fees | | | | |
Total expenses | | | | |
| Less: | | | | |
Investment advisory fees waived | | | | |
Net expenses | | | | |
Net investment income | | | | |
| Net realized gain/(loss) on: | | | | |
Investments | | | (305,714 | ) |
Foreign currency transactions | | | (27,224 | ) |
Foreign currency exchange contracts | | | | |
Net realized loss | | | | |
| Net change in unrealized appreciation/(depreciation) on: | | | | |
Investments | | | 1,984,892 | |
| Accrued foreign capital gains tax on appreciated securities | | | (9,166 | ) |
| Foreign currency transactions and translation of other assets and liabilities denominated in foreign currency | | | | |
| Net change in unrealized appreciation/(depreciation) | | | | |
Net realized and unrealized gain | | | | |
| Net increase in net assets resulting from operations | | | | |
The accompanying notes are an integral part of the financial statements.
| Gallery Trust | | Mondrian International Value |
| | | |
|
|
|
STATEMENTS OF CHANGES IN NET ASSETS
| | | Year ended October 31, 2021 | | | Year ended October 31, 2020 | |
| Operations: | | | | | | |
Net investment income | | $ | 19,553,015 | | | $ | 11,885,420 | |
Net realized gain/(loss) on investments and foreign currency transactions | | | 19,663,267 | | | | (27,057,517 | ) |
Net change in unrealized appreciation/(depreciation) on investments, foreign currency transactions and translation of other assets and liabilities denominated in foreign currency | | | | | | | | |
Net increase/(decrease) in net assets resulting from operations | | | | | | | | |
Distribution of Income | | | | | | | | |
| Capital share transactions(1): | | | | | | | | |
Issued | | | 183,891,112 | | | | 130,131,165 | |
Reinvestment of dividends | | | 10,834,756 | | | | 27,306,352 | |
Redeemed | | | | | | | | |
Net increase/(decrease) in net assets from capital share transactions | | | | | | | | |
| Total increase/(decrease) in net assets | | | | | | | | |
| Net assets: | | | | | | | | |
Beginning of period | | | | | | | | |
End of period | | | | | | | | |
| (1) | See Note 8 – Share transactions in Notes to Financial Statements. |
The accompanying notes are an integral part of the financial statements.
| Gallery Trust | | Mondrian Emerging Markets Value |
| | | |
|
|
|
STATEMENTS OF CHANGES IN NET ASSETS
| | | Year ended October 31, 2021 | | | Year ended October 31, 2020 | |
| Operations: | | | | | | |
Net investment income | | $ | 323,947 | | | $ | 480,924 | |
Net realized gain on investments and foreign currency transactions | | | 1,412,534 | | | | 1,664,173 | |
Net change in unrealized appreciation/(depreciation) on investments, foreign currency transactions and translation of other assets and liabilities denominated in foreign currency | | | | | | | | |
| Net increase in net assets resulting from operations | | | | | | | | |
Distribution of Income | | | | | | | | |
| Capital share transactions(1): | | | | | | | | |
Issued | | | 15,758,497 | | | | 4,484,228 | |
Reinvestment of dividends | | | 479,107 | | | | 1,318,682 | |
Redeemed | | | | | | | | |
Net increase/(decrease) in net assets from capital share transactions | | | | | | | | |
| Total increase/(decrease) in net assets | | | | | | | | |
| Net assets: | | | | | | | | |
Beginning of period | | | | | | | | |
End of period | | | | | | | | |
| (1) | See Note 8 – Share transactions in Notes to Financial Statements. |
The accompanying notes are an integral part of the financial statements.
| Gallery Trust | | Mondrian International Government |
| | | |
|
|
|
STATEMENTS OF CHANGES IN NET ASSETS
| | | Year ended ctober 31, 2021 | | | Year ended October 31, 2020 | |
| Operations: | | | | | | |
Net investment income | | $ | 110,272 | | | $ | 223,677 | |
Net realized gain on investments andforeign currency transactions | | | 646,459 | | | | 894,412 | |
| Net change in unrealized appreciation/(depreciation) on investments, foreign currency transactions and translation of other assets and liabilities denominated in foreign currency | | | | | | | | |
Net increase/(decrease) in net assets resulting from operations | | | | | | | | |
Distribution of Income | | | | | | | | |
| Capital share transactions(1): | | | | | | | | |
Issued | | | 1,775,056 | | | | 1,952,263 | |
Reinvestment of dividends | | | 982,467 | | | | 1,099,109 | |
Redeemed | | | | | | | | |
Net decrease in net assets from capital share transactions | | | | | | | | |
Total decrease in net assets | | | | | | | | |
| Net assets: | | | | | | | | |
Beginning of period | | | | | | | | |
End of period | | | | | | | | |
| (1) | See Note 8 – Share transactions in Notes to Financial Statements. |
The accompanying notes are an integral part of the financial statements.| Gallery Trust | | Mondrian U.S. Small Cap Equity Fund
|
|
|
|
|
|
|
STATEMENTS OF CHANGES IN NET ASSETS
| | | Year ended October 31, 2021 | | | Year ended October 31, 2020 | |
| Operations: | | | | | | |
Net investment income | | $ | 11,887 | | | $ | 13,585 | |
| Net realized gain/(loss) on investments | | | 130,411 | | | | (106,062 | ) |
Net change in unrealized appreciation/(depreciation) on investments | | | | | | | | |
Net increase/(decrease) in net assets resulting from operations | | | | | | | | |
Distribution of Income | | | (4,682 | ) | | | (54,959 | ) |
Return of Capital | | | | | | | | |
Total Distributions | | | | | | | | |
| Capital share transactions(1): | | | | | | | | |
Issued | | | 165,030 | | | | — | |
Reinvestment of dividends | | | 4,682 | | | | 56,673 | |
Redeemed | | | | | | | | |
Net increase in net assets from capital share transactions | | | | | | | | |
| Total increase/(decrease) in net assets | | | | | | | | |
| Net assets: | | | | | | | | |
Beginning of period | | | | | | | | |
End of period | | | | | | | | |
| (1) | See Note 8 – Share transactions in Notes to Financial Statements. |
The accompanying notes are an integral part of the financial statements.| Gallery Trust | | |
| | | Infrastructure Fund
|
|
|
|
STATEMENTS OF CHANGES IN NET ASSETS
| | | Year ended October 31, 2021 | | | Year ended October 31, 2020 | |
| Operations: | | | | | | |
Net investment income | | $ | 38,774 | | | $ | 54,004 | |
Net realized gain on investments and foreign currency transactions | | | 79,283 | | | | 48,358 | |
| Net change in unrealized appreciation/(depreciation) on investments, foreign currency transactions and translation of other assets andliabilities denominated in foreign currency | | | | | | | | |
Net increase/(decrease) in net assets resulting from operations | | | | | | | | |
Distribution of Income | | | | | | | | |
Distribution of Net Realized Gains
| | | (49,270
| )
| | | –
| |
Total Distributions
| | | (92,942
| )
| | | (101,676
| )
|
Capital share transactions(1): | | | | | | | | |
Reinvestment of dividends | | | | | | | | |
Net increase in net assets from capital share transactions | | | | | | | | |
| Total increase/(decrease) in net assets | | | | | | | | |
| Net assets: | | | | | | | | |
Beginning of period | | | | | | | | |
End of period | | | | | | | | |
| (1) | See Note 8 – Share transactions in Notes to Financial Statements. |
The accompanying notes are an integral part of the financial statements.
| Gallery Trust | | Mondrian Global Equity Value Fund
|
|
|
|
|
|
|
STATEMENTS OF CHANGES IN NET ASSETS
| | | Year ended October 31, 2021 | | | Period ended October 31, 2020(1) | |
| Operations: | | | | | | |
Net investment income | | $ | 476,293 | | | $ | 12,743 | |
Net realized gain/(loss) on investments and foreign currency transactions | | | (314,033 | ) | | | 27,418 | |
| Net change in unrealized appreciation on investments, foreign currency transactions and translation of other assets and liabilities denominated in foreign currency | | | | | | | | |
| Net increase in net assets resulting from operations | | | | | | | | |
Distribution of Income | | | | | | | | |
| Capital share transactions(2): | | | | | | | | |
Issued | | | 90,157,272 | | | | 2,550,000 | |
Reinvestment of dividends | | | 48,411 | | | | — | |
Redeemed | | | | | | | | |
Net increase in net assets from capital share transactions | | | | | | | | |
Total increase in net assets | | | | | | | | |
| Net assets: | | | | | | | | |
Beginning of period | | | | | | | | |
End of period | | | | | | | | |
| (1) | The fund commenced operations on June 30, 2020. |
| (2) | See Note 8 – Share transactions in Notes to Financial Statements. |
The accompanying notes are an integral part of the financial statements.
| Gallery Trust | | Mondrian International Value Equity Fund |
| | |
|
|
|
|
Selected per share data & ratios
for a share outstanding throughout the year
| | | | | | | | | | | | | | | | |
| Net asset value, beginning of period | | | | | | | | | | | | | | | | | | | | |
Income/(loss) from operations:(1) | | | | | | | | | | | | | | | | | | | | |
| Net investment income | | | 0.43 | | | | 0.28 | | | | 0.48 | | | | 0.47 | | | | 0.42 | |
Net realized and unrealized gain/(loss) on investments | | | | | | | | | | | | | | | | | | | | |
| Total from operations | | | | | | | | | | | | | | | | | | | | |
Redemption Fees | | | | | | | | | | | | | | | | | | | | |
| Dividends and distributions from: | | | | | | | | | | | | | | | | | | | | |
| Net investment income | | | (0.32 | ) | | | (0.51 | ) | | | (0.39 | ) | | | (0.48 | ) | | | (0.31 | ) |
Net realized gains | | | | | | | | | | | | | | | | | | | | |
| Total dividends and distributions | | | | | | | | | | | | | | | | | | | | |
| Net asset value, end of period | | | | | | | | | | | | | | | | | | | | |
Total return† | | | | | | | | | | | | | | | | | | | | |
| Ratios and supplemental data | | | | | | | | | | | | | | | | | | | | |
| Net assets, end of period ($ Thousands) | | $ | 710,402 | | | $ | 463,697 | | | $ | 607,302 | | | $ | 537,587 | | | $ | 580,798 | |
Ratio of expenses to average net assets (including waivers and reimbursements) | | | 0.73 | % | | | 0.79 | % | | | 0.79 | % | | | 0.79 | % | | | 0.79 | % |
Ratio of expenses to average net assets (excluding waivers and reimbursements) | | | 0.85 | % | | | 0.94 | % | | | 0.89 | % | | | 0.88 | % | | | 0.85 | % |
Ratio of net investment income to average net assets | | | 2.97 | % | | | 2.26 | % | | | 3.40 | % | | | 2.96 | % | | | 2.91 | % |
Portfolio turnover rate | | | 19 | % | | | 24 | % | | | 23 | % | | | 23 | %(2) | | | 28 | %(2) |
| * | Value is less than ($0.005) per share. |
| † | Returns shown do not reflect the deductions of taxes that a shareholder would pay on Fund distributions or the redemption of Fund shares. Total return may have been lower had the Adviser not waived its fee and/or reimbursed other expenses. |
| (1) | Per share calculations were performed using average shares for the period. |
(2) (3)
| Excludes the value of Portfolio securities received or delivered as a result of in-kind purchases or redemptions of the Portfolio’s capital shares. If not for the one-time Fortis Group litigation payment, the Total return would have been 36.42%.
|
Amounts designated as “—” are $0 or have been rounded to $0.
The accompanying notes are an integral part of the financial statements.
| Gallery Trust | | Mondrian Emerging Markets Value |
| | | |
|
|
|
FINANCIAL HIGHLIGHTS
Selected per share data & ratios
for a share outstanding throughout the year or period
| | | | | | | | | | | | | | | | | | | |
Net asset value, beginning of period | | | | | | | | | | | | | | | | | | | | | | | | |
Income/(loss) from operations:(3) | | | | | | | | | | | | | | | | | | | | | | | | |
| Net investment income | | | 0.14 | | | | 0.12 | | | | 0.16 | | | | 0.15 | | | | 0.19 | | | | 0.14 | |
| Net realized and unrealized gain/(loss) on investments | | | | | | | | | | | | | | | | | | | | | | | | |
| Total from operations | | | | | | | | | | | | | | | | | | | | | | | | |
| Dividends and distributions from: | | | | | | | | | | | | | | | | | | | | | | | | |
| Net investment income | | | | | | | | | | | | | | | | | | | | | | | | |
| Total dividends and distributions | | | | | | | | | | | | | | | | | | | | | | | | |
| Net asset value, end of period | | | | | | | | | | | | | | | | | | | | | | | | |
Total return* | | | | | | | | | | | | | | | | | | | | | | | | |
| Ratios and supplemental data | | | | | | | | | | | | | | | | | | | | | | | | |
Net assets, end of period ($ Thousands) | | $ | 25,180 | | | $ | 13,068 | | | $ | 47,496 | | | $ | 89,378 | | | $ | 314,259 | | | $ | 336,896 | |
| Ratio of expenses to average net assets (including waivers and reimbursements) | | | 0.92 | % | | | 0.92 | % | | | 0.92 | % | | | 1.18 | %† | | | 1.19 | %(4) | | | 1.20 | % |
| Ratio of expenses to average net assets (excluding waivers and reimbursements) | | | 1.39 | % | | | 1.41 | % | | | 1.13 | % | | | 1.26 | %† | | | 1.21 | %(4) | | | 1.22 | % |
| Ratio of net investment income to average net assets | | | 1.57 | % | | | 1.67 | % | | | 2.16 | % | | | 3.25 | %† | | | 2.30 | %(4) | | | 1.92 | % |
| Portfolio turnover rate | | | 49 | % | | | 48 | % | | | 37 | % | | | 62 | %‡ | | | 39 | % | | | 32 | % |
| * | Total Return is for the period indicated and has not been annualized. Returns shown do not reflect the deductions of taxes that a shareholder would pay on Fund distributions or the redemption of Fund shares. Total return may have been lower had the Adviser not waived its fee and/or reimbursed other expenses. |
| ‡ | Portfolio turnover is for the period indicated and has not been annualized. |
| (1) | For the period April 1, 2018 to October 31, 2018. On September 24, 2018, the Laudus Mondrian Emerging Markets Fund (the “Emerging Markets Predecessor Fund”) was reorganized into the Gallery Trust Mondrian Emerging Markets Equity Fund (the “Emerging Markets Fund”). Information presented prior to September 24, 2018 is that of the Emerging Markets Predecessor Fund. Effective October 31, 2018, the Emerging Markets Fund changed its fiscal year end to October 31. See Note 1 in Notes to Financial Statements. |
| (2) | Effective July 25, 2017, the Investor Share class, the Select Share class, and the Institutional Share class were consolidated into a single class of shares of the fund. The financial history as shown in the financial highlights is that of the former Institutional Shares. |
| (3) | Per share calculations were performed using average shares for the period. |
| (4) | The ratio of net operating expenses and gross operating expenses would have been 1.20% and 1.22%, respectively, and the ratio of net investment income would have been 2.29%, if the custody out-of-pocket fee reimbursement had not been included. |
The accompanying notes are an integral part of the financial statements.
| Gallery Trust | | Mondrian International Government
|
| | | |
|
|
|
FINANCIAL HIGHLIGHTS
Selected per share data & ratios
for a share outstanding throughout the year or period
| | | | | | | | | | | | | | | | | | | |
Net asset value, beginning of period | | | | | | | | | | | | | | | | | | | | | | | | |
Income/(loss) from operations:(2) | | | | | | | | | | | | | | | | | | | | | | | | |
| Net investment income | | | 0.05 | | | | 0.09 | | | | 0.12 | | | | 0.06 | | | | 0.08 | | | | 0.09 | |
| Net realized and unrealized gain/(loss) on investments | | | | | | | | | | | | | | | | | | | | | | | | |
Total from operations | | | | | | | | | | | | | | | | | | | | | | | | |
| Dividends and distributions from: | | | | | | | | | | | | | | | | | | | | | | | | |
| Net investment income | | | (0.42 | ) | | | (0.38 | ) | | | (0.37 | ) | | | — | | | | — | * | | | — | * |
| Net realized gains | | | | | | | | | | | | | | | | | | | | | | | | |
| Total dividends and distributions | | | | | | | | | | | | | | | | | | | | | | | | |
| Net asset value, end of period | | | | | | | | | | | | | | | | | | | | | | | | |
Total return† | | | | | | | | | | | | | | | | | | | | | | | | |
| Ratios and supplemental data | | | | | | | | | | | | | | | | | | | | | | | | |
Net assets, end of period ($ Thousands) | | $ | 16,029 | | | $ | 24,272 | | | $ | 28,117 | | | $ | 37,126 | | | $ | 84,330 | | | $ | 95,565 | |
| Ratio of expenses to average net assets (including waivers and reimbursements) | | | 0.60 | % | | | 0.60 | % | | | 0.60 | % | | | 0.74 | %‡ | | | 0.74 | %(3) | | | 0.75 | % |
| Ratio of expenses to average net assets (excluding waivers and reimbursements) | | | 0.98 | % | | | 1.05 | % | | | 1.02 | % | | | 0.86 | %‡ | | | 0.81 | %(3) | | | 0.79 | % |
| Ratio of net investment income to average net assets | | | 0.46 | % | | | 0.88 | % | | | 1.19 | % | | | 0.96 | %‡ | | | 0.84 | %(3) | | | 0.87 | % |
| Portfolio turnover rate | | | 26 | % | | | 15 | % | | | 42 | % | | 32 | %§
| | | 52 | % | | | 98 | % |
| * | Value is less than ($0.005) per share. |
| † | Total Return is for the period indicated and has not been annualized. Returns shown do not reflect the deductions of taxes that a shareholder would pay on Fund distributions or the redemption of Fund shares. Total return may have been lower had the Adviser not waived its fee and/or reimbursed other expenses. |
| (1) | For the period April 1, 2018 to October 31, 2018. On September 24, 2018, the Laudus Mondrian Emerging Markets Fund (the “Emerging Markets Predecessor Fund”) was reorganized into the Gallery Trust Mondrian Emerging Markets Equity Fund (the “Emerging Markets Fund”). Information presented prior to September 24, 2018 is that of the Emerging Markets Predecessor Fund. Effective October 31, 2018, the Emerging Markets Fund changed its fiscal year end to October 31. See Note 1 in Notes to Financial Statements. |
| (2) | Per share calculations were performed using average shares for the period. |
| (3) | The ratio of net operating expenses and gross operating expenses would have been 0.75% and 0.82%, respectively, and the ratio of net investment income would have been 0.83%, if the custody out-of-pocket fee reimbursement had not been included. |
| § | Portfolio turnover is for the period indicated and has not been annualized. |
Amounts designated as “—” are $0 or have been rounded to $0.
The accompanying notes are an integral part of the financial statements.
| Gallery Trust | | Mondrian U.S. Small Cap Equity Fund |
| | | |
|
|
|
FINANCIAL HIGHLIGHTS
Selected per share data & ratios
for a share outstanding throughout the period
| | | | | | | | | Period
Ended
October 31, 2019* | |
| Net asset value, beginning of period | | | | | | | | | | | | |
Income/(loss) from operations:(1) | | | | | | | | | | | | |
Net investment income | | | 0.09 | | | | 0.11 | | | | 0.15 | |
Net realized and unrealized gain/(loss) on investments | | | | | | | | | | | | |
| Total from operations | | | | | | | | | | | | |
| Dividends and distributions from: | | | | | | | | | | | | |
Net investment income | | | (0.04 | ) | | | (0.13 | ) | | | — | |
Net realized gains | | | — | | | | (0.32 | ) | | | — | |
Return of capital | | | | | | | | | | | | |
| Total dividends and distributions | | | | | | | | | | | | |
| Net asset value, end of period | | | | | | | | | | | | |
Total return† | | | | | | | | | | | | |
| Ratios and supplemental data | | | | | | | | | | | | |
| Net assets, end of period ($ Thousands) | | $ | 1,778 | | | $ | 1,139 | | | $ | 1,485 | |
| Ratio of expenses to average net assets (including waivers and reimbursements) | | | 0.90 | % | | | 0.90 | % | | | 0.90 | %‡ |
| Ratio of expenses to average net assets (excluding waivers and reimbursements) | | | 4.87 | % | | | 7.49 | % | | | 7.74 | %‡ |
Ratio of net investment income to average net assets | | | 0.75 | % | | | 1.09 | % | | | 1.61 | %‡ |
Portfolio turnover rate | | | 38 | % | | | 59 | % | | 32 | %§ |
| * | Commenced operations December 17, 2018. |
| † | Returns shown do not reflect the deductions of taxes that a shareholder would pay on Fund distributions or the redemption of Fund shares. Total return may have been lower had the Adviser not waived its fee and/or reimbursed other expenses. |
| § | Portfolio turnover is for the period indicated and has not been annualized. |
| (1) | Per share calculations were performed using average shares for the period. |
Amounts designated as “—” are $0 or have been rounded to $0.
The accompanying notes are an integral part of the financial statements.
FINANCIAL HIGHLIGHTS
Selected per share data & ratios
for a share outstanding throughout the period
| | | | | | | | | Period
Ended
October 31, 2019* | |
| Net asset value, beginning of period | | | | | | | | | | | | |
Income/(loss) from operations:(1) | | | | | | | | | | | | |
Net investment income | | | 0.28 | | | | 0.41 | | | | 0.30 | |
Net realized and unrealized gain/(loss) on investments | | | | | | | | | | | | |
| Total from operations | | | | | | | | | | | | |
| Dividends and distributions from: | | | | | | | | | | | | |
Net investment income | | | (0.32 | ) | | | (0.41 | ) | | | (0.01 | ) |
Net realized gains | | | | | | | | | | | | |
| Total dividends and distributions | | | | | | | | | | | | |
Net asset value, end of period | | | | | | | | | | | | |
Total return† | | | | | | | | | | | | |
| Ratios and supplemental data | | | | | | | | | | | | |
| Net assets, end of period ($ Thousands) | | $ | 1,707 | | | $ | 1,358 | | | $ | 1,519 | |
| Ratio of expenses to average net assets (including waivers and reimbursements) | | | 0.95 | % | | | 0.95 | % | | | 0.95 | %‡ |
| Ratio of expenses to average net assets (excluding waivers and reimbursements) | | | 5.08 | % | | | 7.42 | % | | | 8.67 | %‡ |
Ratio of net investment income to average net assets | | | 2.36 | % | | | 3.76 | % | | | 3.15 | %‡ |
Portfolio turnover rate | | | 39 | % | | | 44 | % | | 31 | %§
|
| * | Commenced operations December 17, 2018. |
| † | Returns shown do not reflect the deductions of taxes that a shareholder would pay on Fund distributions or the redemption of Fund shares. Total return may have been lower had the Adviser not waived its fee and/or reimbursed other expenses. |
| § | Portfolio turnover is for the period indicated and has not been annualized. |
| (1) | Per share calculations were performed using average shares for the period. |
Amounts designated as “—” are $0 or have been rounded to $0.
The accompanying notes are an integral part of the financial statements.
| Gallery Trust | | Mondrian Global Equity Value Fund |
| | | |
|
|
|
FINANCIAL HIGHLIGHTS
Selected per share data & ratios
for a share outstanding throughout the period
| | | | | | Period
Ended
October 31, 2020* | |
Net asset value, beginning of period | | | | | | | | |
Income/(loss) from operations:(1) | | | | | | | | |
Net investment income | | | 0.16 | | | | 0.05 | |
| Net realized and unrealized gain on investments | | | | | | | | |
Total from operations | | | | | | | | |
| Dividends and distributions from: | | | | | | | | |
Net investment income | | | (0.18 | ) | | | — | |
Total dividends and distributions | | | | | | | | |
Net asset value, end of period | | | | | | | | |
Total return† | | | | | | | | |
| Ratios and supplemental data | | | | | | | | |
| Net assets, end of period ($ Thousands) | | $ | 83,522 | | | $ | 2,604 | |
Ratio of expenses to average net assets (including waivers and reimbursements) | | | 0.74 | % | | | 0.74 | %‡ |
Ratio of expenses to average net assets (excluding waivers and reimbursements) | | | 1.17 | % | | | 9.16 | %‡ |
| Ratio of net investment income to average net assets | | | 1.29 | % | | | 1.42 | %‡ |
Portfolio turnover rate | | | 64 | % | | 10 | %§ |
| * | Commenced operations June 30, 2020. |
| † | Returns shown do not reflect the deductions of taxes that a shareholder would pay on Fund distributions or the redemption of Fund shares. Total return may have been lower had the Adviser not waived its fee and/or reimbursed other expenses. |
| § | Portfolio turnover is for the period indicated and has not been annualized. |
| (1) | Per share calculations were performed using average shares for the period. |
Amounts designated as “—” are $0 or have been rounded to $0.
The accompanying notes are an integral part of the financial statements.
| Gallery Trust | | October 31, 2021
|
| |
|
NOTES TO FINANCIAL STATEMENTS
Gallery Trust (the “Trust”), is organized as a Delaware statutory trust under an Agreement and Declaration of Trust dated August 25, 2015. The Trust is registered under the Investment Company Act of 1940 (the “1940 Act”), as amended, as an open-end investment management company with six funds. The financial statements herein are those of the Mondrian International Value Equity Fund (formerly, Mondrian International Equity Fund) (the “International Fund”), Mondrian Emerging Markets Value Equity Fund (formerly, the Mondrian Emerging Markets Equity Fund) (the “Emerging Markets Fund”) the Mondrian International Government Fixed Income Fund (the “International Government Fixed Income Fund”), the Mondrian U.S. Small Cap Equity Fund (the “U.S. Small Cap Equity Fund”), the Mondrian Global Listed Infrastructure Fund (the “Global Listed Infrastructure Fund”), and the Mondrian Global Equity Value Fund (the “Global Equity Value Fund”) (each a “Fund” and collectively the “Funds”). The International Fund, Emerging Markets Fund, U.S. Small Cap Equity Fund, and Global Listed Infrastructure Fund are classified as diversified, and the Fixed Income Fund and Global Equity Value Fund are classified as “non-diversified” under the 1940 Act. The investment objective of the International Fund is to seek long-term total return by investing at least 80% of its net assets, plus any borrowings for investment purposes, in equity securities. The investment objective of the Emerging Markets Fund is to seek long-term capital appreciation. The investment objective of the Fixed Income Fund is to seek long-term total return consistent with its value-oriented investment approach. The investment objective of the U.S. Small Cap Equity Fund is to seek long-term total return by investing at least 80% of its net assets, plus any borrowings for investment purposes, in equity securities of U.S. small-capitalization companies. The investment objective of the Global Listed Infrastructure Fund is to seek long-term total return by investing at least 80% of its net assets, plus any borrowings for investment purposes, in equity securities of infrastructure companies listed on a domestic or foreign exchange. The investment objective of the Global Equity Value Fund is to seek long-term total return. Mondrian Investment Partners Limited, a limited company organized under the laws of England and Wales in 1990, serves as the Funds’ investment adviser (“Mondrian” or the “Adviser”). The Adviser makes investment decisions for the Funds and reviews, supervises and administers the investment program of the Funds, subject to the supervision of, and policies established by, the Trustees of the Trust.
The International Fund operated as The International Equity Portfolio, a series of Delaware Pooled Trust (the “International Predecessor Fund”), prior to the International Fund’s acquisition of the assets and assumption of the liabilities
| Gallery Trust | | October 31, 2021
|
| |
|
NOTES TO FINANCIAL STATEMENTS (Continued)
of the International Predecessor Fund (the “Reorganization”) on March 14, 2016 in a tax-free transaction. The International Fund had no operations prior to the Reorganization. The International Predecessor Fund was managed by Delaware Management Company, a series of Delaware Management Business Trust (the “Delaware Predecessor Adviser”), and sub-advised by Mondrian Investment Partners Limited. The International Predecessor Fund had substantially similar investment objectives and strategies as those of the International Fund. The financial statements and financial highlights reflect the financial information of the International Predecessor Fund for periods prior to March 14, 2016.
The Emerging Markets Fund and Fixed Income Fund operated as Laudus Mondrian Emerging Markets Fund (the “Emerging Markets Predecessor Fund”) and Laudus Mondrian International Government Fixed Income Fund (the “Fixed Income Predecessor Fund”) and, together, were a series of Laudus Trust. Each Predecessor Fund was managed by Charles Schwab Investment Management, Inc. (the “Predecessor Adviser”), and sub-advised by Mondrian. Each Fund has the same objective and substantially similar investment strategies as those of its Predecessor Fund. Each Fund acquired the assets and assumed all of the liabilities of its Predecessor Fund (the “Reorganization”) on September 24, 2018 in a tax-free transaction. The Funds had no operations prior to the Reorganization. The financial statements and financial highlights reflect the financial information of the Predecessor Funds for periods prior to September 24, 2018.
Effective October 31, 2018, the Emerging Markets Fund and International Government Fixed Income Fund changed their fiscal year end from March 31 to October 31.
The U.S. Small Cap Equity Fund and Global Listed Infrastructure Fund commenced operations on December 17, 2018.
The Global Equity Value Fund commenced operations on June 30, 2020.
| 2. | Significant accounting policies |
The following are significant accounting policies, which are consistently followed in the preparation of the financial statements of the Funds. The Funds are investment companies that apply the accounting and reporting guidance issued in Topic 946 by the U.S. Financial Accounting Standards Board (“FASB”).
Use of estimates — The preparation of financial statements, in conformity with U.S. generally accepted accounting principles (“U.S. GAAP”), requires
| Gallery Trust | | October 31, 2021
|
| |
|
NOTES TO FINANCIAL STATEMENTS (Continued)
management to make estimates and assumptions that affect the fair value of assets, the reported amounts of assets and liabilities and disclosure of contingent assets and liabilities at the date of the financial statements and the reported amount of increases and decreases in net assets from operations during the reporting period. Actual results could differ from those estimates and such differences could be material.
Valuation of investments — Securities listed on a securities exchange, market or automated quotation system for which quotations are readily available (except for securities traded on NASDAQ), including securities traded over the counter, are valued at the last quoted sale price on an exchange or market (foreign or domestic) on which they are traded on valuation date (or at approximately 4:00 pm ET if a security’s primary exchange is normally open at that time), or, if there is no such reported sale on the valuation date, at the most recent quoted bid price. For securities traded on NASDAQ, the NASDAQ Official Closing Price will be used. If available, debt securities are priced based upon valuations provided by recognized independent, third-party pricing agents. Such values generally reflect the last reported sales price if the security is actively traded. The third-party pricing agents may also value debt securities by employing methodologies that utilize actual market transactions, broker-supplied valuations, or other methodologies designed to identify the market value for such securities. Such methodologies generally consider such factors as security prices, yields, maturities, call features, ratings and developments relating to specific securities in arriving at valuations. Debt securities with remaining maturities of sixty days or less may be valued at their amortized cost, which approximates market value. If such prices are not available or determined to not represent the fair value of the security as of each Fund’s pricing time, the security will be valued at fair value as determined in good faith using methods approved by the Board of Trustees (the “Board”). The prices for foreign securities will be reported in local currency and converted to U.S. dollars using currency exchange rates.
Securities for which market prices are not “readily available” are valued in accordance with fair value procedures established by the Funds’ Board. The Funds’ fair value procedures are implemented through a fair value pricing committee (the “Committee”) designated by the Board. Some of the more common reasons that may necessitate that a security be valued using fair value procedures include: the security’s trading has been halted or suspended; the security has been de-listed from a national exchange; the security’s primary trading market is temporarily closed at a time when
| Gallery Trust | | October 31, 2021
|
| |
|
NOTES TO FINANCIAL STATEMENTS (Continued)
under normal conditions it would be open; or the security’s primary pricing source is not able or willing to provide a price. When a security is valued in accordance with the fair value procedures, the Committee will determine the value after taking into consideration relevant information reasonably available to the Committee.
For securities that principally trade on a foreign market or exchange, a significant gap in time can exist between the time of a particular security’s last trade and the time at which the Fund calculates its net asset value. The closing prices of such securities may no longer reflect their market value at the time the Fund calculates net asset value if an event that could materially affect the value of those securities (a “Significant Event”) has occurred between the time of the security’s last close and the time that the Fund calculates net asset value. A Significant Event may relate to a single issuer or to an entire market sector. If the Funds’ Adviser becomes aware of a Significant Event that has occurred with respect to a security or group of securities after the closing of the exchange or market on which the security or securities principally trade, but before the time at which the Fund calculates net asset value, it may request that a Committee meeting be called.
The Funds use Markit Fair Value (“Markit”) as a third party fair valuation vendor. Markit provides a fair value for foreign securities held by the Funds based on certain factors and methodologies (involving, generally, tracking valuation correlations between the U.S. market and each non-U.S. security) applied by Markit in the event that there is a movement in the U.S. market that exceeds a specific threshold that has been established by the Committee. The Committee has also established a “confidence interval” which is used to determine the level of correlation between the value of a foreign security and movements in the U.S. market before a particular security is fair valued when the threshold is exceeded. In the event that the threshold established by the Committee is exceeded on a specific day, the Funds value the non-U.S. securities in their portfolios that exceed the applicable “confidence interval” based upon the fair values provided by Markit. In such event, it is not necessary to hold a Committee meeting. In the event that the Adviser believes that the fair values provided by Markit are not reliable, the Adviser contacts the Funds’ Administrator and requests that a meeting of the Committee be held.
If a local market in which the Funds own securities is closed for one or more days, the Funds shall value all securities held in the corresponding currency based on the fair value prices provided by Markit using the predetermined confidence interval discussed above.
| Gallery Trust | | October 31, 2021
|
| |
|
NOTES TO FINANCIAL STATEMENTS (Continued)
In accordance with the authoritative guidance on fair value measurements and disclosure under U.S. GAAP, the Funds disclose the fair value of their investments in a hierarchy that prioritizes the inputs to valuation techniques used to measure the fair value. The objective of a fair value measurement is to determine the price that would be received to sell an asset or paid to transfer a liability in an orderly transaction between market participants at the measurement date (an exit price). Accordingly, the fair value hierarchy gives the highest priority to quoted prices (unadjusted) in active markets for identical assets or liabilities (Level 1) and the lowest priority to unobservable inputs (Level 3). The three levels of the fair value hierarchy are described below:
Level 1 — Inputs are unadjusted, quoted prices in active markets for identical assets or liabilities at the measurement date.
Level 2 — Inputs other than quoted prices included in Level 1 that are observable for the asset or liability, either directly or indirectly. Level 2 inputs include quoted prices for similar instruments in active markets, and inputs other than quoted prices that are observable for the asset or liability.
Level 3 — Inputs are unobservable inputs for the asset or liability, and include situations where there is little, if any, market activity for the asset or liability.
Investments are classified within the level of the lowest significant input considered in determining fair value. Investments classified within Level 3 whose fair value measurement considers several inputs may include Level 1 or Level 2 inputs as components of the overall fair value measurement.
Fair value measurement classifications are summarized in the Funds’ Schedule of Investments.
For the year ended October 31, 2021, there have been no significant changes to the Funds’ fair valuation methodology.
Federal income taxes — It is each Fund’s intention to continue to qualify as a regulated investment company for Federal income tax purposes by complying with the appropriate provisions of Subchapter M of the Internal Revenue Code of 1986. Accordingly, no provision for Federal income taxes has been made in the financial statements.
The Funds evaluate tax positions taken or expected to be taken in the course of preparing the Funds’ tax returns to determine whether it is “more-likely-than-not” (i.e., greater than 50-percent) that each tax position
| Gallery Trust | | October 31, 2021
|
| |
|
NOTES TO FINANCIAL STATEMENTS (Continued)
will be sustained upon examination by a taxing authority based on the technical merits of the position. Tax positions not deemed to meet the more-likely-than-not threshold are recorded as a tax benefit or expense in the current year. The Funds did not record any tax provision in the current period. However, management’s conclusions regarding tax positions taken may be subject to review and adjustment at a later date based on factors including, but not limited to, examination by tax authorities (i.e., the last three tax year ends, as applicable), on-going analysis of and changes to tax laws, regulations and interpretations thereof.
As of and during the year ended October 31, 2021, the Funds did not have a liability for any unrecognized tax benefits. The Funds recognize interest and penalties, if any, related to unrecognized tax benefits as income tax expense in the Statement of Operations. During the year ended October 31, 2021, the Funds did not incur any interest or penalties.
Security transactions, dividend and investment income — Security transactions are accounted for on trade date basis for financial reporting purposes. Costs used in determining realized gains and losses on the sale of investment securities are based on the specific identification method. Dividend income is recognized on the ex-dividend date. Interest income is recognized on the accrual basis from settlement date. Purchase discounts and premiums on debt securities are accreted and amortized to maturity and included in interest income. Certain dividends from foreign securities will be recorded as soon as the Funds are informed of the dividend, net of withholding taxes, if such information is obtained subsequent to the ex-dividend date.
Foreign currency translation — The books and records of the Funds are maintained in U.S. dollars. Investment securities and other assets and liabilities denominated in a foreign currency are translated into U.S. dollars on the date of valuation. The Funds do not isolate that portion of realized or unrealized gains and losses resulting from changes in the foreign exchange rate from fluctuations arising from changes in the market prices of the securities. These gains and losses are included in net realized and unrealized gains and losses on investments on the Statement of Operations.
Net realized and unrealized gains and losses on foreign currency transactions represent net foreign exchange gains or losses from foreign currency exchange contracts, disposition of foreign currencies, currency gains or losses realized between trade and settlement dates on securities transactions and the difference between the amount of the investment income and
| Gallery Trust | | October 31, 2021
|
| |
|
NOTES TO FINANCIAL STATEMENTS (Continued)
foreign withholding taxes recorded on the Funds’ books and the U.S. dollar equivalent of the amounts actually received or paid.
Forward Foreign Currency Contracts — The Funds may enter into forward foreign currency contracts as hedges against either specific transactions, fund positions or anticipated fund positions. The Funds may also engage in currency transactions to enhance the Funds’ returns. All commitments are “marked-to-market” daily at the applicable foreign exchange rate, and any resulting unrealized gains or losses are recorded currently. The Funds realize gains and losses at the time forward contracts are closed. Unrealized gains or losses on outstanding positions in forward foreign currency contracts held at the close of the period are recognized as ordinary income or loss for Federal income tax purposes. The Funds could be exposed to risk if the counterparties to the contracts are unable to meet the terms of the contract and from unanticipated movements in the value of a foreign currency relative to the U.S. dollar. Finally, the risk exists that losses could exceed amounts disclosed on the Statement of Assets and Liabilities. Refer to each Fund’s Schedule of Investments for details regarding open forward foreign currency contracts as of October 31, 2021 if applicable.
For the year ended October 31, 2021, the average balances of forward foreign currency exchange contracts for the International Government Fixed Income Fund were as follows:
| Average Monthly Notional Contracts Purchased | | $ | (2,549,339 | ) |
| Average Monthly Notional Contracts Sold | | | 2,438,928 | |
To reduce counterparty risk with respect to Over-the-Counter (“OTC”) transactions, the Funds have entered into netting arrangements, established within the Funds’ International Swap and Derivatives Association, Inc. (“ISDA”) master agreements, which allow the Funds to make (or to have an entitlement to receive) a single net payment in the event of default (close-out netting) for outstanding payables and receivables with respect to certain OTC positions in forward foreign currency contracts for each individual counterparty. In addition, the Funds may require that certain counterparties post cash and/or securities in collateral accounts to cover their net payment obligations for those derivative contracts subject to ISDA master agreements. If the counterparty fails to perform under these contracts and agreements, the cash and/or securities will be made available to the Funds.
For financial reporting purposes, the Funds do not offset derivative assets and derivative liabilities that are subject to netting arrangements in the
| Gallery Trust | | October 31, 2021
|
| |
|
NOTES TO FINANCIAL STATEMENTS (Continued)
Statement of Assets and Liabilities. Bankruptcy or insolvency laws of a particular jurisdiction may impose restrictions on or prohibitions against the right of offset in bankruptcy, insolvency or other events.
Collateral terms are contract specific for OTC derivatives. For derivatives traded under an ISDA master agreement, the collateral requirements are typically calculated by netting the mark to market amount of each transaction under such agreement and comparing that amount to the value of any collateral currently pledged by the Funds or the counterparty.
For financial reporting purposes, cash collateral that has been pledged to cover obligations of the Funds, if any, is reported separately on the Statement of Assets and Liabilities as cash pledged as collateral. Non-cash collateral pledged by the Funds, if any, is noted in the Schedule of Investments. Generally, the amount of collateral due from or to a party must exceed a minimum transfer amount threshold before a transfer has to be made. To the extent amounts due to the Funds from their counterparties are not fully collateralized, contractually or otherwise, the Funds bear the risk of loss from counterparty nonperformance.
The following is a summary by counterparty of the market value of OTC financial derivative instruments and collateral (received)/pledged for the International Government Fixed Income Fund as of October 31, 2021:
| Counterparty | | Gross
Assets Recognized in the Statement of Assets and Liabilities | | | Gross
Liabilities Recognized in the Statement of Assets and Liabilities | | | Net
Amount Available
to be
Offset | | | Cash
Collateral Pledged or (Received) | | | Net
Amount† | |
| Brown Brothers Harriman | | | | | | | | | | | | | | | | | | | | |
| Total | | | | | | | | | | | | | | | | | | | | |
† Represents the net receivable/(payable) that would be due from/to the counterparty in the event of default. Exposure from OTC financial derivative instruments can only be netted across transactions governed under the same master agreement with the same legal entity.
Dividends and distributions to shareholders — The International Fund, Emerging Markets Fund, U.S. Small Cap Equity Fund and Global Listed Infrastructure Fund distribute their net investment income at least annually. The Fixed Income Fund distributes its net investment income quarterly. For each Fund, net realized capital gains, if any, are distributed at least annually. All distributions are recorded on ex-dividend date.
| Gallery Trust | | October 31, 2021
|
| |
|
NOTES TO FINANCIAL STATEMENTS (Continued)
Offering Costs — During the year ended October 31, 2020, the Global Equity Value Fund incurred offering costs which were being amortized to expense over a twelve month period. As of October 31, 2021, the offering costs have been fully amortized by the Fund.
Expenses — Expenses that are directly related to the Fund are charged to the Fund. Other operating expenses of the Trust are prorated to the funds based on the number of funds and/or relative daily net assets.
Investments in REITs — Dividend income from Real Estate Investment Trusts (“REIT”) is recorded based on the income included in distributions received from the REIT investments using published REIT reclassifications, including some management estimates when actual amounts are not available. Distributions received in excess of this estimated amount are recorded as a reduction of the cost of investments or reclassified to capital gains. The actual amounts of income, return of capital, and capital gains are determined by each REIT only after its fiscal year-end, and may differ from the estimated amounts.
| 3. | Transactions with affiliates |
Certain officers of the Trust are also employees of SEI Investments Global Funds Services (the “Administrator”), a wholly owned subsidiary of SEI Investments Company, and/or SEI Investments Distribution Co. (the “Distributor”). Such officers are paid no fees by the Trust, other than the Chief Compliance Officer (“CCO”) as described below, for serving as officers of the Trust.
A portion of the services provided by the CCO and his staff, who are employees of the Administrator, are paid for by the Trust as incurred. The services include regulatory oversight of the Trust’s advisors and service providers, as required by SEC regulations. The CCO’s services and fees have been approved by and are reviewed by the Board.
| 4. | Administration, Custodian, Transfer Agent and
Distribution Agreements |
The Funds and the Administrator are parties to an Administration Agreement under which the Administrator provides administrative services to the Funds. For these services, the Administrator is paid an asset based fee, which will vary depending on the number of share classes and the average daily net assets of
| Gallery Trust | | October 31, 2021
|
| |
|
NOTES TO FINANCIAL STATEMENTS (Continued)
the Funds. For the year ended October 31, 2021, the amounts paid for these services are represented in the table below:
| | | Accounting and Administration Fees | |
International Value Equity Fund | | $ | 674,802 | |
| Emerging Markets Value Equity Fund | | | 20,982 | |
| International Government Fixed Income Fund | | | 24,884 | |
U.S. Small Cap Equity Fund | | | 1,620 | |
| Global Listed Infrastructure Fund | | | 1,662 | |
Global Equity Value Fund | | | 36,532 | |
Expenses incurred under the agreements are shown on the Statement of Operations as “Accounting and administration fees”.
Brown Brothers Harriman & Co., (the “Custodian”) serves as the Funds’ Custodian pursuant to a custody agreement. Apex Fund Services (the “Transfer Agent”) serves as the Funds’ Transfer Agent pursuant to a transfer agency agreement.
| 5. | Investment Advisory Agreement |
Under the terms of an investment advisory agreement, the Adviser provides investment advisory services to the Funds. The Adviser is entitled to a fee, which is calculated daily and paid monthly, at an annual rate for each fund. The table below shows the rate of each Fund’s investment advisory fee.
| | | | |
International Value Equity Fund | | | 0.65 | % |
| Emerging Markets Value Equity Fund | | | 0.75 | % |
| International Government Fixed Income Fund | | | 0.50 | % |
U.S. Small Cap Equity Fund | | | 0.80 | % |
| Global Listed Infrastructure Fund | | | 0.85 | % |
Global Equity Value Fund | | | 0.65 | % |
Prior to September 24, 2018, the Delaware Predecessor Adviser was paid a fee at an annual rate of 1.00% of the Emerging Markets Predecessor Fund’s average daily net assets and 0.60% of the average daily net assets of the Fixed Income Predecessor Fund’s average daily net assets. The Predecessor Adviser paid
| Gallery Trust | | October 31, 2021
|
| |
|
NOTES TO FINANCIAL STATEMENTS (Continued)
Mondrian a sub-advisory fee for its services as sub-adviser to each Predecessor Fund out of the advisory fees that the Predecessor Adviser received from the Predecessor Fund.
The Adviser has contractually agreed to reduce its fees and/or reimburse expenses to the extent necessary to keep total annual Fund operating expenses (excluding interest, taxes, brokerage commissions, acquired fund fees and expenses, and non-routine (collectively “excluded expenses”)) from exceeding the below percentages of the average daily net assets of the Funds until February 28, 2022 (the “Expense Limitation”). Refer to waiver of investment advisory fees on the Statement of Operations for fees waived for the year ended October 31, 2021.
| | | | |
International Value Equity Fund | | | 0.74 | % |
| Emerging Markets Value Equity Fund | | | 0.92 | % |
| International Government Fixed Income Fund | | | 0.60 | % |
U.S. Small Cap Equity Fund | | | 0.90 | % |
| Global Listed Infrastructure Fund | | | 0.95 | % |
Global Equity Value Fund | | | 0.74 | % |
This agreement may be terminated: (i) by the Board for any reason at any time, or (ii) by the Adviser, upon ninety (90) days’ prior written notice to the Trust, effective as of the close of business on February 28, 2022.
Prior to September 24, 2018, the Delaware Predecessor Adviser had contractually agreed through July 30, 2019, to limit the total annual fund operating expenses charged, excluding interest, taxes and certain non-routine expenses to 1.20% and 0.75% of the average daily net assets of the Emerging Markets Predecessor Fund and Fixed Income Predecessor Fund respectively.
| 6. | Investment transactions |
The cost of purchases and proceeds from security sales other than long-term U.S. Government and short-term securities for the year ended October 31, 2021, are as follows:
| Gallery Trust | | October 31, 2021
|
| |
|
NOTES TO FINANCIAL STATEMENTS (Continued)
| | | | | | | | | U.S. Government Purchases | | | U.S. Government Sales and Maturities | |
International Value Equity Fund | | $ | 207,977,922 | | | $ | 117,903,021 | | | $ | — | | | $ | — | |
| Emerging Markets Value Equity Fund | | | 20,922,847 | | | | 10,008,188 | | | | — | | | | — | |
| International Government Fixed Income Fund | | | 6,028,403 | | | | 12,282,177 | | | | — | | | | 429,922 | |
U.S. Small Cap Equity Fund | | | 753,770 | | | | 589,292 | | | | — | | | | — | |
| Global Listed Infrastructure Fund | | | 677,467 | | | | 621,970 | | | | — | | | | — | |
Global Equity Value Fund | | | 101,070,883 | | | | 23,163,441 | | | | — | | | | — | |
| 7. | Federal tax information |
The amount and character of income and capital gain distributions to be paid, if any, are determined in accordance with Federal income tax regulations, which may differ from U.S. GAAP. As a result, net investment income/(loss) and net realized gain/(loss) on investment transactions for a reporting period may differ significantly from distributions during such period. These book/tax differences may be temporary or permanent. To the extent these differences are permanent in nature, they are charged or credited to distributable earnings or paid-in capital, as appropriate, in the period that the differences arise.
The permanent differences primarily consist of foreign currency translations, reclassification of long term capital gain distribution on REITs, investments in publicly traded partnerships, investments in PFICs, net operating losses offset to short-term capital gain and distribution reclassification. The permanent difference that is credited or charged to Paid-in Capital and Distributable Earnings as of October 31, 2021 is primarily related to distribution in excess:
| | | | | | | |
| International Government Fixed Income Fund | | $ | 863,144 | | | $ | (863,144 | ) |
These reclassifications have no impact on net assets or net asset value per share.
| Gallery Trust | | October 31, 2021
|
| |
|
NOTES TO FINANCIAL STATEMENTS (Continued)
The character of distributions made during the year from net investment income or net realized gains may differ from their ultimate characterization for federal income tax purposes. Also, due to the timing of dividend distributions, the fiscal year in which amounts are distributed may differ from the year that the income or realized gains (losses) were recorded by the Funds. Income dividends and capital gain distributions are determined in accordance with federal income tax regulations, which may differ from U.S. GAAP. These differences are primarily due to differing treatments for forwards, foreign currency transactions, wash sale loss deferrals, investments in REIT’s and investments in PFICs. Distributions during the years ended October 31, 2021 and October 31, 2020, unless otherwise noted, were as follows:
| | | | | | | | | | | | | |
| International Value Equity Fund | | | | | | | | | | | | |
| 2021 | | | 13,339,486 | | | | — | | | | — | | | | 13,339,486 | |
| 2020 | | | 21,157,929 | | | | 15,373,629 | | | | — | | | | 36,531,558 | |
| Emerging Markets Value Equity Fund | | | | | | | | | | | | | | | | |
| 2021 | | | 480,237 | | | | — | | | | — | | | | 480,237 | |
| 2020 | | | 1,320,379 | | | | — | | | | — | | | | 1,320,379 | |
| International Government Fixed Income Fund | | | | | | | | | | | | | | | | |
| 2021 | | | 993,720 | | | | — | | | | — | | | | 993,720 | |
| 2020 | | | 581,145 | | | | 569,510 | | | | — | | | | 1,150,655 | |
| U.S. Small Cap Equity Fund | | | | | | | | | | | | | | | | |
| 2021 | | | 4,682 | | | | — | | | | — | | | | 4,682 | |
| 2020 | | | 54,959 | | | | — | | | | 1,714 | | | | 56,673 | |
| Global Listed Infrastructure Fund | | | | | | | | | | | | | | | | |
| 2021 | | | 43,672 | | | | 49,270 | | | | — | | | | 92,942 | |
| 2020 | | | 101,676 | | | | — | | | | — | | | | 101,676 | |
| Global Equity Value Fund | | | | | | | | | | | | | | | | |
| 2021 | | | 48,411 | | | | — | | | | — | | | | 48,411 | |
| 2020* | | | — | | | | — | | | | — | | | | — | |
* Period end October 31.
As of October 31, 2021, the components of Distributable Earnings on a tax basis were as follows:
| Gallery Trust | | October 31, 2021
|
| |
|
NOTES TO FINANCIAL STATEMENTS (Continued)
| | | International Value Equity
Fund | | | Emerging
Markets Value Equity Fund | | | International Government
Fixed Income Fund | |
| Undistributed Ordinary Income | | $ | 22,004,598 | | | $ | 299,062 | | | $ | — | |
| Undistributed Long-Term Capital Gain | | | — | | | | — | | | | — | |
| Capital Loss Carryforwards | | | (957,022 | ) | | | (105,551,483 | ) | | | — | |
| Late-Year Loss Deferral | | | — | | | | — | | | | — | |
| Unrealized Appreciation | | | 28,351,614 | | | | 1,033,165 | | | | 249,258 | |
| Other Temporary Differences | | | | | | | | | | | | |
| Total Distributable Earnings (Accumulated Losses) | | | | | | | | | | | | |
| | | U.S. Small Cap Equity Fund | | | Global Listed Infrastructure Fund | | | | |
| Undistributed Ordinary Income | | $ | 48,987 | | | $ | 54,412 | | | $ | 1,211,729 | |
| Undistributed Long-Term Capital Gain | | | 14,027 | | | | 57,365 | | | | 95,722 | |
| Capital Loss Carryforwards | | | — | | | | — | | | | — | |
| Late-Year Loss Deferral | | | — | | | | — | | | | — | |
| Unrealized Appreciation | | | 239,980 | | | | 150,145 | | | | 835,164 | |
| Other Temporary Differences | | | | | | | | | | | | |
| Total Distributable Earnings (Accumulated Losses) | | | | | | | | | | | | |
* Other Temporary Differences include losses deferred on straddle transactions fir tax purposes.
Capital losses that are carried forward will retain their character as either short-term or long-term capital losses. The Funds have capital losses carried forward as follows:
| | | | | | | | | | |
| International Value Equity Fund | | $ | — | | | $ | 957,022 | | | $ | 957,022 | |
| Emerging Markets Value Equity Fund | | | 24,408,384 | | | | 81,143,099 | | | | 105,551,483 | * |
* The utilization of this amount is subject to significant limitation under IRC section 382-384.
| Gallery Trust | | October 31, 2021
|
| |
|
NOTES TO FINANCIAL STATEMENTS (Continued)
During the fiscal year ended September 30, 2021, the following Funds utilized capital loss carryforward to offset capital gains:
| | | | |
International Value Equity Fund | | $ | 18,851,331 | |
| Emerging Markets Value Equity Fund | | | 1,572,287 | |
U.S. Small Cap Equity Fund | | | 76,944 | |
For Federal income tax purposes the difference between Federal tax cost and book cost primarily relates to passive foreign investment companies, investments in publicly traded partnerships, forwards and wash sales which cannot be used for Federal income tax purposes in the current year and have been deferred for use in future years. The Federal tax cost and aggregate gross unrealized appreciation and depreciation for the investments held by the Funds at October 31, 2021, were as follows:
| | | | | | Aggregate
Gross
Unrealized
Appreciation | | | Aggregate
Gross
Unrealized
Depreciation | | | Net Unrealized
Appreciation
(Depreciation) | |
| International Value Equity Fund | | $ | 673,951,371 | | | $ | 81,870,968 | | | $ | (53,519,355 | ) | | $ | 28,351,613 | |
| Emerging Markets Value Equity Fund | | 23,902,956 | | | 3,755,770 | | | (2,722,606) | | | 1,033,164 | |
| International Government Fixed Income Fund | | 15,567,124 | | | 743,620 | | | (494,362) | | | 249,258 | |
| U.S. Small Cap Equity Fund | | 1,518,598 | | | 345,620 | | | (105,640) | | | 239,980 | |
| Global Listed Infrastructure Fund | | 1,563,766 | | | 234,017 | | | (83,872) | | | 150,145 | |
| Global Equity Value Fund | | 81,264,501 | | | 5,016,266 | | | (4,181,102) | | | 835,164 | |
| Gallery Trust | | October 31, 2021
|
| |
|
NOTES TO FINANCIAL STATEMENTS (Continued)
The share transactions are shown below:
| | | Mondrian International
Value Equity Fund | |
| | | Year ended
October 31, 2021 | | | Year ended
October 31, 2020 | |
Shares transactions: | | | | | | |
| Institutional Class shares | | | | | | |
Issued | | | 12,624,378 | | | | 10,819,338 | |
Reinvestment of dividends | | | 795,503 | | | | 1,856,359 | |
Redeemed | | | | | | | | |
| Net increase/(decrease) in shares outstanding | | | | | | | | |
| | | Mondrian Emerging
Markets Value Equity Fund | |
| | | Year ended
October 31, 2021 | | | Year ended
October 31, 2020 | |
Shares transactions: | | | | | | |
| Institutional Class shares | | | | | | |
Issued | | | 1,728,950 | | | | 640,147 | |
Reinvestment of dividends | | | 55,324 | | | | 170,152 | |
Redeemed | | | | | | | | |
| Net increase/(decrease) in shares outstanding | | | | | | | | |
| | | Mondrian International
Government Fixed Income Fund | |
| | | Year ended
October 31, 2021 | | | Year ended
October 31, 2020 | |
Shares transactions: | | | | | | |
| Institutional Class shares | | | | | | |
Issued | | | 175,808 | | | | 202,349 | |
Reinvestment of dividends | | | 95,085 | | | | 113,648 | |
Redeemed | | | | | | | | |
| Net decrease in shares outstanding | | | | | | | | |
| Gallery Trust | | October 31, 2021
|
| |
|
NOTES TO FINANCIAL STATEMENTS (Continued)
| | Mondrian U.S. Small Cap Equity Fund | |
| | | Year ended
October 31, 2021 | | | Year ended
October 31, 2020 | |
Shares transactions: | | | | | | |
| Institutional Class shares | | | | | | |
Issued | | | 13,367 | | | | — | |
Reinvestment of dividends | | | 431 | | | | 4,694 | |
Redeemed | | | | | | | | |
| Net increase in shares outstanding | | | | | | | | |
| | | Mondrian Global Listed
Infrastructure Fund | |
| | | Year ended
October 31, 2021 | | | Year ended
October 31, 2020 | |
Shares transactions: | | | | | | |
| Institutional Class shares | | | | | | |
Issued | | | — | | | | — | |
Reinvestment of dividends | | | | | | | | |
| Net increase in shares outstanding | | | | | | | | |
| | | Mondrian Global Equity Value Fund | |
| | | Year ended
October 31, 2021 | | | For the
period ended October 31, 2020(1) | |
Shares transactions: | | | | | | |
| Institutional Class shares | | | | | | |
Issued | | | 7,121,513 | | | | 254,840 | |
Reinvestment of dividends | | | 4,212 | | | | — | |
Redeemed | | | | | | | | |
| Net increase in shares outstanding | | | | | | | | |
| (1) | The Fund commenced operations June 30, 2020. |
| 9. | Risks associated with financial instruments |
As with all mutual funds, a shareholder of a Fund is subject to the risk that his or her investment could lose money. The Funds are subject to the principal risks noted below, any of which may adversely affect the Funds’ net asset value and ability to meet its investment objective. A more complete description of risks associated with each Fund is included in the prospectus.
| Gallery Trust | | October 31, 2021
|
| |
|
NOTES TO FINANCIAL STATEMENTS (Continued)
Active management risk
The Funds are subject to the risk that the Adviser’s judgments about the attractiveness, value, or potential appreciation of the Funds’ investments may prove to be incorrect. If the investments selected and strategies employed by the Funds fail to produce the intended results, the Funds could underperform in comparison to its benchmark index or other funds with similar objectives and investment strategies.
Equity risk
Since it purchases equity securities, the Funds are subject to the risk that stock prices may fall over short or extended periods of time. Historically, the equity markets have moved in cycles, and the value of the Funds’ equity securities may fluctuate from day to day. Individual companies may report poor results or be negatively affected by industry and/or economic trends and developments. The prices of securities issued by such companies may suffer a decline in response. These factors contribute to price volatility, which is the principal risk of investing in the Funds.
Convertible securities risk
The value of a convertible security is influenced by changes in interest rates (with investment value declining as interest rates increase and increasing as interest rates decline) and the credit standing of the issuer. The price of a convertible security will also normally vary in some proportion to changes in the price of the underlying common stock because of the conversion or exercise feature.
Large capitalization company risk
The large capitalization companies in which the Funds may invest may lag the performance of smaller capitalization companies because large capitalization companies may experience slower rates of growth than smaller capitalization companies and may not respond as quickly to market changes and opportunities.
Preferred stocks risk
Preferred stocks are sensitive to interest rate changes, and are also subject to equity risk, which is the risk that stock prices will fall over short or extended periods of time. The rights of preferred stocks on the distribution of a company’s assets in the event of a liquidation are generally subordinate to the rights associated with a company’s debt securities.
| Gallery Trust | | October 31, 2021
|
| |
|
NOTES TO FINANCIAL STATEMENTS (Continued)
Foreign company risk
Investing in foreign companies, including direct investments and investments through depositary receipts, poses additional risks since political and economic events unique to a country or region will affect those markets and their issuers. These risks will not necessarily affect the U.S. economy or similar issuers located in the U.S. Securities of foreign companies may not be registered with the SEC and foreign companies are generally not subject to the regulatory controls imposed on U.S. issuers and, as a consequence, there is generally less publically available information about foreign securities than is available about domestic securities. Income from foreign securities owned by the Funds may be reduced by a withholding tax at the source, which tax would reduce income received from the securities comprising the portfolio. Foreign securities may also be more difficult to value than securities of U.S. issuers. While depositary receipts provide an alternative to directly purchasing the underlying foreign securities in their respective national markets and currencies, investments in depositary receipts continue to be subject to many of the risks associated with investing directly in foreign securities.
Emerging markets securities risk
The Funds’ investments in emerging markets securities are considered speculative and subject to heightened risks in addition to the general risks of investing in foreign securities. Unlike more established markets, emerging markets may have governments that are less stable, markets that are less liquid and economies that are less developed. In addition, the securities markets of emerging market countries may consist of companies with smaller market capitalizations and may suffer periods of relative illiquidity; significant price volatility; restrictions on foreign investment; and possible restrictions on repatriation of investment income and capital. Furthermore, foreign investors may be required to register the proceeds of sales, and future economic or political crises could lead to price controls, forced mergers, expropriation or confiscatory taxation, seizure, nationalization or creation of government monopolies.
Foreign currency risk
As a result of the Funds’ investments in securities denominated in, and/or receiving revenues in, foreign currencies, the Funds will be subject to currency risk. Currency risk is the risk that foreign currencies will decline in value relative to the U.S. dollar or, in the case of hedging positions, that the U.S. dollar will decline in value relative to the currency hedged. In either event, the dollar value of an investment in the Funds would be adversely affected.
| Gallery Trust | | October 31, 2021
|
| |
|
NOTES TO FINANCIAL STATEMENTS (Continued)
Depositary receipts risk
Investments in depositary receipts may be less liquid and more volatile than the underlying securities in their primary trading market. If a depositary receipt is denominated in a different currency than its underlying securities, the Funds will be subject to the currency risk of both the investment in the depositary receipt and the underlying security. Holders of depositary receipts may have limited or no rights to take action with respect to the underlying securities or to compel the issuer of the receipts to take action. The prices of depositary receipts may differ from the prices of securities upon which they are based. Certain of the depositary receipts in which the Fund invests may be unsponsored depositary receipts. Unsponsored depositary receipts may not provide as much information about the underlying issuer and may not carry the same voting privileges as sponsored depositary receipts. Unsponsored depositary receipts are issued by one or more depositaries in response to market demand, but without a formal agreement with the company that issues the underlying securities.
Derivatives risk
The Funds’ use of forward contracts and participatory notes is subject to market risk, correlation risk, credit risk, valuation risk and liquidity risk. Market risk is the risk that the market value of an investment may move up and down, sometimes rapidly and unpredictably. Correlation risk is the risk that changes in the value of the derivative may not correlate perfectly or at all with the underlying asset, rate or index. Credit risk is the risk that the counterparty to a derivative contract will default or otherwise become unable to honor a financial obligation. Valuation risk is the risk that the derivative may be difficult to value. Liquidity risk is described below. The Funds’ use of forwards is also subject to leverage risk and hedging risk. Leverage risk is the risk that the use of leverage may amplify the effects of market volatility on the Fund’s share price and may also cause the Fund to liquidate portfolio positions when it would not be advantageous to do so in order to satisfy its obligations. Hedging risk is the risk that derivatives instruments used for hedging purposes may also limit any potential gain that may result from the increase in value of the hedged asset. To the extent that the Funds engage in hedging strategies, there can be no assurance that such strategy will be effective or that there will be a hedge in place at any given time. Each of these risks could cause the Funds to lose more than the principal amount invested in a derivative instrument.
| Gallery Trust | | October 31, 2021
|
| |
|
NOTES TO FINANCIAL STATEMENTS (Continued)
Liquidity risk
Certain securities may be difficult or impossible to sell at the time and the price that the Funds would like. The Funds may have to lower the price, sell other securities instead or forgo an investment opportunity, any of which could have a negative effect on Fund management or performance.
Portfolio turnover risk
Due to their investment strategies, the Funds may buy and sell securities frequently. This may result in higher transaction costs and additional capital gains tax liabilities.
Large purchase and redemption risk
Large purchases or redemptions of the Fund’s shares may force the Fund to purchase or sell securities at times when it would not otherwise do so, and may cause the Fund’s portfolio turnover rate and transaction costs to rise, which may negatively affect the Fund’s performance and have adverse tax consequences for Fund shareholders.
Fixed income risk
Fixed income securities are subject to a number of risks, including credit and interest rate risks. Credit risk is the risk that the issuer or obligor will not make timely payments of principal and interest. Changes in an issuer’s credit rating or the market’s perception of an issuer’s creditworthiness may also affect the value of the Fund’s investment in that issuer. Interest rate risk is the risk that the value of a fixed income security will fall when interest rates rise. In general, the longer the maturity of a fixed income security, the more likely its value will decline when interest rates rise. Risks associated with rising interest rates are heightened given that interest rates in the U.S. are at, or near, historic lows.
Zero-coupon bond risk
The market value of a zero-coupon bond is generally more volatile than the market value of other fixed income securities with similar maturities that pay interest periodically. In addition, federal income tax law requires that the holder of a zero coupon bond accrue a portion of the discount at which the bond was purchased as taxable income each year. The Fund may consequently have to dispose of portfolio securities under disadvantageous circumstances to generate cash to satisfy its requirement as a regulated investment company to distribute all of its net income (including non-cash income attributable to zero-coupon securities). These actions may reduce the assets to which the Fund’s expenses could otherwise be allocated and may reduce the Fund’s rate of return.
| Gallery Trust | | October 31, 2021
|
| |
|
NOTES TO FINANCIAL STATEMENTS (Continued)
Foreign sovereign debt securities risk
The Funds’ investments in foreign sovereign debt securities are subject to the risks that: (i) the governmental entity that controls the repayment of sovereign debt may not be willing or able to repay the principal and/or interest when it becomes due, due to factors such as debt service burden, political constraints, cash flow problems and other national economic factors; (ii) governments may default on their debt securities, which may require holders of such securities to participate in debt rescheduling or additional lending to defaulting governments; and (iii) there is no bankruptcy proceeding by which defaulted sovereign debt may be collected in whole or in part.
Foreign government agencies risk
Bonds issued by government agencies, subdivisions or instrumentalities of foreign governments are generally backed only by the general creditworthiness and reputation of the entity issuing the bonds and may not be backed by the full faith and credit of the foreign government. Moreover, a foreign government that explicitly provides its full faith and credit to a particular entity may be, due to changed circumstances, unable or unwilling to provide that support. A foreign government agency’s operations and financial condition are influenced by the foreign government’s economic and other policies.
Supranational entities risk
Government members, or “stockholders,” usually make initial capital contribu-tions to a supranational entity and in many cases are committed to make additional capital contributions if the supranational entity is unable to repay its borrowings. There is no guarantee, however, that one or more stockholders of the supranational entity will continue to make any necessary additional capital contributions. If such contributions are not made, the entity may be unable to pay interest or repay principal on its debt securities, and the Funds may lose money on such investments.
Corporate fixed income securities risk
Corporate fixed income securities respond to economic developments, especially changes in interest rates, as well as perceptions of the creditworthiness and business prospects of individual issuers.
Investment Style Risk
The Mondrian Global Equity Value Fund pursues a “value style” of investing. Value investing focuses on companies with stocks that appear undervalued to the Adviser in light of factors such as the company’s earnings, book value,
| Gallery Trust | | October 31, 2021
|
| |
|
NOTES TO FINANCIAL STATEMENTS (Continued)
revenues or cash flow. The Adviser’s methodology for analyzing value may differ from other market approaches. If the Adviser’s assessment of market conditions, or a company’s value or its prospects for exceeding earnings expectations is inaccurate, the Fund could suffer losses or produce poor performance relative to other funds. In addition, “value stocks” can continue to be undervalued by the market for long periods of time.
Small- and Mid-Capitalization Company Risk
The small- and mid-capitalization companies in which a Fund may invest may be more vulnerable to adverse business or economic events than larger, more established companies. In particular, investments in these small- and mid-sized companies may pose additional risks, including liquidity risk, because these companies tend to have limited product lines, markets and financial resources, and may depend upon a relatively small management group. Therefore, small- and mid-cap stocks may be more volatile than those of larger companies. These securities may be traded over-the-counter or listed on an exchange.
Rights and Warrants Risk
Investments in rights or warrants involve the risk of loss of the purchase value of a right or warrant if the right to subscribe to additional shares is not exercised prior to the right’s or warrant’s expiration. Also, the purchase of rights and/or warrants involves the risk that the effective price paid for the right and/or warrant added to the subscription price of the underlying security may exceed the market price of the underlying security in instances such as those where there is no movement in the price of the underlying security.
Private Placements Risk
Investment in privately placed securities may be less liquid than in publicly traded securities. Although these securities may be resold in privately negotiated transactions, the prices realized from these sales could be less than those originally paid by the Fund or less than what may be considered the fair value of such securities. Further, companies whose securities are not publicly traded may not be subject to the disclosure and other investor protection requirements that might be applicable if their securities were publicly traded.
Risks of Investing in Other Investment Companies
To the extent a Fund invests in other investment companies, such as open-end funds, closed-end funds and ETFs, the Fund will be subject to substantially the same risks as those associated with the direct ownership of the securities held by such other investment companies. As a shareholder of another investment
| Gallery Trust | | October 31, 2021
|
| |
|
NOTES TO FINANCIAL STATEMENTS (Continued)
company, the Fund relies on that investment company to achieve its investment objective. If the investment company fails to achieve its objective, the value of the Fund’s investment could decline, which could adversely affect the Fund’s performance. By investing in another investment company, Fund shareholders indirectly bear the Fund’s proportionate share of the fees and expenses of the other investment company, in addition to the fees and expenses that Fund shareholders directly bear in connection with the Fund’s own operations.
Because ETFs and certain closed-end funds are listed on national stock exchanges and are traded like stocks listed on an exchange, their shares potentially may trade at a discount or premium. Investments in ETFs and certain closed-end funds are also subject to brokerage and other trading costs, which could result in greater expenses to the Fund. In addition, because the value of ETF and certain closed-end fund shares depends on the demand in the market, the Adviser may not be able to liquidate the Fund’s holdings at the most optimal time, which could adversely affect Fund performance.
REITs Risk
REITs are pooled investment vehicles that own, and usually operate, income- producing real estate. REITs are susceptible to the risks associated with direct ownership of real estate, such as the following: declines in property values; increases in property taxes, operating expenses, interest rates or competition; overbuilding; zoning changes; and losses from casualty or condemnation. REITs typically incur fees that are separate from those of the Fund. Accordingly, the Fund’s investments in REITs will result in the layering of expenses such that shareholders will indirectly bear a proportionate share of the REITs’ operating expenses, in addition to paying Fund expenses. REIT operating expenses are not reflected in the fee table and example in this prospectus.
MLPs Risk
MLPs are limited partnerships in which the ownership units are publicly traded. MLPs often own several properties or businesses (or own interests) that are related to oil and gas industries or other natural resources, but they also may finance other projects. To the extent that an MLP’s interests are all in a particular industry, such as the energy industry, the MLP will be negatively impacted by economic events adversely impacting that industry. Additional risks of investing in an MLP also include those involved in investing in a partnership as opposed to a corporation. For example, state law governing partnerships is often less restrictive than state law governing corporations. Accordingly, there may be fewer protections afforded to investors in an MLP
| Gallery Trust | | October 31, 2021
|
| |
|
NOTES TO FINANCIAL STATEMENTS (Continued)
than investors in a corporation; for example, investors in MLPs may have limited voting rights or be liable under certain circumstances for amounts greater than the amount of their investment. In addition, MLPs may be subject to state taxation in certain jurisdictions which will have the effect of reducing the amount of income paid by the MLP to its investors. A Fund’s investment in MLPs may result in the layering of expenses, such that shareholders will indirectly bear a proportionate share of the MLPs’ operating expenses, in addition to paying Fund expenses. MLP operating expenses are not reflected in the fee table and example in this prospectus.
Energy companies are affected by worldwide energy prices and costs related to energy production. These companies may have significant operations in areas at risk for natural disasters, social unrest and environmental damage. These companies may also be at risk for increased government regulation and intervention, energy conservation efforts, litigation and negative publicity and perception.
Geographic Focus Risk
To the extent that a Fund focuses its investments in a particular country or geographic region, the Fund may be more susceptible to economic, political, regulatory or other events or conditions affecting issuers and countries within that country or geographic region. As a result, the Fund may be subject to greater price volatility and risk of loss than a fund holding more geographically diverse investments.
Stock Connect Investing Risk
Trading through Stock Connect is subject to a number of restrictions that may affect a Fund’s investments and returns, including a daily quota that limits the maximum net purchases under Stock Connect each day. In addition, investments made through Stock Connect are subject to relatively untested trading, clearance and settlement procedures. Moreover, A-Shares purchased through Stock Connect generally may only be sold or otherwise transferred through Stock Connect. The Fund’s investments in A-Shares purchased through Stock Connect are generally subject to Chinese securities regulations and listing rules. While overseas investors currently are exempt from paying capital gains or value added taxes on income and gains from investments in A-Shares purchased through Stock Connect, these tax rules could be changed, which could result in unexpected tax liabilities for the Fund. Stock Connect operates only on days when both the Chinese and Hong Kong markets are open for trading and when banks in both markets are open on the corresponding
| Gallery Trust | | October 31, 2021
|
| |
|
NOTES TO FINANCIAL STATEMENTS (Continued)
settlement days. Therefore, the Fund may be subject to the risk of price fluctuations of A-Shares when Stock Connect is not trading.
U.S. Government Securities Risk
A Fund’s investment in U.S. government obligations may include securities issued or guaranteed as to principal and interest by the U.S. government, or its agencies or instrumentalities. Payment of principal and interest on U.S. government obligations may be backed by the full faith and credit of the United States or may be backed solely by the issuing or guaranteeing agency or instrumentality itself. There can be no assurance that the U.S. government would provide financial support to its agencies or instrumentalities (including government-sponsored enterprises) where it is not obligated to do so. In addi-tion, U.S. government securities are not guaranteed against price movements due to changing interest rates.
High Yield Bond Risk
High yield, or “junk”, bonds are debt securities rated below investment grade. High yield bonds are speculative, involve greater risks of default, downgrade, or price declines and are more volatile and tend to be less liquid than investment-grade securities. Companies issuing high yield bonds are less financially strong, are more likely to encounter financial difficulties, and are more vulnerable to adverse market events and negative sentiments than companies with higher credit ratings.
Non-diversification risk
The Fixed Income Fund and Global Equity Value Fund are classified as “non-diversified,” which means they may invest a larger percentage of their assets in a smaller number of issuers than diversified funds. To the extent the Funds invest their assets in a smaller number of issuers, the Funds will be more susceptible to negative events affecting those issuers than diversified funds.
Market Risk
The prices of and the income generated by a Fund’s securities may decline in response to, among other things, investor sentiment, general economic and market conditions, regional or global instability, and currency and interest rate fluctuations. In addition, the impact of any epidemic, pandemic or natural disaster, or widespread fear that such events may occur, could negatively affect the global economy, as well as the economies of individual countries, the financial performance of individual companies and sectors, and the markets in
| Gallery Trust | | October 31, 2021
|
| |
|
NOTES TO FINANCIAL STATEMENTS (Continued)
general in significant and unforeseen ways. Any such impact could adversely affect the prices and liquidity of the securities and other instruments in which a Fund invests, which in turn could negatively impact the Fund’s performance and cause losses on your investment in the Fund. Similarly, the impact of any epidemic, pandemic or natural disaster, or widespread fear that such events may occur, could negatively affect the global economy, as well as the economies of individual countries, the financial performance of individual companies and sectors, and the markets in general in significant and unforeseen ways. Any such impact could adversely affect the prices and liquidity of the securities and other instruments in which the Fund invests, which in turn could negatively impact the Fund’s performance and cause losses on your investment in the Fund.
In the normal course of business, the Funds enter into contracts that provide general indemnifications. The Funds’ maximum exposure under these arrangements is dependent on future claims that may be made against the Funds and, therefore, cannot be established; however, based on experience, the risk of loss from such claims is considered remote.
The Funds have access to custodian overdraft facilities. A Fund may have utilized the overdraft facility and incurred an interest expense, which is disclosed on the fund’s Statement of Operations, if any. The interest expense is determined based on a negotiated rate above the current Federal Funds Rate. For the year ended October 31, 2021, the Funds utilized the overdraft facilities but none of the Funds incurred any interest expense.
At October 31, 2021, the percentage of total shares outstanding held by a limited number of shareholders for each Fund, which were comprised of omnibus accounts that were held on behalf of various individual shareholders was as follows:
| Gallery Trust | | October 31, 2021
|
| |
|
NOTES TO FINANCIAL STATEMENTS (Continued)
| | | | | | | |
International Value Equity Fund | | | 5 | | | | 71 | % |
| Emerging Markets Value Equity Fund | | | 2 | | | | 86 | % |
| International Government Fixed Income Fund | | | 3 | | | | 90 | % |
U.S. Small Cap Equity Fund | | | 2 | | | | 100 | % |
Global Listed Infrastructure Fund | | | 1 | | | | 100 | % |
Global Equity Value Fund | | | 3 | | | | 71 | % |
On September 7, 2021, Brown Brothers Harriman & Co. (“BBH”), the Funds’ custodian, announced that it had entered into an agreement with State Street Bank and Trust Company (“State Street”) to sell BBH’s Investor Services business to State Street (the “Transaction”). The Transaction is subject to certain closing conditions, including regulatory and customary approvals, and it is expected to be consummated in the first quarter of 2022 (the “Closing Date”). Consequently, as a result of the Transaction, it is expected that State Street will replace BBH as the Funds’ custodian effective as of the Closing Date.
The Funds have evaluated the need for disclosures (other than what is disclosed in the preceding paragraph) and/or adjustments resulting from subsequent events through the date the financials were issued. Based on this evaluation, no disclosures and/or adjustments were required to the financial statements as of October 31, 2021.
| Gallery Trust | | October 31, 2021
|
| |
|
REPORT OF INDEPENDENT REGISTERED PUBLIC ACCOUNTING FIRM
To the Board of Trustees of Gallery Trust and Shareholders of Mondrian International Value Equity Fund, Mondrian Emerging Markets Value Equity Fund, Mondrian International Government Fixed Income Fund, Mondrian U.S. Small Cap Equity Fund, Mondrian Global Listed Infrastructure Fund and Mondrian Global Equity Value Fund
Opinions on the Financial Statements
We have audited the accompanying statements of assets and liabilities, including the schedules of investments, of each of the funds indicated in the table below (constituting Gallery Trust, hereafter collectively referred to as the “Funds”) as of October 31, 2021, the related statements of operations and of changes in net assets for each of the periods indicated in the table below, including the related notes, and the financial highlights for each of the periods indicated in the table below (collectively referred to as the “financial statements”). In our opinion, the financial statements present fairly, in all material respects, the financial position of each of the Funds as of October 31, 2021, the results of each of their operations and changes in each of their net assets and each of the financial highlights for each of the periods indicated in the table below, in conformity with accounting principles generally accepted in the United States of America.
Fund
| Statements of Operations
| Statements of changes in net assets
| Financial highlights
|
Mondrian International Value Equity Fund, Mondrian Emerging Markets Value Equity Fund, Mondrian International Government Fixed Income Fund, Mondrian U.S. Small Cap Equity Fund and Mondrian Global Listed Infrastructure Fund
| For the year ended October 31, 2021
| For each of the two years in the period ended October 31, 2021
| For each of the periods indicated therein
|
Mondrian Global Equity Value Fund
| For the year ended October 31, 2021 | For the year ended October 31, 2021 and for the period June 30, 2020 (commencement of operations) through October 31, 2020 |
| Gallery Trust | | October 31, 2021
|
| |
|
REPORT OF INDEPENDENT REGISTERED PUBLIC ACCOUNTING FIRM
Basis for Opinions
These financial statements are the responsibility of the Funds’ management. Our responsibility is to express an opinion on the Funds’ financial statements based on our audits. We are a public accounting firm registered with the Public Company Accounting Oversight Board (United States) (PCAOB) and are required to be independent with respect to the Funds in accordance with the U.S. federal securities laws and the applicable rules and regulations of the Securities and Exchange Commission and the PCAOB.
We conducted our audits of these financial statements in accordance with the standards of the PCAOB. Those standards require that we plan and perform the audit to obtain reasonable assurance about whether the financial statements are free of material misstatement, whether due to error or fraud.
Our audits included performing procedures to assess the risks of material misstatement of the financial statements, whether due to error or fraud, and performing procedures that respond to those risks. Such procedures included examining, on a test basis, evidence regarding the amounts and disclosures in the financial statements. Our audits also included evaluating the accounting principles used and significant estimates made by management, as well as evaluating the overall presentation of the financial statements. Our procedures included confirmation of securities owned as of October 31, 2021 by correspondence with the custodian and brokers; when replies were not received from brokers, we performed other auditing procedures. We believe that our audits provide a reasonable basis for our opinions.
/s/ PricewaterhouseCoopers LLP
Philadelphia, Pennsylvania
December 30, 2021
We have served as the auditor of one or more investment companies in Mondrian Investment Partners Limited since 2016.
| Gallery Trust | | October 31, 2021
|
| |
|
DISCLOSURE OF FUND EXPENSES
All mutual funds have operating expenses. As a shareholder of a mutual fund, your investment is affected by these ongoing costs, which include (among others) costs for fund management, administrative services, and shareholder reports like this one. It is important for you to understand the impact of these costs on your investment returns.
Operating expenses such as these are deducted from the mutual fund’s gross income and directly reduce its final investment return. These expenses are expressed as a percentage of the mutual fund’s average net assets; this percentage is known as the mutual fund’s expense ratio.
The following examples use the expense ratio and are intended to help you understand the ongoing costs (in dollars) of investing in your Fund and to compare these costs with those of other mutual funds. The examples are based on an investment of $1,000 made at the beginning of the period shown and held for the entire period from May 1, 2021 to October 31, 2021.
The table on the next page illustrates your Fund’s costs in two ways:
Actual Fund Return. This section helps you to estimate the actual expenses after fee waivers that your Fund incurred over the period. The “Expenses Paid During Period” column shows the actual dollar expense cost incurred by a $1,000 investment in the Fund, and the “Ending Account Value” number is derived from deducting that expense cost from the Fund’s gross investment return.
You can use this information, together with the actual amount you invested in the Fund, to estimate the expenses you paid over that period. Simply divide your ending starting account value by $1,000 to arrive at a ratio (for example, an $8,600 account value divided by $1,000 = 8.6), then multiply that ratio by the number shown for your Fund under “Expenses Paid During Period.”
Hypothetical 5% Return. This section helps you compare your Fund’s costs with those of other mutual funds. It assumes that the Fund had an annual 5% return before expenses during the year, but that the expense ratio (Column 3) for the period is unchanged. This example is useful in making comparisons because the Securities and Exchange Commission requires all mutual funds to make this 5% calculation. You can assess your Fund’s comparative cost by comparing the hypothetical result for your Fund in the “Expenses Paid During Period” column with those that appear in the same charts in the shareholder reports for other mutual funds.
| Gallery Trust | | October 31, 2021
|
| |
|
DISCLOSURE OF FUND EXPENSES
Note: Because the return is set at 5% for comparison purposes — NOT your Fund’s actual return — the account values shown may not apply to your specific investment.
| | Beginning
Account
Value
5/1/21 | | | Ending
Account
Value
10/31/21 | | | Annualized Expense
Ratios | | | Expenses
Paid
During
Period* | |
| Mondrian International Value Equity Fund | |
| Actual Fund Return | $ | 1,000.00 | | | $ | 1,034.00 | | | | 0.74 | % | | $ | 3.79 | |
| Hypothetical 5% Return | $ | 1,000.00 | | | $ | 1,021.48 | | | | 0.74 | % | | $ | 3.77 | |
| Mondrian Emerging Markets Value Equity Fund | |
| Actual Fund Return | $ | 1,000.00 | | | $ | 919.30 | | | | 0.92 | % | | $ | 4.45 | |
| Hypothetical 5% Return | $ | 1,000.00 | | | $ | 1,020.57 | | | | 0.92 | % | | $ | 4.69 | |
| Mondrian International Government Fixed Income Fund | |
| Actual Fund Return | $ | 1,000.00 | | | $ | 958.90 | | | | 0.60 | % | | $ | 2.96 | |
| Hypothetical 5% Return | $ | 1,000.00 | | | $ | 1,022.18 | | | | 0.60 | % | | $ | 3.06 | |
| Mondrian U.S. Small Cap Equity Fund | |
| Actual Fund Return | $ | 1,000.00 | | | $ | 981.00 | | | | 0.90 | % | | $ | 4.49 | |
| Hypothetical 5% Return | $ | 1,000.00 | | | $ | 1,020.67 | | | | 0.90 | % | | $ | 4.58 | |
| Mondrian Global Listed Infrastructure Fund | |
| Actual Fund Return | $ | 1,000.00 | | | $ | 1,012.60 | | | | 0.95 | % | | $ | 4.82 | |
| Hypothetical 5% Return | $ | 1,000.00 | | | $ | 1,020.42 | | | | 0.95 | % | | $ | 4.84 | |
| Mondrian Global Equity Value Fund | |
| Actual Fund Return | $ | 1,000.00 | | | $ | 1,020.60 | | | | 0.74 | % | | $ | 3.77 | |
| Hypothetical 5% Return | $ | 1,000.00 | | | $ | 1,021.48 | | | | 0.74 | % | | $ | 3.77 | |
| * | Expenses are equal to the Fund’s annualized expense ratio multiplied by the average account value over the period, multiplied by 184/365 (to reflect the one-half year period). |
| Gallery Trust | | October 31, 2021 (Unaudited)
|
| |
|
TRUSTEES AND OFFICERS OF THE GALLERY TRUST
Set forth below are the names, age, position with the Trust, length of term of office, and the principal occupations for the last five years of each of the persons currently serving as Trustees and Officers of the Trust. Trustees who are deemed not to be “interested persons” of the Trust are referred to as “Independent Trustees.” Mr. Doran is a Trustee who may be deemed to be “interested” persons of the Trust as that term is defined in the 1940 Act by virtue of their affiliation with the Trust’s Distributor. The Trust’s Statement of Additional Information (“SAI”) includes additional information about the Trustees and Officers. The SAI may be obtained without charge by calling 1-888-832-4386.
The following chart lists Trustees and Officers as of October 31, 2021.
Name
and Year
of Birth | Position(s)
Held with
the Trust and
Length of
Time Served1 | Principal Occupation(s)
During the
Past 5 Years | Other Directorships
Held by Board Member2 |
INTERESTED BOARD MEMBER 3,4 |
WILLIAM DORAN 1701 Market Street Philadelphia, PA 19103 (Born: 1940) | Chairman of the Board of Trustees
(Since 2014) | Self-Employed Consultant since 2003. Partner at Morgan, Lewis & Bockius LLP (law firm) from 1976 to 2003. Counsel to the Trust, SEI Investments, SIMC, the Administrator and the Distributor. Secretary of
SEI Investments
since 1978. | Current Directorships: Trustee of The Advisors’ Inner Circle Fund III, Schroder Series Trust, Schroder Global Series Trust, Delaware Wilshire Private Markets Master Fund, Delaware Wilshire Private Markets Fund, Delaware Wilshire Private Markets Tender Fund, SEI Daily Income Trust, SEI Institutional International Trust, SEI Institutional Investments Trust, SEI Institutional Managed Trust, SEI Asset Allocation Trust, SEI Tax Exempt Trust, Adviser Managed Trust, New Covenant Funds, SEI Insurance Products Trust and SEI Catholic Values Trust. Director of SEI Investments, SEI Investments (Europe), Limited, SEI Investments—Global Funds Services, Limited, SEI Investments Global, Limited, SEI Investments (Asia), Limited, SEI Global Nominee Ltd., SEI Investments – Unit Trust Management (UK) Limited and SEI Investments Co. Director of the Distributor. Former Directorships: Trustee of O’Connor EQUUS (closed-end investment company) to 2016. Trustee of SEI Liquid Asset Trust to 2016. Trustee of Winton Series Trust to 2017. Trustee of The Advisors’ Inner Circle Fund, The Advisors’ Inner Circle Fund II, Bishop Street Funds, The KP Funds and Winton Diversified Opportunities Fund (closed-end investment company) to 2018. |
| 1 | Each Trustee shall hold office during the lifetime of this trust until the election and qualification of his or her successor, or until he or she dies, resigns, or is removed in accordance with the Declaration of Trust. |
| 2 | Directorships of Companies required to report to the Securities and Exchange Commission under the Securities Exchange act of1934 (i.e., “public companies”) or other investment companies under the 1940 act. |
| 3 | Trustees oversee 6 Funds in the Trust. |
| 4 | Mr. Doran may be deemed to be an “interested” person of the Fund as that term is defined in the 1940 Act by virtue of his affiliation with the Distributor and/or its affiliates. |
| Gallery Trust | | October 31, 2021 (Unaudited)
|
| |
|
TRUSTEES AND OFFICERS OF THE GALLERY TRUST
Name
and Year
of Birth | Position(s)
Held with
the Trust and
Length of
Time Served1 | Principal Occupation(s)
During the
Past 5 Years | Other Directorships
Held by Board Member2 |
INDEPENDENT TRUSTEES 3 |
JON HUNT (Born: 1951) | Trustee
and Lead Independent
Trustee
(Since 2014) | Retired since 2013. Consultant to Management, Convergent Capital Management, LLC (“CCM”) from 2012 to 2013. Managing Director and Chief Operating Officer, CCM from 1998
to 2012. | Current Directorships: Trustee of The Advisors’ Inner Circle Fund III, City National Rochdale Funds, Schroder Series Trust, Schroder Global Series Trust, Delaware Wilshire Private Markets Master Fund, Delaware Wilshire Private Markets Fund and Delaware Wilshire Private Markets Tender Fund. Former Directorships: Trustee of O’Connor EQUUS (closed-end investment company) to 2016. Member of Independent Committee of Nuveen Commodities Asset Management to 2016. Trustee of Winton Series Trust to 2017. Trustee of Winton Diversified Opportunities Fund (closed-end investment company) to 2018. |
THOMAS LEMKE (Born:1954) | Trustee
(Since 2014) | Retired since 2013. Executive Vice President and General Counsel, Legg Mason, Inc.
from 2005
to 2013. | Current Directorships: Trustee of The Advisor’s’ Inner Circle Fund III, Schroder Series Trust, Schroder Global Series Trust, Delaware Wilshire Private Markets Master Fund, Delaware Wilshire Private Markets Fund, Delaware Wilshire Private Markets Tender Fund, JP Morgan Active Exchange-Traded Funds (33 Portfolios) and Symmetry Panoramic Trust (8 Portfolios). Former Directorships: Trustee of Munder Funds to 2014. Trustee of Victory Funds to 2015. Trustee of O’Connor EQUUS (closed-end investment company) to 2016. Trustee of Winton Series Trust and AXA Premier VIP Trust to 2017. Trustee of Winton Diversified Opportunities Fund (closed-end investment company) to 2018. |
| Gallery Trust | | October 31, 2021 (Unaudited)
|
| |
|
TRUSTEES AND OFFICERS OF THE GALLERY TRUST
Name
and Year
of Birth | Position(s)
Held with
the Trust and
Length of
Time Served1 | Principal Occupation(s)
During the
Past 5 Years | Other Directorships
Held by Board Member2 |
INDEPENDENT TRUSTEES 3 (continued) |
RANDALL YANKER (Born: 1960) | Trustee
(Since 2014) | Co-Founder and Senior Partner, Alternative Asset Managers, L.P. since 2004. | Current Directorships: Trustee of The Advisors’ Inner Circle Fund III, Schroder Series Trust, Schroder Global Series Trust, Delaware Wilshire Private Markets Master Fund, Delaware Wilshire Private Markets Fund and Delaware Wilshire Private Markets Tender Fund. Independent Non-Executive Director of HFA Holdings Limited. Former Directorships: Trustee of O’Connor EQUUS (closed-end investment company) to 2016. Trustee of Winton Series Trust to 2017. Trustee of Winton Diversified Opportunities Fund (closed-end investment company) to 2018. |
JAY NADEL (Born: 1958) | Trustee
(Since 2016) | Self-Employed Consultant since 2004. Executive Vice President, Bank of New
York Broker Dealer from 2002 to 2004. Partner/Managing Director, Weiss & Greer/Robeco from 1986
to 2001. | Current Directorships: Trustee of City National Rochdale Funds, The Advisors’ Inner Circle Fund III, Schroder Series Trust, Schroder Global Series Trust, Delaware Wilshire Private Markets Master Fund, Delaware Wilshire Private Markets Fund and Delaware Wilshire Private Markets Tender Fund. Former Directorships: Trustee of Winton Series Trust to 2017. Director of Lapolla Industries, Inc. to 2017. Trustee of Winton Diversified Opportunities Fund (closed-end investment company) to 2018. |
NICHELLE MAYNARD-ELLIOT (Born: 1968) | Trustee
(Since 2021) | Independent Director since 2018. Executive Director, M&A at Praxair Inc. from 2011-2019. | Current Directorships: Trustee of The Advisors’ Inner Circle Fund III, Schroder Series Trust, Delaware Wilshire Private Markets Master Fund, Delaware Wilshire Private Markets Fund, Delaware Wilshire Private Markets Tender Fund. Director of Chiron Capital Allocation Fund Ltd., Director of Element Solutions Inc., Director of Xerox Holdings Corporation, and Director Nominee for Lucid Group, Inc. |
1 Each Trustee shall hold office during the lifetime of this trust until the election and qualification of his or her successor, or until he or she dies, resigns, or is removed in accordance with the Declaration of Trust.
2 Directorships of Companies required to report to the Securities and Exchange Commission under the Securities Exchange act of 1934 (i.e., “public companies”) or other investment companies under the 1940 act.
3 Board Members oversee 6 Funds in the Trust.
| Gallery Trust | | October 31, 2021 (Unaudited)
|
| |
|
TRUSTEES AND OFFICERS OF THE GALLERY TRUST
Name and
Year of Birth | Position(s) Held with
the Trust and Length of Time Served | Principal Occupation During the Past 5 Years |
| OFFICERS |
MICHAEL BEATTIE (Born: 1965) | President
(since 2014) | Director of Client Service, SEI Investments Company, since 2004. |
JAMES BERNSTEIN (Born: 1962) | Vice Chairman
(since 2014) Secretary
(since 2020) | Attorney, SEI Investments, since 2017.Prior Positions: Self-employed consultant, 2017. Associate General Counsel & Vice President, Nationwide Funds Group and Nationwide Mutual Insurance Company, from 2002 to 2016. Assistance General Counsel & Vice President, Market Street Funds and Provident Mutual Insurance Company, from 1999 to 2002. |
JOHN BOURGEOIS (Born: 1973) | Assistant Treasurer
(Since 2017) | Fund Accounting Manager, SEI Investments, since 2000. |
ANDREW METZGER (Born: 1984) | Treasurer, Controller and Chief Financial Officer (Since 2021) | Director of Fund Accounting, SEI Investments, since 2020. Senior Director, Embark, from 2019 to 2020. Senior Manager, PricewaterhouseCoopers LLP, from 2002 to 2019. |
RUSSELL EMERY (Born: 1962) | Chief Compliance Officer (since 2014) | Chief Compliance Officer of SEI Structured Credit Fund, LP since 2007. Chief Compliance Officer of The Advisors’ Inner Circle Fund, The Advisors’ Inner Circle Fund II, Bishop Street Funds, The KP Funds, Frost Family of Funds, The Advisors’ Inner Circle Fund III, Gallery Trust, Schroder Series Trust, Schroder Global Series Trust, Delaware Wilshire Private Markets Master Fund, Delaware Wilshire Private Markets Fund, Delaware Wilshire Private Markets Tender Fund, SEI Institutional Managed Trust, SEI Asset Allocation Trust, SEI Institutional International Trust, SEI Institutional Investments Trust, SEI Daily Income Trust, SEI Tax Exempt Trust, Adviser Managed Trust, New Covenant Funds, SEI Insurance Products Trust and SEI Catholic Values Trust. Chief Compliance Officer of O’Connor EQUUS (closed-end investment company) to 2016. Chief Compliance Officer of SEI Liquid Asset Trust to 2016. Chief Compliance Officer of Winton Series Trust to 2017. Chief Compliance Officer of Winton Diversified Opportunities Fund (closed-end investment company) to 2018. |
ERIC C. GRIFFITH (Born: 1969) | Vice President and Assistant Secretary
(since 2020) | Counsel at SEI Investments since 2019. Vice President and Assistant General Counsel, JPMorgan Chase & Co., from 2012 to 2018. |
MATTHEW M. MAHER (Born: 1975) | Vice President and Assistant Secretary
(since 2018) | Counsel at SEI Investments since 2018. Attorney, Blank Rome LLP, from 2015 to 2018. Assistant Counsel & Vice President, Bank of New York Mellon, from 2013 to 2014. Attorney, Dilworth Paxon LLP. from 2006 to 2013. |
| Gallery Trust | | October 31, 2021 (Unaudited)
|
| |
|
TRUSTEES AND OFFICERS OF THE GALLERY TRUST
Name and
Year of Birth | Position(s) Held with the Trust and Length of Time Served | Principal Occupation During the Past 5 Years |
| OFFICERS (continued) |
ALEXANDER F. SMITH (Born: 1977) | Vice President and Assistant Secretary
(since 2020) | Cousel at SEI Investments since 2020. Associate Counsel & Manager, Vanguard, 2012 to 2020. Attorney, Stradley Ronon Stevens & Young, LLP, 2008 to 2012. |
ROBERT MORROW (Born: 1968) | Vice President
(since 2017) | Account Manager, SEI Investments, since 2007. |
BRIDGET E. SUDALL (Born: 1980) | Privacy Officer
(since 2015) Anti-Money
Laundering Officer
(since 2015) | Senior Associate and AML Officer, Morgan Stanley Alternative Investment Partners, from 2011 to March 2015. Investor Services Team Lead, Morgan Stanley Alternative Investment Partners, July 2007 to April 2011. |
| Gallery Trust | | October 31, 2021 (Unaudited)
|
| |
|
For shareholders that do not have an October 31, 2021 tax year end, this notice is for informational purposes only. For shareholders with an October 31, 2021 tax year end, please consult your tax advisor as to the pertinence of this notice. For the fiscal year ended October 31, 2021, the Funds are designating the following items with regard to distributions paid during the year.
| | | | | | | | | | | | | | | | | | | | | Foreign Investors | |
Return
of
Capital | | | Ordinary Income
Distributions | | | Long-Term Capital Gain
Distributions | | | Total
Distributions | | | Qualifying for
Corporate Dividends Received Deduction
(1) | | | Qualifying Dividend Income
(2) | | | U.S. Government Interest
(3) | | | Interest
Related Dividends
(4) | | | Short-Term Capital Gain Dividends
(5) | | | Foreign Tax Credit
(6) | |
| Mondrian International Value Equity Fund | |
| 0.00 | % | | | 100.00 | % | | | 0.00 | % | | | 100.00 | % | | | 0.00 | % | | | 92.56 | % | | | 0.00 | % | | | 0.00 | % | | | 0.00 | % | | | 0.00 | % |
| Mondrian Emerging Markets Value Equity Fund | |
| 0.00 | % | | | 100.00 | % | | | 0.00 | % | | | 100.00 | % | | | 0.01 | % | | | 96.96 | % | | | 0.00 | % | | | 0.00 | % | | | 0.00 | % | | | 11.16 | % |
| Mondrian International Government Fixed Income Fund | |
| 0.00 | % | | | 100.00
| % | | | 0.00 | % | | | 100.00 | % | | | 0.00 | % | | | 0.00 | % | | | 0.00 | % | | | 92.64 | % | | | 100.00 | % | | | 0.00 | % |
| Mondrian U.S. Small Cap Equity Fund | |
| 0.00 | % | | | 100.00 | % | | | 0.00 | % | | | 100.00 | % | | | 44.71 | % | | | 46.63 | % | | | 0.00 | % | | | 0.08 | % | | | 0.00 | % | | | 0.00 | % |
| Mondrian Global Listed Infrastructure Fund | |
| 0.00 | % | | | 50.03 | % | | | 49.97 | % | | | 100.00 | % | | | 36.11 | % | | | 97.78 | % | | | 0.00 | % | | | 0.00 | % | | | 0.00 | % | | | 5.74 | % |
| Mondrian Global Equity Value Fund | |
| 0.00 | % | | | 100.00 | % | | | 0.00 | % | | | 100.00 | % | | | 9.64 | % | | | 28.82 | % | | | 0.00 | % | | | 0.00 | % | | | 100.00 | % | | | 46.23 | % |
(1) Qualifying dividends represent dividends which qualify for the corporate dividends received deduction and is reflected as a percentage of ordinary income distributions (the total of short-term capital gain and net investment income distributions).
(2) The percentage in this column represents the amount of “Qualifying Dividend Income” as created by the Jobs and Growth Tax Relief Reconciliation Act of 2003 and is reflected as a percentage of ordinary income distributions (the total of short-term capital gain and net investment income distributions). It is the intention of the Fund to designate the maximum amount permitted by law.
(3) “U.S. Government Interest” represents the amount of interest that was derived from direct U.S. Government obligations and distributed during the fiscal year. This amount is reflected as a percentage of ordinary income. Generally, interest from direct U.S. Government obligations is exempt from state income tax. However, for shareholders of the Fund who are residents of California, Connecticut and New York, the statutory threshold requirements were not satisfied to permit exemption of these amounts from state income.
(4) The percentage in this column represents the amount of “Interest Related Dividends” and is reflected as a percentage of ordinary income distributions. Interest related dividends are exempted from U.S. withholding tax when paid to foreign investors.
(5) The percentage in this column represents the amount of “Short-Term Capital Gain Dividends” and is reflected as a percentage of short-term capital gain distributions that is exempted from U.S. withholding tax when paid to foreign investors.
(6) The percentage in this column represents the amount of “Qualifying Foreign Taxes” as a percentage of ordinary distributions during the fiscal year ended October 31, 2021. The Emerging Markets Value Fund Fund, Global Listed Infrastructure Fund and Global Value Equity Fund intend to pass through a Foreign Tax Credit to shareholders for fiscal year ended 2021. The total amounts of foreign source income are $375,620, $49,003 and $654,997, respectively . The total amounts of foreign tax paid are $60,337, $5,656 and 41627, respectively. Your allocation share of the foreign tax credit will be reported on form 1099-DIV.
The information reported herein may differ from the information and distributions taxable to the shareholders for the calendar year ending December 31, 2021. Complete information will be computed and reported in conjunction with your 2019 Form 1099-DIV.
FUND INFORMATION
| Registered office | P.O. Box 588 |
| | Portland, ME 04112 |
| | |
| Adviser | Mondrian Investment Partners Limited |
| | 10 Gresham Street, 5th Floor |
| | London, England EC2V 7JD |
| | |
| Distributor | SEI Investments Distribution Co. |
| | One Freedom Valley Drive |
| | Oaks, PA 19456 |
| | |
| Administrator | SEI Investments Global Funds Services |
| | One Freedom Valley Drive |
| | Oaks, PA 19456 |
| | |
| Legal Counsel | Morgan, Lewis & Bockius LLP |
| | 1701 Market Street |
| | Philadelphia, PA 19103 |
| | |
| Custodian | Brown Brothers Harriman & Co |
| | 40 Water Street |
| | Boston, Massachusetts 02109 |
| | |
| Transfer Agent | Apex Fund Services |
| | Three Canal Plaza |
| | Portland, ME 04101 |
| | |
| Independent Registered | PricewaterhouseCoopers LLP |
| Public Accounting Firm | 2001 Market Street |
| | Philadelphia, PA 19103 |
[This Page Intentionally Left Blank]
MON-AR-001-0600
Item 2. Code of Ethics.
The Registrant has adopted a code of ethics that applies to the Registrant’s principal executive officer, principal financial officer, controller or principal accounting officer, and any person who performs a similar function. There have been no amendments to or waivers granted to this code of ethics.
Item 3. Audit Committee Financial Expert.
(a)(1) The Registrant’s board of trustees has determined that the Registrant has at least one audit committee financial expert serving on the audit committee.
(a) (2) The audit committee financial experts are Thomas Lemke and Jay Nadel, and each of Mr. Lemke and Mr. Nadel is considered to be “independent,” as that term is defined in Form N-CSR Item 3(a)(2).
Item 4. Principal Accountant Fees and Services.
Fees billed by PricewaterhouseCoopers LLP (“PwC”) relate to the Gallery Trust (the “Trust”).
PwC billed the Trust aggregate fees for services rendered to the Trust for the last two fiscal years as follows:
| | 2021 | 2020 |
| | | All fees and services to the Trust that were pre-approved | All fees and services to service affiliates that were pre-approved | All other fees and services to service affiliates that did not require pre-approval | All fees and services to the Trust that were pre-approved | All fees and services to service affiliates that were pre-approved | All other fees and services to service affiliates that did not require pre-approval |
| (a) | Audit Fees(1) | $151,100 | None | None | $151,100 | None | None |
| (b) | Audit-Related Fees | None | None | None | None | None | $165,403 |
| (c) | Tax Fees | $13,090(2) | None | $132,398(3) | $19,040 | None | $75,000 (3) |
| (d) | All Other Fees | None | None | None | None | None | None |
Notes:
| (1) | Audit fees include amounts related to the audit of the Trust’s annual financial statements and services normally provided by the accountant in connection with statutory and regulatory filings. |
| (2) | Contains tax compliance services for Mondrian International Value Equity Fund.
|
| (3) | Contains tax compliance services provided to service affiliates of the Funds. |
(e)(1) The Trust’s Audit Committee has adopted and the Board of Trustees has ratified an Audit and Non-Audit Services Pre-Approval Policy (the “Policy”), which sets forth the procedures and the conditions pursuant to which services proposed to be performed by the independent auditor of the Funds may be pre-approved.
The Policy provides that all requests or applications for proposed services to be provided by the independent auditor must be submitted to the Registrant’s Chief Financial Officer (“CFO”) and must include a detailed description of the services proposed to be rendered. The CFO will determine whether such services:
1. require specific pre-approval;
2. are included within the list of services that have received the general pre-approval of the Audit Committee pursuant to the Policy; or
3. have been previously pre-approved in connection with the independent auditor’s annual engagement letter for the applicable year or otherwise. In any instance where services require pre-approval, the Audit Committee will consider whether these services are consistent with SEC’s rules and whether the provision of these services would impair the auditor’s independence.
Requests or applications to provide services that require specific pre-approval by the Audit Committee will be submitted to the Audit Committee by the CFO. The Audit Committee will be informed by the CFO on a quarterly basis of all services rendered by the independent auditor. The Audit Committee has delegated specific pre-approval authority to either the Audit Committee Chair or financial expert, provided that the estimated fee for any said proposed pre-approved service does not exceed $100,000 and any pre-approval decisions are reported to the Audit Committee at the Audit Committee’s next regularly-scheduled meeting.
Services that have received the general pre-approval of the Audit Committee are identified and described in the Policy. In addition, the Policy sets forth a maximum fee per engagement with respect to each identified service that has received general pre-approval.
All services to be provided by the independent auditor shall be provided pursuant to a signed written engagement letter with the Registrant, the investment adviser or applicable control affiliate (except that matters as to which an engagement letter would be impractical because of timing issues or because the matter is small may not be the subject of an engagement letter) that sets forth both the services to be provided by the independent auditor and the total fees to be paid to the independent auditor for those services.
In addition, the Audit Committee has determined to take additional measures on an annual basis to meet the Audit Committee’s responsibility to oversee the work of the independent auditor and to assure the auditor's independence from the Registrant, such as (a) reviewing a formal written statement from the independent auditor delineating all relationships between the independent auditor and the Registrant, and (b) discussing with the independent auditor the independent auditor’s methods and procedures for ensuring independence.
| (e)(2) | Percentage of fees billed by PwC applicable to non-audit services pursuant to the “de minimis” exception of Rule 2-01(c)(7)(i)(C) were as follows: |
| | 2021 | 2020 |
| Audit-Related Fees | None | None |
| Tax Fees | None | None |
| All Other Fees | None | None |
(f) Not applicable.
(g) The aggregate non-audit fees and services billed by PwC for services rendered to the Registrant, and rendered to the Registrant’s investment adviser (not including any sub-adviser whose role is primarily portfolio management and is subcontracted with or overseen by another investment adviser), and any entity controlling, controlled by, or under common control with the adviser that provides ongoing services to the Registrant for the last fiscal-years-ended October 31st were $132,398 and $240,403 for 2021 and 2020, respectively.
(h) During the past fiscal year, all non-audit services provided by Registrant’s principal accountant to either Registrant’s investment adviser or to any entity controlling, controlled by, or under common control with Registrant’s investment adviser that provides ongoing services to Registrant were pre-approved by the Audit Committee of Registrant’s Board of Trustees. Included in the Audit Committee’s pre-approval of these non-audit services was the review and consideration as to whether the provision of these non-audit services is compatible with maintaining the principal accountant’s independence.
Item 5. Audit Committee of Listed Registrants.
Not applicable to open-end management investment companies.
Item 6. Schedule of Investments.
Schedule of Investments is included as part of the Report to Shareholders filed under Item 1 of this form.
Item 7. Disclosure of Proxy Voting Policies and Procedures for Closed-End Management Investment Companies.
Not applicable to open-end management investment companies.
Item 8. Portfolio Managers of Closed-End Management Investment Companies.
Not applicable. Effective for closed-end management investment companies for fiscal years ending on or after December 31, 2005.
Item 9. Purchases of Equity Securities by Closed-End Management Company and Affiliated Purchasers.
Not applicable to open-end management investment companies.
Item 10. Submission of Matters to a Vote of Security Holders.
There have been no changes to the procedures by which shareholders may recommend nominees to the Registrant’s Board of Trustees during the period covered by this report.
Item 11. Controls and Procedures.
(a) The Registrant's principal executive and principal financial officers, or persons performing similar functions have concluded that the Registrant's disclosure controls and procedures, as defined in Rule 30a-3(c) under the Act (17 CFR § 270.30a-3(c)), as of a date within 90 days of the filing date of the report, are effective based on the evaluation of these controls and procedures required by Rule 30a-3(b) under the Act (17 CFR § 270.30a-3(b)) and Rules 13a-15(b) or 15d-15(b) under the Exchange Act (17 CFR § 240.13a-15(b) or 240.15d-15(b)).
(b) There has been no change in the Registrant's internal control over financial reporting (as defined in Rule 30a-3(d) under the Act (17 CFR § 270.3a-3(d)) that occurred during the period covered by this report that has materially affected, or is reasonably likely to materially affect, the Registrant's internal control over financial reporting.
Items 12. Disclosure of Securities Lending Activities for Closed-End Management Investment Companies.
Not applicable to open-end management investment companies.
Items 13. Exhibits.
SIGNATURES
Pursuant to the requirements of the Securities Exchange Act of 1934 and the Investment Company Act of 1940, the Registrant has duly caused this report to be signed on its behalf by the undersigned, thereunto duly authorized.
/s/ Michael Beattie
Michael Beattie
President
Pursuant to the requirements of the Securities Exchange Act of 1934 and the Investment Company Act of 1940, this report has been signed below by the following persons on behalf of the Registrant and in the capacities and on the dates indicated.
/s/ Michael Beattie
Michael Beattie
President
Date: January 7, 2022
/s/ Andrew Metzger
Andrew Metzger
Treasurer, Controller, and CFO
Date: January 7, 2022