UNITED STATES
SECURITIES AND EXCHANGE COMMISSION
Washington, D.C. 20549
FORM N-CSR
CERTIFIED SHAREHOLDER REPORT OF REGISTERED
MANAGEMENT INVESTMENT COMPANIES
Investment Company Act file number: 811-23117
JPMorgan Trust IV
(Exact name of registrant as specified in charter)
270 Park Avenue
New York, NY 10017
(Address of principal executive offices) (Zip code)
Frank J. Nasta
270 Park Avenue
New York, NY 10017
(Name and Address of Agent for Service)
Registrant’s telephone number, including area code: (800) 480-4111
Date of fiscal year end: Last day of February
Date of reporting period: May 31, 2016 through February 28, 2017
Form N-CSR is to be used by management investment companies to file reports with the Commission not later than 10 days after the transmission to stockholders of any report that is required to be transmitted to stockholders under Rule 30e-1 under the Investment Company Act of 1940 (17 CFR 270.30e-1). The Commission may use the information provided on Form N-CSR in its regulatory, disclosure review, inspection, and policymaking roles.
A registrant is required to disclose the information specified by Form N-CSR, and the Commission will make this information public. A registrant is not required to respond to the collection of information contained in Form N-CSR unless the Form displays a currently valid Office of Management and Budget (“OMB”) control number. Please direct comments concerning the accuracy of the information collection burden estimate and any suggestions for reducing the burden to Secretary, Securities and Exchange Commission, 450 Fifth Street, NW, Washington, DC 20549-0609. The OMB has reviewed this collection of information under the clearance requirements of 44 U.S.C. Section 3507.
ITEM 1. REPORTS TO STOCKHOLDERS.
The following is a copy of the report transmitted to shareholders pursuant to Rule 30e-1 under the Investment Company Act of 1940 (17 CFR 270.30e-1).
Annual Report
J.P. Morgan Municipal Bond Funds
February 28, 2017
JPMorgan Municipal Income Fund
JPMorgan Ohio Municipal Bond Fund
JPMorgan Short-Intermediate Municipal Bond Fund
JPMorgan Tax Free Bond Fund
JPMorgan Ultra-Short Municipal Fund

CONTENTS
Investments in a Fund are not deposits or obligations of, or guaranteed or endorsed by, any bank and are not insured or guaranteed by the FDIC, the Federal Reserve Board or any other government agency. You could lose money if you sell when a Fund’s share price is lower than when you invested.
Past performance is no guarantee of future performance. The general market views expressed in this report are opinions based on market and other conditions through the end of the reporting period and are subject to change without notice. These views are not intended to predict the future performance of a Fund or the securities markets. References to specific securities and their issuers are for illustrative purposes only and are not intended to be, and should not be interpreted as, recommendations to purchase or sell such securities. Such views are not meant as investment advice and may not be relied on as an indication of trading intent on behalf of any Fund.
Prospective investors should refer to the Funds’ prospectus for a discussion of the Funds’ investment objectives, strategies and risks. Call J.P. Morgan Funds Service Center at 1-800-480-4111 for a prospectus containing more complete information about a Fund, including management fees and other expenses. Please read it carefully before investing.
CEO’S LETTER
March 22, 2017 (Unaudited)
Dear Shareholders,
For most of the past twelve months, the U.S. economy was one of the few bright spots among developed nations as most of Europe and Japan struggled with low or negative economic growth. However, by the end of February 2017 there emerged clear signals that the world’s 20 largest economies were moving in a more synchronized fashion that could lead to an accelerating global economy.
| | |
 | | “While the global economy appeared to grow more synchronized during the twelve months ended February 28, 2017, there also emerged political uncertainties in the U.S. and Europe.” |
Indeed, the World Bank has estimated that global economic growth in 2017 will rise by 2.7% compared with 2.3% in 2016 and economists generally expect each of the world’s 20 largest economies will see an increase in gross domestic product in 2017.
In the 19-nation euro zone, manufacturing activity rose in February 2017 for the sixth consecutive month and reached levels not seen in nearly six years. Economic confidence surveys have been the strongest since 2011. While unemployment across the euro zone remained nearly twice that of the U.S., the jobless rate fell faster than expected in early 2017 to its lowest level since 2009. Importantly, euro zone inflation reached the European Central Bank’s target of 2.0% in February 2017, which provided further evidence that the risk of a painful deflationary spiral had receded.
Meanwhile, Chinese factory activity was stronger than economists expected in February 2017 and more broadly, Chinese economic stimulus measures initiated in 2016 appeared to bolster trade throughout Asia. In Japan, corporate profits were estimated at record highs even in the face of a stronger yen. South Korean exports grew in February 2017 for the fourth consecutive month. Economic data from Australia and India showed signs of stronger growth.
To a certain extent, the healthier global economy was supported by a rebound in global oil prices, which reached 15-month highs in October 2016. Prices for other commodities also rose during 2016, helping growth in those emerging market nations reliant on natural resource exports.
In the U.S., the pace of economic expansion was sufficient to persuade the Federal Reserve Bank to raise interest rates in December 2016 and again in March 2017. Meanwhile, leading
stock market indexes hit record highs in late 2016 and early 2017 amid strength in corporate profits and the broader U.S. economy. Investor expectations that the Republican Party’s newly-won control of the U.S. presidency along with its majorities in both houses of the U.S. Congress would bolster economic growth while lowering certain taxes further supported U.S. financial assets.
While the global economy appeared to grow more synchronized during the twelve months ended February 28, 2017, there also emerged political uncertainties in the U.S. and Europe. In the U.K., a populist drive to exit the European Union won a surprise victory in mid-2016. While global financial markets generally rebounded from the sharp sell-off that followed the June 23rd referendum, the ultimate impact of the so-called Brexit remained uncertain and was seen as a drag on the U.K. economy. In November, Donald Trump, who campaigned on a platform that included tighter restrictions on immigration and protective trade policies, won the U.S. presidency. While voters in the Netherlands declined to give the anti-immigrant Party for Freedom a majority in the lower house of Parliament, populist parties were vying for power in France, Germany and elsewhere.
Each of these parties and their leaders — both in the U.S. and elsewhere — share broad policy goals that prioritize restricting immigration and shunning supranational trade agreements. Given that immigration and free trade are key drivers of economic growth in advanced, post-industrial nations, it remains to be seen how much electoral support these shared agendas would earn.
In the face of all this, U.S. and foreign financial markets generally rewarded investors with positive returns for the twelve months through February 28, 2017. Over time, we believe financial markets will continue to reward those investors who maintain patience and discipline in the context of a properly diversified portfolio.
We look forward to managing your investment needs for years to come. Should you have any questions, please visit www.jpmorganfunds.com or contact the J.P. Morgan Funds Service Center at 1-800-480-4111.
Sincerely yours,

George C.W. Gatch
CEO, Investment Funds Management,
J.P. Morgan Asset Management
| | | | | | | | |
| | | |
| FEBRUARY 28, 2017 | | J.P. MORGAN MUNICIPAL BOND FUNDS | | | | | 1 | |
J.P. Morgan Municipal Bond Funds
MARKET OVERVIEW
TWELVE MONTHS ENDED FEBRUARY 28, 2017 (Unaudited)
U.S. financial markets generally provided positive returns for the twelve month reporting period amid continued growth in the U.S. economy and rising domestic interest rates. While U.S. equity outperformed most other asset classes, commodities and corporate bonds also had positive returns. At the end of June 2016, the U.K.’s vote to exit from the European Union led to a global sell-off in financial markets. However, U.S. markets rebounded within a month.
Commodities prices stabilized during the reporting period and global oil prices reached 15-month highs in October. Oil prices were further bolstered by the Organization of Petroleum Exporting Countries’ decision to curb production.
Following the November 8, 2016, elections, the Republican Party assumed control of the presidency and retained its majority in both houses of the U.S. Congress. In the following months, key U.S. equity benchmarks reached multiple record closing highs. While U.S. Treasury bonds underperformed other bond market sectors, corporate bonds and high-yield bonds (also known as “junk bonds”) posted positive returns as investors sought higher yields on fixed-income assets.
However, investor expectation of changes to tax rates for corporate and municipal bonds hurt returns on municipal bonds. The rally in U.S. equity markets also drew investment away from the municipal bond market. For the twelve months ended February 28, 2017, the Bloomberg Barclays Municipal Bond Index returned 0.25%.
| | | | | | |
| | | |
| 2 | | | | J.P. MORGAN MUNICIPAL BOND FUNDS | | FEBRUARY 28, 2017 |
JPMorgan Municipal Income Fund
FUND COMMENTARY
TWELVE MONTHS ENDED FEBRUARY 28, 2017 (Unaudited)
| | | | |
| REPORTING PERIOD RETURN: | |
| Fund (Class I Shares)1* | | | (0.16)% | |
| Bloomberg Barclays U.S. 1-15 Year Blend (1-17) Municipal Bond Index (formerly Barclays U.S. 1-15 Year Blend (1-17) Municipal Bond Index) | | | 0.02% | |
| |
| Net Assets as of 2/28/2017 (In Thousands) | | $ | 270,811 | |
| Duration as of 2/28/2017 | | | 4.9 years | |
INVESTMENT OBJECTIVE**
The JPMorgan Municipal Income Fund (the “Fund”) seeks current income exempt from federal income taxes.
WHAT WERE THE MAIN DRIVERS OF THE FUND’S PERFORMANCE?
For the twelve months ended February 28, 2017, the Fund’s Class I Shares underperformed the Bloomberg Barclays U.S. 1-15 Year Blend (1-17) Municipal Bond Index (the “Benchmark”).
The Fund’s overweight position in the education and water & sewer bond sectors were leading detractors from relative performance. The Fund’s underweight position to short duration pre-refunded bonds also detracted from relative performance.
Relative to the Benchmark, the Fund’s overweight position in the housing sector and industrial development revenue/pollution control revenue bond sector, as well as its underweight position in state and local general obligation bonds were leading contributors to performance. The Fund’s relative underweight position in the five-to-nine year duration range also contributed to relative performance. Duration measures the price sensitivity of a bond or a portfolio of bonds to relative changes in interest rates. Generally, bonds with longer duration will experience a larger increase or decrease in price as interest rates fall or rise, respectively, versus bonds with shorter duration.
HOW WAS THE FUND POSITIONED?
The Fund’s portfolio managers continued to emphasize higher yielding sectors, particularly the housing sector. At the end of the twelve month period, the Fund’s overall duration was roughly in line with that of the Benchmark.
| | | | |
CREDIT QUALITY ALLOCATIONS*** | |
| AAA | | | 22.6 | % |
| AA | | | 49.8 | |
| A | | | 17.9 | |
| BBB | | | 5.2 | |
| BB | | | 0.6 | |
| NR | | | 3.9 | |
J.P. Morgan Investment Management receives credit ratings on underlying securities of the portfolio from three major rating agencies — Standard & Poor’s (“S&P”), Moody’s and Fitch. When calculating credit quality breakdown, S&P is used as the primary independent rating agency source. Where an S&P rating is not available for a particular security, the Moody’s rating will be used, if available, and Fitch, if available, is used for securities not rated by Moody’s or S&P. Securities not rated by any of the three agencies are reflected as not rated (NR).
Although the Credit Quality Allocations table reflects the ratings of the bonds detailed in the Schedule of Investments, 0.8% of the investments in the table is held in prerefunded municipal bonds or escrowed to maturity securities. Prerefunded municipal bonds and escrowed to maturity securities are bonds the principal and interest of which are to be paid by Treasuries, Agencies and other government securities that have been placed in escrow accounts. For both prerefunded and escrowed to maturity securities, the credit status is considered the same, the only difference is prerefundeds are paid off at a call date while escrowed to maturity are retired at maturity.
| 1 | | Effective April 3, 2017, the Fund’s Select Class Shares were renamed Class I Shares. |
| * | | The return shown is based on net asset values calculated for shareholder transactions and may differ from the return shown in the financial highlights, which reflects adjustments made to the net asset values in accordance with accounting principles generally accepted in the United States of America. |
| ** | | The adviser seeks to achieve the Fund’s objective. There can be no guarantee it will be achieved. |
| *** | | Percentages indicated are based on total investments as of February 28, 2017. The Fund’s portfolio composition is subject to change. |
| | | | | | | | |
| | | |
| FEBRUARY 28, 2017 | | J.P. MORGAN MUNICIPAL BOND FUNDS | | | | | 3 | |
JPMorgan Municipal Income Fund
FUND COMMENTARY
TWELVE MONTHS ENDED FEBRUARY 28, 2017 (Unaudited) (continued)
| | | | | | | | | | | | | | |
AVERAGE ANNUAL TOTAL RETURNS AS OF FEBRUARY 28, 2017 | |
| | | | |
| | | INCEPTION DATE OF
CLASS | | 1 YEAR | | | 5 YEAR | | | 10 YEAR | |
CLASS A SHARES | | February 23, 1993 | | | | | | | | | | | | |
With Sales Charge* | | | | | (4.10 | )% | | | 1.37 | % | | | 2.89 | % |
Without Sales Charge | | | | | (0.40 | ) | | | 2.14 | | | | 3.28 | |
CLASS C SHARES | | November 4, 1997 | | | | | | | | | | | | |
With CDSC** | | | | | (1.87 | ) | | | 1.56 | | | | 2.70 | |
Without CDSC | | | | | (0.87 | ) | | | 1.56 | | | | 2.70 | |
CLASS I SHARES (FORMERLY SELECT CLASS SHARES) | | February 9, 1993 | | | (0.16 | ) | | | 2.39 | | | | 3.53 | |
| * | | Sales Charge for Class A Shares is 3.75%. |
| ** | | Assumes a 1% CDSC (contingent deferred sales charge) for the one year period and 0% CDSC thereafter. |
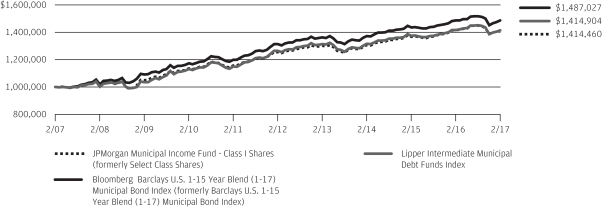
TEN YEAR PERFORMANCE (2/28/07 TO 2/28/17)
The performance quoted is past performance and is not a guarantee of future results. Mutual funds are subject to certain market risks. Investment returns and principal value of an investment will fluctuate so that an investor’s shares, when redeemed, may be worth more or less than their original cost. Current performance may be higher or lower than the performance data shown. For up-to-date, month-end performance information please call 1-800-480-4111.
The graph illustrates comparative performance for $1,000,000 invested in Class I Shares of the JPMorgan Municipal Income Fund, the Bloomberg Barclays U.S. 1-15 Year Blend (1-17) Municipal Bond Index and the Lipper Intermediate Municipal Debt Funds Index from February 28, 2007 to February 28, 2017. The performance of the Fund assumes reinvestment of all dividends and capital gain distributions, if any, and does not include a sales charge. The performance of the Bloomberg Barclays U.S. 1-15 Year Blend (1-17) Municipal Bond Index does not reflect the deduction of expenses or a sales charge associated with a mutual fund and has been adjusted to reflect reinvestment of all dividends and capital gain distributions of the securities included in the benchmark, if applicable. The performance of the Lipper Intermediate Municipal Debt Funds Index includes expenses associated with a mutual fund, such as investment management fees. These expenses are not identical to the expenses incurred
by the Fund. The Bloomberg Barclays U.S. 1-15 Year Blend (1-17) Municipal Bond Index represents the performance of municipal bonds with maturities from 1 to 17 years. The Lipper Intermediate Municipal Debt Funds Index is an index based on the total returns of certain mutual funds within the Fund’s designated category as determined by Lipper, Inc. Investors cannot invest directly in an index.
Capital gain distributions are subject to federal income tax; a portion of the Fund’s income distributions may be subject to the alternative minimum tax and some investors may be subject to certain state and local taxes.
Class I Shares have a $1,000,000 minimum initial investment.
Fund performance may reflect the waiver of the Fund’s fees and reimbursement of expenses for certain periods since the inception date. Without these waivers and reimbursements, performance would have been lower. Also, performance shown in this section does not reflect the deduction of taxes that a shareholder would pay on Fund distributions or redemptions of Fund shares.
The returns shown are based on net asset values calculated for shareholder transactions and may differ from the returns shown in the financial highlights, which reflect adjustments made to the net asset values in accordance with accounting principles generally accepted in the United States of America.
| | | | | | |
| | | |
| 4 | | | | J.P. MORGAN MUNICIPAL BOND FUNDS | | FEBRUARY 28, 2017 |
JPMorgan Ohio Municipal Bond Fund
FUND COMMENTARY
TWELVE MONTHS ENDED FEBRUARY 28, 2017 (Unaudited)
| | | | |
| REPORTING PERIOD RETURN: | |
| Fund (Class I Shares)1* | | | (0.36)% | |
| Bloomberg Barclays U.S. 1-15 Year Blend (1-17) Municipal Bond Index (formerly Barclays U.S. 1-15 Year Blend (1-17) Municipal Bond Index) | | | 0.02% | |
| |
| Net Assets as of 2/28/2017 (In Thousands) | | | $121,426 | |
| Duration as of 2/28/2017 | | | 4.8 years | |
INVESTMENT OBJECTIVE**
The JPMorgan Ohio Municipal Bond Fund (the “Fund”) seeks current income exempt from federal income tax and Ohio personal income tax, consistent with the preservation of principal.
WHAT WERE THE MAIN DRIVERS OF THE FUND’S PERFORMANCE?
For the twelve months ended February 28, 2017, the Fund’s Class I Shares underperformed the Bloomberg Barclays U.S. 1-15 Year Blend (1-17) Municipal Bond Index (the “Benchmark”).
Relative to the Benchmark, the Fund’s overweight position and longer duration in local general obligation bonds was a leading detractor from performance during the reporting period.
Duration measures the price sensitivity of a bond or a portfolio of bonds to relative changes in interest rates. Generally, bonds with longer duration will experience a larger increase or decrease in price as interest rates fall or rise, respectively, versus bonds with shorter duration. The Fund’s overweight position in the leasing sector also detracted from relative performance.
The Fund’s overweight positions and shorter relative duration in pre-refunded bonds and housing bonds were leading contributors to performance relative to the Benchmark. The Fund’s shorter duration in bonds rated AAA also helped relative performance.
HOW WAS THE FUND POSITIONED?
During the reporting period, the Fund’s average duration contracted relative to the Benchmark as interest rates moved upward during the latter part of the reporting period. The Fund’s portfolio managers preferred to invest in issuances from large, highly rated state and local municipalities. Among revenue bond sectors, the Fund managers preferred essential service sectors. However, Fund positioning is generally a result of security structure, duration, credit quality and the unique characteristics of the Ohio municipal bond market.
| | | | |
CREDIT QUALITY ALLOCATIONS*** | |
| AAA | | | 16.6 | % |
| AA | | | 70.5 | |
| A | | | 9.5 | |
| BBB | | | 2.0 | |
| NR | | | 1.4 | |
J.P. Morgan Investment Management receives credit ratings on underlying securities of the portfolio from three major rating agencies — Standard & Poor’s (“S&P”), Moody’s and Fitch. When calculating credit quality breakdown, S&P is used as the primary independent rating agency source. Where an S&P rating is not available for a particular security, the Moody’s rating will be used, if available, and Fitch, if available, is used for securities not rated by Moody’s or S&P. Securities not rated by any of the three agencies are reflected as not rated (NR).
Although the Credit Quality Allocations table reflects the ratings of the bonds detailed in the Schedule of Investments, 22.1% of the investments in the table is held in prerefunded municipal bonds or escrowed to maturity securities. Prerefunded municipal bonds and escrowed to maturity securities are bonds the principal and interest of which are to be paid by Treasuries, Agencies and other government securities that have been placed in escrow accounts. For both prerefunded and escrowed to maturity securities, the credit status is considered the same, the only difference is prerefundeds are paid off at a call date while escrowed to maturity are retired at maturity.
| 1 | | Effective April 3, 2017, the Fund’s Select Class Shares were renamed Class I Shares. |
| * | | The return shown is based on net asset values calculated for shareholder transactions and may differ from the return shown in the financial highlights, which reflects adjustments made to the net asset values in accordance with accounting principles generally accepted in the United States of America. |
| ** | | The adviser seeks to achieve the Fund’s objective. There can be no guarantee it will be achieved. |
| *** | | Percentages indicated are based on total investments as of February 28, 2017. The Fund’s portfolio composition is subject to change. |
| | | | | | | | |
| | | |
| FEBRUARY 28, 2017 | | J.P. MORGAN MUNICIPAL BOND FUNDS | | | | | 5 | |
JPMorgan Ohio Municipal Bond Fund
FUND COMMENTARY
TWELVE MONTHS ENDED FEBRUARY 28, 2017 (Unaudited) (continued)
| | | | | | | | | | | | | | |
AVERAGE ANNUAL TOTAL RETURNS AS OF FEBRUARY 28, 2017 | |
| | | | |
| | | INCEPTION DATE OF
CLASS | | 1 YEAR | | | 5 YEAR | | | 10 YEAR | |
CLASS A SHARES | | February 18, 1992 | | | | | | | | | | | | |
With Sales Charge* | | | | | (4.33 | )% | | | 0.89 | % | | | 2.76 | % |
Without Sales Charge | | | | | (0.59 | ) | | | 1.66 | | | | 3.16 | |
CLASS C SHARES | | February 19, 2005 | | | | | | | | | | | | |
With CDSC** | | | | | (2.19 | ) | | | 1.05 | | | | 2.54 | |
Without CDSC | | | | | (1.19 | ) | | | 1.05 | | | | 2.54 | |
CLASS I SHARES (FORMERLY SELECT CLASS SHARES) | | July 2, 1991 | | | (0.36 | ) | | | 1.92 | | | | 3.42 | |
| * | | Sales Charge for Class A Shares is 3.75%. |
| ** | | Assumes a 1% CDSC (contingent deferred sales charge) for the one year period and 0% CDSC thereafter. |
TEN YEAR PERFORMANCE (2/28/07 TO 2/28/17)

The performance quoted is past performance and is not a guarantee of future results. Mutual funds are subject to certain market risks. Investment returns and principal value of an investment will fluctuate so that an investor’s shares, when redeemed, may be worth more or less than their original cost. Current performance may be higher or lower than the performance data shown. For up-to-date month-end performance information please call 1-800-480-4111.
The graph illustrates comparative performance for $1,000,000 invested in Class I Shares of the JPMorgan Ohio Municipal Bond Fund, the Bloomberg Barclays U.S. 1-15 Year Blend (1-17) Municipal Bond Index and the Lipper Intermediate Municipal Debt Funds Index from February 28, 2007 to February 28, 2017. The performance of the Fund assumes reinvestment of all dividends and capital gain distributions, if any, and does not include a sales charge. The performance of the Bloomberg Barclays U.S. 1-15 Year Blend (1-17) Municipal Bond Index does not reflect the deduction of expenses or a sales charge associated with a mutual fund and has been adjusted to reflect reinvestment of all dividends and capital gain distributions of the securities included in the benchmark, if applicable. The performance of the Lipper Intermediate Municipal Debt Funds Index includes expenses associated with a mutual fund, such as investment management fees. These expenses are not identical to the expenses incurred by
the Fund. The Bloomberg Barclays U.S. 1-15 Year Blend (1-17) Municipal Bond Index represents the performance of municipal bonds with maturities from 1 to 17 years. The Lipper Intermediate Municipal Debt Funds Index is an index based on the total returns of certain mutual funds within the Fund’s designated category as determined by Lipper, Inc. Investors cannot invest directly in an index.
Capital gain distributions are subject to federal income tax; a portion of the Fund’s income distributions may be subject to the alternative minimum tax and some investors may be subject to certain state and local taxes.
Class I Shares have a $1,000,000 minimum initial investment.
Fund performance may reflect the waiver of the Fund’s fees and reimbursement of expenses for certain periods since the inception date. Without these waivers and reimbursements, performance would have been lower. Also, performance shown in this section does not reflect the deduction of taxes that a shareholder would pay on Fund distributions or redemptions of Fund shares.
The returns shown are based on net asset values calculated for shareholder transactions and may differ from the returns shown in the financial highlights, which reflect adjustments made to the net asset values in accordance with accounting principles generally accepted in the United States of America.
| | | | | | |
| | | |
| 6 | | | | J.P. MORGAN MUNICIPAL BOND FUNDS | | FEBRUARY 28, 2017 |
JPMorgan Short-Intermediate Municipal Bond Fund
FUND COMMENTARY
TWELVE MONTHS ENDED FEBRUARY 28, 2017 (Unaudited)
| | | | |
| REPORTING PERIOD RETURN: | |
| Fund (Select Class Shares) 1* | | | (0.37)% | |
| Bloomberg Barclays U.S. 1-5 Year Blend (1-6) Municipal Bond Index (formerly Barclays U.S. 1-5 Year Blend (1-6) Municipal Bond Index) | | | 0.29% | |
| |
| Net Assets as of 2/28/2017 (In Thousands) | | $ | 2,076,038 | |
| Duration as of 2/28/2017 | | | 3.2 years | |
INVESTMENT OBJECTIVE**
The JPMorgan Short-Intermediate Municipal Bond Fund (the “Fund”) seeks as high a level of current income exempt from federal income tax as is consistent with relative stability of principal.
WHAT WERE THE MAIN DRIVERS OF THE FUND’S PERFORMANCE?
For the twelve months ended February 28, 2017, the Fund’s Select Class Shares underperformed the Bloomberg Barclays U.S. 1-5 Year Blend (1-6) Municipal Bond Index (the “Benchmark”).
Relative to the Benchmark, the Fund’s longer duration profile detracted from performance as interest rates rose. Generally, bond yields in the three-to-five year portion of the yield curve rose more than the shorter and longer portions during the reporting period and the Fund’s overweight positions in the short and long portions of the curve also detracted from relative performance. The yield curve shows the relationship between yields and maturity dates for a set of similar bonds at a given point in time. The Fund’s relative longer duration in the local general obligation and the hospital sectors also detracted from relative performance, as did the Fund’s underweight position in short duration pre-refunded bonds.
The Fund’s relative shorter duration in the electric sector and the industrial redevelopment revenue/pollution control revenue sector were leading positive contributors to performance relative to the Benchmark. The Fund’s underweight positions in bonds issued by the states of Florida and Massachusetts also contributed to relative performance.
HOW WAS THE FUND POSITIONED?
During the reporting period, the Fund employed a bottom-up, security selection-based investment approach. The Fund’s portfolio managers sought to take advantage of opportunities stemming from increased volatility, supply pressures and headline credit risk, while maintaining the Fund’s bias toward higher quality issuances.
| | | | |
CREDIT QUALITY ALLOCATIONS*** | |
| AAA | | | 29.1 | % |
| AA | | | 49.0 | |
| A | | | 19.8 | |
| BBB | | | 1.3 | |
| NR | | | 0.8 | |
J.P. Morgan Investment Management receives credit ratings on underlying securities of the portfolio from three major rating agencies — Standard & Poor’s (“S&P”), Moody’s and Fitch. When calculating credit quality breakdown, S&P is used as the primary independent rating agency source. Where an S&P rating is not available for a particular security, the Moody’s rating will be used, if available, and Fitch, if available, is used for securities not rated by Moody’s or S&P. Securities not rated by any of the three agencies are reflected as not rated (NR).
Although the Credit Quality Allocations table reflects the ratings of the bonds detailed in the Schedule of Investments, 4.7% of the investments in the table is held in prerefunded municipal bonds or escrowed to maturity securities. Prerefunded municipal bonds and escrowed to maturity securities are bonds the principal and interest of which are to be paid by Treasuries, Agencies and other government securities that have been placed in escrow accounts. For both prerefunded and escrowed to maturity securities, the credit status is considered the same, the only difference is prerefundeds are paid off at a call date while escrowed to maturity are retired at maturity.
| 1 | | Effective April 3, 2017, the Fund’s Select Class Shares were no longer offered. |
| * | | The return shown is based on net asset values calculated for shareholder transactions and may differ from the return shown in the financial highlights, which reflects adjustments made to the net asset values in accordance with accounting principles generally accepted in the United States of America. |
| ** | | The adviser seeks to achieve the Fund’s objective. There can be no guarantee it will be achieved. |
| *** | | Percentages indicated are based on total investments as of February 28, 2017. The Fund’s portfolio composition is subject to change. |
| | | | | | | | |
| | | |
| FEBRUARY 28, 2017 | | J.P. MORGAN MUNICIPAL BOND FUNDS | | | | | 7 | |
JPMorgan Short-Intermediate Municipal Bond Fund
FUND COMMENTARY
TWELVE MONTHS ENDED FEBRUARY 28, 2017 (Unaudited) (continued)
| | | | | | | | | | | | | | |
AVERAGE ANNUAL TOTAL RETURNS AS OF FEBRUARY 28, 2017 | |
| | | | |
| | | INCEPTION DATE OF
CLASS | | 1 YEAR | | | 5 YEAR | | | 10 YEAR | |
CLASS A SHARES | | May 4, 1998 | | | | | | | | | | | | |
With Sales Charge* | | | | | (2.96 | )% | | | 0.03 | % | | | 1.47 | % |
Without Sales Charge | | | | | (0.69 | ) | | | 0.49 | | | | 1.70 | |
CLASS C SHARES | | November 1, 2001 | | | | | | | | | | | | |
With CDSC** | | | | | (2.27 | ) | | | (0.03 | ) | | | 1.18 | |
Without CDSC | | | | | (1.27 | ) | | | (0.03 | ) | | | 1.18 | |
CLASS I SHARES (FORMERLY INSTITUTIONAL CLASS SHARES) | | June 19, 2009 | | | (0.20 | ) | | | 0.97 | | | | 2.15 | |
SELECT CLASS SHARES | | May 4, 1998 | | | (0.37 | ) | | | 0.75 | | | | 1.96 | |
| * | | Sales Charge for Class A Shares is 2.25%. |
| ** | | Assumes a 1% CDSC (contingent deferred sales charge) for the one year period and 0% CDSC thereafter. |
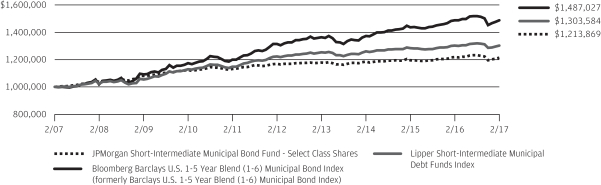
TEN YEAR PERFORMANCE (2/28/07 TO 2/28/17)
The performance quoted is past performance and is not a guarantee of future results. Mutual funds are subject to certain market risks. Investment returns and principal value of an investment will fluctuate so that an investor’s shares, when redeemed, may be worth more or less than their original cost. Current performance may be higher or lower than the performance data shown. For up-to-date, month-end performance information please call 1-800-480-4111.
Returns for Class I Shares prior to its inception are based on the performance of Select Class Shares. The actual returns of Class I Shares would have been different than those shown because Class I Shares had different expenses than Select Class Shares.
The graph illustrates comparative performance for $1,000,000 invested in Select Class Shares of the JPMorgan Short-Intermediate Municipal Bond Fund, the Bloomberg Barclays U.S. 1-5 Year Blend (1-6) Municipal Bond Index and the Lipper Short-Intermediate Municipal Debt Funds Index from February 28, 2007 to February 28, 2017. The performance of the Fund assumes reinvestment of all dividends and capital gain distributions, if any, and does not include a sales charge. The performance of the Bloomberg Barclays U.S. 1-5 Year Blend (1-6) Municipal Bond Index does not reflect the deduction of expenses or a sales charge associated with a mutual fund and has been adjusted to reflect reinvestment of all dividends and capital gain distributions of the securities included in the benchmark, if applicable. The performance of the Lipper Short-Intermediate
Municipal Debt Funds Index includes expenses associated with a mutual fund, such as investment management fees. These expenses are not identical to the expenses incurred by the Fund. The Bloomberg Barclays U.S. 1-5 Year Blend (1-6) Municipal Bond Index is an unmanaged index of investment grade tax-exempt municipal bonds with maturities of 1–5.999 years. The Lipper Short-Intermediate Municipal Debt Funds Index represents the total returns of certain mutual funds within the Fund’s designated category as determined by Lipper, Inc. Investors cannot invest directly in an index.
Capital gain distributions are subject to federal income tax; a portion of the Fund’s income distributions may be subject to the alternative minimum tax and some investors may be subject to certain state and local taxes.
Select Class Shares have a $1,000,000 minimum initial investment.
Fund performance may reflect the waiver of the Fund’s fees and reimbursement of expenses for certain periods since the inception date. Without these waivers and reimbursements, performance would have been lower. Also, performance shown in this section does not reflect the deduction of taxes that a shareholder would pay on Fund distributions or redemptions of Fund shares.
The returns shown are based on net asset values calculated for shareholder transactions and may differ from the returns shown in the financial highlights, which reflect adjustments made to the net asset values in accordance with accounting principles generally accepted in the United States of America.
| | | | | | |
| | | |
| 8 | | | | J.P. MORGAN MUNICIPAL BOND FUNDS | | FEBRUARY 28, 2017 |
JPMorgan Tax Free Bond Fund
FUND COMMENTARY
TWELVE MONTHS ENDED FEBRUARY 28, 2017 (Unaudited)
| | | | |
| REPORTING PERIOD RETURN: | |
Fund (Class A Shares, without a sales charge)* | | | (0.03)% | |
Bloomberg Barclays Municipal Bond Index (formerly Barclays Municipal Bond Index) | | | 0.25% | |
| |
Net Assets as of 2/28/2017 (In Thousands) | | | $322,395 | |
Duration as of 2/28/2017 | | | 6.3 years | |
INVESTMENT OBJECTIVE**
The JPMorgan Tax Free Bond Fund (the “Fund”) seeks as high a level of current income exempt from federal income tax as is consistent with relative stability of principal.
WHAT WERE THE MAIN DRIVERS OF THE FUND’S PERFORMANCE?
For the twelve months ended February 28, 2017, the Fund’s Class A Shares underperformed the Bloomberg Barclays Municipal Bond Index (the “Benchmark”).
Relative to the Benchmark, the Fund’s longer duration profile and its underweight position in A-rated bonds detracted from performance during the reporting period. Duration measures the price sensitivity of a bond or a portfolio of bonds to relative changes in interest rates. Generally, bonds with longer duration will experience a larger increase or decrease in price as interest rates fall or rise, respectively, versus bonds with shorter duration. The Fund’s longer duration profile in the special tax sector and its underweight position in industrial development revenue/pollution control revenue bond sector also detracted from relative performance.
During the reporting period, the Fund’s overall duration profile moved from being longer relative to the Benchmark to being shorter than the Benchmark, which helped relative performance as U.S. interest rates rose. Bonds with five-year maturities generally had negative returns during the reporting period and the Fund’s underweight position in the five-year portion of the yield curve also helped relative performance. The yield curve shows the relationship between yields and maturity dates for a set of similar bonds at a given point in time. The Fund’s overweight position in pre-refunded bonds also helped relative performance.
HOW WAS THE FUND POSITIONED?
The Fund continued to employ a bottom-up, security selection-based investment approach and sought to take advantage of opportunities stemming from increased volatility, supply pressures and headline credit risk. For liquidity, and to enhance the Fund’s overall credit quality, the Fund maintained its overweight position versus the Benchmark in pre-refunded bonds.
| | | | |
CREDIT QUALITY ALLOCATIONS*** | |
| AAA | | | 18.7 | % |
| AA | | | 59.4 | |
| A | | | 13.0 | |
| BBB | | | 6.0 | |
| NR | | | 2.9 | |
J.P. Morgan Investment Management receives credit ratings on underlying securities of the portfolio from three major rating agencies — Standard & Poor’s (“S&P”), Moody’s and Fitch. When calculating credit quality breakdown, S&P, is used as the primary independent rating agency source. Where an S&P rating is not available for a particular security, the Moody’s rating will be used, if available, and Fitch, if available, is used for securities not rated by Moody’s or S&P. Securities not rated by any of the three agencies are reflected as not rated (NR).
Although the Credit Quality Allocations table reflects the ratings of the bonds detailed in the Schedule of Investments, 22.1% of the investments in the table is held in prerefunded municipal bonds or escrowed to maturity securities. Prerefunded municipal bonds and escrowed to maturity securities are bonds the principal and interest of which are to be paid by Treasuries, Agencies and other government securities that have been placed in escrow accounts. For both prerefunded and escrowed to maturity securities, the credit status is considered the same, the only difference is prerefundeds are paid off at a call date while escrowed to maturity are retired at maturity.
| * | | The return shown is based on net asset values calculated for shareholder transactions and may differ from the return shown in the financial highlights, which reflects adjustments made to the net asset values in accordance with accounting principles generally accepted in the United States of America. |
| ** | | The adviser seeks to achieve the Fund’s objective. There can be no guarantee it will be achieved. |
| *** | | Percentages indicated are based on total investments as of February 28, 2017. The Fund’s portfolio composition is subject to change. |
| | | | | | | | |
| | | |
| FEBRUARY 28, 2017 | | J.P. MORGAN MUNICIPAL BOND FUNDS | | | | | 9 | |
JPMorgan Tax Free Bond Fund
FUND COMMENTARY
TWELVE MONTHS ENDED FEBRUARY 28, 2017 (Unaudited) (continued)
| | | | | | | | | | | | | | |
AVERAGE ANNUAL TOTAL RETURNS AS OF FEBRUARY 28, 2017 | |
| | | | |
| | | INCEPTION DATE OF
CLASS | | 1 YEAR | | | 5 YEAR | | | 10 YEAR | |
CLASS A SHARES | | March 1, 1988 | | | | | | | | | | | | |
With Sales Charge* | | | | | (3.78 | )% | | | 2.20 | % | | | 3.28 | % |
Without Sales Charge | | | | | (0.03 | ) | | | 2.99 | | | | 3.68 | |
CLASS C SHARES | | July 1, 2008 | | | | | | | | | | | | |
With CDSC** | | | | | (1.66 | ) | | | 2.30 | | | | 2.99 | |
Without CDSC | | | | | (0.66 | ) | | | 2.30 | | | | 2.99 | |
CLASS I SHARES (FORMERLY SELECT CLASS SHARES) | | February 1, 1995 | | | 0.09 | | | | 3.16 | | | | 3.86 | |
| * | | Sales Charge for Class A Shares is 3.75%. |
| ** | | Assumes a 1% CDSC (contingent deferred sales charge) for the one year period and 0% CDSC thereafter. |
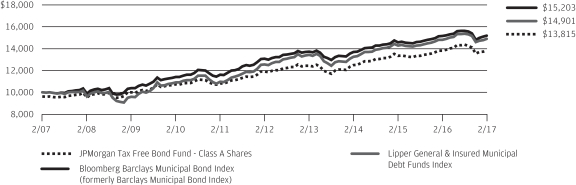
TEN YEAR PERFORMANCE (2/28/07 TO 2/28/17)
The performance quoted is past performance and is not a guarantee of future results. Mutual funds are subject to certain market risks. Investment returns and principal value of an investment will fluctuate so that an investor’s shares, when redeemed, may be worth more or less than their original cost. Current performance may be higher or lower than the performance data shown. For up-to-date, month-end performance information please call 1-800-480-4111.
Returns for Class C Shares prior to its inception are based on the performance of Class B Shares, all of which converted to Class A Shares on June 19, 2015. The actual returns of Class C Shares would have been similar to those shown because Class C Shares had similar expenses to Class B Shares.
The graph illustrates comparative performance for $10,000 invested in Class A Shares of the JPMorgan Tax Free Bond Fund, the Bloomberg Barclays Municipal Bond Index and the Lipper General & Insured Municipal Debt Funds Index from February 28, 2007 to February 28, 2017. The performance of the Fund assumes reinvestment of all dividends and capital gain distributions, if any, and includes a sales charge. The performance of the Bloomberg Barclays Municipal Bond Index does not reflect the deduction of expenses or a sales charge associated with a mutual fund and has been adjusted to reflect reinvestment of all dividends and capital gain distributions of the securities included in the benchmark, if applicable. The performance of the Lipper General & Insured Municipal Debt Funds Index includes expenses associated with a mutual fund, such as investment management fees. These expenses are not identical to the expenses
incurred by the Fund. The Bloomberg Barclays Municipal Bond Index is a total return performance benchmark for the long-term, investment-grade tax-exempt bond market. The Lipper General & Insured Municipal Debt Funds Index represents the total returns of certain mutual funds within the Fund’s designated category as defined by Lipper, Inc. Investors cannot invest directly in an index.
Capital gain distributions are subject to federal income tax; a portion of the Fund’s income distributions may be subject to the alternative minimum tax and some investors may be subject to certain state and local taxes.
Class A Shares have a $1,000 minimum initial investment and carry a 3.75% sales charge.
Fund performance may reflect the waiver of the Fund’s fees and reimbursement of expenses for certain periods since the inception date. Without these waivers and reimbursements, performance would have been lower. Also, performance shown in this section does not reflect the deduction of taxes that a shareholder would pay on Fund distributions or redemptions of Fund shares.
The returns shown are based on net asset values calculated for shareholder transactions and may differ from the returns shown in the financial highlights, which reflect adjustments made to the net asset values in accordance with accounting principles generally accepted in the United States of America.
| | | | | | |
| | | |
| 10 | | | | J.P. MORGAN MUNICIPAL BOND FUNDS | | FEBRUARY 28, 2017 |
JPMorgan Ultra-Short Municipal Fund
FUND SUMMARY
FOR THE PERIOD MAY 31, 2016 (FUND INCEPTION DATE) THROUGH FEBRUARY 28, 2017 (Unaudited)
| | | | |
REPORTING PERIOD RETURN: | |
Fund (Class I Shares)1* | | | 0.65% | |
Bloomberg Barclays 1 Year Municipal Bond Index (formerly Barclays 1 Year Municipal Bond Index) | | | 0.51% | |
| |
Net Assets as of 2/28/2017 (In Thousands) | | | $32,175 | |
Duration as of 2/28/2017 | | | 0.7 years | |
INVESTMENT OBJECTIVE**
The JPMorgan Ultra-Short Municipal Fund (the “Fund”) seeks as high a level of current income exempt from federal income tax as is consistent with relative stability of principal.
WHAT WERE THE MAIN DRIVERS OF THE FUND’S PERFORMANCE?
For the period ended February 28, 2017, the Fund’s Class I Shares outperformed the Bloomberg Barclays 1 Year Municipal Bond Index (the “Benchmark”). Relative to the Benchmark, the Fund’s shorter duration profile was a leading contributor to performance amid rising interest rates. Duration measures the price sensitivity of a bond or a portfolio of bonds to relative changes in interest rates. Generally, bonds with longer duration will experience a larger increase or decrease in price as interest rates fall or rise, respectively, versus bonds with shorter duration. Overall, lower quality bonds generally outperformed higher quality bonds and the Fund’s overweight position in bonds rated A and BBB, as well as its underweight position in bonds rated AAA also contributed to relative performance. The Fund’s overweight position in education bonds was the leading detractor from relative performance.
HOW WAS THE FUND POSITIONED?
During the reporting period, the Fund’s managers sought to maintain an average weighted maturity of two years or less and used a risk/reward analysis to identify investments that they believed would perform well over market cycles.
| | | | |
CREDIT QUALITY ALLOCATIONS*** | |
| AAA | | | 13.8 | % |
| AA | | | 48.7 | |
| A | | | 20.5 | |
| BBB | | | 9.7 | |
| BB | | | 1.5 | |
| NR | | | 5.8 | |
J.P. Morgan Investment Management receives credit ratings on underlying securities of the portfolio from three major rating agencies — Standard and Poor’s (“S&P”), Moody’s and Fitch. When calculating credit quality breakdown, S&P is used as the primary independent rating agency source. Where an S&P rating is not available for a particular security, the Moody’s rating will be used, if available, and Fitch, if available, is used for securities not rated by Moody’s or S&P. Securities not rated by any of the three agencies are reflected as not rated (NR).
Although the Credit Quality Allocations table reflects the ratings of the bonds detailed in the Schedule of Investments, 4.8% of the investments in the table is held in prerefunded municipal bonds or escrowed to maturity securities. Prerefunded municipal bonds and escrowed to maturity securities are bonds the principal and interest of which are to be paid by Treasuries, Agencies and other government securities that have been placed in escrow accounts. For both prerefunded and escrowed to maturity securities, the credit status is considered the same, the only difference is prerefundeds are paid off at a call date while escrowed to maturity are retired at maturity.
| 1 | | Effective April 3, 2017, the Fund’s Select Class Shares were renamed Class I Shares. |
| * | | The return shown is based on net asset values calculated for shareholder transactions and may differ from the return shown in the financial highlights, which reflects adjustments made to the net asset values in accordance with accounting principles generally accepted in the United States of America. |
| ** | | The adviser seeks to achieve the Fund’s objective. There can be no guarantee it will be achieved. |
| *** | | Percentages indicated are based on total investments as of February 28, 2017. The Fund’s portfolio composition is subject to change. |
| | | | | | | | |
| | | |
| FEBRUARY 28, 2017 | | J.P. MORGAN MUNICIPAL BOND FUNDS | | | | | 11 | |
JPMorgan Ultra-Short Municipal Fund
FUND SUMMARY
FOR THE PERIOD MAY 31, 2016 (FUND INCEPTION DATE) THROUGH FEBRUARY 28, 2017 (Unaudited) (continued)
| | | | | | | | | | | | | | |
AVERAGE ANNUAL TOTAL RETURNS AS OF FEBRUARY 28, 2017 | |
| | | | |
| | | | | | | | | INCEPTION DATE OF
CLASS | | SINCE
INCEPTION* | |
CLASS A SHARES | | | | | | | | | | May 31, 2016 | | | | |
With Sales Charge** | | | | | | | | | | | | | (1.74 | )% |
Without Sales Charge | | | | | | | | | | | | | 0.52 | |
CLASS I SHARES (FORMERLY SELECT CLASS SHARES) | | | | | | | | | | May 31, 2016 | | | 0.65 | |
| ** | | Sales Charge for Class A Shares is 2.25%. |
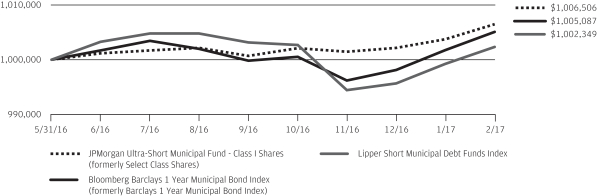
LIFE OF FUND PERFORMANCE (5/31/16 TO 2/28/17)
The performance quoted is past performance and is not a guarantee of future results. Mutual funds are subject to certain market risks. Investment returns and principal value of an investment will fluctuate so that an investor’s shares, when redeemed, may be worth more or less than their original cost. Current performance may be higher or lower than the performance data shown. For up-to-date, month-end performance information please call 1-800-480-4111.
The Fund commenced operations on May 31, 2016.
The graph illustrates comparative performance for $1,000,000 invested in Class I Shares of the JPMorgan Ultra-Short Municipal Fund, the Bloomberg Barclays 1 Year Municipal Bond Index and the Lipper Short Municipal Debt Funds Index from May 31, 2016 to February 28, 2017. The performance of the Fund assumes reinvestment of all dividends and capital gain distributions, if any, and does not include a sales charge. The performance of the Bloomberg Barclays 1 Year Municipal Bond Index does not reflect the deduction of expenses or a sales charge associated with a mutual fund and has been adjusted to reflect reinvestment of all dividends and capital gain distributions of securities included in the benchmark, if applicable. The performance of the Lipper Short Municipal Debt Funds Index includes expenses associated with a mutual fund, such as investment management fees. These expenses are not identical to the expenses incurred by the Fund. The Bloomberg Barclays 1 Year Municipal Bond Index is an unmanaged index that includes bonds with a minimum credit rating of BAA3, are issued as part of a deal of at least $50 million, have an amount outstanding of at least $5 million, and have maturities of 1 to 2 years.
The Lipper Short Municipal Debt Funds Index is an index based on the total returns of certain mutual funds within the Fund’s designated category as determined by Lipper, Inc. Investors cannot invest directly in an index.
Capital gain distributions are subject to federal income tax; a portion of the Fund’s income distributions may be subject to the alternative minimum tax and some investors may be subject to certain state and local taxes.
Class I Shares have a $1,000,000 minimum initial investment.
Subsequent to the inception of the Fund on May 31, 2016 until August 31, 2016, the Fund did not experience any shareholder activity. If such shareholder activity had occurred, the Fund’s performance may have been impacted.
Fund performance may reflect the waiver of the Fund’s fees and reimbursement of expenses for certain periods since the inception date. Without these waivers and reimbursements, performance would have been lower. Also, performance shown in this section does not reflect the deduction of taxes that a shareholder would pay on Fund distributions or redemptions of Fund shares.
The returns shown are based on net asset values calculated for shareholder transactions and may differ from the returns shown in the financial highlights, which reflect adjustments made to the net asset values in accordance with accounting principles generally accepted in the United States of America.
| | | | | | |
| | | |
| 12 | | | | J.P. MORGAN MUNICIPAL BOND FUNDS | | FEBRUARY 28, 2017 |
JPMorgan Municipal Income Fund
SCHEDULE OF PORTFOLIO INVESTMENTS
AS OF FEBRUARY 28, 2017
(Amounts in thousands)
| | | | | | | | |
PRINCIPAL
AMOUNT($) | | | SECURITY DESCRIPTION | | VALUE($) | |
| | Municipal Bonds — 93.9% (t) | |
| | | | Alabama — 0.8% | |
| | | | Utility — 0.8% | |
| | 2,000 | | | The Lower Alabama Gas District, Gas Project, Series A, Rev., 5.000%, 09/01/31 | | | 2,268 | |
| | | | | | | | |
| | | | Alaska — 0.8% | |
| | | | Housing — 0.4% | |
| | 1,000 | | | Alaska Housing Finance Corp., General Mortgage, Series A, Rev., 3.500%, 06/01/46 | | | 1,053 | |
| | | | | | | | |
| | | | Other Revenue — 0.4% | |
| | 1,195 | | | Northern Tobacco Securitization Corp., Series A, Rev., 4.625%, 06/01/23 | | | 1,201 | |
| | | | | | | | |
| | | | Total Alaska | | | 2,254 | |
| | | | | | | | |
| | | | Arizona — 2.1% | |
| | | | Water & Sewer — 2.1% | |
| | 2,645 | | | City of Scottsdale, Water & Sewer System, Rev., 5.250%, 07/01/22 | | | 3,140 | |
| | 2,150 | | | City of Tucson, Water System, Rev., 5.000%, 07/01/24 | | | 2,558 | |
| | | | | | | | |
| | | | Total Arizona | | | 5,698 | |
| | | | | | | | |
| | | | California — 1.7% | |
| | | | General Obligation — 0.3% | |
| | 1,000 | | | Salinas Union High School District, GO, BAN, Zero Coupon, 08/01/20 | | | 939 | |
| | | | | | | | |
| | | | Housing — 0.1% | |
| | 205 | | | California Rural Home Mortgage Finance Authority, Single Family Mortgage, Mortgage-Backed Security Program, Series A, Rev., GNMA/FNMA/FHLMC, 5.400%, 12/01/36 | | | 209 | |
| | | | | | | | |
| | | | Industrial Development Revenue/Pollution Control Revenue — 0.6% | |
| | 1,750 | | | California Pollution Control Financing Authority, Solid Waste Disposal, Waste Management, Inc. Project, Series B-2, Rev., VAR, AMT, 3.125%, 11/03/25 | | | 1,750 | |
| | | | | | | | |
| | | | Other Revenue — 0.3% | |
| | 750 | | | State of California, Department of Veterans Affairs, Series B, Rev., 3.500%, 12/01/45 | | | 792 | |
| | | | | | | | |
| | | | Transportation — 0.4% | |
| | 1,000 | | | Bay Area Toll Authority, Toll Bridge, San Francisco Bay Area, Series C, Rev., VAR, 1.875%, 04/01/19 | | | 1,011 | |
| | | | | | | | |
| | | | Total California | | | 4,701 | |
| | | | | | | | |
| | | | Colorado — 2.4% | |
| | | | Certificate of Participation/Lease — 0.2% | |
| | 625 | | | Pueblo County Judicial Complex Project, COP, AGM, 5.000%, 09/15/21 | | | 705 | |
| | | | | | | | |
| | | | | | | | |
PRINCIPAL
AMOUNT($) | | | SECURITY DESCRIPTION | | VALUE($) | |
| | | | | | | | |
| | | | Education — 0.4% | |
| | | | Colorado Educational & Cultural Facilities Authority, University Corp. for Atmospheric Research Project, | | | | |
| | 450 | | | Rev., 4.000%, 09/01/20 | | | 485 | |
| | 470 | | | Rev., 5.000%, 09/01/22 | | | 536 | |
| | | | | | | | |
| | | | | | | 1,021 | |
| | | | | | | | |
| | | | General Obligation — 0.4% | |
| | 1,000 | | | Douglas County School District No. Re-1, Douglas & Elbert Counties, GO, 5.250%, 12/15/20 | | | 1,147 | |
| | | | | | | | |
| | | | Hospital — 1.3% | |
| | 2,415 | | | Colorado Health Facilities Authority, Parkview Medical Center, Inc., Project, Series B, Rev., 5.000%, 09/01/22 | | | 2,457 | |
| | 1,000 | | | University of Colorado Hospital Authority, Series C-1, Rev., VAR, 4.000%, 03/01/20 | | | 1,063 | |
| | | | | | | | |
| | | | | | | 3,520 | |
| | | | | | | | |
| | | | Housing — 0.1% | |
| | | | Denver City & County, Single Family Home Mortgage, Metropolitan Mayors Caucus Program, | | | | |
| | 70 | | | Rev., GNMA COLL, 6.150%, 11/01/34 | | | 71 | |
| | 25 | | | Series A, Rev., GNMA/FNMA/FHLMC, 7.300%, 11/01/31 | | | 25 | |
| | 115 | | | El Paso County, Single Family Mortgage, Southern Front Range Region Program, Series E, Rev., AMT, GNMA/FNMA/FHLMC, 5.850%, 04/01/41 | | | 117 | |
| | | | | | | | |
| | | | | | | 213 | |
| | | | | | | | |
| | | | Total Colorado | | | 6,606 | |
| | | | | | | | |
| | | | Connecticut — 2.4% | |
| | | | Education — 1.6% | |
| | | | Connecticut State Higher Education Supplemental Loan Authority, CHESLA Loan Program, | | | | |
| | 760 | | | Series A, Rev., 4.000%, 11/15/19 | | | 794 | |
| | 1,560 | | | Series A, Rev., 5.250%, 11/15/23 | | | 1,740 | |
| | 1,500 | | | Series A, Rev., 5.250%, 11/15/24 | | | 1,672 | |
| | | | | | | | |
| | | | | | | 4,206 | |
| | | | | | | | |
| | | | Housing — 0.8% | |
| | | | Connecticut Housing Finance Authority, Housing Mortgage Finance Program, | | | | |
| | 585 | | | Subseries A-1, Rev., 4.000%, 11/15/45 | | | 627 | |
| | 500 | | | Subseries A-1, Rev., 4.000%, 11/15/47 | | | 540 | |
| | 990 | | | Subseries E-1, Rev., 3.500%, 11/15/46 | | | 1,044 | |
| | | | | | | | |
| | | | | | | 2,211 | |
| | | | | | | | |
| | | | Total Connecticut | | | 6,417 | |
| | | | | | | | |
SEE NOTES TO FINANCIAL STATEMENTS.
| | | | | | | | |
| | | |
| FEBRUARY 28, 2017 | | J.P. MORGAN MUNICIPAL BOND FUNDS | | | | | 13 | |
JPMorgan Municipal Income Fund
SCHEDULE OF PORTFOLIO INVESTMENTS
AS OF FEBRUARY 28, 2017 (continued)
(Amounts in thousands)
| | | | | | | | |
PRINCIPAL
AMOUNT($) | | | SECURITY DESCRIPTION | | VALUE($) | |
| | Municipal Bonds — continued | |
| | | | Delaware — 0.2% | |
| | | | Housing — 0.2% | |
| | | | Delaware State Housing Authority, Senior Single Family Mortgage, | | | | |
| | 375 | | | Series A-1, Rev., AMT, 4.900%, 07/01/29 | | | 394 | |
| | 205 | | | Series D-1, Rev., AMT, GNMA/FNMA/FHLMC, 4.625%, 01/01/23 | | | 206 | |
| | | | | | | | |
| | | | Total Delaware | | | 600 | |
| | | | | | | | |
| | | | District of Columbia — 1.3% | |
| | | | Water & Sewer — 1.3% | |
| | 3,000 | | | District of Columbia Water & Sewer Authority Public Utility, Subordinate Lien, Green Bonds, Series A, Rev., 5.000%, 10/01/45 | | | 3,388 | |
| | | | | | | | |
| | | | Florida — 12.9% | |
| | | | Certificate of Participation/Lease — 3.9% | |
| | 4,000 | | | Collier County School Board, Master Lease Program, Series A, COP, AGM, 5.250%, 02/15/21 | | | 4,564 | |
| | 2,250 | | | South Florida Water Management District, COP, 5.000%, 10/01/32 | | | 2,554 | |
| | 3,000 | | | The School Board of Miami-Dade County, Series D, COP, 5.000%, 02/01/27 | | | 3,488 | |
| | | | | | | | |
| | | | | | | 10,606 | |
| | | | | | | | |
| | | | Hospital — 0.5% | |
| | 1,100 | | | Palm Beach County Health Facilities Authority, Hospital, BRRH Corp. Obligated Group, Rev., 5.000%, 12/01/21 | | | 1,240 | |
| | | | | | | | |
| | | | Housing — 1.0% | |
| | 345 | | | Broward County Housing Finance Authority, Series B, Rev., AMT, GNMA/FNMA/FHLMC, 4.500%, 04/01/27 | | | 345 | |
| | | | Florida Housing Finance Corp., Homeowner Mortgage, Special Program, | | | | |
| | 510 | | | Series A, Rev., GNMA/FNMA/FHLMC, 5.000%, 07/01/28 | | | 530 | |
| | 570 | | | Series B, Rev., GNMA COLL, 4.500%, 01/01/29 | | | 600 | |
| | 525 | | | Series B, Rev., GNMA/FNMA/FHLMC, 4.500%, 01/01/29 | | | 553 | |
| | 415 | | | Orange County Housing Finance Authority, Multi-County Program, Series A, Rev., AMT, GNMA/FNMA/FHLMC, 5.125%, 09/01/38 | | | 425 | |
| | 310 | | | Pinellas County Housing Finance Authority, Multi-County Program, Series A-2, Rev., AMT, GNMA/FNMA/FHLMC, 4.900%, 09/01/27 | | | 310 | |
| | | | | | | | |
| | | | | | | 2,763 | |
| | | | | | | | |
| | | | | | | | |
PRINCIPAL
AMOUNT($) | | | SECURITY DESCRIPTION | | VALUE($) | |
| | | | | | | | |
| | | | Industrial Development Revenue/Pollution Control Revenue — 1.8% | |
| | 835 | | | Broward County Fuel System, Fort Lauderdale Fuel Facilities LLC Project, Series A, Rev., AMT, AGM, 5.000%, 04/01/24 | | | 938 | |
| | 500 | | | County of Escambia, Pollution Control, Gulf Power Company Project, Rev., VAR, 2.100%, 04/11/19 | | | 507 | |
| | 1,600 | | | County of Lee, Florida Solid Waste System, Rev., AMT, NATL-RE, 5.000%, 10/01/22 | | | 1,817 | |
| | 1,545 | | | Palm Beach County, Solid Waste Authority, Rev., BHAC, 5.500%, 10/01/22 | | | 1,719 | |
| | | | | | | | |
| | | | | | | 4,981 | |
| | | | | | | | |
| | | | Other Revenue — 0.9% | |
| | 2,000 | | | Miami Beach Redevelopment Agency, Historic Convention Village, Series A, Rev., 5.000%, 02/01/27 | | | 2,307 | |
| | | | | | | | |
| | | | Prerefunded — 0.2% | |
| | 455 | | | Palm Beach County, Solid Waste Authority, Rev., BHAC, 5.500%, 10/01/19 (p) | | | 506 | |
| | | | | | | | |
| | | | Transportation — 1.7% | |
| | 2,635 | | | City of Orlando, Greater Orlando Aviation Authority, Airport Facilities, Series B, Rev., AMT, 5.000%, 10/01/26 | | | 2,916 | |
| | 1,500 | | | Tampa-Hillsborough County Expressway Authority, Series A, Rev., 5.000%, 07/01/27 | | | 1,692 | |
| | | | | | | | |
| | | | | | | 4,608 | |
| | | | | | | | |
| | | | Utility — 2.9% | |
| | 5,000 | | | City of Port St. Lucie, Utility Systems, Rev., NATL-RE, 5.250%, 09/01/24 | | | 5,902 | |
| | 800 | | | Florida Municipal Power Agency, All Requirements Power Supply Project, Series A, Rev., 5.000%, 10/01/30 | | | 928 | |
| | 1,000 | | | Pasco County, Solid Waste Disposal & Resource Recovery System, Rev., AMT, 5.000%, 10/01/20 | | | 1,119 | |
| | | | | | | | |
| | | | | | | 7,949 | |
| | | | | | | | |
| | | | Total Florida | | | 34,960 | |
| | | | | | | | |
| | | | Georgia — 0.9% | |
| | | | Hospital — 0.4% | |
| | 860 | | | Gainesville & Hall County Hospital Authority, Northeast Georgia Health System, Inc. Project, Series A, Rev., RAN, 5.000%, 02/15/26 | | | 997 | |
| | | | | | | | |
| | | | Housing — 0.5% | |
| | 540 | | | Atlanta Urban Residential Finance Authority, Single Family Mortgage, Mortgage-Backed Securities Program, Series B, Rev., GNMA/FNMA/FHLMC, 5.500%, 03/01/41 | | | 567 | |
SEE NOTES TO FINANCIAL STATEMENTS.
| | | | | | |
| | | |
| 14 | | | | J.P. MORGAN MUNICIPAL BOND FUNDS | | FEBRUARY 28, 2017 |
| | | | | | | | |
PRINCIPAL
AMOUNT($) | | | SECURITY DESCRIPTION | | VALUE($) | |
| | Municipal Bonds — continued | |
| | | | Housing — continued | | | | |
| | 750 | | | Georgia Housing & Finance Authority, Single Family Mortgage, Series A, Rev., 4.000%, 12/01/47 | | | 811 | |
| | | | | | | | |
| | | | | | | 1,378 | |
| | | | | | | | |
| | | | Total Georgia | | | 2,375 | |
| | | | | | | | |
| | | | Illinois — 1.4% | |
| | | | General Obligation — 0.8% | |
| | 2,000 | | | Chicago Board of Education, Series C, GO, AGC-ICC, 5.250%, 12/01/26 | | | 2,088 | |
| | | | | | | | |
| | | | Housing — 0.6% | |
| | | | City of Aurora, Single Family Mortgage, | | | | |
| | 193 | | | Series A, Rev., AMT, GNMA/FNMA/FHLMC, 5.500%, 12/01/39 | | | 199 | |
| | 179 | | | Series B, Rev., GNMA/FNMA/FHLMC, 5.450%, 12/01/39 | | | 183 | |
| | 20 | | | City of Peoria, City of Moline & City of Freeport, Collateralized Single Family Mortgage, Series A, Rev., GNMA COLL, 7.600%, 04/01/27 | | | 20 | |
| | 1,300 | | | Illinois Housing Development Authority, Homeowner Mortgage, Series C, Rev., 3.500%, 08/01/46 | | | 1,363 | |
| | | | | | | | |
| | | | | | | 1,765 | |
| | | | | | | | |
| | | | Total Illinois | | | 3,853 | |
| | | | | | | | |
| | | | Indiana — 3.1% | |
| | | | Hospital — 0.7% | |
| | 1,670 | | | Indiana Health Facility Financing Authority, Ascension Health Credit Group, Series A-1, Rev., 5.000%, 11/15/34 | | | 1,874 | |
| | | | | | | | |
| | | | Housing — 0.3% | |
| | 625 | | | Indiana Housing & Community Development Authority, Home First Mortgage, Series A, Rev., GNMA/FNMA/FHLMC, 4.500%, 06/01/28 | | | 657 | |
| | | | | | | | |
| | | | Industrial Development Revenue/Pollution Control Revenue — 1.6% | |
| | 2,000 | | | City of Whiting, Environmental Facilities, BP Products North America, Inc. Project, Rev., VAR, AMT, 5.000%, 11/01/22 | | | 2,260 | |
| | 1,880 | | | County of St. Joseph, Economic Development, St. Mary’s College Project, Series A, Rev., 5.000%, 04/01/26 | | | 2,181 | |
| | | | | | | | |
| | | | | | | 4,441 | |
| | | | | | | | |
| | | | Water & Sewer — 0.5% | |
| | 1,250 | | | Indiana State Finance Authority, First Lien Wastewater Utility, CWA Authority Project, Series A, Rev., 5.000%, 10/01/30 | | | 1,405 | |
| | | | | | | | |
| | | | Total Indiana | | | 8,377 | |
| | | | | | | | |
| | | | | | | | |
PRINCIPAL
AMOUNT($) | | | SECURITY DESCRIPTION | | VALUE($) | |
| | | | | | | | |
| | | | Iowa — 0.9% | |
| | | | Education — 0.6% | |
| | | | Iowa Student Loan Liquidity Corp., Student Loan, | | | | |
| | 500 | | | Series A, Rev., AMT, 5.000%, 12/01/18 | | | 531 | |
| | 1,000 | | | Series A, Rev., AMT, 5.000%, 12/01/25 | | | 1,133 | |
| | | | | | | | |
| | | | | | | 1,664 | |
| | | | | | | | |
| | | | Housing — 0.3% | |
| | | | Iowa Finance Authority, Single Family Mortgage, Mortgage-Backed Securities Program, | | | | |
| | 135 | | | Series 1, Rev., GNMA/FNMA/FHLMC, 5.000%, 07/01/28 | | | 141 | |
| | 685 | | | Series A, Rev., GNMA/FNMA/FHLMC, 4.000%, 07/01/46 | | | 735 | |
| | | | | | | | |
| | | | | | | 876 | |
| | | | | | | | |
| | | | Total Iowa | | | 2,540 | |
| | | | | | | | |
| | | | Kentucky — 0.2% | |
| | | | Industrial Development Revenue/Pollution Control Revenue — 0.2% | |
| | 500 | | | County of Carroll, Pollution Control, Kentucky Utilities Company Project, Series A, Rev., VAR, 1.050%, 09/01/19 | | | 494 | |
| | | | | | | | |
| | | | Louisiana — 0.3% | |
| | | | Housing — 0.3% | |
| | 148 | | | East Baton Rouge Mortgage Finance Authority, Single Family Mortgage, Mortgage-Backed Securities Program, Series A-2, Rev., GNMA/FNMA/FHLMC, 5.250%, 10/01/39 | | | 152 | |
| | 350 | | | Louisiana Housing Finance Agency, Single Family Mortgage, Home Ownership Program, Series A, Rev., GNMA/FNMA/FHLMC, 5.500%, 06/01/40 | | | 359 | |
| | 140 | | | Louisiana Housing Finance Agency, Single Family Mortgage, Mortgage-Backed Securities Program, Series A, Rev., GNMA/FNMA/FHLMC, 4.600%, 12/01/28 | | | 144 | |
| | | | | | | | |
| | | | Total Louisiana | | | 655 | |
| | | | | | | | |
| | | | Maine — 0.6% | |
| | | | Housing — 0.6% | |
| | | | Maine State Housing Authority, | | | | |
| | 1,010 | | | Series A, Rev., 4.000%, 11/15/45 | | | 1,079 | |
| | 325 | | | Series A-1, Rev., AMT, 4.500%, 11/15/28 | | | 342 | |
| | 265 | | | Series B, Rev., 4.000%, 11/15/43 | | | 278 | |
| | | | | | | | |
| | | | Total Maine | | | 1,699 | |
| | | | | | | | |
SEE NOTES TO FINANCIAL STATEMENTS.
| | | | | | | | |
| | | |
| FEBRUARY 28, 2017 | | J.P. MORGAN MUNICIPAL BOND FUNDS | | | | | 15 | |
JPMorgan Municipal Income Fund
SCHEDULE OF PORTFOLIO INVESTMENTS
AS OF FEBRUARY 28, 2017 (continued)
(Amounts in thousands)
| | | | | | | | |
PRINCIPAL
AMOUNT($) | | | SECURITY DESCRIPTION | | VALUE($) | |
| | Municipal Bonds — continued | |
| | | | Massachusetts — 9.1% | |
| | | | Education — 0.8% | |
| | 1,000 | | | Massachusetts Educational Financing Authority, Education Loan, Rev., AMT, 5.000%, 07/01/21 | | | 1,103 | |
| | 820 | | | Massachusetts Health & Educational Facilities Authority, Massachusetts Institute of Technology, Series L, Rev., 5.250%, 07/01/33 | | | 1,050 | |
| | | | | | | | |
| | | | | | | 2,153 | |
| | | | | | | | |
| | | | General Obligation — 1.1% | |
| | 2,500 | | | Commonwealth of Massachusetts, Series B, GO, AGM, 5.250%, 09/01/21 | | | 2,920 | |
| | | | | | | | |
| | | | Housing — 0.3% | |
| | | | Massachusetts Housing Finance Agency, Single Family Housing, | | | | |
| | 405 | | | Series 169, Rev., 4.000%, 12/01/44 | | | 424 | |
| | 500 | | | Series 183, Rev., 3.500%, 12/01/46 | | | 524 | |
| | | | | | | | |
| | | | | | | 948 | |
| | | | | | | | |
| | | | Water & Sewer — 6.9% | |
| | 5,000 | | | Massachusetts Water Pollution Abatement Trust, Pool Program, Rev., 5.250%, 08/01/24 | | | 6,134 | |
| | | | Massachusetts Water Resources Authority, | | | | |
| | 7,925 | | | Series B, Rev., AGM, 5.250%, 08/01/28 | | | 9,904 | |
| | 2,000 | | | Series B, Rev., AGM, 5.250%, 08/01/29 | | | 2,515 | |
| | | | | | | | |
| | | | | | | 18,553 | |
| | | | | | | | �� |
| | | | Total Massachusetts | | | 24,574 | |
| | | | | | | | |
| | | | Michigan — 1.3% | |
| | | | Housing — 0.5% | |
| | 1,330 | | | Michigan State Housing Development Authority, Single-Family Mortgage, Series B, Rev., 3.500%, 06/01/47 | | | 1,391 | |
| | | | | | | | |
| | | | Industrial Development Revenue/Pollution Control Revenue — 0.8% | |
| | 570 | | | Michigan Strategic Fund, The Detroit Edison Company Pollution Control Bonds Project, Series CC, Rev., VAR, 1.450%, 09/01/21 | | | 556 | |
| | 1,395 | | | Saginaw County Economic Development Corp., BGI South LLC-Recovery Zone, Rev., 5.000%, 12/01/20 | | | 1,526 | |
| | | | | | | | |
| | | | | | | 2,082 | |
| | | | | | | | |
| | | | Total Michigan | | | 3,473 | |
| | | | | | | | |
| | | | Minnesota — 2.5% | |
| | | | General Obligation — 0.0% (g) | |
| | 35 | | | State of Minnesota, Series A, GO, 5.000%, 10/01/21 (p) | | | 40 | |
| | | | | | | | |
| | | | | | | | |
PRINCIPAL
AMOUNT($) | | | SECURITY DESCRIPTION | | VALUE($) | |
| | | | | | | | |
| | | | Housing — 2.5% | |
| | | | Dakota County Community Development Agency, Single Family Mortgage, Mortgage-Backed Securities Program, | | | | |
| | 415 | | | Series A, Rev., GNMA/FNMA/FHLMC, 4.500%, 06/01/35 | | | 437 | |
| | 382 | | | Series A, Rev., GNMA/FNMA/FHLMC, 5.125%, 12/01/40 | | | 384 | |
| | 17 | | | Series B, Rev., GNMA/FNMA/FHLMC, 5.150%, 12/01/38 | | | 17 | |
| | 590 | | | Minneapolis Community Development Agency, Multi-Family Housing, Riverside Homes Project, Rev., 6.100%, 09/01/19 | | | 592 | |
| | | | Minneapolis/St. Paul Housing Finance Board, Single Family Mortgage, Mortgage-Backed Securities Program, City Living Home Programs, | | | | |
| | 172 | | | Series A-1, Rev., GNMA/FNMA/FHLMC, 5.250%, 12/01/40 | | | 173 | |
| | 535 | | | Series A-2, Rev., GNMA/FNMA/FHLMC, 5.520%, 03/01/41 | | | 563 | |
| | | | Minnesota Housing Finance Agency, Homeownership Finance, Mortgage-Backed Securities Program, | | | | |
| | 520 | | | Series A, Rev., GNMA/FNMA/FHLMC, 4.250%, 07/01/28 | | | 540 | |
| | 285 | | | Series D, Rev., GNMA/FNMA/FHLMC, 4.500%, 07/01/34 | | | 297 | |
| | | | Minnesota Housing Finance Agency, Non Profit Housing, State Appropriation, | | | | |
| | 1,015 | | | Rev., 5.250%, 08/01/24 | | | 1,147 | |
| | 1,070 | | | Rev., 5.250%, 08/01/25 | | | 1,208 | |
| | 825 | | | Rev., 5.250%, 08/01/26 | | | 930 | |
| | 390 | | | Minnesota Housing Finance Agency, Residential Housing Finance, Series D, Rev., GNMA/FNMA/FHLMC, 4.000%, 07/01/40 | | | 404 | |
| | | | | | | | |
| | | | | | | 6,692 | |
| | | | | | | | |
| | | | Total Minnesota | | | 6,732 | |
| | | | | | | | |
| | | | Mississippi — 0.7% | |
| | | | Housing — 0.7% | |
| | 590 | | | Mississippi Home Corp., Home Ownership Mortgage, Series A, Rev., GNMA COLL, 4.500%, 12/01/31 | | | 617 | |
| | 1,165 | | | Mississippi Home Corp., Single Family Mortgage, Series B-1, Rev., GNMA/FNMA/FHLMC, 5.375%, 12/01/38 | | | 1,206 | |
| | | | | | | | |
| | | | Total Mississippi | | | 1,823 | |
| | | | | | | | |
SEE NOTES TO FINANCIAL STATEMENTS.
| | | | | | |
| | | |
| 16 | | | | J.P. MORGAN MUNICIPAL BOND FUNDS | | FEBRUARY 28, 2017 |
| | | | | | | | |
PRINCIPAL
AMOUNT($) | | �� | SECURITY DESCRIPTION | | VALUE($) | |
| | Municipal Bonds — continued | |
| | | | Missouri — 1.6% | |
| | | | Housing — 0.8% | |
| | 1,865 | | | Missouri Housing Development Commission, Single Family Mortgage, First Place Homeownership Loan Program, Series B, Rev., GNMA/FNMA/FHLMC COLL, 3.500%, 05/01/41 | | | 1,964 | |
| | 280 | | | Missouri Housing Development Commission, Single Family Mortgage, Special Homeownership Loan Program, Series E-1, Rev., GNMA/FNMA/FHLMC, 5.000%, 11/01/27 | | | 295 | |
| | | | | | | | |
| | | | | | | 2,259 | |
| | | | | | | | |
| | | | Transportation — 0.8% | |
| | 2,105 | | | City of St. Louis, Lambert-St. Louis International Airport, Series B, Rev., AMT, AGM, 5.000%, 07/01/19 | | | 2,134 | |
| | | | | | | | |
| | | | Total Missouri | | | 4,393 | |
| | | | | | | | |
| | | | Nevada — 0.0% (g) | |
| | | | Housing — 0.0% (g) | |
| | 73 | | | Nevada Rural Housing Authority, Single Family Mortgage, Series A, Rev., AMT, GNMA/FNMA/FHLMC, 5.200%, 11/01/40 | | | 75 | |
| | | | | | | | |
| | | | New Hampshire — 2.1% | |
| | | | Education — 2.0% | |
| | | | City of Manchester, School Facilities, | | | | |
| | 3,545 | | | Rev., NATL-RE, 5.500%, 06/01/24 | | | 4,302 | |
| | 900 | | | Rev., NATL-RE, 5.500%, 06/01/27 | | | 1,125 | |
| | | | | | | | |
| | | | | | | 5,427 | |
| | | | | | | | |
| | | | Housing — 0.1% | |
| | 245 | | | New Hampshire Housing Finance Authority, Single Family Mortgage, Series E, Rev., 6.625%, 07/01/38 | | | 259 | |
| | | | | | | | |
| | | | Total New Hampshire | | | 5,686 | |
| | | | | | | | |
| | | | New Jersey — 3.3% | |
| | | | Education — 1.0% | |
| | 250 | | | New Jersey Educational Facilities Authority, College of New Jersey Issue, Series A, Rev., 5.000%, 07/01/18 | | | 263 | |
| | | | New Jersey Higher Education Student Assistance Authority, Senior Student Loan, | | | | |
| | 500 | | | Series 1A, Rev., AMT, 5.000%, 12/01/19 | | | 537 | |
| | 1,750 | | | Series 1A, Rev., AMT, 5.000%, 12/01/24 | | | 1,943 | |
| | | | | | | | |
| | | | | | | 2,743 | |
| | | | | | | | |
| | | | | | | | |
PRINCIPAL
AMOUNT($) | | | SECURITY DESCRIPTION | | VALUE($) | |
| | | | | | | | |
| | | | General Obligation — 0.5% | |
| | 1,215 | | | Egg Harbor Township Board of Education, GO, AGM, 5.750%, 07/15/24 | | | 1,494 | |
| | | | | | | | |
| | | | Hospital — 0.8% | |
| | | | New Jersey Health Care Facilities Financing Authority, University Hospital Issue, | | | | |
| | 1,000 | | | Series A, Rev., AGM, 5.000%, 07/01/22 | | | 1,128 | |
| | 820 | | | Series A, Rev., AGM, 5.000%, 07/01/23 | | | 932 | |
| | | | | | | | |
| | | | | | | 2,060 | |
| | | | | | | | |
| | | | Industrial Development Revenue/Pollution Control Revenue — 0.2% | |
| | 500 | | | Gloucester County Improvement Authority, Solid Waste Resource Recovery, Waste Management, Inc. Project, Series A, Rev., VAR, 2.125%, 12/01/17 | | | 503 | |
| | | | | | | | |
| | | | Transportation — 0.8% | |
| | 2,000 | | | New Jersey Transportation Trust Fund Authority, Transportation System, Series A, Rev., 5.500%, 12/15/21 | | | 2,191 | |
| | | | | | | | |
| | | | Total New Jersey | | | 8,991 | |
| | | | | | | | |
| | | | New York — 10.8% | |
| | | | Housing — 1.5% | |
| | | | New York Mortgage Agency, Homeowner Mortgage, | | | | |
| | 1,745 | | | Series 195, Rev., 4.000%, 10/01/46 | | | 1,878 | |
| | 1,665 | | | Series 197, Rev., 3.500%, 10/01/44 | | | 1,755 | |
| | 345 | | | New York State Mortgage Agency, 39th Series, Rev., 5.000%, 04/01/28 | | | 362 | |
| | | | | | | | |
| | | | | | | 3,995 | |
| | | | | | | | |
| | | | Other Revenue — 2.8% | |
| | 4,000 | | | New York State Dormitory Authority, State Sales Tax, Series B, Rev., 5.000%, 03/15/30 | | | 4,713 | |
| | | | Niagara Tobacco Asset Securitization Corp., Tobacco Settlement Asset-Backed Bonds, | | | | |
| | 400 | | | Rev., 5.000%, 05/15/22 | | | 452 | |
| | 1,660 | | | Rev., 5.000%, 05/15/23 | | | 1,896 | |
| | 500 | | | TSASC, Inc., Tobacco Settlement, Series B, Rev., 5.000%, 06/01/20 | | | 537 | |
| | | | | | | | |
| | | | | | | 7,598 | |
| | | | | | | | |
| | | | Prerefunded — 0.0% (g) | |
| | 5 | | | New York State Dormitory Authority, Series A, Rev., 5.250%, 02/15/19 (p) | | | 5 | |
| | | | | | | | |
| | | | Special Tax — 0.8% | |
| | 1,995 | | | New York State Dormitory Authority, Series A, Rev., 5.250%, 02/15/24 | | | 2,154 | |
| | | | | | | | |
SEE NOTES TO FINANCIAL STATEMENTS.
| | | | | | | | |
| | | |
| FEBRUARY 28, 2017 | | J.P. MORGAN MUNICIPAL BOND FUNDS | | | | | 17 | |
JPMorgan Municipal Income Fund
SCHEDULE OF PORTFOLIO INVESTMENTS
AS OF FEBRUARY 28, 2017 (continued)
(Amounts in thousands)
| | | | | | | | |
PRINCIPAL
AMOUNT($) | | | SECURITY DESCRIPTION | | VALUE($) | |
| | Municipal Bonds — continued | |
| | | | Transportation — 3.0% | |
| | 3,000 | | | Metropolitan Transportation Authority, Dedicated Tax Fund, Series A, Rev., 5.000%, 11/15/29 | | | 3,502 | |
| | 3,000 | | | Port Authority of New York & New Jersey, Consolidated, 194th Series, Rev., 5.000%, 10/15/30 | | | 3,515 | |
| | 1,000 | | | Triborough Bridge & Tunnel Authority, MTA Bridges & Tunnels, Series B, Rev., 5.000%, 11/15/29 | | | 1,164 | |
| | | | | | | | |
| | | | | | | 8,181 | |
| | | | | | | | |
| | | | Water & Sewer — 2.7% | |
| | 1,000 | | | New York City Municipal Water Finance Authority, Water & Sewer System, Second General Resolution, Fiscal Year 2015, Series FF, Rev., 5.000%, 06/15/31 | | | 1,166 | |
| | | | New York State Environmental Facilities Corp., State Clean Water & Drinking Water Revolving Funds, New York City Municipal Water Finance Authority Projects — Second Resolution, | | | | |
| | 2,500 | | | Series A, Rev., 5.250%, 06/15/27 | | | 2,730 | |
| | 3,000 | | | Series B, Rev., 5.000%, 06/15/28 | | | 3,423 | |
| | | | | | | | |
| | | | | | | 7,319 | |
| | | | | | | | |
| | | | Total New York | | | 29,252 | |
| | | | | | | | |
| | | | North Carolina — 2.5% | |
| | | | Housing — 0.2% | |
| | 500 | | | North Carolina Housing Finance Agency, Homeownership, Series A, Rev., AMT, 3.500%, 07/01/39 | | | 524 | |
| | | | | | | | |
| | | | Other Revenue — 0.4% | |
| | 1,000 | | | County of Randolph, Limited Obligation, Series B, Rev., 5.000%, 10/01/26 | | | 1,192 | |
| | | | | | | | |
| | | | Prerefunded — 0.6% | |
| | 1,355 | | | University of North Carolina, Series A, Rev., 5.250%, 10/01/19 (p) | | | 1,498 | |
| | | | | | | | |
| | | | Water & Sewer — 1.3% | |
| | 3,330 | | | City of Charlotte, Water & Sewer System, Rev., 5.250%, 07/01/22 | | | 3,636 | |
| | | | | | | | |
| | | | Total North Carolina | | | 6,850 | |
| | | | | | | | |
| | | | North Dakota — 2.4% | |
| | | | Housing — 1.6% | |
| | | | North Dakota Housing Finance Agency, Home Mortgage Finance Program, | | | | |
| | 460 | | | Series B, Rev., 5.000%, 07/01/28 | | | 485 | |
| | 610 | | | Series D, Rev., 3.500%, 07/01/46 | | | 641 | |
| | 1,945 | | | Series D, Rev., 4.000%, 07/01/46 | | | 2,086 | |
| | | | | | | | |
PRINCIPAL
AMOUNT($) | | | SECURITY DESCRIPTION | | VALUE($) | |
| | | | | | | | |
| | | | Housing — continued | | | | |
| | 645 | | | Series D, Rev., 4.500%, 01/01/29 | | | 673 | |
| | 495 | | | Series F, Rev., AMT, 4.500%, 01/01/35 | | | 517 | |
| | | | | | | | |
| | | | | | | 4,402 | |
| | | | | | | | |
| | | | Utility — 0.8% | |
| | 2,000 | | | McLean County, Solid Waste Facilities, Great River Energy Project, Series A, Rev., 4.875%, 07/01/26 | | | 2,115 | |
| | | | | | | | |
| | | | Total North Dakota | | | 6,517 | |
| | | | | | | | |
| | | | Ohio — 2.1% | |
| | | | General Obligation — 0.7% | |
| | 1,500 | | | Lakota Local School District, Series A, GO, NATL-RE, 5.250%, 12/01/25 | | | 1,826 | |
| | | | | | | | |
| | | | Housing — 0.7% | |
| | 1,570 | | | Ohio Housing Finance Agency Residential Mortgage, Mortgage-Backed Securities Program, Series D, Rev., 4.000%, 03/01/47 | | | 1,688 | |
| | 30 | | | Ohio Housing Finance Agency, Single Family Mortgage, Series 1, Rev., GNMA/FNMA/FHLMC, 5.000%, 11/01/28 | | | 31 | |
| | | | | | | | |
| | | | | | | 1,719 | |
| | | | | | | | |
| | | | Industrial Development Revenue/Pollution Control Revenue — 0.7% | |
| | 1,615 | | | Ohio State Water Development Authority, Water Pollution Control Loan Fund, Series B, Rev., 5.000%, 12/01/29 | | | 1,922 | |
| | | | | | | | |
| | | | Utility — 0.0% (g) | |
| | 75 | | | American Municipal Power, Inc., Unrefunded Balance, Prairie State Energy Campus Project, Series A, Rev., 5.250%, 02/15/21 | | | 78 | |
| | | | | | | | |
| | | | Total Ohio | | | 5,545 | |
| | | | | | | | |
| | | | Oklahoma — 0.4% | |
| | | | Housing — 0.4% | |
| | 600 | | | Oklahoma County Home Finance Authority, Single Family Mortgage-Backed Securities Program, Series A, Rev., AMT, GNMA/FNMA/FHLMC, 5.400%, 10/01/38 | | | 618 | |
| | 460 | | | Oklahoma Housing Finance Agency, Single Family Mortgage, Homeownership Loan Program, Series A, Rev., GNMA COLL, 4.375%, 09/01/27 | | | 476 | |
| | | | | | | | |
| | | | | | | 1,094 | |
| | | | | | | | |
| | | | Other Revenue — 0.0% (g) | |
| | 38 | | | IDK Partners III Trust, Mortgage Pass-Through Certificates, Class A, Rev., 5.100%, 08/01/23 | | | 38 | |
| | | | | | | | |
| | | | Total Oklahoma | | | 1,132 | |
| | | | | | | | |
SEE NOTES TO FINANCIAL STATEMENTS.
| | | | | | |
| | | |
| 18 | | | | J.P. MORGAN MUNICIPAL BOND FUNDS | | FEBRUARY 28, 2017 |
| | | | | | | | |
PRINCIPAL
AMOUNT($) | | | SECURITY DESCRIPTION | | VALUE($) | |
| | Municipal Bonds — continued | |
| | | | Oregon — 0.5% | |
| | | | Housing — 0.5% | |
| | 1,240 | | | Oregon State Housing & Community Services Department, Single Family Mortgage Program, Series B, Rev., AMT, 5.000%, 07/01/30 | | | 1,319 | |
| | | | | | | | |
| | | | Pennsylvania — 3.1% | |
| | | | Housing — 1.7% | |
| | | | Pennsylvania Housing Finance Agency, Single Family Mortgage, | | | | |
| | 1,735 | | | Series 118A, Rev., AMT, 3.500%, 04/01/40 | | | 1,802 | |
| | 1,945 | | | Series 121, Rev., 3.500%, 10/01/46 | | | 2,041 | |
| | 600 | | | Series 122, Rev., 4.000%, 10/01/46 | | | 645 | |
| | | | | | | | |
| | | | | | | 4,488 | |
| | | | | | | | |
| | | | Industrial Development Revenue/Pollution Control Revenue — 0.4% | |
| | 1,000 | | | Pennsylvania Economic Development Financing Authority, Solid Waste Disposal, Waste Management, Inc. Project, Series A, Rev., 2.625%, 11/01/21 | | | 1,026 | |
| | | | | | | | |
| | | | Other Revenue — 0.8% | |
| | 2,000 | | | Philadelphia Redevelopment Authority, Neighborhood Transformation Initiative, Rev., 5.000%, 04/15/19 | | | 2,149 | |
| | | | | | | | |
| | | | Transportation — 0.2% | |
| | 600 | | | Allegheny County Airport Authority, Pittsburgh International Airport, Series A-1, Rev., AMT, 5.000%, 01/01/26 | | | 652 | |
| | | | | | | | |
| | | | Total Pennsylvania | | | 8,315 | |
| | | | | | | | |
| | | | Rhode Island — 1.7% | |
| | | | Education — 0.6% | |
| | | | Rhode Island Student Loan Authority, Student Loan Program, | | | | |
| | 650 | | | Series A, Rev., AMT, 5.000%, 12/01/18 | | | 686 | |
| | 1,000 | | | Series A, Rev., AMT, 5.000%, 12/01/19 | | | 1,077 | |
| | | | | | | | |
| | | | | | | 1,763 | |
| | | | | | | | |
| | | | Transportation — 1.1% | |
| | 2,600 | | | Rhode Island Economic Development Corp., Series B, Rev., 5.000%, 07/01/22 | | | 2,906 | |
| | | | | | | | |
| | | | Total Rhode Island | | | 4,669 | |
| | | | | | | | |
| | | | South Carolina — 0.5% | |
| | | | Housing — 0.5% | |
| | | | South Carolina State Housing Finance & Development Authority, | | | | |
| | 320 | | | Series 1, Rev., GNMA COLL, 5.000%, 01/01/28 | | | 337 | |
| | | | | | | | |
PRINCIPAL
AMOUNT($) | | | SECURITY DESCRIPTION | | VALUE($) | |
| | | | | | | | |
| | | | Housing — continued | | | | |
| | 400 | | | Series A, Rev., 4.000%, 01/01/47 | | | 432 | |
| | 560 | | | Series B-2, Rev., AMT, 4.000%, 07/01/43 | | | 594 | |
| | | | | | | | |
| | | | Total South Carolina | | | 1,363 | |
| | | | | | | | |
| | | | South Dakota — 1.0% | |
| | | | Housing — 1.0% | |
| | | | South Dakota Housing Development Authority, Homeownership Mortgage, | | | | |
| | 2,335 | | | Series D, Rev., 4.000%, 11/01/45 | | | 2,512 | |
| | 135 | | | Series E, Rev., 6.000%, 11/01/38 | | | 135 | |
| | | | | | | | |
| | | | Total South Dakota | | | 2,647 | |
| | | | | | | | |
| | | | Tennessee — 2.5% | |
| | | | Housing — 0.4% | |
| | 95 | | | Tennessee Housing Development Agency, Homeownership Program, Series 1C, Rev., AMT, 3.750%, 01/01/25 | | | 96 | |
| | | | Tennessee Housing Development Agency, Housing Finance Program, | | | | |
| | 510 | | | Series A-1, Rev., 5.000%, 01/01/27 | | | 529 | |
| | 55 | | | Series A-2, Rev., 4.200%, 07/01/25 | | | 56 | |
| | 320 | | | Tennessee Housing Development Agency, Residential Finance Program, Series 2B, Rev., 4.000%, 07/01/43 | | | 336 | |
| | | | | | | | |
| | | | | | | 1,017 | |
| | | | | | | | |
| | | | Transportation — 0.4% | |
| | 1,000 | | | Memphis-Shelby County Airport Authority, Series B, Rev., AMT, 5.750%, 07/01/25 | | | 1,095 | |
| | | | | | | | |
| | | | Utility — 0.8% | |
| | 2,000 | | | Tennessee Energy Acquisition Corp., Gas Project, Series A, Rev., 5.250%, 09/01/21 | | | 2,243 | |
| | | | | | | | |
| | | | Water & Sewer — 0.9% | |
| | 2,000 | | | Nashville & Davidson County Metropolitan Government, Water & Sewer, Series A, Rev., AGM, 5.250%, 01/01/21 | | | 2,292 | |
| | | | | | | | |
| | | | Total Tennessee | | | 6,647 | |
| | | | | | | | |
| | | | Texas — 4.2% | |
| | | | General Obligation — 1.1% | |
| | 2,000 | | | Socorro Independent School District, Series A, GO, PSF-GTD, 5.000%, 08/15/24 | | | 2,396 | |
| | 450 | | | State of Texas, Water Financial Assistance, Series D, GO, 5.000%, 05/15/33 | | | 520 | |
| | | | | | | | |
| | | | | | | 2,916 | |
| | | | | | | | |
| | | | Housing — 0.7% | |
| | 1,070 | | | Multi-Family Housing, Bond Pass-Through Certificates, Grand Reserve Apartments, Series 8, Rev., VAR, 5.950%, 11/01/23 | | | 1,071 | |
SEE NOTES TO FINANCIAL STATEMENTS.
| | | | | | | | |
| | | |
| FEBRUARY 28, 2017 | | J.P. MORGAN MUNICIPAL BOND FUNDS | | | | | 19 | |
JPMorgan Municipal Income Fund
SCHEDULE OF PORTFOLIO INVESTMENTS
AS OF FEBRUARY 28, 2017 (continued)
(Amounts in thousands)
| | | | | | | | |
PRINCIPAL
AMOUNT($) | | | SECURITY DESCRIPTION | | VALUE($) | |
| | Municipal Bonds — continued | |
| | | | Housing — continued | |
| | 670 | | | Texas Department of Housing & Community Affairs, Residential Mortgage, Series A, Rev., GNMA/FNMA/FHLMC, 5.000%, 07/01/29 | | | 712 | |
| | 203 | | | West Central Regional Housing Finance Corp., Mortgage-Backed Securities Program, Single Family Mortgage, Series A, Rev., AMT, GNMA/FNMA/FHLMC, 5.350%, 12/01/39 | | | 203 | |
| | | | | | | | |
| | | | | | | 1,986 | |
| | | | | | | | |
| | | | Industrial Development Revenue/Pollution Control Revenue — 1.2% | |
| | | | Harris County Industrial Development Corp., Solid Waste Disposal, Deer Park Refining Limited Partnership Project, | | | | |
| | 900 | | | Rev., 4.700%, 05/01/18 | | | 929 | |
| | 2,000 | | | Rev., 5.000%, 02/01/23 | | | 2,165 | |
| | | | | | | | |
| | | | | | | 3,094 | |
| | | | | | | | |
| | | | Transportation — 1.2% | |
| | 2,800 | | | Dallas Area Rapid Transit, Senior Lien, Series A, Rev., 5.000%, 12/01/32 | | | 3,245 | |
| | | | | | | | |
| | | | Total Texas | | | 11,241 | |
| | | | | | | | |
| | | | Utah — 2.6% | |
| | | | Housing — 2.2% | |
| | 1,865 | | | Utah Housing Corp., Single Family Mortgage, Series D, Rev., FHA, 4.000%, 01/01/45 | | | 1,990 | |
| | 3,245 | | | Utah State Board of Regents, Student Fee & Housing System, Rev., NATL-RE, 5.250%, 04/01/23 | | | 3,844 | |
| | | | | | | | |
| | | | | | | 5,834 | |
| | | | | | | | |
| | | | Other Revenue — 0.4% | |
| | 970 | | | Utah Transit Authority, Sales Tax, Series C, Rev., AGM, 5.250%, 06/15/29 | | | 1,208 | |
| | | | | | | | |
| | | | Total Utah | | | 7,042 | |
| | | | | | | | |
| | | | Vermont — 4.1% | |
| | | | Education — 1.8% | |
| | | | Vermont Student Assistance Corp., Education Loan, | | | | |
| | 1,000 | | | Series A, Rev., AMT, 5.000%, 06/15/23 | | | 1,098 | |
| | 1,400 | | | Series A, Rev., AMT, 5.000%, 06/15/24 | | | 1,539 | |
| | 2,150 | | | Series A, Rev., AMT, 5.000%, 06/15/25 | | | 2,357 | |
| | | | | | | | |
| | | | | | | 4,994 | |
| | | | | | | | |
| | | | Housing — 2.3% | |
| | | | Vermont Housing Finance Agency, Multiple Purpose, | | | | |
| | 1,800 | | | Series A, Rev., AMT, 4.000%, 11/01/46 | | | 1,885 | |
| | | | | | | | |
PRINCIPAL
AMOUNT($) | | | SECURITY DESCRIPTION | | VALUE($) | |
| | | | | | | | |
| | | | | | | | |
| | | | Housing — continued | |
| | 2,060 | | | Series B, Rev., AMT, 3.750%, 11/01/45 | | | 2,137 | |
| | 365 | | | Series B, Rev., AMT, 4.125%, 11/01/42 | | | 377 | |
| | 1,650 | | | Series C, Rev., AMT, GNMA/FNMA/FHLMC COLL, 4.000%, 11/01/46 | | | 1,759 | |
| | | | | | | | |
| | | | | | | 6,158 | |
| | | | | | | | |
| | | | Total Vermont | | | 11,152 | |
| | | | | | | | |
| | | | Washington — 1.8% | |
| | | | General Obligation — 0.9% | |
| | 2,000 | | | State of Washington, Motor Vehicle Fuel Tax, Series B, GO, 5.000%, 07/01/22 | | | 2,340 | |
| | | | | | | | |
| | | | Housing — 0.2% | |
| | 500 | | | Washington Housing Finance Commission, Single-Family Program, Series 2A-R, Rev., AMT, 3.500%, 12/01/46 | | | 520 | |
| | | | | | | | |
| | | | Transportation — 0.5% | |
| | 1,300 | | | Port of Seattle, Series B, Rev., AMT, 5.000%, 09/01/25 | | | 1,452 | |
| | | | | | | | |
| | | | Utility — 0.2% | |
| | 500 | | | Chelan County Public Utility District No.1, Series A, Rev., AMT, 5.500%, 07/01/26 | | | 564 | |
| | | | | | | | |
| | | | Total Washington | | | 4,876 | |
| | | | | | | | |
| | | | West Virginia — 1.1% | |
| | | | Other Revenue — 1.1% | |
| | 2,690 | | | West Virginia Economic Development Authority, Lease, Correctional Juvenile & Public Safety Facilities, Series A, Rev., 5.000%, 06/01/29 | | | 3,058 | |
| | | | | | | | |
| | | | Total Municipal Bonds
(Cost $247,613) | | | 254,257 | |
| | | | | | | | |
| | Weekly Demand Note — 1.5% (t) | |
| | | | Connecticut — 1.5% | |
| | | | Housing — 1.5% | |
| | 4,000 | | | Connecticut Housing Finance Authority, Housing Mortgage Finance Program, Series C-1, Rev., VRDO, 0.620%, 03/01/17
(Cost $4,000) | | | 4,000 | |
| | | | | | | | |
| SHARES | | | | | | |
| | Investment Company — 2.0% | |
| | 391 | | | Nuveen Quality Municipal Income Fund
(Cost $5,430) | | | 5,432 | |
| | | | | | | | |
SEE NOTES TO FINANCIAL STATEMENTS.
| | | | | | |
| | | |
| 20 | | | | J.P. MORGAN MUNICIPAL BOND FUNDS | | FEBRUARY 28, 2017 |
| | | | | | | | |
| SHARES | | | SECURITY DESCRIPTION | | VALUE($) | |
| | Short-Term Investment — 1.9% | |
| | | | Investment Company — 1.9% | |
| | 5,140 | | | JPMorgan U.S. Government Money Market Fund, Institutional Class Shares, 0.450% (b) (l)
(Cost $5,140) | | | 5,140 | |
| | | | | | | | |
| | | | Total Investments — 99.3%
(Cost $262,183) | | | 268,829 | |
| | | | Other Assets in Excess of
Liabilities — 0.7% | | | 1,982 | |
| | | | | | | | |
| | | | NET ASSETS — 100.0% | | $ | 270,811 | |
| | | | | | | | |
Percentages indicated are based on net assets.
SEE NOTES TO FINANCIAL STATEMENTS.
| | | | | | | | |
| | | |
| FEBRUARY 28, 2017 | | J.P. MORGAN MUNICIPAL BOND FUNDS | | | | | 21 | |
JPMorgan Ohio Municipal Bond Fund
SCHEDULE OF PORTFOLIO INVESTMENTS
AS OF FEBRUARY 28, 2017
(Amounts in thousands)
| | | | | | | | |
PRINCIPAL
AMOUNT($) | | | SECURITY DESCRIPTION | | VALUE($) | |
| | Municipal Bonds — 97.5% (t) | |
| | | | California — 2.6% | |
| | | | General Obligation — 2.6% | |
| | 2,700 | | | Foothill-De Anza Community College District, Series B, GO, NATL-RE, Zero Coupon, 08/01/28 | | | 1,880 | |
| | 1,500 | | | Napa & Sonoma Counties Valley Community College District, Election of 2002, Series C, GO, NATL-RE, Zero Coupon, 08/01/20 | | | 1,292 | |
| | | | | | | | |
| | | | Total California | | | 3,172 | |
| | | | | | | | |
| | | | Illinois — 1.2% | |
| | | | Water & Sewer — 1.2% | |
| | 1,500 | | | City of Chicago, Water, Second Lien, Series A, Rev., AMBAC, 5.000%, 11/01/20 | | | 1,505 | |
| | | | | | | | |
| | | | Ohio — 92.5% | |
| | | | Certificate of Participation/Lease — 1.6% | |
| | 1,800 | | | Ohio State Department of Administrative Services, State Taxation Accounting & Revenue System Project, COP, 5.000%, 09/01/18 | | | 1,908 | |
| | | | | | | | |
| | | | Education — 10.5% | |
| | 1,285 | | | Cuyahoga Community College District, General Receipts, Series D, Rev., 5.000%, 08/01/27 | | | 1,466 | |
| | 565 | | | Miami University, A State University of Ohio, Rev., 5.000%, 09/01/33 | | | 651 | |
| | | | Ohio State University, General Receipts, | | | | |
| | 85 | | | Series D, Rev., 5.000%, 12/01/26 (p) | | | 105 | |
| | 85 | | | Series D, Rev., 5.000%, 12/01/27 (p) | | | 106 | |
| | 500 | | | Ohio State University, General Receipts, Special Purpose, Series A, Rev., 5.000%, 06/01/28 | | | 575 | |
| | | | Ohio State University, General Receipts, Unrefunded Balance, | | | | |
| | 1,915 | | | Series D, Rev., 5.000%, 12/01/26 | | | 2,341 | |
| | 1,915 | | | Series D, Rev., 5.000%, 12/01/27 | | | 2,355 | |
| | 1,650 | | | State of Ohio, Higher Educational Facility, Case Western Reserve University 2006 Project, Rev., NATL-RE, 5.250%, 12/01/19 | | | 1,829 | |
| | 2,000 | | | State of Ohio, Higher Educational Facility, University of Dayton 2013 Project, Rev., 5.000%, 12/01/28 | | | 2,256 | |
| | 1,000 | | | Wright State University, General Receipts, Series A, Rev., 5.000%, 05/01/26 | | | 1,109 | |
| | | | | | | | |
| | | | | | | 12,793 | |
| | | | | | | | |
| | | | General Obligation — 18.4% | |
| | 1,240 | | | City of Cleveland, Various Purpose, GO, 5.000%, 12/01/26 | | | 1,445 | |
| | 2,470 | | | City of Columbus, Unlimited Tax, Various Purpose, Series B, GO, 5.000%, 12/01/32 | | | 2,871 | |
| | | | | | | | |
PRINCIPAL
AMOUNT($) | | | SECURITY DESCRIPTION | | VALUE($) | |
| | | | | | | | |
| | | | General Obligation — continued | | | | |
| | 2,500 | | | County of Butler, Lakota Local School District, Series A, GO, NATL-RE, FGIC, 5.250%, 12/01/24 | | | 3,019 | |
| | | | County of Hamilton, Cincinnati City School District, Board of Education, Classroom Facilities Construction & Improvement, | | | | |
| | 1,000 | | | GO, NATL-RE, FGIC, 5.250%, 12/01/20 | | | 1,141 | |
| | 3,000 | | | GO, NATL-RE, FGIC, 5.250%, 12/01/24 | | | 3,630 | |
| | 1,800 | | | GO, NATL-RE, 5.250%, 12/01/25 | | | 2,185 | |
| | 1,000 | | | Franklin & Licking Counties, New Albany Plain Local School District, Various Purpose, GO, 5.000%, 12/01/25 | | | 1,120 | |
| | 1,500 | | | State of Ohio, Common Schools, Series B, GO, 5.000%, 09/15/26 | | | 1,703 | |
| | | | State of Ohio, Higher Educational, | | | | |
| | 1,500 | | | Series C, GO, 5.000%, 11/01/31 | | | 1,744 | |
| | 1,000 | | | Series C, GO, 5.000%, 11/01/33 | | | 1,151 | |
| | 1,000 | | | State of Ohio, Infrastructure Improvement, Series C, GO, 5.000%, 03/01/29 | | | 1,147 | |
| | 1,000 | | | Toledo City School District, School Facilities Improvement, GO, 5.000%, 12/01/23 | | | 1,129 | |
| | | | | | | | |
| | | | | | | 22,285 | |
| | | | | | | | |
| | | | Hospital — 9.8% | |
| | | | County of Franklin, Hospital Facilities, OhioHealth Corp., | | | | |
| | 1,000 | | | Rev., 5.000%, 05/15/27 | | | 1,147 | |
| | 500 | | | Rev., 5.000%, 05/15/31 | | | 570 | |
| | | | State of Ohio, Hospital, Cleveland Clinic Health System Obligated Group, | | | | |
| | 2,000 | | | Series A, Rev., 5.000%, 01/01/26 | | | 2,058 | |
| | 1,500 | | | Series B, Rev., 5.000%, 01/01/25 | | | 1,593 | |
| | | | State of Ohio, University Hospital Health System, Inc., | | | | |
| | 1,500 | | | Series A, Rev., 5.000%, 01/15/20 | | | 1,646 | |
| | 550 | | | Series A, Rev., 5.000%, 01/15/24 | | | 592 | |
| | 1,000 | | | Series A, Rev., 5.000%, 01/15/28 | | | 1,115 | |
| | 1,885 | | | Series A, Rev., 5.000%, 01/15/32 | | | 2,084 | |
| | 1,000 | | | Series A, Rev., 5.250%, 01/15/23 | | | 1,089 | |
| | | | | | | | |
| | | | | | | 11,894 | |
| | | | | | | | |
| | | | Housing — 3.2% | |
| | 510 | | | County of Cuyahoga, Multi-Family Housing, Allerton Apartments Project, Series A, Rev., FHA, GNMA COLL, 4.900%, 08/20/22 | | | 526 | |
| | 45 | | | County of Trumbull, Multi-Family Housing, Royal Mall Apartments Project, Series A, Rev., FHA, GNMA COLL, 4.800%, 05/20/17 | | | 45 | |
SEE NOTES TO FINANCIAL STATEMENTS.
| | | | | | |
| | | |
| 22 | | | | J.P. MORGAN MUNICIPAL BOND FUNDS | | FEBRUARY 28, 2017 |
| | | | | | | | |
PRINCIPAL
AMOUNT($) | | | SECURITY DESCRIPTION | | VALUE($) | |
| | Municipal Bonds — continued | |
| | | | Housing — continued | |
| | | | Ohio Housing Finance Agency, | | | | |
| | 1,000 | | | Series A, Rev., AGM, 5.000%, 04/01/22 | | | 1,004 | |
| | 500 | | | Series A, Rev., AGM, 5.000%, 04/01/27 | | | 502 | |
| | 1,245 | | | Ohio Housing Finance Agency, Multi-Family Housing, Hillwood II Project, Rev., AMT, GNMA COLL, 4.850%, 05/20/21 | | | 1,273 | |
| | 45 | | | Ohio Housing Finance Agency, Multi-Family Housing, Warren Heights, Series C, Rev., AMT, FHA, GNMA COLL, 4.500%, 11/20/17 | | | 45 | |
| | 415 | | | Ohio Housing Finance Agency, Residential Mortgage-Backed Securities Program, Series J, Rev., GNMA/FNMA/FHLMC, 5.900%, 09/01/23 | | | 425 | |
| | 35 | | | Summit County Port Authority, Multi-Family Housing, Callis Tower Apartments Project, Rev., FHA, GNMA COLL, 4.500%, 09/20/17 | | | 35 | |
| | | | | | | | |
| | | | | | | 3,855 | |
| | | | | | | | |
| | | | Other Revenue — 10.5% | |
| | | | City of Cleveland, Parking Facilities, | | | | |
| | 440 | | | Rev., AGM, 5.250%, 09/15/21 (p) | | | 514 | |
| | 930 | | | Rev., AGM, 5.250%, 09/15/21 | | | 1,053 | |
| | 1,310 | | | County of Cuyahoga, Economic Development, Shaker Square Project, Series D, Rev., 5.000%, 12/01/25 | | | 1,453 | |
| | 1,250 | | | County of Cuyahoga, Various Purpose, Rev., 5.000%, 12/01/29 | | | 1,453 | |
| | 115 | | | Franklin County Convention Facilities Authority, Rev., RAN, 5.000%, 12/01/22 | | | 118 | |
| | | | Ohio State Building Authority, State Facilities, Administrative Building Fund Projects, | | | | |
| | 1,000 | | | Series B, Rev., 5.000%, 10/01/23 | | | 1,096 | |
| | 1,220 | | | Series B, Rev., 5.000%, 10/01/24 | | | 1,336 | |
| | 1,235 | | | RiverSouth Authority, RiverSouth Area Redevelopment, Series A, Rev., 5.000%, 12/01/21 | | | 1,416 | |
| | 1,000 | | | State of Ohio, Cultural & Sports Capital Appreciation Facilities, Series A, Rev., 5.250%, 10/01/20 | | | 1,129 | |
| | 1,235 | | | State of Ohio, Parks & Recreation Capital Facilities, Series II-A, Rev., 5.000%, 12/01/20 | | | 1,395 | |
| | 1,500 | | | State of Ohio, Parks & Recreation Improvement Fund Projects, Series C, Rev., 5.000%, 12/01/31 | | | 1,747 | |
| | | | | | | | |
| | | | | | | 12,710 | |
| | | | | | | | |
| | | | Prerefunded — 20.2% | |
| | 1,000 | | | American Municipal Power-Ohio, Inc., Prairie State Energy Campus Project, Series A, Rev., AGC, 5.000%, 02/15/19 (p) | | | 1,078 | |
| | | | | | | | |
PRINCIPAL
AMOUNT($) | | | SECURITY DESCRIPTION | | VALUE($) | |
| | | | | | | | |
| | | | Prerefunded — continued | |
| | 1,530 | | | Beavercreek City School District, Counties of Greene & Montgomery, School Improvement, GO, 5.000%, 06/01/19 (p) | | | 1,665 | |
| | 2,895 | | | Central Ohio Solid Waste Authority, Solid Waste Facilities Improvement, Limited Tax, GO, 5.000%, 06/01/22 (p) | | | 3,396 | |
| | 2,000 | | | City of Avon, Series B, GO, 5.000%, 12/01/18 (p) | | | 2,141 | |
| | 1,500 | | | City of Columbus, Limited Tax, Various Purpose, Series B, GO, 5.000%, 08/15/23 (p) | | | 1,792 | |
| | 1,500 | | | City of Columbus, Unlimited Tax, Various Purpose, Series A, GO, 5.000%, 07/01/21 (p) | | | 1,727 | |
| | 1,000 | | | City of Strongsville, Limited Tax, Various Purpose, GO, 5.000%, 12/01/18 (p) | | | 1,070 | |
| | 1,000 | | | County of Franklin, City of Columbus, School District, School Facilities Construction & Improvement, GO, 5.000%, 06/01/19 (p) | | | 1,087 | |
| | 1,405 | | | Delaware & Franklin Counties, Olentangy Local School District, School Facilities Construction & Improvement, GO, 5.000%, 06/01/18 (p) | | | 1,478 | |
| | 1,000 | | | Franklin, Delaware & Union Counties, Dublin City School District, School Facilities Construction & Improvement, GO, 5.000%, 12/01/18 (p) | | | 1,071 | |
| | 1,835 | | | Ohio State Building Authority, State Facilities, Administrative Building Fund Projects, Series A, Rev., 5.000%, 04/01/19 (p) | | | 1,985 | |
| | 1,745 | | | Ohio State Building Authority, State Facilities, Adult Correctional Building Fund Projects, Series A, Rev., 5.000%, 04/01/19 (p) | | | 1,888 | |
| | 2,185 | | | State of Ohio, Higher Educational Facility, Otterbein College 2008 Project, Series A, Rev., 5.500%, 12/01/18 (p) | | | 2,358 | |
| | 1,750 | | | State of Ohio, Infrastructure Improvement, Series A, GO, 5.375%, 03/01/18 (p) | | | 1,830 | |
| | | | | | | | |
| | | | | | | 24,566 | |
| | | | | | | | |
| | | | Transportation — 7.6% | |
| | 2,000 | | | City of Cleveland, Airport System, Series A, Rev., AGM-CR, AMBAC, 5.250%, 01/01/20 | | | 2,199 | |
| | | | Ohio State Turnpike Commission, | | | | |
| | 2,000 | | | Series A, Rev., 5.000%, 02/15/22 | | | 2,127 | |
| | 1,185 | | | Series A, Rev., 5.000%, 02/15/23 | | | 1,261 | |
| | 2,000 | | | Series A, Rev., 5.250%, 02/15/27 | | | 2,471 | |
| | 1,000 | | | State of Ohio, Capital Facilities Lease Appropriation, Series A, Rev., 5.000%, 04/01/30 | | | 1,144 | |
| | | | | | | | |
| | | | | | | 9,202 | |
| | | | | | | | |
SEE NOTES TO FINANCIAL STATEMENTS.
| | | | | | | | |
| | | |
| FEBRUARY 28, 2017 | | J.P. MORGAN MUNICIPAL BOND FUNDS | | | | | 23 | |
JPMorgan Ohio Municipal Bond Fund
SCHEDULE OF PORTFOLIO INVESTMENTS
AS OF FEBRUARY 28, 2017 (continued)
(Amounts in thousands)
| | | | | | | | |
PRINCIPAL
AMOUNT($) | | | SECURITY DESCRIPTION | | VALUE($) | |
| | Municipal Bonds — continued | |
| | | | Utility — 1.7% | |
| | | | City of Hamilton, Electric System, | | | | |
| | 950 | | | Series A, Rev., AGC, 5.000%, 10/01/20 | | | 1,033 | |
| | 1,000 | | | Series A, Rev., AGC, 5.000%, 10/01/21 | | | 1,082 | |
| | | | | | | | |
| | | | | | | 2,115 | |
| | | | | | | | |
| | | | Water & Sewer — 9.0% | |
| | | | City of Columbus, Sewerage System, | | | | |
| | 1,000 | | | Rev., 5.000%, 06/01/28 | | | 1,172 | |
| | 1,950 | | | Rev., 5.000%, 06/01/29 | | | 2,316 | |
| | 1,880 | | | Rev., 5.000%, 06/01/30 | | | 2,220 | |
| | 1,000 | | | City of Toledo, Water System, Series A, Rev., 5.000%, 11/15/25 | | | 1,125 | |
| | | | Ohio State Water Development Authority, Fresh Water, | | | | |
| | 2,000 | | | Rev., 5.500%, 12/01/21 | | | 2,377 | |
| | 1,500 | | | Series A, Rev., 5.000%, 12/01/30 | | | 1,781 | |
| | | | | | | | |
| | | | | | | 10,991 | |
| | | | | | | | |
| | | | Total Ohio | | | 112,319 | |
| | | | | | | | |
| | | | | | | | |
PRINCIPAL
AMOUNT($) | | | SECURITY DESCRIPTION | | VALUE($) | |
| | | | | | | | |
| | | | Texas — 1.2% | |
| | | | Housing — 1.2% | |
| | 1,500 | | | Southeast Texas Housing Finance Corp., Single Family Mortgage, Series A, Rev., NATL-RE, Zero Coupon, 09/01/17 (p) | | | 1,494 | |
| | | | | | | | |
| | | | Total Municipal Bonds
(Cost $113,192) | | | 118,490 | |
| | | | | | | | |
| | |
SHARES | | | | | | |
| | Short-Term Investment — 1.4% | |
| | | | Investment Company — 1.4% | | | | |
| | 1,648 | | | JPMorgan U.S. Government Money Market Fund, Institutional Class Shares, 0.450% (b) (l)
(Cost $1,648) | | | 1,648 | |
| | | | | | | | |
| | | | Total Investments — 98.9%
(Cost $114,840) | | | 120,138 | |
| | | | Other Assets in Excess of
Liabilities — 1.1% | | | 1,288 | |
| | | | | | | | |
| | | | NET ASSETS — 100.0% | | $ | 121,426 | |
| | | | | | | | |
Percentages indicated are based on net assets.
SEE NOTES TO FINANCIAL STATEMENTS.
| | | | | | |
| | | |
| 24 | | | | J.P. MORGAN MUNICIPAL BOND FUNDS | | FEBRUARY 28, 2017 |
JPMorgan Short-Intermediate Municipal Bond Fund
SCHEDULE OF PORTFOLIO INVESTMENTS
AS OF FEBRUARY 28, 2017
(Amounts in thousands)
| | | | | | | | |
PRINCIPAL
AMOUNT($) | | | SECURITY DESCRIPTION | | VALUE($) | |
| | Collateralized Mortgage Obligation — 0.0% (g) | |
| | 303 | | | FNMA REMIC, Series 2002-36, Class FS, VAR, 1.278%, 06/25/32
(Cost $303) | | | 307 | |
| | | | | | | | |
| | Daily Demand Notes — 0.4% (t) | |
| | | | Ohio — 0.4% | |
| | | | Hospital — 0.4% | |
| | | | State of Ohio, University Hospitals Health System, Inc., | | | | |
| | 5,000 | | | Series A, Rev., VRDO, 0.850%, 03/01/17 | | | 5,000 | |
| | 2,500 | | | Series B, Rev., VRDO, 0.850%, 03/01/17 | | | 2,500 | |
| | | | | | | | |
| | | | Total Ohio | | | 7,500 | |
| | | | | | | | |
| | | | Total Daily Demand Notes
(Cost $7,500) | | | 7,500 | |
| | | | | | | | |
| | Monthly Demand Notes — 3.5% | |
| | | | Connecticut — 1.6% | |
| | | | Education — 1.6% | |
| | 15,000 | | | State of Connecticut, Health & Educational Facilities Authority, Hartford Healthcare Issue, Series G, Rev., VAR, 1.483%, 04/03/17 | | | 14,947 | |
| | 18,775 | | | State of Connecticut, Health & Educational Facility Authority, Series B, Rev., VAR, 1.076%, 04/03/17 | | | 18,713 | |
| | | | | | | | |
| | | | Total Connecticut | | | 33,660 | |
| | | | | | | | |
| | | | Kansas — 0.1% | |
| | | | Transportation — 0.1% | |
| | 2,000 | | | State of Kansas, Department of Transportation, Highway, Series B-3, Rev., VAR, 0.766%, 04/03/17 | | | 1,999 | |
| | | | | | | | |
| | | | Louisiana — 0.7% | |
| | | | Other Revenue — 0.5% | |
| | 9,500 | | | State of Louisiana, Gasoline & Fuels Tax, Second Lien Revenue, Libor Index, Series A, Rev., VAR, 1.019%, 04/03/17 | | | 9,445 | |
| | | | | | | | |
| | | | Water & Sewer — 0.2% | |
| | 4,690 | | | East Baton Rouge Sewerage Commission, Series A, Rev., VAR, 1.049%, 04/03/17 | | | 4,665 | |
| | | | | | | | |
| | | | Total Louisiana | | | 14,110 | |
| | | | | | | | |
| | | | New Jersey — 0.2% | |
| | | | Transportation — 0.2% | |
| | 4,000 | | | New Jersey Turnpike Authority, Series B-3, Rev., VAR, 1.096%, 04/03/17 | | | 4,004 | |
| | | | | | | | |
| | | | New York — 0.9% | |
| | | | Transportation — 0.7% | |
| | 15,000 | | | Triborough Bridge & Tunnel Authority, Subseries B-C, Rev., VAR, 0.926%, 04/03/17 | | | 14,855 | |
| | | | | | | | |
| | | | | | | | |
PRINCIPAL
AMOUNT($) | | | SECURITY DESCRIPTION | | VALUE($) | |
| | | | | | | | |
| | | | Utility — 0.2% | |
| | 5,000 | | | Long Island Power Authority, Electric System, Series C, Rev., VAR, 1.199%, 04/03/17 | | | 5,000 | |
| | | | | | | | |
| | | | Total New York | | | 19,855 | |
| | | | | | | | |
| | | | Total Monthly Demand Notes
(Cost $73,962) | | | 73,628 | |
| | | | | | | | |
| | Municipal Bonds — 84.4% (t) | |
| | | | Alabama — 0.6% | |
| | | | Industrial Development Revenue/Pollution Control Revenue — 0.2% | |
| | 3,480 | | | City of Mobile, Industrial Development Board, Pollution Control, Alabama Power Co., Barry Plant Project, Series A, Rev., VAR, 1.650%, 03/20/17 | | | 3,481 | |
| | | | | | | | |
| | | | Other Revenue — 0.0% (g) | |
| | 500 | | | Montgomery County Public Building Authority, Revenue Refunding Warrants, Facilities Project, Rev., 5.000%, 03/01/23 | | | 583 | |
| | | | | | | | |
| | | | Utility — 0.4% | |
| | 7,675 | | | The Black Belt Energy Gas District Gas Supply, Series A, Rev., VAR, LIQ: Royal Bank of Canada, 4.000%, 06/01/21 | | | 8,270 | |
| | | | | | | | |
| | | | Total Alabama | | | 12,334 | |
| | | | | | | | |
| | | | Alaska — 0.7% | |
| | | | General Obligation — 0.7% | |
| | 2,895 | | | North Slope Borough, General Purpose, Series B, GO, 5.000%, 06/30/20 | | | 3,231 | |
| | | | State of Alaska, | | | | |
| | 8,230 | | | Series A, GO, 5.000%, 08/01/17 | | | 8,377 | |
| | 2,000 | | | Series B, GO, 5.000%, 08/01/18 | | | 2,112 | |
| | | | | | | | |
| | | | | | | 13,720 | |
| | | | | | | | |
| | | | Utility — 0.0% (g) | |
| | 500 | | | City of Anchorage, Electric Utilities, Senior Lien, Series A, Rev., 5.000%, 12/01/23 | | | 586 | |
| | | | | | | | |
| | | | Total Alaska | | | 14,306 | |
| | | | | | | | |
| | | | Arizona — 0.8% | |
| | | | Certificate of Participation/Lease — 0.0% (g) | |
| | 500 | | | Arizona School Facilities Board, Series A-1, COP, 5.000%, 09/01/19 | | | 545 | |
| | | | | | | | |
| | | | General Obligation — 0.1% | |
| | 2,550 | | | City of Scottsdale, GO, 5.000%, 07/01/22 | | | 2,994 | |
| | | | | | | | |
| | | | Hospital — 0.4% | |
| | | | Arizona Health Facilities Authority, Scottsdale Lincoln Hospitals, | | | | |
| | 250 | | | Series A, Rev., 5.000%, 12/01/21 | | | 287 | |
| | 3,540 | | | Series A, Rev., 5.000%, 12/01/25 | | | 4,125 | |
SEE NOTES TO FINANCIAL STATEMENTS.
| | | | | | | | |
| | | |
| FEBRUARY 28, 2017 | | J.P. MORGAN MUNICIPAL BOND FUNDS | | | | | 25 | |
JPMorgan Short-Intermediate Municipal Bond Fund
SCHEDULE OF PORTFOLIO INVESTMENTS
AS OF FEBRUARY 28, 2017 (continued)
(Amounts in thousands)
| | | | | | | | |
PRINCIPAL
AMOUNT($) | | | SECURITY DESCRIPTION | | VALUE($) | |
| | Municipal Bonds — continued | |
| | | | Hospital — continued | |
| | 3,000 | | | Series A, Rev., 5.000%, 12/01/26 | | | 3,472 | |
| | | | | | | | |
| | | | | | | 7,884 | |
| | | | | | | | |
| | | | Transportation — 0.2% | |
| | | | Maricopa County, Regional Public Transportation Authority, Excise Tax Revenue, Public Transportation Fund, | | | | |
| | 1,000 | | | Rev., 5.250%, 07/01/18 | | | 1,059 | |
| | 3,100 | | | Rev., 5.250%, 07/01/19 | | | 3,399 | |
| | | | | | | | |
| | | | | | | 4,458 | |
| | | | | | | | |
| | | | Water & Sewer — 0.1% | |
| | 1,000 | | | Pima County, Sewer System, Rev., 5.000%, 07/01/18 | | | 1,056 | |
| | | | | | | | |
| | | | Total Arizona | | | 16,937 | |
| | | | | | | | |
| | | | Arkansas — 0.4% | |
| | | | Education — 0.2% | |
| | | | University of Arkansas, Uams Campus, | | | | |
| | 535 | | | Rev., 5.000%, 03/01/20 | | | 593 | |
| | 500 | | | Rev., 5.000%, 03/01/25 | | | 597 | |
| | 1,000 | | | Rev., 5.000%, 03/01/26 | | | 1,186 | |
| | 1,000 | | | Rev., 5.000%, 03/01/27 | | | 1,177 | |
| | | | | | | | |
| | | | | | | 3,553 | |
| | | | | | | | |
| | | | Hospital — 0.1% | |
| | 1,410 | | | County of Pulaski, Arkansas Children’s Hospital, Rev., 5.000%, 03/01/28 | | | 1,662 | |
| | | | | | | | |
| | | | Other Revenue — 0.0% (g) | |
| | 580 | | | City of Little Rock, Hotel & Restaurant, Rev., 5.000%, 07/01/20 | | | 647 | |
| | | | | | | | |
| | | | Water & Sewer — 0.1% | |
| | 1,095 | | | City of Fort Smith, Water & Sewer Refunding & Construction, Rev., 5.000%, 10/01/28 | | | 1,264 | |
| | 555 | | | City of Little Rock, Sewer, Rev., 5.000%, 10/01/25 | | | 652 | |
| | | | | | | | |
| | | | | | | 1,916 | |
| | | | | | | | |
| | | | Total Arkansas | | | 7,778 | |
| | | | | | | | |
| | | | California — 20.0% | |
| | | | Certificate of Participation/Lease — 0.5% | |
| | | | City of Chula Vista, Police Facility Project, | | | | |
| | 360 | | | COP, 5.000%, 10/01/21 | | | 410 | |
| | 465 | | | COP, 5.000%, 10/01/22 | | | 538 | |
| | 1,000 | | | COP, 5.000%, 10/01/23 | | | 1,168 | |
| | 140 | | | Goleta Water District, Series A, COP, AGM, 5.000%, 12/01/20 | | | 159 | |
| | | | | | | | |
PRINCIPAL
AMOUNT($) | | | SECURITY DESCRIPTION | | VALUE($) | |
| | | | | | | | |
| | | | Certificate of Participation/Lease — continued | |
| | | | Sweetwater Union High School District, | | | | |
| | 1,000 | | | COP, 5.000%, 09/01/24 | | | 1,176 | |
| | 1,440 | | | COP, 5.000%, 09/01/25 | | | 1,706 | |
| | 2,000 | | | COP, 5.000%, 09/01/27 | | | 2,386 | |
| | 2,830 | | | COP, 5.000%, 09/01/28 | | | 3,336 | |
| | | | | | | | |
| | | | | | | 10,879 | |
| | | | | | | | |
| | | | Education — 1.1% | |
| | | | California Educational Facilities Authority, Claremont Mckenna College, | | | | |
| | 1,575 | | | Series A, Rev., 4.000%, 01/01/23 | | | 1,777 | |
| | 1,675 | | | Series A, Rev., 4.000%, 01/01/24 | | | 1,898 | |
| | 11,505 | | | Regents of the University of California, Series AK, Rev., VAR, 5.000%, 05/15/23 | | | 13,612 | |
| | 4,750 | | | Regents of the University of California, Limited Project, Series I, Rev., 5.000%, 05/15/17 | | | 4,796 | |
| | | | | | | | |
| | | | | | | 22,083 | |
| | | | | | | | |
| | | | General Obligation — 7.6% | |
| | | | Albany Unified School District, | | | | |
| | 230 | | | GO, 5.000%, 08/01/25 | | | 280 | |
| | 760 | | | GO, 5.000%, 08/01/27 | | | 923 | |
| | 1,050 | | | Allan Hancock Joint Community College District, GO, 5.000%, 08/01/22 | | | 1,236 | |
| | | | City & County of San Francisco, | | | | |
| | 5,310 | | | Series A, GO, 5.000%, 06/15/25 | | | 6,229 | |
| | 10,000 | | | Series R-1, GO, 5.000%, 06/15/24 | | | 11,903 | |
| | 5,845 | | | City of Los Angeles, Series B, GO, 5.000%, 09/01/18 | | | 6,210 | |
| | 415 | | | Contra Costa Community College District, Election of 2014, Series A, GO, 4.000%, 08/01/25 | | | 465 | |
| | 5,000 | | | County of Los Angeles, Community College District, Series C, GO, 5.000%, 06/01/26 | | | 6,151 | |
| | 1,000 | | | County of Sacramento, Center Joint Unified School District, GO, Zero Coupon, 08/01/31 | | | 565 | |
| | | | County of Sacramento, San Juan Unified School District, Election of 2002, | | | | |
| | 525 | | | GO, 5.000%, 08/01/17 | | | 534 | |
| | 395 | | | GO, 5.000%, 08/01/18 | | | 418 | |
| | 860 | | | GO, 5.000%, 08/01/19 | | | 940 | |
| | 775 | | | GO, 5.000%, 08/01/20 | | | 871 | |
| | 1,000 | | | County of Santa Clara, Moreland School District, GO, 5.000%, 08/01/21 | | | 1,156 | |
| | 6,055 | | | County of Santa Clara, San Jose Evergreen Community College District, Series B, GO, 5.000%, 09/01/18 | | | 6,429 | |
| | 845 | | | Folsom Cordova Unified School District, School Facilities Improvement District No. 2, GO, 5.000%, 10/01/17 | | | 866 | |
SEE NOTES TO FINANCIAL STATEMENTS.
| | | | | | |
| | | |
| 26 | | | | J.P. MORGAN MUNICIPAL BOND FUNDS | | FEBRUARY 28, 2017 |
| | | | | | | | |
PRINCIPAL
AMOUNT($) | | | SECURITY DESCRIPTION | | VALUE($) | |
| | Municipal Bonds — continued | |
| | | | General Obligation — continued | |
| | 1,500 | | | Foothill-De Anza Community College District, GO, 5.000%, 08/01/28 | | | 1,785 | |
| | | | Grossmont Healthcare District, | | | | |
| | 1,225 | | | Series D, GO, 5.000%, 07/15/26 | | | 1,458 | |
| | 1,285 | | | Series D, GO, 5.000%, 07/15/27 | | | 1,519 | |
| | 1,000 | | | Grossmont Healthcare District, Election of 2006, Series C, GO, 5.000%, 07/15/26 | | | 1,190 | |
| | 11,535 | | | Los Angeles Unified School District, Series C, GO, 5.000%, 07/01/21 | | | 13,315 | |
| | | | Moulton-Niguel Water District Consolidated, | | | | |
| | 335 | | | GO, 4.000%, 09/01/17 | | | 341 | |
| | 300 | | | GO, 5.000%, 09/01/18 | | | 319 | |
| | | | Novato Unified School District, | | | | |
| | 535 | | | GO, 4.000%, 02/01/22 | | | 598 | |
| | 685 | | | GO, 5.000%, 02/01/23 | | | 810 | |
| | 870 | | | GO, 5.000%, 02/01/24 | | | 1,041 | |
| | 1,500 | | | GO, 5.000%, 08/01/25 | | | 1,789 | |
| | 1,800 | | | GO, 5.000%, 08/01/26 | | | 2,147 | |
| | 1,200 | | | Oak Grove School District, GO, 5.000%, 08/01/23 | | | 1,434 | |
| | 1,770 | | | Placentia-Yorba Linda Unified School District, GO, 5.000%, 08/01/25 | | | 2,151 | |
| | 2,000 | | | Salinas Union High School District, GO, BAN, Zero Coupon, 08/01/20 | | | 1,878 | |
| | 1,400 | | | San Diego Community College District, GO, 5.000%, 08/01/18 | | | 1,483 | |
| | | | San Diego Unified School District, Dedicated Unlimited Ad Valorem Property Tax, | | | | |
| | 3,825 | | | Series R-3, GO, 5.000%, 07/01/17 | | | 3,882 | |
| | 6,310 | | | Series R-3, GO, 5.000%, 07/01/19 | | | 6,891 | |
| | 550 | | | San Diego Unified School District, Election of 2012, Series F, GO, 5.000%, 07/01/29 | | | 648 | |
| | | | San Francisco Bay Area Rapid Transit District, Election of 2004, | | | | |
| | 2,735 | | | Series D, GO, 3.000%, 08/01/22 | | | 2,924 | |
| | 1,500 | | | Series D, GO, 5.000%, 08/01/27 | | | 1,806 | |
| | 1,685 | | | Series D, GO, 5.000%, 08/01/28 | | | 2,015 | |
| | 8,580 | | | San Francisco Unified School District, GO, 5.000%, 06/15/18 | | | 9,046 | |
| | 5,190 | | | San Francisco Unified School District, Proposition A, Election of 2011, Series B, GO, 5.000%, 06/15/24 | | | 6,051 | |
| | | | San Mateo County Community College District, | | | | |
| | 700 | | | GO, 5.000%, 09/01/25 | | | 843 | |
| | 1,095 | | | GO, 5.000%, 09/01/26 | | | 1,312 | |
| | | | State of California, Various Purpose, | | | | |
| | 1,855 | | | GO, 5.000%, 03/01/17 | | | 1,856 | |
| | | | | | | | |
PRINCIPAL
AMOUNT($) | | | SECURITY DESCRIPTION | | VALUE($) | |
| | | | | | | | |
| | | | General Obligation — continued | |
| | 3,560 | | | GO, 5.000%, 11/01/23 | | | 4,229 | |
| | 13,210 | | | GO, 5.000%, 03/01/26 | | | 15,749 | |
| | 2,000 | | | GO, 5.000%, 09/01/27 | | | 2,278 | |
| | 2,500 | | | GO, 5.000%, 09/01/28 | | | 2,837 | |
| | 2,810 | | | Series B, GO, 5.000%, 09/01/23 | | | 3,330 | |
| | | | Walnut Valley, Unified School District, | | | | |
| | 100 | | | GO, 5.000%, 08/01/24 | | | 120 | |
| | 150 | | | GO, 5.000%, 08/01/25 | | | 182 | |
| | 135 | | | GO, 5.000%, 08/01/26 | | | 166 | |
| | 245 | | | GO, 5.000%, 08/01/27 | | | 298 | |
| | 10,495 | | | Whittier Union School District, GO, 5.000%, 08/01/23 | | | 12,540 | |
| | | | | | | | |
| | | | | | | 157,437 | |
| | | | | | | | |
| | | | Hospital — 1.9% | |
| | 1,850 | | | California Health Facilities Financing Authority, Cedars-Sinal Medical Center, Rev., 5.000%, 11/15/25 | | | 2,226 | |
| | | | California Health Facilities Financing Authority, Providence Health & Services, | | | | |
| | 750 | | | Series A, Rev., 5.000%, 10/01/21 | | | 867 | |
| | 1,500 | | | Series A, Rev., 5.000%, 10/01/22 | | | 1,759 | |
| | | | California Health Facilities Financing Authority, St. Joseph Health System, | | | | |
| | 5,000 | | | Series C, Rev., VAR, 5.000%, 10/15/19 | | | 5,465 | |
| | 10,000 | | | Series C, Rev., VAR, 5.000%, 10/18/22 | | | 11,486 | |
| | 12,870 | | | Series D, Rev., VAR, 5.000%, 10/15/20 | | | 14,426 | |
| | | | California Municipal Finance Authority, NorthBay Healthcare Group, | | | | |
| | 700 | | | Series A, Rev., 2.000%, 11/01/17 | | | 702 | |
| | 500 | | | Series A, Rev., 5.000%, 11/01/23 | | | 557 | |
| | 800 | | | Series A, Rev., 5.000%, 11/01/24 | | | 893 | |
| | 745 | | | Series A, Rev., 5.000%, 11/01/25 | | | 831 | |
| | 350 | | | California Statewide Communities Development Authority, Series B, Rev., 5.000%, 08/15/26 | | | 423 | |
| | | | | | | | |
| | | | | | | 39,635 | |
| | | | | | | | |
| | | | Other Revenue — 2.9% | |
| | | | Alameda County Transport Authority, Sales Tax, | | | | |
| | 5,000 | | | Rev., 3.000%, 03/01/17 | | | 5,001 | |
| | 3,095 | | | Rev., 3.000%, 03/01/18 | | | 3,163 | |
| | 5,000 | | | Rev., 4.000%, 03/01/19 | | | 5,304 | |
| | 5,000 | | | Rev., 4.000%, 03/01/22 | | | 5,598 | |
| | 1,240 | | | Rev., 5.000%, 03/01/20 | | | 1,383 | |
SEE NOTES TO FINANCIAL STATEMENTS.
| | | | | | | | |
| | | |
| FEBRUARY 28, 2017 | | J.P. MORGAN MUNICIPAL BOND FUNDS | | | | | 27 | |
JPMorgan Short-Intermediate Municipal Bond Fund
SCHEDULE OF PORTFOLIO INVESTMENTS
AS OF FEBRUARY 28, 2017 (continued)
(Amounts in thousands)
| | | | | | | | |
PRINCIPAL
AMOUNT($) | | | SECURITY DESCRIPTION | | VALUE($) | |
| | Municipal Bonds — continued | |
| | | | Other Revenue — continued | |
| | 3,000 | | | Anaheim Housing & Public Improvements Authority, Electric Utility Distribution Systems Refunding & Improvements, Series A, Rev., 5.000%, 10/01/32 | | | 3,365 | |
| | 1,000 | | | Anaheim Public Financing Authority, Anaheim Convention Center Expansion Project, Series A, Rev., 5.000%, 05/01/17 | | | 1,008 | |
| | 4,500 | | | California State Public Works Board, Department of General Services, Series F, Rev., 5.000%, 05/01/21 | | | 5,151 | |
| | | | Contra Costa County Transportation Authority, Sales Tax, | | | | |
| | 3,420 | | | Series A, Rev., 4.000%, 03/01/23 | | | 3,859 | |
| | 3,830 | | | Series A, Rev., 4.000%, 03/01/25 | | | 4,344 | |
| | 2,420 | | | Series A, Rev., 5.000%, 03/01/23 | | | 2,874 | |
| | 2,000 | | | Series A, Rev., 5.000%, 03/01/24 | | | 2,401 | |
| | 1,250 | | | Series A, Rev., 5.000%, 03/01/25 | | | 1,514 | |
| | 1,000 | | | Series B, Rev., 4.000%, 03/01/18 | | | 1,033 | |
| | 1,600 | | | Series B, Rev., 5.000%, 03/01/18 | | | 1,669 | |
| | 1,750 | | | Series B, Rev., 5.000%, 03/01/19 | | | 1,892 | |
| | 1,000 | | | Golden State Tobacco Securitization Corp., Tobacco Settlement, Series A, Rev., 5.000%, 06/01/21 | | | 1,143 | |
| | | | Riverside Community Properties Development, Inc., Riverside County Law Building Project, | | | | |
| | 640 | | | Rev., 5.000%, 10/15/18 | | | 679 | |
| | 780 | | | Rev., 5.000%, 10/15/19 | | | 853 | |
| | | | San Diego County Regional Transportation Commission, Sales Tax, | | | | |
| | 250 | | | Series A, Rev., 5.000%, 04/01/21 | | | 288 | |
| | 100 | | | Series A, Rev., 5.000%, 04/01/22 | | | 118 | |
| | | | San Francisco Bay Area Rapid Transit District, Sales Tax, | | | | |
| | 525 | | | Series A, Rev., 5.000%, 07/01/24 | | | 635 | |
| | 905 | | | Series A, Rev., 5.000%, 07/01/25 | | | 1,104 | |
| | 1,700 | | | San Francisco State Building Authority & Oakland State Building Authority, Elihu M. Harris State Office Building, Series A, Rev., 5.000%, 12/01/22 | | | 1,979 | |
| | 1,225 | | | Santa Clara County Financing Authority, Capital Projects, Series A, Rev., 5.000%, 02/01/19 | | | 1,319 | |
| | 1,000 | | | Santa Clara Valley Transportation Authority, Sales Tax, Series A, Rev., 5.000%, 04/01/26 | | | 1,199 | |
| | 1,000 | | | Sonoma County Transportation Authority, Sales Tax, Rev., 5.000%, 12/01/24 | | | 1,210 | |
| | | | | | | | |
| | | | | | | 60,086 | |
| | | | | | | | |
| | | | | | | | |
PRINCIPAL
AMOUNT($) | | | SECURITY DESCRIPTION | | VALUE($) | |
| | | | | | | | |
| | | | Prerefunded — 0.1% | |
| | 1,160 | | | California State Public Works Board, California State University, Series E, Rev., 5.000%, 04/01/19 (p) | | | 1,255 | |
| | | | | | | | |
| | | | Transportation — 2.4% | |
| | 7,550 | | | Bay Area Toll Authority, Toll Bridge, San Francisco Bay Area, Series C, Rev., VAR, 1.875%, 04/01/19 | | | 7,637 | |
| | 10,000 | | | City of Long Beach Harbor, Series C, Rev., 5.000%, 11/15/18 | | | 10,701 | |
| | | | City of Los Angeles Department of Airports, | | | | |
| | 1,590 | | | Series A, Rev., AMT, 5.000%, 05/15/21 | | | 1,803 | |
| | 315 | | | Series B, Rev., 4.000%, 05/15/23 | | | 354 | |
| | 365 | | | Series B, Rev., 4.000%, 05/15/24 | | | 412 | |
| | 1,015 | | | Series C, Rev., 4.000%, 05/15/18 | | | 1,054 | |
| | 1,000 | | | Series C, Rev., 5.000%, 05/15/19 | | | 1,086 | |
| | 750 | | | Series C, Rev., 5.000%, 05/15/22 | | | 874 | |
| | 700 | | | Series C, Rev., 5.000%, 05/15/24 | | | 833 | |
| | 3,380 | | | Series D, Rev., AMT, 5.000%, 05/15/22 | | | 3,894 | |
| | 2,700 | | | Series D, Rev., AMT, 5.000%, 05/15/27 | | | 3,153 | |
| | 1,950 | | | Series D, Rev., AMT, 5.000%, 05/15/28 | | | 2,258 | |
| | 2,550 | | | Series D, Rev., AMT, 5.000%, 05/15/29 | | | 2,930 | |
| | 9,665 | | | Los Angeles County Metropolitan Transportation Authority, Series A, Rev., 5.000%, 07/01/19 | | | 10,562 | |
| | 1,000 | | | Los Angeles County Metropolitan Transportation Authority, Union Station Gateway Project, Rev., 5.000%, 07/01/27 | | | 1,197 | |
| | 255 | | | San Bernardino County Transportation Authority, Series A, Rev., 3.000%, 03/01/17 | | | 255 | |
| | | | | | | | |
| | | | | | | 49,003 | |
| | | | | | | | |
| | | | Utility — 0.8% | |
| | | | City of Los Angeles Department of Water & Power, Power System, | | | | |
| | 5,000 | | | Series A, Rev., 4.000%, 07/01/17 | | | 5,059 | |
| | 10,000 | | | Series B, Rev., 5.000%, 12/01/18 | | | 10,727 | |
| | 1,000 | | | Southern California, Public Power Authority Canyon Power Project, Series A, Rev., 5.000%, 07/01/26 | | | 1,148 | |
| | 400 | | | Walnut Energy Center Authority, Series A, Rev., 5.000%, 01/01/23 | | | 472 | |
| | | | | | | | |
| | | | | | | 17,406 | |
| | | | | | | | |
| | | | Water & Sewer — 2.7% | |
| | | | Burlingame Financing Authority Water & Wastewater, | | | | |
| | 250 | | | Rev., 4.000%, 04/01/20 | | | 272 | |
| | 200 | | | Rev., 4.000%, 04/01/21 | | | 222 | |
| | 480 | | | Rev., 5.000%, 04/01/24 | | | 577 | |
| | 545 | | | Rev., 5.000%, 04/01/25 | | | 663 | |
SEE NOTES TO FINANCIAL STATEMENTS.
| | | | | | |
| | | |
| 28 | | | | J.P. MORGAN MUNICIPAL BOND FUNDS | | FEBRUARY 28, 2017 |
| | | | | | | | |
PRINCIPAL
AMOUNT($) | | | SECURITY DESCRIPTION | | VALUE($) | |
| | Municipal Bonds — continued | |
| | | | Water & Sewer — continued | |
| | 130 | | | California State Department of Water Resources, Central Valley Project Water System, Series AI, Rev., 5.000%, 12/01/17 (p) | | | 134 | |
| | 15,000 | | | California State Department of Water Resources, Power Supply, Series L, Rev., 5.000%, 05/01/19 | | | 16,301 | |
| | | | City of Los Angeles Wastewater System Subordinate, | | | | |
| | 1,500 | | | Series A, Rev., 5.000%, 06/01/18 | | | 1,579 | |
| | 1,250 | | | Series A, Rev., 5.000%, 06/01/19 | | | 1,361 | |
| | 2,750 | | | Series A, Rev., 5.000%, 06/01/22 | | | 3,228 | |
| | | | County of San Mateo, Silicon Valley Clean Water, | | | | |
| | 400 | | | Rev., 4.000%, 02/01/19 | | | 423 | |
| | 320 | | | Rev., 5.000%, 02/01/18 | | | 333 | |
| | 400 | | | Rev., 5.000%, 08/01/28 | | | 475 | |
| | 390 | | | Rev., 5.000%, 08/01/29 | | | 460 | |
| | | | East Bay Municipal Utility District, Wastewater System, | | | | |
| | 3,000 | | | Series A, Rev., 5.000%, 06/01/20 | | | 3,367 | |
| | 2,330 | | | Series B, Rev., 5.000%, 06/01/19 | | | 2,538 | |
| | | | Metropolitan Water District of Southern California, | | | | |
| | 4,000 | | | Series A, Rev., 5.000%, 07/01/18 | | | 4,224 | |
| | 8,000 | | | Series A, Rev., 5.000%, 07/01/19 | | | 8,739 | |
| | 5,000 | | | Series C, Rev., 5.000%, 07/01/18 | | | 5,279 | |
| | 6,105 | | | Series C-1, Rev., VAR, 3.000%, 10/01/19 | | | 6,364 | |
| | | | | | | | |
| | | | | | | 56,539 | |
| | | | | | | | |
| | | | Total California | | | 414,323 | |
| | | | | | | | |
| | | | Colorado — 1.0% | |
| | | | Certificate of Participation/Lease — 0.4% | |
| | | | City of Longmont, | | | | |
| | 100 | | | Series A, COP, 5.000%, 12/01/21 | | | 114 | |
| | 100 | | | Series A, COP, 5.000%, 12/01/22 | | | 116 | |
| | 100 | | | Series A, COP, 5.000%, 12/01/24 | | | 116 | |
| | 340 | | | City of Westminster, COP, 5.000%, 12/01/25 | | | 405 | |
| | | | County of Boulder, Flood Reconstruction Projects, | | | | |
| | 720 | | | COP, 5.000%, 12/01/22 | | | 809 | |
| | 500 | | | COP, 5.000%, 12/01/23 | | | 561 | |
| | 500 | | | COP, 5.000%, 12/01/25 | | | 560 | |
| | | | County of Eagle, | | | | |
| | 500 | | | COP, 3.000%, 12/01/18 | | | 517 | |
| | 200 | | | COP, 5.000%, 12/01/22 | | | 232 | |
| | | | | | | | |
PRINCIPAL
AMOUNT($) | | | SECURITY DESCRIPTION | | VALUE($) | |
| | | | | | | | |
| | | | Certificate of Participation/Lease — continued | |
| | | | Regional Transportation District, | | | | |
| | 2,000 | | | Series A, COP, 5.000%, 06/01/23 | | | 2,217 | |
| | 1,700 | | | Series A, COP, 5.000%, 06/01/25 | | | 1,869 | |
| | | | | | | | |
| | | | | | | 7,516 | |
| | | | | | | | |
| | | | Education — 0.3% | |
| | 650 | | | Board of Governors of the University of Colorado, Enterprise System, Series B, Rev., 5.000%, 03/01/29 | | | 763 | |
| | | | University of Colorado, University Enterprise, | | | | |
| | 3,150 | | | Series A, Rev., 5.000%, 06/01/22 | | | 3,680 | |
| | 2,300 | | | Series B-1, Rev., 5.000%, 06/01/23 | | | 2,724 | |
| | | | | | | | |
| | | | | | | 7,167 | |
| | | | | | | | |
| | | | General Obligation — 0.1% | |
| | | | Counties of Gunnison, Watershed School District No. 1, | | | | |
| | 300 | | | GO, 4.000%, 12/01/22 | | | 337 | |
| | 500 | | | GO, 5.000%, 12/01/26 | | | 590 | |
| | 1,000 | | | Routt County, Colorado School District Re-2 Steamboat Springs Refunding, Series A, GO, 4.000%, 12/01/18 | | | 1,052 | |
| | | | | | | | |
| | | | | | | 1,979 | |
| | | | | | | | |
| | | | Hospital — 0.1% | |
| | 2,620 | | | University of Colorado Hospital Authority, Series C-1, Rev., VAR, 4.000%, 03/01/20 | | | 2,786 | |
| | | | | | | | |
| | | | Other Revenue — 0.0% (g) | |
| | | | Denver Convention Center Hotel Authority, | | | | |
| | 375 | | | Rev., 4.000%, 12/01/19 | | | 396 | |
| | 500 | | | Rev., 4.000%, 12/01/20 | | | 533 | |
| | | | | | | | |
| | | | | | | 929 | |
| | | | | | | | |
| | | | Water & Sewer — 0.1% | |
| | 1,000 | | | Board of Water Works of Pueblo, Water, Rev., 2.000%, 11/01/18 | | | 1,016 | |
| | | | | | | | |
| | | | Total Colorado | | | 21,393 | |
| | | | | | | | |
| | | | Connecticut — 1.4% | |
| | | | General Obligation — 0.3% | |
| | 6,500 | | | State of Connecticut, Series B, GO, 5.000%, 05/15/21 | | | 7,345 | |
| | | | | | | | |
| | | | Special Tax — 1.1% | |
| | | | State of Connecticut, Transportation Infrastructure, Special Tax, | | | | |
| | 4,265 | | | Series A, Rev., 5.000%, 12/01/17 | | | 4,402 | |
| | 10,000 | | | Series A, Rev., 5.000%, 09/01/28 | | | 11,620 | |
| | 5,750 | | | Series B, Rev., 5.000%, 12/01/17 | | | 5,934 | |
| | | | | | | | |
| | | | | | | 21,956 | |
| | | | | | | | |
| | | | Total Connecticut | | | 29,301 | |
| | | | | | | | |
SEE NOTES TO FINANCIAL STATEMENTS.
| | | | | | | | |
| | | |
| FEBRUARY 28, 2017 | | J.P. MORGAN MUNICIPAL BOND FUNDS | | | | | 29 | |
JPMorgan Short-Intermediate Municipal Bond Fund
SCHEDULE OF PORTFOLIO INVESTMENTS
AS OF FEBRUARY 28, 2017 (continued)
(Amounts in thousands)
| | | | | | | | |
PRINCIPAL
AMOUNT($) | | | SECURITY DESCRIPTION | | VALUE($) | |
| | Municipal Bonds — continued | |
| | | | Delaware — 0.0% (g) | |
| | | | General Obligation — 0.0% (g) | |
| | 120 | | | State of Delaware, GO, 5.000%, 07/01/19 | | | 131 | |
| | | | | | | | |
| | | | District of Columbia — 0.6% | |
| | | | Hospital — 0.5% | |
| | | | District of Columbia Children’s Hospital, | | | | |
| | 1,100 | | | Rev., 5.000%, 07/15/20 | | | 1,228 | |
| | 500 | | | Rev., 5.000%, 07/15/21 | | | 571 | |
| | 850 | | | Rev., 5.000%, 07/15/22 | | | 987 | |
| | 2,725 | | | Rev., 5.000%, 07/15/23 | | | 3,202 | |
| | 1,100 | | | Rev., 5.000%, 07/15/25 | | | 1,308 | |
| | 1,000 | | | Rev., 5.000%, 07/15/26 | | | 1,190 | |
| | 2,500 | | | Rev., 5.000%, 07/15/29 | | | 2,892 | |
| | | | | | | | |
| | | | | | | 11,378 | |
| | | | | | | | |
| | | | Transportation — 0.1% | |
| | 1,475 | | | Metropolitan Washington Airports Authority, Airport System, Series C, Rev., 5.000%, 10/01/21 | | | 1,699 | |
| | | | | | | | |
| | | | Total District of Columbia | | | 13,077 | |
| | | | | | | | |
| | | | Florida — 1.2% | |
| | | | Certificate of Participation/Lease — 0.5% | |
| | | | School Board of Duval County, | | | | |
| | 1,035 | | | Series B, COP, 5.000%, 07/01/19 | | | 1,125 | |
| | 750 | | | Series B, COP, 5.000%, 07/01/21 | | | 856 | |
| | | | Seminole County School Board, | | | | |
| | 295 | | | Series A, COP, 4.000%, 07/01/18 | | | 307 | |
| | 200 | | | Series A, COP, 5.000%, 07/01/19 | | | 217 | |
| | 210 | | | Series A, COP, 5.000%, 07/01/20 | | | 235 | |
| | | | St. Johns County School Board, Master Lease Program, | | | | |
| | 1,500 | | | COP, 5.000%, 07/01/19 | | | 1,634 | |
| | 2,000 | | | COP, 5.000%, 07/01/20 | | | 2,239 | |
| | 1,750 | | | COP, 5.000%, 07/01/21 | | | 2,003 | |
| | 750 | | | St. Lucie County School Board, Master Lease Program, Series A, COP, 5.000%, 07/01/19 | | | 813 | |
| | | | | | | | |
| | | | | | | 9,429 | |
| | | | | | | | |
| | | | Education — 0.1% | |
| | 1,660 | | | Board of Governors of the University of Florida, Student Activity, Rev., 5.000%, 07/01/20 | | | 1,860 | |
| | | | | | | | |
| | | | General Obligation — 0.1% | |
| | 450 | | | City of Port St. Lucie, GO, 4.000%, 07/01/17 | | | 455 | |
| | 1,000 | | | Reedy Creek Improvement District, Series B, GO, 4.000%, 06/01/19 | | | 1,061 | |
| | | | | | | | |
| | | | | | | 1,516 | |
| | | | | | | | |
| | | | | | | | |
PRINCIPAL
AMOUNT($) | | | SECURITY DESCRIPTION | | VALUE($) | |
| | | | | | | | |
| | | | Hospital — 0.0% (g) | |
| | 150 | | | Miami Beach Health Facilities Authority, Mt Sinai Medical Centre, Rev., 4.000%, 11/15/17 | | | 153 | |
| | | | | | | | |
| | | | Other Revenue — 0.2% | |
| | 1,000 | | | Lee County, Rev., 5.000%, 10/01/17 | | | 1,025 | |
| | | | St. Johns County School Sales Tax, | | | | |
| | 1,000 | | | Rev., 5.000%, 10/01/19 | | | 1,097 | |
| | 1,000 | | | Rev., 5.000%, 10/01/25 | | | 1,197 | |
| | | | The School Board of Escambia County, Sales Tax, | | | | |
| | 275 | | | Rev., 5.000%, 09/01/24 | | | 326 | |
| | 120 | | | Rev., 5.000%, 09/01/25 | | | 143 | |
| | | | | | | | |
| | | | | | | 3,788 | |
| | | | | | | | |
| | | | Prerefunded — 0.2% | |
| | 230 | | | Florida State Municipal Power Agency, Series A, Rev., 5.000%, 10/01/18 (p) | | | 245 | |
| | 4,500 | | | Hillsborough County Industrial Development Authority, Health Facilities Projects, University Community Hospital, Series A, Rev., 5.625%, 08/15/18 (p) | | | 4,808 | |
| | | | | | | | |
| | | | | | | 5,053 | |
| | | | | | | | |
| | | | Transportation — 0.1% | |
| | 550 | | | City of Jacksonville, Series B, Rev., 5.000%, 10/01/17 | | | 564 | |
| | | | Miami-Dade County Expressway Authority, Toll System, | | | | |
| | 1,550 | | | Series A, Rev., 5.000%, 07/01/20 | | | 1,727 | |
| | 625 | | | Series A, Rev., 5.000%, 07/01/22 | | | 720 | |
| | | | | | | | |
| | | | | | | 3,011 | |
| | | | | | | | |
| | | | Total Florida | | | 24,810 | |
| | | | | | | | |
| | | | Georgia — 3.0% | |
| | | | General Obligation — 2.1% | |
| | 1,065 | | | Bryan County, School District, Sales Tax, GO, 4.000%, 08/01/17 | | | 1,080 | |
| | 1,000 | | | City of Atlanta, Series A, GO, 4.000%, 12/01/19 | | | 1,077 | |
| | 1,400 | | | County of Sumter, Sales Tax, GO, 4.000%, 12/01/18 | | | 1,473 | |
| | | | State of Georgia, | | | | |
| | 6,750 | | | Series E, GO, 5.000%, 12/01/25 | | | 8,277 | |
| | 14,800 | | | Series I, GO, 5.000%, 07/01/18 | | | 15,626 | |
| | 1,250 | | | Series I, GO, 5.000%, 07/01/19 | | | 1,365 | |
| | 8,165 | | | Series I, GO, 5.000%, 07/01/21 | | | 9,421 | |
| | 4,270 | | | Series J-2, GO, 4.000%, 11/01/17 | | | 4,366 | |
| | | | | | | | |
| | | | | | | 42,685 | |
| | | | | | | | |
SEE NOTES TO FINANCIAL STATEMENTS.
| | | | | | |
| | | |
| 30 | | | | J.P. MORGAN MUNICIPAL BOND FUNDS | | FEBRUARY 28, 2017 |
| | | | | | | | |
PRINCIPAL
AMOUNT($) | | | SECURITY DESCRIPTION | | VALUE($) | |
| | Municipal Bonds — continued | |
| | | | Hospital — 0.2% | |
| | 5,550 | | | Richmond County Hospital Authority, University Health Services, Inc. Project, Rev., RAN, 3.000%, 01/01/32 | | | 5,055 | |
| | | | | | | | |
| | | | Housing — 0.1% | |
| | | | Georgia Housing & Finance Authority, Single Family, | | | | |
| | 750 | | | Series A-4, Rev., 0.800%, 06/01/17 | | | 750 | |
| | 700 | | | Series A-4, Rev., 0.900%, 12/01/17 | | | 701 | |
| | | | | | | | |
| | | | | | | 1,451 | |
| | | | | | | | |
| | | | Industrial Development Revenue/Pollution Control Revenue — 0.2% | |
| | 4,000 | | | Monroe County Development Authority, Pollution Control, Gulf Power Company Plant, Scherer Project, Rev., VAR, 2.000%, 06/21/18 | | | 4,039 | |
| | | | | | | | |
| | | | Other Revenue — 0.4% | |
| | | | Atlanta Development Authority, New Downtown Atlanta Stadium Project, Senior Lien, | | | | |
| | 1,000 | | | Series A-1, Rev., 5.000%, 07/01/27 | | | 1,171 | |
| | 1,000 | | | Series A-1, Rev., 5.000%, 07/01/28 | | | 1,159 | |
| | 750 | | | Series A-1, Rev., 5.000%, 07/01/29 | | | 863 | |
| | 5,000 | | | Fulton County Development Authority, Technology Athletic Association Project, Series A, Rev., 5.000%, 10/01/22 | | | 5,767 | |
| | | | | | | | |
| | | | | | | 8,960 | |
| | | | | | | | |
| | | | Total Georgia | | | 62,190 | |
| | | | | | | | |
| | | | Guam — 0.0% (g) | |
| | | | Other Revenue — 0.0% (g) | |
| | 750 | | | Government of Guam, Limited Obligation Section 30, Series A, Rev., 5.000%, 12/01/18 | | | 792 | |
| | | | | | | | |
| | | | Hawaii — 1.2% | |
| | | | General Obligation — 1.2% | |
| | | | City & County of Honolulu, | | | | |
| | 1,500 | | | Series A, GO, 5.000%, 10/01/18 | | | 1,597 | |
| | 3,700 | | | Series B, GO, 5.000%, 10/01/18 | | | 3,939 | |
| | | | State of Hawaii, | | | | |
| | 10,160 | | | Series DY, GO, 5.000%, 02/01/20 | | | 11,278 | |
| | 7,640 | | | Series EF, GO, 5.000%, 11/01/21 | | | 8,860 | |
| | | | | | | | |
| | | | Total Hawaii | | | 25,674 | |
| | | | | | | | |
| | | | Idaho — 0.0% (g) | |
| | | | Education — 0.0% (g) | |
| | 565 | | | University of Idaho, Series A, Rev., 5.000%, 04/01/22 | | | 655 | |
| | | | | | | | |
| | | | | | | | |
PRINCIPAL
AMOUNT($) | | | SECURITY DESCRIPTION | | VALUE($) | |
| | | | | | | | |
| | | | Illinois — 3.1% | |
| | | | Education — 0.4% | |
| | 5,000 | | | Illinois Educational Facilities Authority, University of Chicago, Series B-2, Rev., VAR, 1.550%, 02/13/20 | | | 5,028 | |
| | | | Illinois Finance Authority, Depaul University, | | | | |
| | 200 | | | Rev., 5.000%, 10/01/23 | | | 233 | |
| | 340 | | | Rev., 5.000%, 10/01/24 | | | 399 | |
| | 300 | | | Rev., 5.000%, 10/01/25 | | | 354 | |
| | 500 | | | Rev., 5.000%, 10/01/26 | | | 593 | |
| | 500 | | | Rev., 5.000%, 10/01/27 | | | 586 | |
| | 250 | | | Rev., 5.000%, 10/01/28 | | | 290 | |
| | | | | | | | |
| | | | | | | 7,483 | |
| | | | | | | | |
| | | | General Obligation — 1.1% | |
| | 5,000 | | | City of Chicago, Series C, GO, 5.000%, 01/01/22 | | | 5,079 | |
| | 4,740 | | | City of Peoria, Tazewell County, Community College District No. 514, Series A, GO, 5.000%, 12/01/19 | | | 5,217 | |
| | 5 | | | Cook County Township High School District No. 225, Series A, GO, 5.000%, 12/01/23 | | | 6 | |
| | | | County of Dupage, Courthouse Project, | | | | |
| | 335 | | | GO, 5.000%, 01/01/24 | | | 395 | |
| | 525 | | | GO, 5.000%, 01/01/27 | | | 620 | |
| | 250 | | | GO, 5.000%, 01/01/28 | | | 294 | |
| | | | County of Winnebago, Public Safety, | | | | |
| | 3,065 | | | Series A, GO, 4.000%, 12/30/19 | | | 3,268 | |
| | 395 | | | Series A, GO, 4.000%, 12/30/19 (p) | | | 426 | |
| | 2,800 | | | DuPage County Forest Preserve District, GO, 5.000%, 01/01/21 | | | 3,173 | |
| | | | Lincoln Land Community College District No. 526, | | | | |
| | 440 | | | GO, 4.000%, 12/15/22 | | | 472 | |
| | 305 | | | GO, 5.000%, 12/15/21 | | | 346 | |
| | 300 | | | McHenry County, Woodstock Community Unit School District No. 200, GO, 5.000%, 01/15/21 | | | 339 | |
| | 2,500 | | | State of Illinois, GO, 4.000%, 02/01/18 | | | 2,547 | |
| | | | | | | | |
| | | | | | | 22,182 | |
| | | | | | | | |
| | | | Hospital — 0.7% | |
| | 6,000 | | | Illinois Finance Authority, Advocate Health Care, Series A-1, Rev., VAR, 5.000%, 01/15/20 | | | 6,601 | |
| | 2,500 | | | Illinois Finance Authority, Edward-Elmhurst Healthcare, Series A, Rev., 5.000%, 01/01/30 | | | 2,764 | |
| | 2,000 | | | Illinois Finance Authority, Northwest Community Hospital, Series A, Rev., 5.000%, 07/01/31 | | | 2,256 | |
SEE NOTES TO FINANCIAL STATEMENTS.
| | | | | | | | |
| | | |
| FEBRUARY 28, 2017 | | J.P. MORGAN MUNICIPAL BOND FUNDS | | | | | 31 | |
JPMorgan Short-Intermediate Municipal Bond Fund
SCHEDULE OF PORTFOLIO INVESTMENTS
AS OF FEBRUARY 28, 2017 (continued)
(Amounts in thousands)
| | | | | | | | |
PRINCIPAL
AMOUNT($) | | | SECURITY DESCRIPTION | | VALUE($) | |
| | Municipal Bonds — continued | |
| | | | Hospital — continued | |
| | | | Illinois Finance Authority, Silver Cross Hospital & Medical Centers, | | | | |
| | 150 | | | Series C, Rev., 5.000%, 08/15/21 | | | 167 | |
| | 500 | | | Series C, Rev., 5.000%, 08/15/22 | | | 563 | |
| | 2,000 | | | Southwestern Illinois Development Authority, Hospital Sisters Services, Inc. Obligated Group, Series A, Rev., 5.000%, 02/15/27 | | | 2,328 | |
| | | | | | | | |
| | | | | | | 14,679 | |
| | | | | | | | |
| | | | Transportation — 0.5% | |
| | | | City of Chicago, Chicago Midway Airport Second Lien Revenue Refunding, | | | | |
| | 1,460 | | | Series A, Rev., AMT, 5.000%, 01/01/20 | | | 1,592 | |
| | 2,580 | | | Series A, Rev., AMT, 5.000%, 01/01/21 | | | 2,875 | |
| | 500 | | | Series B, Rev., 5.000%, 01/01/20 | | | 550 | |
| | 5,000 | | | Illinois State Toll Highway Authority, Senior Priority, Series B, Rev., 5.000%, 12/01/17 | | | 5,159 | |
| | | | | | | | |
| | | | | | | 10,176 | |
| | | | | | | | |
| | | | Utility — 0.4% | |
| | 4,000 | | | City of Springfield, Senior Lien Electric, Rev., 5.000%, 03/01/26 | | | 4,610 | |
| | 4,500 | | | Illinois Municipal Electric Agency, Power Supply System, Series A, Rev., 5.000%, 02/01/19 | | | 4,817 | |
| | | | | | | | |
| | | | | | | 9,427 | |
| | | | | | | | |
| | | | Total Illinois | | | 63,947 | |
| | | | | | | | |
| | | | Indiana — 0.9% | |
| | | | Education — 0.2% | |
| | | | County of Elkhart, GCS School Building Corp. One, First Mortgage Refunding & Improvement, | | | | |
| | 300 | | | Rev., 4.000%, 07/15/17 | | | 304 | |
| | 265 | | | Rev., 5.000%, 07/15/18 | | | 279 | |
| | 1,170 | | | Indiana Finance Authority, Educational Facilities, Indianapolis Museum of Art, Inc. Project, Series B, Rev., 5.000%, 02/01/19 | | | 1,248 | |
| | | | New Albany Floyd County School Building Corp., | | | | |
| | 700 | | | Rev., 5.000%, 07/15/21 | | | 800 | |
| | 835 | | | Rev., 5.000%, 07/15/22 | | | 964 | |
| | | | | | | | |
| | | | | | | 3,595 | |
| | | | | | | | |
| | | | Other Revenue — 0.5% | |
| | 1,000 | | | Fort Wayne Redevelopment Authority Lease Rental, Harrison Square Project, Rev., 5.000%, 08/01/23 | | | 1,167 | |
| | | | Indiana State Finance Authority State Revolving Fund Program Refunding, | | | | |
| | 3,080 | | | Series B, Rev., 5.000%, 02/01/18 | | | 3,201 | |
| | 5,500 | | | Series B, Rev., 5.000%, 02/01/19 | | | 5,925 | |
| | | | | | | | |
PRINCIPAL
AMOUNT($) | | | SECURITY DESCRIPTION | | VALUE($) | |
| | | | | | | | |
| | | | Other Revenue — continued | |
| | 750 | | | Indiana State Office Building Commission, Indiana State Museum Facility, Series C, Rev., NATL-RE, 5.250%, 07/01/19 (p) | | | 823 | |
| | | | | | | | |
| | | | | | | 11,116 | |
| | | | | | | | |
| | | | Transportation — 0.1% | |
| | 1,700 | | | The Indianapolis Local Public Improvement Bond Bank, Airport Authority project, Series A, Rev., AMT, 5.000%, 01/01/19 | | | 1,810 | |
| | | | | | | | |
| | | | Utility — 0.1% | |
| | | | Indiana Municipal Power Agency, Power Supply System, | | | | |
| | 1,000 | | | Series A, Rev., 5.000%, 01/01/18 | | | 1,035 | |
| | 1,250 | | | Series A, Rev., 5.000%, 01/01/19 | | | 1,338 | �� |
| | | | | | | | |
| | | | | | | 2,373 | |
| | | | | | | | |
| | | | Water & Sewer — 0.0% (g) | |
| | 620 | | | Evansville Local Public Improvement Bond Bank, Sewage Works Project, Series A, Rev., 5.000%, 07/01/19 | | | 672 | |
| | | | | | | | |
| | | | Total Indiana | | | 19,566 | |
| | | | | | | | |
| | | | Kansas — 0.4% | |
| | | | General Obligation — 0.0% (g) | |
| | 200 | | | Butler County, Unified School District No. 375, GO, 4.000%, 09/01/24 | | | 217 | |
| | | | | | | | |
| | | | Prerefunded — 0.1% | |
| | 1,795 | | | Kansas Development Finance Authority, Public Water Supply, Series DW-1, Rev., 3.250%, 04/01/17 (p) | | | 1,799 | |
| | | | | | | | |
| | | | Transportation — 0.2% | |
| | 3,400 | | | Kansas State Department Transportation Highway, Series C, Rev., 5.000%, 09/01/17 | | | 3,475 | |
| | | | | | | | |
| | | | Water & Sewer — 0.1% | |
| | 2,200 | | | City of Wichita, Water & Sewer Utility, Series A, Rev., 5.000%, 10/01/22 | | | 2,576 | |
| | | | | | | | |
| | | | Total Kansas | | | 8,067 | |
| | | | | | | | |
| | | | Kentucky — 1.2% | |
| | | | Education — 0.4% | |
| | 6,980 | | | University of Kentucky, Series D, Rev., 5.000%, 10/01/21 | | | 8,082 | |
| | | | | | | | |
| | | | Industrial Development Revenue/Pollution Control Revenue — 0.5% | |
| | 3,000 | | | County of Carroll, Pollution Control, Kentucky Utilities Company Project, Series A, Rev., VAR, 1.050%, 09/01/19 | | | 2,963 | |
SEE NOTES TO FINANCIAL STATEMENTS.
| | | | | | |
| | | |
| 32 | | | | J.P. MORGAN MUNICIPAL BOND FUNDS | | FEBRUARY 28, 2017 |
| | | | | | | | |
PRINCIPAL
AMOUNT($) | | | SECURITY DESCRIPTION | | VALUE($) | |
| | Municipal Bonds — continued | |
| | | | Industrial Development Revenue/Pollution Control Revenue — continued | |
| | 7,000 | | | Louisville/Jefferson County Metro Government, Pollution Control, Louisville Gas & Electric Co. Project, Series A, Rev., VAR, 1.650%, 04/03/17 | | | 7,005 | |
| | | | | | | | |
| | | | | | | 9,968 | |
| | | | | | | | |
| | | | Prerefunded — 0.1% | |
| | 2,500 | | | Louisville/Jefferson County Metro Government, Health Facilities, Jewish Hospital & St. Mary’s HealthCare, Inc. Project, Rev., 6.125%, 02/01/18 (p) | | | 2,623 | |
| | | | | | | | |
| | | | Transportation — 0.2% | |
| | 1,750 | | | Kentucky Asset/Liability Commission, Project Notes, Federal Highway Trust Fund, Series A, Rev., 5.000%, 09/01/25 | | | 2,068 | |
| | | | Louisville Regional Airport Authority, Airport System, | | | | |
| | 1,500 | | | Series A, Rev., AMT, 3.000%, 07/01/17 | | | 1,511 | |
| | 345 | | | Series B, Rev., 4.000%, 07/01/18 | | | 359 | |
| | | | | | | | |
| | | | | | | 3,938 | |
| | | | | | | | |
| | | | Total Kentucky | | | 24,611 | |
| | | | | | | | |
| | | | Louisiana — 0.6% | |
| | | | General Obligation — 0.4% | |
| | 1,445 | | | City of New Orleans, GO, 3.000%, 12/01/32 | | | 1,303 | |
| | | | State of Louisiana, | | | | |
| | 360 | | | Series A, GO, 5.000%, 08/01/19 (p) | | | 394 | |
| | 7,000 | | | Series B, GO, 5.000%, 11/15/18 | | | 7,474 | |
| | | | | | | | |
| | | | | | | 9,171 | |
| | | | | | | | |
| | | | Hospital — 0.0% (g) | |
| | | | Louisiana Public Facilities Authority, Ochsner Clinic Foundation Project, | | | | |
| | 160 | | | Rev., 3.000%, 05/15/17 | | | 161 | |
| | 300 | | | Rev., 3.000%, 05/15/18 | | | 306 | |
| | | | | | | | |
| | | | | | | 467 | |
| | | | | | | | |
| | | | Other Revenue — 0.1% | |
| | 2,250 | | | Tobacco Settlement Financing Corp., Asset-Backed, Series A, Rev., 5.000%, 05/15/17 | | | 2,268 | |
| | | | | | | | |
| | | | Water & Sewer — 0.1% | |
| | 1,100 | | | City of New Orleans, Rev., 5.000%, 12/01/18 | | | 1,170 | |
| | | | | | | | |
| | | | Total Louisiana | | | 13,076 | |
| | | | | | | | |
| | | | Maine — 0.6% | |
| | | | General Obligation — 0.6% | |
| | 750 | | | City of Westbrook, GO, 5.000%, 10/15/24 | | | 897 | |
| | | | | | | | |
PRINCIPAL
AMOUNT($) | | | SECURITY DESCRIPTION | | VALUE($) | |
| | | | | | | | |
| | | | General Obligation — continued | |
| | | | State of Maine, | | | | |
| | 4,740 | | | Series B, GO, 4.000%, 06/01/17 | | | 4,782 | |
| | 6,000 | | | Series B, GO, 5.000%, 06/01/18 | | | 6,319 | |
| | | | | | | | |
| | | | Total Maine | | | 11,998 | |
| | | | | | | | |
| | | | Maryland — 2.4% | |
| | | | Education — 0.4% | |
| | 750 | | | State of Maryland, Health & Higher Educational Facilities Authority, Peninsula Regional Medical Center, Rev., 5.000%, 07/01/22 | | | 870 | |
| | 5,540 | | | University of Maryland, Auxiliary Facilities & Tuition System, Series A, Rev., 5.000%, 04/01/20 | | | 6,182 | |
| | | | | | | | |
| | | | | | | 7,052 | |
| | | | | | | | |
| | | | General Obligation — 1.7% | |
| | 2,000 | | | County of Montgomery, Public Improvement, Series A, GO, 5.000%, 08/01/19 | | | 2,190 | |
| | | | State of Maryland, State & Local Facilities Loan, | | | | |
| | 12,795 | | | Series A, GO, 5.000%, 08/01/20 | | | 14,429 | |
| | 17,780 | | | Series B, GO, 5.000%, 03/15/18 | | | 18,563 | |
| | | | | | | | |
| | | | | | | 35,182 | |
| | | | | | | | |
| | | | Prerefunded — 0.2% | |
| | 4,335 | | | State of Maryland, State & Local Facilities Loan, Series C, GO, 5.000%, 03/01/19 (p) | | | 4,679 | |
| | | | | | | | |
| | | | Transportation — 0.1% | |
| | 2,070 | | | Maryland State Transportation Authority, Rev., GRAN, 5.000%, 03/01/17 | | | 2,071 | |
| | | | | | | | |
| | | | Total Maryland | | | 48,984 | |
| | | | | | | | |
| | | | Massachusetts — 2.8% | |
| | | | Education — 0.0% (g) | |
| | 1,000 | | | Massachusetts Development Finance Agency, Boston College, Series S, Rev., 5.000%, 07/01/17 | | | 1,015 | |
| | | | | | | | |
| | | | General Obligation — 1.0% | |
| | | | City of Boston, | | | | |
| | 6,820 | | | Series A, GO, 5.000%, 03/01/22 | | | 7,960 | |
| | 7,360 | | | Series A, GO, 5.000%, 03/01/23 | | | 8,730 | |
| | 4,310 | | | Massachusetts State Consolidate Loan of 2014, Series 2, GO, 4.000%, 04/01/18 | | | 4,461 | |
| | | | | | | | |
| | | | | | | 21,151 | |
| | | | | | | | |
| | | | Hospital — 0.1% | |
| | 450 | | | Massachusetts Development Finance Agency, Umass Memorial Health Care Obligated Group, Series I, Rev., 5.000%, 07/01/18 | | | 471 | |
SEE NOTES TO FINANCIAL STATEMENTS.
| | | | | | | | |
| | | |
| FEBRUARY 28, 2017 | | J.P. MORGAN MUNICIPAL BOND FUNDS | | | | | 33 | |
JPMorgan Short-Intermediate Municipal Bond Fund
SCHEDULE OF PORTFOLIO INVESTMENTS
AS OF FEBRUARY 28, 2017 (continued)
(Amounts in thousands)
| | | | | | | | |
PRINCIPAL
AMOUNT($) | | | SECURITY DESCRIPTION | | VALUE($) | |
| | Municipal Bonds — continued | |
| | | | Hospital — continued | |
| | 500 | | | Massachusetts State Development Finance Agency, Lahey Health System, Series F, Rev., 5.000%, 08/15/26 | | | 554 | |
| | | | | | | | |
| | | | | | | 1,025 | |
| | | | | | | | |
| | | | Other Revenue — 0.9% | |
| | 3,250 | | | Massachusetts Development Finance Agency, Caregroup, Series H-1, Rev., 5.000%, 07/01/19 | | | 3,517 | |
| | 13,385 | | | Massachusetts Development Finance Agency, Harvard University, Series A, Rev., 4.000%, 07/15/29 | | | 14,921 | |
| | | | | | | | |
| | | | | | | 18,438 | |
| | | | | | | | |
| | | | Prerefunded — 0.4% | |
| | 7,515 | | | Massachusetts Health & Educational Facilities Authority, Institute of Technology, Series O, Rev., 6.000%, 07/01/18 (p) | | | 8,032 | |
| | | | | | | | |
| | | | Transportation — 0.0% (g) | |
| | 100 | | | Commonwealth of Massachusetts, Rail Enhancement Program, Series A, Rev., 5.000%, 06/01/20 | | | 112 | |
| | 750 | | | Massachusetts Port Authority, Series C, Rev., 5.000%, 07/01/23 | | | 889 | |
| | | | | | | | |
| | | | | | | 1,001 | |
| | | | | | | | |
| | | | Water & Sewer — 0.4% | |
| | 6,775 | | | Massachusetts Water Pollution Abatement Trust, Rev., 5.000%, 08/01/25 | | | 8,257 | |
| | | | | | | | |
| | | | Total Massachusetts | | | 58,919 | |
| | | | | | | | |
| | | | Michigan — 1.0% | |
| | | | General Obligation — 0.2% | |
| | 1,000 | | | Kalamazoo Public Schools, GO, 5.000%, 05/01/22 | | | 1,158 | |
| | | | Troy School District, School Building & Site, | | | | |
| | 875 | | | GO, Q-SBLF, 4.000%, 05/01/18 | | | 906 | |
| | 650 | | | GO, Q-SBLF, 5.000%, 05/01/19 | | | 703 | |
| | 500 | | | GO, Q-SBLF, 5.000%, 05/01/20 | | | 556 | |
| | 550 | | | GO, Q-SBLF, 5.000%, 05/01/21 | | | 626 | |
| | 500 | | | GO, Q-SBLF, 5.000%, 05/01/22 | | | 577 | |
| | | | | | | | |
| | | | | | | 4,526 | |
| | | | | | | | |
| | | | Hospital — 0.1% | |
| | 2,250 | | | Michigan State Hospital Finance Authority, Ascension Health Credit Group, Series B-4, Rev., 5.000%, 11/15/27 | | | 2,627 | |
| | | | | | | | |
| | | | | | | | |
PRINCIPAL
AMOUNT($) | | | SECURITY DESCRIPTION | | VALUE($) | |
| | | | | | | | |
| | | | Industrial Development Revenue/Pollution Control Revenue — 0.1% | |
| | 2,600 | | | Michigan Strategic Fund, The Detroit Edison Company Pollution Control Bonds Project, Series CC, Rev., VAR, 1.450%, 09/01/21 | | | 2,538 | |
| | | | | | | | |
| | | | Other Revenue — 0.2% | |
| | 2,250 | | | Michigan Finance Authority, Clean Water Revolving Fund, Rev., 5.000%, 10/01/21 | | | 2,606 | |
| | | | Michigan Finance Authority, Local Government Loan Program, | | | | |
| | 1,290 | | | Series B, Rev., 4.000%, 11/01/18 | | | 1,350 | |
| | 675 | | | Series B, Rev., 4.000%, 11/01/19 | | | 721 | |
| | 455 | | | Series B, Rev., 4.000%, 11/01/20 | | | 492 | |
| | | | | | | | |
| | | | | | | 5,169 | |
| | | | | | | | |
| | | | Prerefunded — 0.3% | |
| | 5,055 | | | Michigan Municipal Bond Authority, Clean Water Revolving Fund, Rev., 5.000%, 10/01/17 (p) | | | 5,182 | |
| | | | | | | | |
| | | | Water & Sewer — 0.1% | |
| | 350 | | | City of Grand Rapids, Sanitary Sewer System Improvement, Rev., 5.000%, 01/01/22 | | | 405 | |
| | | | City of Wyoming, Water Supply System, | | | | |
| | 175 | | | Rev., 5.000%, 06/01/24 | | | 204 | |
| | 610 | | | Rev., 5.000%, 06/01/27 | | | 711 | |
| | | | | | | | |
| | | | | | | 1,320 | |
| | | | | | | | |
| | | | Total Michigan | | | 21,362 | |
| | | | | | | | |
| | | | Minnesota — 1.1% | |
| | | | Education — 0.3% | |
| | | | Minnesota Higher Education Facilities Authority, | | | | |
| | 350 | | | Series L, Rev., 4.000%, 04/01/20 | | | 378 | |
| | 400 | | | Series L, Rev., 5.000%, 04/01/23 | | | 464 | |
| | 4,500 | | | University of Minnesota, Series A, Rev., 5.750%, 07/01/18 (p) | | | 4,792 | |
| | | | | | | | |
| | | | | | | 5,634 | |
| | | | | | | | |
| | | | General Obligation — 0.6% | |
| | 11,885 | | | State of Minnesota, Series A, GO, 5.000%, 08/01/18 | | | 12,581 | |
| | | | | | | | |
| | | | Transportation — 0.1% | |
| | | | Minneapolis-St Paul Metropolitan Airports Commission, Subordinate Airport, | | | | |
| | 750 | | | Series A, Rev., 5.000%, 01/01/18 | | | 776 | |
| | 220 | | | Series A, Rev., 5.000%, 01/01/20 | | | 242 | |
| | 1,000 | | | Series A, Rev., 5.000%, 01/01/22 | | | 1,152 | |
| | | | | | | | |
| | | | | | | 2,170 | |
| | | | | | | | |
SEE NOTES TO FINANCIAL STATEMENTS.
| | | | | | |
| | | |
| 34 | | | | J.P. MORGAN MUNICIPAL BOND FUNDS | | FEBRUARY 28, 2017 |
| | | | | | | | |
PRINCIPAL
AMOUNT($) | | | SECURITY DESCRIPTION | | VALUE($) | |
| | Municipal Bonds — continued | |
| | | | Utility — 0.1% | |
| | | | Western Minnesota Municipal Power Agency, Power Supply, | | | | |
| | 1,500 | | | Series A, Rev., 5.000%, 01/01/23 | | | 1,757 | |
| | 1,000 | | | Series A, Rev., 5.000%, 01/01/24 | | | 1,182 | |
| | | | | | | | |
| | | | | | | 2,939 | |
| | | | | | | | |
| | | | Total Minnesota | | | 23,324 | |
| | | | | | | | |
| | | | Mississippi — 0.2% | |
| | | | Education — 0.1% | |
| | 1,745 | | | Mississippi State University Educational Building Corp., New Facilities & Refinancing Project, Series A, Rev., 4.000%, 08/01/18 | | | 1,822 | |
| | | | | | | | |
| | | | General Obligation — 0.1% | |
| | 2,500 | | | State of Mississippi, Series F, GO, 5.250%, 10/01/23 | | | 3,016 | |
| | | | | | | | |
| | | | Total Mississippi | | | 4,838 | |
| | | | | | | | |
| | | | Missouri — 1.3% | |
| | | | Certificate of Participation/Lease — 0.1% | |
| | 1,000 | | | City of Chesterfield, COP, 5.000%, 12/01/21 | | | 1,155 | |
| | 1,000 | | | St. Charles County Public Water Supply District No. 2, Series B, COP, 5.000%, 12/01/23 | | | 1,154 | |
| | | | | | | | |
| | | | | | | 2,309 | |
| | | | | | | | |
| | | | Education — 0.2% | |
| | | | Health & Educational Facilities Authority, | | | | |
| | 450 | | | Rev., 4.000%, 10/01/18 | | | 471 | |
| | 625 | | | Rev., 4.000%, 10/01/19 | | | 669 | |
| | 300 | | | Rev., 4.000%, 10/01/20 | | | 326 | |
| | 300 | | | Rev., 4.000%, 10/01/21 | | | 331 | |
| | | | Missouri State Health & Educational Facilities Authority, Health Facilities, BJC Health System, | | | | |
| | 950 | | | Rev., 5.000%, 01/01/18 | | | 984 | |
| | 855 | | | Rev., 5.000%, 01/01/19 | | | 916 | |
| | 225 | | | Rev., 5.000%, 01/01/21 | | | 255 | |
| | | | | | | | |
| | | | | | | 3,952 | |
| | | | | | | | |
| | | | General Obligation — 0.1% | |
| | 350 | | | County of Clay, North Kansas City School District 74, Refunding & Improvement, Missouri Direct Deposit Program, GO, 5.000%, 03/01/22 | | | 409 | |
| | 325 | | | School District of the City of Ladue, GO, 4.000%, 03/01/21 | | | 359 | |
| | | | | | | | |
| | | | | | | 768 | |
| | | | | | | | |
| | | | | | | | |
PRINCIPAL
AMOUNT($) | | | SECURITY DESCRIPTION | | VALUE($) | |
| | | | | | | | |
| | | | Industrial Development Revenue/Pollution Control Revenue — 0.3% | |
| | 2,895 | | | Kansas City Industrial Development Authority, Series A, Rev., AMBAC, 5.000%, 12/01/20 | | | 2,977 | |
| | 550 | | | Missouri Environmental Improvement & Energy Resources Authority, Water Pollution Control & Drinking Water, Series B, Rev., 5.000%, 07/01/23 | | | 620 | |
| | 2,045 | | | State of Missouri, Environmental Improvement & Energy Residual Authority, Water Pollution Control & Drinking Water, Series A, Rev., 5.000%, 01/01/24 | | | 2,375 | |
| | | | | | | | |
| | | | | | | 5,972 | |
| | | | | | | | |
| | | | Other Revenue — 0.1% | |
| | 350 | | | City of Springfield, Series A, Rev., 4.000%, 09/01/18 | | | 366 | |
| | 2,010 | | | County of St. Louis, Regional Convention & Sports Complex Authority, Convention & Sports Facility, Series B, Rev., 5.000%, 08/15/19 | | | 2,188 | |
| | | | | | | | |
| | | | | | | 2,554 | |
| | | | | | | | |
| | | | Prerefunded — 0.1% | |
| | 2,205 | | | Missouri Environmental Improvement & Energy Resources Authority, Water Pollution Control & Drinking Water, Series B, Rev., 5.000%, 01/01/21 (p) | | | 2,507 | |
| | | | | | | | |
| | | | Transportation — 0.4% | |
| | | | Kansas City, Missouri Airport Refunding, General Improvement, | | | | |
| | 2,500 | | | Series B, Rev., 5.000%, 09/01/17 | | | 2,554 | |
| | 1,250 | | | Series B, Rev., 5.000%, 09/01/18 | | | 1,324 | |
| | | | Missouri Airport Refunding, Lambert St. Louis International Airport, | | | | |
| | 1,575 | | | Rev., 5.000%, 07/01/21 | | | 1,776 | |
| | 1,000 | | | Rev., 5.000%, 07/01/22 | | | 1,142 | |
| | 1,080 | | | Rev., 5.000%, 07/01/23 | | | 1,242 | |
| | | | | | | | |
| | | | | | | 8,038 | |
| | | | | | | | |
| | | | Total Missouri | | | 26,100 | |
| | | | | | | | |
| | | | Montana — 0.1% | |
| | | | General Obligation — 0.1% | |
| | | | State of Montana, Long-Range Building Program, | | | | |
| | 690 | | | GO, 5.000%, 08/01/21 | | | 798 | |
| | 1,000 | | | GO, 5.000%, 08/01/22 | | | 1,177 | |
| | 650 | | | Yellowstone County, School District No. 2 Billings, School Building, GO, 5.000%, 06/15/20 | | | 729 | |
| | | | | | | | |
| | | | Total Montana | | | 2,704 | |
| | | | | | | | |
SEE NOTES TO FINANCIAL STATEMENTS.
| | | | | | | | |
| | | |
| FEBRUARY 28, 2017 | | J.P. MORGAN MUNICIPAL BOND FUNDS | | | | | 35 | |
JPMorgan Short-Intermediate Municipal Bond Fund
SCHEDULE OF PORTFOLIO INVESTMENTS
AS OF FEBRUARY 28, 2017 (continued)
(Amounts in thousands)
| | | | | | | | |
PRINCIPAL
AMOUNT($) | | | SECURITY DESCRIPTION | | VALUE($) | |
| | Municipal Bonds — continued | |
| | | | Nebraska — 0.2% | |
| | | | Utility — 0.2% | |
| | 2,000 | | | Central Plains Energy Project, Gas Project No. 3, Rev., 5.000%, 09/01/17 | | | 2,034 | |
| | 1,750 | | | Municipal Energy Agency of Nebraska, Series A, Rev., 5.000%, 04/01/17 | | | 1,757 | |
| | | | | | | | |
| | | | Total Nebraska | | | 3,791 | |
| | | | | | | | |
| | | | Nevada — 0.1% | |
| | | | Other Revenue — 0.1% | |
| | 1,250 | | | County of Clark, Series A, Rev., 4.000%, 07/01/18 | | | 1,302 | |
| | | | | | | | |
| | | | New Hampshire — 0.5% | |
| | | | Education — 0.3% | |
| | | | New Hampshire Health & Educational Facilities Authority, Southern New Hampshire Medical Center, | | | | |
| | 620 | | | Rev., 3.000%, 10/01/19 | | | 642 | |
| | 2,715 | | | Rev., 4.000%, 10/01/26 | | | 2,893 | |
| | 2,815 | | | Rev., 4.000%, 10/01/27 | | | 2,965 | |
| | | | | | | | |
| | | | | | | 6,500 | |
| | | | | | | | |
| | | | General Obligation — 0.2% | |
| | 2,880 | | | State of New Hampshire, Series A, GO, 5.000%, 03/01/26 | | | 3,450 | |
| | | | | | | | |
| | | | Total New Hampshire | | | 9,950 | |
| | | | | | | | |
| | | | New Jersey — 1.5% | |
| | | | Education — 0.1% | |
| | 1,040 | | | New Jersey Economic Development Authority, School Facilities Construction, Series A, Rev., 5.250%, 12/15/20 | | | 1,087 | |
| | | | | | | | |
| | | | General Obligation — 1.0% | |
| | | | City of Bayonne, State of New Jersey Qualified General Improvement, | | | | |
| | 245 | | | GO, 5.000%, 07/01/23 | | | 281 | |
| | 680 | | | GO, 5.000%, 07/01/25 | | | 789 | |
| | 1,425 | | | GO, 5.000%, 07/01/26 | | | 1,660 | |
| | 780 | | | GO, 5.000%, 07/01/28 | | | 895 | |
| | | | County of Passaic, | | | | |
| | 3,030 | | | GO, 5.000%, 02/01/19 | | | 3,258 | |
| | 1,685 | | | GO, 5.000%, 02/01/20 | | | 1,867 | |
| | 90 | | | GO, 5.000%, 02/01/21 | | | 102 | |
| | | | State of New Jersey, | | | | |
| | 525 | | | GO, AGM, 4.000%, 02/15/20 | | | 563 | |
| | 10,075 | | | Series Q, GO, 5.000%, 08/15/20 | | | 11,107 | |
| | 425 | | | Township of South Brunswick, GO, 5.000%, 09/01/22 | | | 495 | |
| | | | | | | | |
| | | | | | | 21,017 | |
| | | | | | | | |
| | | | | | | | |
PRINCIPAL
AMOUNT($) | | | SECURITY DESCRIPTION | | VALUE($) | |
| | | | | | | | |
| | | | Other Revenue — 0.3% | |
| | 2,225 | | | New Jersey Environmental Infrastructure Trust, Series A, Rev., 5.000%, 09/01/18 | | | 2,362 | |
| | 4,000 | | | Tobacco Settlement Financing Corp., Asset-Backed, Series 1A, Rev., 5.000%, 06/01/18 | | | 4,041 | |
| | | | | | | | |
| | | | | | | 6,403 | |
| | | | | | | | |
| | | | Prerefunded — 0.1% | |
| | 1,680 | | | New Jersey Transportation Trust Fund Authority, Transportation System, Series A, Rev., 6.000%, 12/15/18 (p) | | | 1,831 | |
| | | | | | | | |
| | | | Total New Jersey | | | 30,338 | |
| | | | | | | | |
| | | | New Mexico — 0.0% (g) | |
| | | | Other Revenue — 0.0% (g) | |
| | 800 | | | New Mexico Finance Authority, Senior Lien Public Project, Series B, Rev., 5.000%, 06/01/21 | | | 917 | |
| | | | | | | | |
| | | | New York — 14.6% | |
| | | | Education — 0.6% | |
| | | | New York State Dormitory Authority, Columbia University, | | | | |
| | 585 | | | Series B, Rev., 5.000%, 10/01/21 | | | 681 | |
| | 2,500 | | | Series B, Rev., 5.000%, 10/01/23 | | | 3,007 | |
| | 500 | | | New York State Dormitory Authority, Fordham University, Series B, Rev., 5.000%, 10/01/24 | | | 609 | |
| | 5,000 | | | New York State Dormitory Authority, New York University, Series A, Rev., 5.000%, 07/01/24 | | | 5,995 | |
| | 1,100 | | | New York State Dormitory Authority, The New School, Series A, Rev., 5.000%, 07/01/24 | | | 1,280 | |
| | | | | | | | |
| | | | | | | 11,572 | |
| | | | | | | | |
| | | | General Obligation — 2.7% | |
| | 2,410 | | | Bedford Central School District, GO, 5.000%, 11/15/22 | | | 2,855 | |
| | 4,230 | | | City of New York, Fiscal Year 2003, Series C, Subseries C-A, GO, 5.000%, 08/01/17 | | | 4,307 | |
| | 3,860 | | | City of New York, Fiscal Year 2012, Subseries G-1, GO, 5.000%, 04/01/20 | | | 4,297 | |
| | 3,695 | | | City of New York, Fiscal Year 2013, Series B, GO, 4.000%, 08/01/19 | | | 3,950 | |
| | 6,250 | | | City of New York, Fiscal Year 2014, Series K, GO, 5.000%, 08/01/19 | | | 6,831 | |
| | | | Counties of Rockland & Orange, Ramapo Central School District, | | | | |
| | 1,800 | | | GO, 4.000%, 10/15/17 | | | 1,838 | |
| | 2,030 | | | GO, 4.000%, 10/15/19 | | | 2,181 | |
| | 285 | | | County of Allegany, Public Improvement, GO, 4.000%, 09/15/19 | | | 306 | |
SEE NOTES TO FINANCIAL STATEMENTS.
| | | | | | |
| | | |
| 36 | | | | J.P. MORGAN MUNICIPAL BOND FUNDS | | FEBRUARY 28, 2017 |
| | | | | | | | |
PRINCIPAL
AMOUNT($) | | | SECURITY DESCRIPTION | | VALUE($) | |
| | Municipal Bonds — continued | |
| | | | General Obligation — continued | |
| | 6,750 | | | County of Westchester, Series B, GO, 5.000%, 11/15/25 | | | 8,261 | |
| | 2,025 | | | Hampton Bays Union Free School District, GO, 5.000%, 09/15/22 | | | 2,379 | |
| | 1,300 | | | South Orangetown New York Central School District, GO, 5.000%, 12/01/23 | | | 1,568 | |
| | | | Town of Brookhaven, | | | | |
| | 1,500 | | | GO, 4.000%, 03/15/25 | | | 1,690 | |
| | 5,250 | | | GO, 4.000%, 03/15/27 | | | 5,826 | |
| | 5,465 | | | GO, 4.000%, 03/15/28 | | | 6,024 | |
| | | | Town of East Hampton, | | | | |
| | 1,000 | | | GO, 5.000%, 05/15/21 | | | 1,149 | |
| | 1,000 | | | GO, 5.000%, 05/15/23 | | | 1,192 | |
| | 1,550 | | | White Plains City School District, GO, 5.000%, 05/15/24 | | | 1,871 | |
| | | | | | | | |
| | | | | | | 56,525 | |
| | | | | | | | |
| | | | Hospital — 0.1% | |
| | | | Build Resource Corp., The New York Methodist Hospital Project, | | | | |
| | 1,000 | | | Rev., 5.000%, 07/01/18 | | | 1,051 | |
| | 550 | | | Rev., 5.000%, 07/01/21 | | | 622 | |
| | 800 | | | Nassau County Local Economic Assistance Corp., Catholic Health Services, Long Island Obligated Group Project, Series B, Rev., 5.000%, 07/01/23 | | | 916 | |
| | | | | | | | |
| | | | | | | 2,589 | |
| | | | | | | | |
| | | | Industrial Development Revenue/Pollution Control Revenue — 0.1% | |
| | 3,000 | | | New York State Energy Research & Development Authority, Pollution Control, Electric & Gas Corp., Project, Series C, Rev., VAR, 2.000%, 05/01/20 | | | 2,992 | |
| | | | | | | | |
| | | | Other Revenue — 4.9% | |
| | | | Battery Park City Authority, | | | | |
| | 3,450 | | | Series A, Rev., 3.000%, 11/01/18 | | | 3,578 | |
| | 2,500 | | | Series A, Rev., 4.000%, 11/01/19 | | | 2,703 | |
| | 500 | | | Brooklyn Arena Local Development Corp., Pilot Refunding, Barclays Center, Series A, Rev., 5.000%, 07/15/20 | | | 551 | |
| | 500 | | | City of Troy Capital Resources Corp., Rensselaer Polytechnic Institute Project, Rev., 5.000%, 08/01/20 | | | 557 | |
| | | | New York City Transitional Finance Authority, Future Tax Secured, Fiscal Year 2003, | | | | |
| | 2,750 | | | Series B, Rev., 5.000%, 02/01/20 | | | 3,052 | |
| | 2,120 | | | Subseries A-1, Rev., 5.000%, 11/01/17 | | | 2,181 | |
| | | | | | | | |
PRINCIPAL
AMOUNT($) | | | SECURITY DESCRIPTION | | VALUE($) | |
| | | | | | | | |
| | | | Other Revenue — continued | |
| | | | New York City Transitional Finance Authority, Future Tax Secured, Fiscal Year 2014, | | | | |
| | 1,490 | | | Series A, Subseries A-1, Rev., 5.000%, 11/01/17 (p) | | | 1,533 | |
| | 3,700 | | | Series A, Subseries A-1, Rev., 5.000%, 11/01/20 | | | 4,194 | |
| | | | New York City, The Trust for Cultural Resources Museum Modern Art, | | | | |
| | 6,510 | | | Series 1-E, Rev., 4.000%, 02/01/23 | | | 7,338 | |
| | 3,500 | | | Series 1-E, Rev., 4.000%, 04/01/28 | | | 3,944 | |
| | 3,000 | | | Series 1-E, Rev., 4.000%, 04/01/29 | | | 3,355 | |
| | 1,750 | | | Series 1-E, Rev., 4.000%, 04/01/30 | | | 1,943 | |
| | 5,000 | | | New York Convention Center Development Corp. Hotel Unit Fee Secured, Rev., 5.000%, 11/15/26 | | | 5,922 | |
| | 1,210 | | | New York Local Government Assistance Corp., Senior Lien, Series A, Rev., 5.000%, 04/01/17 | | | 1,215 | |
| | | | New York Local Government Assistance Corp., Subordinated Lien, | | | | |
| | 2,845 | | | Series A-5/6, Rev., 5.000%, 04/01/18 | | | 2,974 | |
| | 1,500 | | | Series A-5/6, Rev., 5.500%, 04/01/19 | | | 1,640 | |
| | | | New York State Dormitory Authority, State Sales Tax, | | | | |
| | 3,000 | | | Series A, Rev., 5.000%, 03/15/18 | | | 3,133 | |
| | 2,000 | | | Series A, Rev., 5.000%, 03/15/21 | | | 2,294 | |
| | 10,180 | | | New York State Environmental Facilities Corp., Green Bonds, Series D, Rev., 5.000%, 09/15/21 | | | 11,829 | |
| | | | Sales Tax Asset Receivable Corp., Fiscal Year 2015, | | | | |
| | 8,525 | | | Series A, Rev., 5.000%, 10/15/19 | | | 9,396 | |
| | 15,405 | | | Series A, Rev., 5.000%, 10/15/20 | | | 17,469 | |
| | 4,800 | | | Series A, Rev., 5.000%, 10/15/22 | | | 5,677 | |
| | 4,500 | | | Series A, Rev., 5.000%, 10/15/25 | | | 5,423 | |
| | | | | | | | |
| | | | | | | 101,901 | |
| | | | | | | | |
| | | | Prerefunded — 0.8% | |
| | 4,305 | | | Brooklyn Arena Local Development Corp., Pilot Refunding, Barclays Center, Rev., 6.375%, 01/15/20 (p) | | | 4,939 | |
| | 12,055 | | | Westchester Tobacco Asset Securitization Corp., Capital Appreciation, Rev., 6.950%, 07/15/17 (p) | | | 12,458 | |
| | | | | | | | |
| | | | | | | 17,397 | |
| | | | | | | | |
| | | | Special Tax — 0.9% | |
| | 1,110 | | | New York State Dormitory Authority, Personal Income Tax, Series G, Rev., 5.000%, 08/15/21 | | | 1,283 | |
SEE NOTES TO FINANCIAL STATEMENTS.
| | | | | | | | |
| | | |
| FEBRUARY 28, 2017 | | J.P. MORGAN MUNICIPAL BOND FUNDS | | | | | 37 | |
JPMorgan Short-Intermediate Municipal Bond Fund
SCHEDULE OF PORTFOLIO INVESTMENTS
AS OF FEBRUARY 28, 2017 (continued)
(Amounts in thousands)
| | | | | | | | |
PRINCIPAL
AMOUNT($) | | | SECURITY DESCRIPTION | | VALUE($) | |
| | Municipal Bonds — continued | |
| | | | Special Tax — continued | |
| | 17,140 | | | New York State Urban Development Corp., General Purpose, Series C, Rev., 5.000%, 03/15/18 | | | 17,883 | |
| | | | | | | | |
| | | | | | | 19,166 | |
| | | | | | | | |
| | | | Transportation — 4.2% | |
| | | | Buffalo & Fort Erie Public Bridge Authority, Toll Bridge System, | | | | |
| | 465 | | | Rev., 5.000%, 01/01/20 | | | 513 | |
| | 815 | | | Rev., 5.000%, 01/01/21 | | | 920 | |
| | | | Metropolitan Transportation Authority, | | | | |
| | 11,000 | | | Series C, Rev., VAR, 4.000%, 11/15/20 | | | 11,941 | |
| | 2,770 | | | Series D, Rev., 5.000%, 11/15/18 | | | 2,961 | |
| | 1,435 | | | Subseries A-1, Rev., 5.000%, 11/15/20 | | | 1,621 | |
| | 2,000 | | | Subseries C-1, Rev., 5.000%, 11/15/19 | | | 2,200 | |
| | 3,000 | | | Subseries C-1, Rev., 5.000%, 11/15/24 | | | 3,568 | |
| | 14,500 | | | MTA Hudson Rail Yards Trust Obligations, Series A, Rev., 5.000%, 11/15/46 | | | 15,525 | |
| | | | New York State Thruway Authority, | | | | |
| | 32,125 | | | Series A, Rev., 5.000%, 05/01/19 | | | 34,742 | |
| | 4,200 | | | Series J, Rev., 5.000%, 01/01/18 | | | 4,342 | |
| | 2,500 | | | Port Authority of New York & New Jersey, Consolidated 185, Rev., AMT, 5.000%, 09/01/17 | | | 2,554 | |
| | 5,000 | | | Triborough Bridge & Tunnel Authority, Series B, Rev., 5.000%, 11/15/17 | | | 5,155 | |
| | | | | | | | |
| | | | | | | 86,042 | |
| | | | | | | | |
| | | | Water & Sewer — 0.3% | |
| | 5,000 | | | New York City Municipal Water Finance Authority, Water & Sewer System, Second General Resolution, Series EE, Rev., 5.000%, 06/15/19 | | | 5,452 | |
| | | | | | | | |
| | | | Total New York | | | 303,636 | |
| | | | | | | | |
| | | | North Carolina — 0.7% | |
| | | | General Obligation — 0.6% | |
| | 2,230 | | | City of Durham, Series C, GO, 5.000%, 07/01/18 | | | 2,354 | |
| | 9,670 | | | State of North Carolina, Series D, GO, 4.000%, 06/01/20 | | | 10,546 | |
| | | | | | | | |
| | | | | | | 12,900 | |
| | | | | | | | |
| | | | Hospital — 0.0% (g) | |
| | 350 | | | Northern Hospital District of Surry County, Health Care Facilities, Rev., 3.000%, 10/01/17 | | | 353 | |
| | | | | | | | |
| | | | | | | | |
PRINCIPAL
AMOUNT($) | | | SECURITY DESCRIPTION | | VALUE($) | |
| | | | | | | | |
| | | | Prerefunded — 0.1% | |
| | 1,510 | | | County of Union, North Carolina, Series D, GO, NATL-RE, 5.000%, 03/01/17 (p) | | | 1,511 | |
| | | | | | | | |
| | | | Total North Carolina | | | 14,764 | |
| | | | | | | | |
| | | | Ohio — 0.9% | |
| | | | Education — 0.2% | |
| | 535 | | | Ohio Higher Educational Facility Commission, Case Western Reserve University Project, Series A, Rev., 4.000%, 12/01/19 | | | 575 | |
| | | | Ohio State Higher Educational Facility Commission, Oberlin College, | | | | |
| | 600 | | | Rev., 4.000%, 10/01/18 | | | 629 | |
| | 675 | | | Rev., 4.000%, 10/01/19 | | | 723 | |
| | 1,000 | | | Rev., 5.000%, 10/01/20 | | | 1,125 | |
| | | | | | | | |
| | | | | | | 3,052 | |
| | | | | | | | |
| | | | General Obligation — 0.3% | |
| | 4,625 | | | City of Columbus, Unlimited Tax, Various Purpose, Series A, GO, 4.000%, 08/15/27 | | | 5,143 | |
| | | | City of Dublin, Various Purpose, | | | | |
| | 500 | | | GO, 4.000%, 12/01/27 | | | 562 | |
| | 300 | | | GO, 4.000%, 12/01/28 | | | 335 | |
| | | | | | | | |
| | | | | | | 6,040 | |
| | | | | | | | |
| | | | Hospital — 0.2% | |
| | 375 | | | Akron, Bath & Copley Joint Township Hospital District, Summa Health Obligated Group, Rev., 5.000%, 11/15/21 | | | 417 | |
| | | | County of Lake, Hospital Facilities, Lake Hospital System, Inc., | | | | |
| | 1,445 | | | Rev., 5.000%, 08/15/23 | | | 1,665 | |
| | 1,655 | | | Rev., 5.000%, 08/15/24 | | | 1,918 | |
| | | �� | | | | | |
| | | | | | | 4,000 | |
| | | | | | | | |
| | | | Other Revenue — 0.1% | |
| | 1,165 | | | County of Cuyahoga, Rev., 5.000%, 12/01/22 | | | 1,376 | |
| | 200 | | | RiverSouth Authority, Riversouth Area Redevelopment Refunding, Series A, Rev., 5.000%, 06/01/22 | | | 230 | |
| | 1,000 | | | State of Ohio, Capital Facilities Lease-Appropriation, Series A, Rev., 5.000%, 10/01/18 | | | 1,065 | |
| | | | | | | | |
| | | | | | | 2,671 | |
| | | | | | | | |
| | | | Water & Sewer — 0.1% | |
| | | | Hamilton County, Sewer System, Metropolitan Sewer District of Greater Cincinnati, | | | | |
| | 500 | | | Series A, Rev., 5.000%, 12/01/18 | | | 535 | |
SEE NOTES TO FINANCIAL STATEMENTS.
| | | | | | |
| | | |
| 38 | | | | J.P. MORGAN MUNICIPAL BOND FUNDS | | FEBRUARY 28, 2017 |
| | | | | | | | |
PRINCIPAL
AMOUNT($) | | | SECURITY DESCRIPTION | | VALUE($) | |
| | Municipal Bonds — continued | |
| | | | Water & Sewer — continued | |
| | 640 | | | Series A, Rev., 5.000%, 12/01/19 | | | 707 | |
| | 1,375 | | | Series A, Rev., 5.000%, 12/01/21 | | | 1,596 | |
| | | | | | | | |
| | | | | | | 2,838 | |
| | | | | | | | |
| | | | Total Ohio | | | 18,601 | |
| | | | | | | | |
| | | | Oklahoma — 1.0% | |
| | | | Education — 0.6% | |
| | | | Blaine County Educational Facilities Authority, Educational Facilities, Watonga Public Schools Project, | | | | |
| | 555 | | | Rev., 5.000%, 12/01/18 | | | 590 | |
| | 850 | | | Rev., 5.000%, 12/01/19 | | | 928 | |
| | 1,000 | | | Cleveland County Educational Facilities Authority, Educational Facilities Lease, Moore Public Schools Project, Rev., 5.000%, 06/01/17 | | | 1,011 | |
| | 6,195 | | | Cleveland County Educational Facilities Authority, Educational Facilities Lease, Norman Public Schools Project, Rev., 5.000%, 07/01/19 | | | 6,713 | |
| | 450 | | | Oklahoma County Finance Authority, Educational Facilities, Lease Western Harrah Public Schools Project, Rev., 2.000%, 09/01/18 | | | 454 | |
| | | | Oklahoma County Finance Authority, Educational Facilities, Lease Western Heights Public School Project, | | | | |
| | 250 | | | Rev., 4.000%, 09/01/18 | | | 260 | |
| | 325 | | | Rev., 5.000%, 09/01/19 | | | 353 | |
| | 2,000 | | | Tulsa County Industrial Authority Educational Facilities Lease, Jenks Public Schools Project, Rev., 5.000%, 09/01/21 | | | 2,276 | |
| | | | | | | | |
| | | | | | | 12,585 | |
| | | | | | | | |
| | | | Other Revenue — 0.4% | |
| | | | Cleveland County Justice Authority, Sales Tax, Detention Facility Project, | | | | |
| | 1,205 | | | Rev., 3.000%, 03/01/17 | | | 1,205 | |
| | 1,000 | | | Rev., 3.000%, 03/01/18 | | | 1,018 | |
| | 500 | | | Rev., 4.000%, 03/01/20 | | | 524 | |
| | 700 | | | Oklahoma Capitol Improvement Authority, Agency Facilities, Series C, Rev., 5.000%, 07/01/19 | | | 762 | |
| | 3,225 | | | Oklahoma Capitol Improvement Authority, State Facilities, Series A, Rev., 5.000%, 01/01/24 | | | 3,811 | |
| | | | | | | | |
| | | | | | | 7,320 | |
| | | | | | | | |
| | | | Total Oklahoma | | | 19,905 | |
| | | | | | | | |
| | | | | | | | |
PRINCIPAL
AMOUNT($) | | | SECURITY DESCRIPTION | | VALUE($) | |
| | | | | | | | |
| | | | Oregon — 1.1% | |
| | | | General Obligation — 0.6% | |
| | 2,100 | | | Clackamas County School District No. 12, Series B, GO, 5.000%, 06/15/30 | | | 2,517 | |
| | 2,000 | | | State of Oregon, Article XI-Q State Projects, Series H, GO, 5.000%, 05/01/21 | | | 2,296 | |
| | 7,005 | | | State of Oregon, Tax-Exempt Refunding, Series L, GO, 5.000%, 11/01/19 | | | 7,729 | |
| | | | | | | | |
| | | | | | | 12,542 | |
| | | | | | | | |
| | | | Prerefunded — 0.3% | |
| | 6,210 | | | Oregon State Department of Administrative Services, Lottery, Series A, Rev., 5.250%, 04/01/19 (p) | | | 6,745 | |
| | | | | | | | |
| | | | Transportation — 0.2% | |
| | | | Port of Portland, International Airport, | | | | |
| | 1,000 | | | Series 23, Rev., 5.000%, 07/01/23 | | | 1,179 | |
| | 1,595 | | | Series 23, Rev., 5.000%, 07/01/24 | | | 1,898 | |
| | | | | | | | |
| | | | | | | 3,077 | |
| | | | | | | | |
| | | | Water & Sewer — 0.0% (g) | |
| | 40 | | | City of Portland, Sewer System, First Lien, Series A, Rev., 5.000%, 10/01/23 | | | 48 | |
| | | | | | | | |
| | | | Total Oregon | | | 22,412 | |
| | | | | | | | |
| | | | Pennsylvania — 3.8% | |
| | | | Education — 0.8% | |
| | 5,055 | | | Pennsylvania State Higher Educational Facilities Authority, Trustees of the University, Series B, Rev., 5.000%, 10/01/22 | | | 5,957 | |
| | | | State Public School Building Authority, Community College of Philadelphia Project, | | | | |
| | 2,760 | | | Rev., 5.000%, 06/15/21 | | | 3,089 | |
| | 2,625 | | | Rev., 5.000%, 06/15/24 | | | 2,990 | |
| | 2,860 | | | State Public School Building Authority, Montgomery County Community College, Rev., 5.000%, 05/01/19 | | | 3,081 | |
| | 1,525 | | | State Public School Building Authority, Philadelphia School District Project, Series A, Rev., 5.000%, 06/01/17 | | | 1,539 | |
| | | | | | | | |
| | | | | | | 16,656 | |
| | | | | | | | |
| | | | General Obligation — 0.2% | |
| | 2,200 | | | Commonwealth of Pennsylvania, First Series, GO, 5.000%, 07/01/18 | | | 2,317 | |
| | 350 | | | Schuylkill Valley School District, GO, 5.000%, 04/01/22 | | | 405 | |
| | 1,045 | | | Souderton Area School District, Series A, GO, 4.000%, 11/15/18 | | | 1,097 | |
| | | | | | | | |
| | | | | | | 3,819 | |
| | | | | | | | |
SEE NOTES TO FINANCIAL STATEMENTS.
| | | | | | | | |
| | | |
| FEBRUARY 28, 2017 | | J.P. MORGAN MUNICIPAL BOND FUNDS | | | | | 39 | |
JPMorgan Short-Intermediate Municipal Bond Fund
SCHEDULE OF PORTFOLIO INVESTMENTS
AS OF FEBRUARY 28, 2017 (continued)
(Amounts in thousands)
| | | | | | | | |
PRINCIPAL
AMOUNT($) | | | SECURITY DESCRIPTION | | VALUE($) | |
| | Municipal Bonds — continued | |
| | | | Hospital — 0.2% | |
| | 1,225 | | | Lancaster County Hospital Authority, Health System, General Hospital Project, Series B, Rev., 4.000%, 07/01/17 (p) | | | 1,239 | |
| | 1,400 | | | Southcentral General Authority, Hanover Hospital, Inc., Rev., 5.000%, 12/01/26 | | | 1,564 | |
| | 380 | | | Southcentral General Authority, Wellspan Health Obligation Group, Series A, Rev., 5.000%, 06/01/24 | | | 447 | |
| | | | | | | | |
| | | | | | | 3,250 | |
| | | | | | | | |
| | | | Other Revenue — 1.0% | |
| | 14,950 | | | Pennsylvania Economic Development Financing Authority, Unemployment Compensation, Series B, Rev., 5.000%, 07/01/21 | | | 15,491 | |
| | 5,000 | | | Philadelphia City Municipal Authority, Series A, Rev., 5.000%, 11/15/17 | | | 5,141 | |
| | | | | | | | |
| | | | | | | 20,632 | |
| | | | | | | | |
| | | | Prerefunded — 0.3% | |
| | 5,675 | | | Commonwealth of Pennsylvania, Second Series, GO, 5.000%, 03/01/17 (p) | | | 5,677 | |
| | | | | | | | |
| | | | Transportation — 0.0% (g) | |
| | 1,000 | | | Pennsylvania Turnpike Commission, Oil Franchise Tax Senior, Series A, Rev., 5.000%, 12/01/22 | | | 1,171 | |
| | | | | | | | |
| | | | Water & Sewer — 1.3% | |
| | | | Allegheny County Sanitary Authority, Sewer, | | | | |
| | 3,500 | | | Rev., 5.000%, 12/01/21 | | | 4,009 | |
| | 3,000 | | | Rev., 5.000%, 12/01/22 | | | 3,479 | |
| | 4,000 | | | Rev., 5.000%, 12/01/23 | | | 4,679 | |
| | | | City of Philadelphia, Water & Wastewater, | | | | |
| | 8,530 | | | Series A, Rev., 5.000%, 01/01/20 | | | 9,395 | |
| | 1,510 | | | Series A, Rev., 5.000%, 07/01/22 | | | 1,747 | |
| | 2,595 | | | Series A, Rev., 5.000%, 07/01/24 | | | 3,045 | |
| | 750 | | | Pittsburgh Water & Sewer Authority, First Lien, Series B, Rev., AGM, 4.000%, 09/01/17 | | | 763 | |
| | | | | | | | |
| | | | | | | 27,117 | |
| | | | | | | | |
| | | | Total Pennsylvania | | | 78,322 | |
| | | | | | | | |
| | | | Rhode Island — 0.2% | |
| | | | General Obligation — 0.2% | |
| | | | State of Rhode Island & Providence Plantations, Consolidated Capital Development Loan, | | | | |
| | 1,000 | | | Series A, GO, 5.000%, 10/15/18 | | | 1,068 | |
| | 1,475 | | | Series A, GO, 5.000%, 10/15/19 (p) | | | 1,623 | |
| | 1,000 | | | State of Rhode Island & Providence Plantations, Consolidated Capital Development Loan of 2014, Series A, GO, 5.000%, 11/01/19 | | | 1,104 | |
| | | | | | | | |
| | | | | | | 3,795 | |
| | | | | | | | |
| | | | | | | | |
PRINCIPAL
AMOUNT($) | | | SECURITY DESCRIPTION | | VALUE($) | |
| | | | | | | | |
| | | | Industrial Development Revenue/Pollution Control Revenue — 0.0% (g) | |
| | 590 | | | Rhode Island Clean Water Finance Agency, Water Pollution Control Revolving Fund, Green Bonds, Series A, Rev., 5.000%, 10/01/26 | | | 707 | |
| | | | | | | | |
| | | | Total Rhode Island | | | 4,502 | |
| | | | | | | | |
| | | | South Carolina — 0.4% | |
| | | | Education — 0.2% | |
| | 3,840 | | | SCAGO Educational Facilities Corp., School District of Pickens County Project, Rev., 5.000%, 12/01/20 | | | 4,314 | |
| | | | | | | | |
| | | | General Obligation — 0.1% | |
| | | | State of South Carolina, | | | | |
| | 1,310 | | | Series B, GO, 5.000%, 04/01/18 | | | 1,370 | |
| | 1,110 | | | Series D, GO, 5.000%, 04/01/18 | | | 1,161 | |
| | | | | | | | |
| | | | | | | 2,531 | |
| | | | | | | | |
| | | | Other Revenue — 0.1% | |
| | | | County of Charleston, | | | | |
| | 645 | | | Rev., 5.000%, 12/01/18 | | | 690 | |
| | 1,000 | | | Rev., 5.000%, 12/01/19 | | | 1,103 | |
| | | | | | | | |
| | | | | | | 1,793 | |
| | | | | | | | |
| | | | Water & Sewer — 0.0% (g) | |
| | 500 | | | City of Florence, Combined Waterworks & Sewerage System, Rev., 4.000%, 09/01/24 | | | 559 | |
| | | | | | | | |
| | | | Total South Carolina | | | 9,197 | |
| | | | | | | | |
| | | | South Dakota — 0.1% | |
| | | | Education — 0.1% | |
| | | | South Dakota Health & Educational Facilities Authority, | | | | |
| | 625 | | | Series B, Rev., 4.000%, 11/01/20 | | | 681 | |
| | 500 | | | Series B, Rev., 4.000%, 11/01/21 | | | 549 | |
| | 375 | | | Series B, Rev., 5.000%, 11/01/22 | | | 437 | |
| | | | | | | | |
| | | | | | | 1,667 | |
| | | | | | | | |
| | | | Other Revenue — 0.0% (g) | |
| | | | South Dakota State Building Authority, | | | | |
| | 500 | | | Series B, Rev., 5.000%, 06/01/19 | | | 543 | |
| | 485 | | | Series B, Rev., 5.000%, 06/01/21 | | | 554 | |
| | | | | | | | |
| | | | | | | 1,097 | |
| | | | | | | | |
| | | | Total South Dakota | | | 2,764 | |
| | | | | | | | |
| | | | Tennessee — 0.2% | |
| | | | General Obligation — 0.1% | |
| | 2,330 | | | County of Maury, GO, 4.000%, 04/01/17 | | | 2,337 | |
| | | | | | | | |
SEE NOTES TO FINANCIAL STATEMENTS.
| | | | | | |
| | | |
| 40 | | | | J.P. MORGAN MUNICIPAL BOND FUNDS | | FEBRUARY 28, 2017 |
| | | | | | | | |
PRINCIPAL
AMOUNT($) | | | SECURITY DESCRIPTION | | VALUE($) | |
| | Municipal Bonds — continued | |
| | | | Other Revenue — 0.0% (g) | |
| | 5 | | | Metropolitan Government of Nashville & Davidson, County Sports Authority, Public Improvement, Rev., 5.000%, 07/01/20 | | | 6 | |
| | | | | | | | |
| | | | Utility — 0.1% | |
| | 800 | | | City of Chattanooga, Electric System, Series A, Rev., 5.000%, 09/01/22 | | | 940 | |
| | | | | | | | |
| | | | Total Tennessee | | | 3,283 | |
| | | | | | | | |
| | | | Texas — 5.7% | |
| | | | Education — 0.5% | |
| | 790 | | | Austin Community College District, Combined Fee, Series A, Rev., 5.000%, 02/01/21 | | | 891 | |
| | 790 | | | Stephen F. Austin State University, Board of Regents, Revenue Financing System, Rev., 4.000%, 10/15/18 | | | 828 | |
| | 6,735 | | | University of Texas, Financing System, Series I, Rev., 5.000%, 08/15/23 | | | 8,002 | |
| | | | | | | | |
| | | | | | | 9,721 | |
| | | | | | | | |
| | | | General Obligation — 2.1% | |
| | 840 | | | Argyle Independent School District, School Building, GO, PSF-GTD, 3.000%, 08/15/19 | | | 878 | |
| | 475 | | | City of Abilene, Taylor & Jones Counties, GO, 5.000%, 02/15/21 | | | 540 | |
| | | | City of Colony, | | | | |
| | 620 | | | GO, 5.000%, 08/15/19 | | | 678 | |
| | 610 | | | GO, 5.000%, 08/15/20 | | | 685 | |
| | 1,045 | | | City of Denton, GO, 5.000%, 02/15/23 | | | 1,227 | |
| | | | City of El Paso, Refunding & Improvement, | | | | |
| | 530 | | | GO, 5.000%, 08/15/21 | | | 609 | |
| | 4,035 | | | GO, 5.000%, 08/15/25 | | | 4,802 | |
| | | | City of Fort Worth, Certificates of Obligation, | | | | |
| | 445 | | | Series A, GO, 3.000%, 03/01/17 | | | 445 | |
| | 500 | | | Series A, GO, 4.000%, 03/01/18 | | | 516 | |
| | 785 | | | Series A, GO, 4.000%, 03/01/19 | | | 830 | |
| | | | City of Fort Worth, Refunding & Improvement, General Purpose, | | | | |
| | 870 | | | GO, 3.000%, 03/01/17 | | | 870 | |
| | 1,000 | | | GO, 4.000%, 03/01/18 | | | 1,032 | |
| | 1,060 | | | GO, 4.000%, 03/01/19 | | | 1,121 | |
| | 185 | | | City of Mesquite, County of Dallas, GO, 4.000%, 02/15/18 | | | 191 | |
| | 355 | | | City of Mesquite, County of Dallas, Certificates of Obligation, GO, 3.000%, 02/15/18 | | | 362 | |
| | 2,000 | | | City of San Antonio, General Improvement, GO, 5.000%, 02/01/23 | | | 2,335 | |
| | 1,350 | | | City of Wylie, GO, 5.000%, 02/15/27 | | | 1,599 | |
| | | | | | | | |
PRINCIPAL
AMOUNT($) | | | SECURITY DESCRIPTION | | VALUE($) | |
| | | | | | | | |
| | | | General Obligation — continued | |
| | 5,150 | | | County of Travis, Austin Independent School District, Unlimited Tax Refunding, GO, NATL-RE, 5.000%, 08/01/17 | | | 5,247 | |
| | | | Harlandale Independent School District, | | | | |
| | 1,240 | | | Series A, GO, PSF-GTD, 5.000%, 02/15/25 | | | 1,482 | |
| | 1,195 | | | Series A, GO, PSF-GTD, 5.000%, 02/15/26 | | | 1,441 | |
| | 2,005 | | | Series A, GO, PSF-GTD, 5.000%, 02/15/27 | | | 2,433 | |
| | | | Judson Independent School District, | | | | |
| | 420 | | | GO, PSF-GTD, 4.000%, 02/01/18 | | | 432 | |
| | 595 | | | Series A, GO, 5.000%, 02/01/19 | | | 640 | |
| | 5,215 | | | Northside Independent School District, Series A, GO, PSF-GTD, 4.000%, 08/15/24 | | | 5,889 | |
| | 1,880 | | | Northside Independent School District, School Building, GO, PSF-GTD, 5.000%, 08/15/25 | | | 2,269 | |
| | 3,000 | | | State of Texas, Transportation Commission Mobility, GO, 5.000%, 10/01/19 | | | 3,302 | |
| | | | Ysleta Independent School District, School Building, | | | | |
| | 1,500 | | | GO, PSF-GTD, 4.000%, 08/15/32 | | | 1,599 | |
| | 1,155 | | | GO, PSF-GTD, 4.000%, 08/15/33 | | | 1,222 | |
| | | | | | | | |
| | | | | | | 44,676 | |
| | | | | | | | |
| | | | Other Revenue — 1.1% | |
| | 10,755 | | | Harris County, Houston Sports Authority Senior Lien, Series A, Rev., AGM, 5.000%, 11/15/26 | | | 12,547 | |
| | 4,700 | | | Lower Colorado River Authority, Series B, Rev., 5.000%, 05/15/23 | | | 5,442 | |
| | 5,000 | | | Via Metropolitan Transit Authority, Sales Tax, Rev., 5.000%, 07/15/28 | | | 6,000 | |
| | | | | | | | |
| | | | | | | 23,989 | |
| | | | | | | | |
| | | | Prerefunded — 0.3% | |
| | 5,605 | | | Harris County Health Facilities Development Corp., Memorial Hermann Healthcare System, Series B, Rev., 7.250%, 12/01/18 (p) | | | 6,217 | |
| | 60 | | | Lower Colorado River Authority, Series B, Rev., 5.000%, 05/15/22 (p) | | | 70 | |
| | | | | | | | |
| | | | | | | 6,287 | |
| | | | | | | | |
| | | | Transportation — 0.7% | |
| | | | City of Austin, Airport System, | | | | |
| | 1,095 | | | Series B, Rev., AMT, 5.000%, 11/15/26 | | | 1,280 | |
| | 585 | | | Series B, Rev., AMT, 5.000%, 11/15/27 | | | 679 | |
| | 630 | | | Series B, Rev., AMT, 5.000%, 11/15/28 | | | 726 | |
| | | | Love Field Airport Modernization Corp., | | | | |
| | 500 | | | Rev., AMT, 5.000%, 11/01/18 | | | 530 | |
| | 375 | | | Rev., AMT, 5.000%, 11/01/21 | | | 426 | |
SEE NOTES TO FINANCIAL STATEMENTS.
| | | | | | | | |
| | | |
| FEBRUARY 28, 2017 | | J.P. MORGAN MUNICIPAL BOND FUNDS | | | | | 41 | |
JPMorgan Short-Intermediate Municipal Bond Fund
SCHEDULE OF PORTFOLIO INVESTMENTS
AS OF FEBRUARY 28, 2017 (continued)
(Amounts in thousands)
| | | | | | | | |
PRINCIPAL
AMOUNT($) | | | SECURITY DESCRIPTION | | VALUE($) | |
| | Municipal Bonds — continued | |
| | | | Transportation — continued | |
| | 10,125 | | | Texas Transportation Commission Central, Turnpike System, Second Tier, Series A, Rev., VAR, 5.000%, 04/01/20 | | | 11,135 | |
| | | | | | | | |
| | | | | | | 14,776 | |
| | | | | | | | |
| | | | Utility — 0.4% | |
| | | | City of Cedar Park, Utility System, | | | | |
| | 820 | | | Rev., 5.000%, 08/15/21 | | | 942 | |
| | 560 | | | Rev., 5.000%, 08/15/22 | | | 653 | |
| | 5,000 | | | City of Houston, Utility System Revenue Refunding, Series C, Rev., 5.000%, 05/15/20 | | | 5,583 | |
| | | | City of Victoria, Utility System, | | | | |
| | 160 | | | Rev., 2.000%, 12/01/18 | | | 163 | |
| | 150 | | | Rev., 2.500%, 12/01/19 | | | 155 | |
| | | | | | | | |
| | | | | | | 7,496 | |
| | | | | | | | |
| | | | Water & Sewer — 0.6% | |
| | 3,520 | | | City of Dallas, Waterworks & Sewer System, Series A, Rev., 5.000%, 10/01/19 | | | 3,867 | |
| | | | City of Galveston, Waterworks & Sewer System, | | | | |
| | 180 | | | Rev., 4.000%, 05/01/18 | | | 187 | |
| | 205 | | | Rev., 5.000%, 05/01/19 | | | 222 | |
| | 245 | | | Rev., 5.000%, 05/01/20 | | | 272 | |
| | 265 | | | Rev., 5.000%, 05/01/21 | | | 301 | |
| | 380 | | | Rev., 5.000%, 05/01/24 | | | 446 | |
| | | | City of San Antonio, Water System, Junior Lien, | | | | |
| | 2,670 | | | Series A, Rev., 4.000%, 05/15/34 | | | 2,779 | |
| | 1,000 | | | Series E, Rev., 5.000%, 05/15/19 | | | 1,086 | |
| | 1,035 | | | North Harris County, Regional Water Authority, Senior Lien, Rev., 5.000%, 12/15/19 | | | 1,140 | |
| | 1,500 | | | Trinity River Authority Central Regional Wastewater System, Rev., 5.000%, 08/01/18 | | | 1,588 | |
| | | | | | | | |
| | | | | | | 11,888 | |
| | | | | | | | |
| | | | Total Texas | | | 118,833 | |
| | | | | | | | |
| | | | Utah — 1.9% | |
| | | | General Obligation — 0.5% | |
| | | | State of Utah, | | | | |
| | 4,925 | | | GO, 5.000%, 07/01/21 | | | 5,685 | |
| | 4,855 | | | Series C, GO, 5.000%, 07/01/18 | | | 5,126 | |
| | | | | | | | |
| | | | | | | 10,811 | |
| | | | | | | | |
| | | | Transportation — 1.4% | |
| | | | Salt Lake City Corp. Airport Revenue, | | | | |
| | 1,000 | | | Series A, Rev., AMT, 5.000%, 07/01/22 | | | 1,152 | |
| | 5,250 | | | Series A, Rev., AMT, 5.000%, 07/01/29 | | | 6,129 | |
| | | | | | | | |
PRINCIPAL
AMOUNT($) | | | SECURITY DESCRIPTION | | VALUE($) | |
| | | | | | | | |
| | | | Transportation — continued | |
| | 5,000 | | | Series A, Rev., AMT, 5.000%, 07/01/31 | | | 5,773 | |
| | 5,105 | | | Series A, Rev., AMT, 5.000%, 07/01/32 | | | 5,850 | |
| | 4,260 | | | Series A, Rev., AMT, 5.000%, 07/01/33 | | | 4,854 | |
| | 4,000 | | | Series A, Rev., AMT, 5.000%, 07/01/35 | | | 4,517 | |
| | | | | | | | |
| | | | | | | 28,275 | |
| | | | | | | | |
| | | | Total Utah | | | 39,086 | |
| | | | | | | | |
| | | | Vermont — 0.1% | |
| | | | Education — 0.1% | |
| | | | University of Vermont & State Agricultural College, | | | | |
| | 750 | | | Rev., 5.000%, 10/01/21 | | | 864 | |
| | 855 | | | Rev., 5.000%, 10/01/22 | | | 1,000 | |
| | | | | | | | |
| | | | | | | 1,864 | |
| | | | | | | | |
| | | | Other Revenue — 0.0% (g) | |
| | | | Vermont Municipal Bond Bank, | | | | |
| | 545 | | | Series 2, Rev., 5.000%, 12/01/17 | | | 563 | |
| | 400 | | | Series 3, Rev., 5.000%, 12/01/21 | | | 464 | |
| | | | | | | | |
| | | | | | | 1,027 | |
| | | | | | | | |
| | | | Total Vermont | | | 2,891 | |
| | | | | | | | |
| | | | Virginia — 2.1% | |
| | | | Education — 0.2% | |
| | 2,900 | | | Virginia Public School Authority, Special Obligation, Rev., 5.000%, 07/15/19 | | | 3,169 | |
| | | | | | | | |
| | | | General Obligation — 0.5% | |
| | 3,940 | | | City of Alexandria, Series A, GO, 4.250%, 06/15/18 | | | 4,115 | |
| | 5,390 | | | County of Arlington, Series B, GO, 5.000%, 08/15/22 | | | 6,351 | |
| | | | | | | | |
| | | | | | | 10,466 | |
| | | | | | | | |
| | | | Other Revenue — 0.3% | |
| | 2,150 | | | Fairfax County Economic Development Authority, County Facilities Projects, Series A, Rev., 4.000%, 10/01/18 | | | 2,256 | |
| | 1,300 | | | Virginia Resources Authority, Infrastructure & State Moral Obligation, Series B, Rev., 5.000%, 11/01/18 | | | 1,388 | |
| | 2,250 | | | Virginia Resources Authority, Infrastructure Pooled Financing Program, Series C, Rev., 5.000%, 11/01/20 | | | 2,552 | |
| | | | | | | | |
| | | | | | | 6,196 | |
| | | | | | | | |
| | | | Prerefunded — 0.3% | |
| | 1,450 | | | City of Norfolk, Capital Improvement, Series C, GO, 5.000%, 04/01/17 (p) | | | 1,456 | |
SEE NOTES TO FINANCIAL STATEMENTS.
| | | | | | |
| | | |
| 42 | | | | J.P. MORGAN MUNICIPAL BOND FUNDS | | FEBRUARY 28, 2017 |
| | | | | | | | |
PRINCIPAL
AMOUNT($) | | | SECURITY DESCRIPTION | | VALUE($) | |
| | Municipal Bonds — continued | |
| | | | Prerefunded — continued | |
| | 4,725 | | | Virginia Resources Authority, Clean Water State Revolving Fund, Rev., 4.750%, 10/01/17 (p) | | | 4,838 | |
| | | | | | | | |
| | | | | | | 6,294 | |
| | | | | | | | |
| | | | Water & Sewer — 0.8% | |
| | | | City of Norfolk, Water Revenue, | | | | |
| | 4,435 | | | Rev., 5.000%, 11/01/17 | | | 4,564 | |
| | 1,340 | | | Rev., 5.000%, 11/01/18 | | | 1,431 | |
| | 3,190 | | | County of Fairfax, Sewer Revenue, Rev., 5.000%, 07/15/19 | | | 3,488 | |
| | 5,615 | | | Fairfax County Water Authority, Series B, Rev., 5.250%, 04/01/24 | | | 6,867 | |
| | | | | | | | |
| | | | | | | 16,350 | |
| | | | | | | | |
| | | | Total Virginia | | | 42,475 | |
| | | | | | | | |
| | | | Washington — 1.3% | |
| | | | Certificate of Participation/Lease — 0.3% | |
| | | | State of Washington, State & Local Agency Real & Personal Property, | | | | |
| | 2,555 | | | Series D, COP, 5.000%, 07/01/18 | | | 2,694 | |
| | 3,125 | | | Series D, COP, 5.000%, 07/01/19 | | | 3,400 | |
| | | | | | | | |
| | | | | | | 6,094 | |
| | | | | | | | |
| | | | Education — 0.0% (g) | |
| | 125 | | | University of Washington, Rev., 1.750%, 04/01/19 | | | 127 | |
| | | | | | | | |
| | | | General Obligation — 0.6% | |
| | | | King County Public Hospital District No. 2, Evergreenhealth, | | | | |
| | 1,370 | | | GO, 5.000%, 12/01/18 | | | 1,465 | |
| | 870 | | | GO, 5.000%, 12/01/19 | | | 959 | |
| | 1,400 | | | Snohomish County School District No. 002, Everett Refunding, GO, 4.000%, 12/01/17 | | | 1,435 | |
| | 7,300 | | | State of Washington, Various Purpose, Series R-2011B, GO, 5.000%, 07/01/17 | | | 7,410 | |
| | | | | | | | |
| | | | | | | 11,269 | |
| | | | | | | | |
| | | | Transportation — 0.4% | |
| | | | Central Puget Sound Regional Transit Authority, Sales Tax & Motor Vehicle Excise Tax, | | | | |
| | 685 | | | Series S-1, Rev., 5.000%, 11/01/23 | | | 822 | |
| | 720 | | | Series S-1, Rev., 5.000%, 11/01/24 | | | 870 | |
| | 2,000 | | | Series S-1, Rev., 5.000%, 11/01/34 | | | 2,335 | |
| | 4,000 | | | Port of Seattle, Intermediate Lien, Series B, Rev., 5.000%, 03/01/19 | | | 4,304 | |
| | | | | | | | |
| | | | | | | 8,331 | |
| | | | | | | | |
| | | | | | | | |
PRINCIPAL
AMOUNT($) | | | SECURITY DESCRIPTION | | VALUE($) | |
| | | | | | | | |
| | | | Utility — 0.0% (g) | |
| | 500 | | | County of Snohomish, Public Utility District No. 1, Electric System, Rev., 5.000%, 12/01/25 | | | 603 | |
| | | | | | | | |
| | | | Total Washington | | | 26,424 | |
| | | | | | | | |
| | | | West Virginia — 0.2% | |
| | | | General Obligation — 0.0% (g) | |
| | 30 | | | Preston County, Board of Education, Public School, GO, 3.000%, 05/01/17 | | | 30 | |
| | | | | | | | |
| | | | Hospital — 0.2% | |
| | | | Monongalia County Building Commission, Health System, | | | | |
| | 1,545 | | | Rev., 5.000%, 07/01/18 | | | 1,622 | |
| | 1,565 | | | Rev., 5.000%, 07/01/22 | | | 1,793 | |
| | | | | | | | |
| | | | | | | 3,415 | |
| | | | | | | | |
| | | | Total West Virginia | | | 3,445 | |
| | | | | | | | |
| | | | Wisconsin — 1.2% | |
| | | | Certificate of Participation/Lease — 0.1% | |
| | | | State of Wisconsin, Master Lease, | | | | |
| | 800 | | | Series A, COP, 5.000%, 09/01/17 | | | 817 | |
| | 1,125 | | | Series A, COP, 5.000%, 09/01/18 | | | 1,192 | |
| | | | | | | | |
| | | | | | | 2,009 | |
| | | | | | | | |
| | | | Education — 0.4% | |
| | 5,815 | | | Wisconsin Health & Educational Facilities Authority, Ascension Health Alliance Senior Credit Group, Series B-2, Rev., VAR, 4.000%, 05/30/19 | | | 6,173 | |
| | 1,250 | | | Wisconsin Health & Educational Facilities Authority, Thedacare, Inc., Rev., 5.000%, 12/15/20 | | | 1,407 | |
| | | | | | | | |
| | | | | | | 7,580 | |
| | | | | | | | |
| | | | General Obligation — 0.1% | |
| | 1,990 | | | State of Wisconsin, Series A, GO, 5.000%, 05/01/18 | | | 2,088 | |
| | | | | | | | |
| | | | Prerefunded — 0.5% | |
| | 8,440 | | | State of Wisconsin, Series A, GO, 5.000%, 05/01/21 (p) | | | 9,660 | |
| | | | | | | | |
| | | | Transportation — 0.1% | |
| | | | County of Milwaukee, Airport, | | | | |
| | 1,400 | | | Series A, Rev., AMT, 5.000%, 12/01/18 | | | 1,486 | |
| | 1,000 | | | Series A, Rev., AMT, 5.000%, 12/01/28 | | | 1,141 | |
| | | | | | | | |
| | | | | | | 2,627 | |
| | | | | | | | |
| | | | Total Wisconsin | | | 23,964 | |
| | | | | | | | |
| | | | Total Municipal Bonds
(Cost $1,740,816) | | | 1,751,999 | |
| | | | | | | | |
SEE NOTES TO FINANCIAL STATEMENTS.
| | | | | | | | |
| | | |
| FEBRUARY 28, 2017 | | J.P. MORGAN MUNICIPAL BOND FUNDS | | | | | 43 | |
JPMorgan Short-Intermediate Municipal Bond Fund
SCHEDULE OF PORTFOLIO INVESTMENTS
AS OF FEBRUARY 28, 2017 (continued)
(Amounts in thousands)
| | | | | | | | |
PRINCIPAL
AMOUNT($) | | | SECURITY DESCRIPTION | | VALUE($) | |
| | Weekly Demand Notes — 7.5% | |
| | | | California — 1.5% | |
| | | | Other Revenue — 1.1% | |
| | | | California Infrastructure & Economic Development Bank, The J. Paul Getty Trust, | | | | |
| | 10,800 | | | Series A-1, Rev., VAR, 0.900%, 03/01/17 | | | 10,800 | |
| | 5,000 | | | Series A-3, Rev., VAR, 0.900%, 03/01/17 | | | 4,999 | |
| | 5,000 | | | Series A-4, Rev., VAR, 0.900%, 03/01/17 | | | 5,000 | |
| | 1,500 | | | California Statewide Communities Development Authority, Kaiser Permanente, Series B, Rev., VAR, 1.570%, 03/01/17 | | | 1,501 | |
| | | | | | | | |
| | | | | | | 22,300 | |
| | | | | | | | |
| | | | Transportation — 0.4% | |
| | 9,000 | | | Bay Area Toll Authority, Toll Bridge, San Francisco Bay Area, Series G, Rev., VAR, 1.220%, 03/01/17 | | | 9,006 | |
| | | | | | | | |
| | | | Total California | | | 31,306 | |
| | | | | | | | |
| | | | Colorado — 0.1% | |
| | | | Transportation — 0.1% | |
| | 2,500 | | | E-470 Public Highway Authority, Senior LIBOR Index, Series A, Rev., VAR, 1.440%, 03/01/17 | | | 2,500 | |
| | | | | | | | |
| | | | Connecticut — 0.1% | |
| | | | General Obligation — 0.1% | |
| | 1,500 | | | State of Connecticut, SIFMA Index, Series B, GO, VAR, 1.110%, 03/01/17 | | | 1,501 | |
| | | | | | | | |
| | | | Georgia — 0.4% | |
| | | | Other Revenue — 0.2% | |
| | 5,000 | | | Metropolitan Rapid Transit Authority, Sales Tax, Rev., VAR, 0.900%, 03/01/17 | | | 4,999 | |
| | | | | | | | |
| | | | Water & Sewer — 0.2% | |
| | 3,000 | | | City of Atlanta, Water & Wastewater, Revenue Refunding, Series A-1, Rev., VAR, 2.043%, 03/01/17 | | | 3,026 | |
| | | | | | | | |
| | | | Total Georgia | | | 8,025 | |
| | | | | | | | |
| | | | Massachusetts — 0.5% | |
| | | | General Obligation — 0.5% | |
| | 10,000 | | | Commonwealth of Massachusetts, Subseries D-2, GO, VAR, 0.920%, 03/01/17 | | | 10,000 | |
| | | | | | | | |
| | | | Michigan — 0.2% | |
| | | | Education — 0.2% | |
| | 5,000 | | | Regents of the University of Michigan, Series E, Rev., VAR, 1.050%, 03/01/17 | | | 4,992 | |
| | | | | | | | |
| | | | New York — 0.1% | |
| | | | Transportation — 0.1% | |
| | 2,500 | | | Metropolitan Transportation Authority, Series D-2, Rev., VAR, 0.980%, 03/01/17 | | | 2,498 | |
| | | | | | | | |
| | | | | | | | |
PRINCIPAL
AMOUNT($) | | | SECURITY DESCRIPTION | | VALUE($) | |
| | | | | | | | |
| | | | Ohio — 0.5% | |
| | | | Hospital — 0.5% | |
| | 10,800 | | | County of Allen, Mercy Health, Series B, Rev., VAR, 1.370%, 03/01/17 | | | 10,795 | |
| | | | | | | | |
| | | | Oklahoma — 0.1% | |
| | | | Utility — 0.1% | |
| | 1,785 | | | Oklahoma Municipal Power Authority, SIFMA Index, Series A, Rev., VAR, 1.420%, 03/01/17 | | | 1,783 | |
| | | | | | | | |
| | | | Oregon — 0.3% | |
| | | | Hospital — 0.3% | |
| | 5,000 | | | Oregon State Facilities Authority, Providence Health & Services, Series C, Rev., VAR, 1.500%, 03/01/17 | | | 5,000 | |
| | | | | | | | |
| | | | Pennsylvania — 0.4% | |
| | | | Transportation — 0.4% | |
| | | | Pennsylvania Turnpike Commission, | | | | |
| | 5,000 | | | Series A, Rev., VAR, 1.300%, 03/01/17 | | | 4,995 | |
| | 1,525 | | | Series A-2, Rev., VAR, 1.120%, 03/01/17 | | | 1,523 | |
| | 2,500 | | | Subseries A-2, Rev., VAR, 1.420%, 03/01/17 | | | 2,500 | |
| | | | | | | | |
| | | | Total Pennsylvania | | | 9,018 | |
| | | | | | | | |
| | | | Texas — 2.6% | |
| | | | Education — 0.4% | |
| | 7,500 | | | County of Harris, Cultural Education Facilities Finance Corp., Children’s Hospital, Series 3, Rev., VAR, 1.414%, 03/01/17 | | | 7,476 | |
| | | | | | | | |
| | | | General Obligation — 0.8% | |
| | 17,500 | | | State of Texas, Transportation Commission Mobility, Series B, GO, VAR, 1.000%, 03/01/17 | | | 17,493 | |
| | | | | | | | |
| | | | Transportation — 1.0% | |
| | | | Harris County, Toll Road, Senior Lien, | | | | |
| | 3,200 | | | Series A, Rev., VAR, 1.250%, 03/01/17 | | | 3,200 | |
| | 2,500 | | | Series A, Rev., VAR, 1.400%, 03/01/17 | | | 2,502 | |
| | 6,000 | | | North Texas Tollway Authority System, First Tier, Series C, Rev., VAR, 1.290%, 03/01/17 | | | 5,983 | |
| | 10,000 | | | Texas Transportation Commission State Highway Fund, First Tier, SIFMA Index, Series B, Rev., VAR, 0.970%, 03/01/17 | | | 10,000 | |
| | | | | | | | |
| | | | | | | 21,685 | |
| | | | | | | | |
| | | | Utility — 0.4% | |
| | 7,500 | | | City of San Antonio, Electric & Gas Systems, Junior Lien, Series B, Rev., VAR, 1.000%, 03/01/17 | | | 7,484 | |
| | | | | | | | |
| | | | Total Texas | | | 54,138 | |
| | | | | | | | |
SEE NOTES TO FINANCIAL STATEMENTS.
| | | | | | |
| | | |
| 44 | | | | J.P. MORGAN MUNICIPAL BOND FUNDS | | FEBRUARY 28, 2017 |
| | | | | | | | |
PRINCIPAL
AMOUNT($) | | | SECURITY DESCRIPTION | | VALUE($) | |
| | Weekly Demand Notes — continued | |
| | | | Washington — 0.7% | |
| | | | Other Revenue — 0.3% | |
| | 5,000 | | | Central Puget Sound Regional Transit Authority, Sales Tax, Series S-2A, Rev., VAR, 1.320%, 03/01/17 | | | 5,004 | |
| | | | | | | | |
| | | | Utility — 0.4% | |
| | 7,500 | | | City of Seattle, Municipal Light & Power, Series B-1, Rev., VAR, 1.300%, 03/01/17 | | | 7,500 | |
| | 1,000 | | | Grant County Public Utility District No. 2, Electric System, Series K, Rev., VAR, 0.940%, 03/01/17 | | | 998 | |
| | | | | | | | |
| | | | | | | 8,498 | |
| | | | | | | | |
| | | | Total Washington | | | 13,502 | |
| | | | | | | | |
| | | | Total Weekly Demand Notes
(Cost $155,015) | | | 155,058 | |
| | | | | | | | |
| | | | | | | | |
SHARES | | | SECURITY DESCRIPTION | | VALUE($) | |
| | Short-Term Investment — 2.0% | |
| | | | Investment Company — 2.0% | |
| | 41,698 | | | JPMorgan U.S. Government Money Market Fund, Institutional Class Shares, 0.450% (b) (l)
(Cost $41,698) | | | 41,698 | |
| | | | | | | | |
| | | | Total Investments — 97.8%
(Cost $2,019,294) | | | 2,030,190 | |
| | | | Other Assets in Excess of
Liabilities — 2.2% | | | 45,848 | |
| | | | | | | | |
| | | | NET ASSETS — 100.0% | | $ | 2,076,038 | |
| | | | | | | | |
Percentages indicated are based on net assets.
SEE NOTES TO FINANCIAL STATEMENTS.
| | | | | | | | |
| | | |
| FEBRUARY 28, 2017 | | J.P. MORGAN MUNICIPAL BOND FUNDS | | | | | 45 | |
JPMorgan Tax Free Bond Fund
SCHEDULE OF PORTFOLIO INVESTMENTS
AS OF FEBRUARY 28, 2017
(Amounts in thousands)
| | | | | | | | |
PRINCIPAL
AMOUNT($) | | | SECURITY DESCRIPTION | | VALUE($) | |
| | Daily Demand Notes — 3.1% (t) | |
| | | | New York — 3.1% | |
| | | | General Obligation — 1.5% | |
| | 5,000 | | | City of New York, Fiscal Year 2014, Subseries D-4, GO, VRDO, LOC: TD Bank NA, 0.500%, 03/01/17 | | | 5,000 | |
| | | | | | | | |
| | | | Water & Sewer — 1.6% | |
| | 5,000 | | | New York City Municipal Water Finance Authority, Water & Sewer System, Second General Resolution, Fiscal Year 2015, Series BB-4, Rev., VRDO, 0.520%, 03/01/17 | | | 5,000 | |
| | | | | | | | |
| | | | Total Daily Demand Notes
(Cost $10,000) | | | 10,000 | |
| | | | | | | | |
| | Municipal Bonds — 90.6% (t) | | | | |
| | | | Alabama — 0.7% | |
| | | | Industrial Development Revenue/Pollution Control Revenue — 0.3% | |
| | 1,000 | | | Alabama Capital Region Solid Waste Disposal Authority, Tax-Exempt Solid Waste Disposal, IREP-Montgomery MRF, LLC Project, Series A, Rev., AMT, 4.500%, 06/15/34 | | | 1,009 | |
| | | | | | | | |
| | | | Other Revenue — 0.4% | |
| | 1,000 | | | Montgomery County Public Building Authority, Facilities Project, Rev., 5.000%, 03/01/29 | | | 1,146 | |
| | 150 | | | Uab Medicine Financing Authority, Series B, Rev., 4.000%, 09/01/37 | | | 151 | |
| | | | | | | | |
| | | | | | | 1,297 | |
| | | | | | | | |
| | | | Total Alabama | | | 2,306 | |
| | | | | | | | |
| | | | Alaska — 4.2% | |
| | | | Prerefunded — 1.8% | |
| | | | Alaska Municipal Bond Bank Authority, | | | | |
| | 70 | | | Rev., 5.750%, 09/01/18 (p) | | | 75 | |
| | 2,430 | | | Rev., 5.750%, 09/01/18 (p) | | | 2,607 | |
| | 1,745 | | | Matanuska-Susitna Borough, Goose Creek Correctional Center Project, Rev., AGC, 6.000%, 09/01/19 (p) | | | 1,954 | |
| | 1,005 | | | Matanuska-Susitna Borough, Goose Creek Correctional Center Project, Unrefunded Balance, Rev., AGC, 6.000%, 09/01/19 (p) | | | 1,126 | |
| | | | | | | | |
| | | | | | | 5,762 | |
| | | | | | | | |
| | | | Utility — 2.4% | |
| | | | Alaska Energy Authority, Power, Bradley Lake Hydroelectric Project, Fourth Series, | | | | |
| | 3,485 | | | Rev., AGM, 6.000%, 07/01/17 | | | 3,547 | |
| | 3,915 | | | Rev., AGM, 6.000%, 07/01/19 | | | 4,341 | |
| | | | | | | | |
| | | | | | | 7,888 | |
| | | | | | | | |
| | | | Total Alaska | | | 13,650 | |
| | | | | | | | |
| | | | | | | | |
PRINCIPAL
AMOUNT($) | | | SECURITY DESCRIPTION | | VALUE($) | |
| | | | | | | | |
| | | | Arkansas — 0.1% | |
| | | | Education — 0.1% | |
| | 185 | | | Board of Trustees of the University of Arkansas, Various Facility, Fayetteville Campus, Series A, Rev., 5.000%, 11/01/37 | | | 213 | |
| | | | | | | | |
| | | | Hospital — 0.0% (g) | |
| | 50 | | | City of Springdale, Public Facilities Board Hospital, Rev., 4.000%, 03/01/36 | | | 51 | |
| | | | | | | | |
| | | | Total Arkansas | | | 264 | |
| | | | | | | | |
| | | | California — 21.1% | |
| | | | Certificate of Participation/Lease — 0.5% | |
| | 1,500 | | | Riverside Public Financing Authority, Riverside Pavement Rehabilitation Project, COP, AGM, 5.000%, 06/01/33 | | | 1,648 | |
| | | | | | | | |
| | | | Education — 0.7% | |
| | 500 | | | California Educational Facilities Authority, Claremont McKenna College, Series A, Rev., 4.000%, 01/01/39 | | | 511 | |
| | 1,640 | | | California State University, Systemwide, Series A, Rev., 3.125%, 11/01/36 | | | 1,559 | |
| | | | | | | | |
| | | | | | | 2,070 | |
| | | | | | | | |
| | | | General Obligation — 6.3% | |
| | 330 | | | County of Santa Clara, Campbell Union High School District, GO, 3.000%, 08/01/31 | | | 328 | |
| | 5,000 | | | Los Angeles Unified School District, Series D, GO, 5.000%, 01/01/34 | | | 5,421 | |
| | 7,150 | | | Mount San Antonio Community College District, Election of 2008, Series A, GO, Zero Coupon, 08/01/43 | | | 5,095 | |
| | | | Pittsburg Unified School District, | | | | |
| | 1,025 | | | GO, 4.000%, 08/01/32 | | | 1,097 | |
| | 1,640 | | | GO, 4.000%, 08/01/36 | | | 1,711 | |
| | 50 | | | Pomona Unified School District, Series A, GO, NATL-RE, 6.100%, 02/01/20 | | | 57 | |
| | 2,690 | | | Santa Maria Joint Union High School District, Santa Barbara & San Luis Obispo, GO, Zero Coupon, 08/01/37 | | | 961 | |
| | 100 | | | Santa Monica-Malibu Unified School District, GO, 4.000%, 08/01/21 | | | 111 | |
| | 5,000 | | | State of California, Various Purpose, GO, 6.500%, 04/01/33 | | | 5,566 | |
| | | | | | | | |
| | | | | | | 20,347 | |
| | | | | | | | |
| | | | Hospital — 3.5% | |
| | 2,170 | | | California Health Facilities Financing Authority, Cedars-Sinai Medical Center, Rev., 5.000%, 11/15/28 | | | 2,559 | |
SEE NOTES TO FINANCIAL STATEMENTS.
| | | | | | |
| | | |
| 46 | | | | J.P. MORGAN MUNICIPAL BOND FUNDS | | FEBRUARY 28, 2017 |
| | | | | | | | |
PRINCIPAL
AMOUNT($) | | | SECURITY DESCRIPTION | | VALUE($) | |
| | Municipal Bonds — continued | |
| | | | Hospital — continued | |
| | 4,830 | | | California Health Facilities Financing Authority, Providence St. Joseph Health, Series A, Rev., 4.000%, 10/01/47 | | | 4,788 | |
| | 1,450 | | | California Health Facilities Financing Authority, Sutter Health, Series A, Rev., 5.000%, 11/15/41 | | | 1,606 | |
| | 750 | | | California Municipal Finance Authority, Community Medical Centers, Series A, Rev., 5.000%, 02/01/42 | | | 819 | |
| | | | California Public Finance Authority, Henry Mayo Newhall Hospital, | | | | |
| | 500 | | | Rev., 5.000%, 10/15/37 | | | 535 | |
| | 1,000 | | | Rev., 5.000%, 10/15/47 | | | 1,060 | |
| | | | | | | | |
| | | | | | | 11,367 | |
| | | | | | | | |
| | | | Other Revenue — 0.4% | |
| | 1,280 | | | San Francisco Bay Area Rapid Transit District, Sales Tax, Series A, Rev., 4.000%, 07/01/33 | | | 1,362 | |
| | | | | | | | |
| | | | Prerefunded — 3.2% | |
| | 40 | | | California Health Facilities Financing Authority, Providence Health & Services, Series C, Rev., 6.500%, 10/01/18 (p) | | | 43 | |
| | 1,960 | | | California Health Facilities Financing Authority, Unrefunded Balance, Providence Health & Services, Series C, Rev., 6.500%, 10/01/18 (p) | | | 2,134 | |
| | 7,500 | | | San Diego Public Facilities Financing Authority, Senior Sewer, Series A, Rev., 5.250%, 05/15/19 (p) | | | 8,200 | |
| | | | | | | | |
| | | | | | | 10,377 | |
| | | | | | | | |
| | | | Transportation — 1.1% | |
| | 1,250 | | | City of Los Angeles, Department of Airports, Series A, Rev., AMT, 5.000%, 05/15/38 | | | 1,384 | |
| | 1,000 | | | Los Angeles County Metropolitan Transportation Authority, Union Station Gateway Project, Rev., 5.000%, 07/01/27 | | | 1,197 | |
| | 805 | | | Los Angeles Harbor Department, Rev., 7.600%, 10/01/18 (p) | | | 859 | |
| | | | | | | | |
| | | | | | | 3,440 | |
| | | | | | | | |
| | | | Utility — 3.6% | |
| | | | City of Los Angeles, Department of Water & Power, Power System, | | | | |
| | 1,700 | | | Series A, Rev., 5.000%, 07/01/35 | | | 1,983 | |
| | 375 | | | Series B, Rev., 5.000%, 07/01/36 | | | 431 | |
| | 610 | | | Series D, Rev., 5.000%, 07/01/33 | | | 701 | |
| | 2,500 | | | Subseries A-1, Rev., 5.250%, 07/01/38 | | | 2,641 | |
| | 2,450 | | | East Bay Municipal Utility District, Wastewater System, Series A, Rev., 5.000%, 06/01/36 | | | 2,825 | |
| | | | | | | | |
PRINCIPAL
AMOUNT($) | | | SECURITY DESCRIPTION | | VALUE($) | |
| | | | | | | | |
| | | | Utility — continued | |
| | 2,000 | | | Long Beach Bond Finance Authority, Natural Gas, Series A, Rev., 5.250%, 11/15/21 | | | 2,243 | |
| | 595 | | | Northern California Transmission Agency, Transmission Project, Series A, Rev., 5.000%, 05/01/31 | | | 696 | |
| | | | | | | | |
| | | | | | | 11,520 | |
| | | | | | | | |
| | | | Water & Sewer — 1.8% | |
| | 515 | | | East Bay Municipal Utility District Water System, Green Bonds, Series B, Rev., 5.000%, 06/01/33 | | | 600 | |
| | 3,000 | | | Metropolitan Water District of Southern California, Series A, Rev., 5.000%, 07/01/32 | | | 3,042 | |
| | | | Orange County Water District, | | | | |
| | 1,145 | | | Series A, Rev., 5.000%, 08/15/29 | | | 1,387 | |
| | 650 | | | Series A, Rev., 5.000%, 08/15/34 | | | 768 | |
| | | | | | | | |
| | | | | | | 5,797 | |
| | | | | | | | |
| | | | Total California | | | 67,928 | |
| | | | | | | | |
| | | | Colorado — 4.4% | |
| | | | Certificate of Participation/Lease — 2.2% | |
| | 4,655 | | | Adams County, Colorado Refunding & Improvement, COP, 4.000%, 12/01/40 | | | 4,741 | |
| | 2,000 | | | State of Colorado, Building Excellent Schools Today, Series G, COP, 5.000%, 03/15/32 | | | 2,218 | |
| | | | | | | | |
| | | | | | | 6,959 | |
| | | | | | | | |
| | | | Education — 0.0% (g) | |
| | 150 | | | Board of Governors of the University of Colorado, Enterprise System, Series E-1, Rev., 5.000%, 03/01/35 | | | 170 | |
| | | | | | | | |
| | | | Hospital — 1.0% | |
| | 2,130 | | | Colorado Health Facilities Authority, Vail Valley Medical Centre Project, Rev., 4.000%, 01/15/45 | | | 2,134 | |
| | 1,000 | | | Denver Health & Hospital Authority, Series A, Rev., 5.250%, 12/01/45 | | | 1,050 | |
| | | | | | | | |
| | | | | | | 3,184 | |
| | | | | | | | |
| | | | Prerefunded — 1.2% | |
| | | | Colorado Water Resources & Power Development Authority, Water & Wastewater Utility Enterprise Project, | | | | |
| | 1,000 | | | Series A, Rev., AGC, 5.125%, 12/01/18 (p) | | | 1,073 | |
| | 1,000 | | | Series A, Rev., AGC, 5.250%, 12/01/18 (p) | | | 1,075 | |
| | 1,500 | | | University of Colorado, University Enterprise, Series A, Rev., 5.375%, 06/01/19 (p) | | | 1,643 | |
| | | | | | | | |
| | | | | | | 3,791 | |
| | | | | | | | |
| | | | Total Colorado | | | 14,104 | |
| | | | | | | | |
SEE NOTES TO FINANCIAL STATEMENTS.
| | | | | | | | |
| | | |
| FEBRUARY 28, 2017 | | J.P. MORGAN MUNICIPAL BOND FUNDS | | | | | 47 | |
JPMorgan Tax Free Bond Fund
SCHEDULE OF PORTFOLIO INVESTMENTS
AS OF FEBRUARY 28, 2017 (continued)
(Amounts in thousands)
| | | | | | | | |
PRINCIPAL
AMOUNT($) | | | SECURITY DESCRIPTION | | VALUE($) | |
| | Municipal Bonds — continued | |
| | | | Delaware — 0.5% | |
| | | | Education — 0.3% | |
| | | | The Delaware Economic Development Authority, Newark Charter School, Inc. Project, | | | | |
| | 500 | | | Series A, Rev., 5.000%, 09/01/36 | | | 516 | |
| | 500 | | | Series A, Rev., 5.000%, 09/01/46 | | | 511 | |
| | | | | | | | |
| | | | | | | 1,027 | |
| | | | | | | | |
| | | | Hospital — 0.2% | |
| | 555 | | | Delaware State Economic Development Authority, Osteopathic Hospital Association, Series A, Rev., 6.900%, 01/01/18 (p) | | | 579 | |
| | | | | | | | |
| | | | Total Delaware | | | 1,606 | |
| | | | | | | | |
| | | | District of Columbia — 1.7% | |
| | | | Education — 0.3% | |
| | | | District of Columbia, | | | | |
| | 500 | | | Series A, Rev., 6.000%, 07/01/43 | | | 574 | |
| | 500 | | | Series A, Rev., 6.000%, 07/01/48 | | | 573 | |
| | | | | | | | |
| | | | | | | 1,147 | |
| | | | | | | | |
| | | | General Obligation — 1.4% | |
| | 3,965 | | | District of Columbia, Series B, GO, NATL-RE, 6.000%, 06/01/19 | | | 4,396 | |
| | | | | | | | |
| | | | Total District of Columbia | | | 5,543 | |
| | | | | | | | |
| | | | Florida — 3.0% | |
| | | | General Obligation — 0.9% | |
| | 2,415 | | | Hillsborough County, Parks & Recreation Program, GO, NATL-RE, 5.250%, 07/01/25 | | | 2,971 | |
| | | | | | | | |
| | | | Hospital — 0.1% | |
| | 215 | | | Orange County Health Facilities Authority, Series B, Rev., 4.000%, 10/01/45 | | | 210 | |
| | | | | | | | |
| | | | Transportation — 1.1% | |
| | 3,205 | | | Hillsborough County Aviation Authority, Tampa International Airport, Series B, Rev., NATL-RE, 6.000%, 10/01/18 | | | 3,436 | |
| | | | | | | | |
| | | | Utility — 0.9% | |
| | 2,820 | | | Tohopekaliga Water Authority, Utility System Revenue, Series A, Rev., 4.000%, 10/01/41 | | | 2,920 | |
| | | | | | | | |
| | | | Total Florida | | | 9,537 | |
| | | | | | | | |
| | | | Georgia — 1.4% | |
| | | | Hospital — 1.4% | |
| | 3,845 | | | Dalton Development Authority, Hamilton Health Care System, Rev., NATL-RE, 5.500%, 08/15/26 | | | 4,448 | |
| | | | | | | | |
| | | | | | | | |
PRINCIPAL
AMOUNT($) | | | SECURITY DESCRIPTION | | VALUE($) | |
| | | | | | | | |
| | | | Hawaii — 0.8% | |
| | | | General Obligation — 0.8% | |
| | 2,370 | | | City & County of Honolulu, Series A, GO, 5.000%, 10/01/37 | | | 2,702 | |
| | | | | | | | |
| | | | Illinois — 3.1% | |
| | | | Education — 0.6% | |
| | 1,750 | | | Chicago Public Building Commission, Board of Education, Series A, Rev., NATL-RE, 7.000%, 01/01/20 (p) | | | 1,971 | |
| | | | | | | | |
| | | | General Obligation — 1.1% | |
| | 355 | | | Cook County Forest Preserve District, Limited Tax Project, Series B, GO, 5.000%, 12/15/37 | | | 377 | |
| | 3,000 | | | State of Illinois, GO, 5.500%, 07/01/38 | | | 3,120 | |
| | | | | | | | |
| | | | | | | 3,497 | |
| | | | | | | | |
| | | | Transportation — 1.4% | |
| | 1,500 | | | Chicago O’Hare International Airport, General Airport, Third Lien, Series A, Rev., NATL-RE, 5.750%, 01/01/39 | | | 1,688 | |
| | 2,580 | | | Regional Transportation Authority, Series D, Rev., NATL-RE, 7.750%, 06/01/19 | | | 2,789 | |
| | | | | | | | |
| | | | | | | 4,477 | |
| | | | | | | | |
| | | | Total Illinois | | | 9,945 | |
| | | | | | | | |
| | | | Indiana — 1.4% | |
| | | | Other Revenue — 1.4% | |
| | 4,000 | | | Indiana Finance Authority, State Revolving Fund Program, Series A, Rev., 5.000%, 02/01/30 | | | 4,477 | |
| | | | | | | | |
| | | | Kentucky — 1.4% | |
| | | | Education — 1.4% | |
| | | | Oldham County, Kentucky School District Finance Corp., School Building, | | | | |
| | 1,760 | | | Rev., 5.000%, 06/01/26 | | | 2,074 | |
| | 2,000 | | | Rev., 5.000%, 06/01/27 | | | 2,371 | |
| | | | | | | | |
| | | | Total Kentucky | | | 4,445 | |
| | | | | | | | |
| | | | Louisiana — 0.7% | |
| | | | Hospital — 0.4% | |
| | 1,150 | | | Louisiana Public Facilities Authority, Ochsner Clinic Foundation Project, Rev., 5.000%, 05/15/47 | | | 1,231 | |
| | | | | | | | |
| | | | Other Revenue — 0.3% | |
| | 1,000 | | | Tobacco Settlement Financing Corp., Asset-Backed, Series A, Rev., 5.250%, 05/15/35 | | | 1,087 | |
| | | | | | | | |
| | | | Total Louisiana | | | 2,318 | |
| | | | | | | | |
SEE NOTES TO FINANCIAL STATEMENTS.
| | | | | | |
| | | |
| 48 | | | | J.P. MORGAN MUNICIPAL BOND FUNDS | | FEBRUARY 28, 2017 |
| | | | | | | | |
PRINCIPAL
AMOUNT($) | | | SECURITY DESCRIPTION | | VALUE($) | |
| | Municipal Bonds — continued | |
| | | | Maine — 2.0% | |
| | | | Prerefunded — 2.0% | |
| | 5,675 | | | Maine Turnpike Authority, Rev., 6.000%, 07/01/19 (p) | | | 6,319 | |
| | | | | | | | |
| | | | Maryland — 0.5% | |
| | | | General Obligation — 0.5% | |
| | 1,420 | | | Baltimore County, Consolidated Public Improvement, GO, 5.000%, 08/01/26 | | | 1,719 | |
| | | | | | | | |
| | | | Massachusetts — 2.2% | |
| | | | General Obligation — 2.1% | |
| | 1,500 | | | Commonwealth of Massachusetts, Series A, GO, 5.000%, 03/01/32 | | | 1,709 | |
| | 5,000 | | | Commonwealth of Massachusetts, Consolidated Loan of 2016, Series J, GO, 4.000%, 12/01/39 | | | 5,138 | |
| | | | | | | | |
| | | | | | | 6,847 | |
| | | | | | | | |
| | | | Water & Sewer — 0.1% | |
| | 80 | | | Massachusetts Water Pollution Abatement Trust, Pool Program, Rev., 5.250%, 08/01/28 | | | 100 | |
| | | | | | | | |
| | | | Total Massachusetts | | | 6,947 | |
| | | | | | | | |
| | | | Michigan — 0.5% | |
| | | | Transportation — 0.5% | |
| | 1,500 | | | Michigan State Trunk Line, Rev., 5.000%, 11/15/36 | | | 1,678 | |
| | | | | | | | |
| | | | Minnesota — 0.2% | |
| | | | Utility — 0.2% | |
| | | | City of Rochester, Electric Utility, | | | | |
| | 100 | | | Series A, Rev., 5.000%, 12/01/27 | | | 120 | |
| | 400 | | | Series A, Rev., 5.000%, 12/01/28 | | | 477 | |
| | | | | | | | |
| | | | Total Minnesota | | | 597 | |
| | | | | | | | |
| | | | Mississippi — 0.4% | |
| | | | Water & Sewer — 0.4% | |
| | 1,000 | | | Mississippi Development Bank, Water & Sewer System Project, Special Obligation, Rev., AGM, 6.875%, 12/01/40 | | | 1,275 | |
| | | | | | | | |
| | | | Montana — 0.1% | |
| | | | Prerefunded — 0.1% | |
| | 400 | | | City of Helena, COP, 5.000%, 01/01/19 (p) | | | 429 | |
| | | | | | | | |
| | | | Nebraska — 0.2% | |
| | | | Utility — 0.2% | |
| | | | Public Power Generation Agency, Whelan Energy Center Unit 2, | | | | |
| | 185 | | | Series A, Rev., 5.000%, 01/01/34 | | | 207 | |
| | 280 | | | Series A, Rev., 5.000%, 01/01/41 | | | 310 | |
| | | | | | | | |
| | | | Total Nebraska | | | 517 | |
| | | | | | | | |
| | | | | | | | |
PRINCIPAL
AMOUNT($) | | | SECURITY DESCRIPTION | | VALUE($) | |
| | | | | | | | |
| | | | New Jersey — 2.2% | |
| | | | Housing — 0.1% | |
| | 505 | | | New Jersey Housing & Mortgage Finance Agency, Single Family Housing, Series AA, Rev., 6.375%, 10/01/28 | | | 521 | |
| | | | | | | | |
| | | | Transportation — 2.1% | |
| | 10,355 | | | New Jersey Transportation Trust Fund Authority, Capital Appreciation, Transportation Systems, Series A, Rev., Zero Coupon, 12/15/36 | | | 3,620 | |
| | 2,870 | | | New Jersey Transportation Trust Fund Authority, Federal Highway Reimbursement, Series A-1, Rev., 5.000%, 06/15/27 | | | 3,091 | |
| | | | | | | | |
| | | | | | | 6,711 | |
| | | | | | | | |
| | | | Total New Jersey | | | 7,232 | |
| | | | | | | | |
| | | | New York — 13.0% | |
| | | | Education — 0.4% | |
| | 1,025 | | | State Dormitory Authority, New York University, Series A, Rev., 5.000%, 07/01/28 | | | 1,231 | |
| | | | | | | | |
| | | | General Obligation — 0.2% | |
| | 820 | | | Gorham-Middlesex Central School District, GO, 3.000%, 06/15/21 | | | 869 | |
| | | | | | | | |
| | | | Other Revenue — 3.6% | |
| | | | Brooklyn Arena Local Development Corp., Pilot Refunding, Barclays Center, | | | | |
| | 625 | | | Series A, Rev., 5.000%, 07/15/26 | | | 718 | |
| | 565 | | | Series A, Rev., 5.000%, 07/15/28 | | | 644 | |
| | 295 | | | New York City Transitional Finance Authority, Future Tax Secured, Fiscal Year 2012, Subseries E-1, Rev., 5.000%, 02/01/35 | | | 331 | |
| | | | New York Convention Center Development Corp., Subordinated Lien Hotel Unit fee, | | | | |
| | 2,000 | | | Series B, Rev., Zero Coupon, 11/15/36 | | | 872 | |
| | 10,000 | | | Series B, Rev., Zero Coupon, 11/15/55 | | | 1,730 | |
| | 7,500 | | | Series B, Rev., Zero Coupon, 11/15/56 | | | 1,242 | |
| | | | New York Counties Tobacco Trust VI Tobacco Settlement Pass-Through Bonds, | | | | |
| | 300 | | | Series B, Rev., 5.000%, 06/01/25 | | | 350 | |
| | 150 | | | Series B, Rev., 5.000%, 06/01/28 | | | 170 | |
| | 155 | | | Series B, Rev., 5.000%, 06/01/29 | | | 172 | |
| | 4,450 | | | New York State Dormitory Authority, Sales Tax, Series A, Rev., 5.000%, 03/15/26 | | | 5,348 | |
| | | | | | | | |
| | | | | | | 11,577 | |
| | | | | | | | |
| | | | Prerefunded — 0.4% | |
| | 1,150 | | | New York City Municipal Water Finance Authority, Water & Sewer System, Series A, Rev., 5.750%, 06/15/18 (p) | | | 1,223 | |
| | | | | | | | |
SEE NOTES TO FINANCIAL STATEMENTS.
| | | | | | | | |
| | | |
| FEBRUARY 28, 2017 | | J.P. MORGAN MUNICIPAL BOND FUNDS | | | | | 49 | |
JPMorgan Tax Free Bond Fund
SCHEDULE OF PORTFOLIO INVESTMENTS
AS OF FEBRUARY 28, 2017 (continued)
(Amounts in thousands)
| | | | | | | | |
PRINCIPAL
AMOUNT($) | | | SECURITY DESCRIPTION | | VALUE($) | |
| | Municipal Bonds — continued | |
| | | | Transportation — 5.7% | |
| | | | Metropolitan Transportation Authority, | | | | |
| | 250 | | | Series D, Rev., 5.000%, 11/15/29 | | | 293 | |
| | 400 | | | Series D, Rev., 5.000%, 11/15/30 | | | 467 | |
| | 400 | | | Series D, Rev., 5.000%, 11/15/31 | | | 465 | |
| | 2,750 | | | MTA Hudson Rail Yards Trust Obligations, Series A, Rev., 5.000%, 11/15/46 | | | 2,944 | |
| | 11,725 | | | Port Authority of New York & New Jersey, Consolidated, 93rd Series, Rev., 6.125%, 06/01/94 | | | 14,124 | |
| | | | | | | | |
| | | | | | | 18,293 | |
| | | | | | | | |
| | | | Utility — 1.5% | |
| | 4,250 | | | Utility Debt Securitization Authority, Series TE, Rev., 5.000%, 12/15/41 | | | 4,859 | |
| | | | | | | | |
| | | | Water & Sewer — 1.2% | |
| | | | New York City Municipal Water Finance Authority, Water & Sewer System, | | | | |
| | 320 | | | Series A, Rev., 4.500%, 06/15/32 | | | 358 | |
| | 3,030 | | | Series A, Rev., 5.750%, 06/15/40 | | | 3,211 | |
| | | | Water Authority of Great Neck North, New York Water System, | | | | |
| | 200 | | | Series A, Rev., 4.000%, 01/01/29 | | | 223 | |
| | 35 | | | Series A, Rev., 4.000%, 01/01/30 | | | 39 | |
| | 130 | | | Series A, Rev., 4.000%, 01/01/33 | | | 141 | |
| | | | | | | | |
| | | | | | | 3,972 | |
| | | | | | | | |
| | | | Total New York | | | 42,024 | |
| | | | | | | | |
| | | | North Dakota — 0.0% (g) | |
| | | | General Obligation — 0.0% (g) | |
| | 30 | | | West Fargo Public School District No. 6, Series A, GO, 3.000%, 05/01/25 | | | 31 | |
| | | | | | | | |
| | | | Ohio — 2.1% | |
| | | | Education — 0.6% | |
| | | | Miami University, A State University of Ohio, | | | | |
| | 375 | | | Rev., 5.000%, 09/01/29 | | | 443 | |
| | 500 | | | Rev., 5.000%, 09/01/30 | | | 588 | |
| | 650 | | | Rev., 5.000%, 09/01/31 | | | 759 | |
| | | | | | | | |
| | | | | | | 1,790 | |
| | | | | | | | |
| | | | General Obligation — 0.7% | |
| | | | Greenville City School District, School Improvement, | | | | |
| | 1,000 | | | GO, 5.250%, 01/01/38 | | | 1,106 | |
| | 1,000 | | | GO, 5.250%, 01/01/41 | | | 1,106 | |
| | | | | | | | |
| | | | | | | 2,212 | |
| | | | | | | | |
| | | | | | | | |
PRINCIPAL
AMOUNT($) | | | SECURITY DESCRIPTION | | VALUE($) | |
| | | | | | | | |
| | | | Hospital — 0.3% | |
| | 1,000 | | | County of Warren, Otterbein Homes Obligated Group, Healthcare Facilities, Series A, Rev., 5.500%, 07/01/39 | | | 1,101 | |
| | | | | | | | |
| | | | Prerefunded — 0.5% | |
| | | | County of Richland, Correctional Facilities Improvement, | | | | |
| | 500 | | | GO, AGC, 5.875%, 12/01/18 (p) | | | 543 | |
| | 400 | | | GO, AGC, 6.000%, 12/01/18 (p) | | | 436 | |
| | 650 | | | GO, AGC, 6.125%, 12/01/18 (p) | | | 709 | |
| | | | | | | | |
| | | | | | | 1,688 | |
| | | | | | | | |
| | | | Total Ohio | | | 6,791 | |
| | | | | | | | |
| | | | Oklahoma — 2.0% | |
| | | | Other Revenue — 0.7% | |
| | 2,400 | | | The Edmond Public Works Authority, Sales Tax And Utility System, Rev., 4.000%, 07/01/41 | | | 2,472 | |
| | | | | | | | |
| | | | Prerefunded — 0.7% | |
| | 2,000 | | | Oklahoma City Water Utilities Trust, Water & Sewer System, Series A, Rev., 5.000%, 07/01/19 (p) | | | 2,181 | |
| | | | | | | | |
| | | | Transportation — 0.6% | |
| | 1,665 | | | Oklahoma Turnpike Authority, Turnpike System, Second Senior, Series A, Rev., 5.000%, 01/01/37 | | | 1,882 | |
| | | | | | | | |
| | | | Total Oklahoma | | | 6,535 | |
| | | | | | | | |
| | | | Oregon — 0.3% | |
| | | | Water & Sewer — 0.3% | |
| | 700 | | | City of Portland, Sewer System, First Lien, Series A, Rev., 5.000%, 06/01/26 | | | 836 | |
| | | | | | | | |
| | | | Pennsylvania — 0.4% | |
| | | | Education — 0.0% (g) | |
| | 85 | | | University of Pittsburgh — of the Commonwealth System of Higher Education, University Capital Project, Series A, Rev., 4.000%, 09/15/36 | | | 89 | |
| | | | | | | | |
| | | | General Obligation — 0.1% | |
| | 225 | | | County of Allegheny Pennsylvania, Series C, GO, 5.000%, 11/01/23 | | | 264 | |
| | | | | | | | |
| | | | Hospital — 0.3% | |
| | | | Lancaster County Hospital Authority, Health Center, Masonic Villages Project, | | | | |
| | 510 | | | Rev., 5.000%, 11/01/36 | | | 557 | |
| | 250 | | | Rev., 5.000%, 11/01/37 | | | 273 | |
| | | | | | | | |
| | | | | | | 830 | |
| | | | | | | | |
| | | | Total Pennsylvania | | | 1,183 | |
| | | | | | | | |
SEE NOTES TO FINANCIAL STATEMENTS.
| | | | | | |
| | | |
| 50 | | | | J.P. MORGAN MUNICIPAL BOND FUNDS | | FEBRUARY 28, 2017 |
| | | | | | | | |
PRINCIPAL
AMOUNT($) | | | SECURITY DESCRIPTION | | VALUE($) | |
| | Municipal Bonds — continued | |
| | | | South Carolina — 6.5% | |
| | | | General Obligation — 0.2% | |
| | 430 | | | Anderson County South Carolina School District No. 5, GO, SCSDE, 5.000%, 03/01/27 | | | 516 | |
| | | | | | | | |
| | | | Prerefunded — 3.2% | |
| | 9,515 | | | Laurens County School District No. 056, GO, AGC, SCSDE, 6.125%, 03/01/19 (p) | | | 10,481 | |
| | | | | | | | |
| | | | Utility — 3.0% | |
| | 3,900 | | | Piedmont Municipal Power Agency, Electric, Rev., FGIC, 6.750%, 01/01/20 (p) | | | 4,500 | |
| | 4,615 | | | Piedmont Municipal Power Agency, Electric, Unrefunded Balance, Rev., NATL-RE, 6.750%, 01/01/20 | | | 5,270 | |
| | | | | | | | |
| | | | | | | 9,770 | |
| | | | | | | | |
| | | | Water & Sewer — 0.1% | |
| | 295 | | | City of Anderson, South Carolina Water & Sewer System, Rev., 5.000%, 07/01/29 | | | 347 | |
| | | | | | | | |
| | | | Total South Carolina | | | 21,114 | |
| | | | | | | | |
| | | | South Dakota — 0.1% | |
| | | | Other Revenue — 0.1% | |
| | 300 | | | South Dakota State Building Authority, Series A, Rev., 5.000%, 06/01/22 | | | 348 | |
| | | | | | | | |
| | | | Tennessee — 0.0% (g) | |
| | | | General Obligation — 0.0% (g) | |
| | 110 | | | Franklin Special School District, Limited Tax School Refunding & Improvement, GO, 5.000%, 06/01/31 | | | 128 | |
| | | | | | | | |
| | | | Texas — 8.5% | |
| | | | Education — 2.1% | |
| | | | Clifton Higher Education Finance Corp., Idea Public Schools, | | | | |
| | 1,250 | | | Rev., 6.000%, 08/15/33 | | | 1,422 | |
| | 500 | | | Series B, Rev., 4.000%, 08/15/23 | | | 528 | |
| | 345 | | | Series B, Rev., 5.000%, 08/15/24 | | | 387 | |
| | 460 | | | Series B, Rev., 5.000%, 08/15/25 | | | 517 | |
| | | | Tarrant County Cultural Education Facilities Finance Corp., Hendrick Medical Center, Hospital, | | | | |
| | 1,000 | | | Rev., 5.125%, 09/01/33 | | | 1,099 | |
| | 2,300 | | | Rev., 5.500%, 09/01/43 | | | 2,539 | |
| | 210 | | | University of Texas System, Series A, Rev., 5.000%, 07/01/31 | | | 246 | |
| | | | | | | | |
| | | | | | | 6,738 | |
| | | | | | | | |
| | | | General Obligation — 0.2% | |
| | 535 | | | City of Carrollton, GO, 5.000%, 08/15/26 | | | 581 | |
| | | | | | | | |
| | | | | | | | |
PRINCIPAL
AMOUNT($) | | | SECURITY DESCRIPTION | | VALUE($) | |
| | | | | | | | |
| | | | Hospital — 0.4% | |
| | 1,375 | | | Harris County Health Facilities Development Corp., Texas Children’s Hospital Project, Rev., 5.500%, 10/01/19 (p) | | | 1,468 | |
| | | | | | | | |
| | | | Prerefunded — 3.3% | |
| | 4,435 | | | Canyon Regional Water Authority, Wells Ranch Project, Rev., AMBAC, 5.125%, 08/01/17 (p) | | | 4,519 | |
| | 2,200 | | | City of Forney, Independent School District, Series A, GO, PSF-GTD, 5.750%, 08/15/18 (p) | | | 2,354 | |
| | 3,500 | | | Harris County Health Facilities Development Corp., Memorial Hermann Healthcare System, Series B, Rev., 7.250%, 12/01/18 (p) | | | 3,882 | |
| | | | | | | | |
| | | | | | | 10,755 | |
| | | | | | | | |
| | | | Transportation — 1.4% | |
| | 1,965 | | | Dallas-Fort Worth International Airport, Joint Improvement, Series A, Rev., 5.000%, 11/01/42 | | | 2,159 | |
| | 2,000 | | | North Texas Tollway Authority, Special Projects System, Series A, Rev., 6.000%, 09/01/41 | | | 2,343 | |
| | | | | | | | |
| | | | | | | 4,502 | |
| | | | | | | | |
| | | | Utility — 0.0% (g) | |
| | 35 | | | City of San Antonio, Electric & Gas Systems, Rev., 5.000%, 02/01/32 | | | 41 | |
| | | | | | | | |
| | | | Water & Sewer — 1.1% | |
| | 2,500 | | | City of Houston, Water & Sewer System, Junior Lien, Series A, Rev., AGM, 5.750%, 12/01/32 (p) | | | 3,419 | |
| | | | | | | | |
| | | | Total Texas | | | 27,504 | |
| | | | | | | | |
| | | | Utah — 0.5% | |
| | | | Other Revenue — 0.5% | |
| | 1,270 | | | Municipal Building Authority of West Valley City, Rev., AGM, 5.000%, 02/01/27 | | | 1,476 | |
| | 110 | | | Utah Infrastructure Agency Telecommunications And Franchise Tax, Rev., 4.000%, 10/15/40 | | | 113 | |
| | | | | | | | |
| | | | Total Utah | | | 1,589 | |
| | | | | | | | |
| | | | Virginia — 0.5% | |
| | | | Transportation — 0.5% | |
| | | | Capital Region Airport Commission (Richmond International Airport), | | | | |
| | 350 | | | Series A, Rev., 4.000%, 07/01/35 | | | 365 | |
| | 350 | | | Series A, Rev., 4.000%, 07/01/36 | | | 365 | |
| | 750 | | | Series A, Rev., 4.000%, 07/01/38 | | | 780 | |
| | | | | | | | |
| | | | Total Virginia | | | 1,510 | |
| | | | | | | | |
| | | | | | | | |
SEE NOTES TO FINANCIAL STATEMENTS.
| | | | | | | | |
| | | |
| FEBRUARY 28, 2017 | | J.P. MORGAN MUNICIPAL BOND FUNDS | | | | | 51 | |
JPMorgan Tax Free Bond Fund
SCHEDULE OF PORTFOLIO INVESTMENTS
AS OF FEBRUARY 28, 2017 (continued)
(Amounts in thousands, except number of Futures contracts)
| | | | | | | | |
PRINCIPAL
AMOUNT($) | | | SECURITY DESCRIPTION | | VALUE($) | |
| | Municipal Bonds — continued | |
| | | | Washington — 3.9% | |
| | | | Education — 1.9% | |
| | 5,430 | | | Western Washington University, Housing & Dining System, Junior Lien, Series A, Rev., AMBAC, 5.500%, 10/01/22 | | | 6,193 | |
| | | | | | | | |
| | | | General Obligation — 0.4% | |
| | 1,000 | | | State of Washington, Various Purpose, Series C, GO, 5.000%, 02/01/34 | | | 1,148 | |
| | | | | | | | |
| | | | | | | | |
| | | | Prerefunded — 1.6% | |
| | 5,000 | | | Washington Health Care Facilities Authority, Multicare Health System, Series A, Rev., AGM, 5.000%, 08/15/18 (p) | | | 5,296 | |
| | | | | | | | |
| | | | Total Washington | | | 12,637 | |
| | | | | | | | |
| | | | Total Municipal Bonds
(Cost $276,538) | | | 292,216 | |
| | | | | | | | |
| | | | | | | | |
SHARES | | | SECURITY DESCRIPTION | | VALUE($) | |
| | Short-Term Investment — 5.2% | | | | |
| | | | Investment Company — 5.2% | | | | |
| | 16,638 | | | JPMorgan U.S. Government Money Market Fund, Institutional Class Shares, 0.450% (b) (l)
(Cost $16,638) | | | 16,638 | |
| | | | | | | | |
| | | | Total Investments — 98.9%
(Cost $303,176) | | | 318,854 | |
| | | | Other Assets in Excess of
Liabilities — 1.1% | | | 3,541 | |
| | | | | | | | |
| | | | NET ASSETS — 100.0% | | $ | 322,395 | |
| | | | | | | | |
Percentages indicated are based on net assets.
| | | | | | | | | | | | | | | | | | | | |
| Futures Contracts | | | | | | | | | | | | |
NUMBER OF
CONTRACTS | | | DESCRIPTION | | EXPIRATION
DATE | | | TRADING
CURRENCY | | | NOTIONAL
VALUE AT
FEBRUARY 28, 2017 | | | NET UNREALIZED
APPRECIATION
(DEPRECIATION) | |
| | | | Short Futures Outstanding | | | | | | | | | | | | | | | | |
| | (63 | ) | | 10 Year U.S. Treasury Note | | | 06/21/17 | | | | USD | | | $ | (7,848 | ) | | $ | (16 | ) |
| | | | | | | | | | | | | | | | | | | | |
SEE NOTES TO FINANCIAL STATEMENTS.
| | | | | | |
| | | |
| 52 | | | | J.P. MORGAN MUNICIPAL BOND FUNDS | | FEBRUARY 28, 2017 |
JPMorgan Ultra-Short Municipal Fund
SCHEDULE OF PORTFOLIO INVESTMENTS
AS OF FEBRUARY 28, 2017
(Amounts in thousands)
| | | | | | | | |
PRINCIPAL
AMOUNT($) | | | SECURITY DESCRIPTION | | VALUE($) | |
| | | | | | | | |
| | Daily Demand Notes — 4.0% | |
| | | | Florida — 0.6% | |
| | | | Industrial Development Revenue/Pollution Control Revenue — 0.6% | |
| | 200 | | | Township of Jackson, Gulf Power Co., Project, Rev., VRDO, 0.670%, 03/01/17 | | | 200 | |
| | | | | | | | |
| | | | Georgia — 0.9% | |
| | | | Industrial Development Revenue/Pollution Control Revenue — 0.9% | |
| | 300 | | | Burke County Development Authority, Power Company Plant Vogtle Project, Rev., VRDO, 0.640%, 03/01/17 | | | 300 | |
| | | | | | | | |
| | | | Louisiana — 0.5% | |
| | | | Industrial Development Revenue/Pollution Control Revenue — 0.5% | |
| | 150 | | | St. Charles Parish, Pollution Control, Shell Oil Co. Project, Series B, Rev., VRDO, 0.550%, 03/01/17 | | | 150 | |
| | | | | | | | |
| | | | Maryland — 0.6% | |
| | | | Education — 0.6% | |
| | 200 | | | Maryland Health & Higher Educational Facilities Authority, University of Maryland Medical System Issue, Series D, Rev., VRDO, LOC: TD Bank NA, 0.500%, 03/01/17 | | | 200 | |
| | | | | | | | |
| | | | Minnesota — 0.5% | |
| | | | Housing — 0.5% | |
| | 150 | | | City of Minneapolis, St. Paul Housing & Redevelopment Authority, Children Health Care Facilities, Series A, Rev., VRDO, AGM, 0.520%, 03/01/17 | | | 150 | |
| | | | | | | | |
| | | | Missouri — 0.3% | |
| | | | Education — 0.3% | |
| | 100 | | | Missouri State Health & Educational Facilities Authority, Variable Rate Demand Educational Facilities, Series C, Rev., VRDO, 0.520%, 03/01/17 | | | 100 | |
| | | | | | | | |
| | | | New Hampshire — 0.3% | |
| | | | Education — 0.3% | |
| | 100 | | | New Hampshire Health & Educational Facilities Authority, University System, Series B, Rev., VRDO, LIQ: State Street Bank & Trust, 0.510%, 03/01/17 | | | 100 | |
| | | | | | | | |
| | | | Texas — 0.3% | |
| | | | Industrial Development Revenue/Pollution Control Revenue — 0.3% | |
| | 100 | | | Lower Neches Valley Authority Industrial Development Corp., Exempt Facilities, Mobil Oil Corp. Project, Series 2012, Rev., VRDO, 0.490%, 03/01/17 | | | 100 | |
| | | | | | | | |
| | | | Total Daily Demand Notes
(Cost $1,300) | | | 1,300 | |
| | | | | | | | |
| | | | | | | | |
PRINCIPAL
AMOUNT($) | | | SECURITY DESCRIPTION | | VALUE($) | |
| | | | | | | | |
| | Monthly Demand Note — 0.6% | | | | |
| | | | Pennsylvania — 0.6% | |
| | | | Transportation — 0.6% | |
| | 200 | | | Pennsylvania Turnpike Commission, Series A-1, Rev., VAR, 1.149%, 04/03/17
(Cost $200) | | | 200 | |
| | | | | | | | |
| | Municipal Bonds — 77.1% (t) | | | | |
| | | | Alabama — 3.5% | |
| | | | Education — 1.7% | |
| | 550 | | | Jacksonville State University, Tuition & Fee, Rev., AGM, 2.000%, 12/01/17 | | | 554 | |
| | | | | | | | |
| | | | Utility — 1.3% | |
| | 400 | | | The Black Belt Energy Gas District Gas Supply, Series A, Rev., VAR, LIQ: Royal Bank of Canada, 4.000%, 06/01/21 | | | 431 | |
| | | | | | | | |
| | | | Water & Sewer — 0.5% | |
| | 150 | | | Ozark Utilities Board, Water & Sewer, Rev., AGM, 2.000%, 09/01/17 | | | 151 | |
| | | | | | | | |
| | | | Total Alabama | | | 1,136 | |
| | | | | | | | |
| | | | Alaska — 0.6% | |
| | | | General Obligation — 0.4% | |
| | 25 | | | Borough of North Slope, Series A, GO, 4.000%, 06/30/17 | | | 25 | |
| | 100 | | | Municipality of Anchorage, Series B, GO, 5.000%, 08/01/17 | | | 102 | |
| | | | | | | | |
| | | | | | | 127 | |
| | | | | | | | |
| | | | Housing — 0.1% | |
| | 25 | | | Alaska Housing Finance Corp., General Mortgage, Series A, Rev., 1.650%, 12/01/17 | | | 25 | |
| | | | | | | | |
| | | | Prerefunded — 0.1% | |
| | 50 | | | Alaska Rail Road Corp., Capital Grant Receipts, Rev., NATL-RE, 5.000%, 08/01/17 (p) | | | 51 | |
| | | | | | | | |
| | | | Total Alaska | | | 203 | |
| | | | | | | | |
| | | | Arizona — 1.3% | |
| | | | General Obligation — 0.4% | |
| | 115 | | | Summit Fire & Medical District, GO, 2.000%, 07/01/18 | | | 116 | |
| | 25 | | | Town of Gilbert, Projects of 2006 & 2007, GO, 5.000%, 07/01/17 | | | 26 | |
| | | | | | | | |
| | | | | | | 142 | |
| | | | | | | | |
| | | | Industrial Development Revenue/Pollution Control Revenue — 0.4% | |
| | 125 | | | Industrial Development Authority, County of Yavapai, Regional Medical Center, Rev., 3.000%, 08/01/17 | | | 126 | |
| | | | | | | | |
| | | | Other Revenue — 0.1% | |
| | 25 | | | Phoenix Civic Improvement Corp., Light Rail Project, Rev., 5.000%, 07/01/17 | | | 25 | |
| | | | | | | | |
SEE NOTES TO FINANCIAL STATEMENTS.
| | | | | | | | |
| | | |
| FEBRUARY 28, 2017 | | J.P. MORGAN MUNICIPAL BOND FUNDS | | | | | 53 | |
JPMorgan Ultra-Short Municipal Fund
SCHEDULE OF PORTFOLIO INVESTMENTS
AS OF FEBRUARY 28, 2017 (continued)
(Amounts in thousands)
| | | | | | | | |
PRINCIPAL
AMOUNT($) | | | SECURITY DESCRIPTION | | VALUE($) | |
| | | | | | | | |
| | Municipal Bonds — continued | | | | |
| | | | Prerefunded — 0.1% | |
| | 30 | | | Northern Arizona University, Rev., AMBAC, 5.000%, 06/01/17 (p) | | | 30 | |
| | | | | | | | |
| | | | Transportation — 0.3% | |
| | 100 | | | Town of Gilbert, Arizona Street & Highway User, Rev., 4.000%, 07/01/17 | | | 101 | |
| | | | | | | | |
| | | | Total Arizona | | | 424 | |
| | | | | | | | |
| | | | Arkansas — 0.6% | |
| | | | General Obligation — 0.1% | |
| | 25 | | | County of Benton, Bentonville School District No. 6, Series A, GO, 4.000%, 06/01/17 | | | 25 | |
| | | | | | | | |
| | | | Hospital — 0.1% | |
| | 25 | | | Arkansas Development Finance Authority, Healthcare, Baptist Health, Series A, Rev., 4.000%, 12/01/17 | | | 26 | |
| | | | | | | | |
| | | | Prerefunded — 0.1% | |
| | 35 | | | State of Arkansas, Higher Education, Series B, GO, 4.500%, 06/01/17 (p) | | | 35 | |
| | | | | | | | |
| | | | Water & Sewer — 0.3% | |
| | 100 | | | City of Hot Springs, Wastewater Refunding & Construction, Rev., 2.000%, 12/01/17 | | | 101 | |
| | | | | | | | |
| | | | Total Arkansas | | | 187 | |
| | | | | | | | |
| | | | California — 4.1% | |
| | | | General Obligation — 0.4% | |
| | 25 | | | Chaffey Community College District, GO, 4.000%, 06/01/17 | | | 25 | |
| | 100 | | | Chaffey Community College District, Election of 2002, Series C, GO, NATL-RE, Zero Coupon, 06/01/17 | | | 100 | |
| | | | | | | | |
| | | | | | | 125 | |
| | | | | | | | |
| | | | Hospital — 2.6% | |
| | 500 | | | California Municipal Finance Authority, Community Medical Centers, Series A, Rev., 5.000%, 02/01/18 | | | 517 | |
| | 100 | | | California Municipal Finance Authority, NorthBay Healthcare Group, Series A, Rev., 2.000%, 11/01/17 | | | 100 | |
| | 100 | | | California Public Finance Authority, Henry Mayo Newhall Hospital, Rev., 5.000%, 10/15/20 | | | 110 | |
| | 125 | | | Palomar Health, Rev., 3.000%, 11/01/17 | | | 126 | |
| | | | | | | | |
| | | | | | | 853 | |
| | | | | | | | |
| | | | Other Revenue — 0.2% | |
| | 40 | | | San Jose Finance Authority, Civic Center Project, Series A, Rev., 4.000%, 06/01/17 | | | 40 | |
| | | | | | | | |
PRINCIPAL
AMOUNT($) | | | SECURITY DESCRIPTION | | VALUE($) | |
| | | | | | | | |
| | | | | | | | |
| | | | Other Revenue — continued | |
| | 25 | | | Santa Clara Valley Transportation Authority, Sales Tax, Series B, Rev., 5.000%, 04/01/17 | | | 25 | |
| | | | | | | | |
| | | | | | | 65 | |
| | | | | | | | |
| | | | Prerefunded — 0.4% | |
| | 30 | | | Chaffey Community College District, Election of 2002, Series C, GO, NATL-RE, 5.000%, 06/01/17 (p) | | | 30 | |
| | 25 | | | Corona-Norco Unified School District, Election of 2006, Series A, GO, AGM, 4.750%, 08/01/17 (p) | | | 26 | |
| | 25 | | | Palomar California Community College District, Election Of 2006, Series A, GO, AGM, 5.000%, 05/01/17 (p) | | | 25 | |
| | 25 | | | Santa Clara Valley Transportation Authority, Measure A Sales Tax, Series A, Rev., AMBAC, 5.000%, 04/01/17 (p) | | | 25 | |
| | 30 | | | State of California, Various Purpose, GO, NATL-RE, 5.000%, 06/01/17 (p) | | | 30 | |
| | | | | | | | |
| | | | | | | 136 | |
| | | | | | | | |
| | | | Transportation — 0.2% | |
| | 25 | | | City of Los Angeles, Department of Airports, Los Angeles International Airport, Series A, Rev., 5.000%, 05/15/17 | | | 25 | |
| | 25 | | | Los Angeles County Metropolitan Transportation Authority, Series A, Rev., 5.000%, 07/01/17 | | | 26 | |
| | | | | | | | |
| | | | | | | 51 | |
| | | | | | | | |
| | | | Utility — 0.3% | |
| | 40 | | | City of Los Angeles, Department of Water & Power, Power System, Subseries A-1, Rev., AMBAC, 5.000%, 07/01/17 | | | 41 | |
| | 25 | | | East Bay Municipal Utility District, Water System, Series B, Rev., 4.000%, 06/01/17 | | | 25 | |
| | 35 | | | Southern California Public Power Authority, Mead-Adelanto Project, Series A, Rev., 5.000%, 07/01/17 | | | 35 | |
| | | | | | | | |
| | | | | | | 101 | |
| | | | | | | | |
| | | | Total California | | | 1,331 | |
| | | | | | | | |
| | | | Colorado — 3.9% | |
| | | | Certificate of Participation/Lease — 0.9% | |
| | 100 | | | City of Avon, COP, 2.000%, 12/01/17 | | | 101 | |
| | 200 | | | City of Commerce City, COP, AGM, 2.000%, 12/15/17 (w) | | | 201 | |
| | | | | | | | |
| | | | | | | 302 | |
| | | | | | | | |
SEE NOTES TO FINANCIAL STATEMENTS.
| | | | | | |
| | | |
| 54 | | | | J.P. MORGAN MUNICIPAL BOND FUNDS | | FEBRUARY 28, 2017 |
| | | | | | | | |
PRINCIPAL
AMOUNT($) | | | SECURITY DESCRIPTION | | VALUE($) | |
| | | | | | | | |
| | Municipal Bonds — continued | | | | |
| | | | Education — 1.6% | |
| | 500 | | | Colorado Educational & Cultural Facilities Authority, Atmospheric Research Project, Rev., 3.000%, 09/01/17 | | | 505 | |
| | | | | | | | |
| | | | Hospital — 1.3% | |
| | 30 | | | Colorado Health Facilities Authority, Catholic Health Initiatives, Series A, Rev., 5.000%, 07/01/17 | | | 31 | |
| | 380 | | | University of Colorado Hospital Authority, Series C-1, Rev., VAR, 4.000%, 03/01/20 | | | 404 | |
| | | | | | | | |
| | | | | | | 435 | |
| | | | | | | | |
| | | | Water & Sewer — 0.1% | |
| | 25 | | | Metro Wastewater Reclamation District, Sewer Improvement, Series A, Rev., 5.000%, 04/01/17 | | | 25 | |
| | | | | | | | |
| | | | Total Colorado | | | 1,267 | |
| | | | | | | | |
| | | | Connecticut — 3.2% | |
| | | | Education — 1.6% | |
| | 500 | | | State of Connecticut, Health & Educational Facility Authority, Ascension Health Credit Group, Series B, Rev., VAR, 1.650%, 03/01/19 | | | 502 | |
| | | | | | | | |
| | | | Housing — 1.5% | |
| | 500 | | | Norwalk Housing Authority, Multifamily Housing, Cedar Court Apartments Project, Rev., VAR, 1.250%, 06/01/18 | | | 500 | |
| | | | | | | | |
| | | | Prerefunded — 0.1% | |
| | 40 | | | Town of Killingly, GO, NATL-RE, 5.000%, 06/15/17 (p) | | | 41 | |
| | | | | | | | |
| | | | Total Connecticut | | | 1,043 | |
| | | | | | | | |
| | | | Delaware — 0.1% | |
| | | | General Obligation — 0.1% | |
| | 25 | | | State of Delaware, Series B, GO, 5.000%, 07/01/17 | | | 25 | |
| | | | | | | | |
| | | | Florida — 3.3% | |
| | | | Certificate of Participation/Lease — 0.5% | |
| | 160 | | | St. Lucie County School Board, COP, AGM, 4.000%, 08/15/17 | | | 162 | |
| | | | | | | | |
| | | | Education — 0.4% | |
| | 100 | | | Higher Educational Facilities Financing Authority, Flagler College, Inc., Project, Series B, Rev., 3.000%, 11/01/17 | | | 101 | |
| | 25 | | | Miami-Dade County Educational Facilities Authority, University, Series A, Rev., AMBAC, 5.000%, 04/01/17 (p) | | | 25 | |
| | | | | | | | |
| | | | | | | 126 | |
| | | | | | | | |
| | | | | | | | |
PRINCIPAL
AMOUNT($) | | | SECURITY DESCRIPTION | | VALUE($) | |
| | | | | | | | |
| | | | | | | | |
| | | | General Obligation — 0.9% | |
| | 25 | | | City of Fort Lauderdale, Series B, GO, 3.000%, 07/01/17 | | | 26 | |
| | | | Florida State Board of Education, Public Education, Capital Outlay, | | | | |
| | 50 | | | Series A, GO, 5.000%, 06/01/17 | | | 51 | |
| | 55 | | | Series B, GO, 5.000%, 06/01/17 | | | 56 | |
| | 25 | | | Series B, GO, NATL-RE, 5.000%, 06/01/17 | | | 25 | |
| | 105 | | | Series D, GO, 5.500%, 06/01/17 | | | 106 | |
| | 30 | | | Series E, GO, 5.000%, 06/01/17 | | | 30 | |
| | | | | | | | |
| | | | | | | 294 | |
| | | | | | | | |
| | | | Hospital — 0.5% | |
| | 150 | | | Miami Beach Health Facilities Authority, Miami Jewish Health Systems, Inc. Project, Rev., 1.500%, 07/01/17 | | | 150 | |
| | | | | | | | |
| | | | Other Revenue — 0.7% | |
| | 40 | | | County of Miami-Dade, Court Facilities, Series A, Rev., 4.000%, 04/01/17 | | | 40 | |
| | 200 | | | Florida State Municipal Loan Council, Rev., NATL-RE, 2.000%, 10/01/17 | | | 201 | |
| | | | | | | | |
| | | | | | | 241 | |
| | | | | | | | |
| | | | Prerefunded — 0.3% | |
| | 25 | | | County of Citrus Water & Wastewater System, Rev., AGM, 4.375%, 04/01/17 (p) | | | 25 | |
| | 35 | | | Osceola County, Infrastructure Sales Surtax, Rev., AMBAC, 5.000%, 10/01/17 (p) | | | 36 | |
| | 40 | | | Palm Beach County School District, Series E, COP, NATL-RE, 5.000%, 08/01/17 (p) | | | 41 | |
| | | | | | | | |
| | | | | | | 102 | |
| | | | | | | | |
| | | | Total Florida | | | 1,075 | |
| | | | | | | | |
| | | | Georgia — 0.6% | |
| | | | Certificate of Participation/Lease — 0.1% | |
| | 35 | | | Fulton County Facilities Corporation, COP, 5.000%, 11/01/17 | | | 36 | |
| | | | | | | | |
| | | | General Obligation — 0.2% | |
| | 30 | | | Forsyth County School District, GO, AGM, 5.000%, 06/01/17 | | | 30 | |
| | 40 | | | Glynn County School District, Sales Tax, GO, 5.000%, 08/01/17 | | | 41 | |
| | | | | | | | |
| | | | | | | 71 | |
| | | | | | | | |
| | | | Prerefunded — 0.1% | |
| | 25 | | | Douglas County School District, GO, AGM, 5.000%, 04/01/17 (p) | | | 25 | |
| | | | | | | | |
SEE NOTES TO FINANCIAL STATEMENTS.
| | | | | | | | |
| | | |
| FEBRUARY 28, 2017 | | J.P. MORGAN MUNICIPAL BOND FUNDS | | | | | 55 | |
JPMorgan Ultra-Short Municipal Fund
SCHEDULE OF PORTFOLIO INVESTMENTS
AS OF FEBRUARY 28, 2017 (continued)
(Amounts in thousands)
| | | | | | | | |
PRINCIPAL
AMOUNT($) | | | SECURITY DESCRIPTION | | VALUE($) | |
| | | | | | | | |
| | Municipal Bonds — continued | | | | |
| | | | Water & Sewer — 0.2% | |
| | 50 | | | Clayton County Water Authority, Water & Sewerage, Rev., 4.000%, 05/01/17 | | | 50 | |
| | | | | | | | |
| | | | Total Georgia | | | 182 | |
| | | | | | | | |
| | | | Hawaii — 0.1% | |
| | | | General Obligation — 0.1% | |
| | 25 | | | City & County of Honolulu, Series B, GO, AGM, 5.250%, 07/01/17 | | | 25 | |
| | | | | | | | |
| | | | Illinois — 7.3% | |
| | | | Education — 1.1% | |
| | 300 | | | Peoria Public Building Commission, School District No. 150 Project, Rev., 5.000%, 12/01/19 | | | 327 | |
| | 25 | | | University of Illinois, Auxiliary Facilities System, Series B, Rev., NATL-RE, 5.500%, 04/01/17 | | | 25 | |
| | | | | | | | |
| | | | | | | 352 | |
| | | | | | | | |
| | | | General Obligation — 5.4% | |
| | 100 | | | City of Berwyn, Series A, GO, 3.000%, 12/01/17 | | | 101 | |
| | 100 | | | Cook & Will Counties School District No. 194, GO, 4.000%, 12/01/17 | | | 102 | |
| | 150 | | | Cook County, Proviso Township High School District No. 209, Series B, GO, AGM, 4.000%, 12/01/18 | | | 156 | |
| | 150 | | | County of Cook, Series A, GO, 5.000%, 11/15/18 | | | 158 | |
| | 60 | | | Ford etc. Counties Community Unit School District No. 10 Paxton-Buckley-Loda, School Building, Series A, GO, AGM, 4.000%, 12/01/18 | | | 63 | |
| | | | Joliet Park District, Will & Kendall Counties, | | | | |
| | 220 | | | Series A, GO, 4.000%, 02/01/18 | | | 225 | |
| | 350 | | | Series B, GO, 4.000%, 02/01/18 | | | 358 | |
| | 125 | | | Lincoln Land Community College District No. 526, GO, 5.000%, 12/15/21 | | | 142 | |
| | 85 | | | Monroe & St. Clair Counties, Waterloo Unit Community School District No. 5, GO, 4.000%, 04/15/18 | | | 88 | |
| | 100 | | | State of Illinois, GO, 5.000%, 02/01/18 | | | 103 | |
| | 125 | | | Streamwood Park District, GO, 2.000%, 12/01/17 | | | 126 | |
| | 115 | | | Will County, Community Consolidated School District No. 70-C Laraway, Lease Obligations, GO, AGM, 4.000%, 12/01/17 | | | 117 | |
| | | | | | | | |
| | | | | | | 1,739 | |
| | | | | | | | |
| | | | Other Revenue — 0.7% | |
| | 50 | | | State of Illinois, Rev., 4.000%, 06/15/17 | | | 50 | |
| | 80 | | | State of Illinois, Junior Obligation, Rev., 5.000%, 06/15/17 | | | 81 | |
| | | | | | | | |
PRINCIPAL
AMOUNT($) | | | SECURITY DESCRIPTION | | VALUE($) | |
| | | | | | | | |
| | | | | | | | |
| | | | Other Revenue — continued | |
| | 100 | | | State of Illinois, Sales Tax, Series B, Rev., 3.000%, 06/15/17 | | | 101 | |
| | | | | | | | |
| | | | | | | 232 | |
| | | | | | | | |
| | | | Prerefunded — 0.1% | |
| | 25 | | | City of Springfield, Senior Lien Electric, Rev., NATL-RE, 5.000%, 03/01/17 (p) | | | 25 | |
| | | | | | | | |
| | | | Total Illinois | | | 2,348 | |
| | | | | | | | |
| | | | Indiana — 1.5% | |
| | | | Industrial Development Revenue/Pollution Control Revenue — 0.8% | |
| | 265 | | | City of Whiting, Environmental Facilities, BP Products North America, Inc., Project, Rev., 5.000%, 07/01/17 | | | 269 | |
| | | | | | | | |
| | | | Other Revenue — 0.1% | |
| | 25 | | | Carmel Redevelopment Authority, Option Income Tax Lease Rental, Series B, Rev., 5.000%, 07/01/17 | | | 25 | |
| | | | | | | | |
| | | | Water & Sewer — 0.6% | |
| | 200 | | | City of Mount Vernon, Waterworks, Rev., BAN, 2.000%, 07/01/17 | | | 200 | |
| | | | | | | | |
| | | | Total Indiana | | | 494 | |
| | | | | | | | |
| | | | Iowa — 1.9% | |
| | | | General Obligation — 0.1% | |
| | 25 | | | City of Cedar Rapids, Series A, GO, 3.000%, 06/01/17 | | | 25 | |
| | | | | | | | |
| | | | Hospital — 1.7% | |
| | 480 | | | City of Ames, Mary Greeley Medical Center, Rev., 5.000%, 06/15/18 | | | 504 | |
| | 50 | | | Iowa Finance Authority, Healthcare, Genesis Health System, Rev., 4.000%, 07/01/17 | | | 51 | |
| | | | | | | | |
| | | | | | | 555 | |
| | | | | | | | |
| | | | Other Revenue — 0.1% | |
| | 25 | | | State of Iowa, Ijobs Program, Series A, Rev., 5.000%, 06/01/17 (p) | | | 25 | |
| | | | | | | | |
| | | | Total Iowa | | | 605 | |
| | | | | | | | |
| | | | Kansas — 0.4% | |
| | | | General Obligation — 0.1% | |
| | 40 | | | Miami County, Unified School District No. 368, GO, 2.000%, 09/01/17 | | | 40 | |
| | | | | | | | |
| | | | Hospital — 0.3% | |
| | 100 | | | City of Hutchinson, Hutchinson Regional Medical Center, Inc., Rev., 4.000%, 12/01/17 | | | 102 | |
| | | | | | | | |
| | | | Total Kansas | | | 142 | |
| | | | | | | | |
SEE NOTES TO FINANCIAL STATEMENTS.
| | | | | | |
| | | |
| 56 | | | | J.P. MORGAN MUNICIPAL BOND FUNDS | | FEBRUARY 28, 2017 |
| | | | | | | | |
PRINCIPAL
AMOUNT($) | | | SECURITY DESCRIPTION | | VALUE($) | |
| | | | | | | | |
| | Municipal Bonds — continued | | | | |
| | | | Kentucky — 1.6% | |
| | | | Prerefunded — 0.2% | |
| | 75 | | | Mercer County School District Finance Corp., School Building, Rev., NATL-RE, 4.250%, 05/01/17 (p) | | | 76 | |
| | | | | | | | |
| | | | Transportation — 1.4% | |
| | 430 | | | Kentucky Public Transportation Infrastructure Authority, Downtown Crossing Project, Series A, Rev., BAN, 5.000%, 07/01/17 | | | 435 | |
| | | | | | | | |
| | | | Total Kentucky | | | 511 | |
| | | | | | | | |
| | | | Louisiana — 1.1% | |
| | | | Education — 0.5% | |
| | 175 | | | Louisiana Public Facilities Authority, Capital Appreciation, Loyola University Project, Rev., Zero Coupon, 10/01/18 | | | 169 | |
| | | | | | | | |
| | | | Other Revenue — 0.4% | |
| | 125 | | | City of Shreveport, Independence Stadium Project, Rev., 3.000%, 03/01/18 | | | 127 | |
| | | | | | | | |
| | | | Prerefunded — 0.2% | |
| | 45 | | | East Ouachita Parish School District, GO, XLCA, 4.125%, 03/01/17 (p) | | | 45 | |
| | | | | | | | |
| | | | Total Louisiana | | | 341 | |
| | | | | | | | |
| | | | Maine — 0.3% | |
| | | | Transportation — 0.3% | |
| | 100 | | | City of Portland, General Airport, Rev., 3.000%, 07/01/17 | | | 101 | |
| | | | | | | | |
| | | | Maryland — 0.4% | |
| | | | Education — 0.1% | |
| | 25 | | | State of Maryland, Health & Higher Educational Facilities Authority, Johns Hopkins Health System, Series B, Rev., 5.000%, 07/01/17 | | | 25 | |
| | | | | | | | |
| | | | General Obligation — 0.1% | |
| | 25 | | | County of Worcester, Consolidated Public Improvement, GO, 5.000%, 03/01/17 | | | 25 | |
| | 25 | | | State of Maryland, State & Local Facilities Loan, Series A, GO, 5.000%, 08/01/17 | | | 26 | |
| | | | | | | | |
| | | | | | | 51 | |
| | | | | | | | |
| | | | Prerefunded — 0.1% | |
| | 25 | | | State of Maryland, State & Local Facilities Loan, First Lien, GO, 5.000%, 03/15/17 (p) | | | 25 | |
| | | | | | | | |
| | | | Transportation — 0.1% | |
| | 30 | | | Maryland Transportation Authority, Rev., GRAN, 5.250%, 03/01/17 | | | 30 | |
| | | | | | | | |
| | | | Total Maryland | | | 131 | |
| | | | | | | | |
| | | | | | | | |
PRINCIPAL
AMOUNT($) | | | SECURITY DESCRIPTION | | VALUE($) | |
| | | | | | | | |
| | | | | | | | |
| | | | Massachusetts — 1.0% | |
| | | | General Obligation — 0.3% | |
| | 30 | | | City of Newton, Municipal Purpose Loan, Series B, GO, 3.500%, 03/01/17 | | | 30 | |
| | 25 | | | Town of Ashland, Municipal Purpose Loan, GO, 5.000%, 05/15/17 | | | 26 | |
| | 25 | | | Town of Westwood, GO, 4.000%, 06/01/17 | | | 25 | |
| | | | | | | | |
| | | | | | | 81 | |
| | | | | | | | |
| | | | Other Revenue — 0.7% | |
| | 25 | | | Massachusetts School Building Authority, Dedicated Sales Tax, Series A, Rev., AMBAC, 5.000%, 08/15/17 (p) | | | 26 | |
| | 25 | | | Massachusetts School Building Authority, Sales Tax, Series A, Rev., 5.000%, 05/15/17 | | | 25 | |
| | 25 | | | Massachusetts State College Building Authority, Series A, Rev., 5.000%, 05/01/17 | | | 25 | |
| | 155 | | | Massachusetts State Development Finance Agency, Wentworth Institute Technology, Rev., 5.000%, 10/01/17 | | | 158 | |
| | | | | | | | |
| | | | | | | 234 | |
| | | | | | | | |
| | | | Total Massachusetts | | | 315 | |
| | | | | | | | |
| | | | Michigan — 1.3% | |
| | | | General Obligation — 1.0% | |
| | 115 | | | Cedar Springs Public School District, GO, Q-SBLF, 4.000%, 05/01/18 (w) | | | 119 | |
| | 50 | | | County of Wayne, Livonia Public Schools School District, Unlimited Tax, GO, 4.000%, 05/01/17 | | | 50 | |
| | 55 | | | Garden City School District, GO, Q-SBLF, 4.000%, 05/01/17 | | | 55 | |
| | 100 | | | State of Michigan, Northville Public Schools, GO, Q-SBLF, 5.000%, 05/01/17 | | | 101 | |
| | | | | | | | |
| | | | | | | 325 | |
| | | | | | | | |
| | | | Hospital — 0.1% | |
| | 30 | | | Michigan State Hospital Finance Authority, Ascension Health Senior Credit Group, Series F-3, Rev., VAR, 1.400%, 06/29/18 | | | 30 | |
| | | | | | | | |
| | | | Prerefunded — 0.2% | |
| | 30 | | | Grand Rapids Public Schools, School Building & Site, GO, AGM, 4.250%, 05/01/17 (p) | | | 30 | |
| | 30 | | | Novi Community School District, School Building & Site, GO, NATL-RE, 4.500%, 05/01/17 (p) | | | 31 | |
| | | | | | | | |
| | | | | | | 61 | |
| | | | | | | | |
| | | | Total Michigan | | | 416 | |
| | | | | | | | |
SEE NOTES TO FINANCIAL STATEMENTS.
| | | | | | | | |
| | | |
| FEBRUARY 28, 2017 | | J.P. MORGAN MUNICIPAL BOND FUNDS | | | | | 57 | |
JPMorgan Ultra-Short Municipal Fund
SCHEDULE OF PORTFOLIO INVESTMENTS
AS OF FEBRUARY 28, 2017 (continued)
(Amounts in thousands)
| | | | | | | | |
PRINCIPAL
AMOUNT($) | | | SECURITY DESCRIPTION | | VALUE($) | |
| | | | | | | | |
| | Municipal Bonds — continued | | | | |
| | | | Minnesota — 1.6% | |
| | | | Certificate of Participation/Lease — 0.8% | |
| | 150 | | | St. Cloud Independent School District No. 742, Series A, COP, 2.000%, 02/01/18 | | | 152 | |
| | 100 | | | Triton Independent School District No. 2125, Dodge Center, Series A, COP, 2.000%, 04/01/17 | | | 100 | |
| | | | | | | | |
| | | | | | | 252 | |
| | | | | | | | |
| | | | Education — 0.1% | |
| | 50 | | | City of Deephaven, Minnesota Charter School Lease, Eagle Ridge Academy Project, Series A, Rev., 3.000%, 07/01/19 | | | 50 | |
| | | | | | | | |
| | | | General Obligation — 0.2% | |
| | 25 | | | State of Minnesota, Trunk Highway, Series E, GO, 5.000%, 08/01/17 | | | 26 | |
| | 25 | | | State of Minnesota, Various Purpose, Series D, GO, 3.000%, 08/01/17 | | | 25 | |
| | | | | | | | |
| | | | | | | 51 | |
| | | | | | | | |
| | | | Transportation — 0.5% | |
| | 150 | | | Minneapolis-St Paul Metropolitan Airports Commission, Subordinate Airport, Series D, Rev., AMT, 4.000%, 01/01/18 | | | 153 | |
| | | | | | | | |
| | | | Total Minnesota | | | 506 | |
| | | | | | | | |
| | | | Missouri — 1.6% | |
| | | | General Obligation — 0.2% | |
| | 25 | | | Fort Zumwalt School District, Direct Deposit Program, Series B, GO, 5.000%, 03/01/17 | | | 25 | |
| | 25 | | | Springfield School District No. R-12, Missouri Direct Deposit Program, GO, 2.000%, 03/01/17 | | | 25 | |
| | | | | | | | |
| | | | | | | 50 | |
| | | | | | | | |
| | | | Hospital — 0.5% | |
| | 150 | | | County of Boone, Boone Hospital Center, Rev., 3.000%, 08/01/17 | | | 152 | |
| | | | | | | | |
| | | | Industrial Development Revenue/Pollution Control Revenue — 0.3% | |
| | 100 | | | Kirkwood IDA, Aberdeen Heights, Series A, Rev., 5.000%, 05/15/18 (w) | | | 103 | |
| | | | | | | | |
| | | | Other Revenue — 0.3% | |
| | 100 | | | Missouri Development Finance Board Infrastructure Facilities, City of Independence, Centerpoint Project, Series B, Rev., 3.000%, 04/01/17 | | | 100 | |
| | | | | | | | |
| | | | Prerefunded — 0.1% | |
| | 35 | | | Missouri Highways & Transportation Commission, Second Lien, Rev., 5.250%, 05/01/17 (p) | | | 35 | |
| | | | | | | | |
| | | | | | | | |
PRINCIPAL
AMOUNT($) | | | SECURITY DESCRIPTION | | VALUE($) | |
| | | | | | | | |
| | | | | | | | |
| | | | Water & Sewer — 0.2% | |
| | 60 | | | City of Springfield, Sewer System Improvements Project, Rev., 4.000%, 04/01/17 | | | 60 | |
| | | | | | | | |
| | | | Total Missouri | | | 500 | |
| | | | | | | | |
| | | | Nebraska — 0.1% | |
| | | | General Obligation — 0.1% | |
| | 25 | | | City of Omaha, GO, 5.000%, 06/01/17 | | | 25 | |
| | | | | | | | |
| | | | Nevada — 0.3% | |
| | | | Other Revenue — 0.2% | |
| | | | County of Clark, Sales & Excise Tax, | | | | |
| | 25 | | | Rev., 5.000%, 07/01/17 | | | 26 | |
| | 25 | | | Series B, Rev., 3.000%, 07/01/17 | | | 25 | |
| | | | | | | | |
| | | | | | | 51 | |
| | | | | | | | |
| | | | Prerefunded — 0.1% | |
| | | | Clark County School District, | | | | |
| | 25 | | | Series B, GO, AMBAC, 5.000%, 06/15/17 (p) | | | 25 | |
| | 25 | | | Series C, GO, NATL-RE, 3.500%, 06/15/17 (p) | | | 25 | |
| | | | | | | | |
| | | | | | | 50 | |
| | | | | | | | |
| | | | Total Nevada | | | 101 | |
| | | | | | | | |
| | | | New Jersey — 4.1% | |
| | | | Certificate of Participation/Lease — 0.5% | |
| | 150 | | | Township of West Orange, COP, AGM, 3.000%, 10/01/17 | | | 152 | |
| | | | | | | | |
| | | | General Obligation — 1.5% | |
| | 150 | | | City of Rahway, GO, 2.000%, 04/15/17 | | | 150 | |
| | 25 | | | County of Atlantic, GO, NATL-RE, 4.250%, 08/01/17 | | | 25 | |
| | 25 | | | County of Essex, GO, 4.000%, 05/01/17 | | | 25 | |
| | 40 | | | County of Monmouth, Series C, GO, 4.000%, 03/01/17 | | | 40 | |
| | 105 | | | State of New Jersey, Series L, GO, AMBAC, 5.250%, 07/15/17 | | | 107 | |
| | 150 | | | The Board of Education of the Township of Franklin, County of Somerset, GO, 5.000%, 08/15/17 | | | 153 | |
| | | | | | | | |
| | | | | | | 500 | |
| | | | | | | | |
| | | | Hospital — 0.5% | |
| | 150 | | | New Jersey Economic Development Authority, Biomedical Research Facilities, Series A, Rev., 3.000%, 07/15/17 | | | 151 | |
| | | | | | | | |
| | | | Other Revenue — 0.8% | |
| | 65 | | | New Jersey Building Authority, Series B, Rev., 5.000%, 06/15/17 | | | 66 | |
SEE NOTES TO FINANCIAL STATEMENTS.
| | | | | | |
| | | |
| 58 | | | | J.P. MORGAN MUNICIPAL BOND FUNDS | | FEBRUARY 28, 2017 |
| | | | | | | | |
PRINCIPAL
AMOUNT($) | | | SECURITY DESCRIPTION | | VALUE($) | |
| | | | | | | | |
| | Municipal Bonds — continued | | | | |
| | | | Other Revenue — continued | |
| | 200 | | | The Union County Improvement Authority, City of Linden Omnibus Project, Rev., AGM, 2.000%, 11/01/17 | | | 201 | |
| | | | | | | | |
| | | | | | | 267 | |
| | | | | | | | |
| | | | Prerefunded — 0.2% | |
| | 50 | | | County of Hunterdon, Union Township School District, GO, AGM, 5.000%, 07/15/17 (p) | | | 51 | |
| | | | | | | | |
| | | | Transportation — 0.6% | |
| | 100 | | | South Jersey Port Corp., Marine Terminal Revenue, Series S, Rev., 5.000%, 01/01/18 | | | 102 | |
| | 100 | | | Trenton Parking Authority, City Guaranteed, Series B, Rev., AGM, 2.000%, 04/01/17 | | | 100 | |
| | | | | | | | |
| | | | | | | 202 | |
| | | | | | | | |
| | | | Total New Jersey | | | 1,323 | |
| | | | | | | | |
| | | | New Mexico — 0.1% | |
| | | | Other Revenue — 0.1% | |
| | 25 | | | State of New Mexico, Severance Tax, Series A-2, Rev., 5.000%, 07/01/17 | | | 25 | |
| | | | | | | | |
| | | | New York — 5.1% | |
| | | | Education — 0.3% | |
| | 80 | | | New York State Dormitory Authority, State University, Series A, Rev., 5.000%, 07/01/17 | | | 81 | |
| | | | | | | | |
| | | | General Obligation — 2.6% | |
| | 35 | | | Brewster Central School District, Series A, GO, AGM, 5.000%, 04/15/17 | | | 35 | |
| | 30 | | | City of New York, Subseries G-3, GO, 5.000%, 03/01/17 | | | 30 | |
| | 50 | | | City of New York, Fiscal Year 2014, Series G, GO, 5.000%, 08/01/17 | | | 51 | |
| | 30 | | | Clarkstown Central School District, GO, 5.000%, 04/15/17 | | | 30 | |
| | 110 | | | County of Monroe, GO, 5.000%, 03/01/17 | | | 110 | |
| | 50 | | | County of Suffolk, Series B, GO, AGM, 5.250%, 05/01/17 | | | 51 | |
| | 25 | | | Dutchess County, Arlington Central School District, Series A, GO, 5.000%, 05/15/17 | | | 25 | |
| | 25 | | | Half Hollow Hills Central School District, Series A, GO, 3.000%, 04/15/17 | | | 25 | |
| | 25 | | | North Syracuse Central School District, GO, 4.000%, 06/15/17 | | | 25 | |
| | 25 | | | State of New York, Series A, GO, 3.000%, 03/01/17 | | | 25 | |
| | 35 | | | Town of Halfmoon, Water District, GO, 5.000%, 04/15/17 | | | 35 | |
| | | | | | | | |
PRINCIPAL
AMOUNT($) | | | SECURITY DESCRIPTION | | VALUE($) | |
| | | | | | | | |
| | | | | | | | |
| | | | General Obligation — continued | |
| | | | Town of Oyster Bay, | | | | |
| | 100 | | | GO, RAN, 3.750%, 03/31/17 | | | 100 | |
| | 200 | | | Series B, GO, BAN, 3.500%, 02/02/18 | | | 202 | |
| | 100 | | | Series C, GO, BAN, 4.000%, 06/01/18 | | | 102 | |
| | | | | | | | |
| | | | | | | 846 | |
| | | | | | | | |
| | | | Other Revenue — 1.1% | |
| | 75 | | | New York Local Government Assistance Corp., Series C, Rev., 5.500%, 04/01/17 | | | 75 | |
| | 25 | | | New York Local Government Assistance Corp., Senior Lien, Series A, Rev., 5.000%, 04/01/17 | | | 25 | |
| | 25 | | | New York Local Government Assistance Corp., Subordinated Lien, Series B, Rev., 5.000%, 04/01/17 | | | 25 | |
| | | | New York State Environmental Facilities Corp., Master Financing Program, | | | | |
| | 25 | | | Series B, Rev., 5.000%, 05/15/17 | | | 25 | |
| | 35 | | | Series C, Rev., 5.000%, 05/15/17 | | | 36 | |
| | 150 | | | TSASC, Inc., Tobacco Settlement, Series B, Rev., 5.000%, 06/01/19 | | | 159 | |
| | | | | | | | |
| | | | | | | 345 | |
| | | | | | | | |
| | | | Prerefunded — 0.1% | |
| | 25 | | | New York State Thruway Authority, State Personal Income Tax, Transportation, Series A, Rev., 5.250%, 09/15/17 (p) | | | 26 | |
| | | | | | | | |
| | | | Special Tax — 0.3% | |
| | 75 | | | New York State Thruway Authority, State Personal Income Tax, Transportation, Series A, Rev., 5.000%, 03/15/17 | | | 75 | |
| | 25 | | | New York State Urban Development Corp., State Personal Income Tax, Series E, Rev., 5.000%, 03/15/17 | | | 25 | |
| | | | | | | | |
| | | | | | | 100 | |
| | | | | | | | |
| | | | Transportation — 0.7% | |
| | 25 | | | New York State Thruway Authority, 2nd General Highway & Bridge Trust Fund, Series A, Rev., 4.000%, 04/01/17 | | | 25 | |
| | 210 | | | New York Transportation Development Corp., Special Facility, American Airlines, Inc., John F. Kennedy International Airport Project, Rev., AMT, 5.000%, 08/01/17 | | | 213 | |
| | | | | | | | |
| | | | | | | 238 | |
| | | | | | | | |
| | | | Total New York | | | 1,636 | |
| | | | | | | | |
| | | | North Carolina — 1.6% | |
| | | | General Obligation — 0.2% | |
| | 25 | | | State of North Carolina, Series B, GO, 5.000%, 04/01/17 | | | 25 | |
SEE NOTES TO FINANCIAL STATEMENTS.
| | | | | | | | |
| | | |
| FEBRUARY 28, 2017 | | J.P. MORGAN MUNICIPAL BOND FUNDS | | | | | 59 | |
JPMorgan Ultra-Short Municipal Fund
SCHEDULE OF PORTFOLIO INVESTMENTS
AS OF FEBRUARY 28, 2017 (continued)
(Amounts in thousands)
| | | | | | | | |
PRINCIPAL
AMOUNT($) | | | SECURITY DESCRIPTION | | VALUE($) | |
| | | | | | | | |
| | Municipal Bonds — continued | | | | |
| | | | General Obligation — continued | |
| | 50 | | | Town of Cary, Public Improvement, Series B, GO, 4.000%, 06/01/17 | | | 51 | |
| | | | | | | | |
| | | | | | | 76 | |
| | | | | | | | |
| | | | Hospital — 1.2% | |
| | 380 | | | Northern Hospital District of Surry County, Health Care Facilities, Rev., 4.000%, 10/01/18 | | | 393 | |
| | | | | | | | |
| | | | Other Revenue — 0.2% | |
| | 25 | | | City of Concord, Series A, Rev., 4.000%, 06/01/17 | | | 25 | |
| | 25 | | | County of Buncombe, Series A, Rev., 5.000%, 06/01/17 | | | 25 | |
| | | | | | | | |
| | | | | | | 50 | |
| | | | | | | | |
| | | | Total North Carolina | | | 519 | |
| | | | | | | | |
| | | | Ohio — 4.8% | |
| | | | Certificate of Participation/Lease — 0.4% | |
| | 130 | | | Mayfield City School District, Middle School Project, Series B-1, COP, 4.000%, 09/01/17 | | | 132 | |
| | | | | | | | |
| | | | Education — 2.2% | |
| | 605 | | | Cleveland State University, Rev., 4.000%, 06/01/17 | | | 610 | |
| | 100 | | | Fairborn City School District, School Facilities Construction & Improvement, Series A, GO, 3.000%, 12/01/17 | | | 102 | |
| | | | | | | | |
| | | | | | | 712 | |
| | | | | | | | |
| | | | General Obligation — 1.1% | |
| | 250 | | | City of Tipp City, Various Purpose, Series A, GO, BAN, 1.750%, 02/14/18 | | | 252 | |
| | 100 | | | County of Belmount, Various Purpose, GO, BAN, 1.375%, 08/31/17 | | | 100 | |
| | | | | | | | |
| | | | | | | 352 | |
| | | | | | | | |
| | | | Hospital — 0.4% | |
| | 125 | | | Akron, Bath & Copley Joint Township Hospital District, Summa Health Obligated Group, Rev., 5.000%, 11/15/21 | | | 139 | |
| | | | | | | | |
| | | | Other Revenue — 0.1% | |
| | 25 | | | State of Ohio, Capital Facilities Lease-Appropriation, Series A, Rev., 5.000%, 04/01/17 | | | 25 | |
| | | | | | | | |
| | | | Prerefunded — 0.2% | |
| | 50 | | | State of Ohio, Infrastructure Improvement, Series A, GO, 5.000%, 03/01/17 (p) | | | 50 | |
| | | | | | | | |
| | | | | | | | |
PRINCIPAL
AMOUNT($) | | | SECURITY DESCRIPTION | | VALUE($) | |
| | | | | | | | |
| | | | | | | | |
| | | | Transportation — 0.4% | |
| | 140 | | | State of Ohio, Major New State Infrastructure Project, Series 3, Rev., 5.000%, 12/15/17 | | | 145 | |
| | | | | | | | |
| | | | Total Ohio | | | 1,555 | |
| | | | | | | | |
| | | | Oklahoma — 3.0% | |
| | | | Education — 2.5% | |
| | 150 | | | Grady County School Finance Authority, Educational Facilities Lease, Alex Public Schools Project, Rev., 3.000%, 12/01/17 | | | 152 | |
| | 125 | | | Okarche Economic Development Authority, Okarche Public Schools Project, Rev., 4.000%, 09/01/19 | | | 132 | |
| | 200 | | | Oklahoma County Finance Authority, Educational Facilities, Lease Western Harrah Public Schools Project, Rev., 2.000%, 09/01/18 | | | 202 | |
| | 300 | | | Tulsa County Industrial Authority, Educational Facilities Lease, Owasso Public Schools Project, Rev., 4.000%, 09/01/17 | | | 305 | |
| | | | | | | | |
| | | | | | | 791 | |
| | | | | | | | |
| | | | General Obligation — 0.5% | |
| | 25 | | | City of Oklahoma, GO, 5.000%, 03/01/17 | | | 25 | |
| | | | City of Tulsa, | | | | |
| | 100 | | | GO, 3.000%, 03/01/17 | | | 100 | |
| | 25 | | | Series A, GO, 2.000%, 03/01/17 | | | 25 | |
| | 25 | | | Oklahoma County Independent School District No. 89, GO, 2.000%, 07/01/17 | | | 25 | |
| | | | | | | | |
| | | | | | | 175 | |
| | | | | | | | |
| | | | Total Oklahoma | | | 966 | |
| | | | | | | | |
| | | | Oregon — 2.8% | |
| | | | General Obligation — 1.9% | |
| | 250 | | | Clackamas County School District No. 12, Series A, GO, Zero Coupon, 06/15/19 | | | 243 | |
| | 25 | | | Deschutes County Administrative School District No. 1, Bend-La Pine, GO, NATL-RE, 5.000%, 06/15/17 | | | 25 | |
| | | | Lane County, Mapleton School District No. 32, | | | | |
| | 50 | | | GO, 2.000%, 06/15/17 | | | 50 | |
| | 60 | | | GO, 2.000%, 06/15/18 | | | 61 | |
| | 25 | | | Portland Community College District, GO, 5.000%, 06/15/17 | | | 25 | |
| | 200 | | | State of Oregon, Series A, GO, 2.000%, 06/30/17 | | | 201 | |
| | | | | | | | |
| | | | | | | 605 | |
| | | | | | | | |
SEE NOTES TO FINANCIAL STATEMENTS.
| | | | | | |
| | | |
| 60 | | | | J.P. MORGAN MUNICIPAL BOND FUNDS | | FEBRUARY 28, 2017 |
| | | | | | | | |
PRINCIPAL
AMOUNT($) | | | SECURITY DESCRIPTION | | VALUE($) | |
| | | | | | | | |
| | Municipal Bonds — continued | | | | |
| | | | Hospital — 0.6% | |
| | | | Klamath Falls Intercommunity Hospital Authority, Sky Lakes Medical Center Project, | | | | |
| | 75 | | | Rev., 2.000%, 09/01/17 | | | 75 | |
| | 100 | | | Rev., 3.000%, 09/01/18 | | | 103 | |
| | | | | | | | |
| | | | | | | 178 | |
| | | | | | | | |
| | | | Prerefunded — 0.3% | |
| | | | Clackamas County School District No. 12, | | | | |
| | 30 | | | Series A, GO, AGM, 4.500%, 06/15/17 (p) | | | 31 | |
| | 25 | | | Series A, GO, AGM, 4.750%, 06/15/17 (p) | | | 25 | |
| | 25 | | | Lane County, School District No. 040 Creswell, GO, AGM, 4.250%, 06/15/17 (p) | | | 25 | |
| | 25 | | | Polk Marion & Benton Counties School District No. 13J Central, Series A, GO, AGM, 4.000%, 06/15/17 (p) | | | 25 | |
| | | | | | | | |
| | | | | | | 106 | |
| | | | | | | | |
| | | | Total Oregon | | | 889 | |
| | | | | | | | |
| | | | Pennsylvania — 3.1% | |
| | | | Education — 0.3% | |
| | 100 | | | State Public School Building Authority, Philadelphia School District Project, Series A, Rev., 5.000%, 06/01/17 | | | 101 | |
| | | | | | | | |
| | | | General Obligation — 1.5% | |
| | 50 | | | Bethlehem Area School District, GO, AGM, 3.000%, 03/15/17 (p) | | | 50 | |
| | 125 | | | County of Allegheny, North Allegheny School District, Series A, GO, 3.000%, 05/01/17 | | | 126 | |
| | 50 | | | County of Bucks, Township of Bensalem, GO, 2.000%, 06/01/17 | | | 50 | |
| | 25 | | | County of Montgomery, Series A, GO, 5.000%, 03/15/17 | | | 25 | |
| | 25 | | | Lampeter Strasburg School District, GO, 4.000%, 06/01/17 | | | 25 | |
| | 50 | | | Manheim Central School District, GO, AGM, 4.000%, 03/01/17 | | | 50 | |
| | 30 | | | Midd-West School District, Synder County, GO, 3.000%, 05/15/17 | | | 30 | |
| | 65 | | | Parkland School District, Lehigh County, Series A, GO, 3.000%, 03/01/17 | | | 65 | |
| | 50 | | | Tussey Mountain School District, GO, AGM, 0.950%, 04/01/17 | | | 50 | |
| | | | | | | | |
| | | | | | | 471 | |
| | | | | | | | |
| | | | Hospital — 0.3% | |
| | 100 | | | Mount Lebanon Hospital Authority, St. Clair Memorial Hospital Project, Rev., 4.000%, 07/01/17 | | | 101 | |
| | | | | | | | |
| | | | | | | | |
PRINCIPAL
AMOUNT($) | | | SECURITY DESCRIPTION | | VALUE($) | |
| | | | | | | | |
| | | | | | | | |
| | | | Other Revenue — 0.5% | |
| | 175 | | | Delaware Valley Regional Finance Authority, Local Government, Rev., 5.750%, 07/01/17 | | | 178 | |
| | | | | | | | |
| | | | Prerefunded — 0.4% | |
| | 25 | | | County of Lancaster, GO, AMBAC, 5.000%, 05/01/17 (p) | | | 25 | |
| | 50 | | | Delaware River Joint Toll Bridge Commission, Series A, Rev., NATL-RE, 5.000%, 07/01/17 (p) | | | 51 | |
| | 40 | | | Scranton Parking Authority, Guaranteed Parking, Rev., AGC, 5.250%, 06/01/17 (p) | | | 40 | |
| | | | | | | | |
| | | | | | | 116 | |
| | | | | | | | |
| | | | Water & Sewer — 0.1% | |
| | 25 | | | Altoona City Authority, Water, Rev., AGM, 5.000%, 11/01/17 | | | 26 | |
| | | | | | | | |
| | | | Total Pennsylvania | | | 993 | |
| | | | | | | | |
| | | | Rhode Island — 0.3% | |
| | | | Education — 0.2% | |
| | 65 | | | Rhode Island Health & Educational Building Corp., Public School Financing Program, Series B, Rev., 2.000%, 05/15/17 | | | 65 | |
| | | | | | | | |
| | | | Prerefunded — 0.1% | |
| | 25 | | | Rhode Island Health & Educational Building Corp., Public School Financing Program, Series A, Rev., AGM, 5.000%, 05/15/17 (p) | | | 25 | |
| | | | | | | | |
| | | | Total Rhode Island | | | 90 | |
| | | | | | | | |
| | | | South Carolina — 1.4% | |
| | | | Education — 0.1% | |
| | 25 | | | University of South Carolina, Athletic Facilities, Series A, Rev., 4.000%, 05/01/17 | | | 25 | |
| | | | | | | | |
| | | | General Obligation — 0.4% | |
| | 55 | | | County of Dorchester, Transportation Projects, Series A, GO, 3.000%, 05/01/17 | | | 56 | |
| | 25 | | | Horry County School District, GO, SCSDE, 4.000%, 03/01/17 | | | 25 | |
| | 50 | | | Oconee County School District, Series C, GO, SCSDE, 5.000%, 03/01/17 | | | 50 | |
| | | | | | | | |
| | | | | | | 131 | |
| | | | | | | | |
| | | | Prerefunded — 0.1% | |
| | 25 | | | County of Richland School District No. 001, Series B, GO, NATL, SCSDE, 5.000%, 03/01/17 (p) | | | 25 | |
| | | | | | | | |
| | | | Utility — 0.8% | |
| | 250 | | | Piedmont Municipal Power Agency, Electric, Series A, Rev., 5.000%, 01/01/19 | | | 267 | |
| | | | | | | | |
| | | | Total South Carolina | | | 448 | |
| | | | | | | | |
SEE NOTES TO FINANCIAL STATEMENTS.
| | | | | | | | |
| | | |
| FEBRUARY 28, 2017 | | J.P. MORGAN MUNICIPAL BOND FUNDS | | | | | 61 | |
JPMorgan Ultra-Short Municipal Fund
SCHEDULE OF PORTFOLIO INVESTMENTS
AS OF FEBRUARY 28, 2017 (continued)
(Amounts in thousands)
| | | | | | | | |
PRINCIPAL
AMOUNT($) | | | SECURITY DESCRIPTION | | VALUE($) | |
| | | | | | | | |
| | Municipal Bonds — continued | | | | |
| | | | Tennessee — 0.2% | |
| | | | General Obligation — 0.1% | |
| | 25 | | | County of Shelby, Public Improvement & School, Series B, GO, 3.000%, 04/01/17 | | | 25 | |
| | | | | | | | |
| | | | Prerefunded — 0.1% | |
| | 35 | | | Metropolitan Government of Nashville & Davidson, Series A, GO, 5.000%, 05/15/17 (p) | | | 35 | |
| | | | | | | | |
| | | | Total Tennessee | | | 60 | |
| | | | | | | | |
| | | | Texas — 4.6% | |
| | | | Education — 0.6% | |
| | 150 | | | Tarrant County, Cultural Education Facilities Finance Corp., Air Force Villages Obligated Group Project, Rev., 2.000%, 05/15/17 | | | 150 | |
| | 30 | | | Texas A&M University, Series A, Rev., 4.000%, 05/15/17 | | | 30 | |
| | | | | | | | |
| | | | | | | 180 | |
| | | | | | | | |
| | | | General Obligation — 2.2% | |
| | 150 | | | City of Bullard, GO, 2.000%, 09/01/17 | | | 151 | |
| | 420 | | | City of Del Rio, Certificates of Obligation, GO, AGM, 1.000%, 06/01/17 | | | 420 | |
| | 100 | | | Harris County Municipal Utility District No. 412, GO, 2.000%, 09/01/18 | | | 101 | |
| | 25 | | | Mesquite Independent School District, Series B, GO, PSF-GTD, 5.000%, 08/15/17 | | | 25 | |
| | | | | | | | |
| | | | | | | 697 | |
| | | | | | | | |
| | | | Prerefunded — 0.6% | |
| | 25 | | | City of San Antonio, General Improvement, GO, 5.000%, 08/01/17 (p) | | | 25 | |
| | 50 | | | City of Waxahachie, Certificates of Obligation, GO, XLCA, 5.250%, 08/01/17 (p) | | | 51 | |
| | 25 | | | County of Travis, Certificates of Obligation, GO, 4.500%, 03/01/17 (p) | | | 25 | |
| | 25 | | | Spring Independant School District, Series A, GO, PSF-GTD, 5.000%, 08/15/17 (p) | | | 26 | |
| | 25 | | | State of Texas, Transportation Commission Mobility, GO, 4.750%, 04/01/17 (p) | | | 25 | |
| | 45 | | | Texas Transportation Commission, Highway Fund, First Tier, Rev., 5.000%, 04/01/17 (p) | | | 45 | |
| | | | | | | | |
| | | | | | | 197 | |
| | | | | | | | |
| | | | Transportation — 0.4% | |
| | 125 | | | Love Field Airport Modernization Corp., Rev., AMT, 5.000%, 11/01/21 | | | 142 | |
| | | | | | | | |
| | | | Utility — 0.4% | |
| | 25 | | | City of Houston, Combined Utility System, First Lien, Series A, Rev., NATL-RE, 5.250%, 05/15/17 | | | 26 | |
| | | | | | | | |
PRINCIPAL
AMOUNT($) | | | SECURITY DESCRIPTION | | VALUE($) | |
| | | | | | | | |
| | | | | | | | |
| | | | Utility — continued | |
| | 85 | | | City of Plano, Municipal Drainage Utility System, Rev., 2.000%, 05/15/17 (w) | | | 85 | |
| | | | | | | | |
| | | | | | | 111 | |
| | | | | | | | |
| | | | Water & Sewer — 0.4% | |
| | 65 | | | City of Longview, Texas, Waterworks & Sewer System, Rev., 4.000%, 03/01/17 | | | 65 | |
| | 25 | | | City of Mansfield, Waterworks & Sewer System, Rev., 5.000%, 08/01/17 | | | 26 | |
| | 25 | | | City of McKinney, Waterworks & Sewer System, Rev., 4.000%, 03/15/17 | | | 25 | |
| | 25 | | | North Texas Municipal Water District, Rev., 5.000%, 06/01/17 | | | 25 | |
| | | | | | | | |
| | | | | | | 141 | |
| | | | | | | | |
| | | | Total Texas | | | 1,468 | |
| | | | | | | | |
| | | | Utah — 1.1% | |
| | | | General Obligation — 0.3% | |
| | 35 | | | Alpine School District, School Building, GO, 4.500%, 03/15/17 | | | 35 | |
| | 40 | | | Board of Education of Weber School District, GO, 5.000%, 06/15/17 | | | 41 | |
| | 25 | | | State of Utah, Series C, GO, 5.000%, 07/01/17 | | | 25 | |
| | | | | | | | |
| | | | | | | 101 | |
| | | | | | | | |
| | | | Other Revenue — 0.8% | |
| | 115 | | | State of Utah, Series B, Rev., 5.000%, 07/01/17 | | | 117 | |
| | 25 | | | Utah State Building Ownership Authority Lease, State Facilities Master Lease Program, Series A, Rev., 5.000%, 05/15/17 | | | 25 | |
| | 25 | | | Utah Transit Authority, Sales Tax, Series C, Rev., AGM, 5.250%, 06/15/17 | | | 25 | |
| | 100 | | | West Valley City Redevelopment Agency, Rev., 2.000%, 11/01/17 | | | 101 | |
| | | | | | | | |
| | | | | | | 268 | |
| | | | | | | | |
| | | | Total Utah | | | 369 | |
| | | | | | | | |
| | | | Virginia — 0.2% | |
| | | | Other Revenue — 0.1% | |
| | 25 | | | Fairfax County Economic Development Authority, Joint Public Uses Complex Project, Rev., 5.000%, 05/15/17 | | | 25 | |
| | | | | | | | |
| | | | Prerefunded — 0.1% | |
| | 25 | | | County of James City, GO, NATL-RE, 4.000%, 06/15/17 (p) | | | 26 | |
| | | | | | | | |
| | | | Total Virginia | | | 51 | |
| | | | | | | | |
| | | | Washington — 1.0% | |
| | | | General Obligation — 0.3% | |
| | 25 | | | King County School District No. 210 Federal Way, GO, 4.000%, 06/01/17 | | | 25 | |
SEE NOTES TO FINANCIAL STATEMENTS.
| | | | | | |
| | | |
| 62 | | | | J.P. MORGAN MUNICIPAL BOND FUNDS | | FEBRUARY 28, 2017 |
| | | | | | | | |
PRINCIPAL
AMOUNT($) | | | SECURITY DESCRIPTION | | VALUE($) | |
| | | | | | | | |
| | Municipal Bonds — continued | | | | |
| | | | General Obligation — continued | |
| | 50 | | | Skagit County, Public Hospital District No. 1, GO, 4.000%, 12/01/17 | | | 51 | |
| | 25 | | | State of Washington, Series C, GO, 5.000%, 07/01/17 | | | 26 | |
| | | | | | | | |
| | | | | | | 102 | |
| | | | | | | | |
| | | | Hospital — 0.1% | |
| | 40 | | | Washington Health Care Facilities Authority, Rev., 5.000%, 11/01/17 | | | 41 | |
| | | | | | | | |
| | | | Prerefunded — 0.1% | |
| | 25 | | | Clark County, Camas School District No. 117, GO, AGM, 4.500%, 12/01/17 (p) | | | 26 | |
| | | | | | | | |
| | | | Utility — 0.5% | |
| | 130 | | | County of Snohomish, Public Utility District No. 1, Water System, Rev., 4.000%, 12/01/17 | | | 133 | |
| | 25 | | | Energy Northwest, Project 1, Series D, Rev., 5.000%, 07/01/17 | | | 25 | |
| | | | | | | | |
| | | | | | | 158 | |
| | | | | | | | |
| | | | Total Washington | | | 327 | |
| | | | | | | | |
| | | | Wisconsin — 0.9% | |
| | | | General Obligation — 0.9% | |
| | 25 | | | County of Dane, Promissory Notes, Series A, GO, 2.000%, 06/01/17 | | | 25 | |
| | 45 | | | Milwaukee Area Technical College District, Series C, GO, 2.000%, 06/01/17 | | | 45 | |
| | 25 | | | State of Wisconsin, Series A, GO, 4.000%, 05/01/17 | | | 25 | |
| | 130 | | | Wautoma Area School District, GO, AGM, 3.000%, 03/01/18 | | | 133 | |
| | 65 | | | Western Technical College District, Series A, GO, 2.000%, 04/01/17 | | | 65 | |
| | | | | | | | |
| | | | Total Wisconsin | | | 293 | |
| | | | | | | | |
| | | | Wyoming — 1.1% | |
| | | | Utility — 1.1% | |
| | | | Wyoming Municipal Power Agency, Inc., Power Supply System, | | | | |
| | 175 | | | Series A, Rev., 4.000%, 01/01/18 | | | 179 | |
| | 175 | | | Series A, Rev., 4.000%, 01/01/19 | | | 184 | |
| | | | | | | | |
| | | | Total Wyoming | | | 363 | |
| | | | | | | | |
| | | | Total Municipal Bonds
(Cost $24,769) | | | 24,809 | |
| | | | | | | | |
| | | | | | | | |
PRINCIPAL
AMOUNT($) | | | SECURITY DESCRIPTION | | VALUE($) | |
| | | | | | | | |
| | Quarterly Demand Note — 0.8% (t) | | | | |
| | | | Texas — 0.8% | |
| | | | Industrial Development Revenue/Pollution Control Revenue — 0.8% | |
| | 250 | | | Mission Economic Development Corp., Solid Waste Disposal, Republic Services, Inc. Project, Rev., VRDO, 1.250%, 05/01/17
(Cost $250) | | | 250 | |
| | | | | | | | |
| | Weekly Demand Notes — 13.7% (t) | | | | |
| | | | California — 0.8% | |
| | | | Water & Sewer — 0.8% | |
| | 250 | | | Irvine Ranch Water District, Series A-1, Rev., 0.690%, 03/01/17 | | | 250 | |
| | | | | | | | |
| | | | Colorado — 2.0% | |
| | | | Transportation — 1.5% | |
| | 500 | | | E-470 Public Highway Authority, Senior LIBOR Index, Series A, Rev., VAR, 1.440%, 03/01/17 | | | 500 | |
| | | | | | | | |
| | | | Utility — 0.5% | |
| | 150 | | | City of Colorado Springs, Utilities System Improvement, Series B, Rev., VRDO, 0.610%, 03/01/17 | | | 150 | |
| | | | | | | | |
| | | | Total Colorado | | | 650 | |
| | | | | | | | |
| | | | District of Columbia — 3.1% | |
| | | | Other Revenue — 3.1% | |
| | 1,000 | | | District of Columbia, American Society, Series A, Rev., VRDO, LOC: Wells Fargo Bank NA, 0.600%, 03/01/17 | | | 1,000 | |
| | | | | | | | |
| | | | Indiana — 3.1% | |
| | | | Hospital — 3.1% | |
| | 1,000 | | | Indiana Finance Authority, Indiana University Health Obligated Group, Series E, Rev., VRDO, LOC: Bank of America NA, 0.600%, 03/01/17 | | | 1,000 | |
| | | | | | | | |
| | | | Massachusetts — 3.1% | |
| | | | General Obligation — 3.1% | |
| | 1,000 | | | Commonwealth of Massachusetts, Subseries D-2, GO, VAR, 0.920%, 03/01/17 | | | 1,000 | |
| | | | | | | | |
| | | | Ohio — 0.6% | |
| | | | Utility — 0.6% | |
| | 200 | | | Ohio Air Quality Development Authority, Electric Corp. Project, Series D, Rev., VRDO, LOC: Bank of Tokyo-Mitsubishi UFJ Ltd., 0.630%, 03/01/17 | | | 200 | |
| | | | | | | | |
| | | | Washington — 1.0% | |
| | | | Other Revenue — 0.6% | |
| | 200 | | | Washington Economic Development Finance Authority, Seadrunar Project, Series E, Rev., VRDO, LOC: U.S. Bank NA, 1.050%, 03/01/17 | | | 200 | |
| | | | | | | | |
SEE NOTES TO FINANCIAL STATEMENTS.
| | | | | | | | |
| | | |
| FEBRUARY 28, 2017 | | J.P. MORGAN MUNICIPAL BOND FUNDS | | | | | 63 | |
JPMorgan Ultra-Short Municipal Fund
SCHEDULE OF PORTFOLIO INVESTMENTS
AS OF FEBRUARY 28, 2017 (continued)
(Amounts in thousands)
| | | | | | | | |
PRINCIPAL
AMOUNT($) | | | SECURITY DESCRIPTION | | VALUE($) | |
| | | | | | | | |
| | Weekly Demand Notes — continued | | | | |
| | | | Utility — 0.4% | |
| | 100 | | | City of Seattle, Municipal Light & Power, Series B-2, Rev., VAR, 1.300%, 03/01/17 | | | 100 | |
| | | | | | | | |
| | | | Total Washington | | | 300 | |
| | | | | | | | |
| | | | Total Weekly Demand Notes
(Cost $4,400) | | | 4,400 | |
| | | | | | | | |
| | | | | | | | |
SHARES | | | SECURITY DESCRIPTION | | VALUE($) | |
| | Short-Term Investment — 8.7% | |
| | | | Investment Company — 8.7% | |
| | 2,788 | | | JPMorgan U.S. Government Money Market Fund, Institutional Class Shares, 0.450% (b) (l) (Cost $2,788) | | | 2,788 | |
| | | | | | | | |
| | | | Total Investments — 104.9%
(Cost $33,707) | | | 33,747 | |
| | | | Liabilities in Excess of
Other Assets — (4.9)% | | | (1,572 | ) |
| | | | | | | | |
| | | | NET ASSETS — 100.0% | | $ | 32,175 | |
| | | | | | | | |
Percentages indicated are based on net assets.
SEE NOTES TO FINANCIAL STATEMENTS.
| | | | | | |
| | | |
| 64 | | | | J.P. MORGAN MUNICIPAL BOND FUNDS | | FEBRUARY 28, 2017 |
J.P. Morgan Municipal Bond Funds
NOTES TO SCHEDULE OF PORTFOLIO INVESTMENTS
AS OF FEBRUARY 28, 2017
| | |
| AGC | | — Insured by Assured Guaranty Corp. |
| AGM | | — Insured by Assured Guaranty Municipal Corp. |
| AMBAC | | — Insured by American Municipal Bond Assurance Corp. |
| AMT | | — Alternative Minimum Tax |
| BAN | | — Bond Anticipation Note |
| BHAC | | — Insured by Berkshire Hathaway Assurance Corp. |
| BRRH | | — Boca Raton Regional Hospital |
| CHESLA | | — Connecticut Higher Education Supplemental Loan Authority |
| COLL | | — Collateral |
| COP | | — Certificate of Participation |
| CR | | — Custodial Receipts |
| FGIC | | — Insured by Financial Guaranty Insurance Co. |
| FHA | | — Federal Housing Administration |
| FHLMC | | — Federal Home Loan Mortgage Corp. |
| FNMA | | — Federal National Mortgage Association |
| GNMA | | — Government National Mortgage Association |
| GO | | — General Obligation |
| GRAN | | — Grant Revenue Anticipation Note |
| GTD | | — Guaranteed |
| ICC | | — Insured Custody Certificates |
| IDA | | — Industrial Development Authority |
| LIBOR | | — London Interbank Offered Rate |
| LIQ | | — Liquidity Agreement |
| LOC | | — Letter of Credit |
| MTA | | — Metropolitan Transportation Authority |
| NATL | | — Insured by National Public Finance Guarantee Corp. |
| PSF | | — Permanent School Fund |
| Q-SBLF | | — Qualified School Bond Loan Fund |
| RAN | | — Revenue Anticipation Note |
| | |
| RE | | — Reinsured |
| REMIC | | — Real Estate Mortgage Investment Conduit |
| Rev. | | — Revenue |
| SCSDE | | — South Carolina School District Enhancement |
| SIFMA | | — Securities Industry and Financial Markets Association |
| USD | | — United States Dollar |
| VAR | | — Variable Rate Security. The interest rate shown is the rate in effect as of February 28, 2017. |
| VRDO | | — Variable Rate Demand Obligation. The interest rate shown is the rate in effect as of February 28, 2017. |
| XLCA | | — Insured by XL Capital Assurance |
| |
| (b) | | — Investment in affiliate. Money market fund is registered under the Investment Company Act of 1940, as amended, and advised by J.P. Morgan Investment Management Inc. |
| (g) | | — Amount rounds to less than 0.05%. |
| (l) | | — The rate shown is the current yield as of February 28, 2017. |
| (p) | | — Security is prerefunded or escrowed to maturity. |
| (t) | | — The date shown represents the earliest of the prerefunded date, next put date, or final maturity date. |
| (w) | | — All or a portion of the security is a when-issued security, delayed delivery security, or forward commitment. |
Detailed information about investment portfolios of the underlying funds can be found in shareholder reports filed with the Securities and Exchange Commission (SEC) by each such underlying fund semi-annually on Form N-CSR and in certified portfolio holdings filed quarterly on Form N-Q, and are available for download from both the SEC‘s as well as each respective underlying fund’s website. Detailed information about underlying J.P. Morgan Funds can also be found at www.jpmorganfunds.com or by calling 1-800-480-4111.
SEE NOTES TO FINANCIAL STATEMENTS.
| | | | | | | | |
| | | |
| FEBRUARY 28, 2017 | | J.P. MORGAN MUNICIPAL BOND FUNDS | | | | | 65 | |
STATEMENTS OF ASSETS AND LIABILITIES
AS OF FEBRUARY 28, 2017
(Amounts in thousands, except per share amounts)
| | | | | | | | | | | | |
| | | Municipal
Income Fund | | | Ohio
Municipal
Bond Fund | | | Short-
Intermediate
Municipal
Bond Fund | |
ASSETS: | | | | | | | | | | | | |
Investments in non-affiliates, at value | | $ | 263,689 | | | $ | 118,490 | | | $ | 1,988,492 | |
Investments in affiliates, at value | | | 5,140 | | | | 1,648 | | | | 41,698 | |
| | | | | | | | | | | | |
Total investment securities, at value | | | 268,829 | | | | 120,138 | | | | 2,030,190 | |
Cash | | | — | | | | — | | | | 14 | |
Receivables: | | | | | | | | | | | | |
Investment securities sold | | | 549 | | | | 10 | | | | 33,404 | |
Investment securities sold — delayed delivery securities | | | 165 | | | | 35 | | | | — | |
Fund shares sold | | | 261 | | | | 2 | | | | 1,368 | |
Interest and dividends from non-affiliates | | | 2,862 | | | | 1,344 | | | | 19,712 | |
Dividends from affiliates | | | 3 | | | | — | (a) | | | 16 | |
Due from adviser | | | — | | | | — | (a) | | | — | |
| | | | | | | | | | | | |
Total Assets | | | 272,669 | | | | 121,529 | | | | 2,084,704 | |
| | | | | | | | | | | | |
| | | |
LIABILITIES: | | | | | | | | | | | | |
Payables: | | | | | | | | | | | | |
Investment securities purchased | | | 1,344 | | | | — | | | | 4,994 | |
Fund shares redeemed | | | 364 | | | | 3 | | | | 3,110 | |
Accrued liabilities: | | | | | | | | | | | | |
Investment advisory fees | | | 4 | | | | — | | | | 203 | |
Administration fees | | | — | | | | — | | | | 2 | |
Distribution fees | | | 25 | | | | 25 | | | | 14 | |
Shareholder servicing fees | | | 50 | | | | 20 | | | | 103 | |
Custodian and accounting fees | | | 14 | | | | 11 | | | | 39 | |
Trustees’ and Chief Compliance Officer’s fees | | | — | | | | — | | | | — | (a) |
Audit fees | | | 34 | | | | 31 | | | | 33 | |
Other | | | 23 | | | | 13 | | | | 168 | |
| | | | | | | | | | | | |
Total Liabilities | | | 1,858 | | | | 103 | | | | 8,666 | |
| | | | | | | | | | | | |
Net Assets | | $ | 270,811 | | | $ | 121,426 | | | $ | 2,076,038 | |
| | | | | | | | | | | | |
| (a) | Amount rounds to less than 500. |
SEE NOTES TO FINANCIAL STATEMENTS.
| | | | | | |
| | | |
| 66 | | | | J.P. MORGAN MUNICIPAL BOND FUNDS | | FEBRUARY 28, 2017 |
| | | | | | | | | | | | |
| | | Municipal
Income Fund | | | Ohio
Municipal
Bond Fund | | | Short-
Intermediate
Municipal
Bond Fund | |
NET ASSETS: | | | | | | | | | | | | |
Paid-in-Capital | | $ | 263,665 | | | $ | 115,987 | | | $ | 2,074,004 | |
Accumulated undistributed (distributions in excess of) net investment income | | | (19 | ) | | | (3 | ) | | | (17 | ) |
Accumulated net realized gains (losses) | | | 519 | | | | 144 | | | | (8,845 | ) |
Net unrealized appreciation (depreciation) | | | 6,646 | | | | 5,298 | | | | 10,896 | |
| | | | | | | | | | | | |
Total Net Assets | | $ | 270,811 | | | $ | 121,426 | | | $ | 2,076,038 | |
| | | | | | | | | | | | |
| | | |
Net Assets: | | | | | | | | | | | | |
Class A | | $ | 76,684 | | | $ | 47,146 | | | $ | 30,535 | |
Class C | | | 17,137 | | | | 26,938 | | | | 14,013 | |
Institutional Class* | | | — | | | | — | | | | 1,887,149 | |
Select Class* | | | 176,990 | | | | 47,342 | | | | 144,341 | |
| | | | | | | | | | | | |
Total | | $ | 270,811 | | | $ | 121,426 | | | $ | 2,076,038 | |
| | | | | | | | | | | | |
| | | |
Outstanding units of beneficial interest (shares) | | | | | | | | | | | | |
($0.0001 par value; unlimited number of shares authorized): | | | | | | | | | | | | |
Class A | | | 7,906 | | | | 4,453 | | | | 2,914 | |
Class C | | | 1,784 | | | | 2,530 | | | | 1,327 | |
Institutional Class* | | | — | | | | — | | | | 179,229 | |
Select Class* | | | 18,373 | | | | 4,501 | | | | 13,738 | |
| | | |
Net Asset Value (a): | | | | | | | | | | | | |
Class A — Redemption price per share | | $ | 9.70 | | | $ | 10.59 | | | $ | 10.48 | |
Class C — Offering price per share (b) | | | 9.61 | | | | 10.65 | | | | 10.56 | |
Institutional Class* — Offering and redemption price per share | | | — | | | | — | | | | 10.53 | |
Select Class* — Offering and redemption price per share | | | 9.63 | | | | 10.52 | | | | 10.51 | |
Class A maximum sales charge | | | 3.75 | % | | | 3.75 | % | | | 2.25 | % |
Class A maximum public offering price per share
[net asset value per share/(100% — maximum sales charge)] | | $ | 10.08 | | | $ | 11.00 | | | $ | 10.72 | |
| | | | | | | | | | | | |
| | | |
Cost of investments in non-affiliates | | $ | 257,043 | | | $ | 113,192 | | | $ | 1,977,596 | |
Cost of investments in affiliates | | | 5,140 | | | | 1,648 | | | | 41,698 | |
| (a) | Per share amounts may not recalculate due to rounding of net assets and/or shares outstanding. |
| (b) | Redemption price for Class C Shares varies based upon length of time the shares are held. |
| * | Effective April 3, 2017, the Institutional Class of Short-Intermediate Municipal Bond Fund and the Select Class of Municipal Income Fund and Ohio Municipal Bond Fund were renamed Class I. |
SEE NOTES TO FINANCIAL STATEMENTS.
| | | | | | | | |
| | | |
| FEBRUARY 28, 2017 | | J.P. MORGAN MUNICIPAL BOND FUNDS | | | | | 67 | |
STATEMENTS OF ASSETS AND LIABILITIES
AS OF FEBRUARY 28, 2017 (continued)
(Amounts in thousands, except per share amounts)
| | | | | | | | |
| | |
Tax Free
Bond Fund | | | Ultra-Short
Municipal Fund | |
ASSETS: | | | | | | | | |
Investments in non-affiliates, at value | | $ | 302,216 | | | $ | 30,959 | |
Investments in affiliates, at value | | | 16,638 | | | | 2,788 | |
| | | | | | | | |
Total investment securities, at value | | | 318,854 | | | | 33,747 | |
Deposits at broker for futures contracts | | | 115 | | | | — | |
Receivables: | | | | | | | | |
Investment securities sold | | | 242 | | | | — | |
Fund shares sold | | | 219 | | | | 450 | |
Interest and dividends from non-affiliates | | | 3,455 | | | | 187 | |
Dividends from affiliates | | | 9 | | | | 2 | |
Variation margin on futures contracts | | | 1 | | | | — | |
Due from adviser | | | — | | | | 33 | |
Deferred offering costs | | | — | | | | 21 | |
| | | | | | | | |
Total Assets | | | 322,895 | | | | 34,440 | |
| | | | | | | | |
| | |
LIABILITIES: | | | | | | | | |
Payables: | | | | | | | | |
Due to custodian | | | — | | | | — | (a) |
Investment securities purchased | | | — | | | | 1,711 | |
Investment securities purchased — delayed delivery securities | | | — | | | | 508 | |
Fund shares redeemed | | | 309 | | | | — | |
Accrued liabilities: | | | | | | | | |
Investment advisory fees | | | 7 | | | | — | |
Distribution fees | | | 47 | | | | — | (a) |
Shareholder servicing fees | | | 50 | | | | 1 | |
Custodian and accounting fees | | | 14 | | | | 5 | |
Trustees’ and Chief Compliance Officer’s fees | | | — | (a) | | | — | (a) |
Audit fees | | | 38 | | | | 35 | |
Other | | | 35 | | | | 5 | |
| | | | | | | | |
Total Liabilities | | | 500 | | | | 2,265 | |
| | | | | | | | |
Net Assets | | $ | 322,395 | | | $ | 32,175 | |
| | | | | | | | |
| (a) | Amount rounds to less than 500. |
SEE NOTES TO FINANCIAL STATEMENTS.
| | | | | | |
| | | |
| 68 | | | | J.P. MORGAN MUNICIPAL BOND FUNDS | | FEBRUARY 28, 2017 |
| | | | | | | | |
| | |
Tax Free
Bond Fund | | | Ultra-Short
Municipal Fund | |
NET ASSETS: | | | | | | | | |
Paid-in-Capital | | $ | 308,459 | | | $ | 32,133 | |
Accumulated undistributed (distributions in excess of) net investment income | | | (9 | ) | | | 2 | |
Accumulated net realized gains (losses) | | | (1,717 | ) | | | — | (a) |
Net unrealized appreciation (depreciation) | | | 15,662 | | | | 40 | |
| | | | | | | | |
Total Net Assets | | $ | 322,395 | | | $ | 32,175 | |
| | | | | | | | |
| | |
Net Assets: | | | | | | | | |
Class A | | $ | 148,987 | | | $ | 519 | |
Class C | | | 32,052 | | | | — | |
Class I (formerly Select Class) | | | 141,356 | | | | 31,656 | |
| | | | | | | | |
Total | | $ | 322,395 | | | $ | 32,175 | |
| | | | | | | | |
| | |
Outstanding units of beneficial interest (shares) | | | | | | | | |
($0.0001 par value; unlimited number of shares authorized): | | | | | | | | |
Class A | | | 12,487 | | | | 52 | |
Class C | | | 2,708 | | | | — | |
Class I (formerly Select Class) | | | 11,896 | | | | 3,160 | |
Net Asset Value (b): | | | | | | | | |
Class A — Redemption price per share | | $ | 11.93 | | | $ | 10.02 | |
Class C — Offering price per share (c) | | | 11.84 | | | | — | |
Class I (formerly Select Class) — Offering and redemption price per share | | | 11.88 | | | | 10.02 | |
Class A maximum sales charge | | | 3.75 | % | | | 2.25 | % |
Class A maximum public offering price per share
[net asset value per share/(100% — maximum sales charge)] | | $ | 12.39 | | | $ | 10.25 | |
| | | | | | | | |
| | |
Cost of investments in non-affiliates | | $ | 286,538 | | | $ | 30,919 | |
Cost of investments in affiliates | | | 16,638 | | | | 2,788 | |
| (a) | Amount rounds to less than 500. |
| (b) | Per share amounts may not recalculate due to rounding of net assets and/or shares outstanding. |
| (c) | Redemption price for Class C Shares varies based upon length of time the shares are held. |
SEE NOTES TO FINANCIAL STATEMENTS.
| | | | | | | | |
| | | |
| FEBRUARY 28, 2017 | | J.P. MORGAN MUNICIPAL BOND FUNDS | | | | | 69 | |
STATEMENTS OF OPERATIONS
FOR THE YEAR ENDED FEBRUARY 28, 2017
(Amounts in thousands)
| | | | | | | | | | | | |
| | | Municipal
Income Fund | | | Ohio
Municipal
Bond Fund | | | Short-
Intermediate
Municipal
Bond Fund | |
INVESTMENT INCOME: | | | | | | | | | | | | |
Interest income from non-affiliates | | $ | 9,255 | | | $ | 4,550 | | | $ | 38,176 | |
Interest income from affiliates | | | — | (a) | | | — | (a) | | | 2 | |
Dividend income from non-affiliates | | | 329 | | | | — | | | | — | |
Dividend income from affiliates | | | 26 | | | | 4 | | | | 164 | |
| | | | | | | | | | | | |
Total investment income | | | 9,610 | | | | 4,554 | | | | 38,342 | |
| | | | | | | | | | | | |
| | | |
EXPENSES: | | | | | | | | | | | | |
Investment advisory fees | | | 909 | | | | 388 | | | | 5,830 | |
Administration fees | | | 248 | | | | 106 | | | | 1,911 | |
Distribution fees: | | | | | | | | | | | | |
Class A | | | 197 | | | | 124 | | | | 94 | |
Class C | | | 134 | | | | 209 | | | | 120 | |
Shareholder servicing fees: | | | | | | | | | | | | |
Class A | | | 197 | | | | 124 | | | | 94 | |
Class C | | | 45 | | | | 70 | | | | 40 | |
Institutional Class* | | | — | | | | — | | | | 2,126 | |
Select Class* | | | 515 | | | | 130 | | | | 381 | |
Custodian and accounting fees | | | 109 | | | | 95 | | | | 276 | |
Interest expense to affiliates | | | — | (a) | | | — | | | | — | |
Professional fees | | | 67 | | | | 56 | | | | 82 | |
Trustees’ and Chief Compliance Officer’s fees | | | 24 | | | | 24 | | | | 28 | |
Printing and mailing costs | | | 15 | | | | 15 | | | | 126 | |
Registration and filing fees | | | 41 | | | | 14 | | | | 117 | |
Transfer agency fees (See Note 2.F.) | | | 8 | | | | 6 | | | | 19 | |
Sub-transfer agency fees (See Note 2.F.) | | | 36 | | | | 21 | | | | 332 | |
Other | | | 10 | | | | 7 | | | | 47 | |
| | | | | | | | | | | | |
Total expenses | | | 2,555 | | | | 1,389 | | | | 11,623 | |
| | | | | | | | | | | | |
Less fees waived | | | (613 | ) | | | (269 | ) | | | (5,111 | ) |
Less earnings credits | | | — | | | | — | | | | — | (a) |
Less expense reimbursements | | | — | | | | — | | | | (178 | ) |
| | | | | | | | | | | | |
Net expenses | | | 1,942 | | | | 1,120 | | | | 6,334 | |
| | | | | | | | | | | | |
Net investment income (loss) | | | 7,668 | | | | 3,434 | | | | 32,008 | |
| | | | | | | | | | | | |
| | | |
REALIZED/UNREALIZED GAINS (LOSSES): | | | | | | | | | | | | |
Net realized gain (loss) on transactions from investments in non-affiliates | | | 4,031 | | | | 466 | | | | 1,510 | |
Change in net unrealized appreciation/depreciation on investments in non-affiliates | | | (12,606 | ) | | | (4,710 | ) | | | (41,497 | ) |
| | | | | | | | | | | | |
Net realized/unrealized gains (losses) | | | (8,575 | ) | | | (4,244 | ) | | | (39,987 | ) |
| | | | | | | | | | | | |
Change in net assets resulting from operations | | $ | (907 | ) | | $ | (810 | ) | | $ | (7,979 | ) |
| | | | | | | | | | | | |
| (a) | Amount rounds to less than 500. |
| * | Effective April 3, 2017, the Institutional Class of Short-Intermediate Municipal Bond Fund and the Select Class of Municipal Income Fund and Ohio Municipal Bond Fund were renamed Class I. |
SEE NOTES TO FINANCIAL STATEMENTS.
| | | | | | |
| | | |
| 70 | | | | J.P. MORGAN MUNICIPAL BOND FUNDS | | FEBRUARY 28, 2017 |
| | | | | | | | |
| | | Tax Free
Bond Fund | | |
Ultra-Short
Municipal
Fund (a) | |
INVESTMENT INCOME: | | | | | | | | |
Interest income from non-affiliates | | $ | 12,745 | | | $ | 106 | |
Dividend income from affiliates | | | 82 | | | | 6 | |
| | | | | | | | |
Total investment income | | | 12,827 | | | | 112 | |
| | | | | | | | |
| | |
EXPENSES: | | | | | | | | |
Investment advisory fees | | | 1,008 | | | | 17 | |
Administration fees | | | 275 | | | | 9 | |
Distribution fees: | | | | | | | | |
Class A | | | 402 | | | | — | (b) |
Class C | | | 248 | | | | — | |
Shareholder servicing fees: | | | | | | | | |
Class A | | | 402 | | | | — | (b) |
Class C | | | 83 | | | | — | |
Class I (formerly Select Class) | | | 355 | | | | 28 | |
Custodian and accounting fees | | | 105 | | | | 21 | |
Professional fees | | | 68 | | | | 60 | |
Trustees’ and Chief Compliance Officer’s fees | | | 24 | | | | 17 | |
Printing and mailing costs | | | 20 | | | | 12 | |
Registration and filing fees | | | 61 | | | | 7 | |
Transfer agency fees (See Note 2.F.) | | | 24 | | | | — | (b) |
Sub-transfer agency fees (See Note 2.F.) | | | 62 | | | | — | |
Offering costs | | | — | | | | 63 | |
Other | | | 10 | | | | 5 | |
| | | | | | | | |
Total expenses | | | 3,147 | | | | 239 | |
| | | | | | | | |
Less fees waived | | | (991 | ) | | | (51 | ) |
Less expense reimbursements | | | — | | | | (158 | ) |
| | | | | | | | |
Net expenses | | | 2,156 | | | | 30 | |
| | | | | | | | |
Net investment income (loss) | | | 10,671 | | | | 82 | |
| | | | | | | | |
| | |
REALIZED/UNREALIZED GAINS (LOSSES): | | | | | | | | |
Net realized gain (loss) on transactions from: | | | | | | | | |
Investments in non-affiliates | | | 2,970 | | | | — | (b) |
Futures | | | 62 | | | | — | |
| | | | | | | | |
Net realized gain (loss) | | | 3,032 | | | | — | (b) |
| | | | | | | | |
Change in net unrealized appreciation/depreciation on: | | | | | | | | |
Investments in non-affiliates | | | (15,340 | ) | | | 40 | |
Futures | | | (16 | ) | | | — | |
| | | | | | | | |
Change in net unrealized appreciation/depreciation | | | (15,356 | ) | | | 40 | |
| | | | | | | | |
Net realized/unrealized gains (losses) | | | (12,324 | ) | | | 40 | |
| | | | | | | | |
Change in net assets resulting from operations | | $ | (1,653 | ) | | $ | 122 | |
| | | | | | | | |
| (a) | Commencement of operations was May 31, 2016. |
| (b) | Amount rounds to less than 500. |
SEE NOTES TO FINANCIAL STATEMENTS.
| | | | | | | | |
| | | |
| FEBRUARY 28, 2017 | | J.P. MORGAN MUNICIPAL BOND FUNDS | | | | | 71 | |
STATEMENTS OF CHANGES IN NET ASSETS
FOR THE PERIODS INDICATED
(Amounts in thousands)
| | | | | | | | | | | | | | | | |
| | |
Municipal Income Fund | | | Ohio Municipal Bond Fund | |
| | | Year Ended
February 28, 2017 | | | Year Ended
February 29, 2016 | | | Year Ended
February 28, 2017 | | | Year Ended
February 29, 2016 | |
CHANGE IN NET ASSETS RESULTING FROM OPERATIONS: | | | | | | | | | | | | | | | | |
Net investment income (loss) | | $ | 7,668 | | | $ | 8,523 | | | $ | 3,434 | | | $ | 3,902 | |
Net realized gain (loss) | | | 4,031 | | | | 2,323 | | | | 466 | | | | 881 | |
Distributions of capital gains received from investment company affiliates | | | — | | | | 2 | | | | — | | | | — | (a) |
Change in net unrealized appreciation/depreciation | | | (12,606 | ) | | | (284 | ) | | | (4,710 | ) | | | (1,269 | ) |
| | | | | | | | | | | | | | | | |
Change in net assets resulting from operations | | | (907 | ) | | | 10,564 | | | | (810 | ) | | | 3,514 | |
| | | | | | | | | | | | | | | | |
| | | | |
DISTRIBUTIONS TO SHAREHOLDERS: | | | | | | | | | | | | | | | | |
Class A | | | | | | | | | | | | | | | | |
From net investment income | | | (1,923 | ) | | | (1,746 | ) | | | (1,347 | ) | | | (1,480 | ) |
From net realized gains | | | (925 | ) | | | (513 | ) | | | (275 | ) | | | (470 | ) |
Class B (b) | | | | | | | | | | | | | | | | |
From net investment income | | | — | | | | — | (a) | | | — | | | | (3 | ) |
Class C | | | | | | | | | | | | | | | | |
From net investment income | | | (339 | ) | | | (289 | ) | | | (582 | ) | | | (604 | ) |
From net realized gains | | | (217 | ) | | | (105 | ) | | | (159 | ) | | | (240 | ) |
Class I (formerly Select Class) | | | | | | | | | | | | | | | | |
From net investment income | | | (5,493 | ) | | | (6,683 | ) | | | (1,536 | ) | | | (1,922 | ) |
From net realized gains | | | (2,361 | ) | | | (1,813 | ) | | | (280 | ) | | | (526 | ) |
| | | | | | | | | | | | | | | | |
Total distributions to shareholders | | | (11,258 | ) | | | (11,149 | ) | | | (4,179 | ) | | | (5,245 | ) |
| | | | | | | | | | | | | | | | |
| | | | |
CAPITAL TRANSACTIONS: | | | | | | | | | | | | | | | | |
Change in net assets resulting from capital transactions | | | (51,958 | ) | | | (2,140 | ) | | | (5,868 | ) | | | (15,915 | ) |
| | | | | | | | | | | | | | | | |
| | | | |
NET ASSETS: | | | | | | | | | | | | | | | | |
Change in net assets | | | (64,123 | ) | | | (2,725 | ) | | | (10,857 | ) | | | (17,646 | ) |
Beginning of period | | | 334,934 | | | | 337,659 | | | | 132,283 | | | | 149,929 | |
| | | | | | | | | | | | | | | | |
End of period | | $ | 270,811 | | | $ | 334,934 | | | $ | 121,426 | | | $ | 132,283 | |
| | | | | | | | | | | | | | | | |
Accumulated undistributed (distributions in excess of) net investment income | | $ | (19 | ) | | $ | 68 | | | $ | (3 | ) | | $ | 28 | |
| | | | | | | | | | | | | | | | |
| (a) | Amount rounds to less than 500. |
| (b) | All remaining Class B Shares converted to Class A Shares on June 19, 2015. |
SEE NOTES TO FINANCIAL STATEMENTS.
| | | | | | |
| | | |
| 72 | | | | J.P. MORGAN MUNICIPAL BOND FUNDS | | FEBRUARY 28, 2017 |
| | | | | | | | | | | | | | | | |
| | |
Short-Intermediate Municipal Bond Fund | | | Tax Free Bond Fund | |
| | | Year Ended
February 28, 2017 | | | Year Ended
February 29, 2016 | | | Year Ended
February 28, 2017 | | | Year Ended
February 29, 2016 | |
CHANGE IN NET ASSETS RESULTING FROM OPERATIONS: | | | | | | | | | | | | | | | | |
Net investment income (loss) | | $ | 32,008 | | | $ | 36,155 | | | $ | 10,671 | | | $ | 11,022 | |
Net realized gain (loss) | | | 1,510 | | | | 4,455 | | | | 3,032 | | | | 3,539 | |
Distributions of capital gains received from investment company affiliates | | | — | | | | 3 | | | | — | | | | 2 | |
Change in net unrealized appreciation/depreciation | | | (41,497 | ) | | | 22,057 | | | | (15,356 | ) | | | (4,498 | ) |
| | | | | | | | | | | | | | | | |
Change in net assets resulting from operations | | | (7,979 | ) | | | 62,670 | | | | (1,653 | ) | | | 10,065 | |
| | | | | | | | | | | | | | | | |
| | | | |
DISTRIBUTIONS TO SHAREHOLDERS: | | | | | | | | | | | | | | | | |
Class A | | | | | | | | | | | | | | | | |
From net investment income | | | (351 | ) | | | (279 | ) | | | (5,043 | ) | | | (5,422 | ) |
From net realized gains | | | (190 | ) | | | — | | | | (3,145 | ) | | | (1,137 | ) |
Class B (a) | | | | | | | | | | | | | | | | |
From net investment income | | | — | | | | — | (b) | | | — | | | | (3 | ) |
Class C | | | | | | | | | | | | | | | | |
From net investment income | | | (69 | ) | | | (34 | ) | | | (838 | ) | | | (774 | ) |
From net realized gains | | | (81 | ) | | | — | | | | (678 | ) | | | (190 | ) |
Institutional Class* | | | | | | | | | | | | | | | | |
From net investment income | | | (30,151 | ) | | | (34,727 | ) | | | — | | | | — | |
From net realized gains | | | (10,500 | ) | | | — | | | | — | | | | — | |
Select Class* | | | | | | | | | | | | | | | | |
From net investment income | | | (1,914 | ) | | | (1,502 | ) | | | (4,773 | ) | | | (5,128 | ) |
From net realized gains | | | (790 | ) | | | — | | | | (2,991 | ) | | | (966 | ) |
| | | | | | | | | | | | | | | | |
Total distributions to shareholders | | | (44,046 | ) | | | (36,542 | ) | | | (17,468 | ) | | | (13,620 | ) |
| | | | | | | | | | | | | | | | |
| | | | |
CAPITAL TRANSACTIONS: | | | | | | | | | | | | | | | | |
Change in net assets resulting from capital transactions | | | (532,349 | ) | | | (450,440 | ) | | | 36,503 | | | | (35,086 | ) |
| | | | | | | | | | | | | | | | |
| | | | |
NET ASSETS: | | | | | | | | | | | | | | | | |
Change in net assets | | | (584,374 | ) | | | (424,312 | ) | | | 17,382 | | | | (38,641 | ) |
Beginning of period | | | 2,660,412 | | | | 3,084,724 | | | | 305,013 | | | | 343,654 | |
| | | | | | | | | | | | | | | | |
End of period | | $ | 2,076,038 | | | $ | 2,660,412 | | | $ | 322,395 | | | $ | 305,013 | |
| | | | | | | | | | | | | | | | |
Accumulated undistributed (distributions in excess of) net investment income | | $ | (17 | ) | | $ | 462 | | | $ | (9 | ) | | $ | (26 | ) |
| | | | | | | | | | | | | | | | |
| (a) | All remaining Class B Shares converted to Class A Shares on June 19, 2015. |
| (b) | Amount rounds to less than 500. |
| * | Effective April 3, 2017, the Institutional Class of Short-Intermediate Municipal Bond Fund and the Select Class of Tax Free Bond Fund were renamed Class I. |
SEE NOTES TO FINANCIAL STATEMENTS.
| | | | | | | | |
| | | |
| FEBRUARY 28, 2017 | | J.P. MORGAN MUNICIPAL BOND FUNDS | | | | | 73 | |
STATEMENTS OF CHANGES IN NET ASSETS
FOR THE PERIODS INDICATED (continued)
(Amounts in thousands)
| | | | |
| | |
Ultra-Short Municipal Fund | |
| | | Period Ended
February 28, 2017 (a) | |
CHANGE IN NET ASSETS RESULTING FROM OPERATIONS: | | | | |
Net investment income (loss) | | $ | 82 | |
Net realized gain (loss) | | | — | (b) |
Change in net unrealized appreciation/depreciation | | | 40 | |
| | | | |
Change in net assets resulting from operations | | | 122 | |
| | | | |
| |
DISTRIBUTIONS TO SHAREHOLDERS: | | | | |
Class A | | | | |
From net investment income | | | (1 | ) |
Class I (formerly Select Class) | | | | |
From net investment income | | | (79 | ) |
| | | | |
Total distributions to shareholders | | | (80 | ) |
| | | | |
| |
CAPITAL TRANSACTIONS: | | | | |
Change in net assets resulting from capital transactions | | | 22,133 | |
| | | | |
| |
NET ASSETS: | | | | |
Change in net assets | | | 22,175 | |
Beginning of period (See Note 1) | | | 10,000 | |
| | | | |
End of period | | $ | 32,175 | |
| | | | |
Accumulated undistributed (distributions in excess of) net investment income | | $ | 2 | |
| | | | |
| (a) | Commencement of operations was May 31, 2016. |
| (b) | Amount rounds to less than 500. |
SEE NOTES TO FINANCIAL STATEMENTS.
| | | | | | |
| | | |
| 74 | | | | J.P. MORGAN MUNICIPAL BOND FUNDS | | FEBRUARY 28, 2017 |
| | | | | | | | | | | | | | | | |
| | |
Municipal Income Fund | | | Ohio Municipal Bond Fund | |
| | | Year Ended
February 28, 2017 | | | Year Ended
February 29, 2016 | | | Year Ended
February 28, 2017 | | | Year Ended
February 29, 2016 | |
CAPITAL TRANSACTIONS: | | | | | | | | | | | | | | | | |
Class A | | | | | | | | | | | | | | | | |
Proceeds from shares issued | | $ | 23,344 | | | $ | 16,000 | | | $ | 2,462 | | | $ | 3,024 | |
Distributions reinvested | | | 2,795 | | | | 2,210 | | | | 1,517 | | | | 1,825 | |
Cost of shares redeemed | | | (19,384 | ) | | | (13,070 | ) | | | (5,847 | ) | | | (5,644 | ) |
Conversion from Class B Shares | | | — | | | | 31 | | | | — | | | | 459 | |
| | | | | | | | | | | | | | | | |
Change in net assets resulting from Class A capital transactions | | $ | 6,755 | | | $ | 5,171 | | | $ | (1,868 | ) | | $ | (336 | ) |
| | | | | | | | | | | | | | | | |
Class B (a) | | | | | | | | | | | | | | | | |
Proceeds from shares issued | | $ | — | | | $ | — | (b) | | $ | — | | | $ | 1 | |
Distributions reinvested | | | — | | | | — | (b) | | | — | | | | 2 | |
Cost of shares redeemed | | | — | | | | (10 | ) | | | — | | | | (72 | ) |
Conversion to Class A Shares | | | — | | | | (31 | ) | | | — | | | | (459 | ) |
| | | | | | | | | | | | | | | | |
Change in net assets resulting from Class B capital transactions | | $ | — | | | $ | (41 | ) | | $ | — | | | $ | (528 | ) |
| | | | | | | | | | | | | | | | |
Class C | | | | | | | | | | | | | | | | |
Proceeds from shares issued | | $ | 6,745 | | | $ | 4,893 | | | $ | 4,603 | | | $ | 2,398 | |
Distributions reinvested | | | 497 | | | | 346 | | | | 712 | | | | 815 | |
Cost of shares redeemed | | | (5,290 | ) | | | (3,716 | ) | | | (3,828 | ) | | | (3,608 | ) |
| | | | | | | | | | | | | | | | |
Change in net assets resulting from Class C capital transactions | | $ | 1,952 | | | $ | 1,523 | | | $ | 1,487 | | | $ | (395 | ) |
| | | | | | | | | | | | | | | | |
Class I (formerly Select Class) | | | | | | | | | | | | | | | | |
Proceeds from shares issued | | $ | 48,297 | | | $ | 87,128 | | | $ | 6,807 | | | $ | 5,370 | |
Distributions reinvested | | | 1,190 | | | | 1,019 | | | | 1,412 | | | | 1,753 | |
Cost of shares redeemed | | | (110,152 | ) | | | (96,940 | ) | | | (13,706 | ) | | | (21,779 | ) |
| | | | | | | | | | | | | | | | |
Change in net assets resulting from Class I capital transactions | | $ | (60,665 | ) | | $ | (8,793 | ) | | $ | (5,487 | ) | | $ | (14,656 | ) |
| | | | | | | | | | | | | | | | |
Total change in net assets resulting from capital transactions | | $ | (51,958 | ) | | $ | (2,140 | ) | | $ | (5,868 | ) | | $ | (15,915 | ) |
| | | | | | | | | | | | | | | | |
| (a) | All remaining Class B Shares converted to Class A Shares on June 19, 2015. |
| (b) | Amount rounds to less than 500. |
SEE NOTES TO FINANCIAL STATEMENTS.
| | | | | | | | |
| | | |
| FEBRUARY 28, 2017 | | J.P. MORGAN MUNICIPAL BOND FUNDS | | | | | 75 | |
STATEMENTS OF CHANGES IN NET ASSETS
FOR THE PERIODS INDICATED (continued)
(Amounts in thousands)
| | | | | | | | | | | | | | | | |
| | |
Municipal Income Fund | | | Ohio Municipal Bond Fund | |
| | | Year Ended
February 28, 2017 | | | Year Ended
February 29, 2016 | | | Year Ended
February 28, 2017 | | | Year Ended
February 29, 2016 | |
SHARE TRANSACTIONS: | | | | | | | | | | | | | | | | |
Class A | | | | | | | | | | | | | | | | |
Issued | | | 2,330 | | | | 1,592 | | | | 225 | | | | 274 | |
Reinvested | | | 284 | | | | 221 | | | | 140 | | | | 166 | |
Redeemed | | | (1,950 | ) | | | (1,302 | ) | | | (537 | ) | | | (512 | ) |
Conversion from Class B Shares | | | — | | | | 3 | | | | — | | | | 42 | |
| | | | | | | | | | | | | | | | |
Change in Class A Shares | | | 664 | | | | 514 | | | | (172 | ) | | | (30 | ) |
| | | | | | | | | | | | | | | | |
Class B (a) | | | | | | | | | | | | | | | | |
Issued | | | — | | | | — | (b) | | | — | | | | 1 | |
Reinvested | | | — | | | | — | (b) | | | — | | | | — | (b) |
Redeemed | | | — | | | | (1 | ) | | | — | | | | (7 | ) |
Conversion to Class A Shares | | | — | | | | (3 | ) | | | — | | | | (41 | ) |
| | | | | | | | | | | | | | | | |
Change in Class B Shares | | | — | | | | (4 | ) | | | — | | | | (47 | ) |
| | | | | | | | | | | | | | | | |
Class C | | | | | | | | | | | | | | | | |
Issued | | | 678 | | | | 489 | | | | 417 | | | | 216 | |
Reinvested | | | 51 | | | | 35 | | | | 66 | | | | 74 | |
Redeemed | | | (539 | ) | | | (374 | ) | | | (353 | ) | | | (326 | ) |
| | | | | | | | | | | | | | | | |
Change in Class C Shares | | | 190 | | | | 150 | | | | 130 | | | | (36 | ) |
| | | | | | | | | | | | | | | | |
Class I (formerly Select Class) | | | | | | | | | | | | | | | | |
Issued | | | 4,864 | | | | 8,731 | | | | 630 | | | | 490 | |
Reinvested | | | 121 | | | | 102 | | | | 132 | | | | 160 | |
Redeemed | | | (11,124 | ) | | | (9,723 | ) | | | (1,273 | ) | | | (1,986 | ) |
| | | | | | | | | | | | | | | | |
Change in Class I Shares | | | (6,139 | ) | | | (890 | ) | | | (511 | ) | | | (1,336 | ) |
| | | | | | | | | | | | | | | | |
| (a) | All remaining Class B Shares converted to Class A Shares on June 19, 2015. |
| (b) | Amount rounds to less than 500. |
SEE NOTES TO FINANCIAL STATEMENTS.
| | | | | | |
| | | |
| 76 | | | | J.P. MORGAN MUNICIPAL BOND FUNDS | | FEBRUARY 28, 2017 |
| | | | | | | | | | | | | | | | |
| | |
Short-Intermediate Municipal Bond Fund | | | Tax Free Bond Fund | |
| | | Year Ended
February 28, 2017 | | | Year Ended
February 29, 2016 | | | Year Ended
February 28, 2017 | | | Year Ended
February 29, 2016 | |
CAPITAL TRANSACTIONS: | | | | | | | | | | | | | | | | |
Class A | | | | | | | | | | | | | | | | |
Proceeds from shares issued | | $ | 11,600 | | | $ | 9,633 | | | $ | 45,224 | | | $ | 37,119 | |
Distributions reinvested | | | 530 | | | | 269 | | | | 7,911 | | | | 6,297 | |
Cost of shares redeemed | | | (19,048 | ) | | | (12,393 | ) | | | (47,813 | ) | | | (56,410 | ) |
Conversion from Class B Shares | | | — | | | | 40 | | | | — | | | | 381 | |
| | | | | | | | | | | | | | | | |
Change in net assets resulting from Class A capital transactions | | $ | (6,918 | ) | | $ | (2,451 | ) | | $ | 5,322 | | | $ | (12,613 | ) |
| | | | | | | | | | | | | | | | |
Class B (a) | | | | | | | | | | | | | | | | |
Proceeds from shares issued | | $ | — | | | $ | — | (b) | | $ | — | | | $ | — | (b) |
Distributions reinvested | | | — | | | | — | (b) | | | — | | | | 3 | |
Cost of shares redeemed | | | — | | | | — | | | | — | | | | (228 | ) |
Conversion to Class A Shares | | | — | | | | (40 | ) | | | — | | | | (381 | ) |
| | | | | | | | | | | | | | | | |
Change in net assets resulting from Class B capital transactions | | $ | — | | | $ | (40 | ) | | $ | — | | | $ | (606 | ) |
| | | | | | | | | | | | | | | | |
Class C | | | | | | | | | | | | | | | | |
Proceeds from shares issued | | $ | 2,753 | | | $ | 6,849 | | | $ | 16,584 | | | $ | 5,451 | |
Distributions reinvested | | | 134 | | | | 30 | | | | 1,490 | | | | 947 | |
Cost of shares redeemed | | | (6,226 | ) | | | (7,401 | ) | | | (10,720 | ) | | | (6,982 | ) |
| | | | | | | | | | | | | | | | |
Change in net assets resulting from Class C capital transactions | | $ | (3,339 | ) | | $ | (522 | ) | | $ | 7,354 | | | $ | (584 | ) |
| | | | | | | | | | | | | | | | |
Institutional Class* | | | | | | | | | | | | | | | | |
Proceeds from shares issued | | $ | 647,799 | | | $ | 1,058,123 | | | $ | — | | | $ | — | |
Distributions reinvested | | | 10,099 | | | | 5,951 | | | | — | | | | — | |
Cost of shares redeemed | | | (1,176,872 | ) | | | (1,492,628 | ) | | | — | | | | — | |
| | | | | | | | | | | | | | | | |
Change in net assets resulting from Institutional Class capital transactions | | $ | (518,974 | ) | | $ | (428,554 | ) | | $ | — | | | $ | — | |
| | | | | | | | | | | | | | | | |
Select Class* | | | | | | | | | | | | | | | | |
Proceeds from shares issued | | $ | 39,141 | | | $ | 47,246 | | | $ | 72,909 | | | $ | 27,990 | |
Distributions reinvested | | | 415 | | | | 286 | | | | 4,095 | | | | 2,391 | |
Cost of shares redeemed | | | (42,674 | ) | | | (66,405 | ) | | | (53,177 | ) | | | (51,664 | ) |
| | | | | | | | | | | | | | | | |
Change in net assets resulting from
Select Class capital transactions | | $ | (3,118 | ) | | $ | (18,873 | ) | | $ | 23,827 | | | $ | (21,283 | ) |
| | | | | | | | | | | | | | | | |
Total change in net assets resulting from capital transactions | | $ | (532,349 | ) | | $ | (450,440 | ) | | $ | 36,503 | | | $ | (35,086 | ) |
| | | | | | | | | | | | | | | | |
| (a) | All remaining Class B Shares converted to Class A Shares on June 19, 2015. |
| (b) | Amount rounds to less than 500. |
| * | Effective April 3, 2017, the Institutional Class of Short-Intermediate Municipal Bond Fund and the Select Class of Tax Free Bond Fund were renamed Class I. |
SEE NOTES TO FINANCIAL STATEMENTS.
| | | | | | | | |
| | | |
| FEBRUARY 28, 2017 | | J.P. MORGAN MUNICIPAL BOND FUNDS | | | | | 77 | |
STATEMENTS OF CHANGES IN NET ASSETS
FOR THE PERIODS INDICATED (continued)
(Amounts in thousands)
| | | | | | | | | | | | | | | | |
| | |
Short-Intermediate Municipal Bond Fund | | | Tax Free Bond Fund | |
| | | Year Ended
February 28, 2017 | | | Year Ended
February 29, 2016 | | | Year Ended
February 28, 2017 | | | Year Ended
February 29, 2016 | |
SHARE TRANSACTIONS: | | | | | | | | | | | | | | | | |
Class A | | | | | | | | | | | | | | | | |
Issued | | | 1,086 | | | | 910 | | | | 3,575 | | | | 2,962 | |
Reinvested | | | 50 | | | | 25 | | | | 647 | | | | 503 | |
Redeemed | | | (1,802 | ) | | | (1,170 | ) | | | (3,839 | ) | | | (4,496 | ) |
Conversion from Class B Shares | | | — | | | | 4 | | | | — | | | | 31 | |
| | | | | | | | | | | | | | | | |
Change in Class A Shares | | | (666 | ) | | | (231 | ) | | | 383 | | | | (1,000 | ) |
| | | | | | | | | | | | | | | | |
Class B (a) | | | | | | | | | | | | | | | | |
Issued | | | — | | | | — | (b) | | | — | | | | — | (b) |
Reinvested | | | — | | | | — | (b) | | | — | | | | — | (b) |
Redeemed | | | — | | | | — | | | | — | | | | (18 | ) |
Conversion to Class A Shares | | | — | | | | (4 | ) | | | — | | | | (31 | ) |
| | | | | | | | | | | | | | | | |
Change in Class B Shares | | | — | | | | (4 | ) | | | — | | | | (49 | ) |
| | | | | | | | | | | | | | | | |
Class C | | | | | | | | | | | | | | | | |
Issued | | | 256 | | | | 640 | | | | 1,317 | | | | 437 | |
Reinvested | | | 13 | | | | 3 | | | | 124 | | | | 76 | |
Redeemed | | | (583 | ) | | | (692 | ) | | | (873 | ) | | | (561 | ) |
| | | | | | | | | | | | | | | | |
Change in Class C Shares | | | (314 | ) | | | (49 | ) | | | 568 | | | | (48 | ) |
| | | | | | | | | | | | | | | | |
Institutional Class* | | | | | | | | | | | | | | | | |
Issued | | | 60,721 | | | | 99,256 | | | | — | | | | — | |
Reinvested | | | 952 | | | | 558 | | | | — | | | | — | |
Redeemed | | | (110,395 | ) | | | (139,661 | ) | | | — | | | | — | |
| | | | | | | | | | | | | | | | |
Change in Institutional Class Shares | | | (48,722 | ) | | | (39,847 | ) | | | — | | | | — | |
| | | | | | | | | | | | | | | | |
Select Class* | | | | | | | | | | | | | | | | |
Issued | | | 3,664 | | | | 4,432 | | | | 5,838 | | | | 2,236 | |
Reinvested | | | 39 | | | | 27 | | | | 337 | | | | 192 | |
Redeemed | | | (4,018 | ) | | | (6,244 | ) | | | (4,344 | ) | | | (4,147 | ) |
| | | | | | | | | | | | | | | | |
Change in Select Class Shares | | | (315 | ) | | | (1,785 | ) | | | 1,831 | | | | (1,719 | ) |
| | | | | | | | | | | | | | | | |
| (a) | All remaining Class B Shares converted to Class A Shares on June 19, 2015. |
| (b) | Amount rounds to less than 500. |
| * | Effective April 3, 2017, the Institutional Class of Short-Intermediate Municipal Bond Fund and the Select Class of Tax Free Bond Fund were renamed Class I. |
SEE NOTES TO FINANCIAL STATEMENTS.
| | | | | | |
| | | |
| 78 | | | | J.P. MORGAN MUNICIPAL BOND FUNDS | | FEBRUARY 28, 2017 |
| | | | |
| | |
Ultra-Short Municipal Fund | |
| | | Period Ended
February 28, 2017 (a) | |
CAPITAL TRANSACTIONS: | | | | |
Class A | | | | |
Proceeds from shares issued | | $ | 599 | |
Distributions reinvested | | | — | (b) |
Cost of shares redeemed | | | (100 | ) |
| | | | |
Change in net assets resulting from Class A capital transactions | | $ | 499 | |
| | | | |
Class I (formerly Select Class) | | | | |
Proceeds from shares issued | | $ | 21,948 | |
Distributions reinvested | | | 46 | |
Cost of shares redeemed | | | (360 | ) |
| | | | |
Change in net assets resulting from Class I capital transactions | | $ | 21,634 | |
| | | | |
Total change in net assets resulting from capital transactions | | $ | 22,133 | |
| | | | |
| |
SHARE TRANSACTIONS: | | | | |
Class A | | | | |
Issued | | | 60 | |
Reinvested | | | — | (b) |
Redeemed | | | (10 | ) |
| | | | |
Change in Class A Shares | | | 50 | |
| | | | |
Class I (formerly Select Class) | | | | |
Issued | | | 2,193 | |
Reinvested | | | 5 | |
Redeemed | | | (36 | ) |
| | | | |
Change in Class I Shares | | | 2,162 | |
| | | | |
| (a) | Commencement of operations was May 31, 2016. |
| (b) | Amount rounds to less than 500. |
SEE NOTES TO FINANCIAL STATEMENTS.
| | | | | | | | |
| | | |
| FEBRUARY 28, 2017 | | J.P. MORGAN MUNICIPAL BOND FUNDS | | | | | 79 | |
FINANCIAL HIGHLIGHTS
FOR THE PERIODS INDICATED
| | | | | | | | | | | | | | | | | | | | | | | | | | | | |
| | | Per share operating performance | |
| | | | | | Investment operations | | | Distributions | |
| | | Net asset
value,
beginning
of period | | | Net
investment
income
(loss) (a) | | |
Net realized
and unrealized
gains
(losses) on
investments | | | Total from
investment
operations | | | Net
investment
income | | | Net
realized
gain | | | Total
distributions | |
Municipal Income Fund | | | | | | | | | | | | | | | | | | | | | | | | | | | | |
Class A | | | | | | | | | |
Year Ended February 28, 2017 | | $ | 10.10 | | | $ | 0.24 | | | $ | (0.28 | ) | | $ | (0.04 | ) | | $ | (0.24 | ) | | $ | (0.12 | ) | | $ | (0.36 | ) |
Year Ended February 29, 2016 | | | 10.11 | | | | 0.25 | | | | 0.08 | | | | 0.33 | | | | (0.26 | ) | | | (0.08 | ) | | | (0.34 | ) |
Year Ended February 28, 2015 | | | 9.98 | | | | 0.27 | | | | 0.18 | | | | 0.45 | | | | (0.27 | ) | | | (0.05 | ) | | | (0.32 | ) |
Year Ended February 28, 2014 | | | 10.41 | | | | 0.28 | | | | (0.28 | ) | | | — | (e) | | | (0.29 | ) | | | (0.14 | ) | | | (0.43 | ) |
Year Ended February 28, 2013 | | | 10.35 | | | | 0.29 | | | | 0.05 | | | | 0.34 | | | | (0.28 | ) | | | — | | | | (0.28 | ) |
| | |
Class C | | | | | | | | | |
Year Ended February 28, 2017 | | | 10.00 | | | | 0.18 | | | | (0.26 | ) | | | (0.08 | ) | | | (0.19 | ) | | | (0.12 | ) | | | (0.31 | ) |
Year Ended February 29, 2016 | | | 10.02 | | | | 0.19 | | | | 0.07 | | | | 0.26 | | | | (0.20 | ) | | | (0.08 | ) | | | (0.28 | ) |
Year Ended February 28, 2015 | | | 9.90 | | | | 0.21 | | | | 0.17 | | | | 0.38 | | | | (0.21 | ) | | | (0.05 | ) | | | (0.26 | ) |
Year Ended February 28, 2014 | | | 10.33 | | | | 0.22 | | | | (0.28 | ) | | | (0.06 | ) | | | (0.23 | ) | | | (0.14 | ) | | | (0.37 | ) |
Year Ended February 28, 2013 | | | 10.27 | | | | 0.23 | | | | 0.06 | | | | 0.29 | | | | (0.23 | ) | | | — | | | | (0.23 | ) |
|
Class I (formerly Select Class) | |
Year Ended February 28, 2017 | | | 10.03 | | | | 0.26 | | | | (0.27 | ) | | | (0.01 | ) | | | (0.27 | ) | | | (0.12 | ) | | | (0.39 | ) |
Year Ended February 29, 2016 | | | 10.04 | | | | 0.28 | | | | 0.07 | | | | 0.35 | | | | (0.28 | ) | | | (0.08 | ) | | | (0.36 | ) |
Year Ended February 28, 2015 | | | 9.92 | | | | 0.29 | | | | 0.17 | | | | 0.46 | | | | (0.29 | ) | | | (0.05 | ) | | | (0.34 | ) |
Year Ended February 28, 2014 | | | 10.35 | | | | 0.30 | | | | (0.27 | ) | | | 0.03 | | | | (0.32 | ) | | | (0.14 | ) | | | (0.46 | ) |
Year Ended February 28, 2013 | | | 10.29 | | | | 0.31 | | | | 0.06 | | | | 0.37 | | | | (0.31 | ) | | | — | | | | (0.31 | ) |
| (a) | Calculated based upon average shares outstanding. |
| (b) | Includes adjustments in accordance with accounting principles generally accepted in the United States of America and as such, the net asset values for financial reporting purposes and the returns based upon those net asset values may differ from the net asset values and returns for shareholder transactions. |
| (c) | Includes earnings credits and interest expense, if applicable, each of which is less than 0.005% unless otherwise noted. |
| (d) | Portfolio turnover is calculated by dividing the lesser of total purchases or sales of portfolio securities for the reporting period by the monthly average value of portfolio securities owned during the reporting period. Excluded from both the numerator and denominator are amounts relating to derivatives and securities whose maturities or expiration dates at the time of acquisition were one year or less. |
| (e) | Amount rounds to less than $0.005. |
SEE NOTES TO FINANCIAL STATEMENTS.
| | | | | | |
| | | |
| 80 | | | | J.P. MORGAN MUNICIPAL BOND FUNDS | | FEBRUARY 28, 2017 |
| | | | | | | | | | | | | | | | | | | | | | | | | | |
| | | Ratios/Supplemental data | |
| | | | | | | | | | Ratios to average net assets | | | | |
Net asset
value,
end of
period | | | Total return
(excludes
sales charge) (b) | | | Net assets,
end of
period
(000’s) | | | Net expenses
(including
imputed
interest) (c) | | | Net
investment
income
(loss) | | | Expenses
without waivers,
reimbursements and
earnings credits
(including imputed
interest) | | | Portfolio
turnover
rate (d) | |
| | | | | | | | | | | | | | | | | | | | | | | | | | |
| | | | | | | | | | | | | | | | | | | | | | | | | | |
| $ | 9.70 | | | | (0.40 | )% | | $ | 76,684 | | | | 0.77 | % | | | 2.39 | % | | | 1.00 | % | | | 15 | % |
| | 10.10 | | | | 3.26 | | | | 73,120 | | | | 0.82 | | | | 2.52 | | | | 0.97 | | | | 22 | |
| | 10.11 | | | | 4.47 | | | | 68,003 | | | | 0.86 | | | | 2.65 | | | | 0.97 | | | | 9 | |
| | 9.98 | | | | 0.13 | | | | 64,327 | | | | 0.87 | | | | 2.78 | | | | 0.94 | | | | 3 | |
| | 10.41 | | | | 3.35 | | | | 86,839 | | | | 0.86 | | | | 2.76 | | | | 0.92 | | | | 13 | |
| | | | | | |
| | | | | | | | | | | | | | | | | | | | | | | | | | |
| | 9.61 | | | | (0.87 | ) | | | 17,137 | | | | 1.34 | | | | 1.83 | | | | 1.50 | | | | 15 | |
| | 10.00 | | | | 2.61 | | | | 15,950 | | | | 1.39 | | | | 1.95 | | | | 1.48 | | | | 22 | |
| | 10.02 | | | | 3.81 | | | | 14,462 | | | | 1.44 | | | | 2.07 | | | | 1.47 | | | | 9 | |
| | 9.90 | | | | (0.45 | ) | | | 15,425 | | | | 1.44 | | | | 2.20 | | | | 1.44 | | | | 3 | |
| | 10.33 | | | | 2.80 | | | | 26,248 | | | | 1.42 | | | | 2.21 | | | | 1.42 | | | | 13 | |
| | | | | | |
| | | | | | | | | | | | | | | | | | | | | | | | | | |
| | 9.63 | | | | (0.16 | ) | | | 176,990 | | | | 0.53 | | | | 2.64 | | | | 0.72 | | | | 15 | |
| | 10.03 | | | | 3.56 | | | | 245,864 | | | | 0.57 | | | | 2.77 | | | | 0.70 | | | | 22 | |
| | 10.04 | | | | 4.66 | | | | 255,153 | | | | 0.61 | | | | 2.91 | | | | 0.71 | | | | 9 | |
| | 9.92 | | | | 0.38 | | | | 279,537 | | | | 0.62 | | | | 3.02 | | | | 0.69 | | | | 3 | |
| | 10.35 | | | | 3.61 | | | | 483,257 | | | | 0.62 | | | | 3.01 | | | | 0.67 | | | | 13 | |
SEE NOTES TO FINANCIAL STATEMENTS.
| | | | | | | | |
| | | |
| FEBRUARY 28, 2017 | | J.P. MORGAN MUNICIPAL BOND FUNDS | | | | | 81 | |
FINANCIAL HIGHLIGHTS
FOR THE PERIODS INDICATED (continued)
| | | | | | | | | | | | | | | | | | | | | | | | | | | | |
| | | Per share operating performance | |
| | | | | | Investment operations | | | Distributions | |
| | | Net asset
value,
beginning
of period | | | Net
investment
income
(loss) (a) | | | Net realized
and unrealized
gains
(losses) on
investments | | | Total from
investment
operations | | | Net
investment
income | | | Net
realized
gain | | | Total
distributions | |
Ohio Municipal Bond Fund | | | | | | | | | | | | | | | | | | | | | | | | | | | | |
Class A | | | | | | | | | |
Year Ended February 28, 2017 | | $ | 11.01 | | | $ | 0.29 | | | $ | (0.35 | ) | | $ | (0.06 | ) | | $ | (0.30 | ) | | $ | (0.06 | ) | | $ | (0.36 | ) |
Year Ended February 29, 2016 | | | 11.14 | | | | 0.31 | | | | (0.02 | ) | | | 0.29 | | | | (0.32 | ) | | | (0.10 | ) | | | (0.42 | ) |
Year Ended February 28, 2015 | | | 11.17 | | | | 0.32 | | | | 0.06 | | | | 0.38 | | | | (0.33 | ) | | | (0.08 | ) | | | (0.41 | ) |
Year Ended February 28, 2014 | | | 11.51 | | | | 0.32 | | | | (0.34 | ) | | | (0.02 | ) | | | (0.32 | ) | | | — | (e) | | | (0.32 | ) |
Year Ended February 28, 2013 | | | 11.50 | | | | 0.32 | | | | 0.01 | | | | 0.33 | | | | (0.31 | ) | | | (0.01 | ) | | | (0.32 | ) |
| | |
Class C | | | | | | | | | |
Year Ended February 28, 2017 | | | 11.07 | | | | 0.23 | | | | (0.36 | ) | | | (0.13 | ) | | | (0.23 | ) | | | (0.06 | ) | | | (0.29 | ) |
Year Ended February 29, 2016 | | | 11.19 | | | | 0.25 | | | | (0.02 | ) | | | 0.23 | | | | (0.25 | ) | | | (0.10 | ) | | | (0.35 | ) |
Year Ended February 28, 2015 | | | 11.22 | | | | 0.26 | | | | 0.05 | | | | 0.31 | | | | (0.26 | ) | | | (0.08 | ) | | | (0.34 | ) |
Year Ended February 28, 2014 | | | 11.56 | | | | 0.25 | | | | (0.33 | ) | | | (0.08 | ) | | | (0.26 | ) | | | — | (e) | | | (0.26 | ) |
Year Ended February 28, 2013 | | | 11.55 | | | | 0.25 | | | | 0.01 | | | | 0.26 | | | | (0.24 | ) | | | (0.01 | ) | | | (0.25 | ) |
|
Class I (formerly Select Class) | |
Year Ended February 28, 2017 | | | 10.94 | | | | 0.32 | | | | (0.36 | ) | | | (0.04 | ) | | | (0.32 | ) | | | (0.06 | ) | | | (0.38 | ) |
Year Ended February 29, 2016 | | | 11.07 | | | | 0.34 | | | | (0.02 | ) | | | 0.32 | | | | (0.35 | ) | | | (0.10 | ) | | | (0.45 | ) |
Year Ended February 28, 2015 | | | 11.10 | | | | 0.35 | | | | 0.06 | | | | 0.41 | | | | (0.36 | ) | | | (0.08 | ) | | | (0.44 | ) |
Year Ended February 28, 2014 | | | 11.44 | | | | 0.35 | | | | (0.34 | ) | | | 0.01 | | | | (0.35 | ) | | | — | (e) | | | (0.35 | ) |
Year Ended February 28, 2013 | | | 11.43 | | | | 0.35 | | | | 0.01 | | | | 0.36 | | | | (0.34 | ) | | | (0.01 | ) | | | (0.35 | ) |
| (a) | Calculated based upon average shares outstanding. |
| (b) | Includes adjustments in accordance with accounting principles generally accepted in the United States of America and as such, the net asset values for financial reporting purposes and the returns based upon those net asset values may differ from the net asset values and returns for shareholder transactions. |
| (c) | Includes earnings credits and interest expense, if applicable, each of which is less than 0.005% unless otherwise noted. |
| (d) | Portfolio turnover is calculated by dividing the lesser of total purchases or sales of portfolio securities for the reporting period by the monthly average value of portfolio securities owned during the reporting period. Excluded from both the numerator and denominator are amounts relating to derivatives and securities whose maturities or expiration dates at the time of acquisition were one year or less. |
| (e) | Amount rounds to less than $0.005. |
SEE NOTES TO FINANCIAL STATEMENTS.
| | | | | | |
| | | |
| 82 | | | | J.P. MORGAN MUNICIPAL BOND FUNDS | | FEBRUARY 28, 2017 |
| | | | | | | | | | | | | | | | | | | | | | | | | | |
| | | Ratios/Supplemental data | |
| | | | | | | | | | Ratios to average net assets | | | | |
Net asset
value,
end of
period | | | Total return
(excludes
sales charge) (b) | | | Net assets,
end of
period
(000’s) | | | Net
expenses (c) | | | Net
investment
income
(loss) | | |
Expenses
without waivers,
reimbursements and
earnings credits | | | Portfolio
turnover
rate (d) | |
| | | | | | | | | | | | | | | | | | | | | | | | | | |
| | | | | | | | | | | | | | | | | | | | | | | | | | |
| $ | 10.59 | | | | (0.59 | )% | | $ | 47,146 | | | | 0.84 | % | | | 2.68 | % | | | 1.06 | % | | | 7 | % |
| | 11.01 | | | | 2.72 | | | | 50,915 | | | | 0.88 | | | | 2.83 | | | | 0.98 | | | | 8 | |
| | 11.14 | | | | 3.47 | | | | 51,856 | | | | 0.88 | | | | 2.89 | | | | 1.07 | | | | 3 | |
| | 11.17 | | | | (0.08 | ) | | | 61,153 | | | | 0.88 | | | | 2.85 | | | | 0.99 | | | | 3 | |
| | 11.51 | | | | 2.86 | | | | 90,786 | | | | 0.87 | �� | | | 2.77 | | | | 0.97 | | | | 6 | |
| | | | | | |
| | | | | | | | | | | | | | | | | | | | | | | | | | |
| | 10.65 | | | | (1.19 | ) | | | 26,938 | | | | 1.43 | | | | 2.08 | | | | 1.57 | | | | 7 | |
| | 11.07 | | | | 2.14 | | | | 26,556 | | | | 1.49 | | | | 2.22 | | | | 1.49 | | | | 8 | |
| | 11.19 | | | | 2.81 | | | | 27,267 | | | | 1.50 | | | | 2.27 | | | | 1.57 | | | | 3 | |
| | 11.22 | | | | (0.70 | ) | | | 29,872 | | | | 1.48 | | | | 2.24 | | | | 1.48 | | | | 3 | |
| | 11.56 | | | | 2.27 | | | | 55,414 | | | | 1.46 | | | | 2.18 | | | | 1.47 | | | | 6 | |
| | | | | | |
| | | | | | | | | | | | | | | | | | | | | | | | | | |
| | 10.52 | | | | (0.36 | ) | | | 47,342 | | | | 0.59 | | | | 2.92 | | | | 0.81 | | | | 7 | |
| | 10.94 | | | | 2.99 | | | | 54,812 | | | | 0.63 | | | | 3.08 | | | | 0.74 | | | | 8 | |
| | 11.07 | | | | 3.75 | | | | 70,270 | | | | 0.63 | | | | 3.15 | | | | 0.82 | | | | 3 | |
| | 11.10 | | | | 0.17 | | | | 90,114 | | | | 0.63 | | | | 3.11 | | | | 0.74 | | | | 3 | |
| | 11.44 | | | | 3.12 | | | | 103,644 | | | | 0.62 | | | | 3.02 | | | | 0.72 | | | | 6 | |
SEE NOTES TO FINANCIAL STATEMENTS.
| | | | | | | | |
| | | |
| FEBRUARY 28, 2017 | | J.P. MORGAN MUNICIPAL BOND FUNDS | | | | | 83 | |
FINANCIAL HIGHLIGHTS
FOR THE PERIODS INDICATED (continued)
| | | | | | | | | | | | | | | | | | | | | | | | | | | | |
| | | Per share operating performance | |
| | | | | | Investment operations | | | Distributions | |
| | | Net asset
value,
beginning
of period | | | Net
investment
income
(loss) (a) | | | Net realized
and unrealized
gains
(losses) on
investments | | | Total from
investment
operations | | | Net
investment
income | | | Net
realized
gain | | | Total
distributions | |
Short-Intermediate Municipal Bond Fund | | | | | | | | | | | | | | | | | | | | | | | | | | | | |
Class A | | | | | | | | | |
Year Ended February 28, 2017 | | $ | 10.71 | | | $ | 0.10 | | | $ | (0.17 | ) | | $ | (0.07 | ) | | $ | (0.10 | ) | | $ | (0.06 | ) | | $ | (0.16 | ) |
Year Ended February 29, 2016 | | | 10.62 | | | | 0.08 | | | | 0.09 | | | | 0.17 | | | | (0.08 | ) | | | — | | | | (0.08 | ) |
Year Ended February 28, 2015 | | | 10.61 | | | | 0.06 | | | | 0.01 | | | | 0.07 | | | | (0.06 | ) | | | — | | | | (0.06 | ) |
Year Ended February 28, 2014 | | | 10.63 | | | | 0.07 | | | | (0.03 | ) | | | 0.04 | | | | (0.06 | ) | | | — | | | | (0.06 | ) |
Year Ended February 28, 2013 | | | 10.65 | | | | 0.08 | | | | (0.02 | ) | | | 0.06 | | | | (0.08 | ) | | | — | | | | (0.08 | ) |
| | |
Class C | | | | | | | | | |
Year Ended February 28, 2017 | | | 10.80 | | | | 0.04 | | | | (0.17 | ) | | | (0.13 | ) | | | (0.05 | ) | | | (0.06 | ) | | | (0.11 | ) |
Year Ended February 29, 2016 | | | 10.70 | | | | 0.02 | | | | 0.10 | | | | 0.12 | | | | (0.02 | ) | | | — | | | | (0.02 | ) |
Year Ended February 28, 2015 | | | 10.69 | | | | 0.01 | | | | — | (e) | | | 0.01 | | | | — | (e) | | | — | | | | — | (e) |
Year Ended February 28, 2014 | | | 10.71 | | | | 0.01 | | | | (0.02 | ) | | | (0.01 | ) | | | (0.01 | ) | | | — | | | | (0.01 | ) |
Year Ended February 28, 2013 | | | 10.74 | | | | 0.03 | | | | (0.03 | ) | | | — | (e) | | | (0.03 | ) | | | — | | | | (0.03 | ) |
| | |
Class I (formerly Institutional Class) | | | | | | | | | |
Year Ended February 28, 2017 | | | 10.76 | | | | 0.15 | | | | (0.17 | ) | | | (0.02 | ) | | | (0.15 | ) | | | (0.06 | ) | | | (0.21 | ) |
Year Ended February 29, 2016 | | | 10.67 | | | | 0.13 | | | | 0.09 | | | | 0.22 | | | | (0.13 | ) | | | — | | | | (0.13 | ) |
Year Ended February 28, 2015 | | | 10.66 | | | | 0.11 | | | | 0.01 | | | | 0.12 | | | | (0.11 | ) | | | — | | | | (0.11 | ) |
Year Ended February 28, 2014 | | | 10.68 | | | | 0.12 | | | | (0.03 | ) | | | 0.09 | | | | (0.11 | ) | | | — | | | | (0.11 | ) |
Year Ended February 28, 2013 | | | 10.71 | | | | 0.14 | | | | (0.04 | ) | | | 0.10 | | | | (0.13 | ) | | | — | | | | (0.13 | ) |
|
Select Class | |
Year Ended February 28, 2017 | | | 10.74 | | | | 0.13 | | | | (0.17 | ) | | | (0.04 | ) | | | (0.13 | ) | | | (0.06 | ) | | | (0.19 | ) |
Year Ended February 29, 2016 | | | 10.65 | | | | 0.10 | | | | 0.10 | | | | 0.20 | | | | (0.11 | ) | | | — | | | | (0.11 | ) |
Year Ended February 28, 2015 | | | 10.65 | | | | 0.09 | | | | — | (e) | | | 0.09 | | | | (0.09 | ) | | | — | | | | (0.09 | ) |
Year Ended February 28, 2014 | | | 10.66 | | | | 0.09 | | | | (0.02 | ) | | | 0.07 | | | | (0.08 | ) | | | — | | | | (0.08 | ) |
Year Ended February 28, 2013 | | | 10.68 | | | | 0.11 | | | | (0.02 | ) | | | 0.09 | | | | (0.11 | ) | | | — | | | | (0.11 | ) |
| (a) | Calculated based upon average shares outstanding. |
| (b) | Includes adjustments in accordance with accounting principles generally accepted in the United States of America and as such, the net asset values for financial reporting purposes and the returns based upon those net asset values may differ from the net asset values and returns for shareholder transactions. |
| (c) | Includes earnings credits and interest expense, if applicable, each of which is less than 0.005% unless otherwise noted. |
| (d) | Portfolio turnover is calculated by dividing the lesser of total purchases or sales of portfolio securities for the reporting period by the monthly average value of portfolio securities owned during the reporting period. Excluded from both the numerator and denominator are amounts relating to derivatives and securities whose maturities or expiration dates at the time of acquisition were one year or less. |
| (e) | Amount rounds to less than $0.005. |
SEE NOTES TO FINANCIAL STATEMENTS.
| | | | | | |
| | | |
| 84 | | | | J.P. MORGAN MUNICIPAL BOND FUNDS | | FEBRUARY 28, 2017 |
| | | | | | | | | | | | | | | | | | | | | | | | | | |
| | | Ratios/Supplemental data | |
| | | | | | | | | | Ratios to average net assets | | | | |
Net asset
value,
end of
period | | | Total return
(excludes
sales charge) (b) | | | Net assets,
end of
period
(000’s) | | | Net
expenses (c) | | | Net
investment
income
(loss) | | | Expenses
without waivers,
reimbursements and
earnings credits | | | Portfolio
turnover
rate (d) | |
| | | | | | | | | | | | | | | | | | | | | | | | | | |
| | | | | | | | | | | | | | | | | | | | | | | | | | |
| $ | 10.48 | | | | (0.69 | )% | | $ | 30,535 | | | | 0.73 | % | | | 0.91 | % | | | 0.88 | % | | | 31 | % |
| | 10.71 | | | | 1.58 | | | | 38,345 | | | | 0.75 | | | | 0.71 | | | | 0.87 | | | | 39 | |
| | 10.62 | | | | 0.64 | | | | 40,468 | | | | 0.74 | | | | 0.55 | | | | 0.87 | | | | 53 | |
| | 10.61 | | | | 0.38 | | | | 41,685 | | | | 0.74 | | | | 0.63 | | | | 0.87 | | | | 39 | |
| | 10.63 | | | | 0.56 | | | | 73,578 | | | | 0.74 | | | | 0.77 | | | | 0.86 | | | | 33 | |
| | | | | | |
| | | | | | | | | | | | | | | | | | | | | | | | | | |
| | 10.56 | | | | (1.27 | ) | | | 14,013 | | | | 1.23 | | | | 0.41 | | | | 1.40 | | | | 31 | |
| | 10.80 | | | | 1.14 | | | | 17,709 | | | | 1.25 | | | | 0.21 | | | | 1.40 | | | | 39 | |
| | 10.70 | | | | 0.13 | | | | 18,082 | | | | 1.24 | | | | 0.05 | | | | 1.38 | | | | 53 | |
| | 10.69 | | | | (0.10 | ) | | | 21,918 | | | | 1.24 | | | | 0.13 | | | | 1.37 | | | | 39 | |
| | 10.71 | | | | (0.05 | ) | | | 35,324 | | | | 1.24 | | | | 0.28 | | | | 1.36 | | | | 33 | |
| | | | | | |
| | | | | | | | | | | | | | | | | | | | | | | | | | |
| | 10.53 | | | | (0.20 | ) | | | 1,887,149 | | | | 0.25 | | | | 1.40 | | | | 0.48 | | | | 31 | |
| | 10.76 | | | | 2.09 | | | | 2,453,419 | | | | 0.25 | | | | 1.21 | | | | 0.47 | | | | 39 | |
| | 10.67 | | | | 1.13 | | | | 2,857,462 | | | | 0.24 | | | | 1.05 | | | | 0.47 | | | | 53 | |
| | 10.66 | | | | 0.88 | | | | 2,175,023 | | | | 0.23 | | | | 1.10 | | | | 0.49 | | | | 39 | |
| | 10.68 | | | | 0.95 | | | | 272,548 | | | | 0.24 | | | | 1.27 | | | | 0.46 | | | | 33 | |
| | | | | | |
| | | | | | | | | | | | | | | | | | | | | | | | | | |
| | 10.51 | | | | (0.37 | ) | | | 144,341 | | | | 0.42 | | | | 1.23 | | | | 0.61 | | | | 31 | |
| | 10.74 | | | | 1.85 | | | | 150,939 | | | | 0.50 | | | | 0.96 | | | | 0.62 | | | | 39 | |
| | 10.65 | | | | 0.80 | | | | 168,672 | | | | 0.49 | | | | 0.80 | | | | 0.61 | | | | 53 | |
| | 10.65 | | | | 0.67 | | | | 178,381 | | | | 0.49 | | | | 0.88 | | | | 0.61 | | | | 39 | |
| | 10.66 | | | | 0.80 | | | | 924,024 | | | | 0.49 | | | | 1.01 | | | | 0.61 | | | | 33 | |
SEE NOTES TO FINANCIAL STATEMENTS.
| | | | | | | | |
| | | |
| FEBRUARY 28, 2017 | | J.P. MORGAN MUNICIPAL BOND FUNDS | | | | | 85 | |
FINANCIAL HIGHLIGHTS
FOR THE PERIODS INDICATED (continued)
| | | | | | | | | | | | | | | | | | | | | | | | | | | | |
| | | Per share operating performance | |
| | | | | | Investment operations | | | Distributions | |
| | | Net asset
value,
beginning
of period | | | Net
investment
income
(loss) (a) | | | Net realized
and unrealized
gains
(losses) on
investments | | | Total from
investment
operations | | | Net
investment
income | | | Net
realized
gain | | | Total
distributions | |
Tax Free Bond Fund | | | | | | | | | | | | | | | | | | | | | | | | | | | | |
Class A | | | | | | | | | |
Year Ended February 28, 2017 | | $ | 12.57 | | | $ | 0.40 | | | $ | (0.40 | ) | | $ | — | (e) | | $ | (0.39 | ) | | $ | (0.25 | ) | | $ | (0.64 | ) |
Year Ended February 29, 2016 | | | 12.70 | | | | 0.45 | | | | (0.01 | ) | | | 0.44 | | | | (0.47 | ) | | | (0.10 | ) | | | (0.57 | ) |
Year Ended February 28, 2015 | | | 12.41 | | | | 0.44 | | | | 0.39 | | | | 0.83 | | | | (0.44 | ) | | | (0.10 | ) | | | (0.54 | ) |
Year Ended February 28, 2014 | | | 12.88 | | | | 0.46 | | | | (0.44 | ) | | | 0.02 | | | | (0.48 | ) | | | (0.01 | ) | | | (0.49 | ) |
Year Ended February 28, 2013 | | | 12.77 | | | | 0.47 | | | | 0.09 | | | | 0.56 | | | | (0.45 | ) | | | — | | | | (0.45 | ) |
| | |
Class C | | | | | | | | | |
Year Ended February 28, 2017 | | | 12.48 | | | | 0.31 | | | | (0.39 | ) | | | (0.08 | ) | | | (0.31 | ) | | | (0.25 | ) | | | (0.56 | ) |
Year Ended February 29, 2016 | | | 12.60 | | | | 0.37 | | | | (0.01 | ) | | | 0.36 | | | | (0.38 | ) | | | (0.10 | ) | | | (0.48 | ) |
Year Ended February 28, 2015 | | | 12.33 | | | | 0.35 | | | | 0.38 | | | | 0.73 | | | | (0.36 | ) | | | (0.10 | ) | | | (0.46 | ) |
Year Ended February 28, 2014 | | | 12.80 | | | | 0.37 | | | | (0.44 | ) | | | (0.07 | ) | | | (0.39 | ) | | | (0.01 | ) | | | (0.40 | ) |
Year Ended February 28, 2013 | | | 12.69 | | | | 0.38 | | | | 0.10 | | | | 0.48 | | | | (0.37 | ) | | | — | | | | (0.37 | ) |
|
Class I (formerly Select Class) | |
Year Ended February 28, 2017 | | | 12.53 | | | | 0.42 | | | | (0.40 | ) | | | 0.02 | | | | (0.42 | ) | | | (0.25 | ) | | | (0.67 | ) |
Year Ended February 29, 2016 | | | 12.65 | | | | 0.47 | | | | — | (e) | | | 0.47 | | | | (0.49 | ) | | | (0.10 | ) | | | (0.59 | ) |
Year Ended February 28, 2015 | | | 12.37 | | | | 0.46 | | | | 0.38 | | | | 0.84 | | | | (0.46 | ) | | | (0.10 | ) | | | (0.56 | ) |
Year Ended February 28, 2014 | | | 12.84 | | | | 0.48 | | | | (0.44 | ) | | | 0.04 | | | | (0.50 | ) | | | (0.01 | ) | | | (0.51 | ) |
Year Ended February 28, 2013 | | | 12.73 | | | | 0.49 | | | | 0.09 | | | | 0.58 | | | | (0.47 | ) | | | — | | | | (0.47 | ) |
| (a) | Calculated based upon average shares outstanding. |
| (b) | Includes adjustments in accordance with accounting principles generally accepted in the United States of America and as such, the net asset values for financial reporting purposes and the returns based upon those net asset values may differ from the net asset values and returns for shareholder transactions. |
| (c) | Includes earnings credits and interest expense, if applicable, each of which is less than 0.005% unless otherwise noted. |
| (d) | Portfolio turnover is calculated by dividing the lesser of total purchases or sales of portfolio securities for the reporting period by the monthly average value of portfolio securities owned during the reporting period. Excluded from both the numerator and denominator are amounts relating to derivatives and securities whose maturities or expiration dates at the time of acquisition were one year or less. |
| (e) | Amount rounds to less than $0.005. |
SEE NOTES TO FINANCIAL STATEMENTS.
| | | | | | |
| | | |
| 86 | | | | J.P. MORGAN MUNICIPAL BOND FUNDS | | FEBRUARY 28, 2017 |
| | | | | | | | | | | | | | | | | | | | | | | | | | |
| | | Ratios/Supplemental data | |
| | | | | | | | | | Ratios to average net assets | | | | |
Net asset
value,
end of
period | | | Total return
(excludes
sales charge) (b) | | | Net assets,
end of
period
(000’s) | | | Net
expenses (c) | | | Net
investment
income
(loss) | | | Expenses
without waivers,
reimbursements and
earnings credits | | | Portfolio
turnover
rate (d) | |
| | | | | | | | | | | | | | | | | | | | |
| | | | | | | | | | | | | | | | | | | | |
| $ | 11.93 | | | | (0.03 | )% | | $ | 148,987 | | | | 0.66 | % | | | 3.16 | % | | | 1.00 | % | | | 73 | % |
| | 12.57 | | | | 3.53 | | | | 152,207 | | | | 0.67 | | | | 3.62 | | | | 0.97 | | | | 94 | |
| | 12.70 | | | | 6.83 | | | | 166,359 | | | | 0.74 | | | | 3.49 | | | | 0.98 | | | | 90 | |
| | 12.41 | | | | 0.31 | | | | 129,124 | | | | 0.74 | | | | 3.72 | | | | 0.99 | | | | 62 | |
| | 12.88 | | | | 4.45 | | | | 198,873 | | | | 0.74 | | | | 3.67 | | | | 0.94 | | | | 43 | |
| | | | | | |
| | | | | | | | | | | | | | | | | | | | | | | | | | |
| | 11.84 | | | | (0.66 | ) | | | 32,052 | | | | 1.31 | | | | 2.50 | | | | 1.50 | | | | 73 | |
| | 12.48 | | | | 2.92 | | | | 26,715 | | | | 1.36 | | | | 2.93 | | | | 1.47 | | | | 94 | |
| | 12.60 | | | | 5.99 | | | | 27,579 | | | | 1.43 | | | | 2.81 | | | | 1.48 | | | | 90 | |
| | 12.33 | | | | (0.40 | ) | | | 25,057 | | | | 1.43 | | | | 3.00 | | | | 1.48 | | | | 62 | |
| | 12.80 | | | | 3.80 | | | | 57,237 | | | | 1.43 | | | | 2.98 | | | | 1.44 | | | | 43 | |
| | | | | | |
| | | | | | | | | | | | | | | | | | | | | | | | | | |
| | 11.88 | | | | 0.09 | | | | 141,356 | | | | 0.47 | | | | 3.34 | | | | 0.74 | | | | 73 | |
| | 12.53 | | | | 3.82 | | | | 126,091 | | | | 0.50 | | | | 3.79 | | | | 0.71 | | | | 94 | |
| | 12.65 | | | | 6.95 | | | | 149,102 | | | | 0.57 | | | | 3.67 | | | | 0.72 | | | | 90 | |
| | 12.37 | | | | 0.49 | | | | 129,602 | | | | 0.57 | | | | 3.89 | | | | 0.74 | | | | 62 | |
| | 12.84 | | | | 4.63 | | | | 200,023 | | | | 0.57 | | | | 3.85 | | | | 0.69 | | | | 43 | |
SEE NOTES TO FINANCIAL STATEMENTS.
| | | | | | | | |
| | | |
| FEBRUARY 28, 2017 | | J.P. MORGAN MUNICIPAL BOND FUNDS | | | | | 87 | |
FINANCIAL HIGHLIGHTS
FOR THE PERIODS INDICATED (continued)
| | | | | | | | | | | | | | | | | | | | |
| | | Per share operating performance | |
| | | | | | Investment operations | | | Distributions | |
| | | Net asset
value,
beginning
of period | | | Net
investment
income
(loss) (b) | | | Net realized
and unrealized
gains
(losses) on
investments | | | Total from
investment
operations | | | Net
investment
income | |
Ultra-Short Municipal Fund | | | | | | | | | | | | | | | | | | | | |
Class A | | | | | | | | | | | | | | | | | | | | |
May 31, 2016(h) through February 28, 2017 | | $ | 10.00 | | | $ | 0.06 | | | $ | (0.01 | ) | | $ | 0.05 | | | $ | (0.03 | ) |
| | | | | |
Class I (formerly Select Class) | | | | | | | | | | | | | | | | | | | | |
May 31, 2016(h) through February 28, 2017 | | | 10.00 | | | | 0.06 | | | | — | (i) | | | 0.06 | | | | (0.04 | ) |
| (a) | Annualized for periods less than one year, unless otherwise noted. |
| (b) | Calculated based upon average shares outstanding. |
| (c) | Not annualized for periods less than one year. |
| (d) | Includes adjustments in accordance with accounting principles generally accepted in the United States of America and as such, the net asset values for financial reporting purposes and the returns based upon those net asset values may differ from the net asset values and returns for shareholder transactions. |
| (e) | Includes earnings credits and interest expense, if applicable, each of which is less than 0.005% unless otherwise noted. |
| (f) | Certain non-recurring expenses incurred by the Fund were not annualized for the period ended February 28, 2017. |
| (g) | Portfolio turnover is calculated by dividing the lesser of total purchases or sales of portfolio securities for the reporting period by the monthly average value of portfolio securities owned during the reporting period. Excluded from both the numerator and denominator are amounts relating to derivatives and securities whose maturities or expiration dates at the time of acquisition were one year or less. |
| (h) | Commencement of operations. |
| (i) | Amount rounds to less than $0.005. |
SEE NOTES TO FINANCIAL STATEMENTS.
| | | | | | |
| | | |
| 88 | | | | J.P. MORGAN MUNICIPAL BOND FUNDS | | FEBRUARY 28, 2017 |
| | | | | | | | | | | | | | | | | | | | | | | | | | |
| | | Ratios/Supplemental data | |
| | | | | | | | | | Ratios to average net assets (a) | | | | |
Net asset
value,
end of
period | | | Total return
(excludes
sales charge) (c)(d) | | | Net assets,
end of
period
(000’s) | | | Net
expenses (e)(f) | | | Net
investment
income
(loss) (f) | | | Expenses
without waivers,
reimbursements and
earnings credits (f) | | | Portfolio
turnover
rate (c)(g) | |
| | | | | | | | | | | | | | | | | | | | | | | | | | |
| | | | | | | | | | | | | | | | | | | | | | | | | | |
| $ | 10.02 | | | | 0.52 | % | | $ | 519 | | | | 0.44 | % | | | 0.81 | % | | | 2.56 | % | | | 80 | % |
| | | | | | |
| | | | | | | | | | | | | | | | | | | | | | | | | | |
| | 10.02 | | | | 0.65 | | | | 31,656 | | | | 0.27 | | | | 0.74 | | | | 2.00 | | | | 80 | |
SEE NOTES TO FINANCIAL STATEMENTS.
| | | | | | | | |
| | | |
| FEBRUARY 28, 2017 | | J.P. MORGAN MUNICIPAL BOND FUNDS | | | | | 89 | |
NOTES TO FINANCIAL STATEMENTS
AS OF FEBRUARY 28, 2017
1. Organization
JPMorgan Trust II (“JPM II”) and JPMorgan Trust IV (“JPM IV”) (the “Trusts”) were formed on November 12, 2004 and November 12, 2015, respectively, as Delaware statutory trusts, pursuant to a Declarations of Trust dated November 5, 2004 and November 12, 2015, respectively, and are registered under the Investment Company Act of 1940, as amended (the “1940 Act”), as open-end management investment companies.
The following are 5 separate funds of the Trusts (collectively, the “Funds”) covered by this report:
| | | | | | |
| | | Classes Offered | | Trust | | Diversified/Non-Diversified |
| Municipal Income Fund | | Class A, Class C and Class I* | | JPM II | | Diversified |
| Ohio Municipal Bond Fund | | Class A, Class C and Class I* | | JPM II | | Diversified |
| Short-Intermediate Municipal Bond Fund | | Class A, Class C, Class I** and Select Class** | | JPM II | | Diversified |
| Tax Free Bond Fund | | Class A, Class C and Class I* | | JPM II | | Diversified |
| Ultra-Short Municipal Fund*** | | Class A and Class I* | | JPM IV | | Diversified |
| * | Effective April 3, 2017, Select Class was renamed Class I. |
| ** | On April 3, 2017, Select Class Shares of the Short-Intermediate Municipal Bond Fund were converted into Institutional Class Shares of the Fund and the Institutional Class Shares were then renamed Class I Shares. Additionally, on April 3, 2017, Select Class Shares were no longer offered. |
| *** | The Ultra-Short Municipal Fund commenced investment operations on May 31, 2016. Prior to May 31, 2016, the Fund had no significant operations other than matters relating to the organization and registration of JPM IV and the issuance of 2,000 shares of Class A Shares and 998,000 shares of Class I Shares to J.P. Morgan Investment Management Inc., an indirect, wholly-owned subsidiary of JPMorgan Chase & Co. (“JPMorgan”). |
The investment objective of Municipal Income Fund is to seek current income exempt from federal income taxes.
The investment objective of Ohio Municipal Bond Fund is to seek current income exempt from federal income tax and Ohio personal income tax, consistent with the preservation of principal.
The investment objective of Short-Intermediate Municipal Bond Fund, Tax Free Bond Fund and Ultra-Short Municipal Fund is to seek as high a level of current income exempt from federal income tax as is consistent with relative stability of principal.
Class A Shares generally provide for a front-end sales charge while Class C Shares provide for a contingent deferred sales charge (“CDSC”) (except for Class C Shares of Short-Intermediate Municipal Bond Fund purchased before September 3, 2013). Effective September 3, 2013, purchases of Class C Shares of the Short-Intermediate Municipal Bond Fund were subject to a CDSC on the original cost of shares. No sales charges are assessed with respect to Class I Shares. All classes of shares have equal rights as to earnings, assets and voting privileges, except that each class may bear different transfer agency, sub-transfer agency, distribution and shareholder servicing fees and each class has exclusive voting rights with respect to its distribution plan and shareholder servicing agreements. Certain Class A Shares, for which front-end sales charges have been waived, may be subject to a CDSC as described in the Funds’ prospectuses.
On June 19, 2015, all remaining Class B Shares converted to Class A Shares of the same Fund. Prior to June 19, 2015, Class B Shares automatically converted to Class A Shares after eight years (except for Short-Intermediate Municipal Bond Fund whose Class B Shares converted to Class A Shares after six years) and provided for a CDSC.
J.P. Morgan Investment Management Inc. (“JPMIM”) an indirect, wholly-owned subsidiary of JPMorgan acts as Adviser (the “Adviser”) and Administrator (the “Administrator”) to the Funds. Prior to April 1, 2016, JPMorgan Funds Management, Inc. (“JPMFM”) served as the Funds’ administrator. Effective April 1, 2016, JPMFM merged into JPMIM and JPMIM became the Funds’ Administrator under the Administration Agreement.
2. Significant Accounting Policies
The following is a summary of significant accounting policies followed by the Funds in the preparation of their financial statements. The Funds are investment companies and, accordingly, follow the investment company accounting and reporting guidance of the Financial Accounting Standards Board Accounting Standards Codification Topic 946 — Investment Companies, which is part of U.S. generally accepted accounting principles (“GAAP”). The preparation of financial statements in conformity with GAAP requires management to make estimates and assumptions that affect the reported amounts of assets and liabilities and disclosure of contingent assets and liabilities at the date of the financial statements and the reported amounts of increases and decreases in net assets from operations during the reporting period. Actual results could differ from those estimates.
A. Valuation of Investments — The valuation of investments is in accordance with GAAP and the Funds’ valuation policies set forth by and under the supervision and responsibility of the Board of Trustees (the “Board”), which established the following approach to valuation, as described more fully below: (i) investments for which market quotations are readily available shall be valued at such unadjusted quoted prices and (ii) all other investments for which market quotations are not readily available shall be valued at their fair value as determined in good faith by the Board.
The Administrator has established the J.P. Morgan Investment Management Americas Valuation Committee (“AVC”) to assist the Board with the oversight and monitoring of the valuation of the Funds’ investments. The Administrator implements the valuation policies of the Funds’ investments, as directed by the Board. The AVC oversees and carries out the policies for the valuation of investments held in the Funds. This includes monitoring
| | | | | | |
| | | |
| 90 | | | | J.P. MORGAN MUNICIPAL BOND FUNDS | | FEBRUARY 28, 2017 |
the appropriateness of fair values based on results of ongoing valuation oversight, including but not limited to consideration of macro or security specific events, market events and pricing vendor and broker due diligence. The Administrator is responsible for discussing and assessing the potential impacts to the fair values on an ongoing basis, and at least on a quarterly basis with the AVC and the Board.
A market-based approach is primarily used to value the Funds’ investments. Investments for which market quotations are not readily available are fair valued by approved affiliated and unaffiliated pricing vendors or third party broker-dealers (collectively referred to as “Pricing Services”) or may be internally fair valued using methods set forth by the valuation policies approved by the Board. This may include related or comparable assets or liabilities, recent transactions, market multiples, book values, and other relevant information for the investment to determine the fair value of the investment. An income-based valuation approach may be used in which the anticipated future cash flows of the investment are discounted to calculate the fair value. Discounts may also be applied due to the nature or duration of any restrictions on the disposition of the investments. Valuations may be based upon current market prices of securities that are comparable in coupon, rating, maturity and industry. It is possible that the estimated values may differ significantly from the values that would have been used, had a ready market for the investments existed, and such differences could be material.
Fixed income instruments are valued based on prices received from Pricing Services. The Pricing Services use multiple valuation techniques to determine the valuation of fixed income instruments. In instances where sufficient market activity exists, the Pricing Services may utilize a market-based approach through which trades or quotes from market makers are used to determine the valuation of these instruments. In instances where sufficient market activity may not exist, the Pricing Services also utilize proprietary valuation models which may consider market transactions in comparable securities and the various relationships between securities in determining fair value and/or market characteristics in order to estimate the relevant cash flows, which are then discounted to calculate the fair values.
Futures are generally valued on the basis of available market quotations.
Investments in open-end investment companies (the “Underlying Funds”) are valued at each Underlying Fund’s net asset value per share (‘NAV’) as of the report date.
Valuations reflected in this report are as of the report date. As a result, changes in valuation due to market events and/or issuer related events after the report date and prior to issuance of the report are not reflected herein.
The various inputs that are used in determining the valuation of the Funds’ investments are summarized into the three broad levels listed below.
| • | | Level 1 — Unadjusted inputs using quoted prices in active markets for identical investments. |
| • | | Level 2 — Other significant observable inputs including, but not limited to, quoted prices for similar investments, inputs other than quoted prices that are observable for investments (such as interest rates, prepayment speeds, credit risk, etc.) or other market corroborated inputs. |
| • | | Level 3 — Significant inputs based on the best information available in the circumstances, to the extent observable inputs are not available (including the Funds’ assumptions in determining the fair value of investments). |
A financial instrument’s level within the fair value hierarchy is based on the lowest level of any input, both individually and in the aggregate, that is significant to the fair value measurement. The inputs or methodology used for valuing instruments are not necessarily an indication of the risk associated with investing in those instruments.
The following tables represent each valuation input by municipal sector as presented on the Schedules of Portfolio Investments (“SOIs”) (amounts in thousands):
Municipal Income Fund
| | | | | | | | | | | | | | | | |
| | | Level 1
Quoted prices | | | Level 2
Other significant
observable inputs | | | Level 3
Significant
unobservable inputs | | | Total | |
Investments in Securities | |
Debt Securities | | | | | | | | | | | | | | | | |
Municipal Bonds | | | | | | | | | | | | | | | | |
Alabama | | | | | | | | | | | | | | | | |
Utility | | $ | — | | | $ | 2,268 | | | $ | — | | | $ | 2,268 | |
| | | | | | | | | | | | | | | | |
Alaska | | | | | | | | | | | | | | | | |
Housing | | | — | | | | 1,053 | | | | — | | | | 1,053 | |
Other Revenue | | | — | | | | 1,201 | | | | — | | | | 1,201 | |
| | | | | | | | | | | | | | | | |
Total Alaska | | | — | | | | 2,254 | | | | — | | | | 2,254 | |
| | | | | | | | | | | | | | | | |
Arizona | | | | | | | | | | | | | | | | |
Water & Sewer | | | — | | | | 5,698 | | | | — | | | | 5,698 | |
| | | | | | | | | | | | | | | | |
| | | | | | | | |
| | | |
| FEBRUARY 28, 2017 | | J.P. MORGAN MUNICIPAL BOND FUNDS | | | | | 91 | |
NOTES TO FINANCIAL STATEMENTS
AS OF FEBRUARY 28, 2017 (continued)
| | | | | | | | | | | | | | | | |
Municipal Income Fund (continued) | | | | | | | | | | | | | | | | |
| | | Level 1
Quoted prices | | | Level 2
Other significant
observable inputs | | | Level 3
Significant
unobservable inputs | | | Total | |
California | | | | | | | | | | | | | | | | |
General Obligation | | $ | — | | | $ | 939 | | | $ | — | | | $ | 939 | |
Housing | | | — | | | | 209 | | | | — | | | | 209 | |
Industrial Development Revenue/Pollution Control Revenue | | | — | | | | 1,750 | | | | — | | | | 1,750 | |
Other Revenue | | | — | | | | 792 | | | | — | | | | 792 | |
Transportation | | | — | | | | 1,011 | | | | — | | | | 1,011 | |
| | | | | | | | | | | | | | | | |
Total California | | | — | | | | 4,701 | | | | — | | | | 4,701 | |
| | | | | | | | | | | | | | | | |
Colorado | | | | | | | | | | | | | | | | |
Certificate of Participation/Lease | | | — | | | | 705 | | | | — | | | | 705 | |
Education | | | — | | | | 1,021 | | | | — | | | | 1,021 | |
General Obligation | | | — | | | | 1,147 | | | | — | | | | 1,147 | |
Hospital | | | — | | | | 3,520 | | | | — | | | | 3,520 | |
Housing | | | — | | | | 213 | | | | — | | | | 213 | |
| | | | | | | | | | | | | | | | |
Total Colorado | | | — | | | | 6,606 | | | | — | | | | 6,606 | |
| | | | | | | | | | | | | | | | |
Connecticut | | | | | | | | | | | | | | | | |
Education | | | — | | | | 4,206 | | | | — | | | | 4,206 | |
Housing | | | — | | | | 2,211 | | | | — | | | | 2,211 | |
| | | | | | | | | | | | | | | | |
Total Connecticut | | | — | | | | 6,417 | | | | — | | | | 6,417 | |
| | | | | | | | | | | | | | | | |
Delaware | | | | | | | | | | | | | | | | |
Housing | | | — | | | | 600 | | | | — | | | | 600 | |
| | | | | | | | | | | | | | | | |
District of Columbia | | | | | | | | | | | | | | | | |
Water & Sewer | | | — | | | | 3,388 | | | | — | | | | 3,388 | |
| | | | | | | | | | | | | | | | |
Florida | | | | | | | | | | | | | | | | |
Certificate of Participation/Lease | | | — | | | | 10,606 | | | | — | | | | 10,606 | |
Hospital | | | — | | | | 1,240 | | | | — | | | | 1,240 | |
Housing | | | — | | | | 2,763 | | | | — | | | | 2,763 | |
Industrial Development Revenue/Pollution Control Revenue | | | — | | | | 4,981 | | | | — | | | | 4,981 | |
Other Revenue | | | — | | | | 2,307 | | | | — | | | | 2,307 | |
Prerefunded | | | — | | | | 506 | | | | — | | | | 506 | |
Transportation | | | — | | | | 4,608 | | | | — | | | | 4,608 | |
Utility | | | — | | | | 7,949 | | | | — | | | | 7,949 | |
| | | | | | | | | | | | | | | | |
Total Florida | | | — | | | | 34,960 | | | | — | | | | 34,960 | |
| | | | | | | | | | | | | | | | |
Georgia | | | | | | | | | | | | | | | | |
Hospital | | | — | | | | 997 | | | | — | | | | 997 | |
Housing | | | — | | | | 1,378 | | | | — | | | | 1,378 | |
| | | | | | | | | | | | | | | | |
Total Georgia | | | — | | | | 2,375 | | | | — | | | | 2,375 | |
| | | | | | | | | | | | | | | | |
Illinois | | | | | | | | | | | | | | | | |
General Obligation | | | — | | | | 2,088 | | | | — | | | | 2,088 | |
Housing | | | — | | | | 1,765 | | | | — | | | | 1,765 | |
| | | | | | | | | | | | | | | | |
Total Illinois | | | — | | | | 3,853 | | | | — | | | | 3,853 | |
| | | | | | | | | | | | | | | | |
Indiana | | | | | | | | | | | | | | | | |
Hospital | | | — | | | | 1,874 | | | | — | | | | 1,874 | |
Housing | | | — | | | | 657 | | | | — | | | | 657 | |
Industrial Development Revenue/Pollution Control Revenue | | | — | | | | 4,441 | | | | — | | | | 4,441 | |
Water & Sewer | | | — | | | | 1,405 | | | | — | | | | 1,405 | |
| | | | | | | | | | | | | | | | |
Total Indiana | | | — | | | | 8,377 | | | | — | | | | 8,377 | |
| | | | | | | | | | | | | | | | |
| | | | | | |
| | | |
| 92 | | | | J.P. MORGAN MUNICIPAL BOND FUNDS | | FEBRUARY 28, 2017 |
| | | | | | | | | | | | | | | | |
Municipal Income Fund (continued) | | | | | | | | | | | | | | | | |
| | | Level 1
Quoted prices | | | Level 2
Other significant
observable inputs | | | Level 3
Significant
unobservable inputs | | | Total | |
Iowa | | | | | | | | | | | | | | | | |
Education | | $ | — | | | $ | 1,664 | | | $ | — | | | $ | 1,664 | |
Housing | | | — | | | | 876 | | | | — | | | | 876 | |
| | | | | | | | | | | | | | | | |
Total Iowa | | | — | | | | 2,540 | | | | — | | | | 2,540 | |
| | | | | | | | | | | | | | | | |
Kentucky | | | | | | | | | | | | | | | | |
Industrial Development Revenue/Pollution Control Revenue | | | — | | | | 494 | | | | — | | | | 494 | |
| | | | | | | | | | | | | | | | |
Louisiana | | | | | | | | | | | | | | | | |
Housing | | | — | | | | 655 | | | | — | | | | 655 | |
| | | | | | | | | | | | | | | | |
Maine | | | | | | | | | | | | | | | | |
Housing | | | — | | | | 1,699 | | | | — | | | | 1,699 | |
| | | | | | | | | | | | | | | | |
Massachusetts | | | | | | | | | | | | | | | | |
Education | | | — | | | | 2,153 | | | | — | | | | 2,153 | |
General Obligation | | | — | | | | 2,920 | | | | — | | | | 2,920 | |
Housing | | | — | | | | 948 | | | | — | | | | 948 | |
Water & Sewer | | | — | | | | 18,553 | | | | — | | | | 18,553 | |
| | | | | | | | | | | | | | | | |
Total Massachusetts | | | — | | | | 24,574 | | | | — | | | | 24,574 | |
| | | | | | | | | | | | | | | | |
Michigan | | | | | | | | | | | | | | | | |
Housing | | | — | | | | 1,391 | | | | — | | | | 1,391 | |
Industrial Development Revenue/Pollution Control Revenue | | | — | | | | 2,082 | | | | — | | | | 2,082 | |
| | | | | | | | | | | | | | | | |
Total Michigan | | | — | | | | 3,473 | | | | — | | | | 3,473 | |
| | | | | | | | | | | | | | | | |
Minnesota | | | | | | | | | | | | | | | | |
General Obligation | | | — | | | | 40 | | | | — | | | | 40 | |
Housing | | | — | | | | 6,692 | | | | — | | | | 6,692 | |
| | | | | | | | | | | | | | | | |
Total Minnesota | | | — | | | | 6,732 | | | | — | | | | 6,732 | |
| | | | | | | | | | | | | | | | |
Mississippi | | | | | | | | | | | | | | | | |
Housing | | | — | | | | 1,823 | | | | — | | | | 1,823 | |
| | | | | | | | | | | | | | | | |
Missouri | | | | | | | | | | | | | | | | |
Housing | | | — | | | | 2,259 | | | | — | | | | 2,259 | |
Transportation | | | — | | | | 2,134 | | | | — | | | | 2,134 | |
| | | | | | | | | | | | | | | | |
Total Missouri | | | — | | | | 4,393 | | | | — | | | | 4,393 | |
| | | | | | | | | | | | | | | | |
Nevada | | | | | | | | | | | | | | | | |
Housing | | | — | | | | 75 | | | | — | | | | 75 | |
| | | | | | | | | | | | | | | | |
New Hampshire | | | | | | | | | | | | | | | | |
Education | | | — | | | | 5,427 | | | | — | | | | 5,427 | |
Housing | | | — | | | | 259 | | | | — | | | | 259 | |
| | | | | | | | | | | | | | | | |
Total New Hampshire | | | — | | | | 5,686 | | | | — | | | | 5,686 | |
| | | | | | | | | | | | | | | | |
New Jersey | | | | | | | | | | | | | | | | |
Education | | | — | | | | 2,743 | | | | — | | | | 2,743 | |
General Obligation | | | — | | | | 1,494 | | | | — | | | | 1,494 | |
Hospital | | | — | | | | 2,060 | | | | — | | | | 2,060 | |
Industrial Development Revenue/Pollution Control Revenue | | | — | | | | 503 | | | | — | | | | 503 | |
Transportation | | | — | | | | 2,191 | | | | — | | | | 2,191 | |
| | | | | | | | | | | | | | | | |
Total New Jersey | | | — | | | | 8,991 | | | | — | | | | 8,991 | |
| | | | | | | | | | | | | | | | |
| | | | | | | | |
| | | |
| FEBRUARY 28, 2017 | | J.P. MORGAN MUNICIPAL BOND FUNDS | | | | | 93 | |
NOTES TO FINANCIAL STATEMENTS
AS OF FEBRUARY 28, 2017 (continued)
| | | | | | | | | | | | | | | | |
Municipal Income Fund (continued) | | | | | | | | | | | | | | | | |
| | | Level 1
Quoted prices | | | Level 2
Other significant
observable inputs | | | Level 3
Significant
unobservable inputs | | | Total | |
New York | | | | | | | | | | | | | | | | |
Housing | | $ | — | | | $ | 3,995 | | | $ | — | | | $ | 3,995 | |
Other Revenue | | | — | | | | 7,598 | | | | — | | | | 7,598 | |
Prerefunded | | | — | | | | 5 | | | | — | | | | 5 | |
Special Tax | | | — | | | | 2,154 | | | | — | | | | 2,154 | |
Transportation | | | — | | | | 8,181 | | | | — | | | | 8,181 | |
Water & Sewer | | | — | | | | 7,319 | | | | — | | | | 7,319 | |
| | | | | | | | | | | | | | | | |
Total New York | | | — | | | | 29,252 | | | | — | | | | 29,252 | |
| | | | | | | | | | | | | | | | |
North Carolina | | | | | | | | | | | | | | | | |
Housing | | | — | | | | 524 | | | | — | | | | 524 | |
Other Revenue | | | — | | | | 1,192 | | | | — | | | | 1,192 | |
Prerefunded | | | — | | | | 1,498 | | | | — | | | | 1,498 | |
Water & Sewer | | | — | | | | 3,636 | | | | — | | | | 3,636 | |
| | | | | | | | | | | | | | | | |
Total North Carolina | | | — | | | | 6,850 | | | | — | | | | 6,850 | |
| | | | | | | | | | | | | | | | |
North Dakota | | | | | | | | | | | | | | | | |
Housing | | | — | | | | 4,402 | | | | — | | | | 4,402 | |
Utility | | | — | | | | 2,115 | | | | — | | | | 2,115 | |
| | | | | | | | | | | | | | | | |
Total North Dakota | | | — | | | | 6,517 | | | | — | | | | 6,517 | |
| | | | | | | | | | | | | | | | |
Ohio | | | | | | | | | | | | | | | | |
General Obligation | | | — | | | | 1,826 | | | | — | | | | 1,826 | |
Housing | | | — | | | | 1,719 | | | | — | | | | 1,719 | |
Industrial Development Revenue/Pollution Control Revenue | | | — | | | | 1,922 | | | | — | | | | 1,922 | |
Utility | | | — | | | | 78 | | | | — | | | | 78 | |
| | | | | | | | | | | | | | | | |
Total Ohio | | | — | | | | 5,545 | | | | — | | | | 5,545 | |
| | | | | | | | | | | | | | | | |
Oklahoma | | | | | | | | | | | | | | | | |
Housing | | | — | | | | 1,094 | | | | — | | | | 1,094 | |
Other Revenue | | | — | | | | — | | | | 38 | | | | 38 | |
| | | | | | | | | | | | | | | | |
Total Oklahoma | | | — | | | | 1,094 | | | | 38 | | | | 1,132 | |
| | | | | | | | | | | | | | | | |
Oregon | | | | | | | | | | | | | | | | |
Housing | | | — | | | | 1,319 | | | | — | | | | 1,319 | |
| | | | | | | | | | | | | | | | |
Pennsylvania | | | | | | | | | | | | | | | | |
Housing | | | — | | | | 4,488 | | | | — | | | | 4,488 | |
Industrial Development Revenue/Pollution Control Revenue | | | — | | | | 1,026 | | | | — | | | | 1,026 | |
Other Revenue | | | — | | | | 2,149 | | | | — | | | | 2,149 | |
Transportation | | | — | | | | 652 | | | | — | | | | 652 | |
| | | | | | | | | | | | | | | | |
Total Pennsylvania | | | — | | | | 8,315 | | | | — | | | | 8,315 | |
| | | | | | | | | | | | | | | | |
Rhode Island | | | | | | | | | | | | | | | | |
Education | | | — | | | | 1,763 | | | | — | | | | 1,763 | |
Transportation | | | — | | | | 2,906 | | | | — | | | | 2,906 | |
| | | | | | | | | | | | | | | | |
Total Rhode Island | | | — | | | | 4,669 | | | | — | | | | 4,669 | |
| | | | | | | | | | | | | | | | |
South Carolina | | | | | | | | | | | | | | | | |
Housing | | | — | | | | 1,363 | | | | — | | | | 1,363 | |
| | | | | | | | | | | | | | | | |
South Dakota | | | | | | | | | | | | | | | | |
Housing | | | — | | | | 2,647 | | | | — | | | | 2,647 | |
| | | | | | | | | | | | | | | | |
Tennessee | | | | | | | | | | | | | | | | |
Housing | | | — | | | | 1,017 | | | | — | | | | 1,017 | |
Transportation | | | — | | | | 1,095 | | | | — | | | | 1,095 | |
Utility | | | — | | | | 2,243 | | | | — | | | | 2,243 | |
Water & Sewer | | | — | | | | 2,292 | | | | — | | | | 2,292 | |
| | | | | | | | | | | | | | | | |
Total Tennessee | | | — | | | | 6,647 | | | | — | | | | 6,647 | |
| | | | | | | | | | | | | | | | |
| | | | | | |
| | | |
| 94 | | | | J.P. MORGAN MUNICIPAL BOND FUNDS | | FEBRUARY 28, 2017 |
| | | | | | | | | | | | | | | | |
Municipal Income Fund (continued) | | | | | | | | | | | | | | | | |
| | | Level 1
Quoted prices | | | Level 2
Other significant
observable inputs | | | Level 3
Significant
unobservable inputs | | | Total | |
Texas | | | | | | | | | | | | | | | | |
General Obligation | | $ | — | | | $ | 2,916 | | | $ | — | | | $ | 2,916 | |
Housing | | | — | | | | 1,986 | | | | — | | | | 1,986 | |
Industrial Development Revenue/Pollution Control Revenue | | | — | | | | 3,094 | | | | — | | | | 3,094 | |
Transportation | | | — | | | | 3,245 | | | | — | | | | 3,245 | |
| | | | | | | | | | | | | | | | |
Total Texas | | | — | | | | 11,241 | | | | — | | | | 11,241 | |
| | | | | | | | | | | | | | | | |
Utah | | | | | | | | | | | | | | | | |
Housing | | | — | | | | 5,834 | | | | — | | | | 5,834 | |
Other Revenue | | | — | | | | 1,208 | | | | — | | | | 1,208 | |
| | | | | | | | | | | | | | | | |
Total Utah | | | — | | | | 7,042 | | | | — | | | | 7,042 | |
| | | | | | | | | | | | | | | | |
Vermont | | | | | | | | | | | | | | | | |
Education | | | — | | | | 4,994 | | | | — | | | | 4,994 | |
Housing | | | — | | | | 6,158 | | | | — | | | | 6,158 | |
| | | | | | | | | | | | | | | | |
Total Vermont | | | — | | | | 11,152 | | | | — | | | | 11,152 | |
| | | | | | | | | | | | | | | | |
Washington | | | | | | | | | | | | | | | | |
General Obligation | | | — | | | | 2,340 | | | | — | | | | 2,340 | |
Housing | | | — | | | | 520 | | | | — | | | | 520 | |
Transportation | | | — | | | | 1,452 | | | | — | | | | 1,452 | |
Utility | | | — | | | | 564 | | | | — | | | | 564 | |
| | | | | | | | | | | | | | | | |
Total Washington | | | — | | | | 4,876 | | | | — | | | | 4,876 | |
| | | | | | | | | | | | | | | | |
West Virginia | | | | | | | | | | | | | | | | |
Other Revenue | | | — | | | | 3,058 | | | | — | | | | 3,058 | |
| | | | | | | | | | | | | | | | |
Total Municipal Bonds | | | | | | | 254,219 | | | | 38 | | | | 254,257 | |
| | | | | | | | | | | | | | | | |
Weekly Demand Note | | | | | | | | | | | | | | | | |
Connecticut | | | — | | | | 4,000 | | | | — | | | | 4,000 | |
| | | | | | | | | | | | | | | | |
Investment Company | | | 5,432 | | | | — | | | | — | | | | 5,432 | |
| | | | | | | | | | | | | | | | |
Short-Term Investment | | | | | | | | | | | | | | | | |
Investment Company | | | 5,140 | | | | — | | | | — | | | | 5,140 | |
| | | | | | | | | | | | | | | | |
Total Investments in Securities | | $ | 10,572 | | | $ | 258,219 | | | $ | 38 | | | $ | 268,829 | |
| | | | | | | | | | | | | | | | |
| | | | |
| Ohio Municipal Bond Fund | | | | | | | | | | | | | | | | |
| | | Level 1
Quoted prices | | | Level 2
Other significant
observable inputs | | | Level 3
Significant
unobservable inputs | | | Total | |
Total Investments in Securities (a) | | $ | 1,648 | | | $ | 118,490 | | | $ | — | | | $ | 120,138 | |
| | | | | | | | | | | | | | | | |
| | | | |
| Short-Intermediate Municipal Bond Fund | | | | | | | | | | | | | | | | |
| | | Level 1
Quoted prices | | | Level 2
Other significant
observable inputs | | | Level 3
Significant
unobservable inputs | | | Total | |
Total Investments in Securities (a) | | $ | 41,698 | | | $ | 1,988,492 | | | $ | — | | | $ | 2,030,190 | |
| | | | | | | | | | | | | | | | |
| | | | |
| Tax Free Bond Fund | | | | | | | | | | | | | | | | |
| | | Level 1
Quoted prices | | | Level 2
Other significant
observable inputs | | | Level 3
Significant
unobservable inputs | | | Total | |
Total Investments in Securities (a) | | $ | 16,638 | | | $ | 302,216 | | | $ | — | | | $ | 318,854 | |
| | | | | | | | | | | | | | | | |
Depreciation in Other Financial Instruments | | | | | | | | | | | | | | | | |
Futures Contracts | | $ | (16 | ) | | $ | — | | | $ | — | | | $ | (16 | ) |
| | | | | | | | | | | | | | | | |
| | | | | | | | |
| | | |
| FEBRUARY 28, 2017 | | J.P. MORGAN MUNICIPAL BOND FUNDS | | | | | 95 | |
NOTES TO FINANCIAL STATEMENTS
AS OF FEBRUARY 28, 2017 (continued)
Ultra-Short Municipal Fund
| | | | | | | | | | | | | | | | |
| | | Level 1
Quoted prices | | | Level 2
Other significant
observable inputs | | | Level 3
Significant
unobservable inputs | | | Total | |
Investments in Securities | |
Debt Securities | | | | | | | | | | | | | | | | |
Daily Demand Notes | | | | | | | | | | | | | | | | |
Florida | | | | | | | | | | | | | | | | |
Industrial Development Revenue/Pollution Control Revenue | | $ | — | | | $ | 200 | | | $ | — | | | $ | 200 | |
Georgia | | | | | | | | | | | | | | | | |
Industrial Development Revenue/Pollution Control Revenue | | | — | | | | 300 | | | | — | | | | 300 | |
Louisiana | | | | | | | | | | | | | | | | |
Industrial Development Revenue/Pollution Control Revenue | | | — | | | | 150 | | | | — | | | | 150 | |
Maryland | | | | | | | | | | | | | | | | |
Education | | | — | | | | 200 | | | | — | | | | 200 | |
Minnesota | | | | | | | | | | | | | | | | |
Housing | | | — | | | | 150 | | | | — | | | | 150 | |
Missouri | | | | | | | | | | | | | | | | |
Education | | | — | | | | 100 | | | | — | | | | 100 | |
New Hampshire | | | | | | | | | | | | | | | | |
Education | | | — | | | | 100 | | | | — | | | | 100 | |
Texas | | | | | | | | | | | | | | | | |
Industrial Development Revenue/Pollution Control Revenue | | | — | | | | 100 | | | | — | | | | 100 | |
| | | | | | | | | | | | | | | | |
Total Daily Demand Notes | | | — | | | | 1,300 | | | | — | | | | 1,300 | |
| | | | | | | | | | | | | | | | |
Monthly Demand Note | | | | | | | | | | | | | | | | |
Pennsylvania | | | | | | | | | | | | | | | | |
Transportation | | | — | | | | 200 | | | | — | | | | 200 | |
| | | | | | | | | | | | | | | | |
Municipal Bonds | | | | | | | | | | | | | | | | |
Alabama | | | | | | | | | | | | | | | | |
Education | | | — | | | | 554 | | | | — | | | | 554 | |
Utility | | | — | | | | 431 | | | | — | | | | 431 | |
Water & Sewer | | | — | | | | 151 | | | | — | | | | 151 | |
| | | | | | | | | | | | | | | | |
Total Alabama | | | — | | | | 1,136 | | | | — | | | | 1,136 | |
| | | | | | | | | | | | | | | | |
Alaska | | | | | | | | | | | | | | | | |
General Obligation | | | — | | | | 127 | | | | — | | | | 127 | |
Housing | | | — | | | | 25 | | | | — | | | | 25 | |
Prerefunded | | | — | | | | 51 | | | | — | | | | 51 | |
| | | | | | | | | | | | | | | | |
Total Alaska | | | — | | | | 203 | | | | — | | | | 203 | |
| | | | | | | | | | | | | | | | |
Arizona | | | | | | | | | | | | | | | | |
General Obligation | | | — | | | | 142 | | | | — | | | | 142 | |
Industrial Development Revenue/Pollution Control Revenue | | | — | | | | 126 | | | | — | | | | 126 | |
Other Revenue | | | — | | | | 25 | | | | — | | | | 25 | |
Prerefunded | | | — | | | | 30 | | | | — | | | | 30 | |
Transportation | | | — | | | | 101 | | | | — | | | | 101 | |
| | | | | | | | | | | | | | | | |
Total Arizona | | | — | | | | 424 | | | | — | | | | 424 | |
| | | | | | | | | | | | | | | | |
Arkansas | | | | | | | | | | | | | | | | |
General Obligation | | | — | | | | 25 | | | | — | | | | 25 | |
Hospital | | | — | | | | 26 | | | | — | | | | 26 | |
Prerefunded | | | — | | | | 35 | | | | — | | | | 35 | |
Water & Sewer | | | — | | | | 101 | | | | — | | | | 101 | |
| | | | | | | | | | | | | | | | |
Total Arkansas | | | — | | | | 187 | | | | — | | | | 187 | |
| | | | | | | | | | | | | | | | |
| | | | | | |
| | | |
| 96 | | | | J.P. MORGAN MUNICIPAL BOND FUNDS | | FEBRUARY 28, 2017 |
| | | | | | | | | | | | | | | | |
Ultra-Short Municipal Fund (continued) | | | | | | | | | | | | | | | | |
| | | Level 1
Quoted prices | | | Level 2
Other significant
observable inputs | | | Level 3
Significant
unobservable inputs | | | Total | |
California | | | | | | | | | | | | | | | | |
General Obligation | | $ | — | | | $ | 125 | | | $ | — | | | $ | 125 | |
Hospital | | | — | | | | 853 | | | | — | | | | 853 | |
Other Revenue | | | — | | | | 65 | | | | — | | | | 65 | |
Prerefunded | | | — | | | | 136 | | | | — | | | | 136 | |
Transportation | | | — | | | | 51 | | | | — | | | | 51 | |
Utility | | | — | | | | 101 | | | | — | | | | 101 | |
| | | | | | | | | | | | | | | | |
Total California | | | — | | | | 1,331 | | | | — | | | | 1,331 | |
| | | | | | | | | | | | | | | | |
Colorado | | | | | | | | | | | | | | | | |
Certificate of Participation/Lease | | | — | | | | 302 | | | | — | | | | 302 | |
Education | | | — | | | | 505 | | | | — | | | | 505 | |
Hospital | | | — | | | | 435 | | | | — | | | | 435 | |
Water & Sewer | | | — | | | | 25 | | | | — | | | | 25 | |
| | | | | | | | | | | | | | | | |
Total Colorado | | | — | | | | 1,267 | | | | — | | | | 1,267 | |
| | | | | | | | | | | | | | | | |
Connecticut | | | | | | | | | | | | | | | | |
Education | | | — | | | | 502 | | | | — | | | | 502 | |
Housing | | | — | | | | 500 | | | | — | | | | 500 | |
Prerefunded | | | — | | | | 41 | | | | — | | | | 41 | |
| | | | | | | | | | | | | | | | |
Total Connecticut | | | — | | | | 1,043 | | | | — | | | | 1,043 | |
| | | | | | | | | | | | | | | | |
Delaware | | | | | | | | | | | | | | | | |
General Obligation | | | — | | | | 25 | | | | — | | | | 25 | |
| | | | | | | | | | | | | | | | |
Florida | | | | | | | | | | | | | | | | |
Certificate of Participation/Lease | | | — | | | | 162 | | | | — | | | | 162 | |
Education | | | — | | | | 126 | | | | — | | | | 126 | |
General Obligation | | | — | | | | 294 | | | | — | | | | 294 | |
Hospital | | | — | | | | 150 | | | | — | | | | 150 | |
Other Revenue | | | — | | | | 241 | | | | — | | | | 241 | |
Prerefunded | | | — | | | | 102 | | | | — | | | | 102 | |
| | | | | | | | | | | | | | | | |
Total Florida | | | — | | | | 1,075 | | | | — | | | | 1,075 | |
| | | | | | | | | | | | | | | | |
Georgia | | | | | | | | | | | | | | | | |
Certificate of Participation/Lease | | | — | | | | 36 | | | | — | | | | 36 | |
General Obligation | | | — | | | | 71 | | | | — | | | | 71 | |
Prerefunded | | | — | | | | 25 | | | | — | | | | 25 | |
Water & Sewer | | | — | | | | 50 | | | | — | | | | 50 | |
| | | | | | | | | | | | | | | | |
Total Georgia | | | — | | | | 182 | | | | — | | | | 182 | |
| | | | | | | | | | | | | | | | |
Hawaii | | | | | | | | | | | | | | | | |
General Obligation | | | — | | | | 25 | | | | — | | | | 25 | |
| | | | | | | | | | | | | | | | |
Illinois | | | | | | | | | | | | | | | | |
Education | | | — | | | | 352 | | | | — | | | | 352 | |
General Obligation | | | — | | | | 1,739 | | | | — | | | | 1,739 | |
Other Revenue | | | — | | | | 232 | | | | — | | | | 232 | |
Prerefunded | | | — | | | | 25 | | | | — | | | | 25 | |
| | | | | | | | | | | | | | | | |
Total Illinois | | | — | | | | 2,348 | | | | — | | | | 2,348 | |
| | | | | | | | | | | | | | | | |
Indiana | | | | | | | | | | | | | | | | |
Industrial Development Revenue/Pollution Control Revenue | | | — | | | | 269 | | | | — | | | | 269 | |
Other Revenue | | | — | | | | 25 | | | | — | | | | 25 | |
Water & Sewer | | | — | | | | 200 | | | | — | | | | 200 | |
| | | | | | | | | | | | | | | | |
Total Indiana | | | — | | | | 494 | | | | — | | | | 494 | |
| | | | | | | | | | | | | | | | |
| | | | | | | | |
| | | |
| FEBRUARY 28, 2017 | | J.P. MORGAN MUNICIPAL BOND FUNDS | | | | | 97 | |
NOTES TO FINANCIAL STATEMENTS
AS OF FEBRUARY 28, 2017 (continued)
| | | | | | | | | | | | | | | | |
Ultra-Short Municipal Fund (continued) | | | | | | | | | | | | | | | | |
| | | Level 1
Quoted prices | | | Level 2
Other significant
observable inputs | | | Level 3
Significant
unobservable inputs | | | Total | |
Iowa | | | | | | | | | | | | | | | | |
General Obligation | | $ | — | | | $ | 25 | | | $ | — | | | $ | 25 | |
Hospital | | | — | | | | 555 | | | | — | | | | 555 | |
Other Revenue | | | — | | | | 25 | | | | — | | | | 25 | |
| | | | | | | | | | | | | | | | |
Total Iowa | | | — | | | | 605 | | | | — | | | | 605 | |
| | | | | | | | | | | | | | | | |
Kansas | | | | | | | | | | | | | | | | |
General Obligation | | | — | | | | 40 | | | | — | | | | 40 | |
Hospital | | | — | | | | 102 | | | | — | | | | 102 | |
| | | | | | | | | | | | | | | | |
Total Kansas | | | — | | | | 142 | | | | — | | | | 142 | |
| | | | | | | | | | | | | | | | |
Kentucky | | | | | | | | | | | | | | | | |
Prerefunded | | | — | | | | 76 | | | | — | | | | 76 | |
Transportation | | | — | | | | 435 | | | | — | | | | 435 | |
| | | | | | | | | | | | | | | | |
Total Kentucky | | | — | | | | 511 | | | | — | | | | 511 | |
| | | | | | | | | | | | | | | | |
Louisiana | | | | | | | | | | | | | | | | |
Education | | | — | | | | 169 | | | | — | | | | 169 | |
Other Revenue | | | — | | | | 127 | | | | — | | | | 127 | |
Prerefunded | | | — | | | | 45 | | | | — | | | | 45 | |
| | | | | | | | | | | | | | | | |
Total Louisiana | | | — | | | | 341 | | | | — | | | | 341 | |
| | | | | | | | | | | | | | | | |
Maine | | | | | | | | | | | | | | | | |
Transportation | | | — | | | | 101 | | | | — | | | | 101 | |
| | | | | | | | | | | | | | | | |
Maryland | | | | | | | | | | | | | | | | |
Education | | | — | | | | 25 | | | | — | | | | 25 | |
General Obligation | | | — | | | | 51 | | | | — | | | | 51 | |
Prerefunded | | | — | | | | 25 | | | | — | | | | 25 | |
Transportation | | | — | | | | 30 | | | | — | | | | 30 | |
| | | | | | | | | | | | | | | | |
Total Maryland | | | — | | | | 131 | | | | — | | | | 131 | |
| | | | | | | | | | | | | | | | |
Massachusetts | | | | | | | | | | | | | | | | |
General Obligation | | | — | | | | 81 | | | | — | | | | 81 | |
Other Revenue | | | — | | | | 234 | | | | — | | | | 234 | |
| | | | | | | | | | | | | | | | |
Total Massachusetts | | | — | | | | 315 | | | | — | | | | 315 | |
| | | | | | | | | | | | | | | | |
Michigan | | | | | | | | | | | | | | | | |
General Obligation | | | — | | | | 325 | | | | — | | | | 325 | |
Hospital | | | — | | | | 30 | | | | — | | | | 30 | |
Prerefunded | | | — | | | | 61 | | | | — | | | | 61 | |
| | | | | | | | | | | | | | | | |
Total Michigan | | | — | | | | 416 | | | | — | | | | 416 | |
| | | | | | | | | | | | | | | | |
Minnesota | | | | | | | | | | | | | | | | |
Certificate of Participation/Lease | | | — | | | | 252 | | | | — | | | | 252 | |
Education | | | — | | | | 50 | | | | — | | | | 50 | |
General Obligation | | | — | | | | 51 | | | | — | | | | 51 | |
Transportation | | | — | | | | 153 | | | | — | | | | 153 | |
| | | | | | | | | | | | | | | | |
Total Minnesota | | | — | | | | 506 | | | | — | | | | 506 | |
| | | | | | | | | | | | | | | | |
Missouri | | | | | | | | | | | | | | | | |
General Obligation | | | — | | | | 50 | | | | — | | | | 50 | |
Hospital | | | — | | | | 152 | | | | — | | | | 152 | |
Industrial Development Revenue/Pollution Control Revenue | | | — | | | | 103 | | | | — | | | | 103 | |
Other Revenue | | | — | | | | 100 | | | | — | | | | 100 | |
Prerefunded | | | — | | | | 35 | | | | — | | | | 35 | |
Water & Sewer | | | — | | | | 60 | | | | — | | | | 60 | |
| | | | | | | | | | | | | | | | |
Total Missouri | | | — | | | | 500 | | | | — | | | | 500 | |
| | | | | | | | | | | | | | | | |
| | | | | | |
| | | |
| 98 | | | | J.P. MORGAN MUNICIPAL BOND FUNDS | | FEBRUARY 28, 2017 |
| | | | | | | | | | | | | | | | |
| Ultra-Short Municipal Fund (continued) | | | | | | | | | | | | |
| | | Level 1
Quoted prices | | | Level 2
Other significant
observable inputs | | | Level 3
Significant
unobservable inputs | | | Total | |
Nebraska | | | | | | | | | | | | | | | | |
General Obligation | | $ | — | | | $ | 25 | | | $ | — | | | $ | 25 | |
| | | | | | | | | | | | | | | | |
Nevada | | | | | | | | | | | | | | | | |
Other Revenue | | | — | | | | 51 | | | | — | | | | 51 | |
Prerefunded | | | — | | | | 50 | | | | — | | | | 50 | |
| | | | | | | | | | | | | | | | |
Total Nevada | | | — | | | | 101 | | | | — | | | | 101 | |
| | | | | | | | | | | | | | | | |
New Jersey | | | | | | | | | | | | | | | | |
Certificate of Participation/Lease | | | — | | | | 152 | | | | — | | | | 152 | |
General Obligation | | | — | | | | 500 | | | | — | | | | 500 | |
Hospital | | | — | | | | 151 | | | | — | | | | 151 | |
Other Revenue | | | — | | | | 267 | | | | — | | | | 267 | |
Prerefunded | | | — | | | | 51 | | | | — | | | | 51 | |
Transportation | | | — | | | | 202 | | | | — | | | | 202 | |
| | | | | | | | | | | | | | | | |
Total New Jersey | | | — | | | | 1,323 | | | | — | | | | 1,323 | |
| | | | | | | | | | | | | | | | |
New Mexico | | | | | | | | | | | | | | | | |
Other Revenue | | | — | | | | 25 | | | | — | | | | 25 | |
| | | | | | | | | | | | | | | | |
New York | | | | | | | | | | | | | | | | |
Education | | | — | | | | 81 | | | | — | | | | 81 | |
General Obligation | | | — | | | | 746 | | | | 100 | | | | 846 | |
Other Revenue | | | — | | | | 345 | | | | — | | | | 345 | |
Prerefunded | | | — | | | | 26 | | | | — | | | | 26 | |
Special Tax | | | — | | | | 100 | | | | — | | | | 100 | |
Transportation | | | — | | | | 238 | | | | — | | | | 238 | |
| | | | | | | | | | | | | | | | |
Total New York | | | — | | | | 1,536 | | | | 100 | | | | 1,636 | |
| | | | | | | | | | | | | | | | |
North Carolina | | | | | | | | | | | | | | | | |
General Obligation | | | — | | | | 76 | | | | — | | | | 76 | |
Hospital | | | — | | | | 393 | | | | — | | | | 393 | |
Other Revenue | | | — | | | | 50 | | | | — | | | | 50 | |
| | | | | | | | | | | | | | | | |
Total North Carolina | | | — | | | | 519 | | | | — | | | | 519 | |
| | | | | | | | | | | | | | | | |
Ohio | | | | | | | | | | | | | | | | |
Certificate of Participation/Lease | | | — | | | | 132 | | | | — | | | | 132 | |
Education | | | — | | | | 712 | | | | — | | | | 712 | |
General Obligation | | | — | | | | 352 | | | | — | | | | 352 | |
Hospital | | | — | | | | 139 | | | | — | | | | 139 | |
Other Revenue | | | — | | | | 25 | | | | — | | | | 25 | |
Prerefunded | | | — | | | | 50 | | | | — | | | | 50 | |
Transportation | | | — | | | | 145 | | | | — | | | | 145 | |
| | | | | | | | | | | | | | | | |
Total Ohio | | | — | | | | 1,555 | | | | — | | | | 1,555 | |
| | | | | | | | | | | | | | | | |
Oklahoma | | | | | | | | | | | | | | | | |
Education | | | — | | | | 791 | | | | — | | | | 791 | |
General Obligation | | | — | | | | 175 | | | | — | | | | 175 | |
| | | | | | | | | | | | | | | | |
Total Oklahoma | | | — | | �� | | 966 | | | | — | | | | 966 | |
| | | | | | | | | | | | | | | | |
Oregon | | | | | | | | | | | | | | | | |
General Obligation | | | — | | | | 605 | | | | — | | | | 605 | |
Hospital | | | — | | | | 178 | | | | — | | | | 178 | |
Prerefunded | | | — | | | | 106 | | | | — | | | | 106 | |
| | | | | | | | | | | | | | | | |
Total Oregon | | | — | | | | 889 | | | | — | | | | 889 | |
| | | | | | | | | | | | | | | | |
| | | | | | | | |
| | | |
| FEBRUARY 28, 2017 | | J.P. MORGAN MUNICIPAL BOND FUNDS | | | | | 99 | |
NOTES TO FINANCIAL STATEMENTS
AS OF FEBRUARY 28, 2017 (continued)
| | | | | | | | | | | | | | | | |
| Ultra-Short Municipal Fund (continued) | | | | | | | | | | | | |
| | | Level 1
Quoted prices | | | Level 2
Other significant
observable inputs | | | Level 3
Significant
unobservable inputs | | | Total | |
Pennsylvania | | | | | | | | | | | | | | | | |
Education | | $ | — | | | $ | 101 | | | $ | — | | | $ | 101 | |
General Obligation | | | — | | | | 471 | | | | — | | | | 471 | |
Hospital | | | — | | | | 101 | | | | — | | | | 101 | |
Other Revenue | | | — | | | | 178 | | | | — | | | | 178 | |
Prerefunded | | | — | | | | 116 | | | | — | | | | 116 | |
Water & Sewer | | | — | | | | 26 | | | | — | | | | 26 | |
| | | | | | | | | | | | | | | | |
Total Pennsylvania | | | — | | | | 993 | | | | — | | | | 993 | |
| | | | | | | | | | | | | | | | |
Rhode Island | | | | | | | | | | | | | | | | |
Education | | | — | | | | 65 | | | | — | | | | 65 | |
Prerefunded | | | — | | | | 25 | | | | — | | | | 25 | |
| | | | | | | | | | | | | | | | |
Total Rhode Island | | | — | | | | 90 | | | | — | | | | 90 | |
| | | | | | | | | | | | | | | | |
South Carolina | | | | | | | | | | | | | | | | |
Education | | | — | | | | 25 | | | | — | | | | 25 | |
General Obligation | | | — | | | | 131 | | | | — | | | | 131 | |
Prerefunded | | | — | | | | 25 | | | | — | | | | 25 | |
Utility | | | — | | | | 267 | | | | — | | | | 267 | |
| | | | | | | | | | | | | | | | |
Total South Carolina | | | — | | | | 448 | | | | — | | | | 448 | |
| | | | | | | | | | | | | | | | |
Tennessee | | | | | | | | | | | | | | | | |
General Obligation | | | — | | | | 25 | | | | — | | | | 25 | |
Prerefunded | | | — | | | | 35 | | | | — | | | | 35 | |
| | | | | | | | | | | | | | | | |
Total Tennessee | | | — | | | | 60 | | | | — | | | | 60 | |
| | | | | | | | | | | | | | | | |
Texas | | | | | | | | | | | | | | | | |
Education | | | — | | | | 180 | | | | — | | | | 180 | |
General Obligation | | | — | | | | 697 | | | | — | | | | 697 | |
Prerefunded | | | — | | | | 197 | | | | — | | | | 197 | |
Transportation | | | — | | | | 142 | | | | — | | | | 142 | |
Utility | | | — | | | | 111 | | | | — | | | | 111 | |
Water & Sewer | | | — | | | | 141 | | | | — | | | | 141 | |
| | | | | | | | | | | | | | | | |
Total Texas | | | — | | | | 1,468 | | | | — | | | | 1,468 | |
| | | | | | | | | | | | | | | | |
Utah | | | | | | | | | | | | | | | | |
General Obligation | | | — | | | | 101 | | | | — | | | | 101 | |
Other Revenue | | | — | | | | 268 | | | | — | | | | 268 | |
| | | | | | | | | | | | | | | | |
Total Utah | | | — | | | | 369 | | | | — | | | | 369 | |
| | | | | | | | | | | | | | | | |
Virginia | | | | | | | | | | | | | | | | |
Other Revenue | | | — | | | | 25 | | | | — | | | | 25 | |
Prerefunded | | | — | | | | 26 | | | | — | | | | 26 | |
| | | | | | | | | | | | | | | | |
Total Virginia | | | — | | | | 51 | | | | — | | | | 51 | |
| | | | | | | | | | | | | | | | |
Washington | | | | | | | | | | | | | | | | |
General Obligation | | | — | | | | 102 | | | | — | | | | 102 | |
Hospital | | | — | | | | 41 | | | | — | | | | 41 | |
Prerefunded | | | — | | | | 26 | | | | — | | | | 26 | |
Utility | | | — | | | | 158 | | | | — | | | | 158 | |
| | | | | | | | | | | | | | | | |
Total Washington | | | — | | | | 327 | | | | — | | | | 327 | |
| | | | | | | | | | | | | | | | |
Wisconsin | | | | | | | | | | | | | | | | |
General Obligation | | | — | | | | 293 | | | | — | | | | 293 | |
| | | | | | | | | | | | | | | | |
Wyoming | | | | | | | | | | | | | | | | |
Utility | | | — | | | | 363 | | | | — | | | | 363 | |
| | | | | | | | | | | | | | | | |
Total Municipal Bonds | | | — | | | | 24,709 | | | | 100 | | | | 24,809 | |
| | | | | | | | | | | | | | | | |
| | | | | | |
| | | |
| 100 | | | | J.P. MORGAN MUNICIPAL BOND FUNDS | | FEBRUARY 28, 2017 |
| | | | | | | | | | | | | | | | |
| Ultra-Short Municipal Fund (continued) | | | | | | | | | | | | |
| | | Level 1
Quoted prices | | | Level 2
Other significant
observable inputs | | | Level 3
Significant
unobservable inputs | | | Total | |
Quarterly Demand Note | | | | | | | | | | | | | | | | |
Texas | | | | | | | | | | | | | | | | |
Industrial Development Revenue/Pollution Control Revenue | | $ | — | | | $ | 250 | | | $ | — | | | $ | 250 | |
| | | | | | | | | | | | | | | | |
Weekly Demand Notes | | | | | | | | | | | | | | | | |
California | | | | | | | | | | | | | | | | |
Water & Sewer | | | — | | | | 250 | | | | — | | | | 250 | |
Colorado | | | | | | | | | | | | | | | | |
Transportation | | | — | | | | 500 | | | | — | | | | 500 | |
Utility | | | — | | | | 150 | | | | — | | | | 150 | |
| | | | | | | | | | | | | | | | |
Total Colorado | | | — | | | | 650 | | | | — | | | | 650 | |
| | | | | | | | | | | | | | | | |
District of Columbia | | | | | | | | | | | | | | | | |
Other Revenue | | | — | | | | 1,000 | | | | — | | | | 1,000 | |
Indiana | | | | | | | | | | | | | | | | |
Hospital | | | — | | | | 1,000 | | | | — | | | | 1,000 | |
Massachusetts | | | | | | | | | | | | | | | | |
General Obligation | | | — | | | | 1,000 | | | | — | | | | 1,000 | |
Ohio | | | | | | | | | | | | | | | | |
Utility | | | — | | | | 200 | | | | — | | | | 200 | |
Washington | | | | | | | | | | | | | | | | |
Other Revenue | | | — | | | | 200 | | | | — | | | | 200 | |
Utility | | | — | | | | 100 | | | | — | | | | 100 | |
| | | | | | | | | | | | | | | | |
Total Washington | | | — | | | | 300 | | | | — | | | | 300 | |
| | | | | | | | | | | | | | | | |
Total Weekly Demand Notes | | | — | | | | 4,400 | | | | — | | | | 4,400 | |
| | | | | | | | | | | | | | | | |
Short-Term Investment | | | | | | | | | | | | | | | | |
Investment Company | | | 2,788 | | | | — | | | | — | | | | 2,788 | |
| | | | | | | | | | | | | | | | |
Total Investments in Securities | | $ | 2,788 | | | $ | 30,859 | | | $ | 100 | | | $ | 33,747 | |
| | | | | | | | | | | | | | | | |
| (a) | All portfolio holdings designated as level 1 and level 2 are disclosed individually on the SOIs. Level 1 consists of a money market mutual fund that is held for daily investments of cash. Please refer to the SOIs for industry specifics of portfolio holdings. |
There were no transfers among any levels during the year ended February 28, 2017.
B. When Issued, Delayed Delivery Securities and Forward Commitments — Municipal Income Fund, Ohio Municipal Bond Fund and Ultra-Short Municipal Fund purchased when issued securities, including To Be Announced (“TBA”) securities, and entered into contracts to purchase or sell securities for a fixed price that may be settled a month or more after the trade date, or purchased delayed delivery securities which generally settle seven days after the trade date. When issued securities are securities that have been authorized, but not issued in the market. A forward commitment involves entering into a contract to purchase or sell securities for a fixed price at a future date that may be settled a month or more after the trade date. A delayed delivery security is agreed upon in advance between the buyer and the seller of the security and is generally delivered beyond seven days of the agreed upon date. The purchase of securities on a when issued, delayed delivery, or forward commitment basis involves the risk that the value of the security to be purchased declines before settlement date. The sale of securities on a forward commitment basis involves the risk that the value of the securities sold may increase before the settlement date. The Funds may be exposed to credit risk if the counterparty fails to perform under the terms of the transaction. Interest income for securities purchased on a when issued, delayed delivery, or forward commitment basis is not accrued until settlement date.
The Funds had when issued securities, forward commitments or delayed delivery securities outstanding as of February 28, 2017, which are shown as a Receivable for Investment securities sold — delayed delivery securities and Payable for Investment securities purchased — delayed delivery securities, respectively, on the Statements of Assets and Liabilities. The values of these securities held at February 28, 2017 are detailed on the SOIs.
The Funds did not have TBA purchase commitments outstanding as of February 28, 2017.
C. Futures Contracts — Tax Free Bond Fund used treasury and interest rate futures contracts to manage and hedge interest rate risk associated with portfolio investments. The Fund also used futures contracts to lengthen or shorten the duration of the overall investment portfolio.
Futures contracts provide for the delayed delivery of the underlying instrument at a fixed price or are settled for a cash amount based on the change in the value of the underlying instrument at a specific date in the future. Upon entering into a futures contract, the Fund is required to
| | | | | | | | |
| | | |
| FEBRUARY 28, 2017 | | J.P. MORGAN MUNICIPAL BOND FUNDS | | | | | 101 | |
NOTES TO FINANCIAL STATEMENTS
AS OF FEBRUARY 28, 2017 (continued)
deposit with the broker, cash or securities in an amount equal to a certain percentage of the contract amount, which is referred to as the initial margin deposit. Subsequent payments, referred to as variation margin, are made or received by the Fund periodically and are based on changes in the market value of open futures contracts. Changes in the market value of open futures contracts are recorded as Change in net unrealized appreciation/depreciation on the Statements of Operations. Realized gains or losses, representing the difference between the value of the contract at the time it was opened and the value at the time it was closed, are reported on the Statements of Operations at the closing or expiration of the futures contract. Securities deposited as initial margin are designated on the SOI and cash deposited is recorded on the Statements of Assets and Liabilities. A receivable from and/or a payable to brokers for the daily variation margin is also recorded on the Statements of Assets and Liabilities.
The use of futures contracts exposes the Fund to interest rate risk. The Fund may be subject to the risk that the change in the value of the futures contract may not correlate perfectly with the underlying instrument. Use of long futures contracts subjects the Fund to risk of loss in excess of the amounts shown on the Statements of Assets and Liabilities, up to the notional amount of the futures contracts. Use of short futures contracts subjects the Fund to unlimited risk of loss. The Fund may enter into futures contracts only on exchanges or boards of trade. The exchange or board of trade acts as the counterparty to each futures transaction; therefore, the Fund’s credit risk is limited to failure of the exchange or board of trade. Under some circumstances, futures exchanges may establish daily limits on the amount that the price of a futures contract can vary from the previous day’s settlement price, which could effectively prevent liquidation of positions.
The table below discloses the volume of the Fund’s futures contracts activity during the year ended February 28, 2017 (amounts in thousands):
| | | | |
| | | Tax Free
Bond Fund | |
Futures Contracts: | | | | |
Average Notional Balance Short | | $ | 8,028 | (a) |
Ending Notional Balance Short | | | 7,848 | |
| (a) | For the period November 1, 2016 through February 28, 2017. |
The Fund’s futures contracts are not subject to master netting arrangements (the right to close out all transactions traded with a counterparty and net amounts owed or due across transactions).
D. Offering and Organizational Costs — Total offering costs of approximately $84,000 incurred in connection with the offering of shares of the Ultra-Short Municipal Fund are amortized on a straight line basis over 12 months from the date the Fund commenced operations. Costs paid in connection with the organization of the Fund, if any, were recorded as an expense at the time the Fund commenced operations and are included as part of Professional fees on the Statements of Operations. For the year ended February 28, 2017, total offering costs amortized were approximately $63,000.
E. Security Transactions and Investment Income — Investment transactions are accounted for on the trade date (the date the order to buy or sell is executed). Securities gains and losses are calculated on a specifically identified cost basis. Interest income is determined on the basis of coupon interest accrued using the effective interest method which adjusts for amortization of premiums and accretion of discounts. Dividend income net of foreign taxes withheld, if any, is recorded on the ex-dividend date or when a fund first learns of the dividend.
F. Allocation of Income and Expenses — Expenses directly attributable to a fund are charged directly to that fund, while the expenses attributable to more than one fund of the Trusts are allocated among the respective funds. In calculating the NAV of each class, investment income, realized and unrealized gains and losses and expenses, other than class specific expenses, are allocated daily to each class of shares based upon the proportion of net assets of each class at the beginning of each day.
| | | | | | |
| | | |
| 102 | | | | J.P. MORGAN MUNICIPAL BOND FUNDS | | FEBRUARY 28, 2017 |
Transfer agency fees and sub-transfer agency fees are class-specific expenses. The amount of transfer agency fees and sub-transfer agency fees charged to each class of the Funds for the year ended February 28, 2017 are as follows (amounts in thousands):
| | | | | | | | | | | | | | | | | | | | |
| | | Class A | | | Class C | | | Class I* | | | Select Class | | | Total | |
Municipal Income Fund | | | | | | | | | | | | | | | | | | | | |
Transfer agency fees | | $ | 4 | | | $ | 1 | | | $ | 3 | | | | n/a | | | $ | 8 | |
Sub-transfer agency fees | | | 19 | | | | 6 | | | | 11 | | | | n/a | | | | 36 | |
| | | | | |
Ohio Municipal Bond Fund | | | | | | | | | | | | | | | | | | | | |
Transfer agency fees | | | 2 | | | | 1 | | | | 3 | | | | n/a | | | | 6 | |
Sub-transfer agency fees | | | 8 | | | | 6 | | | | 7 | | | | n/a | | | | 21 | |
| | | | | |
Short-Intermediate Municipal Bond Fund | | | | | | | | | | | | | | | | | | | | |
Transfer agency fees | | | 1 | | | | 1 | | | | 15 | | | $ | 2 | | | | 19 | |
Sub-transfer agency fees | | | 6 | | | | 6 | | | | 317 | | | | 3 | | | | 332 | |
| | | | | |
Tax Free Bond Fund | | | | | | | | | | | | | | | | | | | | |
Transfer agency fees | | | 19 | | | | 1 | | | | 4 | | | | n/a | | | | 24 | |
Sub-transfer agency fees | | | 29 | | | | 9 | | | | 24 | | | | n/a | | | | 62 | |
| | | | | |
Ultra-Short Municipal Fund | | | | | | | | | | | | | | | | | | | | |
Transfer agency fees | | | — | (a) | | | n/a | | | | — | (a) | | | n/a | | | | — | (a) |
Sub-transfer agency fees | | | — | | | | n/a | | | | — | | |
| n/a
|
| | | — | |
| (a) | Amount rounds to less than 500. |
| * | Effective April 3, 2017, the Institutional Class of Short-Intermediate Municipal Bond Fund and the Select Class of Municipal Income Fund, Ohio Municipal Bond Fund, Tax Free Bond Fund and Ultra-Short Municipal Fund were renamed Class I. |
G. Federal Income Taxes — Each Fund is treated as a separate taxable entity for Federal income tax purposes. Each Fund’s policy is to comply with the provisions of the Internal Revenue Code of 1986, as amended (the “Code”), applicable to regulated investment companies and to distribute to shareholders all of its distributable net investment income and net realized capital gains on investments. Accordingly, no provision for Federal income tax is necessary. Management has reviewed the Funds’ tax positions for all open tax years and has determined that as of February 28, 2017, no liability for income tax is required in the Funds’ financial statements for net unrecognized tax benefits. However, management’s conclusions may be subject to future review based on changes in, or the interpretation of, the accounting standards or tax laws and regulations. Each of the Funds’ Federal tax returns for the prior three fiscal years remain subject to examination by the Internal Revenue Service.
H. Distributions to Shareholders — Distributions from net investment income are generally declared and paid monthly and are declared separately for each class. No class has preferential dividend rights; differences in per share rates are due to differences in separate class expenses. Net realized capital gains, if any, are distributed by each Fund at least annually. The amount of distributions from net investment income and net realized capital gains is determined in accordance with Federal income tax regulations, which may differ from GAAP. To the extent these “book/tax” differences are permanent in nature (i.e., that they result from other than timing of recognition — “temporary differences”), such amounts are reclassified within the capital accounts based on their Federal tax-basis treatment.
The following amounts were reclassified within the capital accounts (amounts in thousands):
| | | | | | | | | | | | |
| | | Paid-in-Capital | | | Accumulated undistributed (distributions in excess of) net investment income | | | Accumulated net realized gains (losses) | |
Short-Intermediate Municipal Bond Fund | | $ | — | | | $ | (2 | ) | | $ | 2 | |
Tax Free Bond Fund | | | — | | | | — | (a) | | | — | (a) |
Ultra-Short Municipal Fund | | | — | (a) | | | — | (a) | | | — | |
| (a) | Amount rounds to less than 500. |
The reclassifications for the Funds relate primarily to redesignation of distributions and non-deductible expenses.
| | | | | | | | |
| | | |
| FEBRUARY 28, 2017 | | J.P. MORGAN MUNICIPAL BOND FUNDS | | | | | 103 | |
NOTES TO FINANCIAL STATEMENTS
AS OF FEBRUARY 28, 2017 (continued)
3. Fees and Other Transactions with Affiliates
A. Investment Advisory Fee — Pursuant to Investment Advisory Agreements, the Adviser supervises the investments of each Fund and for such services is paid a fee. The fee is accrued daily and paid monthly based on each Fund’s respective average daily net assets. The annual rate for each Fund is as follows:
| | | | |
Municipal Income Fund | | | 0.30 | % |
Ohio Municipal Bond Fund | | | 0.30 | |
Short-Intermediate Municipal Bond Fund | | | 0.25 | |
Tax Free Bond Fund | | | 0.30 | |
Ultra-Short Municipal Fund | | | 0.15 | |
The Adviser waived Investment Advisory fees and/or reimbursed expenses as outlined in Note 3.F.
B. Administration Fee — Pursuant to Administration Agreements, the Administrator provides certain administration services to the Funds. In consideration of these services, the Administrator receives a fee accrued daily and paid monthly at an annual rate of 0.15% of the first $25 billion of the average daily net assets of all funds in the J.P. Morgan Funds Complex covered by the Administration Agreement (excluding certain funds of funds and money market funds) and 0.075% of the average daily net assets in excess of $25 billion of all such funds. For the year ended February 28, 2017, the effective rate was 0.08% of each Fund’s average daily net assets, notwithstanding any fee waivers and/or expense reimbursements.
The Administrator waived Administration fees as outlined in Note 3.F.
JPMorgan Chase Bank, N.A. (“JPMCB”), a wholly-owned subsidiary of JPMorgan, serves as the Funds’ sub-administrator (the “Sub-administrator”). For its services as Sub-administrator, JPMCB receives a portion of the fees payable to the Administrator.
C. Distribution Fees — Pursuant to a Distribution Agreement, JPMorgan Distribution Services, Inc. (“JPMDS”), a wholly-owned subsidiary of JPMorgan, serves as the Trusts’ principal underwriter and promotes and arranges for the sale of each Fund’s shares.
The Board has adopted a Distribution Plan (the “Distribution Plan”) for Class A and Class C Shares of the Funds in accordance with Rule 12b-1 under the 1940 Act. Select Class Shares of Short-Intermediate Municipal Bond Fund and Class I Shares do not charge a distribution fee. The Distribution Plan provides that each Fund shall pay distribution fees, including payments to JPMDS, at annual rates of the average daily net assets as shown in the table below:
| | | | | | |
| | | Class A | | Class C | |
| | 0.25% | | | 0.75 | % |
In addition, JPMDS is entitled to receive the front-end sales charges from purchases of Class A Shares and the CDSC from redemptions of Class C Shares and certain Class A Shares for which front-end sales charges have been waived. For the year ended February 28, 2017, JPMDS retained the following (amounts in thousands):
| | | | | | | | |
| | | Front-End Sales Charge | | | CDSC | |
Municipal Income Fund | | $ | 15 | | | $ | — | |
Ohio Municipal Bond Fund | | | 6 | | | | — | |
Short-Intermediate Municipal Bond Fund | | | 4 | | | | — | |
Tax Free Bond Fund | | | 36 | | | | — | |
Ultra-Short Municipal Fund | | | 1 | | | | — | |
D. Shareholder Servicing Fees — The Trusts, on behalf of the Funds, have entered into a Shareholder Servicing Agreement with JPMDS under which JPMDS provides certain support services to the shareholders. For performing these services, JPMDS receives a fee that is accrued daily and paid monthly equal to a percentage of the average daily net assets as shown in the table below:
| | | | | | | | | | | | | | | | |
| | | Class A | | | Class C | | | Class I* | | | Select Class | |
Municipal Income Fund | | | 0.25 | % | | | 0.25 | % | | | 0.25 | % | | | n/a | |
Ohio Municipal Bond Fund | | | 0.25 | | | | 0.25 | | | | 0.25 | | | | n/a | |
Short-Intermediate Municipal Bond Fund | | | 0.25 | | | | 0.25 | | | | 0.10 | | | | 0.25 | % |
Tax Free Bond Fund | | | 0.25 | | | | 0.25 | | | | 0.25 | | | | n/a | |
Ultra-Short Municipal Fund | | | 0.25 | | | | n/a | | | | 0.25 | | | | n/a | |
| * | Effective April 3, 2017, the Institutional Class of Short-Intermediate Municipal Bond Fund and the Select Class of Municipal Income Fund, Ohio Municipal Bond Fund, Tax Free Bond Fund and Ultra-Short Municipal Fund were renamed Class I. |
JPMDS has entered into shareholder services contracts with affiliated and unaffiliated financial intermediaries who provide shareholder services and other related services to their clients or customers who invest in the Funds under which JPMDS will pay all or a portion of such fees earned to financial intermediaries for performing such services.
JPMDS waived shareholder servicing fees as outlined in Note 3.F.
| | | | | | |
| | | |
| 104 | | | | J.P. MORGAN MUNICIPAL BOND FUNDS | | FEBRUARY 28, 2017 |
E. Custodian and Accounting Fees — JPMCB provides portfolio custody and accounting services to the Funds. For performing these services, the Funds pay JPMCB transaction and asset-based fees that vary according to the number of transactions and positions, plus out-of-pocket expenses. The amounts paid directly to JPMCB by the Funds for custody and accounting services are included in Custodian and accounting fees on the Statements of Operations. Payments to the custodian may be reduced by credits earned by each Fund, based on uninvested cash balances held by the custodian. Such earnings credits, if any, are presented separately on the Statements of Operations.
Interest expense paid to the custodian related to cash overdrafts, if any, is included in Interest expense to affiliates on the Statements of Operations.
F. Waivers and Reimbursements — The Adviser, Administrator and/or JPMDS have contractually agreed to waive fees and/or reimburse the Funds to the extent that total annual operating expenses (excluding acquired fund fees and expenses other than certain money market fund fees as described below, dividend and interest expenses related to short sales, interest, taxes, expenses related to litigation and potential litigation and extraordinary expenses) exceed the percentages of the Funds’ respective average daily net assets as shown in the table below:
| | | | | | | | | | | | | | | | |
| | | Class A | | | Class C | | | Class I* | | | Select Class | |
Municipal Income Fund | | | 0.70 | % | | | 1.25 | % | | | 0.45 | % | | | n/a | |
Ohio Municipal Bond Fund | | | 0.75 | | | | 1.25 | | | | 0.50 | | | | n/a | |
Short-Intermediate Municipal Bond Fund | | | 0.70 | | | | 1.20 | | | | 0.25 | | | | 0.25 | % |
Tax Free Bond Fund | | | 0.67 | | | | 1.25 | | | | 0.45 | | | | n/a | |
Ultra-Short Municipal Fund | | | 0.45 | | | | n/a | | | | 0.25 | | | | n/a | |
| * | Effective April 3, 2017, the Institutional Class of Short-Intermediate Municipal Bond Fund and the Select Class of the Municipal Income Fund, Ohio Municipal Bond Fund, Tax Free Bond Fund and Ultra-Short Municipal Fund were renamed Class I. |
The contractual limitations percentages in the table above are in place until at least October 31, 2018.
Prior to November 1, 2016, the contractual expense limitations for the Funds were as shown in the table below:
| | | | | | | | | | | | | | | | |
| | | Class A | | | Class C | | | Class I* | | | Select Class | |
Municipal Income Fund | | | 0.82 | % | | | 1.39 | % | | | 0.57 | % | | | n/a | |
Ohio Municipal Bond Fund | | | 0.88 | | | | 1.53 | | | | 0.63 | | | | n/a | |
Short-Intermediate Municipal Bond Fund | | | 0.75 | | | | 1.25 | | | | 0.25 | | | | 0.50 | % |
Tax Free Bond Fund | | | 0.67 | | | | 1.36 | | | | 0.50 | | | | n/a | |
Ultra-Short Municipal Fund | | | 0.55 | | | | n/a | | | | 0.35 | | | | n/a | |
| * | Effective April 3, 2017, the Institutional Class of Short-Intermediate Municipal Bond Fund and the Select Class of the Municipal Income Fund, Ohio Municipal Bond Fund, Tax Free Bond Fund and Ultra-Short Municipal Fund were renamed Class I. |
For the year ended February 28, 2017, the Funds’ service providers waived fees and/or reimbursed expenses for each of the Funds as follows (amounts in thousands). None of these parties expect the Funds to repay any such waived fees and/or reimbursed expenses in future years.
| | | | | | | | | | | | | | | | | | | | |
| | | Contractual Waivers | | | | |
| | | Investment
Advisory | | | Administration | | | Shareholder
Servicing | | | Total | | | Contractual
Reimbursement | |
Municipal Income Fund | | $ | 318 | | | $ | 161 | | | $ | 117 | | | $ | 596 | | | $ | — | |
Ohio Municipal Bond Fund | | | 121 | | | | 44 | | | | 101 | | | | 266 | | | | — | |
Short-Intermediate Municipal Bond Fund | | | 1,894 | | | | 1,261 | | | | 1,860 | | | | 5,015 | | | | 178 | |
Tax Free Bond Fund | | | 377 | | | | 207 | | | | 362 | | | | 946 | | | | — | |
Ultra-Short Municipal Fund | | | 17 | | | | 9 | | | | 23 | | | | 49 | | | | 158 | |
Additionally, the Funds may invest in one or more money market funds advised by the Adviser or its affiliates (affiliated money market funds). The Adviser, Administrator and/or JPMDS, as shareholder servicing agent, have contractually agreed to waive fees and/or reimburse expenses in an amount sufficient to offset the respective net fees each collects from the affiliated money market fund on the applicable Funds’ investment in such affiliated money market fund.
| | | | | | | | |
| | | |
| FEBRUARY 28, 2017 | | J.P. MORGAN MUNICIPAL BOND FUNDS | | | | | 105 | |
NOTES TO FINANCIAL STATEMENTS
AS OF FEBRUARY 28, 2017 (continued)
The amounts of these waivers resulting from investments in these money market funds for the year ended February 28, 2017 were as follows (amounts in thousands):
| | | | |
Municipal Income Fund | | $ | 17 | |
Ohio Municipal Bond Fund | | | 3 | |
Short-Intermediate Municipal Bond Fund | | | 96 | |
Tax Free Bond Fund | | | 45 | |
Ultra-Short Municipal Fund | | | 2 | |
G. Other — Certain officers of the Trusts are affiliated with the Adviser, the Administrator and JPMDS. Such officers, with the exception of the Chief Compliance Officer, receive no compensation from the Funds for serving in their respective roles.
The Board appointed a Chief Compliance Officer to the Funds in accordance with Federal securities regulations. Each Fund, along with other affiliated funds, makes reimbursement payments, on a pro-rata basis, to the Administrator for a portion of the fees associated with the Office of the Chief Compliance Officer. Such fees are included in Trustees’ and Chief Compliance Officer’s fees on the Statements of Operations.
The Trusts adopted a Trustee Deferred Compensation Plan (the “Plan”) which allows the Independent Trustees to defer the receipt of all or a portion of compensation related to performance of their duties as Trustees. The deferred fees are invested in various J.P. Morgan Funds until distribution in accordance with the Plan.
During the year ended February 28, 2017, Municipal Income Fund, Short-Intermediate Municipal Bond Fund, Tax Free Bond Fund and Ultra-Short Municipal Fund purchased securities from an underwriting syndicate in which the principal underwriter or members of the syndicate were affiliated with the Adviser.
The Funds may use related party broker-dealers. For the year ended February 28, 2017, the Funds did not incur any brokerage commissions with broker-dealers affiliated with the Adviser.
The Securities and Exchange Commission (“SEC”) has granted an exemptive order permitting the Funds to engage in principal transactions with J.P. Morgan Securities, Inc., an affiliated broker, involving taxable money market instruments, subject to certain conditions.
4. Investment Transactions
During the year ended February 28, 2017, purchases and sales of investments (excluding short-term investments) were as follows (amounts in thousands):
| | | | | | | | |
| | | Purchases
(excluding U.S.
Government) | | | Sales
(excluding U.S.
Government) | |
Municipal Income Fund | | $ | 42,475 | | | $ | 93,335 | |
Ohio Municipal Bond Fund | | | 9,302 | | | | 18,050 | |
Short-Intermediate Municipal Bond Fund | | | 714,701 | | | | 1,292,488 | |
Tax Free Bond Fund | | | 255,927 | | | | 223,585 | |
Ultra-Short Municipal Fund | | | 26,526 | | | | 6,886 | |
During the year ended February 28, 2017, there were no purchases or sales of U.S. Government securities.
5. Federal Income Tax Matters
For Federal income tax purposes, the estimated cost and unrealized appreciation (depreciation) in value of investment securities held at February 28, 2017 were as follows (amounts in thousands):
| | | | | | | | | | | | | | | | |
| | | Aggregate Cost | | | Gross Unrealized Appreciation | | | Gross Unrealized Depreciation | | | Net Unrealized Appreciation (Depreciation) | |
Municipal Income Fund | | $ | 262,185 | | | $ | 8,278 | | | $ | 1,634 | | | $ | 6,644 | |
Ohio Municipal Bond Fund | | | 114,840 | | | | 5,862 | | | | 564 | | | | 5,298 | |
Short-Intermediate Municipal Bond Fund | | | 2,019,385 | | | | 18,656 | | | | 7,851 | | | | 10,805 | |
Tax Free Bond Fund | | | 303,176 | | | | 19,841 | | | | 4,163 | | | | 15,678 | |
Ultra-Short Municipal Fund | | | 33,707 | | | | 47 | | | | 7 | | | | 40 | |
The reclassifications for the Funds relate primarily to wash sale loss deferrals.
| | | | | | |
| | | |
| 106 | | | | J.P. MORGAN MUNICIPAL BOND FUNDS | | FEBRUARY 28, 2017 |
The tax character of distributions paid during the year ended February 28, 2017 was as follows (amounts in thousands):
| | | | | | | | | | | | | | | | |
| | | Ordinary Income* | | | Tax Exempt Income | | | Net Long-Term Capital
Gains | | | Total Distributions Paid | |
Municipal Income Fund | | $ | 27 | | | $ | 7,728 | | | $ | 3,503 | | | $ | 11,258 | |
Ohio Municipal Bond Fund | | | 3 | | | | 3,462 | | | | 714 | | | | 4,179 | |
Short-Intermediate Municipal Bond Fund | | | 4,917 | | | | 32,366 | | | | 6,763 | | | | 44,046 | |
Tax Free Bond Fund | | | 3,209 | | | | 10,622 | | | | 3,637 | | | | 17,468 | |
Ultra-Short Municipal Fund | | | 5 | | | | 75 | | | | — | | | | 80 | |
| * | Short-term gains are treated as ordinary income for income tax purposes. |
The tax character of distributions paid during the year ended February 29, 2016 was as follows (amounts in thousands):
| | | | | | | | | | | | | | | | |
| | | Ordinary Income* | | | Tax Exempt Income | | | Net Long-Term
Capital Gains | | | Total Distributions Paid | |
Municipal Income Fund | | $ | 105 | | | $ | 8,712 | | | $ | 2,332 | | | $ | 11,149 | |
Ohio Municipal Bond Fund | | | — | (a) | | | 4,009 | | | | 1,236 | | | | 5,245 | |
Short-Intermediate Municipal Bond Fund | | | 13 | | | | 36,529 | | | | — | | | | 36,542 | |
Tax Free Bond Fund | | | 947 | | | | 11,326 | | | | 1,347 | | | | 13,620 | |
| (a) | Amount rounds to less than 500. |
| * | Short-term gains are treated as ordinary income for income tax purposes. |
As of February 28, 2017, the estimated components of net assets (excluding paid-in-capital) on a tax basis were as follows (amounts in thousands):
| | | | | | | | | | | | |
| | | Tax Exempt Income | | | Current Distributable Long-Term Capital Gain or (Tax Basis Capital Loss Carryover) | | | Unrealized Appreciation (Depreciation) | |
Municipal Income Fund | | $ | 20 | | | $ | 548 | | | $ | 6,644 | |
Ohio Municipal Bond Fund | | | 11 | | | | 143 | | | | 5,298 | |
Short-Intermediate Municipal Bond Fund | | | 48 | | | | — | | | | 10,805 | |
Tax Free Bond Fund | | | 38 | | | | — | | | | 15,678 | |
Ultra-Short Municipal Fund | | | 7 | | | | — | | | | 40 | |
For the Funds, the cumulative timing differences primarily consist of trustee deferred compensation and post-October capital loss deferrals.
As of February 28, 2017, the Funds did not have net capital loss carryforwards.
Net capital losses incurred after October 31 within the taxable year are deemed to arise on the first business day of the Fund’s next taxable year. For the year ended February 28, 2017, the following Funds deferred to March 1, 2017 the net capital losses of (amounts in thousands):
| | | | | | | | |
| | | Net Capital Loss | |
| | | Short-Term | | | Long-Term | |
Municipal Income Fund | | $ | 30 | | | $ | — | |
Short-Intermediate Municipal Bond Fund | | | 8,006 | | | | 748 | |
Tax Free Bond Fund | | | 1,839 | | | | (105 | ) |
Ultra-Short Municipal Fund | | | — | (a) | | | — | |
| (a) | Amount rounds to less than 500. |
6. Borrowings
The Funds rely upon an exemptive order granted by the SEC (the “Order”) permitting the establishment and operation of an Interfund Lending Facility (the “Facility”). The Facility allows the Funds to directly lend and borrow money to or from any other fund relying upon the Order at rates beneficial to both the borrowing and lending funds. Advances under the Facility are taken primarily for temporary or emergency purposes, including the meeting of redemption requests that otherwise might require the untimely disposition of securities, and are subject to each Fund’s borrowing restrictions. The Interfund loan rate is determined, as specified in the Order, by averaging the current repurchase agreement rate and the current bank loan rate. The Order was granted to JPM II and may be relied upon by the Funds because the Funds and the series of JPMorgan Trust II are all investment companies in the same “group of investment companies” (as defined in Section 12(d)(1)(G) of the 1940 Act).
| | | | | | | | |
| | | |
| FEBRUARY 28, 2017 | | J.P. MORGAN MUNICIPAL BOND FUNDS | | | | | 107 | |
NOTES TO FINANCIAL STATEMENTS
AS OF FEBRUARY 28, 2017 (continued)
The Trusts and JPMCB have entered into a financing arrangement. Under this arrangement, JPMCB provides an unsecured, uncommitted credit facility in the aggregate amount of $100 million to certain of the J.P. Morgan Funds, including the Funds. Advances under the arrangement are taken primarily for temporary or emergency purposes, including the meeting of redemption requests that otherwise might require the untimely disposition of securities, and are subject to each Fund’s borrowing restrictions. Interest on borrowings is payable at a rate determined by JPMCB at the time of borrowing. This agreement has been extended until November 6, 2017.
The Funds had no borrowings outstanding from another fund or from the unsecured, uncommitted credit facility at February 28, 2017. Average borrowings from the Facility for, or at any time during the year ended February 28, 2017, were as follows (amounts in thousands):
| | | | | | | | | | | | | | | | |
| | | Average
Borrowings | | | Average Interest
Rate Paid | | | Number of
Days Outstanding | | | Interest
Paid | |
Municipal Income Fund | | $ | 20,758 | | | | 0.44 | % | | | 1 | | | $ | — | (a) |
| (a) | Amount rounds to less than 500. |
Interest expense paid as a result of borrowing from another fund or from the unsecured, uncommited credit facility is included in Interest expense to affiliates on the Statements of Operations.
In addition, effective August 16, 2016, JPM II along with certain other trusts (“Borrowers”) entered into a joint syndicated senior unsecured revolving credit facility totaling $1.5 billion (“Credit Facility”) with various lenders and The Bank of New York Mellon, as administrative agent for the lenders. This Credit Facility provides a source of funds to the Borrowers for temporary and emergency purposes, including the meeting of redemption requests that otherwise might require the untimely disposition of securities. Under the terms of the Credit Facility, a borrowing fund must have a minimum of $25,000,000 in adjusted net asset value and not exceed certain adjusted net asset coverage ratios prior to and during the time in which any borrowings are outstanding. If a fund does not comply with the aforementioned requirements, the fund must remediate within three business days with respect to the $25,000,000 minimum adjusted net asset value or within one business day with respect to certain asset coverage ratios or the administrative agent at the request of, or with the consent of, the lenders may terminate the Credit Facility and declare any outstanding borrowings to be due and payable immediately.
Interest associated with any borrowing under the Credit Facility is charged to the borrowing fund at a rate of interest equal to 1.00% plus the greater of the federal funds effective rate or one month LIBOR. The annual commitment fee to maintain the Credit Facility is 0.15% and is incurred on the unused portion of the Credit Facility and is allocated to all participating funds pro rata based on their respective net assets. The initial term of the Credit Facility is 364 days, unless extended.
The Funds did not utilize the Credit Facility during the year ended February 28, 2017.
7. Risks, Concentrations and Indemnifications
In the normal course of business, the Funds enter into contracts that contain a variety of representations which provide general indemnifications. Each Fund’s maximum exposure under these arrangements is unknown. The amount of exposure would depend on future claims that may be made against each Fund that have not yet occurred. However, based on experience, the Funds expect the risk of loss to be remote.
As of February 28, 2017, the Funds had affiliated omnibus accounts which collectively represented the following percentage of each Fund’s net assets as follows:
| | | | | | | | |
| | | Number of
Affiliated
Omnibus
Accounts | | | % of the
Fund | |
Municipal Income Fund | | | 3 | | | | 70.0 | % |
Ohio Municipal Bond Fund | | | 3 | | | | 65.4 | |
Short-Intermediate Municipal Bond Fund | | | 5 | | | | 93.9 | |
Tax Free Bond Fund | | | 4 | | | | 60.3 | |
Ultra-Short Municipal Fund | | | 2 | | | | 97.1 | |
Significant shareholder transactions by these shareholders may impact the Funds’ performance.
Due to Municipal Income Fund investments in Underlying Funds, the Fund indirectly pays a portion of the expenses incurred by the underlying funds. As a result, the cost of investing in the Fund may be higher than the cost of investing in a mutual fund that invests directly in individual securities and financial instruments. The Fund is also subject to certain risks related to the Underlying Funds’ investments in securities and financial instruments such as fixed income securities, including high yield, asset-backed and mortgage-related securities, including collateralized mortgage obligations and stripped mortgage-backed securities, equity securities, foreign and emerging markets securities, and convertible securities. These securities are subject to risks specific to their structure, sector or market.
Derivatives may be riskier than other types of investments because they may be more sensitive to changes in economic and market conditions and could result in losses that significantly exceed the Funds’ original investment. Many derivatives create leverage thereby causing the Funds to be more volatile than they would have been if they had not used derivatives. Derivatives also expose the Funds to counterparty risk (the risk that the derivative counterparty will not fulfill its contractual obligations), including credit risk of the derivative counterparty.
| | | | | | |
| | | |
| 108 | | | | J.P. MORGAN MUNICIPAL BOND FUNDS | | FEBRUARY 28, 2017 |
The Funds are subject to interest rate and credit risk. The value of debt securities may decline as interest rates increase. The Funds could lose money if the issuer of a fixed income security is unable to pay interest or repay principal when it is due. The Funds invest in floating rate loans and other floating rate debt securities. Although these investments are generally less sensitive to interest rate changes than other fixed rate instruments, the value of floating rate loans and other floating rate investments may decline if their interest rates do not rise as quickly, or as much, as general interest rates. Many factors can cause interest rates to rise. Some examples include central bank monetary policy, rising inflation rates and general economic conditions. Given the historically low interest rate environment, risks associated with rising rates are heightened. The ability of the issuers of debt to meet their obligations may be affected by the economic and political developments in a specific industry or region.
Specific risks and concentrations present in the underlying funds are disclosed within their individual financial statements and registration statements, as appropriate.
The Funds invest primarily in a portfolio of debt obligations issued by states, territories and possessions of the United States and by the District of Columbia, and by their political subdivisions and duly constituted authorities. The Ohio Municipal Bond Fund primarily invests in issuers in the State of Ohio. These debt obligations may be insured by private insurers who guarantee the payment of principal and interest in the event of issuer default. The value of these investments may be impacted by changes to bond insurers’ ratings and the Fund’s ability to collect principal and interest in the event of an issuer’s default may be limited if the private insurer does not have the wherewithal to satisfy its obligation.
8. Investment Company Reporting Modernization
In October 2016, the U.S. Securities and Exchange Commission adopted new rules and forms, and amendments to certain current rules and forms, to modernize the reporting and disclosure of information by registered investment companies. In part, the final rules amend Regulation S-X and will require standardized, enhanced disclosures about derivatives in investment company financial statements, as well as other amendments. The compliance date for the amendments to Regulation S-X is August 1, 2017. At this time, management is currently assessing the anticipated impact of the Regulation S-X amendments on the Funds’ financial statements and related disclosures.
9. Subsequent Event
Effective April 3, 2017, the Funds ceased making direct payments to financial intermediaries for any applicable sub-transfer agency services. Payments to financial intermediaries for sub-transfer agency services are made by JPMDS from the Shareholder Servicing Fee which has been renamed as the Service Fee.
| | | | | | | | |
| | | |
| FEBRUARY 28, 2017 | | J.P. MORGAN MUNICIPAL BOND FUNDS | | | | | 109 | |
REPORT OF INDEPENDENT REGISTERED PUBLIC ACCOUNTING FIRM
To the Board of Trustees of JPMorgan Trust II and JPMorgan Trust IV and the Shareholders of JPMorgan Municipal Income Fund, JPMorgan Ohio Municipal Bond Fund, JPMorgan Short-Intermediate Municipal Bond Fund, JPMorgan Tax Free Bond Fund and JPMorgan Ultra-Short Municipal Fund:
In our opinion, the accompanying statements of assets and liabilities, including the schedules of portfolio investments, and the related statements of operations and of changes in net assets and the financial highlights present fairly, in all material respects, the financial position of JPMorgan Municipal Income Fund, JPMorgan Ohio Municipal Bond Fund, JPMorgan Short-Intermediate Municipal Bond Fund and JPMorgan Tax Free Bond Fund (each a separate series of JPMorgan Trust II) as of February 28, 2017, the results of each of their operations for the year then ended, the changes in each of their net assets for each of the two years in the period then ended and the financial highlights for each of the five years in the period then ended and the financial position of JPMorgan Ultra-Short Municipal Fund (a separate series of JPMorgan Trust IV) (hereafter collectively referred to as the “Funds”) as of February 28, 2017, and the results of its operations, the changes in its net assets and the financial highlights for the period May 31, 2016 (commencement of operations) through February 28, 2017, in conformity with accounting principles generally accepted in the United States of America. These financial statements and financial highlights (hereafter referred to as “financial statements”) are the responsibility of the Funds’ management. Our responsibility is to express an opinion on these financial statements based on our audits. We conducted our audits of these financial statements in accordance with the standards of the Public Company Accounting Oversight Board (United States). Those standards require that we plan and perform the audit to obtain reasonable assurance about whether the financial statements are free of material misstatement. An audit includes examining, on a test basis, evidence supporting the amounts and disclosures in the financial statements, assessing the accounting principles used and significant estimates made by management, and evaluating the overall financial statement presentation. We believe that our audits, which included confirmation of securities as of February 28, 2017 by correspondence with the transfer agent, custodian and brokers, provide a reasonable basis for our opinion.
PricewaterhouseCoopers LLP
New York, New York
April 26, 2017
| | | | | | |
| | | |
| 110 | | | | J.P. MORGAN MUNICIPAL BOND FUNDS | | FEBRUARY 28, 2017 |
TRUSTEES
(Unaudited)
The Funds’ Statement of Additional Information includes additional information about the Funds’ Trustees and is available, without charge, upon request by calling 1-800-480-4111 or on the J.P. Morgan Funds’ website at www.jpmorganfunds.com.
| | | | | | |
Name (Year of Birth); Positions With the Funds (1) | | Principal Occupations During Past 5 Years | | Number of
Portfolios in Fund
Complex Overseen
by Trustee (2) | | Other Directorships Held Outside Fund Complex During Past 5 Years |
Independent Trustees | | |
| | | |
| John F. Finn (1947); Trustee of Trusts since 2005; Trustee of heritage One Group Mutual Funds since 1998. | | Chairman (1985-present), President and Chief Executive Officer, Gardner, Inc. (supply chain management company serving industrial and consumer markets) (1974-present). | | 153 | | Director, Greif, Inc. (GEF) (industrial package products and services) (2007-present); Trustee, Columbus Association for the Performing Arts (1988-present); Director, Cardinal Health, Inc. (CAH) (1994-2014). |
| | | |
| Dr. Matthew Goldstein (1941); Chairman since 2013; Trustee of Trusts since 2005; Trustee of heritage J.P. Morgan Funds since 2003. | | Chancellor Emeritus, City University of New York (2015-present); Professor, City University of New York (2013-present); Chancellor, City University of New York (1999-2013); President, Adelphi University (New York) (1998-1999). | | 153 | | Trustee, Museum of Jewish Heritage (2011-present); Trustee, National Museum of Mathematics (present); Chair, Association of College and University Administrators (present). |
| | | |
| Dennis P. Harrington (1950); Trustee of Trusts since 2017. | | Retired; Partner, Deloitte LLP (1984-2012). | | 152 | | None |
| | | |
| Frankie D. Hughes (1952); Trustee of Trusts since 2008. | | President, Ashland Hughes Properties (property management) (2014-present); President and Chief Investment Officer, Hughes Capital Management, Inc. (fixed income asset management) (1993-2014). | | 153 | | Trustee, The Victory Portfolios
(2000-2008) (Investment companies). |
| | | |
| Peter C. Marshall (1942); Trustee of Trusts since 2005; Trustee of heritage One Group Mutual Funds since 1985. | | Self-employed business consultant
(2002-present). | | 153 | | None |
| | | |
| Mary E. Martinez (1960); Trustee of Trusts since 2013. | | Associate, Special Properties, a Christie’s International Real Estate Affiliate (2010-present); Managing Director, Bank of America (Asset Management) (2007-2008); Chief Operating Officer, U.S. Trust Asset Management, U.S. Trust Company (asset management) (2003-2007); President, Excelsior Funds (registered investment companies) (2004-2005). | | 153 | | None |
| | | |
| Marilyn McCoy* (1948); Trustee of Trusts since 2005; Trustee of heritage One Group Mutual Funds since 1999. | | Vice President of Administration and Planning, Northwestern University (1985-present). | | 153 | | None |
| | | |
| Mitchell M. Merin (1953); Trustee of Trusts since 2013. | | Retired; President and Chief Operating Officer, Morgan Stanley Investment Management, Member Morgan Stanley & Co. Management Committee (registered investment adviser) (1998-2005). | | 153 | | Director, Sun Life Financial (SLF) (2007-2013) (financial services and insurance); Trustee, Trinity College, Hartford, CT (2002-2010). |
| | | |
| Dr. Robert A. Oden, Jr. (1946); Trustee of Trusts since 2005; Trustee of heritage One Group Mutual Funds since 1997. | | Retired; President, Carleton College
(2002-2010); President, Kenyon College
(1995-2002). | | 153 | | Chairman, Dartmouth-Hitchcock Medical Center (2011-present); Trustee, American Schools of Oriental Research (2011-present); Trustee, American University in Cairo (1999-2014); Trustee, American Museum of Fly Fishing (2013-present). |
| | | | | | | | |
| | | |
| FEBRUARY 28, 2017 | | J.P. MORGAN MUNICIPAL BOND FUNDS | | | | | 111 | |
| | | | | | |
Name (Year of Birth); Positions With the Funds (1) | | Principal Occupations During Past 5 Years | | Number of
Portfolios in Fund
Complex Overseen
by Trustee (2) | | Other Directorships Held Outside Fund Complex During Past 5 Years |
Independent Trustees (continued) | | |
| | | |
| Marian U. Pardo** (1946); Trustee of Trusts since 2013. | | Managing Director and Founder, Virtual Capital Management LLC (Investment Consulting) (2007-present); Managing Director, Credit Suisse Asset Management (portfolio manager) (2003-2006). | | 153 | | Member, Board of Governors, Columbus Citizens Foundation (not-for-profit supporting philanthropic and cultural programs) (2006-present). |
| | | |
| Frederick W. Ruebeck (1939); Trustee of Trusts since 2005; Trustee of heritage One Group Mutual Funds since 1994. | | Consultant (2000-present); Adviser, JP Greene & Associates, LLC (broker-dealer)
(2000-2009); Chief Investment Officer, Wabash College (2004-present); Director of Investments, Eli Lilly and Company (pharmaceuticals) (1988-1999). | | 153 | | None |
| | | |
| James J. Schonbachler (1943); Trustee of Trusts since 2005; Trustee of heritage J.P. Morgan Funds since 2001. | | Retired; Managing Director of Bankers Trust Company (financial services) (1968-1998). | | 153 | | None |
| (1) | The Trustees serve for an indefinite term, subject to the Trusts’ current retirement policy, which is age 78 for all Trustees. |
| (2) | A Fund Complex means two or more registered investment companies that hold themselves out to investors as related companies for purposes of investment and investor services or have a common investment adviser or have an investment adviser that is an affiliated person of the investment adviser of any of the other registered investment companies. The J.P. Morgan Funds Complex for which the Board of Trustees serves currently includes twelve registered investment companies (153 funds). |
| * | Two members of the Board of Trustees of Northwestern University are executive officers of registered investment advisers (not affiliated with JPMorgan) that are under common control with sub-advisers to certain J.P. Morgan Funds. |
| ** | In connection with prior employment with JPMorgan Chase, Ms. Pardo was the recipient of non-qualified pension plan payments from JPMorgan Chase in the amount of approximately $2,055 per month, which she irrevocably waived effective January 1, 2013, and deferred compensation payments from JPMorgan Chase in the amount of approximately $7,294 per year, which ended in January 2013. In addition, Ms. Pardo receives payments from a fully-funded qualified plan, which is not an obligation of JPMorgan Chase. |
The contact address for each of the Trustees is 270 Park Avenue, New York, NY 10017.
| | | | | | |
| | | |
| 112 | | | | J.P. MORGAN MUNICIPAL BOND FUNDS | | FEBRUARY 28, 2017 |
OFFICERS
(Unaudited)
| | |
Name (Year of Birth), Positions Held with the Trust (Since) | | Principal Occupations During Past 5 Years |
| |
Brian S. Shlissel (1964),
President and Principal Executive Officer (2016) | | Managing Director and Chief Administrative Officer for J.P. Morgan pooled vehicles, J.P. Morgan Investment Management Inc. (formerly JPMorgan Funds Management, Inc.) (2014 – present); Managing Director and Head of Mutual Fund Services, Allianz Global Investors; President and Chief Executive Officer, Allianz Global Investors Mutual Funds and PIMCO Closed-End Funds (1999-2014) |
| |
Laura M. Del Prato (1964),
Treasurer and Principal Financial Officer (2014)* | | Managing Director, J.P. Morgan Investment Management Inc. (formerly JPMorgan Funds Management, Inc.) since 2014; Partner, Cohen Fund Audit Services, Ltd. (2012-2013); Partner (2004-2012) and various other titles (1990-2004) at KPMG, LLP. |
| |
Frank J. Nasta (1964),
Secretary (2008) | | Managing Director and Associate General Counsel, JPMorgan Chase since 2008. |
| |
Stephen M. Ungerman (1953),
Chief Compliance Officer (2005) | | Managing Director, JPMorgan Chase & Co.; Mr. Ungerman has been with JPMorgan Chase & Co. since 2000. |
| |
Elizabeth A. Davin (1964), Assistant Secretary (2005)* | | Executive Director and Assistant General Counsel, JPMorgan Chase since February 2012; formerly Vice President and Assistant General Counsel, JPMorgan Chase from 2005 to February 2012; Senior Counsel, JPMorgan Chase (formerly Bank One Corporation) from 2004 to 2005. |
| |
Jessica K. Ditullio (1962),
Assistant Secretary (2005)* | | Executive Director and Assistant General Counsel, JPMorgan Chase. Ms. Ditullio has been with JPMorgan Chase (formerly Bank One Corporation) since 1990. |
| |
John T. Fitzgerald (1975),
Assistant Secretary (2008) | | Executive Director and Assistant General Counsel, JPMorgan Chase. Mr. Fitzgerald has been with JPMorgan Chase since 2005. |
| |
Carmine Lekstutis (1980),
Assistant Secretary (2011) | | Executive Director and Assistant General Counsel, JPMorgan Chase since February 2015; formerly Vice President and Assistant General Counsel, JPMorgan Chase from 2011 to February 2015. |
| |
Gregory S. Samuels (1980),
Assistant Secretary (2010) | | Executive Director and Assistant General Counsel, JPMorgan Chase since 2014; formerly Vice President and Assistant General Counsel, JPMorgan Chase since 2010. |
| |
Pamela L. Woodley (1971),
Assistant Secretary (2012)** | | Vice President and Assistant General Counsel, JPMorgan Chase since November 2004. |
| |
Zachary E. Vonnegut-Gabovitch (1986) Assistant Secretary (2017) | | Vice President and Assistant General Counsel, JPMorgan Chase since September 2016; Associate, Morgan, Lewis & Bockius (law firm) from 2012 to 2016. |
| |
Michael M. D’Ambrosio (1969),
Assistant Treasurer (2012) | | Managing Director, J.P. Morgan Investment Management Inc. (formerly JPMorgan Funds Management, Inc.) since May 2014; formerly Executive Director, JPMorgan Funds Management, Inc. from 2012 to May 2014; prior to joining JPMorgan Chase, Mr. D’Ambrosio was a Tax Director at PricewaterhouseCoopers LLP since 2006. |
| |
Lauren A. Paino (1973), Assistant Treasurer (2014)** | | Executive Director, J.P. Morgan Investment Management Inc. (formerly JPMorgan Funds Management, Inc.) since August 2013; formerly Director, Credit Suisse Asset Management from 2000-2013. |
| |
Joseph Parascondola (1963),
Assistant Treasurer (2011)** | | Vice President, J.P. Morgan Investment Management Inc. (formerly JPMorgan Funds Management, Inc.) since August 2006. |
| |
Matthew J. Plastina (1970),
Assistant Treasurer (2011)** | | Executive Director, J.P. Morgan Investment Management Inc. (formerly JPMorgan Funds Management, Inc.) since February 2016; Vice President, JPMorgan Funds Management, Inc. from 2010 to January 2016. |
| |
Julie A. Roach (1971),
Assistant Treasurer (2012)* | | Executive Director, J.P. Morgan Investment Management Inc. (formerly JPMorgan Funds Management, Inc.) since February 2017; Vice President, JPMorgan Funds Management, Inc. from August 2012 to January 2016; prior to joining JPMorgan Chase, Ms. Roach was a Senior Manager with Deloitte since 2001. |
| |
Gillian I. Sands (1969),
Assistant Treasurer (2012)** | | Vice President, J.P. Morgan Investment Management Inc. (formerly JPMorgan Funds Management, Inc.) since September 2012; Assistant Treasurer, Wells Fargo Funds Management (2007-2009). |
The contact address for each of the officers, unless otherwise noted, is 270 Park Avenue, New York, NY 10017.
| * | The contact address for the officer is 1111 Polaris Parkway, Columbus, OH 43240. |
| ** | The contact address for the officer is 4 New York Plaza, New York, NY 10004. |
| | | | | | | | |
| | | |
| FEBRUARY 28, 2017 | | J.P. MORGAN MUNICIPAL BOND FUNDS | | | | | 113 | |
SCHEDULE OF SHAREHOLDER EXPENSES
(Unaudited)
Hypothetical $1,000 Investment
As a shareholder of the Funds, you incur two types of costs: (1) transaction costs, including sales charges (loads) on purchase payments and (2) ongoing costs, including investment advisory, fees, administration fees, distribution fees and other Fund expenses. The examples below are intended to help you understand your ongoing costs (in dollars) of investing in the Funds and to compare these ongoing costs with the ongoing costs of investing in other mutual funds. The examples assume that you had a $1,000 investment in each Class at the beginning of the reporting period, September 1, 2016, and continued to hold your shares at the end of the reporting period, February 28, 2017.
Actual Expenses
For each Class of each Fund in the table below, the first line provides information about actual account values and actual expenses. You may use the information in this line, together with the amount you invested, to estimate the expenses that you paid over the period. Simply divide your account value by $1,000 (for example, an $8,600 account value divided by $1,000 = 8.6), then multiply the result by the number in the first line of each Class under the heading entitled “Expenses Paid During the Period” to estimate the expenses you paid on your account during this period.
Hypothetical Example for Comparison Purposes
The second line of each Class in the table below provides information about hypothetical account values and hypothetical expenses based on the Class’ actual expense ratio and an assumed rate of return of 5% per year before expenses, which is not the Class’ actual return. The hypothetical account values and expenses may not be used to estimate the actual ending account balance or expenses you paid for the period. You may use this information to compare the ongoing costs of investing in the Class of the Fund and other funds. To do so, compare this 5% hypothetical example with the 5% hypothetical examples that appear in the shareholder reports of the other funds. Please note that the expenses shown in the table are meant to highlight your ongoing costs only and do not reflect any transaction costs, such as sales charges (loads) or redemption fees. Therefore, the second line for each Class in the table is useful in comparing ongoing costs only, and will not help you determine the relative total costs of owning different funds. In addition, if these transaction costs were included, your costs would have been higher. The examples also assume all dividends and distributions have been reinvested.
| | | | | | | | | | | | | | | | |
| | | Beginning
Account Value
September 1, 2016 | | | Ending
Account Value
February 28, 2017 | | | Expenses
Paid During
the Period* | | | Annualized
Expense
Ratio | |
Municipal Income Fund | | | | | | | | | | | | | | | | |
Class A | | | | | | | | | | | | | | | | |
Actual | | $ | 1,000.00 | | | $ | 975.20 | | | $ | 3.58 | | | | 0.73 | % |
Hypothetical | | | 1,000.00 | | | | 1,021.17 | | | | 3.66 | | | | 0.73 | |
Class C | | | | | | | | | | | | | | | | |
Actual | | | 1,000.00 | | | | 972.30 | | | | 6.31 | | | | 1.29 | |
Hypothetical | | | 1,000.00 | | | | 1,018.40 | | | | 6.46 | | | | 1.29 | |
Class I (formerly Select Class) | | | | | | | | | | | | | | | | |
Actual | | | 1,000.00 | | | | 975.30 | | | | 2.40 | | | | 0.49 | |
Hypothetical | | | 1,000.00 | | | | 1,022.36 | | | | 2.46 | | | | 0.49 | |
| | | | |
Ohio Municipal Bond Fund | | | | | | | | | | | | | | | | |
Class A | | | | | | | | | | | | | | | | |
Actual | | | 1,000.00 | | | | 977.40 | | | | 3.87 | | | | 0.79 | |
Hypothetical | | | 1,000.00 | | | | 1,020.88 | | | | 3.96 | | | | 0.79 | |
Class C | | | | | | | | | | | | | | | | |
Actual | | | 1,000.00 | | | | 974.70 | | | | 6.56 | | | | 1.34 | |
Hypothetical | | | 1,000.00 | | | | 1,018.15 | | | | 6.71 | | | | 1.34 | |
Class I (formerly Select Class) | | | | | | | | | | | | | | | | |
Actual | | | 1,000.00 | | | | 978.40 | | | | 2.65 | | | | 0.54 | |
Hypothetical | | | 1,000.00 | | | | 1,022.12 | | | | 2.71 | | | | 0.54 | |
| | | | |
Short-Intermediate Municipal Bond Fund | | | | | | | | | | | | | | | | |
Class A | | | | | | | | | | | | | | | | |
Actual | | | 1,000.00 | | | | 983.00 | | | | 3.49 | | | | 0.71 | |
Hypothetical | | | 1,000.00 | | | | 1,021.27 | | | | 3.56 | | | | 0.71 | |
Class C | | | | | | | | | | | | | | | | |
Actual | | | 1,000.00 | | | | 980.60 | | | | 5.94 | | | | 1.21 | |
Hypothetical | | | 1,000.00 | | | | 1,018.79 | | | | 6.06 | | | | 1.21 | |
| | | | | | |
| | | |
| 114 | | | | J.P. MORGAN MUNICIPAL BOND FUNDS | | FEBRUARY 28, 2017 |
SCHEDULE OF SHAREHOLDER EXPENSES
(Unaudited) (continued)
Hypothetical $1,000 Investment
| | | | | | | | | | | | | | | | |
| | | Beginning
Account Value
September 1, 2016 | | | Ending
Account Value
February 28, 2017 | | | Expenses
Paid During
the Period* | | | Annualized
Expense
Ratio | |
Short-Intermediate Municipal Bond Fund (continued) | | | | | | | | | | | | | | | | |
Class I (formerly Institutional Class) | | | | | | | | | | | | | | | | |
Actual | | $ | 1,000.00 | | | $ | 985.50 | | | $ | 1.18 | | | | 0.24 | % |
Hypothetical | | | 1,000.00 | | | | 1,023.60 | | | | 1.20 | | | | 0.24 | |
Select Class | | | | | | | | | | | | | | | | |
Actual | | | 1,000.00 | | | | 984.90 | | | | 1.62 | | | | 0.33 | |
Hypothetical | | | 1,000.00 | | | | 1,023.16 | | | | 1.66 | | | | 0.33 | |
| | | | |
Tax Free Bond Fund | | | | | | | | | | | | | | | | |
Class A | | | | | | | | | | | | | | | | |
Actual | | | 1,000.00 | | | | 961.80 | | | | 3.16 | | | | 0.65 | |
Hypothetical | | | 1,000.00 | | | | 1,021.57 | | | | 3.26 | | | | 0.65 | |
Class C | | | | | | | | | | | | | | | | |
Actual | | | 1,000.00 | | | | 959.30 | | | | 6.17 | | | | 1.27 | |
Hypothetical | | | 1,000.00 | | | | 1,018.50 | | | | 6.36 | | | | 1.27 | |
Class I (formerly Select Class) | | | | | | | | | | | | | | | | |
Actual | | | 1,000.00 | | | | 962.60 | | | | 2.19 | | | | 0.45 | |
Hypothetical | | | 1,000.00 | | | | 1,022.56 | | | | 2.26 | | | | 0.45 | |
| | | | |
Ultra-Short Municipal Fund | | | | | | | | | | | | | | | | |
Class A | | | | | | | | | | | | | | | | |
Actual | | | 1,000.00 | | | | 1,003.60 | | | | 2.09 | | | | 0.42 | |
Hypothetical | | | 1,000.00 | | | | 1,022.71 | | | | 2.11 | | | | 0.42 | |
Class I (formerly Select Class) | | | | | | | | | | | | | | | | |
Actual | | | 1,000.00 | | | | 1,004.30 | | | | 1.24 | | | | 0.25 | |
Hypothetical | | | 1,000.00 | | | | 1,023.55 | | | | 1.25 | | | | 0.25 | |
| * | Expenses are equal to each Class’ respective annualized expense ratio, multiplied by the average account value over the period, multiplied by 181/365 (to reflect the one-half year period). |
| | | | | | | | |
| | | |
| FEBRUARY 28, 2017 | | J.P. MORGAN MUNICIPAL BOND FUNDS | | | | | 115 | |
TAX LETTER
(Unaudited)
Certain tax information for the J.P. Morgan Funds is required to be provided to shareholders based upon the Funds’ income and distributions for the taxable year ended February 28, 2017. The information and distributions reported in this letter may differ from the information and taxable distributions reported to the shareholders for the calendar year ending December 31, 2017. The information necessary to complete your income tax returns for the calendar year ending December 31, 2017 will be provided under separate cover.
Long Term Capital Gain
Each fund listed below distributed the following amount, or maximum allowable amount, of long-term capital gain dividends for the fiscal year ended February 28, 2017 (amounts in thousands):
| | | | |
| | | Long-Term
Capital Gain
Distribution | |
Municipal Income Fund | | $ | 3,503 | |
Ohio Municipal Bond Fund | | | 714 | |
Short-Intermediate Municipal Bond Fund | | | 6,763 | |
Tax Free Bond Fund | | | 3,637 | |
Tax-Exempt Income
Each fund listed below had the following amount, or maximum allowable amount, of dividends paid from investment income exempt from federal income tax for the fiscal year ended February 28, 2017 (amounts in thousands):
| | | | |
| | | Exempt
Distributions
Paid | |
Municipal Income Fund | | $ | 7,728 | |
Ohio Municipal Bond Fund | | | 3,462 | |
Short-Intermediate Municipal Bond Fund | | | 32,366 | |
Tax Free Bond Fund | | | 10,622 | |
Ultra-Short Municipal Fund | | | 75 | |
| | | | | | |
| | | |
| 116 | | | | J.P. MORGAN MUNICIPAL BOND FUNDS | | FEBRUARY 28, 2017 |

Rev. January 2011
| | |
| FACTS | | WHAT DOES J.P. MORGAN FUNDS DO WITH YOUR PERSONAL INFORMATION? |
| | |
| Why? | | Financial companies choose how they share your personal information. Federal law gives consumers the right to limit some but not all sharing. Federal law also requires us to tell you how we collect, share, and protect your personal information. Please read this notice carefully to understand what we do. |
| | |
| What? | | The types of personal information we collect and share depend on the product or service you have with us. This information can include: ◾ Social Security number and account balances ◾ transaction history and account transactions ◾ checking account information and wire transfer instructions When you are no longer our customer, we continue to share your information as described in this notice. |
| | |
| How? | | All financial companies need to share customers’ personal information to run their everyday business. In the section below, we list the reasons financial companies can share their customers’ personal information; the reasons J.P. Morgan Funds chooses to share; and whether you can limit this sharing. |
| | | | |
| Reasons we can share your personal information | | Does J.P. Morgan
Funds share? | | Can you limit this
sharing? |
For our everyday business purposes — such as to process your transactions, maintain your account(s), respond to court orders and legal investigations, or report to credit bureaus | | Yes | | No |
For marketing purposes — to offer our products and services to you | | Yes | | No |
| For joint marketing with other financial companies | | No | | We don’t share |
For our affiliates’ everyday business purposes — information about your transactions and experiences | | No | | We don’t share |
For our affiliates’ everyday business purposes — information about your creditworthiness | | No | | We don’t share |
| For nonaffiliates to market to you | | No | | We don’t share |
| | |
| | |
| Questions? | | Call 1-800-480-4111 or go to www.jpmorganfunds.com |

| | |
| Who we are |
| Who is providing this notice? | | J.P. Morgan Funds |
| | |
| What we do |
| How does J.P. Morgan Funds protect my personal information? | | To protect your personal information from unauthorized access and use, we use security measures that comply with federal law. These measures include computer safeguards and secured files and buildings. We authorize our employees to access your information only when they need it to do their work and we require companies that work for us to protect your information. |
How does J.P. Morgan Funds collect my personal information? | | We collect your personal information, for example, when you: ◾ open an account or provide contact information ◾ give us your account information or pay us by check ◾ make a wire transfer We also collect your personal information from others, such as credit bureaus, affiliates and other companies. |
| Why can’t I limit all sharing? | | Federal law gives you the right to limit only ◾ sharing for affiliates’ everyday business purposes – information about your creditworthiness ◾ affiliates from using your information to market to you ◾ sharing for nonaffiliates to market to you State laws and individual companies may give you additional rights to limit sharing. |
| | |
| Definitions |
| Affiliates | | Companies related by common ownership or control. They can be financial and nonfinancial companies. ◾ J.P. Morgan Funds does not share with our affiliates. |
| Nonaffiliates | | Companies not related by common ownership or control. They can be financial and nonfinancial companies. ◾ J.P. Morgan Funds does not share with nonaffiliates so they can market to you. |
| Joint Marketing | | A formal agreement between nonaffiliated financial companies that together market financial products or services to you. ◾ J.P. Morgan Funds doesn’t jointly market. |
TRUSTEES
(Unaudited)
The Funds’ Statement of Additional Information includes additional information about the Funds’ Trustees and is available, without charge, upon request by calling 1-800-480-4111 or on the J.P. Morgan Funds’ website at www.jpmorganfunds.com.
| | | | | | |
Name (Year of Birth); Positions With the Funds (1) | | Principal Occupations During Past 5 Years | | Number of
Portfolios in Fund
Complex Overseen
by Trustee (2) | | Other Directorships Held Outside Fund Complex During Past 5 Years |
Independent Trustees | | |
| | | |
| John F. Finn (1947); Trustee of Trusts since 2005; Trustee of heritage One Group Mutual Funds since 1998. | | Chairman (1985-present), President and Chief Executive Officer, Gardner, Inc. (supply chain management company serving industrial and consumer markets) (1974-present). | | 153 | | Director, Greif, Inc. (GEF) (industrial package products and services) (2007-present); Trustee, Columbus Association for the Performing Arts (1988-present); Director, Cardinal Health, Inc. (CAH) (1994-2014). |
| | | |
| Dr. Matthew Goldstein (1941); Chairman since 2013; Trustee of Trusts since 2005; Trustee of heritage J.P. Morgan Funds since 2003. | | Chancellor Emeritus, City University of New York (2015-present); Professor, City University of New York (2013-present); Chancellor, City University of New York (1999-2013); President, Adelphi University (New York) (1998-1999). | | 153 | | Trustee, Museum of Jewish Heritage (2011-present); Trustee, National Museum of Mathematics (present); Chair, Association of College and University Administrators (present). |
| | | |
| Dennis P. Harrington (1950); Trustee of Trusts since 2017. | | Retired; Partner, Deloitte LLP (1984-2012). | | 152 | | None |
| | | |
| Frankie D. Hughes (1952); Trustee of Trusts since 2008. | | President, Ashland Hughes Properties (property management) (2014-present); President and Chief Investment Officer, Hughes Capital Management, Inc. (fixed income asset management) (1993-2014). | | 153 | | Trustee, The Victory Portfolios
(2000-2008) (Investment companies). |
| | | |
| Peter C. Marshall (1942); Trustee of Trusts since 2005; Trustee of heritage One Group Mutual Funds since 1985. | | Self-employed business consultant
(2002-present). | | 153 | | None |
| | | |
| Mary E. Martinez (1960); Trustee of Trusts since 2013. | | Associate, Special Properties, a Christie’s International Real Estate Affiliate (2010-present); Managing Director, Bank of America (Asset Management) (2007-2008); Chief Operating Officer, U.S. Trust Asset Management, U.S. Trust Company (asset management) (2003-2007); President, Excelsior Funds (registered investment companies) (2004-2005). | | 153 | | None |
| | | |
| Marilyn McCoy* (1948); Trustee of Trusts since 2005; Trustee of heritage One Group Mutual Funds since 1999. | | Vice President of Administration and Planning, Northwestern University (1985-present). | | 153 | | None |
| | | |
| Mitchell M. Merin (1953); Trustee of Trusts since 2013. | | Retired; President and Chief Operating Officer, Morgan Stanley Investment Management, Member Morgan Stanley & Co. Management Committee (registered investment adviser) (1998-2005). | | 153 | | Director, Sun Life Financial (SLF) (2007-2013) (financial services and insurance); Trustee, Trinity College, Hartford, CT (2002-2010). |
| | | |
| Dr. Robert A. Oden, Jr. (1946); Trustee of Trusts since 2005; Trustee of heritage One Group Mutual Funds since 1997. | | Retired; President, Carleton College
(2002-2010); President, Kenyon College
(1995-2002). | | 153 | | Chairman, Dartmouth-Hitchcock Medical Center (2011-present); Trustee, American Schools of Oriental Research (2011-present); Trustee, American University in Cairo (1999-2014); Trustee, American Museum of Fly Fishing (2013-present). |
| | | | | | |
Name (Year of Birth); Positions With the Funds (1) | | Principal Occupations During Past 5 Years | | Number of
Portfolios in Fund
Complex Overseen
by Trustee (2) | | Other Directorships Held Outside Fund Complex During Past 5 Years |
Independent Trustees (continued) | | |
| | | |
| Marian U. Pardo** (1946); Trustee of Trusts since 2013. | | Managing Director and Founder, Virtual Capital Management LLC (Investment Consulting) (2007-present); Managing Director, Credit Suisse Asset Management (portfolio manager) (2003-2006). | | 153 | | Member, Board of Governors, Columbus Citizens Foundation (not-for-profit supporting philanthropic and cultural programs) (2006-present). |
| | | |
| Frederick W. Ruebeck (1939); Trustee of Trusts since 2005; Trustee of heritage One Group Mutual Funds since 1994. | | Consultant (2000-present); Adviser, JP Greene & Associates, LLC (broker-dealer)
(2000-2009); Chief Investment Officer, Wabash College (2004-present); Director of Investments, Eli Lilly and Company (pharmaceuticals) (1988-1999). | | 153 | | None |
| | | |
| James J. Schonbachler (1943); Trustee of Trusts since 2005; Trustee of heritage J.P. Morgan Funds since 2001. | | Retired; Managing Director of Bankers Trust Company (financial services) (1968-1998). | | 153 | | None |
| (1) | The Trustees serve for an indefinite term, subject to the Trusts’ current retirement policy, which is age 78 for all Trustees. |
| (2) | A Fund Complex means two or more registered investment companies that hold themselves out to investors as related companies for purposes of investment and investor services or have a common investment adviser or have an investment adviser that is an affiliated person of the investment adviser of any of the other registered investment companies. The J.P. Morgan Funds Complex for which the Board of Trustees serves currently includes twelve registered investment companies (153 funds). |
| * | Two members of the Board of Trustees of Northwestern University are executive officers of registered investment advisers (not affiliated with JPMorgan) that are under common control with sub-advisers to certain J.P. Morgan Funds. |
| ** | In connection with prior employment with JPMorgan Chase, Ms. Pardo was the recipient of non-qualified pension plan payments from JPMorgan Chase in the amount of approximately $2,055 per month, which she irrevocably waived effective January 1, 2013, and deferred compensation payments from JPMorgan Chase in the amount of approximately $7,294 per year, which ended in January 2013. In addition, Ms. Pardo receives payments from a fully-funded qualified plan, which is not an obligation of JPMorgan Chase. |
The contact address for each of the Trustees is 270 Park Avenue, New York, NY 10017.

J.P. Morgan Asset Management is the marketing name for the asset management businesses of JPMorgan Chase & Co. Those businesses include, but are not limited to, J.P. Morgan Investment Management Inc., Security Capital Research & Management Incorporated and J.P. Morgan Alternative Asset Management, Inc.
| | | | |
| | © JPMorgan Chase & Co., 2017. All rights reserved. February 2017. | | AN-MUNIBOND-217 |
J.P. Morgan Income Funds
Annual Report
February 28, 2017
JPMorgan Flexible Long/Short Fund
JPMorgan High Yield Opportunities Fund
Investments in a Fund are not deposits or obligations of, or guaranteed or endorsed by, any bank and are not insured or guaranteed by the FDIC, the Federal Reserve Board or any other government agency. You could lose money if you sell when a Fund’s share price is lower than when you invested.
Past performance is no guarantee of future performance. The general market views expressed in this report are opinions based on market and other conditions through the end of the reporting period and are subject to change without notice. These views are not intended to predict the future performance of a Fund or the securities markets. References to specific securities and their issuers are for illustrative purposes only and are not intended to be, and should not be interpreted as, recommendations to purchase or sell such securities. Such views are not meant as investment advice and may not be relied on as an indication of trading intent on behalf of any Fund.
Prospective investors should refer to the Funds’ prospectus for a discussion of the Funds’ investment objective, strategies and risks. Call J.P. Morgan Funds Service Center at 1-800-480-4111 for a prospectus containing more complete information about a Fund including management fees and other expenses. Please read it carefully before investing.
CEO’S LETTER
March 22, 2017 (Unaudited)
Dear Shareholders:
For most of the past twelve months, the U.S. economy was one of the few bright spots among developed nations as most of Europe and Japan struggled with low or negative economic growth. However, by the end of February 2017 there emerged clear signals that the world’s 20 largest economies were moving in a more synchronized fashion that could lead to an accelerating global economy.
Indeed, the World Bank has estimated that global economic growth in 2017 will rise by 2.7% compared with 2.3% in 2016 and economists generally expect each of the world’s 20 largest economies will see an increase in gross domestic product in 2017.
In the 19-nation euro zone, manufacturing activity rose in February 2017 for the sixth consecutive month and reached levels not seen in nearly six years. Economic confidence surveys have been the strongest since 2011. While unemployment across the euro zone remained nearly twice that of the U.S., the jobless rate fell faster than expected in early 2017 to its lowest level since 2009. Importantly, euro zone inflation reached the European Central Bank’s target of 2.0% in February 2017, which provided further evidence that the risk of a painful deflationary spiral had receded.
Meanwhile, Chinese factory activity was stronger than economists expected in February 2017 and more broadly, Chinese economic stimulus measures initiated in 2016 appeared to bolster trade throughout Asia. In Japan, corporate profits were estimated at record highs even in the face of a stronger yen. South Korean exports grew in February 2017 for the fourth consecutive month. Economic data from Australia and India showed signs of stronger growth.
To a certain extent, the healthier global economy was supported by a rebound in global oil prices, which reached 15-month highs in October 2016. Prices for other commodities also rose during 2016, helping growth in those emerging market nations reliant on natural resource exports.
In the U.S., the pace of economic expansion was sufficient to persuade the Federal Reserve Bank to raise interest rates in December 2016 and again in March 2017. Meanwhile, leading stock market indexes hit record highs in late 2016 and early 2017 amid strength in corporate profits and the broader U.S. economy. Investor expectations that the Republican Party’s newly-won control of the U.S. presidency along with its majorities in both houses of the U.S. Congress would bolster economic growth while lowering certain taxes further supported U.S. financial assets.
While the global economy appeared to grow more synchronized during the twelve months ended February 28, 2017, there also emerged political uncertainties in the U.S. and Europe. In the U.K., a populist drive to exit the European Union won a surprise victory in mid-2016. While global financial markets generally rebounded from the sharp sell-off that followed the June 23rd referendum, the ultimate impact of the so-called
1
Brexit remained uncertain and was seen as a drag on the U.K. economy. In November, Donald Trump, who campaigned on a platform that included tighter restrictions on immigration and protective trade policies, won the U.S. presidency. While voters in the Netherlands declined to give the anti-immigrant Party for Freedom a majority in the lower house of Parliament, populist parties were vying for power in France, Germany and elsewhere.
Each of these parties and their leaders – both in the U.S. and elsewhere – share broad policy goals that prioritize restricting immigration and shunning supranational trade agreements. Given that immigration and free trade are key drivers of economic growth in advanced, post-industrial nations, it remains to be seen how much electoral support these shared agendas would earn.
In the face of all this, U.S. and foreign financial markets generally rewarded investors with positive returns for the twelve months through February 28, 2017. Over time, we believe financial markets will continue to reward those investors who maintain patience and discipline in the context of a properly diversified portfolio.
We look forward to managing your investment needs for years to come. Should you have any questions, please visit www.jpmorganfunds.com or contact the J.P. Morgan Funds Service Center at 1-800-480-4111.
Sincerely yours,
George C.W. Gatch
CEO, Investment Funds Management, J.P. Morgan Asset Management
2
JPMorgan Flexible Long/Short Fund
Fund Commentary
For the period June 30, 2016 (Fund Inception Date) through February 28, 2017 (Unaudited)
| | | | |
| Reporting Period Return: | | | |
| |
Fund (Class I Shares) 1* | | | 3.37% | |
Bloomberg Barclays Multiverse Corporate Index | | | 0.85% | |
Net Assets as of 2/28/2017 | | $ | 25,839,167 | |
Duration as of 2/28/2017 | | | 2.7 Years | |
| |
INVESTMENT OBJECTIVE**
The JPMorgan Flexible Long/Short Fund (the “Fund”) seeks to provide total return.
HOW DID THE MARKET PERFORM?
U.S. financial markets overall provided mixed returns for the reporting period ended February 28, 2017. Equity markets rose along with bond yields amid a backdrop of low but rising interest rates and price inflation, as well as improved corporate profits. Commodities prices stabilized during the reporting period and global oil prices reached 15-month highs in October 2016. Oil prices were further bolstered by the Organization of Petroleum Exporting Countries’ decision to curb production.
The November 8, 2016 election handed Donald Trump the U.S. presidency and maintained the Republican Party’s majority in both houses of the U.S. Congress. In the following months, key U.S. equity benchmarks reached multiple closing record highs. U.S. Treasury bonds underperformed other bond market sectors and high yield bonds (also known as “junk bonds”) outperformed the broader bond market.
WHAT WERE THE MAIN DRIVERS OF THE FUND’S PERFORMANCE?
For the period June 30, 2016 to February 28, 2017, the Fund’s Class I Shares outperformed the Bloomberg Barclays Multiverse Corporate Bond Index (the “Index”). Relative to the Index, the Fund’s overweight position in high yield debt securities and its security selection in investment grade corporate debt securities were leading contributors to performance.
In terms of absolute performance, the Fund’s allocations to high yield debt securities and below investment grade loan assignments were leading contributors to performance. The Fund’s allocation to investment grade loan assignments, which had a higher sensitivity to U.S. government interest rates, detracted from absolute performance as interest rates rose during the reporting period.
HOW WAS THE FUND POSITIONED?
During the reporting period, the Fund’s positioning was dynamic regarding allocations to investment grade corporate bonds, high yield corporate bonds and loan assignments. Emerging markets corporate debt remained a relatively small portion of the Fund’s strategic allocation. At the end of the reporting period, the Fund’s overall duration was about 2.5 years. Duration measures the price sensitivity of a bond or a portfolio of bonds to changes in interest rates. Generally, bonds with longer duration will experience a larger increase or decrease in price as interest rates fall or rise, respectively, versus bonds with shorter duration.
| | | | | | |
| PORTFOLIO COMPOSITION*** | | | | | |
|
| | |
Corporate Bonds | | | 62.6% | | | |
Loan Assignments | | | 31.9 | | | |
Convertible Bonds | | | 1.1 | | | |
Others (each less than 1.0%) | | | 0.3 | | | |
Short-Term Investments | | | 4.1 | | | |
| | 1 | Effective April 3, 2017, the Fund’s Select Class Shares were renamed Class I Shares. |
| | * | The return shown is based on net asset values calculated for shareholder transactions and may differ from the return shown in the financial highlights, which reflects adjustments made to the net asset values in accordance with accounting principles generally accepted in the United States of America. |
| | ** | The adviser seeks to achieve the Fund’s objective. There can be no guarantee it will be achieved. |
| | *** | Percentages indicated are based on total investments as of February 28, 2017. The Fund’s portfolio composition is subject to change. |
3
JPMorgan Flexible Long/Short Fund
Fund Summary
For the period June 30, 2016 (Fund Inception Date) through February 28, 2017 (Unaudited) (continued)
TOTAL RETURNS AS OF FEBRUARY 28, 2017
| | | | | | |
| | | INCEPTION
DATE OF
CLASS | | SINCE
INCEPTION* | |
CLASS A SHARES | | June 30, 2016 | | | | |
With Sales Charge** | | | | | (0.69)% | |
Without Sales Charge | | | | | 3.18 | |
CLASS C SHARES | | June 30, 2016 | | | | |
With CDSC*** | | | | | 1.84 | |
Without CDSC | | | | | 2.84 | |
CLASS R6 SHARES | | June 30, 2016 | | | 3.53 | |
CLASS I SHARES | | | | | | |
(FORMERLY SELECT CLASS SHARES) | | June 30, 2016 | | | 3.37 | |
| | | | |
| * | | | | |
| | Not annualized. | | |
| ** | | | | |
| | Sales Charge for Class A Shares is 3.75%. | | |
| *** | | | | |
| | Assumes a 1% CDSC (contingent deferred sales charge) for the period. | | |
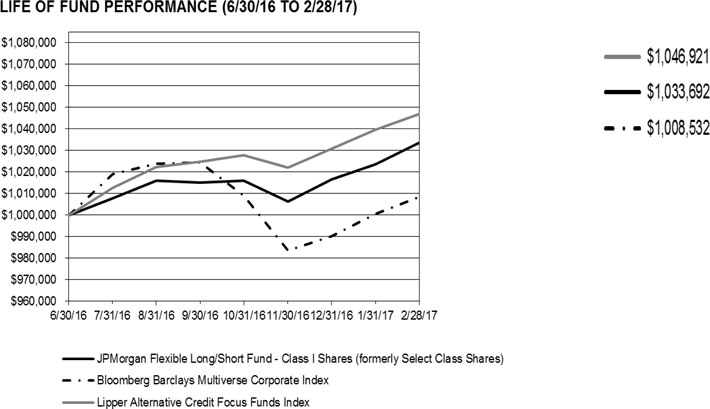
The performance quoted is past performance and is not a guarantee of future results. Mutual funds are subject to certain market risks. Investment returns and principal value of an investment will fluctuate so that an investor’s shares, when redeemed, may be worth more or less than their original cost. Current performance may be higher or lower than the performance data shown. For up-to-date, month-end performance information please call 1-800-480-4111.
4
The Fund commenced operations on June 30, 2016.
The graph illustrates comparative performance for $1,000,000 invested in Class I Shares of the JPMorgan Flexible Long/Short Fund, the Bloomberg Barclays Multiverse Corporate Index and the Lipper Alternative Credit Focus Funds Index from June 30, 2016 to February 28, 2017. The performance of the Fund assumes reinvestment of all dividends and capital gain distributions, if any, and does not include a sales charge. The performance of the Bloomberg Barclays Multiverse Corporate Index does not reflect the deduction of expenses or a sales charge associated with a mutual fund and approximates the minimum possible dividend reinvestment of the securities included in the benchmark, if applicable. The dividend is reinvested after deduction of withholding tax, applying the maximum rate to non-resident institutional investors who do not benefit from double taxation treaties. The Bloomberg Barclays Multiverse Corporate Index provides a broad-based measure of the international fixed-income bond market. The Lipper Alternative Credit Focus Funds Index represents the total returns of certain mutual funds within the Fund’s designated category as determined by Lipper, Inc. Investors cannot invest directly in an index.
Class I Shares have a $1,000,000 minimum initial investment.
Fund performance may reflect the waiver of the Fund’s fees and reimbursement of expenses for certain periods since the inception date. Without these waivers and reimbursements, performance would have been lower. Also, performance shown in this section does not reflect the deduction of taxes that a shareholder would pay on Fund distributions or redemptions of Fund shares.
The returns shown are based on net asset values calculated for shareholder transactions and may differ from the returns shown in the financial highlights, which reflect adjustments made to the net asset values in accordance with accounting principles generally accepted in the United States of America.
5
JPMorgan High Yield Opportunities Fund
Fund Summary
For the period November 1, 2016 (Fund Inception Date) through February 28, 2017 (Unaudited)
| | | | |
| Reporting Period Return: | | | |
| |
Fund (Class I Shares) 1* | | | 4.83% | |
Bloomberg Barclays Global Aggregate Index - Hedged USD. | | | 0.76% | |
Net Assets as of 2/28/2017 | | $ | 26,195,984 | |
| |
| | |
| Investment objective** and strategies | | The JPMorgan High Yield Opportunities Fund (the “Fund”) seeks a high level of current income. Capital appreciation is a secondary objective. The Fund’s principal investment strategy is to invest in high yield, high risk corporate debt securities and instruments from developed markets. The Fund will allocate its assets between U.S. and non-U.S. developed markets depending on investment opportunities. In addition to high yield corporate debt securities and instruments, the Fund also may invest in other types of high yield investments. |
| | | | | | |
| PORTFOLIO COMPOSITION*** | | | | | |
|
| | |
Corporate Bonds | | | 89.7% | | | |
Loan Assignments | | | 2.9 | | | |
Convertible Bonds | | | 1.2 | | | |
Short-Term Investments | | | 6.2 | | | |
| | 1 | Effective April 3, 2017, the Fund’s Select Class Shares were renamed Class I Shares. |
| | * | The return shown is based on net asset values calculated for shareholder transactions and may differ from the return shown in the financial highlights, which reflects adjustments made to the net asset values in accordance with accounting principles generally accepted in the United States of America. |
| | ** | The adviser seeks to achieve the Fund’s objective. There can be no guarantee it will be achieved. |
| | *** | Percentages indicated are based on total investments as of February 28, 2017. The Fund’s portfolio composition is subject to change. |
6
JPMorgan High Yield Opportunities Fund
Fund Summary
For the period November 1, 2016 (Fund Inception Date) through February 28, 2017 (Unaudited) (continued)
TOTAL RETURNS AS OF FEBRUARY 28, 2017
| | | | | | |
| | | INCEPTION
DATE OF
CLASS | | SINCE
INCEPTION* | |
CLASS A SHARES | | November 1, 2016 | | | | |
With Sales Charge** | | | | | 0.83% | |
Without Sales Charge | | | | | 4.76 | |
CLASS C SHARES | | November 1, 2016 | | | | |
With CDSC*** | | | | | 3.57 | |
Without CDSC | | | | | 4.57 | |
CLASS R6 SHARES | | November 1, 2016 | | | 4.90 | |
CLASS I SHARES | | | | | | |
(FORMERLY SELECT CLASS SHARES) | | November 1, 2016 | | | 4.83 | |
| | | | |
| * | | | | |
| | Not annualized. | | |
| ** | | | | |
| | Sales Charge for Class A Shares is 3.75%. | | |
| *** | | | | |
| | Assumes a 1% CDSC (contingent deferred sales charge) for the period. | | |
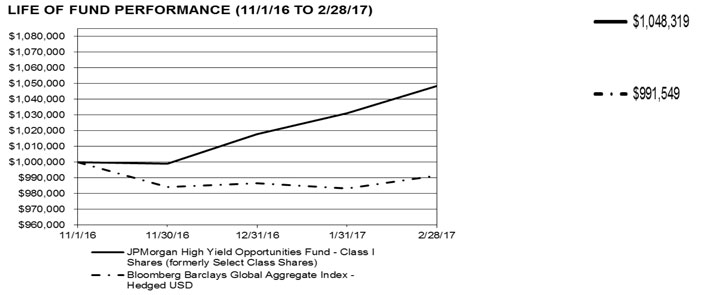
The performance quoted is past performance and is not a guarantee of future results. Mutual funds are subject to certain market risks. Investment returns and principal value of an investment will fluctuate so that an investor’s shares, when redeemed, may be worth more or less than their original cost. Current performance may be higher or lower than the performance data shown. For up-to-date, month-end performance information please call 1-800-480-4111.
7
The Fund commenced operations on November 1, 2016.
The graph illustrates comparative performance for $1,000,000 invested in Class I Shares of the JPMorgan High Yield Opportunities Fund and the Bloomberg Barclays Global Aggregate Index - Hedged USD from November 1, 2016 to February 28, 2017. The performance of the Fund assumes reinvestment of all dividends and capital gain distributions, if any, and does not include a sales charge. The performance of the Bloomberg Barclays Global Aggregate Index - Hedged USD does not reflect the deduction of expenses or a sales charge associated with a mutual fund and approximates the minimum possible dividend reinvestment of the securities included in the benchmark, if applicable. The dividend is reinvested after deduction of withholding tax, applying the maximum rate to non-resident institutional investors who do not benefit from double taxation treaties. The Bloomberg Barclays Global Aggregate Index - Hedged USD provides a broad-based measure of the international fixed-income bond market. Investors cannot invest directly in an index.
Class I Shares have a $1,000,000 minimum initial investment.
Fund performance may reflect the waiver of the Fund’s fees and reimbursement of expenses for certain periods since the inception date. Without these waivers and reimbursements, performance would have been lower. Also, performance shown in this section does not reflect the deduction of taxes that a shareholder would pay on Fund distributions or redemptions of Fund shares.
The returns shown are based on net asset values calculated for shareholder transactions and may differ from the returns shown in the financial highlights, which reflect adjustments made to the net asset values in accordance with accounting principles generally accepted in the United States of America.
8
JPMorgan Flexible Long/Short Fund
SCHEDULE OF PORTFOLIO INVESTMENTS
AS OF FEBRUARY 28, 2017
(Amounts in U.S. Dollars, unless otherwise noted)
| | | | | | | | |
PRINCIPAL
AMOUNT | | | SECURITY DESCRIPTION | | VALUE | |
| | |
| | Asset-Backed Security — 0.0% (g) | | | | |
| | 409 | | | Continental Airlines Pass-Through Trust, Series 2003-ERJ1, 7.875%, 07/02/18
(Cost $420) | | | 424 | |
| | | | | | | | |
| |
| | Convertible Bonds — 1.1% | | | | |
| |
| | | | Consumer Discretionary — 0.3% | |
| | | | Internet & Direct Marketing Retail — 0.1% | |
| | 20,000 | | | Ctrip.com International Ltd., (China), 1.000%, 07/01/20 | | | 21,775 | |
| | | | | | | | |
| | |
| | | | Media — 0.2% | | | | |
| | 50,902 | | | Liberty Interactive LLC, 3.750%, 02/15/30 | | | 30,414 | |
| | 25,000 | | | Live Nation Entertainment, Inc., 2.500%, 05/15/19 | | | 26,703 | |
| | | | | | | | |
| | | | | | | 57,117 | |
| | | | | | | | |
| | | | Total Consumer Discretionary | | | 78,892 | |
| | | | | | | | |
| | | | Energy — 0.2% | | | | |
| | | | Energy Equipment & Services — 0.1% | |
| | 20,000 | | | Nabors Industries, Inc., 0.750%, 01/15/24 (e) | | | 19,300 | |
| | | | | | | | |
| |
| | | | Oil, Gas & Consumable Fuels — 0.1% | |
| | 20,000 | | | Oasis Petroleum, Inc., 2.625%, 09/15/23 | | | 27,087 | |
| | | | | | | | |
| | | | Total Energy | | | 46,387 | |
| | | | | | | | |
| | | | Information Technology — 0.6% | |
| | | | Communications Equipment — 0.1% | |
| | 25,000 | | | Finisar Corp., 0.500%, 12/15/36 (e) | | | 26,375 | |
| | | | | | | | |
| |
| | | | Internet Software & Services — 0.1% | |
| | 20,000 | | | Zillow Group, Inc., 2.000%, 12/01/21 (e) | | | 19,913 | |
| | | | | | | | |
| |
| | | | Semiconductors & Semiconductor Equipment — 0.3% | |
| | 20,000 | | | Cypress Semiconductor Corp., 4.500%, 01/15/22 (e) | | | 24,175 | |
| | 20,000 | | | Intel Corp., 2.950%, 12/15/35 | | | 27,125 | |
| | 25,000 | | | ON Semiconductor Corp., 1.000%, 12/01/20 | | | 27,250 | |
| | 10,000 | | | Teradyne, Inc., 1.250%, 12/15/23 (e) | | | 11,163 | |
| | | | | | | | |
| | | | | | | 89,713 | |
| | | | | | | | |
| | | | Software — 0.1% | | | | |
| | 15,000 | | | Red Hat, Inc., 0.250%, 10/01/19 | | | 19,116 | |
| | | | | | | | |
PRINCIPAL
AMOUNT | | | SECURITY DESCRIPTION | | VALUE | |
| | |
| |
| | | | Software — continued | |
| | 20,000 | | | Synchronoss Technologies, Inc., 0.750%, 08/15/19 | | | 18,912 | |
| | | | | | | | |
| | | | | | | 38,028 | |
| | | | | | | | |
| | | | Total Information Technology | | | 174,029 | |
| | | | | | | | |
| | | | Total Convertible Bonds (Cost $298,061) | | | 299,308 | |
| | | | | | | | |
| | Corporate Bonds — 62.7% | | | | |
| |
| | | | Consumer Discretionary — 10.8% | |
| | | | Auto Components — 1.2% | |
| | 28,000 | | | American Axle & Manufacturing, Inc., 6.625%, 10/15/22 | | | 28,980 | |
| | 3,000 | | | Cooper-Standard Automotive, Inc., 5.625%, 11/15/26 (e) | | | 3,037 | |
| | 4,000 | | | Goodyear Tire & Rubber Co. (The), 7.000%, 05/15/22 | | | 4,180 | |
| | EUR 100,000 | | | LKQ Italia Bondco SpA, Reg. S, 3.875%, 04/01/24 | | | 113,225 | |
| | 21,000 | | | MPG Holdco I, Inc., 7.375%, 10/15/22 | | | 22,688 | |
| | EUR 125,000 | | | Schaeffler Finance BV, (Germany), Reg. S, 3.250%, 05/15/25 | | | 143,200 | |
| | | | | | | | |
| | | | | | | 315,310 | |
| | | | | | | | |
| | | | Automobiles — 1.2% | |
| | | | General Motors Co., | | | | |
| | 75,000 | | | 4.000%, 04/01/25 | | | 75,522 | |
| | 10,000 | | | 6.750%, 04/01/46 | | | 12,151 | |
| | GBP 100,000 | | | Jaguar Land Rover Automotive plc, (United Kingdom), Reg. S, 3.875%, 03/01/23 | | | 128,056 | |
| | EUR 100,000 | | | Volvo Car AB, (Sweden), Reg. S, 3.250%, 05/18/21 | | | 114,016 | |
| | | | | | | | |
| | | | | | | 329,745 | |
| | | | | | | | |
| | | | Distributors — 0.5% | |
| | EUR 100,000 | | | Alliance Automotive Finance plc, (United Kingdom), Reg. S, 6.250%, 12/01/21 | | | 112,970 | |
| | 8,000 | | | Performance Food Group, Inc., 5.500%, 06/01/24 (e) | | | 8,300 | |
| | | | | | | | |
| | | | | | | 121,270 | |
| | | | | | | | |
| | | | Hotels, Restaurants & Leisure — 2.6% | |
| | 9,000 | | | Boyd Gaming Corp., 6.875%, 05/15/23 | | | 9,720 | |
| | 31,000 | | | Choice Hotels International, Inc., 5.750%, 07/01/22 | | | 33,635 | |
| | EUR 110,000 | | | Cirsa Funding Luxembourg SA, (Spain), Reg. S, 5.875%, 05/15/23 | | | 121,050 | |
| | 5,000 | | | Gateway Casinos & Entertainment Ltd., (Canada), 8.250%, 03/01/24 (e) | | | 5,081 | |
| | 18,000 | | | GLP Capital LP, 5.375%, 11/01/23 | | | 19,305 | |
| | 24,000 | | | Golden Nugget, Inc., 8.500%, 12/01/21 (e) | | | 25,620 | |
SEE NOTES TO FINANCIAL STATEMENTS.
9
JPMorgan Flexible Long/Short Fund
SCHEDULE OF PORTFOLIO INVESTMENTS
AS OF FEBRUARY 28, 2017 (continued)
(Amounts in U.S. Dollars, unless otherwise noted)
| | | | | | | | |
PRINCIPAL
AMOUNT | | | SECURITY DESCRIPTION | | VALUE | |
| | |
| | Corporate Bonds — continued | | | | |
| |
| | | | Hotels, Restaurants & Leisure — continued | |
| | EUR 125,000 | | | International Game Technology plc, Reg. S, 4.750%, 02/15/23 | | | 144,464 | |
| | | | KFC Holding Co., | | | | |
| | 5,000 | | | 5.000%, 06/01/24 (e) | | | 5,133 | |
| | 5,000 | | | 5.250%, 06/01/26 (e) | | | 5,169 | |
| | 11,000 | | | Landry’s, Inc., 6.750%, 10/15/24 (e) | | | 11,440 | |
| | | | MGM Resorts International, | | | | |
| | 21,000 | | | 6.000%, 03/15/23 | | | 22,890 | |
| | 30,000 | | | 8.625%, 02/01/19 | | | 33,150 | |
| | GBP 100,000 | | | Pizzaexpress Financing 2 plc, (United Kingdom), Reg. S, 6.625%, 08/01/21 | | | 127,807 | |
| | 2,000 | | | Rivers Pittsburgh Borrower LP, 6.125%, 08/15/21 (e) | | | 2,046 | |
| | 9,000 | | | Sabre GLBL, Inc., 5.250%, 11/15/23 (e) | | | 9,135 | |
| | 72,000 | | | Seminole Hard Rock Entertainment, Inc., 5.875%, 05/15/21 (e) | | | 73,800 | |
| | | | Six Flags Entertainment Corp., | | | | |
| | 2,000 | | | 4.875%, 07/31/24 (e) | | | 2,020 | |
| | 9,000 | | | 5.250%, 01/15/21 (e) | | | 9,268 | |
| | | | | | | | |
| | | | | | | 660,733 | |
| | | | | | | | |
| | | | Household Durables — 0.2% | | | | |
| | 10,000 | | | CalAtlantic Group, Inc., 5.875%, 11/15/24 | | | 10,725 | |
| | | | Lennar Corp., | | | | |
| | 33,000 | | | 4.500%, 06/15/19 | | | 34,072 | |
| | 15,000 | | | 4.875%, 12/15/23 | | | 15,488 | |
| | 8,000 | | | M/I Homes, Inc., 6.750%, 01/15/21 | | | 8,400 | |
| | 10,000 | | | Mattamy Group Corp., (Canada), 6.500%, 11/15/20 (e) | | | 10,275 | |
| | | | | | | | |
| | | | | | | 78,960 | |
| | | | | | | | |
| | | | Media — 4.4% | | | | |
| | EUR 200,000 | | | Altice Luxembourg SA, (Luxembourg), Reg. S, 7.250%, 05/15/22 | | | 224,857 | |
| | | | Cablevision Systems Corp., | | | | |
| | 19,000 | | | 8.000%, 04/15/20 | | | 20,995 | |
| | 32,000 | | | 8.625%, 09/15/17 | | | 33,000 | |
| | 30,000 | | | Charter Communications Operating LLC, 6.484%, 10/23/45 | | | 34,877 | |
| | 19,000 | | | Cinemark USA, Inc., 4.875%, 06/01/23 | | | 19,475 | |
| | | | Clear Channel Worldwide Holdings, Inc., | | | | |
| | 15,000 | | | Series B, 6.500%, 11/15/22 | | | 15,534 | |
| | 16,000 | | | Series B, 7.625%, 03/15/20 | | | 16,120 | |
| | | | Comcast Corp., | | | | |
| | 20,000 | | | 2.350%, 01/15/27 | | | 18,368 | |
| | 50,000 | | | 3.150%, 03/01/26 | | | 49,291 | |
| | 30,000 | | | 4.750%, 03/01/44 | | | 31,901 | |
| | 65,000 | | | Cox Communications, Inc., 3.350%, 09/15/26 (e) | | | 62,881 | |
| | | | | | | | |
PRINCIPAL
AMOUNT | | | SECURITY DESCRIPTION | | VALUE | |
| | |
| | |
| | | | Media — continued | | | | |
| | 8,000 | | | CSC Holdings LLC, 8.625%, 02/15/19 | | | 8,845 | |
| | 43,000 | | | DISH DBS Corp., 6.750%, 06/01/21 | | | 47,192 | |
| | 4,000 | | | EMI Music Publishing Group North America Holdings, Inc., 7.625%, 06/15/24 (e) | | | 4,390 | |
| | 25,000 | | | iHeartCommunications, Inc., 9.000%, 12/15/19 | | | 21,847 | |
| | 36,000 | | | Live Nation Entertainment, Inc., 5.375%, 06/15/22 (e) | | | 37,530 | |
| | 21,000 | | | Nexstar Broadcasting, Inc., 6.125%, 02/15/22 (e) | | | 21,971 | |
| | EUR 100,000 | | | SES SA, (Luxembourg), Reg. S, VAR, 4.625%, 01/02/22 (x) (y) | | | 110,146 | |
| | 56,000 | | | Sinclair Television Group, Inc., 6.125%, 10/01/22 | | | 58,590 | |
| | 54,000 | | | Sirius XM Radio, Inc., 4.625%, 05/15/23 (e) | | | 55,215 | |
| | EUR 81,000 | | | Unitymedia Hessen GmbH & Co. KG, (Germany), Reg. S, 5.125%, 01/21/23 | | | 90,724 | |
| | | | Univision Communications, Inc., | | | | |
| | 42,000 | | | 5.125%, 05/15/23 (e) | | | 42,000 | |
| | 34,000 | | | 5.125%, 02/15/25 (e) | | | 33,533 | |
| | 30,000 | | | Viacom, Inc., 4.375%, 03/15/43 | | | 26,339 | |
| | 13,000 | | | Videotron Ltd., (Canada), 5.000%, 07/15/22 | | | 13,683 | |
| | | | WMG Acquisition Corp., | | | | |
| | 5,000 | | | 5.000%, 08/01/23 (e) | | | 5,113 | |
| | 7,000 | | | 5.625%, 04/15/22 (e) | | | 7,280 | |
| | 15,000 | | | 6.750%, 04/15/22 (e) | | | 15,789 | |
| | | | | | | | |
| | | | | | | 1,127,486 | |
| | | | | | | | |
| | | | Specialty Retail — 0.7% | | | | |
| | EUR 100,000 | | | Douglas GmbH, (Germany), Reg. S, 6.250%, 07/15/22 | | | 116,013 | |
| | 13,000 | | | PetSmart, Inc., 7.125%, 03/15/23 (e) | | | 12,756 | |
| | 31,000 | | | Radio Systems Corp., 8.375%, 11/01/19 (e) | | | 32,279 | |
| | 13,000 | | | Sally Holdings LLC, 5.500%, 11/01/23 | | | 13,195 | |
| | | | | | | | |
| | | | | | | 174,243 | |
| | | | | | | | |
| | | | Total Consumer Discretionary | | | 2,807,747 | |
| | | | | | | | |
| | | | Consumer Staples — 3.1% | | | | |
| | | | Beverages — 0.5% | | | | |
| | | | Anheuser-Busch InBev Finance, Inc., (Belgium), | | | | |
| | 35,000 | | | 3.650%, 02/01/26 | | | 35,511 | |
| | 15,000 | | | 4.900%, 02/01/46 | | | 16,480 | |
| | 36,000 | | | Cott Beverages, Inc., (Canada), 5.375%, 07/01/22 | | | 36,900 | |
| | 29,000 | | | DS Services of America, Inc., (Canada), 10.000%, 09/01/21 (e) | | | 31,465 | |
| | | | | | | | |
| | | | | | | 120,356 | |
| | | | | | | | |
SEE NOTES TO FINANCIAL STATEMENTS.
10
JPMorgan Flexible Long/Short Fund
SCHEDULE OF PORTFOLIO INVESTMENTS
AS OF FEBRUARY 28, 2017 (continued)
(Amounts in U.S. Dollars, unless otherwise noted)
| | | | | | |
PRINCIPAL
AMOUNT | | | SECURITY DESCRIPTION | | VALUE |
|
| | Corporate Bonds — continued | | |
| |
| | | | Food & Staples Retailing — 1.0% |
| | 21,000 | | | Albertsons Cos. LLC, 6.625%, 06/15/24 (e) | | 22,207 |
| | EUR 100,000 | | | Dufry Finance SCA, (Switzerland), Reg. S, 4.500%, 08/01/23 | | 113,780 |
| | 5,000 | | | Ingles Markets, Inc., 5.750%, 06/15/23 | | 5,162 |
| | 50,000 | | | Kroger Co. (The), 4.450%, 02/01/47 | | 49,636 |
| | | | New Albertsons, Inc., | | |
| | 4,000 | | | 7.450%, 08/01/29 | | 3,930 |
| | 8,000 | | | 8.700%, 05/01/30 | | 8,220 |
| | 13,000 | | | Rite Aid Corp., 6.125%, 04/01/23 (e) | | 13,775 |
| | | | SUPERVALU, Inc., | | |
| | 17,000 | | | 6.750%, 06/01/21 | | 16,957 |
| | 31,000 | | | 7.750%, 11/15/22 | | 30,613 |
| | | | | | |
| | | | | | 264,280 |
| | | | | | |
| | | | Food Products — 0.5% | | |
| | | | JBS USA LUX SA, (Brazil), | | |
| | 13,000 | | | 5.875%, 07/15/24 (e) | | 13,585 |
| | 18,000 | | | 7.250%, 06/01/21 (e) | | 18,540 |
| | 25,000 | | | Kraft Heinz Foods Co., 4.375%, 06/01/46 | | 23,638 |
| | | | Lamb Weston Holdings, Inc., | | |
| | 3,000 | | | 4.625%, 11/01/24 (e) | | 3,052 |
| | 3,000 | | | 4.875%, 11/01/26 (e) | | 3,047 |
| | | | Post Holdings, Inc., | | |
| | 18,000 | | | 5.000%, 08/15/26 (e) | | 17,336 |
| | 4,000 | | | 5.500%, 03/01/25 (e) | | 4,080 |
| | 4,000 | | | 5.750%, 03/01/27 (e) | | 4,048 |
| | 9,000 | | | 7.750%, 03/15/24 (e) | | 9,990 |
| | | | Smithfield Foods, Inc., | | |
| | 25,000 | | | 3.350%, 02/01/22 (e) | | 25,203 |
| | 15,000 | | | 4.250%, 02/01/27 (e) | | 15,326 |
| | | | | | |
| | | | | | 137,845 |
| | | | | | |
| | | | Household Products — 0.1% | | |
| | 3,000 | | | Kronos Acquisition Holdings, Inc., (Canada), 9.000%, 08/15/23 (e) | | 3,064 |
| | 23,000 | | | Spectrum Brands, Inc., 5.750%, 07/15/25 | | 24,486 |
| | | | | | |
| | | | | | 27,550 |
| | | | | | |
| | | | Personal Products — 0.2% | | |
| | 13,000 | | | Nature’s Bounty Co. (The), 7.625%, 05/15/21 (e) | | 13,731 |
| | 9,000 | | | Prestige Brands, Inc., 6.375%, 03/01/24 (e) | | 9,540 |
| | 12,000 | | | Revlon Consumer Products Corp., 6.250%, 08/01/24 | | 12,330 |
| | | | | | |
| | | | | | 35,601 |
| | | | | | |
| | | | Tobacco — 0.8% | | |
| | 50,000 | | | Altria Group, Inc., 4.250%, 08/09/42 | | 49,702 |
| | | | | | |
PRINCIPAL
AMOUNT | | | SECURITY DESCRIPTION | | VALUE |
|
| | |
| | | | Tobacco — continued | | |
| | 40,000 | | | Philip Morris International, Inc., 4.250%, 11/10/44 | | 40,130 |
| | 115,000 | | | Reynolds American, Inc., 4.450%, 06/12/25 | | 121,585 |
| | | | | | |
| | | | | | 211,417 |
| | | | | | |
| | | | Total Consumer Staples | | 797,049 |
| | | | | | |
| | | | Energy — 5.9% | | |
| | | | Energy Equipment & Services — 0.8% | | |
| | 8,000 | | | Nabors Industries, Inc., 5.500%, 01/15/23 (e) | | 8,255 |
| | 2,000 | | | Noble Holding International Ltd., (United Kingdom), 7.750%, 01/15/24 | | 1,945 |
| | 17,000 | | | Parker Drilling Co., 6.750%, 07/15/22 | | 15,725 |
| | 6,000 | | | Rowan Cos., Inc., 7.375%, 06/15/25 | | 6,225 |
| | 100,000 | | | Schlumberger Investment SA, 2.400%, 08/01/22 (e) | | 98,289 |
| | 10,000 | | | Summit Midstream Holdings LLC, 5.500%, 08/15/22 | | 10,125 |
| | 29,000 | | | Transocean Proteus Ltd., 6.250%, 12/01/24 (e) | | 29,906 |
| | | | Transocean, Inc., | | |
| | 16,000 | | | 6.800%, 03/15/38 | | 12,880 |
| | 12,000 | | | 9.000%, 07/15/23 (e) | | 12,960 |
| | 4,000 | | | Trinidad Drilling Ltd., (Canada), | | |
| | | | 6.625%, 02/15/25 (e) | | 4,120 |
| | | | Weatherford International Ltd., | | |
| | 15,000 | | | 6.750%, 09/15/40 | | 13,650 |
| | 5,000 | | | 9.875%, 02/15/24 (e) | | 5,775 |
| | | | | | |
| | | | | | 219,855 |
| | | | | | |
| | | | Oil, Gas & Consumable Fuels — 5.1% | | |
| | 10,000 | | | Antero Resources Corp., 5.125%, 12/01/22 | | 10,050 |
| | 100,000 | | | Boardwalk Pipelines LP, 5.950%, 06/01/26 | | 113,289 |
| | | | BP Capital Markets plc, (United Kingdom), | | |
| | 75,000 | | | 3.119%, 05/04/26 | | 73,325 |
| | 25,000 | | | 3.216%, 11/28/23 | | 25,101 |
| | 21,000 | | | California Resources Corp., 8.000%, 12/15/22 (e) | | 17,850 |
| | | | Cenovus Energy, Inc., (Canada), | | |
| | 29,000 | | | 5.200%, 09/15/43 | | 28,720 |
| | 15,000 | | | 6.750%, 11/15/39 | | 16,954 |
| | | | Chesapeake Energy Corp., | | |
| | 10,000 | | | Reg. S, 8.000%, 12/15/22 | | 10,575 |
| | 13,000 | | | 8.000%, 01/15/25 (e) | | 12,919 |
| | 35,000 | | | Chevron Corp., 2.355%, 12/05/22 | | 34,264 |
| | 7,000 | | | Citgo Holding, Inc., 10.750%, 02/15/20 (e) | | 7,586 |
SEE NOTES TO FINANCIAL STATEMENTS.
11
JPMorgan Flexible Long/Short Fund
SCHEDULE OF PORTFOLIO INVESTMENTS
AS OF FEBRUARY 28, 2017 (continued)
(Amounts in U.S. Dollars, unless otherwise noted)
| | | | | | |
PRINCIPAL
AMOUNT | | SECURITY DESCRIPTION | | VALUE | |
| |
Corporate Bonds — continued | | | | |
| |
| | Oil, Gas & Consumable Fuels — continued | |
| 21,000 | | CITGO Petroleum Corp., 6.250%, 08/15/22 (e) | | | 21,630 | |
| 15,000 | | Continental Resources, Inc., 5.000%, 09/15/22 | | | 15,300 | |
| 26,000 | | DCP Midstream Operating LP, 3.875%, 03/15/23 | | | 25,090 | |
| 13,000 | | Energy Transfer Equity LP, 5.875%, 01/15/24 | | | 13,975 | |
| | EP Energy LLC, | | | | |
| 19,000 | | 7.750%, 09/01/22 | | | 16,530 | |
| 20,000 | | 8.000%, 02/15/25 (e) | | | 19,500 | |
| 12,000 | | 9.375%, 05/01/20 | | | 11,730 | |
| 11,000 | | Genesis Energy LP, 6.000%, 05/15/23 | | | 11,137 | |
| 10,000 | | Hess Corp., 5.800%, 04/01/47 | | | 10,631 | |
| 39,000 | | Hilcorp Energy I LP, 5.000%, 12/01/24 (e) | | | 37,342 | |
| 10,000 | | Magellan Midstream Partners LP, 4.250%, 09/15/46 | | | 9,588 | |
| | MEG Energy Corp., (Canada), | | | | |
| 24,000 | | 6.500%, 03/15/21 (e) | | | 24,540 | |
| 14,000 | | 6.500%, 01/15/25 (e) | | | 13,685 | |
| 2,000 | | 7.000%, 03/31/24 (e) | | | 1,800 | |
| 10,000 | | MPLX LP, 5.200%, 03/01/47 | | | 10,213 | |
| | NGPL PipeCo LLC, | | | | |
| 33,000 | | 7.119%, 12/15/17 (e) | | | 34,196 | |
| 27,000 | | 9.625%, 06/01/19 (e) | | | 28,080 | |
| 26,000 | | Oasis Petroleum, Inc., 6.875%, 03/15/22 | | | 26,520 | |
| 35,000 | | ONEOK Partners LP, 6.125%, 02/01/41 | | | 39,813 | |
| | Petrobras Global Finance BV, (Brazil), | | | | |
| 8,000 | | 6.850%, 06/05/15 | | | 6,921 | |
| 132,000 | | 8.750%, 05/23/26 | | | 149,622 | |
| 15,000 | | Phillips 66 Partners LP, 4.900%, | | | | |
| | 10/01/46 | | | 14,765 | |
| 20,000 | | QEP Resources, Inc., 5.250%, 05/01/23 | | | 19,700 | |
| EUR 100,000 | | Repsol International Finance BV, (Spain), Reg. S, VAR, 4.500%, 03/25/75 | | | 107,298 | |
| 15,000 | | Rockies Express Pipeline LLC, 6.000%, 01/15/19 (e) | | | 15,750 | |
| 10,000 | | SM Energy Co., 5.625%, 06/01/25 | | | 9,463 | |
| 25,000 | | Sunoco Logistics Partners Operations LP, 5.300%, 04/01/44 | | | 25,243 | |
| 13,000 | | Sunoco LP, 5.500%, 08/01/20 | | | 13,098 | |
| 25,000 | | Tallgrass Energy Partners LP, 5.500%, 09/15/24 (e) | | | 25,250 | |
| 5,000 | | Targa Resources Partners LP, 5.125%, 02/01/25 (e) | | | 5,200 | |
| EUR 100,000 | | TOTAL SA, (France), Reg. S, VAR, 2.250%, 02/26/21 (x) (y) | | | 106,094 | |
| | | | | | |
PRINCIPAL
AMOUNT | | SECURITY DESCRIPTION | | VALUE | |
| |
| |
| | Oil, Gas & Consumable Fuels — continued | |
| 50,000 | | Western Gas Partners LP, 4.650%, 07/01/26 | | | 52,296 | |
| | Whiting Petroleum Corp., | | | | |
| 35,000 | | 5.000%, 03/15/19 | | | 35,306 | |
| 13,000 | | 5.750%, 03/15/21 | | | 12,935 | |
| | | | | | |
| | | | | 1,320,874 | |
| | | | | | |
| | Total Energy | | | 1,540,729 | |
| | | | | | |
| | Financials — 15.9% | | | | |
| | Banks — 5.1% | | | | |
| | Bank of America Corp., | | | | |
| 50,000 | | 3.500%, 04/19/26 | | | 49,599 | |
| 225,000 | | Series X, VAR, 6.250%, 09/05/24 (x) (y) | | | 240,772 | |
| | CIT Group, Inc., | | | | |
| 28,000 | | 5.000%, 08/15/22 | | | 29,680 | |
| 32,000 | | 5.375%, 05/15/20 | | | 34,240 | |
| 32,000 | | 5.500%, 02/15/19 (e) | | | 33,700 | |
| | Citigroup, Inc., | | | | |
| 60,000 | | 4.300%, 11/20/26 | | | 61,068 | |
| 20,000 | | Series O, VAR, 5.875%, 03/27/20 (x) (y) | | | 20,650 | |
| 225,000 | | Series P, VAR, 5.950%, 05/15/25 (x) (y) | | | 234,563 | |
| 18,000 | | Series R, VAR, 6.125%, 11/15/20 (x) (y) | | | 19,036 | |
| 200,000 | | HSBC Holdings plc, (United Kingdom), VAR, 6.875%, 06/01/21(x) (y) | | | 214,250 | |
| 200,000 | | Societe Generale SA, (France), VAR, 7.375%, 09/13/21 (e) (x) (y) | | | 202,500 | |
| | Toronto-Dominion Bank (The), (Canada), | | | | |
| 55,000 | | 1.800%, 07/13/21 | | | 53,641 | |
| 25,000 | | VAR, 3.625%, 09/15/31 | | | 24,628 | |
| 100,000 | | Wells Fargo & Co., 4.300%, 07/22/27 | | | 104,092 | |
| | | | | | |
| | | | | 1,322,419 | |
| | | | | | |
| | Capital Markets — 4.9% | | | | |
| | Bank of New York Mellon Corp. (The), | | | | |
| 50,000 | | Series E, VAR, 4.950%, 06/20/20 (x) (y) | | | 51,750 | |
| 94,000 | | Series F, VAR, 4.625%, 09/20/26 (x) (y) | | | 91,532 | |
| | E*TRADE Financial Corp., | | | | |
| 33,000 | | 4.625%, 09/15/23 | | | 34,155 | |
| 20,000 | | 5.375%, 11/15/22 | | | 21,187 | |
| | Goldman Sachs Group, Inc. (The), | | | | |
| 75,000 | | 2.875%, 02/25/21 | | | 75,782 | |
| 225,000 | | Series M, VAR, 5.375%, 05/10/20 (x) (y) | | | 231,187 | |
| EUR 100,000 | | ING Bank NV, (Netherlands), Reg. S, VAR, 3.000%, 04/11/28 | | | 111,374 | |
| | Morgan Stanley, | | | | |
| 30,000 | | 3.125%, 07/27/26 | | | 28,878 | |
| 110,000 | | 3.875%, 01/27/26 | | | 112,220 | |
| 20,000 | | 4.375%, 01/22/47 | | | 20,331 | |
| 225,000 | | Series H, VAR, 5.450%, 07/15/19 (x) (y) | | | 230,803 | |
SEE NOTES TO FINANCIAL STATEMENTS.
12
JPMorgan Flexible Long/Short Fund
SCHEDULE OF PORTFOLIO INVESTMENTS
AS OF FEBRUARY 28, 2017 (continued)
(Amounts in U.S. Dollars, unless otherwise noted)
| | | | | | |
PRINCIPAL
AMOUNT | | SECURITY DESCRIPTION | | VALUE | |
| |
Corporate Bonds — continued | |
| | |
| | Capital Markets — continued | | | | |
| 18,000 | | MSCI, Inc., 5.250%, 11/15/24 (e) | | | 18,990 | |
| EUR 200,000 | | UBS Group AG, (Switzerland), Reg. S, VAR, 5.750%, 02/19/22 (x) (y) | | | 231,479 | |
| | | | | | |
| | | | | 1,259,668 | |
| | | | | | |
| | Consumer Finance — 2.4% | | | | |
| 150,000 | | AerCap Ireland Capital DAC, (Netherlands), 4.625%, 10/30/20 | | | 160,021 | |
| | Ally Financial, Inc., | | | | |
| 20,000 | | 4.250%, 04/15/21 | | | 20,625 | |
| 19,000 | | 4.625%, 03/30/25 | | | 19,427 | |
| 50,000 | | Capital One Financial Corp., 3.750%, 04/24/24 | | | 51,357 | |
| 200,000 | | Ford Motor Credit Co. LLC, 4.375%, 08/06/23 | | | 209,517 | |
| 40,000 | | General Motors Financial Co., Inc., 4.350%, 01/17/27 | | | 40,721 | |
| 42,000 | | Springleaf Finance Corp., 8.250%, 12/15/20 | | | 46,148 | |
| 55,000 | | Synchrony Financial, 3.750%, 08/15/21 | | | 56,659 | |
| | | | | | |
| | | | | 604,475 | |
| | | | | | |
| | Diversified Financial Services — 2.8% | |
| 12,000 | | ACE Cash Express, Inc., 11.000%,
02/01/19 (e) | | | 11,310 | |
| 10,000 | | CNG Holdings, Inc., 9.375%, 05/15/20 (e) | | | 9,025 | |
| 200,000 | | EDP Finance BV, (Portugal), 5.250%, 01/14/21 (e) | | | 213,431 | |
| EUR 100,000 | | Lincoln Finance Ltd., (Netherlands), Reg. S, 6.875%, 04/15/21 | | | 114,517 | |
| | Nationstar Mortgage LLC, | | | | |
| 37,000 | | 6.500%, 07/01/21 | | | 37,833 | |
| 20,000 | | 7.875%, 10/01/20 | | | 20,850 | |
| 250,000 | | Nationwide Building Society, (United Kingdom), 4.000%, 09/14/26 (e) | | | 240,761 | |
| | Shell International Finance BV, (Netherlands), | | | | |
| 50,000 | | 3.250%, 05/11/25 | | | 50,438 | |
| 50,000 | | 4.000%, 05/10/46 | | | 48,801 | |
| | | | | | |
| | | | | 746,966 | |
| | | | | | |
| | Insurance — 0.7% | | | | |
| 130,000 | | American International Group, Inc., 3.900%, 04/01/26 | | | 131,632 | |
| 30,000 | | MetLife, Inc., 4.721%, 12/15/44 | | | 32,428 | |
| GBP 9,000 | | Zurich Finance UK plc, (Switzerland), VAR, 6.625%, 10/02/22 (x) (y) | | | 12,857 | |
| | | | | | |
| | | | | 176,917 | |
| | | | | | |
| | | | | | |
PRINCIPAL
AMOUNT | | SECURITY DESCRIPTION | | VALUE | |
| |
| |
| | Thrifts & Mortgage Finance — 0.0% (g) | |
| 10,000 | | Quicken Loans, Inc., 5.750%, 05/01/25 (e) | | | 9,850 | |
| | | | | | |
| | Total Financials | | | 4,120,295 | |
| | | | | | |
| | Health Care — 3.1% | | | | |
| | Biotechnology — 0.3% | | | | |
| 75,000 | | Gilead Sciences, Inc., 2.500%, 09/01/23 | | | 72,683 | |
| | | | | | |
| |
| | Health Care Equipment & Supplies — 0.3% | |
| 13,000 | | Hologic, Inc., 5.250%, 07/15/22 (e) | | | 13,552 | |
| | Mallinckrodt International Finance SA, | | | | |
| 35,000 | | 3.500%, 04/15/18 | | | 35,088 | |
| 28,000 | | 5.625%, 10/15/23 (e) | | | 26,880 | |
| | | | | | |
| | | | | 75,520 | |
| | | | | | |
| | Health Care Providers & Services — 1.3% | |
| 20,000 | | Acadia Healthcare Co., Inc., 6.500%, 03/01/24 | | | 21,250 | |
| 4,000 | | AMN Healthcare, Inc., 5.125%, 10/01/24 (e) | | | 4,070 | |
| | Centene Corp., | | | | |
| 5,000 | | 4.750%, 01/15/25 | | | 5,144 | |
| 11,000 | | 6.125%, 02/15/24 | | | 11,935 | |
| 13,000 | | Community Health Systems, Inc., 6.875%, 02/01/22 | | | 11,424 | |
| 33,000 | | DaVita, Inc., 5.125%, 07/15/24 | | | 33,681 | |
| | Envision Healthcare Corp., | | | | |
| 7,000 | | 5.125%, 07/01/22 (e) | | | 7,166 | |
| 6,000 | | 5.625%, 07/15/22 | | | 6,248 | |
| | HCA, Inc., | | | | |
| 54,000 | | 5.000%, 03/15/24 | | | 56,903 | |
| 29,000 | | 5.875%, 03/15/22 | | | 32,009 | |
| 21,000 | | 5.875%, 05/01/23 | | | 22,837 | |
| 31,000 | | IASIS Healthcare LLC, 8.375%, 05/15/19 | | | 30,302 | |
| 20,000 | | MPH Acquisition Holdings LLC, 7.125%, 06/01/24 (e) | | | 21,550 | |
| 7,000 | | Team Health Holdings, Inc., 6.375%, 02/01/25 (e) | | | 6,948 | |
| | Tenet Healthcare Corp., | | | | |
| 35,000 | | VAR, 4.463%, 06/15/20 | | | 35,437 | |
| 15,000 | | 5.000%, 03/01/19 | | | 15,010 | |
| 39,000 | | 6.750%, 06/15/23 | | | 38,659 | |
| | | | | | |
| | | | | 360,573 | |
| | | | | | |
| | Health Care Technology — 0.0% (g) | |
| 11,000 | | Quintiles IMS, Inc., 4.875%, 05/15/23 (e) | | | 11,316 | |
| | | | | | |
| | Pharmaceuticals — 1.2% | | | | |
| 60,000 | | Actavis Funding SCS, 3.800%, 03/15/25 | | | 60,621 | |
SEE NOTES TO FINANCIAL STATEMENTS.
13
JPMorgan Flexible Long/Short Fund
SCHEDULE OF PORTFOLIO INVESTMENTS
AS OF FEBRUARY 28, 2017 (continued)
(Amounts in U.S. Dollars, unless otherwise noted)
| | | | | | |
PRINCIPAL
AMOUNT | | SECURITY DESCRIPTION | | VALUE | |
| |
Corporate Bonds — continued | | | | |
| |
| | Pharmaceuticals — continued | |
| | Concordia International Corp., (Canada), | | | | |
| 45,000 | | 7.000%, 04/15/23 (e) | | | 17,550 | |
| 2,000 | | 9.000%, 04/01/22 (e) | | | 1,760 | |
| 100,000 | | Mylan NV, 3.150%, 06/15/21 | | | 100,032 | |
| | Teva Pharmaceutical Finance Netherlands III BV, (Israel), | | | | |
| 25,000 | | 2.200%, 07/21/21 | | | 24,077 | |
| 25,000 | | 3.150%, 10/01/26 | | | 23,018 | |
| | Valeant Pharmaceuticals International, Inc., | | | | |
| 26,000 | | 6.750%, 08/15/21 (e) | | | 23,465 | |
| 43,000 | | 7.000%, 10/01/20 (e) | | | 40,098 | |
| | | | | | |
| | | | | 290,621 | |
| | | | | | |
| | Total Health Care | | | 810,713 | |
| | | | | | |
| | Industrials — 5.6% | | | | |
| | Aerospace & Defense — 0.7% | | | | |
| | Arconic, Inc., | | | | |
| 17,000 | | 5.125%, 10/01/24 | | | 17,552 | |
| 44,000 | | 5.900%, 02/01/27 | | | 47,135 | |
| 42,000 | | Bombardier, Inc., (Canada), 7.750%, 03/15/20 (e) | | | 45,255 | |
| 25,000 | | L3 Technologies, Inc., 3.850%, 12/15/26 | | | 25,417 | |
| | TransDigm, Inc., | | | | |
| 11,000 | | 6.000%, 07/15/22 | | | 11,316 | |
| 11,000 | | 6.375%, 06/15/26 (e) | | | 11,110 | |
| | | | | | |
| | | | | 157,785 | |
| | | | | | |
| | Airlines — 0.3% | | | | |
| 84,720 | | Continental Airlines Pass-Through Trust, Series 2012-2, Class A, 4.000%, 10/29/24 | | | 87,685 | |
| | | | | | |
| |
| | Building Products — 0.6% | |
| 3,000 | | Airxcel, Inc., 8.500%, 02/15/22 (e) | | | 3,090 | |
| 65,000 | | Masco Corp., 4.375%, 04/01/26 | | | 67,594 | |
| 14,000 | | NCI Building Systems, Inc., 8.250%, 01/15/23 (e) | | | 15,225 | |
| 26,000 | | Standard Industries, Inc., 6.000%,
10/15/25 (e) | | | 27,625 | |
| 19,000 | | Summit Materials LLC, 6.125%, 07/15/23 | | | 19,760 | |
| 6,000 | | Unifrax I LLC, 7.500%, 02/15/19 (e) | | | 5,985 | |
| | | | | | |
| | | | | 139,279 | |
| | | | | | |
| | Commercial Services & Supplies — 0.9% | |
| 3,000 | | ACCO Brands Corp., 5.250%, 12/15/24 (e) | | | 3,037 | |
| 15,000 | | ADT Corp. (The), 4.125%, 06/15/23 | | | 14,437 | |
| 23,000 | | Garda World Security Corp., (Canada), 7.250%, 11/15/21 (e) | | | 22,022 | |
| | | | | | |
PRINCIPAL
AMOUNT | | SECURITY DESCRIPTION | | VALUE | |
| |
| |
| | Commercial Services & Supplies — continued | |
| 19,000 | | Prime Security Services Borrower LLC, 9.250%, 05/15/23 (e) | | | 20,829 | |
| EUR 100,000 | | Verisure Holding AB, (Sweden), Reg. S, 6.000%, 11/01/22 | | | 115,421 | |
| 20,000 | | West Corp., 5.375%, 07/15/22 (e) | | | 19,210 | |
| | | | | | |
| | | | | 194,956 | |
| | | | | | |
| | Construction & Engineering — 0.3% | | | | |
| | AECOM, | | | | |
| 13,000 | | 5.125%, 03/15/27 (e) | | | 13,210 | |
| 37,000 | | 5.875%, 10/15/24 | | | 40,422 | |
| 30,000 | | MasTec, Inc., 4.875%, 03/15/23 | | | 30,000 | |
| | | | | | |
| | | | | 83,632 | |
| | | | | | |
| | Electrical Equipment — 0.5% | | | | |
| EUR 100,000 | | NEW Areva Holding SA, (France), Reg. S, 3.125%, 03/20/23 | | | 99,663 | |
| | Novelis Corp., | | | | |
| 5,000 | | 5.875%, 09/30/26 (e) | | | 5,144 | |
| 5,000 | | 6.250%, 08/15/24 (e) | | | 5,300 | |
| 19,000 | | Sensata Technologies BV, 5.625%, 11/01/24 (e) | | | 20,045 | |
| 10,000 | | Vertiv Group Corp., 9.250%, 10/15/24 (e) | | | 10,737 | |
| | | | | | |
| | | | | 140,889 | |
| | | | | | |
| | Industrial Conglomerates — 0.1% | | | | |
| 15,000 | | Roper Technologies, Inc., 3.800%, 12/15/26 | | | 15,160 | |
| | | | | | |
| | |
| | Machinery — 0.1% | | | | |
| 14,000 | | BlueLine Rental Finance Corp., 7.000%, 02/01/19 (e) | | | 14,280 | |
| 5,000 | | Navistar International Corp., 8.250%, 11/01/21 | | | 5,050 | |
| 11,000 | | Terex Corp., 5.625%, 02/01/25 (e) | | | 11,289 | |
| 5,000 | | Xylem, Inc., 4.375%, 11/01/46 | | | 5,028 | |
| | | | | | |
| | | | | 35,647 | |
| | | | | | |
| | Marine — 0.1% | | | | |
| 43,485 | | Shelf Drilling Holdings Ltd., (United Arab Emirates), 9.500%, 11/02/20 (e) | | | 41,311 | |
| | | | | | |
| | |
| | Road & Rail — 1.6% | | | | |
| 50,000 | | Burlington Northern Santa Fe LLC, 4.550%, 09/01/44 | | | 53,774 | |
| EUR 125,000 | | Europcar Groupe SA, (France), Reg. S, 5.750%, 06/15/22 | | | 139,708 | |
| GBP 42,080 | | Great Rolling Stock Co. Ltd. (The), (United Kingdom), Reg. S, 6.875%, 07/27/35 | | | 70,141 | |
| GBP 100,000 | | Porterbrook Rail Finance Ltd., (United Kingdom), Reg. S, 6.500%, 10/20/20 | | | 146,920 | |
| | | | | | |
| | | | | 410,543 | |
| | | | | | |
SEE NOTES TO FINANCIAL STATEMENTS.
14
JPMorgan Flexible Long/Short Fund
SCHEDULE OF PORTFOLIO INVESTMENTS
AS OF FEBRUARY 28, 2017 (continued)
(Amounts in U.S. Dollars, unless otherwise noted)
| | | | | | |
PRINCIPAL
AMOUNT | | SECURITY DESCRIPTION | | VALUE | |
| |
Corporate Bonds — continued | | | | |
| |
| | Trading Companies & Distributors — 0.4% | |
| 18,000 | | Aircastle Ltd., 7.625%, 04/15/20 | | | 20,407 | |
| 22,000 | | HD Supply, Inc., 5.750%, 04/15/24 (e) | | | 23,265 | |
| 37,000 | | United Rentals North America, Inc., 5.750%, 11/15/24 | | | 39,220 | |
| 11,000 | | Univar USA, Inc., 6.750%, 07/15/23 (e) | | | 11,523 | |
| 9,000 | | WESCO Distribution, Inc., 5.375%, 06/15/24 | | | 9,270 | |
| | | | | | |
| | | | | 103,685 | |
| | | | | | |
| | Total Industrials | | | 1,410,572 | |
| | | | | | |
| | Information Technology — 3.0% | | | | |
| | Communications Equipment — 0.6% | |
| 20,000 | | Alcatel-Lucent USA, Inc., (France), 6.450%, 03/15/29 | | | 22,100 | |
| 7,000 | | Avaya, Inc., 7.000%, 04/01/19 (d) (e) | | | 5,591 | |
| 100,000 | | Cisco Systems, Inc., 2.200%, 02/28/21 | | | 100,131 | |
| 30,000 | | Harris Corp., 5.054%, 04/27/45 | | | 33,118 | |
| | | | | | |
| | | | | 160,940 | |
| | | | | | |
| | Electronic Equipment, Instruments & Components — 0.4% | |
| | Anixter, Inc., | | | | |
| 28,000 | | 5.500%, 03/01/23 | | | 29,330 | |
| 32,000 | | 5.625%, 05/01/19 | | | 33,760 | |
| 41,000 | | CDW LLC, 5.500%, 12/01/24 | | | 43,050 | |
| | | | | | |
| | | | | 106,140 | |
| | | | | | |
| | Internet Software & Services — 0.2% | | | | |
| 15,000 | | Genesys Telecommunications Laboratories, Inc., 10.000%, 11/30/24 (e) | | | 16,312 | |
| 35,000 | | Rackspace Hosting, Inc., 8.625%, 11/15/24 (e) | | | 36,881 | |
| 4,000 | | Zayo Group LLC, 5.750%, 01/15/27 (e) | | | 4,229 | |
| | | | | | |
| | | | | 57,422 | |
| | | | | | |
| | IT Services — 0.2% | | | | |
| | First Data Corp., | | | | |
| 30,000 | | 5.000%, 01/15/24 (e) | | | 30,637 | |
| 20,000 | | 5.750%, 01/15/24 (e) | | | 20,725 | |
| | | | | | |
| | | | | 51,362 | |
| | | | | | |
| | Semiconductors & Semiconductor Equipment — 0.2% | |
| 25,000 | | Analog Devices, Inc., 3.500%, 12/05/26 | | | 24,944 | |
| 6,000 | | Micron Technology, Inc., 5.250%, 01/15/24 (e) | | | 6,075 | |
| 17,000 | | Microsemi Corp., 9.125%, 04/15/23 (e) | | | 19,593 | |
| | | | | | |
| | | | | 50,612 | |
| | | | | | |
| | Software — 1.0% | | | | |
| 10,000 | | Camelot Finance SA, 7.875%, 10/15/24 (e) | | | 10,650 | |
| 3,000 | | CURO Financial Technologies Corp., 12.000%, 03/01/22 (e) | | | 3,079 | |
| | | | | | |
PRINCIPAL
AMOUNT | | SECURITY DESCRIPTION | | VALUE | |
| |
| |
| | Software — continued | |
| 20,000 | | Infor US, Inc., 6.500%, 05/15/22 | | | 20,800 | |
| 15,000 | | Informatica LLC, 7.125%, 07/15/23 (e) | | | 14,550 | |
| | Microsoft Corp., | | | | |
| 20,000 | | 3.700%, 08/08/46 | | | 18,936 | |
| 20,000 | | 4.875%, 12/15/43 | | | 22,514 | |
| | Oracle Corp., | | | | |
| 50,000 | | 1.900%, 09/15/21 | | | 49,088 | |
| 100,000 | | 2.650%, 07/15/26 | | | 96,100 | |
| | | | | | |
| | | | | 235,717 | |
| | | | | | |
| | Technology Hardware, Storage & Peripherals — 0.4% | |
| | Apple, Inc., | | | | |
| 10,000 | | 3.250%, 02/23/26 | | | 10,150 | |
| 15,000 | | 3.350%, 02/09/27 | | | 15,219 | |
| 50,000 | | 4.650%, 02/23/46 | | | 54,400 | |
| | Diamond 1 Finance Corp., | | | | |
| 3,000 | | 4.420%, 06/15/21 (e) | | | 3,148 | |
| 8,000 | | 5.450%, 06/15/23 (e) | | | 8,642 | |
| 3,000 | | 5.875%, 06/15/21 (e) | | | 3,174 | |
| 3,000 | | 7.125%, 06/15/24 (e) | | | 3,315 | |
| | | | | | |
| | | | | 98,048 | |
| | | | | | |
| | Total Information Technology | | | 760,241 | |
| | | | | | |
| | Materials — 6.3% | | | | |
| | Chemicals — 1.5% | | | | |
| 15,000 | | Blue Cube Spinco, Inc., 10.000%, 10/15/25 | | | 18,225 | |
| | CF Industries, Inc., | | | | |
| 10,000 | | 4.500%, 12/01/26 (e) | | | 10,243 | |
| 35,000 | | 4.950%, 06/01/43 | | | 30,100 | |
| 15,000 | | 6.875%, 05/01/18 | | | 15,739 | |
| 18,000 | | CVR Partners LP, 9.250%, 06/15/23 (e) | | | 19,260 | |
| 21,000 | | Hexion, Inc., 6.625%, 04/15/20 | | | 19,530 | |
| EUR 100,000 | | Ineos Finance plc, (United Kingdom), Reg. S, 4.000%, 05/01/23 | | | 110,310 | |
| EUR 100,000 | | INEOS Group Holdings SA, (Luxembourg), Reg. S, 5.375%, 08/01/24 | | | 111,500 | |
| 2,000 | | Koppers, Inc., 6.000%, 02/15/25 (e) | | | 2,080 | |
| 3,000 | | Scotts Miracle-Gro Co. (The), 5.250%, 12/15/26 (e) | | | 3,064 | |
| 45,000 | | Tronox Finance LLC, 6.375%, 08/15/20 | | | 45,788 | |
| | | | | | |
| | | | | 385,839 | |
| | | | | | |
| | Construction Materials — 0.0% (g) | |
| 9,000 | | US Concrete, Inc., 6.375%, 06/01/24 | | | 9,518 | |
| | | | | | |
| |
| | Containers & Packaging — 2.1% | |
| EUR 125,000 | | Ardagh Packaging Finance plc, (Ireland), Reg. S, 6.750%, 05/15/24 | | | 146,495 | |
SEE NOTES TO FINANCIAL STATEMENTS.
15
JPMorgan Flexible Long/Short Fund
SCHEDULE OF PORTFOLIO INVESTMENTS
AS OF FEBRUARY 28, 2017 (continued)
(Amounts in U.S. Dollars, unless otherwise noted)
| | | | | | | | |
PRINCIPAL
AMOUNT | | | SECURITY DESCRIPTION | | VALUE | |
| | |
| | Corporate Bonds — continued | |
| | |
| | | | Containers & Packaging — continued | | | | |
| | 16,000 | | | Berry Plastics Corp., 6.000%, 10/15/22 | | | 16,940 | |
| | 7,000 | | | Owens-Brockway Glass Container, Inc., 5.000%, 01/15/22 (e) | | | 7,280 | |
| | | | Reynolds Group Issuer, Inc., (New Zealand), | | | | |
| | 35,000 | | | 5.750%, 10/15/20 | | | 36,050 | |
| | 9,000 | | | 7.000%, 07/15/24 (e) | | | 9,681 | |
| | 5,000 | | | Sealed Air Corp., 6.500%, 12/01/20 (e) | | | 5,625 | |
| | EUR 125,000 | | | SIG Combibloc Holdings SCA, (Luxembourg), Reg. S, 7.750%, 02/15/23 | | | 142,688 | |
| | EUR 150,000 | | | Verallia Packaging SASU, (France), Reg. S, 5.125%, 08/01/22 | | | 168,604 | |
| | | | | | | | |
| | | | | | | 533,363 | |
| | | | | | | | |
| | | | Metals & Mining — 2.3% | | | | |
| | 9,000 | | | AK Steel Corp., 7.500%, 07/15/23 | | | 9,832 | |
| | 17,000 | | | Aleris International, Inc., 7.875%, 11/01/20 | | | 16,830 | |
| | EUR 200,000 | | | Anglo American Capital plc, (United Kingdom), Reg. S, 3.500%, 03/28/22 | | | 234,093 | |
| | 62,000 | | | ArcelorMittal, (Luxembourg), 7.000%, 02/25/22 | | | 70,525 | |
| | GBP 100,000 | | | BHP Billiton Finance Ltd., (Australia), Reg. S, VAR, 6.500%, 10/22/77 | | | 141,581 | |
| | 10,000 | | | Commercial Metals Co., 4.875%, 05/15/23 | | | 10,225 | |
| | 10,000 | | | HudBay Minerals, Inc., (Canada), 7.250%, 01/15/23 (e) | | | 10,675 | |
| | 9,000 | | | Lundin Mining Corp., (Canada), 7.875%, 11/01/22 (e) | | | 9,855 | |
| | 13,000 | | | New Gold, Inc., (Canada), 6.250%, 11/15/22 (e) | | | 13,130 | |
| | 22,000 | | | Steel Dynamics, Inc., 5.250%, 04/15/23 | | | 22,910 | |
| | 9,000 | | | Teck Resources Ltd., (Canada), 8.000%, 06/01/21 (e) | | | 10,001 | |
| | 16,000 | | | United States Steel Corp., 8.375%, 07/01/21 (e) | | | 18,000 | |
| | 40,000 | | | Vale Overseas Ltd., (Brazil), 6.250%, 08/10/26 | | | 43,892 | |
| | | | | | | | |
| | | | | | | 611,549 | |
| | | | | | | | |
| | | | Paper & Forest Products — 0.4% | | | | |
| | EUR 100,000 | | | WEPA Hygieneprodukte GmbH, (Germany), Reg. S, 3.750%, 05/15/24 | | | 111,300 | |
| | | | | | | | |
| | | | Total Materials | | | 1,651,569 | |
| | | | | | | | |
| | | | Real Estate — 1.0% | | | | |
| | | | Equity Real Estate Investment Trusts (REITs) — 1.0% | | | | |
| | | | Crown Castle International Corp., | | | | |
| | 100,000 | | | 3.700%, 06/15/26 | | | 98,677 | |
| | 23,000 | | | 4.875%, 04/15/22 | | | 24,852 | |
| | | | | | | | |
PRINCIPAL
AMOUNT | | | SECURITY DESCRIPTION | | VALUE | |
| | |
| |
| | | | Equity Real Estate Investment Trusts (REITs) — continued | |
| | 10,000 | | | DuPont Fabros Technology LP, 5.625%, 06/15/23 | | | 10,412 | |
| | 14,000 | | | Equinix, Inc., 5.750%, 01/01/25 | | | 14,840 | |
| | 13,000 | | | Iron Mountain, Inc., 5.750%, 08/15/24 | | | 13,341 | |
| | 67,000 | | | VEREIT Operating Partnership LP, 4.600%, 02/06/24 | | | 68,717 | |
| | | | | | | | |
| | | | Total Real Estate | | | 230,839 | |
| | | | | | | | |
| | | | Telecommunication Services — 5.0% | | | | |
| | | | Diversified Telecommunication Services — 3.8% | |
| | | | AT&T, Inc., | | | | |
| | 50,000 | | | 4.125%, 02/17/26 | | | 50,761 | |
| | 50,000 | | | 4.300%, 12/15/42 | | | 44,736 | |
| | | | CCO Holdings LLC, | | | | |
| | 8,000 | | | 5.500%, 05/01/26 (e) | | | 8,490 | |
| | 16,000 | | | 5.750%, 02/15/26 (e) | | | 17,120 | |
| | 18,000 | | | 5.875%, 04/01/24 (e) | | | 19,305 | |
| | 8,000 | | | Cincinnati Bell, Inc., 7.000%, 07/15/24 (e) | | | 8,460 | |
| | 10,000 | | | Consolidated Communications, Inc., 6.500%, 10/01/22 | | | 9,975 | |
| | EUR 120,000 | | | eircom Finance DAC, (Ireland), Reg. S, 4.500%, 05/31/22 | | | 133,103 | |
| 71,000
|
| | Embarq Corp., 7.995%, 06/01/36 Frontier Communications Corp., | |
| 71,233
|
|
| | 32,000 | | | 7.125%, 03/15/19 | | | 34,000 | |
| | 36,000 | | | 9.000%, 08/15/31 | | | 31,950 | |
| | 28,000 | | | 9.250%, 07/01/21 | | | 29,540 | |
| | 4,000 | | | 11.000%, 09/15/25 | | | 4,020 | |
| | | | Intelsat Jackson Holdings SA, | | | | |
| | | | (Luxembourg), | | | | |
| | 12,000 | | | 5.500%, 08/01/23 | | | 9,945 | |
| | 5,000 | | | 7.250%, 04/01/19 | | | 4,787 | |
| | 6,000 | | | 7.250%, 10/15/20 | | | 5,550 | |
| | 28,000 | | | 8.000%, 02/15/24 (e) | | | 30,310 | |
| | 14,000 | | | Level 3 Financing, Inc., 5.125%, 05/01/23 | | | 14,280 | |
| | EUR 100,000 | | | Matterhorn Telecom SA, (Luxembourg), Reg. S, 3.875%, 05/01/22 | | | 109,913 | |
| | 2,000 | | | Qwest Capital Funding, Inc., 7.750%, 02/15/31 | | | 1,895 | |
| | 9,000 | | | Qwest Corp., 6.750%, 12/01/21 | | | 9,950 | |
| | 13,000 | | | SBA Communications Corp., 4.875%, 07/15/22 | | | 13,276 | |
| | | | Verizon Communications, Inc., | | | | |
| | 10,000 | | | 4.125%, 08/15/46 | | | 8,749 | |
| | 25,000 | | | 4.862%, 08/21/46 | | | 24,514 | |
| | 20,000 | | | 5.012%, 04/15/49 (e) | | | 19,626 | |
SEE NOTES TO FINANCIAL STATEMENTS.
16
JPMorgan Flexible Long/Short Fund
SCHEDULE OF PORTFOLIO INVESTMENTS
AS OF FEBRUARY 28, 2017 (continued)
(Amounts in U.S. Dollars, unless otherwise noted)
| | | | | | | | |
PRINCIPAL
AMOUNT | | | SECURITY DESCRIPTION | | VALUE | |
| | |
| | Corporate Bonds — continued | | | | |
| | |
| | | | Diversified Telecommunication Services — continued | | | | |
| | EUR 120,000 | | | Virgin Media Finance plc, (United Kingdom), Reg. S, 4.500%, 01/15/25 | | | 133,802 | |
| | EUR 100,000 | | | Wind Acquisition Finance SA, (Italy), Reg. S, 4.000%, 07/15/20 | | | 107,953 | |
| | 18,000 | | | Zayo Group LLC, 6.000%, 04/01/23 | | | 19,035 | |
| | | | | | | | |
| | | | | | | 976,278 | |
| | | | | | | | |
| | | | Wireless Telecommunication Services — 1.2% | |
| | | | Sprint Communications, Inc., | | | | |
| | 35,000 | | | 9.000%, 11/15/18 (e) | | | 38,325 | |
| | 21,000 | | | 9.250%, 04/15/22 | | | 25,883 | |
| | | | Sprint Corp., | | | | |
| | 25,000 | | | 7.125%, 06/15/24 | | | 26,992 | |
| | 20,000 | | | 7.625%, 02/15/25 | | | 22,300 | |
| | EUR 100,000 | | | Telefonica Europe BV, (Spain), Reg. S, VAR, 7.625%, 09/18/21 (x) (y) | | | 123,949 | |
| | | | T-Mobile USA, Inc., | | | | |
| | 25,000 | | | 6.625%, 04/01/23 | | | 26,550 | |
| | 11,000 | | | 6.633%, 04/28/21 | | | 11,442 | |
| | 11,000 | | | 6.731%, 04/28/22 | | | 11,440 | |
| | 13,000 | | | 6.836%, 04/28/23 | | | 13,878 | |
| | | | | | | | |
| | | | | | | 300,759 | |
| | | | | | | | |
| | | | Total Telecommunication Services | | | 1,277,037 | |
| | | | | | | | |
| | |
| | | | Utilities — 3.0% | | | | |
| | | | Electric Utilities — 2.1% | | | | |
| | 60,000 | | | Emera US Finance LP, (Canada), 3.550%, 06/15/26 | | | 59,237 | |
| | 200,000 | | | Empresa Electrica Angamos SA, (Chile), Reg. S, 4.875%, 05/25/29 | | | 199,600 | |
| | 25,000 | | | Exelon Corp., 4.450%, 04/15/46 | | | 24,992 | |
| | 50,000 | | | ITC Holdings Corp., 3.250%, 06/30/26 | | | 48,966 | |
| | 200,000 | | | Lamar Funding Ltd., (Oman), Reg. S, 3.958%, 05/07/25 | | | 186,750 | |
| | 21,000 | | | Terraform Global Operating LLC, 9.750%, 08/15/22 (e) | | | 23,520 | |
| | | | | | | | |
| | | | | | | 543,065 | |
| | | | | | | | |
| | | | Gas Utilities — 0.0% (g) | | | | |
| | 3,000 | | | AmeriGas Partners LP, 5.500%, 05/20/25 | | | 3,041 | |
| | 11,000 | | | Rose Rock Midstream LP, 5.625%, 07/15/22 | | | 10,808 | |
| | | | | | | | |
| | | | | | | 13,849 | |
| | | | | | | | |
| | | | Independent Power & Renewable Electricity Producers — 0.7% | |
| | | | AES Corp., | | | | |
| | 6,000 | | | VAR, 3.931%, 06/01/19 | | | 6,002 | |
| | 9,000 | | | 5.500%, 03/15/24 | | | 9,180 | |
| | | | Calpine Corp., | | | | |
| | 21,000 | | | 5.875%, 01/15/24 (e) | | | 22,155 | |
| | | | | | | | |
PRINCIPAL
AMOUNT | | | SECURITY DESCRIPTION | | VALUE | |
| | |
| |
| | | | Independent Power & Renewable Electricity Producers — continued | |
| | 25,000 | | | 7.875%, 01/15/23 (e) | | | 26,007 | |
| | 26,000 | | | Dynegy, Inc., 5.875%, 06/01/23 | | | 23,530 | |
| | 11,000 | | | GenOn Energy, Inc., 9.875%, 10/15/20 | | | 8,085 | |
| | 20,000 | | | NRG Energy, Inc., 6.625%, 03/15/23 | | | 20,250 | |
| | 9,000 | | | NRG Yield Operating LLC, 5.375%, 08/15/24 | | | 9,225 | |
| | 48,000 | | | TerraForm Power Operating LLC, SUB, 6.625%, 06/15/25 (e) | | | 50,400 | |
| | | | | | | | |
| | | | | | | 174,834 | |
| | | | | | | | |
| | | | Multi-Utilities — 0.2% | | | | |
| | 49,000 | | | Dominion Resources, Inc., Series D, 2.850%, 08/15/26 | | | 46,329 | |
| | | | | | | | |
| | | | Total Utilities | | | 778,077 | |
| | | | | | | | |
| | | | Total Corporate Bonds (Cost 16,180,744) | | | 16,184,868 | |
| | | | | | | | |
| | U.S. Treasury Obligations — 0.3% | | | | |
| | 35,000 | | | U.S. Treasury Bond, 2.250%, 08/15/46 | | | 29,955 | |
| | 45,000 | | | U.S. Treasury Note, 2.250%, 02/15/27 | | | 44,561 | |
| | | | | | | | |
| | | | Total U.S. Treasury Obligations (Cost 74,138) | | | 74,516 | |
| | Loan Assignments — 31.9% | | | | |
| | |
| | | | Consumer Discretionary — 8.1% | | | | |
| | | | Diversified Consumer Services — 0.6% | | | | |
| | 149,239 | | | Spin Holdco, Inc., Initial Term Loan, VAR, 4.285%, 11/14/19 | | | 148,625 | |
| | | | | | | | |
| | |
| | | | Hotels, Restaurants & Leisure — 1.0% | | | | |
| | 10,000 | | | Gateway Casinos & Entertainment Ltd., 1st Lien Term Loan B, VAR, 5.250%, 02/15/23(Canada) ^ | | | 10,056 | |
| | 178,053 | | | Graton Economic Development Authority, Incremental Term B Loan, VAR, 4.779%, 09/01/22 | | | 179,833 | |
| | 14,400 | | | Landry’s, Inc., 1st Lien Term Loan, VAR, 4.029%, 09/22/23 | | | 14,547 | |
| | 74,613 | | | Seminole Hard Rock Entertainment, Inc., Term Loan B, VAR, 3.748%, 05/14/20 | | | 74,955 | |
| | | | | | | | |
| | | | | | | 279,391 | |
| | | | | | | | |
| | | | Leisure Products — 0.6% | | | | |
| | 150,000 | | | Delta 2 Sarl, USD Facility B-3, VAR, 5.068%, 07/30/21 | | | 150,354 | |
| | | | | | | | |
| | |
| | | | Media — 3.8% | | | | |
| | 20,000 | | | Altice US Finance I Corp., Senior Secured Term Loan B, VAR, 3.781%, 01/20/25 | | | 20,208 | |
SEE NOTES TO FINANCIAL STATEMENTS.
17
JPMorgan Flexible Long/Short Fund
SCHEDULE OF PORTFOLIO INVESTMENTS
AS OF FEBRUARY 28, 2017 (continued)
(Amounts in U.S. Dollars, unless otherwise noted)
| | | | | | | | |
PRINCIPAL
AMOUNT | | | SECURITY DESCRIPTION | | VALUE | |
| | |
| | Loan Assignments — continued | | | | |
| | |
| | | | Media — continued | | | | |
| | 100,000 | | | AMC Entertainment Holdings, Inc., VAR, 3.528%, 10/31/23 | | | 101,050 | |
| | 99,499 | | | Charter Communications Operating LLC, 1st Lien Term Loan H, VAR, 2.790%, 01/15/22 | | | 99,872 | |
| | 174,563 | | | CSC Holdings LLC, Term Loan B, VAR, 3.772%, 10/11/24 | | | 176,235 | |
| | 93,049 | | | Entravision Communications Corp., Tranche B Term Loan, VAR, 3.500%, 05/31/20 | | | 93,224 | |
| | 51,760 | | | Gray Television, Inc., 1st Lien Term Loan B, VAR, 3.276%, 02/28/24 | | | 52,148 | |
| | 70,789 | | | Sinclair Broadcast Group, Inc., 1st Lien Term Loan B, VAR, 3.040%, 01/03/24 | | | 70,848 | |
| | 79,010 | | | Tribune Media Co., 1st Lien Term Loan C, VAR, 3.781%, 01/18/24 ^ | | | 79,677 | |
| | 99,463 | | | Univision Communications, Inc., 2013 Incremental Term Loan, VAR, 4.000%, 03/01/20 | | | 99,726 | |
| | 76,805 | | | WMG Acquisition Corp., Term Loan B, VAR, 3.750%, 11/01/23 | | | 76,997 | |
| | 99,750 | | | Zuffa LLC, 1st Lien Guaranteed Senior Secured Term Loan, VAR, 4.250%, 08/18/23 | | | 100,427 | |
| | | | | | | | |
| | | | | | | 970,412 | |
| | | | | | | | |
| | | | Multiline Retail — 0.5% | | | | |
| | 148,125 | | | J.C. Penney Corp., Term Loan B, VAR, 5.304%, 06/23/23 | | | 146,242 | |
| | | | | | | | |
| | |
| | | | Specialty Retail — 1.0% | | | | |
| | 100,000 | | | Bass Pro Group LLC, Senior Secured Term Loan B, VAR, 5.970%, 11/04/23 | | | 95,931 | |
| | 159,200 | | | Harbor Freight Tools USA, Inc., 1st Lien Term Loan, VAR, 3.778%, 08/11/23 | | | 159,291 | |
| | | | | | | | |
| | | | | | | 255,222 | |
| | | | | | | | |
| | | | Textiles, Apparel & Luxury Goods — 0.6% | |
| | 149,625 | | | SAMSONITE IP Holdings, 1st Lien Term Loan B, VAR, 3.031%, 08/01/23 | | | 150,997 | |
| | | | | | | | |
| | | | Total Consumer Discretionary | | | 2,101,243 | |
| | | | | | | | |
| | |
| | | | Consumer Staples — 4.1% | | | | |
| | | | Food & Staples Retailing — 1.1% | | | | |
| | 100,000 | | | Albertson’s LLC, Term Loan B-5, VAR, 4.247%, 12/21/22 | | | 101,364 | |
| | 100,000 | | | Moran Foods LLC, Term Loan B, VAR, 7.000%, 11/29/23 | | | 99,125 | |
| | 77,302 | | | SUPERVALU, Inc., Term Loan B, VAR, 5.500%, 03/21/19 | | | 77,882 | |
| | | | | | | | |
| | | | | | | 278,371 | |
| | | | | | | | |
| | | | | | | | |
PRINCIPAL
AMOUNT | | | SECURITY DESCRIPTION | | VALUE | |
| | |
| | | | Food Products — 1.9% | | | | |
| | 198,918 | | | Dole Food Co., Inc., Tranche B Term Loan, VAR, 4.549%, 11/01/18 | | | 199,515 | |
| | 149,235 | | | Hearthside Group Holdings LLC, 1st Lien Term Loan B, VAR, 4.000%, 06/21/21 | | | 149,981 | |
| | 44,864 | | | JBS USA LLC, Term Loan B, VAR, 3.279%, 10/30/22 | | | 45,107 | |
| | 79,000 | | | Pinnacle Foods Finance LLC, Term Loan B, VAR, 2.780%, 01/27/24 ^ | | | 79,362 | |
| | | | | | | | |
| | | | | | | 473,965 | |
| | | | | | | | |
| | | | Personal Products — 1.1% | | | | |
| | 149,250 | | | NBTY, Inc., Term Loan, VAR, 5.000%, 05/05/23 | | | 150,183 | |
| | 100,000 | | | Prestige Brands, Inc., 1st Lien Term Loan B-4, VAR, 3.531%, 01/24/24 ^ | | | 101,208 | |
| | 29,926 | | | Revlon Consumer Products Corp., Term Loan B, VAR, 4.281%, 09/07/23 | | | 30,087 | |
| | | | | | | | |
| | | | | | | 281,478 | |
| | | | | | | | |
| | | | Total Consumer Staples | | | 1,033,814 | |
| | | | | | | | |
| | |
| | | | Energy — 1.0% | | | | |
| | | | Oil, Gas & Consumable Fuels — 1.0% | | | | |
| | 10,000 | | | California Resources Corp., 1st Lien Second Out Term Loan, VAR, 11.375%, 08/05/21 | | | 11,267 | |
| | 10,000 | | | Chesapeake Energy Corp., 1st Lien Last Out, VAR, 8.553%, 08/23/21 | | | 10,800 | |
| | 199,500 | | | Gulf Finance LLC, 1st Lien Term Loan B, VAR, 6.250%, 07/27/23 | | | 202,409 | |
| | 50,000 | | | MEG Energy Corp., 1st Lien Term B Loan, VAR, 4.540%, 12/31/23(Canada) ^ | | | 50,269 | |
| | 15,684 | | | Western Refining, Inc., 1st Lien Term Loan B, VAR, 5.500%, 06/23/23 | | | 15,743 | |
| | | | | | | | |
| | | | Total Energy | | | 290,488 | |
| | | | | | | | |
| | |
| | | | Financials — 0.7% | | | | |
| | | | Capital Markets — 0.2% | | | | |
| | 45,652 | | | Lightstone Group LLC, Term Loan B, VAR, 6.539%, 12/31/23 | | | 46,299 | |
| | 4,348 | | | Lightstone Group LLC, Term Loan C, VAR, 6.539%, 12/31/23 | | | 4,409 | |
| | | | | | | | |
| | | | | | | 50,708 | |
| | | | | | | | |
| | | | Consumer Finance — 0.5% | | | | |
| | 148,846 | | | Sears Roebuck Acceptance Corp., Term Loan, VAR, 5.500%, 06/30/18 | | | 147,265 | |
| | | | | | | | |
| | | | Total Financials | | | 197,973 | |
| | | | | | | | |
| | |
| | | | Health Care — 4.7% | | | | |
| | | | Health Care Equipment & Supplies — 0.6% | |
| | 149,237 | | | Mallinckrodt International Finance SA, Incremental Term B-1 Loan, VAR, 3.748%, 03/19/21 | | | 149,517 | |
| | | | | | | | |
SEE NOTES TO FINANCIAL STATEMENTS.
18
JPMorgan Flexible Long/Short Fund
SCHEDULE OF PORTFOLIO INVESTMENTS
AS OF FEBRUARY 28, 2017 (continued)
(Amounts in U.S. Dollars, unless otherwise noted)
| | | | | | | | |
PRINCIPAL
AMOUNT | | | SECURITY DESCRIPTION | | VALUE | |
| | |
| | Loan Assignments — continued | | | | |
| |
| | | | Health Care Providers & Services — 2.3% | |
| | 99,249 | | | CHG Healthcare Services, Inc., Term Loan B, VAR, 4.750%, 06/07/23 | | | 100,489 | |
| | 67,506 | | | CHS/Community Health Systems, Inc., Incremental 2021 Term H Loan, VAR, 4.000%, 01/27/21 | | | 66,317 | |
| | 149,223 | | | IASIS Healthcare LLC, Term Loan B, VAR, 4.500%, 05/03/18 | | | 149,160 | |
| | 184,150 | | | MultiPlan, Inc., 1st Lien Term Loan B, VAR, 5.000%, 06/07/23 | | | 186,945 | |
| | 99,489 | | | National Mentor Holdings, Inc., Tranche B Term Loan, VAR, 4.250%, 01/31/21 | | | 99,519 | |
| | | | | | | | |
| | | | | | | 602,430 | |
| | | | | | | | |
| | | | Pharmaceuticals — 1.8% | | | | |
| | 84,573 | | | Concordia Healthcare Corp., Initial Dollar Term Loan, VAR, 5.250%, 10/21/21(Canada) | | | 68,969 | |
| | 149,246 | | | Endo Pharmaceutical, 2015 Incremental Term B Loan, VAR, 3.813%, 09/26/22 | | | 149,833 | |
| | 90,000 | | | Grifols Worldwide Operations Ltd., Term Loan B, VAR, 2.969%, 01/19/25(Spain) ^ | | | 90,295 | |
| | 147,599 | | | Valeant Pharmaceuticals International, Inc., Series F-1 Tranche B Term Loan, VAR, 5.530%, 04/01/22(Canada) | | | 148,521 | |
| | | | | | | | |
| | | | | | | 457,618 | |
| | | | | | | | |
| | | | Total Health Care | | | 1,209,565 | |
| | | | | | | | |
| | | | Industrials — 3.0% | | | | |
| | | | Aerospace & Defense — 0.6% | | | | |
| | 149,250 | | | TransDigm, Inc., Tranche F Term Loan, VAR, 3.781%, 06/09/23 | | | 149,969 | |
| | | | | | | | |
| | | | Commercial Services & Supplies — 2.3% | |
| | 76,731 | | | Camelot Finance LP, 1st Lien Term Loan B, VAR, 4.750%, 10/03/23 | | | 77,578 | |
| | 22,029 | | | Garda World Security Corp., Term B Delayed Draw Loan, VAR, 4.000%, 11/06/20(Canada) | | | 22,112 | |
| | 126,817 | | | Garda World Security Corp., Term B Loan, VAR, 4.000%, 11/06/20(Canada) | | | 127,293 | |
| | 198,990 | | | Pharmaceutical Product Development LLC, 1st Lien Term Loan B, VAR, 4.250%, 08/18/22 | | | 199,985 | |
| | 149,750 | | | Prime Security Services Borrower LLC, Term B-1 Loan, VAR, 4.250%, 05/02/22 ^ | | | 151,123 | |
| | | | | | | | |
| | | | | | | 578,091 | |
| | | | | | | | |
| | | | Machinery — 0.1% | | | | |
| | 20,000 | | | Piscine US Acquisition LLC, 1st Lien Term Loan, VAR, 5.500%, 12/12/23 | | | 20,138 | |
| | | | | | | | |
| | | | Total Industrials | | | 748,198 | |
| | | | | | | | |
| | | | | | | | |
PRINCIPAL
AMOUNT | | | SECURITY DESCRIPTION | | VALUE | |
| | |
| | |
| | | | Information Technology — 4.1% | | | | |
| | | | Internet Software & Services — 0.4% | | | | |
| | 100,000 | | | Genesys Telecommunications Laboratories, Inc., Term Loan B, VAR, 5.025%, 12/01/23 | | | 101,143 | |
| | | | | | | | |
| | |
| | | | IT Services — 0.5% | | | | |
| | 139,943 | | | First Data Corp., Term Loan, VAR, 3.779%, 07/08/22 | | | 140,853 | |
| | | | | | | | |
| |
| | | | Semiconductors & Semiconductor Equipment — 1.2% | |
| | 182,425 | | | Microsemi Corp., Closing Date Term B Loan, VAR, 3.031%, 01/15/23 | | | 183,668 | |
| | 99,750 | | | ON Semiconductor Corp., 1st Lien Term Loan B, VAR, 4.031%, 03/31/23 | | | 100,605 | |
| | 19,950 | | | Versum Materials, Inc., Senior Secured Term Loan B, VAR, 3.498%, 09/22/23 | | | 20,187 | |
| | | | | | | | |
| | | | | | | 304,460 | |
| | | | | | | | |
| | | | Software — 1.3% | | | | |
| | 110,281 | | | Infor US, Inc., Tranche B-6 Term Loan, VAR, 3.750%, 02/01/22 | | | 110,360 | |
| | 80,000 | | | Rackspace Hosting, Inc., 1st Lien Term Loan B, VAR, 4.534%, 11/03/23 | | | 80,850 | |
| | 149,250 | | | SolarWinds, Inc., 1st Lien Term Loan, VAR, 4.500%, 02/03/23 | | | 149,922 | |
| | | | | | | | |
| | | | | | | 341,132 | |
| | | | | | | | |
| | | | Technology Hardware, Storage & Peripherals — 0.7% | |
| | 149,625 | | | Dell Inc. 1st Lien Term Loan B, VAR, 4.040%, 06/02/23 | | | 150,538 | |
| | 24,938 | | | Dell Software Group, Term Loan, VAR, 7.000%, 09/15/22 | | | 25,358 | |
| | | | | | | | |
| | | | | | | 175,896 | |
| | | | | | | | |
| | | | Total Information Technology | | | 1,063,484 | |
| | | | | | | | |
| | |
| | | | Materials — 1.4% | | | | |
| | | | Chemicals — 0.2% | | | | |
| | 49,749 | | | PolyOne Corp., Term B-2 Loan, VAR, 3.030%, 11/11/22 | | | 50,060 | |
| | | | | | | | |
| | |
| | | | Construction Materials — 0.8% | | | | |
| | 99,750 | | | Forterra Finance LLC, 1st Lien Term Loan, VAR, 4.500%, 10/18/23 | | | 100,698 | |
| | 97,801 | | | Headwaters, Inc., Term Loan B, VAR, 4.000%, 03/24/22 | | | 98,070 | |
| | | | | | | | |
| | | | | | | 198,768 | |
| | | | | | | | |
| | | | Containers & Packaging — 0.4% | | | | |
| | 100,000 | | | Berry Plastics Corp., Term Loan L, VAR, 3.022%, 01/06/21 | | | 100,466 | |
| | | | | | | | |
| | | | Total Materials | | | 349,294 | |
| | | | | | | | |
SEE NOTES TO FINANCIAL STATEMENTS.
19
JPMorgan Flexible Long/Short Fund
SCHEDULE OF PORTFOLIO INVESTMENTS
AS OF FEBRUARY 28, 2017 (continued)
(Amounts in U.S. Dollars, unless otherwise noted)
| | | | | | | | |
PRINCIPAL
AMOUNT | | | SECURITY DESCRIPTION | | VALUE | |
| | |
| | Loan Assignments — continued | | | | |
| | |
| | | | Real Estate — 1.2% | | | | |
| | | | Equity Real Estate Investment Trusts (REITs) — 0.8% | |
| | 198,998 | | | MGM Growth Properties, Term Loan B, VAR, 3.281%, 04/25/23 | | | 200,552 | |
| | | | | | | | |
| | | | Real Estate Management & Development — 0.4% | |
| | 100,000 | | | CityCenter Holdings LLC, Term B Loan, VAR, 3.750%, 10/16/20 | | | 101,225 | |
| | | | | | | | |
| | | | Total Real Estate | | | 301,777 | |
| | | | | | | | |
| | | | Telecommunication Services — 1.1% | | | | |
| | | | Diversified Telecommunication Services — 1.1% | |
| | 60,135 | | | Cincinnati Bell, Inc., Term Loan, VAR, 4.000%, 09/10/20 | | | 60,611 | |
| | 150,000 | | | Intelsat Jackson Holdings SA, Tranche B-2 Term Loan, VAR, 3.750%, 06/30/19(Luxembourg) | | | 148,977 | |
| | 50,625 | | | Zayo Group LLC, 1st Lien Term Loan B, VAR, 3.500%, 01/12/24 ^ | | | 51,099 | |
| | 24,375 | | | Zayo Group LLC, Term B-3 Loan, VAR, 3.500%, 01/29/24 ^ | | | 24,603 | |
| | | | | | | | |
| | | | Total Telecommunication Services | | | 285,290 | |
| | | | | | | | |
| | | | Utilities — 2.5% | | | | |
| | | | Electric Utilities — 0.7% | | | | |
| | 162,857 | | | Texas Competitive Electric Holdings Co. LLC, Term Loan, VAR, 3.531%, 08/04/23 | | | 163,590 | |
| | 37,143 | | | Texas Competitive Electric Holdings Co. LLC, Term Loan C, VAR, 3.531%, 08/04/23 | | | 37,310 | |
| | | | | | | | |
| | | | | | | 200,900 | |
| | | | | | | | |
| | | | Independent Power & Renewable Electricity Producers — 1.8% | |
| | 149,242 | | | Calpine Corp., Term Loan, VAR, 3.750%, 05/27/22 | | | 149,933 | |
| | 150,000 | | | Dynegy, Inc., Term Loan, VAR, 4.250%, 01/12/24 | | | 151,490 | |
| | 149,250 | | | NRG Energy, Inc., Term Loan, VAR, 3.031%, 06/30/23 | | | 149,729 | |
| | | | | | | | |
| | | | | | | 451,152 | |
| | | | | | | | |
| | | | Total Utilities | | | 652,052 | |
| | | | | | | | |
| | | | Total Loan Assignments (Cost 8,156,231) | | | 8,233,178 | |
| | | | | | | | |
| | | | | | | | |
| SHARES | | | SECURITY DESCRIPTION | | VALUE | |
| | |
| | Short-Term Investments — 4.1% | | | | |
| | |
| | | | Investment Companies — 4.1% | | | | |
| | 837,776 | | | JPMorgan Prime Money Market Fund, Institutional Class Shares, 0.850% (b) (l) | | | 838,111 | |
| | 217,203 | | | JPMorgan U.S. Government Money Market Fund, Institutional Class Shares, 0.450% (b) (l) | | | 217,203 | |
| | | | | | | | |
| | | | Total Short-Term Investments (Cost $1,055,314) | | | 1,055,314 | |
| | | | | | | | |
| | | | Total Investments — 100.1% (Cost $25,764,908) | | | 25,847,608 | |
| | | | Liabilities in Excess of
Other Assets — (0.1%) | | | (8,441) | |
| | | | | | | | |
| | | | NET ASSETS — 100.0% | | $ | 25,839,167 | |
| | | | | | | | |
Percentages indicated are based on net assets.
SEE NOTES TO FINANCIAL STATEMENTS.
20
JPMorgan Flexible Long/Short Fund
SCHEDULE OF PORTFOLIO INVESTMENTS
AS OF FEBRUARY 28, 2017 (continued)
(Amounts in U.S. Dollars, unless otherwise noted)
| | | | | | | | | | | | | | | | | | |
| Futures Contracts | |
| |
NUMBER OF
CONTRACTS | | DESCRIPTION | | EXPIRATION
DATE | | | TRADING
CURRENCY | | | NOTIONAL
VALUE AT
FEBRUARY 28,
2017 | | | NET
UNREALIZED
APPRECIATION
(DEPRECIATION) | |
| |
| | Short Futures Outstanding | | | | | | | | | | | | | | | | |
| (2) | | Euro-Bobl | | | 03/08/17 | | | | EUR | | | | (285,466) | | | | (3,299) | |
| (2) | | Euro-Bund | | | 03/08/17 | | | | EUR | | | | (351,827) | | | | (8,961) | |
| (1) | | Euro-Schatz | | | 03/08/17 | | | | EUR | | | | (119,331) | | | | (487) | |
| (7) | | 10 Year U.S. Treasury Note | | | 06/21/17 | | | | USD | | | | (872,047) | | | | (2,828) | |
| (1) | | U.S. Treasury Long Bond | | | 06/21/17 | | | | USD | | | | (151,656) | | | | (1,713) | |
| (1) | | Long Gilt | | | 06/28/17 | | | | GBP | | | | (157,873) | | | | (2,635) | |
| (2) | | 2 Year U.S. Treasury Note | | | 06/30/17 | | | | USD | | | | (432,812) | | | | (285) | |
| (5) | | 5 Year U.S. Treasury Note | | | 06/30/17 | | | | USD | | | | (588,516) | | | | (792) | |
| | | | | | | | | | | | | | | | | | |
| | | | | | | | | | | | | | | | | (21,000) | |
| | | | | | | | | | | | | | | | | | |
Forward Foreign Currency Exchange Contracts
| | | | | | | | | | | | | | |
| |
CONTRACTS
TO BUY | | | CURRENCY | | COUNTERPARTY | | SETTLEMENT
DATE | | SETTLEMENT
VALUE | | VALUE AT
FEBRUARY 28, 2017 | | NET
UNREALIZED
APPRECIATION (DEPRECIATION) |
| |
| | 2,451 | | | EUR | | | | | | | | | | |
| | 2,115 | | | for GBP | | Royal Bank of Canada | | 03/03/17 | | 2,624# | | 2,596# | | (28) |
| |
| | 3,896,858 | | | EUR | | Australia and New Zealand Banking Group Limited | | 03/03/17 | | 4,139,164 | | 4,128,476 | | (10,688) |
| | 8,318 | | | EUR | | BNP Paribas | | 03/03/17 | | 8,915 | | 8,812 | | (103) |
| | 12,749 | | | EUR | | Royal Bank of Canada | | 03/03/17 | | 13,619 | | 13,506 | | (113) |
| |
| | 509,078 | | | GBP | | Royal Bank of Canada | | 03/03/17 | | 632,025 | | 631,698 | | (327) |
| |
| | | | | | | | | | 4,796,347 | | 4,785,088 | | (11,259) |
| |
|
| |
CONTRACTS
TO SELL | | | | | COUNTERPARTY | | SETTLEMENT
DATE | | SETTLEMENT
VALUE | | VALUE AT
FEBRUARY 28, 2017 | | NET
UNREALIZED
APPRECIATION
(DEPRECIATION) |
| |
| | 3,884,137 | | | EUR | | Australia and New Zealand Banking Group Limited | | 03/03/17 | | 4,164,995 | | 4,115,000 | | 49,995 |
| | 16,823 | | | EUR | | BNP Paribas | | 03/03/17 | | 17,970 | | 17,823 | | 147 |
| | 8,642 | | | EUR | | Morgan Stanley | | 03/03/17 | | 9,200 | | 9,156 | | 44 |
| | 10,773 | | | EUR | | Royal Bank of Canada | | 03/03/17 | | 11,559 | | 11,413 | | 146 |
| | 3,875,660 | | | EUR | | Australia and New Zealand Banking Group Limited | | 04/05/17 | | 4,123,170 | | 4,112,728 | | 10,442 |
| | 5,706 | | | EUR | | Morgan Stanley | | 04/05/17 | | 6,010 | | 6,055 | | (45) |
| |
| | 500,065 | | | GBP | | Australia and New Zealand Banking Group Limited | | 03/03/17 | | 622,298 | | 620,515 | | 1,783 |
| | 6,897 | | | GBP | | Royal Bank of Canada | | 03/03/17 | | 8,673 | | 8,558 | | 115 |
| | 509,078 | | | GBP | | Royal Bank of Canada | | 04/05/17 | | 632,577 | | 632,271 | | 306 |
| |
| | | | | | | | | | 9,596,452 | | 9,533,519 | | 62,933 |
| |
# For cross-currency exchange contracts, the settlement value is the U.S. Dollar market value at February 28, 2017 of the currency being sold, and the value at February 28, 2017 is the U.S. Dollar market value of the currency being purchased.
SEE NOTES TO FINANCIAL STATEMENTS.
21
JPMorgan Flexible Long/Short Fund
SCHEDULE OF PORTFOLIO INVESTMENTS
AS OF FEBRUARY 28, 2017 (continued)
(Amounts in U.S. Dollars, unless otherwise noted)
Centrally Cleared Credit Default Swaps - Buy Protection[1]
Credit indices:
| | | | | | | | | | | | | | | | | | | | | | | | | | | | |
| |
REFERENCE OBLIGATION | | FUND PAYS
FIXED RATE
(r) | | | TERMINATION DATE | | | IMPLIED CREDIT
SPREAD AS OF FEBRUARY 28,
2017 [2] | | | NOTIONAL
AMOUNT [3] | | | VALUE | | | UPFRONT
PREMIUMS
(PAID)/
RECEIVED [4] | |
| |
iTraxx Europe 26.1 | | | 1.000% quarterly | | | | 12/20/21 | | | | 0.729 | % | | | EUR | | | | 60,000 | | | | (942 | ) | | | 842 | |
iTraxx Europe Senior | | | | | | | | | | | | | | | | | | | | | | | | | | | | |
Financials 26.1 | | | 1.000% quarterly | | | | 12/20/21 | | | | 0.917 | | | | EUR | | | | 305,000 | | | | (1,899 | ) | | | 1,650 | |
| | | | | | | | | | | | | | | | | | | | | | | | |
| | | | | | | | | | | | | | | | | | | | | | | (2,841 | ) | | | 2,492 | |
| | | | | | | | | | | | | | | | | | | | | | | | |
| [1] | The Fund, as a buyer of credit protection, is generally obligated to make periodic payments and may also pay or receive an upfront premium to or from the protection seller, in exchange for the right to receive a contingent payment, upon occurrence of a credit event with respect to an underlying reference obligation, as defined under the terms of individual swap contracts. |
| [2] | Implied credit spreads are an indication of the seller’s performance risk, related to the likelihood of a credit event occurring that would require a seller to make payment to a buyer. Implied credit spreads are used to determine the value of swap contracts and reflect the cost of buying/selling protection, which may include upfront payments made to enter into the contract. Therefore, higher spreads would indicate a greater likelihood that a seller will be obligated to perform (i.e.,make payment) under the swap contract. Increasing values, in absolute terms and relative to notional amounts, are also indicative of greater performance risk. Implied credit spreads for credit default swaps on credit indexes are linked to the weighted average spread across the underlying reference obligations included in a particular index. |
| [3] | The notional amount is the maximum amount that a seller of credit protection would be obligated to pay and a buyer of credit protection would receive, upon occurrence of a credit event. |
| [4] | Upfront premiums generally relate to payments made or received at the initiation of the agreement to compensate the differences between the stated terms of the swap agreement and current market conditions (credit spreads, interest rates and other relevant factors). |
SEE NOTES TO FINANCIAL STATEMENTS.
22
JPMorgan High Yield Opportunities Fund
SCHEDULE OF PORTFOLIO INVESTMENTS
AS OF FEBRUARY 28, 2017
(Amounts in U.S. Dollars, unless otherwise noted)
| | | | | | | | |
PRINCIPAL
AMOUNT($) | | | SECURITY DESCRIPTION | | VALUE($) | |
| | |
| | Convertible Bonds — 1.2% | | | | |
| | |
| | | | Consumer Discretionary — 0.4% | | | | |
| | | | Media — 0.4% | | | | |
| | 100,000 | | | Live Nation Entertainment, Inc., 2.500%, 05/15/19 | | | 106,813 | |
| | |
| | | | Information Technology — 0.8% | | | | |
| | | | Communications Equipment — 0.4% | |
| | 100,000 | | | Finisar Corp., 0.500%, 12/15/36 (e) | | | 105,500 | |
| | | | | | | | |
| |
| | | | Semiconductors & Semiconductor Equipment — 0.4% | |
| | 100,000 | | | ON Semiconductor Corp., 1.000%, 12/01/20 | | | 109,000 | |
| | | | | | | | |
| | | | Total Information Technology | | | 214,500 | |
| | | | | | | | |
| | | | Total Convertible Bonds
(Cost $307,182) | | | 321,313 | |
| | | | | | | | |
| | Corporate Bonds — 89.2% | | | | |
| | |
| | | | Consumer Discretionary — 24.9% | | | | |
| | | | Auto Components — 2.7% | | | | |
| | EUR150,000 | | | Adient Global Holdings Ltd., Reg. S, 3.500%, 08/15/24 | | | 162,708 | |
| | 25,000 | | | Cooper-Standard Automotive, Inc., 5.625%, 11/15/26 (e) | | | 25,313 | |
| | EUR100,000 | | | Gestamp Funding Luxembourg SA, (Spain), Reg. S, 3.500%, 05/15/23 | | | 111,207 | |
| | 100,000 | | | Goodyear Tire & Rubber Co. (The), 5.125%, 11/15/23 | | | 103,800 | |
| | 200,000 | | | IHO Verwaltungs GmbH, (Germany), 4.500%, (cash), 09/15/23 (e) (v) | | | 199,000 | |
| | 100,000 | | | TI Group Automotive Systems LLC, (United Kingdom), 8.750%, 07/15/23 (e) | | | 107,500 | |
| | | | | | | | |
| | | | | | | 709,528 | |
| | | | | | | | |
| | |
| | | | Automobiles — 1.0% | | | | |
| | 250,000 | | | Fiat Chrysler Automobiles NV, (United Kingdom), 5.250%, 04/15/23 | | | 259,062 | |
| | | | | | | | |
| | |
| | | | Diversified Consumer Services — 0.5% | | | | |
| | 100,000 | | | Service Corp. International, 7.500%, 04/01/27 | | | 118,500 | |
| | | | | | | | |
| | |
| | | | Hotels, Restaurants & Leisure — 6.7% | | | | |
| | 105,000 | | | 1011778 BC ULC, (Canada), 6.000%, 04/01/22 (e) | | | 109,494 | |
| | 245,889 | | | Caesars Entertainment Operating Co., Inc., 9.000%, 02/15/20 (d) | | | 276,318 | |
| | EUR100,000 | | | Cirsa Funding Luxembourg SA, (Spain), Reg. S, 5.750%, 05/15/21 | | | 111,767 | |
| | 100,000 | | | ESH Hospitality, Inc., 5.250%, 05/01/25 (e) | | | 100,875 | |
| | 10,000 | | | Hilton Grand Vacations Borrower LLC, 6.125%, 12/01/24 (e) | | | 10,550 | |
| | 200,000 | | | International Game Technology plc, 6.250%, 02/15/22 (e) | | | 216,000 | |
| | 50,000 | | | Interval Acquisition Corp., 5.625%, 04/15/23 | | | 51,625 | |
| | | | | | | | |
PRINCIPAL
AMOUNT($) | | | SECURITY DESCRIPTION | | VALUE($) | |
| | |
| |
| | | | Hotels, Restaurants & Leisure — continued | |
| | 60,000 | | | Jack Ohio Finance LLC, 6.750%, 11/15/21 (e) | | | 62,250 | |
| | 390,000 | | | MGM Resorts International, 4.625%, 09/01/26 | | | 381,225 | |
| | GBP 100,000 | | | Pizzaexpress Financing 2 plc, (United Kingdom), Reg. S, 6.625%, 08/01/21 | | | 127,808 | |
| | 125,000 | | | Sabre GLBL, Inc., 5.375%, 04/15/23 (e) | | | 127,187 | |
| | 60,000 | | | Scientific Games International, Inc., 7.000%, 01/01/22 (e) | | | 63,825 | |
| | 100,000 | | | Wynn Las Vegas LLC, 5.500%, 03/01/25 (e) | | | 101,500 | |
| | | | | | | | |
| | | | | | | 1,740,424 | |
| | | | | | | | |
| | |
| | | | Household Durables — 1.0% | | | | |
| | 5,000 | | | American Greetings Corp., 7.875%, 02/15/25 (e) | | | 5,244 | |
| | 30,000 | | | Apex Tool Group LLC, 7.000%, 02/01/21 (e) | | | 28,800 | |
| | 105,00025 | | | RSI Home Products, Inc., 6.500%, 03/15/23 (e) | | | 109,188 | |
| | 120,000 | | | Tempur Sealy International, Inc., 5.625%, 10/15/23 | | | 121,200 | |
| | | | | | | | |
| | | | | | | 264,432 | |
| | | | | | | | |
| |
| | | | Internet & Direct Marketing Retail — 0.4% | |
| | EUR 100,000 | | | eDreams ODIGEO SA, (Spain), 8.500%, 08/01/21 (e) | | | 113,515 | |
| | | | | | | | |
| | |
| | | | Leisure Products — 0.4% | | | | |
| | 105,000 | | | Vista Outdoor, Inc., 5.875%, 10/01/23 | | | 104,212 | |
| | | | | | | | |
| | |
| | | | Media — 8.9% | | | | |
| | 200,000 | | | Altice Luxembourg SA, (Luxembourg), 7.750%, 05/15/22 (e) | | | 212,750 | |
| | | | Clear Channel Worldwide Holdings, Inc., | | | | |
| | 305,000 | | | Series B, 6.500%, 11/15/22 | | | 315,864 | |
| | 190,000 | | | Series B, 7.625%, 03/15/20 | | | 191,425 | |
| | | | DISH DBS Corp., | | | | |
| | 430,000 | | | 5.875%, 11/15/24 | | | 459,025 | |
| | 20,000 | | | 7.750%, 07/01/26 | | | 23,500 | |
| | 75,000 | | | Quebecor Media, Inc., (Canada), 5.750%, 01/15/23 | | | 79,969 | |
| | 50,000 | | | Regal Entertainment Group, 5.750%, 06/15/23 | | | 52,000 | |
| | EUR 100,000 | | | SES SA, (Luxembourg), Reg. S, VAR, 4.625%, 01/02/22 (x) (y) | | | 110,146 | |
| | 100,000 | | | Sinclair Television Group, Inc., 5.625%, 08/01/24 (e) | | | 102,875 | |
| | 270,000 | | | Sirius XM Radio, Inc., 5.375%, 04/15/25 (e) | | | 276,161 | |
| | 200,000 | | | Unitymedia Hessen GmbH & Co. KG, (Germany), 5.500%, 01/15/23 (e) | | | 209,000 | |
SEE NOTES TO FINANCIAL STATEMENTS.
23
JPMorgan High Yield Opportunities Fund
SCHEDULE OF PORTFOLIO INVESTMENTS
AS OF FEBRUARY 28, 2017 (continued)
(Amounts in U.S. Dollars, unless otherwise noted)
| | | | | | | | |
PRINCIPAL
AMOUNT($) | | | SECURITY DESCRIPTION | | VALUE($) | |
| | |
| | Corporate Bonds — continued | | | | |
| | |
| | | | Media — continued | | | | |
| | 200,000 | | | Videotron Ltd., (Canada), 5.375%, 06/15/24 (e) | | | 213,250 | |
| | 90,000 | | | WMG Acquisition Corp., 5.625%, 04/15/22 (e) | | | 93,600 | |
| | | | | | | | |
| | | | | | | 2,339,565 | |
| | | | | | | | |
| | |
| | | | Multiline Retail — 0.2% | | | | |
| | 80,000 | | | Neiman Marcus Group Ltd. LLC, 8.750%, (cash), 10/15/21 (e) (v) | | | 46,000 | |
| | | | | | | | |
| | |
| | | | Specialty Retail — 2.7% | | | | |
| | EUR 100,000 | | | Groupe Fnac SA, (France), 3.250%, 09/30/23 (e) | | | 107,529 | |
| | 55,000 | | | Hillman Group, Inc. (The), 6.375%, 07/15/22 (e) | | | 52,937 | |
| | EUR 100,000 | | | Kirk Beauty One GmbH, (Germany), Reg. S, 8.750%, 07/15/23 | | | 117,382 | |
| | 150,000 | | | Michaels Stores, Inc., 5.875%, 12/15/20 (e) | | | 154,125 | |
| | 125,000 | | | PetSmart, Inc., 7.125%, 03/15/23 (e) | | | 122,656 | |
| | 150,000 | | | Radio Systems Corp., 8.375%, 11/01/19 (e) | | | 156,188 | |
| | | | | | | | |
| | | | | | | 710,817 | |
| | | | | | | | |
| | | | Textiles, Apparel & Luxury Goods — 0.4% | |
| | EUR 100,000 | | | BiSoho SAS, (France), Reg. S, 5.875%, 05/01/23 | | | 113,091 | |
| | | | | | | | |
| | | | Total Consumer Discretionary | | | 6,519,146 | |
| | | | | | | | |
| | | | Consumer Staples — 3.0% | | | | |
| | | | Food & Staples Retailing — 1.2% | | | | |
| | | | Albertsons Cos. LLC, | | | | |
| | 30,000 | | | 5.750%, 03/15/25 (e) | | | 30,056 | |
| | 30,000 | | | 6.625%, 06/15/24 (e) | | | 31,725 | |
| | EUR 100,000 | | | Dufry Finance SCA, (Switzerland), Reg. S, 4.500%, 08/01/23 | | | 113,780 | |
| | GBP 100,000 | | | Iceland Bondco plc, (United Kingdom), Reg. S, 6.250%, 07/15/21 | | | 129,063 | |
| | | | | | | | |
| | | | | | | 304,624 | |
| | | | | | | | |
| | | | Food Products — 0.8% | | | | |
| | 10,000 | | | AdvancePierre Foods Holdings, Inc., 5.500%, 12/15/24 (e) | | | 10,175 | |
| | GBP 100,000 | | | Boparan Finance plc, (United Kingdom), Reg. S, 5.250%, 07/15/19 | | | 126,293 | |
| | 25,000 | | | Post Holdings, Inc., 5.500%, 03/01/25 (e) | | | 25,500 | |
| | 50,000 | | | TreeHouse Foods, Inc., 6.000%, 02/15/24 (e) | | | 52,625 | |
| | | | | | | | |
| | | | | | | 214,593 | |
| | | | | | | | |
| | | | Household Products — 1.0% | | | | |
| | 100,000 | | | Central Garden & Pet Co., 6.125%, 11/15/23 | | | 106,750 | |
| | 50,000 | | | Energizer Holdings, Inc., 5.500%, 06/15/25 (e) | | | 51,750 | |
| | | | | | | | |
PRINCIPAL
AMOUNT($) | | | SECURITY DESCRIPTION | | VALUE($) | |
| | |
| |
| | | | Household Products — continued | |
| | 100,000 | | | HRG Group, Inc., 7.750%, 01/15/22 | | | 105,750 | |
| | | | | | | | |
| | | | | | | 264,250 | |
| | | | | | | | |
| | | | Total Consumer Staples | | | 783,467 | |
| | | | | | | | |
| | | | Energy — 8.4% | | | | |
| | | | Energy Equipment & Services — 0.1% | |
| | 15,000 | | | Nabors Industries, Inc., 5.500%, 01/15/23 (e) | | | 15,478 | |
| | 10,000 | | | Weatherford International Ltd., 9.875%, 02/15/24 (e) | | | 11,550 | |
| | | | | | | | |
| | | | | | | 27,028 | |
| | | | | | | | |
| | | | Oil, Gas & Consumable Fuels — 8.3% | | | | |
| | 20,000 | | | Alta Mesa Holdings LP, 7.875%, 12/15/24 (e) | | | 21,150 | |
| | 100,000 | | | Antero Midstream Partners LP, 5.375%, 09/15/24 (e) | | | 101,500 | |
| | 55,000 | | | Blue Racer Midstream LLC, 6.125%, 11/15/22 (e) | | | 55,962 | |
| | 35,000 | | | Cheniere Corpus Christi Holdings LLC, 5.875%, 03/31/25 (e) | | | 37,056 | |
| | | | Chesapeake Energy Corp., | | | | |
| | 150,000 | | | 8.000%, 12/15/22 (e) | | | 158,625 | |
| | 45,000 | | | 8.000%, 01/15/25 (e) | | | 44,719 | |
| | | | Concho Resources, Inc., | | | | |
| | 10,000 | | | 5.500%, 10/01/22 | | | 10,350 | |
| | 35,000 | | | 5.500%, 04/01/23 | | | 36,225 | |
| | 100,000 | | | Continental Resources, Inc., 4.500%, 04/15/23 | | | 97,937 | |
| | 100,000 | | | Crestwood Midstream Partners LP, 6.125%, 03/01/22 | | | 103,375 | |
| | 75,000 | | | Denbury Resources, Inc., 5.500%, 05/01/22 | | | 61,875 | |
| | | | EP Energy LLC, | | | | |
| | 35,000 | | | 8.000%, 11/29/24 (e) | | | 37,100 | |
| | 35,000 | | | 8.000%, 02/15/25 (e) | | | 34,125 | |
| | 65,000 | | | Halcon Resources Corp., 6.750%, 02/15/25 (e) | | | 64,350 | |
| | | | MEG Energy Corp., (Canada), | | | | |
| | 25,000 | | | 6.375%, 01/30/23 (e) | | | 22,187 | |
| | 15,000 | | | 6.500%, 01/15/25 (e) | | | 14,663 | |
| | 115,000 | | | 7.000%, 03/31/24 (e) | | | 103,500 | |
| | 125,000 | | | Newfield Exploration Co., 5.750%, 01/30/22 | | | 133,437 | |
| | 125,000 | | | Oasis Petroleum, Inc., 6.875%, 01/15/23 | | | 126,719 | |
| | 15,000 | | | Parsley Energy LLC, 5.250%, 08/15/25 (e) | | | 15,150 | |
| | 100,000 | | | Regency Energy Partners LP, 5.500%, 04/15/23 | | | 103,625 | |
| | 15,000 | | | RSP Permian, Inc., 5.250%, 01/15/25 (e) | | | 15,375 | |
SEE NOTES TO FINANCIAL STATEMENTS.
24
JPMorgan High Yield Opportunities Fund
SCHEDULE OF PORTFOLIO INVESTMENTS
AS OF FEBRUARY 28, 2017 (continued)
(Amounts in U.S. Dollars, unless otherwise noted)
| | | | | | | | |
PRINCIPAL
AMOUNT($) | | | SECURITY DESCRIPTION | | VALUE($) | |
| | |
| | Corporate Bonds — continued | | | | |
| |
| | | | Oil, Gas & Consumable Fuels — continued | |
| | EUR 100,000 | | | Saipem Finance International BV, (Italy), Reg. S, 3.750%, 09/08/23 | | | 111,481 | |
| | 50,000 | | | SM Energy Co., 6.500%, 11/15/21 | | | 51,125 | |
| | 65,000 | | | Southwestern Energy Co., 4.100%, 03/15/22 | | | 57,769 | |
| | 100,000 | | | Targa Resources Partners LP, 4.250%, 11/15/23 | | | 99,250 | |
| | | | Tesoro Logistics LP, | | | | |
| | 20,000 | | | 5.250%, 01/15/25 | | | 21,075 | |
| | 100,000 | | | 5.875%, 10/01/20 | | | 103,075 | |
| | 150,000 | | | Whiting Petroleum Corp., 5.750%, 03/15/21 | | | 149,250 | |
| | 25,000 | | | WildHorse Resource Development Corp., 6.875%, 02/01/25 (e) | | | 24,688 | |
| | 140,000 | | | WPX Energy, Inc., 8.250%, 08/01/23 | | | 157,325 | |
| | | | | | | | |
| | | | | | | 2,174,043 | |
| | | | | | | | |
| | | | Total Energy | | | 2,201,071 | |
| | | | | | | | |
| | | | Financials — 1.2% | | | | |
| | | | Banks — 0.7% | | | | |
| | 150,000 | | | Bank of America Corp., Series K, VAR, 8.000%, 01/30/18 (x) (y) | | | 155,250 | |
| | | | Citigroup, Inc., | | | | |
| | 10,000 | | | Series N, VAR, 5.800%,
11/15/19 (x) (y) | | | 10,375 | |
| | 5,000 | | | Series O, VAR, 5.875%,
03/27/20 (x) (y) | | | 5,163 | |
| | | | | | | | |
| | | | | | | 170,788 | |
| | | | | | | | |
| | | | Consumer Finance — 0.1% | | | | |
| | 25,000 | | | Ally Financial, Inc., 4.250%, 04/15/21 | | | 25,781 | |
| | | | | | | | |
| | | | Diversified Financial Services — 0.4% | | | | |
| | EUR 100,000 | | | Worldpay Finance plc, (United Kingdom), Reg. S, 3.750%, 11/15/22 | | | 114,150 | |
| | | | | | | | |
| | | | Total Financials | | | 310,719 | |
| | | | | | | | |
| | | | Health Care — 10.7% | | | | |
| | | | Health Care Equipment & Supplies — 1.2% | |
| | EUR 100,000 | | | Auris Luxembourg II SA, (Sweden), Reg. S, 8.000%, 01/15/23 | | | 115,077 | |
| | 100,000 | | | DJO Finco, Inc., 8.125%, 06/15/21 (e) | | | 88,500 | |
| | 10,000 | | | Hill-Rom Holdings, Inc., 5.000%, 02/15/25 (e) | | | 10,050 | |
| | 100,000 | | | Mallinckrodt International Finance SA, 5.625%, 10/15/23 (e) | | | 96,000 | |
| | | | | | | | |
| | | | | | | 309,627 | |
| | | | | | | | |
| | | | Health Care Providers & Services — 6.8% | |
| | 80,000 | | | DaVita, Inc., 5.000%, 05/01/25 | | | 80,495 | |
| | | | HCA, Inc., | | | | |
| | 100,000 | | | 5.250%, 04/15/25 | | | 106,750 | |
| | 685,000 | | | 5.375%, 02/01/25 | | | 716,681 | |
| | 100,000 | | | HealthSouth Corp., 5.750%, 11/01/24 | | | 102,000 | |
| | | | | | | | |
PRINCIPAL
AMOUNT($) | | | SECURITY DESCRIPTION | | VALUE($) | |
| | |
| |
| | | | Health Care Providers & Services — continued | |
| | 95,000 | | | inVentiv Group Holdings, Inc., 7.500%, 10/01/24 (e) | | | 99,275 | |
| | 100,000 | | | Kindred Healthcare, Inc., 8.750%, 01/15/23 | | | 97,125 | |
| | EUR 150,000 | | | Synlab Unsecured Bondco plc, (United Kingdom), Reg. S, 8.250%, 07/01/23 | | | 175,035 | |
| | | | Tenet Healthcare Corp., | | | | |
| | 185,000 | | | 6.750%, 06/15/23 | | | 183,381 | |
| | 10,000 | | | 7.500%, 01/01/22 (e) | | | 10,825 | |
| | 200,000 | | | 8.125%, 04/01/22 | | | 210,000 | |
| | | | | | | | |
| | | | | | | 1,781,567 | |
| | | | | | | | |
| | | | Health Care Technology — 0.2% | | | | |
| | 50,000 | | | Quintiles IMS, Inc., 4.875%,
05/15/23 (e) | | | 51,438 | |
| | | | | | | | |
| | | | Pharmaceuticals — 2.5% | | | | |
| | | | Valeant Pharmaceuticals International, Inc., | | | | |
| | 610,000 | | | 5.875%, 05/15/23 (e) | | | 490,669 | |
| | 225,000 | | | 6.125%, 04/15/25 (e) | | | 180,562 | |
| | | | | | | | |
| | | | | | | 671,231 | |
| | | | | | | | |
| | | | Total Health Care | | | 2,813,863 | |
| | | | | | | | |
| | | | Industrials — 8.6% | | | | |
| | | | Aerospace & Defense — 1.6% | | | | |
| | 150,000 | | | Arconic, Inc., 5.900%, 02/01/27 | | | 160,687 | |
| | 70,000 | | | KLX, Inc., 5.875%, 12/01/22 (e) | | | 73,689 | |
| | EUR 90,000 | | | Leonardo SpA, (Italy), 5.250%, 01/21/22 | | | 111,768 | |
| | 60,000 | | | TransDigm, Inc., 6.500%, 05/15/25 | | | 61,425 | |
| | | | | | | | |
| | | | | | | 407,569 | |
| | | | | | | | |
| | | | Air Freight & Logistics — 0.4% | | | | |
| | 100,000 | | | XPO Logistics, Inc., 6.500%, 06/15/22 (e) | | | 105,000 | |
| | | | | | | | |
| | | | Commercial Services & Supplies — 1.4% | |
| | 25,000 | | | ACCO Brands Corp., 5.250%, 12/15/24 (e) | | | 25,312 | |
| | 100,000 | | | Clean Harbors, Inc., 5.250%, 08/01/20 | | | 102,150 | |
| | 100,000 | | | Herc Rentals, Inc., 7.750%,
06/01/24 (e) | | | 110,000 | |
| | EUR 100,000 | | | Verisure Holding AB, (Sweden), Reg. S, 6.000%, 11/01/22 | | | 115,422 | |
| | | | | | | | |
| | | | | | | 352,884 | |
| | | | | | | | |
| | | | Electrical Equipment — 1.2% | | | | |
| | 50,000 | | | General Cable Corp., 5.750%, 10/01/22 | | | 49,000 | |
| | EUR 150,000 | | | NEW Areva Holding SA, (France), 4.875%, 09/23/24 | | | 160,674 | |
| | 100,000 | | | Novelis Corp., 5.875%, 09/30/26 (e) | | | 102,875 | |
| | | | | | | | |
| | | | | | | 312,549 | |
| | | | | | | | |
| | | | Machinery — 1.3% | | | | |
| | EUR 100,000 | | | Galapagos SA, (Luxembourg), Reg. S, 5.375%, 06/15/21 | | | 105,834 | |
| | 50,000 | | | Gates Global LLC, 6.000%,
07/15/22 (e) | | | 50,375 | |
SEE NOTES TO FINANCIAL STATEMENTS.
25
JPMorgan High Yield Opportunities Fund
SCHEDULE OF PORTFOLIO INVESTMENTS
AS OF FEBRUARY 28, 2017 (continued)
(Amounts in U.S. Dollars, unless otherwise noted)
| | | | | | | | |
PRINCIPAL
AMOUNT($) | | | SECURITY DESCRIPTION | | VALUE($) | |
| | |
| | Corporate Bonds — continued | | | | |
| | |
| | | | Machinery — continued | | | | |
| | 100,000 | | | Manitowoc Foodservice, Inc., 9.500%, 02/15/24 | | | 115,625 | |
| | 50,000 | | | SPX FLOW, Inc., 5.625%,
08/15/24 (e) | | | 51,375 | |
| | 25,000 | | | Terex Corp., 5.625%, 02/01/25 (e) | | | 25,656 | |
| | | | | | | | |
| | | | | | | 348,865 | |
| | | | | | | | |
| | | | Road & Rail — 1.7% | | | | |
| | 125,000 | | | Avis Budget Car Rental LLC, 6.375%, 04/01/24 (e) | | | 127,031 | |
| | EUR 100,000 | | | Europcar Groupe SA, (France), Reg. S, 5.750%, 06/15/22 | | | 111,767 | |
| | | | Hertz Corp. (The), | | | | |
| | 125,000 | | | 5.500%, 10/15/24 (e) | | | 112,813 | |
| | 100,000 | | | 6.250%, 10/15/22 | | | 96,125 | |
| | | | | | | | |
| | | | | | | 447,736 | |
| | | | | | | | |
| | | | Trading Companies & Distributors — 0.6% | |
| | 150,000 | | | United Rentals North America, Inc., 5.500%, 07/15/25 | | | 158,250 | |
| | | | | | | | |
| | | | Transportation Infrastructure — 0.4% | |
| | EUR 100,000 | | | Swissport Investments SA, (Luxembourg), Reg. S, 6.750%, 12/15/21 | | | 116,163 | |
| | | | | | | | |
| | | | Total Industrials | | | 2,249,016 | |
| | | | | | | | |
| | | | Information Technology — 5.5% | | | | |
| | | | Communications Equipment — 0.6% | |
| | 150,000 | | | CommScope Technologies Finance LLC, 6.000%, 06/15/25 (e) | | | 160,500 | |
| | | | | | | | |
| | | | Electronic Equipment, Instruments &
Components — 0.4% | |
| | 100,000 | | | Belden, Inc., 5.500%, 09/01/22 (e) | | | 103,125 | |
| | | | | | | | |
| | | | Internet Software & Services — 0.4% | | | | |
| | 100,000 | | | Rackspace Hosting, Inc., 8.625%, 11/15/24 (e) | | | 105,375 | |
| | | | | | | | |
| | | | IT Services — 1.2% | | | | |
| | 305,000 | | | First Data Corp., 5.750%, 01/15/24 (e) | | | 316,056 | |
| | | | | | | | |
| | | | Semiconductors & Semiconductor Equipment — 0.8% | |
| | 100,000 | | | Amkor Technology, Inc., 6.375%, 10/01/22 | | | 103,625 | |
| | 100,000 | | | Micron Technology, Inc., 7.500%, 09/15/23 (e) | | | 111,500 | |
| | | | | | | | |
| | | | | | | 215,125 | |
| | | | | | | | |
| | | | Software — 1.2% | | | | |
| | 100,000 | | | ACI Worldwide, Inc., 6.375%, 08/15/20 (e) | | | 103,200 | |
| | 145,000 | | | Infor US, Inc., 6.500%, 05/15/22 | | | 150,800 | |
| | 70,000 | | | Informatica LLC, 7.125%, 07/15/23 (e) | | | 67,900 | |
| | | | | | | | |
| | | | | | | 321,900 | |
| | | | | | | | |
| | | | | | | | |
PRINCIPAL
AMOUNT($) | | | SECURITY DESCRIPTION | | VALUE($) | |
| | |
| |
| | | | Technology Hardware, Storage & Peripherals — 0.9% | |
| | | | Western Digital Corp., | | | | |
| | 100,000 | | | 7.375%, 04/01/23 (e) | | | 109,370 | |
| | 100,000 | | | 10.500%, 04/01/24 | | | 116,875 | |
| | | | | | | | |
| | | | | | | 226,245 | |
| | | | | | | | |
| | | | Total Information Technology | | | 1,448,326 | |
| | | | | | | | |
| | | | Materials — 7.0% | | | | |
| | | | Chemicals — 3.4% | | | | |
| | 100,000 | | | GCP Applied Technologies, Inc., 9.500%, 02/01/23 (e) | | | 113,480 | |
| | 150,000 | | | Hexion, Inc., 6.625%, 04/15/20 | | | 139,500 | |
| | 100,000 | | | Huntsman International LLC, 5.125%, 11/15/22 | | | 105,000 | |
| | 200,000 | | | INEOS Group Holdings SA, (Luxembourg), 5.625%, 08/01/24 (e) | | | 204,000 | |
| | 100,000 | | | LSB Industries, Inc., SUB, 8.500%, 08/01/19 | | | 97,750 | |
| | EUR 100,000 | | | Monitchem HoldCo 3 SA, (Luxembourg), Reg. S, 5.250%, 06/15/21 | | | 109,913 | |
| | | | Scotts Miracle-Gro Co. (The), | | | | |
| | 15,000 | | | 5.250%, 12/15/26 (e) | | | 15,318 | |
| | 100,000 | | | 6.000%, 10/15/23 | | | 106,562 | |
| | | | | | | | |
| | | | | | | 891,523 | |
| | | | | | | | |
| | | | Containers & Packaging — 3.0% | | | | |
| | | | Ardagh Packaging Finance plc, (Ireland), | | | | |
| | 200,000 | | | 7.250%, 05/15/24 (e) | | | 218,000 | |
| | EUR 200,000 | | | Reg. S, 6.750%, 05/15/24 | | | 234,392 | |
| | 100,000 | | | Reynolds Group Issuer, Inc., (New Zealand), 5.750%, 10/15/20 | | | 103,000 | |
| | EUR 100,000 | | | SIG Combibloc Holdings SCA, (Luxembourg), Reg. S, 7.750%, 02/15/23 | | | 114,151 | |
| | EUR 100,000 | | | Verallia Packaging SASU, (France), Reg. S, 5.125%, 08/01/22 | | | 112,402 | |
| | | | | | | | |
| | | | | | | 781,945 | |
| | | | | | | | |
| | | | Metals & Mining — 0.2% | | | | |
| | | | Freeport-McMoRan, Inc., | | | | |
| | 10,000 | | | 3.875%, 03/15/23 | | | 9,200 | |
| | 35,000 | | | 4.550%, 11/14/24 | | | 32,725 | |
| | | | | | | | |
| | | | | | | 41,925 | |
| | | | | | | | |
| | | | Paper & Forest Products — 0.4% | | | | |
| | EUR 100,000 | | | WEPA Hygieneprodukte GmbH, (Germany), Reg. S, 3.750%, 05/15/24 | | | 111,300 | |
| | | | | | | | |
| | | | Total Materials | | | 1,826,693 | |
| | | | | | | | |
| | | | Real Estate — 1.9% | | | | |
| | | | Equity Real Estate Investment Trusts (REITs) — 1.9% | |
| | | | Communications Sales & Leasing, Inc., | | | | |
| | 100,000 | | | 6.000%, 04/15/23 (e) | | | 105,000 | |
SEE NOTES TO FINANCIAL STATEMENTS.
26
JPMorgan High Yield Opportunities Fund
SCHEDULE OF PORTFOLIO INVESTMENTS
AS OF FEBRUARY 28, 2017 (continued)
(Amounts in U.S. Dollars, unless otherwise noted)
| | | | | | | | |
PRINCIPAL
AMOUNT($) | | | SECURITY DESCRIPTION | | VALUE($) | |
| | |
| | Corporate Bonds — continued | | | | |
| |
| | | | Equity Real Estate Investment Trusts
(REITs) — continued | |
| | 15,000 | | | 7.125%, 12/15/24 (e) | | | 15,450 | |
| | 100,000 | | | 8.250%, 10/15/23 | | | 108,375 | |
| | 75,000 | | | CoreCivic, Inc., 4.625%, 05/01/23 | | | 75,187 | |
| | 85,000 | | | GEO Group, Inc. (The),
5.125%, 04/01/23 | | | 85,213 | |
| | 100,000 | | | MGM Growth Properties Operating Partnership LP, 5.625%,
05/01/24 (e) | | | 105,750 | |
| | | | | | | | |
| | | | Total Real Estate | | | 494,975 | |
| | | | | | | | |
| | | | Telecommunication Services — 15.5% | |
| | | | Diversified Telecommunication Services — 10.8% | |
| | | | CCO Holdings LLC, | | | | |
| | 380,000 | | | 5.750%, 02/15/26 (e) | | | 406,600 | |
| | 220,000 | | | 5.875%, 04/01/24 (e) | | | 235,950 | |
| | 100,000 | | | CenturyLink, Inc., 5.625%, 04/01/25 | | | 97,250 | |
| | 60,000 | | | Cogent Communications Group, Inc., 5.375%, 03/01/22 (e) | | | 62,400 | |
| | EUR 150,000 | | | eircom Finance DAC, (Ireland), Reg. S, 4.500%, 05/31/22 | | | 166,379 | |
| | 100,000 | | | Frontier Communications Corp., 7.125%, 01/15/23 | | | 90,500 | |
| | | | Intelsat Jackson Holdings SA, (Luxembourg), | | | | |
| | 175,000 | | | 5.500%, 08/01/23 | | | 145,031 | |
| | 100,000 | | | 7.250%, 04/01/19 | | | 95,750 | |
| | 100,000 | | | 8.000%, 02/15/24 (e) | | | 108,250 | |
| | 150,000 | | | Level 3 Financing, Inc., 5.375%, 05/01/25 | | | 154,875 | |
| | 200,000 | | | SFR Group SA, (France), 7.375%, 05/01/26 (e) | | | 207,250 | |
| | 245,000 | | | Sprint Capital Corp., 8.750%, 03/15/32 | | | 294,000 | |
| | 200,000 | | | UPCB Finance IV Ltd., (Netherlands), 5.375%, 01/15/25 (e) | | | 204,500 | |
| | 200,000 | | | Wind Acquisition Finance SA, (Italy), 7.375%, 04/23/21 (e) | | | 208,250 | |
| | 270,000 | | | Windstream Services LLC, 6.375%, 08/01/23 | | | 245,025 | |
| | 100,000 | | | Zayo Group LLC, 6.375%, 05/15/25 | | | 107,750 | |
| | | | | | | | |
| | | | | | | 2,829,760 | |
| | | | | | | | |
| | | | Wireless Telecommunication Services — 4.7% | |
| | EUR 150,000 | | | Matterhorn Telecom Holding SA, (Luxembourg), Reg. S, 4.875%, 05/01/23 | | | 164,113 | |
| | 575,000 | | | Sprint Corp., 7.625%, 02/15/25 | | | 641,125 | |
| | 275,000 | | | T-Mobile USA, Inc., 6.500%, 01/15/24 | | | 295,487 | |
| | 125,000 | | | United States Cellular Corp., 6.700%, 12/15/33 | | | 126,036 | |
| | | | | | | | |
| | | | | | | 1,226,761 | |
| | | | | | | | |
| | | | Total Telecommunication Services | | | 4,056,521 | |
| | | | | | | | |
| | | | | | | | |
PRINCIPAL
AMOUNT($) | | | SECURITY DESCRIPTION | | VALUE($) | |
| | |
| | | | Utilities — 2.5% | | | | |
| | | | Electric Utilities — 0.9% | | | | |
| | EUR 100,000 | | | EDP - Energias de Portugal SA, (Portugal), Reg. S, VAR, 5.375%, 09/16/75 | | | 111,898 | |
| | EUR 100,000 | | | Enel SpA, (Italy), Reg. S, VAR, 5.000%, 01/15/75 | | | 113,091 | |
| | | | | | | | |
| | | | | | | 224,989 | |
| | | | | | | | |
| | | | Gas Utilities — 1.0% | | | | |
| | 30,000 | | | AmeriGas Partners LP, 5.500%, 05/20/25 | | | 30,412 | |
| | 190,000 | | | Sabine Pass Liquefaction LLC, 5.750%, | | | | |
| | | | 05/15/24 | | | 210,357 | |
| | 25,000 | | | Summit Midstream Holdings LLC, 5.750%, 04/15/25 | | | 25,375 | |
| | | | | | | | |
| | | | | | | 266,144 | |
| | | | | | | | |
| | | | Independent Power & Renewable Electricity
Producers — 0.6% | |
| | 50,000 | | | AES Corp., 4.875%, 05/15/23 | | | 49,650 | |
| | 125,000 | | | Dynegy, Inc., 5.875%, 06/01/23 | | | 113,125 | |
| | | | | | | | |
| | | | | | | 162,775 | |
| | | | | | | | |
| | | | Total Utilities | | | 653,908 | |
| | | | | | | | |
| | | | Total Corporate Bonds
(Cost $22,790,129) | | | 23,357,705 | |
| | | | | | | | |
| | Loan Assignments — 2.8% | | | | |
| | | | Consumer Discretionary — 1.4% | | | | |
| | | | Leisure Products — 0.4% | | | | |
| | 100,000 | | | Steinway Musical Instruments, Inc., 1st Lien Term Loan, VAR, 4.789%, 09/19/19 | | | 92,917 | |
| | | | | | | | |
| | | | Media — 0.5% | | | | |
| | 150,000 | | | iHeartCommunications, Inc., Term Loan D, VAR, 7.531%, 01/30/19 | | | 130,162 | |
| | | | | | | | |
| | | | Multiline Retail — 0.3% | | | | |
| | 115,000 | | | Neiman Marcus Group, Inc., Other Term Loan, VAR, 4.250%,
10/25/20 ^ | | | 92,536 | |
| | | | | | | | |
| | | | Speciality Retail — 0.2% | | | | |
| | 99,744 | | | J Crew Group, Inc., Initial Loan, VAR, 4.000%, 03/05/21 | | | 56,910 | |
| | | | | | | | |
| | | | Total Consumer Discretionary | | | 372,525 | |
| | | | | | | | |
| | | | Consumer Staples — 0.1% | | | | |
| | | | Food Products — 0.1% | | | | |
| | 15,000 | | | Prestige Brands., 1st Lien Term Loan B-4, VAR, 3.531%, 01/24/24 | | | 15,181 | |
| | | | | | | | |
| | | | Energy — 0.2% | | | | |
| | | | Oil, Gas & Consumable Fuels — 0.2% | |
| | 50,000 | | | Meg Energy Corp., 1st Lien Term B Loan, (Canada), VAR, 4.540%, 12/31/23 ^ | | | 50,269 | |
| | | | | | | | |
SEE NOTES TO FINANCIAL STATEMENTS.
27
JPMorgan High Yield Opportunities Fund
SCHEDULE OF PORTFOLIO INVESTMENTS
AS OF FEBRUARY 28, 2017 (continued)
(Amounts in U.S. Dollars, unless otherwise noted)
| | | | | | | | |
PRINCIPAL
AMOUNT($) | | | SECURITY DESCRIPTION | | VALUE($) | |
| | |
| | Loan Assignments — continued | | | | |
| | | | Health Care — 0.5% | | | | |
| | | | Health Care Equipment & Supplies — 0.4% | |
| | 99,744 | | | Ortho-Clinical Diagnostics, Inc., Initial Term Loan, VAR, 4.750%, 06/30/21 | | | 98,782 | |
| | | | | | | | |
| | | | Pharmaceuticals — 0.1% | | | | |
| | 25,000 | | | Grifols Worldwide Operations Ltd., Term Loan B, (Spain), VAR, 2.969%, 01/19/25 ^ | | | 25,082 | |
| | | | | | | | |
| | | | Total Health Care | | | 123,864 | |
| | | | | | | | |
| | | | Information Technology — 0.6% | | | | |
| | | | Software — 0.6% | | | | |
| | 65,000 | | | Synchronoss Technologies, Inc., 1st Lien Term B Loan, VAR, 4.082%, 01/13/24 ^ | | | 65,163 | |
| | 99,749 | | | Veritas US, Inc., Intial Dollar Term B-1 Loan, VAR, 6.625%, 01/27/23 | | | 99,468 | |
| | | | | | | | |
| | | | Total Information Technology | | | 164,631 | |
| | | | | | | | |
| | | | Materials — 0.0% (g) | | | | |
| | | | Containers & Packaging — 0.0% (g) | | | | |
| | 15,000 | | | Berry Plastics Corp., Term Loan J, VAR, 3.281%, 01/20/24 ^ | | | 15,090 | |
| | | | | | | | |
| | | | Total Loan Assignments
(Cost $735,137) | | | 741,560 | |
| | | | | | | | |
| | |
| SHARES | | | | | | |
| | |
| | Short-Term Investment — 6.2% | | | | |
| | | | Investment Company — 6.2% | | | | |
| | 1,621,378 | | | JPMorgan U.S. Government Money Market Fund, Institutional Class Shares, 0.450% (b) (l)
(Cost $1,621,378) | | | 1,621,378 | |
| | | | | | | | |
| | | | Total Investments — 99.4%
(Cost $25,453,826) | | | 26,041,956 | |
| | | | Other Assets in Excess of
Liabilities — 0.6% | | | 154,028 | |
| | | | | | | | |
| | | | NET ASSETS — 100.0% | | $ | 26,195,984 | |
| | | | | | | | |
Percentages indicated are based on net assets.
SEE NOTES TO FINANCIAL STATEMENTS.
28
JPMorgan High Yield Opportunities Fund
SCHEDULE OF PORTFOLIO INVESTMENTS
AS OF FEBRUARY 28, 2017 (continued)
(Amounts in U.S. Dollars, unless otherwise noted)
Forward Foreign Currency Exchange Contracts
| | | | | | | | | | | | |
|
CONTRACTS
TO SELL | | | | COUNTERPARTY | | SETTLEMENT
DATE | | SETTLEMENT
VALUE | | VALUE AT
FEBRUARY 28, 2017 | | NET
UNREALIZED
APPRECIATION (DEPRECIATION) |
|
| 8,101 | | EUR | | Royal Bank of Canada | | 03/03/17 | | 8,691 | | 8,582 | | 109 |
| 8,424 | | EUR | | Royal Bank of Canada | | 03/03/17 | | 8,975 | | 8,925 | | 50 |
| 3,363,684 | | EUR | | State Street Corp. | | 03/03/17 | | 3,602,662 | | 3,563,612 | | 39,050 |
| 7,328 | | EUR | | Deutsche Bank AG | | 04/05/17 | | 7,720 | | 7,775 | | (55) |
| 310,837 | | GBP | | Australia and New Zealand Banking Group Ltd. | | 03/03/17 | | 387,174 | | 385,709 | | 1,465 |
| 6,185 | | GBP | | Merrill Lynch International | | 03/03/17 | | 7,740 | | 7,675 | | 65 |
|
| | | | | | | | 4,022,962 | | 3,982,278 | | 40,684 |
|
SEE NOTES TO FINANCIAL STATEMENTS.
29
J.P. Morgan Income Funds
NOTES TO SCHEDULE OF PORTFOLIO INVESTMENTS
AS OF FEBRUARY 28, 2017
NOTES TO SCHEDULE OF PORTFOLIO INVESTMENTS:
| | | | | | | | |
| | | | |
| EUR | | | | — | | Euro | | |
| GBP | | — | | British Pound | | |
| MSCI | | — | | Morgan Stanley Capital International | | |
| Reg. S | | — | | Security was purchased pursuant to Regulation S under the Securities Act of 1933, which exempts from registration securities offered and sold outside of the United States. Such a security cannot be sold in the United States without either an effective registration statement filed pursuant to the Securities Act of 1933, or pursuant to an exemption from registration. | | |
| SUB | | — | | Step-Up Bond. The interest rate shown is the rate in effect as of February 28, 2017. | | |
| USD | | — | | United States Dollar | | |
| VAR | | — | | Variable Rate Security. The interest rate shown is the rate in effect as of February 28, 2017. | | |
| | | |
| (b) | | — | | Investment in affiliate. Money market fund registered under the Investment Company Act of 1940, as amended, and advised by J.P. Morgan Investment Management Inc. | | |
| (d) | | — | | Defaulted Security. Security has not paid its last interest payment and/or interest is not being accrued. | | |
| (e) | | — | | Security is exempt from registration under Rule 144A of the Securities Act of 1933, as amended. Unless otherwise indicated, this security has been determined to be liquid under procedures established by the Board of Trustees and may be resold in transactions exempt from registration, normally to qualified institutional buyers. | | |
| (g) | | — | | Amount rounds to less than 0.05%. | | |
| (l) | | — | | The rate shown is the current yield as of February 28, 2017. | | |
| (r) | | — | | Rates shown are per annum and payments are as described. | | |
| (v) | | — | | Security has the ability to pay in kind (“PIK”) or pay income in cash. When applicable, separate rates of such payments are disclosed | | |
| (x) | | — | | Security is perpetual and thus, does not have a predetermined maturity date. The coupon rate for this security is fixed for a period of time and may be structured to adjust thereafter. The date shown, if applicable, reflects the next call date. The coupon rate shown is the rate in effect as of February 28, 2017. | | |
| (y) | | — | | Preferred Security. | | |
| ^ | | — | | All or a portion of the security is unsettled as of February 28, 2017. Unless otherwise indicated, the coupon rate is undetermined. The coupon rate shown may not be accrued for the entire position. | | |
30
STATEMENTS OF ASSETS AND LIABILITIES
AS OF FEBRUARY 28, 2017
| | | | | | | | | | | | |
| | | Flexible Long/Short
Fund | | | High Yield
Opportunities Fund | | | | |
| |
ASSETS: | | | | | | | | | | | | |
Investments in non-affiliates, at value | | $ | 24,792,294 | | | $ | 24,420,578 | | | | | |
Investments in affiliates, at value | | | 1,055,314 | | | | 1,621,378 | | | | | |
| | | | |
Total investment securities, at value | | | 25,847,608 | | | | 26,041,956 | | | | | |
Cash | | | 192,413 | | | | 911 | | | | | |
Foreign currency, at value | | | 9,605 | | | | 21,618 | | | | | |
Deposits at broker for futures contracts | | | 36,000 | | | | — | | | | | |
Deposits at broker for swap contracts | | | 6,140 | | | | — | | | | | |
Receivables: | | | | | | | | | | | | |
Investment securities sold | | | 65,763 | | | | — | | | | | |
Interest from non-affiliates | | | 247,742 | | | | 359,216 | | | | | |
Dividends from affiliates | | | 590 | | | | 574 | | | | | |
Tax reclaims | | | 117 | | | | — | | | | | |
Variation margin on futures contracts | | | 706 | | | | — | | | | | |
Unrealized appreciation on forward foreign currency exchange contracts | | | 62,978 | | | | 40,739 | | | | | |
Due from Adviser | | | 16,561 | | | | 21,859 | | | | | |
Deferred offering costs | | | 24,959 | | | | 28,283 | | | | | |
| | | | |
Total Assets | | | 26,511,182 | | | | 26,515,156 | | | | | |
| | | | |
| | | |
LIABILITIES: | | | | | | | | | | | | |
Payables: | | | | | | | | | | | | |
Investment securities purchased | | | 578,758 | | | | 245,950 | | | | | |
Unrealized depreciation on forward foreign currency exchange contracts | | | 11,304 | | | | 55 | | | | | |
Variation margin on centrally cleared swaps | | | 559 | | | | — | | | | | |
Accrued liabilities: | | | | | | | | | | | | |
Distribution fees | | | 16 | | | | 16 | | | | | |
Shareholder servicing fees | | | 4,921 | | | | 3,978 | | | | | |
Custodian and accounting fees | | | 5,885 | | | | 4,002 | | | | | |
Collateral management fees | | | 1,351 | | | | — | | | | | |
Audit fees | | | 66,587 | | | | 62,229 | | | | | |
Other | | | 2,634 | | | | 2,942 | | | | | |
| | | | |
Total Liabilities | | | 672,015 | | | | 319,172 | | | | | |
| | | | |
Net Assets | | $ | 25,839,167 | | | $ | 26,195,984 | | | | | |
| | | | |
SEE NOTES TO FINANCIAL STATEMENTS.
31
STATEMENTS OF ASSETS AND LIABILITIES
AS OF FEBRUARY 28, 2017 (continued)
| | | | | | | | | | | | |
| | | Flexible Long/Short
Fund | | | High Yield
Opportunities Fund | | | | |
| |
NET ASSETS: | | | | | | | | | | | | |
Paid-in-Capital | | $ | 25,689,118 | | | $ | 25,376,915 | | | | | |
Accumulated undistributed (distributions in excess of) net investment income | | | 95,601 | | | | (13,628) | | | | | |
Accumulated net realized gains (losses) | | | (57,983) | | | | 204,370 | | | | | |
Net unrealized appreciation (depreciation) | | | 112,431 | | | | 628,327 | | | | | |
| | | | |
Total Net Assets | | $ | 25,839,167 | | | $ | 26,195,984 | | | | | |
| | | | |
| | | |
Net Assets: | | | | | | | | | | | | |
Class A | | $ | 20,638 | | | $ | 20,944 | | | | | |
Class C | | | 20,568 | | | | 20,906 | | | | | |
Class R6 | | | 20,705 | | | | 20,970 | | | | | |
Class I (formerly Select Class) | | | 25,777,256 | | | | 26,133,164 | | | | | |
| | | | |
Total | | $ | 25,839,167 | | | $ | 26,195,984 | | | | | |
| | | | |
| | | |
Outstanding units of beneficial interest (shares) | | | | | | | | | | | | |
($0.0001 par value; unlimited number of shares authorized): | | | | | | | | | | | | |
Class A | | | 2,051 | | | | 2,028 | | | | | |
Class C | | | 2,045 | | | | 2,025 | | | | | |
Class R6 | | | 2,058 | | | | 2,031 | | | | | |
Class I (formerly Select Class) | | | 2,562,653 | | | | 2,530,984 | | | | | |
| | | |
Net Asset Value (a): | | | | | | | | | | | | |
Class A - Redemption price per share | | $ | 10.06 | | | $ | 10.33 | | | | | |
Class C - Offering price per share (b) | | | 10.06 | | | | 10.33 | | | | | |
Class R6 - Offering and redemption price per share | | | 10.06 | | | | 10.33 | | | | | |
Class I (formerly Select Class) - Offering and redemption price per share | | | 10.06 | | | | 10.33 | | | | | |
Class A maximum sales charge | | | 3.75 | % | | | 3.75 | % | | | | |
Class A maximum public offering price per share | | | | | | | | | | | | |
[net asset value per share/(100% – maximum sales charge)] | | $ | 10.45 | | | $ | 10.73 | | | | | |
| | | | |
| | | |
Cost of investments in non-affiliates | | $ | 24,709,594 | | | $ | 23,832,448 | | | | | |
Cost of investments in affiliates | | | 1,055,314 | | | | 1,621,378 | | | | | |
Cost of foreign currency | | | 9,585 | | | | 21,749 | | | | | |
Premiums received on swaps | | | 2,492 | | | | — | | | | | |
(a) Per share amounts may not recalculate due to rounding of net assets and/or shares outstanding.
(b) Redemption price for Class C Shares varies based upon length of time the shares are held.
SEE NOTES TO FINANCIAL STATEMENTS.
32
STATEMENTS OF OPERATIONS
FOR THE PERIOD ENDED FEBRUARY 28, 2017
| | | | | | | | | | | | |
| | | Flexible
Long/Short
Fund (a) | | | High Yield
Opportunities
Fund (b) | | | | |
| |
INVESTMENT INCOME: | | | | | | | | | | | | |
Interest income from non-affiliates | | $ | 709,865 | | | $ | 443,737 | | | | | |
Dividend income from affiliates | | | 7,022 | | | | 4,023 | | | | | |
Foreign taxes withheld | | | (616 | ) | | | (420 | ) | | | | |
| | | | |
Total investment income | | | 716,271 | | | | 447,340 | | | | | |
| | | | |
| | | |
EXPENSES: | | | | | | | | | | | | |
Investment advisory fees | | | 84,228 | | | | 49,718 | | | | | |
Administration fees | | | 13,790 | | | | 6,784 | | | | | |
Distribution fees: | | | | | | | | | | | | |
Class A | | | 34 | | | | 17 | | | | | |
Class C | | | 101 | | | | 50 | | | | | |
Shareholder servicing fees: | | | 42,081 | | | | 20,699 | | | | | |
Class A | | | 34 | | | | 17 | | | | | |
Class C | | | 34 | | | | 17 | | | | | |
Class I (formerly Select Class) | | | 42,013 | | | | 20,666 | | | | | |
Custodian and accounting fees | | | 22,666 | | | | 7,402 | | | | | |
Collateral management fees | | | 3,378 | | | | — | | | | | |
Interest expense to affiliates | | | 145 | | | | 141 | | | | | |
Professional fees | | | 117,630 | | | | 117,437 | | | | | |
Trustees’ and Chief Compliance Officer’s fees | | | 14,619 | | | | 6,373 | | | | | |
Printing and mailing costs | | | 3,032 | | | | 2,444 | | | | | |
Registration and filing fees | | | 962 | | | | 452 | | | | | |
Transfer agency fees (See Note 2.I.) | | | 465 | | | | 249 | | | | | |
Offering costs | | | 49,715 | | | | 13,681 | | | | | |
Other | | | 3,676 | | | | 5,012 | | | | | |
| | | | |
Total expenses | | | 356,522 | | | | 230,460 | | | | | |
| | | | |
Less fees waived | | | (101,553 | ) | | | (61,430 | ) | | | | |
Less expense reimbursements | | | (106,481 | ) | | | (104,314 | ) | | | | |
| | | | |
Net expenses | | | 148,488 | | | | 64,716 | | | | | |
| | | | |
Net investment income (loss) | | | 567,783 | | | | 382,624 | | | | | |
| | | | |
| | | |
REALIZED/UNREALIZED GAINS (LOSSES): | | | | | | | | | | | | |
Net realized gain (loss) on transactions from: | | | | | | | | | | | | |
Investments in non-affiliates | | | (46,290 | ) | | | 62,210 | | | | | |
Futures | | | 25,857 | | | | — | | | | | |
Foreign currency transactions | | | 195,105 | | | | 122,823 | | | | | |
Swaps | | | (15,719 | ) | | | — | | | | | |
| | | | |
Net realized gain (loss) | | | 158,953 | | | | 185,033 | | | | | |
| | | | |
Change in net unrealized appreciation/depreciation on: | | | | | | | | | | | | |
Investments in non-affiliates | | | 82,700 | | | | 588,130 | | | | | |
Futures | | | (21,000 | ) | | | — | | | | | |
Foreign currency translations | | | 51,080 | | | | 40,197 | | | | | |
Swaps | | | (349 | ) | | | — | | | | | |
| | | | |
Change in net unrealized appreciation/depreciation | | | 112,431 | | | | 628,327 | | | | | |
| | | | |
Net realized/unrealized gains (losses) | | | 271,384 | | | | 813,360 | | | | | |
| | | | |
Change in net assets resulting from operations | | $ | 839,167 | | | $ | 1,195,984 | | | | | |
| | | | |
(a) Commencement of operations was June 30, 2016.
(b) Commencement of operations was November 1, 2016.
SEE NOTES TO FINANCIAL STATEMENTS.
33
STATEMENTS OF CHANGES IN NET ASSETS
FOR THE PERIODS INDICATED
| | | | | | | | |
| | | | | | High Yield Opportunities | |
| | | Flexible Long/Short Fund | | | Fund | |
| | | | |
| | | Period Ended February | | | Period Ended February | |
| | | 28, 2017 (a) | | | 28, 2017 (b) | |
| |
CHANGE IN NET ASSETS RESULTING FROM OPERATIONS: | | | | | | | | |
Net investment income (loss) | | $ | 567,783 | | | $ | 382,624 | |
Net realized gain (loss) | | | 158,953 | | | | 185,033 | |
Change in net unrealized appreciation/depreciation | | | 112,431 | | | | 628,327 | |
| | | | |
Change in net assets resulting from operations | | | 839,167 | | | | 1,195,984 | |
| | | | |
| | |
DISTRIBUTIONS TO SHAREHOLDERS: | | | | | | | | |
Class A | | | | | | | | |
From net investment income | | | (486) | | | | (287) | |
From net realized gains | | | (29) | | | | — | |
Class C | | | | | | | | |
From net investment income | | | (416) | | | | (251) | |
From net realized gains | | | (29) | | | | — | |
Class R6 | | | | | | | | |
From net investment income | | | (555) | | | | (314) | |
From net realized gains | | | (29) | | | | — | |
Class I (formerly Select Class) | | | | | | | | |
From net investment income | | | (651,711) | | | | (376,112) | |
From net realized gains | | | (35,914) | | | | — | |
| | | | |
Total distributions to shareholders | | | (689,169) | | | | (376,964) | |
| | | | |
| | |
CAPITAL TRANSACTIONS: | | | | | | | | |
Change in net assets resulting from capital transactions | | | 25,689,169 | | | | 25,376,964 | |
| | | | |
| | |
NET ASSETS: | | | | | | | | |
Change in net assets | | | 25,839,167 | | | | 26,195,984 | |
Beginning of period | | | — | | | | — | |
| | | | |
End of period | | $ | 25,839,167 | | | $ | 26,195,984 | |
| | | | |
Accumulated undistributed (distributed in excess of) net investment income | | $ | 95,601 | | | $ | (13,628) | |
| | | | |
(a) Commencement of operations was June 30, 2016.
(b) Commencement of operations was November 1, 2016.
SEE NOTES TO FINANCIAL STATEMENTS.
34
STATEMENTS OF CHANGES IN NET ASSETS (continued)
FOR THE PERIODS INDICATED
| | | | | | | | | | | | |
| | | Flexible Long/Short | | | High Yield | |
| | | Fund | | | Opportunities Fund | |
| | | | |
| | | Period Ended February | | | Period Ended February | |
| | | 28, 2017 (a) | | | 28, 2017 (b) | |
| |
CAPITAL TRANSACTIONS: | | | | | | | | | | | | |
Class A | | | | | | | | | | | | |
Proceeds from shares issued | | $ | 20,000 | | | $ | 20,000 | | | | | |
Distributions reinvested | | | 515 | | | | 287 | | | | | |
| | | | |
Change in net assets resulting from Class A capital transactions | | $ | 20,515 | | | $ | 20,287 | | | | | |
| | | | |
Class C | | | | | | | | | | | | |
Proceeds from shares issued | | $ | 20,000 | | | $ | 20,000 | | | | | |
Distributions reinvested | | | 445 | | | | 251 | | | | | |
| | | | |
Change in net assets resulting from Class C capital transactions | | $ | 20,445 | | | $ | 20,251 | | | | | |
| | | | |
Class R6 | | | | | | | | | | | | |
Proceeds from shares issued | | $ | 20,000 | | | $ | 20,000 | | | | | |
Distributions reinvested | | | 584 | | | | 314 | | | | | |
| | | | |
Change in net assets resulting from Class R6 capital transactions | | $ | 20,584 | | | $ | 20,314 | | | | | |
| | | | |
Class I (formerly Select Class) | | | | | | | | | | | | |
Proceeds from shares issued | | $ | 25,540,000 | | | $ | 26,296,525 | | | | | |
Distributions reinvested | | | 687,625 | | | | 376,112 | | | | | |
Cost of shares redeemed | | | (600,000 | ) | | | (1,356,525 | ) | | | | |
| | | | |
Change in net assets resulting from Class I capital transactions | | $ | 25,627,625 | | | $ | 25,316,112 | | | | | |
| | | | |
Total change in net assets resulting from capital transactions | | $ | 25,689,169 | | | $ | 25,376,964 | | | | | |
| | | | |
| | | |
SHARE TRANSACTIONS: | | | | | | | | | | | | |
Class A | | | | | | | | | | | | |
Issued | | | 2,000 | | | | 2,000 | | | | | |
Reinvested | | | 51 | | | | 28 | | | | | |
| | | | |
Change in Class A Shares | | | 2,051 | | | | 2,028 | | | | | |
| | | | |
Class C | | | | | | | | | | | | |
Issued | | | 2,000 | | | | 2,000 | | | | | |
Reinvested | | | 45 | | | | 25 | | | | | |
| | | | |
Change in Class C Shares | | | 2,045 | | | | 2,025 | | | | | |
| | | | |
Class R6 | | | | | | | | | | | | |
Issued | | | 2,000 | | | | 2,000 | | | | | |
Reinvested | | | 58 | | | | 31 | | | | | |
| | | | |
Change in Class R6 Shares | | | 2,058 | | | | 2,031 | | | | | |
| | | | |
Class I (formerly Select Class) | | | | | | | | | | | | |
Issued | | | 2,554,060 | | | | 2,626,993 | | | | | |
Reinvested | | | 68,653 | | | | 36,984 | | | | | |
Redeemed | | | (60,060 | ) | | | (132,993 | ) | | | | |
| | | | |
Change in Class I Shares | | | 2,562,653 | | | | 2,530,984 | | | | | |
| | | | |
(a) Commencement of operations was June 30, 2016.
(b) Commencement of operations was November 1, 2016.
SEE NOTES TO FINANCIAL STATEMENTS.
35
FINANCIAL HIGHLIGHTS
FOR THE PERIODS INDICATED
| | | | | | | | | | | | | | | | | | | | | | | | | | | | | | | | | | | | | | | | | | | | | | | | | | | | | | | | |
| | | | | | | | | Per share operating performance | | | | | | | | | | | | | | | Ratios/Supplemental data | | | | |
| | | | |
| | | | | | Investment operations | | | Distributions | | | | | | | | | | | | Ratios to average net assets (a) | | | | |
| | | Net asset
value,
beginning
of period | | | Net
investment
income
(loss) (b) | | | Net realized and
unrealized
gains (losses)
on investments | | | Total from
investment
operations | | | Net
investment
income | | | Net
realized
gain | | | Total
distributions | | | Net asset value,
end of period | | | Total return
(excludes sales
charge) (c) (d) | | | Net assets, end
of period | | | Net expenses
(e) (f) | | | Net investment income (loss) (f) | | | Expenses without
waivers,
reimbursements
and earnings
credits (f) | | | Portfolio
turnover
rate (c) (g) | |
| | | | |
Flexible Long/Short Fund | | | | | | | | | | | | | | | | | | | | | | | | | | | | | | | | | | | | | | | | | | | | | | | | | | | | | | | | |
Class A | | | | | | | | | | | | | | | | | | | | | | | | | | | | | | | | | | | | | | | | | | | | | | | | | | | | | | | | |
June 30, 2016 (h) through February 28, 2017 | | | $10.00 | | | | $0.21 | | | | $0.10 | | | | $0.31 | | | | $(0.24 | ) | | | $(0.01 | ) | | | $(0.25 | ) | | | $10.06 | | | | 3.18% | | | | $20,638 | | | | 1.13% | | | | 3.11% | | | | 3.13% | | | | 30% | |
Class C | | | | | | | | | | | | | | | | | | | | | | | | | | | | | | | | | | | | | | | | | | | | | | | | | | | | | | | | |
June 30, 2016 (h) through February 28, 2017 | | | 10.00 | | | | 0.17 | | | | 0.11 | | | | 0.28 | | | | (0.21 | ) | | | (0.01 | ) | | | (0.22 | ) | | | 10.06 | | | | 2.84 | | | | 20,568 | | | | 1.63 | | | | 2.61 | | | | 3.61 | | | | 30 | |
Class R6 | | | | | | | | | | | | | | | | | | | | | | | | | | | | | | | | | | | | | | | | | | | | | | | | | | | | | | | | |
June 30, 2016 (h) through February 28, 2017 | | | 10.00 | | | | 0.24 | | | | 0.10 | | | | 0.34 | | | | (0.27 | ) | | | (0.01 | ) | | | (0.28 | ) | | | 10.06 | | | | 3.53 | | | | 20,705 | | | | 0.63 | | | | 3.61 | | | | 2.61 | | | | 30 | |
Class I (formerly Select Class) | | | | | | | | | | | | | | | | | | | | | | | | | | | | | | | | | | | | | | | | | | | | | | | | | | | | | | | | |
June 30, 2016 (h) through February 28, 2017 | | | 10.00 | | | | 0.22 | | | | 0.11 | | | | 0.33 | | | | (0.26 | ) | | | (0.01 | ) | | | (0.27 | ) | | | 10.06 | | | | 3.37 | | | | 25,777,256 | | | | 0.88 | | | | 3.36 | | | | 2.01 | | | | 30 | |
| (a) | Annualized for periods less than one year, unless otherwise noted. |
| (b) | Calculated based upon average shares outstanding. |
| (c) | Not annualized for periods less than one year. |
| (d) | Includes adjustments in accordance with accounting principles generally accepted in the United States of America and as such, the net asset values for financial reporting purposes and the returns based upon those net asset values may differ from the net asset values and returns for shareholder transactions. |
| (e) | Includes earnings credits and interest expense, if applicable, each of which is less than 0.005% unless otherwise noted. |
| (f) | Certain non-recurring expenses incurred by the Fund were not annualized for the period ended February 28, 2017. |
| (g) | Portfolio turnover is calculated by dividing the lesser of total purchases or sales portfolio securities for the reporting period by the monthly average value of portfolio securities owned during the reporting period. Excluded from both the numerator and denominator are amounts relating to derivatives and securities whose maturities or expiration dates at the time of acquisition were one year or less. |
| (h) | Commencement of operations. |
SEE NOTES TO FINANCIAL STATEMENTS.
36
FINANCIAL HIGHLIGHTS
FOR THE PERIODS INDICATED
| | | | | | | | | | | | | | | | | | | | | | | | | | | | | | | | | | | | | | | | | | | | | | | | |
| | | | | | Per share operating performance | | | | | | | | | | | | Ratios/Supplemental data | |
| | | | |
| | | | | | Investment operations | | | Distributions | | | | | | | | | | | | Ratios to average net assets (a) | | | | |
| | | Net asset value, beginning of period | | | Net investment income (loss) (b) | | | Net realized and unrealized gains (losses) on investments | | | Total from investment operations | | | Net investment income | | | Net asset value, end
of period | | | Total return
(excludes sales charge) (c)(d) | | | Net assets,
end of period | | | Net
expenses (e) (f) | | | Net investment income
(loss) (f) | | | Expenses without waivers and reimbursements (f) | | | Portfolio turnover rate (c)(g) | |
| | | | | | | | |
High Yield Opportunities Fund | | | | | | | | | | | | | | | | | | | | | | | | | | | | | | | | | | | | | | | | | | | | | | | | |
Class A | | | | | | | | | | | | | | | | | | | | | | | | | | | | | | | | | | | | | | | | | | | | | | | | |
November 1, 2016 (h) through February 28, 2017 | | | $10.00 | | | | $0.15 | | | | $0.32 | | | | $0.47 | | | | $(0.14) | | | | $10.33 | | | | 4.76% | | | | $20,944 | | | | 0.97% | | | | 4.41% | | | | 3.73% | | | | 6% | |
Class C | | | | | | | | | | | | | | | | | | | | | | | | | | | | | | | | | | | | | | | | | | | | | | | | |
November 1, 2016 (h) through February 28, 2017 | | | 10.00 | | | | 0.13 | | | | 0.32 | | | | 0.45 | | | | (0.12 | ) | | | 10.33 | | | | 4.57 | | | | 20,906 | | | | 1.53 | | | | 3.87 | | | | 4.25 | | | | 6 | |
Class R6 | | | | | | | | | | | | | | | | | | | | | | | | | | | | | | | | | | | | | | | | | | | | | | | | |
November 1, 2016 (h) through February 28, 2017 | | | 10.00 | | | | 0.16 | | | | 0.33 | | | | 0.49 | | | | (0.16 | ) | | | 10.33 | | | | 4.90 | | | | 20,970 | | | | 0.58 | | | | 4.82 | | | | 3.24 | | | | 6 | |
Class I (formerly Select Class) | | | | | | | | | | | | | | | | | | | | | | | | | | | | | | | | | | | | | | | | | | | | | | | | |
November 1, 2016 (h) through February 28, 2017 | | | 10.00 | | | | 0.15 | | | | 0.33 | | | | 0.48 | | | | (0.15 | ) | | | 10.33 | | | | 4.83 | | | | 26,133,164 | | | | 0.78 | | | | 4.61 | | | | 2.67 | | | | 6 | |
| (a) | Annualized for periods less than one year, unless otherwise noted. | |
| (b) | Calculated based upon average shares outstanding. | |
| (c) | Not annualized for periods less than one year. | |
| (d) | Includes adjustments in accordance with accounting principles generally accepted in the United States of America and as such, the net asset values for financial reporting purposes and the returns based upon those net asset values may differ from the net asset values and returns for shareholder transactions. | |
| (e) | Includes interest expense, if applicable, which is less than 0.005% unless otherwise noted. | |
| (f) | Certain non-recurring expenses incurred by the Fund were not annualized for the period ended February��28, 2017. | |
| (g) | Portfolio turnover is calculated by dividing the lesser of total purchases or sales of portfolio securities for the reporting period by the monthly average value of portfolio securities owned during the reporting period. Excluded from both the numerator and denominator are amounts relating to derivatives and securities whose maturities or expiration dates at the time of acquisition were one year or less. | |
| (h) | Commencement of operations. | |
SEE NOTES TO FINANCIAL STATEMENTS.
37
NOTES TO FINANCIAL STATEMENTS
AS OF FEBRUARY 28, 2017
1. Organization
JPMorgan Trust IV (the “Trust”) was formed on November 11, 2015, as a Delaware statutory trust, pursuant to a Declaration of Trust dated November 11, 2015 and is registered under the Investment Company Act of 1940, as amended (the “1940 Act”), as an open-end management investment company.
The following are 2 separate funds of the Trust (collectively, the “Funds”) covered by this report:
| | | | |
| | | Classes Offered | | Diversified/Non-Diversified |
Flexible Long/Short Fund | | Class A, Class C, Class R6 and Class I^ | | Diversified |
High Yield Opportunities Fund | | Class A, Class C, Class R6 and Class I^ | | Diversified |
^Effective April 3, 2017, Select Class was renamed Class I.
The investment objective of the Flexible Long/Short Fund is to seek to provide total return.
The investment objective of the High Yield Opportunities Fund is to seek a high level of current income. Capital appreciation is a secondary objective.
The Flexible Long/Short Fund and High Yield Opportunities Fund commenced operations on June 30, 2016 and November 1, 2016, respectively. Currently, the Funds are not publicly offered for investment.
Class A Shares generally provide for a front-end sales charge while Class C Shares provide for a contingent deferred sales charge (“CDSC”). No sales charges are assessed with respect to Class R6 and Class I Shares. All classes of shares have equal rights as to earnings, assets and voting privileges, except that each class may bear different transfer agency, sub-transfer agency distribution and shareholder servicing fees and each class has exclusive voting rights with respect to its distribution plan and shareholder servicing agreements. Certain Class A Shares, for which front-end sales charges have been waived, may be subject to a CDSC as described in the Funds’ prospectus.
J.P. Morgan Investment Management Inc. (“JPMIM”) an indirect, wholly-owned subsidiary of JPMorgan Chase & Co. (“JPMorgan”) acts as Adviser (the “Adviser”) and Administrator (the “Administrator”) to the Funds.
2. Significant Accounting Policies
The following is a summary of significant accounting policies followed by the Funds in the preparation of their financial statements. The Funds are investment companies and, accordingly, follow the investment company accounting and reporting guidance of the Financial Accounting Standards Board Accounting Standards Codification Topic 946 - Investment Companies, which is part of U.S. generally accepted accounting principles (“GAAP”). The preparation of financial statements in conformity with GAAP requires management to make estimates and assumptions that affect the reported amounts of assets and liabilities and disclosure of contingent assets and liabilities at the date of the financial statements and the reported amounts of increases and decreases in net assets from operations during the reporting period. Actual results could differ from those estimates.
A. Valuation of Investments — The valuation of investments is in accordance with GAAP and the Funds’ valuation policies set forth by and under the supervision and responsibility of the Board of Trustees (the “Board”), which established the following approach to valuation, as described more fully below: (i) investments for which market quotations are readily available shall be valued at such unadjusted quoted prices and (ii) all other investments for which market quotations are not readily available shall be valued at their fair value as determined in good faith by the Board.
The Administrator has established the J.P. Morgan Asset Management Americas Valuation Committee (“AVC”) to assist the Board with the oversight and monitoring of the valuation of the Funds’ investments. The Administrator implements the valuation policies of the Funds’ investments, as directed by the Board. The AVC oversees and carries out the policies for the valuation of investments held in the Funds. This includes monitoring the appropriateness of fair values based on results of ongoing valuation oversight, including but not limited to consideration of macro or security specific events, market events and pricing vendor and broker due diligence. The Administrator is responsible for discussing and assessing the potential impacts to the fair values on an ongoing basis, and at least on a quarterly basis with the AVC and the Board.
Fixed income instruments are valued based on prices received from Pricing Services. The Pricing Services use multiple valuation techniques to determine the valuation of fixed income instruments. In instances where sufficient market activity exists, the Pricing Services may utilize a market-based approach through which trades or quotes from market makers are used to determine the valuation of these instruments. In instances where sufficient market activity may not exist, the Pricing Services also utilize proprietary valuation models which may consider market transactions in comparable securities and the various relationships between securities in determining fair value and/or market characteristics in order to estimate the relevant cash flows, which are then discounted to calculate the fair values.
38
Equities and other exchange-traded instruments are valued at the last sale price or official market closing price on the primary exchange on which the instrument is traded before the net asset values (“NAV”) of the Funds are calculated on a valuation date.
Investments in open-end investment companies (the “Underlying Funds”), are valued at each Underlying Fund’s NAV per share as of the report date.
Futures and options are generally valued on the basis of available market quotations. Swaps and forward foreign currency exchange contracts are valued utilizing market quotations from approved Pricing Services.
Valuations reflected in this report are as of the report date. As a result, changes in valuation due to market events and/or issuer related events after the report date and prior to issuance of the report are not reflected herein.
The various inputs that are used in determining the valuation of the Funds’ investments are summarized into the three broad levels listed below.
| • | | Level 1 — Unadjusted inputs using quoted prices in active markets for identical investments. |
| • | | Level 2 — Other significant observable inputs including, but not limited to, quoted prices for similar investments, inputs other than quoted prices that are observable for investments (such as interest rates, prepayment speeds, credit risk, etc.) or other market corroborated inputs. |
| • | | Level 3 — Significant inputs based on the best information available in the circumstances, to the extent observable inputs are not available (including the Funds’ assumptions in determining the fair value of investments). |
A financial instrument’s level within the fair value hierarchy is based on the lowest level of any input, both individually and in the aggregate, that is significant to the fair value measurement. The inputs or methodology used for valuing instruments are not necessarily an indication of the risk associated with investing in those instruments.
The following tables represent each valuation input as presented on the Schedule of Portfolio Investments (“SOIs”):
| | | | | | | | | | | | | | | | |
| Flexible Long/Short Fund | | Level 1
Quoted prices | | | Level 2
Other significant
observable inputs | | | Level 3
Significant unobservable
inputs | | | Total | |
Total Investments in Securities(a) | | $ | 1,055,314 | | | $ | 24,792,294 | | | $ | – | | | $ | 25,847,608 | |
| | | | |
Appreciation in Other Financial Instruments | | | | | | | | | | | | | | | | |
Forward Foreign Currency | | | | | | | | | | | | | | | | |
Exchange Contracts | | $ | – | | | $ | 62,978 | | | $ | – | | | $ | 62,978 | |
| | | | |
Depreciation in Other Financial Instruments | | | | | | | | | | | | | | | | |
Forward Foreign Currency | | | | | | | | | | | | | | | | |
Exchange Contracts | | $ | – | | | $ | (11,304) | | | $ | – | | | $ | (11,304) | |
Futures Contracts | | | (21,000 | ) | | | – | | | | – | | | | (21,000) | |
Swaps | | | – | | | | (349) | | | | – | | | | (349) | |
| | | | |
Total Depreciation in Other Financial Instruments | | $ | (21,000 | ) | | $ | (11,653) | | | $ | – | | | $ | (32,653) | |
| | | | |
| | | | | | | | | | | | | | | | |
| High Yield Opportunities Fund | | Level 1
Quoted prices | | | Level 2
Other
significant
observable
inputs | | | Level 3
Significant
unobservable
inputs | | | Total | |
Total Investments in Securities (a) | | $ | 1,621,378 | | | $ | 24,420,578 | | | $ | – | | | $ | 26,041,956 | |
| | | | | | | | | | | | | | | | |
Appreciation in Other Financial Instruments | | | | | | | | | | | | | | | | |
Forward Foreign Currency Exchange Contracts | | $ | – | | | $ | 40,739 | | | $ | – | | | $ | 40,739 | |
| | | | | | | | | | | | | | | | |
| | | | |
Depreciation in Other Financial Instruments | | | | | | | | | | | | | | | | |
Forward Foreign Currency Exchange Contracts | | $ | – | | | $ | (55) | | | $ | – | | | $ | (55) | |
| | | | | | | | | | | | | | | | |
(a) All portfolio holdings designated as level 1 and level 2 are disclosed individually on the SOIs. Level 1 consists of a money market mutual fund that is held for daily investments of cash. Please refer to the SOIs for industry specifics of portfolio holdings.
There were no transfers between any levels during the period ended February 28, 2017.
39
B. Restricted Securities — Certain securities held by the Funds may be subject to legal or contractual restrictions on resale. Restricted securities generally are resold in transactions exempt from registration under the Securities Act of 1933 (the “Securities Act”). Disposal of these securities may involve time-consuming negotiations and expense. Prompt sale at the current valuation may be difficult and could adversely affect the net assets of the Funds.
As of February 28, 2017, the Funds had no investments in restricted securities other than securities sold to the Funds under Rule 144A and/or Regulation S under the Securities Act.
C. Loan Assignments — The Funds invested in debt instruments that are interests in amounts owed to lenders or lending syndicates (a “Lender”) by corporate, governmental, or other borrowers (a “Borrower”). A loan is often administered by a bank or other financial institution (the “Agent”) that acts as Agent for all holders. The Agent administers the terms of the loan, as specified in the loan agreement. The Funds invest in loan assignments of all or a portion of the loans. When a fund purchases a loan assignment, the fund has direct rights against the Borrower on a loan, provided, however, the fund’s rights may be more limited than the Lender from which it acquired the assignment and the fund may be able to enforce its rights only through the Agent. As a result, a fund assumes the credit risk of the Borrower as well as any other persons interpositioned between the fund and the Borrower (“Intermediate Participants”). A fund may incur certain costs and delays in realizing payment on a loan assignment or suffer a loss of principal and/or interest if assets or interests held by the Agent or other Intermediate Participants are determined to be subject to the claims of the Agent’s or other Intermediate Participant’s creditors. In addition, it is unclear whether loan assignments and other forms of direct indebtedness offer securities law protections against fraud and misrepresentation. Also, because JPMIM may wish to invest in publicly traded securities of a Borrower, it may not have access to material non-public information regarding the Borrower to which other investors have access. Although certain loan assignments are secured by collateral, a fund could experience delays or limitations in realizing the value on such collateral or have its interest subordinated to other indebtedness of the Borrower. Loan assignments are vulnerable to market conditions such that economic conditions or other events may reduce the demand for assignments and certain assignments that were liquid, when purchased, may become illiquid and they may be difficult to value. In addition, the settlement period for loans is uncertain as there is no standardized settlement schedule applicable to such investments. Therefore, a fund may not receive the proceeds from a sale of such investments for a period after the sale.
Certain loan assignments are also subject to the risks associated with high yield securities described under Note 7.
At February 28, 2017, Flexible Long/Short Fund had investments in Loan Assignments that amounted to more than 5% of the Fund’s net assets, by agent bank as follows:
| | | | |
Agent Bank | | | Percentage | |
Bank of America NA | | | 5.9% | |
Credit Suisse | | | 6.4 | |
D. Derivatives — The Funds used derivative instruments including futures, forward foreign currency exchange contracts, options and swaps, in connection with their investment strategies. Derivative instruments may be used as substitutes for securities in which the Funds can invest, to hedge portfolio investments or to generate income or gain to the Funds. Derivatives may also be used to manage duration, sector and yield curve exposures and credit and spread volatility.
The Funds may be subject to various risks from the use of derivatives including the risk that changes in the value of a derivative may not correlate perfectly with the underlying asset, rate or index; counterparty credit risk related to derivatives counterparties’ failure to perform under contract terms; liquidity risk related to the lack of a liquid market for these contracts allowing the Funds to close out their position(s); and, documentation risk relating to disagreement over contract terms. Investing in certain derivatives also results in a form of leverage and as such, the Funds’ risk of loss associated with these instruments may exceed their value, as recorded on the Statements of Assets and Liabilities.
The Funds are party to various derivative contracts governed by International Swaps and Derivatives Association master agreements (“ISDA agreements”). The Funds’ ISDA agreements, which are separately negotiated with each dealer counterparty, may contain provisions allowing, absent other considerations, a counterparty to exercise rights, to the extent not otherwise waived, against the Funds in the event the Funds’ net assets decline over time by a pre-determined percentage or fall below a pre-determined floor. The ISDA agreements may also contain provisions allowing, absent other conditions, the Funds to exercise rights, to the extent not otherwise waived, against the counterparties (i.e., decline in a counterparty’s credit rating below a specified level). Such rights for both the counterparty and Funds often include the ability to terminate (i.e., close out) open contracts at prices which may favor the counterparty, which could have an adverse effect on the Funds. The ISDA agreements give the Funds and counterparty the right, upon an event of default, to close out all transactions traded under such agreements and to net amounts owed or due across all transactions and offset such net payable or receivable with collateral posted to a segregated account by one party to the other.
40
Counterparty credit risk may be mitigated to the extent a counterparty posts collateral for mark to market gains to the Funds.
Notes D(1) — D(4) below describe the various derivatives used by the Funds.
(1). Options — The Flexible Long/Short Fund purchased put and call options on various instruments including futures, securities and interest rate swaps (“swaptions”) to manage and hedge interest rate risks within its portfolio and also to gain long or short exposure to the underlying instrument, index, currency or rate. A purchaser of a put option has the right, but not the obligation, to sell the underlying instrument at an agreed upon price (“strike price”) to the option seller. A purchaser of a call option has the right, but not the obligation, to purchase the underlying instrument at the strike price from the option seller. Swaptions and Eurodollar options are settled for cash.
Options Purchased — Premiums paid by the Fund for options purchased are included on the Statement of Assets and Liabilities as an investment. The option is adjusted daily to reflect the current market value of the option and the change is recorded as Change in net unrealized appreciation/depreciation of investments in non-affiliates on the Statement of Operations. If the option is allowed to expire, the Fund will lose the entire premium they paid and record a realized loss for the premium amount. Premiums paid for options purchased which are exercised or closed are added to the amounts paid or offset against the proceeds on the underlying investment transaction to determine the realized gain (loss) or cost basis of the underlying investment.
The Fund’s exchange traded option contracts are not subject to master netting arrangements (the right to close out all transactions traded with a counterparty and net amounts owed or due across transactions).
As of February 28, 2017, the Funds did not hold any options.
(2). Futures Contracts — The Flexible Long/Short Fund used treasury, index or other financial futures contracts to manage and hedge interest rate risk associated with portfolio investments. The Funds also used futures contracts to lengthen or shorten the duration of the overall investment portfolio.
Futures contracts provide for the delayed delivery of the underlying instrument at a fixed price or are settled for a cash amount based on the change in the value of the underlying instrument at a specific date in the future. Upon entering into a futures contract, the Funds is required to deposit with the broker, cash or securities in an amount equal to a certain percentage of the contract amount, which is referred to as the initial margin deposit. Subsequent payments, referred to as variation margin, are made or received by the Funds periodically and are based on changes in the market value of open futures contracts. Changes in the market value of open futures contracts are recorded as Change in net unrealized appreciation/depreciation on the Statement of Operations. Realized gains or losses, representing the difference between the value of the contract at the time it was opened and the value at the time it was closed, are reported on the Statement of Operations at the closing or expiration of the futures contract. Securities deposited as initial margin are designated on the SOI and cash deposited is recorded on the Statement of Assets and Liabilities. A receivable from and/or a payable to brokers for the daily variation margin is also recorded on the Statement of Assets and Liabilities.
The use of futures contracts exposes the Funds to interest rate and equity price risk. The Funds may be subject to the risk that the change in the value of the futures contract may not correlate perfectly with the underlying instrument. Use of long futures contracts subjects the Funds to risk of loss in excess of the amounts shown on the Statement of Assets and Liabilities, up to the notional amount of the futures contracts. Use of short futures contracts subjects the Funds to unlimited risk of loss. The Funds may enter into futures contracts only on exchanges or boards of trade. The exchange or board of trade acts as the counterparty to each futures transaction; therefore, the Funds’ credit risk is limited to failure of the exchange or board of trade. Under some circumstances, futures exchanges may establish daily limits on the amount that the price of a futures contract can vary from the previous day’s settlement price, which could effectively prevent liquidation of positions.
The Funds’ futures contracts are not subject to master netting arrangements (the right to close out all transactions traded with a counterparty and net amounts owed or due across transactions).
(3). Forward Foreign Currency Exchange Contracts — The Funds may be exposed to foreign currency risks with some or all of the portfolio investments and used forward foreign currency exchange contracts to hedge or manage certain of these exposures as part of an investment strategy. The Funds also bought forward foreign currency exchange contracts to gain exposure to currencies. Forward foreign currency exchange contracts represent obligations to purchase or sell foreign currency on a specified future date at a price fixed at the time the contracts are entered into. Non-deliverable forward foreign currency exchange contracts are settled with the counterparty in U.S. Dollar without the delivery of foreign currency.
The values of the forward foreign currency exchange contracts are adjusted daily based on the applicable exchange rate of the underlying currency. Changes in the value of these contracts are recorded as unrealized appreciation or depreciation until the contract settlement date. When the forward foreign currency exchange contract is closed, the Funds
41
record a realized gain or loss equal to the difference between the value at the time the contract was opened and the value at the time it was closed. The Funds also record a realized gain or loss when a forward foreign currency exchange contract offsets another forward foreign currency exchange contract with the same counterparty upon settlement.
The Funds’ forward foreign currency exchange contracts are subject to master netting arrangements (the right to close out all transactions with a counterparty and net amounts owed or due across transactions). As of February 28, 2017, the Funds did not receive or post collateral for forward foreign currency exchange contracts.
(4). Swaps — The Flexible Long/Short Fund engaged in various swap transactions, including credit default, interest rate and return swaps, to manage credit and interest rate (e.g., duration, yield curve) risks within its portfolio. The Funds also used swaps as alternatives to direct investments. Swap transactions are negotiated contracts over the counter (“OTC swaps”) between the fund and a counterparty or centrally cleared (“centrally cleared swaps”) with a central clearinghouse through a Futures Commission Merchant (“FCM”), to exchange investment cash flows, assets, foreign currencies or market-linked returns at specified, future intervals.
Upfront payments made and/or received are recorded as assets or liabilities, respectively on the Statement of Assets and Liabilities and amortized over the term of the swap. The value of an OTC swap agreement is recorded as either an asset or a liability on the Statement of Assets and Liabilities at the beginning of the measurement period. Upon entering into a centrally cleared swap, the Funds is required to deposit with the FCM cash or securities, which is referred to as initial margin deposit. Securities deposited as initial margin are designated on the SOI and cash deposited is recorded on the Statement of Assets and Liabilities. Daily changes in valuation of centrally cleared swaps, if any, are recorded as a variation margin receivable or payable on the Statement of Assets and Liabilities. The change in the value of swaps, including accruals of periodic amounts of interest to be paid or received on swaps, is reported as change in net unrealized appreciation/depreciation on the Statement of Operations. A realized gain or loss is recorded upon payment or receipt of a periodic payment or payment made upon termination of a swap agreement.
The Funds may be required to post or receive collateral based on the net value of the Funds’ outstanding OTC swap contracts with the counterparty in the form of cash or securities. Daily movement of cash collateral is subject to minimum threshold amounts. Collateral posted by the Funds is held in a segregated account at the Funds’ custodian bank. For certain counterparties cash collateral posted by the Funds is invested in an affiliated money market fund. Otherwise the cash collateral is included on the Statement of Assets and Liabilities as Restricted cash.
The Funds’ swap contracts (excluding centrally cleared swaps) are subject to master netting arrangements.
Credit Default Swaps
The Funds entered into credit default swaps to simulate long and short bond positions or to take an active long or short position with respect to the likelihood of a default or credit event by the issuer of the underlying reference obligation.
The underlying reference obligation may be a single issuer of corporate or sovereign debt, a basket of issuers or a credit index. A credit index is a list of credit instruments or exposures that reference a fixed number of obligors with shared characteristics that represents some part of the credit market as a whole. Index credit default swaps have standardized terms including a fixed spread and standard maturity dates. The composition of the obligations within a particular index changes periodically.
Credit default swaps involve one party, the protection buyer, making a stream of payments to another party, the protection seller, in exchange for the right to receive a contingent payment if there is a credit event related to the underlying reference obligation. In the event that the reference obligation matures prior to the termination date of the contract, a similar security will be substituted for the duration of the contract term. Credit events are defined under individual swap agreements and generally include bankruptcy, failure to pay, restructuring, repudiation/moratorium, obligation acceleration and obligation default.
If a credit event occurs, the Funds, as protection seller, would be obligated to make a payment, which may be either: (i) a net cash settlement equal to the notional amount of the swap less the auction value of the reference obligation or (ii) the notional amount of the swap in exchange for the delivery of the reference obligation. Selling protection effectively adds leverage to a Funds’ portfolio up to the notional amount of swap agreements. The notional amount represents the maximum potential liability under a contract and is not reflected on the Statement of Assets and Liabilities. Potential liabilities under these contracts may be reduced by: the auction rates of the underlying reference obligations; upfront payments received at the inception of a swap; and net amounts received from credit default swaps purchased with the identical reference obligation.
42
(5). Summary of Derivatives Information
The following table presents the value of derivatives held as of February 28, 2017, by their primary underlying risk exposure and respective location on the Statements of Assets and Liabilities:
| | | | | | | | | | | | | | | | | | | | |
| | | Flexible Long/Short Fund | |
| Derivative Contracts | | Statement of Assets and
Liabilities Location | | | | | | | | | | | | | |
| Gross Assets: | | | | | Futures
Contracts (a) | | | Forward Foreign
Currency Exchange
Contracts | | | Centrally
Cleared
Swaps (b) | | | Total | |
Foreign exchange contracts | |
| Receivables, Net Assets -
Unrealized Appreciation |
| | $ | — | | | $ | 62,978 | | | $ | — | | | $ | 62,978 | |
| | | | | | | | | | | | | | | | | | | | |
Gross Liabilities: | | | | | | | | | | | | | | | | | | | | |
Interest rate contracts | |
| Payables, Net Assets —
Unrealized Depreciation |
| | $ | (21,000) | | | $ | — | | | $ | — | | | $ | (21,000) | |
Foreign exchange contracts | | | Payables | | | | — | | | | (11,304) | | | | — | | | | (11,304) | |
Credit contracts | | | Payables | | | | — | | | | — | | | | (2,841) | | | | (2,841) | |
| | | | | | | | | | | | | | | | | | | | |
Total | | | | | | $ | (21,000) | | | $ | (11,304) | | | $ | (2,841) | | | $ | (35,145) | |
| | | | | | | | | | | | | | | | | | | | |
| (a) | This amount represents the cumulative appreciation (depreciation) of futures contracts as reported on the SOI. The Statement of Assets and Liabilities only reflect the current day variation margin receivable/payable from/to brokers. |
| (b) | This amount represents the value of centrally cleared swaps as reported on the SOI. The Statement of Assets and Liabilities only reflect the current day variation margin receivable/payable from/to brokers. |
The following table presents the value of derivatives held as of February 28, 2017, by their primary underlying risk exposure and respective location on the Statement of Assets and Liabilities:
| | | | | | | | | | | | | | |
| | | High Yield Opportunities Fund | | | | | |
| Derivative Contracts | | Statements of Assets and Liabilities Location | | | | | |
| Gross Assets: | | | | | | | Forward Foreign
Currency Exchange
Contracts | | | |
Foreign exchange contracts | | Receivables | | | | | | $ | 40,739 | | |
| | | | | | | | | | | |
Gross Liabilities: | | | | | | | | | | | |
Foreign exchange contracts | | Payables | | | | | | $ | (55) | | |
| | | | | | | | | | | |
43
The following tables present the effect of derivatives on the Statement of Operations for the period ended February 28, 2017, by primary underlying risk exposure:
| | | | | | | | | | | | | | | | | | | | |
| | | Flexible Long/Short Fund | | | | | | | |
|
| Amount of Realized Gain (Loss) on Derivatives Recognized on the Statement of Operations | |
| |
Derivative Contracts | | Options | | | Futures Contracts | | | Forward Foreign
Currency Exchange
Contracts | | | Swaps | | | Total | |
Interest rate contracts | | $ | — | | | $ | 25,857 | | | $ | — | | | $ | — | | | $ | 25,857 | |
Foreign exchange contracts | | | — | | | | — | | | | 199,562 | | | | — | | | | 199,562 | |
Credit contracts | | | (9,920 | ) | | | — | | | | — | | | | (15,719 | ) | | | (25,639 | ) |
| | | | | | | | | | | | | | | | | | | | |
Total | | $ | (9,920 | ) | | $ | 25,857 | | | $ | 199,562 | | | $ | (15,719 | ) | | $ | 199,780 | |
| | | | | | | | | | | | | | | | | | | | |
|
| Amount of Change in Unrealized Appreciation (Depreciation) on Derivatives Recognized on the Statement of Operations | |
| |
Derivative Contracts | | Options | | | Futures Contracts | | | Forward Foreign
Currency Exchange
Contracts | | | Swaps | | | Total | |
Interest rate contracts | | $ | — | | | $ | (21,000 | ) | | $ | — | | | $ | — | | | $ | (21,000 | ) |
Foreign exchange contracts | | | — | | | | — | | | | 51,674 | | | | — | | | | 51,674 | |
Credit contracts | | | — | | | | — | | | | — | | | | (349 | ) | | | (349 | ) |
| | | | | | | | | | | | | | | | | | | | |
Total | | $ | — | | | $ | (21,000 | ) | | $ | 51,674 | | | $ | (349 | ) | | $ | 30,325 | |
| | | | | | | | | | | | |
| | |
| | | High Yield Opportunities Fund | | | |
|
| Amount of Realized Gain (Loss) on Derivatives Recognized on Statements of Operations | |
| Derivative Contracts | | | | | | | | Forward Foreign
Currency Exchange
Contracts | |
Foreign exchange contracts | | | | | | | | $ | 137,043 | |
| | | | | | | | | | |
|
Amount of Change in Unrealized Appreciation (Depreciation) on Derivatives Recognized on the Statement of Operations | |
| Derivative Contracts | | | | | | | | Forward Foreign
Currency Exchange
Contracts | |
Foreign exchange contracts | | | | | | | | $ | 40,684 | |
| | | | | | | | | | |
Derivatives Volume
The tables below disclose the volume of the Funds’ futures contracts, forward foreign currency exchange contracts, options and swaps activity during the period ended February 28, 2017. Please refer to the tables in the Summary of Derivatives Information for derivative-related gains and losses associated with volume activity.
| | | | | | | | |
| | | Flexible
Long/Short
Fund | | | High Yield
Opportunities
Fund | |
Futures Contracts: | | | | | | | | |
Average Notional Balance Long | | | $ 3,984,688 (a) | | | $ | - | |
Average Notional Balance Short | | | 3,177,083(b) | | | | - | |
Ending Notional Balance Long | | | - | | | | - | |
Ending Notional Balance Short | | | 2,959,528 | | | | - | |
Forward Foreign Currency Exchange Contracts: | | | | | | | | |
Average Settlement Value Purchased | | | 1,932,593(b) | | | | 990,949 | |
Average Settlement Value Sold | | | 6,916,448(b) | | | | 4,982,623(d) | |
Ending Settlement Value Purchased | | | 4,796,347 | | | | - | |
44
| | | | | | | | |
| | | Flexible
Long/Short
Fund | | | High Yield
Opportunities
Fund | |
Ending Settlement Value Sold | | | $ 9,596,452 | | | $ | 4,022,962 | |
Swaptions & OTC Options: | | | | | | | | |
Average Notional Balance Purchased | | | 3,383,333(c) | | | | - | |
Credit Default Swaps: | | | | | | | | |
Average Notional Balance — Buy Protection | | | 220,835(b) | | | | - | |
Ending Notional Balance — Buy Protection | | | 365,000 | | | | - | |
(a) For the period July 1, 2016 through August 31, 2016.
(b) For the period July 1, 2016 through February 28, 2017.
(c) For the period July 1, 2016 through December 31, 2016.
(d) For the period November 1, 2016 through February 28, 2017.
The Funds’ derivatives contracts held at February 28, 2017 are not accounted for as hedging instruments under GAAP.
E. Foreign Currency Translation — The books and records of the Funds are maintained in U.S. dollars. Foreign currency amounts are translated into U.S. dollars at the prevailing exchange rates of such currencies against the U.S. dollar. The market value of investment securities and other assets and liabilities are translated at the exchange rate as of the valuation date. Purchases and sales of investment securities, income and expenses are translated at the exchange rate prevailing on the respective dates of such transactions.
The Funds do not isolate the effect of changes in foreign exchange rates from changes in market prices on securities held. Accordingly, such changes are included within Change in net unrealized appreciation/depreciation on investments on the Statement of Operations.
Reported realized foreign currency gains and losses arise from the disposition of foreign currency, currency gains or losses realized between the trade and settlement dates on securities transactions, and the difference between the amounts of dividends, interest and foreign withholding taxes recorded on each Funds’ books on the transaction date and the U.S. dollar equivalent of the amounts actually received or paid. These reported realized foreign currency gains and losses are included in Net realized gain (loss) on foreign currency transactions on the Statement of Operations. Unrealized foreign currency gains and losses arise from changes (due to changes in exchange rates) in the value of foreign currency and other assets and liabilities denominated in foreign currencies, which are held at year end are included in Change in net unrealized appreciation/depreciation on foreign currency translations on the Statement of Operations.
F. Offering and Organizational Costs — Total offering costs of $74,674 and $41,964 incurred in connection with the offering of shares of the Flexible Long/Short Fund and High Yield Opportunities Fund, respectively and are amortized on a straight line basis over 12 months from the date the Funds’ commenced operations. Costs paid in connection with the organization of the Funds, if any, were recorded as an expense at the time the Funds’ commenced operations and are included as part of Professional fees on the Statements of Operations. For the period ended February 28, 2017, total offering costs amortized for each fund were $49,715 and $13,681, respectively.
G. Security Transactions and Investment Income — Investment transactions are accounted for on the trade date (the date the order to buy or sell is executed). Securities gains and losses are calculated on a specifically identified cost basis. Interest income and interest expense on securities sold short, if any, is determined on the basis of coupon interest accrued using the effective interest method which adjusts for amortization of premiums and accretion of discounts. Dividend income net of foreign tax withheld, if any, is recorded on the ex-dividend date or when the Funds first learn of the dividend. Certain Funds may receive other income from investment in loan assignments and/or unfunded commitments, including amendment fees, consent fees and commitment fees. These fees are recorded as income when received by the Funds. These amounts are included in Interest Income in the Statements of Operations.
H. Foreign Taxes — The Funds may be subject to foreign taxes on income, gains on investments or currency purchases/repatriation, a portion of which may be recoverable. The Funds will accrue such taxes and recoveries as applicable, based upon their current interpretation of tax rules and regulations that exist in the markets in which they invest.
I. Allocation of Income and Expenses — Expenses directly attributable to a fund are charged directly to that fund, while the expenses attributable to more than one fund of the Trust are allocated among the respective funds. In calculating the NAV of each class, investment income, realized and unrealized gains and losses and expenses, other than class specific expenses, are allocated daily to each class of shares based upon the proportion of net assets of each class at the beginning of each day.
45
Transfer agency fees are class-specific expenses. The amount of the transfer agency fees charged to each class of the Funds for the period ended February 28, 2017 are as follows:
| | | | | | | | | | | | | | | | | | | | |
| | | Class A | | | Class C | | | Class R6 | | | Class I | | | Total | |
| |
Flexible Long/Short Fund | | | $ 115 | | | | $ 115 | | | | $ 116 | | | | $ 119 | | | | $ 465 | |
High Yield Opportunities Fund | | | 55 | | | | 55 | | | | 55 | | | | 84 | | | | 249 | |
J. Federal Income Taxes — Each Fund is treated as a separate taxable entity for Federal income tax purposes. Each Fund’s policy is to comply with the provisions of the Internal Revenue Code of 1986, as amended (the “Code”), applicable to regulated investment companies and to distribute to shareholders all of its distributable net investment income and net realized capital gains on investments. Accordingly, no provision for Federal income tax is necessary. Management has reviewed the Funds’ tax positions for all open tax years and has determined that as of February 28, 2017, no liability for income tax is required in the Funds’ financial statements for net unrecognized tax benefits. However, management’s conclusions may be subject to future review based on changes in, or the interpretation of, the accounting standards or tax laws and regulations. The Funds’ Federal tax returns for the prior three fiscal years, or since inception if shorter, remains subject to examination by the Internal Revenue Service.
M. Distributions to Shareholders — Distributions from net investment income are generally declared and paid monthly and are declared separately for each class. No class has preferential dividend rights; differences in per share rates are due to differences in separate class expenses. Net realized capital gains, if any, are distributed by each Fund at least annually. The amount of distributions from net investment income and net realized capital gains is determined in accordance with Federal income tax regulations, which may differ from GAAP. To the extent these “book/tax” differences are permanent in nature (i.e., that they result from other than timing of recognition — “temporary differences”), such amounts are reclassified within the capital accounts based on their Federal tax-basis treatment.
The following amounts were reclassified within the capital accounts:
| | | | | | | | |
| | | Paid-in-Capital | | Accumulated
undistributed
(distributions in
excess of)
net investment
income | | Accumulated
net realized
gains (losses) | |
Flexible Long/Short Fund | | $(51) | | $180,986 | | | $(180,935) | |
High Yield Opportunities Fund | | (49) | | (19,288) | | | 19,337 | |
The reclassifications for the Funds relate primarily to foreign currency gains or losses.
3. Fees and Other Transactions with Affiliates
A. Investment Advisory Fee — Pursuant to Investment Advisory Agreements, the Adviser supervises the investments of each Fund and for such services is paid a fee. The fee is accrued daily and paid monthly based on each Funds’ respective average daily net assets. The annual rate for each Fund is as follows:
| | | | |
Flexible Long/Short Fund | | | 0.50% | |
High Yield Opportunities Fund | | | 0.60 | |
The Adviser waived Investment Advisory fees and/or reimbursed expenses as outlined in Note 3.G.
B. Administration Fee — Pursuant to Administration Agreements, the Administrator provides certain administration services to the Funds. In consideration of these services, the Administrator receives a fee accrued daily and paid monthly at an annual rate of 0.15% of the first $25 billion of the average daily net assets of all funds in the J.P. Morgan Funds Complex covered by the Administration Agreement (excluding certain funds of funds and money market funds) and 0.075% of the average daily net assets in excess of $25 billion of all such funds. For the period ended February 28, 2017, the effective annualized rate was 0.08% of the Funds’ average daily net assets, notwithstanding any fee waivers and/or expense reimbursements.
The Administrator waived Administration fees as outlined in Note 3.G.
JPMCB, a wholly-owned subsidiary of JPMorgan, serves as the Funds’ sub-administrator (the “Sub-administrator”). For its services as Sub-administrator, JPMCB receives a portion of the fees payable to the Administrator.
C. Distribution Fees — Pursuant to a Distribution Agreement, JPMorgan Distribution Services, Inc. (“JPMDS”), a wholly-owned subsidiary of JPMorgan, serves as the Trust’s exclusive underwriter and promotes and arranges for the sale of the Funds’ shares.
46
The Board has adopted a Distribution Plan (the “Distribution Plan”) for Class A and Class C Shares of the Funds in accordance with Rule 12b-1 under the 1940 Act. The Class R6 and Class I do not charge a distribution fee. The Distribution Plan provides that the Funds shall pay distribution fees, including payments to JPMDS, at annual rates of 0.25% and 0.75% of the average daily net assets of Class A and Class C Shares, respectively.
In addition, JPMDS is entitled to receive the front-end sales charges from purchases of Class A Shares and the CDSC from redemptions of Class C Shares and certain Class A Shares for which front-end sales charges have been waived. For the period ended February 28, 2017, JPMDS did not retain any front-end sales charges or CDSC.
D. Shareholder Servicing Fees — The Trust, on behalf of the Funds, has entered into a Shareholder Servicing Agreement with JPMDS under which JPMDS provides certain support services to the shareholders. The Class R6 Shares do not charge a shareholder servicing fee. For performing these services, JPMDS receives a fee that is accrued daily and paid monthly equal to a percentage of the average daily net assets as shown in the table below:
| | | | | | | | | | |
| | | Class A | | | Class C | | | Class I |
|
Flexible Long/Short Fund | | | 0.25% | | | | 0.25% | | | 0.25% |
High Yield Opportunities Fund | | | 0.25% | | | | 0.25% | | | 0.25% |
JPMDS has entered into shareholder services contracts with affiliated and unaffiliated financial intermediaries who provide shareholder services and other related services to their clients or customers who invest in the Funds under which JPMDS will pay all or a portion of such fees earned to financial intermediaries for performing such services.
JPMDS waived shareholder servicing fees as outlined in Note 3.G.
E. Custodian and Accounting Fees — JPMCB provides portfolio custody and accounting services to the Funds. For performing these services, the Funds pay JPMCB transaction and asset-based fees that vary according to the number of transactions and positions, plus out-of-pocket expenses. The amounts paid directly to JPMCB by the Funds for custody and accounting services are included in Custodian and accounting fees on the Statement of Operations. Payments to the custodian may be reduced by credits earned by the Funds, based on uninvested cash balances held by the custodian. Such earnings credits, if any, are presented separately on the Statement of Operations.
Interest income earned on cash balances at the custodian, if any, is included in Interest income from affiliates on the Statements of Operations.
Interest expense paid to the custodian related to cash overdrafts, if any, is included in Interest expense to affiliates on the Statements of Operations.
F. Collateral Management Fees — JPMCB provides derivatives collateral management services for the Funds. The amounts paid directly to JPMCB by the Funds for these services are included in Collateral management fees on the Statements of Operations.
G. Waivers and Reimbursements — The Adviser, Administrator and/or JPMDS have contractually agreed to waive fees and/or reimburse the Funds to the extent that total annual operating expenses (excluding acquired fund fees and expenses other than certain money market fund fees as described below, dividend and interest expenses related to short sales, interest, taxes, expenses related to litigation and potential litigation, and extraordinary expenses) exceed the percentages of the Funds’ average daily net assets as shown in the table below:
| | | | | | | | |
| | | Class A | | Class C | | Class R6 | | Class I |
Flexible Long/Short Fund | | 1.15% | | 1.65% | | 0.65% | | 0.90% |
High Yield Opportunities Fund | | 1.00 | | 1.55 | | 0.60 | | 0.80 |
The expense limitation agreement was in effect for the period ended February 28, 2017 and is in place until at least May 31, 2017 for Flexible Long/Short Fund and October 3, 2017 for High Yield Opportunities Fund.
For the period ended February 28, 2017, the Funds’ service providers waived fees and/or reimbursed expenses for the Funds as follows. None of these parties expect the Funds to repay any such waived fees and/or reimbursed expenses in future years.
| | | | | | | | | | |
| | | Contractual Waivers | | |
| | | Investment
Advisory | | Administration | | Shareholder
Servicing | | Total | | Reimbursements |
Flexible Long/Short Fund | | $84,228 | | $13,790 | | $153 | | $98,171 | | $106,481 |
High Yield Opportunities Fund | | 49,718 | | 6,784 | | 3,165 | | 59,667 | | 104,314 |
Additionally, the Funds may invest in one or more money market funds advised by the Adviser or its affiliates (affiliated money market funds). The Adviser, Administrator and/or JPMDS, as shareholder servicing agent, have contractually agreed to waive fees and/or reimburse expense in an amount sufficient to offset the respective net fees each collects from the affiliated money market funds on the Funds’ investment in such affiliated money market funds.
47
The amounts of waivers resulting from investments in these money market funds for the period ended February 28, 2017 were as follows:
| | | | |
Flexible Long/Short Fund | | $ | 3,382 | |
High Yield Opportunities Fund | | | 1,763 | |
H. Other — Certain officers of the Trust are affiliated with the Adviser, the Administrator and JPMDS. Such officers, with the exception of the Chief Compliance Officer, receive no compensation from the Funds for serving in their respective roles.
The Board appointed a Chief Compliance Officer to the Funds in accordance with Federal securities regulations. Each Fund, along with other affiliated funds, makes reimbursement payments, on a pro-rata basis, to the Administrator for a portion of the fees associated with the Office of the Chief Compliance Officer. Such fees are included in Trustees’ and Chief Compliance Officer’s fees on the Statements of Operations.
The Trust adopted a Trustee Deferred Compensation Plan (the “Plan”) which allows the Independent Trustees to defer the receipt of all or a portion of compensation related to performance of their duties as Trustees. The deferred fees are invested in various J.P. Morgan Funds until distribution in accordance with the Plan.
During the period ended February 28, 2017, the Funds purchased securities from an underwriting syndicate in which the principal underwriter or members of the syndicate are affiliated with the Adviser.
The Funds may use related party broker-dealers. For the period ended February 28, 2017, the Funds did not incur any brokerage commissions with broker-dealers affiliated with the Adviser.
The Securities and Exchange Commission (“SEC”) has granted an exemptive order permitting the Funds to engage in principal transactions with J.P. Morgan Securities, Inc., an affiliated broker, involving taxable money market instruments, subject to certain conditions.
4. Investment Transactions
During the period ended February 28, 2017, purchases and sales of investments (excluding short-term investments) were as follows:
| | | | | | | | |
| | | Purchases
(excluding
U.S. Government) | | Sales (excluding
U.S. Government) | | Purchases
of U.S.
Government | | Sales of U.S.
Government |
Flexible Long/Short Fund | | $31,877,343 | | $7,189,057 | | $168,309 | | $91,209 |
High Yield Opportunities Fund | | 25,119,987 | | 1,357,882 | | - | | - |
5. Federal Income Tax Matters
For Federal income tax purposes, the estimated cost and unrealized appreciation (depreciation) in value of investment securities held at February 28, 2017 were as follows:
| | | | | | | | |
| | | Aggregate
Cost | | Gross
Unrealized
Appreciation | | Gross
Unrealized
Depreciation | | Net
Unrealized
Appreciation
(Depreciation) |
Flexible Long/Short Fund | | $25,753,491 | | $384,609 | | $290,492 | | $94,117 |
High Yield Opportunities Fund | | 25,453,826 | | 754,873 | | 166,743 | | 588,130 |
The difference between book and tax basis appreciation (depreciation) on investments is primarily wash sale loss deferrals and investments in perpetual bonds.
The tax character of distributions paid during the period ended February 28, 2017 was as follows:
| | | | | | | | |
| | | Ordinary Income* | | Net
Long-Term
Capital Gains | | Total
Distributions
Paid | | |
Flexible Long/Short Fund | | $684,969 | | $4,200 | | $689,169 | | |
High Yield Opportunities Fund | | 376,964 | | - | | 376,964 | | |
| * | Short-term gains are treated as ordinary income for income tax purposes. |
48
As of February 28, 2017, the estimated components of net assets (excluding paid-in-capital) on a tax basis were as follows:
| | | | | | |
| | | Current
Distributable
Ordinary
Income | | Current
Distributable
Long-Term
Capital Gain or
(Tax Basis Loss Carryover) | | Unrealized
Appreciation
(Depreciation) |
Flexible Long/Short Fund | | $137,753 | | $— | | $92,703 |
High Yield Opportunities Fund | | 145,528 | | 106,636 | | 587,645 |
The cumulative timing differences primarily consist of post-October capital loss deferrals and mark to market of forward foreign currency contracts.
As of February 28, 2017, the Funds did not have any net capital loss carryforwards.
Specified ordinary losses and net capital losses incurred after October 31 within the taxable year are deemed to arise on the first business day of the Funds’ next taxable year. For the year ended February 28, 2017 the Funds deferred to March
1, 2017 the following specified ordinary losses and net capital losses of:
| | | | | | |
| | | Net capital loss | | |
| | | Short-Term | | Long-Term | | Specified Loss |
Flexible Long/Short Fund | | $73,875 | | $2,931 | | $ - |
High Yield Opportunities Fund | | - | | - | | 19,337 |
6. Borrowings
The Funds rely upon an exemptive order granted by the SEC (the “Order”) permitting the establishment and operation of an Interfund Lending Facility (the “Facility”). The Facility allows the Funds to directly lend and borrow money to or from any other fund relying upon the Order at rates beneficial to both the borrowing and lending funds. Advances under the Facility are taken primarily for temporary or emergency purposes, including the meeting of redemption requests that otherwise might require the untimely disposition of securities, and are subject to each Funds’ borrowing restrictions. The Interfund loan rate is determined, as specified in the Order, by averaging the current repurchase agreement rate and the current bank loan rate. The Order was granted to JPMorgan Trust II and may be relied upon by the Funds because the Funds and the series of JPMorgan Trust II are all investment companies in the same “group of investment companies” (as defined in Section 12(d)(1)(G) of the 1940 Act).
In addition, the Trust and JPMCB have entered into a financing arrangement. Under this arrangement, JPMCB provides an unsecured, uncommitted credit facility in the aggregate amount of $100 million to certain of the J.P. Morgan Funds, including the Funds. Advances under the arrangement are taken primarily for temporary or emergency purposes, including the meeting of redemption requests that otherwise might require the untimely disposition of securities, and are subject to each Funds’ borrowing restrictions. Interest on borrowings is payable at a rate determined by JPMCB at the time of borrowing. This agreement has been extended until November 6, 2017.
The Funds had no borrowings outstanding from another fund or from the unsecured, uncommitted credit facility during the period ended February 28, 2017.
7. Risks, Concentrations and Indemnifications
In the normal course of business, the Funds entered into contracts that contain a variety of representations which provide general indemnifications. Each Fund’s maximum exposure under these arrangements is unknown. The amount of exposure would depend on future claims that may be made against each Fund that have not yet occurred. However, based on experience, the Funds expect the risk of loss to be remote.
The Funds’ shares are currently held by the Adviser.
The Funds’ investments in sovereign and corporate debt obligations within emerging market countries may be subject to potentially higher risks than investments in more developed markets and the prices of such investments may be volatile. The yields of emerging market debt obligations reflect, among other things, perceived credit risk. The consequences of political, social or economic instability in these markets may have disruptive effects on the market prices of the Funds’ investments and the income they generate, as well as the Funds’ ability to repatriate such amounts.
The Funds are subject to interest rate and credit risk. The value of debt securities may decline as interest rates increase. The Funds could lose money if the issuer of a fixed income security is unable to pay interest or repay principal when it is due. The Funds invest in floating rate loans and other floating rate debt securities. Although these investments are
49
generally less sensitive to interest rate changes than other fixed rate instruments, the value of floating rate loans and other floating rate investments may decline if their interest rates do not rise as quickly, or as much, as general interest rates. Many factors can cause interest rates to rise. Some examples include central bank monetary policy, rising inflation rates and general economic conditions. Given the historically low interest rate environment, risks associated with rising rates are heightened. The ability of the issuers of debt to meet their obligations may be affected by the economic and political developments in a specific industry or region.
The Funds invest in high yield securities that are not rated or rated below investment grade (commonly known as “junk bonds.”) These securities are considered to be high risk investments. Investments in lower-rated securities or unrated securities of comparable quality tend to be more sensitive to economic conditions than higher rated securities. Junk bonds involve a greater risk of default by the issuer because such securities are generally unsecured and are often subordinated to other creditors’ claims. The market price of these securities can change suddenly and unexpectedly. As a result, the Funds are intended for investors who are able and willing to assume a high degree of risk.
Flexible Long/Short Fund and High Yield Opportunities Fund invest in Preferred Securities. These securities are typically issued by corporations, generally in the form of interest bearing notes with preferred security characteristics and may include provisions that permit the issuer, in its discretion, to defer or omit distributions for a certain period of time.
Investing in securities of foreign countries may include certain risks and considerations not typically associated with investing in U.S. securities. These risks include revaluation of currencies, high rates of inflation, repatriation restrictions on income and currencies, and future and adverse political, social and economic developments.
Derivatives may be riskier than other types of investments because they may be more sensitive to changes in economic and market conditions and could result in losses that significantly exceed the Funds’ original investment. Many derivatives create leverage thereby causing the Funds to be more volatile than they would have been if they had not used derivatives. Derivatives also expose the Funds to counterparty risk (the risk that the derivative counterparty will not fulfill its contractual obligations), including credit risk of the derivative counterparty.
The Funds are also subject to counterparty credit risk, which is the risk that a counterparty fails to perform on agreements with the Funds such as swap and option contracts and forward foreign currency exchange contracts.
8. Investment Company Reporting Modernization
In October 2016, the U.S. Securities and Exchange Commission adopted new rules and forms, and amendments to certain current rules and forms, to modernize the reporting and disclosure of information by registered investment companies. In part, the final rules amend Regulation S-X and will require standardized, enhanced disclosures about derivatives in investment company financial statements, as well as other amendments. The compliance date for the amendments to Regulation S-X is August 1, 2017. At this time, management is currently assessing the anticipated impact of the Regulation S-X amendments on the Funds’ financial statements and related disclosures.
9. Subsequent Event
Effective April 3, 2017, the Funds ceased making direct payments to financial intermediaries for any applicable sub-transfer agency services. Payments to financial intermediaries for sub-transfer agency services are made by JPMDS from the Shareholder Servicing Fee which has been renamed as the Service Fee.
50
REPORT OF INDEPENDENT REGISTERED PUBLIC ACCOUNTING FIRM
To the Board of Trustees of JPMorgan Trust IV and the Shareholders of JPMorgan Flexible Long/Short Fund and JPMorgan High Yield Opportunities Fund:
In our opinion, the accompanying statements of assets and liabilities, including the schedules of portfolio investments, and the related statements of operations, of changes in net assets and the financial highlights present fairly, in all material respects, the financial position of JPMorgan Flexible Long/Short Fund and JPMorgan High Yield Opportunities Fund (each a separate series of JPMorgan Trust IV) (hereafter collectively referred to as the “Funds”) as of February 28, 2017, and the results of each of their operations, changes in each of their net assets and the financial highlights for the period June 30, 2016 (commencement of operations of JPMorgan Flexible Long/Short Fund) and the period November 1, 2016 (commencement of operations of JPMorgan High Yield Opportunities Fund) through February 28, 2017, in conformity with accounting principles generally accepted in the United States of America. These financial statements and financial highlights (hereafter referred to as “financial statements”) are the responsibility of the Funds’ management. Our responsibility is to express an opinion on these financial statements based on our audits. We conducted our audits of these financial statements in accordance with the standards of the Public Company Accounting Oversight Board (United States). Those standards require that we plan and perform the audit to obtain reasonable assurance about whether the financial statements are free of material misstatement. An audit includes examining, on a test basis, evidence supporting the amounts and disclosures in the financial statements, assessing the accounting principles used and significant estimates made by management, and evaluating the overall financial statement presentation. We believe that our audits, which included confirmation of securities as of February 28, 2017 by correspondence with the transfer agent, custodian and brokers, provide a reasonable basis for our opinion.
PricewaterhouseCoopers LLP
New York, New York
April 26, 2017
51
TRUSTEES
(Unaudited)
The Fund’s Statement of Additional Information includes additional information about the Fund’s Trustees and is available, without charge, upon request by calling 1-800-480-4111 or on the J.P. Morgan Funds’ website at www.jpmorganfunds.com.
| | | | | | |
Name (Year of Birth); Positions With the Fund (1) | | Principal Occupations During Past 5 Years | | Number of Portfolios in Fund Complex Overseen by Trustee (2) | | Other Directorships Held Outside Fund Complex During Past 5 Years |
| Independent Trustees | | | | | | |
| | | |
John F. Finn (1947); Trustee of Trust since 2005; Trustee of heritage One Group Mutual Funds since 1998. | | Chairman (1985-present), President and Chief Executive Officer, Gardner, Inc. (supply chain management company serving industrial and consumer markets) (1974-present). | | 153 | | Director, Greif, Inc. (GEF) (industrial package products and services) (2007-present); Trustee, Columbus Association for the Performing Arts (1988-present); Director, Cardinal Health, Inc. (CAH) (1994-2014). |
| | | |
Dr. Matthew Goldstein (1941); Chairman since 2013; Trustee of Trust since 2005; Trustee of heritage J.P. Morgan Funds since 2003. | | Chancellor Emeritus, City University of New York (2015-present); Professor, City University of New York (2013-present); Chancellor, City University of New York (1999-2013); President, Adelphi University (New York) (1998-1999). | | 153 | | Trustee, Museum of Jewish Heritage (2011-present); Trustee, National Museum of Mathematics (present); Chair, Association of College and University Administrators (present). |
| | | |
| Dennis P. Harrington (1950); Trustee of Trust since 2017. | | Retired; Partner, Deloitte LLP (1984-2012). | | 152 | | None |
| | | |
Frankie D. Hughes (1952); Trustee of Trust since 2008. | | President, Ashland Hughes Properties (property management) (2014-present); President and Chief Investment Officer, Hughes Capital Management, Inc. (fixed income asset management) (1993-2014). | | 153 | | Trustee, The Victory Portfolios (2000-2008) (Investment companies). |
| | | |
Peter C. Marshall (1942); Trustee of Trust since 2005; Trustee of heritage One Group Mutual Funds since 1985. | | Self-employed business consultant (2002-present). | | 153 | | None |
| | | |
Mary E. Martinez (1960); Trustee of Trust since 2013. | | Associate, Special Properties, a Christie’s International Real Estate Affiliate (2010-present); Managing Director, Bank of America (Asset Management) (2007-2008); Chief Operating Officer, U.S. Trust Asset Management, U.S. Trust Company (asset management) (2003-2007); President, Excelsior Funds (registered investment companies) (2004-2005). | | 153 | | None |
| | | |
Marilyn McCoy* (1948); Trustee of Trust since 2005; Trustee of heritage One Group Mutual Funds since 1999. | | Vice President of Administration and Planning, Northwestern University (1985-present). | | 153 | | None |
| | | |
Mitchell M. Merin (1953); Trustee of Trust since 2013. | | Retired; President and Chief Operating Officer, Morgan Stanley Investment Management, Member Morgan Stanley & Co. Management Committee (registered investment adviser) (1998-2005). | | 153 | | Director, Sun Life Financial (SLF) (2007-2013) (financial services and insurance); Trustee, Trinity College, Hartford, CT (2002-2010). |
| | | |
| Dr. Robert A. Oden, Jr. (1946); Trustee of Trust since 2005; Trustee of heritage One Group Mutual Funds since 1997. | | Retired; President, Carleton College (2002-2010); President, Kenyon College (1995-2002). | | 153 | | Chairman, Dartmouth-Hitchcock Medical Center (2011-present); Trustee, American Schools of Oriental Research (2011-present); Trustee, American University in Cairo (1999-2014); Trustee, American Museum of Fly Fishing (2013- present). |
52
| | | | | | |
Name (Year of Birth); Positions With the Fund (1) | | Principal Occupations During Past 5 Years | | Number of Portfolios in Fund Complex Overseen by Trustee (2) | | Other Directorships Held Outside Fund Complex During Past 5 Years |
Independent Trustees (continued) | | | | |
Marian U. Pardo** (1946); Trustee of Trust since 2013. | | Managing Director and Founder, Virtual Capital Management LLC (Investment Consulting) (2007-present); Managing Director, Credit Suisse Asset Management (portfolio manager) (2003-2006). | | 153 | | Member, Board of Governors, Columbus Citizens Foundation (not-for-profit supporting philanthropic and cultural programs) (2006-present). |
| | | |
Frederick W. Ruebeck (1939); Trustee of Trust since 2005; Trustee of heritage One Group Mutual Funds since 1994. | | Consultant (2000-present); Adviser, JP Greene & Associates, LLC (broker-dealer) (2000-2009); Chief Investment Officer, Wabash College (2004-present); Director of Investments, Eli Lilly and Company (pharmaceuticals) (1988-1999). | | 153 | | None |
| | | |
James J. Schonbachler (1943); Trustee of Trust since 2005; Trustee of heritage J.P. Morgan Funds since 2001. | | Retired; Managing Director of Bankers Trust Company (financial services) (1968-1998). | | 153 | | None |
| (1) | The Trustees serve for an indefinite term, subject to the Trust’s current retirement policy, which is age 78 for all Trustees. |
| (2) | A Fund Complex means two or more registered investment companies that hold themselves out to investors as related companies for purposes of investment and investor services or have a common investment adviser or have an investment adviser that is an affiliated person of the investment adviser of any of the other registered investment companies. The J.P. Morgan Funds Complex for which the Board of Trustees serves currently includes twelve registered investment companies (153 funds). |
| * | Two members of the Board of Trustees of Northwestern University are executive officers of registered investment advisers (not affiliated with JPMorgan) that are under common control with sub-advisers to certain J.P. Morgan Funds. |
| ** | In connection with prior employment with JPMorgan Chase, Ms. Pardo was the recipient of non-qualified pension plan payments from JPMorgan Chase in the amount of approximately $2,055 per month, which she irrevocably waived effective January 1, 2013, and deferred compensation payments from JPMorgan Chase in the amount of approximately $7,294 per year, which ended in January 2013. In addition, Ms. Pardo receives payments from a fully-funded qualified plan, which is not an obligation of JPMorgan Chase. |
The contact address for each of the Trustees is 270 Park Avenue, New York, NY 10017.
53
OFFICERS
(Unaudited)
| | |
Name (Year of Birth), Positions Held with the Trust (Since) | | Principal Occupations During Past 5 Years |
| |
Brian S. Shlissel (1964), President and Principal Executive Officer (2016) | | Managing Director and Chief Administrative Officer for J.P. Morgan pooled vehicles, J.P. Morgan Investment Management Inc. (formerly JPMorgan Funds Management, Inc.) (2014 – present); Managing Director and Head of Mutual Fund Services, Allianz Global Investors; President and Chief Executive Officer, Allianz Global Investors Mutual Funds and PIMCO Closed-End Funds (1999-2014) |
| |
Laura M. Del Prato (1964), Treasurer and Principal Financial Officer (2014)* | | Managing Director, J.P. Morgan Investment Management Inc. (formerly JPMorgan Funds Management, Inc.) since 2014; Partner, Cohen Fund Audit Services, Ltd. (2012-2013); Partner (2004-2012) and various other titles (1990-2004) at KPMG, LLP. |
| |
Frank J. Nasta (1964), Secretary (2008) | | Managing Director and Associate General Counsel, JPMorgan Chase since 2008. |
| |
Stephen M. Ungerman (1953), Chief Compliance Officer (2005) | | Managing Director, JPMorgan Chase & Co.; Mr. Ungerman has been with JPMorgan Chase & Co. since 2000. |
| |
Elizabeth A. Davin (1964), Assistant Secretary (2005)* | | Executive Director and Assistant General Counsel, JPMorgan Chase since February 2012; formerly Vice President and Assistant General Counsel, JPMorgan Chase from 2005 to February 2012; Senior Counsel, JPMorgan Chase (formerly Bank One Corporation) from 2004 to 2005. |
| |
Jessica K. Ditullio (1962), Assistant Secretary (2005)* | | Executive Director and Assistant General Counsel, JPMorgan Chase. Ms. Ditullio has been with JPMorgan Chase (formerly Bank One Corporation) since 1990. |
| |
John T. Fitzgerald (1975), Assistant Secretary (2008) | | Executive Director and Assistant General Counsel, JPMorgan Chase. Mr. Fitzgerald has been with JPMorgan Chase since 2005. |
| |
Carmine Lekstutis (1980), Assistant Secretary (2011) | | Executive Director and Assistant General Counsel, JPMorgan Chase since February 2015; formerly Vice President and Assistant General Counsel, JPMorgan Chase from 2011 to February 2015. |
| |
| Gregory S. Samuels (1980), Assistant Secretary (2010) | | Executive Director and Assistant General Counsel, JPMorgan Chase since 2014; formerly Vice President and Assistant General Counsel, JPMorgan Chase since 2010. |
| |
| Pamela L. Woodley (1971), Assistant Secretary (2012)** | | Vice President and Assistant General Counsel, JPMorgan Chase since November 2004. |
| |
| Zachary E. Vonnegut-Gabovitch (1986) | | Vice President and Assistant General Counsel, JPMorgan Chase since September 2016; Associate, Morgan, Lewis & Bockius (law firm) from 2012 to 2016. |
| |
| Assistant Secretary (2017) | | |
| |
| Michael M. D’Ambrosio (1969), Assistant Treasurer (2012) | | Managing Director, J.P. Morgan Investment Management Inc. (formerly JPMorgan Funds Management, Inc.) since May 2014; formerly Executive Director, JPMorgan Funds Management, Inc. from 2012 to May 2014; prior to joining JPMorgan Chase, Mr. D’Ambrosio was a Tax Director at PricewaterhouseCoopers LLP since 2006. |
| |
Lauren A. Paino (1973), Assistant Treasurer (2014)** | | Executive Director, J.P. Morgan Investment Management Inc. (formerly JPMorgan Funds Management, Inc.) since August 2013; formerly Director, Credit Suisse Asset Management from 2000-2013. |
| |
Joseph Parascondola (1963), Assistant Treasurer (2011)** | | Vice President, J.P. Morgan Investment Management Inc. (formerly JPMorgan Funds Management, Inc.) since August 2006. |
| |
Matthew J. Plastina (1970), Assistant Treasurer (2011)** | | Executive Director, J.P. Morgan Investment Management Inc. (formerly JPMorgan Funds Management, Inc.) since February 2016; Vice President, JPMorgan Funds Management, Inc. from 2010 to January 2016. |
| |
Julie A. Roach (1971), Assistant Treasurer (2012)* | | Executive Director, J.P. Morgan Investment Management Inc. (formerly JPMorgan Funds Management, Inc.) since February 2017; Vice President, JPMorgan Funds Management, Inc. from August 2012 to January 2016; prior to joining JPMorgan Chase, Ms. Roach was a Senior Manager with Deloitte since 2001. |
| |
Gillian I. Sands (1969), Assistant Treasurer (2012)** | | Vice President, J.P. Morgan Investment Management Inc. (formerly JPMorgan Funds Management, Inc.) since September 2012; Assistant Treasurer, Wells Fargo Funds Management (2007-2009). |
The contact address for each of the officers, unless otherwise noted, is 270 Park Avenue, New York, NY 10017.
| * | The contact address for the officer is 1111 Polaris Parkway, Columbus, OH 43240. |
| ** | The contact address for the officer is 4 New York Plaza, New York, NY 10004. |
54
SCHEDULE OF SHAREHOLDER EXPENSES (Unaudited)
Hypothetical $1,000 Investment
As a shareholder of the Funds, you incur two types of costs: (1) transaction costs, including sales charges (loads) on purchase payments and (2) ongoing costs, including investment advisory fees, administration fees, distribution fees and other Fund expenses. The examples below are intended to help you understand your ongoing costs (in dollars) of investing in the Fund and to compare these ongoing costs with the ongoing costs of investing in other mutual funds. The examples assume that you had a $1,000 investment in each Class at the beginning of the reporting period, September 1, 2016 for JPMorgan Flexible Long/Short Fund and November 1, 2016 for JPMorgan High Yield Opportunities Fund, and continued to hold your shares at the end of the reporting period, December 31, 2016.
Actual Expenses
For each Class of each Fund in the table below, the first line provides information about actual account values and actual expenses. You may use the information in this line, together with the amount you invested, to estimate the expenses that you paid over the period. Simply divide your account value by $1,000 (for example, an $8,600 account value divided by $1,000 = 8.6), then multiply the result by the number in the first line of each Class under the heading entitled “Expenses Paid During the Period” to estimate the expenses you paid on your account during this period.
Hypothetical Example for Comparison Purposes
The second line of each Class in the table below provides information about hypothetical account values and hypothetical expenses based on the Class’ actual expense ratio and an assumed rate of return of 5% per year before expenses, which is not the Class’ actual return. The hypothetical account values and expenses may not be used to estimate the actual ending account balance or expenses you paid for the period. You may use this information to compare the ongoing costs of investing in the Class of the Fund and other funds. To do so, compare this 5% hypothetical example with the 5% hypothetical examples that appear in the shareholder reports of the other funds. Please note that the expenses shown in the table are meant to highlight your ongoing costs only and do not reflect any transaction costs, such as sales charges (loads) or redemption fees. Therefore, the second line for each Class in the table is useful in comparing ongoing costs only, and will not help you determine the relative total costs of owning different funds. In addition, if these transaction costs were included, your costs would have been higher. The examples also assume all dividends and distributions have been reinvested.
| | | | | | | | |
| | | Beginning Account Value
September 1, 2016 | | Ending Account Value
February 28, 2017 | | Expenses Paid During the Period* | | Annualized Expense Ratio |
Flexible Long/Short | | | | | | | | |
Fund | | | | | | | | |
| | | | |
Class A | | | | | | | | |
Actual | | $1,000.00 | | $1,016.00 | | $5.70 | | 1.14% |
Hypothetical | | 1,000.00 | | 1,019.14 | | 5.71 | | 1.14 |
Class C | | | | | | | | |
Actual | | 1,000.00 | | 1,013.40 | | 8.19 | | 1.64 |
Hypothetical | | 1,000.00 | | 1,016.66 | | 8.20 | | 1.64 |
Class R6 | | | | | | | | |
Actual | | 1,000.00 | | 1,018.60 | | 3.20 | | 0.64 |
Hypothetical | | 1,000.00 | | 1,021.62 | | 3.21 | | 0.64 |
Class I (formerly | | | | | | | | |
Select Class) | | | | | | | | |
Actual | | 1,000.00 | | 1,017.40 | | 4.45 | | 0.89 |
Hypothetical | | 1,000.00 | | 1,020.38 | | 4.46 | | 0.89 |
55
SCHEDULE OF SHAREHOLDER EXPENSES (Unaudited) (continued)
Hypothetical $1,000 Investment
| | | | | | | | |
| | | Beginning Account Value
November 1, 2016 | | Ending Account Value
February 28, 2017 | | Expenses Paid During the Period | | Annualized Expense Ratio |
High Yield | | | | | | | | |
Opportunities Fund | | | | | | | | |
Class A | | | | | | | | |
Actual** | | $1,000.00 | | $1,047.60 | | $3.24 | | 0.97% |
Hypothetical* | | 1,000.00 | | 1,019.98 | | 4.86 | | 0.97 |
Class C | | | | | | | | |
Actual** | | 1,000.00 | | 1,045.70 | | 5.10 | | 1.53 |
Hypothetical* | | 1,000.00 | | 1,017.21 | | 7.65 | | 1.53 |
Class R6 | | | | | | | | |
Actual** | | 1,000.00 | | 1,049.00 | | 1.94 | | 0.58 |
Hypothetical* | | 1,000.00 | | 1,021.92 | | 2.91 | | 0.58 |
Class I (formerly | | | | | | | | |
Select Class) | | | | | | | | |
Actual** | | 1,000.00 | | 1,048.30 | | 2.60 | | 0.78 |
Hypothetical* | | 1,000.00 | | 1,020.93 | | 3.91 | | 0.78 |
| * | Expenses are equal to each Class’ respective annualized expense ratio, multiplied by the average account value over the period, multiplied by 184/366 (to reflect the one-half year period). |
| ** | Expenses are equal to each Class’ respective annualized expense ratio, multiplied by the average account value over the period, multiplied by 119/365 (to reflect the actual period). Commencement of operations was November 1, 2016. |
56
Tax Letter
(Unaudited)
Certain tax information for the J.P. Morgan Funds is required to be provided to shareholders based upon the Funds’ income and distributions for the taxable year ended February 28, 2017. The information and distributions reported in this letter may differ from the information and taxable distributions reported to the shareholders for the calendar year ending December 31, 2017. The information necessary to complete your income tax returns for the calendar year ending December 31, 2017 will be provided under separate cover.
Long-Term Capital Gain
Each Fund listed below distributed the following amount, or maximum allowable amount, of long-term capital gain dividends for the fiscal year ended February 28, 2017:
| | | | |
| | | Long-Term | |
| | | Capital | |
| | | Gain | |
| | | Distribution | |
Flexible Long/Short Fund | | | $4,200 | |
57
For the JPMorgan High Yield Opportunities Fund Only
The Board of Trustees has established various standing committees composed of Trustees with diverse backgrounds, to which the Board of Trustees has assigned specific subject matter responsibilities to further enhance the effectiveness of the Board’s oversight and decision making. The Board of Trustees and its investment committees (money market and alternative products, equity, and fixed income) meet regularly throughout the year and consider factors that are relevant to their annual consideration of investment advisory agreements at each meeting. They also meet for the specific purpose of considering approvals of initial advisory agreements for new funds. At their May 2016 in-person meeting, the Trustees, including a majority of the Trustees who are not “interested persons” (as defined in the 1940 Act) of any party to the initial advisory agreement or any of their affiliates (“Independent Trustees”), approved the initial investment advisory agreement (the “New Advisory Agreement”) for the Fund whose annual report is contained herein.
In connection with the approval of the New Advisory Agreement, the Trustees reviewed written materials prepared by the Adviser and received oral presentations from Adviser personnel. Before voting on the proposed New Advisory Agreement, the Trustees reviewed the New Advisory Agreement with representatives of the Adviser and with counsel to the Trust and independent legal counsel and received a memorandum from independent legal counsel to the Trustees discussing the legal standards for their consideration of the proposed agreement. The Trustees also discussed the proposed agreement in an executive session with independent legal counsel at which no representatives of the Adviser were present. Set forth below is a summary of the material factors evaluated by the Trustees in determining whether to approve the New Advisory Agreement.
The Trustees considered information provided with respect to the Fund and the approval of the New Advisory Agreement. Each Trustee attributed different weights to the various factors and no factor alone was considered determinative. The Trustees determined that the proposed compensation to be received by the Adviser from the Fund under the New Advisory Agreement was fair and reasonable and that the initial approval of the New Advisory Agreement was in the best interests of the Fund and its potential shareholders.
The factors summarized below were considered and discussed by the Trustees in reaching their conclusions:
Nature, Extent and Quality of Services Provided by the Adviser
In connection with the approval of the New Advisory Agreement, the Trustees considered the materials furnished specifically in connection with the approval of the New Advisory Agreement, as well as other relevant information furnished throughout the year for the J.P. Morgan Funds complex and the Trustees’ experience with the Adviser and its services. The Trustees considered the background and experience of the Adviser’s senior management and investment personnel, as well as the qualifications, backgrounds and responsibilities of the portfolio management team primarily responsible for the day-to-day management of the Fund. The Trustees also considered the investment strategy and investment process for the Fund, and the infrastructure supporting the portfolio management team. In addition, the Trustees considered information about the structure and distribution strategy of the Fund, how it fits within the J.P. Morgan Funds lineup, and how it will be positioned against identified peers.
58
The Trustees also considered its knowledge of the nature and quality of the services provided by the Adviser to the J.P. Morgan Funds gained from their experience as Trustees of the J.P. Morgan Funds. In addition, they considered the overall reputation and capabilities of the Adviser and its affiliates, the commitment of the Adviser to provide high quality service to the J.P. Morgan Funds, their overall confidence in the Adviser’s integrity and the Adviser’s responsiveness to questions or concerns raised by them, including the Adviser’s willingness to consider and implement organizational and operational changes designed to improve investment results and the services provided to the J.P. Morgan Funds.
Based upon these considerations and other factors, the Trustees concluded that they were satisfied with the nature, extent and quality of the investment advisory services to be provided to the Fund by the Adviser.
Fall-Out Benefits
The Trustees reviewed information regarding potential “fallout” or ancillary benefits received by the Adviser and its affiliates as a result of their relationship with the J.P. Morgan Funds. The Trustees also considered the Adviser’s allocation of fund brokerage for the J.P. Morgan Funds complex, including allocations to brokers who provide research to the Adviser.
The Trustees also considered that JPMorgan Distribution Services, Inc. (“JPMDS”), an affiliate of the Adviser, and J.P. Morgan Investment Management Inc., in its role as administrator (“JPMIM”), will earn fees from the Fund for providing shareholder and administrative services, respectively. The Trustees also considered the payments of Rule 12b-1 fees to JPMDS, which also acts as the Fund’s distributor and that these fees are in turn generally paid to financial intermediaries that sell the Fund, including financial intermediaries that are affiliates of the Adviser. The Trustees also considered the fees paid to JPMorgan Chase Bank, N.A. (“JPMCB”) for custody and fund accounting and other related services. The Trustees also considered that any fall-out benefits would be comparable to those related to the other actively managed funds in the complex and were consistent with the process of approving advisory agreements for new funds.
Economies of Scale
The Trustees considered the extent to which the Fund may benefit from economies of scale. The Trustees considered that there may not be a direct relationship between economies of scale realized by the Fund and those realized by the Adviser as assets increase. The Trustees noted that the proposed investment advisory fee schedule for the Fund does not contain breakpoints, but that the fee remains competitive with peer funds. The Trustees also considered that the Adviser has implemented fee waivers and expense limitations (“Fee Caps”) which allow the Fund’s shareholders to share potential economies of scale from the Fund’s inception. The Trustees also considered that the Adviser has shared economies of scale by adding or enhancing services to the Fund over time, noting the Adviser’s substantial investments in its business in support of the Fund, including investments in trading systems and technology (including cybersecurity improvements), retention of key talent, additions to analyst and portfolio management teams, and regulatory support enhancements. The Trustees also considered whether it would be appropriate to add advisory fee breakpoints, and the Trustees concluded that the current fee structure was reasonable in light of the Fee Caps that the Adviser has in place that serve to limit the overall net expense ratios of the Fund at a competitive level. The Trustees concluded that the Fund’s shareholders received the benefits of potential economies of scale through the Fee Caps and the Adviser’s reinvestment in its operations to serve the Fund and its shareholders.
Investment Performance
The Trustees considered the Fund’s investment strategy and process, portfolio management team and competitive positioning against identified peer funds, and concluded that the prospects for competitive future performance were acceptable.
59
Advisory Fees and Expense Ratios
The Trustees considered the contractual advisory fee rate that will be paid by the Fund to the Adviser and compared that rate to the information prepared by Broadridge, using data from Lipper Inc., independent providers of investment company data (together, “Broadridge/Lipper”) concerning management fee rates paid by other funds in the same Broadridge/Lipper category as the Fund. The Trustees recognized that Broadridge/Lipper reported the Fund’s management fee rate as the combined contractual advisory fee and administration fee rates. The Trustees also reviewed information about other projected expenses and the expense ratios for the Fund. The Trustees considered the projected fee waiver and/or expense reimbursement arrangements proposed for the Fund and considered the net advisory fee rate after taking into account any projected waivers and/or reimbursements. The Trustees recognized that it is difficult to make comparisons of advisory fees because there are variations in the services that are included in the fees paid by other funds.
The Trustees noted that the Fund’s estimated net advisory fees and total expenses, which were considered on a class-by-class basis, were in line with identified peer funds. After considering the factors identified above, in light of the information, the Trustees concluded that the advisory fees were reasonable.
60

Rev. January 2011
| | | | |
FACTS | | WHAT DOES J.P. MORGAN FUNDS DO WITH YOUR PERSONAL INFORMATION? | | |
| | | | |
| Why? | | Financial companies choose how they share your personal information. Federal law gives consumers the right to limit some but not all sharing. Federal law also requires us to tell you how we collect, share, and protect your personal information. Please read this notice carefully to understand what we do. | | |
| | | | |
| What? | | The types of personal information we collect and share depend on the product or service you have with us. This information can include: ◾ Social Security number and account balances ◾ transaction history and account transactions ◾ checking account information and wire transfer instructions When you are no longer our customer, we continue to share your information as described in this notice. | | |
| | | | |
| How? | | All financial companies need to share customers’ personal information to run their everyday business. In the section below, we list the reasons financial companies can share their customers’ personal information; the reasons J.P. Morgan Funds chooses to share; and whether you can limit this sharing. | | |

| | | | | | |
| Reasons we can share your personal information | | Does J.P. Morgan Funds share? | | Can you limit this
sharing? | | |
For our everyday business purposes – such as to process your transactions, maintain your account(s), respond to court orders and legal investigations, or report to credit bureaus | | Yes | | No | | |
For marketing purposes — to offer our products and services to you | | Yes | | No | | |
| For joint marketing with other financial companies | | No | | We don’t share | | |
For our affiliates’ everyday business purposes — information about your transactions and experiences | | No | | We don’t share | | |
For our affiliates’ everyday business purposes — information about your creditworthiness | | No | | We don’t share | | |
| For nonaffiliates to market to you | | No | | We don’t share | | |
| | | | |
| | | |
| Questions? | | Call 1-800-480-4111 or go to www.jpmorganfunds.com | | |
| | |
| Who we are |
| Who is providing this notice? | | J.P. Morgan Funds |
| | |
| What we do |
| How does J.P. Morgan Funds protect my personal information? | | To protect your personal information from unauthorized access and use, we use security measures that comply with federal law. These measures include computer safeguards and secured files and buildings. We authorize our employees to access your information only when they need it to do their work and we require companies that work for us to protect your information. |
| How does J.P. Morgan Funds collect my personal information? | | We collect your personal information, for example, when you: ◾ open an account or provide contact information ◾ give us your account information or pay us by check ◾ make a wire transfer We also collect your personal information from others, such as credit bureaus, affiliates and other companies. |
| Why can’t I limit all sharing? | | Federal law gives you the right to limit only ◾ sharing for affiliates’ everyday business purposes – information about your creditworthiness ◾ affiliates from using your information to market to you ◾ sharing for nonaffiliates to market to you State laws and individual companies may give you additional rights to limit sharing. |
| | |
| Definitions |
| Affiliates | | Companies related by common ownership or control. They can be financial and nonfinancial companies. ◾ J.P. Morgan Funds does not share with our affiliates. |
| Nonaffiliates | | Companies not related by common ownership or control. They can be financial and nonfinancial companies. ◾ J.P. Morgan Funds does not share with nonaffiliates so they can market to you. |
| Joint Marketing | | A formal agreement between nonaffiliated financial companies that together market financial products or services to you. ◾ J.P. Morgan Funds doesn’t jointly market. |
J.P. Morgan Funds are distributed by JPMorgan Distribution Services, Inc., which is an affiliate of JPMorgan Chase & Co. Affiliates of JPMorgan Chase & Co. receive fees for providing various services to the funds.
Contact JPMorgan Distribution Services, Inc. at 1-800-480-4111 for a fund prospectus. You can also visit us at www.jpmorganfunds.com. Investors should carefully consider the investment objectives and risk as well as charges and expenses of the mutual fund before investing. The prospectus contains this and other information about the mutual fund. Read the prospectus carefully before investing.
Investors may obtain information about the Securities Investor Protection Corporation (SIPC), including the SIPC brochure by visiting www.sipc.org or by calling SIPC at 202-371-8300.
The Fund files a complete schedule of its fund holdings for the first and third quarters of its fiscal year with the SEC on Form N-Q. The Fund’s Forms N-Q are available on the SEC’s website at http://www.sec.gov and may be reviewed and copied at the SEC’s Public Reference Room in Washington, DC. Information on the operation of the SEC’s Public Reference Room may be obtained by calling 1-800-SEC-0330. Shareholders may request the Form N-Q without charge by calling 1-800-480-4111 or by visiting the J.P. Morgan Funds’ website at www.jpmorganfunds.com.
A description of the Fund’s policies and procedures with respect to the disclosure of the Fund’s holdings is available in the prospectus and Statement of Additional Information.
A copy of proxy policies and procedures is available without charge upon request by calling 1-800-480-4111 and on the Fund’s website at www.jpmorganfunds.com. A description of such policies and procedures is on the SEC’s website at www.sec.gov. The Trustees have delegated the authority to vote proxies for securities owned by the Fund to the Adviser. A copy of the Fund’s voting record for the most recent 12-month period ended June 30 is available on the SEC’s website at www.sec.gov or at the Fund’s website at www.jpmorganfunds.com no later than August 31 of each year. The Fund’s proxy voting record will include, among other things, a brief description of the matter voted on for each fund security, and will state how each vote was cast, for example, for or against the proposal.
| | |
| © JPMorgan Chase & Co., 2013. All rights reserved. December 2013. | |  |
ITEM 2. CODE OF ETHICS.
Disclose whether, as of the end of the period covered by the report, the registrant has adopted a code of ethics that applies to the registrant’s principal executive officer, principal financial officer, principal accounting officer or controller, or persons performing similar functions, regardless of whether these individuals are employed by the registrant or a third party. If the registrant has not adopted such a code of ethics, explain why it has not done so.
The registrant must briefly describe the nature of any amendment, during the period covered by the report, to a provision of its code of ethics that applies to the registrant’s principal executive officer, principal financial officer, principal accounting officer or controller, or persons performing similar functions, regardless of whether these individuals are employed by the registrant or a third party, and that relates to any element of the code of ethics definition enumerated in paragraph (b) of this Item. The registrant must file a copy of any such amendment as an exhibit pursuant to Item 12(a)(1), unless the registrant has elected to satisfy paragraph (f) of this Item by positing its code of ethics on its website pursuant to paragraph (f)(2) of this Item, or by undertaking to provide its code of ethics to any person without charge, upon request, pursuant to paragraph (f)(3) of this Item.
If the registrant has, during the period covered by the report, granted a waiver, including an implicit waiver, from a provision of the code of ethics that applies to the registrant’s principal executive officer, principal financial officer, principal accounting officer or controller, or persons performing similar functions, regardless of whether these individuals are employed by the registrant or third party, that relates to one or more items set forth in paragraph (b) of this Item, the registrant must briefly describe the nature of the waiver, the name of the person to whom the waiver was granted, and the date of the waiver.
The Registrant has adopted a code of ethics that applies to the Registrant’s principal executive officer and principal financial officer. There were no amendments to the code of ethics or waivers granted with respect to the code of ethics in the period covered by the report.
ITEM 3. AUDIT COMMITTEE FINANCIAL EXPERT.
(a) (1) Disclose that the registrant’s board of directors has determined that the registrant either:
(i) Has at least one audit committee financial expert serving on its audit committee; or
(ii) Does not have an audit committee financial expert serving on its audit committee.
The Registrant’s Board of Trustees has determined that the Registrant has at least one audit committee financial expert serving on its audit committee. The Securities and Exchange Commission has stated that the designation or identification of a person as an audit committee financial expert pursuant to this Item 3 of Form N-CSR does not impose on such person any duties, obligations or liabilities that are greater than the duties, obligations and liabilities imposed on such person as a member of the Audit Committee and the Board of Trustees in the absence of such designation or identification.
(2) If the registrant provides the disclosure required by paragraph (a)(1)(i) of this Item, it must disclose the name of the audit committee financial expert and whether that person is “independent.” In order to be considered “independent” for purposes of this Item, a member of an audit committee may not, other than in his or her capacity as a member of the audit committee, the board of directors, or any other board committee:
(i) Accept directly or indirectly any consulting, advisory, or other compensatory fee from the issuer; or
(ii) Be an “interested person” of the investment company as defined in Section 2(a)(19) of the Act (15 U.S.C. 80a-2(a)(19)).
The audit committee financial expert is James Schonbachler. He is not an “interested person” of the Registrant and is also “independent” as defined by the U.S. Securities and Exchange Commission for purposes of audit committee financial expert determinations.
(3) If the registrant provides the disclosure required by paragraph (a)(1)(ii) of this Item, it must explain why it does not have an audit committee financial expert.
Not applicable.
ITEM 4. PRINCIPAL ACCOUNTANT FEES AND SERVICES.
(a) Disclose, under the caption Audit Fees, the aggregate fees billed for each of the last two fiscal years for professional
services rendered by the principal accountant for the audit of the registrant’s annual financial statements or services that are normally provided by the accountant in connection with statutory and regulatory filings or engagements for those fiscal years.
AUDIT FEES
2017 – $224,600
2016 – Not applicable
(b) Disclose, under the caption Audit-Related Fees, the aggregate fees billed in each of the last two fiscal years for assurance and related services by the principal accountant that are reasonably related to the performance of the audit of the registrant’s financial statements and are not reported under paragraph (a) of this Item. Registrants shall describe the nature of the services comprising the fees disclosed under this category.
AUDIT-RELATED FEES
2017 – $22,263
2016 – Not applicable
Audit-related fees consists of semi-annual financial statement reviews and security count procedures performed as required under Rule 17f-2 of the Investment Company Act of 1940 during the Registrant’s fiscal year.
(c) Disclose, under the caption Tax Fees, the aggregate fees billed in each of the last two fiscal years for professional services rendered by the principal accountant for tax compliance, tax advice, and tax planning. Registrants shall describe the nature of the services comprising the fees disclosed under this category.
TAX FEES
2017 – $39,405
2016 – Not applicable
The tax fees consist of fees billed in connection with preparing the federal regulated investment company income tax returns for the Registrant for the tax years ended February 28, 2017 and February 29, 2016 – Not applicable, respectively.
For the last fiscal year, no tax fees were required to be approved pursuant to paragraph (c)(7)(ii) of Rule 2-01 of Regulation S-X.
(d) Disclose, under the caption All Other Fees, the aggregate fees billed in each of the last two fiscal years for products and services provided by the principal accountant, other than the services reported in paragraphs (a) through (c) of this Item. Registrants shall describe the nature of the services comprising the fees disclosed under this category.
ALL OTHER FEES
2017 – Not applicable
2016 – Not applicable
(e) (1) Disclose the audit committee’s pre-approval policies and procedures described in paragraph (c)(7) of Rule 2-01 of Regulation S-X.
Pursuant to the Registrant’s Audit Committee Charter and written policies and procedures for the pre-approval of audit and non-audit services (the “Pre-approval Policy”), the Audit Committee pre-approves all audit and non-audit services performed by the Registrant’s independent public registered accounting firm for the Registrant. In addition, the Audit Committee pre-approves the auditor’s engagement for non-audit services with the Registrant’s investment adviser (not including a sub-adviser whose role is primarily portfolio management and is sub-contracted or overseen by another investment adviser) and any Service Affiliate in accordance with paragraph (c)(7)(ii) of Rule 2-01 of Regulation S-X, if the engagement relates directly to the operations and financial reporting of the Registrant. Proposed services may be pre-approved either 1) without consideration of specific case-by-case services or 2) require the specific pre-approval of the Audit Committee. Therefore, initially the Pre-approval Policy listed a number of audit and non-audit services that have
been approved by the Audit Committee, or which were not subject to pre-approval under the transition provisions of Sarbanes-Oxley Act of 2002 (the “Pre-approval List”). The Audit Committee annually reviews and pre-approves the services included on the Pre-approval List that may be provided by the independent public registered accounting firm without obtaining additional specific pre-approval of individual services from the Audit Committee. The Audit Committee adds to, or subtracts from, the list of general pre-approved services from time to time, based on subsequent determinations. All other audit and non-audit services not on the Pre-approval List must be specifically pre-approved by the Audit Committee.
One or more members of the Audit Committee may be appointed as the Committee’s delegate for the purposes of considering whether to approve such services. Any pre-approvals granted by the delegate will be reported, for informational purposes only, to the Audit Committee at its next scheduled meeting. The Audit Committee’s responsibilities to pre-approve services performed by the independent public registered accounting firm are not delegated to management.
(2) Disclose the percentage of services described in each of paragraphs (b) through (d) of this Item that were approved by the audit committee pursuant to paragraph (c)(7)(i)(C) of Rule 2-01 of Regulation S-X.
2017 – 0.0%
2016 – Not applicable
(f) If greater than 50 percent, disclose the percentage of hours expended on the principal accountant’s engagement to audit the registrant’s financial statements for the most recent fiscal year that were attributed to work performed by persons other than the principal accountant’s full-time, permanent employees.
Not applicable - Less than 50%.
(g) Disclose the aggregate non-audit fees billed by the registrant’s accountant for services rendered to the registrant, and rendered to the registrant’s investment adviser (not including any sub-adviser whose role is primarily portfolio management and is subcontracted with or overseen by another investment adviser), and any entity controlling, controlled by, or under common control with the adviser that provides ongoing services to the registrant for each of the last two fiscal years of the registrant.
The aggregate non-audit fees billed by the independent registered public accounting firm for services rendered to the Registrant, and rendered to Service Affiliates, for the last two calendar year ends were:
2016 – $28.4 million
2016 – Not applicable
(h) Disclose whether the registrant’s audit committee of the board of directors has considered whether the provision of non-audit services that were rendered to the registrant’s investment adviser (not including any subadviser whose role is primarily portfolio management and is subcontracted with or overseen by another investment adviser), and any entity controlling, controlled by, or under common control with the investment adviser that provides ongoing services to the registrant that were not pre-approved pursuant to paragraph (c)(7)(ii) of Rule 2-01 of Regulation S-X is compatible with maintaining the principal accountant’s independence.
The Registrant’s Audit Committee has considered whether the provision of the non-audit services that were rendered to Service Affiliates that were not pre-approved (not requiring pre-approval) is compatible with maintaining the independent public registered accounting firm’s independence. All services provided by the independent public registered accounting firm to the Registrant or to Service Affiliates that were required to be pre-approved were pre-approved as required.
ITEM 5. AUDIT COMMITTEE OF LISTED REGISTRANTS.
(a) If the registrant is a listed issuer as defined in Rule 10A-3 under the Exchange Act (17CFR 240.10A-3), state whether or not the registrant has a separately-designated standing audit committee established in accordance with Section 3(a)(58)(A) of the Exchange Act (15 U.S.C. 78c(a)(58)(A)). If the registrant has such a committee, however designated, identify each committee member. If the entire board of directors is acting as the registrant’s audit committee as specified in Section 3(a)(58)(B) of the Exchange Act (15 U.S.C. 78c(a)(58)(B)), so state.
(b) If applicable, provide the disclosure required by Rule 10A-3(d) under the Exchange Act (17CFR 240.10A-3(d)) regarding an exemption from the listing standards for all audit committees.
Not applicable.
ITEM 6. SCHEDULE OF INVESTMENTS.
File Schedule I – Investments in securities of unaffiliated issuers as of the close of the reporting period as set forth in Section 210.12-12 of Regulation S-X, unless the schedule is included as part of the report to shareholders filed under Item 1 of this Form.
Included in Item 1.
ITEM 7. DISCLOSURE OF PROXY VOTING POLICIES AND PROCEDURES FOR CLOSED-END MANAGEMENT INVESTMENT COMPANIES.
A closed-end management investment company that is filing an annual report on this Form N-CSR must, unless it invests exclusively in non-voting securities, describe the policies and procedures that it uses to determine how to vote proxies relating to portfolio securities, including the procedures that the company uses when a vote presents a conflict between the interests of its shareholders, on the one hand, and those of the company’s investment adviser; principal underwriter; or any affiliated person (as defined in Section 2(a)(3) of the Investment Company Act of 1940 (15 U.S.C. 80a-2(a)(3)) and the rules thereunder) of the company, its investment adviser, or its principal underwriter, on the other. Include any policies and procedures of the company’s investment adviser, or any other third party, that the company uses, or that are used on the company’s behalf, to determine how to vote proxies relating to portfolio securities.
Not applicable.
ITEM 8. PORTFOLIO MANAGERS OF CLOSED-END MANAGEMENT INVESTMENT COMPANIES.
Not applicable.
ITEM 9. PURCHASE OF EQUITY SECURITIES BY CLOSED-END MANAGEMENT INVESTMENT COMPANY AND AFFILIATED PURCHASERS.
(a) If the registrant is a closed-end management investment company, provide the information specified in paragraph (b) of this Item with respect to any purchase made by or on behalf of the registrant or any “affiliated purchaser,” as defined in Rule 10b-18(a)(3) under the Exchange Act (17 CFR 240.10b-18(a)(3)), of shares or other units of any class of the registrant’s equity securities that is registered by the registrant pursuant to Section 12 of the Exchange Act (15 U.S.C. 781).
Not applicable.
ITEM 10. SUBMISSION OF MATTERS TO A VOTE OF SECURITY HOLDERS.
Describe any material changes to the procedures by which shareholders may recommend nominees to the registrant’s board of directors, where those changes were implemented after the registrant last provided disclosure in response to the requirements of Item 7(d)(2)(ii)(G) of Schedule 14A (17 CFR 240.14a-101), or this Item.
No material changes to report.
ITEM 11. CONTROLS AND PROCEDURES.
(a) Disclose the conclusions of the registrant’s principal executive and principal financial officers, or persons performing similar functions, regarding the effectiveness of the registrant’s disclosure controls and procedures (as defined in Rule 30a-3(c) under the Act (17 CFR 270.30a-3(c))) as of a date within 90 days of the filing date of the report that includes the disclosure required by this paragraph, based on the evaluation of these controls and procedures required by Rule 30a-3(b) under the Act (17 CFR 270.30a-3(b)) and Rules 13a-15(b) or 15d-15(b) under the Exchange Act (17 CFR 240.13a-15(b) or 240.15d-15(b)).
The Registrant’s principal executive and principal financial officers have concluded, based on their evaluation of the Registrant’s disclosure controls and procedures as of a date within 90 days of the filing date of this report, that the Registrant’s disclosure controls and procedures are reasonably designed to ensure that information required to be disclosed by the Registrant on Form N-CSR is recorded, processed, summarized and reported within the required time periods and that information required to be disclosed by the Registrant in the reports that it files or submits on Form N-CSR is accumulated and communicated to the Registrant’s management, including its principal executive and principal financial officers, as appropriate to allow timely decisions regarding required disclosure.
(b) Disclose any change in the registrant’s internal control over financial reporting (as defined in Rule 30a-3(d) under the Act (17 CFR 270.30a-3(d)) that occurred during the registrant’s second fiscal quarter of the period covered by this report that has materially affected, or is reasonably likely to materially affect, the registrant’s internal control over financial reporting.
There were no changes in the Registrant’s internal control over financial reporting that occurred during the last fiscal quarter covered by this report that have materially affected, or are reasonably likely to materially affect, the Registrant’s internal control over financial reporting.
ITEM 12. EXHIBITS.
(a) File the exhibits listed below as part of this Form. Letter or number the exhibits in the sequence indicated.
(a)(1) Any code of ethics, or amendment thereto, that is the subject of the disclosure required by Item 2, to the extent that the registrant intends to satisfy the Item 2 requirements through filing of an exhibit.
Code of Ethics applicable to its Principal Executive and Principal Financial Officers pursuant to Section 406 of the Sarbanes-Oxley Act of 2002 attached hereto.
(a)(2) A separate certification for each principal executive officer and principal financial officer of the registrant as required by Rule 30a-2(a) under the Act (17 CFR 270.30a-2).
Certifications pursuant to Rule 30a-2(a) under the Investment Company Act of 1940 are attached hereto.
(a)(3) Any written solicitation to purchase securities under Rule 23c-1 under the Act (17 CFR 270.23c-1) sent or given during the period covered by the report by or on behalf of the registrant to 10 or more persons.
Not applicable.
(b) A separate or combined certification for each principal executive officer and principal officer of the registrant as required by Rule 30a-2(b) under the Act of 1940.
Certifications pursuant to Rule 30a-2(b) under the Investment Company Act of 1940 are attached hereto.
SIGNATURES
Pursuant to the requirements of the Securities Exchange Act of 1934 and the Investment Company Act of 1940, the registrant has duly caused this report to be signed on its behalf by the undersigned, thereunto duly authorized.
JPMorgan Trust IV
| | |
| By: | | /s/ Brian S. Shlissel |
| | Brian S. Shlissel |
| | President and Principal Executive Officer |
| | May 4, 2017 |
Pursuant to the requirements of the Securities Exchange Act of 1934 and the Investment Company Act of 1940, this report has been signed below by the following persons on behalf of the registrant and in the capacities and on the dates indicated.
| | |
| By: | | /s/ Brian S. Shlissel |
| | Brian S. Shlissel |
| | President and Principal Executive Officer |
| | May 4, 2017 |
| |
| By: | | /s/ Laura M. Del Prato |
| | Laura M. Del Prato |
| | Treasurer and Principal Financial Officer |
| | May 4, 2017 |