UNITED STATES
SECURITIES AND EXCHANGE COMMISSION
Washington, D.C. 20549
FORM N-CSR
CERTIFIED SHAREHOLDER REPORT OF REGISTERED
MANAGEMENT INVESTMENT COMPANIES
Investment Company Act file number: 811-23117
JPMorgan Trust IV
(Exact name of registrant as specified in charter)
270 Park Avenue
New York, NY 10017
(Address of principal executive offices) (Zip code)
Frank J. Nasta
270 Park Avenue
New York, NY 10017
(Name and Address of Agent for Service)
Registrant’s telephone number, including area code: (800) 480-4111
Date of fiscal year end: Last day of February
Date of reporting period: March 1, 2017 through February 28, 2018
Form N-CSR is to be used by management investment companies to file reports with the Commission not later than 10 days after the transmission to stockholders of any report that is required to be transmitted to stockholders under Rule 30e-1 under the Investment Company Act of 1940 (17 CFR 270.30e-1). The Commission may use the information provided on Form N-CSR in its regulatory, disclosure review, inspection, and policymaking roles.
A registrant is required to disclose the information specified by Form N-CSR, and the Commission will make this information public. A registrant is not required to respond to the collection of information contained in Form N-CSR unless the Form displays a currently valid Office of Management and Budget (“OMB”) control number. Please direct comments concerning the accuracy of the information collection burden estimate and any suggestions for reducing the burden to Secretary, Securities and Exchange Commission, 450 Fifth Street, NW, Washington, DC 20549-0609. The OMB has reviewed this collection of information under the clearance requirements of 44 U.S.C. Section 3507.
ITEM 1. REPORTS TO STOCKHOLDERS.
The following is a copy of the report transmitted to shareholders pursuant to Rule 30e-1 under the Investment Company Act of 1940 (17 CFR 270.30e-1).
Annual Report
J.P. Morgan Municipal Bond Funds
February 28, 2018
JPMorgan Municipal Income Fund
JPMorgan Short-Intermediate Municipal Bond Fund
JPMorgan Tax Free Bond Fund
JPMorgan Ultra-Short Municipal Fund

CONTENTS
Investments in a Fund are not deposits or obligations of, or guaranteed or endorsed by, any bank and are not insured or guaranteed by the FDIC, the Federal Reserve Board or any other government agency. You could lose money if you sell when a Fund’s share price is lower than when you invested.
Past performance is no guarantee of future performance. The general market views expressed in this report are opinions based on market and other conditions through the end of the reporting period and are subject to change without notice. These views are not intended to predict the future performance of a Fund or the securities markets. References to specific securities and their issuers are for illustrative purposes only and are not intended to be, and should not be interpreted as, recommendations to purchase or sell such securities. Such views are not meant as investment advice and may not be relied on as an indication of trading intent on behalf of any Fund.
Prospective investors should refer to the Funds’ prospectuses for a discussion of the Funds’ investment objectives, strategies and risks. Call J.P. Morgan Funds Service Center at 1-800-480-4111 for a prospectus containing more complete information about a Fund, including management fees and other expenses. Please read it carefully before investing.
CEO’S LETTER
March 29, 2018 (Unaudited)
Dear Shareholder,
The global economic expansion continued through its ninth consecutive year, supported by central bank policies, corporate earnings growth, consumer confidence and stable energy prices. Global equity and bond prices generally rose throughout the twelve months ended February 28, 2018, but fought to rebound from a sharp sell-off in early February.
| | |
 | | “Key fundamental drivers of asset prices remain in place even as financial market volatility has risen from the historic lows seen throughout 2017.” — George C.W. Gatch |
During the reporting period, the U.S. Federal Reserve (the “Fed”) raised benchmark interest rates three times in response to a tightening labor market and early but muted signs of price inflation. Meanwhile, U.S. gross domestic product (GDP) surged to a better-than-expected 2.9% in the final quarter of 2017, and early indicators pointed to a continued seasonal pattern of weaker but positive GDP growth for the first quarter of 2018.
Labor markets in the U.S. continued to tighten, with the unemployment rate falling to 4.1% in October and remaining at that level through February. Labor force participation rates also rose somewhat but wage growth remained subdued.
Meanwhile, surging U.S. consumer confidence, record low volatility in financial markets and the December enactment of tax cut legislation appeared to provide additional fuel to the rally in equities that lasted from March through January. The Standard & Poor’s 500 Index (the “S&P 500”) reached record closing highs throughout the reporting period until February’s sell-off, which snapped a 15-month run of gains. Amid the sell-off, prices for government and corporate bonds plummeted.
Analysts largely attributed the sell-off to investor concerns that signs of rising inflation would prompt the Fed to accelerate the rollout of future interest rates increases. Historically high equity market valuations added fuel to the sell-off. While equity prices had somewhat rebounded by the end of February, bond prices remained under pressure.
In response to continued economic growth, the European Central Bank in January reduced its monthly asset purchases by
half, though it left its benchmark interest rate unchanged at 0%. In November, the Bank of England raised interest rates for the first time in a decade and preparations for Britain’s exit from the European Union continued to move forward. Political uncertainty in Europe appeared to recede somewhat. In May, centrist politician Emmanuel Macron decisively defeated a challenge from far-right candidate Marine Le Pen to become France’s president. In October, a separatist movement in Spain’s Catalonia region was largely thwarted by the central government in Madrid. And at the end of the reporting period, German Chancellor Angela Merkel ended a political stalemate by successfully forming a governing coalition.
Emerging market nations continued to benefit from robust growth in China, rising commodity prices and strong global demand for goods. Emerging markets debt, which generated strong returns for investors during most of the reporting period, began to weaken late in 2017 amid a decline in the value of the U.S. dollar, which effectively raises export prices.
Key fundamental drivers of asset prices remain in place even as financial market volatility has risen from the historic lows seen throughout 2017. While leading central banks have edged toward policy normalization, they largely continue to be accommodative to financial markets. Corporate earnings have increased and business investment began to rise in the latter part of the reporting period. Consumer sentiment is buoyant and the global economy continued to expand in a synchronized fashion. Investors who hold a long-term outlook, while remaining fully invested in a well-diversified portfolio, will be best positioned, we believe, to navigate the current market environment.
We look forward to managing your investment needs for years to come. Should you have any questions, please visit www.jpmorganfunds.com or contact the J.P. Morgan Funds Service Center at 1-800-480-4111.
Sincerely yours,

George C.W. Gatch
CEO, Global Funds Management
J.P. Morgan Asset Management
| | | | | | | | |
| | | |
| FEBRUARY 28, 2018 | | J.P. MORGAN MUNICIPAL BOND FUNDS | | | | | 1 | |
J.P. Morgan Municipal Bond Funds
MARKET OVERVIEW
TWELVE MONTHS ENDED FEBRUARY 28, 2018 (Unaudited)
Returns for U.S. municipal bonds were modestly positive. Interest rates rose during the second half of the reporting period and bond yields, which move in the opposite direction of prices, rose most among bonds with shorter maturities. In early February 2018, a sharp sell-off pushed down prices for both fixed income and equity securities. Generally, investors blamed the sell-off on a surge in U.S. Treasury bond yields, uncertainty about U.S. Federal Reserve policy and historically high equity valuations.
By the end of the reporting period, U.S. stock prices had rebounded somewhat, while yields on corporate bonds and U.S. Treasury bonds remained at elevated levels. Overall, bond prices were weighed down by expectations of accelerating inflation rising and interest rates as the U.S. economic expansion neared its ninth year.
For the twelve months ended February 28, 2018, the Bloomberg Barclays Municipal Bond Index returned 2.50%.
| | | | | | |
| | | |
| 2 | | | | J.P. MORGAN MUNICIPAL BOND FUNDS | | FEBRUARY 28, 2018 |
JPMorgan Municipal Income Fund
FUND COMMENTARY
TWELVE MONTHS ENDED FEBRUARY 28, 2018 (Unaudited)
| | | | |
| REPORTING PERIOD RETURN: | |
| Fund (Class I Shares)1, * | | | 1.42% | |
| Bloomberg Barclays U.S. 1-15 Year Blend (1-17) Municipal Bond Index | | | 1.76% | |
| |
| Net Assets as of 2/28/2018 (In Thousands) | | | $217,295 | |
| Duration as of 2/28/2018 | | | 5.0 years | |
INVESTMENT OBJECTIVE**
The JPMorgan Municipal Income Fund (the “Fund”) seeks current income exempt from federal income taxes.
WHAT WERE THE MAIN DRIVERS OF THE FUND’S PERFORMANCE?
For the twelve months ended February 28, 2018, the Fund’s Class I Shares underperformed the Bloomberg Barclays U.S. 1-15 Year Blend (1-17) Municipal Bond Index (the “Benchmark”).
Relative to the Benchmark, the Fund’s underweight position in the intermediate and longer portions of the yield curve detracted from performance. The yield curve shows the relationship between yields and maturity dates for a set of similar bonds at a given point in time. The Fund’s overweight positions in the housing sector and in bonds rated AAA also detracted from relative performance.
The Fund’s overweight position in revenue bonds was a leading contributor to performance relative to the Benchmark. The Fund had no allocation to pre-refunded bonds, which contributed to relative performance. The Fund’s overweight allocation to education bonds and its underweight allocation to bonds rated AA also helped relative performance.
HOW WAS THE FUND POSITIONED?
The Fund’s portfolio managers continued to emphasize higher yielding sectors, particularly the housing sector. At the end of
the twelve month period, the Fund’s overall duration was roughly in line with that of the Benchmark. Duration measures the price sensitivity for a portfolio of bonds. Bonds with a longer duration will experience a larger increase in price than short duration bonds when interest rates fall.
| | | | |
CREDIT QUALITY ALLOCATIONS*** | |
| AAA | | | 24.3 | % |
| AA | | | 44.8 | |
| A | | | 23.8 | |
| BBB | | | 6.0 | |
| BB | | | 0.1 | |
| NR | | | 1.0 | |
| 1 | | On April 3, 2017, the Fund’s Select Class Shares were renamed Class I Shares. |
| * | | The return shown is based on net asset values calculated for shareholder transactions and may differ from the return shown in the financial highlights, which reflects adjustments made to the net asset values in accordance with accounting principles generally accepted in the United States of America. |
| ** | | The adviser seeks to achieve the Fund’s objective. There can be no guarantee it will be achieved. |
| *** | | Percentages indicated are based on total investments as of February 28, 2018. The Fund’s portfolio composition is subject to change. |
| | | | | | | | |
| | | |
| FEBRUARY 28, 2018 | | J.P. MORGAN MUNICIPAL BOND FUNDS | | | | | 3 | |
JPMorgan Municipal Income Fund
FUND COMMENTARY
TWELVE MONTHS ENDED FEBRUARY 28, 2018 (Unaudited) (continued)
| | | | | | | | | | | | | | |
AVERAGE ANNUAL TOTAL RETURNS AS OF FEBRUARY 28, 2018 | |
| | | | |
| | | INCEPTION DATE OF
CLASS | | 1 YEAR | | | 5 YEAR | | | 10 YEAR | |
| | | | | | | | | | | | | | |
CLASS A SHARES | | February 23, 1993 | | | | | | | | | | | | |
With Sales Charge* | | | | | (2.65 | )% | | | 0.92 | % | | | 2.93 | % |
Without Sales Charge | | | | | 1.16 | | | | 1.71 | | | | 3.33 | |
CLASS C SHARES | | November 4, 1997 | | | | | | | | | | | | |
With CDSC** | | | | | (0.49 | ) | | | 1.11 | | | | 2.73 | |
Without CDSC | | | | | 0.51 | | | | 1.11 | | | | 2.73 | |
CLASS I SHARES (FORMERLY SELECT CLASS SHARES) | | February 9, 1993 | | | 1.42 | | | | 1.96 | | | | 3.58 | |
CLASS R6 SHARES | | November 6, 2017 | | | 1.46 | | | | 1.96 | | | | 3.59 | |
| * | | Sales Charge for Class A Shares is 3.75%. |
| ** | | Assumes a 1% CDSC (contingent deferred sales charge) for the one year period and 0% CDSC thereafter. |
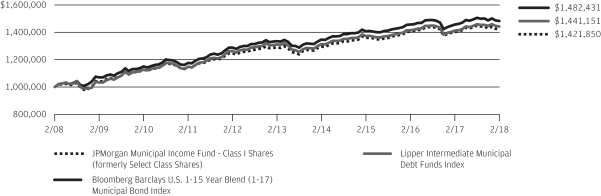
TEN YEAR PERFORMANCE (2/29/08 TO 2/28/18)
The performance quoted is past performance and is not a guarantee of future results. Mutual funds are subject to certain market risks. Investment returns and principal value of an investment will fluctuate so that an investor’s shares, when redeemed, may be worth more or less than their original cost. Current performance may be higher or lower than the performance data shown. For up-to-date, month-end performance information please call 1-800-480-4111.
Returns for Class R6 Shares prior to its inception date are based on the performance of Class I Shares. The actual returns of Class R6 Shares would have been different than those shown because Class R6 Shares had different expenses than Class I Shares.
The graph illustrates comparative performance for $1,000,000 invested in Class I Shares of the JPMorgan Municipal Income Fund, the Bloomberg Barclays U.S. 1-15 Year Blend (1-17) Municipal Bond Index and the Lipper Intermediate Municipal Debt Funds Index from February 29, 2008 to February 28, 2018. The performance of the Fund assumes reinvestment of all dividends and capital gain distributions, if any, and does not include a sales charge. The performance of the Bloomberg Barclays U.S. 1-15 Year Blend (1-17) Municipal Bond Index does not reflect the deduction of expenses or a sales charge associated with a mutual fund and has been adjusted to reflect reinvestment of all dividends and capital gain distributions of the securities included in the benchmark, if applicable. The performance of the Lipper Intermediate Municipal Debt Funds Index
includes expenses associated with a mutual fund, such as investment management fees. These expenses are not identical to the expenses incurred by the Fund. The Bloomberg Barclays U.S. 1-15 Year Blend (1-17) Municipal Bond Index represents the performance of municipal bonds with maturities from 1 to 17 years. The Lipper Intermediate Municipal Debt Funds Index is an index based on the total returns of certain mutual funds within the Fund’s designated category as determined by Lipper, Inc. Investors cannot invest directly in an index.
Capital gain distributions are subject to federal income tax; a portion of the Fund’s income distributions may be subject to the alternative minimum tax and some investors may be subject to certain state and local taxes.
Class I Shares have a $1,000,000 minimum initial investment.
Fund performance may reflect the waiver of the Fund’s fees and reimbursement of expenses for certain periods since the inception date. Without these waivers and reimbursements, performance would have been lower. Also, performance shown in this section does not reflect the deduction of taxes that a shareholder would pay on Fund distributions or redemptions of Fund shares.
The returns shown are based on net asset values calculated for shareholder transactions and may differ from the returns shown in the financial highlights, which reflect adjustments made to the net asset values in accordance with accounting principles generally accepted in the United States of America.
| | | | | | |
| | | |
| 4 | | | | J.P. MORGAN MUNICIPAL BOND FUNDS | | FEBRUARY 28, 2018 |
JPMorgan Short-Intermediate Municipal Bond Fund
FUND COMMENTARY
TWELVE MONTHS ENDED FEBRUARY 28, 2018 (Unaudited)
| | | | |
| REPORTING PERIOD RETURN: | |
| Fund (Class A Shares, without a sales charge)* | | | 0.26% | |
| Bloomberg Barclays U.S. 1-5 Year Blend (1-6) Municipal Bond Index | | | 0.59% | |
| |
| Net Assets as of 2/28/2018 (In Thousands) | | | $1,719,586 | |
| Duration as of 2/28/2018 | | | 3.8 years | |
INVESTMENT OBJECTIVE**
The JPMorgan Short-Intermediate Municipal Bond Fund (the “Fund”) seeks as high a level of current income exempt from federal income tax as is consistent with relative stability of principal.
WHAT WERE THE MAIN DRIVERS OF THE FUND’S PERFORMANCE?
For the twelve months ended February 28, 2018, the Fund underperformed the Bloomberg Barclays U.S. 1-5 Year Blend (1-6) Municipal Bond Index (the “Benchmark”). During the reporting period, interest rates in the U.S. generally rose, particularly for bonds with shorter maturities, and investors generally continued to favor lower quality fixed income securities.
Relative to the Benchmark, the Fund’s underweight position in lower quality sectors, including industrial development revenue/pollution control revenue bonds and bonds issued by New Jersey, detracted from performance. The Fund’s overweight position in electricity sector bonds and its underweight position in bonds rated BBB also detracted from relative performance.
The Fund’s overall duration was longer than that of the Benchmark and contributed to relative performance. Duration measures the price sensitivity of a portfolio of bonds to changes in interest rates. Generally, bonds with longer duration will experience a larger increase in price as interest rates fall. The Fund’s overweight positions in the short and long ends of the yield curve also helped relative performance. The yield curve
shows the relationship between yields and maturity dates for a set of similar bonds at a given point in time. The Fund’s overweight position in revenue bonds and its underweight position in pre-refunded bonds also helped relative performance.
HOW WAS THE FUND POSITIONED?
During the reporting period, the Fund employed a bottom-up, security selection-based investment approach. The Fund’s portfolio managers sought to take advantage of opportunities stemming from increased volatility, supply pressures and headline credit risk, while maintaining the Fund’s bias toward higher quality issuances.
| | | | |
CREDIT QUALITY ALLOCATIONS*** | |
| AAA | | | 23.4 | % |
| AA | | | 51.4 | |
| A | | | 20.0 | |
| BBB | | | 3.4 | |
| NR | | | 1.8 | |
| * | | The return shown is based on net asset values calculated for shareholder transactions and may differ from the return shown in the financial highlights, which reflects adjustments made to the net asset values in accordance with accounting principles generally accepted in the United States of America. |
| ** | | The adviser seeks to achieve the Fund’s objective. There can be no guarantee it will be achieved. |
| *** | | Percentages indicated are based on total investments as of February 28, 2018. The Fund’s portfolio composition is subject to change. |
| | | | | | | | |
| | | |
| FEBRUARY 28, 2018 | | J.P. MORGAN MUNICIPAL BOND FUNDS | | | | | 5 | |
JPMorgan Short-Intermediate Municipal Bond Fund
FUND COMMENTARY
TWELVE MONTHS ENDED FEBRUARY 28, 2018 (Unaudited) (continued)
| | | | | | | | | | | | | | | | |
AVERAGE ANNUAL TOTAL RETURNS AS OF FEBRUARY 28, 2018 | |
| | | INCEPTION DATE OF
CLASS | | | 1 YEAR | | | 5 YEAR | | | 10 YEAR | |
CLASS A SHARES | | | May 4, 1998 | | | | | | | | | | | | | |
With Sales Charge* | | | | | | | (1.99 | )% | | | (0.02 | )% | | | 1.16 | % |
Without Sales Charge | | | | | | | 0.26 | | | | 0.43 | | | | 1.39 | |
CLASS C SHARES | | | November 1, 2001 | | | | | | | | | | | | | |
With CDSC** | | | | | | | (1.19 | ) | | | (0.06 | ) | | | 0.88 | |
Without CDSC | | | | | | | (0.19 | ) | | | (0.06 | ) | | | 0.88 | |
CLASS I SHARES (FORMERLY INSTITUTIONAL CLASS SHARES) | | | June 19, 2009 | | | | 0.70 | | | | 0.92 | | | | 1.85 | |
| * | | Sales Charge for Class A Shares is 2.25%. |
| ** | | Assumes a 1% CDSC (contingent deferred sales charge) for the one year period and 0% CDSC thereafter. |
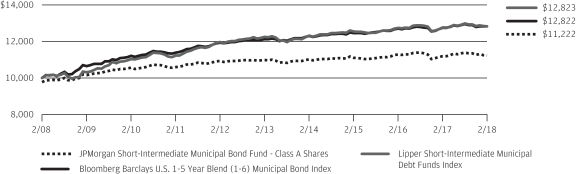
TEN YEAR PERFORMANCE (2/29/08 TO 2/28/18)
The performance quoted is past performance and is not a guarantee of future results. Mutual funds are subject to certain market risks. Investment returns and principal value of an investment will fluctuate so that an investor’s shares, when redeemed, may be worth more or less than their original cost. Current performance may be higher or lower than the performance data shown. For up-to-date, month-end performance information please call 1-800-480-4111.
Returns for Class I Shares prior to its inception date are based on the performance of Class A Shares. The actual returns of Class I Shares would have been different than those shown because Class I Shares had different expenses than Class A Shares.
The graph illustrates comparative performance for $10,000 invested in Class A Shares of the JPMorgan Short-Intermediate Municipal Bond Fund, the Bloomberg Barclays U.S. 1-5 Year Blend (1-6) Municipal Bond Index and the Lipper Short-Intermediate Municipal Debt Funds Index from February 29, 2008 to February 28, 2018. The performance of the Fund assumes reinvestment of all dividends and capital gain distributions, if any, and does not include a sales charge. The performance of the Bloomberg Barclays U.S. 1-5 Year Blend (1-6) Municipal Bond Index does not reflect the deduction of expenses or a sales charge associated with a mutual fund and has been adjusted to reflect reinvestment of all dividends and capital gain distributions of the securities included in the benchmark, if applicable. The performance of the Lipper Short-Intermediate Municipal Debt Funds Index includes expenses associated with a mutual fund,
such as investment management fees. These expenses are not identical to the expenses incurred by the Fund. The Bloomberg Barclays U.S. 1-5 Year Blend (1-6) Municipal Bond Index is an unmanaged index of investment grade tax-exempt municipal bonds with maturities of 1–5.999 years. The Lipper Short-Intermediate Municipal Debt Funds Index represents the total returns of certain mutual funds within the Fund’s designated category as determined by Lipper, Inc. Investors cannot invest directly in an index.
Capital gain distributions are subject to federal income tax; a portion of the Fund’s income distributions may be subject to the alternative minimum tax and some investors may be subject to certain state and local taxes.
Class A Shares have a $1,000 minimum initial investment and carry a 2.25% sales charge.
Fund performance may reflect the waiver of the Fund’s fees and reimbursement of expenses for certain periods since the inception date. Without these waivers and reimbursements, performance would have been lower. Also, performance shown in this section does not reflect the deduction of taxes that a shareholder would pay on Fund distributions or redemptions of Fund shares.
The returns shown are based on net asset values calculated for shareholder transactions and may differ from the returns shown in the financial highlights, which reflect adjustments made to the net asset values in accordance with accounting principles generally accepted in the United States of America.
| | | | | | |
| | | |
| 6 | | | | J.P. MORGAN MUNICIPAL BOND FUNDS | | FEBRUARY 28, 2018 |
JPMorgan Tax Free Bond Fund
FUND COMMENTARY
TWELVE MONTHS ENDED FEBRUARY 28, 2018 (Unaudited)
| | | | |
| Bloomberg Barclays U.S. Municipal Index (formerly Bloomberg Barclays Municipal Bond Index) | | | | |
|
| REPORTING PERIOD RETURN: | |
| Fund (Class A Shares, without a sales charge)* | | | 2.36% | |
| Bloomberg Barclays Municipal Bond Index | | | 2.50% | |
| |
| Net Assets as of 2/28/2018 (In Thousands) | | | $316,025 | |
| Duration as of 2/28/2018 | | | 6.2 years | |
INVESTMENT OBJECTIVE**
The JPMorgan Tax Free Bond Fund (the “Fund”) seeks as high a level of current income exempt from federal income tax as is consistent with relative stability of principal.
WHAT WERE THE MAIN DRIVERS OF THE FUND’S PERFORMANCE?
For the twelve months ended February 28, 2018, the Fund underperformed the Bloomberg Barclays Municipal Bond Index (the “Benchmark”). During the reporting period, interest rates generally rose and investors continued to favor lower rated bonds.
Relative to the Benchmark, the Fund’s overweight position in pre-refunded bonds was a leading detractor from performance. The Fund’s overweight position in the electricity sector and its underweight position in the housing sector also detracted from relative performance.
The Fund’s overweight position in bonds with maturities of eight years or longer was a leading contributor to performance relative to the Benchmark. The Fund’s longer duration positions in the transportation and hospital sectors also made a positive contribution to relative performance. Duration measures the price sensitivity of a portfolio of bonds to relative changes in interest rates. Generally, bonds with longer duration will experience a larger increase or decrease in price as interest
rates fall or rise, respectively, versus bonds with shorter duration.
HOW WAS THE FUND POSITIONED?
The Fund continued to employ a bottom-up, security selection-based investment approach and sought to take advantage of opportunities stemming from increased volatility, supply pressures and headline credit risk.
| | | | |
CREDIT QUALITY ALLOCATIONS*** | |
| AAA | | | 16.3 | % |
| AA | | | 60.5 | |
| A | | | 13.3 | |
| BBB | | | 6.2 | |
| NR | | | 3.7 | |
| * | | The return shown is based on net asset values calculated for shareholder transactions and may differ from the return shown in the financial highlights, which reflects adjustments made to the net asset values in accordance with accounting principles generally accepted in the United States of America. |
| ** | | The adviser seeks to achieve the Fund’s objective. There can be no guarantee it will be achieved. |
| *** | | Percentages indicated are based on total investments as of February 28, 2018. The Fund’s portfolio composition is subject to change. |
| | | | | | | | |
| | | |
| FEBRUARY 28, 2018 | | J.P. MORGAN MUNICIPAL BOND FUNDS | | | | | 7 | |
JPMorgan Tax Free Bond Fund
FUND COMMENTARY
TWELVE MONTHS ENDED FEBRUARY 28, 2018 (Unaudited) (continued)
| | | | | | | | | | | | | | |
AVERAGE ANNUAL TOTAL RETURNS AS OF FEBRUARY 28, 2018 | |
| | | INCEPTION DATE OF
CLASS | | 1 YEAR | | | 5 YEAR | | | 10 YEAR | |
CLASS A SHARES | | March 1, 1988 | | | | | | | | | | | | |
With Sales Charge* | | | | | (1.44 | )% | | | 1.79 | % | | | 3.62 | % |
Without Sales Charge | | | | | 2.36 | | | | 2.57 | | | | 4.01 | |
CLASS C SHARES | | July 1, 2008 | | | | | | | | | | | | |
With CDSC** | | | | | 0.70 | | | | 1.88 | | | | 3.32 | |
Without CDSC | | | | | 1.70 | | | | 1.88 | | | | 3.32 | |
CLASS I SHARES (FORMERLY SELECT CLASS SHARES) | | February 1, 1995 | | | 2.60 | | | | 2.76 | | | | 4.20 | |
| * | | Sales Charge for Class A Shares is 3.75%. |
| ** | | Assumes a 1% CDSC (contingent deferred sales charge) for the one year period and 0% CDSC thereafter. |
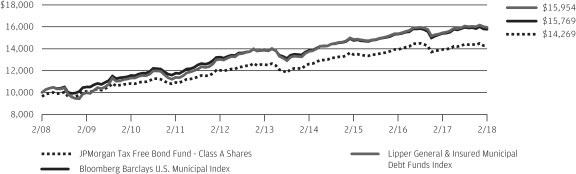
TEN YEAR PERFORMANCE (2/29/08 TO 2/28/18)
The performance quoted is past performance and is not a guarantee of future results. Mutual funds are subject to certain market risks. Investment returns and principal value of an investment will fluctuate so that an investor’s shares, when redeemed, may be worth more or less than their original cost. Current performance may be higher or lower than the performance data shown. For up-to-date, month-end performance information please call 1-800-480-4111.
Returns for Class C Shares prior to its inception date are based on the performance of Class B Shares, all of which converted to Class A Shares on June 19, 2015. The actual returns of Class C Shares would have been similar to those shown because Class C Shares had similar expenses to Class B Shares.
The graph illustrates comparative performance for $10,000 invested in Class A Shares of the JPMorgan Tax Free Bond Fund, the Bloomberg Barclays U.S. Municipal Index and the Lipper General & Insured Municipal Debt Funds Index from February 29, 2008 to February 28, 2018. The performance of the Fund assumes reinvestment of all dividends and capital gain distributions, if any, and includes a sales charge. The performance of the Bloomberg Barclays U.S. Municipal Index does not reflect the deduction of expenses or a sales charge associated with a mutual fund and has been adjusted to reflect reinvestment of all dividends and capital gain distributions of the securities included in the benchmark, if applicable. The performance of the Lipper General & Insured Municipal Debt Funds Index includes expenses associated with a
mutual fund, such as investment management fees. These expenses are not identical to the expenses incurred by the Fund. The Bloomberg Barclays U.S. Municipal Index is a total return performance benchmark for the long-term, investment-grade tax-exempt bond market. The Lipper General & Insured Municipal Debt Funds Index represents the total returns of certain mutual funds within the Fund’s designated category as defined by Lipper, Inc. Investors cannot invest directly in an index.
Capital gain distributions are subject to federal income tax; a portion of the Fund’s income distributions may be subject to the alternative minimum tax and some investors may be subject to certain state and local taxes.
Class A Shares have a $1,000 minimum initial investment and carry a 3.75% sales charge.
Fund performance may reflect the waiver of the Fund’s fees and reimbursement of expenses for certain periods since the inception date. Without these waivers and reimbursements, performance would have been lower. Also, performance shown in this section does not reflect the deduction of taxes that a shareholder would pay on Fund distributions or redemptions of Fund shares.
The returns shown are based on net asset values calculated for shareholder transactions and may differ from the returns shown in the financial highlights, which reflect adjustments made to the net asset values in accordance with accounting principles generally accepted in the United States of America.
| | | | | | |
| | | |
| 8 | | | | J.P. MORGAN MUNICIPAL BOND FUNDS | | FEBRUARY 28, 2018 |
JPMorgan Ultra-Short Municipal Fund
FUND SUMMARY
TWELVE MONTHS ENDED FEBRUARY 28, 2018 (Unaudited)
| | | | |
| REPORTING PERIOD RETURN: | |
| Fund (Class I Shares)1, * | | | 0.63% | |
| Bloomberg Barclays 1 Year Municipal Bond Index | | | 0.68% | |
| |
| Net Assets as of 2/28/2018 (In Thousands) | | | $2,065,069 | |
| Duration as of 2/28/2018 | | | 0.6 years | |
INVESTMENT OBJECTIVE**
The JPMorgan Ultra-Short Municipal Fund (the “Fund”) seeks as high a level of current income exempt from federal income tax as is consistent with relative stability of principal.
WHAT WERE THE MAIN DRIVERS OF THE FUND’S PERFORMANCE?
For the twelve months ended February 28, 2018, the Fund underperformed the Bloomberg Barclays 1 Year Municipal Bond Index (the “Benchmark”). Interest rates generally fell during the first half of the reporting period before rising somewhat during the latter portion of the period. Investor appetite for lower rated bonds remained strong throughout the period.
Relative to the Benchmark, the Fund’s underweight position in bonds rated single-A and BBB detracted from performance. The Fund’s underweight positions in the transportation and water & sewer sectors also detracted from relative performance.
The Fund’s allocation to floating rate bonds, which are not held in the Benchmark, was a leading contributor to relative performance. The Fund’s underweight position in pre-refunded bonds also contributed to relative performance.
Relative to the Benchmark, the Fund’s shorter duration profile was a leading detractor from performance. Generally, a portfolio of bonds with shorter duration will experience a smaller increase in price as interest rates fall versus bonds with longer duration. The Fund’s underweight position in bond rated
single-A and BBB detracted from performance as lower quality bonds outperformed higher rated bonds.
HOW WAS THE FUND POSITIONED?
During the reporting period, the Fund’s managers sought to maintain an average weighted maturity of two years or less and used a risk/reward analysis to identify investments that they believed would perform well over market cycles.
| | | | |
CREDIT QUALITY ALLOCATIONS*** | |
| AAA | | | 18.6 | % |
| AA | | | 40.8 | |
| A | | | 11.8 | |
| BBB | | | 3.2 | |
| BB | | | 0.2 | |
| NR | |
| 25.4
|
|
| 1 | | On April 3, 2017, the Fund’s Select Class Shares were renamed Class I Shares. |
| * | | The return shown is based on net asset values calculated for shareholder transactions and may differ from the return shown in the financial highlights, which reflects adjustments made to the net asset values in accordance with accounting principles generally accepted in the United States of America. |
| ** | | The adviser seeks to achieve the Fund’s objective. There can be no guarantee it will be achieved. |
| *** | | Percentages indicated are based on total investments as of February 28, 2018. The Fund’s portfolio composition is subject to change. |
| | | | | | | | |
| | | |
| FEBRUARY 28, 2018 | | J.P. MORGAN MUNICIPAL BOND FUNDS | | | | | 9 | |
JPMorgan Ultra-Short Municipal Fund
FUND SUMMARY
TWELVE MONTHS ENDED FEBRUARY 28, 2018 (Unaudited) (continued)
| | | | | | | | | | | | |
AVERAGE ANNUAL TOTAL RETURNS AS OF FEBRUARY 28, 2018 | |
| | | INCEPTION DATE OF
CLASS | | | 1 YEAR | | | SINCE
INCEPTION | |
CLASS A SHARES | | | May 31, 2016 | | | | | | | | | |
With Sales Charge* | | | | | | | (1.78 | )% | | | (0.73 | )% |
Without Sales Charge | | | | | | | 0.47 | | | | 0.57 | |
CLASS I SHARES (FORMERLY SELECT CLASS SHARES) | | | May 31, 2016 | | | | 0.63 | | | | 0.73 | |
| * | | Sales Charge for Class A Shares is 2.25%. |
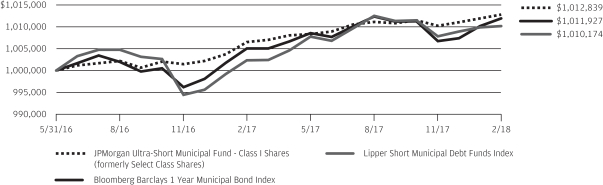
LIFE OF FUND PERFORMANCE (5/31/16 TO 2/28/18)
The performance quoted is past performance and is not a guarantee of future results. Mutual funds are subject to certain market risks. Investment returns and principal value of an investment will fluctuate so that an investor’s shares, when redeemed, may be worth more or less than their original cost. Current performance may be higher or lower than the performance data shown. For up-to-date, month-end performance information please call 1-800-480-4111.
The Fund commenced operations on May 31, 2016.
The graph illustrates comparative performance for $1,000,000 invested in Class I Shares of the JPMorgan Ultra-Short Municipal Fund, the Bloomberg Barclays 1 Year Municipal Bond Index and the Lipper Short Municipal Debt Funds Index from May 31, 2016 to February 28, 2018. The performance of the Fund assumes reinvestment of all dividends and capital gain distributions, if any, and does not include a sales charge. The performance of the Bloomberg Barclays 1 Year Municipal Bond Index does not reflect the deduction of expenses or a sales charge associated with a mutual fund and has been adjusted to reflect reinvestment of all dividends and capital gain distributions of securities included in the benchmark, if applicable. The performance of the Lipper Short Municipal Debt Funds Index includes expenses associated with a mutual fund, such as investment management fees. These expenses are not identical to the expenses incurred by the Fund. The Bloomberg Barclays 1 Year Municipal Bond Index is an unmanaged index that includes bonds with a minimum credit rating of BAA3, are issued as part of a deal of at least $50 million, have an amount
outstanding of at least $5 million, and have maturities of 1 to 2 years. The Lipper Short Municipal Debt Funds Index is an index based on the total returns of certain mutual funds within the Fund’s designated category as determined by Lipper, Inc. Investors cannot invest directly in an index.
Capital gain distributions are subject to federal income tax; a portion of the Fund’s income distributions may be subject to the alternative minimum tax and some investors may be subject to certain state and local taxes.
Class I Shares have a $1,000,000 minimum initial investment.
Subsequent to the inception of the Fund on May 31, 2016 until August 31, 2016, the Fund did not experience any shareholder activity. If such shareholder activity had occurred, the Fund’s performance may have been impacted.
Fund performance may reflect the waiver of the Fund’s fees and reimbursement of expenses for certain periods since the inception date. Without these waivers and reimbursements, performance would have been lower. Also, performance shown in this section does not reflect the deduction of taxes that a shareholder would pay on Fund distributions or redemptions of Fund shares.
The returns shown are based on net asset values calculated for shareholder transactions and may differ from the returns shown in the financial highlights, which reflect adjustments made to the net asset values in accordance with accounting principles generally accepted in the United States of America.
| | | | | | |
| | | |
| 10 | | | | J.P. MORGAN MUNICIPAL BOND FUNDS | | FEBRUARY 28, 2018 |
JPMorgan Municipal Income Fund
SCHEDULE OF PORTFOLIO INVESTMENTS
AS OF FEBRUARY 28, 2018
(Amounts in thousands)
| | | | | | | | |
PRINCIPAL
AMOUNT($) | | | SECURITY DESCRIPTION | | VALUE($) | |
| | Municipal Bonds — 96.8% (t) | |
| | | | Alabama — 1.1% | |
| | | | Utility — 1.1% | |
| | 2,000 | | | The Lower Alabama Gas District, Gas Project, Series A, Rev., 5.00%, 09/01/2031 | | | 2,338 | |
| | | | | | | | |
| | | | Alaska — 0.4% | |
| | | | Housing — 0.4% | |
| | 945 | | | Alaska Housing Finance Corp., General Mortgage, Series A, Rev., 3.50%, 06/01/2046 | | | 981 | |
| | | | | | | | |
| | | | Arizona — 2.5% | |
| | | | Water & Sewer — 2.5% | |
| | 2,645 | | | City of Scottsdale, Water & Sewer System, Rev., 5.25%, 07/01/2022 | | | 3,011 | |
| | 2,150 | | | City of Tucson, Water System, Rev., 5.00%, 07/01/2024 | | | 2,501 | |
| | | | | | | | |
| | | | Total Arizona | | | 5,512 | |
| | | | | | | | |
| | | | California — 1.0% | |
| | | | General Obligation — 0.4% | |
| | 1,000 | | | Salinas Union High School District, GO, BAN, Zero Coupon, 08/01/2020 | | | 953 | |
| | | | | | | | |
| | | | Hospital — 0.2% | |
| | 410 | | | California Municipal Finance Authority, Eisenhower Medical Center, Series B, Rev., 5.00%, 07/01/2026 | | | 473 | |
| | | | | | | | |
| | | | Other Revenue — 0.4% | |
| | 715 | | | State of California, Department of Veterans Affairs, Series B, Rev., 3.50%, 12/01/2045 | | | 745 | |
| | | | | | | | |
| | | | Total California | | | 2,171 | |
| | | | | | | | |
| | | | Colorado — 1.0% | |
| | | | Education — 0.5% | |
| | | | Colorado Educational & Cultural Facilities Authority, University Corp. for Atmospheric Research Project, | | | | |
| | 450 | | | Rev., 4.00%, 09/01/2020 | | | 472 | |
| | 470 | | | Rev., 5.00%, 09/01/2022 | | | 524 | |
| | | | | | | | |
| | | | | | | 996 | |
| | | | | | | | |
| | | | Hospital — 0.5% | |
| | 1,000 | | | University of Colorado Hospital Authority, Series C-1, Rev., 4.00%, 03/01/2020 (z) | | | 1,033 | |
| | | | | | | | |
| | | | Housing — 0.0% (g) | |
| | 55 | | | Denver City & County, Single Family Home Mortgage, Metropolitan Mayors Caucus Program, Rev., GNMA COLL, 6.15%, 11/01/2034 | | | 55 | |
| | | | | | | | |
| | | | Total Colorado | | | 2,084 | |
| | | | | | | | |
| | | | | | | | |
PRINCIPAL
AMOUNT($) | | | SECURITY DESCRIPTION | | VALUE($) | |
| | | | | |
| | | | Connecticut — 3.1% | |
| | | | Education — 1.5% | |
| | | | Connecticut State Higher Education Supplemental Loan Authority, CHESLA Loan Program, | | | | |
| | 1,560 | | | Series A, Rev., 5.25%, 11/15/2023 | | | 1,688 | |
| | 1,500 | | | Series A, Rev., 5.25%, 11/15/2024 | | | 1,623 | |
| | | | | | | | |
| | | | | | | 3,311 | |
| | | | | | | | |
| | | | Housing — 1.6% | |
| | | | Connecticut Housing Finance Authority, Housing Mortgage Finance Program, | | | | |
| | 1,300 | | | Series D, Subseries D-1, Rev., GNMA/FNMA/FHLMC, 4.00%, 11/15/2047 | | | 1,380 | |
| | 550 | | | Subseries A-1, Rev., 4.00%, 11/15/2045 | | | 575 | |
| | 490 | | | Subseries A-1, Rev., 4.00%, 11/15/2047 | | | 519 | |
| | 925 | | | Subseries E-1, Rev., 3.50%, 11/15/2046 | | | 964 | |
| | | | | | | | |
| | | | | | | 3,438 | |
| | | | | | | | |
| | | | Total Connecticut | | | 6,749 | |
| | | | | | | | |
| | | | Delaware — 0.2% | |
| | | | Housing — 0.2% | |
| | | | Delaware State Housing Authority, Senior Single Family Mortgage, | | | | |
| | 300 | | | Series A-1, Rev., AMT, 4.90%, 07/01/2029 | | | 312 | |
| | 160 | | | Series D-1, Rev., AMT, GNMA/FNMA/FHLMC, 4.63%, 01/01/2023 | | | 160 | |
| | | | | | | | |
| | | | Total Delaware | | | 472 | |
| | | | | | | | |
| | | | District of Columbia — 2.1% | |
| | | | Transportation — 0.5% | |
| | 1,000 | | | Washington Metropolitan Area Transit Authority, Gross Revenue Transit Bonds, Series B, Rev., 5.00%, 07/01/2025 | | | 1,171 | |
| | | | | | | | |
| | | | Water & Sewer — 1.6% | |
| | 3,000 | | | District of Columbia Water & Sewer Authority Public Utility, Subordinate Lien, Green Bonds, Series A, Rev., 5.00%, 10/01/2045 | | | 3,374 | |
| | | | | | | | |
| | | | Total District of Columbia | | | 4,545 | |
| | | | | | | | |
| | | | Florida — 9.0% | |
| | | | Certificate of Participation/Lease — 2.8% | |
| | 2,250 | | | South Florida Water Management District, COP, 5.00%, 10/01/2032 | | | 2,573 | |
| | 3,000 | | | The School Board of Miami-Dade County, Series D, COP, 5.00%, 02/01/2027 | | | 3,458 | |
| | | | | | | | |
| | | | | | | 6,031 | |
| | | | | | | | |
| | | | Hospital — 0.5% | |
| | 1,100 | | | Palm Beach County Health Facilities Authority, Hospital, BRRH Corp. Obligated Group, Rev., 5.00%, 12/01/2021 | | | 1,199 | |
| | | | | | | | |
SEE NOTES TO FINANCIAL STATEMENTS.
| | | | | | | | |
| | | |
| FEBRUARY 28, 2018 | | J.P. MORGAN MUNICIPAL BOND FUNDS | | | | | 11 | |
JPMorgan Municipal Income Fund
SCHEDULE OF PORTFOLIO INVESTMENTS
AS OF FEBRUARY 28, 2018 (continued)
(Amounts in thousands)
| | | | | | | | |
PRINCIPAL
AMOUNT($) | | | SECURITY DESCRIPTION | | VALUE($) | |
| | Municipal Bonds — continued | |
| | | | Housing — 0.6% | |
| | 280 | | | Broward County Housing Finance Authority, Series B, Rev., AMT, GNMA/FNMA/FHLMC, 4.50%, 04/01/2027 | | | 280 | |
| | | | Florida Housing Finance Corp., Homeowner Mortgage, Special Program, | | | | |
| | 290 | | | Series A, Rev., GNMA/FNMA/FHLMC, 5.00%, 07/01/2028 | | | 294 | |
| | 355 | | | Series B, Rev., GNMA/FNMA/FHLMC, 4.50%, 01/01/2029 | | | 366 | |
| | 330 | | | Series B, Rev., GNMA COLL, 4.50%, 01/01/2029 | | | 337 | |
| | | | | | | | |
| | | | | | | 1,277 | |
| | | | | | | | |
| | | | Industrial Development Revenue/Pollution Control Revenue — 0.6% | |
| | 835 | | | Broward County Fuel System, Fort Lauderdale Fuel Facilities LLC Project, Series A, Rev., AMT, AGM, 5.00%, 04/01/2024 | | | 920 | |
| | 500 | | | County of Escambia, Pollution Control, Gulf Power Company Project, Rev., 2.10%, 04/11/2019 (z) | | | 501 | |
| | | | | | | | |
| | | | | | | 1,421 | |
| | | | | | | | |
| | | | Other Revenue — 1.0% | |
| | 2,000 | | | Miami Beach Redevelopment Agency, Historic Convention Village, Series A, Rev., 5.00%, 02/01/2027 | | | 2,263 | |
| | | | | | | | |
| | | | Transportation — 0.8% | |
| | 1,500 | | | Tampa-Hillsborough County Expressway Authority, Series A, Rev., 5.00%, 07/01/2027 | | | 1,665 | |
| | | | | | | | |
| | | | Utility — 2.7% | |
| | 5,000 | | | City of Port St. Lucie, Utility Systems, Rev., NATL-RE, 5.25%, 09/01/2024 | | | 5,824 | |
| | | | | | | | |
| | | | Total Florida | | | 19,680 | |
| | | | | | | | |
| | | | Georgia — 1.4% | |
| | | | Hospital — 0.4% | |
| | 860 | | | Gainesville & Hall County Hospital Authority, Northeast Georgia Health System, Inc. Project, Series A, Rev., RAN, 5.00%, 02/15/2026 | | | 990 | |
| | | | | | | | |
| | | | Housing — 1.0% | |
| | | | Georgia Housing & Finance Authority, Single Family Mortgage, | | | | |
| | 750 | | | Series A, Rev., 4.00%, 12/01/2047 | | | 795 | |
| | 1,250 | | | Series B, Rev., 4.00%, 12/01/2047 | | | 1,334 | |
| | | | | | | | |
| | | | | | | 2,129 | |
| | | | | | | | |
| | | | Total Georgia | | | 3,119 | |
| | | | | | | | |
| | | | | | | | |
PRINCIPAL
AMOUNT($) | | | SECURITY DESCRIPTION | | VALUE($) | |
| | | | | | | | |
| | | | Guam — 0.3% | |
| | | | Water & Sewer — 0.3% | |
| | | | Guam Government Waterworks Authority, Water & Wastewater System, | | | | |
| | 375 | | | Rev., 5.00%, 07/01/2023 | | | 415 | |
| | 300 | | | Rev., 5.00%, 07/01/2024 | | | 333 | |
| | | | | | | | |
| | | | Total Guam | | | 748 | |
| | | | | | | | |
| | | | Illinois — 0.9% | |
| | | | Hospital — 0.2% | |
| | 365 | | | Illinois Finance Authority, Healthcare Enterprises, Inc., Series C, Rev., 5.00%, 03/01/2033 | | | 406 | |
| | | | | | | | |
| | | | Housing — 0.7% | |
| | | | City of Aurora, Single Family Mortgage, | | | | |
| | 156 | | | Series A, Rev., AMT, GNMA/FNMA/FHLMC, 5.50%, 12/01/2039 | | | 157 | |
| | 140 | | | Series B, Rev., GNMA/FNMA/FHLMC, 5.45%, 12/01/2039 | | | 141 | |
| | 15 | | | City of Peoria, City of Moline & City of Freeport, Collateralized Single Family Mortgage, Series A, Rev., GNMA COLL, 7.60%, 04/01/2027 | | | 15 | |
| | 1,170 | | | Illinois Housing Development Authority, Homeowner Mortgage, Series C, Rev., 3.50%, 08/01/2046 | | | 1,213 | |
| | | | | | | | |
| | | | | | | 1,526 | |
| | | | | | | | |
| | | | Total Illinois | | | 1,932 | |
| | | | | | | | |
| | | | Indiana — 2.7% | |
| | | | Hospital — 0.9% | |
| | 1,670 | | | Indiana Health Facility Financing Authority, Ascension Health Credit Group, Series A-1, Rev., 5.00%, 11/15/2034 | | | 1,891 | |
| | | | | | | | |
| | | | Housing — 0.2% | |
| | 430 | | | Indiana Housing & Community Development Authority, Home First Mortgage, Series A, Rev., GNMA/FNMA/FHLMC, 4.50%, 06/01/2028 | | | 439 | |
| | | | | | | | |
| | | | Industrial Development Revenue/Pollution Control Revenue — 1.0% | |
| | 1,880 | | | County of St. Joseph, Economic Development, St. Mary’s College Project, Series A, Rev., 5.00%, 04/01/2026 | | | 2,163 | |
| | | | | | | | |
| | | | Water & Sewer — 0.6% | |
| | 1,250 | | | Indiana State Finance Authority, First Lien Wastewater Utility, CWA Authority Project, Series A, Rev., 5.00%, 10/01/2030 | | | 1,383 | |
| | | | | | | | |
| | | | Total Indiana | | | 5,876 | |
| | | | | | | | |
SEE NOTES TO FINANCIAL STATEMENTS.
| | | | | | |
| | | |
| 12 | | | | J.P. MORGAN MUNICIPAL BOND FUNDS | | FEBRUARY 28, 2018 |
| | | | | | | | |
PRINCIPAL
AMOUNT($) | | | SECURITY DESCRIPTION | | VALUE($) | |
| | Municipal Bonds — continued | |
| | | | Iowa — 1.8% | |
| | | | Education — 0.5% | |
| | 1,000 | | | Iowa Student Loan Liquidity Corp., Student Loan, Series A, Rev., AMT, 5.00%, 12/01/2025 | | | 1,112 | |
| | | | | | | | |
| | | | Housing — 1.3% | |
| | | | Iowa Finance Authority, Single Family Mortgage, Mortgage-Backed Securities Program, | | | | |
| | 1,990 | | | Rev., GNMA/FNMA/FHLMC COLL, 3.50%, 01/01/2047 | | | 2,077 | |
| | 40 | | | Series 1, Rev., GNMA/FNMA/FHLMC, 5.00%, 07/01/2028 | | | 41 | |
| | 590 | | | Series A, Rev., GNMA/FNMA/FHLMC, 4.00%, 07/01/2046 | | | 623 | |
| | | | | | | | |
| | | | | | | 2,741 | |
| | | | | | | | |
| | | | Total Iowa | | | 3,853 | |
| | | | | | | | |
| | | | Kentucky — 0.5% | |
| | | | Education — 0.3% | |
| | 515 | | | Kentucky Higher Education Student Loan Corp., Series A, Rev., AMT, 5.00%, 06/01/2020 | | | 543 | |
| | | | | | | | |
| | | | Industrial Development Revenue/Pollution Control Revenue — 0.2% | |
| | 500 | | | County of Carroll, Pollution Control, Kentucky Utilities Company Project, Series A, Rev., 1.05%, 09/01/2019 (z) | | | 493 | |
| | | | | | | | |
| | | | Total Kentucky | | | 1,036 | |
| | | | | | | | |
| | | | Louisiana — 0.8% | |
| | | | Housing — 0.2% | |
| | 113 | | | East Baton Rouge Mortgage Finance Authority, Single Family Mortgage, Mortgage-Backed Securities Program, Series A-2, Rev., GNMA/FNMA/FHLMC, 5.25%, 10/01/2039 | | | 115 | |
| | 260 | | | Louisiana Housing Finance Agency, Single Family Mortgage, Home Ownership Program, Series A, Rev., GNMA/FNMA/FHLMC, 5.50%, 06/01/2040 | | | 264 | |
| | 45 | | | Louisiana Housing Finance Agency, Single Family Mortgage, Mortgage-Backed Securities Program, Series A, Rev., GNMA/FNMA/FHLMC, 4.60%, 12/01/2028 | | | 45 | |
| | | | | | | | |
| | | | | | | 424 | |
| | | | | | | | |
| | | | Other Revenue — 0.6% | |
| | 670 | | | Louisiana Local Government Environmental Facilities & Community Development Authority, LCTCS Act 391 Project, Rev., 5.00%, 10/01/2028 | | | 786 | |
| | | | | | | | |
PRINCIPAL
AMOUNT($) | | | SECURITY DESCRIPTION | | VALUE($) | |
| | | | | | | | |
| | | | Other Revenue — continued | |
| | | | Louisiana Public Facilities Authority, Archdiocese of New Orleans Project, | | | | |
| | 165 | | | Rev., 5.00%, 07/01/2021 | | | 177 | |
| | 250 | | | Rev., 5.00%, 07/01/2022 | | | 272 | |
| | | | | | | | |
| | | | | | | 1,235 | |
| | | | | | | | |
| | | | Total Louisiana | | | 1,659 | |
| | | | | | | | |
| | | | Maine — 0.7% | |
| | | | Housing — 0.7% | |
| | | | Maine State Housing Authority, | | | | |
| | 925 | | | Series A, Rev., 4.00%, 11/15/2045 | | | 973 | |
| | 245 | | | Series A-1, Rev., AMT, 4.50%, 11/15/2028 | | | 253 | |
| | 205 | | | Series B, Rev., 4.00%, 11/15/2043 | | | 212 | |
| | | | | | | | |
| | | | Total Maine | | | 1,438 | |
| | | | | | | | |
| | | | Maryland — 0.7% | |
| | | | Housing — 0.7% | |
| | 1,460 | | | Montgomery County Housing Opportunities Commission, Single Family Mortgage, Series A, Rev., 4.00%, 07/01/2048 | | | 1,551 | |
| | | | | | | | |
| | | | Massachusetts — 8.1% | |
| | | | Education — 1.0% | |
| | 1,000 | | | Massachusetts Educational Financing Authority, Education Loan, Rev., AMT, 5.00%, 07/01/2021 | | | 1,083 | |
| | 820 | | | Massachusetts Health & Educational Facilities Authority, Massachusetts Institute of Technology, Series L, Rev., 5.25%, 07/01/2033 | | | 1,042 | |
| | | | | | | | |
| | | | | | | 2,125 | |
| | | | | | | | |
| | | | Housing — 0.4% | |
| | | | Massachusetts Housing Finance Agency, Single Family Housing, | | | | |
| | 305 | | | Series 169, Rev., 4.00%, 12/01/2044 | | | 315 | |
| | 430 | | | Series 183, Rev., 3.50%, 12/01/2046 | | | 448 | |
| | | | | | | | |
| | | | | | | 763 | |
| | | | | | | | |
| | | | Water & Sewer — 6.7% | |
| | 5,000 | | | Massachusetts Water Pollution Abatement Trust, Pool Program, Rev., 5.25%, 08/01/2024 | | | 5,919 | |
| | | | Massachusetts Water Resources Authority, | | | | |
| | 5,000 | | | Series B, Rev., AGM, 5.25%, 08/01/2028 | | | 6,219 | |
| | 2,000 | | | Series B, Rev., AGM, 5.25%, 08/01/2029 | | | 2,510 | |
| | | | | | | | |
| | | | | | | 14,648 | |
| | | | | | | | |
| | | | Total Massachusetts | | | 17,536 | |
| | | | | | | | |
SEE NOTES TO FINANCIAL STATEMENTS.
| | | | | | | | |
| | | |
| FEBRUARY 28, 2018 | | J.P. MORGAN MUNICIPAL BOND FUNDS | | | | | 13 | |
JPMorgan Municipal Income Fund
SCHEDULE OF PORTFOLIO INVESTMENTS
AS OF FEBRUARY 28, 2018 (continued)
(Amounts in thousands)
| | | | | | | | |
PRINCIPAL
AMOUNT($) | | | SECURITY DESCRIPTION | | VALUE($) | |
| | Municipal Bonds — continued | |
| | | | Michigan — 1.6% | |
| | | | Education — 0.3% | |
| | 575 | | | Eastern Michigan University, Series A, Rev., 5.00%, 03/01/2030 | | | 676 | |
| | | | | | | | |
| | | | Housing — 0.5% | |
| | 1,180 | | | Michigan State Housing Development Authority, Single-Family Mortgage, Series B, Rev., 3.50%, 06/01/2047 | | | 1,221 | |
| | | | | | | | |
| | | | Industrial Development Revenue/Pollution Control Revenue — 0.8% | |
| | 570 | | | Michigan Strategic Fund, The Detroit Edison Company Pollution Control Bonds Project, Series CC, Rev., 1.45%, 09/01/2021 (z) | | | 556 | |
| | 1,075 | | | Saginaw County Economic Development Corp., BGI South LLC-Recovery Zone, Rev., 5.00%, 12/01/2020 | | | 1,113 | |
| | | | | | | | |
| | | | | | | 1,669 | |
| | | | | | | | |
| | | | Total Michigan | | | 3,566 | |
| | | | | | | | |
| | | | Minnesota — 3.1% | |
| | | | General Obligation — 0.0% (g) | |
| | 35 | | | State of Minnesota, Series A, GO, 5.00%, 10/01/2021 (p) | | | 39 | |
| | | | | | | | |
| | | | Housing — 3.1% | |
| | | | Dakota County Community Development Agency, Single Family Mortgage, Mortgage-Backed Securities Program, | | | | |
| | 335 | | | Series A, Rev., GNMA/FNMA/FHLMC, 4.50%, 06/01/2035 | | | 346 | |
| | 284 | | | Series A, Rev., GNMA/FNMA/FHLMC, 5.13%, 12/01/2040 | | | 285 | |
| | 14 | | | Series B, Rev., GNMA/FNMA/FHLMC, 5.15%, 12/01/2038 | | | 14 | |
| | 405 | | | Minneapolis Community Development Agency, Multi-Family Housing, Riverside Homes Project, Rev., 6.10%, 09/01/2019 | | | 406 | |
| | | | Minneapolis/St. Paul Housing Finance Board, Single Family Mortgage, Mortgage-Backed Securities Program, City Living Home Programs, | | | | |
| | 120 | | | Series A-1, Rev., GNMA/FNMA/FHLMC, 5.25%, 12/01/2040 | | | 121 | |
| | 410 | | | Series A-2, Rev., GNMA/FNMA/FHLMC, 5.52%, 03/01/2041 | | | 416 | |
| | | | Minnesota Housing Finance Agency, Homeownership Finance, Mortgage-Backed Securities Program, | | | | |
| | 295 | | | Series A, Rev., GNMA/FNMA/FHLMC, 4.25%, 07/01/2028 | | | 298 | |
| | 205 | | | Series D, Rev., GNMA/FNMA/FHLMC, 4.50%, 07/01/2034 | | | 210 | |
| | | | | | | | |
PRINCIPAL
AMOUNT($) | | | SECURITY DESCRIPTION | | VALUE($) | |
| | | | | | | | |
| | | | Housing — continued | |
| | | | Minnesota Housing Finance Agency, Non Profit Housing, State Appropriation, | | | | |
| | 1,015 | | | Rev., 5.25%, 08/01/2024 | | | 1,128 | |
| | 1,070 | | | Rev., 5.25%, 08/01/2025 | | | 1,189 | |
| | 825 | | | Rev., 5.25%, 08/01/2026 | | | 917 | |
| | | | Minnesota Housing Finance Agency, Residential Housing Finance, | | | | |
| | 970 | | | Series B, Rev., GNMA/FNMA/FHLMC COLL, 4.00%, 07/01/2047 | | | 1,023 | |
| | 270 | | | Series D, Rev., GNMA/FNMA/FHLMC, 4.00%, 07/01/2040 | | | 277 | |
| | | | | | | | |
| | | | | | | 6,630 | |
| | | | | | | | |
| | | | Total Minnesota | | | 6,669 | |
| | | | | | | | |
| | | | Mississippi — 0.2% | |
| | | | Housing — 0.2% | |
| | 390 | | | Mississippi Home Corp., Home Ownership Mortgage, Series A, Rev., GNMA COLL, 4.50%, 12/01/2031 | | | 397 | |
| | | | | | | | |
| | | | Missouri — 0.9% | |
| | | | Housing — 0.9% | |
| | 1,755 | | | Missouri Housing Development Commission, Single Family Mortgage, First Place Homeownership Loan Program, Series B, Rev., GNMA/FNMA/FHLMC COLL, 3.50%, 05/01/2041 | | | 1,826 | |
| | 185 | | | Missouri Housing Development Commission, Single Family Mortgage, Special Homeownership Loan Program, Series E-1, Rev., GNMA/FNMA/FHLMC, 5.00%, 11/01/2027 | | | 189 | |
| | | | | | | | |
| | | | Total Missouri | | | 2,015 | |
| | | | | | | | |
| | | | Nevada — 0.6% | |
| | | | Hospital — 0.6% | |
| | | | City of Carson, Carson Tahoe Regional Healthcare Project, | | | | |
| | 555 | | | Rev., 5.00%, 09/01/2026 | | | 632 | |
| | 620 | | | Rev., 5.00%, 09/01/2029 | | | 701 | |
| | | | | | | | |
| | | | Total Nevada | | | 1,333 | |
| | | | | | | | |
| | | | New Hampshire — 2.4% | |
| | | | Education — 2.4% | |
| | | | City of Manchester, School Facilities, | | | | |
| | 3,545 | | | Rev., NATL-RE, 5.50%, 06/01/2024 | | | 4,193 | |
| | 900 | | | Rev., NATL-RE, 5.50%, 06/01/2027 | | | 1,101 | |
| | | | | | | | |
| | | | Total New Hampshire | | | 5,294 | |
| | | | | | | | |
SEE NOTES TO FINANCIAL STATEMENTS.
| | | | | | |
| | | |
| 14 | | | | J.P. MORGAN MUNICIPAL BOND FUNDS | | FEBRUARY 28, 2018 |
| | | | | | | | |
PRINCIPAL
AMOUNT($) | | | SECURITY DESCRIPTION | | VALUE($) | |
| | Municipal Bonds — continued | |
| | | | New Jersey — 3.2% | |
| | | | Education — 1.0% | |
| | 250 | | | New Jersey Educational Facilities Authority, College of New Jersey Issue, Series A, Rev., 5.00%, 07/01/2018 | | | 253 | |
| | 1,750 | | | New Jersey Higher Education Student Assistance Authority, Senior Student Loan, Series 1A, Rev., AMT, 5.00%, 12/01/2024 | | | 1,956 | |
| | | | | | | | |
| | | | | | | 2,209 | |
| | | | | | | | |
| | | | General Obligation — 0.7% | |
| | 1,215 | | | Egg Harbor Township Board of Education, GO, AGM, 5.75%, 07/15/2024 | | | 1,453 | |
| | | | | | | | |
| | | | Hospital — 1.5% | |
| | | | New Jersey Health Care Facilities Financing Authority, University Hospital Issue, | | | | |
| | 1,000 | | | Series A, Rev., AGM, 5.00%, 07/01/2022 | | | 1,111 | |
| | 820 | | | Series A, Rev., AGM, 5.00%, 07/01/2023 | | | 924 | |
| | 1,095 | | | Series A, Rev., AGM, 5.00%, 07/01/2026 | | | 1,254 | |
| | | | | | | | |
| | | | | | | 3,289 | |
| | | | | | | | |
| | | | Total New Jersey | | | 6,951 | |
| | | | | | | | |
| | | | New York — 8.4% | |
| | | | Housing — 1.7% | |
| | | | New York Mortgage Agency, Homeowner Mortgage, | | | | |
| | 1,625 | | | Series 195, Rev., 4.00%, 10/01/2046 | | | 1,727 | |
| | 1,545 | | | Series 197, Rev., 3.50%, 10/01/2044 | | | 1,609 | |
| | 235 | | | New York State Mortgage Agency, 39th Series, Rev., 5.00%, 04/01/2028 | | | 237 | |
| | | | | | | | |
| | | | | | | 3,573 | |
| | | | | | | | |
| | | | Other Revenue — 0.8% | |
| | 1,500 | | | New York State Dormitory Authority, State Sales Tax, Series B, Rev., 5.00%, 03/15/2030 | | | 1,737 | |
| | | | | | | | |
| | | | Prerefunded — 0.0% (g) | |
| | 5 | | | New York State Dormitory Authority, Series A, Rev., 5.25%, 02/15/2019 (p) | | | 5 | |
| | | | | | | | |
| | | | Special Tax — 0.0% (g) | |
| | 75 | | | New York State Dormitory Authority, State Personal Income Tax, Series A, Rev., 5.25%, 02/15/2024 | | | 78 | |
| | | | | | | | |
| | | | Transportation — 2.6% | |
| | 3,000 | | | Metropolitan Transportation Authority, Dedicated Tax Fund, Series A, Rev., 5.00%, 11/15/2029 | | | 3,386 | |
| | 2,000 | | | Port Authority of New York & New Jersey, Consolidated, 194th Series, Rev., 5.00%, 10/15/2030 | | | 2,317 | |
| | | | | | | | |
| | | | | | | 5,703 | |
| | | | | | | | |
| | | | | | | | |
PRINCIPAL
AMOUNT($) | | | SECURITY DESCRIPTION | | VALUE($) | |
| | | | | | | | |
| | | | Water & Sewer — 3.3% | |
| | 1,000 | | | New York City Municipal Water Finance Authority, Water & Sewer System, Second General Resolution, Fiscal Year 2015, Series FF, Rev., 5.00%, 06/15/2031 | | | 1,152 | |
| | | | New York State Environmental Facilities Corp., State Clean Water & Drinking Water Revolving Funds, New York City Municipal Water Finance Authority Projects — Second Resolution, | | | | |
| | 2,500 | | | Series A, Rev., 5.25%, 06/15/2027 | | | 2,619 | |
| | 3,000 | | | Series B, Rev., 5.00%, 06/15/2028 | | | 3,295 | |
| | | | | | | | |
| | | | | | | 7,066 | |
| | | | | | | | |
| | | | Total New York | | | 18,162 | |
| | | | | | | | |
| | | | North Carolina — 2.1% | |
| | | | Other Revenue — 0.5% | |
| | 1,000 | | | County of Randolph, Limited Obligation, Series B, Rev., 5.00%, 10/01/2026 | | | 1,178 | |
| | | | | | | | |
| | | | Water & Sewer — 1.6% | |
| | 3,330 | | | City of Charlotte, Water & Sewer System, Rev., 5.25%, 07/01/2022 | | | 3,494 | |
| | | | | | | | |
| | | | Total North Carolina | | | 4,672 | |
| | | | | | | | |
| | | | North Dakota — 3.2% | |
| | | | Housing — 2.3% | |
| | | | North Dakota Housing Finance Agency, Home Mortgage Finance Program, | | | | |
| | 235 | | | Series B, Rev., 5.00%, 07/01/2028 | | | 237 | |
| | 545 | | | Series D, Rev., 3.50%, 07/01/2046 | | | 565 | |
| | 1,755 | | | Series D, Rev., 4.00%, 07/01/2046 | | | 1,860 | |
| | 1,445 | | | Series D, Rev., FHA, 4.00%, 01/01/2048 | | | 1,540 | |
| | 385 | | | Series D, Rev., 4.50%, 01/01/2029 | | | 392 | |
| | 390 | | | Series F, Rev., AMT, 4.50%, 01/01/2035 | | | 398 | |
| | | | | | | | |
| | | | | | | 4,992 | |
| | | | | | | | |
| | | | Utility — 0.9% | |
| | 2,000 | | | McLean County, Solid Waste Facilities, Great River Energy Project, Series A, Rev., 4.88%, 07/01/2026 | | | 2,080 | |
| | | | | | | | |
| | | | Total North Dakota | | | 7,072 | |
| | | | | | | | |
| | | | Ohio — 2.3% | |
| | | | General Obligation — 0.8% | |
| | 1,500 | | | Lakota Local School District, Series A, GO, NATL-RE, 5.25%, 12/01/2025 | | | 1,798 | |
| | | | | | | | |
| | | | Housing — 0.6% | |
| | 1,345 | | | Ohio Housing Finance Agency Residential Mortgage, Mortgage-Backed Securities Program, Series D, Rev., GNMA/FNMA/FHLMC, 4.00%, 03/01/2047 | | | 1,413 | |
SEE NOTES TO FINANCIAL STATEMENTS.
| | | | | | | | |
| | | |
| FEBRUARY 28, 2018 | | J.P. MORGAN MUNICIPAL BOND FUNDS | | | | | 15 | |
JPMorgan Municipal Income Fund
SCHEDULE OF PORTFOLIO INVESTMENTS
AS OF FEBRUARY 28, 2018 (continued)
(Amounts in thousands)
| | | | | | | | |
PRINCIPAL
AMOUNT($) | | | SECURITY DESCRIPTION | | VALUE($) | |
| | Municipal Bonds — continued | |
| | | | Housing — continued | |
| | 20 | | | Ohio Housing Finance Agency, Single Family Mortgage, Series 1, Rev., GNMA/FNMA/FHLMC, 5.00%, 11/01/2028 | | | 20 | |
| | | | | | | | |
| | | | | | | 1,433 | |
| | | | | | | | |
| | | | Industrial Development Revenue/Pollution Control Revenue — 0.9% | |
| | 1,615 | | | Ohio State Water Development Authority, Water Pollution Control Loan Fund, Series B, Rev., 5.00%, 12/01/2029 | | | 1,888 | |
| | | | | | | | |
| | | | Total Ohio | | | 5,119 | |
| | | | | | | | |
| | | | Oklahoma — 0.4% | |
| | | | Housing — 0.4% | |
| | 465 | | | Oklahoma County Home Finance Authority, Single Family Mortgage-Backed Securities Program, Series A, Rev., AMT, GNMA/FNMA/FHLMC, 5.40%, 10/01/2038 | | | 477 | |
| | 280 | | | Oklahoma Housing Finance Agency, Single Family Mortgage, Homeownership Loan Program, Series A, Rev., GNMA COLL, 4.38%, 09/01/2027 | | | 288 | |
| | | | | | | | |
| | | | | | | 765 | |
| | | | | | | | |
| | | | Other Revenue — 0.0% (g) | |
| | 28 | | | IDK Partners III Trust, Mortgage Pass-Through Certificates, Class A, Rev., 5.10%, 08/01/2023 (bb) | | | 28 | |
| | | | | | | | |
| | | | Total Oklahoma | | | 793 | |
| | | | | | | | |
| | | | Oregon — 0.4% | |
| | | | Housing — 0.4% | |
| | 785 | | | Oregon State Housing & Community Services Department, Single Family Mortgage Program, Series B, Rev., AMT, 5.00%, 07/01/2030 | | | 819 | |
| | | | | | | | |
| | | | Pennsylvania — 4.6% | |
| | | | Housing — 1.1% | |
| | | | Pennsylvania Housing Finance Agency, Single Family Mortgage, | | | | |
| | 1,750 | | | Series 121, Rev., 3.50%, 10/01/2046 | | | 1,814 | |
| | 530 | | | Series 122, Rev., 4.00%, 10/01/2046 | | | 559 | |
| | | | | | | | |
| | | | | | | 2,373 | |
| | | | | | | | |
| | | | Industrial Development Revenue/Pollution Control Revenue — 2.2% | |
| | | | Philadelphia Authority for Industrial Development, City Service Agreement, Affordable Housing Preservation Programs Project, | | | | |
| | 2,020 | | | Rev., 5.00%, 12/01/2023 | | | 2,252 | |
| | | | | | | | |
PRINCIPAL
AMOUNT($) | | | SECURITY DESCRIPTION | | VALUE($) | |
| | | | | | | | |
| | | | Industrial Development Revenue/Pollution Control Revenue — continued | |
| | 1,550 | | | Rev., AGM, 5.00%, 12/01/2026 | | | 1,778 | |
| | 680 | | | Rev., AGM, 5.00%, 12/01/2027 | | | 780 | |
| | | | | | | | |
| | | | | | | 4,810 | |
| | | | | | | | |
| | | | Other Revenue — 1.0% | |
| | 2,000 | | | Philadelphia Redevelopment Authority, Neighborhood Transformation Initiative, Rev., 5.00%, 04/15/2019 | | | 2,070 | |
| | | | | | | | |
| | | | Transportation — 0.3% | |
| | 600 | | | Allegheny County Airport Authority, Pittsburgh International Airport, Series A-1, Rev., AMT, 5.00%, 01/01/2026 | | | 651 | |
| | | | | | | | |
| | | | Total Pennsylvania | | | 9,904 | |
| | | | | | | | |
| | | | Rhode Island — 2.2% | |
| | | | Housing — 0.9% | |
| | 2,000 | | | Rhode Island Housing & Mortgage Finance Corp., Multi-Family Housing, Series 1-A, Rev., 1.70%, 10/01/2019 (z) | | | 1,987 | |
| | | | | | | | |
| | | | Transportation — 1.3% | |
| | 2,600 | | | Rhode Island Economic Development Corp., Series B, Rev., 5.00%, 07/01/2022 | | | 2,879 | |
| | | | | | | | |
| | | | Total Rhode Island | | | 4,866 | |
| | | | | | | | |
| | | | South Carolina — 1.3% | |
| | | | Housing — 0.7% | |
| | | | South Carolina State Housing Finance & Development Authority, | | | | |
| | 215 | | | Series 1, Rev., GNMA COLL, 5.00%, 01/01/2028 | | | 219 | |
| | 390 | | | Series A, Rev., 4.00%, 01/01/2047 | | | 414 | |
| | 895 | | | Series B, Rev., FHA, 4.00%, 07/01/2047 | | | 950 | |
| | | | | | | | |
| | | | | | | 1,583 | |
| | | | | | | | |
| | | | Other Revenue — 0.6% | |
| | 1,000 | | | Town of Hilton Head Island, Beach Preservation Fee Pledge, Rev., 5.00%, 08/01/2026 | | | 1,163 | |
| | | | | | | | |
| | | | Total South Carolina | | | 2,746 | |
| | | | | | | | |
| | | | South Dakota — 1.0% | |
| | | | Housing — 1.0% | |
| | 2,040 | | | South Dakota Housing Development Authority, Homeownership Mortgage, Series D, Rev., 4.00%, 11/01/2045 | | | 2,172 | |
| | | | | | | | |
| | | | Tennessee — 1.1% | |
| | | | Housing — 1.1% | |
| | 225 | | | Tennessee Housing Development Agency, Housing Finance Program, Series A-1, Rev., 5.00%, 01/01/2027 | | | 227 | |
SEE NOTES TO FINANCIAL STATEMENTS.
| | | | | | |
| | | |
| 16 | | | | J.P. MORGAN MUNICIPAL BOND FUNDS | | FEBRUARY 28, 2018 |
| | | | | | | | |
PRINCIPAL
AMOUNT($) | | | SECURITY DESCRIPTION | | VALUE($) | |
| | Municipal Bonds — continued | |
| | | | Housing — continued | |
| | | | Tennessee Housing Development Agency, Residential Finance Program, | | | | |
| | 1,865 | | | Rev., 3.50%, 01/01/2048 | | | 1,948 | |
| | 265 | | | Series 2B, Rev., 4.00%, 07/01/2043 | | | 274 | |
| | | | | | | | |
| | | | Total Tennessee | | | 2,449 | |
| | | | | | | | |
| | | | Texas — 5.2% | |
| | | | General Obligation — 1.3% | |
| | 2,000 | | | Socorro Independent School District, Series A, GO, PSF-GTD, 5.00%, 08/15/2024 | | | 2,325 | |
| | 450 | | | State of Texas, Water Financial Assistance, Series D, GO, 5.00%, 05/15/2033 | | | 515 | |
| | | | | | | | |
| | | | | | | 2,840 | |
| | | | | | | | |
| | | | Hospital — 0.4% | |
| | | | Irving Hospital Authority, Baylor Scott and White Medical Center, | | | | |
| | 250 | | | Rev., 5.00%, 10/15/2026 | | | 282 | |
| | 500 | | | Rev., 5.00%, 10/15/2027 | | | 561 | |
| | | | | | | | |
| | | | | | | 843 | |
| | | | | | | | |
| | | | Housing — 0.7% | |
| | 1,040 | | | Multi-Family Housing, Bond Pass-Through Certificates, Grand Reserve Apartments, Series 8, Rev., 5.95%, 11/01/2023 (z) | | | 1,041 | |
| | 460 | | | Texas Department of Housing & Community Affairs, Residential Mortgage, Series A, Rev., GNMA/FNMA/FHLMC, 5.00%, 07/01/2029 | | | 474 | |
| | | | | | | | |
| | | | | | | 1,515 | |
| | | | | | | | |
| | | | Industrial Development Revenue/Pollution Control Revenue — 0.4% | |
| | 900 | | | Harris County Industrial Development Corp., Solid Waste Disposal, Deer Park Refining Limited Partnership Project, Rev., 4.70%, 05/01/2018 | | | 904 | |
| | | | | | | | |
| | | | Other Revenue — 0.5% | |
| | 1,000 | | | Central Texas Regional Mobility Authority, Rev., 5.00%, 01/01/2046 | | | 1,094 | |
| | | | | | | | |
| | | | Transportation — 1.5% | |
| | 2,800 | | | Dallas Area Rapid Transit, Senior Lien, Series A, Rev., 5.00%, 12/01/2032 | | | 3,221 | |
| | | | | | | | |
| | | | Water & Sewer — 0.4% | |
| | 665 | | | City of Austin, Water & Wastewater System, Rev., 5.00%, 11/15/2027 | | | 791 | |
| | | | | | | | |
| | | | Total Texas | | | 11,208 | |
| | | | | | | | |
| | | | | | | | |
PRINCIPAL
AMOUNT($) | | | SECURITY DESCRIPTION | | VALUE($) | |
| | | | | | | | |
| | | | Utah — 4.0% | |
| | | | Housing — 2.5% | |
| | 1,650 | | | Utah Housing Corp., Single Family Mortgage, Series D, Rev., FHA, 4.00%, 01/01/2045 | | | 1,748 | |
| | 3,245 | | | Utah State Board of Regents, Student Fee & Housing System, Rev., NATL-RE, 5.25%, 04/01/2023 | | | 3,712 | |
| | | | | | | | |
| | | | | | | 5,460 | |
| | | | | | | | |
| | | | Other Revenue — 0.6% | |
| | 970 | | | Utah Transit Authority, Sales Tax, Series C, Rev., AGM, 5.25%, 06/15/2029 | | | 1,189 | |
| | | | | | | | |
| | | | Utility — 0.9% | |
| | 1,700 | | | Utah Associated Municipal Power System, Horse Butte Wind Project, Series B, Rev., 5.00%, 09/01/2033 | | | 1,956 | |
| | | | | | | | |
| | | | Total Utah | | | 8,605 | |
| | | | | | | | |
| | | | Vermont — 3.3% | |
| | | | Education — 2.3% | |
| | | | Vermont Student Assistance Corp., Education Loan, | | | | |
| | 1,000 | | | Series A, Rev., AMT, 5.00%, 06/15/2023 | | | 1,097 | |
| | 1,400 | | | Series A, Rev., AMT, 5.00%, 06/15/2024 | | | 1,551 | |
| | 2,150 | | | Series A, Rev., AMT, 5.00%, 06/15/2025 | | | 2,388 | |
| | | | | | | | |
| | | | | | | 5,036 | |
| | | | | | | | |
| | | | Housing — 1.0% | |
| | | | Vermont Housing Finance Agency, Multiple Purpose, | | | | |
| | 1,735 | | | Series B, Rev., AMT, 3.75%, 11/01/2045 | | | 1,799 | |
| | 250 | | | Series B, Rev., AMT, 4.13%, 11/01/2042 | | | 254 | |
| | | | | | | | |
| | | | | | | 2,053 | |
| | | | | | | | |
| | | | Total Vermont | | | 7,089 | |
| | | | | | | | |
| | | | Washington — 3.1% | |
| | | | Hospital — 1.5% | |
| | 1,850 | | | Washington Health Care Facilities Authority, Multicare Health System, Series B, Rev., 5.00%, 08/15/2035 | | | 2,096 | |
| | 1,125 | | | Washington Health Care Facilities Authority, Virginia Mason Medical Center, Rev., 5.00%, 08/15/2026 | | | 1,274 | |
| | | | | | | | |
| | | | | | | 3,370 | |
| | | | | | | | |
| | | | Housing — 1.6% | |
| | | | Washington Housing Finance Commission, Single-Family Program, | | | | |
| | 435 | | | Series 2A-R, Rev., AMT, 3.50%, 12/01/2046 | | | 449 | |
SEE NOTES TO FINANCIAL STATEMENTS.
| | | | | | | | |
| | | |
| FEBRUARY 28, 2018 | | J.P. MORGAN MUNICIPAL BOND FUNDS | | | | | 17 | |
JPMorgan Municipal Income Fund
SCHEDULE OF PORTFOLIO INVESTMENTS
AS OF FEBRUARY 28, 2018 (continued)
(Amounts in thousands)
| | | | | | | | |
PRINCIPAL
AMOUNT($) | | | SECURITY DESCRIPTION | | VALUE($) | |
| | Municipal Bonds — continued | |
| | | | Housing — continued | |
| | 2,850 | | | Series 2N, Rev., GNMA/FNMA/FHLMC, 3.50%, 06/01/2047 | | | 2,970 | |
| | | | | | | | |
| | | | | | | 3,419 | |
| | | | | | | | |
| | | | Total Washington | | | 6,789 | |
| | | | | | | | |
| | | | West Virginia — 1.4% | |
| | | | Other Revenue — 1.4% | |
| | 2,690 | | | West Virginia Economic Development Authority, Lease, Correctional Juvenile & Public Safety Facilities, Series A, Rev., 5.00%, 06/01/2029 | | | 2,982 | |
| | | | | | | | |
| | | | Wisconsin — 2.5% | |
| | | | Education — 2.5% | |
| | | | Wisconsin Health & Educational Facilities Authority, Agnesian Healthcare, Inc., | | | | |
| | 250 | | | Rev., 5.00%, 07/01/2024 | | | 283 | |
| | 250 | | | Rev., 5.00%, 07/01/2025 | | | 285 | |
| | | | Wisconsin Health & Educational Facilities Authority, Franciscan Sisters of Christian Charity Sponsored Ministries, Inc., | | | | |
| | 520 | | | Rev., 5.00%, 09/01/2022 | | | 568 | |
| | 550 | | | Rev., 5.00%, 09/01/2023 | | | 606 | |
| | 580 | | | Rev., 5.00%, 09/01/2024 | | | 643 | |
| | 235 | | | Rev., 5.00%, 09/01/2025 | | | 262 | |
| | 385 | | | Rev., 5.00%, 09/01/2026 | | | 430 | |
| | 785 | | | Rev., 5.00%, 09/01/2027 | | | 880 | |
| | | | | | | | |
PRINCIPAL
AMOUNT($) | | | SECURITY DESCRIPTION | | VALUE($) | |
| | | | | | | | |
| | | | Education — continued | |
| | | | Wisconsin Health & Educational Facilities Authority, Marshfield Clinic Health System, Inc., | | | | |
| | 400 | | | Series C, Rev., 5.00%, 02/15/2027 | | | 458 | |
| | 575 | | | Series C, Rev., 5.00%, 02/15/2028 | | | 655 | |
| | 375 | | | Series C, Rev., 5.00%, 02/15/2029 | | | 425 | |
| | | | | | | | |
| | | | Total Wisconsin | | | 5,495 | |
| | | | | | | | |
| | | | Total Municipal Bonds
(Cost $208,385) | | | 210,447 | |
| | | | | | | | |
| | |
| SHARES | | | | | | |
| | Short-Term Investment — 2.0% | |
| | | | Investment Company — 2.0% | |
| | 4,335 | | | JPMorgan U.S. Government Money Market Fund, Institutional Class Shares, 1.25% (b) (l) (Cost $4,335) | | | 4,335 | |
| | | | | | | | |
| | | | Total Investments — 98.8%
(Cost $212,720) | | | 214,782 | |
| | | | Other Assets in Excess of
Liabilities — 1.2% | | | 2,513 | |
| | | | | | | | |
| | | | NET ASSETS — 100.0% | | $ | 217,295 | |
| | | | | | | | |
Percentages indicated are based on net assets.
SEE NOTES TO FINANCIAL STATEMENTS.
| | | | | | |
| | | |
| 18 | | | | J.P. MORGAN MUNICIPAL BOND FUNDS | | FEBRUARY 28, 2018 |
JPMorgan Short-Intermediate Municipal Bond Fund
SCHEDULE OF PORTFOLIO INVESTMENTS
AS OF FEBRUARY 28, 2018
(Amounts in thousands)
| | | | | | | | |
PRINCIPAL
AMOUNT($) | | | SECURITY DESCRIPTION | | VALUE($) | |
| | Collateralized Mortgage Obligation — 0.1% | | | | |
| | 238 | | | FNMA REMIC, Series 2002-36, Class FS, 2.12%, 06/25/2032 (z) (Cost $238) | | | 241 | |
| | | | | | | | |
| | Municipal Bonds — 98.5% (t) | | | | |
| | | | Alabama — 0.5% | | | | |
| | | | Other Revenue — 0.0% (g) | | | | |
| | 500 | | | Montgomery County Public Building Authority, Revenue Refunding Warrants, Facilities Project, Rev., 5.00%, 03/01/2023 | | | 565 | |
| | | | | | | | |
| | | | Utility — 0.5% | |
| | 7,675 | | | The Black Belt Energy Gas District Gas Supply, Series A, Rev., LIQ: Royal Bank of Canada, 4.00%, 06/01/2021 (z) | | | 8,108 | |
| | | | | | | | |
| | | | Total Alabama | | | 8,673 | |
| | | | | | | | |
| | | | Alaska — 0.5% | | | | |
| | | | General Obligation — 0.5% | | | | |
| | 7,220 | | | Borough of North Slope, Series A, GO, 5.00%, 06/30/2021 | | | 7,736 | |
| | | | | | | | |
| | | | Utility — 0.0% (g) | |
| | 500 | | | City of Anchorage, Electric Utilities, Senior Lien, Series A, Rev., 5.00%, 12/01/2023 | | | 573 | |
| | | | | | | | |
| | | | Total Alaska | | | 8,309 | |
| | | | | | | | |
| | | | Arizona — 1.6% | | | | |
| | | | Certificate of Participation/Lease — 0.0% (g) | | | | |
| | 500 | | | Arizona School Facilities Board, Series A-1, COP, 5.00%, 09/01/2019 | | | 526 | |
| | | | | | | | |
| | | | General Obligation — 0.2% | |
| | 2,550 | | | City of Scottsdale, GO, 5.00%, 07/01/2022 | | | 2,876 | |
| | | | | | | | |
| | | | Hospital — 0.2% | |
| | 3,540 | | | Arizona Health Facilities Authority, Scottsdale Lincoln Hospitals, Series A, Rev., 5.00%, 12/01/2025 | | | 4,047 | |
| | | | | | | | |
| | | | Industrial Development Revenue/Pollution Control Revenue — 1.1% | |
| | | | Maricopa County Industrial Development Authority, Banner Health, | | | | |
| | 7,370 | | | Series B, Rev., 5.00%, 10/18/2022 (z) | | | 8,292 | |
| | 9,000 | | | Series C, Rev., 5.00%, 10/18/2024 (z) | | | 10,398 | |
| | | | | | | | |
| | | | | | | 18,690 | |
| | | | | | | | |
| | | | Other Revenue — 0.0% (g) | |
| | | | Town of Marana, Excise Tax, | | | | |
| | 75 | | | Series B, Rev., 4.00%, 07/01/2020 | | | 79 | |
| | 100 | | | Series B, Rev., 5.00%, 07/01/2021 | | | 109 | |
| | | | | | | | |
| | | | | | | 188 | |
| | | | | | | | |
| | | | | | | | |
PRINCIPAL
AMOUNT($) | | | SECURITY DESCRIPTION | | VALUE($) | |
| | | | | |
| | | | Transportation — 0.1% | |
| | 1,000 | | | Maricopa County, Regional Public Transportation Authority, Excise Tax Revenue, Public Transportation Fund, Rev., 5.25%, 07/01/2018 | | | 1,013 | |
| | | | | | | | |
| | | | Water & Sewer — 0.0% (g) | |
| | 1,000 | | | Pima County, Sewer System, Rev., 5.00%, 07/01/2018 | | | 1,012 | |
| | | | | | | | |
| | | | Total Arizona | | | 28,352 | |
| | | | | | | | |
| | | | Arkansas — 0.3% | | | | |
| | | | Education — 0.3% | | | | |
| | | | University of Arkansas, Uams Campus, | | | | |
| | 535 | | | Rev., 5.00%, 03/01/2020 | | | 570 | |
| | 500 | | | Rev., 5.00%, 03/01/2025 | | | 585 | |
| | 1,000 | | | Rev., 5.00%, 03/01/2026 | | | 1,164 | |
| | 1,600 | | | University of Central Arkansas, Student Housing System, Series A, Rev., 5.00%, 11/01/2021 | | | 1,779 | |
| | | | | | | | |
| | | | | | | 4,098 | |
| | | | | | | | |
| | | | Other Revenue — 0.0% (g) | |
| | 580 | | | City of Little Rock, Hotel & Restaurant, Rev., 5.00%, 07/01/2020 | | | 621 | |
| | | | | | | | |
| | | | Total Arkansas | | | 4,719 | |
| | | | | | | | |
| | | | California — 27.2% | | | | |
| | | | Certificate of Participation/Lease — 0.1% | | | | |
| | | | City of Chula Vista, Police Facility Project, | | | | |
| | 360 | | | COP, 5.00%, 10/01/2021 | | | 401 | |
| | 465 | | | COP, 5.00%, 10/01/2022 | | | 527 | |
| | 1,000 | | | COP, 5.00%, 10/01/2023 | | | 1,153 | |
| | 140 | | | Goleta Water District, Series A, COP, AGM, 5.00%, 12/01/2020 | | | 152 | |
| | | | | | | | |
| | | | | | | 2,233 | |
| | | | | | | | |
| | | | Education — 0.9% | |
| | 1,675 | | | California Educational Facilities Authority, Claremont McKenna College, Series A, Rev., 4.00%, 01/01/2024 | | | 1,862 | |
| | 11,505 | | | Regents of the University of California, Series AK, Rev., 5.00%, 05/15/2023 (z) | | | 13,255 | |
| | | | | | | | |
| | | | | | | 15,117 | |
| | | | | | | | |
| | | | General Obligation — 8.6% | |
| | 1,050 | | | Allan Hancock Joint Community College District, GO, 5.00%, 08/01/2022 | | | 1,193 | |
| | 5,310 | | | City & County of San Francisco, Series A, GO, 5.00%, 06/15/2025 | | | 5,968 | |
| | 5,000 | | | County of Los Angeles, Community College District, Series C, GO, 5.00%, 06/01/2026 | | | 6,012 | |
SEE NOTES TO FINANCIAL STATEMENTS.
| | | | | | | | |
| | | |
| FEBRUARY 28, 2018 | | J.P. MORGAN MUNICIPAL BOND FUNDS | | | | | 19 | |
JPMorgan Short-Intermediate Municipal Bond Fund
SCHEDULE OF PORTFOLIO INVESTMENTS
AS OF FEBRUARY 28, 2018 (continued)
(Amounts in thousands)
| | | | | | | | |
PRINCIPAL
AMOUNT($) | | | SECURITY DESCRIPTION | | VALUE($) | |
| | Municipal Bonds — continued | | | | |
| | | | General Obligation — continued | |
| | | | County of Sacramento, San Juan Unified School District, Election of 2002, | | | | |
| | 860 | | | GO, 5.00%, 08/01/2019 | | | 903 | |
| | 775 | | | GO, 5.00%, 08/01/2020 | | | 837 | |
| | 1,000 | | | County of Santa Clara, Moreland School District, GO, 5.00%, 08/01/2021 | | | 1,106 | |
| | 350 | | | County of Santa Clara, San Jose Unified School District, GO, 5.00%, 08/01/2023 | | | 405 | |
| | | | Grossmont Healthcare District, | | | | |
| | 1,225 | | | Series D, GO, 5.00%, 07/15/2026 | | | 1,440 | |
| | 1,285 | | | Series D, GO, 5.00%, 07/15/2027 | | | 1,506 | |
| | 1,000 | | | Grossmont Healthcare District, Election of 2006, Series C, GO, 5.00%, 07/15/2026 | | | 1,176 | |
| | 1,000 | | | Los Angeles Community College District, Election of 2008, Series J, GO, 5.00%, 08/01/2028 | | | 1,209 | |
| | 11,535 | | | Los Angeles Unified School District, Series C, GO, 5.00%, 07/01/2021 | | | 12,780 | |
| | 300 | | | Moulton-Niguel Water District Consolidated, GO, 5.00%, 09/01/2018 | | | 306 | |
| | | | Novato Unified School District, | | | | |
| | 535 | | | GO, 4.00%, 02/01/2022 | | | 580 | |
| | 685 | | | GO, 5.00%, 02/01/2023 | | | 783 | |
| | 870 | | | GO, 5.00%, 02/01/2024 | | | 1,011 | |
| | 1,500 | | | GO, 5.00%, 08/01/2025 | | | 1,747 | |
| | 1,800 | | | GO, 5.00%, 08/01/2026 | | | 2,087 | |
| | 1,200 | | | Oak Grove School District, GO, 5.00%, 08/01/2023 | | | 1,383 | |
| | 1,770 | | | Placentia-Yorba Linda Unified School District, GO, 5.00%, 08/01/2025 | | | 2,106 | |
| | 2,000 | | | Salinas Union High School District, GO, BAN, Zero Coupon, 08/01/2020 | | | 1,906 | |
| | 6,310 | | | San Diego Unified School District, Dedicated Unlimited Ad Valorem Property Tax, Series R-3, GO, 5.00%, 07/01/2019 | | | 6,619 | |
| | 550 | | | San Diego Unified School District, Election of 2012, Series F, GO, 5.00%, 07/01/2029 | | | 645 | |
| | | | San Francisco Bay Area Rapid Transit District, Election of 2004, | | | | |
| | 2,735 | | | Series D, GO, 3.00%, 08/01/2022 | | | 2,879 | |
| | 1,500 | | | Series D, GO, 5.00%, 08/01/2027 | | | 1,772 | |
| | 1,685 | | | Series D, GO, 5.00%, 08/01/2028 | | | 1,985 | |
| | | | San Francisco Unified School District, | | | | |
| | 30 | | | Series A, GO, 4.00%, 08/01/2022 | | | 33 | |
| | 50 | | | Series B, GO, 5.00%, 08/01/2026 | | | 60 | |
| | 5,190 | | | San Francisco Unified School District, Proposition A, Election of 2011, Series B, GO, 5.00%, 06/15/2024 | | | 5,840 | |
| | | | | | | | |
PRINCIPAL
AMOUNT($) | | | SECURITY DESCRIPTION | | VALUE($) | |
| | | | | |
| | | | General Obligation — continued | |
| | | | San Mateo County Community College District, | | | | |
| | 700 | | | GO, 5.00%, 09/01/2025 | | | 822 | |
| | 1,095 | | | GO, 5.00%, 09/01/2026 | | | 1,281 | |
| | | | Southwestern Community College District, | | | | |
| | 270 | | | Series A, GO, 4.00%, 08/01/2031 | | | 290 | |
| | 250 | | | Series A, GO, 4.00%, 08/01/2032 | | | 266 | |
| | 300 | | | Series A, GO, 4.00%, 08/01/2033 | | | 317 | |
| | | | State of California, Various Purpose, | | | | |
| | 4,000 | | | GO, 4.00%, 08/01/2028 | | | 4,403 | |
| | 4,180 | | | GO, 4.00%, 08/01/2029 | | | 4,562 | |
| | 10,000 | | | GO, 4.00%, 08/01/2030 | | | 10,803 | |
| | 3,560 | | | GO, 5.00%, 11/01/2023 | | | 4,117 | |
| | 13,210 | | | GO, 5.00%, 03/01/2026 | | | 15,454 | |
| | 4,900 | | | GO, 5.00%, 09/01/2026 | | | 5,850 | |
| | 2,000 | | | GO, 5.00%, 09/01/2027 | | | 2,208 | |
| | 2,500 | | | GO, 5.00%, 09/01/2028 | | | 2,759 | |
| | 10,000 | | | GO, 5.00%, 08/01/2029 | | | 11,732 | |
| | 2,810 | | | Series B, GO, 5.00%, 09/01/2023 | | | 3,241 | |
| | 1,000 | | | Vacaville Unified School District, Election of 2014, Series B, GO, 4.00%, 08/01/2019 | | | 1,037 | |
| | 10,495 | | | Whittier Union School District, GO, 5.00%, 08/01/2023 | | | 12,169 | |
| | | | | | | | |
| | | | | | | 147,588 | |
| | | | | | | | |
| | | | Hospital — 3.2% | |
| | 1,850 | | | California Health Facilities Financing Authority, Cedars-Sinai Medical Center, Rev., 5.00%, 11/15/2025 | | | 2,196 | |
| | | | California Health Facilities Financing Authority, Kaiser Permanente, | | | | |
| | 5,000 | | | Series C, Rev., 5.00%, 11/01/2022 (z) | | | 5,681 | |
| | 17,420 | | | Series D, Rev., 5.00%, 11/01/2022 (z) | | | 19,798 | |
| | 2,500 | | | Subseries A-1, Rev., 5.00%, 11/01/2027 | | | 3,047 | |
| | | | California Health Facilities Financing Authority, Providence Health & Services, | | | | |
| | 750 | | | Series A, Rev., 5.00%, 10/01/2021 | | | 833 | |
| | 1,500 | | | Series A, Rev., 5.00%, 10/01/2022 | | | 1,696 | |
| | | | California Health Facilities Financing Authority, St. Joseph Health System, | | | | |
| | 5,000 | | | Series C, Rev., 5.00%, 10/15/2019 (z) | | | 5,278 | |
| | 12,870 | | | Series D, Rev., 5.00%, 10/15/2020 (z) | | | 13,961 | |
| | | | California Municipal Finance Authority, NorthBay Healthcare Group, | | | | |
| | 500 | | | Series A, Rev., 5.00%, 11/01/2023 | | | 551 | |
| | 800 | | | Series A, Rev., 5.00%, 11/01/2024 | | | 888 | |
| | 745 | | | Series A, Rev., 5.00%, 11/01/2025 | | | 832 | |
| | | | | | | | |
| | | | | | | 54,761 | |
| | | | | | | | |
SEE NOTES TO FINANCIAL STATEMENTS.
| | | | | | |
| | | |
| 20 | | | | J.P. MORGAN MUNICIPAL BOND FUNDS | | FEBRUARY 28, 2018 |
| | | | | | | | |
PRINCIPAL
AMOUNT($) | | | SECURITY DESCRIPTION | | VALUE($) | |
| | Municipal Bonds — continued | | | | |
| | | | Housing — 0.4% | |
| | 1,725 | | | Anaheim Housing & Public Improvements Authority, Electric Utility Distribution System, Series 2016-A, Rev., 5.00%, 10/01/2032 | | | 1,863 | |
| | 4,750 | | | California Statewide Communities Development Authority, LA Puente Park Apartments, Series F, Rev., 1.20%, 10/01/2018 (z) | | | 4,740 | |
| | | | | | | | |
| | | | | | | 6,603 | |
| | | | | | | | |
| | | | Other Revenue — 4.1% | |
| | | | Alameda County Transport Authority, Sales Tax, | | | | |
| | 5,000 | | | Rev., 4.00%, 03/01/2019 | | | 5,136 | |
| | 5,000 | | | Rev., 4.00%, 03/01/2022 | | | 5,424 | |
| | 1,240 | | | Rev., 5.00%, 03/01/2020 | | | 1,326 | |
| | | | California Infrastructure & Economic Development Bank, The J. Paul Getty Trust, | | | | |
| | 10,800 | | | Series A-1, Rev., (Dow Jones US Mid Cap Sofware Index GICS Level 4 USD + 0.28%, 12.00% Cap), 1.37%, 03/08/2018 (aa) | | | 10,792 | |
| | 8,000 | | | Series A-3, Rev., (ICE LIBOR USD 3 Month + 0.37%, 8.00% Cap), 1.61%, 04/02/2018 (aa) | | | 8,056 | |
| | 7,000 | | | Series A-4, Rev., (ICE LIBOR USD 3 Month + 0.37%, 8.00% Cap), 1.61%, 04/02/2018 (aa) | | | 7,099 | |
| | | | California Municipal Finance Authority, Biola University, | | | | |
| | 205 | | | Rev., 4.00%, 10/01/2019 | | | 213 | |
| | 370 | | | Rev., 5.00%, 10/01/2021 | | | 409 | |
| | 4,500 | | | California State Public Works Board, Department of General Services, Series F, Rev., 5.00%, 05/01/2021 | | | 4,951 | |
| | | | Contra Costa County Transportation Authority, Sales Tax, | | | | |
| | 3,420 | | | Series A, Rev., 4.00%, 03/01/2023 | | | 3,769 | |
| | 3,830 | | | Series A, Rev., 4.00%, 03/01/2025 | | | 4,302 | |
| | 2,420 | | | Series A, Rev., 5.00%, 03/01/2023 | | | 2,782 | |
| | 2,000 | | | Series A, Rev., 5.00%, 03/01/2024 | | | 2,342 | |
| | 1,000 | | | Series B, Rev., 4.00%, 03/01/2018 | | | 1,000 | |
| | 1,600 | | | Series B, Rev., 5.00%, 03/01/2018 | | | 1,600 | |
| | 1,750 | | | Series B, Rev., 5.00%, 03/01/2019 | | | 1,815 | |
| | 1,000 | | | Golden State Tobacco Securitization Corp., Tobacco Settlement, Series A, Rev., 5.00%, 06/01/2021 | | | 1,099 | |
| | | | Riverside Community Properties Development, Inc., Riverside County Law Building Project, | | | | |
| | 640 | | | Rev., 5.00%, 10/15/2018 (p) | | | 654 | |
| | 780 | | | Rev., 5.00%, 10/15/2019 (p) | | | 822 | |
| | | | | | | | |
PRINCIPAL
AMOUNT($) | | | SECURITY DESCRIPTION | | VALUE($) | |
| | | | | |
| | | | Other Revenue — Continued | |
| | | | San Diego County Regional Transportation Commission, Sales Tax, | | | | |
| | 250 | | | Series A, Rev., 5.00%, 04/01/2021 | | | 275 | |
| | 100 | | | Series A, Rev., 5.00%, 04/01/2022 | | | 113 | |
| | | | San Francisco Bay Area Rapid Transit District, Sales Tax, | | | | |
| | 525 | | | Series A, Rev., 5.00%, 07/01/2024 | | | 617 | |
| | 905 | | | Series A, Rev., 5.00%, 07/01/2025 | | | 1,078 | |
| | 1,700 | | | San Francisco State Building Authority & Oakland State Building Authority, Elihu M. Harris State Office Building, Series A, Rev., 5.00%, 12/01/2022 | | | 1,926 | |
| | 1,225 | | | Santa Clara County Financing Authority, Capital Projects, Series A, Rev., 5.00%, 02/01/2019 | | | 1,266 | |
| | 1,000 | | | Sonoma County Transportation Authority, Sales Tax, Rev., 5.00%, 12/01/2024 | | | 1,180 | |
| | | | | | | | |
| | | | | | | 70,046 | |
| | | | | | | | |
| | | | Prerefunded — 0.3% | |
| | 1,275 | | | Anaheim Housing & Public Improvements Authority, Electric Utility Distribution System, Series 2016-A, Rev., 5.00%, 10/01/2021 (p) | | | 1,421 | |
| | 1,160 | | | California State Public Works Board, California State University, Series E, Rev., 5.00%, 04/01/2019 (p) | | | 1,205 | |
| | 2,820 | | | California State Public Works Board, California State University, Davidson Library at Santa Barbara, Series C, Rev., 5.00%, 03/01/2023 (p) | | | 3,234 | |
| | | | | | | | |
| | | | | | | 5,860 | |
| | | | | | | | |
| | | | Transportation — 3.9% | |
| | | | Bay Area Toll Authority, Toll Bridge, San Francisco Bay Area, | | | | |
| | 7,550 | | | Series C, Rev., 1.88%, 04/01/2019 (z) | | | 7,576 | |
| | 9,000 | | | Series G, Rev., (Dow Jones US Mid Cap Sofware Index GICS Level 4 USD + 0.60%, 12.00% Cap), 1.69%, 03/08/2018 (aa) | | | 9,156 | |
| | 20,000 | | | Series S-7, Rev., 4.00%, 04/01/2029 | | | 22,211 | |
| | | | City of Los Angeles Department of Airports, | | | | |
| | 1,590 | | | Series A, Rev., AMT, 5.00%, 05/15/2021 | | | 1,742 | |
| | 315 | | | Series B, Rev., 4.00%, 05/15/2023 | | | 345 | |
| | 365 | | | Series B, Rev., 4.00%, 05/15/2024 | | | 403 | |
| | 1,015 | | | Series C, Rev., 4.00%, 05/15/2018 | | | 1,021 | |
| | 1,000 | | | Series C, Rev., 5.00%, 05/15/2019 | | | 1,044 | |
| | 750 | | | Series C, Rev., 5.00%, 05/15/2022 | | | 845 | |
| | 700 | | | Series C, Rev., 5.00%, 05/15/2024 | | | 815 | |
SEE NOTES TO FINANCIAL STATEMENTS.
| | | | | | | | |
| | | |
| FEBRUARY 28, 2018 | | J.P. MORGAN MUNICIPAL BOND FUNDS | | | | | 21 | |
JPMorgan Short-Intermediate Municipal Bond Fund
SCHEDULE OF PORTFOLIO INVESTMENTS
AS OF FEBRUARY 28, 2018 (continued)
(Amounts in thousands)
| | | | | | | | |
PRINCIPAL
AMOUNT($) | | | SECURITY DESCRIPTION | | VALUE($) | |
| | Municipal Bonds — continued | | | | |
| | | | Transportation — continued | |
| | 3,380 | | | Series D, Rev., AMT, 5.00%, 05/15/2022 | | | 3,776 | |
| | 2,700 | | | Series D, Rev., AMT, 5.00%, 05/15/2027 | | | 3,087 | |
| | 1,950 | | | Series D, Rev., AMT, 5.00%, 05/15/2028 | | | 2,222 | |
| | 2,550 | | | Series D, Rev., AMT, 5.00%, 05/15/2029 | | | 2,896 | |
| | 9,665 | | | Los Angeles County Metropolitan Transportation Authority, Series A, Rev., 5.00%, 07/01/2019 | | | 10,135 | |
| | | | | | | | |
| | | | | | | 67,274 | |
| | | | | | | | |
| | | | Utility — 1.5% | |
| | 3,500 | | | California Infrastructure & Economic Development Bank, Pacific Gas & Electric Co., Series E, Rev., 1.75%, 06/01/2022 (z) | | | 3,389 | |
| | 10,000 | | | City of Los Angeles Department of Water & Power, Power System, Series B, Rev., 5.00%, 12/01/2018 | | | 10,256 | |
| | 100 | | | City of Los Angeles, Department of Water & Power, Water System, Series A, Rev., 5.00%, 07/01/2025 | | | 118 | |
| | | | Sacramento Municipal Utility District, Electric, | | | | |
| | 2,740 | | | Series E, Rev., 5.00%, 08/15/2022 | | | 3,116 | |
| | 105 | | | Series E, Rev., 5.00%, 08/15/2027 | | | 128 | |
| | 7,000 | | | Southern California Public Power Authority, Magnolia Power Project, Series 1, Rev., 2.00%, 07/01/2020 (z) | | | 7,068 | |
| | 1,000 | | | Southern California, Public Power Authority Canyon Power Project, Series A, Rev., 5.00%, 07/01/2026 | | | 1,104 | |
| | 400 | | | Walnut Energy Center Authority, Series A, Rev., 5.00%, 01/01/2023 | | | 457 | |
| | | | | | | | |
| | | | | | | 25,636 | |
| | | | | | | | |
| | | | Water & Sewer — 4.2% | |
| | 250 | | | Burlingame Financing Authority Water & Wastewater, Rev., 4.00%, 04/01/2020 | | | 263 | |
| | 10,000 | | | California State Department of Water Resources, Central Valley Project Water System, Series AU, Rev., (Dow Jones US Mid Cap Sofware Index GICS Level 4 USD + 0.22%, 8.00% Cap), 1.31%, 03/08/2018 (aa) | | | 10,095 | |
| | 15,000 | | | California State Department of Water Resources, Power Supply, Series L, Rev., 5.00%, 05/01/2019 | | | 15,646 | |
| | | | City of Los Angeles Wastewater System Subordinate, | | | | |
| | 1,500 | | | Series A, Rev., 5.00%, 06/01/2018 | | | 1,514 | |
| | 1,250 | | | Series A, Rev., 5.00%, 06/01/2019 | | | 1,307 | |
| | 2,750 | | | Series A, Rev., 5.00%, 06/01/2022 | | | 3,110 | |
| | | | | | | | |
PRINCIPAL
AMOUNT($) | | | SECURITY DESCRIPTION | | VALUE($) | |
| | | | | | | | |
| | | | Water & Sewer — continued | |
| | 400 | | | County of San Mateo, Silicon Valley Clean Water, Rev., 4.00%, 02/01/2019 | | | 410 | |
| | | | East Bay Municipal Utility District, Wastewater System, | | | | |
| | 3,000 | | | Series A, Rev., 5.00%, 06/01/2020 | | | 3,234 | |
| | 2,330 | | | Series B, Rev., 5.00%, 06/01/2019 | | | 2,438 | |
| | | | Eastern Municipal Water District, Water & Wastewater, | | | | |
| | 2,530 | | | Series C, Rev., 5.00%, 07/01/2021 | | | 2,806 | |
| | 1,700 | | | Series C, Rev., 5.00%, 07/01/2022 | | | 1,930 | |
| | | | Metropolitan Water District of Southern California, | | | | |
| | 4,000 | | | Series A, Rev., 5.00%, 07/01/2018 | | | 4,050 | |
| | 8,000 | | | Series A, Rev., 5.00%, 07/01/2019 | | | 8,390 | |
| | 5,000 | | | Series C, Rev., 5.00%, 07/01/2018 | | | 5,063 | |
| | 6,105 | | | Series C-1, Rev., 3.00%, 10/01/2019 (z) | | | 6,238 | |
| | 5,000 | | | Orange County Sanitation District, Wastewater, Series A, Rev., 5.00%, 02/01/2030 | | | 5,979 | |
| | | | | | | | |
| | | | | | | 72,473 | |
| | | | | | | | |
| | | | Total California | | | 467,591 | |
| | | | | | | | |
| | | | Colorado — 1.7% | |
| | | | Certificate of Participation/Lease — 0.4% | |
| | | | City of Aurora, | | | | |
| | 125 | | | COP, 3.00%, 12/01/2020 | | | 129 | |
| | 375 | | | COP, 4.00%, 12/01/2022 | | | 406 | |
| | 375 | | | COP, 5.00%, 12/01/2030 | | | 434 | |
| | | | City of Longmont, | | | | |
| | 100 | | | Series A, COP, 5.00%, 12/01/2021 | | | 111 | |
| | 100 | | | Series A, COP, 5.00%, 12/01/2022 | | | 113 | |
| | 100 | | | Series A, COP, 5.00%, 12/01/2024 | | | 114 | |
| | | | County of Boulder, Flood Reconstruction Projects, | | | | |
| | 720 | | | COP, 5.00%, 12/01/2022 | | | 781 | |
| | 500 | | | COP, 5.00%, 12/01/2023 | | | 542 | |
| | 500 | | | COP, 5.00%, 12/01/2025 | | | 543 | |
| | | | County of Eagle, | | | | |
| | 500 | | | COP, 3.00%, 12/01/2018 | | | 506 | |
| | 200 | | | COP, 5.00%, 12/01/2022 | | | 225 | |
| | | | State of Colorado Department of Transportation, Headquarters Facilities Lease Purchase Agreement, | | | | |
| | 250 | | | COP, 3.00%, 06/15/2020 | | | 258 | |
| | 1,000 | | | COP, 3.00%, 06/15/2021 | | | 1,039 | |
| | 450 | | | COP, 5.00%, 06/15/2023 | | | 514 | |
| | 615 | | | COP, 5.00%, 06/15/2025 | | | 719 | |
| | | | | | | | |
| | | | | | | 6,434 | |
| | | | | | | | |
SEE NOTES TO FINANCIAL STATEMENTS.
| | | | | | |
| | | |
| 22 | | | | J.P. MORGAN MUNICIPAL BOND FUNDS | | FEBRUARY 28, 2018 |
| | | | | | | | |
PRINCIPAL
AMOUNT($) | | | SECURITY DESCRIPTION | | VALUE($) | |
| | Municipal Bonds — continued | | | | |
| | | | Education — 0.3% | |
| | 650 | | | Board of Governors of the University of Colorado, Enterprise System, Series B, Rev., 5.00%, 03/01/2029 | | | 756 | |
| | 1,080 | | | University of Colorado, Enterprise System, Series A-2, Rev., 5.00%, 06/01/2022 | | | 1,216 | |
| | 3,150 | | | University of Colorado, University Enterprise, Series A, Rev., 5.00%, 06/01/2022 | | | 3,548 | |
| | | | | | | | |
| | | | | | | 5,520 | |
| | | | | | | | |
| | | | General Obligation — 0.1% | |
| | | | Counties of Gunnison, Watershed School District No. 1, | | | | |
| | 300 | | | GO, 4.00%, 12/01/2022 | | | 327 | |
| | 500 | | | GO, 5.00%, 12/01/2026 | | | 579 | |
| | | | | | | | |
| | | | | | | 906 | |
| | | | | | | | |
| | | | Hospital — 0.2% | |
| | 675 | | | Colorado Health Facilities Authority, Parkview Medical Center, Inc. Project, Rev., 5.00%, 09/01/2027 | | | 786 | |
| | 2,620 | | | University of Colorado Hospital Authority, Series C-1, Rev., 4.00%, 03/01/2020 (z) | | | 2,706 | |
| | | | | | | | |
| | | | | | | 3,492 | |
| | | | | | | | |
| | | | Housing — 0.3% | |
| | 5,000 | | | Adams County Colorado Housing Authority Multifamily Housing, Baker School Apartment Project, Rev., 1.50%, 11/01/2019 (z) | | | 4,982 | |
| | | | | | | | |
| | | | Other Revenue — 0.1% | |
| | | | Denver Convention Center Hotel Authority, | | | | |
| | 375 | | | Rev., 4.00%, 12/01/2019 | | | 385 | |
| | 500 | | | Rev., 4.00%, 12/01/2020 | | | 520 | |
| | | | | | | | |
| | | | | | | 905 | |
| | | | | | | | |
| | | | Prerefunded — 0.2% | |
| | 3,700 | | | Regional Transportation District, | | | | |
| | | | Series A, COP, 5.00%, 06/01/2020 (p) | | | 3,969 | |
| | | | | | | | |
| | | | Transportation — 0.1% | |
| | 2,500 | | | E-470 Public Highway Authority, Senior LIBOR Index, Series A, Rev., (ICE LIBOR USD 1 Month + 0.90%, 10.00% Cap), 1.99%, 03/08/2018 (aa) | | | 2,517 | |
| | | | | | | | |
| | | | Total Colorado | | | 28,725 | |
| | | | | | | | |
| | | | Connecticut — 3.5% | |
| | | | Education — 2.0% | |
| | | | Connecticut State Health and Educational Facility Authority, Sacred Heart University, | | | | |
| | 400 | | | Series I-1, Rev., 5.00%, 07/01/2030 | | | 459 | |
| | 400 | | | Series I-1, Rev., 5.00%, 07/01/2031 | | | 457 | |
| | | | | | | | |
PRINCIPAL
AMOUNT($) | | | SECURITY DESCRIPTION | | VALUE($) | |
| | | | | | | | |
| | | | Education — continued | |
| | 15,000 | | | State of Connecticut, Health & Educational Facilities Authority, Hartford Healthcare Issue, Series G, Rev., (ICE LIBOR USD 1 Month + 0.95%, 12.00% Cap), 2.02%, 04/02/2018 (aa) | | | 15,151 | |
| | 18,775 | | | State of Connecticut, Health & Educational Facility Authority, Series B, Rev., (ICE LIBOR USD 1 Month + 0.55%, 12.00% Cap), 1.61%, 04/02/2018 (aa) | | | 18,804 | |
| | | | | | | | |
| | | | | | | 34,871 | |
| | | | | | | | |
| | | | General Obligation — 1.5% | |
| | 23,000 | | | Hartford County, Connecticut Metropolitan District, Series B, GO, BAN, 3.00%, 08/01/2018 | | | 23,102 | |
| | 1,500 | | | State of Connecticut, SIFMA Index, Series B, GO, (Dow Jones US Mid Cap Sofware Index GICS Level 4 USD + 0.49%, 10.00% Cap), 1.58%, 03/08/2018 (aa) | | | 1,502 | |
| | | | | | | | |
| | | | | | | 24,604 | |
| | | | | | | | |
| | | | Total Connecticut | | | 59,475 | |
| | | | | | | | |
| | | | Delaware — 0.0% (g) | |
| | | | General Obligation — 0.0% (g) | |
| | 120 | | | State of Delaware, GO, 5.00%, 07/01/2019 | | | 126 | |
| | | | | | | | |
| | | | District of Columbia — 0.6% | |
| | | | Hospital — 0.2% | |
| | | | District of Columbia Children’s Hospital, | | | | |
| | 1,100 | | | Rev., 5.00%, 07/15/2020 | | | 1,182 | |
| | 500 | | | Rev., 5.00%, 07/15/2021 | | | 550 | |
| | 850 | | | Rev., 5.00%, 07/15/2022 | | | 954 | |
| | | | | | | | |
| | | | | | | 2,686 | |
| | | | | | | | |
| | | | Transportation — 0.4% | |
| | 1,475 | | | Metropolitan Washington Airports Authority, Airport System, Series C, Rev., 5.00%, 10/01/2021 | | | 1,633 | |
| | 5,060 | | | Washington Metropolitan Area Transit Authority, Gross Revenue Transit Bonds, Series B, Rev., 5.00%, 07/01/2029 | | | 5,984 | |
| | | | | | | | |
| | | | | | | 7,617 | |
| | | | | | | | |
| | | | Total District of Columbia | | | 10,303 | |
| | | | | | | | |
| | | | Florida — 1.4% | |
| | | | Certificate of Participation/Lease — 0.2% | |
| | 750 | | | School Board of Duval County, Series B, COP, 5.00%, 07/01/2021 | | | 824 | |
| | | | Seminole County School Board, | | | | |
| | 295 | | | Series A, COP, 4.00%, 07/01/2018 | | | 297 | |
SEE NOTES TO FINANCIAL STATEMENTS.
| | | | | | | | |
| | | |
| FEBRUARY 28, 2018 | | J.P. MORGAN MUNICIPAL BOND FUNDS | | | | | 23 | |
JPMorgan Short-Intermediate Municipal Bond Fund
SCHEDULE OF PORTFOLIO INVESTMENTS
AS OF FEBRUARY 28, 2018 (continued)
(Amounts in thousands)
| | | | | | | | |
PRINCIPAL
AMOUNT($) | | | SECURITY DESCRIPTION | | VALUE($) | |
| | Municipal Bonds — continued | | | | |
| | | | Certificate of Participation/Lease — continued | |
| | 200 | | | Series A, COP, 5.00%, 07/01/2019 | | | 209 | |
| | 210 | | | Series A, COP, 5.00%, 07/01/2020 | | | 225 | |
| | 1,500 | | | St. Johns County School Board, Master Lease Program, COP, 5.00%, 07/01/2019 | | | 1,568 | |
| | | | | | | | |
| | | | | | | 3,123 | |
| | | | | | | | |
| | | | Education — 0.4% | |
| | 1,660 | | | Board of Governors of the University of Florida, Student Activity, Rev., 5.00%, 07/01/2020 | | | 1,785 | |
| | 3,980 | | | Florida State Board of Education, Lottery, Series A, Rev., 4.00%, 07/01/2027 | | | 4,256 | |
| | | | | | | | |
| | | | | | | 6,041 | |
| | | | | | | | |
| | | | General Obligation — 0.1% | |
| | 1,000 | | | Reedy Creek Improvement District, Series B, GO, 4.00%, 06/01/2019 | | | 1,031 | |
| | | | | | | | |
| | | | Transportation — 0.1% | |
| | | | Miami-Dade County Expressway Authority, Toll System, | | | | |
| | 1,550 | | | Series A, Rev., 5.00%, 07/01/2020 | | | 1,664 | |
| | 625 | | | Series A, Rev., 5.00%, 07/01/2022 | | | 700 | |
| | | | | | | | |
| | | | | | | 2,364 | |
| | | | | | | | |
| | | | Utility — 0.6% | |
| | 8,500 | | | JEA Electric System, Series 2017B, Rev., 5.00%, 10/01/2025 | | | 9,929 | |
| | | | | | | | |
| | | | Water & Sewer — 0.0% (g) | |
| | 675 | | | City of Miami Beach, Water and Sewer, Rev., 5.00%, 09/01/2025 | | | 788 | |
| | | | | | | | |
| | | | Total Florida | | | 23,276 | |
| | | | | | | | |
| | | | Georgia — 2.9% | |
| | | | General Obligation — 1.2% | |
| | 1,000 | | | City of Atlanta, Series A, GO, 4.00%, 12/01/2019 | | | 1,043 | |
| | | | Douglas County, Sales Tax, | | | | |
| | 500 | | | GO, 5.00%, 04/01/2018 | | | 502 | |
| | 1,120 | | | GO, 5.00%, 04/01/2019 | | | 1,162 | |
| | | | State of Georgia, | | | | |
| | 6,750 | | | Series E, GO, 5.00%, 12/01/2025 | | | 8,030 | |
| | 1,250 | | | Series I, GO, 5.00%, 07/01/2019 | | | 1,308 | |
| | 8,165 | | | Series I, GO, 5.00%, 07/01/2021 | | | 9,016 | |
| | | | | | | | |
| | | | | | | 21,061 | |
| | | | | | | | |
| | | | Housing — 0.1% | |
| | | | Gwinnett County Development Authority, Gwinnett College Student Housing Project, | | | | |
| | 725 | | | Series A, Rev., 5.00%, 07/01/2025 | | | 839 | |
| | | | | | | | |
PRINCIPAL
AMOUNT($) | | | SECURITY DESCRIPTION | | VALUE($) | |
| | | | | | | | |
| | | | Housing — continued | |
| | 700 | | | Series A, Rev., 5.00%, 07/01/2026 | | | 816 | |
| | | | | | | | |
| | | | | | | 1,655 | |
| | | | | | | | |
| | | | Industrial Development Revenue/Pollution Control Revenue — 0.2% | |
| | 4,000 | | | Monroe County Development Authority, Pollution Control, Gulf Power Company Plant, Scherer Project, Rev., 2.00%, 06/21/2018 (z) | | | 4,002 | |
| | | | | | | | |
| | | | Other Revenue — 0.8% | |
| | | | Atlanta Development Authority, New Downtown Atlanta Stadium Project, Senior Lien, | | | | |
| | 1,000 | | | Series A-1, Rev., 5.00%, 07/01/2027 | | | 1,140 | |
| | 1,000 | | | Series A-1, Rev., 5.00%, 07/01/2028 | | | 1,136 | |
| | | | Dahlonega Downtown Development Authority, North Georgia MAC, LLC Project, | | | | |
| | 1,000 | | | Series 2017, Rev., 4.00%, 07/01/2032 | | | 1,046 | |
| | 325 | | | Series 2017, Rev., 5.00%, 07/01/2023 | | | 368 | |
| | 420 | | | Series 2017, Rev., 5.00%, 07/01/2024 | | | 482 | |
| | 250 | | | Series 2017, Rev., 5.00%, 07/01/2025 | | | 290 | |
| | 275 | | | Series 2017, Rev., 5.00%, 07/01/2026 | | | 321 | |
| | 300 | | | Series 2017, Rev., 5.00%, 07/01/2027 | | | 352 | |
| | 375 | | | Series 2017, Rev., 5.00%, 07/01/2028 | | | 438 | |
| | 575 | | | Series 2017, Rev., 5.00%, 07/01/2029 | | | 669 | |
| | 1,200 | | | Series 2017, Rev., 5.00%, 07/01/2030 | | | 1,391 | |
| | 5,000 | | | Fulton County Development Authority, Technology Athletic Association Project, Series A, Rev., 5.00%, 10/01/2022 | | | 5,560 | |
| | | | | | | | |
| | | | | | | 13,193 | |
| | | | | | | | |
| | | | Utility — 0.4% | |
| | | | City of Dalton, Board of Water Light & Sinking Fund Commissioners, | | | | |
| | 500 | | | Rev., 5.00%, 03/01/2025 | | | 581 | |
| | 500 | | | Rev., 5.00%, 03/01/2026 | | | 585 | |
| | 2,080 | | | Rev., 5.00%, 03/01/2030 | | | 2,417 | |
| | 2,000 | | | Rev., 5.00%, 03/01/2031 | | | 2,312 | |
| | 1,095 | | | Rev., 5.00%, 03/01/2032 | | | 1,262 | |
| | | | | | | �� | |
| | | | | | | 7,157 | |
| | | | | | | | |
| | | | Water & Sewer — 0.2% | |
| | 3,000 | | | City of Atlanta, Water & Wastewater, Revenue Refunding, Series A-1, Rev., (ICE LIBOR USD 1 Month + 1.50%, 10.00% Cap), 2.57%, 03/08/2018 (aa) | | | 3,029 | |
| | | | | | | | |
| | | | Total Georgia | | | 50,097 | |
| | | | | | | | |
SEE NOTES TO FINANCIAL STATEMENTS.
| | | | | | |
| | | |
| 24 | | | | J.P. MORGAN MUNICIPAL BOND FUNDS | | FEBRUARY 28, 2018 |
| | | | | | | | |
PRINCIPAL
AMOUNT($) | | | SECURITY DESCRIPTION | | VALUE($) | |
| | Municipal Bonds — continued | | | | |
| | | | Guam — 0.0% (g) | |
| | | | Other Revenue — 0.0% (g) | |
| | 750 | | | Government of Guam, Limited Obligation Section 30, (Guam), Series A, Rev., 5.00%, 12/01/2018 | | | 766 | |
| | | | | | | | |
| | | | Hawaii — 1.2% | |
| | | | General Obligation — 1.2% | |
| | 2,200 | | | City & County of Honolulu, Rail Transit Project, GO, (Dow Jones US Mid Cap Sofware Index GICS Level 4 USD + 0.30%, 8.00% Cap), 1.39%, 03/08/2018 (aa) | | | 2,209 | |
| | | | State of Hawaii, | | | | |
| | 10,160 | | | Series DY, GO, 5.00%, 02/01/2020 | | | 10,805 | |
| | 7,640 | | | Series EF, GO, 5.00%, 11/01/2021 | | | 8,483 | |
| | | | | | | | |
| | | | Total Hawaii | | | 21,497 | |
| | | | | | | | |
| | | | Illinois — 4.0% | |
| | | | Education — 0.3% | |
| | 5,000 | | | Illinois Educational Facilities Authority, University of Chicago, Series B-2, Rev., 1.55%, 02/13/2020 (z) | | | 4,958 | |
| | | | Illinois Finance Authority, DePaul University, | | | | |
| | 200 | | | Rev., 5.00%, 10/01/2023 | | | 226 | |
| | 300 | | | Rev., 5.00%, 10/01/2025 | | | 346 | |
| | 250 | | | Rev., 5.00%, 10/01/2028 | | | 288 | |
| | | | | | | | |
| | | | | | | 5,818 | |
| | | | | | | | |
| | | | General Obligation — 1.8% | |
| | 5,000 | | | City of Chicago, Series C, GO, 5.00%, 01/01/2022 | | | 5,348 | |
| | 5 | | | Cook County Township High School District No. 225, Series A, GO, 5.00%, 12/01/2023 | | | 6 | |
| | 335 | | | County of DuPage, Courthouse Project, GO, 5.00%, 01/01/2024 | | | 382 | |
| | 3,065 | | | County of Winnebago, Public Safety, Series A, GO, 4.00%, 12/30/2019 | | | 3,182 | |
| | 2,800 | | | DuPage County Forest Preserve District, GO, 5.00%, 01/01/2021 | | | 3,023 | |
| | 355 | | | Kane & DeKalb Counties Community Unit School District No. 301, GO, 5.00%, 01/01/2027 | | | 413 | |
| | 2,000 | | | Lake & McHenry Counties Community Unit School District No. 118, GO, 5.00%, 01/01/2024 | | | 2,257 | |
| | | | Lincoln Land Community College District No. 526, | | | | |
| | 440 | | | GO, 4.00%, 12/15/2022 | | | 469 | |
| | 305 | | | GO, 5.00%, 12/15/2021 | | | 338 | |
| | 300 | | | McHenry County, Woodstock Community Unit School District No. 200, GO, 5.00%, 01/15/2021 | | | 325 | |
| | | | | | | | |
PRINCIPAL
AMOUNT($) | | | SECURITY DESCRIPTION | | VALUE($) | |
| | | | | | | | |
| | | | General Obligation — continued | |
| | 15,000 | | | State of Illinois, Series D, GO, 5.00%, 11/01/2020 | | | 15,579 | |
| | | | | | | | |
| | | | | | | 31,322 | |
| | | | | | | | |
| | | | Hospital — 1.0% | |
| | 6,000 | | | Illinois Finance Authority, Advocate Health Care, Series A-1, Rev., 5.00%, 01/15/2020 (z) | | | 6,353 | |
| | 1,500 | | | Illinois Finance Authority, Ann & Robert H. Lurie Children’s Hospital, Rev., 5.00%, 08/15/2027 | | | 1,761 | |
| | 3,750 | | | Illinois Finance Authority, Ascension Health Alliance Senior Credit Group, Series E-2, Rev., 1.75%, 04/01/2021 (z) | | | 3,707 | |
| | 2,500 | | | Illinois Finance Authority, Edward-Elmhurst Healthcare, Series A, Rev., 5.00%, 01/01/2030 | | | 2,843 | |
| | | | Illinois Finance Authority, Silver Cross Hospital & Medical Centers, | | | | |
| | 150 | | | Series C, Rev., 5.00%, 08/15/2021 | | | 161 | |
| | 500 | | | Series C, Rev., 5.00%, 08/15/2022 | | | 544 | |
| | 2,000 | | | Southwestern Illinois Development Authority, Hospital Sisters Services, Inc. Obligated Group, Series A, Rev., 5.00%, 02/15/2027 | | | 2,331 | |
| | | | | | | | |
| | | | | | | 17,700 | |
| | | | | | | | |
| | | | Other Revenue — 0.6% | |
| | | | Arlington Heights Park District, | | | | |
| | 1,070 | | | Series B, Rev., 4.00%, 12/01/2027 | | | 1,156 | |
| | 1,135 | | | Series B, Rev., 4.00%, 12/01/2028 | | | 1,221 | |
| | 1,550 | | | Illinois Finance Authority, Ann & Robert H. Lurie Children’s Hospital, Rev., 5.00%, 08/15/2026 | | | 1,809 | |
| | 2,515 | | | Illinois Finance Authority, Clean Water Initiative, Rev., 5.00%, 01/01/2019 | | | 2,587 | |
| | 2,745 | | | State of Illinois, Junior Obligation, Rev., 5.00%, 06/15/2018 | | | 2,771 | |
| | | | | | | | |
| | | | | | | 9,544 | |
| | | | | | | | |
| | | | Transportation — 0.3% | |
| | | | City of Chicago, Chicago Midway Airport Second Lien Revenue Refunding, | | | | |
| | 1,460 | | | Series A, Rev., AMT, 5.00%, 01/01/2020 | | | 1,541 | |
| | 2,580 | | | Series A, Rev., AMT, 5.00%, 01/01/2021 | | | 2,780 | |
| | 500 | | | Series B, Rev., 5.00%, 01/01/2020 | | | 529 | |
| | | | | | | | |
| | | | | | | 4,850 | |
| | | | | | | | |
| | | | Total Illinois | | | 69,234 | |
| | | | | | | | |
SEE NOTES TO FINANCIAL STATEMENTS.
| | | | | | | | |
| | | |
| FEBRUARY 28, 2018 | | J.P. MORGAN MUNICIPAL BOND FUNDS | | | | | 25 | |
JPMorgan Short-Intermediate Municipal Bond Fund
SCHEDULE OF PORTFOLIO INVESTMENTS
AS OF FEBRUARY 28, 2018 (continued)
(Amounts in thousands)
| | | | | | | | |
PRINCIPAL
AMOUNT($) | | | SECURITY DESCRIPTION | | VALUE($) | |
| | Municipal Bonds — continued | | | | |
| | | | Indiana — 0.7% | |
| | | | Education — 0.2% | |
| | 265 | | | County of Elkhart, GCS School Building Corp. One, First Mortgage Refunding & Improvement, Rev., 5.00%, 07/15/2018 | | | 269 | |
| | 1,170 | | | Indiana Finance Authority, Educational Facilities, Indianapolis Museum of Art, Inc. Project, Series B, Rev., 5.00%, 02/01/2019 | | | 1,203 | |
| | | | New Albany Floyd County School Building Corp., | | | | |
| | 700 | | | Rev., 5.00%, 07/15/2021 | | | 771 | |
| | 835 | | | Rev., 5.00%, 07/15/2022 | | | 938 | |
| | | | | | | | |
| | | | | | | 3,181 | |
| | | | | | | | |
| | | | Other Revenue — 0.4% | |
| | 1,000 | | | Fort Wayne Redevelopment Authority Lease Rental, Harrison Square Project, Rev., 5.00%, 08/01/2023 | | | 1,132 | |
| | 5,500 | | | Indiana State Finance Authority State Revolving Fund Program Refunding, Series B, Rev., 5.00%, 02/01/2019 | | | 5,680 | |
| | 750 | | | Indiana State Office Building Commission, Indiana State Museum Facility, Series C, Rev., NATL-RE, 5.25%, 07/01/2019 (p) | | | 786 | |
| | | | | | | | |
| | | | | | | 7,598 | |
| | | | | | | | |
| | | | Utility — 0.1% | |
| | 1,250 | | | Indiana Municipal Power Agency, Power Supply System, Series A, Rev., 5.00%, 01/01/2019 | | | 1,286 | |
| | | | | | | | |
| | | | Water & Sewer — 0.0% (g) | |
| | 620 | | | Evansville Local Public Improvement Bond Bank, Sewage Works Project, Series A, Rev., 5.00%, 07/01/2019 | | | 648 | |
| | | | | | | | |
| | | | Total Indiana | | | 12,713 | |
| | | | | | | | |
| | | | Kansas — 0.7% | |
| | | | General Obligation — 0.5% | |
| | 200 | | | Butler County, Unified School District No. 375, GO, 4.00%, 09/01/2024 | | | 212 | |
| | 625 | | | Johnson County Unified School District No. 233, Series B, GO, 4.00%, 09/01/2025 | | | 686 | |
| | | | Seward County Unified School District No. 480, | | | | |
| | 1,140 | | | Series B, GO, 5.00%, 09/01/2023 | | | 1,294 | |
| | 1,400 | | | Series B, GO, 5.00%, 09/01/2024 | | | 1,609 | |
| | 1,750 | | | Series B, GO, 5.00%, 09/01/2025 | | | 2,029 | |
| | 2,500 | | | Series B, GO, 5.00%, 09/01/2027 | | | 2,868 | |
| | | | | | | | |
| | | | | | | 8,698 | |
| | | | | | | | |
| | | | Hospital — 0.0% (g) | |
| | 275 | | | University of Kansas Hospital Authority, Health System, Series A, Rev., 5.00%, 03/01/2024 | | | 314 | |
| | | | | | | | |
| | | | | | | | |
PRINCIPAL
AMOUNT($) | | | SECURITY DESCRIPTION | | VALUE($) | |
| | | | | | | | |
| | | | Water & Sewer — 0.2% | |
| | 2,200 | | | City of Wichita, Water & Sewer Utility, Series A, Rev., 5.00%, 10/01/2022 | | | 2,481 | |
| | | | | | | | |
| | | | Total Kansas | | | 11,493 | |
| | | | | | | | |
| | | | Kentucky — 0.5% | |
| | | | Education — 0.5% | |
| | 6,980 | | | University of Kentucky, Series D, Rev., 5.00%, 10/01/2021 | | | 7,745 | |
| | | | | | | | |
| | | | Prerefunded — 0.0% (g) | |
| | 250 | | | Carter County Kentucky School District Finance Corp., Rev., 4.50%, 02/01/2021 (p) | | | 269 | |
| | | | | | | | |
| | | | Transportation — 0.0% (g) | |
| | 345 | | | Louisville Regional Airport Authority, Airport System, Series B, Rev., 4.00%, 07/01/2018 | | | 348 | |
| | | | | | | | |
| | | | Total Kentucky | | | 8,362 | |
| | | | | | | | |
| | | | Louisiana — 0.7% | |
| | | | Hospital — 0.1% | |
| | | | Louisiana Public Facilities Authority, Ochsner Clinic Foundation Project, | | | | |
| | 300 | | | Rev., 3.00%, 05/15/2018 | | | 301 | |
| | 400 | | | Rev., 5.00%, 05/15/2023 | | | 452 | |
| | 500 | | | Rev., 5.00%, 05/15/2024 | | | 570 | |
| | 600 | | | Rev., 5.00%, 05/15/2025 | | | 688 | |
| | | | | | | | |
| | | | | | | 2,011 | |
| | | | | | | | |
| | | | Other Revenue — 0.3% | |
| | 2,350 | | | Louisiana Local Government Environmental Facilities & Community Development Authority, LCTCS Act 391 Project, Rev., 5.00%, 10/01/2021 | | | 2,587 | |
| | | | Louisiana Public Facilities Authority, Tulane University Project, | | | | |
| | 230 | | | Rev., 5.00%, 12/15/2022 | | | 259 | |
| | 315 | | | Rev., 5.00%, 12/15/2023 | | | 359 | |
| | 300 | | | Rev., 5.00%, 12/15/2024 | | | 346 | |
| | 250 | | | Rev., 5.00%, 12/15/2025 | | | 290 | |
| | 300 | | | Rev., 5.00%, 12/15/2026 | | | 350 | |
| | 600 | | | Rev., 5.00%, 12/15/2027 | | | 705 | |
| | 200 | | | Rev., 5.00%, 12/15/2029 | | | 232 | |
| | 150 | | | Rev., 5.00%, 12/15/2030 | | | 173 | |
| | 165 | | | Rev., 5.00%, 12/15/2032 | | | 189 | |
| | | | | | | | |
| | | | | | | 5,490 | |
| | | | | | | | |
SEE NOTES TO FINANCIAL STATEMENTS.
| | | | | | |
| | | |
| 26 | | | | J.P. MORGAN MUNICIPAL BOND FUNDS | | FEBRUARY 28, 2018 |
| | | | | | | | |
PRINCIPAL
AMOUNT($) | | | SECURITY DESCRIPTION | | VALUE($) | |
| | Municipal Bonds — continued | | | | |
| | | | Water & Sewer — 0.3% | |
| | 4,580 | | | East Baton Rouge Sewerage Commission, Series A, Rev., (ICE LIBOR USD 1 Month + 0.50%, 12.00% Cap), 1.60%, 04/02/2018 (aa) | | | 4,589 | |
| | | | | | | | |
| | | | Total Louisiana | | | 12,090 | |
| | | | | | | | |
| | | | Maryland — 2.3% | |
| | | | General Obligation — 1.5% | |
| | 2,000 | | | County of Montgomery, Public Improvement, Series A, GO, 5.00%, 08/01/2019 | | | 2,100 | |
| | 12,795 | | | State of Maryland, State & Local Facilities Loan of 2013, Second Series, Series A, GO, 5.00%, 08/01/2020 | | | 13,808 | |
| | 7,550 | | | State of Maryland, State & Local Facilities Loan of 2017, First Series, Series A, GO, 5.00%, 03/15/2026 | | | 8,969 | |
| | | | | | | | |
| | | | | | | 24,877 | |
| | | | | | | | |
| | | | Other Revenue — 0.6% | |
| | | | Maryland Stadium Authority, Construction & Revitalization Program, | | | | |
| | 2,100 | | | Series 2018A, Rev., 5.00%, 05/01/2027 | | | 2,487 | |
| | 1,725 | | | Series 2018A, Rev., 5.00%, 05/01/2028 | | | 2,056 | |
| | 5,245 | | | Series 2018A, Rev., 5.00%, 05/01/2032 | | | 6,117 | |
| | | | | | | | |
| | | | | | | 10,660 | |
| | | | | | | | |
| | | | Prerefunded — 0.2% | |
| | 3,000 | | | State of Maryland, State & Local Facilities Loan of 2015, Series A, GO, 5.00%, 03/01/2023 (p) | | | 3,416 | |
| | | | | | | | |
| | | | Total Maryland | | | 38,953 | |
| | | | | | | | |
| | | | Massachusetts — 2.7% | |
| | | | General Obligation — 0.9% | |
| | | | City of Boston, | | | | |
| | 6,820 | | | Series A, GO, 5.00%, 03/01/2022 | | | 7,645 | |
| | 7,360 | | | Series A, GO, 5.00%, 03/01/2023 | | | 8,403 | |
| | | | | | | | |
| | | | | | | 16,048 | |
| | | | | | | | |
| | | | Hospital — 0.6% | |
| | 10,000 | | | Massachusetts Development Finance Agency, Partners Healthcare System Issue, Series 2017S, Rev., (Dow Jones US Mid Cap Sofware Index GICS Level 4 USD + 0.50%, 10.00% Cap), 1.59%, 03/08/2018 (aa) | | | 10,068 | |
| | 450 | | | Massachusetts Development Finance Agency, Umass Memorial Health Care Obligated Group, Series I, Rev., 5.00%, 07/01/2018 | | | 455 | |
| | 500 | | | Massachusetts State Development Finance Agency, Lahey Health System, Series F, Rev., 5.00%, 08/15/2026 | | | 536 | |
| | | | | | | | |
| | | | | | | 11,059 | |
| | | | | | | | |
| | | | | | | | |
PRINCIPAL
AMOUNT($) | | | SECURITY DESCRIPTION | | VALUE($) | |
| | | | | | | | |
| | | | Other Revenue — 0.2% | |
| | 3,250 | | | Massachusetts Development Finance Agency, Caregroup, Series H-1, Rev., 5.00%, 07/01/2019 | | | 3,394 | |
| | | | | | | | |
| | | | Prerefunded — 0.4% | |
| | 7,515 | | | Massachusetts Health & Educational Facilities Authority, Institute of Technology, Series O, Rev., 6.00%, 07/01/2018 (p) | | | 7,630 | |
| | | | | | | | |
| | | | Transportation — 0.1% | |
| | 1,135 | | | Massachusetts Bay Transportation Authority, General Transportation System, Series A-2, Rev., VRDO, 1.10%, 03/08/2018 (z) | | | 1,135 | |
| | | | | | | | |
| | | | Water & Sewer — 0.5% | |
| | 6,775 | | | Massachusetts Clean Water Trust, State Revolving Fund, Rev., 5.00%, 08/01/2025 | | | 8,019 | |
| | | | | | | | |
| | | | Total Massachusetts | | | 47,285 | |
| | | | | | | | |
| | | | Michigan — 1.4% | |
| | | | General Obligation — 0.3% | |
| | 1,000 | | | Kalamazoo Public Schools, GO, 5.00%, 05/01/2022 | | | 1,115 | |
| | | | Troy School District, School Building & Site, | | | | |
| | 875 | | | GO, Q-SBLF, 4.00%, 05/01/2018 | | | 879 | |
| | 650 | | | GO, Q-SBLF, 5.00%, 05/01/2019 | | | 678 | |
| | 500 | | | GO, Q-SBLF, 5.00%, 05/01/2020 | | | 538 | |
| | 550 | | | GO, Q-SBLF, 5.00%, 05/01/2021 | | | 607 | |
| | 500 | | | GO, Q-SBLF, 5.00%, 05/01/2022 | | | 564 | |
| | | | | | | | |
| | | | | | | 4,381 | |
| | | | | | | | |
| | | | Hospital — 0.7% | |
| | | | Michigan Finance Authority, Trinity Health Credit Group, | | | | |
| | 1,250 | | | Series 2017A, Rev., 5.00%, 12/01/2023 | | | 1,428 | |
| | 1,500 | | | Series 2017A, Rev., 5.00%, 12/01/2024 | | | 1,732 | |
| | 2,500 | | | Series 2017A, Rev., 5.00%, 12/01/2025 | | | 2,910 | |
| | 2,250 | | | Series 2017A, Rev., 5.00%, 12/01/2026 | | | 2,638 | |
| | 2,250 | | | Michigan State Hospital Finance Authority, Ascension Health Credit Group, Series B-4, Rev., 5.00%, 11/15/2027 | | | 2,574 | |
| | | | | | | | |
| | | | | | | 11,282 | |
| | | | | | | | |
| | | | Industrial Development Revenue/Pollution Control Revenue — 0.1% | |
| | 2,600 | | | Michigan Strategic Fund, The Detroit Edison Company Pollution Control Bonds Project, Series CC, Rev., 1.45%, 09/01/2021 (z) | | | 2,535 | |
| | | | | | | | |
| | | | Other Revenue — 0.3% | |
| | 2,250 | | | Michigan Finance Authority, Clean Water Revolving Fund, Rev., 5.00%, 10/01/2021 | | | 2,495 | |
SEE NOTES TO FINANCIAL STATEMENTS.
| | | | | | | | |
| | | |
| FEBRUARY 28, 2018 | | J.P. MORGAN MUNICIPAL BOND FUNDS | | | | | 27 | |
JPMorgan Short-Intermediate Municipal Bond Fund
SCHEDULE OF PORTFOLIO INVESTMENTS
AS OF FEBRUARY 28, 2018 (continued)
(Amounts in thousands)
| | | | | | | | |
PRINCIPAL
AMOUNT($) | | | SECURITY DESCRIPTION | | VALUE($) | |
| | Municipal Bonds — continued | | | | |
| | | | Other Revenue — continued | |
| | | | Michigan Finance Authority, Local Government Loan Program, | | | | |
| | 1,290 | | | Series B, Rev., 4.00%, 11/01/2018 | | | 1,311 | |
| | 675 | | | Series B, Rev., 4.00%, 11/01/2019 | | | 700 | |
| | 455 | | | Series B, Rev., 4.00%, 11/01/2020 | | | 480 | |
| | | | | | | | |
| | | | | | | 4,986 | |
| | | | | | | | |
| | | | Water & Sewer — 0.0% (g) | |
| | 350 | | | City of Grand Rapids, Sanitary Sewer System Improvement, Rev., 5.00%, 01/01/2022 | | | 390 | |
| | | | | | | | |
| | | | Total Michigan | | | 23,574 | |
| | | | | | | | |
| | | | Minnesota — 0.3% | |
| | | | Education — 0.1% | |
| | 350 | | | Minnesota Higher Education Facilities Authority, Series L, Rev., 4.00%, 04/01/2020 | | | 366 | |
| | | | Minnesota Higher Education Facilities Authority, Macalester College, | | | | |
| | 175 | | | Rev., 4.00%, 03/01/2025 | | | 193 | |
| | 230 | | | Rev., 5.00%, 03/01/2024 | | | 265 | |
| | 150 | | | Rev., 5.00%, 03/01/2026 | | | 176 | |
| | 150 | | | Rev., 5.00%, 03/01/2027 | | | 178 | |
| | 150 | | | Rev., 5.00%, 03/01/2029 | | | 176 | |
| | | | | | | | |
| | | | | | | 1,354 | |
| | | | | | | | |
| | | | Transportation — 0.1% | |
| | | | Minneapolis-St Paul Metropolitan Airports Commission, Subordinate Airport, | | | | |
| | 220 | | | Series A, Rev., 5.00%, 01/01/2020 | | | 233 | |
| | 1,000 | | | Series A, Rev., 5.00%, 01/01/2022 | | | 1,111 | |
| | | | | | | | |
| | | | | | | 1,344 | |
| | | | | | | | |
| | | | Utility — 0.1% | |
| | | | Western Minnesota Municipal Power Agency, Power Supply, | | | | |
| | 1,500 | | | Series A, Rev., 5.00%, 01/01/2023 | | | 1,697 | |
| | 1,000 | | | Series A, Rev., 5.00%, 01/01/2024 | | | 1,149 | |
| | | | | | | | |
| | | | | | | 2,846 | |
| | | | | | | | |
| | | | Total Minnesota | | | 5,544 | |
| | | | | | | | |
| | | | Mississippi — 0.2% | |
| | | | Education — 0.1% | |
| | 1,745 | | | Mississippi State University Educational Building Corp., New Facilities & Refinancing Project, Series A, Rev., 4.00%, 08/01/2018 | | | 1,763 | |
| | | | | | | | |
| | | | Other Revenue — 0.1% | |
| | | | Mississippi Development Bank, Rankin County Bond Project, | | | | |
| | 750 | | | Rev., 5.00%, 03/01/2023 | | | 840 | |
| | | | | | | | |
PRINCIPAL
AMOUNT($) | | | SECURITY DESCRIPTION | | VALUE($) | |
| | | | | | | | |
| | | | Other Revenue — continued | |
| | 1,080 | | | Rev., 5.00%, 03/01/2024 | | | 1,225 | |
| | | | | | | | |
| | | | | | | 2,065 | |
| | | | | | | | |
| | | | Total Mississippi | | | 3,828 | |
| | | | | | | | |
| | | | Missouri — 1.0% | |
| | | | Certificate of Participation/Lease — 0.1% | |
| | 1,000 | | | City of Chesterfield, COP, 5.00%, 12/01/2021 | | | 1,106 | |
| | | | | | | | |
| | | | Education — 0.2% | |
| | | | Health & Educational Facilities Authority, | | | | |
| | 450 | | | Rev., 4.00%, 10/01/2018 | | | 457 | |
| | 625 | | | Rev., 4.00%, 10/01/2019 | | | 650 | |
| | 300 | | | Rev., 4.00%, 10/01/2020 | | | 318 | |
| | 300 | | | Rev., 4.00%, 10/01/2021 | | | 323 | |
| | | | Missouri State Health & Educational Facilities Authority, Health Facilities, BJC Health System, | | | | |
| | 855 | | | Rev., 5.00%, 01/01/2019 | | | 879 | |
| | 225 | | | Rev., 5.00%, 01/01/2021 | | | 243 | |
| | | | | | | | |
| | | | | | | 2,870 | |
| | | | | | | | |
| | | | General Obligation — 0.1% | |
| | 1,300 | | | City of Kansas, Improvement & Refunding, Series A, GO, 5.00%, 02/01/2023 | | | 1,446 | |
| | 350 | | | County of Clay, North Kansas City School District 74, Refunding & Improvement, Missouri Direct Deposit Program, GO, 5.00%, 03/01/2022 | | | 391 | |
| | | | | | | | |
| | | | | | | 1,837 | |
| | | | | | | | |
| | | | Industrial Development Revenue/Pollution Control Revenue — 0.0% (g) | |
| | 550 | | | Missouri Environmental Improvement & Energy Resources Authority, Water Pollution Control & Drinking Water, Series B, Rev., 5.00%, 07/01/2023 | | | 598 | |
| | | | | | | | |
| | | | Other Revenue — 0.2% | |
| | 350 | | | City of Springfield, Series A, Rev., 4.00%, 09/01/2018 | | | 355 | |
| | 2,010 | | | County of St. Louis, Regional Convention & Sports Complex Authority, Convention & Sports Facility, Series B, Rev., 5.00%, 08/15/2019 | | | 2,102 | |
| | | | | | | | |
| | | | | | | 2,457 | |
| | | | | | | | |
| | | | Transportation — 0.4% | |
| | 2,000 | | | City of St. Louis, Lambert International Airport, Series A, Rev., AGM, 5.00%, 07/01/2021 | | | 2,193 | |
SEE NOTES TO FINANCIAL STATEMENTS.
| | | | | | |
| | | |
| 28 | | | | J.P. MORGAN MUNICIPAL BOND FUNDS | | FEBRUARY 28, 2018 |
| | | | | | | | |
PRINCIPAL
AMOUNT($) | | | SECURITY DESCRIPTION | | VALUE($) | |
| | Municipal Bonds — continued | | | | |
| | | | Transportation — continued | |
| | 1,250 | | | Kansas City, Missouri Airport Refunding, General Improvement, Series B, Rev., 5.00%, 09/01/2018 | | | 1,272 | |
| | | | Missouri Airport Refunding, Lambert St. Louis International Airport, | | | | |
| | 1,575 | | | Rev., 5.00%, 07/01/2021 | | | 1,724 | |
| | 1,000 | | | Rev., 5.00%, 07/01/2022 | | | 1,114 | |
| | 1,080 | | | Rev., 5.00%, 07/01/2023 | | | 1,219 | |
| | | | | | | | |
| | | | | | | 7,522 | |
| | | | | | | | |
| | | | Total Missouri | | | 16,390 | |
| | | | | | | | |
| | | | Montana — 0.2% | |
| | | | General Obligation — 0.2% | |
| | | | State of Montana, Long-Range Building Program, | | | | |
| | 690 | | | GO, 5.00%, 08/01/2021 | | | 764 | |
| | 1,000 | | | GO, 5.00%, 08/01/2022 | | | 1,131 | |
| | 650 | | | Yellowstone County, School District No. 2 Billings, School Building, GO, 5.00%, 06/15/2020 | | | 698 | |
| | | | | | | | |
| | | | Total Montana | | | 2,593 | |
| | | | | | | | |
| | | | Nevada — 1.3% | |
| | | | General Obligation — 1.2% | |
| | | | Washoe County School District, Limited Tax, School Improvement, | | | | |
| | 6,700 | | | Series C, GO, 4.00%, 10/01/2032 | | | 6,974 | |
| | 6,975 | | | Series C, GO, 4.00%, 10/01/2033 | | | 7,191 | |
| | 7,260 | | | Series C, GO, 4.00%, 10/01/2034 | | | 7,456 | |
| | | | | | | | |
| | | | | | | 21,621 | |
| | | | | | | | |
| | | | Other Revenue — 0.1% | |
| | 1,250 | | | County of Clark, Series A, Rev., 4.00%, 07/01/2018 | | | 1,261 | |
| | | | | | | | |
| | | | Total Nevada | | | 22,882 | |
| | | | | | | | |
| | | | New Hampshire — 0.5% | |
| | | | General Obligation — 0.2% | |
| | 2,880 | | | State of New Hampshire, Series A, GO, 5.00%, 03/01/2026 | | | 3,372 | |
| | | | | | | | |
| | | | Other Revenue — 0.3% | |
| | | | New Hampshire Municipal Bond Bank, | | | | |
| | 900 | | | Series A, Rev., 4.00%, 08/15/2018 | | | 911 | |
| | 520 | | | Series A, Rev., 5.00%, 02/15/2019 | | | 538 | |
| | 2,985 | | | Series A, Rev., 5.00%, 08/15/2019 | | | 3,136 | |
| | | | | | | | |
| | | | | | | 4,585 | |
| | | | | | | | |
| | | | Total New Hampshire | | | 7,957 | |
| | | | | | | | |
| | | | | | | | |
PRINCIPAL
AMOUNT($) | | | SECURITY DESCRIPTION | | VALUE($) | |
| | | | | | | | |
| | | | New Jersey — 2.1% | |
| | | | Education — 0.3% | |
| | | | New Jersey Economic Development Authority, School Facilities Construction, | | | | |
| | 1,040 | | | Series A, Rev., 5.25%, 12/15/2020 | | | 1,079 | |
| | 1,500 | | | Series DDD, Rev., 5.00%, 06/15/2025 | | | 1,644 | |
| | 1,840 | | | Series DDD, Rev., 5.00%, 06/15/2026 | | | 2,019 | |
| | 750 | | | New Jersey Educational Facilities Authority, Rev., 5.00%, 06/01/2018 | | | 754 | |
| | | | | | | | |
| | | | | | | 5,496 | |
| | | | | | | | |
| | | | General Obligation — 0.7% | |
| | 90 | | | County of Passaic, GO, 5.00%, 02/01/2021 | | | 98 | |
| | 10,075 | | | State of New Jersey, Series Q, GO, 5.00%, 08/15/2020 | | | 10,819 | |
| | 425 | | | Township of South Brunswick, GO, 5.00%, 09/01/2022 | | | 477 | |
| | | | | | | | |
| | | | | | | 11,394 | |
| | | | | | | | |
| | | | Other Revenue — 0.1% | |
| | 2,225 | | | New Jersey Environmental Infrastructure Trust, Series A, Rev., 5.00%, 09/01/2018 | | | 2,266 | |
| | | | | | | | |
| | | | Prerefunded — 0.1% | |
| | 1,680 | | | New Jersey Transportation Trust Fund Authority, Transportation System, Series A, Rev., 6.00%, 12/15/2018 (p) | | | 1,740 | |
| | | | | | | | |
| | | | Transportation — 0.9% | |
| | 5,500 | | | New Jersey Transportation Trust Fund Authority, Transportation Program, Series BB-1, Rev., (Dow Jones US Mid Cap Sofware Index GICS Level 4 USD + 1.00%, 12.00% Cap), 2.09%, 03/08/2018 (aa) | | | 5,520 | |
| | 10,000 | | | New Jersey Turnpike Authority, Series C-6, Rev., VRDO, 1.85%, 04/02/2018 (z) | | | 10,000 | |
| | | | | | | | |
| | | | | | | 15,520 | |
| | | | | | | | |
| | | | Total New Jersey | | | 36,416 | |
| | | | | | | | |
| | | | New Mexico — 0.2% | |
| | | | Housing — 0.1% | |
| | 2,500 | | | County of Bernalillo, Arroyo Vista Apartments Project, Rev., 1.40%, 03/01/2019 (z) | | | 2,494 | |
| | | | | | | | |
| | | | Other Revenue — 0.1% | |
| | 800 | | | New Mexico Finance Authority, Senior Lien Public Project, Series B, Rev., 5.00%, 06/01/2021 | | | 881 | |
| | | | | | | | |
| | | | Total New Mexico | | | 3,375 | |
| | | | | | | | |
SEE NOTES TO FINANCIAL STATEMENTS.
| | | | | | | | |
| | | |
| FEBRUARY 28, 2018 | | J.P. MORGAN MUNICIPAL BOND FUNDS | | | | | 29 | |
JPMorgan Short-Intermediate Municipal Bond Fund
SCHEDULE OF PORTFOLIO INVESTMENTS
AS OF FEBRUARY 28, 2018 (continued)
(Amounts in thousands)
| | | | | | | | |
PRINCIPAL
AMOUNT($) | | | SECURITY DESCRIPTION | | VALUE($) | |
| | Municipal Bonds — continued | | | | |
| | | | New York — 8.8% | |
| | | | Education — 0.3% | |
| | | | New York State Dormitory Authority, Columbia University, | | | | |
| | 585 | | | Series B, Rev., 5.00%, 10/01/2021 | | | 652 | |
| | 2,500 | | | Series B, Rev., 5.00%, 10/01/2023 | | | 2,894 | |
| | 1,100 | | | New York State Dormitory Authority, The New School, Series A, Rev., 5.00%, 07/01/2024 | | | 1,263 | |
| | | | | | | | |
| | | | | | | 4,809 | |
| | | | | | | | |
| | | | General Obligation — 1.6% | |
| | 2,410 | | | Bedford Central School District, GO, 5.00%, 11/15/2022 | | | 2,738 | |
| | 3,860 | | | City of New York, Fiscal Year 2012, Subseries G-1, GO, 5.00%, 04/01/2020 | | | 4,127 | |
| | 3,695 | | | City of New York, Fiscal Year 2013, Series B, GO, 4.00%, 08/01/2019 | | | 3,826 | |
| | 6,250 | | | City of New York, Fiscal Year 2014, Series K, GO, 5.00%, 08/01/2019 | | | 6,559 | |
| | 2,030 | | | Counties of Rockland & Orange, Ramapo Central School District, GO, 4.00%, 10/15/2019 | | | 2,113 | |
| | | | County of Orange, Public Improvement, | | | | |
| | 1,510 | | | Series B, GO, 5.00%, 03/01/2021 | | | 1,655 | |
| | 1,000 | | | Series B, GO, 5.00%, 03/01/2022 | | | 1,122 | |
| | 2,025 | | | Hampton Bays Union Free School District, GO, 5.00%, 09/15/2022 | | | 2,285 | |
| | | | Town of East Hampton, | | | | |
| | 1,000 | | | GO, 5.00%, 05/15/2021 | | | 1,103 | |
| | 1,000 | | | GO, 5.00%, 05/15/2023 | | | 1,148 | |
| | 1,550 | | | White Plains City School District, GO, 5.00%, 05/15/2024 | | | 1,816 | |
| | | | | | | | |
| | | | | | | 28,492 | |
| | | | | | | | |
| | | | Hospital — 0.2% | |
| | | | Build Resource Corp., The New York Methodist Hospital Project, | | | | |
| | 1,000 | | | Rev., 5.00%, 07/01/2018 | | | 1,012 | |
| | 550 | | | Rev., 5.00%, 07/01/2021 | | | 605 | |
| | 800 | | | Nassau County Local Economic Assistance Corp., Catholic Health Services, Long Island Obligated Group Project, Series B, Rev., 5.00%, 07/01/2023 | | | 894 | |
| | 1,015 | | | New York State Dormitory Authority, Memorial Sloan-Kettering Cancer Center, Series 2017-1, Rev., 5.00%, 07/01/2028 | | | 1,199 | |
| | | | | | | | |
| | | | | | | 3,710 | |
| | | | | | | | |
| | | | | | | | |
PRINCIPAL
AMOUNT($) | | | SECURITY DESCRIPTION | | VALUE($) | |
| | | | | | | | |
| | | | Industrial Development Revenue/Pollution Control Revenue — 0.2% | |
| | 3,000 | | | New York State Energy Research & Development Authority, Pollution Control, Electric & Gas Corp., Project, Series C, Rev., 2.00%, 05/01/2020 (z) | | | 2,999 | |
| | | | | | | | |
| | | | Other Revenue — 3.5% | |
| | | | Battery Park City Authority, | | | | |
| | 3,450 | | | Series A, Rev., 3.00%, 11/01/2018 | | | 3,489 | |
| | 2,500 | | | Series A, Rev., 4.00%, 11/01/2019 | | | 2,605 | |
| | 500 | | | Brooklyn Arena Local Development Corp., Pilot Refunding, Barclays Center, Series A, Rev., 5.00%, 07/15/2020 | | | 535 | |
| | 500 | | | City of Troy Capital Resources Corp., Rensselaer Polytechnic Institute Project, Rev., 5.00%, 08/01/2020 | | | 536 | |
| | 2,750 | | | New York City Transitional Finance Authority, Future Tax Secured, Fiscal Year 2003, Series B, Rev., 5.00%, 02/01/2020 | | | 2,929 | |
| | 3,700 | | | New York City Transitional Finance Authority, Future Tax Secured, Fiscal Year 2014, Series A, Subseries A-1, Rev., 5.00%, 11/01/2020 | | | 4,019 | |
| | 5,000 | | | New York Convention Center Development Corp. Hotel Unit Fee Secured, Rev., 5.00%, 11/15/2026 | | | 5,829 | |
| | 1,500 | | | New York Local Government Assistance Corp., Subordinated Lien, Series A-5/6, Rev., 5.50%, 04/01/2019 | | | 1,567 | |
| | | | New York State Dormitory Authority, Memorial Sloan-Kettering Cancer Center, | | | | |
| | 1,000 | | | Series 2017-1, Rev., 5.00%, 07/01/2026 | | | 1,177 | |
| | 4,705 | | | Series 2017-1, Rev., 5.00%, 07/01/2027 | | | 5,663 | |
| | 2,000 | | | New York State Dormitory Authority, State Sales Tax, Series A, Rev., 5.00%, 03/15/2021 | | | 2,194 | |
| | | | Sales Tax Asset Receivable Corp., Fiscal Year 2015, | | | | |
| | 15,405 | | | Series A, Rev., 5.00%, 10/15/2020 | | | 16,748 | |
| | 4,800 | | | Series A, Rev., 5.00%, 10/15/2022 | | | 5,466 | |
| | 4,500 | | | Series A, Rev., 5.00%, 10/15/2025 | | | 5,274 | |
| | | | Schenectady County Capital Resource Corp., Union College Project, | | | | |
| | 960 | | | Rev., 5.00%, 01/01/2024 | | | 1,099 | |
| | 400 | | | Rev., 5.00%, 01/01/2025 | | | 462 | |
| | | | | | | | |
| | | | | | | 59,592 | |
| | | | | | | | |
| | | | Prerefunded — 0.3% | |
| | 4,305 | | | Brooklyn Arena Local Development Corp., Pilot Refunding, Barclays Center, Rev., 6.38%, 01/15/2020 (p) | | | 4,685 | |
| | | | | | | | |
SEE NOTES TO FINANCIAL STATEMENTS.
| | | | | | |
| | | |
| 30 | | | | J.P. MORGAN MUNICIPAL BOND FUNDS | | FEBRUARY 28, 2018 |
| | | | | | | | |
PRINCIPAL
AMOUNT($) | | | SECURITY DESCRIPTION | | VALUE($) | |
| | Municipal Bonds — continued | | | | |
| | | | Special Tax — 0.1% | |
| | 1,110 | | | New York State Dormitory Authority, Personal Income Tax, Series G, Rev., 5.00%, 08/15/2021 | | | 1,228 | |
| | | | | | | | |
| | | | Transportation — 1.8% | |
| | | | Buffalo & Fort Erie Public Bridge Authority, Toll Bridge System, | | | | |
| | 465 | | | Rev., 5.00%, 01/01/2020 | | | 493 | |
| | 815 | | | Rev., 5.00%, 01/01/2021 | | | 887 | |
| | | | Metropolitan Transportation Authority, | | | | |
| | 2,770 | | | Series D, Rev., 5.00%, 11/15/2018 | | | 2,840 | |
| | 1,435 | | | Subseries A-1, Rev., 5.00%, 11/15/2020 | | | 1,558 | |
| | 2,000 | | | Subseries C-1, Rev., 5.00%, 11/15/2019 | | | 2,116 | |
| | 3,000 | | | Subseries C-1, Rev., 5.00%, 11/15/2024 | | | 3,489 | |
| | 4,000 | | | Metropolitan Transportation Authority, Green Bonds, Series B-2, Rev., 4.00%, 11/15/2032 | | | 4,253 | |
| | 15,000 | | | Triborough Bridge & Tunnel Authority, Subseries B-C, Rev., (ICE LIBOR USD 1 Month + 0.40%, 9.00% Cap), 1.46%, 04/02/2018 (aa) | | | 15,082 | |
| | | | | | | | |
| | | | | | | 30,718 | |
| | | | | | | | |
| | | | Utility — 0.5% | |
| | | | Long Island Power Authority, Electric System, | | | | |
| | 500 | | | Series 2017, Rev., 5.00%, 09/01/2025 | | | 584 | |
| | 1,000 | | | Series 2017, Rev., 5.00%, 09/01/2026 | | | 1,176 | |
| | 500 | | | Series 2017, Rev., 5.00%, 09/01/2027 | | | 592 | |
| | 750 | | | Series 2017, Rev., 5.00%, 09/01/2028 | | | 884 | |
| | 750 | | | Series 2017, Rev., 5.00%, 09/01/2030 | | | 875 | |
| | 5,000 | | | Series C, Rev., (ICE LIBOR USD 1 Month + 0.65%, 10.00% Cap), 1.75%, 04/02/2018 (aa) | | | 5,024 | |
| | | | | | | | |
| | | | | | | 9,135 | |
| | | | | | | | |
| | | | Water & Sewer — 0.3% | |
| | 5,000 | | | New York City Municipal Water Finance Authority, Water & Sewer System, Second General Resolution, Series EE, Rev., 5.00%, 06/15/2019 | | | 5,227 | |
| | | | | | | | |
| | | | Total New York | | | 150,595 | |
| | | | | | | | |
| | | | North Carolina — 1.0% | |
| | | | Education — 0.4% | |
| | 5,750 | | | University of North Carolina, Chapel Hill, Series B, Rev., (ICE LIBOR USD 1 Month + 0.40%, 12.00% Cap), 1.46%, 04/02/2018 (aa) | | | 5,755 | |
| | | | | | | | |
PRINCIPAL
AMOUNT($) | | | SECURITY DESCRIPTION | | VALUE($) | |
| | | | | | | | |
| | | | Education — continued | |
| | 445 | | | Winston-Salem State University Foundation LLC, Rev., AGM, 5.00%, 10/01/2023 | | | 513 | |
| | | | | | | | |
| | | | | | | 6,268 | |
| | | | | | | | |
| | | | General Obligation — 0.6% | |
| | 9,670 | | | State of North Carolina, Series D, GO, 4.00%, 06/01/2020 | | | 10,180 | |
| | | | | | | | |
| | | | Other Revenue — 0.0% (g) | |
| | 550 | | | Jacksonville Public Facilities Corp., Series 2017, Rev., 5.00%, 04/01/2027 | | | 654 | |
| | | | | | | | |
| | | | Total North Carolina | | | 17,102 | |
| | | | | | | | |
| | | | Ohio — 2.1% | |
| | | | Education — 0.2% | |
| | 535 | | | Ohio Higher Educational Facility Commission, Case Western Reserve University Project, Series A, Rev., 4.00%, 12/01/2019 | | | 557 | |
| | | | Ohio State Higher Educational Facility Commission, Oberlin College, | | | | |
| | 600 | | | Rev., 4.00%, 10/01/2018 | | | 609 | |
| | 675 | | | Rev., 4.00%, 10/01/2019 | | | 701 | |
| | 1,000 | | | Rev., 5.00%, 10/01/2020 | | | 1,084 | |
| | | | | | | | |
| | | | | | | 2,951 | |
| | | | | | | | |
| | | | General Obligation — 0.3% | |
| | 200 | | | City of Dublin, Various Purpose, GO, 4.00%, 12/01/2028 | | | 220 | |
| | | | Cuyahoga Ohio Community College District, Facilities Construction & Improvement Bonds, | | | | |
| | 1,250 | | | Series 2018, GO, 4.00%, 12/01/2032 | | | 1,321 | |
| | 1,300 | | | Series 2018, GO, 4.00%, 12/01/2033 | | | 1,363 | |
| | 2,795 | | | State of Ohio, Infrastructure Improvement, Series A, GO, VRDO, 1.20%, 03/08/2018 (z) | | | 2,795 | |
| | | | | | | | |
| | | | | | | 5,699 | |
| | | | | | | | |
| | | | Hospital — 1.0% | |
| | 375 | | | Akron, Bath & Copley Joint Township Hospital District, Summa Health Obligated Group, Rev., 5.00%, 11/15/2021 | | | 404 | |
| | 10,800 | | | County of Allen, Mercy Health, Series B, Rev., (Dow Jones US Mid Cap Sofware Index GICS Level 4 USD + 0.75%, 12.00% Cap), 1.84%, 03/08/2018 (aa) | | | 10,843 | |
| | | | County of Lake, Hospital Facilities, Lake Hospital System, Inc., | | | | |
| | 1,445 | | | Rev., 5.00%, 08/15/2023 | | | 1,622 | |
| | 1,655 | | | Rev., 5.00%, 08/15/2024 | | | 1,876 | |
SEE NOTES TO FINANCIAL STATEMENTS.
| | | | | | | | |
| | | |
| FEBRUARY 28, 2018 | | J.P. MORGAN MUNICIPAL BOND FUNDS | | | | | 31 | |
JPMorgan Short-Intermediate Municipal Bond Fund
SCHEDULE OF PORTFOLIO INVESTMENTS
AS OF FEBRUARY 28, 2018 (continued)
(Amounts in thousands)
| | | | | | | | |
PRINCIPAL
AMOUNT($) | | | SECURITY DESCRIPTION | | VALUE($) | |
| | Municipal Bonds — continued | | | | |
| | | | Hospital — continued | |
| | 2,500 | | | State of Ohio, University Hospitals Health System, Inc., Series B, Rev., VRDO, 1.34%, 03/01/2018 (z) | | | 2,500 | |
| | | | | | | | |
| | | | | | | 17,245 | |
| | | | | | | | |
| | | | Other Revenue — 0.1% | |
| | 1,165 | | | County of Cuyahoga, Rev., 5.00%, 12/01/2022 | | | 1,322 | |
| | 1,000 | | | State of Ohio, Capital Facilities Lease-Appropriation, Series A, Rev., 5.00%, 10/01/2018 | | | 1,021 | |
| | | | | | | | |
| | | | | | | 2,343 | |
| | | | | | | | |
| | | | Water & Sewer — 0.5% | |
| | | | Hamilton County, Sewer System, Metropolitan Sewer District of Greater Cincinnati, | | | | |
| | 500 | | | Series A, Rev., 5.00%, 12/01/2018 | | | 513 | |
| | 640 | | | Series A, Rev., 5.00%, 12/01/2019 | | | 678 | |
| | 1,375 | | | Series A, Rev., 5.00%, 12/01/2021 | | | 1,530 | |
| | 5,000 | | | Ohio Water Development Authority, Fresh Water, Series B, Rev., 5.00%, 12/01/2027 | | | 5,947 | |
| | | | | | | | |
| | | | | | | 8,668 | |
| | | | | | | | |
| | | | Total Ohio | | | 36,906 | |
| | | | | | | | |
| | | | Oklahoma — 0.6% | |
| | | | Education — 0.4% | |
| | 555 | | | Blaine County Educational Facilities Authority, Educational Facilities, Watonga Public Schools Project, Rev., 5.00%, 12/01/2018 | | | 568 | |
| | 1,220 | | | Comanche County Educational Facilities Authority, Elgin Public Schools Project, Series A, Rev., 5.00%, 12/01/2027 | | | 1,412 | |
| | | | Oklahoma County Finance Authority, Educational Facilities, Lease Midwest City-Del City Public Schools Project, | | | | |
| | 500 | | | Series 2018, Rev., 5.00%, 10/01/2022 | | | 557 | |
| | 355 | | | Series 2018, Rev., 5.00%, 10/01/2023 | | | 401 | |
| | 1,000 | | | Series 2018, Rev., 5.00%, 10/01/2025 | | | 1,149 | |
| | | | Oklahoma County Finance Authority, Educational Facilities, Lease Western Heights Public School Project, | | | | |
| | 250 | | | Rev., 4.00%, 09/01/2018 | | | 253 | |
| | 325 | | | Rev., 5.00%, 09/01/2019 | | | 341 | |
| | 2,000 | | | Tulsa County Industrial Authority Educational Facilities Lease, Jenks Public Schools Project, Rev., 5.00%, 09/01/2021 | | | 2,205 | |
| | | | | | | | |
| | | | | | | 6,886 | |
| | | | | | | | |
| | | | | | | | |
PRINCIPAL
AMOUNT($) | | | SECURITY DESCRIPTION | | VALUE($) | |
| | | | | | | | |
| | | | Other Revenue — 0.0% (g) | |
| | 500 | | | Cleveland County Justice Authority, Sales Tax, Detention Facility Project, Rev., 4.00%, 03/01/2020 | | | 511 | |
| | | | | | | | |
| | | | Utility — 0.2% | |
| | 1,525 | | | Oklahoma Municipal Power Authority, SIFMA Index, Series A, Rev., (Dow Jones US Mid Cap Sofware Index GICS Level 4 USD + 0.80%, 14.00% Cap), 1.89%, 03/08/2018 (aa) | | | 1,527 | |
| | 1,185 | | | The Edmond Public Works Authority, Sales Tax and Utility System, Rev., 4.00%, 07/01/2028 | | | 1,301 | |
| | | | | | | | |
| | | | | | | 2,828 | |
| | | | | | | | |
| | | | Total Oklahoma | | | 10,225 | |
| | | | | | | | |
| | | | Oregon — 0.9% | |
| | | | Education — 0.0% (g) | |
| | | | Oregon State Facilities Authority, Reed College Project, | | | | |
| | 350 | | | Series A, Rev., 4.00%, 07/01/2032 | | | 375 | |
| | 125 | | | Series A, Rev., 5.00%, 07/01/2028 | | | 150 | |
| | | | | | | | |
| | | | | | | 525 | |
| | | | | | | | |
| | | | General Obligation — 0.3% | |
| | 4,205 | | | Clackamas County School District No. 12, Series B, GO, 5.00%, 06/15/2030 | | | 4,972 | |
| | | | | | | | |
| | | | Prerefunded — 0.4% | |
| | 6,210 | | | Oregon State Department of Administrative Services, Lottery, Series A, Rev., 5.25%, 04/01/2019 (p) | | | 6,464 | |
| | | | | | | | |
| | | | Transportation — 0.2% | |
| | | | Port of Portland, International Airport, | | | | |
| | 1,000 | | | Series 23, Rev., 5.00%, 07/01/2023 | | | 1,143 | |
| | 1,595 | | | Series 23, Rev., 5.00%, 07/01/2024 | | | 1,850 | |
| | | | | | | | |
| | | | | | | 2,993 | |
| | | | | | | | |
| | | | Water & Sewer — 0.0% (g) | |
| | 40 | | | City of Portland, Sewer System, First Lien, Series A, Rev., 5.00%, 10/01/2023 | | | 46 | |
| | | | | | | | |
| | | | Total Oregon | | | 15,000 | |
| | | | | | | | |
| | | | Pennsylvania — 5.2% | |
| | | | Education — 1.1% | |
| | 5,055 | | | Pennsylvania State Higher Educational Facilities Authority, Trustees of the University, Series B, Rev., 5.00%, 10/01/2022 | | | 5,726 | |
| | | | State Public School Building Authority, Community College of Philadelphia Project, | | | | |
| | 2,760 | | | Rev., 5.00%, 06/15/2021 | | | 3,013 | |
| | 2,625 | | | Rev., 5.00%, 06/15/2024 | | | 2,994 | |
SEE NOTES TO FINANCIAL STATEMENTS.
| | | | | | |
| | | |
| 32 | | | | J.P. MORGAN MUNICIPAL BOND FUNDS | | FEBRUARY 28, 2018 |
| | | | | | | | |
PRINCIPAL
AMOUNT($) | | | SECURITY DESCRIPTION | | VALUE($) | |
| | Municipal Bonds — continued | | | | |
| | | | Education — continued | |
| | 2,860 | | | State Public School Building Authority, Montgomery County Community College, Rev., 5.00%, 05/01/2019 | | | 2,975 | |
| | | | University of Pennsylvania, Higher Educational Facilities Authority, Health System, | | | | |
| | 1,000 | | | Series A, Rev., 5.00%, 08/15/2027 | | | 1,185 | |
| | 1,000 | | | Series A, Rev., 5.00%, 08/15/2028 | | | 1,179 | |
| | 1,600 | | | Series A, Rev., 5.00%, 08/15/2029 | | | 1,876 | |
| | | | | | | | |
| | | | | | | 18,948 | |
| | | | | | | | |
| | | | General Obligation — 1.0% | |
| | 2,000 | | | City of Philadelphia, Series A, GO, 5.00%, 08/01/2019 | | | 2,093 | |
| | 15,000 | | | Commonwealth of Pennsylvania, Series 2011, GO, 4.00%, 11/15/2028 | | | 15,656 | |
| | 350 | | | Schuylkill Valley School District, GO, 5.00%, 04/01/2022 | | | 390 | |
| | | | | | | | |
| | | | | | | 18,139 | |
| | | | | | | | |
| | | | Hospital — 0.5% | |
| | | | Berks County Industrial Development Authority, Tower Health Project, | | | | |
| | 2,500 | | | Rev., 4.00%, 11/01/2031 | | | 2,573 | |
| | 1,000 | | | Rev., 5.00%, 11/01/2023 | | | 1,128 | |
| | 1,000 | | | Rev., 5.00%, 11/01/2024 | | | 1,138 | |
| | 500 | | | Rev., 5.00%, 11/01/2029 | | | 571 | |
| | 750 | | | Rev., 5.00%, 11/01/2030 | | | 853 | |
| | 1,400 | | | Southcentral General Authority, Hanover Hospital, Inc., Rev., 5.00%, 12/01/2026 | | | 1,547 | |
| | 380 | | | Southcentral General Authority, Wellspan Health Obligation Group, Series A, Rev., 5.00%, 06/01/2024 | | | 437 | |
| | | | | | | | |
| | | | | | | 8,247 | |
| | | | | | | | |
| | | | Industrial Development Revenue/Pollution Control Revenue — 0.4% | |
| | | | Lehigh County Industrial Development Authority, Pollution Control, | | | | |
| | 4,000 | | | Rev., 1.80%, 08/15/2022 (z) | | | 3,913 | |
| | 2,500 | | | Rev., 1.80%, 09/01/2022 (z) | | | 2,444 | |
| | | | | | | | |
| | | | | | | 6,357 | |
| | | | | | | | |
| | | | Other Revenue — 0.3% | |
| | | | Commonwealth Financing Authority, Tobacco Master Settlement Payment, | | | | |
| | 555 | | | Series 2018, Rev., 5.00%, 06/01/2022 | | | 610 | |
| | 1,785 | | | Series 2018, Rev., 5.00%, 06/01/2023 | | | 1,984 | |
| | 1,500 | | | Series 2018, Rev., 5.00%, 06/01/2029 | | | 1,697 | |
| | | | | | | | |
PRINCIPAL
AMOUNT($) | | | SECURITY DESCRIPTION | | VALUE($) | |
| | | | | | | | |
| | | | Other Revenue — continued | |
| | 1,000 | | | Cumberland County Municipal Authority, AICUP Financing Program-Messiah College Project, Rev., 2.00%, 04/30/2020 (z) | | | 999 | |
| | | | | | | | |
| | | | | | | 5,290 | |
| | | | | | | | |
| | | | Transportation — 0.4% | |
| | | | Pennsylvania Turnpike Commission, | | | | |
| | 5,000 | | | Series A, Rev., (Dow Jones US Mid Cap Sofware Index GICS Level 4 USD + 0.68%, 12.00% Cap), 1.77%, 03/08/2018 (aa) | | | 5,009 | |
| | 2,500 | | | Subseries A-2, Rev., (Dow Jones US Mid Cap Sofware Index GICS Level 4 USD + 0.80%, 10.00% Cap), 1.89%, 03/08/2018 (aa) | | | 2,507 | |
| | | | | | | | |
| | | | | | | 7,516 | |
| | | | | | | | |
| | | | Water & Sewer — 1.5% | |
| | | | Allegheny County Sanitary Authority, Sewer, | | | | |
| | 3,500 | | | Rev., 5.00%, 12/01/2021 | | | 3,873 | |
| | 3,000 | | | Rev., 5.00%, 12/01/2022 | | | 3,375 | |
| | 4,000 | | | Rev., 5.00%, 12/01/2023 | | | 4,564 | |
| | | | City of Philadelphia, Water & Wastewater, | | | | |
| | 8,530 | | | Series A, Rev., 5.00%, 01/01/2020 | | | 9,043 | |
| | 1,510 | | | Series A, Rev., 5.00%, 07/01/2022 | | | 1,692 | |
| | 2,595 | | | Series A, Rev., 5.00%, 07/01/2024 | | | 2,994 | |
| | | | | | | | |
| | | | | | | 25,541 | |
| | | | | | | | |
| | | | Total Pennsylvania | | | 90,038 | |
| | | | | | | | |
| | | | Rhode Island — 0.2% | |
| | | | General Obligation — 0.2% | |
| | 1,475 | | | State of Rhode Island & Providence Plantations, Consolidated Capital Development Loan, Series A, GO, 5.00%, 10/15/2019 (p) | | | 1,557 | |
| | 1,000 | | | State of Rhode Island & Providence Plantations, Consolidated Capital Development Loan of 2014, Series A, GO, 5.00%, 11/01/2019 | | | 1,054 | |
| | | | | | | | |
| | | | Total Rhode Island | | | 2,611 | |
| | | | | | | | |
| | | | South Carolina — 1.2% | |
| | | | General Obligation — 1.1% | |
| | 14,605 | | | County of Charleston, Series C, GO, TRAN, 4.00%, 11/01/2028 | | | 16,354 | |
| | | | State of South Carolina, | | | | |
| | 1,310 | | | Series B, GO, 5.00%, 04/01/2018 | | | 1,314 | |
| | 1,110 | | | Series D, GO, 5.00%, 04/01/2018 | | | 1,113 | |
| | | | | | | | |
| | | | | | | 18,781 | |
| | | | | | | | |
| | | | Other Revenue — 0.1% | |
| | | | County of Charleston, | | | | |
| | 645 | | | Rev., 5.00%, 12/01/2018 | | | 662 | |
SEE NOTES TO FINANCIAL STATEMENTS.
| | | | | | | | |
| | | |
| FEBRUARY 28, 2018 | | J.P. MORGAN MUNICIPAL BOND FUNDS | | | | | 33 | |
JPMorgan Short-Intermediate Municipal Bond Fund
SCHEDULE OF PORTFOLIO INVESTMENTS
AS OF FEBRUARY 28, 2018 (continued)
(Amounts in thousands)
| | | | | | | | |
PRINCIPAL
AMOUNT($) | | | SECURITY DESCRIPTION | | VALUE($) | |
| | Municipal Bonds — continued | | | | |
| | | | Other Revenue — continued | |
| | 1,000 | | | Rev., 5.00%, 12/01/2019 | | | 1,056 | |
| | | | | | | | |
| | | | | | | 1,718 | |
| | | | | | | | |
| | | | Total South Carolina | | | 20,499 | |
| | | | | | | | |
| | | | South Dakota — 0.2% | |
| | | | Education — 0.1% | |
| | | | South Dakota Health & Educational Facilities Authority, | | | | |
| | 625 | | | Series B, Rev., 4.00%, 11/01/2020 | | | 659 | |
| | 500 | | | Series B, Rev., 4.00%, 11/01/2021 | | | 534 | |
| | 375 | | | Series B, Rev., 5.00%, 11/01/2022 | | | 420 | |
| | | | | | | | |
| | | | | | | 1,613 | |
| | | | | | | | |
| | | | Other Revenue — 0.1% | |
| | | | South Dakota State Building Authority, | | | | |
| | 500 | | | Series B, Rev., 5.00%, 06/01/2019 | | | 521 | |
| | 485 | | | Series B, Rev., 5.00%, 06/01/2021 | | | 532 | |
| | | | | | | | |
| | | | | | | 1,053 | |
| | | | | | | | |
| | | | Total South Dakota | | | 2,666 | |
| | | | | | | | |
| | | | Tennessee — 0.8% | |
| | | | Other Revenue — 0.0% (g) | |
| | 5 | | | Metropolitan Government of Nashville & Davidson, County Sports Authority, Public Improvement, Rev., 5.00%, 07/01/2020 | | | 6 | |
| | | | | | | | |
| | | | Utility — 0.8% | |
| | 800 | | | City of Chattanooga, Electric System, Series A, Rev., 5.00%, 09/01/2022 | | | 906 | |
| | | | Tennessee Energy Acquisition Corp., Gas Project, | | | | |
| | 1,460 | | | Series A, Rev., 4.00%, 05/01/2022 | | | 1,552 | |
| | 1,400 | | | Series A, Rev., 4.00%, 05/01/2023 | | | 1,491 | |
| | 10,000 | | | Series A, Rev., 4.00%, 05/01/2023 (z) | | | 10,654 | |
| | | | | | | | |
| | | | | | | 14,603 | |
| | | | | | | | |
| | | | Total Tennessee | | | 14,609 | |
| | | | | | | | |
| | | | Texas — 9.9% | |
| | | | Education — 1.9% | |
| | 1,000 | | | Arlington Higher Education Finance Corp., Uplift Education, Series A, Rev., PSF-GTD, 4.00%, 12/01/2029 | | | 1,073 | |
| | 790 | | | Austin Community College District, Combined Fee, Series A, Rev., 5.00%, 02/01/2021 | | | 861 | |
| | 7,500 | | | County of Harris, Cultural Education Facilities Finance Corp., Children’s Hospital, Series 3, Rev., (ICE LIBOR USD 1 Month + 0.85%, 12.00% Cap), 1.94%, 03/08/2018 (aa) | | | 7,584 | |
| | | | | | | | |
PRINCIPAL
AMOUNT($) | | | SECURITY DESCRIPTION | | VALUE($) | |
| | | | | | | | |
| | | | Education — continued | |
| | | | Southwest Higher Education Authority, Inc., Southern Methodist University Project, | | | | |
| | 425 | | | Series 2017, Rev., 5.00%, 10/01/2021 | | | 470 | |
| | 400 | | | Series 2017, Rev., 5.00%, 10/01/2022 | | | 450 | |
| | 400 | | | Series 2017, Rev., 5.00%, 10/01/2023 | | | 456 | |
| | 400 | | | Series 2017, Rev., 5.00%, 10/01/2024 | | | 462 | |
| | 600 | | | Series 2017, Rev., 5.00%, 10/01/2025 | | | 700 | |
| | 525 | | | Series 2017, Rev., 5.00%, 10/01/2026 | | | 618 | |
| | 790 | | | Stephen F. Austin State University, Board of Regents, Revenue Financing System, Rev., 4.00%, 10/15/2018 | | | 802 | |
| | | | Texas State University, Financing System, | | | | |
| | 5,100 | | | Series A, Rev., 5.00%, 03/15/2030 | | | 5,962 | |
| | 4,365 | | | Series A, Rev., 5.00%, 03/15/2032 | | | 5,059 | |
| | 6,735 | | | University of Texas, Financing System, Series I, Rev., 5.00%, 08/15/2023 | | | 7,715 | |
| | | | | | | | |
| | | | | | | 32,212 | |
| | | | | | | | |
| | | | General Obligation — 3.9% | |
| | 1,630 | | | Austin Independent School District, Series B, GO, 5.00%, 08/01/2022 | | | 1,837 | |
| | 475 | | | City of Abilene, Taylor & Jones Counties, GO, 5.00%, 02/15/2021 | | | 518 | |
| | 610 | | | City of Colony, GO, 5.00%, 08/15/2020 | | | 657 | |
| | 1,045 | | | City of Denton, GO, 5.00%, 02/15/2023 | | | 1,184 | |
| | | | City of El Paso, Refunding & Improvement, | | | | |
| | 530 | | | GO, 5.00%, 08/15/2021 | | | 584 | |
| | 4,035 | | | GO, 5.00%, 08/15/2025 | | | 4,711 | |
| | | | City of Fort Worth, Certificates of Obligation, | | | | |
| | 500 | | | Series A, GO, 4.00%, 03/01/2018 | | | 500 | |
| | 785 | | | Series A, GO, 4.00%, 03/01/2019 | | | 805 | |
| | | | City of Fort Worth, Refunding & Improvement, General Purpose, | | | | |
| | 1,000 | | | GO, 4.00%, 03/01/2018 | | | 1,000 | |
| | 1,060 | | | GO, 4.00%, 03/01/2019 | | | 1,087 | |
| | | | City of Houston, Public Improvement, | | | | |
| | 3,000 | | | Series A, GO, 5.00%, 03/01/2021 | | | 3,272 | |
| | 8,000 | | | Series A, GO, 5.00%, 03/01/2024 | | | 9,176 | |
| | 1,195 | | | Series A, GO, 5.00%, 03/01/2025 | | | 1,385 | |
| | 4,000 | | | Series A, GO, 5.00%, 03/01/2026 | | | 4,671 | |
| | | | City of Odessa, | | | | |
| | 1,150 | | | Series 2017, GO, 4.00%, 03/01/2025 | | | 1,252 | |
| | 1,430 | | | Series 2017, GO, 4.00%, 03/01/2029 | | | 1,542 | |
| | 1,535 | | | Series 2017, GO, 4.00%, 03/01/2032 | | | 1,609 | |
| | 1,400 | | | Series 2017, GO, 5.00%, 03/01/2026 | | | 1,623 | |
SEE NOTES TO FINANCIAL STATEMENTS.
| | | | | | |
| | | |
| 34 | | | | J.P. MORGAN MUNICIPAL BOND FUNDS | | FEBRUARY 28, 2018 |
| | | | | | | | |
PRINCIPAL
AMOUNT($) | | | SECURITY DESCRIPTION | | VALUE($) | |
| | Municipal Bonds — continued | | | | |
| | | | General Obligation — continued | |
| | | | City of Victoria, | | | | |
| | 1,975 | | | Series 2017, GO, 4.00%, 08/15/2029 | | | 2,140 | |
| | 1,000 | | | Series 2017, GO, 5.00%, 08/15/2024 | | | 1,153 | |
| | 1,400 | | | Series 2017, GO, 5.00%, 08/15/2026 | | | 1,644 | |
| | 1,260 | | | Galveston County, Limited Tax Flood Control, Series 2017, GO, 4.00%, 02/01/2029 | | | 1,376 | |
| | | | Galveston County, Unlimited Tax Road, | | | | |
| | 980 | | | Series 2017, GO, 4.00%, 02/01/2024 | | | 1,074 | |
| | 800 | | | Series 2017, GO, 4.00%, 02/01/2025 | | | 881 | |
| | 1,435 | | | Series 2017, GO, 4.00%, 02/01/2028 | | | 1,579 | |
| | 595 | | | Judson Independent School District, Series A, GO, 5.00%, 02/01/2019 | | | 615 | |
| | 800 | | | Odessa Junior College District, Limited Tax, Series 2017, GO, 5.00%, 08/15/2025 | | | 929 | |
| | 250 | | | Southside Independent School District, School Building, GO, PSF-GTD, 5.00%, 08/15/2022 | | | 282 | |
| | 17,500 | | | State of Texas, Transportation Commission Mobility, Series B, GO, (Dow Jones US Mid Cap Sofware Index GICS Level 4 USD + 0.38%, 9.00% Cap), 1.47%, 03/08/2018 (aa) | | | 17,503 | |
| | | | | | | | |
| | | | | | | 66,589 | |
| | | | | | | | |
| | | | Hospital — 0.2% | |
| | | | Irving Hospital Authority, Baylor Scott and White Medical Center, | | | | |
| | 1,750 | | | Rev., VRDO, 2.19%, 03/08/2018 (z) | | | 1,750 | |
| | 250 | | | Rev., 5.00%, 10/15/2022 | | | 276 | |
| | 250 | | | Rev., 5.00%, 10/15/2028 | | | 279 | |
| | 500 | | | Rev., 5.00%, 10/15/2029 | | | 556 | |
| | 1,000 | | | Rev., 5.00%, 10/15/2031 | | | 1,100 | |
| | | | | | | | |
| | | | | | | 3,961 | |
| | | | | | | | |
| | | | Other Revenue — 0.4% | |
| | | | Austin Convention Enterprises, Inc., Convention Center Hotel First Tier, | | | | |
| | 500 | | | Series A, Rev., 5.00%, 01/01/2021 | | | 537 | |
| | 750 | | | Series A, Rev., 5.00%, 01/01/2022 | | | 821 | |
| | 800 | | | Austin Convention Enterprises, Inc., Convention Center Hotel Second Tier, Series B, Rev., 5.00%, 01/01/2021 | | | 850 | |
| | 4,700 | | | Lower Colorado River Authority, Series B, Rev., 5.00%, 05/15/2023 | | | 5,253 | |
| | | | | | | | |
| | | | | | | 7,461 | |
| | | | | | | | |
| | | | Prerefunded — 0.4% | |
| | 5,605 | | | Harris County Health Facilities Development Corp., Memorial Hermann Healthcare System, Series B, Rev., 7.25%, 12/01/2018 (p) | | | 5,847 | |
| | | | | | | | |
PRINCIPAL
AMOUNT($) | | | SECURITY DESCRIPTION | | VALUE($) | |
| | | | | | | | |
| | | | Prerefunded — continued | |
| | 60 | | | Lower Colorado River Authority, Series B, Rev., 5.00%, 05/15/2022 (p) | | | 67 | |
| | | | | | | | |
| | | | | | | 5,914 | |
| | | | | | | | |
| | | | Transportation — 1.5% | |
| | | | City of Austin, Airport System, | | | | |
| | 1,095 | | | Series B, Rev., AMT, 5.00%, 11/15/2026 | | | 1,269 | |
| | 585 | | | Series B, Rev., AMT, 5.00%, 11/15/2027 | | | 674 | |
| | 630 | | | Series B, Rev., AMT, 5.00%, 11/15/2028 | | | 722 | |
| | | | Harris County Toll Road Authority, Senior Lien, | | | | |
| | 8,000 | | | Series A, Rev., 5.00%, 08/15/2031 | | | 9,445 | |
| | 4,770 | | | Series A, Rev., 5.00%, 08/15/2032 | | | 5,611 | |
| | | | North Texas Tollway Authority System, First Tier, | | | | |
| | 2,500 | | | Series A, Rev., 4.00%, 01/01/2033 | | | 2,598 | |
| | 6,000 | | | Series C, Rev., (Dow Jones US Mid Cap Sofware Index GICS Level 4 USD + 0.67%, 9.00% Cap), 1.76%, 03/08/2018 (aa) | | | 5,919 | |
| | | | | | | | |
| | | | | | | 26,238 | |
| | | | | | | | |
| | | | Utility — 1.1% | |
| | 560 | | | City of Cedar Park, Utility System, Rev., 5.00%, 08/15/2022 | | | 631 | |
| | 5,000 | | | City of Houston, Utility System Revenue Refunding, Series C, Rev., 5.00%, 05/15/2020 | | | 5,357 | |
| | 2,000 | | | City of San Antonio, Electric & Gas Systems, Rev., 5.00%, 02/01/2026 | | | 2,360 | |
| | 6,480 | | | City of San Antonio, Electric & Gas Systems, Junior Lien, Series B, Rev., 2.00%, 12/01/2021 (z) | | | 6,413 | |
| | | | City of Victoria, Utility System, | | | | |
| | 160 | | | Rev., 2.00%, 12/01/2018 | | | 161 | |
| | 150 | | | Rev., 2.50%, 12/01/2019 | | | 152 | |
| | | | West Travis County Public Utility Agency, | | | | |
| | 545 | | | Series 2017, Rev., 5.00%, 08/15/2022 | | | 609 | |
| | 325 | | | Series 2017, Rev., 5.00%, 08/15/2023 | | | 369 | |
| | 350 | | | Series 2017, Rev., 5.00%, 08/15/2027 | | | 413 | |
| | 1,415 | | | Series 2017, Rev., 5.00%, 08/15/2029 | | | 1,653 | |
| | 1,000 | | | Series 2017, Rev., 5.00%, 08/15/2031 | | | 1,159 | |
| | | | | | | | |
| | | | | | | 19,277 | |
| | | | | | | | |
| | | | Water & Sewer — 0.5% | |
| | 3,520 | | | City of Dallas, Waterworks & Sewer System, Series A, Rev., 5.00%, 10/01/2019 | | | 3,712 | |
| | | | City of Galveston, Waterworks & Sewer System, | | | | |
| | 180 | | | Rev., 4.00%, 05/01/2018 | | | 181 | |
| | 205 | | | Rev., 5.00%, 05/01/2019 | | | 213 | |
SEE NOTES TO FINANCIAL STATEMENTS.
| | | | | | | | |
| | | |
| FEBRUARY 28, 2018 | | J.P. MORGAN MUNICIPAL BOND FUNDS | | | | | 35 | |
JPMorgan Short-Intermediate Municipal Bond Fund
SCHEDULE OF PORTFOLIO INVESTMENTS
AS OF FEBRUARY 28, 2018 (continued)
(Amounts in thousands)
| | | | | | | | |
PRINCIPAL
AMOUNT($) | | | SECURITY DESCRIPTION | | VALUE($) | |
| | Municipal Bonds — continued | | | | |
| | | | Water & Sewer — continued | |
| | 245 | | | Rev., 5.00%, 05/01/2020 | | | 262 | |
| | 265 | | | Rev., 5.00%, 05/01/2021 | | | 289 | |
| | 380 | | | Rev., 5.00%, 05/01/2024 | | | 435 | |
| | 1,000 | | | City of San Antonio, Water System, Junior Lien, Series E, Rev., 5.00%, 05/15/2019 | | | 1,042 | |
| | 1,035 | | | North Harris County, Regional Water Authority, Senior Lien, Rev., 5.00%, 12/15/2019 | | | 1,094 | |
| | 1,500 | | | Trinity River Authority Central Regional Wastewater System, Rev., 5.00%, 08/01/2018 | | | 1,522 | |
| | | | | | | | |
| | | | | | | 8,750 | |
| | | | | | | | |
| | | | Total Texas | | | 170,402 | |
| | | | | | | | |
| | | | Utah — 2.6% | |
| | | | General Obligation — 0.3% | |
| | 4,925 | | | State of Utah, GO, 5.00%, 07/01/2021 | | | 5,442 | |
| | | | | | | | |
| | | | Other Revenue — 0.9% | |
| | 10,380 | | | Utah Infrastructure Agency, Telecommunication Revenue, Series A, Rev., 5.00%, 10/15/2025 | | | 11,418 | |
| | | | West Valley City Municipal Building Authority, | | | | |
| | 500 | | | Rev., AGM, 4.00%, 02/01/2024 | | | 544 | |
| | 250 | | | Rev., AGM, 5.00%, 02/01/2025 | | | 289 | |
| | 720 | | | Rev., AGM, 5.00%, 02/01/2027 | | | 846 | |
| | 1,070 | | | Rev., AGM, 5.00%, 02/01/2029 | | | 1,246 | |
| | 500 | | | Rev., AGM, 5.00%, 02/01/2030 | | | 580 | |
| | | | | | | | |
| | | | | | | 14,923 | |
| | | | | | | | |
| | | | Transportation — 1.4% | |
| | | | Salt Lake City Corp. Airport Revenue, | | | | |
| | 1,000 | | | Series A, Rev., AMT, 5.00%, 07/01/2022 | | | 1,114 | |
| | 5,250 | | | Series A, Rev., AMT, 5.00%, 07/01/2029 | | | 6,062 | |
| | 5,000 | | | Series A, Rev., AMT, 5.00%, 07/01/2031 | | | 5,724 | |
| | 5,105 | | | Series A, Rev., AMT, 5.00%, 07/01/2032 | | | 5,820 | |
| | 4,260 | | | Series A, Rev., AMT, 5.00%, 07/01/2033 | | | 4,842 | |
| | | | | | | | |
| | | | | | | 23,562 | |
| | | | | | | | |
| | | | Total Utah | | | 43,927 | |
| | | | | | | | |
| | | | Vermont — 0.1% | |
| | | | Education — 0.1% | |
| | | | University of Vermont & State Agricultural College, | | | | |
| | 750 | | | Rev., 5.00%, 10/01/2021 | | | 833 | |
| | 855 | | | Rev., 5.00%, 10/01/2022 | | | 969 | |
| | | | | | | | |
| | | | | | | 1,802 | |
| | | | | | | | |
| | | | | | | | |
PRINCIPAL
AMOUNT($) | | | SECURITY DESCRIPTION | | VALUE($) | |
| | | | | | | | |
| | | | Other Revenue — 0.0% (g) | |
| | 400 | | | Vermont Municipal Bond Bank, Series 3, Rev., 5.00%, 12/01/2021 | | | 446 | |
| | | | | | | | |
| | | | Total Vermont | | | 2,248 | |
| | | | | | | | |
| | | | Virginia — 1.8% | |
| | | | Education — 0.2% | |
| | 2,900 | | | Virginia Public School Authority, Special Obligation, Rev., 5.00%, 07/15/2019 | | | 3,039 | |
| | | | | | | | |
| | | | General Obligation — 1.1% | |
| | | | County of Fairfax, Public Improvement, | | | | |
| | 10,215 | | | Series A, GO, 5.00%, 10/01/2025 | | | 11,709 | |
| | 6,000 | | | Series A, GO, 5.00%, 10/01/2026 | | | 7,196 | |
| | | | | | | | |
| | | | | | | 18,905 | |
| | | | | | | | |
| | | | Other Revenue — 0.1% | |
| | 1,300 | | | Virginia Resources Authority, Infrastructure & State Moral Obligation, Series B, Rev., 5.00%, 11/01/2018 | | | 1,331 | |
| | | | | | | | |
| | | | Water & Sewer — 0.4% | |
| | 1,340 | | | City of Norfolk, Water Revenue, Rev., 5.00%, 11/01/2018 | | | 1,372 | |
| | 5,615 | | | Fairfax County Water Authority, Series B, Rev., 5.25%, 04/01/2024 | | | 6,636 | |
| | | | | | | | |
| | | | | | | 8,008 | |
| | | | | | | | |
| | | | Total Virginia | | | 31,283 | |
| | | | | | | | |
| | | | Washington — 1.5% | |
| | | | Certificate of Participation/Lease — 0.3% | |
| | | | State of Washington, State & Local Agency Real & Personal Property, | | | | |
| | 2,555 | | | Series D, COP, 5.00%, 07/01/2018 | | | 2,586 | |
| | 3,125 | | | Series D, COP, 5.00%, 07/01/2019 | | | 3,268 | |
| | | | | | | | |
| | | | | | | 5,854 | |
| | | | | | | | |
| | | | Education — 0.0% (g) | |
| | 125 | | | University of Washington, Rev., 1.75%, 04/01/2019 | | | 125 | |
| | | | | | | | |
| | | | General Obligation — 0.1% | |
| | | | King County Public Hospital District No. 2, Evergreenhealth, | | | | |
| | 1,370 | | | GO, 5.00%, 12/01/2018 | | | 1,404 | |
| | 870 | | | GO, 5.00%, 12/01/2019 | | | 917 | |
| | | | | | | | |
| | | | | | | 2,321 | |
| | | | | | | | |
| | | | Hospital — 0.1% | |
| | 1,000 | | | Washington Health Care Facilities Authority, Multicare Health System, Series B, Rev., 5.00%, 08/15/2030 | | | 1,160 | |
| | | | | | | | |
SEE NOTES TO FINANCIAL STATEMENTS.
| | | | | | |
| | | |
| 36 | | | | J.P. MORGAN MUNICIPAL BOND FUNDS | | FEBRUARY 28, 2018 |
| | | | | | | | |
PRINCIPAL
AMOUNT($) | | | SECURITY DESCRIPTION | | VALUE($) | |
| | Municipal Bonds — continued | | | | |
| | | | Other Revenue — 0.3% | |
| | 5,000 | | | Central Puget Sound Regional Transit Authority, Sales Tax, Series S-2A, Rev., (Dow Jones US Mid Cap Sofware Index GICS Level 4 USD + 0.70%, 12.00% Cap), 1.79%, 03/08/2018 (aa) | | | 5,024 | |
| | | | | | | | |
| | | | Transportation — 0.2% | |
| | | | Central Puget Sound Regional Transit Authority, Sales Tax & Motor Vehicle Excise Tax, | | | | |
| | 685 | | | Series S-1, Rev., 5.00%, 11/01/2023 | | | 790 | |
| | 720 | | | Series S-1, Rev., 5.00%, 11/01/2024 | | | 842 | |
| | 2,000 | | | Series S-1, Rev., 5.00%, 11/01/2034 | | | 2,320 | |
| | | | | | | | |
| | | | | | | 3,952 | |
| | | | | | | | |
| | | | Utility — 0.5% | |
| | 7,500 | | | City of Seattle, Municipal Light & Power, Series B-1, Rev., (Dow Jones US Mid Cap Sofware Index GICS Level 4 USD + 0.68%, 12.00% Cap), 1.77%, 03/08/2018 (aa) | | | 7,526 | |
| | 500 | | | County of Snohomish, Public Utility District No. 1, Electric System, Rev., 5.00%, 12/01/2025 | | | 588 | |
| | | | | | | | |
| | | | | | | 8,114 | |
| | | | | | | | |
| | | | Total Washington | | | 26,550 | |
| | | | | | | | |
| | | | West Virginia — 0.1% | |
| | | | Hospital — 0.1% | |
| | 1,565 | | | Monongalia County Building Commission, Health System, Rev., 5.00%, 07/01/2022 | | | 1,729 | |
| | | | | | | | |
| | | | Wisconsin — 1.3% | |
| | | | Education — 0.5% | |
| | 5,815 | | | Wisconsin Health & Educational Facilities Authority, Ascension Health Alliance Senior Credit Group, Series B-2, Rev., 4.00%, 05/30/2019 (z) | | | 5,993 | |
| | | | Wisconsin Health & Educational Facilities Authority, Aspirus, Inc., Obligated Group, | | | | |
| | 420 | | | Rev., 5.00%, 08/15/2023 | | | 476 | |
| | 200 | | | Rev., 5.00%, 08/15/2024 | | | 229 | |
| | 325 | | | Rev., 5.00%, 08/15/2025 | | | 375 | |
| | 200 | | | Rev., 5.00%, 08/15/2026 | | | 233 | |
| | 150 | | | Rev., 5.00%, 08/15/2027 | | | 175 | |
| | | | | | | | |
PRINCIPAL
AMOUNT($) | | | SECURITY DESCRIPTION | | VALUE($) | |
| | | | | | | | |
| | | | Education — continued | |
| | 1,250 | | | Wisconsin Health & Educational Facilities Authority, Thedacare, Inc., Rev., 5.00%, 12/15/2020 | | | 1,351 | |
| | | | | | | | |
| | | | | | | 8,832 | |
| | | | | | | | |
| | | | General Obligation — 0.7% | |
| | 300 | | | City of Racine, GO, 4.00%, 12/01/2025 | | | 330 | |
| | 10,000 | | | State of Wisconsin, Series 3, GO, 5.00%, 11/01/2023 | | | 11,286 | |
| | | | | | | | |
| | | | | | | 11,616 | |
| | | | | | | | |
| | | | Transportation — 0.1% | |
| | | | County of Milwaukee, Airport, | | | | |
| | 1,400 | | | Series A, Rev., AMT, 5.00%, 12/01/2018 | | | 1,435 | |
| | 1,000 | | | Series A, Rev., AMT, 5.00%, 12/01/2028 | | | 1,142 | |
| | | | | | | | |
| | | | | | | 2,577 | |
| | | | | | | | |
| | | | Total Wisconsin | | | 23,025 | |
| | | | | | | | |
| | | | Total Municipal Bonds
(Cost $1,696,041) | | | 1,694,013 | |
| | | | | | | | |
| | |
SHARES | | | | | | |
| | Short-Term Investment — 0.6% | |
| | | | Investment Company — 0.6% | |
| | 11,128 | | | JPMorgan U.S. Government Money Market Fund, Institutional Class Shares, Institutional Class Shares, 1.25% (b) (l)
(Cost $11,128) | | | 11,128 | |
| | | | | | | | |
| | | | Total Investments — 99.2%
(Cost $1,707,407) | | | 1,705,382 | |
| | | | Other Assets in Excess of
Liabilities — 0.8% | | | 14,204 | |
| | | | | | | | |
| | | | NET ASSETS — 100.0% | | $ | 1,719,586 | |
| | | | | | | | |
Percentages indicated are based on net assets.
SEE NOTES TO FINANCIAL STATEMENTS.
| | | | | | | | |
| | | |
| FEBRUARY 28, 2018 | | J.P. MORGAN MUNICIPAL BOND FUNDS | | | | | 37 | |
JPMorgan Tax Free Bond Fund
SCHEDULE OF PORTFOLIO INVESTMENTS
AS OF FEBRUARY 28, 2018
(Amounts in thousands)
| | | | | | | | |
PRINCIPAL
AMOUNT($) | | | SECURITY DESCRIPTION | | VALUE($) | |
| | Municipal Bonds — 95.9% (t) | |
| | | | Alabama — 0.8% | |
| | | | Other Revenue — 0.4% | |
| | 1,000 | | | Montgomery County Public Building Authority, Warrants, Facilities Project, Rev., 5.00%, 03/01/2029 | | | 1,126 | |
| | | | | | | | |
| | | | Transportation — 0.4% | |
| | 1,350 | | | Alabama Federal Aid Highway Finance Authority, Series A, Rev., 4.00%, 06/01/2037 | | | 1,419 | |
| | | | | | | | |
| | | | Total Alabama | | | 2,545 | |
| | | | | | | | |
| | | | Alaska — 3.0% | |
| | | | Prerefunded — 1.7% | |
| | 2,500 | | | Alaska Municipal Bond Bank Authority, Rev., 5.75%, 09/01/2018 (p) | | | 2,554 | |
| | 1,745 | | | Matanuska-Susitna Borough, Goose Creek Correctional Center Project, Rev., AGC, 6.00%, 09/01/2019 (p) | | | 1,860 | |
| | 1,005 | | | Matanuska-Susitna Borough, Goose Creek Correctional Center Project, Unrefunded Balance, Rev., AGC, 6.00%, 09/01/2019 (p) | | | 1,071 | |
| | | | | | | | |
| | | | | | | 5,485 | |
| | | | | | | | |
| | | | Utility — 1.3% | |
| | 3,915 | | | Alaska Energy Authority, Power, Bradley Lake Hydroelectric Project, Fourth Series, Rev., AGM, 6.00%, 07/01/2019 | | | 4,131 | |
| | | | | | | | |
| | | | Total Alaska | | | 9,616 | |
| | | | | | | | |
| | | | Arizona — 0.7% | |
| | | | Education — 0.7% | |
| | | | Arizona State University, | | | | |
| | 1,000 | | | Series B, Rev., 5.00%, 07/01/2042 | | | 1,145 | |
| | 1,000 | | | Series B, Rev., 5.00%, 07/01/2043 | | | 1,141 | |
| | | | | | | | |
| | | | Total Arizona | | | 2,286 | |
| | | | | | | | |
| | | | Arkansas — 0.1% | |
| | | | Education — 0.1% | |
| | 185 | | | Board of Trustees of the University of Arkansas, Various Facility, Fayetteville Campus, Series A, Rev., 5.00%, 11/01/2037 | | | 212 | |
| | 100 | | | University of Arkansas, Student Fee, UALR Campus, Rev., 5.00%, 10/01/2029 | | | 117 | |
| | | | | | | | |
| | | | | | | 329 | |
| | | | | | | | |
| | | | General Obligation — 0.0% (g) | |
| | 60 | | | State of Arkansas, Four-Lane Highway Construction & Improvement, Series 2013, GO, 5.00%, 06/15/2021 | | | 66 | |
| | | | | | | | |
| | | | Total Arkansas | | | 395 | |
| | | | | | | | |
| | | | | | | | |
PRINCIPAL
AMOUNT($) | | | SECURITY DESCRIPTION | | VALUE($) | |
| | | | | | | | |
| | | | California — 17.6% | |
| | | | Certificate of Participation/Lease — 0.6% | |
| | 25 | | | City & County of San Francisco, Multiple Capital Improvement Projects, Series A, COP, 3.00%, 04/01/2018 | | | 25 | |
| | 1,500 | | | Riverside Public Financing Authority, Riverside Pavement Rehabilitation Project, COP, AGM, 5.00%, 06/01/2033 | | | 1,670 | |
| | | | | | | | |
| | | | | | | 1,695 | |
| | | | | | | | |
| | | | Education — 0.2% | |
| | 500 | | | California Educational Facilities Authority, Claremont McKenna College, Series A, Rev., 4.00%, 01/01/2039 | | | 519 | |
| | | | | | | | |
| | | | General Obligation — 6.7% | |
| | 60 | | | Alta Loma School District, Series A, GO, 5.00%, 08/01/2032 | | | 71 | |
| | 30 | | | County of Santa Clara, Campbell Union High School District, GO, 3.00%, 08/01/2031 | | | 30 | |
| | 1,180 | | | Los Angeles Community College District, GO, 5.00%, 08/01/2038 | | | 1,363 | |
| | | | Los Angeles Unified School District, | | | | |
| | 1,000 | | | Series B, GO, 5.00%, 07/01/2030 | | | 1,176 | |
| | 5,000 | | | Series D, GO, 5.00%, 01/01/2034 | | | 5,227 | |
| | 1,000 | | | Mount San Antonio Community College District, GO, BAN, Zero Coupon, 04/01/2022 | | | 925 | |
| | 7,150 | | | Mount San Antonio Community College District, Election of 2008, Series A, GO, Zero Coupon, 08/01/2043 | | | 5,721 | |
| | 50 | | | Pomona Unified School District, Series A, GO, NATL-RE, 6.10%, 02/01/2020 | | | 54 | |
| | 2,450 | | | Santa Maria Joint Union High School District, Santa Barbara & San Luis Obispo, GO, Zero Coupon, 08/01/2037 | | | 992 | |
| | 5,000 | | | State of California, Various Purpose, GO, 6.50%, 04/01/2033 | | | 5,275 | |
| | | | Weaver Union School District, Election of 2012, | | | | |
| | 100 | | | Series A, GO, 5.00%, 08/01/2028 | | | 113 | |
| | 100 | | | Series A, GO, 5.00%, 08/01/2030 | | | 113 | |
| | 100 | | | Series A, GO, 5.00%, 08/01/2032 | | | 113 | |
| | | | | | | | |
| | | | | | | 21,173 | |
| | | | | | | | |
| | | | Hospital — 1.2% | |
| | 1,500 | | | California Health Facilities Financing Authority, Cedars-Sinai Medical Center, Rev., 5.00%, 11/15/2028 | | | 1,770 | |
| | 250 | | | California Health Facilities Financing Authority, Sutter Health, Series A, Rev., 5.00%, 11/15/2041 | | | 281 | |
SEE NOTES TO FINANCIAL STATEMENTS.
| | | | | | |
| | | |
| 38 | | | | J.P. MORGAN MUNICIPAL BOND FUNDS | | FEBRUARY 28, 2018 |
| | | | | | | | |
PRINCIPAL
AMOUNT($) | | | SECURITY DESCRIPTION | | VALUE($) | |
| | Municipal Bonds — continued | |
| | | | Hospital — continued | |
| | | | California Public Finance Authority, Henry Mayo Newhall Hospital, | | | | |
| | 500 | | | Rev., 5.00%, 10/15/2037 | | | 545 | |
| | 1,000 | | | Rev., 5.00%, 10/15/2047 | | | 1,091 | |
| | | | | | | | |
| | | | | | | 3,687 | |
| | | | | | | | |
| | | | Other Revenue — 0.8% | |
| | 20 | | | San Diego Convention Center Expansion Financing Authority, Series A, Rev., 4.00%, 04/15/2018 | | | 20 | |
| | 2,250 | | | San Diego Regional Building Authority, County Operations Center, Series A, Rev., 5.00%, 10/15/2034 | | | 2,604 | |
| | | | | | | | |
| | | | | | | 2,624 | |
| | | | | | | | |
| | | | Prerefunded — 3.1% | |
| | 40 | | | California Health Facilities Financing Authority, Providence Health & Services, Series C, Rev., 6.50%, 10/01/2018 (p) | | | 41 | |
| | 1,960 | | | California Health Facilities Financing Authority, Unrefunded Balance, Providence Health & Services, Series C, Rev., 6.50%, 10/01/2018 (p) | | | 2,019 | |
| | 7,500 | | | San Diego Public Facilities Financing Authority, Senior Sewer, Series A, Rev., 5.25%, 05/15/2019 (p) | | | 7,849 | |
| | | | | | | | |
| | | | | | | 9,909 | |
| | | | | | | | |
| | | | Transportation — 1.1% | |
| | 390 | | | Bay Area Toll Authority, Toll Bridge, San Francisco Bay Area, Rev., 4.00%, 04/01/2032 | | | 420 | |
| | 1,250 | | | City of Los Angeles, Department of Airports, Series A, Rev., AMT, 5.00%, 05/15/2038 | | | 1,370 | |
| | 1,000 | | | Los Angeles County Metropolitan Transportation Authority, Union Station Gateway Project, Rev., 5.00%, 07/01/2027 | | | 1,181 | |
| | 415 | | | Los Angeles Harbor Department, Rev., 7.60%, 10/01/2018 (p) | | | 430 | |
| | | | | | | | |
| | | | | | | 3,401 | |
| | | | | | | | |
| | | | Utility — 3.5% | |
| | | | City of Los Angeles, Department of Water & Power, Power System, | | | | |
| | 1,700 | | | Series A, Rev., 5.00%, 07/01/2035 | | | 1,965 | |
| | 375 | | | Series B, Rev., 5.00%, 07/01/2036 | | | 432 | |
| | 610 | | | Series D, Rev., 5.00%, 07/01/2033 | | | 699 | |
| | 2,500 | | | Subseries A-1, Rev., 5.25%, 07/01/2038 | | | 2,532 | |
| | 2,450 | | | East Bay Municipal Utility District, Wastewater System, Series A, Rev., 5.00%, 06/01/2036 | | | 2,820 | |
| | | | | | | | |
PRINCIPAL
AMOUNT($) | | | SECURITY DESCRIPTION | | VALUE($) | |
| | | | | | | | |
| | | | Utility — continued | |
| | 2,000 | | | Long Beach Bond Finance Authority, Natural Gas, Series A, Rev., 5.25%, 11/15/2021 | | | 2,220 | |
| | 430 | | | Northern California Transmission Agency, Transmission Project, Series A, Rev., 5.00%, 05/01/2031 | | | 501 | |
| | | | | | | | |
| | | | | | | 11,169 | |
| | | | | | | | |
| | | | Water & Sewer — 0.4% | |
| | 515 | | | East Bay Municipal Utility District Water System, Green Bonds, Series B, Rev., 5.00%, 06/01/2033 | | | 597 | |
| | 650 | | | Orange County Water District, Series A, Rev., 5.00%, 08/15/2034 | | | 763 | |
| | | | | | | | |
| | | | | | | 1,360 | |
| | | | | | | | |
| | | | Total California | | | 55,537 | |
| | | | | | | | |
| | | | Colorado — 4.3% | |
| | | | Certificate of Participation/Lease — 1.3% | |
| | 2,855 | | | Adams County, Colorado Refunding & Improvement, COP, 4.00%, 12/01/2040 | | | 2,913 | |
| | 1,000 | | | Colorado Department of Transportation Headquarters Facilities, COP, 5.00%, 06/15/2041 | | | 1,120 | |
| | | | | | | | |
| | | | | | | 4,033 | |
| | | | | | | | |
| | | | Education — 0.1% | |
| | 150 | | | Board of Governors of the University of Colorado, Enterprise System, Series E-1, Rev., 5.00%, 03/01/2035 | | | 169 | |
| | | | | | | | |
| | | | General Obligation — 0.4% | |
| | 1,000 | | | Adams and Arapahoe Joint School District 28J Aurora, Series A, GO, 5.00%, 12/01/2030 | | | 1,173 | |
| | 55 | | | Adams and Weld Counties School District No 27J Brighton, GO, 5.00%, 12/01/2038 | | | 64 | |
| | | | | | | | |
| | | | | | | 1,237 | |
| | | | | | | | |
| | | | Hospital — 0.7% | |
| | 1,095 | | | Colorado Health Facilities Authority, Vail Valley Medical Centre Project, Rev., 4.00%, 01/15/2045 | | | 1,110 | |
| | 1,000 | | | Denver Health & Hospital Authority, Series A, Rev., 5.25%, 12/01/2045 | | | 1,068 | |
| | | | | | | | |
| | | | | | | 2,178 | |
| | | | | | | | |
| | | | Prerefunded — 1.8% | |
| | | | Colorado Water Resources & Power Development Authority, Water & Wastewater Utility Enterprise Project, | | | | |
| | 1,000 | | | Series A, Rev., AGC, 5.13%, 12/01/2018 (p) | | | 1,028 | |
| | 1,000 | | | Series A, Rev., AGC, 5.25%, 12/01/2018 (p) | | | 1,028 | |
SEE NOTES TO FINANCIAL STATEMENTS.
| | | | | | | | |
| | | |
| FEBRUARY 28, 2018 | | J.P. MORGAN MUNICIPAL BOND FUNDS | | | | | 39 | |
JPMorgan Tax Free Bond Fund
SCHEDULE OF PORTFOLIO INVESTMENTS
AS OF FEBRUARY 28, 2018 (continued)
(Amounts in thousands)
| | | | | | | | |
PRINCIPAL
AMOUNT($) | | | SECURITY DESCRIPTION | | VALUE($) | |
| | Municipal Bonds — continued | |
| | | | Prerefunded — continued | |
| | 2,000 | | | State of Colorado, Building Excellent Schools Today, Series G, COP, 5.00%, 03/15/2021 (p) | | | 2,189 | |
| | 1,500 | | | University of Colorado, University Enterprise, Series A, Rev., 5.38%, 06/01/2019 (p) | | | 1,573 | |
| | | | | | | | |
| | | | | | | 5,818 | |
| | | | | | | | |
| | | | Total Colorado | | | 13,435 | |
| | | | | | | | |
| | | | Connecticut — 0.0% (g) | |
| | | | Education — 0.0% (g) | |
| | 15 | | | University of Connecticut, Series A, Rev., 5.00%, 02/15/2028 | | | 17 | |
| | | | | | | | |
| | | | Delaware — 0.8% | |
| | | | Education — 0.4% | |
| | | | The Delaware Economic Development Authority, Newark Charter School, Inc. Project, | | | | |
| | 500 | | | Series A, Rev., 5.00%, 09/01/2036 | | | 540 | |
| | 500 | | | Series A, Rev., 5.00%, 09/01/2046 | | | 533 | |
| | | | | | | | |
| | | | | | | 1,073 | |
| | | | | | | | |
| | | | Hospital — 0.4% | |
| | 1,300 | | | Delaware State Health Facilities Authority, Bayhealth Medical Center Project, Series A, Rev., 4.00%, 07/01/2043 | | | 1,321 | |
| | | | | | | | |
| | | | Total Delaware | | | 2,394 | |
| | | | | | | | |
| | | | District of Columbia — 3.0% | |
| | | | General Obligation — 2.6% | |
| | | | District of Columbia, | | | | |
| | 1,500 | | | Series A, GO, 5.00%, 06/01/2037 | | | 1,724 | |
| | 3,965 | | | Series B, GO, NATL-RE, 6.00%, 06/01/2019 | | | 4,186 | |
| | 2,000 | | | Series D, GO, 5.00%, 06/01/2038 | | | 2,300 | |
| | | | | | | | |
| | | | | | | 8,210 | |
| | | | | | | | |
| | | | Prerefunded — 0.4% | |
| | 1,000 | | | District of Columbia, Series A, Rev., 6.00%, 07/01/2023 (p) | | | 1,191 | |
| | | | | | | | |
| | | | Total District of Columbia | | | 9,401 | |
| | | | | | | | |
| | | | Florida — 2.4% | |
| | | | Certificate of Participation/Lease — 0.0% (g) | |
| | 10 | | | Broward County School Board, Series A, COP, AGM, 4.00%, 07/01/2018 | | | 10 | |
| | | | | | | | |
| | | | General Obligation — 0.9% | |
| | 2,415 | | | Hillsborough County, Parks & Recreation Program, GO, NATL-RE, 5.25%, 07/01/2025 | | | 2,823 | |
| | | | | | | | |
| | | | | | | | |
PRINCIPAL
AMOUNT($) | | | SECURITY DESCRIPTION | | VALUE($) | |
| | | | | | | | |
| | | | Hospital — 0.1% | |
| | 215 | | | Orange County Health Facilities Authority, Series B, Rev., 4.00%, 10/01/2045 | | | 214 | |
| | | | | | | | |
| | | | Transportation — 1.0% | |
| | 3,205 | | | Hillsborough County Aviation Authority, Tampa International Airport, Series B, Rev., NATL-RE, 6.00%, 10/01/2018 | | | 3,294 | |
| | | | | | | | |
| | | | Utility — 0.4% | |
| | 1,320 | | | Tohopekaliga Water Authority, Utility System Revenue, Series A, Rev., 4.00%, 10/01/2041 | | | 1,367 | |
| | | | | | | | |
| | | | Total Florida | | | 7,708 | |
| | | | | | | | |
| | | | Georgia — 2.4% | |
| | | | Hospital — 2.4% | |
| | 3,845 | | | Dalton Development Authority, Hamilton Health Care System, Rev., NATL-RE, 5.50%, 08/15/2026 | | | 4,281 | |
| | 1,000 | | | Dalton Whitfield County Joint Development Authority, Hamilton Health Care System, Series 2017, Rev., 4.00%, 08/15/2041 | | | 1,007 | |
| | 2,150 | | | Fulton County Georgia Development Authority, Hospital Revenue Health System, Rev., 5.00%, 04/01/2042 | | | 2,379 | |
| | | | | | | | |
| | | | Total Georgia | | | 7,667 | |
| | | | | | | | |
| | | | Hawaii — 1.5% | |
| | | | General Obligation — 1.5% | |
| | 1,970 | | | City & County of Honolulu, Series A, GO, 5.00%, 10/01/2037 | | | 2,238 | |
| | 2,000 | | | State of Hawaii, Series FK, GO, 5.00%, 05/01/2027 | | | 2,391 | |
| | | | | | | | |
| | | | Total Hawaii | | | 4,629 | |
| | | | | | | | |
| | | | Illinois — 3.0% | |
| | | | Education — 0.6% | |
| | 1,750 | | | Chicago Public Building Commission, Board of Education, Series A, Rev., NATL-RE, 7.00%, 01/01/2020 (p) | | | 1,866 | |
| | | | | | | | |
| | | | General Obligation — 1.1% | |
| | 295 | | | Cook County Forest Preserve District, Limited Tax Project, Series B, GO, 5.00%, 12/15/2037 | | | 316 | |
| | 3,000 | | | State of Illinois, GO, 5.50%, 07/01/2038 | | | 3,137 | |
| | | | | | | | |
| | | | | | | 3,453 | |
| | | | | | | | |
| | | | Hospital — 0.2% | |
| | | | Illinois Finance Authority, Healthcare Enterprises, Inc., | | | | |
| | 305 | | | Series C, Rev., 5.00%, 03/01/2033 | | | 339 | |
| | 205 | | | Series C, Rev., 5.00%, 03/01/2034 | | | 227 | |
| | | | | | | | |
| | | | | | | 566 | |
| | | | | | | | |
SEE NOTES TO FINANCIAL STATEMENTS.
| | | | | | |
| | | |
| 40 | | | | J.P. MORGAN MUNICIPAL BOND FUNDS | | FEBRUARY 28, 2018 |
| | | | | | | | |
PRINCIPAL
AMOUNT($) | | | SECURITY DESCRIPTION | | VALUE($) | |
| | Municipal Bonds — continued | |
| | | | Prerefunded — 0.4% | |
| | 1,260 | | | City of Chicago, O’Hare International Airport, Third Lien, Series A, Rev., 5.75%, 01/01/2021 (p) | | | 1,396 | |
| | | | | | | | |
| | | | Transportation — 0.7% | |
| | 240 | | | City of Chicago, O’Hare International Airport, Third Lien, Series A, Rev., 5.75%, 01/01/2039 | | | 264 | |
| | 1,780 | | | Regional Transportation Authority, Series D, Rev., NATL-RE, 7.75%, 06/01/2019 | | | 1,861 | |
| | | | | | | | |
| | | | | | | 2,125 | |
| | | | | | | | |
| | | | Total Illinois | | | 9,406 | |
| | | | | | | | |
| | | | Indiana — 1.7% | |
| | | | Other Revenue — 0.3% | |
| | 800 | | | Indiana Finance Authority, Educational Facilities, Valparaiso University, Rev., 5.00%, 10/01/2026 | | | 929 | |
| | | | | | | | |
| | | | Prerefunded — 1.4% | |
| | 4,000 | | | Indiana Finance Authority, State Revolving Fund Program, Series A, Rev., 5.00%, 02/01/2022 (p) | | | 4,464 | |
| | | | | | | | |
| | | | Total Indiana | | | 5,393 | |
| | | | | | | | |
| | | | Louisiana — 0.7% | |
| | | | Hospital — 0.4% | |
| | 1,055 | | | Louisiana Public Facilities Authority, Ochsner Clinic Foundation Project, Rev., 5.00%, 05/15/2047 | | | 1,140 | |
| | | | | | | | |
| | | | Other Revenue — 0.3% | |
| | 1,000 | | | Tobacco Settlement Financing Corp., Asset-Backed, Series A, Rev., 5.25%, 05/15/2035 | | | 1,078 | |
| | | | | | | | |
| | | | Total Louisiana | | | 2,218 | |
| | | | | | | | |
| | | | Maine — 1.9% | |
| | | | Prerefunded — 1.9% | |
| | 5,675 | | | Maine Turnpike Authority, Rev., 6.00%, 07/01/2019 (p) | | | 6,015 | |
| | | | | | | | |
| | | | Maryland — 0.8% | |
| | | | General Obligation — 0.8% | |
| | 1,215 | | | Baltimore County, Consolidated Public Improvement, GO, 5.00%, 08/01/2026 | | | 1,430 | |
| | 995 | | | City of Baltimore, Series B, GO, 5.00%, 10/15/2030 | | | 1,177 | |
| | | | | | | | |
| | | | Total Maryland | | | 2,607 | |
| | | | | | | | |
| | | | Massachusetts — 3.5% | |
| | | | General Obligation — 3.3% | |
| | | | Commonwealth of Massachusetts, | | | | |
| | 1,500 | | | Series A, GO, 5.00%, 03/01/2032 | | | 1,700 | |
| | 4,135 | | | Series B, GO, 5.00%, 07/01/2028 | | | 4,993 | |
| | | | | | | | |
PRINCIPAL
AMOUNT($) | | | SECURITY DESCRIPTION | | VALUE($) | |
| | | | | | | | |
| | | | General Obligation — continued | |
| | 3,690 | | | Commonwealth of Massachusetts, Consolidated Loan of 2016, Series J, GO, 4.00%, 12/01/2039 | | | 3,823 | |
| | 25 | | | Town of Chelmsford, Municipal Purpose Loan, GO, 4.00%, 05/15/2018 | | | 25 | |
| | | | | | | | |
| | | | | | | 10,541 | |
| | | | | | | | |
| | | | Transportation — 0.2% | |
| | 500 | | | Massachusetts Bay Transportation Authority, Series A-1, Rev., 5.00%, 07/01/2035 | | | 580 | |
| | | | | | | | |
| | | | Water & Sewer — 0.0% (g) | |
| | 25 | | | Massachusetts Clean Water Trust, Pool Program, Rev., 5.25%, 08/01/2028 | | | 31 | |
| | | | | | | | |
| | | | Total Massachusetts | | | 11,152 | |
| | | | | | | | |
| | | | Michigan — 1.4% | |
| | | | Hospital — 0.9% | |
| | 2,500 | | | Michigan Finance Authority, Trinity Health Credit Group, Rev., 5.00%, 12/01/2047 | | | 2,720 | |
| | | | | | | | |
| | | | Transportation — 0.5% | |
| | 1,500 | | | Michigan State Trunk Line, Rev., 5.00%, 11/15/2036 | | | 1,648 | |
| | | | | | | | |
| | | | Total Michigan | | | 4,368 | |
| | | | | | | | |
| | | | Minnesota — 1.4% | |
| | | | Education — 0.5% | |
| | | | Minnesota Higher Education Facilities Authority, Carleton College, | | | | |
| | 1,000 | | | Rev., 4.00%, 03/01/2032 | | | 1,062 | |
| | 500 | | | Rev., 4.00%, 03/01/2033 | | | 527 | |
| | | | | | | | |
| | | | | | | 1,589 | |
| | | | | | | | |
| | | | General Obligation — 0.8% | |
| | | | Aurora Independent School District No. 2711, School Building, Capital Appreciation, | | | | |
| | 200 | | | Series B, GO, Zero Coupon, 02/01/2026 | | | 155 | |
| | 425 | | | Series B, GO, Zero Coupon, 02/01/2027 | | | 321 | |
| | 400 | | | Series B, GO, Zero Coupon, 02/01/2028 | | | 284 | |
| | 1,560 | | | Series B, GO, Zero Coupon, 02/01/2029 | | | 1,064 | |
| | 990 | | | Series B, GO, Zero Coupon, 02/01/2030 | | | 659 | |
| | | | | | | | |
| | | | | | | 2,483 | |
| | | | | | | | |
| | | | Utility — 0.1% | |
| | 250 | | | City of Rochester, Electric Utility, Series A, Rev., 5.00%, 12/01/2028 | | | 295 | |
| | | | | | | | |
| | | | Total Minnesota | | | 4,367 | |
| | | | | | | | |
SEE NOTES TO FINANCIAL STATEMENTS.
| | | | | | | | |
| | | |
| FEBRUARY 28, 2018 | | J.P. MORGAN MUNICIPAL BOND FUNDS | | | | | 41 | |
JPMorgan Tax Free Bond Fund
SCHEDULE OF PORTFOLIO INVESTMENTS
AS OF FEBRUARY 28, 2018 (continued)
(Amounts in thousands)
| | | | | | | | |
PRINCIPAL
AMOUNT($) | | | SECURITY DESCRIPTION | | VALUE($) | |
| | Municipal Bonds — continued | |
| | | | Mississippi — 0.4% | |
| | | | Water & Sewer — 0.4% | |
| | 1,000 | | | Mississippi Development Bank, Water & Sewer System Project, Special Obligation, Rev., AGM, 6.88%, 12/01/2040 | | | 1,213 | |
| | | | | | | | |
| | | | Montana — 0.1% | |
| | | | Prerefunded — 0.1% | |
| | 400 | | | City of Helena, COP, 5.00%, 01/01/2019 (p) | | | 412 | |
| | | | | | | | |
| | | | Nebraska — 0.8% | |
| | | | Utility — 0.8% | |
| | 2,000 | | | Omaha Public Power District, Electric System, Series A, Rev., 5.00%, 02/01/2042 | | | 2,303 | |
| | 185 | | | Public Power Generation Agency, Whelan Energy Center Unit 2, Series A, Rev., 5.00%, 01/01/2034 | | | 208 | |
| | | | | | | | |
| | | | Total Nebraska | | | 2,511 | |
| | | | | | | | |
| | | | New Jersey — 2.3% | |
| | | | Transportation — 2.3% | |
| | 10,355 | | | New Jersey Transportation Trust Fund Authority, Capital Appreciation, Transportation Systems, Series A, Rev., Zero Coupon, 12/15/2036 | | | 4,222 | |
| | 2,670 | | | New Jersey Transportation Trust Fund Authority, Federal Highway Reimbursement, Series A-1, Rev., 5.00%, 06/15/2027 | | | 2,956 | |
| | | | | | | | |
| | | | Total New Jersey | | | 7,178 | |
| | | | | | | | |
| | | | New York — 12.1% | |
| | | | General Obligation — 1.1% | |
| | 3,500 | | | City of New York, Fiscal Year 2006, Series I, Subseries I-4, GO, VRDO, LOC: TD Bank NA, 1.10%, 03/01/2018 (z) | | | 3,500 | |
| | | | | | | | |
| | | | Other Revenue — 3.3% | |
| | 195 | | | New York City Transitional Finance Authority, Future Tax Secured, Fiscal Year 2012, Subseries E-1, Rev., 5.00%, 02/01/2035 | | | 213 | |
| | 1,220 | | | New York City Transitional Finance Authority, Future Tax Secured, Fiscal Year 2017, Series B, Subseries B-1, Rev., 5.00%, 08/01/2036 | | | 1,390 | |
| | 1,160 | | | New York City Transitional Finance Authority, Future Tax Secured, Fiscal Year 2018, Series B-1, Rev., 5.00%, 08/01/2045 | | | 1,316 | |
| | | | New York Convention Center Development Corp., Subordinated Lien Hotel Unit fee, | | | | |
| | 4,970 | | | Series B, Rev., Zero Coupon, 11/15/2055 | | | 987 | |
| | 6,500 | | | Series B, Rev., Zero Coupon, 11/15/2056 | | | 1,291 | |
| | 4,400 | | | New York State Dormitory Authority, Sales Tax, Series A, Rev., 5.00%, 03/15/2026 | | | 5,141 | |
| | | | | | | | |
| | | | | | | 10,338 | |
| | | | | | | | |
| | | | | | | | |
PRINCIPAL
AMOUNT($) | | | SECURITY DESCRIPTION | | VALUE($) | |
| | | | | | | | |
| | | | Prerefunded — 0.4% | |
| | 1,150 | | | New York City Municipal Water Finance Authority, Water & Sewer System, Series A, Rev., 5.75%, 06/15/2018 (p) | | | 1,165 | |
| | | | | | | | |
| | | | Transportation — 4.2% | |
| | | | Metropolitan Transportation Authority, | | | | |
| | 250 | | | Series D, Rev., 5.00%, 11/15/2029 | | | 291 | |
| | 400 | | | Series D, Rev., 5.00%, 11/15/2030 | | | 465 | |
| | 400 | | | Series D, Rev., 5.00%, 11/15/2031 | | | 463 | |
| | 7,790 | | | Port Authority of New York & New Jersey, Consolidated, 93rd Series, Rev., 6.13%, 06/01/2094 | | | 9,344 | |
| | 2,500 | | | Triborough Bridge & Tunnel Authority, MTA Bridges And Tunnels, Series C-2, Rev., 5.00%, 11/15/2042 | | | 2,866 | |
| | | | | | | | |
| | | | | | | 13,429 | |
| | | | | | | | |
| | | | Utility — 1.5% | |
| | 4,250 | | | Utility Debt Securitization Authority, Series TE, Rev., 5.00%, 12/15/2041 | | | 4,824 | |
| | | | | | | | |
| | | | Water & Sewer — 1.6% | |
| | 3,030 | | | New York City Municipal Water Finance Authority, Water & Sewer System, Series A, Rev., 5.75%, 06/15/2040 | | | 3,067 | |
| | 1,750 | | | New York State Environmental Facilities Corp., State Clean Water & Drinking Water Revolving Funds, Municipal Water Finance Authority Projects — Second Resolution, Series A, Rev., 5.00%, 06/15/2037 | | | 2,017 | |
| | | | | | | | |
| | | | | | | 5,084 | |
| | | | | | | | |
| | | | Total New York | | | 38,340 | |
| | | | | | | | |
| | | | North Dakota — 0.0% (g) | |
| | | | General Obligation — 0.0% (g) | |
| | 30 | | | West Fargo Public School District No. 6, Series A, GO, 3.00%, 05/01/2025 | | | 31 | |
| | | | | | | | |
| | | | Ohio — 2.2% | |
| | | | Education — 0.6% | |
| | | | Miami University, A State University of Ohio, | | | | |
| | 375 | | | Rev., 5.00%, 09/01/2029 | | | 438 | |
| | 500 | | | Rev., 5.00%, 09/01/2030 | | | 583 | |
| | 650 | | | Rev., 5.00%, 09/01/2031 | | | 755 | |
| | | | | | | | |
| | | | | | | 1,776 | |
| | | | | | | | |
| | | | General Obligation — 0.7% | |
| | | | Greenville City School District, School Improvement, | | | | |
| | 1,000 | | | GO, 5.25%, 01/01/2038 | | | 1,108 | |
| | 1,000 | | | GO, 5.25%, 01/01/2041 | | | 1,108 | |
| | | | | | | | |
| | | | | | | 2,216 | |
| | | | | | | | |
SEE NOTES TO FINANCIAL STATEMENTS.
| | | | | | |
| | | |
| 42 | | | | J.P. MORGAN MUNICIPAL BOND FUNDS | | FEBRUARY 28, 2018 |
| | | | | | | | |
PRINCIPAL
AMOUNT($) | | | SECURITY DESCRIPTION | | VALUE($) | |
| | Municipal Bonds — continued | |
| | | | Hospital — 0.4% | |
| | 1,000 | | | County of Warren, Otterbein Homes Obligated Group, Healthcare Facilities, Series A, Rev., 5.50%, 07/01/2039 | | | 1,122 | |
| | | | | | | | |
| | | | Industrial Development Revenue/Pollution Control Revenue — 0.0% (g) | |
| | 140 | | | Ohio Water Development Authority, Water Pollution Control Loan Fund, Series A, Rev., 5.00%, 12/01/2029 | | | 166 | |
| | | | | | | | |
| | | | Prerefunded — 0.5% | |
| | | | County of Richland, Correctional Facilities Improvement, | | | | |
| | 500 | | | GO, AGC, 5.88%, 12/01/2018 (p) | | | 516 | |
| | 400 | | | GO, AGC, 6.00%, 12/01/2018 (p) | | | 414 | |
| | 650 | | | GO, AGC, 6.13%, 12/01/2018 (p) | | | 673 | |
| | | | | | | | |
| | | | | | | 1,603 | |
| | | | | | | | |
| | | | Total Ohio | | | 6,883 | |
| | | | | | | | |
| | | | Oklahoma — 1.9% | |
| | | | Other Revenue — 0.5% | |
| | 1,455 | | | The Edmond Public Works Authority, Sales Tax And Utility System, Rev., 4.00%, 07/01/2041 | | | 1,517 | |
| | | | | | | | |
| | | | Prerefunded — 0.6% | |
| | 2,000 | | | Oklahoma City Water Utilities Trust, Water & Sewer System, Series A, Rev., 5.00%, 07/01/2019 (p) | | | 2,093 | |
| | | | | | | | |
| | | | Transportation — 0.8% | |
| | | | Oklahoma Turnpike Authority, Turnpike System, Second Senior, | | | | |
| | 1,665 | | | Series A, Rev., 5.00%, 01/01/2037 | | | 1,877 | |
| | 600 | | | Series C, Rev., 4.00%, 01/01/2042 | | | 618 | |
| | | | | | | | |
| | | | | | | 2,495 | |
| | | | | | | | |
| | | | Total Oklahoma | | | 6,105 | |
| | | | | | | | |
| | | | Pennsylvania — 4.2% | |
| | | | General Obligation — 0.8% | |
| | 730 | | | City of Pittsburgh, GO, 4.00%, 09/01/2031 | | | 780 | |
| | 1,245 | | | Nazareth Area School District, Series E, GO, 5.00%, 11/15/2037 | | | 1,415 | |
| | 250 | | | Upper Merion Area School District, GO, 5.00%, 01/15/2036 | | | 285 | |
| | | | | | | | |
| | | | | | | 2,480 | |
| | | | | | | | |
| | | | Hospital — 0.2% | |
| | | | Lancaster County Hospital Authority, Health Center, Masonic Villages Project, | | | | |
| | 510 | | | Rev., 5.00%, 11/01/2036 | | | 575 | |
| | 250 | | | Rev., 5.00%, 11/01/2037 | | | 281 | |
| | | | | | | | |
| | | | | | | 856 | |
| | | | | | | | |
| | | | | | | | |
PRINCIPAL
AMOUNT($) | | | SECURITY DESCRIPTION | | VALUE($) | |
| | | | | | | | |
| | | | Other Revenue — 3.2% | |
| | 10,000 | | | Commonwealth Financing Authority, Tobacco Master Settlement Payment, Series 2018, Rev., AGM, 4.00%, 06/01/2039 | | | 10,026 | |
| | | | | | | | |
| | | | Total Pennsylvania | | | 13,362 | |
| | | | | | | | |
| | | | South Carolina — 6.3% | |
| | | | General Obligation — 0.0% (g) | |
| | 10 | | | York County, Capital Improvement, GO, 5.00%, 04/01/2018 | | | 10 | |
| | | | | | | | |
| | | | Prerefunded — 3.2% | |
| | 9,515 | | | Laurens County School District No. 056, GO, AGC, SCSDE, 6.13%, 03/01/2019 (p) | | | 9,956 | |
| | | | | | | | |
| | | | Utility — 2.9% | |
| | 3,900 | | | Piedmont Municipal Power Agency, Electric, Rev., FGIC, 6.75%, 01/01/2020 (p) | | | 4,260 | |
| | 4,615 | | | Piedmont Municipal Power Agency, Electric, Unrefunded Balance, Rev., NATL-RE, 6.75%, 01/01/2020 | | | 5,030 | |
| | | | | | | | |
| | | | | | | 9,290 | |
| | | | | | | | |
| | | | Water & Sewer — 0.2% | |
| | 220 | | | City of Anderson, South Carolina Water & Sewer System, Rev., 5.00%, 07/01/2029 | | | 256 | |
| | 415 | | | City of Spartanburg, Waterworks and Improvement System, Series B, Rev., 5.00%, 06/01/2039 | | | 473 | |
| | | | | | | | |
| | | | | | | 729 | |
| | | | | | | | |
| | | | Total South Carolina | | | 19,985 | |
| | | | | | | | |
| | | | South Dakota — 0.1% | |
| | | | Other Revenue — 0.1% | |
| | 300 | | | South Dakota State Building Authority, Series A, Rev., 5.00%, 06/01/2022 | | | 336 | |
| | | | | | | | |
| | | | Tennessee — 0.1% | |
| | | | General Obligation — 0.1% | |
| | 250 | | | County of Rutherford, Series B, GO, 5.00%, 04/01/2028 | | | 289 | |
| | | | | | | | |
| | | | Texas — 7.5% | |
| | | | Education — 2.1% | |
| | | | Clifton Higher Education Finance Corp., Idea Public Schools, | | | | |
| | 1,250 | | | Rev., 6.00%, 08/15/2033 | | | 1,443 | |
| | 500 | | | Series B, Rev., 4.00%, 08/15/2023 | | | 532 | |
| | 345 | | | Series B, Rev., 5.00%, 08/15/2024 | | | 388 | |
| | 460 | | | Series B, Rev., 5.00%, 08/15/2025 | | | 520 | |
SEE NOTES TO FINANCIAL STATEMENTS.
| | | | | | | | |
| | | |
| FEBRUARY 28, 2018 | | J.P. MORGAN MUNICIPAL BOND FUNDS | | | | | 43 | |
JPMorgan Tax Free Bond Fund
SCHEDULE OF PORTFOLIO INVESTMENTS
AS OF FEBRUARY 28, 2018 (continued)
(Amounts in thousands, except number of Futures contracts)
| | | | | | | | |
PRINCIPAL
AMOUNT($) | | | SECURITY DESCRIPTION | | VALUE($) | |
| | Municipal Bonds — continued | |
| | | | Education — continued | |
| | | | Tarrant County Cultural Education Facilities Finance Corp., Hendrick Medical Center, Hospital, | | | | |
| | 1,000 | | | Rev., 5.13%, 09/01/2033 | | | 1,087 | |
| | 2,300 | | | Rev., 5.50%, 09/01/2043 | | | 2,569 | |
| | 210 | | | University of Texas System, Series A, Rev., 5.00%, 07/01/2031 | | | 243 | |
| | | | | | | | |
| | | | | | | 6,782 | |
| | | | | | | | |
| | | | General Obligation — 0.2% | |
| | 535 | | | City of Carrollton, GO, 5.00%, 08/15/2026 | | | 561 | |
| | | | | | | | |
| | | | Hospital — 0.3% | |
| | 940 | | | Harris County Health Facilities Development Corp., Texas Children’s Hospital Project, Rev., 5.50%, 10/01/2019 (p) | | | 970 | |
| | | | | | | | |
| | | | Prerefunded — 2.6% | |
| | 2,200 | | | City of Forney, Independent School District, Series A, GO, PSF-GTD, 5.75%, 08/15/2018 (p) | | | 2,243 | |
| | 3,500 | | | Harris County Health Facilities Development Corp., Memorial Hermann Healthcare System, Series B, Rev., 7.25%, 12/01/2018 (p) | | | 3,651 | |
| | 2,000 | | | North Texas Tollway Authority, Special Projects System, Series A, Rev., 6.00%, 09/01/2021 (p) | | | 2,278 | |
| | | | | | | | |
| | | | | | | 8,172 | |
| | | | | | | | |
| | | | Transportation — 0.7% | |
| | 1,965 | | | Dallas-Fort Worth International Airport, Joint Improvement, Series A, Rev., 5.00%, 11/01/2042 | | | 2,095 | |
| | | | | | | | |
| | | | Utility — 0.6% | |
| | 1,535 | | | City of Houston, Utility System, Series B, Rev., 5.00%, 11/15/2036 | | | 1,752 | |
| | 35 | | | City of San Antonio, Electric & Gas Systems, Rev., 5.00%, 02/01/2032 | | | 41 | |
| | | | | | | | |
| | | | | | | 1,793 | |
| | | | | | | | |
| | | | Water & Sewer — 1.0% | |
| | 2,500 | | | City of Houston, Water & Sewer System, Junior Lien, Series A, Rev., AGM, 5.75%, 12/01/2032 (p) | | | 3,359 | |
| | | | | | | | |
| | | | Total Texas | | | 23,732 | |
| | | | | | | | |
| | | | Utah — 0.4% | |
| | | | Water & Sewer — 0.4% | |
| | 1,000 | | | Utah Water Finance Agency, Loan Financing Program, Series A, Rev., 5.00%, 03/01/2027 | | | 1,188 | |
| | | | | | | | |
| | | | | | | | |
PRINCIPAL
AMOUNT($) | | | SECURITY DESCRIPTION | | VALUE($) | |
| | | | | | | | |
| | | | Virginia — 1.0% | |
| | | | General Obligation — 0.4% | |
| | | | City of Richmond, Public Improvement, | | | | |
| | 100 | | | Series D, GO, 5.00%, 03/01/2032 | | | 123 | |
| | 915 | | | Series D, GO, 5.00%, 03/01/2033 | | | 1,128 | |
| | | | | | | | |
| | | | | | | 1,251 | |
| | | | | | | | |
| | | | Transportation — 0.6% | |
| | | | Capital Region Airport Commission (Richmond International Airport), | | | | |
| | 350 | | | Series A, Rev., 4.00%, 07/01/2035 | | | 367 | |
| | 320 | | | Series A, Rev., 4.00%, 07/01/2036 | | | 334 | |
| | 1,000 | | | Virginia Commonwealth Transportation Board, Capital Projects, Series A, Rev., 4.00%, 05/15/2036 | | | 1,047 | |
| | | | | | | | |
| | | | | | | 1,748 | |
| | | | | | | | |
| | | | Total Virginia | | | 2,999 | |
| | | | | | | | |
| | | | Washington — 5.5% | |
| | | | Education — 1.4% | |
| | 4,050 | | | Western Washington University, Housing & Dining System, Junior Lien, Series A, Rev., AMBAC, 5.50%, 10/01/2022 | | | 4,481 | |
| | | | | | | | |
| | | | General Obligation — 2.5% | |
| | | | State of Washington, Various Purpose, | | | | |
| | 5,745 | | | Series A, GO, 5.00%, 08/01/2041 | | | 6,521 | |
| | 1,000 | | | Series C, GO, 5.00%, 02/01/2034 | | | 1,146 | |
| | | | | | | | |
| | | | | | | 7,667 | |
| | | | | | | | |
| | | | Prerefunded — 1.6% | |
| | 5,000 | | | Washington Health Care Facilities Authority, Multicare Health System, Series A, Rev., AGM, 5.00%, 08/15/2018 (p) | | | 5,081 | |
| | | | | | | | |
| | | | Utility — 0.0% (g) | |
| | 25 | | | Energy Northwest, Electric Revenue, Columbia Generating Station, Series A, Rev., 5.00%, 07/01/2018 | | | 25 | |
| | | | | | | | |
| | | | Total Washington | | | 17,254 | |
| | | | | | | | |
| | | | Total Municipal Bonds
(Cost $290,401) | | | 302,974 | |
| | | | | | | | |
SEE NOTES TO FINANCIAL STATEMENTS.
| | | | | | |
| | | |
| 44 | | | | J.P. MORGAN MUNICIPAL BOND FUNDS | | FEBRUARY 28, 2018 |
| | | | | | | | |
SHARES | | | SECURITY DESCRIPTION | | VALUE($) | |
| | Short-Term Investment — 3.1% | |
| | | | Investment Company — 3.1% | |
| | 9,885 | | | JPMorgan U.S. Government Money Market Fund, Institutional Class Shares, 1.25% (b) (l)
(Cost $9,885) | | | 9,885 | |
| | | | | | | | |
| | | | Total Investments — 99.0%
(Cost $300,286) | | | 312,859 | |
| | | | Other Assets in Excess of Liabilities — 1.0% | | | 3,166 | |
| | | | | | | | |
| | | | NET ASSETS — 100.0% | | $ | 316,025 | |
| | | | | | | | |
Percentages indicated are based on net assets.
| | | | | | | | | | | | | | | | | | | | |
| Futures contracts outstanding as of February 28, 2018: | |
| DESCRIPTION | | NUMBER OF
CONTRACTS | | | EXPIRATION
DATE | | | TRADING CURRENCY | | | NOTIONAL AMOUNT ($) | | | VALUE AND
UNREALIZED
APPRECIATION
(DEPRECIATION) ($) | |
Short Contracts | |
U.S. Treasury 10 Year Note | | | (55 | ) | | | 06/2018 | | | | USD | | | | (6,604 | ) | | | (12 | ) |
| | | | | | | | | | | | | | | | | | | | |
SEE NOTES TO FINANCIAL STATEMENTS.
| | | | | | | | |
| | | |
| FEBRUARY 28, 2018 | | J.P. MORGAN MUNICIPAL BOND FUNDS | | | | | 45 | |
JPMorgan Ultra-Short Municipal Fund
SCHEDULE OF PORTFOLIO INVESTMENTS
AS OF FEBRUARY 28, 2018
(Amounts in thousands)
| | | | | | | | |
PRINCIPAL
AMOUNT($) | | | SECURITY DESCRIPTION | | VALUE($) | |
| | Municipal Bonds — 94.6% (t) | | | | |
| | | | Alabama — 0.2% | | | | |
| | | | Education — 0.0% (g) | | | | |
| | | | Alabama Public School & College Authority, | | | | |
| | 55 | | | Series A, Rev., 5.00%, 05/01/2018 | | | 55 | |
| | 25 | | | Series B, Rev., 5.00%, 03/01/2018 | | | 25 | |
| | 20 | | | Series B, Rev., 5.00%, 05/01/2018 | | | 20 | |
| | 25 | | | Series C, Rev., 5.00%, 09/01/2018 | | | 26 | |
| | 45 | | | Madison County Board of Education, Tax Anticipation Warrants, Rev., 5.00%, 09/01/2018 | | | 46 | |
| | 70 | | | University of Montevallo, Rev., 2.00%, 05/01/2018 | | | 70 | |
| | | | | | | | |
| | | �� | | | | 242 | |
| | | | | | | | |
| | | | General Obligation — 0.0% (g) | | | | |
| | 25 | | | City of Orange Beach, GO, AGC, 5.00%, 10/01/2018 | | | 26 | |
| | 20 | | | County of Baldwin, GO, 4.00%, 06/01/2018 | | | 20 | |
| | 40 | | | County of Mobile, Series A, GO, 4.00%, 06/01/2018 | | | 40 | |
| | | | | | | | |
| | | | | | | 86 | |
| | | | | | | | |
| | | | Housing — 0.2% | | | | |
| | 2,890 | | | Alabama Housing Finance Authority Multi-Family Housing, Summit Ridge Apartments Project, Series D, Rev., FHA, 1.35%, 07/01/2019 (z) | | | 2,873 | |
| | | | | | | | |
| | | | Prerefunded — 0.0% (g) | |
| | | | Madison County Board of Education, Tax Anticipation Warrants, | | | | |
| | 25 | | | Rev., AGC, 4.80%, 09/01/2018 (p) | | | 25 | |
| | 45 | | | Rev., AGC, 5.13%, 09/01/2018 (p) | | | 46 | |
| | 20 | | | Smiths Water & Sewer Authority, Series 2009, Rev., AGC, 5.00%, 06/01/2018 (p) | | | 20 | |
| | | | | | | | |
| | | | | | | 91 | |
| | | | | | | | |
| | | | Utility — 0.0% (g) | |
| | 400 | | | The Black Belt Energy Gas District Gas Supply, Series A, Rev., LIQ: Royal Bank of Canada, 4.00%, 06/01/2021 (z) | | | 423 | |
| | | | | | | | |
| | | | Total Alabama | | | 3,715 | |
| | | | | | | | |
| | | | Alaska — 0.0% (g) | |
| | | | General Obligation — 0.0% (g) | |
| | 35 | | | Borough of North Slope, Series A, GO, 5.50%, 06/30/2018 | | | 35 | |
| | 40 | | | Municipality of Anchorage, General Purpose, Series B, GO, 5.00%, 08/01/2018 | | | 41 | |
| | | | | | | | |
| | | | | | | 76 | |
| | | | | | | | |
| | | | | | | | |
PRINCIPAL
AMOUNT($) | | | SECURITY DESCRIPTION | | VALUE($) | |
| | | | | | | | |
| | | | Housing — 0.0% (g) | |
| | 50 | | | Alaska Housing Finance Corp., State Capital Project Bonds II, Series A, Rev., 3.00%, 06/01/2018 | | | 50 | |
| | | | | | | | |
| | | | Total Alaska | | | 126 | |
| | | | | | | | |
| | | | Arizona — 0.4% | |
| | | | Certificate of Participation/Lease — 0.2% | |
| | | | Arizona State University, | | | | |
| | 750 | | | Series 2018A, COP, 5.00%, 06/01/2018 | | | 757 | |
| | 1,450 | | | Series 2018A, COP, 5.00%, 06/01/2019 | | | 1,513 | |
| | 1,000 | | | Series 2018A, COP, 5.00%, 06/01/2020 | | | 1,074 | |
| | 30 | | | County of Maricopa, COP, 5.00%, 07/01/2018 | | | 30 | |
| | | | | | | | |
| | | | | | | 3,374 | |
| | | | | | | | |
| | | | Education — 0.0% (g) | |
| | | | University of Arizona, | | | | |
| | 45 | | | Series A, Rev., 5.00%, 06/01/2018 | | | 45 | |
| | 1,000 | | | Series B, Rev., 5.00%, 07/01/2018 | | | 1,012 | |
| | | | | | | | |
| | | | | | | 1,057 | |
| | | | | | | | |
| | | | General Obligation — 0.1% | |
| | 25 | | | City of Casa Grande, Series��A, GO, 2.00%, 08/01/2018 | | | 25 | |
| | 60 | | | City of Flagstaff, Series B, GO, 4.00%, 07/01/2018 | | | 61 | |
| | 25 | | | City of Goodyear, GO, AGM, 6.00%, 07/01/2018 | | | 25 | |
| | | | City of Mesa, | | | | |
| | 20 | | | GO, AGM, 4.55%, 07/01/2028 | | | 20 | |
| | 40 | | | GO, NATL-RE, 5.00%, 07/01/2018 (p) | | | 41 | |
| | 15 | | | City of Phoenix, Series C, GO, 4.00%, 07/01/2018 | | | 15 | |
| | 150 | | | Estrella Mountain Ranch Community Facilities District, GO, AGM, 4.00%, 07/15/2018 | | | 151 | |
| | 20 | | | Madison Elementary School District No. 38, Series A, GO, 3.00%, 07/01/2018 | | | 20 | |
| | 65 | | | Maricopa County Community College District, Series C, GO, 5.00%, 07/01/2018 | | | 66 | |
| | | | Maricopa County Union High School District No. 201, School Improvement, | | | | |
| | 375 | | | GO, 3.00%, 07/01/2018 | | | 377 | |
| | 275 | | | GO, 3.00%, 07/01/2019 | | | 280 | |
| | 30 | | | Pima County Unified School District No. 1, GO, 4.00%, 07/01/2018 | | | 30 | |
| | 115 | | | Summit Fire & Medical District, GO, 2.00%, 07/01/2018 | | | 115 | |
| | | | | | | | |
| | | | | | | 1,226 | |
| | | | | | | | |
SEE NOTES TO FINANCIAL STATEMENTS.
| | | | | | |
| | | |
| 46 | | | | J.P. MORGAN MUNICIPAL BOND FUNDS | | FEBRUARY 28, 2018 |
| | | | | | | | |
PRINCIPAL
AMOUNT($) | | | SECURITY DESCRIPTION | | VALUE($) | |
| | Municipal Bonds — continued | |
| | | | Industrial Development Revenue/Pollution Control Revenue — 0.1% | |
| | 1,100 | | | Coconino County Pollution Control Corp., Nevada Power Company Projects, Series B, Rev., 1.60%, 05/21/2020 (z) | | | 1,090 | |
| | | | | | | | |
| | | | Other Revenue — 0.0% (g) | |
| | 30 | | | City of Casa Grande, Rev., 5.00%, 04/01/2018 | | | 30 | |
| | 20 | | | City of Flagstaff, Rev., 5.00%, 07/01/2018 | | | 20 | |
| | 40 | | | City of Phoenix, Civic Improvement Corp., Series A, Rev., 4.00%, 07/01/2018 | | | 40 | |
| | 20 | | | Gilbert Public Facilities Municipal Property Corp., Revenue Refunding Bonds, Rev., 4.00%, 07/01/2019 | | | 21 | |
| | 450 | | | Santa Cruz County Jail District, Rev., AGM, 2.00%, 07/01/2018 | | | 451 | |
| | 45 | | | Scottsdale Municipal Property Corp., Excise Tax, Rev., 5.00%, 07/01/2018 | | | 46 | |
| | 20 | | | Scottsdale Preserve Authority, Excise Tax, Rev., 4.00%, 07/01/2018 | | | 20 | |
| | | | | | | | |
| | | | | | | 628 | |
| | | | | | | | |
| | | | Prerefunded — 0.0% (g) | |
| | 35 | | | Arizona Department of Transportation State Highway Fund, Series B, Rev., 5.00%, 07/01/2018 (p) | | | 35 | |
| | 20 | | | Scottsdale Municipal Property Corp., Excise Tax, Water & Sewer Development Project, Series A, Rev., 5.00%, 07/01/2018 (p) | | | 20 | |
| | 40 | | | State of Arizona, Series A, COP, AGM, 5.00%, 03/01/2018 (p) | | | 40 | |
| | | | | | | | |
| | | | | | | 95 | |
| | | | | | | | |
| | | | Transportation — 0.0% (g) | |
| | | | Arizona Department of Transportation State Highway Fund, | | | | |
| | 30 | | | Series A, Rev., 5.00%, 07/01/2018 | | | 30 | |
| | 400 | | | Series A, Rev., 5.00%, 07/01/2020 | | | 431 | |
| | 20 | | | Arizona Transportation Board, Series A, Rev., GRAN, 4.00%, 07/01/2018 | | | 20 | |
| | | | Arizona Transportation Board, Maricopa County Regional Area Road Fund, | | | | |
| | 30 | | | Rev., 5.00%, 07/01/2018 | | | 31 | |
| | 20 | | | Series 2009, Rev., 5.00%, 07/01/2018 | | | 20 | |
| | 20 | | | Maricopa County, Regional Public Transportation Authority, Excise Tax Revenue, Public Transportation Fund, Series A, Rev., 5.00%, 07/01/2018 | | | 20 | |
| | | | | | | | |
| | | | | | | 552 | |
| | | | | | | | |
| | | | | | | | |
PRINCIPAL
AMOUNT($) | | | SECURITY DESCRIPTION | | VALUE($) | |
| | | | | | | | |
| | | | Utility — 0.0% (g) | |
| | | | Salt River Project Agricultural Improvement & Power District, Electric System, | | | | |
| | 20 | | | Series A, Rev., 5.00%, 12/01/2018 | | | 21 | |
| | 25 | | | Series B, Rev., 4.00%, 12/01/2018 | | | 25 | |
| | | | | | | | |
| | | | | | | 46 | |
| | | | | | | | |
| | | | Water & Sewer — 0.0% (g) | |
| | | | Arizona Water Infrastructure Finance Authority, Water Quality, | | | | |
| | 540 | | | Rev., 4.00%, 10/01/2020 (p) | | | 571 | |
| | 10 | | | Series A, Rev., 5.00%, 10/01/2018 | | | 10 | |
| | | | City of Phoenix, Civic Improvement Corp., | | | | |
| | 25 | | | Rev., 5.00%, 07/01/2018 | | | 25 | |
| | 20 | | | Rev., 5.00%, 07/01/2018 | | | 20 | |
| | | | City of Tucson, Water System, | | | | |
| | 25 | | | Rev., 4.00%, 07/01/2018 | | | 25 | |
| | 35 | | | Series A, Rev., 5.00%, 07/01/2018 | | | 36 | |
| | 35 | | | County of Pima, Sewer System, Series B, Rev., 5.00%, 07/01/2018 | | | 35 | |
| | 45 | | | Scottsdale Municipal Property Corp., Excise Tax, Water & Sewer Development Project, Series A, Rev., 5.00%, 07/01/2018 | | | 46 | |
| | | | | | | | |
| | | | | | | 768 | |
| | | | | | | | |
| | | | Total Arizona | | | 8,836 | |
| | | | | | | | |
| | | | Arkansas — 0.2% | |
| | | | Education — 0.0% (g) | |
| | 120 | | | Arkansas Technical University, Athletic Enterprises, Series A, Rev., 3.00%, 06/01/2019 | | | 122 | |
| | | | Arkansas Technical University, Student Fee, | | | | |
| | 200 | | | Series A, Rev., 3.00%, 06/01/2018 | | | 201 | |
| | 200 | | | Series A, Rev., 3.00%, 06/01/2019 | | | 203 | |
| | | | | | | | |
| | | | | | | 526 | |
| | | | | | | | |
| | | | General Obligation — 0.0% (g) | |
| | 200 | | | City of Fayetteville, Library Improvement, GO, 3.00%, 01/01/2020 | | | 204 | |
| | 20 | | | City of Little Rock, GO, 4.00%, 03/01/2019 | | | 21 | |
| | | | | | | | |
| | | | | | | 225 | |
| | | | | | | | |
| | | | Housing — 0.0% (g) | |
| | | | Arkansas Technical University, Housing System, | | | | |
| | 210 | | | Series A, Rev., 3.00%, 06/01/2018 | | | 211 | |
| | 225 | | | Series A, Rev., 3.00%, 06/01/2019 | | | 229 | |
| | | | | | | | |
| | | | | | | 440 | |
| | | | | | | | |
SEE NOTES TO FINANCIAL STATEMENTS.
| | | | | | | | |
| | | |
| FEBRUARY 28, 2018 | | J.P. MORGAN MUNICIPAL BOND FUNDS | | | | | 47 | |
JPMorgan Ultra-Short Municipal Fund
SCHEDULE OF PORTFOLIO INVESTMENTS
AS OF FEBRUARY 28, 2018 (continued)
(Amounts in thousands)
| | | | | | | | |
PRINCIPAL
AMOUNT($) | | | SECURITY DESCRIPTION | | VALUE($) | |
| | Municipal Bonds — continued | |
| | | �� | Other Revenue — 0.1% | |
| | 500 | | | Arkansas Development Finance Authority, 900 West Capitol Building Project, Rev., 3.00%, 04/01/2021 | | | 513 | |
| | | | City of Little Rock, | | | | |
| | 300 | | | Rev., 2.00%, 10/01/2018 | | | 301 | |
| | 500 | | | Rev., 3.00%, 10/01/2019 | | | 510 | |
| | | | | | | | |
| | | | | | | 1,324 | |
| | | | | | | | |
| | | | Water & Sewer — 0.1% | |
| | 100 | | | City of Little Rock, Water Reclamation System, Rev., 1.15%, 10/01/2018 | | | 99 | |
| | | | Northwest Arkansas Conservation Authority, Wastewater, | | | | |
| | 125 | | | Rev., 3.00%, 03/01/2018 | | | 125 | |
| | 220 | | | Rev., 3.00%, 03/01/2019 | | | 224 | |
| | 280 | | | Rev., 3.00%, 03/01/2020 | | | 294 | |
| | | | | | | | |
| | | | | | | 742 | |
| | | | | | | | |
| | | | Total Arkansas | | | 3,257 | |
| | | | | | | | |
| | | | California — 2.1% | |
| | | | Education — 0.3% | |
| | 6,000 | | | University of California, Series AL-2, Rev., VRDO, 1.05%, 03/08/2018 (z) | | | 6,000 | |
| | 20 | | | University of California, Limited Project, Series E, Rev., 4.00%, 05/15/2018 | | | 20 | |
| | | | | | | | |
| | | | | | | 6,020 | |
| | | | | | | | |
| | | | General Obligation — 0.2% | |
| | 20 | | | Beverly Hills Unified School District, GO, 5.50%, 05/01/2018 | | | 20 | |
| | 25 | | | City & County of San Francisco, Public Health & Safety, Series A, GO, 5.00%, 06/15/2018 | | | 25 | |
| | 20 | | | Grossmont-Cuyamaca Community College District, Election of 2012, Series 2012A, GO, 4.00%, 08/01/2018 | | | 20 | |
| | 1,710 | | | Hayward Unified School District, Election of 2014, GO, AGM, 3.00%, 08/01/2018 | | | 1,721 | |
| | 45 | | | Los Angeles Community College District, Series C, GO, 5.00%, 08/01/2018 | | | 46 | |
| | 250 | | | Mount San Antonio Community College District, GO, BAN, Zero Coupon, 04/01/2022 | | | 231 | |
| | 25 | | | Pittsburg Unified School District, GO, AGM, 4.00%, 08/01/2018 | | | 25 | |
| | 20 | | | San Diego Community College District, GO, 4.00%, 08/01/2018 | | | 20 | |
| | 20 | | | San Francisco Unified School District, Proposition A, Election of 2011, Series A, GO, 5.00%, 06/15/2018 | | | 20 | |
| | 500 | | | San Leandro Unified School District, GO, 3.00%, 08/01/2018 | | | 504 | |
| | | | | | | | |
PRINCIPAL
AMOUNT($) | | | SECURITY DESCRIPTION | | VALUE($) | |
| | | | | | | | |
| | | | General Obligation — continued | |
| | 750 | | | San Leandro Unified School District, Election of 2016, Series A, GO, 3.00%, 08/01/2018 | | | 755 | |
| | 40 | | | San Ramon Valley Unified School District, GO, 4.00%, 08/01/2018 | | | 41 | |
| | | | State of California, Economic Recovery, | | | | |
| | 25 | | | Series A, GO, 5.00%, 07/01/2018 (p) | | | 26 | |
| | 20 | | | Series A, GO, 5.00%, 07/01/2018 (p) | | | 20 | |
| | 25 | | | State of California, Various Purpose, GO, 5.00%, 04/01/2018 | | | 25 | |
| | | | | | | | |
| | | | | | | 3,499 | |
| | | | | | | | |
| | | | Hospital — 0.0% (g) | |
| | 100 | | | California Public Finance Authority, Henry Mayo Newhall Hospital, Rev., 5.00%, 10/15/2020 | | | 107 | |
| | | | Pioneers Memorial Healthcare District, | | | | |
| | 255 | | | Rev., 3.00%, 10/01/2019 | | | 254 | |
| | 265 | | | Rev., 3.00%, 10/01/2020 | | | 263 | |
| | | | | | | | |
| | | | | | | 624 | |
| | | | | | | | |
| | | | Housing — 0.1% | |
| | 2,480 | | | California Municipal Finance Authority, Providence House Oakland, Rev., 1.10%, 05/01/2018 (z) | | | 2,479 | |
| | | | | | | | |
| | | | Industrial Development Revenue/Pollution Control Revenue — 0.5% | |
| | 10,000 | | | California Pollution Control Financing Authority, Solid Waste Disposal, Republic Services, Inc. Project, Series 2010B, Rev., 1.45%, 05/01/2018 (e) (z) | | | 9,990 | |
| | | | | | | | |
| | | | Other Revenue — 0.1% | |
| | 1,000 | | | California Infrastructure & Economic Development Bank, The J. Paul Getty Trust, Series A-4, Rev., (ICE LIBOR USD 3 Month + 0.37%, 8.00% Cap), 1.61%, 04/02/2018 (aa) | | | 1,014 | |
| | 75 | | | California Statewide Communities Development Authority, Front Porch Communities & Services, Rev., 5.00%, 04/01/2020 | | | 80 | |
| | 20 | | | Los Angeles Convention & Exhibit Center Authority, Series A, Rev., 4.50%, 08/15/2018 (p) | | | 20 | |
| | 35 | | | Los Angeles County Public Works Financing Authority, Los Angeles County Regional Park & Open Space, Rev., AGM, 5.25%, 10/01/2018 | | | 36 | |
| | 25 | | | Riverside County Redevelopment Successor Agency, Jurupa Valley Redevelopment Project, Series B, Rev., AGM, 4.00%, 10/01/2018 | | | 26 | |
| | | | | | | | |
| | | | | | | 1,176 | |
| | | | | | | | |
SEE NOTES TO FINANCIAL STATEMENTS.
| | | | | | |
| | | |
| 48 | | | | J.P. MORGAN MUNICIPAL BOND FUNDS | | FEBRUARY 28, 2018 |
| | | | | | | | |
PRINCIPAL
AMOUNT($) | | | SECURITY DESCRIPTION | | VALUE($) | |
| | Municipal Bonds — continued | |
| | | | Prerefunded — 0.0% (g) | |
| | 20 | | | Cajon Valley Union School District, Election of 2008, Series 2008A, GO, 4.00%, 08/01/2018 (p) | | | 20 | |
| | 80 | | | Imperial Irrigation District Electric System, Series A, Rev., 5.25%, 11/01/2018 (p) | | | 82 | |
| | 40 | | | Kern County Water Agency Improvement District No. 4, Series A, COP, AGC, 5.00%, 05/01/2018 (p) | | | 40 | |
| | 40 | | | State of California, Department of Water Resources, Central Valley Project, Rev., 5.00%, 06/01/2018 (p) | | | 40 | |
| | | | State of California, Department of Water Resources, Power Supply, | | | | |
| | 20 | | | Series F-3, Rev., 5.00%, 05/01/2018 (p) | | | 20 | |
| | 30 | | | Series H, Rev., AGM, 4.25%, 05/01/2018 (p) | | | 31 | |
| | 20 | | | Series H, Rev., 5.00%, 05/01/2018 (p) | | | 20 | |
| | 20 | | | Series H, Rev., AGM, 5.00%, 05/01/2018 (p) | | | 20 | |
| | | | | | | | |
| | | | | | | 273 | |
| | | | | | | | |
| | | | Transportation — 0.0% (g) | |
| | 25 | | | Bay Area Toll Authority, Rev., 4.00%, 04/01/2018 | | | 25 | |
| | 650 | | | Bay Area Toll Authority, Toll Bridge, San Francisco Bay Area, Series C, Rev., 1.88%, 04/01/2019 (z) | | | 652 | |
| | 30 | | | City of Los Angeles, Department of International Airports, Series A, Rev., 5.00%, 05/15/2018 | | | 30 | |
| | 40 | | | Riverside County Transportation Commission, Limited Tax, Series A, Rev., 5.00%, 06/01/2018 | | | 41 | |
| | 20 | | | San Diego County Regional Transportation Commission, Sales Tax, Series B, Rev., 4.00%, 04/01/2018 | | | 20 | |
| | | | | | | | |
| | | | | | | 768 | |
| | | | | | | | |
| | | | Utility — 0.3% | |
| | 6,900 | | | California Infrastructure & Economic Development Bank, Pacific Gas & Electric Co., Series G, Rev., 1.05%, 12/01/2018 | | | 6,865 | |
| | 20 | | | Los Angeles Department of Water & Power, Power System, Series A, Rev., 5.00%, 07/01/2018 | | | 20 | |
| | | | | | | | |
| | | | | | | 6,885 | |
| | | | | | | | |
| | | | Water & Sewer — 0.6% | |
| | 12,000 | | | California State Department of Water Resources, Central Valley Project Water System, Series AU, Rev., (Dow Jones US Mid Cap Sofware Index GICS Level 4 USD + 0.22%, 8.00% Cap), 1.31%, 03/08/2018 (aa) | | | 12,114 | |
| | | | | | | | |
PRINCIPAL
AMOUNT($) | | | SECURITY DESCRIPTION | | VALUE($) | |
| | | | | | | | |
| | | | Water & Sewer — continued | |
| | 20 | | | Chino Hills Financing Authority, Rev., 4.00%, 06/01/2018 | | | 20 | |
| | | | State of California, Department of Water Resources, Power Supply, | | | | |
| | 20 | | | Series G-11, Rev., 4.70%, 05/01/2018 | | | 20 | |
| | 25 | | | Series G-11, Rev., 4.88%, 05/01/2018 | | | 25 | |
| | 60 | | | Series K, Rev., 5.00%, 05/01/2018 | | | 61 | |
| | 20 | | | Series N, Rev., 5.00%, 05/01/2018 | | | 20 | |
| | | | | | | | |
| | | | | | | 12,260 | |
| | | | | | | | |
| | | | Total California | | | 43,974 | |
| | | | | | | | |
| | | | Colorado — 1.2% | |
| | | | General Obligation — 0.1% | |
| | 120 | | | Adams 12 Five Star Schools, GO, 5.00%, 12/15/2018 | | | 123 | |
| | | | City of Aurora, Sterling Hills West Metropolitan District, | | | | |
| | 100 | | | GO, 5.00%, 12/01/2018 | | | 102 | |
| | 110 | | | GO, 5.00%, 12/01/2019 | | | 115 | |
| | 100 | | | GO, 5.00%, 12/01/2020 | | | 106 | |
| | 255 | | | Denver City & County School District No. 1, Series B, GO, 4.00%, 12/01/2019 (p) | | | 265 | |
| | 20 | | | Douglas County School District No. Re-1, Douglas & Elbert Counties, Series B, GO, 5.00%, 12/15/2018 | | | 21 | |
| | 20 | | | Mesa County Valley, School District No. 51, Grand Junction, GO, 4.00%, 12/01/2018 | | | 20 | |
| | 25 | | | Pueblo County School District No. 70, GO, NATL-RE, 5.00%, 12/01/2018 | | | 26 | |
| | | | | | | | |
| | | | | | | 778 | |
| | | | | | | | |
| | | | Hospital — 0.1% | |
| | | | Colorado Health Facilities Authority, Frasier Meadows Retirement Community Project, | | | | |
| | 395 | | | Series 2017B, Rev., 5.00%, 05/15/2021 | | | 426 | |
| | 345 | | | Series A, Rev., 5.00%, 05/15/2018 | | | 347 | |
| | | | Colorado Health Facilities Authority, Parkview Medical Center, Inc. Project, | | | | |
| | 100 | | | Rev., 3.00%, 09/01/2018 | | | 101 | |
| | 310 | | | Rev., 3.00%, 09/01/2019 | | | 315 | |
| | 50 | | | Colorado Health Facilities Authority, Sisters of Charity of Leavenworth Health System, Inc., Series A, Rev., 3.88%, 01/01/2019 | | | 51 | |
| | | | Colorado Health Facilities Authority, The Evangelical Lutheran Good Samaritan Society Project, | | | | |
| | 500 | | | Rev., 5.00%, 06/01/2018 | | | 504 | |
| | 200 | | | Rev., 5.00%, 06/01/2019 | | | 207 | |
| | 400 | | | Rev., 5.00%, 06/01/2020 | | | 422 | |
SEE NOTES TO FINANCIAL STATEMENTS.
| | | | | | | | |
| | | |
| FEBRUARY 28, 2018 | | J.P. MORGAN MUNICIPAL BOND FUNDS | | | | | 49 | |
JPMorgan Ultra-Short Municipal Fund
SCHEDULE OF PORTFOLIO INVESTMENTS
AS OF FEBRUARY 28, 2018 (continued)
(Amounts in thousands)
| | | | | | | | |
PRINCIPAL
AMOUNT($) | | | SECURITY DESCRIPTION | | VALUE($) | |
| | Municipal Bonds — continued | |
| | | | Hospital — continued | |
| | 380 | | | University of Colorado Hospital Authority, Series C-1, Rev., 4.00%, 03/01/2020 (z) | | | 393 | |
| | | | | | | | |
| | | | | | | 2,766 | |
| | | | | | | | |
| | | | Housing — 0.3% | |
| | 5,000 | | | Adams County Colorado Housing Authority Multifamily Housing, Baker School Apartment Project, Rev., 1.50%, 11/01/2019 (z) | | | 4,982 | |
| | | | | | | | |
| | | | Other Revenue — 0.3% | |
| | 425 | | | Pueblo Urban Renewal Authority, Sales Tax Increment, Regional Tourism Act Project, Rev., 2.25%, 06/01/2018 | | | 424 | |
| | 6,000 | | | State of Colorado, General Fund, Series A, Rev., TRAN, 4.00%, 06/27/2018 | | | 6,051 | |
| | | | | | | | |
| | | | | | | 6,475 | |
| | | | | | | | |
| | | | Prerefunded — 0.0% (g) | |
| | 20 | | | Rio Blanco County School District No. Re-1, GO, 5.00%, 12/01/2018 (p) | | | 21 | |
| | | | | | | | |
| | | | Transportation — 0.0% (g) | |
| | 35 | | | Denver City & County, Department of Aviation Airport System, Series A, Rev., 5.00%, 11/15/2018 | | | 36 | |
| | 500 | | | E-470 Public Highway Authority, Senior LIBOR Index, Series A, Rev., (ICE LIBOR USD 1 Month + 0.90%, 10.00% Cap), 1.99%, 03/08/2018 (aa) | | | 503 | |
| | 25 | | | Regional Transportation District, Sales Tax, Series A, Rev., 5.25%, 11/01/2018 | | | 26 | |
| | | | | | | | |
| | | | | | | 565 | |
| | | | | | | | |
| | | | Utility — 0.4% | |
| | 8,020 | | | City of Colorado Springs, Utilities System Improvement & Refunding, Series B, Rev., VRDO, 1.08%, 03/08/2018 (z) | | | 8,020 | |
| | 200 | | | Colorado Water Resources & Power Development Authority, Clean Water, Series A, Rev., 5.00%, 03/01/2020 | | | 213 | |
| | | | | | | | |
| | | | | | | 8,233 | |
| | | | | | | | |
| | | | Water & Sewer — 0.0% (g) | |
| | 100 | | | City of Boulder, Water & Sewer Revenue, Series 2012, Rev., 5.00%, 12/01/2018 | | | 103 | |
| | 25 | | | Metro Wastewater Reclamation District, Sewer Revenue, Series A, Rev., 5.00%, 04/01/2018 | | | 25 | |
| | | | | | | | |
| | | | | | | 128 | |
| | | | | | | | |
| | | | Total Colorado | | | 23,948 | |
| | | | | | | | |
| | | | | | | | |
PRINCIPAL
AMOUNT($) | | | SECURITY DESCRIPTION | | VALUE($) | |
| | | | | | | | |
| | | | Connecticut — 3.5% | |
| | | | Education — 0.0% (g) | |
| | 470 | | | State of Connecticut, Health & Educational Facility Authority, Ascension Health Credit Group, Series B, Rev., 1.65%, 03/01/2019 (z) | | | 469 | |
| | | | | | | | |
| | | | General Obligation — 2.7% | |
| | 8,000 | | | City of Danbury, GO, BAN, 2.00%, 07/19/2018 | | | 8,021 | |
| | 115 | | | City of Hartford, Series B, GO, 4.00%, 04/01/2020 (p) | | | 120 | |
| | | | City of New Haven, | | | | |
| | 5,300 | | | GO, TAN, 2.50%, 05/15/2018 | | | 5,309 | |
| | 100 | | | Series A, GO, 3.00%, 08/01/2018 | | | 100 | |
| | 750 | | | Series A, GO, 5.25%, 08/01/2019 | | | 784 | |
| | | | City of Waterbury, | | | | |
| | 430 | | | Series A, GO, 3.00%, 11/15/2018 | | | 434 | |
| | 485 | | | Series A, GO, 3.00%, 11/15/2019 | | | 494 | |
| | 265 | | | Series B, GO, 3.00%, 09/01/2018 | | | 267 | |
| | 325 | | | Series B, GO, 3.00%, 09/01/2019 | | | 330 | |
| | 215 | | | City of West Haven, Series A, GO, 3.00%, 11/01/2018 | | | 215 | |
| | 12,000 | | | Hartford County, Connecticut Metropolitan District, Series B, GO, BAN, 3.00%, 08/01/2018 | | | 12,053 | |
| | | | State of Connecticut, | | | | |
| | 160 | | | Series B, GO, AMBAC, 5.25%, 06/01/2018 | | | 161 | |
| | 5,235 | | | Series C, GO, VRDO, 1.22%, 03/08/2018 (z) | | | 5,235 | |
| | 475 | | | Series C, GO, 5.00%, 12/01/2020 | | | 498 | |
| | 150 | | | Series E, GO, 5.00%, 09/01/2019 | | | 157 | |
| | 11,575 | | | Series F, GO, 5.00%, 11/15/2019 | | | 12,155 | |
| | 200 | | | Series G, GO, 5.00%, 11/01/2021 | | | 218 | |
| | 7,000 | | | Tender Option Bond Trust Receipts/Certificates, Series 2017-YX1047, GO, VRDO, LIQ: Barclays Bank plc, 1.15%, 03/08/2018 (e) (z) | | | 7,000 | |
| | 20 | | | Town of Groton Court, Lot A, GO, 4.00%, 10/01/2018 | | | 20 | |
| | 2,250 | | | Town of Hamden, GO, BAN, 3.00%, 08/23/2018 | | | 2,268 | |
| | 15 | | | Town of New Canaan, Series A, GO, 5.00%, 04/01/2018 | | | 15 | |
| | | | | | | | |
| | | | | | | 55,854 | |
| | | | | | | | |
| | | | Housing — 0.6% | |
| | | | Connecticut Housing Finance Authority, Housing Mortgage Finance Program, | | | | |
| | 4,905 | | | Series C-1, Rev., VRDO, 1.07%, 03/08/2018 (z) | | | 4,905 | |
| | 5,080 | | | Series F-5, Rev., AMT, GNMA/FNMA/FHLMC, 1.30%, 11/15/2018 (z) | | | 5,071 | |
SEE NOTES TO FINANCIAL STATEMENTS.
| | | | | | |
| | | |
| 50 | | | | J.P. MORGAN MUNICIPAL BOND FUNDS | | FEBRUARY 28, 2018 |
| | | | | | | | |
PRINCIPAL
AMOUNT($) | | | SECURITY DESCRIPTION | | VALUE($) | |
| | Municipal Bonds — continued | |
| | | | Housing — continued | |
| | 910 | | | Norwalk Housing Authority, Multifamily Housing, Cedar Court Apartments Project, Rev., 1.25%, 06/01/2018 (z) | | | 909 | |
| | | | | | | | |
| | | | | | | 10,885 | |
| | | | | | | | |
| | | | Other Revenue — 0.2% | |
| | 25 | | | State of Connecticut, Revolving Fund, Series A, Rev., 4.00%, 06/01/2018 | | | 25 | |
| | 4,550 | | | Tender Option Bond Trust Receipts/Certificates, Series 2017-YX1077, Rev., VRDO, LIQ: Barclays Bank plc, 1.15%, 03/08/2018 (e) (z) | | | 4,550 | |
| | | | | | | | |
| | | | | | | 4,575 | |
| | | | | | | | |
| | | | Prerefunded — 0.0% (g) | |
| | 150 | | | Connecticut State Health & Educational Facility Authority, Rev., BHAC-CR NATL-RE, 5.00%, 07/01/2018 (p) | | | 152 | |
| | 100 | | | Connecticut State Health & Educational Facility Authority, The Loomis Chafee School, Series G, Rev., 4.50%, 07/01/2018 (p) | | | 101 | |
| | 100 | | | South Central Connecticut Regional Water Authority, Water System, Rev., NATL-RE, 5.00%, 08/01/2018 (p) | | | 102 | |
| | 25 | | | State of Connecticut, Health & Educational Facility Authority, Quinnipiac University, Rev., NATL-RE, 5.00%, 07/01/2018 (p) | | | 25 | |
| | 30 | | | Town of Old Saybrook, GO, 3.00%, 11/01/2018 (p) | | | 30 | |
| | | | | | | | |
| | | | | | | 410 | |
| | | | | | | | |
| | | | Total Connecticut | | | 72,193 | |
| | | | | | | | |
| | | | Delaware — 0.0% (g) | |
| | | | Housing — 0.0% (g) | |
| | 30 | | | Delaware State Housing Authority, Senior Single Family Mortgage, Series A, Rev., GNMA/FNMA/FHLMC, 3.90%, 07/01/2018 | | | 30 | |
| | | | | | | | |
| | | | Prerefunded — 0.0% (g) | |
| | 45 | | | Delaware Transportation Authority, Series A, Rev., 4.00%, 07/01/2018 (p) | | | 46 | |
| | | | | | | | |
| | | | Transportation — 0.0% (g) | |
| | | | Delaware Transportation Authority, | | | | |
| | 15 | | | Rev., 5.00%, 07/01/2018 | | | 15 | |
| | 40 | | | Series A, Rev., 5.00%, 07/01/2018 | | | 41 | |
| | | | | | | | |
| | | | | | | 56 | |
| | | | | | | | |
| | | | Utility — 0.0% (g) | |
| | 25 | | | Sustainable Energy Utility, Inc., Energy Efficiency, Rev., 4.00%, 09/15/2018 | | | 25 | |
| | | | | | | | |
| | | | Total Delaware | | | 157 | |
| | | | | | | | |
| | | | | | | | |
PRINCIPAL
AMOUNT($) | | | SECURITY DESCRIPTION | | VALUE($) | |
| | | | | | | | |
| | | | District of Columbia — 0.5% | |
| | | | General Obligation — 0.0% (g) | |
| | 20 | | | District of Columbia, Series F, GO, BHAC, 5.00%, 06/01/2018 | | | 20 | |
| | | | | | | | |
| | | | Other Revenue — 0.5% | |
| | 915 | | | District of Columbia, American Society, Series A, Rev., VRDO, LOC: Wells Fargo Bank NA, 1.22%, 03/08/2018 (z) | | | 915 | |
| | 20 | | | District of Columbia, Income Tax Revenue, Series C, Rev., 5.00%, 12/01/2018 | | | 21 | |
| | 20 | | | District of Columbia, Income Tax Secured, Series A, Rev., 5.00%, 12/01/2018 | | | 20 | |
| | 9,675 | | | District of Columbia, Medlantic/Helix Issue, Tranche II, Series A, Rev., VRDO, LOC: TD Bank NA, 1.08%, 03/08/2018 (z) | | | 9,675 | |
| | | | | | | | |
| | | | | | | 10,631 | |
| | | | | | | | |
| | | | Prerefunded — 0.0% (g) | |
| | 25 | | | District of Columbia, Children’s Hospital, Rev., AGM, 5.25%, 07/15/2018 (p) | | | 26 | |
| | | | | | | | |
| | | | Transportation — 0.0% (g) | |
| | 20 | | | Metropolitan Washington Airports Authority, Series B, Rev., 4.00%, 10/01/2018 | | | 20 | |
| | | | | | | | |
| | | | Total District of Columbia | | | 10,697 | |
| | | | | | | | |
| | | | Florida — 3.0% | |
| | | | Certificate of Participation/Lease — 0.0% (g) | |
| | 30 | | | Lee County School Board, Series B, COP, 5.00%, 08/01/2018 | | | 31 | |
| | 25 | | | Palm Beach County School District, Series B, COP, 5.00%, 08/01/2018 | | | 25 | |
| | 450 | | | Walton County District School Board, COP, 4.00%, 07/01/2018 | | | 454 | |
| | | | | | | | |
| | | | | | | 510 | |
| | | | | | | | |
| | | | Education — 0.0% (g) | |
| | 20 | | | Board of Governors of the University of Florida, Housing Facility Revenue, Series A, Rev., 5.00%, 05/01/2018 | | | 20 | |
| | | | Florida State Board of Education, Lottery, | | | | |
| | 20 | | | Series B, Rev., 5.00%, 07/01/2018 | | | 20 | |
| | 20 | | | Series C, Rev., 5.00%, 07/01/2018 | | | 20 | |
| | 50 | | | Volusia County School Board, Sales Tax, Rev., 5.00%, 10/01/2018 | | | 51 | |
| | | | | | | | |
| | | | | | | 111 | |
| | | | | | | | |
| | | | General Obligation — 0.1% | |
| | | | City of Lauderhill, | | | | |
| | 175 | | | GO, 3.00%, 01/01/2019 | | | 177 | |
| | 460 | | | GO, 3.00%, 01/01/2020 | | | 470 | |
| | 425 | | | GO, 3.00%, 01/01/2021 | | | 437 | |
SEE NOTES TO FINANCIAL STATEMENTS.
| | | | | | | | |
| | | |
| FEBRUARY 28, 2018 | | J.P. MORGAN MUNICIPAL BOND FUNDS | | | | | 51 | |
JPMorgan Ultra-Short Municipal Fund
SCHEDULE OF PORTFOLIO INVESTMENTS
AS OF FEBRUARY 28, 2018 (continued)
(Amounts in thousands)
| | | | | | | | |
PRINCIPAL
AMOUNT($) | | | SECURITY DESCRIPTION | | VALUE($) | |
| | Municipal Bonds — continued | |
| | | | General Obligation — continued | |
| | | | County of Miami-Dade, Building Better Communities Program, | | | | |
| | 55 | | | GO, 5.00%, 07/01/2018 | | | 56 | |
| | 25 | | | Series A, GO, 4.00%, 07/01/2018 | | | 25 | |
| | 20 | | | County of Miami-Dade, Double Barreled Aviation, Series 2010, GO, 5.00%, 07/01/2018 | | | 20 | |
| | 25 | | | County of Sarasota, Environmentally Sensitive, GO, 4.00%, 10/01/2018 (p) | | | 26 | |
| | | | Florida State Board of Education, Public Education Capital Outlay, | | | | |
| | 10 | | | Series B, GO, 5.00%, 06/01/2018 | | | 10 | |
| | 20 | | | Series D, GO, 5.00%, 06/01/2018 | | | 20 | |
| | 315 | | | Florida State Department of Transportation, Right-of-Way Acquisition & Bridge Construction, Series B, GO, 5.00%, 07/01/2018 | | | 319 | |
| | | | | | | | |
| | | | | | | 1,560 | |
| | | | | | | | |
| | | | Hospital — 1.0% | |
| | 15,000 | | | Highlands County Health Facilities Authority, Adventist Health System, Series A, Rev., VRDO, 1.08%, 03/08/2018 (z) | | | 15,000 | |
| | 6,240 | | | Orange County Health Facilities Authority, The Nemours Foundation Project, Series C-2, Rev., VRDO, LOC: TD Bank NA, 1.07%, 03/08/2018 (z) | | | 6,240 | |
| | | | | | | | |
| | | | | | | 21,240 | |
| | | | | | | | |
| | | | Housing — 0.1% | |
| | 2,000 | | | Pinellas County Housing Finance Authority, Multi-Family Housing, Boca Ciega Townhomes, Rev., 0.95%, 09/01/2018 | | | 1,996 | |
| | | | | | | | |
| | | | Industrial Development Revenue/Pollution Control Revenue — 0.7% | |
| | | | Florida Department of Environmental Protection, | | | | |
| | 20 | | | Series A, Rev., 5.00%, 07/01/2018 | | | 20 | |
| | 35 | | | Series A, Rev., 5.00%, 07/01/2018 | | | 36 | |
| | 20 | | | Series B, Rev., 5.00%, 07/01/2018 | | | 20 | |
| | 14,065 | | | Florida Department of Environmental Protection, Everglades Restoration, Series B, Rev., VRDO, AGC, 1.13%, 03/08/2018 (z) | | | 14,065 | |
| | | | | | | | |
| | | | | | | 14,141 | |
| | | | | | | | |
| | | | Other Revenue — 0.1% | |
| | 745 | | | City of Cape Coral, Water & Sewer, Rev., AGM, 1.40%, 09/01/2018 | | | 743 | |
| | | | | | | | |
PRINCIPAL
AMOUNT($) | | | SECURITY DESCRIPTION | | VALUE($) | |
| | | | | | | | |
| | | | Other Revenue — continued | |
| | | | City of Orlando, | | | | |
| | 30 | | | Series B, Rev., 5.00%, 10/01/2018 | | | 31 | |
| | 20 | | | Series B, Rev., 5.00%, 10/01/2018 | | | 20 | |
| | 40 | | | County of Hillsborough, Rev., 5.00%, 08/01/2018 | | | 41 | |
| | 40 | | | County of Pasco, Series A, Rev., 5.00%, 12/01/2018 | | | 41 | |
| | 25 | | | Osceola County, Sales Tax, Rev., AGC, 4.00%, 10/01/2018 (p) | | | 25 | |
| | | | | | | | |
| | | | | | | 901 | |
| | | | | | | | |
| | | | Prerefunded — 0.9% | |
| | | | Broward County School Board, | | | | |
| | 10 | | | Series A, COP, AGM, 4.50%, 07/01/2018 (p) | | | 10 | |
| | 20 | | | Series A, COP, AGM, 4.75%, 07/01/2018 (p) | | | 20 | |
| | | | County of Miami-Dade, Miami International Airport, | | | | |
| | 20 | | | Series B, Rev., AGM, 5.00%, 10/01/2018 (p) | | | 20 | |
| | 25 | | | Series B, Rev., AGC, 5.00%, 10/01/2018 (p) | | | 26 | |
| | | | County of Miami-Dade, Transit System, | | | | |
| | 20 | | | Rev., AGM, 5.00%, 07/01/2018 (p) | | | 20 | |
| | 16,965 | | | Series 2008, Rev., AGM, 5.00%, 07/01/2018 (p) | | | 17,165 | |
| | 20 | | | County of Miami-Dade, Transit System Sales Surtax, Rev., AGM, 5.00%, 07/01/2018 (p) | | | 20 | |
| | 20 | | | County of Sarasota, Series A, Rev., 4.13%, 10/01/2018 (p) | | | 20 | |
| | | | Florida State Municipal Power Agency, | | | | |
| | 20 | | | Rev., AGM-CR, 5.00%, 10/01/2018 (p) | | | 20 | |
| | 85 | | | Rev., 5.25%, 10/01/2018 (p) | | | 87 | |
| | 200 | | | Series A, Rev., 5.00%, 10/01/2018 (p) | | | 204 | |
| | 40 | | | Halifax Hospital Medical Center, Daytona Beach, Series B-2, Rev., AGM, 5.38%, 06/01/2018 (p) | | | 41 | |
| | 105 | | | JEA Electric System, Series 3-A, Rev., 2.50%, 10/01/2018 (p) | | | 106 | |
| | | | | | | | |
| | | | | | | 17,759 | |
| | | | | | | | |
| | | | Transportation — 0.0% (g) | |
| | 100 | | | County of Miami-Dade, Aviation, Series B, Rev., 5.00%, 10/01/2018 | | | 102 | |
| | 25 | | | Orlando-Orange County Expressway Authority, Series B, Rev., AGM, 5.00%, 07/01/2018 | | | 25 | |
| | 75 | | | State of Florida, Department of Transportation, Turnpike Authority, Series A, Rev., 5.00%, 07/01/2018 | | | 76 | |
| | | | | | | | |
| | | | | | | 203 | |
| | | | | | | | |
SEE NOTES TO FINANCIAL STATEMENTS.
| | | | | | |
| | | |
| 52 | | | | J.P. MORGAN MUNICIPAL BOND FUNDS | | FEBRUARY 28, 2018 |
| | | | | | | | |
PRINCIPAL
AMOUNT($) | | | SECURITY DESCRIPTION | | VALUE($) | |
| | Municipal Bonds — continued | |
| | | | Utility — 0.1% | |
| | 35 | | | County of Charlotte, Utility System, Rev., AGM, 5.00%, 10/01/2018 | | | 36 | |
| | 110 | | | JEA Electric System, Series 3-A, Rev., 4.00%, 10/01/2018 | | | 112 | |
| | 2,475 | | | Orlando Utilities Commission, Series B, Rev., VRDO, 1.12%, 03/08/2018 (z) | | | 2,475 | |
| | 120 | | | Reedy Creek Improvement District Utility Revenue, Series 2, Rev., 5.00%, 10/01/2019 | | | 126 | |
| | | | | | | | |
| | | | | | | 2,749 | |
| | | | | | | | |
| | | | Water & Sewer — 0.0% (g) | |
| | 25 | | | City of Fort Lauderdale, Water & Sewer, Rev., 5.00%, 03/01/2018 | | | 25 | |
| | 20 | | | Florida Water Pollution Control Financing Corp., Water Pollution Control, Series A, Rev., 5.00%, 07/15/2018 | | | 20 | |
| | | | | | | | |
| | | | | | | 45 | |
| | | | | | | | |
| | | | Total Florida | | | 61,215 | |
| | | | | | | | |
| | | | Georgia — 1.2% | |
| | | | General Obligation — 0.6% | |
| | 5,650 | | | Clarke County Board of Education, GO, 5.00%, 09/01/2022 | | | 6,387 | |
| | 60 | | | County of Meriwether, GO, 2.00%, 03/01/2018 | | | 60 | |
| | | | Dougherty County School District, Sales Tax, | | | | |
| | 1,775 | | | Series 2018, GO, 4.00%, 12/01/2019 | | | 1,850 | |
| | 1,250 | | | Series 2018, GO, 4.00%, 12/01/2020 | | | 1,326 | |
| | | | Hall County School District, | | | | |
| | 1,500 | | | Series 2018, GO, 5.00%, 11/01/2019 | | | 1,586 | |
| | 1,250 | | | Series 2018, GO, 5.00%, 11/01/2020 | | | 1,359 | |
| | 250 | | | Jackson County School District, GO, 5.00%, 03/01/2019 | | | 259 | |
| | 20 | | | McDuffie County School District, Sales Tax, GO, 4.00%, 05/01/2018 | | | 20 | |
| | 150 | | | Morgan County Georgia School District, GO, 5.00%, 05/01/2018 | | | 151 | |
| | | | | | | | |
| | | | | | | 12,998 | |
| | | | | | | | |
| | | | Hospital — 0.0% (g) | |
| | 25 | | | Fulton County Development Authority, Catholic Health East Issue, Rev., 3.75%, 11/15/2018 (p) | | | 25 | |
| | 100 | | | Richmond County Hospital Authority, University Health Services, Inc. Project, Rev., 5.00%, 01/01/2022 | | | 111 | |
| | | | | | | | |
| | | | | | | 136 | |
| | | | | | | | |
| | | | | | | | |
PRINCIPAL
AMOUNT($) | | | SECURITY DESCRIPTION | | VALUE($) | |
| | | | | | | | |
| | | | Other Revenue — 0.1% | |
| | | | Dahlonega Downtown Development Authority, North Georgia MAC, LLC Project, | | | | |
| | 200 | | | Series 2017, Rev., 5.00%, 07/01/2019 | | | 209 | |
| | 275 | | | Series 2017, Rev., 5.00%, 07/01/2020 | | | 295 | |
| | 370 | | | Series 2017, Rev., 5.00%, 07/01/2021 | | | 406 | |
| | 300 | | | Series 2017, Rev., 5.00%, 07/01/2022 | | | 335 | |
| | | | | | | | |
| | | | | | | 1,245 | |
| | | | | | | | |
| | | | Prerefunded — 0.0% (g) | |
| | 25 | | | Athens-Clarke County Unified Government Development Authority, UGAREF Central Precinct, LLC Project, Rev., 5.00%, 06/15/2018 (p) | | | 25 | |
| | 25 | | | County of McDuffie, GO, AGC, 5.25%, 04/01/2018 (p) | | | 25 | |
| | | | | | | | |
| | | | | | | 50 | |
| | | | | | | | |
| | | | Utility — 0.4% | |
| | 8,405 | | | Municipal Electric Authority of Georgia, Series B, Rev., VRDO, LOC: Barclays Bank plc, 1.10%, 03/08/2018 (z) | | | 8,405 | |
| | | | | | | | |
| | | | Water & Sewer — 0.1% | |
| | 25 | | | Douglasville-Douglas County Water & Sewer Authority, Rev., 5.00%, 06/01/2018 | | | 25 | |
| | | | East Point Building Authority, Water & Sewer Project, | | | | |
| | 1,000 | | | Rev., AGM, 4.00%, 02/01/2019 | | | 1,023 | |
| | 550 | | | Rev., AGM, 5.00%, 02/01/2020 | | | 584 | |
| | | | | | | | |
| | | | | | | 1,632 | |
| | | | | | | | |
| | | | Total Georgia | | | 24,466 | |
| | | | | | | | |
| | | | Hawaii — 0.3% | |
| | | | General Obligation — 0.3% | |
| | 5,000 | | | City & County of Honolulu, Rail Transit Project, GO, (Dow Jones US Mid Cap Sofware Index GICS Level 4 USD + 0.30%, 8.00% Cap), 1.39%, 03/08/2018 (aa) | | | 5,022 | |
| | 235 | | | County of Maui, Series 2012, GO, 5.00%, 06/01/2019 | | | 245 | |
| | 15 | | | State of Hawaii, Series DT, GO, 4.00%, 11/01/2018 | | | 15 | |
| | | | | | | | |
| | | | | | | 5,282 | |
| | | | | | | | |
| | | | Transportation — 0.0% (g) | |
| | 20 | | | State of Hawaii, Highway, Rev., 5.50%, 07/01/2018 | | | 20 | |
| | | | | | | | |
| | | | Water & Sewer — 0.0% (g) | |
| | 45 | | | City & County of Honolulu, Wastewater System, Series A, Rev., 5.00%, 07/01/2018 | | | 46 | |
| | | | | | | | |
| | | | Total Hawaii | | | 5,348 | |
| | | | | | | | |
SEE NOTES TO FINANCIAL STATEMENTS.
| | | | | | | | |
| | | |
| FEBRUARY 28, 2018 | | J.P. MORGAN MUNICIPAL BOND FUNDS | | | | | 53 | |
JPMorgan Ultra-Short Municipal Fund
SCHEDULE OF PORTFOLIO INVESTMENTS
AS OF FEBRUARY 28, 2018 (continued)
(Amounts in thousands)
| | | | | | | | |
PRINCIPAL
AMOUNT($) | | | SECURITY DESCRIPTION | | VALUE($) | |
| | Municipal Bonds — continued | |
| | | | Idaho — 0.6% | |
| | | | General Obligation — 0.0% (g) | |
| | 30 | | | Ada & Boise Counties Independent School District, Idaho Independent School District, Series B, GO, 4.00%, 08/01/2018 | | | 30 | |
| | | | | | | | |
| | | | Hospital — 0.6% | |
| | 12,500 | | | Idaho Health Facilities Authority, CHE Trinity Health Credit Group, Series 2013ID, Rev., VRDO, 1.10%, 05/01/2018 (z) | | | 12,499 | |
| | | | | | | | |
| | | | Prerefunded — 0.0% (g) | |
| | 30 | | | Idaho Bond Bank Authority, Series C, Rev., 5.63%, 09/15/2018 (p) | | | 30 | |
| | 50 | | | Idaho Housing & Finance Association, Federal Highway, Series G, Rev., GRAN, AGC, 5.25%, 07/15/2018 (p) | | | 51 | |
| | | | | | | | |
| | | | | | | 81 | |
| | | | | | | | |
| | | | Total Idaho | | | 12,610 | |
| | | | | | | | |
| | | | Illinois — 6.5% | |
| | | | Certificate of Participation/Lease — 0.1% | |
| | | | University of Illinois, | | | | |
| | 1,000 | | | Series A, COP, 5.00%, 10/01/2019 | | | 1,043 | |
| | 1,215 | | | Series C, COP, 5.00%, 03/15/2018 | | | 1,217 | |
| | | | | | | | |
| | | | | | | 2,260 | |
| | | | | | | | |
| | | | Education — 1.7% | |
| | 5,500 | | | Illinois Educational Facilities Authority, University of Chicago, Series B-1, Rev., 1.80%, 02/13/2020 (z) | | | 5,511 | |
| | | | Illinois Finance Authority, Chicago International Charter School Project, Refunding & Improvement, | | | | |
| | 300 | | | Rev., 3.00%, 06/01/2018 | | | 300 | |
| | 125 | | | Rev., 3.00%, 12/01/2018 | | | 126 | |
| | 185 | | | Rev., 3.00%, 12/01/2019 | | | 186 | |
| | 15,957 | | | Illinois Finance Authority, The University of Chicago, Rev., VRDO, 1.09%, 03/08/2018 (z) | | | 15,957 | |
| | 300 | | | Peoria Public Building Commission, School District No. 150 Project, Rev., 5.00%, 12/01/2019 | | | 315 | |
| | 315 | | | University of Illinois, Auxiliary Facilities System, Series A, Rev., 5.00%, 04/01/2019 | | | 325 | |
| | 11,165 | | | University of Illinois, Health Services System, Series 2008, Rev., VRDO, LOC: Wells Fargo Bank NA, 1.12%, 03/08/2018 (z) | | | 11,165 | |
| | | | Will County, Community Consolidated School District No. 70-C Laraway, Lease Certificates, | | | | |
| | 355 | | | Series A, Rev., AGM, 4.00%, 12/01/2018 | | | 360 | |
| | 370 | | | Series A, Rev., AGM, 4.00%, 12/01/2019 | | | 381 | |
| | | | | | | | |
PRINCIPAL
AMOUNT($) | | | SECURITY DESCRIPTION | | VALUE($) | |
| | | | | | | | |
| | | | Education — continued | |
| | 385 | | | Series A, Rev., AGM, 4.00%, 12/01/2020 | | | 401 | |
| | 400 | | | Series A, Rev., AGM, 4.00%, 12/01/2021 | | | 421 | |
| | | | | | | | |
| | | | | | | 35,448 | |
| | | | | | | | |
| | | | General Obligation — 1.9% | |
| | | | Adams County School District No. 172, | | | | |
| | 270 | | | GO, AGM, 4.00%, 02/01/2019 | | | 275 | |
| | 300 | | | GO, AGM, 4.00%, 02/01/2020 | | | 309 | |
| | 300 | | | GO, AGM, 4.00%, 02/01/2021 | | | 313 | |
| | 330 | | | Buffalo Grove Park District, Lake & Cook Counties, GO, 2.00%, 12/30/2020 | | | 330 | |
| | 175 | | | Chicago Park District, Series C, GO, 5.00%, 01/01/2022 | | | 190 | |
| | | | Chicago Park District, Limited Tax, | | | | |
| | 50 | | | Series B, GO, 4.00%, 01/01/2020 | | | 52 | |
| | 225 | | | Series B, GO, 5.00%, 01/01/2020 | | | 236 | |
| | 100 | | | Series B, GO, 5.00%, 01/01/2021 | | | 107 | |
| | 100 | | | Chicago Park District, Unlimited Tax, Series C, GO, 3.00%, 01/01/2020 | | | 101 | |
| | | | City of Calumet, | | | | |
| | 150 | | | Series 2018, GO, 4.00%, 03/01/2019 | | | 153 | |
| | 150 | | | Series 2018, GO, 4.00%, 03/01/2020 | | | 154 | |
| | | | City of Rock Island, | | | | |
| | 100 | | | Series A, GO, AGM, 2.00%, 12/01/2018 | | | 100 | |
| | 130 | | | Series A, GO, AGM, 2.00%, 12/01/2019 | | | 130 | |
| | 130 | | | Series A, GO, AGM, 3.00%, 12/01/2021 | | | 132 | |
| | 120 | | | Series B, GO, AGM, 2.00%, 12/01/2018 | | | 120 | |
| | 150 | | | Series B, GO, AGM, 2.00%, 12/01/2019 | | | 150 | |
| | 200 | | | Series B, GO, AGM, 3.00%, 12/01/2020 | | | 203 | |
| | 200 | | | Series B, GO, AGM, 3.00%, 12/01/2021 | | | 203 | |
| | 380 | | | Clinton & St. Clair Counties Community Unit School District No. 3, School Building, GO, 5.00%, 12/01/2019 | | | 396 | |
| | 20 | | | Cook County High School District No. 204, Lyons Township, GO, 4.00%, 12/15/2018 | | | 20 | |
| | | | Cook County Township High School District No. 208 Riverside-Brookfield, | | | | |
| | 920 | | | Series C, GO, 3.00%, 12/15/2018 | | | 930 | |
| | 690 | | | Series C, GO, 3.00%, 12/15/2019 | | | 705 | |
| | 150 | | | Cook County, Proviso Township High School District No. 209, Series B, GO, AGM, 4.00%, 12/01/2018 | | | 153 | |
| | | | County of Cook, | | | | |
| | 1,200 | | | Series 2018, GO, 3.00%, 11/15/2018 | | | 1,211 | |
| | 800 | | | Series 2018, GO, 5.00%, 11/15/2019 | | | 841 | |
| | 900 | | | Series 2018, GO, 5.00%, 11/15/2020 | | | 969 | |
| | 700 | | | Series 2018, GO, 5.00%, 11/15/2021 | | | 769 | |
SEE NOTES TO FINANCIAL STATEMENTS.
| | | | | | |
| | | |
| 54 | | | | J.P. MORGAN MUNICIPAL BOND FUNDS | | FEBRUARY 28, 2018 |
| | | | | | | | |
PRINCIPAL
AMOUNT($) | | | SECURITY DESCRIPTION | | VALUE($) | |
| | Municipal Bonds — continued | |
| | | | General Obligation — continued | |
| | 150 | | | Series A, GO, 5.00%, 11/15/2018 | | | 153 | |
| | 355 | | | Series A, GO, 5.00%, 11/15/2021 | | | 390 | |
| | 100 | | | Series C, GO, 4.25%, 11/15/2018 | | | 102 | |
| | 180 | | | Series C, GO, 5.00%, 11/15/2022 | | | 200 | |
| | 185 | | | County of Winnebago, Series C, GO, 2.00%, 12/30/2018 | | | 186 | |
| | 50 | | | County of Winnebago, General Funds Alternate Revenue Source, Series A, GO, AGC, 4.00%, 12/30/2018 | | | 51 | |
| | 200 | | | County of Winnebago, Illinois Tax Alternate Revenue Source, Series D, GO, 2.50%, 12/30/2018 | | | 201 | |
| | 25 | | | Du Page Cook & Will Counties Community College District No. 502, Series A, GO, 5.00%, 06/01/2018 | | | 25 | |
| | 830 | | | DuPage County Community High School District No. 94, GO, 4.00%, 01/01/2019 | | | 846 | |
| | 60 | | | Ford etc. Counties Community Unit School District No. 10 Paxton-Buckley-Loda, School Building, Series A, GO, AGM, 4.00%, 12/01/2018 | | | 61 | |
| | 60 | | | Fox Valley Park District, Series B, GO, 4.00%, 12/15/2018 | | | 61 | |
| | 1,595 | | | Grundy & Will Counties Community Unit School District No. 1 Coal City, GO, 4.00%, 02/01/2020 | | | 1,650 | |
| | | | Jackson County Community Unit School District No. 186, | | | | |
| | 200 | | | GO, AGM, 4.00%, 12/01/2019 | | | 206 | |
| | 265 | | | GO, AGM, 4.00%, 12/01/2020 | | | 276 | |
| | | | Kendall Kane & Will Counties Community Unit School District No. 308, | | | | |
| | 360 | | | Series B, GO, 3.00%, 10/01/2018 | | | 363 | |
| | 120 | | | Series B, GO, 4.00%, 10/01/2019 | | | 124 | |
| | 225 | | | Series B, GO, 4.00%, 10/01/2020 | | | 235 | |
| | 255 | | | Series B, GO, 4.00%, 10/01/2021 | | | 270 | |
| | 1,375 | | | Series B, GO, 5.00%, 10/01/2022 | | | 1,523 | |
| | 35 | | | Lake County Forest Preserve District, Series B, GO, 5.00%, 12/15/2018 | | | 36 | |
| | 125 | | | Lincoln Land Community College District No. 526, GO, 5.00%, 12/15/2021 | | | 138 | |
| | 1,240 | | | Madison County Community Unit School District No. 7, GO, 4.00%, 12/01/2018 | | | 1,260 | |
| | 85 | | | Monroe & St. Clair Counties, Waterloo Unit Community School District No. 5, GO, 4.00%, 04/15/2018 | | | 85 | |
| | 1,600 | | | Schaumburg Park District, Series B, GO, 5.00%, 12/01/2018 | | | 1,639 | |
| | | | | | | | |
PRINCIPAL
AMOUNT($) | | | SECURITY DESCRIPTION | | VALUE($) | |
| | | | | | | | |
| | | | General Obligation — continued | |
| | | | State of Illinois, | | | | |
| | 25 | | | GO, 4.00%, 04/01/2018 | | | 25 | |
| | 355 | | | GO, 5.00%, 11/01/2018 | | | 360 | |
| | 250 | | | Series A, GO, 5.00%, 04/01/2018 | | | 250 | |
| | 10,000 | | | Series D, GO, 5.00%, 11/01/2020 | | | 10,386 | |
| | | | Tazewell & Woodford Counties, Community Unit School District No. 701, | | | | |
| | 100 | | | Series A, GO, 4.00%, 12/01/2018 | | | 102 | |
| | 260 | | | Series A, GO, 4.00%, 12/01/2019 | | | 268 | |
| | 25 | | | Township of Campton, GO, 5.00%, 12/15/2018 | | | 26 | |
| | | | Village of Antioch, | | | | |
| | 220 | | | GO, 2.00%, 12/01/2018 | | | 221 | |
| | 285 | | | GO, 2.00%, 12/01/2019 | | | 285 | |
| | 290 | | | GO, 3.00%, 12/01/2020 | | | 296 | |
| | | | Village of Flossmoor, | | | | |
| | 545 | | | GO, 3.00%, 12/01/2018 | | | 551 | |
| | 425 | | | GO, 3.00%, 12/01/2019 | | | 434 | |
| | 585 | | | GO, 3.00%, 12/01/2020 | | | 602 | |
| | 605 | | | GO, 3.00%, 12/01/2021 | | | 624 | |
| | | | Village of Hoffman Estates, | | | | |
| | 110 | | | Series A, GO, 2.00%, 12/01/2019 | | | 110 | |
| | 110 | | | Series A, GO, 3.00%, 12/01/2020 | | | 112 | |
| | 20 | | | Village of Northbrook, Series B, GO, 3.00%, 12/01/2018 | | | 20 | |
| | | | Village of Oswego, | | | | |
| | 100 | | | GO, 2.00%, 12/15/2018 | | | 100 | |
| | 100 | | | GO, 2.00%, 12/15/2019 | | | 100 | |
| | | | Village of Palatine, | | | | |
| | 1,135 | | | Series A, GO, 4.00%, 12/01/2018 | | | 1,155 | |
| | 1,250 | | | Series A, GO, 4.00%, 12/01/2019 | | | 1,295 | |
| | 60 | | | Village of Plainfield, Will & Kendall Counties, GO, 4.00%, 12/15/2018 | | | 61 | |
| | | | Village of Sugar Grove, Kane County, Waterworks & Sewerage, | | | | |
| | 50 | | | GO, 2.00%, 05/01/2018 | | | 50 | |
| | 130 | | | GO, 2.00%, 05/01/2019 | | | 131 | |
| | 390 | | | GO, 3.00%, 05/01/2020 | | | 399 | |
| | 100 | | | Village of Villa Park, Illinois Sales Tax Alternate Revenue Source, Series B, GO, 2.00%, 12/15/2018 | | | 100 | |
| | | | Village of Woodridge, | | | | |
| | 175 | | | Series 2017, GO, 2.00%, 02/01/2019 | | | 176 | |
| | 270 | | | Series 2017, GO, 3.00%, 02/01/2020 | | | 275 | |
| | 250 | | | Series 2017, GO, 3.00%, 02/01/2021 | | | 256 | |
SEE NOTES TO FINANCIAL STATEMENTS.
| | | | | | | | |
| | | |
| FEBRUARY 28, 2018 | | J.P. MORGAN MUNICIPAL BOND FUNDS | | | | | 55 | |
JPMorgan Ultra-Short Municipal Fund
SCHEDULE OF PORTFOLIO INVESTMENTS
AS OF FEBRUARY 28, 2018 (continued)
(Amounts in thousands)
| | | | | | | | |
PRINCIPAL
AMOUNT($) | | | SECURITY DESCRIPTION | | VALUE($) | |
| | Municipal Bonds — continued | |
| | | | General Obligation — continued | |
| | 320 | | | Whiteside & Lee Counties, Sterling Community Unit School District No. 5, GO, AGM, 4.00%, 12/01/2020 | | | 335 | |
| | | | Whiteside County Community Unit School District No. 6 Morrison, | | | | |
| | 205 | | | Series A, GO, AGM, 4.00%, 12/01/2020 | | | 214 | |
| | 745 | | | Series A, GO, AGM, 4.00%, 12/01/2021 | | | 782 | |
| | 20 | | | Will County, Alternate Revenue Source, GO, 4.00%, 11/15/2018 | | | 20 | |
| | | | | | | | |
| | | | | | | 39,454 | |
| | | | | | | | |
| | | | Hospital — 0.2% | |
| | 3,300 | | | Illinois Finance Authority, Advocate Health Care Network, Rev., 1.05%, 07/30/2018 (z) | | | 3,293 | |
| | 250 | | | Illinois Finance Authority, Ascension Health Alliance Senior Credit Group, Series E-2, Rev., 1.75%, 04/01/2021 (z) | | | 247 | |
| | 1,200 | | | Illinois Finance Authority, OSF Healthcare System, Series C, Rev., VRDO, LOC: Wells Fargo Bank NA, 1.09%, 03/08/2018 (z) | | | 1,200 | |
| | | | | | | | |
| | | | | | | 4,740 | |
| | | | | | | | |
| | | | Other Revenue — 2.0% | |
| | | | City of Rochelle, | | | | |
| | 100 | | | Series A, Rev., AGM, 3.00%, 06/30/2019 | | | 101 | |
| | 275 | | | Series A, Rev., AGM, 3.00%, 06/30/2020 | | | 279 | |
| | 7,500 | | | Illinois Finance Authority, Carle Foundation, Series B, Rev., VRDO, LOC: Northern Trust Co., 1.10%, 03/08/2018 (z) | | | 7,500 | |
| | 9,200 | | | Illinois Finance Authority, North Park University Project, Rev., VRDO, LOC: U.S. Bank NA, 1.08%, 03/08/2018 (z) | | | 9,200 | |
| | 25 | | | Illinois Sports Facilities Authority, Tax Supported, Rev., 5.00%, 06/15/2018 | | | 25 | |
| | 25 | | | Metropolitan Pier & Exposition Authority, Illinois Dedicated State Tax, Capital Appreciation, Rev., NATL-RE, FGIC, Zero Coupon, 06/15/2018 (p) | | | 25 | |
| | 250 | | | Metropolitan Pier & Exposition Authority, McCormick Place Expansion Project, Series B, Rev., 3.00%, 12/15/2018 | | | 252 | |
| | 650 | | | Railsplitter Tobacco Settlement Authority, Rev., 5.00%, 06/01/2018 | | | 655 | |
| | 3,880 | | | State of Illinois, Rev., 4.50%, 06/15/2019 | | | 4,014 | |
| | 11,825 | | | State of Illinois, Junior Obligation, Rev., 5.00%, 06/15/2018 | | | 11,938 | |
| | 7,575 | | | Tender Option Bond Trust Receipts/Certificates, Series 2016-YX1035, Rev., VRDO, LIQ: Barclays Bank plc, 1.24%, 03/08/2018 (e) (z) | | | 7,575 | |
| | | | | | | | |
| | | | | | | 41,564 | |
| | | | | | | | |
| | | | | | | | |
PRINCIPAL
AMOUNT($) | | | SECURITY DESCRIPTION | | VALUE($) | |
| | | | | | | | |
| | | | Prerefunded — 0.2% | |
| | 25 | | | Chicago Transit Authority, Series A, Rev., AGC, 5.25%, 06/01/2018 (p) | | | 25 | |
| | 2,750 | | | City of Chicago, Rev., AGM, 5.25%, 11/01/2018 (p) | | | 2,819 | |
| | | | Illinois Finance Authority, | | | | |
| | 195 | | | Rev., 6.13%, 05/15/2019 (p) | | | 205 | |
| | 30 | | | Series B, Rev., NATL-RE, 5.25%, 11/01/2018 (p) | | | 31 | |
| | 50 | | | Illinois Finance Authority, Children’s Memorial Hospital, Series B, Rev., 5.50%, 08/15/2018 (p) | | | 51 | |
| | 110 | | | Illinois Finance Authority, Northwest Community Hospital, Series A, Rev., 5.38%, 07/01/2018 (p) | | | 112 | |
| | | | Illinois Finance Authority, Resurrection Health, | | | | |
| | 340 | | | Rev., 6.13%, 05/15/2019 (p) | | | 359 | |
| | 50 | | | Series A, Rev., AGM, 4.25%, 05/15/2018 (p) | | | 50 | |
| | | | Illinois Finance Authority, The University of Chicago, | | | | |
| | 25 | | | Series B, Rev., 5.25%, 07/01/2018 (p) | | | 25 | |
| | 140 | | | Series B, Rev., 5.50%, 07/01/2018 (p) | | | 142 | |
| | 810 | | | Williamson County Community Unit School District No. 5 Carterville, Capital Appreciation, Series B, GO, AGC, Zero Coupon, 01/01/2019 (p) | | | 478 | |
| | | | | | | | |
| | | | | | | 4,297 | |
| | | | | | | | |
| | | | Special Tax — 0.1% | |
| | | | Village of Hampshire, Special Service Area No. 14, Lakewood Crossing, | | | | |
| | 480 | | | Rev., 1.50%, 03/01/2018 | | | 480 | |
| | 180 | | | Rev., 1.70%, 03/01/2019 | | | 179 | |
| | 200 | | | Rev., 1.90%, 03/01/2020 | | | 198 | |
| | | | | | | | |
| | | | | | | 857 | |
| | | | | | | | |
| | | | Transportation — 0.2% | |
| | 600 | | | Chicago O’Hare International Airport, Series A, Rev., AMT, 5.00%, 01/01/2019 | | | 616 | |
| | 200 | | | Chicago O’Hare International Airport, General Airport, Senior Lien, Series G, Rev., AMT, 5.00%, 01/01/2021 | | | 216 | |
| | 270 | | | Chicago Transit Authority, Federal Transit Administration Section 5307 Urbanized Area Formula Funds, Rev., 5.00%, 06/01/2021 | | | 291 | |
| | | | Chicago Transit Authority, Federal Transit Administration Section 5337 State of Good Repair Formula Funds, | | | | |
| | 200 | | | Rev., 2.00%, 06/01/2018 | | | 200 | |
| | 2,270 | | | Rev., 4.00%, 06/01/2019 | | | 2,328 | |
SEE NOTES TO FINANCIAL STATEMENTS.
| | | | | | |
| | | |
| 56 | | | | J.P. MORGAN MUNICIPAL BOND FUNDS | | FEBRUARY 28, 2018 |
| | | | | | | | |
PRINCIPAL
AMOUNT($) | | | SECURITY DESCRIPTION | | VALUE($) | |
| | Municipal Bonds — continued | |
| | | | Transportation — continued | |
| | 50 | | | Regional Transportation Authority, Series A, Rev., AGM, 5.00%, 06/01/2018 | | | 50 | |
| | | | | | | | |
| | | | | | | 3,701 | |
| | | | | | | | |
| | | | Water & Sewer — 0.1% | |
| | 1,000 | | | City of Chicago, Second Lien Wastewater Transmission, Series B, Rev., 5.00%, 01/01/2019 | | | 1,024 | |
| | | | City of Chicago, Second Lien Water, Project, | | | | |
| | 50 | | | Rev., AGM, 4.25%, 11/01/2018 | | | 51 | |
| | 1,160 | | | Rev., 5.00%, 11/01/2018 | | | 1,186 | |
| | 25 | | | Illinois Finance Authority, Clean Water Initiative, Rev., 5.00%, 07/01/2018 | | | 25 | |
| | 25 | | | Northwest Suburban Municipal Joint Action Water Agency, Water Supply System, Rev., 4.25%, 05/01/2018 | | | 25 | |
| | | | | | | | |
| | | | | | | 2,311 | |
| | | | | | | | |
| | | | Total Illinois | | | 134,632 | |
| | | | | | | | |
| | | | Indiana — 3.5% | |
| | | | Education — 0.8% | |
| | 20 | | | Edinburgh Community School Building Corp., Ad Valorem Property Tax, Rev., 1.50%, 07/15/2018 | | | 20 | |
| | 3,000 | | | Hamilton Southeastern Consolidated School Building Corp., Rev., BAN, 1.25%, 06/15/2018 | | | 2,998 | |
| | | | Ivy Tech Community College of Indiana, Student Fee, | | | | |
| | 50 | | | Series P, Rev., 4.50%, 07/01/2018 | | | 51 | |
| | 35 | | | Series T, Rev., 5.00%, 07/01/2018 | | | 35 | |
| | 600 | | | Lebanon Middle School Building Corp., Ad Valorem Property Tax First Mortgage Bonds, Series B, Rev., 3.00%, 07/10/2018 | | | 603 | |
| | | | Mount Vernon of Hancock County Multi-School Building Corp., | | | | |
| | 510 | | | Rev., 4.00%, 01/15/2019 | | | 521 | |
| | 210 | | | Rev., 4.00%, 07/15/2019 | | | 217 | |
| | | | Purdue University, Student Facilities System, | | | | |
| | 25 | | | Series A, Rev., 5.00%, 07/01/2018 | | | 25 | |
| | 6,575 | | | Series C, Rev., VRDO, 1.04%, 03/08/2018 (z) | | | 6,575 | |
| | | | Southmont School Building Corp., Ad Valorem Property Tax, | | | | |
| | 200 | | | Rev., 4.00%, 07/15/2018 | | | 202 | |
| | 125 | | | Rev., 4.00%, 01/15/2019 | | | 128 | |
| | 300 | | | Rev., 4.00%, 07/15/2019 | | | 309 | |
| | 550 | | | Rev., 4.00%, 01/15/2020 | | | 573 | |
| | 190 | | | Rev., 4.00%, 07/15/2020 | | | 199 | |
| | | | | | | | |
PRINCIPAL
AMOUNT($) | | | SECURITY DESCRIPTION | | VALUE($) | |
| | | | | | | | |
| | | | Education — continued | |
| | | | Wawasee High School Building Corp., Ad Valorem Property Tax First Mortgage Bonds, | | | | |
| | 155 | | | Rev., 4.00%, 07/15/2018 | | | 156 | |
| | 50 | | | Rev., 4.00%, 07/15/2019 | | | 52 | |
| | | | Westfield High School Building Corp., Property Tax, First Mortgage, | | | | |
| | 720 | | | Rev., 4.00%, 07/15/2018 | | | 727 | |
| | 1,030 | | | Rev., 4.00%, 01/15/2019 | | | 1,051 | |
| | 1,240 | | | Rev., 4.00%, 07/15/2019 | | | 1,279 | |
| | | | | | | | |
| | | | | | | 15,721 | |
| | | | | | | | |
| | | | Hospital — 1.3% | |
| | 9,865 | | | Indiana Finance Authority, Trinity Health Credit Group, Series D-1, Rev., VRDO, 1.09%, 03/08/2018 (z) | | | 9,865 | |
| | 13,365 | | | Indiana Finance Authority, University Health Obligated Group, Series B, Rev., VRDO, LOC: TD Bank NA, 1.08%, 03/08/2018 (z) | | | 13,365 | |
| | 4,510 | | | Indiana Health Facility Financing Authority, Ascension Health Subordinate Credit Group, Rev., 1.37%, 10/01/2027 (z) | | | 4,477 | |
| | | | | | | | |
| | | | | | | 27,707 | |
| | | | | | | | |
| | | | Housing — 0.0% (g) | |
| | 50 | | | Greater Clark Building Corp., First Mortgage Bond, Rev., 3.00%, 07/15/2018 | | | 50 | |
| | | | | | | | |
| | | | Other Revenue — 1.4% | |
| | | | Hammond Redevelopment District, | | | | |
| | 150 | | | Rev., 4.00%, 07/15/2018 | | | 151 | |
| | 615 | | | Rev., 4.00%, 07/15/2019 | | | 630 | |
| | 20,000 | | | Indiana Finance Authority, Duke Energy Indiana, Inc. Project, Series A-3, Rev., VRDO, LOC: Mizuho Bank Ltd., 1.13%, 03/08/2018 (z) | | | 20,000 | |
| | | | Indiana Finance Authority, Educational Facilities, Valparaiso University, | | | | |
| | 200 | | | Rev., 4.00%, 10/01/2018 | | | 202 | |
| | 255 | | | Rev., 4.00%, 10/01/2019 | | | 263 | |
| | 7,135 | | | Indiana State Finance Authority, Lease Appropriation, Stadium Project, Series A, Rev., VRDO, 1.08%, 03/08/2018 (z) | | | 7,135 | |
| | 100 | | | Miami County Holding Corp., Option Income Tax Lease Rental, Rev., 3.00%, 01/15/2019 | | | 101 | |
| | | | | | | | |
| | | | | | | 28,482 | |
| | | | | | | | |
| | | | Prerefunded — 0.0% (g) | |
| | 185 | | | Indiana Health & Educational Facilities Financing Authority, Sisters of St. Francis Health Services, Inc. Obligated Group, Rev., AGM, 5.25%, 05/01/2018 (p) | | | 186 | |
SEE NOTES TO FINANCIAL STATEMENTS.
| | | | | | | | |
| | | |
| FEBRUARY 28, 2018 | | J.P. MORGAN MUNICIPAL BOND FUNDS | | | | | 57 | |
JPMorgan Ultra-Short Municipal Fund
SCHEDULE OF PORTFOLIO INVESTMENTS
AS OF FEBRUARY 28, 2018 (continued)
(Amounts in thousands)
| | | | | | | | |
PRINCIPAL
AMOUNT($) | | | SECURITY DESCRIPTION | | VALUE($) | |
| | Municipal Bonds — continued | |
| | | | Prerefunded — continued | |
| | 95 | | | Indiana Health Facility Financing Authority, Ascension Health Subordinate Credit Group, Rev., 1.37%, 05/01/2020 (p) (z) | | | 95 | |
| | | | | | | | |
| | | | | | | 281 | |
| | | | | | | | |
| | | | Total Indiana | | | 72,241 | |
| | | | | | | | |
| | | | Iowa — 0.4% | |
| | | | Certificate of Participation/Lease — 0.0% (g) | |
| | | | Kirkwood Community College, | | | | |
| | 100 | | | Series A, COP, 3.00%, 06/01/2018 | | | 100 | |
| | 175 | | | Series A, COP, 3.00%, 06/01/2019 | | | 178 | |
| | | | | | | | |
| | | | | | | 278 | |
| | | | | | | | |
| | | | Education — 0.1% | |
| | 25 | | | Council Bluffs Community School District, Rev., 4.00%, 07/01/2018 (p) | | | 25 | |
| | 25 | | | Des Moines Independent Community School District, School Infrastructure Sales, Rev., 5.00%, 06/01/2018 | | | 25 | |
| | 2,250 | | | Iowa Higher Education Loan Authority, Private Education Working Capital Loan Program, Series A, Rev., RAN, 2.75%, 05/10/2018 | | | 2,254 | |
| | 35 | | | University of Iowa Science & Technology, Academic Building, Series A, Rev., 4.00%, 07/01/2018 | | | 36 | |
| | | | | | | | |
| | | | | | | 2,340 | |
| | | | | | | | |
| | | | General Obligation — 0.1% | |
| | 105 | | | City of Ames, Corporate Purpose, Series A, GO, 5.00%, 06/01/2018 | | | 106 | |
| | | | City of Ankeny, | | | | |
| | 20 | | | Series A, GO, 3.00%, 06/01/2018 | | | 20 | |
| | 25 | | | Series A, GO, 4.00%, 06/01/2018 | | | 25 | |
| | 50 | | | Series D, GO, 4.00%, 06/01/2018 | | | 51 | |
| | 25 | | | Series G, GO, 5.00%, 06/01/2018 | | | 25 | |
| | 25 | | | City of Cedar Rapids, Series A, GO, 3.00%, 06/01/2018 | | | 25 | |
| | | | City of Des Moines, | | | | |
| | 20 | | | Series A, GO, 5.00%, 06/01/2018 | | | 20 | |
| | 50 | | | Series B, GO, 4.00%, 06/01/2018 | | | 51 | |
| | 500 | | | Kirkwood Community College, GO, 3.00%, 06/01/2018 | | | 502 | |
| | 25 | | | Linn-Mar Community School District, GO, 5.00%, 05/01/2018 | | | 25 | |
| | 20 | | | Waukee Community School District, Series C, GO, 5.00%, 06/01/2018 | | | 20 | |
| | 75 | | | West Des Moines Community School District, School Capital Loan, GO, 5.00%, 05/01/2018 | | | 75 | |
| | | | | | | | |
| | | | | | | 945 | |
| | | | | | | | |
| | | | | | | | |
PRINCIPAL
AMOUNT($) | | | SECURITY DESCRIPTION | | VALUE($) | |
| | | | | | | | |
| | | | Hospital — 0.0% (g) | |
| | 480 | | | City of Ames, Mary Greeley Medical Center, Rev., 5.00%, 06/15/2018 | | | 485 | |
| | | | | | | | |
| | | | Other Revenue — 0.2% | |
| | 2,740 | | | Iowa Finance Authority, State Revolving Fund, Green Bonds, Series 2015, Rev., 5.00%, 08/01/2018 | | | 2,781 | |
| | 400 | | | State of Iowa, Ijobs Program, Series A, Rev., 5.00%, 06/01/2021 | | | 440 | |
| | | | | | | | |
| | | | | | | 3,221 | |
| | | | | | | | |
| | | | Prerefunded — 0.0% (g) | |
| | 45 | | | Iowa Finance Authority, State Revolving Fund, Rev., 5.25%, 08/01/2018 (p) | | | 46 | |
| | | | | | | | |
| | | | Utility — 0.0% (g) | |
| | 20 | | | City of Des Moines, Stormwater Utility, Series G, Rev., 3.00%, 06/01/2018 | | | 20 | |
| | | | | | | | |
| | | | Water & Sewer — 0.0% (g) | |
| | 40 | | | Des Moines Metropolitan Wastewater Reclamation Authority, Sewer Revenue, Series B, Rev., 3.00%, 06/01/2018 | | | 40 | |
| | 110 | | | Muscatine Power & Water, Rev., 2.00%, 12/01/2018 | | | 110 | |
| | | | | | | | |
| | | | | | | 150 | |
| | | | | | | | |
| | | | Total Iowa | | | 7,485 | |
| | | | | | | | |
| | | | Kansas — 0.0% (g) | |
| | | | General Obligation — 0.0% (g) | |
| | 25 | | | City of Olathe, Series 218, GO, 5.00%, 10/01/2018 | | | 26 | |
| | 65 | | | County of Neosho, Sales Tax, GO, 3.00%, 10/01/2018 | | | 66 | |
| | | | Douglas County Unified School District No. 497, | | | | |
| | 20 | | | Series A, GO, 2.00%, 09/01/2018 | | | 20 | |
| | 20 | | | Series A, GO, 5.00%, 09/01/2018 | | | 20 | |
| | 100 | | | Ford County Unified School District No. 443, Series B, GO, 5.00%, 09/01/2018 | | | 102 | |
| | 25 | | | Johnson County Unified School District No. 233, Series B, GO, 4.00%, 09/01/2018 | | | 25 | |
| | | | | | | | |
| | | | | | | 259 | |
| | | | | | | | |
| | | | Hospital — 0.0% (g) | |
| | 20 | | | Kansas Development Finance Authority, Department of Health & Environment, Revolving Funds, Series SRF-1, Rev., 5.00%, 03/01/2018 | | | 20 | |
| | | | | | | | |
| | | | Prerefunded — 0.0% (g) | |
| | 25 | | | City of Manhattan, Series A, GO, 4.10%, 11/01/2018 (p) | | | 26 | |
SEE NOTES TO FINANCIAL STATEMENTS.
| | | | | | |
| | | |
| 58 | | | | J.P. MORGAN MUNICIPAL BOND FUNDS | | FEBRUARY 28, 2018 |
| | | | | | | | |
PRINCIPAL
AMOUNT($) | | | SECURITY DESCRIPTION | | VALUE($) | |
| | Municipal Bonds — continued | |
| | | | Prerefunded — continued | |
| | 20 | | | Kansas Unified School District No. 265 Sedgwick County, GO, AGC, 4.50%, 10/01/2018 (p) | | | 20 | |
| | 60 | | | Kansas Unified School District No. 266 Sedgwick County, GO, AGM, 5.25%, 09/01/2018 (p) | | | 61 | |
| | | | | | | | |
| | | | | | | 107 | |
| | | | | | | | |
| | | | Total Kansas | | | 386 | |
| | | | | | | | |
| | | | Kentucky — 0.9% | |
| | | | Education — 0.1% | |
| | 50 | | | Boone County School District Finance Corp., School Building, Rev., 2.00%, 03/01/2018 | | | 50 | |
| | 1,250 | | | City of Berea Education Facilities, Berea College Project, Series A, Rev., VRDO, 1.00%, 03/01/2018 (z) | | | 1,250 | |
| | 50 | | | Eastern Kentucky University, Series A, Rev., 2.50%, 10/01/2018 | | | 51 | |
| | 25 | | | University of Kentucky, Series A, Rev., 5.00%, 05/01/2018 | | | 25 | |
| | 20 | | | University of Kentucky, General Receipts, Series B, Rev., 5.00%, 04/01/2018 | | | 20 | |
| | | | | | | | |
| | | | | | | 1,396 | |
| | | | | | | | |
| | | | Hospital — 0.0% (g) | |
| | 50 | | | Kentucky Bond Development Corp., Hospital Facilities, St. Elizabeth Medical Centre, Inc., Rev., 5.00%, 05/01/2018 | | | 50 | |
| | 375 | | | Kentucky Economic Development Finance Authority, Owensboro Health, Inc., Series A, Rev., 5.00%, 06/01/2019 | | | 387 | |
| | | | | | | | |
| | | | | | | 437 | |
| | | | | | | | |
| | | | Industrial Development Revenue/Pollution Control Revenue — 0.0% (g) | |
| | 300 | | | Louisville/Jefferson County Metro Government, Pollution Control, Louisville Gas & Electric Company Project, Series A, Rev., 1.50%, 04/01/2019 (z) | | | 299 | |
| | | | | | | | |
| | | | Other Revenue — 0.1% | |
| | 175 | | | Kentucky Economic Development Finance Authority, Owensboro Health, Inc., Series A, Rev., 5.00%, 06/01/2018 | | | 176 | |
| | 350 | | | Kentucky State Property & Buildings Commission, Project No. 100, Series A, Rev., 5.00%, 08/01/2018 | | | 355 | |
| | 75 | | | Kentucky State Property & Buildings Commission, Project No. 82, Rev., AGM, 5.25%, 10/01/2018 | | | 76 | |
| | 200 | | | Kentucky State Property & Buildings Commission, Project No. 90, Rev., 5.00%, 11/01/2018 | | | 204 | |
| | | | | | | | |
| | | | | | | 811 | |
| | | | | | | | |
| | | | | | | | |
PRINCIPAL
AMOUNT($) | | | SECURITY DESCRIPTION | | VALUE($) | |
| | | | | | | | |
| | | | Prerefunded — 0.2% | |
| | 4,500 | | | Kentucky State Property & Buildings Commission, Project No. 90, Rev., 5.00%, 11/01/2018 (p) | | | 4,603 | |
| | 50 | | | Louisville/Jefferson County Metro Government, Mortgage Revenue Refunding & Improvement, Series B, Rev., 4.50%, 03/01/2018 (p) | | | 50 | |
| | 25 | | | University of Louisville, General Receipts, Series A, Rev., 4.50%, 09/01/2018 (p) | | | 26 | |
| | | | | | | | |
| | | | | | | 4,679 | |
| | | | | | | | |
| | | | Utility — 0.4% | |
| | | | Kentucky Public Energy Authority, Gas Supply, | | | | |
| | 665 | | | Series A, Rev., 4.00%, 04/01/2019 | | | 682 | |
| | 780 | | | Series A, Rev., 4.00%, 04/01/2020 | | | 813 | |
| | 775 | | | Series A, Rev., 4.00%, 04/01/2021 | | | 819 | |
| | 1,210 | | | Series A, Rev., 4.00%, 04/01/2022 | | | 1,292 | |
| | 4,200 | | | Louisville/Jefferson County Metro Government, Pollution Control, Louisville Gas & Electric Company Project, Rev., 1.25%, 06/03/2019 (z) | | | 4,168 | |
| | | | | | | | |
| | | | | | | 7,774 | |
| | | | | | | | |
| | | | Water & Sewer — 0.1% | |
| | 2,440 | | | Louisville/Jefferson County Metro Government, Water System, Rev., 5.00%, 11/15/2019 | | | 2,580 | |
| | | | | | | | |
| | | | Total Kentucky | | | 17,976 | |
| | | | | | | | |
| | | | Louisiana — 0.6% | |
| | | | Education — 0.0% (g) | |
| | 175 | | | Louisiana Public Facilities Authority, Capital Appreciation, Loyola University Project, Rev., Zero Coupon, 10/01/2018 | | | 173 | |
| | | | | | | | |
| | | | General Obligation — 0.1% | |
| | 520 | | | Calcasieu Parish School District No. 34, GO, 3.00%, 01/15/2022 | | | 539 | |
| | 150 | | | Iberia Parishwide School District, GO, 2.00%, 03/01/2021 | | | 150 | |
| | | | Natchitoches Parish Consolidated School District No. 7, | | | | |
| | 90 | | | GO, 2.00%, 03/01/2018 | | | 90 | |
| | 100 | | | GO, 2.00%, 03/01/2019 | | | 100 | |
| | 335 | | | St. Martin Parish School Board, GO, 3.00%, 03/01/2021 | | | 345 | |
| | | | State of Louisiana, St. Tammany Parishwide School District No. 12, | | | | |
| | 100 | | | GO, 2.00%, 03/01/2019 | | | 100 | |
| | 200 | | | GO, 2.00%, 03/01/2020 | | | 201 | |
| | | | | | | | |
| | | | | | | 1,525 | |
| | | | | | | | |
SEE NOTES TO FINANCIAL STATEMENTS.
| | | | | | | | |
| | | |
| FEBRUARY 28, 2018 | | J.P. MORGAN MUNICIPAL BOND FUNDS | | | | | 59 | |
JPMorgan Ultra-Short Municipal Fund
SCHEDULE OF PORTFOLIO INVESTMENTS
AS OF FEBRUARY 28, 2018 (continued)
(Amounts in thousands)
| | | | | | | | |
PRINCIPAL
AMOUNT($) | | | SECURITY DESCRIPTION | | VALUE($) | |
| | Municipal Bonds — continued | |
| | | | Hospital — 0.0% (g) | |
| | | | Louisiana Public Facilities Authority, Ochsner Clinic Foundation Project, | | | | |
| | 225 | | | Rev., 4.00%, 05/15/2019 | | | 231 | |
| | 325 | | | Rev., 5.00%, 05/15/2020 | | | 348 | |
| | | | | | | | |
| | | | | | | 579 | |
| | | | | | | | |
| | | | Housing — 0.0% (g) | |
| | 160 | | | Louisiana Public Facilities Authority, University Alexandria Student Housing Project, Series A, Rev., 2.00%, 10/01/2018 | | | 160 | |
| | | | | | | | |
| | | | Industrial Development Revenue/Pollution Control Revenue — 0.0% (g) | |
| | 150 | | | St. Charles Parish, Pollution Control, Shell Oil Co. Project, Series B, Rev., VRDO, 1.17%, 03/01/2018 (z) | | | 150 | |
| | | | | | | | |
| | | | Other Revenue — 0.5% | |
| | 125 | | | City of Shreveport, Independence Stadium Project, Rev., 3.00%, 03/01/2018 | | | 125 | |
| | 100 | | | Lafayette Consolidated Government, Public Improvement Sales Tax, Series A, Rev., 3.00%, 03/01/2019 | | | 101 | |
| | | | Louisiana Local Government Environmental Facilities & Community Development Authority, Delta Campus Facilities Project, | | | | |
| | 1,000 | | | Rev., 5.00%, 10/01/2018 | | | 1,020 | |
| | 1,715 | | | Rev., 5.00%, 10/01/2019 | | | 1,804 | |
| | 200 | | | Louisiana Local Government Environmental Facilities & Community Development Authority, Lake Charles Public Improvement Projects, Rev., 4.00%, 05/01/2020 | | | 209 | |
| | 1,500 | | | Louisiana Local Government Environmental Facilities & Community Development Authority, LCTCS Act 391 Project, Rev., 5.00%, 10/01/2021 | | | 1,651 | |
| | 4,290 | | | Louisiana Office Facilities Corp., Lease Revenue, Capitol Complex Program, Series A, Rev., 5.00%, 05/01/2020 | | | 4,570 | |
| | 275 | | | Louisiana Public Facilities Authority, Archdiocese of New Orleans Project, Rev., 5.00%, 07/01/2018 | | | 277 | |
| | | | | | | | |
| | | | | | | 9,757 | |
| | | | | | | | |
| | | | Special Tax — 0.0% (g) | |
| | 250 | | | St. Charles Parish, Limited Tax, Series A, Rev., AGM, 3.00%, 03/01/2019 | | | 254 | |
| | | | | | | | |
| | | | Transportation — 0.0% (g) | |
| | 135 | | | New Orleans Aviation Board, General Airport, North Terminal Project, Series A, Rev., 5.00%, 01/01/2020 | | | 143 | |
| | | | | | | | |
| | | | | | | | |
PRINCIPAL
AMOUNT($) | | | SECURITY DESCRIPTION | | VALUE($) | |
| | | | | | | | |
| | | | Utility — 0.0% (g) | |
| | 25 | | | State of Louisiana, Gasoline & Fuels Tax, Series A-1, Rev., 5.00%, 05/01/2018 | | | 25 | |
| | | | | | | | |
| | | | Water & Sewer — 0.0% (g) | |
| | 200 | | | City of Shreveport, Water & Sewer, Series A, Rev., AGM, 4.00%, 12/01/2018 | | | 204 | |
| | 150 | | | City of Shreveport, Water & Sewer, Junior Lien, Series B, Rev., AGM, 4.00%, 12/01/2018 | | | 152 | |
| | | | | | | | |
| | | | | | | 356 | |
| | | | | | | | |
| | | | Total Louisiana | | | 13,122 | |
| | | | | | | | |
| | | | Maine — 0.0% (g) | |
| | | | Education — 0.0% (g) | |
| | 540 | | | Maine Health & Higher Educational Facilities Authority, University of New England, Rev., 4.00%, 07/01/2019 | | | 556 | |
| | | | | | | | |
| | | | Other Revenue — 0.0% (g) | |
| | 25 | | | Maine Municipal Bond Bank, Series F, Rev., 5.00%, 11/01/2018 | | | 26 | |
| | | | | | | | |
| | | | Total Maine | | | 582 | |
| | | | | | | | |
| | | | Maryland — 1.1% | |
| | | | General Obligation — 0.7% | |
| | 20 | | | City of Frederick, Series B, GO, 3.00%, 03/01/2018 | | | 20 | |
| | 30 | | | County of Anne Arundel, GO, 4.00%, 04/01/2018 | | | 30 | |
| | 25 | | | State of Maryland, State & Local Facilities Loan of 2003, Series A, GO, 5.25%, 03/01/2018 | | | 25 | |
| | 20 | | | State of Maryland, State & Local Facilities Loan of 2010, Series B, GO, 5.00%, 03/01/2018 | | | 20 | |
| | 25 | | | State of Maryland, State & Local Facilities Loan of 2012, First Series, Series C, GO, 4.00%, 08/15/2018 | | | 25 | |
| | 3,300 | | | State of Maryland, State & Local Facilities Loan of 2013, Second Series, Series A, GO, 5.00%, 08/01/2018 | | | 3,350 | |
| | 11,300 | | | Washington Suburban Sanitary Commission, Series A, GO, VRDO, BAN, 1.09%, 03/08/2018 (z) | | | 11,300 | |
| | 50 | | | Washington Suburban Sanitary Commission, Public Improvement, GO, 5.00%, 06/01/2018 | | | 51 | |
| | | | | | | | |
| | | | | | | 14,821 | |
| | | | | | | | |
| | | | Other Revenue — 0.4% | |
| | 20 | | | City of Baltimore, Water Projects, Series A, Rev., 3.00%, 07/01/2018 | | | 20 | |
| | | | City of Rockville, Ingleside at King Farm Project, | | | | |
| | 400 | | | Rev., 5.00%, 11/01/2018 | | | 408 | |
| | 150 | | | Rev., 5.00%, 11/01/2019 | | | 156 | |
SEE NOTES TO FINANCIAL STATEMENTS.
| | | | | | |
| | | |
| 60 | | | | J.P. MORGAN MUNICIPAL BOND FUNDS | | FEBRUARY 28, 2018 |
| | | | | | | | |
PRINCIPAL
AMOUNT($) | | | SECURITY DESCRIPTION | | VALUE($) | |
| | Municipal Bonds — continued | |
| | | | Other Revenue — continued | |
| | 165 | | | Series A-2, Rev., 4.00%, 11/01/2018 | | | 167 | |
| | 100 | | | Series A-2, Rev., 4.00%, 11/01/2019 | | | 103 | |
| | 250 | | | County of Prince George’s, Collington Episcopal Life Care Community, Inc., Rev., 5.00%, 04/01/2018 | | | 250 | |
| | | | Maryland Stadium Authority, Construction & Revitalization Program, | | | | |
| | 1,760 | | | Series 2018A, Rev., 5.00%, 05/01/2018 | | | 1,770 | |
| | 1,800 | | | Series 2018A, Rev., 5.00%, 05/01/2019 | | | 1,873 | |
| | 800 | | | Series 2018A, Rev., 5.00%, 05/01/2020 | | | 857 | |
| | 1,215 | | | Series 2018A, Rev., 5.00%, 05/01/2021 | | | 1,333 | |
| | | | | | | | |
| | | | | | | 6,937 | |
| | | | | | | | |
| | | | Prerefunded — 0.0% (g) | |
| | 5 | | | County of Prince George’s, Consolidated Public Improvement Bond, GO, 4.00%, 07/15/2018 (p) | | | 5 | |
| | 50 | | | Maryland Health & Higher Educational Facilities Authority, University Maryland Medical System, Rev., AMBAC, 5.50%, 07/01/2018 (p) | | | 51 | |
| | 20 | | | State of Maryland, Department of Transportation, Rev., 4.00%, 09/01/2018 (p) | | | 20 | |
| | | | | | | | |
| | | | | | | 76 | |
| | | | | | | | |
| | | | Transportation — 0.0% (g) | |
| | | | Maryland Transportation Authority, | | | | |
| | 35 | | | Rev., 5.25%, 03/01/2018 | | | 35 | |
| | 45 | | | Series A, Rev., 5.00%, 07/01/2018 | | | 46 | |
| | | | | | | | |
| | | | | | | 81 | |
| | | | | | | | |
| | | | Total Maryland | | | 21,915 | |
| | | | | | | | |
| | | | Massachusetts — 4.6% | |
| | | | Education — 0.0% (g) | |
| | | | Massachusetts Health & Educational Facilities Authority, Tufts University, | | | | |
| | 20 | | | Rev., 5.00%, 08/15/2018 | | | 20 | |
| | 30 | | | Series J, Rev., 5.50%, 08/15/2018 | | | 31 | |
| | | | University of Massachusetts Building Authority, | | | | |
| | 75 | | | Series 1, Rev., 5.00%, 05/01/2018 | | | 76 | |
| | 20 | | | Series 2, Rev., 4.00%, 11/01/2018 | | | 20 | |
| | | | | | | | |
| | | | | | | 147 | |
| | | | | | | | |
| | | | General Obligation — 2.1% | |
| | 7,500 | | | Blue Hills Regional Technical High School District, GO, BAN, 2.00%, 07/25/2018 | | | 7,519 | |
| | 2,072 | | | City of New Bedford, GO, BAN, 2.00%, 05/03/2018 | | | 2,074 | |
| | | | | | | | |
PRINCIPAL
AMOUNT($) | | | SECURITY DESCRIPTION | | VALUE($) | |
| | | | | | | | |
| | | | General Obligation — continued | |
| | 35 | | | City of Newton, Municipal Purpose Loan, Series B, GO, 4.00%, 03/01/2018 | | | 35 | |
| | | | Commonwealth of Massachusetts, | | | | |
| | 20 | | | Series 8, GO, 4.00%, 07/01/2018 | | | 20 | |
| | 30,000 | | | Series A, GO, (ICE LIBOR USD 3 Month + 0.55%), 1.74%, 05/01/2018 (aa) | | | 29,876 | |
| | 30 | | | Series A, GO, 5.00%, 04/01/2018 | | | 30 | |
| | 20 | | | Series B, GO, 4.00%, 07/01/2018 | | | 20 | |
| | 25 | | | Series B, GO, 5.00%, 08/01/2018 | | | 25 | |
| | 2,730 | | | Series D, GO, 5.50%, 10/01/2018 | | | 2,796 | |
| | 325 | | | Series D, GO, AMBAC, 5.50%, 10/01/2019 | | | 345 | |
| | 55 | | | Town of Avon, Municipal Purpose Loan, GO, 4.00%, 12/01/2018 | | | 56 | |
| | 20 | | | Town of Braintree, Municipal Purpose Loan, GO, 5.00%, 05/15/2018 | | | 20 | |
| | 40 | | | Town of Burlington, Municipal Purpose Loan, GO, 5.00%, 07/15/2018 | | | 41 | |
| | 25 | | | Town of Framingham, Municipal Purpose Loan, GO, 5.00%, 06/15/2018 | | | 25 | |
| | 20 | | | Town of Georgetown, School Bonds, GO, 4.00%, 05/01/2018 | | | 20 | |
| | 25 | | | Town of Grafton, Unlimited Tax, GO, 4.00%, 04/01/2018 | | | 25 | |
| | 35 | | | Town of Marblehead, Unlimited Tax, GO, 5.00%, 08/01/2018 | | | 36 | |
| | 20 | | | Town of Marshfield, Series A, GO, 5.00%, 06/15/2018 | | | 20 | |
| | 40 | | | Town of Milford, School Project Loan, GO, 5.00%, 05/01/2018 | | | 40 | |
| | | | | | | | |
| | | | | | | 43,023 | |
| | | | | | | | |
| | | | Hospital — 0.5% | |
| | 335 | | | Massachusetts Development Finance Agency, Lawrence General Hospital, Rev., 5.00%, 07/01/2019 | | | 346 | |
| | 10,000 | | | Massachusetts Development Finance Agency, Partners Healthcare System Issue, Series 2017S-5, Rev., (Dow Jones US Mid Cap Sofware Index GICS Level 4 USD + 0.42%), 1.51%, 03/08/2018 (aa) | | | 10,085 | |
| | | | | | | | |
| | | | | | | 10,431 | |
| | | | | | | | |
| | | | Housing — 0.3% | |
| | 5,700 | | | Massachusetts Housing Finance Agency, Construction Loan, Series A, Rev., 1.85%, 06/01/2020 | | | 5,700 | |
| | | | | | | | |
SEE NOTES TO FINANCIAL STATEMENTS.
| | | | | | | | |
| | | |
| FEBRUARY 28, 2018 | | J.P. MORGAN MUNICIPAL BOND FUNDS | | | | | 61 | |
JPMorgan Ultra-Short Municipal Fund
SCHEDULE OF PORTFOLIO INVESTMENTS
AS OF FEBRUARY 28, 2018 (continued)
(Amounts in thousands)
| | | | | | | | |
PRINCIPAL
AMOUNT($) | | | SECURITY DESCRIPTION | | VALUE($) | |
| | Municipal Bonds — continued | |
| | | | Industrial Development Revenue/Pollution Control Revenue — 0.0% (g) | |
| | 25 | | | Massachusetts Clean Water Trust, Pool Program, Series A, Rev., 5.25%, 08/01/2018 | | | 25 | |
| | | | | | | | |
| | | | Other Revenue — 0.0% (g) | |
| | 620 | | | Massachusetts Development Finance Agency, Newbridge on the Charles, Inc., Series 20, Rev., 3.00%, 10/01/2019 (e) | | | 624 | |
| | | | | | | | |
| | | | Prerefunded — 0.5% | |
| | 45 | | | City of Boston, Series A, GO, 5.00%, 04/01/2018 (p) | | | 45 | |
| | 20 | | | City of Quincy, GO, AGM, 4.38%, 03/15/2018 (p) | | | 20 | |
| | 25 | | | Commonwealth of Massachusetts, Consolidated Loan of 2008, Series A, GO, 5.00%, 08/01/2018 (p) | | | 25 | |
| | | | Massachusetts Bay Transportation Authority, | | | | |
| | 50 | | | Series A, Rev., 4.75%, 07/01/2018 (p) | | | 50 | |
| | 50 | | | Series A, Rev., 5.00%, 07/01/2018 (p) | | | 51 | |
| | 410 | | | Series C, Rev., 5.00%, 07/01/2018 (p) | | | 415 | |
| | 4,720 | | | Massachusetts Clean Water Trust, State Revolving Fund, Rev., 5.00%, 08/01/2020 (p) | | | 5,091 | |
| | 15 | | | Massachusetts Development Finance Agency, Harvard, Series A, Rev., 5.50%, 11/15/2018 (p) | | | 16 | |
| | 20 | | | Massachusetts Development Finance Agency, Phillips Academy, Rev., 5.00%, 09/01/2018 (p) | | | 20 | |
| | | | Massachusetts Health & Educational Facilities Authority, Caregroup, | | | | |
| | 75 | | | Series B-2, Rev., NATL-RE, 5.38%, 08/01/2018 (p) | | | 76 | |
| | 25 | | | Series E-1, Rev., 5.00%, 07/01/2018 (p) | | | 25 | |
| | 35 | | | Series E-1, Rev., 5.13%, 07/01/2018 (p) | | | 36 | |
| | 4,945 | | | Series E-2, Rev., 5.38%, 07/01/2018 (p) | | | 5,010 | |
| | | | Massachusetts Water Resources Authority, | | | | |
| | 20 | | | Series A, Rev., AMBAC, 5.00%, 08/01/2018 (p) | | | 20 | |
| | 55 | | | Series B, Rev., AMBAC, 5.00%, 08/01/2018 (p) | | | 56 | |
| | 30 | | | Springfield Water & Sewer Commission, Series A, Rev., AGC, 5.00%, 10/15/2018 (p) | | | 31 | |
| | 25 | | | Town of Wellfleet, Municipal Purpose Loan, GO, 5.00%, 05/01/2018 (p) | | | 25 | |
| | | | University of Massachusetts Building Authority Project, | | | | |
| | 20 | | | Series 2, Rev., AGM, 4.60%, 05/01/2018 (p) | | | 20 | |
| | 20 | | | Series 2, Rev., AGM, 4.80%, 05/01/2018 (p) | | | 20 | |
| | | | | | | | |
PRINCIPAL
AMOUNT($) | | | SECURITY DESCRIPTION | | VALUE($) | |
| | | | | | | | |
| | | | Prerefunded — continued | |
| | 120 | | | Series 2, Rev., 5.00%, 05/01/2018 (p) | | | 121 | |
| | | | | | | | |
| | | | | | | 11,173 | |
| | | | | | | | |
| | | | Transportation — 0.7% | |
| | 14,245 | | | Massachusetts Bay Transportation Authority, General Transportation System, Series A-2, Rev., VRDO, 1.10%, 03/08/2018 (z) | | | 14,245 | |
| | | | Massachusetts Port Authority, | | | | |
| | 25 | | | Series A, Rev., 4.00%, 07/01/2018 | | | 25 | |
| | 25 | | | Series C, Rev., 5.00%, 07/01/2018 | | | 26 | |
| | | | | | | | |
| | | | | | | 14,296 | |
| | | | | | | | |
| | | | Water & Sewer — 0.5% | |
| | | | Massachusetts Clean Water Trust, State Revolving Fund, | | | | |
| | 25 | | | Series 15A, Rev., 5.00%, 08/01/2018 | | | 26 | |
| | 200 | | | Series 15A, Rev., 5.00%, 08/01/2020 | | | 216 | |
| | 25 | | | Subseries 16B, Rev., 5.00%, 08/01/2018 | | | 25 | |
| | | | Massachusetts Water Resources Authority, | | | | |
| | 9,735 | | | Series A-3, Rev., VRDO, 1.11%, 03/08/2018 (z) | | | 9,735 | |
| | 20 | | | Series C, Rev., 4.00%, 08/01/2018 | | | 20 | |
| | | | | | | | |
| | | | | | | 10,022 | |
| | | | | | | | |
| | | | Total Massachusetts | | | 95,441 | |
| | | | | | | | |
| | | | Michigan — 1.8% | |
| | | | Education — 0.0% (g) | |
| | 25 | | | Michigan State University, Series A, Rev., 5.00%, 08/15/2018 | | | 25 | |
| | 20 | | | Southfield Library Building Authority, Limited Tax, Rev., 5.00%, 05/01/2018 | | | 20 | |
| | | | | | | | |
| | | | | | | 45 | |
| | | | | | | | |
| | | | General Obligation — 0.3% | |
| | 50 | | | Ann Arbor Public School District, GO, Q-SBLF, 4.00%, 05/01/2018 | | | 50 | |
| | 20 | | | Birmingham City Public School District, GO, 5.00%, 05/01/2018 | | | 20 | |
| | 30 | | | Brighton Area School District, GO, Q-SBLF, 4.00%, 05/01/2018 | | | 30 | |
| | 115 | | | Cedar Springs Public School District, GO, Q-SBLF, 4.00%, 05/01/2018 | | | 116 | |
| | 140 | | | Charlotte Public School District, GO, Q-SBLF, 4.00%, 05/01/2018 | | | 141 | |
| | 40 | | | Charter Township of Northville, GO, 4.00%, 04/01/2018 | | | 40 | |
| | 40 | | | Chippewa Valley Schools, Series A, GO, Q-SBLF, 5.00%, 05/01/2018 | | | 40 | |
SEE NOTES TO FINANCIAL STATEMENTS.
| | | | | | |
| | | |
| 62 | | | | J.P. MORGAN MUNICIPAL BOND FUNDS | | FEBRUARY 28, 2018 |
| | | | | | | | |
PRINCIPAL
AMOUNT($) | | | SECURITY DESCRIPTION | | VALUE($) | |
| | Municipal Bonds — continued | |
| | | | General Obligation — continued | |
| | | | City of Romulus, Capital Improvement, | | | | |
| | 165 | | | Series B, GO, 3.00%, 11/01/2018 | | | 166 | |
| | 140 | | | Series B, GO, 3.00%, 11/01/2019 | | | 143 | |
| | 2,750 | | | Fraser Public School District, GO, Q-SBLF, 5.00%, 05/01/2018 | | | 2,766 | |
| | 200 | | | Mancelona Public Schools, GO, Q-SBLF, 2.00%, 05/01/2018 | | | 200 | |
| | 200 | | | Meridian Public School District, GO, Q-SBLF, 1.50%, 05/01/2018 | | | 200 | |
| | 25 | | | Northville Public Schools, GO, Q-SBLF, 5.00%, 05/01/2018 | | | 25 | |
| | 200 | | | Okemos Public Schools, School Improvement & Bus, GO, Q-SBLF, 1.50%, 05/01/2018 | | | 200 | |
| | 30 | | | Plymouth-Canton Community School District, School Building & Site, GO, AGM, Q-SBLF, 5.25%, 05/01/2018 | | | 30 | |
| | 2,425 | | | Spring Lake Public Schools, School Building & Site, GO, Q-SBLF, 5.00%, 11/01/2018 | | | 2,481 | |
| | 25 | | | State of Michigan, Environmental Program, Series A, GO, 5.00%, 05/01/2018 | | | 25 | |
| | 75 | | | Walled Lake Consolidated School District, GO, Q-SBLF, 3.50%, 05/01/2018 | | | 75 | |
| | | | | | | | |
| | | | | | | 6,748 | |
| | | | | | | | |
| | | | Hospital — 0.7% | |
| | 25 | | | Grand Traverse County Hospital Finance Authority, Munson Healthcare, Series A, Rev., 4.00%, 07/01/2018 | | | 25 | |
| | | | Michigan Finance Authority, Trinity Health Credit Group, | | | | |
| | 10,000 | | | Series 2013MI-1, Rev., VRDO, 1.14%, 06/01/2018 (z) | | | 10,000 | |
| | 120 | | | Series A, Rev., 5.00%, 12/01/2018 | | | 123 | |
| | | | Michigan State Hospital Finance Authority, Ascension Health Senior Credit Group, | | | | |
| | 330 | | | Rev., 5.00%, 11/15/2018 | | | 338 | |
| | 30 | | | Series F-3, Rev., 1.40%, 06/29/2018 (z) | | | 30 | |
| | 2,710 | | | Michigan State Hospital Finance Authority, Ascension Health Subordinate Credit Group, Subseries A-1, Rev., 1.37%, 05/01/2020 (z) | | | 2,667 | |
| | | | | | | | |
| | | | | | | 13,183 | |
| | | | | | | | |
| | | | Housing — 0.7% | |
| | 14,300 | | | Michigan State Housing Development Authority, Single-Family Mortgage, Series D, Rev., VRDO, 1.20%, 03/08/2018 (z) | | | 14,300 | |
| | | | | | | | |
| | | | Other Revenue — 0.0% (g) | |
| | 50 | | | Michigan Finance Authority, Unemployment Obligation Assessment, Series A, Rev., 5.00%, 07/01/2018 | | | 51 | |
| | | | | | | | |
| | | | | | | | |
PRINCIPAL
AMOUNT($) | | | SECURITY DESCRIPTION | | VALUE($) | |
| | | | | | | | |
| | | | Prerefunded — 0.0% (g) | |
| | 35 | | | City of Battle Creek, GO, 5.00%, 06/01/2018 (p) | | | 36 | |
| | 55 | | | Dearborn School District, Limited Tax, Community College, GO, 4.25%, 05/01/2018 (p) | | | 55 | |
| | 20 | | | Ferris State University, Rev., AGC, 4.75%, 10/01/2018 (p) | | | 21 | |
| | 30 | | | Grand Valley State University, Series A, Rev., AGM, 4.13%, 06/01/2018 (p) | | | 30 | |
| | 40 | | | Jackson College, Community College Building & Site, GO, AGM, 4.13%, 05/01/2018 (p) | | | 40 | |
| | 40 | | | Rockford Public Schools, School Building & Site, GO, AGM, Q-SBLF, 5.00%, 05/01/2018 (p) | | | 40 | |
| | 50 | | | Saginaw City School District, School Building & Site, GO, AGM, Q-SBLF, 4.63%, 05/01/2018 (p) | | | 50 | |
| | 25 | | | Saginaw Township Community School District, School Building & Site, GO, AGM, Q-SBLF, 4.00%, 05/01/2018 (p) | | | 25 | |
| | 20 | | | State of Michigan, School Loan, Series A, GO, 5.00%, 11/01/2018 (p) | | | 21 | |
| | 30 | | | Van Dyke Public Schools, School Building & Site, GO, AGM, Q-SBLF, 5.00%, 05/01/2018 (p) | | | 30 | |
| | 25 | | | Western Michigan University, Rev., AGM, 5.00%, 05/15/2018 (p) | | | 25 | |
| | | | | | | | |
| | | | | | | 373 | |
| | | | | | | | |
| | | | Transportation — 0.1% | |
| | 50 | | | State of Michigan, Comprehensive Transportation, Rev., 5.25%, 05/15/2018 | | | 50 | |
| | | | Wayne County Airport Authority, Junior Lien, | | | | |
| | 400 | | | Series B, Rev., 5.00%, 12/01/2018 | | | 410 | |
| | 550 | | | Series B, Rev., 5.00%, 12/01/2019 | | | 579 | |
| | 550 | | | Series B, Rev., 5.00%, 12/01/2020 | | | 591 | |
| | | | | | | | |
| | | | | | | 1,630 | |
| | | | | | | | |
| | | | Water & Sewer — 0.0% (g) | |
| | 25 | | | North Kent Sewer Authority, Rev., 3.00%, 11/01/2018 | | | 25 | |
| | | | | | | | |
| | | | Total Michigan | | | 36,355 | |
| | | | | | | | |
| | | | Minnesota — 1.2% | |
| | | | Certificate of Participation/Lease — 0.0% (g) | |
| | 930 | | | St. Paul Independent School District No. 625, Series B, COP, 5.00%, 02/01/2021 | | | 1,013 | |
| | | | | | | | |
| | | | Education — 0.3% | |
| | 50 | | | City of Deephaven, Minnesota Charter School Lease, Eagle Ridge Academy Project, Series A, Rev., 3.00%, 07/01/2019 | | | 50 | |
SEE NOTES TO FINANCIAL STATEMENTS.
| | | | | | | | |
| | | |
| FEBRUARY 28, 2018 | | J.P. MORGAN MUNICIPAL BOND FUNDS | | | | | 63 | |
JPMorgan Ultra-Short Municipal Fund
SCHEDULE OF PORTFOLIO INVESTMENTS
AS OF FEBRUARY 28, 2018 (continued)
(Amounts in thousands)
| | | | | | | | |
PRINCIPAL
AMOUNT($) | | | SECURITY DESCRIPTION | | VALUE($) | |
| | Municipal Bonds — continued | |
| | | | Education — continued | |
| | 735 | | | Minnesota Higher Education Facilities Authority, College of St. Benedict, Series 2017, Rev., 3.00%, 03/01/2018 | | | 735 | |
| | | | Minnesota Higher Education Facilities Authority, Trustees of the Hamline University, | | | | |
| | 300 | | | Rev., 4.00%, 10/01/2018 | | | 303 | |
| | 750 | | | Rev., 4.00%, 10/01/2019 | | | 772 | |
| | 780 | | | Rev., 4.00%, 10/01/2020 | | | 812 | |
| | 25 | | | Minnesota State Colleges & Universities, Rev., 2.00%, 10/01/2018 | | | 25 | |
| | 2,715 | | | University of Minnesota, Series A, Rev., 5.00%, 04/01/2022 | | | 3,042 | |
| | | | | | | | |
| | | | | | | 5,739 | |
| | | | | | | | |
| | | | General Obligation — 0.2% | |
| | | | State of Minnesota, Trunk Highway, | | | | |
| | 1,570 | | | Series B, GO, 4.00%, 08/01/2018 | | | 1,588 | |
| | 1,765 | | | Series B, GO, 5.00%, 08/01/2021 | | | 1,952 | |
| | | | | | | | |
| | | | | | | 3,540 | |
| | | | | | | | |
| | | | Hospital — 0.6% | |
| | | | City of Maple Grove, Maple Grove Hospital Corporation, | | | | |
| | 650 | | | Rev., 3.00%, 05/01/2018 | | | 652 | |
| | 930 | | | Rev., 3.00%, 05/01/2019 | | | 943 | |
| | | | City of Rochester, Health Care Facilities, Mayo Clinic, | | | | |
| | 10,000 | | | Series A, Rev., VRDO, 1.05%, 03/08/2018 (z) | | | 10,000 | |
| | 335 | | | Series A, Rev., 4.00%, 11/15/2018 (z) | | | 341 | |
| | 850 | | | St. Paul Minnesota, Housing & Redevelopment Authority Health Care, Series A, Rev., 2.00%, 11/15/2018 | | | 855 | |
| | | | | | | | |
| | | | | | | 12,791 | |
| | | | | | | | |
| | | | Housing — 0.1% | |
| | | | City of St. Paul Park, Senior Housing & Health Care, Presbyterian Homes Bloomington Project, | | | | |
| | 445 | | | Rev., 3.00%, 09/01/2018 | | | 449 | |
| | 795 | | | Rev., 3.00%, 09/01/2019 | | | 814 | |
| | 515 | | | St. Paul Minnesota, Housing & Redevelopment Authority, Parking Enterprise, Series A, Rev., 3.00%, 08/01/2020 | | | 530 | |
| | | | | | | | |
| | | | | | | 1,793 | |
| | | | | | | | |
| | | | Other Revenue — 0.0% (g) | |
| | | | State of Minnesota, General Fund Appropriation, | | | | |
| | 40 | | | Series B, Rev., 5.00%, 03/01/2018 | | | 40 | |
| | 400 | | | Series B, Rev., 5.00%, 03/01/2020 | | | 427 | |
| | | | | | | | |
PRINCIPAL
AMOUNT($) | | | SECURITY DESCRIPTION | | VALUE($) | |
| | | | | | | | |
| | | | Other Revenue — continued | |
| | 25 | | | State of Minnesota, Public Safety Radio Communications System Project, Rev., AGC, 4.00%, 06/01/2018 (p) | | | 25 | |
| | 25 | | | State of Minnesota, Retirement System Building, Rev., 2.00%, 06/01/2018 | | | 25 | |
| | | | | | | | |
| | | | | | | 517 | |
| | | | | | | | |
| | | | Utility — 0.0% (g) | |
| | 20 | | | City of Chaska, Electric Generating Facilities, Series A, Rev., 4.00%, 10/01/2018 | | | 20 | |
| | | | | | | | |
| | | | Total Minnesota | | | 25,413 | |
| | | | | | | | |
| | | | Mississippi — 1.1% | |
| | | | General Obligation — 0.2% | |
| | 405 | | | County of Hinds, Series A, GO, 2.00%, 08/01/2018 | | | 406 | |
| | 4,000 | | | State of Mississippi, Series F, GO, 5.00%, 11/01/2020 | | | 4,338 | |
| | | | | | | | |
| | | | | | | 4,744 | |
| | | | | | | | |
| | | | Industrial Development Revenue/Pollution Control Revenue — 0.3% | |
| | 6,200 | | | Mississippi Business Finance Corp., Gulf Opportunity Zone Industrial Development, Chevron USA, Inc. Project, Series E, Rev., VRDO, 1.09%, 03/08/2018 (z) | | | 6,200 | |
| | | | | | | | |
| | | | Other Revenue — 0.6% | |
| | 11,150 | | | Mississippi Business Finance Corp., Gulf Opportunity Zone Industrial Development, Chevron USA, Inc. Project, Series A, Rev., VRDO, 1.16%, 03/08/2018 (z) | | | 11,150 | |
| | 100 | | | Mississippi Development Bank, Rankin County Bond Project, Rev., 3.00%, 03/01/2022 | | | 103 | |
| | | | | | | | |
| | | | | | | 11,253 | |
| | | | | | | | |
| | | | Total Mississippi | | | 22,197 | |
| | | | | | | | |
| | | | Missouri — 1.5% | |
| | | | Certificate of Participation/Lease — 0.0% (g) | |
| | | | City of Arnold, | | | | |
| | 120 | | | COP, 3.00%, 12/15/2018 | | | 121 | |
| | 120 | | | COP, 3.00%, 12/15/2019 | | | 123 | |
| | | | City of Waynesville, | | | | |
| | 200 | | | Series C, COP, 2.00%, 04/15/2018 | | | 200 | |
| | 125 | | | Series C, COP, 2.00%, 04/15/2019 | | | 125 | |
| | 250 | | | Series C, COP, 2.00%, 04/15/2020 | | | 250 | |
| | | | | | | | |
| | | | | | | 819 | |
| | | | | | | | |
SEE NOTES TO FINANCIAL STATEMENTS.
| | | | | | |
| | | |
| 64 | | | | J.P. MORGAN MUNICIPAL BOND FUNDS | | FEBRUARY 28, 2018 |
| | | | | | | | |
PRINCIPAL
AMOUNT($) | | | SECURITY DESCRIPTION | | VALUE($) | |
| | Municipal Bonds — continued | |
| | | | General Obligation — 0.0% (g) | |
| | 25 | | | Columbia School District, Refunding & Improvement, GO, 2.00%, 03/01/2018 | | | 25 | |
| | 20 | | | Jackson County Reorganized School District No. 7, Series B, GO, 4.00%, 03/01/2018 | | | 20 | |
| | 30 | | | Springfield School District No. R-12, School, Missouri Direct Deposit, Series B, GO, 4.00%, 03/01/2018 | | | 30 | |
| | | | | | | | |
| | | | | | | 75 | |
| | | | | | | | |
| | | | Industrial Development Revenue/Pollution Control Revenue — 0.4% | |
| | 250 | | | Branson IDA, Branson Shoppes Redevelopment Project, Series A, Rev., 3.00%, 11/01/2018 | | | 251 | |
| | | | Cape Girardeau County IDA, South Eastern Health, | | | | |
| | 2,650 | | | Rev., 2.00%, 03/01/2018 | | | 2,650 | |
| | 300 | | | Rev., 5.00%, 03/01/2019 | | | 307 | |
| | 320 | | | Rev., 5.00%, 03/01/2020 | | | 334 | |
| | 300 | | | Hannibal IDA, Healthcare Facilities, Rev., 5.00%, 10/01/2020 | | | 319 | |
| | 100 | | | Kirkwood IDA, Aberdeen Heights, Series A, Rev., 5.00%, 05/15/2018 | | | 101 | |
| | 20 | | | Missouri State Environmental Improvement & Energy Resources Authority, State Revolving Funds Program, Series A, Rev., 5.00%, 07/01/2018 | | | 20 | |
| | | | Riverside IDA, Riverside Horizons Infrastructure Project, | | | | |
| | 1,000 | | | Rev., 2.00%, 05/01/2018 | | | 1,000 | |
| | 2,055 | | | Rev., 3.00%, 05/01/2019 | | | 2,083 | |
| | | | | | | | |
| | | | | | | 7,065 | |
| | | | | | | | |
| | | | Other Revenue — 1.0% | |
| | 14,500 | | | Missouri Development Finance Board, Cultural Facilities, The Nelson Gallery Foundation, Series A, Rev., VRDO, 1.10%, 03/01/2018 (z) | | | 14,500 | |
| | 25 | | | Missouri State Board of Public Buildings, Series A, Rev., 4.00%, 10/01/2018 | | | 26 | |
| | 5,975 | | | Missouri State Regional Convention & Sports Complex Authority, Convention & Sports Facility Project, Series 2013A, Rev., 5.00%, 08/15/2018 | | | 6,070 | |
| | | | | | | | |
| | | | | | | 20,596 | |
| | | | | | | | |
| | | | Prerefunded — 0.0% (g) | |
| | 20 | | | City of Kansas, Downtown Arena Project, Series C, Rev., 5.00%, 04/01/2018 (p) | | | 20 | |
| | 100 | | | Missouri State Health & Educational Facilities Authority, Health Facilities, Series A, Rev., AGM, 5.50%, 11/15/2018 (p) | �� | | 103 | |
| | | | | | | | |
PRINCIPAL
AMOUNT($) | | | SECURITY DESCRIPTION | | VALUE($) | |
| | | | | | | | |
| | | | Prerefunded — continued | |
| | 15 | | | Missouri State Health & Educational Facilities Authority, Health Facilities, Coxhealth, Series A, Rev., 5.50%, 11/15/2018 (p) | | | 15 | |
| | | | | | | | |
| | | | | | | 138 | |
| | | | | | | | |
| | | | Transportation — 0.1% | |
| | 1,305 | | | City of St. Louis, Lambert International Airport, Series B, Rev., AGM, 5.00%, 07/01/2021 | | | 1,421 | |
| | 35 | | | Missouri Highways & Transportation Commission, Federal Reimbursement, Series A, Rev., 5.00%, 05/01/2018 | | | 35 | |
| | | | | | | | |
| | | | | | | 1,456 | |
| | | | | | | | |
| | | | Total Missouri | | | 30,149 | |
| | | | | | | | |
| | | | Montana — 0.1% | |
| | | | Other Revenue — 0.1% | |
| | 2,600 | | | Montana Board of Investments, Municipal Finance Consolidation Act, Intercap Revolving Program, Series 2000, Rev., 1.20%, 03/01/2019 (z) | | | 2,600 | |
| | | | | | | | |
| | | | Nebraska — 0.1% | |
| | | | General Obligation — 0.1% | |
| | 50 | | | Douglas County School District No. 17, Millard Public Schools, GO, 4.00%, 06/15/2018 | | | 50 | |
| | | | Papio-Missouri River Natural Resource District, | | | | |
| | 330 | | | GO, 3.00%, 12/15/2018 | | | 334 | |
| | 720 | | | GO, 4.00%, 12/15/2019 | | | 750 | |
| | 405 | | | GO, 4.00%, 12/15/2020 | | | 429 | |
| | | | | | | | |
| | | | | | | 1,563 | |
| | | | | | | | |
| | | | Hospital — 0.0% (g) | |
| | | | Madison County Hospital Authority No. 1, Faith Regional Health Services Project, | | | | |
| | 100 | | | Series A, Rev., 3.00%, 07/01/2018 | | | 100 | |
| | 725 | | | Series A, Rev., 4.00%, 07/01/2019 | | | 743 | |
| | | | | | | | |
| | | | | | | 843 | |
| | | | | | | | |
| | | | Other Revenue — 0.0% (g) | |
| | 250 | | | Upper Republican Natural Resource District, Limited Obligation, Occupation Tax Supported, River Flow Enhancement, Rev., AGM, 3.00%, 12/15/2020 | | | 257 | |
| | | | | | | | |
| | | | Prerefunded — 0.0% (g) | |
| | 20 | | | Douglas County Hospital Authority No. 3, Rev., BHAC-CR, 5.50%, 11/01/2018 (p) | | | 21 | |
| | | | | | | | |
| | | | Utility — 0.0% (g) | |
| | 20 | | | City of Lincoln, Electric System, Rev., 5.00%, 09/01/2018 | | | 20 | |
| | | | | | | | |
| | | | Total Nebraska | | | 2,704 | |
| | | | | | | | |
SEE NOTES TO FINANCIAL STATEMENTS.
| | | | | | | | |
| | | |
| FEBRUARY 28, 2018 | | J.P. MORGAN MUNICIPAL BOND FUNDS | | | | | 65 | |
JPMorgan Ultra-Short Municipal Fund
SCHEDULE OF PORTFOLIO INVESTMENTS
AS OF FEBRUARY 28, 2018 (continued)
(Amounts in thousands)
| | | | | | | | |
PRINCIPAL
AMOUNT($) | | | SECURITY DESCRIPTION | | VALUE($) | |
| | Municipal Bonds — continued | |
| | | | Nevada — 0.3% | |
| | | | General Obligation — 0.0% (g) | |
| | 30 | | | Clark County Water Reclamation District, GO, 5.50%, 07/01/2018 | | | 30 | |
| | | | Las Vegas Valley Water District, | | | | |
| | 35 | | | Series A, GO, 4.00%, 06/01/2018 | | | 35 | |
| | 45 | | | Series B, GO, 4.00%, 06/01/2018 | | | 46 | |
| | 105 | | | State of Nevada, Capital Improvement, Series C, GO, 5.00%, 06/01/2018 | | | 106 | |
| | | | | | | | |
| | | | | | | 217 | |
| | | | | | | | |
| | | | Hospital — 0.1% | |
| | | | City of Carson, Carson Tahoe Regional Healthcare Project, | | | | |
| | 460 | | | Rev., 5.00%, 09/01/2018 | | | 467 | |
| | 325 | | | Rev., 5.00%, 09/01/2019 | | | 340 | |
| | 250 | | | Rev., 5.00%, 09/01/2020 | | | 267 | |
| | 610 | | | Rev., 5.00%, 09/01/2027 | | | 697 | |
| | | | | | | | |
| | | | | | | 1,771 | |
| | | | | | | | |
| | | | Other Revenue — 0.0% (g) | |
| | 350 | | | City of Henderson Nevada Local Improvement District No. T-14, Rev., 2.50%, 03/01/2019 | | | 352 | |
| | 200 | | | City of Henderson Nevada Local Improvement District No. T-17, Rev., 2.00%, 09/01/2019 | | | 200 | |
| | | | | | | | |
| | | | | | | 552 | |
| | | | | | | | |
| | | | Prerefunded — 0.0% (g) | |
| | 20 | | | City of Reno, Rev., AGM, 5.25%, 06/01/2018 (p) | | | 20 | |
| | 70 | | | City of Reno, Washoe Medical Center, Series A, Rev., AGM, 5.25%, 06/01/2018 (p) | | | 71 | |
| | 310 | | | Clark County School District, Series A, GO, 5.00%, 06/15/2018 (p) | | | 313 | |
| | 20 | | | Nevada System of Higher Education, Series A, Rev., BHAC-CR, 5.00%, 07/01/2018 (p) | | | 21 | |
| | 20 | | | State of Nevada, Highway Improvement, Motor Vehicle Fuel Tax, Rev., AGM, 5.00%, 06/01/2018 (p) | | | 20 | |
| | | | | | | | |
| | | | | | | 445 | |
| | | | | | | | |
| | | | Transportation — 0.0% (g) | |
| | 25 | | | County of Clark Department of Aviation, Airport System, Series B, Rev., 5.00%, 07/01/2018 | | | 25 | |
| | | | | | | | |
| | | | Utility — 0.2% | |
| | 3,000 | | | County of Clark, Nevada Power Company Projects, Rev., 1.60%, 05/21/2020 (z) | | | 2,970 | |
| | 580 | | | County of Washoe, Gas & Water Facilities, Sierra Pacific Power Company Project, Series B, Rev., 3.00%, 06/01/2022 (z) | | | 593 | |
| | | | | | | | |
| | | | | | | 3,563 | |
| | | | | | | | |
| | | | | | | | |
PRINCIPAL
AMOUNT($) | | | SECURITY DESCRIPTION | | VALUE($) | |
| | | | | | | | |
| | | | Water & Sewer — 0.0% (g) | |
| | 30 | | | Truckee Meadows Water Authority, Series A, Rev., 4.00%, 07/01/2018 | | | 30 | |
| | | | | | | | |
| | | | Total Nevada | | | 6,603 | |
| | | | | | | | |
| | | | New Hampshire — 0.1% | |
| | | | Education — 0.1% | |
| | 1,385 | | | New Hampshire Health & Education Facilities Authority Act, University System, Series A, Rev., 5.00%, 07/01/2019 | | | 1,449 | |
| | | | | | | | |
| | | | General Obligation — 0.0% (g) | |
| | 35 | | | State of New Hampshire, Capital Improvement, Series C, GO, 4.38%, 05/01/2018 | | | 35 | |
| | | | | | | | |
| | | | Prerefunded — 0.0% (g) | |
| | 55 | | | State of New Hampshire, Capital Improvement, Series C, GO, 4.75%, 11/01/2018 (p) | | | 56 | |
| | | | | | | | |
| | | | Transportation — 0.0% (g) | |
| | 25 | | | New Hampshire State Turnpike System, Rev., 5.00%, 10/01/2018 | | | 26 | |
| | | | | | | | |
| | | | Total New Hampshire | | | 1,566 | |
| | | | | | | | |
| | | | New Jersey — 10.8% | |
| | | | Education — 0.3% | |
| | | | New Jersey Economic Development Authority, School Facilities Construction, | | | | |
| | 500 | | | Series DDD, Rev., 5.00%, 06/15/2019 | | | 517 | |
| | 500 | | | Series DDD, Rev., 5.00%, 06/15/2020 | | | 528 | |
| | 5,000 | | | New Jersey EDA, School Facilities Construction, Series XX, Rev., 5.00%, 06/15/2021 | | | 5,351 | |
| | 20 | | | New Jersey Educational Facilities Authority, Princeton University, Series A, Rev., 5.00%, 07/01/2018 | | | 20 | |
| | | | | | | | |
| | | | | | | 6,416 | |
| | | | | | | | |
| | | | General Obligation — 8.4% | |
| | 2,845 | | | Borough of Alpha, GO, BAN, 2.50%, 12/10/2018 | | | 2,861 | |
| | 9,254 | | | Borough of Avalon, GO, BAN, 2.50%, 02/19/2019 | | | 9,335 | |
| | 12,556 | | | Borough of Beachwood, GO, BAN, 3.00%, 03/06/2019 | | | 12,728 | |
| | 5,092 | | | Borough of Bogota, GO, BAN, 2.25%, 05/11/2018 | | | 5,101 | |
| | | | Borough of East Rutherford, | | | | |
| | 5,274 | | | GO, BAN, 2.25%, 10/19/2018 | | | 5,288 | |
| | 260 | | | GO, AGM, 4.00%, 12/01/2018 | | | 264 | |
| | 145 | | | GO, AGM, 5.00%, 12/01/2019 | | | 152 | |
| | 290 | | | GO, AGM, 5.00%, 12/01/2020 | | | 312 | |
SEE NOTES TO FINANCIAL STATEMENTS.
| | | | | | |
| | | |
| 66 | | | | J.P. MORGAN MUNICIPAL BOND FUNDS | | FEBRUARY 28, 2018 |
| | | | | | | | |
PRINCIPAL
AMOUNT($) | | | SECURITY DESCRIPTION | | VALUE($) | |
| | Municipal Bonds — continued | |
| | | | General Obligation — continued | |
| | 5,284 | | | Borough of Englewood Cliffs, GO, BAN, 2.50%, 02/22/2019 | | | 5,330 | |
| | 2,967 | | | Borough of Highlands, GO, BAN, 2.25%, 10/05/2018 | | | 2,973 | |
| | 25 | | | Borough of Metuchen, GO, 4.00%, 09/01/2018 | | | 25 | |
| | 5,251 | | | Borough of Oakland, GO, BAN, 2.50%, 12/14/2018 | | | 5,281 | |
| | 3,280 | | | Borough of Ramsey, Water-Sewer Utility, GO, BAN, 2.25%, 06/08/2018 | | | 3,288 | |
| | 6,173 | | | Borough of Rockaway, GO, BAN, 2.25%, 09/14/2018 | | | 6,187 | |
| | 5,530 | | | Borough of Woodcliff Lake, GO, BAN, 2.50%, 02/22/2019 | | | 5,578 | |
| | 3,034 | | | Borough of Wood-Ridge, GO, BAN, 2.25%, 11/08/2018 | | | 3,050 | |
| | | | City of Atlantic, | | | | |
| | 250 | | | Series B, GO, AGM, 4.00%, 03/01/2019 | | | 255 | |
| | 200 | | | Series B, GO, AGM, 5.00%, 03/01/2020 | | | 211 | |
| | 650 | | | City of Atlantic, Tax Appeal, Series A, GO, 5.00%, 03/01/2020 | | | 686 | |
| | 1,046 | | | City of Bordentown, Series A, GO, BAN, 2.25%, 05/17/2018 | | | 1,048 | |
| | 2,588 | | | City of Burlington, Series A, GO, BAN, 2.25%, 06/06/2018 | | | 2,593 | |
| | 3,467 | | | City of Pleasantville, Series A, GO, BAN, 2.25%, 08/16/2018 | | | 3,473 | |
| | 1,000 | | | City of Union, County of Hudson, Series 2017, GO, 4.00%, 11/01/2019 | | | 1,030 | |
| | 25 | | | County of Burlington, Series A-1, GO, 4.00%, 09/01/2018 | | | 25 | |
| | 15 | | | County of Essex, Series A, GO, 4.00%, 10/01/2018 | | | 15 | |
| | 35 | | | County of Monmouth, GO, 4.00%, 03/01/2018 | | | 35 | |
| | 30 | | | County of Ocean, GO, 4.00%, 08/01/2018 | | | 30 | |
| | 20 | | | County of Somerset, GO, 4.00%, 12/01/2018 | | | 20 | |
| | | | County of Union, | | | | |
| | 30 | | | GO, 4.00%, 03/01/2018 | | | 30 | |
| | 30 | | | GO, 5.00%, 03/01/2018 | | | 30 | |
| | 30 | | | Middletown Township Board of Education, School Building, GO, 3.00%, 08/01/2018 | | | 30 | |
| | | | Mullica Township School District, | | | | |
| | 106 | | | GO, 2.00%, 09/15/2018 | | | 106 | |
| | 105 | | | GO, 2.00%, 09/15/2019 | | | 105 | |
| | 25 | | | Parsippany-Troy Hills Township School District, GO, 4.00%, 08/15/2018 | | | 25 | |
| | 6,300 | | | Penns Grove-Carneys Point Regional School District, GO, GAN, 2.25%, 07/13/2018 | | | 6,309 | |
| | | | | | | | |
PRINCIPAL
AMOUNT($) | | | SECURITY DESCRIPTION | | VALUE($) | |
| | | | | | | | |
| | | | General Obligation — continued | |
| | 20 | | | Pennsauken Township School District, GO, 4.00%, 04/01/2018 | | | 20 | |
| | 4,000 | | | South Plainfield School District, Temporary Notes, GO, 2.00%, 03/08/2018 | | | 4,000 | |
| | 11,582 | | | Township of Belleville, GO, BAN, 2.50%, 05/25/2018 | | | 11,608 | |
| | 2,977 | | | Township of Cherry Hill, GO, BAN, 3.00%, 10/16/2018 | | | 3,005 | |
| | 26,330 | | | Township of Edison, Sewer Utility, GO, BAN, 3.00%, 02/08/2019 | | | 26,688 | |
| | | | Township of Hillside, | | | | |
| | 4,542 | | | GO, BAN, 2.25%, 07/25/2018 | | | 4,548 | |
| | 2,229 | | | GO, BAN, 2.50%, 08/03/2018 | | | 2,234 | |
| | 3,823 | | | Township of Lebanon, GO, BAN, 2.50%, 07/26/2018 | | | 3,834 | |
| | | | Township of Lyndhurst, | | | | |
| | 6,403 | | | GO, BAN, 2.00%, 03/15/2018 | | | 6,404 | |
| | 8,574 | | | GO, BAN, 2.50%, 03/14/2019 (w) | | | 8,648 | |
| | 4,000 | | | Township of Maple Shade, GO, BAN, 2.25%, 06/28/2018 | | | 4,005 | |
| | 20 | | | Township of Mount Laure, Series 2014, GO, 4.00%, 09/01/2018 | | | 20 | |
| | 20 | | | Township of Raritan, General Improvement, GO, 5.00%, 08/15/2018 | | | 20 | |
| | 20 | | | Township of South Brunswick, Series 2014, GO, 4.00%, 09/01/2018 | | | 20 | |
| | | | Township of West Orange, | | | | |
| | 6,592 | | | GO, BAN, 2.25%, 07/27/2018 | | | 6,605 | |
| | 6,122 | | | GO, BAN, 2.25%, 09/07/2018 | | | 6,136 | |
| | 2,050 | | | Township of Woodbridge, GO, BAN, 2.00%, 08/17/2018 | | | 2,055 | |
| | | | | | | | |
| | | | | | | 173,659 | |
| | | | | | | | |
| | | | Hospital — 0.0% (g) | |
| | 375 | | | New Jersey Health Care Facilities Financing Authority, Holy Name Medical Center, Series 2010, Rev., 4.50%, 07/01/2020 | | | 395 | |
| | | | | | | | |
| | | | Housing — 0.2% | |
| | 3,500 | | | New Jersey Housing & Mortgage Finance Agency, Multifamily Conduit Camden Townhouses Project, Series F, Rev., 1.35%, 02/01/2019 (z) | | | 3,484 | |
| | | | | | | | |
| | | | Industrial Development Revenue/Pollution Control Revenue — 0.0% (g) | |
| | | | Passaic County Utilities Authority, Solid Waste Disposal, | | | | |
| | 170 | | | Series 2018, Rev., 4.13%, 03/01/2019 | | | 174 | |
| | 180 | | | Series 2018, Rev., 4.25%, 03/01/2020 | | | 188 | |
SEE NOTES TO FINANCIAL STATEMENTS.
| | | | | | | | |
| | | |
| FEBRUARY 28, 2018 | | J.P. MORGAN MUNICIPAL BOND FUNDS | | | | | 67 | |
JPMorgan Ultra-Short Municipal Fund
SCHEDULE OF PORTFOLIO INVESTMENTS
AS OF FEBRUARY 28, 2018 (continued)
(Amounts in thousands)
| | | | | | | | |
PRINCIPAL
AMOUNT($) | | | SECURITY DESCRIPTION | | VALUE($) | |
| | Municipal Bonds — continued | |
| | | | Industrial Development Revenue/Pollution Control Revenue — continued | |
| | 255 | | | Series 2018, Rev., 4.38%, 03/01/2021 | | | 272 | |
| | | | | | | | |
| | | | | | | 634 | |
| | | | | | | | |
| | | | Other Revenue — 1.5% | |
| | 6,500 | | | Atlantic County Improvement Authority, Aviation Park Project, Rev., 2.00%, 10/03/2018 | | | 6,523 | |
| | 25 | | | Bergen County Improvement Authority, Guaranteed Governmental Loan, Rev., 4.00%, 08/15/2018 | | | 25 | |
| | 30 | | | Burlington County Bridge Commission Lease, Governmental Leasing Program, Series A, Rev., 5.00%, 10/15/2018 | | | 31 | |
| | 500 | | | Gloucester County Improvement Authority, Series A, Rev., 5.00%, 11/01/2019 | | | 527 | |
| | 20 | | | Gloucester County Improvement Authority, Capital Program, Rev., 5.00%, 04/01/2018 | | | 20 | |
| | 1,000 | | | Hudson County Improvement Authority, Local Unit Loan Program, Series A-1, Rev., 2.25%, 04/05/2018 | | | 1,001 | |
| | 200 | | | New Jersey Economic Development Authority, School Facilities Construction, Series PP, Rev., 5.00%, 06/15/2020 | | | 211 | |
| | 20,000 | | | RBC Municipal Products, Inc. Trust, Floater Certificates, Series 2018-E117, Rev., VRDO, LIQ: Royal Bank of Canada, LOC: Royal Bank of Canada, 1.17%, 03/01/2018 (e) (z) | | | 20,000 | |
| | 2,500 | | | Tender Option Bond Trust Receipts/Certificates, Series 2018-XL0058, Rev., VRDO, LIQ: Barclays Bank plc, 1.21%, 03/08/2018 (e) (z) | | | 2,500 | |
| | 340 | | | The Cumberland County Improvement Authority, Vineland Public Safety Building Project, Series 2017, Rev., 5.00%, 12/15/2021 | | | 373 | |
| | | | | | | | |
| | | | | | | 31,211 | |
| | | | | | | | |
| | | | Prerefunded — 0.1% | |
| | 25 | | | County of Burlington, General Improvement, Series A, GO, 4.00%, 09/01/2018 (p) | | | 25 | |
| | | | New Jersey Economic Development Authority, School Facilities Construction, | | | | |
| | 25 | | | Series Y, Rev., 4.50%, 09/01/2018 (p) | | | 25 | |
| | 85 | | | Series Z, Rev., AGC, 5.50%, 12/15/2018 (p) | | | 88 | |
| | 130 | | | New Jersey Educational Facilities Authority, College of New Jersey, Series D, Rev., AGM, 5.00%, 07/01/2018 (p) | | | 132 | |
| | | | New Jersey Health Care Facilities Financing Authority, Hospital Asset Transformation, | | | | |
| | 30 | | | Rev., 5.00%, 10/01/2018 (p) | | | 30 | |
| | 35 | | | Rev., 5.25%, 10/01/2018 (p) | | | 36 | |
| | | | | | | | |
PRINCIPAL
AMOUNT($) | | | SECURITY DESCRIPTION | | VALUE($) | |
| | | | | | | | |
| | | | Prerefunded — continued | |
| | 805 | | | New Jersey Health Care Facilities Financing Authority, Meridian Health System, Rev., AGC, 5.00%, 07/01/2018 (p) | | | 815 | |
| | | | State of New Jersey, Equipment Lease Purchase, | | | | |
| | 40 | | | Series A, COP, 5.00%, 06/15/2018 (p) | | | 41 | |
| | 25 | | | Series A, COP, 5.25%, 06/15/2019 (p) | | | 26 | |
| | | | | | | | |
| | | | | | | 1,218 | |
| | | | | | | | |
| | | | Transportation — 0.3% | |
| | 700 | | | New Jersey Transportation Trust Fund Authority, Transportation Program, Series BB-1, Rev., (Dow Jones US Mid Cap Sofware Index GICS Level 4 USD + 1.00%, 12.00% Cap), 2.09%, 03/08/2018 (aa) | | | 703 | |
| | 225 | | | New Jersey Transportation Trust Fund Authority, Transportation System, Series B-4, Rev., 5.25%, 12/15/2019 | | | 236 | |
| | 4,000 | | | New Jersey Turnpike Authority, Series C-1, Rev., (ICE LIBOR USD 1 Month + 0.34%, 8.00% Cap), 1.44%, 04/02/2018 (aa) | | | 4,013 | |
| | | | | | | | |
| | | | | | | 4,952 | |
| | | | | | | | |
| | | | Total New Jersey | | | 221,969 | |
| | | | | | | | |
| | | | New Mexico — 0.3% | |
| | | | Education — 0.0% (g) | |
| | 30 | | | University of New Mexico (The), Refunding & Improvement, Subordinated Lien, Series A, Rev., 2.00%, 06/01/2018 | | | 30 | |
| | | | | | | | |
| | | | General Obligation — 0.2% | |
| | 50 | | | Albuquerque Municipal School District No. 12, Series D, GO, 4.00%, 08/01/2018 | | | 51 | |
| | 880 | | | Jal Public School District No. 19, Credit Enhancement Program, GO, AGM, 5.00%, 08/01/2019 | | | 922 | |
| | | | Santa Fe Public School District, | | | | |
| | 25 | | | GO, 3.00%, 08/01/2018 | | | 25 | |
| | 2,500 | | | Series 2015, GO, 5.00%, 08/01/2018 | | | 2,539 | |
| | 500 | | | Silver City Consolidated School District No. 1, School Building, GO, 2.00%, 08/01/2018 | | | 500 | |
| | | | | | | | |
| | | | | | | 4,037 | |
| | | | | | | | |
| | | | Other Revenue — 0.0% (g) | |
| | 25 | | | City of Rio Rancho, Series 2013, Rev., 4.00%, 06/01/2018 | | | 25 | |
| | 60 | | | State of New Mexico, Severance Tax Permanent Fund, Series A, Rev., 5.00%, 07/01/2018 | | | 61 | |
| | | | | | | | |
| | | | | | | 86 | |
| | | | | | | | |
SEE NOTES TO FINANCIAL STATEMENTS.
| | | | | | |
| | | |
| 68 | | | | J.P. MORGAN MUNICIPAL BOND FUNDS | | FEBRUARY 28, 2018 |
| | | | | | | | |
PRINCIPAL
AMOUNT($) | | | SECURITY DESCRIPTION | | VALUE($) | |
| | Municipal Bonds — continued | |
| | | | Prerefunded — 0.0% (g) | |
| | 25 | | | Albuquerque Bernalillo County Water Utility Authority, Joint Water & Sewer System Improvement, Series A, Rev., 5.00%, 07/01/2018 (p) | | | 25 | |
| | 25 | | | County of Los Alamos, Rev., 6.00%, 06/01/2018 (p) | | | 25 | |
| | | | | | | | |
| | | | | | | 50 | |
| | | | | | | | |
| | | | Water & Sewer — 0.1% | |
| | 2,750 | | | Albuquerque Bernalillo County Water Utility Authority, Joint Water & Sewer System Improvement, Rev., 5.00%, 07/01/2018 | | | 2,783 | |
| | | | | | | | |
| | | | Total New Mexico | | | 6,986 | |
| | | | | | | | |
| | | | New York — 20.5% | |
| | | | Education — 1.5% | |
| | 5,000 | | | Board of Cooperative Educational Services First Supervisory District, Rev., RAN, 2.25%, 03/08/2018 | | | 5,001 | |
| | | | Board of Cooperative Educational Services for the Sole Supervisory District, | | | | |
| | 13,500 | | | Rev., RAN, 2.00%, 06/29/2018 | | | 13,529 | |
| | 3,500 | | | Rev., RAN, 2.25%, 03/16/2018 | | | 3,500 | |
| | 5,000 | | | Rev., RAN, 2.25%, 06/22/2018 | | | 5,013 | |
| | 4,440 | | | New York State Dormitory Authority, University of Rochester, Series 2006A-1, Rev., VRDO, LOC: Barclays Bank plc, 1.10%, 03/08/2018 (z) | | | 4,440 | |
| | | | | | | | |
| | | | | | | 31,483 | |
| | | | | | | | |
| | | | General Obligation — 8.2% | |
| | 6,500 | | | Amsterdam City School District, Series A, GO, BAN, 2.25%, 06/29/2018 | | | 6,514 | |
| | 35 | | | Baldwinsville Central School District, GO, 4.00%, 05/15/2018 | | | 35 | |
| | 3,500 | | | Binghamton City School District, GO, RAN, 2.50%, 01/25/2019 | | | 3,524 | |
| | | | City of New York, | | | | |
| | 15,000 | | | Series E, Subseries E-3, GO, VRDO, LOC: Bank of America NA, 1.10%, 03/08/2018 (z) | | | 15,000 | |
| | 20 | | | Subseries J-1, GO, 4.00%, 08/01/2018 | | | 20 | |
| | 25 | | | City of New York, Fiscal Year 2013, Series J, GO, 5.00%, 08/01/2018 | | | 25 | |
| | 3,635 | | | City of Olean, GO, BAN, 2.25%, 06/14/2018 | | | 3,645 | |
| | 2,008 | | | City of Troy, Series B, GO, BAN, 2.25%, 08/03/2018 | | | 2,011 | |
| | 20 | | | Clarkstown Central School District, GO, 5.00%, 04/15/2018 | | | 20 | |
| | 7,665 | | | County of Erie, GO, RAN, 2.00%, 06/30/2018 | | | 7,682 | |
| | | | | | | | |
PRINCIPAL
AMOUNT($) | | | SECURITY DESCRIPTION | | VALUE($) | |
| | | | | | | | |
| | | | General Obligation — continued | |
| | 22,495 | | | County of Nassau, Series B, GO, TAN, 3.00%, 09/18/2018 | | | 22,693 | |
| | 30 | | | County of Orange, Series A, GO, AGM, 4.00%, 03/01/2018 | | | 30 | |
| | 14,225 | | | County of Schoharie, GO, BAN, 2.50%, 02/08/2019 | | | 14,351 | |
| | 1,130 | | | County of Suffolk, Series A, GO, 5.00%, 04/01/2018 | | | 1,133 | |
| | 20 | | | County of Suffolk, Town of Brookhaven, Series 2015, GO, 5.00%, 05/01/2018 | | | 20 | |
| | 20 | | | East Hampton Union Free School District, GO, 4.00%, 06/01/2018 | | | 20 | |
| | 16,035 | | | Gouverneur Central School District, GO, BAN, 2.25%, 06/28/2018 | | | 16,087 | |
| | 1,875 | | | Harpursville Central School District, GO, RAN, 2.25%, 06/29/2018 | | | 1,879 | |
| | 3,500 | | | Harrisville Central School District, GO, BAN, 2.25%, 06/29/2018 | | | 3,509 | |
| | 20 | | | Lancaster Central School District, GO, 4.00%, 05/15/2018 | | | 20 | |
| | 40 | | | Mahopac Central School District, Series A, GO, 5.00%, 04/01/2018 | | | 40 | |
| | 6,713 | | | Marcellus Central School District, GO, BAN, 3.00%, 02/22/2019 | | | 6,803 | |
| | 6,405 | | | Mattituck, Cutchogue Union Free School District, GO, TAN, 2.25%, 06/27/2018 | | | 6,416 | |
| | 45 | | | Middle Country Central School District, GO, 5.00%, 05/15/2018 | | | 45 | |
| | 7,000 | | | Niagara Falls City School District, GO, RAN, 2.00%, 03/30/2018 | | | 7,003 | |
| | 6,100 | | | Portville Central School District, GO, BAN, 2.25%, 06/29/2018 | | | 6,116 | |
| | 1,480 | | | Queensbury Union Free School District, GO, BAN, 2.25%, 04/27/2018 | | | 1,482 | |
| | 20 | | | Rocky Point Union Free School District, GO, 5.00%, 06/01/2018 | | | 20 | |
| | 7,000 | | | Sewanhaka Central High School District of Elmont, GO, TAN, 2.25%, 06/22/2018 | | | 7,011 | |
| | 20 | | | State of New York, Tax-Exempt, Series A, GO, 4.00%, 03/01/2018 | | | 20 | |
| | 3,292 | | | Town of Corning, Series A, GO, BAN, 2.25%, 08/15/2018 | | | 3,300 | |
| | 500 | | | Town of Islip, Public Improvement, Series A, GO, 4.00%, 11/15/2020 | | | 509 | |
| | 1,067 | | | Town of LaGrange, Series B, GO, BAN, 2.50%, 06/14/2018 | | | 1,070 | |
| | | | Town of Oyster Bay, | | | | |
| | 500 | | | Series A, GO, BAN, 3.50%, 06/01/2018 | | | 502 | |
| | 100 | | | Series C, GO, BAN, 4.00%, 06/01/2018 | | | 101 | |
SEE NOTES TO FINANCIAL STATEMENTS.
| | | | | | | | |
| | | |
| FEBRUARY 28, 2018 | | J.P. MORGAN MUNICIPAL BOND FUNDS | | | | | 69 | |
JPMorgan Ultra-Short Municipal Fund
SCHEDULE OF PORTFOLIO INVESTMENTS
AS OF FEBRUARY 28, 2018 (continued)
(Amounts in thousands)
| | | | | | | | |
PRINCIPAL
AMOUNT($) | | | SECURITY DESCRIPTION | | VALUE($) | |
| | Municipal Bonds — continued | |
| | | | General Obligation — continued | |
| | 1,530 | | | Town of Phelps, GO, BAN, 2.25%, 07/06/2018 | | | 1,532 | |
| | 1,079 | | | Town of Union, GO, BAN, 2.25%, 05/04/2018 | | | 1,081 | |
| | 3,104 | | | Village of Tully, GO, BAN, 2.25%, 04/12/2018 | | | 3,107 | |
| | 4,450 | | | Weedsport Central School District, GO, BAN, 2.50%, 07/13/2018 | | | 4,467 | |
| | 6,460 | | | West Canada Valley Central School District, GO, BAN, 2.00%, 06/14/2018 | | | 6,470 | |
| | 8,000 | | | West Seneca Fire District No. 2, Series B, GO, BAN, 2.25%, 07/11/2018 | | | 8,013 | |
| | 5,000 | | | West Webster Fire District, GO, BAN, 1.75%, 07/13/2018 | | | 4,997 | |
| | | | | | | | |
| | | | | | | 168,323 | |
| | | | | | | | |
| | | | Hospital — 0.1% | |
| | | | Jefferson County Civic Facility Development Corp., Samaritan Medical Center Project, | | | | |
| | 515 | | | Series A, Rev., 2.00%, 11/01/2018 | | | 515 | |
| | 550 | | | Series A, Rev., 2.00%, 11/01/2019 | | | 547 | |
| | 575 | | | Series A, Rev., 3.00%, 11/01/2020 | | | 582 | |
| | | | | | | | |
| | | | | | | 1,644 | |
| | | | | | | | |
| | | | Housing — 0.1% | |
| | 2,360 | | | Amherst Development Corp., Student Housing Facility, Greiner & Hadley Refunding Projects, Series A, Rev., 3.00%, 10/01/2018 | | | 2,382 | |
| | | | | | | | |
| | | | Industrial Development Revenue/Pollution Control Revenue — 1.0% | |
| | 20,145 | | | Syracuse City Industrial Development Agency, Syracuse University Project, Series A, Rev., VRDO, LOC: U.S. Bank NA, 1.11%, 03/08/2018 (z) | | | 20,145 | |
| | | | | | | | |
| | | | Other Revenue — 3.1% | |
| | 340 | | | Albany Capital Resource Corp., Albany Law School of Union University Refunding Project, Rev., 3.00%, 07/01/2018 | | | 341 | |
| | | | Erie County Fiscal Stability Authority, Sales Tax, | | | | |
| | 20 | | | Series A, Rev., 4.00%, 04/01/2018 | | | 20 | |
| | 20 | | | Series A, Rev., 5.00%, 04/01/2018 | | | 20 | |
| | 50 | | | Series A, Rev., 5.00%, 05/15/2018 | | | 51 | |
| | 50 | | | Series C, Rev., 4.13%, 03/15/2018 | | | 50 | |
| | 10,975 | | | Nassau County Interim Finance Authority, Sales Tax Secured, Series C, Rev., VRDO, 1.09%, 03/08/2018 (z) | | | 10,975 | |
| | 20,000 | | | New York City Transitional Finance Authority, Future Tax Secured, Subseries C-5, Rev., VRDO, LOC: Sumitomo Mitsui Banking Corp., 1.07%, 03/08/2018 (z) | | | 20,000 | |
| | | | | | | | |
PRINCIPAL
AMOUNT($) | | | SECURITY DESCRIPTION | | VALUE($) | |
| | | | | | | | |
| | | | Other Revenue — continued | |
| | | | New York City Transitional Finance Authority, Future Tax Secured, Fiscal Year 2003, | | | | |
| | 1,000 | | | Series 2003A-1, Rev., 5.00%, 11/01/2018 | | | 1,024 | |
| | 1,250 | | | Subseries A-4, Rev., VRDO, 1.10%, 03/01/2018 (z) | | | 1,250 | |
| | | | New York City Transitional Finance Authority, Future Tax Secured, Fiscal Year 2010, | | | | |
| | 25 | | | Series D, Rev., 5.00%, 11/01/2018 | | | 26 | |
| | 14,675 | | | Subseries F-5, Rev., VRDO, LOC: Sumitomo Mitsui Banking Corp., 1.08%, 03/08/2018 (z) | | | 14,675 | |
| | | | New York City Transitional Finance Authority, Future Tax Secured, Fiscal Year 2013, | | | | |
| | 2,000 | | | Series A, Subseries A-4, Rev., VRDO, 1.10%, 03/01/2018 (z) | | | 2,000 | |
| | 150 | | | Subseries F-1, Rev., 5.00%, 02/01/2019 | | | 155 | |
| | 4,000 | | | New York City Transitional Finance Authority, New York City Recovery, Series 3, Subseries 3-G, Rev., VRDO, 1.09%, 03/08/2018 (z) | | | 4,000 | |
| | 8,000 | | | New York City Trust for Cultural Resources, American Museum of Natural History, Rev., (Dow Jones US Mid Cap Sofware Index GICS Level 4 USD + 0.04%), 1.13%, 03/08/2018 (aa) | | | 7,995 | |
| | 65 | | | New York Local Government Assistance Corp., Senior Lien, Series C, Rev., 5.00%, 04/01/2018 | | | 65 | |
| | 20 | | | New York Local Government Assistance Corp., Subordinated Lien, Series B, Rev., 5.00%, 04/01/2018 | | | 20 | |
| | 150 | | | New York State Dormitory Authority, North Shore, Long Island Jewish Obligated Group, Series A, Rev., 4.00%, 05/01/2020 | | | 157 | |
| | 35 | | | New York State Dormitory Authority, State Sales Tax, Series A, Rev., 5.00%, 03/15/2018 | | | 35 | |
| | 25 | | | New York State Dormitory Authority, Third General Resolution, State University Educational Facilities, Rev., 5.00%, 05/15/2018 | | | 25 | |
| | 25 | | | New York State Environmental Facilities Corp., State Personal Income Tax, Series A, Rev., 5.25%, 12/15/2018 | | | 26 | |
| | 1,240 | | | Schenectady Metroplex Development Authority, Series A, Rev., BAN, 3.00%, 12/28/2018 | | | 1,255 | |
| | 150 | | | TSASC, Inc., Tobacco Settlement, Series B, Rev., 5.00%, 06/01/2019 | | | 155 | |
| | 130 | | | Wautoma Area School District, GO, AGM, 3.00%, 03/01/2018 | | | 130 | |
| | | | | | | | |
| | | | | | | 64,450 | |
| | | | | | | | |
SEE NOTES TO FINANCIAL STATEMENTS.
| | | | | | |
| | | |
| 70 | | | | J.P. MORGAN MUNICIPAL BOND FUNDS | | FEBRUARY 28, 2018 |
| | | | | | | | |
PRINCIPAL
AMOUNT($) | | | SECURITY DESCRIPTION | | VALUE($) | |
| | Municipal Bonds — continued | |
| | | | Prerefunded — 0.7% | |
| | | | New York State Dormitory Authority, State Personal Income Tax, Education, | | | | |
| | 20 | | | Series A, Rev., 5.00%, 03/15/2018 (p) | | | 20 | |
| | 25 | | | Series C, Rev., 5.00%, 03/15/2018 (p) | | | 25 | |
| | 30 | | | New York State Thruway Authority, 2nd General Highway & Bridge Trust Fund, Series A, Rev., 5.00%, 04/01/2018 (p) | | | 30 | |
| | 25 | | | New York State Urban Development Corp., State Personal Income Tax, Rev., NATL-RE, 4.25%, 03/15/2018 (p) | | | 25 | |
| | 50 | | | Onondaga County Water Authority, Series A, Rev., 5.00%, 09/15/2018 (p) | | | 51 | |
| | | | Triborough Bridge & Tunnel Authority, MTA Bridges & Tunnels, | | | | |
| | 35 | | | Series A, Rev., 4.88%, 05/15/2018 (p) | | | 35 | |
| | 20 | | | Series A, Rev., 5.00%, 05/15/2018 (p) | | | 20 | |
| | 1,120 | | | Series A, Rev., 5.00%, 01/01/2022 (p) | | | 1,252 | |
| | 13,000 | | | Series A, Rev., 5.25%, 05/15/2018 (p) | | | 13,104 | |
| | | | | | | | |
| | | | | | | 14,562 | |
| | | | | | | | |
| | | | Special Tax — 0.0% (g) | |
| | | | New York State Dormitory Authority, State Personal Income Tax, General Purpose, | | | | |
| | 200 | | | Series A, Rev., 5.00%, 02/15/2021 | | | 219 | |
| | 20 | | | Series C, Rev., 5.00%, 06/15/2018 | | | 20 | |
| | 25 | | | Series E, Rev., 4.00%, 03/15/2018 | | | 25 | |
| | 20 | | | New York State Thruway Authority, Transportation, Series A, Rev., 5.00%, 03/15/2018 | | | 20 | |
| | | | | | | | |
| | | | | | | 284 | |
| | | | | | | | |
| | | | Transportation — 3.7% | |
| | | | Metropolitan Transportation Authority, | | | | |
| | 20 | | | Series A, Rev., 5.75%, 07/01/2018 | | | 20 | |
| | 13,750 | | | Series A-3, Rev., BAN, 4.00%, 08/15/2019 | | | 14,222 | |
| | 15,000 | | | Series C-2D, Rev., BAN, 4.00%, 05/15/2019 | | | 15,435 | |
| | 8,710 | | | Subseries E-2, Rev., VRDO, LOC: Bank of Tokyo-Mitsubishi UFJ Ltd., 1.06%, 03/08/2018 (z) | | | 8,710 | |
| | 2,955 | | | Subseries E-3, Rev., VRDO, LOC: Citibank NA, 1.05%, 03/08/2018 (z) | | | 2,955 | |
| | 25,520 | | | New York State Thruway Authority, Series A, Rev., 5.00%, 05/01/2019 | | | 26,544 | |
| | | | New York State Thruway Authority, 2nd General Highway & Bridge Trust Fund, | | | | |
| | 440 | | | Series A, Rev., 5.00%, 04/01/2018 | | | 442 | |
| | 20 | | | Series A-1, Rev., 3.00%, 04/01/2018 | | | 20 | |
| | | | | | | | |
PRINCIPAL
AMOUNT($) | | | SECURITY DESCRIPTION | | VALUE($) | |
| | | | | | | | |
| | | | Transportation — continued | |
| | 25 | | | New York State Thruway Authority, Local Highway & Bridge Service Contract, Rev., 5.00%, 04/01/2018 | | | 25 | |
| | 25 | | | New York State Thruway Authority, Transportation, Series A, Rev., 5.00%, 03/15/2018 | | | 25 | |
| | 20 | | | Port Authority of New York & New Jersey, Consolidated, Series 180, Rev., 4.00%, 06/01/2018 | | | 20 | |
| | 100 | | | Port Authority of New York & New Jersey, Consolidated, 173rd Series, Rev., 5.00%, 12/01/2018 | | | 103 | |
| | | | Triborough Bridge & Tunnel Authority, MTA Bridges & Tunnels, | | | | |
| | 2,210 | | | Series A, Rev., 4.00%, 11/15/2018 | | | 2,251 | |
| | 4,010 | | | Series A, Rev., 5.00%, 11/15/2018 | | | 4,113 | |
| | 20 | | | Series B, Rev., 5.00%, 11/15/2018 | | | 21 | |
| | 1,500 | | | Series B-4D, Rev., (ICE LIBOR USD 1 Month + 0.58%, 9.00% Cap), 1.64%, 04/02/2018 (aa) | | | 1,507 | |
| | | | | | | | |
| | | | | | | 76,413 | |
| | | | | | | | |
| | | | Utility — 0.0% (g) | |
| | 25 | | | Long Island Power Authority, Electric System, Series A, Rev., AGM, Zero Coupon, 12/01/2018 | | | 25 | |
| | | | | | | | |
| | | | Water & Sewer — 2.1% | |
| | 25,000 | | | New York City Municipal Water Finance Authority, Water & Sewer System, Fiscal Year 2008, Subseries B-4, Rev., VRDO, 1.09%, 03/08/2018 (z) | | | 25,000 | |
| | | | New York City Municipal Water Finance Authority, Water & Sewer System, Second General Resolution, Fiscal Year 2011, | | | | |
| | 1,250 | | | Series DD-1, Rev., VRDO, 1.10%, 03/01/2018 (z) | | | 1,250 | |
| | 8,205 | | | Series DD-3B, Rev., VRDO, 1.11%, 03/01/2018 (z) | | | 8,205 | |
| | 2,500 | | | New York City Municipal Water Finance Authority, Water & Sewer System, Second General Resolution, Fiscal Year 2014, Series AA, Subseries AA1-AA6, Rev., VRDO, 1.10%, 03/01/2018 (z) | | | 2,500 | |
| | 5,680 | | | New York City Municipal Water Finance Authority, Water & Sewer System, Second General Resolution, Fiscal Year 2015, Series BB-3, Rev., VRDO, 1.08%, 03/08/2018 (z) | | | 5,680 | |
SEE NOTES TO FINANCIAL STATEMENTS.
| | | | | | | | |
| | | |
| FEBRUARY 28, 2018 | | J.P. MORGAN MUNICIPAL BOND FUNDS | | | | | 71 | |
JPMorgan Ultra-Short Municipal Fund
SCHEDULE OF PORTFOLIO INVESTMENTS
AS OF FEBRUARY 28, 2018 (continued)
(Amounts in thousands)
| | | | | | | | |
PRINCIPAL
AMOUNT($) | | | SECURITY DESCRIPTION | | VALUE($) | |
| | Municipal Bonds — continued | |
| | | | Water & Sewer — continued | |
| | 20 | | | New York State Environmental Facilities Corp., State Clean Water & Drinking Water Revolving Funds, Municipal Water Finance Authority Projects, Series A, Rev., 5.00%, 06/15/2018 | | | 20 | |
| | | | | | | | |
| | | | | | | 42,655 | |
| | | | | | | | |
| | | | Total New York | | | 422,366 | |
| | | | | | | | |
| | | | North Carolina — 2.7% | |
| | | | Certificate of Participation/Lease — 0.6% | |
| | 13,120 | | | City of Raleigh, Downtown Improvement Projects, Series A, COP, VRDO, 1.09%, 03/08/2018 (z) | | | 13,120 | |
| | | | | | | | |
| | | | Education — 0.2% | |
| | 3,250 | | | University of North Carolina, Chapel Hill, Series B, Rev., (ICE LIBOR USD 1 Month + 0.40%, 12.00% Cap), 1.46%, 04/02/2018 (aa) | | | 3,253 | |
| | | | Winston-Salem State University Foundation LLC, The Board of Governors of The University of North Carolina, | | | | |
| | 110 | | | Rev., AGM, 3.00%, 10/01/2018 | | | 111 | |
| | 90 | | | Rev., AGM, 4.00%, 10/01/2019 | | | 94 | |
| | 120 | | | Rev., AGM, 4.00%, 10/01/2020 | | | 128 | |
| | | | | | | | |
| | | | | | | 3,586 | |
| | | | | | | | |
| | | | General Obligation — 0.2% | |
| | 25 | | | City of Raleigh, Series B, GO, 5.00%, 04/01/2018 | | | 25 | |
| | 25 | | | County of Forsyth, GO, 5.00%, 05/01/2018 | | | 25 | |
| | 2,535 | | | County of Lincoln, Series A, GO, 4.00%, 06/01/2019 | | | 2,614 | |
| | 500 | | | State of North Carolina, Series A, GO, 5.00%, 06/01/2019 | | | 522 | |
| | | | | | | | |
| | | | | | | 3,186 | |
| | | | | | | | |
| | | | Hospital — 0.2% | |
| | 2,935 | | | North Carolina Medical Care Commission, Firsthealth Carolinas, Series A, Rev., VRDO, 1.14%, 03/08/2018 (z) | | | 2,935 | |
| | | | North Carolina Medical Care Commission, United Methodist Retirement Homes, Inc., Retirement Facilities, | | | | |
| | 180 | | | Rev., 5.00%, 10/01/2018 | | | 183 | |
| | 275 | | | Rev., 5.00%, 10/01/2019 | | | 288 | |
| | 380 | | | Northern Hospital District of Surry County, Health Care Facilities, Rev., 4.00%, 10/01/2018 | | | 383 | |
| | | | | | | | |
| | | | | | | 3,789 | |
| | | | | | | | |
| | | | | | | | |
PRINCIPAL
AMOUNT($) | | | SECURITY DESCRIPTION | | VALUE($) | |
| | | | | | | | |
| | | | Other Revenue — 0.1% | |
| | 30 | | | City of Fayetteville Public Works Commission, Series A, Rev., 5.00%, 03/01/2018 | | | 30 | |
| | 25 | | | City of Winston-Salem, Series C, Rev., 4.00%, 06/01/2018 | | | 25 | |
| | 25 | | | County of Bladen, Rev., 4.00%, 06/01/2018 | | | 25 | |
| | 210 | | | County of Chatham, Series 2014, Rev., 5.00%, 11/01/2019 | | | 222 | |
| | 1,000 | | | State of North Carolina, Vehicle, Rev., 4.00%, 03/01/2018 | | | 1,000 | |
| | | | | | | | |
| | | | | | | 1,302 | |
| | | | | | | | |
| | | | Prerefunded — 0.0% (g) | |
| | 45 | | | Cape Fear Public Utility Authority, Water & Sewer System, Rev., 5.00%, 08/01/2018 (p) | | | 46 | |
| | | | | | | | |
| | | | Transportation — 0.0% (g) | |
| | 420 | | | North Carolina Turnpike Authority, Monroe Connector System, Series 2011, Rev., 5.00%, 07/01/2020 | | | 452 | |
| | | | | | | | |
| | | | Water & Sewer — 1.4% | |
| | | | City of Charlotte, Water & Sewer System, | | | | |
| | 3,650 | | | Series 2015, Rev., 5.00%, 07/01/2018 | | | 3,695 | |
| | 14,990 | | | Series B, Rev., VRDO, 1.09%, 03/08/2018 (z) | | | 14,990 | |
| | 6,005 | | | City of Greensboro, Combined Enterprise System, Series A, Rev., VRDO, 1.12%, 03/08/2018 (z) | | | 6,005 | |
| | 5,000 | | | Orange Water & Sewer Authority, Series B, Rev., VRDO, 1.12%, 03/08/2018 (z) | | | 5,000 | |
| | | | | | | | |
| | | | | | | 29,690 | |
| | | | | | | | |
| | | | Total North Carolina | | | 55,171 | |
| | | | | | | | |
| | | | North Dakota — 0.0% (g) | |
| | | | Hospital — 0.0% (g) | |
| | 270 | | | City of Grand Forks, Health Care System, Altru Health System Obligated Group, Series A, Rev., 5.00%, 12/01/2018 | | | 277 | |
| | | | | | | | |
| | | | Ohio — 4.2% | |
| | | | Certificate of Participation/Lease — 0.0% (g) | |
| | | | Goshen Local School District, School Facilities Project, | | | | |
| | 280 | | | COP, 1.50%, 12/15/2020 | | | 277 | |
| | 170 | | | COP, 4.00%, 12/15/2018 | | | 173 | |
| | 240 | | | COP, 4.00%, 12/15/2019 | | | 249 | |
| | | | | | | | |
| | | | | | | 699 | |
| | | | | | | | |
SEE NOTES TO FINANCIAL STATEMENTS.
| | | | | | |
| | | |
| 72 | | | | J.P. MORGAN MUNICIPAL BOND FUNDS | | FEBRUARY 28, 2018 |
| | | | | | | | |
PRINCIPAL
AMOUNT($) | | | SECURITY DESCRIPTION | | VALUE($) | |
| | Municipal Bonds — continued | |
| | | | Education — 0.3% | |
| | 225 | | | Lorain County Community College District, Rev., 2.00%, 12/01/2018 | | | 226 | |
| | 50 | | | Miami University, A State University of Ohio, Rev., 4.00%, 09/01/2018 | | | 51 | |
| | 5,300 | | | Ohio State University (The), General Receipts, Rev., VRDO, 1.05%, 03/08/2018 (z) | | | 5,300 | |
| | | | University of Cincinnati, General Receipts, | | | | |
| | 25 | | | Series A, Rev., 5.00%, 06/01/2018 | | | 25 | |
| | 25 | | | Series C, Rev., 4.00%, 06/01/2018 | | | 25 | |
| | 100 | | | Wright State University, General Receipts, Series A, Rev., 4.00%, 05/01/2018 | | | 100 | |
| | | | | | | | |
| | | | | | | 5,727 | |
| | | | | | | | |
| | | | General Obligation — 1.9% | |
| | 215 | | | Antwerp Local School District, School Facilities Construction & Improvement, GO, 3.00%, 12/01/2018 | | | 217 | |
| | 1,075 | | | City of Ashland, Various Purpose Notes, GO, BAN, 2.00%, 05/17/2018 | | | 1,076 | |
| | | | City of Cincinnati, Unlimited Tax Refunding & Improvement, | | | | |
| | 2,000 | | | Series 2014A, GO, 5.00%, 12/01/2018 | | | 2,054 | |
| | 5,925 | | | Series 2014A, GO, 5.00%, 12/01/2019 | | | 6,275 | |
| | 645 | | | City of Cleveland Heights, GO, BAN, 2.30%, 07/24/2018 | | | 647 | |
| | 3,500 | | | City of Cuyahoga Falls, Various Purpose, GO, BAN, 1.75%, 08/08/2018 | | | 3,505 | |
| | 685 | | | City of Elyria, GO, BAN, 2.00%, 05/25/2018 | | | 686 | |
| | | | City of Elyria, Improvement & Refunding, Various Purpose, | | | | |
| | 685 | | | GO, 3.00%, 12/01/2018 | | | 693 | |
| | 1,340 | | | GO, 5.00%, 12/01/2019 | | | 1,418 | |
| | 425 | | | City of Fairborn, Various Purpose, Series B, GO, BAN, 1.75%, 09/07/2018 | | | 425 | |
| | 1,360 | | | City of Forest Park, Various Purpose, GO, BAN, 1.75%, 08/22/2018 | | | 1,362 | |
| | 1,000 | | | City of Highland Heights, Various Purpose, GO, BAN, 1.75%, 06/14/2018 | | | 1,001 | |
| | 8,000 | | | City of Huber Heights, Capital Facilities Notes, GO, BAN, 2.00%, 05/30/2018 | | | 8,012 | |
| | | | City of Middletown, Various Purpose, | | | | |
| | 250 | | | GO, 4.00%, 12/01/2018 | | | 254 | |
| | 500 | | | GO, 4.00%, 12/01/2019 | | | 519 | |
| | 500 | | | City of Seven Hills, Capital Improvement, GO, BAN, 2.25%, 06/28/2018 | | | 499 | |
| | 650 | | | City of Seven Hills, Street Improvement, GO, BAN, 2.25%, 08/02/2018 | | | 649 | |
| | 25 | | | City of Springboro, GO, 5.00%, 12/01/2018 | | | 26 | |
| | | | | | | | |
PRINCIPAL
AMOUNT($) | | | SECURITY DESCRIPTION | | VALUE($) | |
| | | | | | | | |
| | | | General Obligation — continued | |
| | 1,115 | | | City of Springfield, Sewer & Water, GO, BAN, 2.00%, 03/30/2018 | | | 1,115 | |
| | | | City of Toledo, | | | | |
| | 180 | | | GO, AGM, 2.00%, 12/01/2019 | | | 181 | |
| | 100 | | | GO, AGM, 4.00%, 12/01/2020 | | | 105 | |
| | 225 | | | County of Crawford, Various Purpose, GO, AGM, 2.00%, 12/01/2018 | | | 226 | |
| | 1,000 | | | County of Lake, Water Utilities Improvement, GO, 1.50%, 06/14/2018 | | | 1,000 | |
| | 5,000 | | | County of Lucas, Various Purpose Improvement, GO, BAN, 2.00%, 07/11/2018 | | | 5,011 | |
| | 645 | | | Madison Local School District, Energy Conservation Improvement, GO, BAN, 2.00%, 10/04/2018 | | | 647 | |
| | 95 | | | Painesville City Local School District, School Improvement, GO, Zero Coupon, 12/01/2018 | | | 94 | |
| | 100 | | | Riverside Local School District, School Construction & Improvement, Series C, GO, 5.00%, 10/01/2018 | | | 102 | |
| | | | State of Ohio, Higher Education, | | | | |
| | 25 | | | Series A, GO, 5.00%, 08/01/2018 | | | 25 | |
| | 45 | | | Series B, GO, 5.00%, 08/01/2018 | | | 46 | |
| | 65 | | | Series C, GO, 4.00%, 08/01/2018 | | | 66 | |
| | 230 | | | Wauseon Exempted Village School District, Classroom Facilities & School Improvement, GO, 2.00%, 12/01/2018 | | | 231 | |
| | | | | | | | |
| | | | | | | 38,167 | |
| | | | | | | | |
| | | | Hospital — 1.1% | |
| | 125 | | | Akron, Bath & Copley Joint Township Hospital District, Summa Health Obligated Group, Rev., 5.00%, 11/15/2021 | | | 135 | |
| | | | City of Centerville, Graceworks Lutheran Services, | | | | |
| | 275 | | | Rev., 5.00%, 11/01/2020 | | | 289 | |
| | 285 | | | Rev., 5.00%, 11/01/2021 | | | 303 | |
| | 2,000 | | | County of Allen, Hospital Facilities, Mercy Health, Series B, Rev., 5.00%, 05/05/2022 (z) | | | 2,218 | |
| | 11,645 | | | County of Franklin, Hospital Facilities, U.S. Health Corp., Series A, Rev., VRDO, LOC: Northern Trust Co., 1.09%, 03/08/2018 (z) | | | 11,645 | |
| | 25 | | | State of Ohio, Capital Facilities Lease Appropriation, Mental Health Improvement Fund Project, Series A, Rev., 4.00%, 06/01/2018 | | | 25 | |
| | 8,250 | | | State of Ohio, University Hospitals Health System, Inc., Series A, Rev., VRDO, 1.34%, 03/01/2018 (z) | | | 8,250 | |
| | | | | | | | |
| | | | | | | 22,865 | |
| | | | | | | | |
SEE NOTES TO FINANCIAL STATEMENTS.
| | | | | | | | |
| | | |
| FEBRUARY 28, 2018 | | J.P. MORGAN MUNICIPAL BOND FUNDS | | | | | 73 | |
JPMorgan Ultra-Short Municipal Fund
SCHEDULE OF PORTFOLIO INVESTMENTS
AS OF FEBRUARY 28, 2018 (continued)
(Amounts in thousands)
| | | | | | | | |
PRINCIPAL
AMOUNT($) | | | SECURITY DESCRIPTION | | VALUE($) | |
| | Municipal Bonds — continued | |
| | | | Housing — 0.0% (g) | |
| | 20 | | | Ohio State Building Authority, State Facilities, Adult Correctional Building Fund Projects, Series 2011A, Rev., 5.00%, 04/01/2018 | | | 20 | |
| | | | | | | | |
| | | | Industrial Development Revenue/Pollution Control Revenue — 0.7% | |
| | 13,935 | | | Ohio State Water Development Authority, Water Pollution Control Loan Fund, Series B, Rev., (Dow Jones US Mid Cap Sofware Index GICS Level 4 USD + 0.22%), 1.31%, 03/08/2018 (aa) | | | 13,967 | |
| | | | | | | | |
| | | | Prerefunded — 0.0% (g) | |
| | 20 | | | City of Cincinnati, Economic Development, Baldwin 300 Project, Series B, Rev., 5.00%, 11/01/2018 (p) | | | 21 | |
| | 20 | | | City of Cleveland, Bridges & Roadways, Series B, Rev., AGC, 5.00%, 04/01/2018 (p) | | | 20 | |
| | 25 | | | City of North Canton, Series A, GO, AGC, 5.00%, 06/01/2018 (p) | | | 25 | |
| | 25 | | | Dublin City School District, School Facilities Construction & Improvement, GO, 5.00%, 12/01/2018 (p) | | | 26 | |
| | 25 | | | Miamisburg City School District, Facilities Construction & Improvement, GO, 5.00%, 12/01/2018 (p) | | | 26 | |
| | 20 | | | Monroeville Local School District, School Improvement, GO, 4.00%, 12/01/2018 (p) | | | 20 | |
| | 50 | | | Northmor Local School District, School Facilities Construction & Improvement, GO, 5.00%, 11/01/2018 (p) | | | 51 | |
| | 25 | | | St. Marys City School District, School Facilities Construction & Improvement, GO, AGM, 4.50%, 06/01/2018 (p) | | | 25 | |
| | 20 | | | State of Ohio, Infrastructure Improvement, GO, 5.38%, 03/01/2018 (p) | | | 20 | |
| | 35 | | | State of Ohio, Infrastructure Project, Series 1, Rev., 5.75%, 06/15/2018 (p) | | | 35 | |
| | | | | | | | |
| | | | | | | 269 | |
| | | | | | | | |
| | | | Transportation — 0.2% | |
| | 4,170 | | | City of Cleveland, Airport System, Series D, Rev., VRDO, LOC: U.S. Bank NA, 1.08%, 03/08/2018 (z) | | | 4,170 | |
| | 735 | | | Ohio Turnpike & Infrastructure Commission, Junior Lien, Infrastructure Projects, Series A-1, Rev., 5.00%, 02/15/2019 | | | 759 | |
| | | | | | | | |
| | | | | | | 4,929 | |
| | | | | | | | |
| | | | Water & Sewer — 0.0% (g) | |
| | 20 | | | City of Cincinnati, Water System, Series A, Rev., 5.00%, 12/01/2018 | | | 20 | |
| | | | | | | | |
PRINCIPAL
AMOUNT($) | | | SECURITY DESCRIPTION | | VALUE($) | |
| | | | | | | | |
| | | | Water & Sewer — continued | |
| | 30 | | | County of Butler, Rev., 4.00%, 12/01/2018 | | | 31 | |
| | | | | | | | |
| | | | | | | 51 | |
| | | | | | | | |
| | | | Total Ohio | | | 86,694 | |
| | | | | | | | |
| | | | Oklahoma — 0.2% | |
| | | | Education — 0.1% | |
| | | | Canadian County Educational Facilities Authority, Mustang Public Schools Project, | | | | |
| | 335 | | | Rev., 3.00%, 09/01/2018 | | | 338 | |
| | 1,000 | | | Rev., 3.00%, 09/01/2019 | | | 1,019 | |
| | | | Cleveland County Educational Facilities Authority, Educational Facilities Lease, Noble Public Schools Project, | | | | |
| | 125 | | | Rev., 4.00%, 09/01/2018 | | | 126 | |
| | 120 | | | Rev., 4.00%, 09/01/2019 | | | 124 | |
| | 300 | | | Cleveland County Educational Facilities Authority, Moore Public Schools Project, Rev., 5.00%, 06/01/2019 | | | 313 | |
| | 125 | | | Okarche Economic Development Authority, Okarche Public Schools Project, Rev., 4.00%, 09/01/2019 | | | 128 | |
| | 50 | | | Oklahoma Agricultural & Mechanical Colleges, State University, Rev., 3.50%, 07/01/2018 (p) | | | 50 | |
| | 160 | | | Oklahoma County Finance Authority, Educational Facilities, Lease Midwest City-Del City Public Schools Project, Series 2018, Rev., 5.00%, 10/01/2018 | | | 163 | |
| | 200 | | | Oklahoma County Finance Authority, Educational Facilities, Lease Western Harrah Public Schools Project, Rev., 2.00%, 09/01/2018 | | | 200 | |
| | 500 | | | Sequoyah County Educational Facilities Authority, Sallisaw Public Schools Project, Rev., 2.00%, 09/01/2018 | | | 501 | |
| | | | | | | | |
| | | | | | | 2,962 | |
| | | | | | | | |
| | | | General Obligation — 0.0% (g) | |
| | 50 | | | State of Oklahoma, Building Commission, Series A, GO, 5.00%, 07/15/2018 | | | 51 | |
| | | | | | | | |
| | | | Housing — 0.1% | |
| | 1,500 | | | Oklahoma Housing Finance Agency, Green Rural Development Portfolio, Series 2018, Rev., VRDO, 1.90%, 03/01/2020 (z) | | | 1,500 | |
| | | | | | | | |
| | | | Prerefunded — 0.0% (g) | |
| | 30 | | | Grand River Dam Authority, Series A, Rev., BHAC, 5.00%, 06/01/2018 (p) | | | 30 | |
| | | | | | | | |
SEE NOTES TO FINANCIAL STATEMENTS.
| | | | | | |
| | | |
| 74 | | | | J.P. MORGAN MUNICIPAL BOND FUNDS | | FEBRUARY 28, 2018 |
| | | | | | | | |
PRINCIPAL
AMOUNT($) | | | SECURITY DESCRIPTION | | VALUE($) | |
| | Municipal Bonds — continued | |
| | | | Utility — 0.0% (g) | |
| | 75 | | | Stillwater Utilities Authority, Utility System & Sales Tax, Series A, Rev., 4.00%, 10/01/2018 | | | 76 | |
| | | | | | | | |
| | | | Total Oklahoma | | | 4,619 | |
| | | | | | | | |
| | | | Oregon — 0.7% | |
| | | | General Obligation — 0.4% | |
| | 25 | | | Clackamas & Washington Counties School District No. 3, Series A, GO, NATL-RE, Zero Coupon, 06/15/2018 | | | 25 | |
| | | | Clackamas County School District No. 12, | | | | |
| | 135 | | | GO, AGM, 5.00%, 06/15/2018 | | | 137 | |
| | 250 | | | Series A, GO, Zero Coupon, 06/15/2019 | | | 245 | |
| | 1,875 | | | County of Washington, Series 2016, GO, 5.00%, 06/01/2021 | | | 2,065 | |
| | 25 | | | Lane County, Bethel School District No. 52, GO, 4.00%, 06/15/2018 | | | 25 | |
| | 60 | | | Lane County, Mapleton School District No. 32, GO, 2.00%, 06/15/2018 | | | 60 | |
| | 25 | | | State of Oregon, Series L, GO, 5.00%, 11/01/2018 | | | 25 | |
| | 6,085 | | | State of Oregon, Veterans Welfare, Series 9, GO, VRDO, 1.08%, 03/08/2018 (z) | | | 6,085 | |
| | | | | | | | |
| | | | | | | 8,667 | |
| | | | | | | | |
| | | | Hospital — 0.3% | |
| | 100 | | | Klamath Falls Intercommunity Hospital Authority, Sky Lakes Medical Center Project, Rev., 3.00%, 09/01/2018 | | | 101 | |
| | 5,350 | | | Salem Hospital Facility Authority, Hospital Project, Series B, Rev., VRDO, LOC: U.S. Bank NA, 1.08%, 03/08/2018 (z) | | | 5,350 | |
| | | | | | | | |
| | | | | | | 5,451 | |
| | | | | | | | |
| | | | Prerefunded — 0.0% (g) | |
| | 40 | | | Chemeketa Community College District, GO, 5.50%, 06/15/2018 (p) | | | 41 | |
| | 195 | | | City of Portland, Sewer System, Series B, Rev., AGM, 5.00%, 06/15/2018 (p) | | | 197 | |
| | 20 | | | Port of Portland, Airport Revenue, Series 19, Rev., 5.00%, 07/01/2018 (p) | | | 20 | |
| | 20 | | | State of Oregon, Higher Education, Series A, GO, 5.00%, 08/01/2018 (p) | | | 20 | |
| | | | | | | | |
| | | | | | | 278 | |
| | | | | | | | |
| | | | Transportation — 0.0% (g) | |
| | 35 | | | Tri-County Metropolitan Transportation District of Oregon, Capital Grant Receipts, Series A, Rev., 5.00%, 10/01/2018 | | | 36 | |
| | | | | | | | |
| | | | Total Oregon | | | 14,432 | |
| | | | | | | | |
| | | | | | | | |
PRINCIPAL
AMOUNT($) | | | SECURITY DESCRIPTION | | VALUE($) | |
| | | | | | | | |
| | | | Pennsylvania — 2.5% | |
| | | | Education — 0.9% | |
| | 255 | | | Chester County Health & Education Facilities Authority, Immaculata University Project, Rev., 3.00%, 11/01/2018 | | | 255 | |
| | | | Pennsylvania Higher Educational Facilities Authority, | | | | |
| | 8,950 | | | Series A, Rev., 5.00%, 09/01/2019 (p) | | | 9,423 | |
| | 5,975 | | | Series AN, Rev., 5.00%, 06/15/2020 | | | 6,408 | |
| | 215 | | | Series AT-1, Rev., 5.00%, 06/15/2018 | | | 217 | |
| | | | Pennsylvania Higher Educational Facilities Authority, University of Pennsylvania Health System, | | | | |
| | 25 | | | Rev., 5.00%, 08/15/2018 | | | 25 | |
| | 200 | | | Rev., 5.00%, 08/15/2019 | | | 210 | |
| | 290 | | | Pennsylvania Higher Educational Facilities Authority, Widener University, Rev., 2.00%, 07/15/2019 | | | 289 | |
| | 375 | | | Snyder County Higher Education Authority, Susquehanna University Project, Rev., 4.00%, 01/01/2019 | | | 382 | |
| | 25 | | | State Public School Building Authority, Northampton Community College Project, Rev., 4.00%, 06/15/2018 | | | 25 | |
| | | | | | | | |
| | | | | | | 17,234 | |
| | | | | | | | |
| | | | General Obligation — 0.8% | |
| | 25 | | | Carlisle Area School District, Series 2014, GO, 4.00%, 03/01/2018 | | | 25 | |
| | 350 | | | City of Easton, Series A, GO, AGM, 2.00%, 11/15/2018 | | | 351 | |
| | 35 | | | Cocalico School District, Series 2014, GO, 4.00%, 03/01/2018 | | | 35 | |
| | 8,995 | | | Commonwealth of Pennsylvania, Series 2015, GO, 5.00%, 08/15/2022 | | | 10,017 | |
| | 270 | | | County of Beaver, GO, 3.00%, 04/15/2018 | | | 271 | |
| | 30 | | | County of Centre, GO, 5.00%, 06/01/2018 | | | 30 | |
| | 4,000 | | | County of Luzerne, Series 2018, GO, TRAN, 3.00%, 06/29/2018 | | | 4,019 | |
| | 30 | | | County of Montgomery, Series A, GO, 5.00%, 03/15/2018 | | | 30 | |
| | 20 | | | Cumberland Valley School District, Refunding & Improvement, Series A, GO, 4.00%, 11/15/2018 | | | 20 | |
| | 30 | | | Fox Chapel Area School District, GO, 3.00%, 08/01/2018 | | | 30 | |
| | 20 | | | Great Valley School District, GO, 4.00%, 11/01/2018 | | | 20 | |
| | 35 | | | Manheim Central School District, GO, AGM, 4.00%, 03/01/2018 | | | 35 | |
SEE NOTES TO FINANCIAL STATEMENTS.
| | | | | | | | |
| | | |
| FEBRUARY 28, 2018 | | J.P. MORGAN MUNICIPAL BOND FUNDS | | | | | 75 | |
JPMorgan Ultra-Short Municipal Fund
SCHEDULE OF PORTFOLIO INVESTMENTS
AS OF FEBRUARY 28, 2018 (continued)
(Amounts in thousands)
| | | | | | | | |
PRINCIPAL
AMOUNT($) | | | SECURITY DESCRIPTION | | VALUE($) | |
| | Municipal Bonds — continued | |
| | | | General Obligation — continued | |
| | 1,075 | | | Municipality of Monroeville, GO, 3.00%, 06/01/2020 | | | 1,102 | |
| | 105 | | | Parkland School District, Series A, GO, 3.00%, 03/01/2018 | | | 105 | |
| | 50 | | | Pine-Richland School District, Series A, GO, 2.00%, 07/15/2018 | | | 50 | |
| | 30 | | | Pleasant Valley School District, GO, 5.00%, 05/01/2018 | | | 30 | |
| | 20 | | | Schuylkill Valley School District, GO, 4.00%, 04/01/2018 | | | 20 | |
| | 20 | | | Souderton Area School District, Series A, GO, 4.00%, 11/15/2018 | | | 20 | |
| | 50 | | | Township of Exeter, GO, AMBAC, 5.30%, 07/15/2018 | | | 51 | |
| | 20 | | | Township of Hopewell, GO, 4.00%, 05/01/2018 | | | 20 | |
| | 210 | | | Township of Upper Darby, GO, AGM, 2.00%, 05/01/2019 | | | 211 | |
| | | | West Chester Area School District, | | | | |
| | 20 | | | GO, 5.00%, 04/15/2018 | | | 20 | |
| | 35 | | | Series AA, GO, 5.00%, 05/15/2018 | | | 35 | |
| | | | | | | | |
| | | | | | | 16,547 | |
| | | | | | | | |
| | | | Hospital — 0.1% | |
| | 1,085 | | | Allegheny County Hospital Development Authority, University of Pittsburgh Medical Center, Series A, Rev., 5.00%, 05/15/2018 | | | 1,093 | |
| | 1,000 | | | Philadelphia Hospitals & Higher Education Facilities Authority, Temple University Health System, Hospital Revenue, Rev., 5.00%, 07/01/2019 | | | 1,034 | |
| | | | | | | | |
| | | | | | | 2,127 | |
| | | | | | | | |
| | | | Housing — 0.0% (g) | |
| | 250 | | | Philadelphia Housing Authority, PHA Headquarters Project, Rev., 4.00%, 05/01/2019 | | | 257 | |
| | | | | | | | |
| | | | Industrial Development Revenue/Pollution Control Revenue — 0.1% | |
| | | | Lackawanna County Industrial Development Authority, University of Scranton, | | | | |
| | 25 | | | Rev., 3.00%, 11/01/2018 | | | 25 | |
| | 50 | | | Rev., 3.00%, 11/01/2019 | | | 51 | |
| | 100 | | | Rev., 4.00%, 11/01/2020 | | | 105 | |
| | 1,000 | | | Rev., 5.00%, 11/01/2021 | | | 1,095 | |
| | | | | | | | |
| | | | | | | 1,276 | |
| | | | | | | | |
| | | | | | | | |
PRINCIPAL
AMOUNT($) | | | SECURITY DESCRIPTION | | VALUE($) | |
| | | | | | | | |
| | | | Other Revenue — 0.5% | |
| | | | Commonwealth Financing Authority, Tobacco Master Settlement Payment, | | | | |
| | 555 | | | Series 2018, Rev., 5.00%, 06/01/2020 | | | 590 | |
| | 535 | | | Series 2018, Rev., 5.00%, 06/01/2021 | | | 579 | |
| | 250 | | | Cumberland County Municipal Authority, AICUP Financing Program-Messiah College Project, Rev., 2.00%, 04/30/2020 (z) | | | 250 | |
| | 7,855 | | | Emmaus General Authority, Rev., VRDO, AGM, 1.17%, 03/08/2018 (z) | | | 7,855 | |
| | 1,070 | | | Pennsylvania Economic Development Financing Authority, Unemployment Compensation, Series A, Rev., 5.00%, 07/01/2018 | | | 1,083 | |
| | 195 | | | Philadelphia Municipal Authority, City Agreement, Juvenile Justice Services Center, Rev., 4.00%, 04/01/2019 | | | 199 | |
| | | | | | | | |
| | | | | | | 10,556 | |
| | | | | | | | |
| | | | Prerefunded — 0.0% (g) | |
| | 30 | | | Allegheny County Higher Education Building Authority, Duquesne University, Rev., 5.00%, 03/01/2018 (p) | | | 30 | |
| | 60 | | | Central Bucks School District, GO, 5.00%, 05/15/2018 (p) | | | 60 | |
| | 40 | | | Commonwealth of Pennsylvania, GO, 5.00%, 05/15/2018 (p) | | | 40 | |
| | 15 | | | County of Allegheny, West Mifflin Area School District, GO, AGM, 5.38%, 10/01/2018 (p) | | | 15 | |
| | 25 | | | County of Lehigh, Rev., AGM, 5.00%, 07/01/2018 (p) | | | 26 | |
| | 50 | | | Doylestown Hospital Authority, Series A, Rev., AGC, 5.00%, 07/01/2018 (p) | | | 51 | |
| | 55 | | | Manheim Central School District, GO, AGM, 5.00%, 03/01/2018 (p) | | | 55 | |
| | 20 | | | Pennsylvania Higher Educational Facilities Authority, University of Pennsylvania Health System, Series B, Rev., 6.00%, 08/15/2018 (p) | | | 20 | |
| | | | Pennsylvania Turnpike Commission, | | | | |
| | 95 | | | Series A1, Rev., AGC, 5.00%, 06/01/2018 (p) | | | 97 | |
| | 25 | | | Series B-1, Rev., 5.00%, 06/01/2018 (p) | | | 25 | |
| | 25 | | | Series B-1, Rev., 5.25%, 06/01/2018 (p) | | | 25 | |
| | 30 | | | Series B-1, Rev., 5.63%, 06/01/2018 (p) | | | 30 | |
| | 20 | | | Series C, Rev., AGC, 6.00%, 06/01/2018 (p) | | | 20 | |
| | 20 | | | Red Lion Area School District, GO, AGM, 5.00%, 05/01/2018 (p) | | | 20 | |
| | 35 | | | The School Board of Philadelphia County, Series F, GO, BHAC, 5.13%, 09/01/2018 (p) | | | 36 | |
SEE NOTES TO FINANCIAL STATEMENTS.
| | | | | | |
| | | |
| 76 | | | | J.P. MORGAN MUNICIPAL BOND FUNDS | | FEBRUARY 28, 2018 |
| | | | | | | | |
PRINCIPAL
AMOUNT($) | | | SECURITY DESCRIPTION | | VALUE($) | |
| | Municipal Bonds — continued | |
| | | | Prerefunded — continued | |
| | 25 | | | West Shore School District, GO, AGC, 4.50%, 05/15/2019 (p) | | | 26 | |
| | | | | | | | |
| | | | | | | 576 | |
| | | | | | | | |
| | | | Transportation — 0.0% (g) | |
| | | | Pennsylvania Turnpike Commission, | | | | |
| | 70 | | | Series B, Subseries B-2, Rev., 5.00%, 06/01/2018 | | | 71 | |
| | 75 | | | Series B, Subseries B-2, Rev., 5.00%, 06/01/2019 | | | 78 | |
| | 50 | | | Series B, Subseries B-2, Rev., 5.00%, 06/01/2020 | | | 53 | |
| | 110 | | | Pennsylvania Turnpike Commission, Senior Lien, Series A, Rev., 5.00%, 12/01/2020 | | | 119 | |
| | | | | | | | |
| | | | | | | 321 | |
| | | | | | | | |
| | | | Utility — 0.1% | |
| | 2,100 | | | City of Philadelphia, Gas Works, 1998 General Ordinance, Fifteen, Rev., 3.00%, 08/01/2019 | | | 2,138 | |
| | | | | | | | |
| | | | Total Pennsylvania | | | 51,032 | |
| | | | | | | | |
| | | | Rhode Island — 0.3% | |
| | | | Hospital — 0.3% | |
| | 5,205 | | | Rhode Island Health & Educational Building Corp., Higher Education Facility, Rhode Island School of Design Issue, Series A, Rev., VRDO, LOC: U.S. Bank NA, 1.08%, 03/08/2018 (z) | | | 5,205 | |
| | | | | | | | |
| | | | Industrial Development Revenue/Pollution Control Revenue — 0.0% (g) | |
| | 35 | | | Rhode Island Infrastructure Bank, Water Pollution Control Revolving Fund, Series A, Rev., 5.00%, 10/01/2018 | | | 36 | |
| | | | | | | | |
| | | | Other Revenue — 0.0% (g) | |
| | | | Providence Public Building Authority, Capital Improvement, | | | | |
| | 125 | | | Series A, Rev., 3.00%, 09/15/2018 | | | 125 | |
| | 250 | | | Series A, Rev., 4.00%, 09/15/2019 | | | 257 | |
| | 200 | | | Series A, Rev., 5.00%, 09/15/2020 | | | 213 | |
| | 205 | | | Tobacco Settlement Financing Corp., Asset-Backed, Series A, Rev., 4.00%, 06/01/2018 | | | 206 | |
| | | | | | | | |
| | | | | | | 801 | |
| | | | | | | | |
| | | | Transportation — 0.0% (g) | |
| | | | Rhode Island Commerce Corp., First Lien Special Facility, Rhode Island Airport Corp. Intermodal Facility Project, | | | | |
| | 500 | | | Series 2018, Rev., 5.00%, 07/01/2019 | | | 521 | |
| | 585 | | | Series 2018, Rev., 5.00%, 07/01/2020 | | | 625 | |
| | | | | | | | |
| | | | | | | 1,146 | |
| | | | | | | | |
| | | | Total Rhode Island | | | 7,188 | |
| | | | | | | | |
| | | | | | | | |
PRINCIPAL
AMOUNT($) | | | SECURITY DESCRIPTION | | VALUE($) | |
| | | | | | | | |
| | | | South Carolina — 1.3% | |
| | | | Education — 0.1% | |
| | 300 | | | County of Spartanburg, School District No. 7, Rev., 3.00%, 12/01/2018 | | | 303 | |
| | 500 | | | Educational Facilities Authority, Wofford College, Series B, Rev., 2.38%, 04/01/2022 (z) | | | 497 | |
| | | | | | | | |
| | | | | | | 800 | |
| | | | | | | | |
| | | | General Obligation — 0.0% (g) | |
| | | | Aiken County Consolidated School District, | | | | |
| | 20 | | | GO, SCSDE, 4.00%, 04/01/2018 | | | 20 | |
| | 25 | | | GO, SCSDE, 5.00%, 04/01/2018 | | | 25 | |
| | 20 | | | County of Florence, GO, 4.00%, 06/01/2018 | | | 20 | |
| | 20 | | | Florence School District No. 1, GO, SCSDE, 4.00%, 03/01/2018 | | | 20 | |
| | | | Fort Mill School District No. 4, | | | | |
| | 20 | | | Series A, GO, SCSDE, 4.00%, 03/01/2018 | | | 20 | |
| | 20 | | | Series D, GO, SCSDE, 5.00%, 03/01/2018 | | | 20 | |
| | | | Horry County School District, | | | | |
| | 25 | | | Series 2012, GO, SCSDE, 4.00%, 03/01/2018 | | | 25 | |
| | 20 | | | Series A, GO, SCSDE, 5.00%, 03/01/2018 | | | 20 | |
| | 25 | | | State of South Carolina, Highway, Series A, GO, 5.00%, 06/01/2018 | | | 26 | |
| | 45 | | | State of South Carolina, Winthorp University, Series B, GO, 5.00%, 04/01/2018 | | | 45 | |
| | | | | | | | |
| | | | | | | 241 | |
| | | | | | | | |
| | | | Hospital — 1.2% | |
| | 24,810 | | | Greenville Health System, Series B, Rev., VRDO, LOC: U.S. Bank NA, 1.08%, 03/08/2018 (z) | | | 24,810 | |
| | 750 | | | Lexington County Health Services District, Inc., Hospital, LexMed Obligated Group, Series 2017, Rev., 5.00%, 11/01/2018 | | | 767 | |
| | | | | | | | |
| | | | | | | 25,577 | |
| | | | | | | | |
| | | | Prerefunded — 0.0% (g) | |
| | 500 | | | University of South Carolina, Higher Education, Series A, Rev., AGM, 5.00%, 06/01/2018 (p) | | | 504 | |
| | | | | | | | |
| | | | Utility — 0.0% (g) | |
| | 250 | | | Piedmont Municipal Power Agency, Electric, Series A, Rev., 5.00%, 01/01/2019 | | | 257 | |
| | | | | | | | |
| | | | Total South Carolina | | | 27,379 | |
| | | | | | | | |
| | | | South Dakota — 0.0% (g) | |
| | | | Housing — 0.0% (g) | |
| | 375 | | | South Dakota Board of Regents, Housing & Auxiliary Facility System, Series 2017, Rev., 5.00%, 04/01/2022 | | | 417 | |
| | | | | | | | |
SEE NOTES TO FINANCIAL STATEMENTS.
| | | | | | | | |
| | | |
| FEBRUARY 28, 2018 | | J.P. MORGAN MUNICIPAL BOND FUNDS | | | | | 77 | |
JPMorgan Ultra-Short Municipal Fund
SCHEDULE OF PORTFOLIO INVESTMENTS
AS OF FEBRUARY 28, 2018 (continued)
(Amounts in thousands)
| | | | | | | | |
PRINCIPAL
AMOUNT($) | | | SECURITY DESCRIPTION | | VALUE($) | |
| | Municipal Bonds — continued | |
| | | | Other Revenue — 0.0% (g) | |
| | | | South Dakota State Building Authority, | | | | |
| | 150 | | | Series A, Rev., 3.00%, 06/01/2019 | | | 153 | |
| | 200 | | | Series A, Rev., 3.00%, 06/01/2020 | | | 205 | |
| | | | | | | | |
| | | | | | | 358 | |
| | | | | | | | |
| | | | Prerefunded — 0.0% (g) | |
| | 45 | | | South Dakota State Building Authority, Rev., AGM, 5.00%, 06/01/2018 (p) | | | 45 | |
| | | | | | | | |
| | | | Total South Dakota | | | 820 | |
| | | | | | | | |
| | | | Tennessee — 1.9% | |
| | | | Education — 0.5% | |
| | 6,250 | | | Metropolitan Government of Nashville & Davidson County, Health & Educational Facilities Board, Rev., 1.30%, 07/01/2019 (z) | | | 6,233 | |
| | 4,000 | | | Metropolitan Government of Nashville & Davidson County, Health & Educational Facilities Board, Twelfth & Wedgewood Apartments Project, Series 2017, Rev., 1.80%, 12/01/2019 (z) | | | 4,001 | |
| | | | | | | | |
| | | | | | | 10,234 | |
| | | | | | | | |
| | | | General Obligation — 0.2% | |
| | 25 | | | City of Oak Ridge, GO, 4.00%, 06/01/2018 | | | 25 | |
| | 3,500 | | | County of Monroe, GO, BAN, 1.20%, 06/15/2019 | | | 3,489 | |
| | 30 | | | County of Montgomery, Public Improvement, GO, 5.00%, 04/01/2018 | | | 30 | |
| | | | County of Shelby, | | | | |
| | 50 | | | Series A, GO, 4.00%, 03/01/2018 | | | 50 | |
| | 45 | | | Series A, GO, 4.75%, 03/01/2018 | | | 45 | |
| | 105 | | | County of Sumner, School & Public Improvement, Series 2013, GO, 5.00%, 12/01/2019 | | | 112 | |
| | | | | | | | |
| | | | | | | 3,751 | |
| | | | | | | | |
| | | | Hospital — 1.0% | |
| | 20,000 | | | Shelby County Health Educational & Housing Facilities Board, Methodist Le Bonheur Healthcare, Series B, Rev., VRDO, AGM, 1.10%, 03/01/2018 (z) | | | 20,000 | |
| | | | | | | | |
| | | | Prerefunded — 0.0% (g) | |
| | 25 | | | City of Chattanooga, Electric Power Board, Series A, Rev., 5.00%, 03/01/2018 (p) | | | 25 | |
| | 25 | | | City of Memphis, General Improvement, GO, AGC, 4.50%, 04/01/2018 (p) | | | 25 | |
| | | | | | | | |
| | | | | | | 50 | |
| | | | | | | | |
| | | | | | | | |
PRINCIPAL
AMOUNT($) | | | SECURITY DESCRIPTION | | VALUE($) | |
| | | | | | | | |
| | | | Utility — 0.2% | |
| | 120 | | | City of Knoxville, Gas System, Series W, Rev., 5.00%, 03/01/2019 | | | 124 | |
| | 300 | | | Metropolitan Government of Nashville & Davidson County, Electric Revenue, Series A, Rev., 4.00%, 05/15/2018 | | | 302 | |
| | | | Tennessee Energy Acquisition Corp., Gas Project, | | | | |
| | 625 | | | Series A, Rev., 4.00%, 05/01/2019 | | | 641 | |
| | 780 | | | Series A, Rev., 4.00%, 05/01/2020 | | | 812 | |
| | 730 | | | Series A, Rev., 4.00%, 05/01/2021 | | | 770 | |
| | 1,715 | | | Series A, Rev., 4.00%, 05/01/2023 (z) | | | 1,827 | |
| | | | | | | | |
| | | | | | | 4,476 | |
| | | | | | | | |
| | | | Water & Sewer — 0.0% (g) | |
| | | | Jackson Energy Authority, Wastewater System, | | | | |
| | 425 | | | Rev., 5.00%, 12/01/2018 | | | 436 | |
| | 350 | | | Rev., 5.00%, 12/01/2019 | | | 370 | |
| | | | | | | | |
| | | | | | | 806 | |
| | | | | | | | |
| | | | Total Tennessee | | | 39,317 | |
| | | | | | | | |
| | | | Texas — 7.4% | |
| | | | Education — 1.6% | |
| | | | Arlington Higher Education Finance Corp., Uplift Education, | | | | |
| | 700 | | | Series A, Rev., PSF-GTD, 2.00%, 12/01/2018 | | | 702 | |
| | 435 | | | Series A, Rev., PSF-GTD, 3.00%, 12/01/2019 | | | 445 | |
| | 30 | | | Austin Community College District Public Facility Corp., Lease, Round Rock Campus, Rev., 5.00%, 08/01/2018 | | | 30 | |
| | | | County of Harris, Cultural Education Facilities Finance Corp., Children’s Hospital, | | | | |
| | 3,155 | | | Rev., 5.00%, 11/15/2018 | | | 3,232 | |
| | 25 | | | Series D, Rev., 5.00%, 11/15/2018 (p) | | | 25 | |
| | | | Harris County Cultural Education Facilities Finance Corp., Memorial Hermann Health System, | | | | |
| | 18,795 | | | Rev., VRDO, 1.13%, 03/08/2018 (z) | | | 18,795 | |
| | 8,800 | | | Series D, Rev., VRDO, 1.13%, 03/08/2018 (z) | | | 8,800 | |
| | 175 | | | Harris County Cultural Education Facilities Finance Corp., TECO Project, Series 2017, Rev., 5.00%, 11/15/2019 | | | 185 | |
| | 200 | | | Newark Higher Education Finance Corp., Orenda Education, Rev., PSF-GTD, 4.00%, 08/15/2019 | | | 206 | |
| | 25 | | | Regents of the University of North Texas, Series 2010, Rev., 5.00%, 04/15/2018 | | | 25 | |
SEE NOTES TO FINANCIAL STATEMENTS.
| | | | | | |
| | | |
| 78 | | | | J.P. MORGAN MUNICIPAL BOND FUNDS | | FEBRUARY 28, 2018 |
| | | | | | | | |
PRINCIPAL
AMOUNT($) | | | SECURITY DESCRIPTION | | VALUE($) | |
| | Municipal Bonds — continued | |
| | | | Education — continued | |
| | 300 | | | Tarrant County Cultural Education Facilities Finance Corp., Buckner Retirement Services, Inc. Project, Rev., 5.00%, 11/15/2018 | | | 307 | |
| | | | Texas A&M University, Financing System, | | | | |
| | 55 | | | Series A, Rev., 5.00%, 05/15/2018 | | | 56 | |
| | 30 | | | Series D, Rev., 5.00%, 05/15/2018 | | | 30 | |
| | 20 | | | Texas State University, Financing System, Rev., 5.00%, 03/15/2018 | | | 20 | |
| | 25 | | | Texas Woman’s University, Series 2012, Rev., 5.00%, 07/01/2018 | | | 25 | |
| | 25 | | | University of Texas System, Board of Regents, Financing System, Series D, Rev., 5.00%, 08/15/2018 | | | 25 | |
| | | | | | | | |
| | | | | | | 32,908 | |
| | | | | | | | |
| | | | General Obligation — 3.3% | |
| | 20 | | | City of Austin, GO, 4.00%, 09/01/2018 | | | 20 | |
| | | | City of Corpus Christi, | | | | |
| | 20 | | | GO, 4.00%, 03/01/2018 | | | 20 | |
| | 25 | | | Series C, GO, 4.00%, 03/01/2018 | | | 25 | |
| | 25 | | | City of Forney, GO, AGC, 4.00%, 08/15/2018 | | | 25 | |
| | 70 | | | City of Fort Stockton, Certificates of Obligation, GO, 2.00%, 03/15/2018 | | | 70 | |
| | | | City of Granbury, | | | | |
| | 160 | | | Series 2018, GO, 2.00%, 08/15/2019 | | | 161 | |
| | 185 | | | Series 2018, GO, 2.00%, 08/15/2020 | | | 186 | |
| | 1,540 | | | City of Houston, Public Improvement, Series A, GO, 5.00%, 03/01/2018 | | | 1,541 | |
| | 50 | | | City of Mercedes, GO, AGC, 3.00%, 08/15/2018 | | | 50 | |
| | 25 | | | City of Midland, Certificates of Obligation, Series 2012, GO, 4.00%, 03/01/2018 | | | 25 | |
| | 55 | | | City of Missouri City, Series B, GO, 5.00%, 06/15/2018 | | | 56 | |
| | | | City of Odessa, | | | | |
| | 600 | | | Series 2017, GO, 4.00%, 03/01/2018 | | | 600 | |
| | 360 | | | Series 2017, GO, 4.00%, 03/01/2019 | | | 369 | |
| | 300 | | | Series 2017, GO, 4.00%, 03/01/2020 | | | 313 | |
| | 65 | | | City of Pearland, GO, 4.50%, 03/01/2018 | | | 65 | |
| | 50 | | | City of Pflugerville, GO, 3.00%, 08/01/2018 | | | 50 | |
| | 35 | | | City of Weatherford, Tax & Utility System, GO, XLCA, 4.13%, 03/01/2018 | | | 35 | |
| | 2,200 | | | Clear Creek Independent School District, School Building, Series B, GO, PSF-GTD, 1.45%, 08/14/2020 (z) | | | 2,163 | |
| | 25 | | | Clear Lake City Water Authority, Waterworks & Sewer System, GO, 4.00%, 03/01/2018 | | | 25 | |
| | | | | | | | |
PRINCIPAL
AMOUNT($) | | | SECURITY DESCRIPTION | | VALUE($) | |
| | | | | | | | |
| | | | General Obligation — continued | |
| | 1,250 | | | Corpus Christi Independent School District, School Building, Series A, GO, PSF-GTD, 2.00%, 08/15/2019 (z) | | | 1,259 | |
| | 30 | | | County of Bexar, Series A, GO, 5.00%, 06/15/2018 | | | 30 | |
| | | | County of Harris, | | | | |
| | 25 | | | Series A, GO, 5.00%, 10/01/2018 | | | 26 | |
| | 30 | | | Series B, GO, 4.00%, 10/01/2018 | | | 30 | |
| | | | County of Montgomery, | | | | |
| | 50 | | | GO, AGC, 5.00%, 03/01/2018 (p) | | | 50 | |
| | 30 | | | Series A, GO, 4.00%, 03/01/2018 | | | 30 | |
| | | | County of Travis, | | | | |
| | 25 | | | GO, 5.00%, 03/01/2018 | | | 25 | |
| | 30 | | | Series A, GO, 5.00%, 03/01/2018 | | | 30 | |
| | 100 | | | Cuero Independent School District, School Building, Series 2014, GO, PSF-GTD, 5.00%, 08/15/2021 | | | 111 | |
| | 175 | | | El Paso County Hospital District, GO, 5.00%, 08/15/2019 | | | 182 | |
| | 190 | | | Fort Bend County Municipal Utility District No. 151, GO, 3.00%, 09/01/2021 | | | 194 | |
| | 2,545 | | | Fort Bend County, Levee Improvement District No. 15, GO, 0.75%, 09/01/2018 | | | 2,537 | |
| | | | Fort Bend Independent School District, | | | | |
| | 25 | | | GO, PSF-GTD, 5.00%, 08/15/2018 | | | 26 | |
| | 6,750 | | | Series B, GO, PSF-GTD, 1.35%, 08/01/2019 (z) | | | 6,735 | |
| | 20 | | | Frisco Independent School District, GO, PSF-GTD, 5.00%, 08/15/2018 | | | 20 | |
| | 3,100 | | | Goose Creek Consolidated Independent School District, Series B, GO, PSF-GTD, 1.18%, 08/15/2019 (z) | | | 3,085 | |
| | 60 | | | Grapevine-Colleyville Independent School District, Series B, GO, 5.00%, 08/15/2018 | | | 61 | |
| | 100 | | | Harris County Municipal Utility District No. 412, GO, 2.00%, 09/01/2018 | | | 100 | |
| | 6,000 | | | Houston Independent School District, Schoolhouse, Series A-2, GO, PSF-GTD, 3.00%, 06/01/2019 (z) | | | 6,111 | |
| | 200 | | | Joshua Independent School District, School Building, GO, PSF-GTD, 4.00%, 08/15/2018 | | | 202 | |
| | 40 | | | Klein Independent School District, Series B, GO, 4.00%, 08/01/2018 | | | 40 | |
| | 500 | | | Klein Independent School District, Schoolhouse, Series A, GO, PSF-GTD, 5.00%, 08/01/2018 | | | 507 | |
| | 220 | | | Leander Independent School District, Capital Appreciation, Series B, GO, Zero Coupon, 08/15/2019 | | | 215 | |
SEE NOTES TO FINANCIAL STATEMENTS.
| | | | | | | | |
| | | |
| FEBRUARY 28, 2018 | | J.P. MORGAN MUNICIPAL BOND FUNDS | | | | | 79 | |
JPMorgan Ultra-Short Municipal Fund
SCHEDULE OF PORTFOLIO INVESTMENTS
AS OF FEBRUARY 28, 2018 (continued)
(Amounts in thousands)
| | | | | | | | |
PRINCIPAL
AMOUNT($) | | | SECURITY DESCRIPTION | | VALUE($) | |
| | Municipal Bonds — continued | |
| | | | General Obligation — continued | |
| | 480 | | | Midlothian Independent School District, School Building, Series B, GO, PSF-GTD, 2.50%, 08/01/2052 (z) | | | 482 | |
| | 4,000 | | | Northside Independent School District, GO, PSF-GTD, 1.45%, 06/01/2020 (z) | | | 3,978 | |
| | 600 | | | Pasadena Independent School District, School Building, Series 2018, GO, PSF-GTD, 5.00%, 02/15/2019 | | | 620 | |
| | 250 | | | Sienna Plantation Levee Improvement District of Fort Bend County, GO, 2.00%, 09/01/2019 | | | 251 | |
| | 250 | | | Southside Independent School District, School Building, GO, PSF-GTD, 2.00%, 08/15/2019 | | | 252 | |
| | 40 | | | State of Texas, Public Finance Authority, Series A, GO, 5.00%, 10/01/2018 | | | 41 | |
| | 11,900 | | | State of Texas, Transportation Commission, Multi Mode Mobility Fund, Series B-R, GO, VRDO, LIQ: Texas Comptroller of Public Accounts, 1.13%, 03/08/2018 (z) | | | 11,900 | |
| | 30 | | | State of Texas, Unrefunded Balance, Transportation Commission, Mobility Fund, GO, 5.00%, 04/01/2018 | | | 30 | |
| | 22,255 | | | State of Texas, Veterans Bonds, GO, VRDO, 1.15%, 03/08/2018 (z) | | | 22,255 | |
| | | | State of Texas, Water Financial Assistance, | | | | |
| | 40 | | | Series B, GO, 5.00%, 08/01/2018 | | | 41 | |
| | 25 | | | Series C, GO, 5.00%, 08/01/2018 | | | 25 | |
| | 230 | | | Weslaco Independent School District, Maintenance Tax Notes, GO, AGM, 3.00%, 02/15/2019 | | | 233 | |
| | | | | | | | |
| | | | | | | 67,513 | |
| | | | | | | | |
| | | | Industrial Development Revenue/Pollution Control Revenue — 0.7% | |
| | 30 | | | Guadalupe-Blanco River Authority Industrial Development Corp., Western Canyon Regional Water Supply Project, Series 2013A, Rev., 4.00%, 04/15/2018 | | | 30 | |
| | 11,490 | | | Lower Neches Valley Authority Industrial Development Corp., ExxonMobil Project, Series 2012, Rev., VRDO, 1.14%, 03/01/2018 (z) | | | 11,490 | |
| | 4,000 | | | Matagorda County Navigation District No. 1, Pollution Control, Rev., AMT, 1.75%, 09/01/2020 (z) | | | 3,963 | |
| | | | | | | | |
| | | | | | | 15,483 | |
| | | | | | | | |
| | | | Other Revenue — 0.1% | |
| | 1,100 | | | Austin Convention Enterprises, Inc., Convention Center Hotel First Tier, Series A, Rev., 5.00%, 01/01/2019 | | | 1,128 | |
| | | | | | | | |
PRINCIPAL
AMOUNT($) | | | SECURITY DESCRIPTION | | VALUE($) | |
| | | | | | | | |
| | | | Other Revenue — continued | |
| | 100 | | | Lower Colorado River Authority, Transmission Contract, Rev., 5.00%, 05/15/2018 | | | 101 | |
| | 960 | | | Mission Redevelopment Authority, Tax Increment Contract Revenue, Rev., AGM, 4.00%, 09/01/2018 | | | 971 | |
| | | | | | | | |
| | | | | | | 2,200 | |
| | | | | | | | |
| | | | Prerefunded — 0.2% | |
| | 20 | | | City of Corpus Christi, GO, AGC, 5.00%, 03/01/2018 (p) | | | 20 | |
| | 55 | | | City of Corpus Christi, Utility System, Rev., AGC, 5.25%, 07/15/2018 (p) | | | 56 | |
| | 25 | | | City of Dallas, Waterworks & Sewer System, Rev., 5.00%, 10/01/2018 (p) | | | 26 | |
| | 35 | | | City of El Paso, Water & Sewer, Series C, Rev., 5.00%, 03/01/2018 (p) | | | 35 | |
| | 700 | | | City of Forney, Independent School District, Series A, GO, PSF-GTD, 6.00%, 08/15/2018 (p) | | | 715 | |
| | 25 | | | City of Garland, Water & Sewer System, Rev., AGM, 5.00%, 03/01/2018 (p) | | | 25 | |
| | 500 | | | Corpus Christi Independent School District, School Building, GO, 5.00%, 08/15/2019 (p) | | | 525 | |
| | 45 | | | Dallas Area Rapid Transit, Senior Lien, Rev., 5.00%, 12/01/2018 (p) | | | 46 | |
| | 195 | | | Ennis Texas, Independent School District Capital Appreciation, GO, PSF-GTD, Zero Coupon, 08/15/2018 (p) | | | 82 | |
| | 25 | | | Everman Independent School District, School Building, GO, PSF-GTD, 5.00%, 08/15/2018 (p) | | | 25 | |
| | 25 | | | Harris County, Toll Road, Senior Lien, Rev., 5.00%, 08/15/2018 (p) | | | 25 | |
| | 20 | | | Hidalgo County Drain District No. 1, Improvement, GO, AGC, 4.75%, 09/01/2018 (p) | | | 20 | |
| | 445 | | | Jarrell Independent School District, School Building, Series B, GO, 4.35%, 08/15/2018 (p) | | | 451 | |
| | 20 | | | Midlothian Independent School District, School Building, Series B, GO, PSF-GTD, 2.50%, 08/01/2018 (p) (z) | | | 20 | |
| | | | North Texas Tollway Authority System, First Tier, | | | | |
| | 1,220 | | | Series A, Rev., 6.00%, 01/01/2019 (p) | | | 1,265 | |
| | 50 | | | Series A, Rev., 6.25%, 01/01/2019 (p) | | | 52 | |
| | 70 | | | Series K-1, Rev., AGC, 5.75%, 01/01/2019 (p) | | | 73 | |
SEE NOTES TO FINANCIAL STATEMENTS.
| | | | | | |
| | | |
| 80 | | | | J.P. MORGAN MUNICIPAL BOND FUNDS | | FEBRUARY 28, 2018 |
| | | | | | | | |
PRINCIPAL
AMOUNT($) | | | SECURITY DESCRIPTION | | VALUE($) | |
| | Municipal Bonds — continued | |
| | | | Prerefunded — continued | |
| | 80 | | | Spring Hill Independent School District, GO, PSF-GTD, 5.00%, 08/15/2018 (p) | | | 81 | |
| | 30 | | | State of Texas, Unrefunded Balance, Transportation Commission, Mobility Fund, GO, 5.00%, 04/01/2018 (p) | | | 30 | |
| | 25 | | | Williamson County, Municipal Utility District No. 11, GO, 4.20%, 08/01/2018 (p) | | | 25 | |
| | | | | | | | |
| | | | | | | 3,597 | |
| | | | | | | | |
| | | | Transportation — 0.6% | |
| | 7,000 | | | Brazoria County Toll Road Authority, Limited Contract Tax & Subordinate Lien Toll Road, Series B, Rev., BAN, 1.45%, 03/01/2020 | | | 6,911 | |
| | 155 | | | Camino Real Regional Mobility Authority, Subordinate Lien Vehicle, Rev., AGM, 5.00%, 06/01/2019 | | | 161 | |
| | 25 | | | County of Harris, Series B, Rev., 5.00%, 08/15/2018 | | | 25 | |
| | | | Dallas Area Rapid Transit, Senior Lien, | | | | |
| | 50 | | | Rev., 5.00%, 12/01/2018 | | | 52 | |
| | 50 | | | Series A, Rev., 5.00%, 12/01/2018 | | | 51 | |
| | 525 | | | Dallas-Fort Worth International Airport, Series E, Rev., 5.00%, 11/01/2019 | | | 554 | |
| | | | Harris County Toll Road Authority, Senior Lien, | | | | |
| | 1,850 | | | Series A, Rev., 5.00%, 08/15/2019 | | | 1,943 | |
| | 1,500 | | | Series A, Rev., 5.00%, 08/15/2020 | | | 1,620 | |
| | 1,500 | | | Series A, Rev., 5.00%, 08/15/2021 | | | 1,660 | |
| | 30 | | | Harris County, Metropolitan Transit Authority, Rev., 4.00%, 11/01/2018 (p) | | | 31 | |
| | 125 | | | Love Field Airport Modernization Corp., Rev., AMT, 5.00%, 11/01/2021 | | | 137 | |
| | | | Port Beaumont Navigation District, | | | | |
| | 100 | | | Rev., 2.00%, 09/01/2019 | | | 102 | |
| | 155 | | | Rev., 4.00%, 09/01/2020 | | | 162 | |
| | | | Texas Transportation Commission, State Highway Fund, | | | | |
| | 20 | | | Rev., 4.00%, 10/01/2018 | | | 20 | |
| | 20 | | | Series A, Rev., 5.00%, 10/01/2018 | | | 21 | |
| | | | | | | | |
| | | | | | | 13,450 | |
| | | | | | | | |
| | | | Utility — 0.2% | |
| | 75 | | | City of Cedar Park, Utility System, Rev., 5.13%, 08/15/2018 | | | 76 | |
| | 25 | | | City of Georgetown, Utility System, Rev., 5.00%, 08/15/2018 | | | 25 | |
| | 25 | | | City of Houston, Combined Utility System, First Lien, Series C, Rev., 5.00%, 11/15/2018 | | | 26 | |
| | 4,425 | | | City of Houston, Utility System, Series B-6, Rev., VRDO, LOC: Sumitomo Mitsui Banking Corp., 1.10%, 03/08/2018 (z) | | | 4,425 | |
| | | | | | | | |
PRINCIPAL
AMOUNT($) | | | SECURITY DESCRIPTION | | VALUE($) | |
| | | | | | | | |
| | | | Utility — continued | |
| | 100 | | | City of Lubbock, Electric Light & Power System, Rev., 5.00%, 04/15/2018 | | | 101 | |
| | 50 | | | Red River Authority, Utility System, Rev., NATL-RE, 2.00%, 04/01/2018 | | | 50 | |
| | | | | | | | |
| | | | | | | 4,703 | |
| | | | | | | | |
| | | | Water & Sewer — 0.7% | |
| | 20 | | | Canyon Regional Water Authority, Wells Ranch I Project, Series 2016, Rev., 3.00%, 08/01/2018 | | | 20 | |
| | 11,275 | | | City of Austin, Water & Wastewater System, Rev., VRDO, LOC: Citibank NA, 1.11%, 03/08/2018 (z) | | | 11,275 | |
| | | | City of El Paso, Water & Sewer, | | | | |
| | 45 | | | Rev., 4.00%, 03/01/2018 | | | 45 | |
| | 25 | | | Rev., 5.00%, 03/01/2018 | | | 25 | |
| | | | City of San Antonio, Water System, | | | | |
| | 50 | | | Rev., 4.00%, 05/15/2018 | | | 51 | |
| | 25 | | | Rev., 5.00%, 05/15/2018 | | | 25 | |
| | 25 | | | Series B, Rev., 5.00%, 05/15/2018 | | | 25 | |
| | 20 | | | North Texas Municipal Water District, Upper East Fork Wastewater Interceptor System, Rev., 4.00%, 06/01/2018 | | | 20 | |
| | 20 | | | North Texas Municipal Water District, Water System, Rev., 4.00%, 09/01/2018 | | | 20 | |
| | 70 | | | Trinity River Authority Central Regional Wastewater System, Rev., 5.00%, 08/01/2018 | | | 71 | |
| | | | Trinity River Authority Central Regional Wastewater System Revenue, | | | | |
| | 1,255 | | | Rev., 5.00%, 08/01/2019 | | | 1,316 | |
| | 675 | | | Rev., 5.00%, 08/01/2020 | | | 728 | |
| | | | | | | | |
| | | | | | | 13,621 | |
| | | | | | | | |
| | | | Total Texas | | | 153,475 | |
| | | | | | | | |
| | | | Utah — 1.0% | |
| | | | General Obligation — 0.1% | |
| | | | Salt Lake City Corp., | | | | |
| | 20 | | | Series A, GO, 4.00%, 06/15/2018 | | | 20 | |
| | 30 | | | Series B, GO, 4.00%, 06/15/2018 | | | 30 | |
| | 20 | | | State of Utah, Series A, GO, 5.00%, 07/01/2018 | | | 20 | |
| | 3,130 | | | Tooele County School District, Series 2017, GO, 5.00%, 06/01/2018 | | | 3,159 | |
| | | | | | | | |
| | | | | | | 3,229 | |
| | | | | | | | |
SEE NOTES TO FINANCIAL STATEMENTS.
| | | | | | | | |
| | | |
| FEBRUARY 28, 2018 | | J.P. MORGAN MUNICIPAL BOND FUNDS | | | | | 81 | |
JPMorgan Ultra-Short Municipal Fund
SCHEDULE OF PORTFOLIO INVESTMENTS
AS OF FEBRUARY 28, 2018 (continued)
(Amounts in thousands)
| | | | | | | | |
PRINCIPAL
AMOUNT($) | | | SECURITY DESCRIPTION | | VALUE($) | |
| | Municipal Bonds — continued | |
| | | | Hospital — 0.7% | |
| | | | County of Utah Hospital, IHC Health Services, Inc., | | | | |
| | 4,000 | | | Series B, Rev., VRDO, 1.07%, 03/08/2018 (z) | | | 4,000 | |
| | 2,500 | | | Series C, Rev., VRDO, 1.08%, 03/08/2018 (z) | | | 2,500 | |
| | 7,895 | | | Series D, Rev., VRDO, 1.08%, 03/08/2018 (z) | | | 7,895 | |
| | | | | | | | |
| | | | | | | 14,395 | |
| | | | | | | | |
| | | | Other Revenue — 0.1% | |
| | | | City of Murray, Sales Tax, | | | | |
| | 200 | | | Series 2018, Rev., 2.00%, 11/15/2018 | | | 201 | |
| | 100 | | | Series 2018, Rev., 3.00%, 11/15/2019 | | | 102 | |
| | 235 | | | Series 2018, Rev., 3.00%, 11/15/2020 | | | 242 | |
| | 150 | | | Series 2018, Rev., 4.00%, 11/15/2021 | | | 161 | |
| | | | Utah Infrastructure Agency, Telecommunication Revenue, | | | | |
| | 540 | | | Series A, Rev., 2.00%, 10/15/2018 | | | 540 | |
| | 1,000 | | | Series A, Rev., 2.00%, 10/15/2019 | | | 996 | |
| | | | | | | | |
| | | | | | | 2,242 | |
| | | | | | | | |
| | | | Utility — 0.1% | |
| | | | City of Lehi, Electric Utility, | | | | |
| | 75 | | | Series 2018, Rev., 4.00%, 06/01/2019 | | | 77 | |
| | 85 | | | Series 2018, Rev., 5.00%, 06/01/2020 | | | 91 | |
| | 75 | | | Series 2018, Rev., 5.00%, 06/01/2021 | | | 82 | |
| | 1,020 | | | Intermountain Power Agency, Series A, Rev., 5.00%, 07/01/2021 | | | 1,032 | |
| | | | | | | | |
| | | | | | | 1,282 | |
| | | | | | | | |
| | | | Water & Sewer — 0.0% (g) | |
| | 20 | | | Snyderville Basin Water Reclamation District, Sewer, Rev., 5.00%, 09/15/2018 | | | 20 | |
| | 20 | | | Weber Basin Water Conservancy District, Series A, Rev., 5.00%, 10/01/2018 | | | 21 | |
| | | | | | | | |
| | | | | | | 41 | |
| | | | | | | | |
| | | | Total Utah | | | 21,189 | |
| | | | | | | | |
| | | | Vermont — 0.0% (g) | |
| | | | Prerefunded — 0.0% (g) | |
| | 275 | | | Vermont Educational & Health Buildings Financing Agency, Fletcher Allen Health, Hospital, Series B, Rev., AGM, 5.00%, 06/01/2018 (p) | | | 277 | |
| | | | | | | | |
| | | | Virginia — 1.2% | |
| | | | Education — 0.0% (g) | |
| | 110 | | | Virginia College Building Authority, Series B, Rev., 5.00%, 09/01/2018 | | | 112 | |
| | | | | | | | |
PRINCIPAL
AMOUNT($) | | | SECURITY DESCRIPTION | | VALUE($) | |
| | | | | | | | |
| | | | Education — continued | |
| | 20 | | | Virginia Public School Authority, Technology & Security, Series I, Rev., 5.00%, 04/15/2018 | | | 20 | |
| | | | | | | | |
| | | | | | | 132 | |
| | | | | | | | |
| | | | General Obligation — 0.1% | |
| | 200 | | | City of Charlottesville, Public Improvement, Series B, GO, 4.00%, 07/15/2020 | | | 211 | |
| | | | City of Norfolk, | | | | |
| | 15 | | | Series G, GO, 4.00%, 10/01/2018 | | | 15 | |
| | 10 | | | Series G, GO, 4.00%, 10/01/2018 (p) | | | 10 | |
| | 35 | | | City of Town of Blacksburg, GO, 3.00%, 03/01/2018 | | | 35 | |
| | | | City of Virginia Beach, | | | | |
| | 25 | | | Series A, GO, 4.00%, 08/01/2018 | | | 25 | |
| | 30 | | | Series A-1, GO, 5.00%, 03/15/2018 | | | 30 | |
| | 1,480 | | | Commonwealth of Virginia, Series A, GO, 5.00%, 06/01/2021 | | | 1,631 | |
| | 25 | | | County of Fairfax, Public Improvement, Series A, GO, 5.00%, 04/01/2018 | | | 25 | |
| | 40 | | | County of Stafford, Public Improvement, GO, 5.00%, 07/01/2018 | | | 41 | |
| | | | | | | | |
| | | | | | | 2,023 | |
| | | | | | | | |
| | | | Housing — 0.5% | |
| | 10,000 | | | Newport News Redevelopment & Housing Authority, Berkley Preservation Project, Rev., FHA/GNMA, 1.20%, 04/01/2019 | | | 9,922 | |
| | | | | | | | |
| | | | Other Revenue — 0.2% | |
| | 25 | | | Albemarle County Economic Development Authority, Albemarle County Project, Rev., 5.00%, 06/01/2018 | | | 25 | |
| | | | Virginia Public Building Authority, Public Facilities, | | | | |
| | 20 | | | Series 2017B-1, Rev., 5.00%, 08/01/2018 | | | 20 | |
| | 20 | | | Series A, Rev., 5.00%, 08/01/2018 | | | 20 | |
| | 4,000 | | | Series D, Rev., 5.00%, 08/01/2018 | | | 4,061 | |
| | 20 | | | Virginia Resources Authority, Infrastructure, Unrefunded Balance, Rev., 4.00%, 11/01/2018 | | | 21 | |
| | | | | | | | |
| | | | | | | 4,147 | |
| | | | | | | | |
| | | | Prerefunded — 0.4% | |
| | 45 | | | City of Newport News, Series AB, GO, 5.00%, 03/01/2018 (p) | | | 45 | |
| | 20 | | | Commonwealth of Virginia, Series B, GO, 5.00%, 06/01/2018 (p) | | | 20 | |
| | 20 | | | County of Prince William, GO, 4.13%, 08/01/2018 (p) | | | 20 | |
SEE NOTES TO FINANCIAL STATEMENTS.
| | | | | | |
| | | |
| 82 | | | | J.P. MORGAN MUNICIPAL BOND FUNDS | | FEBRUARY 28, 2018 |
| | | | | | | | |
PRINCIPAL
AMOUNT($) | | | SECURITY DESCRIPTION | | VALUE($) | |
| | Municipal Bonds — continued | |
| | | | Prerefunded — continued | |
| | 8,235 | | | Fairfax County EDA, Community Services Facilities Projects, Series A, Rev., 4.50%, 03/01/2021 (p) | | | 8,894 | |
| | 30 | | | Hampton Roads Sanitation District, Wastewater Revenue, Rev., 5.00%, 04/01/2018 (p) | | | 30 | |
| | 20 | | | Virginia College Building Authority, Educational Facilities, 21st Century College & Equipment, Series A, Rev., 5.00%, 02/01/2019 (p) | | | 21 | |
| | | | | | | | |
| | | | | | | 9,030 | |
| | | | | | | | |
| | | | Water & Sewer — 0.0% (g) | |
| | 20 | | | Hampton Roads Sanitation District, Wastewater Revenue, Series A, Rev., 5.00%, 08/01/2018 | | | 20 | |
| | | | | | | | |
| | | | Total Virginia | | | 25,274 | |
| | | | | | | | |
| | | | Washington — 1.1% | |
| | | | Certificate of Participation/Lease — 0.0% (g) | |
| | 100 | | | State of Washington, State & Local Agency Real & Personal Property, Series D, COP, 5.00%, 07/01/2018 | | | 101 | |
| | | | | | | | |
| | | | Education — 0.1% | |
| | 1,100 | | | University of Washington, Series A, Rev., 5.00%, 12/01/2018 | | | 1,130 | |
| | | | | | | | |
| | | | General Obligation — 0.3% | |
| | 20 | | | City of Yakima, Series A, GO, 4.00%, 06/01/2018 | | | 20 | |
| | 35 | | | King County School District No. 414, Lake Washington, GO, 5.00%, 06/01/2018 | | | 35 | |
| | 170 | | | Snohomish County School District No. 25, Marysville, GO, 5.00%, 12/01/2020 | | | 185 | |
| | | | State of Washington, Motor Vehicle Fuel Tax, | | | | |
| | 50 | | | Series B, GO, 5.00%, 07/01/2018 | | | 51 | |
| | 4,000 | | | Series R-2011C, GO, 5.00%, 07/01/2018 | | | 4,048 | |
| | | | State of Washington, Various Purpose, | | | | |
| | 400 | | | Series R-2011B, GO, 5.00%, 07/01/2019 | | | 418 | |
| | 1,500 | | | Series R-2013C, GO, 5.00%, 07/01/2018 | | | 1,518 | |
| | 55 | | | Series R-A, GO, 5.00%, 07/01/2018 | | | 56 | |
| | 20 | | | Series R-B, GO, 5.00%, 07/01/2018 | | | 20 | |
| | 625 | | | State of Washington, Various Purpose, Green Bond, Series A-2, GO, 4.00%, 08/01/2018 | | | 632 | |
| | | | | | | | |
| | | | | | | 6,983 | |
| | | | | | | | |
| | | | Hospital — 0.5% | |
| | 145 | | | Washington Biomedical Research Properties 3.2, Series A, Rev., 5.00%, 01/01/2019 | | | 149 | |
| | 5,000 | | | Washington Health Care Facilities Authority, Catholic Health Initiatives, Rev., (Dow Jones US Mid Cap Sofware Index GICS Level 4 USD + 1.00%, 12.00% Cap), 2.09%, 03/08/2018 (aa) | | | 4,973 | |
| | | | | | | | |
PRINCIPAL
AMOUNT($) | | | SECURITY DESCRIPTION | | VALUE($) | |
| | | | | | | | |
| | | | Hospital — continued | |
| | 1,210 | | | Washington Health Care Facilities Authority, Overlake Hospital Medical Center, Series 2017B, Rev., 5.00%, 07/01/2022 | | | 1,339 | |
| | 3,150 | | | Washington Health Care Facilities Authority, Providence Health & Service, Series C, Rev., VRDO, 1.17%, 03/08/2018 (z) | | | 3,150 | |
| | 20 | | | Washington Health Care Facilities Authority, Seattle Children’s Hospital, Rev., 5.00%, 10/01/2018 | | | 21 | |
| | | | | | | | |
| | | | | | | 9,632 | |
| | | | | | | | |
| | | | Housing — 0.2% | |
| | 4,000 | | | Washington State Housing Finance Commission, Royal Hills Apartments, Series A, Rev., 1.40%, 11/01/2019 | | | 3,982 | |
| | | | | | | | |
| | | | Other Revenue — 0.0% (g) | |
| | 165 | | | Washington Economic Development Finance Authority, Seadrunar Project, Series E, Rev., VRDO, LOC: U.S. Bank NA, 1.47%, 03/08/2018 (z) | | | 165 | |
| | | | | | | | |
| | | | Prerefunded — 0.0% (g) | |
| | | | City of Seattle, Municipal Light & Power, | | | | |
| | 20 | | | Rev., AGM, 5.00%, 06/01/2018 (p) | | | 20 | |
| | 25 | | | Rev., 5.00%, 06/01/2018 (p) | | | 25 | |
| | | | King County Public Hospital District No. 1, | | | | |
| | 35 | | | Series A, GO, AGC, 5.00%, 06/01/2018 (p) | | | 36 | |
| | 25 | | | Series A, GO, AGC, 5.25%, 06/01/2018 (p) | | | 25 | |
| | 35 | | | Port of Tacoma, Limited Tax, Series A, GO, AGM, 5.00%, 06/01/2018 (p) | | | 35 | |
| | 15 | | | Snohomish County School District No. 201, Snohomish, GO, 5.25%, 12/01/2018 (p) | | | 15 | |
| | 85 | | | State of Washington, Motor Vehicle Fuel Tax, Series B, GO, 5.00%, 07/01/2018 (p) | | | 86 | |
| | | | State of Washington, Various Purpose, | | | | |
| | 20 | | | Series 2009A, GO, 5.00%, 07/01/2018 (p) | | | 20 | |
| | 40 | | | Series A, GO, 5.00%, 07/01/2018 (p) | | | 41 | |
| | | | | | | | |
| | | | | | | 303 | |
| | | | | | | | |
| | | | Utility — 0.0% (g) | |
| | 100 | | | City of Seattle, Municipal Light & Power, Series B-2, Rev., (Dow Jones US Mid Cap Sofware Index GICS Level 4 USD + 0.68%, 12.00% Cap), 1.77%, 03/08/2018 (aa) | | | 100 | |
| | | | Energy Northwest, Electric Revenue, | | | | |
| | 60 | | | Rev., 5.00%, 07/01/2018 | | | 61 | |
| | 110 | | | Series A, Rev., 5.00%, 07/01/2018 | | | 111 | |
| | 35 | | | Series A, Rev., 5.25%, 07/01/2018 | | | 35 | |
| | 55 | | | Series S, Rev., 5.00%, 07/01/2018 | | | 56 | |
SEE NOTES TO FINANCIAL STATEMENTS.
| | | | | | | | |
| | | |
| FEBRUARY 28, 2018 | | J.P. MORGAN MUNICIPAL BOND FUNDS | | | | | 83 | |
JPMorgan Ultra-Short Municipal Fund
SCHEDULE OF PORTFOLIO INVESTMENTS
AS OF FEBRUARY 28, 2018 (continued)
(Amounts in thousands)
| | | | | | | | |
PRINCIPAL
AMOUNT($) | | | SECURITY DESCRIPTION | | VALUE($) | |
| | Municipal Bonds — continued | |
| | | | Utility — continued | |
| | 20 | | | Lewis County Public Utility District No. 1, Cowlitz Falls Hydroelectric Project, Rev., 5.00%, 10/01/2018 | | | 21 | |
| | | | | | | | |
| | | | | | | 384 | |
| | | | | | | | |
| | | | Water & Sewer — 0.0% (g) | |
| | 90 | | | City of Marysville, Water & Sewer, Rev., 4.00%, 04/01/2018 | | | 90 | |
| | | | | | | | |
| | | | Total Washington | | | 22,770 | |
| | | | | | | | |
| | | | Wisconsin — 1.5% | |
| | | | Education — 0.9% | |
| | 8,500 | | | Madison Metropolitan School District, GO, TRAN, 2.00%, 09/06/2018 | | | 8,528 | |
| | | | Wisconsin Health & Educational Facilities Authority, Franciscan Sisters of Christian Charity Sponsored Ministries, Inc., | | | | |
| | 175 | | | Rev., 4.00%, 09/01/2018 | | | 177 | |
| | 145 | | | Rev., 5.00%, 09/01/2019 | | | 151 | |
| | 155 | | | Rev., 5.00%, 09/01/2020 | | | 164 | |
| | 160 | | | Rev., 5.00%, 09/01/2021 | | | 173 | |
| | 8,000 | | | Wisconsin School Districts, Cash Flow Administration Program, Series A, GO, 1.38%, 10/08/2018 | | | 7,995 | |
| | | | | | | | |
| | | | | | | 17,188 | |
| | | | | | | | |
| | | | General Obligation — 0.1% | |
| | 225 | | | City of Fond Du Lac, Series B, GO, 2.00%, 04/01/2019 | | | 226 | |
| | 30 | | | City of Madison, Series A, GO, 5.00%, 10/01/2018 | | | 31 | |
| | 25 | | | City of New Berlin, Promissory Notes, GO, 3.50%, 12/01/2018 | | | 25 | |
| | 170 | | | City of Shawano, GO, AGM, 2.00%, 04/01/2018 | | | 170 | |
| | | | County of Manitowoc, | | | | |
| | 105 | | | GO, 2.00%, 11/01/2018 | | | 105 | |
| | 215 | | | GO, 2.00%, 11/01/2019 | | | 216 | |
| | 40 | | | Northcentral Technical College District, Promissory Notes, GO, 2.00%, 03/01/2018 | | | 40 | |
| | | | State of Wisconsin, | | | | |
| | 35 | | | Series 1, GO, AMBAC, 5.00%, 05/01/2018 | | | 35 | |
| | 70 | | | Series 1, GO, 5.00%, 05/01/2018 | | | 71 | |
| | 190 | | | Series A, GO, 5.00%, 05/01/2018 | | | 191 | |
| | 20 | | | Series B, GO, 5.00%, 05/01/2018 | | | 20 | |
| | 45 | | | Series C, GO, 5.00%, 05/01/2018 | | | 45 | |
| | 50 | | | Series D, GO, 5.00%, 05/01/2018 | | | 50 | |
| | | | | | | | |
PRINCIPAL
AMOUNT($) | | | SECURITY DESCRIPTION | | VALUE($) | |
| | | | | | | | |
| | | | General Obligation — continued | |
| | | | Village of Pulaski, | | | | |
| | 520 | | | GO, AGM, 2.00%, 04/01/2018 | | | 520 | |
| | 160 | | | GO, AGM, 2.00%, 04/01/2019 | | | 160 | |
| | 160 | | | GO, AGM, 3.00%, 04/01/2020 | | | 164 | |
| | | | | | | | |
| | | | | | | 2,069 | |
| | | | | | | | |
| | | | Other Revenue — 0.4% | |
| | 1,750 | | | PMA Levy & Aid Anticipation Notes Program, Series B, Rev., 2.00%, 07/20/2018 | | | 1,754 | |
| | 20 | | | State of Wisconsin, Annual Appropriation, Series A, Rev., 5.00%, 05/01/2018 (p) | | | 20 | |
| | 35 | | | State of Wisconsin, Clean Water Fund, Leveraged Loan Portfolio, Series 3, Rev., 5.00%, 06/01/2018 (p) | | | 35 | |
| | 6,965 | | | Village of Howard, Rev., 2.00%, 12/01/2021 | | | 6,959 | |
| | | | | | | | |
| | | | | | | 8,768 | |
| | | | | | | | |
| | | | Prerefunded — 0.0% (g) | |
| | 20 | | | City of Racine, GO, 5.00%, 12/01/2018 (p) | | | 21 | |
| | | | Wisconsin Department of Transportation, | | | | |
| | 25 | | | Series A, Rev., BHAC-CR, 5.00%, 07/01/2018 (p) | | | 25 | |
| | 90 | | | Series A, Rev., 5.00%, 07/01/2018 (p) | | | 91 | |
| | | | | | | | |
| | | | | | | 137 | |
| | | | | | | | |
| | | | Transportation — 0.1% | |
| | | | Wisconsin Department of Transportation, | | | | |
| | 25 | | | Series 1, Rev., 4.00%, 07/01/2018 | | | 25 | |
| | 20 | | | Series 1, Rev., 5.00%, 07/01/2018 | | | 20 | |
| | 2,135 | | | Series 1, Rev., 5.00%, 07/01/2020 | | | 2,299 | |
| | | | | | | | |
| | | | | | | 2,344 | |
| | | | | | | | |
| | | | Utility — 0.0% (g) | |
| | 80 | | | Wisconsin Public Power, Inc., Power Supply System, Series A, Rev., AGM, 5.00%, 07/01/2018 | | | 81 | |
| | | | | | | | |
| | | | Water & Sewer — 0.0% (g) | |
| | | | State of Wisconsin, Clean Water Fund, Leveraged Loan Portfolio, | | | | |
| | 80 | | | Series 1, Rev., 5.00%, 06/01/2018 (p) | | | 81 | |
| | 25 | | | Series 4, Rev., 5.00%, 06/01/2018 (p) | | | 25 | |
| | | | | | | | |
| | | | | | | 106 | |
| | | | | | | | |
| | | | Total Wisconsin | | | 30,693 | |
| | | | | | | | |
| | | | Wyoming — 0.0% (g) | |
| | | | General Obligation — 0.0% (g) | |
| | 25 | | | Laramie County Community College District, GO, 4.00%, 06/01/2018 | | | 25 | |
| | | | | | | | |
SEE NOTES TO FINANCIAL STATEMENTS.
| | | | | | |
| | | |
| 84 | | | | J.P. MORGAN MUNICIPAL BOND FUNDS | | FEBRUARY 28, 2018 |
| | | | | | | | |
PRINCIPAL
AMOUNT($) | | | SECURITY DESCRIPTION | | VALUE($) | |
| | Municipal Bonds — continued | |
| | | | Utility — 0.0% (g) | |
| | 175 | | | Wyoming Municipal Power Agency, Inc., Power Supply System, Series A, Rev., 4.00%, 01/01/2019 | | | 178 | |
| | | | | | | | |
| | | | Total Wyoming | | | 203 | |
| | | | | | | | |
| | | | Total Municipal Bonds
(Cost $1,957,044) | | | 1,954,040 | |
| | | | | | | | |
| | |
SHARES | | | | | | |
| | Short-Term Investment — 4.5% | |
| | | | Investment Company — 4.5% | |
| | 92,021 | | | JPMorgan U.S. Government Money Market Fund, Institutional Class Shares, 1.25% (b) (l)
(Cost $92,021) | | | 92,021 | |
| | | | | | | | |
| | | | Total Investments — 99.1%
(Cost $2,049,065) | | | 2,046,061 | |
| | | | Other Assets in Excess of
Liabilities — 0.9% | | | 19,008 | |
| | | | | | | | |
| | | | NET ASSETS — 100.0% | | $ | 2,065,069 | |
| | | | | | | | |
Percentages indicated are based on net assets.
SEE NOTES TO FINANCIAL STATEMENTS.
| | | | | | | | |
| | | |
| FEBRUARY 28, 2018 | | J.P. MORGAN MUNICIPAL BOND FUNDS | | | | | 85 | |
JPMorgan Municipal Bond Funds
NOTES TO SCHEDULES OF PORTFOLIO INVESTMENTS
AS OF FEBRUARY 28, 2018
| | |
| AGC | | — Insured by Assured Guaranty Corp. |
| AGM | | — Insured by Assured Guaranty Municipal Corp. |
| AMBAC | | — Insured by American Municipal Bond Assurance Corp. |
| AMT | | — Alternative Minimum Tax |
| BAN | | — Bond Anticipation Note |
| BHAC | | — Insured by Berkshire Hathaway Assurance Corp. |
| CHESLA | | — Connecticut Higher Education Supplemental Loan Authority |
| COLL | | — Collateral |
| COP | | — Certificate of Participation |
| CR | | — Custodial Receipts |
| EDA | | — Economic Development Authority |
| FGIC | | — Insured by Financial Guaranty Insurance Co. |
| FHA | | — Federal Housing Administration |
| FHLMC | | — Federal Home Loan Mortgage Corp. |
| FNMA | | — Federal National Mortgage Association |
| GAN | | — Grant Anticipation Notes |
| GICS | | — Global Industry Classification Standard |
| GNMA | | — Government National Mortgage Association |
| GO | | — General Obligation |
| GRAN | | — Grant Revenue Anticipation Notes |
| GTD | | — Guaranteed |
| ICE | | — Intercontinental Exchange |
| IDA | | — Industrial Development Authority |
| LIBOR | | — London Interbank Offered Rate |
| LIQ | | — Liquidity Agreement |
| LOC | | — Letter of Credit |
| MTA | | — Metropolitan Transportation Authority |
| NATL | | — Insured by National Public Finance Guarantee Corp. |
| PSF | | — Permanent School Fund |
| Q-SBLF | | — Qualified School Bond Loan Fund |
| RAN | | — Revenue Anticipation Note |
| RE | | — Reinsured |
| REMIC | | — Real Estate Mortgage Investment Conduit |
| | |
| Rev. | | — Revenue |
| SCSDE | | — South Carolina School District Enhancement |
| TAN | | — Tax Anticipation Note |
| TRAN | | — Tax & Revenue Anticipation Note |
| USD | | — United States Dollar |
| VRDO | | — Variable Rate Demand Obligation. The interest rate shown is the rate in effect as of February 28, 2018. |
| XLCA | | — Insured by XL Capital Assurance |
| |
| (b) | | — Investment in affiliate. Money market fund is registered under the Investment Company Act of 1940, as amended, and advised by J.P. Morgan Investment Management Inc. |
| (e) | | — Security is exempt from registration under Rule 144A of the Securities Act of 1933, as amended. Unless otherwise indicated, this security has been determined to be liquid under procedures established by the Board of Trustees and may be resold in transactions exempt from registration, normally to qualified institutional buyers. |
| (g) | | — Amount rounds to less than 0.05%. |
| (l) | | — The rate shown is the current yield as of February 28, 2018. |
| (p) | | — Security is prerefunded or escrowed to maturity. |
| (t) | | — The date shown represents the earliest of the prerefunded date, next put date or final maturity date. |
| (w) | | — All or a portion of the security is a when-issued security, delayed delivery security, or forward commitment. |
| (z) | | — Variable or floating rate security, the interest rate of which adjusts periodically based on changes in current interest rates and prepayments on the underlying pool of assets. The interest rate shown is the current rate as of February 28, 2018. |
| (aa) | | — Variable or floating rate security, linked to the referenced benchmark. The interest rate shown is the current rate as of February 28, 2018. |
| (bb) | | — Security has been valued using significant unobservable inputs. |
SEE NOTES TO FINANCIAL STATEMENTS.
| | | | | | |
| | | |
| 86 | | | | J.P. MORGAN MUNICIPAL BOND FUNDS | | FEBRUARY 28, 2018 |
THIS PAGE IS INTENTIONALLY LEFT BLANK
| | | | | | | | |
| | | |
| FEBRUARY 28, 2018 | | J.P. MORGAN MUNICIPAL BOND FUNDS | | | | | 87 | |
STATEMENTS OF ASSETS AND LIABILITIES
AS OF FEBRUARY 28, 2018
(Amounts in thousands, except per share amounts)
| | | | | | | | |
| | | Municipal
Income Fund | | | Short-
Intermediate
Municipal
Bond Fund | |
ASSETS: | | | | | | | | |
Investments in non-affiliates, at value | | $ | 210,447 | | | $ | 1,694,254 | |
Investments in affiliates, at value | | | 4,335 | | | | 11,128 | |
Cash | | | — | (a) | | | — | (a) |
Receivables: | | | | | | | | |
Investment securities sold | | | 197 | | | | 5,696 | |
Investment securities sold — delayed delivery securities | | | 155 | | | | — | |
Fund shares sold | | | 160 | | | | 849 | |
Interest from non-affiliates | | | 2,209 | | | | 16,006 | |
Dividends from affiliates | | | 4 | | | | 21 | |
Due from adviser | | | 9 | | | | — | |
Other assets | | | 9 | | | | — | |
| | | | | | | | |
Total Assets | | | 217,525 | | | | 1,727,954 | |
| | | | | | | | |
| | |
LIABILITIES: | | | | | | | | |
Payables: | | | | | | | | |
Investment securities purchased | | | — | | | | 2,821 | |
Fund shares redeemed | | | 133 | | | | 5,098 | |
Accrued liabilities: | | | | | | | | |
Investment advisory fees | | | — | | | | 191 | |
Administration fees | | | — | | | | 14 | |
Distribution fees | | | 21 | | | | 10 | |
Service fees | | | 12 | | | | 81 | |
Custodian and accounting fees | | | 12 | | | | 23 | |
Trustees’ and Chief Compliance Officer’s fees | | | — | | | | — | (a) |
Audit fees | | | 33 | | | | 31 | |
Printing and mailing cost | | | 13 | | | | 99 | |
Other | | | 6 | | | | — | (a) |
| | | | | | | | |
Total Liabilities | | | 230 | | | | 8,368 | |
| | | | | | | | |
Net Assets | | $ | 217,295 | | | $ | 1,719,586 | |
| | | | | | | | |
| (a) | Amount rounds to less than 500. |
SEE NOTES TO FINANCIAL STATEMENTS.
| | | | | | |
| | | |
| 88 | | | | J.P. MORGAN MUNICIPAL BOND FUNDS | | FEBRUARY 28, 2018 |
| | | | | | | | |
| | | Municipal
Income Fund | | | Short-
Intermediate
Municipal
Bond Fund | |
NET ASSETS: | | | | | | | | |
Paid-in-Capital | | $ | 214,384 | | | $ | 1,733,229 | |
Accumulated undistributed (distributions in excess of) net investment income | | | (26 | ) | | | 12 | |
Accumulated net realized gains (losses) | | | 875 | | | | (11,630 | ) |
Net unrealized appreciation (depreciation) | | | 2,062 | | | | (2,025 | ) |
| | | | | | | | |
Total Net Assets | | $ | 217,295 | | | $ | 1,719,586 | |
| | | | | | | | |
| | |
Net Assets: | | | | | | | | |
Class A | | $ | 66,258 | | | $ | 32,373 | |
Class C | | | 15,138 | | | | 6,406 | |
Class I* | | | 71,161 | | | | 1,680,807 | |
Class R6 | | | 64,738 | | | | — | |
| | | | | | | | |
Total | | $ | 217,295 | | | $ | 1,719,586 | |
| | | | | | | | |
| | |
Outstanding units of beneficial interest (shares) | | | | | | | | |
($0.0001 par value; unlimited number of shares authorized): | | | | | | | | |
Class A | | | 6,962 | | | | 3,116 | |
Class C | | | 1,606 | | | | 611 | |
Class I* | | | 7,530 | | | | 160,959 | |
Class R6 | | | 6,852 | | | | — | |
| | |
Net Asset Value (a): | | | | | | | | |
Class A — Redemption price per share | | $ | 9.52 | | | $ | 10.39 | |
Class C — Offering price per share (b) | | | 9.42 | | | | 10.48 | |
Class I* — Offering and redemption price per share | | | 9.45 | | | | 10.44 | |
Class R6 — Offering and redemption price per share | | | 9.45 | | | | — | |
Class A maximum sales charge | | | 3.75 | % | | | 2.25 | % |
Class A maximum public offering price per share
[net asset value per share/(100% — maximum sales charge)] | | $ | 9.89 | | | $ | 10.63 | |
| | | | | | | | |
Cost of investments in non-affiliates | | $ | 208,385 | | | $ | 1,696,279 | |
Cost of investments in affiliates | | | 4,335 | | | | 11,128 | |
| (a) | Per share amounts may not recalculate due to rounding of net assets and/or shares outstanding. |
| (b) | Redemption price for Class C Shares varies based upon length of time the shares are held. |
| * | Effective April 3, 2017, the Institutional Class of Short-Intermediate Municipal Bond Fund and the Select Class of Municipal Income Fund were renamed Class I. |
SEE NOTES TO FINANCIAL STATEMENTS.
| | | | | | | | |
| | | |
| FEBRUARY 28, 2018 | | J.P. MORGAN MUNICIPAL BOND FUNDS | | | | | 89 | |
STATEMENTS OF ASSETS AND LIABILITIES
AS OF FEBRUARY 28, 2018 (continued)
(Amounts in thousands, except per share amounts)
| | | | | | | | |
| | |
Tax Free
Bond Fund | | | Ultra-Short
Municipal Fund | |
ASSETS: | | | | | | | | |
Investments in non-affiliates, at value | | $ | 302,974 | | | $ | 1,954,040 | |
Investments in affiliates, at value | | | 9,885 | | | | 92,021 | |
Cash | | | — | | | | 7 | |
Deposits at broker for futures contracts | | | 115 | | | | — | |
Receivables: | | | | | | | | |
Investment securities sold | | | 29 | | | | 27,240 | |
Fund shares sold | | | 480 | | | | 33,329 | |
Interest and dividends from non-affiliates | | | 3,511 | | | | 11,243 | |
Dividends from affiliates | | | 8 | | | | 149 | |
Variation margin on futures contracts | | | 10 | | | | — | |
Due from adviser | | | — | | | | 27 | |
| | | | | | | | |
Total Assets | | | 317,012 | | | | 2,118,056 | |
| | | | | | | | |
| | |
LIABILITIES: | | | | | | | | |
Payables: | | | | | | | | |
Due to custodian | | | 17 | | | | — | |
Investment securities purchased | | | — | | | | 41,734 | |
Investment securities purchased — delayed delivery securities | | | — | | | | 8,649 | |
Fund shares redeemed | | | 804 | | | | 2,169 | |
Accrued liabilities: | | | | | | | | |
Investment advisory fees | | | 11 | | | | — | |
Distribution fees | | | 40 | | | | — | (a) |
Service fees | | | 47 | | | | 189 | |
Custodian and accounting fees | | | 14 | | | | 33 | |
Trustees’ and Chief Compliance Officer’s fees | | | — | (a) | | | 1 | |
Audit fees | | | 37 | | | | 43 | |
Printing and mailing cost | | | 15 | | | | 2 | |
Other | | | 2 | | | | 167 | |
| | | | | | | | |
Total Liabilities | | | 987 | | | | 52,987 | |
| | | | | | | | |
Net Assets | | $ | 316,025 | | | $ | 2,065,069 | |
| | | | | | | | |
| (a) | Amount rounds to less than 500. |
SEE NOTES TO FINANCIAL STATEMENTS.
| | | | | | |
| | | |
| 90 | | | | J.P. MORGAN MUNICIPAL BOND FUNDS | | FEBRUARY 28, 2018 |
| | | | | | | | |
| | |
Tax Free
Bond Fund | | | Ultra-Short
Municipal Fund | |
NET ASSETS: | | | | | | | | |
Paid-in-Capital | | $ | 305,287 | | | $ | 2,068,015 | |
Accumulated undistributed (distributions in excess of) net investment income | | | (11 | ) | | | 115 | |
Accumulated net realized gains (losses) | | | (1,812 | ) | | | (57 | ) |
Net unrealized appreciation (depreciation) | | | 12,561 | | | | (3,004 | ) |
| | | | | | | | |
Total Net Assets | | $ | 316,025 | | | $ | 2,065,069 | |
| | | | | | | | |
| | |
Net Assets: | | | | | | | | |
Class A | | $ | 130,462 | | | $ | 772 | |
Class C | | | 25,172 | | | | — | |
Class I (formerly Select Class) | | | 160,391 | | | | 2,064,297 | |
| | | | | | | | |
Total | | $ | 316,025 | | | $ | 2,065,069 | |
| | | | | | | | |
| | |
Outstanding units of beneficial interest (shares) | | | | | | | | |
($0.0001 par value; unlimited number of shares authorized): | | | | | | | | |
Class A | | | 11,037 | | | | 77 | |
Class C | | | 2,147 | | | | — | |
Class I (formerly Select Class) | | | 13,627 | | | | 206,364 | |
| | |
Net Asset Value (a): | | | | | | | | |
Class A — Redemption price per share | | $ | 11.82 | | | $ | 10.01 | |
Class C — Offering price per share (b) | | | 11.72 | | | | — | |
Class I (formerly Select Class) — Offering and redemption price per share | | | 11.77 | | | | 10.00 | |
Class A maximum sales charge | | | 3.75 | % | | | 2.25 | % |
Class A maximum public offering price per share
[net asset value per share/(100% — maximum sales charge)] | | $ | 12.28 | | | $ | 10.24 | |
| | | | | | | | |
Cost of investments in non-affiliates | | $ | 290,401 | | | $ | 1,957,044 | |
Cost of investments in affiliates | | | 9,885 | | | | 92,021 | |
| (a) | Per share amounts may not recalculate due to rounding of net assets and/or shares outstanding. |
| (b) | Redemption price for Class C Shares varies based upon length of time the shares are held. |
SEE NOTES TO FINANCIAL STATEMENTS.
| | | | | | | | |
| | | |
| FEBRUARY 28, 2018 | | J.P. MORGAN MUNICIPAL BOND FUNDS | | | | | 91 | |
STATEMENTS OF OPERATIONS
FOR THE YEAR ENDED FEBRUARY 28, 2018
(Amounts in thousands)
| | | | | | | | |
| | | Municipal
Income Fund | | | Short-
Intermediate
Municipal
Bond Fund | |
INVESTMENT INCOME: | | | | | | | | |
Interest income from non-affiliates | | $ | 7,649 | | | $ | 40,457 | |
Interest income from affiliates | | | — | (a) | | | 1 | |
Dividend income from non-affiliates | | | 112 | | | | — | (a) |
Dividend income from affiliates | | | 68 | | | | 723 | |
| | | | | | | | |
Total investment income | | | 7,829 | | | | 41,181 | |
| | | | | | | | |
| | |
EXPENSES: | | | | | | | | |
Investment advisory fees | | | 778 | | | | 5,822 | |
Administration fees | | | 211 | | | | 1,897 | |
Distribution fees: | | | | | | | | |
Class A | | | 179 | | | | 77 | |
Class C | | | 122 | | | | 81 | |
Service fees: | | | | | | | | |
Class A | | | 179 | | | | 77 | |
Class C | | | 41 | | | | 27 | |
Class I* | | | 384 | | | | 5,430 | |
Select Class (b) | | | — | | | | 33 | |
Custodian and accounting fees | | | 77 | | | | 210 | |
Professional fees | | | 90 | | | | 90 | |
Trustees’ and Chief Compliance Officer’s fees | | | 26 | | | | 32 | |
Printing and mailing costs | | | 40 | | | | 149 | |
Registration and filing fees | | | 55 | | | | 67 | |
Transfer agency fees (See Note 2.F.) | | | 9 | | | | 20 | |
Sub-transfer agency fees (See Note 2.F.) | | | 3 | | | | 17 | |
Other | | | 10 | | | | 40 | |
| | | | | | | | |
Total expenses | | | 2,204 | | | | 14,069 | |
| | | | | | | | |
Less fees waived | | | (754 | ) | | | (8,188 | ) |
Less expense reimbursements | | | (8 | ) | | | — | |
| | | | | | | | |
Net expenses | | | 1,442 | | | | 5,881 | |
| | | | | | | | |
Net investment income (loss) | | | 6,387 | | | | 35,300 | |
| | | | | | | | |
| | |
REALIZED/UNREALIZED GAINS (LOSSES): | | | | | | | | |
Net realized gain (loss) on transactions from investments in non-affiliates | | | 2,097 | | | | (2,785 | ) |
Change in net unrealized appreciation/depreciation on investments in non-affiliates | | | (4,584 | ) | | | (12,921 | ) |
| | | | | | | | |
Net realized/unrealized gains (losses) | | | (2,487 | ) | | | (15,706 | ) |
| | | | | | | | |
Change in net assets resulting from operations | | $ | 3,900 | | | $ | 19,594 | |
| | | | | | | | |
| (a) | Amount rounds to less than 500. |
| (b) | Select Class Shares of Short-Intermediate Municipal Bond Fund had no assets from the close of business on April 3, 2017. |
| * | Effective April 3, 2017, the Institutional Class of Short-Intermediate Municipal Bond Fund and the Select Class of Municipal Income Fund were renamed Class I. |
SEE NOTES TO FINANCIAL STATEMENTS.
| | | | | | |
| | | |
| 92 | | | | J.P. MORGAN MUNICIPAL BOND FUNDS | | FEBRUARY 28, 2018 |
| | | | | | | | |
| | | Tax Free
Bond Fund | | |
Ultra-Short
Municipal
Fund | |
INVESTMENT INCOME: | | | | | | | | |
Interest income from non-affiliates | | $ | 12,591 | | | $ | 12,342 | |
Interest income from affiliates | | | 1 | | | | — | (a) |
Dividend income from affiliates | | | 82 | | | | 659 | |
| | | | | | | | |
Total investment income | | | 12,674 | | | | 13,001 | |
| | | | | | | | |
| | |
EXPENSES: | | | | | | | | |
Investment advisory fees | | | 967 | | | | 1,712 | |
Administration fees | | | 263 | | | | 928 | |
Distribution fees: | | | | | | | | |
Class A | | | 350 | | | | 4 | |
Class C | | | 218 | | | | — | |
Service fees: | | | | | | | | |
Class A | | | 350 | | | | 4 | |
Class C | | | 73 | | | | — | |
Class I (formerly Select Class) | | | 383 | | | | 2,850 | |
Custodian and accounting fees | | | 81 | | | | 162 | |
Professional fees | | | 96 | | | | 81 | |
Trustees’ and Chief Compliance Officer’s fees | | | 26 | | | | 29 | |
Printing and mailing costs | | | 31 | | | | 28 | |
Registration and filing fees | | | 41 | | | | 541 | |
Transfer agency fees (See Note 2.F.) | | | 19 | | | | 9 | |
Sub-transfer agency fees (See Note 2.F.) | | | 5 | | | | — | (a) |
Offering costs | | | — | | | | 21 | |
Other | | | 10 | | | | 21 | |
| | | | | | | | |
Total expenses | | | 2,913 | | | | 6,390 | |
| | | | | | | | |
Less fees waived | | | (943 | ) | | | (3,456 | ) |
Less expense reimbursements | | | — | | | | (191 | ) |
| | | | | | | | |
Net expenses | | | 1,970 | | | | 2,743 | |
| | | | | | | | |
Net investment income (loss) | | | 10,704 | | | | 10,258 | |
| | | | | | | | |
| | |
REALIZED/UNREALIZED GAINS (LOSSES): | | | | | | | | |
Net realized gain (loss) on transactions from: | | | | | | | | |
Investments in non-affiliates | | | (252 | ) | | | (57 | ) |
Futures contracts | | | 157 | | | | — | |
| | | | | | | | |
Net realized gain (loss) | | | (95 | ) | | | (57 | ) |
| | | | | | | | |
Change in net unrealized appreciation/depreciation on: | | | | | | | | |
Investments in non-affiliates | | | (3,105 | ) | | | (3,044 | ) |
Futures contracts | | | 4 | | | | — | |
| | | | | | | | |
Change in net unrealized appreciation/depreciation | | | (3,101 | ) | | | (3,044 | ) |
| | | | | | | | |
Net realized/unrealized gains (losses) | | | (3,196 | ) | | | (3,101 | ) |
| | | | | | | | |
Change in net assets resulting from operations | | $ | 7,508 | | | $ | 7,157 | |
| | | | | | | | |
| (a) | Amount rounds to less than 500. |
SEE NOTES TO FINANCIAL STATEMENTS.
| | | | | | | | |
| | | |
| FEBRUARY 28, 2018 | | J.P. MORGAN MUNICIPAL BOND FUNDS | | | | | 93 | |
STATEMENTS OF CHANGES IN NET ASSETS
FOR THE PERIODS INDICATED
(Amounts in thousands)
| | | | | | | | | | | | | | | | |
| | |
Municipal Income Fund | | | Short-Intermediate Municipal Bond Fund | |
| | | Year Ended
February 28, 2018 | | | Year Ended
February 28, 2017 | | | Year Ended
February 28, 2018 | | | Year Ended
February 28, 2017 | |
CHANGE IN NET ASSETS RESULTING FROM OPERATIONS: | | | | | | | | | | | | | | | | |
Net investment income (loss) | | $ | 6,387 | | | $ | 7,668 | | | $ | 35,300 | | | $ | 32,008 | |
Net realized gain (loss) | | | 2,097 | | | | 4,031 | | | | (2,785 | ) | | | 1,510 | |
Change in net unrealized appreciation/depreciation | | | (4,584 | ) | | | (12,606 | ) | | | (12,921 | ) | | | (41,497 | ) |
| | | | | | | | | | | | | | | | |
Change in net assets resulting from operations | | | 3,900 | | | | (907 | ) | | | 19,594 | | | | (7,979 | ) |
| | | | | | | | | | | | | | | | |
| | | | |
DISTRIBUTIONS TO SHAREHOLDERS: | | | | | | | | | | | | | | | | |
Class A | | | | | | | | | | | | | | | | |
From net investment income | | | (1,664 | ) | | | (1,923 | ) | | | (348 | ) | | | (351 | ) |
From net realized gains | | | (471 | ) | | | (925 | ) | | | — | | | | (190 | ) |
Class C | | | | | | | | | | | | | | | | |
From net investment income | | | (293 | ) | | | (339 | ) | | | (56 | ) | | | (69 | ) |
From net realized gains | | | (111 | ) | | | (217 | ) | | | — | | | | (81 | ) |
Class I* | | | | | | | | | | | | | | | | |
From net investment income | | | (3,943 | ) | | | (5,493 | ) | | | (34,696 | ) | | | (30,151 | ) |
From net realized gains | | | (566 | ) | | | (2,361 | ) | | | — | | | | (10,500 | ) |
Class R6 (a) | | | | | | | | | | | | | | | | |
From net investment income | | | (494 | ) | | | — | | | | — | | | | — | |
From net realized gains | | | (593 | ) | | | — | | | | — | | | | — | |
Select Class (b) | | | | | | | | | | | | | | | | |
From net investment income | | | — | | | | — | | | | (171 | ) | | | (1,914 | ) |
From net realized gains | | | — | | | | — | | | | — | | | | (790 | ) |
| | | | | | | | | | | | | | | | |
Total distributions to shareholders | | | (8,135 | ) | | | (11,258 | ) | | | (35,271 | ) | | | (44,046 | ) |
| | | | | | | | | | | | | | | | |
| | | | |
CAPITAL TRANSACTIONS: | | | | | | | | | | | | | | | | |
Change in net assets resulting from capital transactions | | | (49,281 | ) | | | (51,958 | ) | | | (340,775 | ) | | | (532,349 | ) |
| | | | | | | | | | | | | | | | |
| | | | |
NET ASSETS: | | | | | | | | | | | | | | | | |
Change in net assets | | | (53,516 | ) | | | (64,123 | ) | | | (356,452 | ) | | | (584,374 | ) |
Beginning of period | | | 270,811 | | | | 334,934 | | | | 2,076,038 | | | | 2,660,412 | |
| | | | | | | | | | | | | | | | |
End of period | | $ | 217,295 | | | $ | 270,811 | | | $ | 1,719,586 | | | $ | 2,076,038 | |
| | | | | | | | | | | | | | | | |
Accumulated undistributed (distributions in excess of) net investment income | | $ | (26 | ) | | $ | (19 | ) | | $ | 12 | | | $ | (17 | ) |
| | | | | | | | | | | | | | | | |
| (a) | Commencement of offering of class of shares effective November 6, 2017 for Municipal Income Fund. |
| (b) | Select Class Shares of Short-Intermediate Municipal Bond Fund had no assets from the close of business on April 3, 2017. |
| * | Effective April 3, 2017, the Institutional Class of Short-Intermediate Municipal Bond Fund and the Select Class of Municipal Income Fund were renamed Class I. |
SEE NOTES TO FINANCIAL STATEMENTS.
| | | | | | |
| | | |
| 94 | | | | J.P. MORGAN MUNICIPAL BOND FUNDS | | FEBRUARY 28, 2018 |
| | | | | | | | | | | | | | | | |
| | |
Tax Free Bond Fund | | | Ultra-Short Municipal Fund | |
| | | Year Ended
February 28, 2018 | | | Year Ended
February 28, 2017 | | | Year Ended
February 28, 2018 | | | Period Ended
February 28, 2017 (a) | |
CHANGE IN NET ASSETS RESULTING FROM OPERATIONS: | | | | | | | | | | | | | | | | |
Net investment income (loss) | | $ | 10,704 | | | $ | 10,671 | | | $ | 10,258 | | | $ | 82 | |
Net realized gain (loss) | | | (95 | ) | | | 3,032 | | | | (57 | ) | | | — | (b) |
Change in net unrealized appreciation/depreciation | | | (3,101 | ) | | | (15,356 | ) | | | (3,044 | ) | | | 40 | |
| | | | | | | | | | | | | | | | |
Change in net assets resulting from operations | | | 7,508 | | | | (1,653 | ) | | | 7,157 | | | | 122 | |
| | | | | | | | | | | | | | | | |
| | | | |
DISTRIBUTIONS TO SHAREHOLDERS: | | | | | | | | | | | | | | | | |
Class A | | | | | | | | | | | | | | | | |
From net investment income | | | (4,552 | ) | | | (5,043 | ) | | | (8 | ) | | | (1 | ) |
From net realized gains | | | — | | | | (3,145 | ) | | | — | | | | — | |
Class C | | | | | | | | | | | | | | | | |
From net investment income | | | (779 | ) | | | (838 | ) | | | — | | | | — | |
From net realized gains | | | — | | | | (678 | ) | | | — | | | | — | |
Class I (formerly Select Class) | | | | | | | | | | | | | | | | |
From net investment income | | | (5,375 | ) | | | (4,773 | ) | | | (10,137 | ) | | | (79 | ) |
From net realized gains | | | — | | | | (2,991 | ) | | | — | | | | — | |
| | | | | | | | | | | | | | | | |
Total distributions to shareholders | | | (10,706 | ) | | | (17,468 | ) | | | (10,145 | ) | | | (80 | ) |
| | | | | | | | | | | | | | | | |
| | | | |
CAPITAL TRANSACTIONS: | | | | | | | | | | | | | | | | |
Change in net assets resulting from capital transactions | | | (3,172 | ) | | | 36,503 | | | | 2,035,882 | | | | 22,133 | |
| | | | | | | | | | | | | | | | |
| | | | |
NET ASSETS: | | | | | | | | | | | | | | | | |
Change in net assets | | | (6,370 | ) | | | 17,382 | | | | 2,032,894 | | | | 22,175 | |
Beginning of period | | | 322,395 | | | | 305,013 | | | | 32,175 | | | | 10,000 | |
| | | | | | | | | | | | | | | | |
End of period | | $ | 316,025 | | | $ | 322,395 | | | $ | 2,065,069 | | | $ | 32,175 | |
| | | | | | | | | | | | | | | | |
Accumulated undistributed (distributions in excess of) net investment income | | $ | (11 | ) | | $ | (9 | ) | | $ | 115 | | | $ | 2 | |
| | | | | | | | | | | | | | | | |
| (a) | Commencement of operations was May 31, 2016. |
| (b) | Amount rounds to less than 500. |
SEE NOTES TO FINANCIAL STATEMENTS.
| | | | | | | | |
| | | |
| FEBRUARY 28, 2018 | | J.P. MORGAN MUNICIPAL BOND FUNDS | | | | | 95 | |
STATEMENTS OF CHANGES IN NET ASSETS
FOR THE PERIODS INDICATED (continued)
(Amounts in thousands)
| | | | | | | | | | | | | | | | |
| | |
Municipal Income Fund | | | Short-Intermediate Municipal Bond Fund | |
| | | Year Ended
February 28, 2018 | | | Year Ended
February 28, 2017 | | | Year Ended
February 28, 2018 | | | Year Ended
February 28, 2017 | |
CAPITAL TRANSACTIONS: | | | | | | | | | | | | | | | | |
Class A | | | | | | | | | | | | | | | | |
Proceeds from shares issued | | $ | 22,238 | | | $ | 23,344 | | | $ | 10,656 | | | $ | 11,600 | |
Distributions reinvested | | | 2,094 | | | | 2,795 | | | | 344 | | | | 530 | |
Cost of shares redeemed | | | (33,567 | ) | | | (19,384 | ) | | | (8,869 | ) | | | (19,048 | ) |
| | | | | | | | | | | | | | | | |
Change in net assets resulting from Class A capital transactions | | $ | (9,235 | ) | | $ | 6,755 | | | $ | 2,131 | | | $ | (6,918 | ) |
| | | | | | | | | | | | | | | | |
Class C | | | | | | | | | | | | | | | | |
Proceeds from shares issued | | $ | 5,107 | | | $ | 6,745 | | | $ | 861 | | | $ | 2,753 | |
Distributions reinvested | | | 362 | | | | 497 | | | | 49 | | | | 134 | |
Cost of shares redeemed | | | (7,178 | ) | | | (5,290 | ) | | | (8,514 | ) | | | (6,226 | ) |
| | | | | | | | | | | | | | | | |
Change in net assets resulting from Class C capital transactions | | $ | (1,709 | ) | | $ | 1,952 | | | $ | (7,604 | ) | | $ | (3,339 | ) |
| | | | | | | | | | | | | | | | |
Class I* | | | | | | | | | | | | | | | | |
Proceeds from shares issued | | $ | 42,887 | | | $ | 48,297 | | | $ | 1,080,724 | | | $ | 647,799 | |
Distributions reinvested | | | 1,807 | | | | 1,190 | | | | 16,842 | | | | 10,099 | |
Cost of shares redeemed | | | (149,658 | ) | | | (110,152 | ) | | | (1,429,300 | ) | | | (1,176,872 | ) |
Conversion from Select Class Shares | | | — | | | | — | | | | 140,758 | | | | — | |
| | | | | | | | | | | | | | | | |
Change in net assets resulting from Class I capital transactions | | $ | (104,964 | ) | | $ | (60,665 | ) | | $ | (190,976 | ) | | $ | (518,974 | ) |
| | | | | | | | | | | | | | | | |
Class R6 (a) | | | | | | | | | | | | | | | | |
Proceeds from shares issued | | $ | 90,639 | | | $ | — | | | $ | — | | | $ | — | |
Distributions reinvested | | | 1,086 | | | | — | | | | — | | | | — | |
Cost of shares redeemed | | | (25,098 | ) | | | — | | | | — | | | | — | |
| | | | | | | | | | | | | | | | |
Change in net assets resulting from Class R6 capital transactions | | $ | 66,627 | | | $ | — | | | $ | — | | | $ | — | |
| | | | | | | | | | | | | | | | |
Select Class (b) | | | | | | | | | | | | | | | | |
Proceeds from shares issued | | $ | — | | | $ | — | | | $ | 1,645 | | | $ | 39,141 | |
Distributions reinvested | | | — | | | | — | | | | 28 | | | | 415 | |
Cost of shares redeemed | | | — | | | | — | | | | (5,241 | ) | | | (42,674 | ) |
Conversion to Class I Shares | | | — | | �� | | — | | | | (140,758 | ) | | | — | |
| | | | | | | | | | | | | | | | |
Change in net assets resulting from Select Class capital transactions | | $ | — | | | $ | — | | | $ | (144,326 | ) | | $ | (3,118 | ) |
| | | | | | | | | | | | | | | | |
Total change in net assets resulting from capital transactions | | $ | (49,281 | ) | | $ | (51,958 | ) | | $ | (340,775 | ) | | $ | (532,349 | ) |
| | | | | | | | | | | | | | | | |
| (a) | Commencement of offering of class of shares effective November 6, 2017 for Municipal Income Fund. |
| (b) | Select Class Shares of Short-Intermediate Municipal Bond Fund had no assets from the close of business on April 3, 2017. |
| * | Effective April 3, 2017, the Institutional Class of Short-Intermediate Municipal Bond Fund and the Select Class of Municipal Income Fund were renamed Class I. |
SEE NOTES TO FINANCIAL STATEMENTS.
| | | | | | |
| | | |
| 96 | | | | J.P. MORGAN MUNICIPAL BOND FUNDS | | FEBRUARY 28, 2018 |
| | | | | | | | | | | | | | | | |
| | |
Municipal Income Fund | | | Short-Intermediate Municipal Bond Fund | |
| | | Year Ended
February 28, 2018 | | | Year Ended
February 28, 2017 | | | Year Ended
February 28, 2018 | | | Year Ended
February 28, 2017 | |
SHARE TRANSACTIONS: | | | | | | | | | | | | | | | | |
Class A | | | | | | | | | | | | | | | | |
Issued | | | 2,271 | | | | 2,330 | | | | 1,013 | | | | 1,086 | |
Reinvested | | | 215 | | | | 284 | | | | 33 | | | | 50 | |
Redeemed | | | (3,430 | ) | | | (1,950 | ) | | | (844 | ) | | | (1,802 | ) |
| | | | | | | | | | | | | | | | |
Change in Class A Shares | | | (944 | ) | | | 664 | | | | 202 | | | | (666 | ) |
| | | | | | | | | | | | | | | | |
Class C | | | | | | | | | | | | | | | | |
Issued | | | 526 | | | | 678 | | | | 81 | | | | 256 | |
Reinvested | | | 38 | | | | 51 | | | | 4 | | | | 13 | |
Redeemed | | | (742 | ) | | | (539 | ) | | | (801 | ) | | | (583 | ) |
| | | | | | | | | | | | | | | | |
Change in Class C Shares | | | (178 | ) | | | 190 | | | | (716 | ) | | | (314 | ) |
| | | | | | | | | | | | | | | | |
Class I* | | | | | | | | | | | | | | | | |
Issued | | | 4,427 | | | | 4,864 | | | | 102,244 | | | | 60,721 | |
Reinvested | | | 188 | | | | 121 | | | | 1,599 | | | | 952 | |
Redeemed | | | (15,458 | ) | | | (11,124 | ) | | | (135,480 | ) | | | (110,395 | ) |
Conversion from Select Class Shares | | | — | | | | — | | | | 13,367 | | | | — | |
| | | | | | | | | | | | | | | | |
Change in Class I Shares | | | (10,843 | ) | | | (6,139 | ) | | | (18,270 | ) | | | (48,722 | ) |
| | | | | | | | | | | | | | | | |
Class R6 (a) | | | | | | | | | | | | | | | | |
Issued | | | 9,369 | | | | — | | | | — | | | | — | |
Reinvested | | | 113 | | | | — | | | | — | | | | — | |
Redeemed | | | (2,630 | ) | | | — | | | | — | | | | — | |
| | | | | | | | | | | | | | | | |
Change in Class R6 Shares | | | 6,852 | | | | — | | | | — | | | | — | |
| | | | | | | | | | | | | | | | |
Select Class (b) | | | | | | | | | | | | | | | | |
Issued | | | — | | | | — | | | | 152 | | | | 3,664 | |
Reinvested | | | — | | | | — | | | | 3 | | | | 39 | |
Redeemed | | | — | | | | — | | | | (500 | ) | | | (4,018 | ) |
Conversion to Class I Shares | | | — | | | | — | | | | (13,393 | ) | | | — | |
| | | | | | | | | | | | | | | | |
Change in Select Class Shares | | | — | | | | — | | | | (13,738 | ) | | | (315 | ) |
| | | | | | | | | | | | | | | | |
| (a) | Commencement of offering of class of shares effective November 6, 2017 for Municipal Income Fund. |
| (b) | Select Class Shares of Short-Intermediate Municipal Bond Fund had no assets from the close of business on April 3, 2017. |
| * | Effective April 3, 2017, the Institutional Class of Short-Intermediate Municipal Bond Fund and the Select Class of Municipal Income Fund were renamed Class I. |
SEE NOTES TO FINANCIAL STATEMENTS.
| | | | | | | | |
| | | |
| FEBRUARY 28, 2018 | | J.P. MORGAN MUNICIPAL BOND FUNDS | | | | | 97 | |
STATEMENTS OF CHANGES IN NET ASSETS
FOR THE PERIODS INDICATED (continued)
(Amounts in thousands)
| | | | | | | | | | | | | | | | |
| | |
Tax Free Bond Fund | | | Ultra-Short Municipal Fund | |
| | | Year Ended
February 28, 2018 | | | Year Ended
February 28, 2017 | | | Year Ended
February 28, 2018 | | | Period Ended
February 28, 2017 (a) | |
CAPITAL TRANSACTIONS: | | | | | | | | | | | | | | | | |
Class A | | | | | | | | | | | | | | | | |
Proceeds from shares issued | | $ | 31,215 | | | $ | 45,224 | | | $ | 2,427 | | | $ | 599 | |
Distributions reinvested | | | 4,375 | | | | 7,911 | | | | 8 | | | | — | (b) |
Cost of shares redeemed | | | (52,729 | ) | | | (47,813 | ) | | | (2,179 | ) | | | (100 | ) |
| | | | | | | | | | | | | | | | |
Change in net assets resulting from Class A capital transactions | | $ | (17,139 | ) | | $ | 5,322 | | | $ | 256 | | | $ | 499 | |
| | | | | | | | | | | | | | | | |
Class C | | | | | | | | | | | | | | | | |
Proceeds from shares issued | | $ | 3,952 | | | $ | 16,584 | | | $ | — | | | $ | — | |
Distributions reinvested | | | 770 | | | | 1,490 | | | | — | | | | — | |
Cost of shares redeemed | | | (11,395 | ) | | | (10,720 | ) | | | — | | | | — | |
| | | | | | | | | | | | | | | | |
Change in net assets resulting from Class C capital transactions | | $ | (6,673 | ) | | $ | 7,354 | | | $ | — | | | $ | — | |
| | | | | | | | | | | | | | | | |
Class I (formerly Select Class) | | | | | | | | | | | | | | | | |
Proceeds from shares issued | | $ | 59,833 | | | $ | 72,909 | | | $ | 3,119,503 | | | $ | 21,948 | |
Distributions reinvested | | | 3,871 | | | | 4,095 | | | | 5,769 | | | | 46 | |
Cost of shares redeemed | | | (43,064 | ) | | | (53,177 | ) | | | (1,089,646 | ) | | | (360 | ) |
| | | | | | | | | | | | | | | | |
Change in net assets resulting from Class I capital transactions | | $ | 20,640 | | | $ | 23,827 | | | $ | 2,035,626 | | | $ | 21,634 | |
| | | | | | | | | | | | | | | | |
Total change in net assets resulting from capital transactions | | $ | (3,172 | ) | | $ | 36,503 | | | $ | 2,035,882 | | | $ | 22,133 | |
| | | | | | | | | | | | | | | | |
| (a) | Commencement of operations was May 31, 2016. |
| (b) | Amount rounds to less than 500. |
SEE NOTES TO FINANCIAL STATEMENTS.
| | | | | | |
| | | |
| 98 | | | | J.P. MORGAN MUNICIPAL BOND FUNDS | | FEBRUARY 28, 2018 |
| | | | | | | | | | | | | | | | |
| | |
Tax Free Bond Fund | | | Ultra-Short Municipal Fund | |
| | | Year Ended
February 28, 2018 | | | Year Ended
February 28, 2017 | | | Year Ended
February 28, 2018 | | | Period Ended
February 28, 2017 (a) | |
SHARE TRANSACTIONS: | | | | | | | | | | | | | | | | |
Class A | | | | | | | | | | | | | | | | |
Issued | | | 2,587 | | | | 3,575 | | | | 242 | | | | 60 | |
Reinvested | | | 365 | | | | 647 | | | | 1 | | | | — | (b) |
Redeemed | | | (4,402 | ) | | | (3,839 | ) | | | (218 | ) | | | (10 | ) |
| | | | | | | | | | | | | | | | |
Change in Class A Shares | | | (1,450 | ) | | | 383 | | | | 25 | | | | 50 | |
| | | | | | | | | | | | | | | | |
Class C | | | | | | | | | | | | | | | | |
Issued | | | 331 | | | | 1,317 | | | | — | | | | — | |
Reinvested | | | 65 | | | | 124 | | | | — | | | | — | |
Redeemed | | | (957 | ) | | | (873 | ) | | | — | | | | — | |
| | | | | | | | | | | | | | | | |
Change in Class C Shares | | | (561 | ) | | | 568 | | | | — | | | | — | |
| | | | | | | | | | | | | | | | |
Class I (formerly Select Class) | | | | | | | | | | | | | | | | |
Issued | | | 5,004 | | | | 5,838 | | | | 311,420 | | | | 2,193 | |
Reinvested | | | 324 | | | | 337 | | | | 577 | | | | 5 | |
Redeemed | | | (3,597 | ) | | | (4,344 | ) | | | (108,793 | ) | | | (36 | ) |
| | | | | | | | | | | | | | | | |
Change in Class I Shares | | | 1,731 | | | | 1,831 | | | | 203,204 | | | | 2,162 | |
| | | | | | | | | | | | | | | | |
| (a) | Commencement of operations was May 31, 2016. |
| (b) | Amount rounds to less than 500. |
SEE NOTES TO FINANCIAL STATEMENTS.
| | | | | | | | |
| | | |
| FEBRUARY 28, 2018 | | J.P. MORGAN MUNICIPAL BOND FUNDS | | | | | 99 | |
FINANCIAL HIGHLIGHTS
FOR THE PERIODS INDICATED
| | | | | | | | | | | | | | | | | | | | | | | | | | | | |
| | | Per share operating performance | |
| | | | | | Investment operations | | | Distributions | |
| | | Net asset
value,
beginning
of period | | | Net
investment
income
(loss) (b) | | |
Net realized
and unrealized
gains
(losses) on
investments | | | Total from
investment
operations | | | Net
investment
income | | | Net
realized
gain | | | Total
distributions | |
Municipal Income Fund | | | | | | | | | | | | | | | | | | | | | | | | | | | | |
Class A | | | | | | | | | | | | | | | | | | | | | | | | | | | | |
Year Ended February 28, 2018 | | $ | 9.70 | | | $ | 0.23 | (f) | | $ | (0.11 | ) | | $ | 0.12 | | | $ | (0.23 | ) | | $ | (0.07 | ) | | $ | (0.30 | ) |
Year Ended February 28, 2017 | | | 10.10 | | | | 0.24 | | | | (0.28 | ) | | | (0.04 | ) | | | (0.24 | ) | | | (0.12 | ) | | | (0.36 | ) |
Year Ended February 29, 2016 | | | 10.11 | | | | 0.25 | | | | 0.08 | | | | 0.33 | | | | (0.26 | ) | | | (0.08 | ) | | | (0.34 | ) |
Year Ended February 28, 2015 | | | 9.98 | | | | 0.27 | | | | 0.18 | | | | 0.45 | | | | (0.27 | ) | | | (0.05 | ) | | | (0.32 | ) |
Year Ended February 28, 2014 | | | 10.41 | | | | 0.28 | | | | (0.28 | ) | | | — | (g) | | | (0.29 | ) | | | (0.14 | ) | | | (0.43 | ) |
| | | | | | | |
Class C | | | | | | | | | | | | | | | | | | | | | | | | | | | | |
Year Ended February 28, 2018 | | | 9.61 | | | | 0.17 | (f) | | | (0.12 | ) | | | 0.05 | | | | (0.17 | ) | | | (0.07 | ) | | | (0.24 | ) |
Year Ended February 28, 2017 | | | 10.00 | | | | 0.18 | | | | (0.26 | ) | | | (0.08 | ) | | | (0.19 | ) | | | (0.12 | ) | | | (0.31 | ) |
Year Ended February 29, 2016 | | | 10.02 | | | | 0.19 | | | | 0.07 | | | | 0.26 | | | | (0.20 | ) | | | (0.08 | ) | | | (0.28 | ) |
Year Ended February 28, 2015 | | | 9.90 | | | | 0.21 | | | | 0.17 | | | | 0.38 | | | | (0.21 | ) | | | (0.05 | ) | | | (0.26 | ) |
Year Ended February 28, 2014 | | | 10.33 | | | | 0.22 | | | | (0.28 | ) | | | (0.06 | ) | | | (0.23 | ) | | | (0.14 | ) | | | (0.37 | ) |
| | | | | | | |
Class I (formerly Select Class) | | | | | | | | | | | | | | | | | | | | | | | | | | | | |
Year Ended February 28, 2018 | | | 9.63 | | | | 0.25 | (f) | | | (0.11 | ) | | | 0.14 | | | | (0.25 | ) | | | (0.07 | ) | | | (0.32 | ) |
Year Ended February 28, 2017 | | | 10.03 | | | | 0.26 | | | | (0.27 | ) | | | (0.01 | ) | | | (0.27 | ) | | | (0.12 | ) | | | (0.39 | ) |
Year Ended February 29, 2016 | | | 10.04 | | | | 0.28 | | | | 0.07 | | | | 0.35 | | | | (0.28 | ) | | | (0.08 | ) | | | (0.36 | ) |
Year Ended February 28, 2015 | | | 9.92 | | | | 0.29 | | | | 0.17 | | | | 0.46 | | | | (0.29 | ) | | | (0.05 | ) | | | (0.34 | ) |
Year Ended February 28, 2014 | | | 10.35 | | | | 0.30 | | | | (0.27 | ) | | | 0.03 | | | | (0.32 | ) | | | (0.14 | ) | | | (0.46 | ) |
| | | | | | | |
Class R6 | | | | | | | | | | | | | | | | | | | | | | | | | | | | |
November 6, 2017 (h) through February 28, 2018 | | | 9.74 | | | | 0.08 | (f) | | | (0.21 | ) | | | (0.13 | ) | | | (0.09 | ) | | | (0.07 | ) | | | (0.16 | ) |
| (a) | Annualized for periods less than one year, unless otherwise noted. |
| (b) | Calculated based upon average shares outstanding. |
| (c) | Not annualized for periods less than one year. |
| (d) | Includes adjustments in accordance with accounting principles generally accepted in the United States of America and as such, the net asset values for financial reporting purposes and the returns based upon those net asset values may differ from the net asset values and returns for shareholder transactions. |
| (e) | Includes earnings credits and interest expense, if applicable, each of which is less than 0.005% unless otherwise noted. |
| (f) | Net investment income (loss) may appear disproportionate among classes due to the timing of the Class R6 Shares commencement of operations on November 6, 2017. |
| (g) | Amount rounds to less than $0.005. |
| (h) | Commencement of offering of class of shares. |
SEE NOTES TO FINANCIAL STATEMENTS.
| | | | | | |
| | | |
| 100 | | | | J.P. MORGAN MUNICIPAL BOND FUNDS | | FEBRUARY 28, 2018 |
| | | | | | | | | | | | | | | | | | | | | | | | | | |
| | | Ratios/Supplemental data | |
| | | | | | | | | | Ratios to average net assets (a) | | | | |
Net asset
value,
end of
period | | | Total return
(excludes
sales charge) (c)(d) | | | Net assets,
end of
period
(000’s) | | | Net expenses
(including
imputed interest) (e) | | | Net
investment
income
(loss) | | | Expenses
without waivers,
reimbursements and
earnings credits
(including imputed
interest) | | | Portfolio
turnover
rate (c) | |
| | | | | | | | | | | | | | | | | | | | | | | | | | |
| | | | | | | | | | | | | | | | | | | | | | | | | | |
| $ | 9.52 | | | | 1.16 | % | | $ | 66,258 | | | | 0.69 | % | | | 2.33 | %(f) | | | 1.01 | % | | | 21 | % |
| | 9.70 | | | | (0.40 | ) | | | 76,684 | | | | 0.77 | | | | 2.39 | | | | 1.00 | | | | 15 | |
| | 10.10 | | | | 3.26 | | | | 73,120 | | | | 0.82 | | | | 2.52 | | | | 0.97 | | | | 22 | |
| | 10.11 | | | | 4.47 | | | | 68,003 | | | | 0.86 | | | | 2.65 | | | | 0.97 | | | | 9 | |
| | 9.98 | | | | 0.13 | | | | 64,327 | | | | 0.87 | | | | 2.78 | | | | 0.94 | | | | 3 | |
| | | | | | |
| | | | | | | | | | | | | | | | | | | | | | | | | | |
| | 9.42 | | | | 0.51 | | | | 15,138 | | | | 1.24 | | | | 1.78 | (f) | | | 1.51 | | | | 21 | |
| | 9.61 | | | | (0.87 | ) | | | 17,137 | | | | 1.34 | | | | 1.83 | | | | 1.50 | | | | 15 | |
| | 10.00 | | | | 2.61 | | | | 15,950 | | | | 1.39 | | | | 1.95 | | | | 1.48 | | | | 22 | |
| | 10.02 | | | | 3.81 | | | | 14,462 | | | | 1.44 | | | | 2.07 | | | | 1.47 | | | | 9 | |
| | 9.90 | | | | (0.45 | ) | | | 15,425 | | | | 1.44 | | | | 2.20 | | | | 1.44 | | | | 3 | |
| | | | | | |
| | | | | | | | | | | | | | | | | | | | | | | | | | |
| | 9.45 | | | | 1.42 | | | | 71,161 | | | | 0.44 | | | | 2.57 | (f) | | | 0.74 | | | | 21 | |
| | 9.63 | | | | (0.16 | ) | | | 176,990 | | | | 0.53 | | | | 2.64 | | | | 0.72 | | | | 15 | |
| | 10.03 | | | | 3.56 | | | | 245,864 | | | | 0.57 | | | | 2.77 | | | | 0.70 | | | | 22 | |
| | 10.04 | | | | 4.66 | | | | 255,153 | | | | 0.61 | | | | 2.91 | | | | 0.71 | | | | 9 | |
| | 9.92 | | | | 0.38 | | | | 279,537 | | | | 0.62 | | | | 3.02 | | | | 0.69 | | | | 3 | |
| | | | | | |
| | | | | | | | | | | | | | | | | | | | | | | | | | |
| | 9.45 | | | | (1.42 | ) | | | 64,738 | | | | 0.34 | | | | 2.67 | (f) | | | 0.57 | | | | 21 | |
SEE NOTES TO FINANCIAL STATEMENTS.
| | | | | | | | |
| | | |
| FEBRUARY 28, 2018 | | J.P. MORGAN MUNICIPAL BOND FUNDS | | | | | 101 | |
FINANCIAL HIGHLIGHTS
FOR THE PERIODS INDICATED (continued)
| | | | | | | | | | | | | | | | | | | | | | | | | | | | |
| | | Per share operating performance | |
| | | | | | Investment operations | | | Distributions | |
| | | Net asset
value,
beginning
of period | | | Net
investment
income
(loss) (a) | | | Net realized
and unrealized
gains
(losses) on
investments | | | Total from
investment
operations | | | Net
investment
income | | | Net
realized
gain | | | Total
distributions | |
Short-Intermediate Municipal Bond Fund | | | | | | | | | | | | | | | | | | | | | | | | | | | | |
Class A | | | | | | | | | | | | | | | | | | | | | | | | | | | | |
Year Ended February 28, 2018 | | $ | 10.48 | | | $ | 0.12 | | | $ | (0.09 | ) | | $ | 0.03 | | | $ | (0.12 | ) | | $ | — | | | $ | (0.12 | ) |
Year Ended February 28, 2017 | | | 10.71 | | | | 0.10 | | | | (0.17 | ) | | | (0.07 | ) | | | (0.10 | ) | | | (0.06 | ) | | | (0.16 | ) |
Year Ended February 29, 2016 | | | 10.62 | | | | 0.08 | | | | 0.09 | | | | 0.17 | | | | (0.08 | ) | | | — | | | | (0.08 | ) |
Year Ended February 28, 2015 | | | 10.61 | | | | 0.06 | | | | 0.01 | | | | 0.07 | | | | (0.06 | ) | | | — | | | | (0.06 | ) |
Year Ended February 28, 2014 | | | 10.63 | | | | 0.07 | | | | (0.03 | ) | | | 0.04 | | | | (0.06 | ) | | | — | | | | (0.06 | ) |
| | | | | | | |
Class C | | | | | | | | | | | | | | | | | | | | | | | | | | | | |
Year Ended February 28, 2018 | | | 10.56 | | | | 0.06 | | | | (0.08 | ) | | | (0.02 | ) | | | (0.06 | ) | | | — | | | | (0.06 | ) |
Year Ended February 28, 2017 | | | 10.80 | | | | 0.04 | | | | (0.17 | ) | | | (0.13 | ) | | | (0.05 | ) | | | (0.06 | ) | | | (0.11 | ) |
Year Ended February 29, 2016 | | | 10.70 | | | | 0.02 | | | | 0.10 | | | | 0.12 | | | | (0.02 | ) | | | — | | | | (0.02 | ) |
Year Ended February 28, 2015 | | | 10.69 | | | | 0.01 | | | | — | (d) | | | 0.01 | | | | — | (d) | | | — | | | | — | (d) |
Year Ended February 28, 2014 | | | 10.71 | | | | 0.01 | | | | (0.02 | ) | | | (0.01 | ) | | | (0.01 | ) | | | — | | | | (0.01 | ) |
| | | | | | | |
Class I (formerly Institutional Class) | | | | | | | | | | | | | | | | | | | | | | | | | | | | |
Year Ended February 28, 2018 | | | 10.53 | | | | 0.16 | | | | (0.09 | ) | | | 0.07 | | | | (0.16 | ) | | | — | | | | (0.16 | ) |
Year Ended February 28, 2017 | | | 10.76 | | | | 0.15 | | | | (0.17 | ) | | | (0.02 | ) | | | (0.15 | ) | | | (0.06 | ) | | | (0.21 | ) |
Year Ended February 29, 2016 | | | 10.67 | | | | 0.13 | | | | 0.09 | | | | 0.22 | | | | (0.13 | ) | | | — | | | | (0.13 | ) |
Year Ended February 28, 2015 | | | 10.66 | | | | 0.11 | | | | 0.01 | | | | 0.12 | | | | (0.11 | ) | | | — | | | | (0.11 | ) |
Year Ended February 28, 2014 | | | 10.68 | | | | 0.12 | | | | (0.03 | ) | | | 0.09 | | | | (0.11 | ) | | | — | | | | (0.11 | ) |
| (a) | Calculated based upon average shares outstanding. |
| (b) | Includes adjustments in accordance with accounting principles generally accepted in the United States of America and as such, the net asset values for financial reporting purposes and the returns based upon those net asset values may differ from the net asset values and returns for shareholder transactions. |
| (c) | Includes earnings credits and interest expense, if applicable, each of which is less than 0.005% unless otherwise noted. |
| (d) | Amount rounds to less than $0.005. |
SEE NOTES TO FINANCIAL STATEMENTS.
| | | | | | |
| | | |
| 102 | | | | J.P. MORGAN MUNICIPAL BOND FUNDS | | FEBRUARY 28, 2018 |
| | | | | | | | | | | | | | | | | | | | | | | | | | |
| | | Ratios/Supplemental data | |
| | | | | | | | | | Ratios to average net assets | | | | |
Net asset
value,
end of
period | | | Total return
(excludes
sales charge) (b) | | | Net assets,
end of
period
(000’s) | | | Net
expenses (c) | | | Net
investment
income
(loss) | | |
Expenses
without waivers,
reimbursements and
earnings credits | | | Portfolio
turnover
rate | |
| | | | | | | | | | | | | | | | | | | | | | | | | | |
| | | | | | | | | | | | | | | | | | | | | | | | | | |
| $ | 10.39 | | | | 0.26 | % | | $ | 32,373 | | | | 0.69 | % | | | 1.10 | % | | | 0.86 | % | | | 73 | % |
| | 10.48 | | | | (0.69 | ) | | | 30,535 | | | | 0.73 | | | | 0.91 | | | | 0.88 | | | | 31 | |
| | 10.71 | | | | 1.58 | | | | 38,345 | | | | 0.75 | | | | 0.71 | | | | 0.87 | | | | 39 | |
| | 10.62 | | | | 0.64 | | | | 40,468 | | | | 0.74 | | | | 0.55 | | | | 0.87 | | | | 53 | |
| | 10.61 | | | | 0.38 | | | | 41,685 | | | | 0.74 | | | | 0.63 | | | | 0.87 | | | | 39 | |
| | | | | | |
| | | | | | | | | | | | | | | | | | | | | | | | | | |
| | 10.48 | | | | (0.19 | ) | | | 6,406 | | | | 1.19 | | | | 0.56 | | | | 1.37 | | | | 73 | |
| | 10.56 | | | | (1.27 | ) | | | 14,013 | | | | 1.23 | | | | 0.41 | | | | 1.40 | | | | 31 | |
| | 10.80 | | | | 1.14 | | | | 17,709 | | | | 1.25 | | | | 0.21 | | | | 1.40 | | | | 39 | |
| | 10.70 | | | | 0.13 | | | | 18,082 | | | | 1.24 | | | | 0.05 | | | | 1.38 | | | | 53 | |
| | 10.69 | | | | (0.10 | ) | | | 21,918 | | | | 1.24 | | | | 0.13 | | | | 1.37 | | | | 39 | |
| | | | | | |
| | | | | | | | | | | | | | | | | | | | | | | | | | |
| | 10.44 | | | | 0.70 | | | | 1,680,807 | | | | 0.24 | | | | 1.53 | | | | 0.60 | | | | 73 | |
| | 10.53 | | | | (0.20 | ) | | | 1,887,149 | | | | 0.25 | | | | 1.40 | | | | 0.48 | | | | 31 | |
| | 10.76 | | | | 2.09 | | | | 2,453,419 | | | | 0.25 | | | | 1.21 | | | | 0.47 | | | | 39 | |
| | 10.67 | | | | 1.13 | | | | 2,857,462 | | | | 0.24 | | | | 1.05 | | | | 0.47 | | | | 53 | |
| | 10.66 | | | | 0.88 | | | | 2,175,023 | | | | 0.23 | | | | 1.10 | | | | 0.49 | | | | 39 | |
SEE NOTES TO FINANCIAL STATEMENTS.
| | | | | | | | |
| | | |
| FEBRUARY 28, 2018 | | J.P. MORGAN MUNICIPAL BOND FUNDS | | | | | 103 | |
FINANCIAL HIGHLIGHTS
FOR THE PERIODS INDICATED (continued)
| | | | | | | | | | | | | | | | | | | | | | | | | | | | |
| | | Per share operating performance | |
| | | | | | Investment operations | | | Distributions | |
| | | Net asset
value,
beginning
of period | | | Net
investment
income
(loss) (a) | | | Net realized
and unrealized
gains
(losses) on
investments | | | Total from
investment
operations | | | Net
investment
income | | | Net
realized
gain | | | Total
distributions | |
Tax Free Bond Fund | | | | | | | | | | | | | | | | | | | | | | | | | | | | |
Class A | | | | | | | | | | | | | | | | | | | | | | | | | | | | |
Year Ended February 28, 2018 | | $ | 11.93 | | | $ | 0.39 | | | $ | (0.11 | ) | | $ | 0.28 | | | $ | (0.39 | ) | | $ | — | | | $ | (0.39 | ) |
Year Ended February 28, 2017 | | | 12.57 | | | | 0.40 | | | | (0.40 | ) | | | — | (d) | | | (0.39 | ) | | | (0.25 | ) | | | (0.64 | ) |
Year Ended February 29, 2016 | | | 12.70 | | | | 0.45 | | | | (0.01 | ) | | | 0.44 | | | | (0.47 | ) | | | (0.10 | ) | | | (0.57 | ) |
Year Ended February 28, 2015 | | | 12.41 | | | | 0.44 | | | | 0.39 | | | | 0.83 | | | | (0.44 | ) | | | (0.10 | ) | | | (0.54 | ) |
Year Ended February 28, 2014 | | | 12.88 | | | | 0.46 | | | | (0.44 | ) | | | 0.02 | | | | (0.48 | ) | | | (0.01 | ) | | | (0.49 | ) |
| | | | | | | |
Class C | | | | | | | | | | | | | | | | | | | | | | | | | | | | |
Year Ended February 28, 2018 | | | 11.84 | | | | 0.32 | | | | (0.12 | ) | | | 0.20 | | | | (0.32 | ) | | | — | | | | (0.32 | ) |
Year Ended February 28, 2017 | | | 12.48 | | | | 0.31 | | | | (0.39 | ) | | | (0.08 | ) | | | (0.31 | ) | | | (0.25 | ) | | | (0.56 | ) |
Year Ended February 29, 2016 | | | 12.60 | | | | 0.37 | | | | (0.01 | ) | | | 0.36 | | | | (0.38 | ) | | | (0.10 | ) | | | (0.48 | ) |
Year Ended February 28, 2015 | | | 12.33 | | | | 0.35 | | | | 0.38 | | | | 0.73 | | | | (0.36 | ) | | | (0.10 | ) | | | (0.46 | ) |
Year Ended February 28, 2014 | | | 12.80 | | | | 0.37 | | | | (0.44 | ) | | | (0.07 | ) | | | (0.39 | ) | | | (0.01 | ) | | | (0.40 | ) |
| | | | | | | |
Class I (formerly Select Class) | | | | | | | | | | | | | | | | | | | | | | | | | | | | |
Year Ended February 28, 2018 | | | 11.88 | | | | 0.42 | | | | (0.11 | ) | | | 0.31 | | | | (0.42 | ) | | | — | | | | (0.42 | ) |
Year Ended February 28, 2017 | | | 12.53 | | | | 0.42 | | | | (0.40 | ) | | | 0.02 | | | | (0.42 | ) | | | (0.25 | ) | | | (0.67 | ) |
Year Ended February 29, 2016 | | | 12.65 | | | | 0.47 | | | | — | (d) | | | 0.47 | | | | (0.49 | ) | | | (0.10 | ) | | | (0.59 | ) |
Year Ended February 28, 2015 | | | 12.37 | | | | 0.46 | | | | 0.38 | | | | 0.84 | | | | (0.46 | ) | | | (0.10 | ) | | | (0.56 | ) |
Year Ended February 28, 2014 | | | 12.84 | | | | 0.48 | | | | (0.44 | ) | | | 0.04 | | | | (0.50 | ) | | | (0.01 | ) | | | (0.51 | ) |
| (a) | Calculated based upon average shares outstanding. |
| (b) | Includes adjustments in accordance with accounting principles generally accepted in the United States of America and as such, the net asset values for financial reporting purposes and the returns based upon those net asset values may differ from the net asset values and returns for shareholder transactions. |
| (c) | Includes earnings credits and interest expense, if applicable, each of which is less than 0.005% unless otherwise noted. |
| (d) | Amount rounds to less than $0.005. |
SEE NOTES TO FINANCIAL STATEMENTS.
| | | | | | |
| | | |
| 104 | | | | J.P. MORGAN MUNICIPAL BOND FUNDS | | FEBRUARY 28, 2018 |
| | | | | | | | | | | | | | | | | | | | | | | | | | |
| | | Ratios/Supplemental data | |
| | | | | | | | | | Ratios to average net assets | | | | |
Net asset
value,
end of
period | | | Total return
(excludes
sales charge) (b) | | | Net assets,
end of
period
(000’s) | | | Net
expenses (c) | | | Net
investment
income
(loss) | | |
Expenses
without waivers,
reimbursements and
earnings credits | | | Portfolio
turnover
rate | |
| | | | | | | | | | | | | | | | | | | | | | | | | | |
| | | | | | | | | | | | | | | | | | | | | | | | | | |
| $ | 11.82 | | | | 2.36 | % | | $ | 130,462 | | | | 0.66 | % | | | 3.27 | % | | | 0.98 | % | | | 39 | % |
| | 11.93 | | | | (0.03 | ) | | | 148,987 | | | | 0.66 | | | | 3.16 | | | | 1.00 | | | | 73 | |
| | 12.57 | | | | 3.53 | | | | 152,207 | | | | 0.67 | | | | 3.62 | | | | 0.97 | | | | 94 | |
| | 12.70 | | | | 6.83 | | | | 166,359 | | | | 0.74 | | | | 3.49 | | | | 0.98 | | | | 90 | |
| | 12.41 | | | | 0.31 | | | | 129,124 | | | | 0.74 | | | | 3.72 | | | | 0.99 | | | | 62 | |
| | | | | | |
| | | | | | | | | | | | | | | | | | | | | | | | | | |
| | 11.72 | | | | 1.70 | | | | 25,172 | | | | 1.24 | | | | 2.69 | | | | 1.48 | | | | 39 | |
| | 11.84 | | | | (0.66 | ) | | | 32,052 | | | | 1.31 | | | | 2.50 | | | | 1.50 | | | | 73 | |
| | 12.48 | | | | 2.92 | | | | 26,715 | | | | 1.36 | | | | 2.93 | | | | 1.47 | | | | 94 | |
| | 12.60 | | | | 5.99 | | | | 27,579 | | | | 1.43 | | | | 2.81 | | | | 1.48 | | | | 90 | |
| | 12.33 | | | | (0.40 | ) | | | 25,057 | | | | 1.43 | | | | 3.00 | | | | 1.48 | | | | 62 | |
| | | | | | |
| | | | | | | | | | | | | | | | | | | | | | | | | | |
| | 11.77 | | | | 2.60 | | | | 160,391 | | | | 0.44 | | | | 3.49 | | | | 0.72 | | | | 39 | |
| | 11.88 | | | | 0.09 | | | | 141,356 | | | | 0.47 | | | | 3.34 | | | | 0.74 | | | | 73 | |
| | 12.53 | | | | 3.82 | | | | 126,091 | | | | 0.50 | | | | 3.79 | | | | 0.71 | | | | 94 | |
| | 12.65 | | | | 6.95 | | | | 149,102 | | | | 0.57 | | | | 3.67 | | | | 0.72 | | | | 90 | |
| | 12.37 | | | | 0.49 | | | | 129,602 | | | | 0.57 | | | | 3.89 | | | | 0.74 | | | | 62 | |
SEE NOTES TO FINANCIAL STATEMENTS.
| | | | | | | | |
| | | |
| FEBRUARY 28, 2018 | | J.P. MORGAN MUNICIPAL BOND FUNDS | | | | | 105 | |
FINANCIAL HIGHLIGHTS
FOR THE PERIODS INDICATED (continued)
| | | | | | | | | | | | | | | | | | | | |
| | | Per share operating performance | |
| | | | | | Investment operations | | | Distributions | |
| | | Net asset
value,
beginning
of period | | | Net
investment
income
(loss) (b) | | | Net realized
and unrealized
gains
(losses) on
investments | | | Total from
investment
operations | | | Net
investment
income | |
Ultra-Short Municipal Fund | | | | | | | | | | | | | | | | | | | | |
Class A | | | | | | | | | | | | | | | | | | | | |
Year Ended February 28, 2018 | | $ | 10.02 | | | $ | 0.07 | | | $ | (0.02 | ) | | $ | 0.05 | | | $ | (0.06 | ) |
May 31, 2016 (g) through February 28, 2017 | | | 10.00 | | | | 0.06 | | | | (0.01 | ) | | | 0.05 | | | | (0.03 | ) |
| | | | | |
Class I (formerly Select Class) | | | | | | | | | | | | | | | | | | | | |
Year Ended February 28, 2018 | | | 10.02 | | | | 0.09 | | | | (0.03 | ) | | | 0.06 | | | | (0.08 | ) |
May 31, 2016 (g) through February 28, 2017 | | | 10.00 | | | | 0.06 | | | | — | (h) | | | 0.06 | | | | (0.04 | ) |
| (a) | Annualized for periods less than one year, unless otherwise noted. |
| (b) | Calculated based upon average shares outstanding. |
| (c) | Not annualized for periods less than one year. |
| (d) | Includes adjustments in accordance with accounting principles generally accepted in the United States of America and as such, the net asset values for financial reporting purposes and the returns based upon those net asset values may differ from the net asset values and returns for shareholder transactions. |
| (e) | Includes earnings credits and interest expense, if applicable, each of which is less than 0.005% unless otherwise noted. |
| (f) | Certain non-recurring expenses incurred by the Fund were not annualized for the year ended February 28, 2018 and for the period ended February 28, 2017. |
| (g) | Commencement of operations. |
| (h) | Amount rounds to less than $0.005. |
SEE NOTES TO FINANCIAL STATEMENTS.
| | | | | | |
| | | |
| 106 | | | | J.P. MORGAN MUNICIPAL BOND FUNDS | | FEBRUARY 28, 2018 |
| | | | | | | | | | | | | | | | | | | | | | | | | | |
| | | Ratios/Supplemental data | |
| | | | | | | | | | Ratios to average net assets (a) | | | | |
Net asset
value,
end of
period | | | Total return
(excludes
sales charge) (c)(d) | | |
Net assets,
end of
period
(000’s) | | | Net
expenses (e)(f) | | | Net
investment
income
(loss) (f) | | | Expenses
without waivers,
reimbursements and
earnings credits (f) | | | Portfolio
turnover
rate (c) | |
| | | | | | | | | | | | | | | | | | | | | | | | | | |
| | | | | | | | | | | | | | | | | | | | | | | | | | |
| $ | 10.01 | | | | 0.47 | % | | $ | 772 | | | | 0.44 | % | | | 0.67 | % | | | 0.85 | % | | | 71 | % |
| | 10.02 | | | | 0.52 | | | | 519 | | | | 0.44 | | | | 0.81 | | | | 2.56 | | | | 80 | |
| | | | | | |
| | | | | | | | | | | | | | | | | | | | | | | | | | |
| | 10.00 | | | | 0.63 | | | | 2,064,297 | | | | 0.24 | | | | 0.90 | | | | 0.56 | | | | 71 | |
| | 10.02 | | | | 0.65 | | | | 31,656 | | | | 0.27 | | | | 0.74 | | | | 2.00 | | | | 80 | |
SEE NOTES TO FINANCIAL STATEMENTS.
| | | | | | | | |
| | | |
| FEBRUARY 28, 2018 | | J.P. MORGAN MUNICIPAL BOND FUNDS | | | | | 107 | |
NOTES TO FINANCIAL STATEMENTS
AS OF FEBRUARY 28, 2018
1. Organization
JPMorgan Trust II (“JPM II”) and JPMorgan Trust IV (“JPM IV”) (the “Trusts”) were formed on November 12, 2004 and November 12, 2015, respectively, as Delaware statutory trusts, pursuant to Declarations of Trust dated November 5, 2004 and November 12, 2015, respectively, and are registered under the Investment Company Act of 1940, as amended (the “1940 Act”), as open-end management investment companies.
The following are 4 separate funds of the Trusts (collectively, the “Funds”) covered by this report:
| | | | | | |
| | | Classes Offered | | Trust | | Diversified/Non-Diversified |
| Municipal Income Fund | | Class A, Class C, Class I* and Class R6** | | JPM II | | Diversified |
| Short-Intermediate Municipal Bond Fund | | Class A, Class C and Class I*** | | JPM II | | Diversified |
| Tax Free Bond Fund | | Class A, Class C and Class I* | | JPM II | | Diversified |
| Ultra-Short Municipal Fund**** | | Class A and Class I* | | JPM IV | | Diversified |
| * | Effective April 3, 2017, Select Class was renamed Class I. |
| ** | Class R6 Shares commenced operations on November 6, 2017 for the Municipal Income Fund. |
| *** | On April 3, 2017, Select Class Shares of the Short-Intermediate Municipal Bond Fund were converted into Institutional Class Shares of the Fund and the Institutional Class Shares were then renamed Class I Shares. Additionally, on April 3, 2017, Select Class Shares were no longer offered. |
| **** | The Ultra-Short Municipal Fund commenced investment operations on May 31, 2016. Prior to May 31, 2016, the Fund had no significant operations other than matters relating to the organization and registration of JPM IV and the issuance of 2,000 shares of Class A Shares and 998,000 shares of Class I Shares to J.P. Morgan Investment Management Inc., an indirect, wholly-owned subsidiary of JPMorgan Chase & Co. (“JPMorgan”). |
The investment objective of Municipal Income Fund is to seek current income exempt from federal income taxes.
The investment objective of Short-Intermediate Municipal Bond Fund, Tax Free Bond Fund and Ultra-Short Municipal Fund is to seek as high a level of current income exempt from federal income tax as is consistent with relative stability of principal.
Class A Shares generally provide for a front-end sales charge while Class C Shares provide for a contingent deferred sales charge (“CDSC”) (except for Class C Shares of Short-Intermediate Municipal Bond Fund purchased before September 3, 2013). Effective September 3, 2013, purchases of Class C Shares of the Short-Intermediate Municipal Bond Fund were subject to a CDSC on the original cost of shares. No sales charges are assessed with respect to Class I Shares. Certain Class A Shares, for which front-end sales charges have been waived, may be subject to a CDSC as described in the Funds’ prospectuses. Beginning on November 14, 2017, Class C Shares automatically convert to Class A Shares after ten years. All classes of shares have equal rights as to earnings, assets and voting privileges, except that each class may bear different transfer agency, sub-transfer agency (through April 2, 2017), distribution and service fees and each class has exclusive voting rights with respect to its distribution plan and shareholder servicing agreements. Effective April 3, 2017 sub-transfer agency and shareholder servicing fees were consolidated into a single service fee.
J.P. Morgan Investment Management Inc. (“JPMIM”), an indirect, wholly-owned subsidiary of JPMorgan, acts as Adviser (the “Adviser”) and Administrator (the “Administrator”) to the Funds.
2. Significant Accounting Policies
The following is a summary of significant accounting policies followed by the Funds in the preparation of their financial statements. The Funds are investment companies and, accordingly, follow the investment company accounting and reporting guidance of the Financial Accounting Standards Board Accounting Standards Codification Topic 946 — Investment Companies, which is part of U.S. generally accepted accounting principles (“GAAP”). The preparation of financial statements in conformity with GAAP requires management to make estimates and assumptions that affect the reported amounts of assets and liabilities and disclosure of contingent assets and liabilities at the date of the financial statements and the reported amounts of increases and decreases in net assets from operations during the reporting period. Actual results could differ from those estimates.
A. Valuation of Investments — The valuation of investments is in accordance with GAAP and the Funds’ valuation policies set forth by and under the supervision and responsibility of the Board of Trustees (the “Board”), which established the following approach to valuation, as described more fully below: (i) investments for which market quotations are readily available shall be valued at such unadjusted quoted prices and (ii) all other investments for which market quotations are not readily available shall be valued at their fair value as determined in good faith by the Board.
The Administrator has established the J.P. Morgan Asset Management Americas Valuation Committee (“AVC”) to assist the Board with the oversight and monitoring of the valuation of the Funds’ investments. The Administrator implements the valuation policies of the Funds’ investments, as directed by the Board. The AVC oversees and carries out the policies for the valuation of investments held in the Funds. This includes monitoring the appropriateness of fair values based on results of ongoing valuation oversight including, but not limited to, consideration of macro or security specific events, market events and pricing vendor and broker due diligence. The Administrator is responsible for discussing and assessing the potential impacts to the fair values on an ongoing basis, and at least on a quarterly basis with the AVC and the Board.
A market-based approach is primarily used to value the Funds’ investments. Investments for which market quotations are not readily available are fair valued by approved affiliated and unaffiliated pricing vendors or third party broker-dealers (collectively referred to as “Pricing Services”) or may be internally fair valued using methods set forth by the valuation policies approved by the Board. This may include related or comparable assets or
| | | | | | |
| | | |
| 108 | | | | J.P. MORGAN MUNICIPAL BOND FUNDS | | FEBRUARY 28, 2018 |
liabilities, recent transactions, market multiples, book values and other relevant information for the investment to determine the fair value of the investment. An income-based valuation approach may be used in which the anticipated future cash flows of the investment are discounted to calculate the fair value. Discounts may also be applied due to the nature or duration of any restrictions on the disposition of the investments. Valuations may be based upon current market prices of securities that are comparable in coupon, rating, maturity and industry. It is possible that the estimated values may differ significantly from the values that would have been used, had a ready market for the investments existed, and such differences could be material.
Fixed income instruments are valued based on prices received from Pricing Services. The Pricing Services use multiple valuation techniques to determine the valuation of fixed income instruments. In instances where sufficient market activity exists, the Pricing Services may utilize a market-based approach through which trades or quotes from market makers are used to determine the valuation of these instruments. In instances where sufficient market activity may not exist, the Pricing Services also utilize proprietary valuation models which may consider market transactions in comparable securities and the various relationships between securities in determining fair value and/or market characteristics in order to estimate the relevant cash flows, which are then discounted to calculate the fair values.
Futures are generally valued on the basis of available market quotations.
Investments in open-end investment companies (the “Underlying Funds”) are valued at each Underlying Fund’s net asset value per share (“NAV”) as of the report date.
Valuations reflected in this report are as of the report date. As a result, changes in valuation due to market events and/or issuer related events after the report date and prior to issuance of the report are not reflected herein.
The various inputs that are used in determining the valuation of the Funds’ investments are summarized into the three broad levels listed below.
| • | | Level 1 — Unadjusted inputs using quoted prices in active markets for identical investments. |
| • | | Level 2 — Other significant observable inputs including, but not limited to, quoted prices for similar investments, inputs other than quoted prices that are observable for investments (such as interest rates, prepayment speeds, credit risk, etc.) or other market corroborated inputs. |
| • | | Level 3 — Significant inputs based on the best information available in the circumstances, to the extent observable inputs are not available (including the Funds’ assumptions in determining the fair value of investments). |
A financial instrument’s level within the fair value hierarchy is based on the lowest level of any input, both individually and in the aggregate, that is significant to the fair value measurement. The inputs or methodology used for valuing instruments are not necessarily an indication of the risk associated with investing in those instruments.
The following tables represent each valuation input by municipal sector as presented on the Schedules of Portfolio Investments (“SOIs”) (amounts in thousands):
| | | | | | | | | | | | | | | | |
Municipal Income Fund | | | | | | | | | | | | | | | | |
| | | Level 1
Quoted prices | | | Level 2
Other significant
observable inputs | | | Level 3
Significant
unobservable inputs | | | Total | |
Investments in Securities | | | | | | | | | | | | | | | | |
Debt Securities | | | | | | | | | | | | | | | | |
Municipal Bonds | | | | | | | | | | | | | | | | |
Alabama | | | | | | | | | | | | | | | | |
Utility | | $ | — | | | $ | 2,338 | | | $ | — | | | $ | 2,338 | |
Alaska | | | | | | | | | | | | | | | | |
Housing | | | — | | | | 981 | | | | — | | | | 981 | |
Arizona | | | | | | | | | | | | | | | | |
Water & Sewer | | | — | | | | 5,512 | | | | — | | | | 5,512 | |
California | | | | | | | | | | | | | | | | |
General Obligation | | | — | | | | 953 | | | | — | | | | 953 | |
Hospital | | | — | | | | 473 | | | | — | | | | 473 | |
Other Revenue | | | — | | | | 745 | | | | — | | | | 745 | |
| | | | | | | | | | | | | | | | |
Total California | | | — | | | | 2,171 | | | | — | | | | 2,171 | |
| | | | | | | | | | | | | | | | |
Colorado | | | | | | | | | | | | | | | | |
Education | | | — | | | | 996 | | | | — | | | | 996 | |
Hospital | | | — | | | | 1,033 | | | | — | | | | 1,033 | |
Housing | | | — | | | | 55 | | | | — | | | | 55 | |
| | | | | | | | | | | | | | | | |
Total Colorado | | | — | | | | 2,084 | | | | — | | | | 2,084 | |
| | | | | | | | | | | | | | | | |
| | | | | | | | |
| | | |
| FEBRUARY 28, 2018 | | J.P. MORGAN MUNICIPAL BOND FUNDS | | | | | 109 | |
NOTES TO FINANCIAL STATEMENTS
AS OF FEBRUARY 28, 2018 (continued)
| | | | | | | | | | | | | | | | |
| | | Level 1
Quoted prices | | | Level 2
Other significant
observable inputs | | | Level 3
Significant
unobservable inputs | | | Total | |
Connecticut | | | | | | | | | | | | | | | | |
Education | | $ | — | | | $ | 3,311 | | | $ | — | | | $ | 3,311 | |
Housing | | | — | | | | 3,438 | | | | — | | | | 3,438 | |
| | | | | | | | | | | | | | | | |
Total Connecticut | | | — | | | | 6,749 | | | | — | | | | 6,749 | |
| | | | | | | | | | | | | | | | |
Delaware | | | | | | | | | | | | | | | | |
Housing | | | — | | | | 472 | | | | — | | | | 472 | |
District of Columbia | | | | | | | | | | | | | | | | |
Transportation | | | — | | | | 1,171 | | | | — | | | | 1,171 | |
Water & Sewer | | | — | | | | 3,374 | | | | — | | | | 3,374 | |
| | | | | | | | | | | | | | | | |
Total District of Columbia | | | — | | | | 4,545 | | | | — | | | | 4,545 | |
| | | | | | | | | | | | | | | | |
Florida | | | | | | | | | | | | | | | | |
Certificate of Participation/Lease | | | — | | | | 6,031 | | | | — | | | | 6,031 | |
Hospital | | | — | | | | 1,199 | | | | — | | | | 1,199 | |
Housing | | | — | | | | 1,277 | | | | — | | | | 1,277 | |
Industrial Development Revenue/Pollution Control Revenue | | | — | | | | 1,421 | | | | — | | | | 1,421 | |
Other Revenue | | | — | | | | 2,263 | | | | — | | | | 2,263 | |
Transportation | | | — | | | | 1,665 | | | | — | | | | 1,665 | |
Utility | | | — | | | | 5,824 | | | | — | | | | 5,824 | |
| | | | | | | | | | | | | | | | |
Total Florida | | | — | | | | 19,680 | | | | — | | | | 19,680 | |
| | | | | | | | | | | | | | | | |
Georgia | | | | | | | | | | | | | | | | |
Hospital | | | — | | | | 990 | | | | — | | | | 990 | |
Housing | | | — | | | | 2,129 | | | | — | | | | 2,129 | |
| | | | | | | | | | | | | | | | |
Total Georgia | | | — | | | | 3,119 | | | | — | | | | 3,119 | |
| | | | | | | | | | | | | | | | |
Guam | | | | | | | | | | | | | | | | |
Water & Sewer | | | — | | | | 748 | | | | — | | | | 748 | |
Illinois | | | | | | | | | | | | | | | | |
Hospital | | | — | | | | 406 | | | | — | | | | 406 | |
Housing | | | — | | �� | | 1,526 | | | | — | | | | 1,526 | |
| | | | | | | | | | | | | | | | |
Total Illinois | | | — | | | | 1,932 | | | | — | | | | 1,932 | |
| | | | | | | | | | | | | | | | |
Indiana | | | | | | | | | | | | | | | | |
Hospital | | | — | | | | 1,891 | | | | — | | | | 1,891 | |
Housing | | | — | | | | 439 | | | | — | | | | 439 | |
Industrial Development Revenue/Pollution Control Revenue | | | — | | | | 2,163 | | | | — | | | | 2,163 | |
Water & Sewer | | | — | | | | 1,383 | | | | — | | | | 1,383 | |
| | | | | | | | | | | | | | | | |
Total Indiana | | | — | | | | 5,876 | | | | — | | | | 5,876 | |
| | | | | | | | | | | | | | | | |
Iowa | | | | | | | | | | | | | | | | |
Education | | | — | | | | 1,112 | | | | — | | | | 1,112 | |
Housing | | | — | | | | 2,741 | | | | — | | | | 2,741 | |
| | | | | | | | | | | | | | | | |
Total Iowa | | | — | | | | 3,853 | | | | — | | | | 3,853 | |
| | | | | | | | | | | | | | | | |
Kentucky | | | | | | | | | | | | | | | | |
Education | | | — | | | | 543 | | | | — | | | | 543 | |
Industrial Development Revenue/Pollution Control Revenue | | | — | | | | 493 | | | | — | | | | 493 | |
| | | | | | | | | | | | | | | | |
Total Kentucky | | | — | | | | 1,036 | | | | — | | | | 1,036 | |
| | | | | | | | | | | | | | | | |
Louisiana | | | | | | | | | | | | | | | | |
Housing | | | — | | | | 424 | | | | — | | | | 424 | |
Other Revenue | | | — | | | | 1,235 | | | | — | | | | 1,235 | |
| | | | | | | | | | | | | | | | |
Total Louisiana | | | — | | | | 1,659 | | | | — | | | | 1,659 | |
| | | | | | | | | | | | | | | | |
| | | | | | |
| | | |
| 110 | | | | J.P. MORGAN MUNICIPAL BOND FUNDS | | FEBRUARY 28, 2018 |
| | | | | | | | | | | | | | | | |
| | | Level 1
Quoted prices | | | Level 2
Other significant
observable inputs | | | Level 3
Significant
unobservable inputs | | | Total | |
Maine | | | | | | | | | | | | | | | | |
Housing | | $ | — | | | $ | 1,438 | | | $ | — | | | $ | 1,438 | |
Maryland | | | | | | | | | | | | | | | | |
Housing | | | — | | | | 1,551 | | | | — | | | | 1,551 | |
Massachusetts | | | | | | | | | | | | | | | | |
Education | | | — | | | | 2,125 | | | | — | | | | 2,125 | |
Housing | | | — | | | | 763 | | | | — | | | | 763 | |
Water & Sewer | | | — | | | | 14,648 | | | | — | | | | 14,648 | |
| | | | | | | | | | | | | | | | |
Total Massachusetts | | | — | | | | 17,536 | | | | — | | | | 17,536 | |
| | | | | | | | | | | | | | | | |
Michigan | | | | | | | | | | | | | | | | |
Education | | | — | | | | 676 | | | | — | | | | 676 | |
Housing | | | — | | | | 1,221 | | | | — | | | | 1,221 | |
Industrial Development Revenue/Pollution Control Revenue | | | — | | | | 1,669 | | | | — | | | | 1,669 | |
| | | | | | | | | | | | | | | | |
Total Michigan | | | — | | | | 3,566 | | | | — | | | | 3,566 | |
| | | | | | | | | | | | | | | | |
Minnesota | | | | | | | | | | | | | | | | |
General Obligation | | | — | | | | 39 | | | | — | | | | 39 | |
Housing | | | — | | | | 6,630 | | | | — | | | | 6,630 | |
| | | | | | | | | | | | | | | | |
Total Minnesota | | | — | | | | 6,669 | | | | — | | | | 6,669 | |
| | | | | | | | | | | | | | | | |
Mississippi | | | | | | | | | | | | | | | | |
Housing | | | — | | | | 397 | | | | — | | | | 397 | |
Missouri | | | | | | | | | | | | | | | | |
Housing | | | — | | | | 2,015 | | | | — | | | | 2,015 | |
Nevada | | | | | | | | | | | | | | | | |
Hospital | | | — | | | | 1,333 | | | | — | | | | 1,333 | |
New Hampshire | | | | | | | | | | | | | | | | |
Education | | | — | | | | 5,294 | | | | — | | | | 5,294 | |
New Jersey | | | | | | | | | | | | | | | | |
Education | | | — | | | | 2,209 | | | | — | | | | 2,209 | |
General Obligation | | | — | | | | 1,453 | | | | — | | | | 1,453 | |
Hospital | | | — | | | | 3,289 | | | | — | | | | 3,289 | |
| | | | | | | | | | | | | | | | |
Total New Jersey | | | — | | | | 6,951 | | | | — | | | | 6,951 | |
| | | | | | | | | | | | | | | | |
New York | | | | | | | | | | | | | | | | |
Housing | | | — | | | | 3,573 | | | | — | | | | 3,573 | |
Other Revenue | | | — | | | | 1,737 | | | | — | | | | 1,737 | |
Prerefunded | | | — | | | | 5 | | | | — | | | | 5 | |
Special Tax | | | — | | | | 78 | | | | — | | | | 78 | |
Transportation | | | — | | | | 5,703 | | | | — | | | | 5,703 | |
Water & Sewer | | | — | | | | 7,066 | | | | — | | | | 7,066 | |
| | | | | | | | | | | | | | | | |
Total New York | | | — | | | | 18,162 | | | | — | | | | 18,162 | |
| | | | | | | | | | | | | | | | |
North Carolina | | | | | | | | | | | | | | | | |
Other Revenue | | | — | | | | 1,178 | | | | — | | | | 1,178 | |
Water & Sewer | | | — | | | | 3,494 | | | | — | | | | 3,494 | |
| | | | | | | | | | | | | | | | |
Total North Carolina | | | — | | | | 4,672 | | | | — | | | | 4,672 | |
| | | | | | | | | | | | | | | | |
North Dakota | | | | | | | | | | | | | | | | |
Housing | | | — | | | | 4,992 | | | | — | | | | 4,992 | |
Utility | | | — | | | | 2,080 | | | | — | | | | 2,080 | |
| | | | | | | | | | | | | | | | |
Total North Dakota | | | — | | | | 7,072 | | | | — | | | | 7,072 | |
| | | | | | | | | | | | | | | | |
| | | | | | | | |
| | | |
| FEBRUARY 28, 2018 | | J.P. MORGAN MUNICIPAL BOND FUNDS | | | | | 111 | |
NOTES TO FINANCIAL STATEMENTS
AS OF FEBRUARY 28, 2018 (continued)
| | | | | | | | | | | | | | | | |
| | | Level 1
Quoted prices | | | Level 2
Other significant
observable inputs | | | Level 3
Significant
unobservable inputs | | | Total | |
Ohio | | | | | | | | | | | | | | | | |
General Obligation | | $ | — | | | $ | 1,798 | | | $ | — | | | $ | 1,798 | |
Housing | | | — | | | | 1,433 | | | | — | | | | 1,433 | |
Industrial Development Revenue/Pollution Control Revenue | | | — | | | | 1,888 | | | | — | | | | 1,888 | |
| | | | | | | | | | | | | | | | |
Total Ohio | | | — | | | | 5,119 | | | | — | | | | 5,119 | |
| | | | | | | | | | | | | | | | |
Oklahoma | | | | | | | | | | | | | | | | |
Housing | | | — | | | | 765 | | | | — | | | | 765 | |
Other Revenue | | | — | | | | — | | | | 28 | | | | 28 | |
| | | | | | | | | | | | | | | | |
Total Oklahoma | | | — | | | | 765 | | | | 28 | | | | 793 | |
| | | | | | | | | | | | | | | | |
Oregon | | | | | | | | | | | | | | | | |
Housing | | | — | | | | 819 | | | | — | | | | 819 | |
Pennsylvania | | | | | | | | | | | | | | | | |
Housing | | | — | | | | 2,373 | | | | — | | | | 2,373 | |
Industrial Development Revenue/Pollution Control Revenue | | | — | | | | 4,810 | | | | — | | | | 4,810 | |
Other Revenue | | | — | | | | 2,070 | | | | — | | | | 2,070 | |
Transportation | | | — | | | | 651 | | | | — | | | | 651 | |
| | | | | | | | | | | | | | | | |
Total Pennsylvania | | | — | | | | 9,904 | | | | — | | | | 9,904 | |
| | | | | | | | | | | | | | | | |
Rhode Island | | | | | | | | | | | | | | | | |
Housing | | | — | | | | 1,987 | | | | — | | | | 1,987 | |
Transportation | | | — | | | | 2,879 | | | | — | | | | 2,879 | |
| | | | | | | | | | | | | | | | |
Total Rhode Island | | | — | | | | 4,866 | | | | — | | | | 4,866 | |
| | | | | | | | | | | | | | | | |
South Carolina | | | | | | | | | | | | | | | | |
Housing | | | — | | | | 1,583 | | | | — | | | | 1,583 | |
Other Revenue | | | — | | | | 1,163 | | | | — | | | | 1,163 | |
| | | | | | | | | | | | | | | | |
Total South Carolina | | | — | | | | 2,746 | | | | — | | | | 2,746 | |
| | | | | | | | | | | | | | | | |
South Dakota | | | | | | | | | | | | | | | | |
Housing | | | — | | | | 2,172 | | | | — | | | | 2,172 | |
Tennessee | | | | | | | | | | | | | | | | |
Housing | | | — | | | | 2,449 | | | | — | | | | 2,449 | |
Texas | | | | | | | | | | | | | | | | |
General Obligation | | | — | | | | 2,840 | | | | — | | | | 2,840 | |
Hospital | | | — | | | | 843 | | | | — | | | | 843 | |
Housing | | | — | | | | 1,515 | | | | — | | | | 1,515 | |
Industrial Development Revenue/Pollution Control Revenue | | | — | | | | 904 | | | | — | | | | 904 | |
Other Revenue | | | — | | | | 1,094 | | | | — | | | | 1,094 | |
Transportation | | | — | | | | 3,221 | | | | — | | | | 3,221 | |
Water & Sewer | | | — | | | | 791 | | | | — | | | | 791 | |
| | | | | | | | | | | | | | | | |
Total Texas | | | — | | | | 11,208 | | | | — | | | | 11,208 | |
| | | | | | | | | | | | | | | | |
Utah | | | | | | | | | | | | | | | | |
Housing | | | — | | | | 5,460 | | | | — | | | | 5,460 | |
Other Revenue | | | — | | | | 1,189 | | | | — | | | | 1,189 | |
Utility | | | — | | | | 1,956 | | | | — | | | | 1,956 | |
| | | | | | | | | | | | | | | | |
Total Utah | | | — | | | | 8,605 | | | | — | | | | 8,605 | |
| | | | | | | | | | | | | | | | |
Vermont | | | | | | | | | | | | | | | | |
Education | | | — | | | | 5,036 | | | | — | | | | 5,036 | |
Housing | | | — | | | | 2,053 | | | | — | | | | 2,053 | |
| | | | | | | | | | | | | | | | |
Total Vermont | | | — | | | | 7,089 | | | | — | | | | 7,089 | |
| | | | | | | | | | | | | | | | |
| | | | | | |
| | | |
| 112 | | | | J.P. MORGAN MUNICIPAL BOND FUNDS | | FEBRUARY 28, 2018 |
| | | | | | | | | | | | | | | | |
| | | Level 1
Quoted prices | | | Level 2
Other significant
observable inputs | | | Level 3
Significant
unobservable inputs | | | Total | |
Washington | | | | | | | | | | | | | | | | |
Hospital | | $ | — | | | $ | 3,370 | | | $ | — | | | $ | 3,370 | |
Housing | | | — | | | | 3,419 | | | | — | | | | 3,419 | |
| | | | | | | | | | | | | | | | |
Total Washington | | | — | | | | 6,789 | | | | — | | | | 6,789 | |
| | | | | | | | | | | | | | | | |
West Virginia | | | | | | | | | | | | | | | | |
Other Revenue | | | — | | | | 2,982 | | | | — | | | | 2,982 | |
Wisconsin | | | | | | | | | | | | | | | | |
Education | | | — | | | | 5,495 | | | | — | | | | 5,495 | |
| | | | | | | | | | | | | | | | |
Total Municipal Bonds | | | — | | | | 210,419 | | | | 28 | | | | 210,447 | |
| | | | | | | | | | | | | | | | |
Short-Term Investment | | | | | | | | | | | | | | | | |
Investment Company | | | 4,335 | | | | — | | | | — | | | | 4,335 | |
| | | | | | | | | | | | | | | | |
Total Investments in Securities | | $ | 4,335 | | | $ | 210,419 | | | $ | 28 | | | $ | 214,782 | |
| | | | | | | | | | | | | | | | |
| | | | | | | | | | | | | | | | |
|
Short-Intermediate Municipal Bond Fund | |
| | | Level 1
Quoted prices | | | Level 2
Other significant
observable inputs | | | Level 3
Significant
unobservable inputs | | | Total | |
Total Investments in Securities (a) | | $ | 11,128 | | | $ | 1,694,254 | | | $ | — | | | $ | 1,705,382 | |
| | | | | | | | | | | | | | | | |
| | | | | | | | | | | | | | | | |
|
Tax Free Bond Fund | |
| | | Level 1
Quoted prices | | | Level 2
Other significant
observable inputs | | | Level 3
Significant
unobservable inputs | | | Total | |
Total Investments in Securities (a) | | $ | 9,885 | | | $ | 302,974 | | | $ | — | | | $ | 312,859 | |
| | | | | | | | | | | | | | | | |
Depreciation in Other Financial Instruments | | | | | | | | | | | | | | | | |
Futures Contracts (a) | | $ | (12 | ) | | $ | — | | | $ | — | | | $ | (12 | ) |
| | | | | | | | | | | | | | | | |
| | | | | | | | | | | | | | | | |
|
Ultra-Short Municipal Fund | |
| | | Level 1
Quoted prices | | | Level 2
Other significant
observable inputs | | | Level 3
Significant
unobservable inputs | | | Total | |
Total Investments in Securities (a) | | $ | 92,021 | | | $ | 1,954,040 | | | $ | — | | | $ | 2,046,061 | |
| | | | | | | | | | | | | | | | |
| (a) | All portfolio holdings designated as level 1 and level 2 are disclosed individually on the SOIs. Level 1 consists of a money market mutual fund that is held for daily investments of cash. Please refer to the SOIs for industry specifics of portfolio holdings. |
There were no transfers among any levels during the year ended February 28, 2018.
B. When-Issued Securities, Delayed Delivery Securities and Forward Commitments — Municipal Income Fund and Ultra-Short Municipal Fund purchased when-issued securities, including To Be Announced (“TBA”) securities, and entered into contracts to purchase or sell securities for a fixed price that may be settled a month or more after the trade date, or purchased delayed delivery securities which generally settle seven days after the trade date. When-issued securities are securities that have been authorized, but not issued in the market. A forward commitment involves entering into a contract to purchase or sell securities for a fixed price at a future date that may be settled a month or more after the trade date. A delayed delivery security is agreed upon in advance between the buyer and the seller of the security and is generally delivered beyond seven days of the agreed upon date. The purchase of securities on a when-issued, delayed delivery or forward commitment basis involves the risk that the value of the security to be purchased declines before settlement date. The sale of securities on a forward commitment basis involves the risk that the value of the securities sold may increase before the settlement date. The Funds may be exposed to credit risk if the counterparty fails to perform under the terms of the transaction. Interest income for securities purchased on a when-issued, delayed delivery or forward commitment basis is not accrued until settlement date.
The Funds had when-issued securities, forward commitments or delayed delivery securities outstanding as of February 28, 2018, which are shown as a Receivable for Investment securities sold — delayed delivery securities and Payable for Investment securities purchased — delayed delivery securities, respectively, on the Statements of Assets and Liabilities. The values of these securities held at February 28, 2018 are detailed on the SOIs.
| | | | | | | | |
| | | |
| FEBRUARY 28, 2018 | | J.P. MORGAN MUNICIPAL BOND FUNDS | | | | | 113 | |
NOTES TO FINANCIAL STATEMENTS
AS OF FEBRUARY 28, 2018 (continued)
The Funds did not have TBA purchase commitments outstanding as of February 28, 2018.
C. Futures Contracts — Tax Free Bond Fund used treasury and interest rate futures contracts to manage and hedge interest rate risk associated with portfolio investments. The Fund also used futures contracts to lengthen or shorten the duration of the overall investment portfolio.
Futures contracts provide for the delayed delivery of the underlying instrument at a fixed price or are settled for a cash amount based on the change in the value of the underlying instrument at a specific date in the future. Upon entering into a futures contract, the Fund is required to deposit with the broker, cash or securities in an amount equal to a certain percentage of the contract amount, which is referred to as the initial margin deposit. Subsequent payments, referred to as variation margin, are made or received by the Fund periodically and are based on changes in the market value of open futures contracts. Changes in the market value of open futures contracts are recorded as Change in net unrealized appreciation/depreciation on the Statements of Operations. Realized gains or losses, representing the difference between the value of the contract at the time it was opened and the value at the time it was closed, are reported on the Statements of Operations at the closing or expiration of the futures contract. Securities deposited as initial margin are designated on the SOI and cash deposited is recorded on the Statements of Assets and Liabilities. A receivable from and/or a payable to brokers for the daily variation margin is also recorded on the Statements of Assets and Liabilities.
The use of futures contracts exposes the Fund to interest rate risk. The Fund may be subject to the risk that the change in the value of the futures contract may not correlate perfectly with the underlying instrument. Use of long futures contracts subjects the Fund to risk of loss in excess of the amounts shown on the Statements of Assets and Liabilities, up to the notional amount of the futures contracts. Use of short futures contracts subjects the Fund to unlimited risk of loss. The Fund may enter into futures contracts only on exchanges or boards of trade. The exchange or board of trade acts as the counterparty to each futures transaction; therefore, the Fund’s credit risk is limited to failure of the exchange or board of trade. Under some circumstances, futures exchanges may establish daily limits on the amount that the price of a futures contract can vary from the previous day’s settlement price, which could effectively prevent liquidation of positions.
The table below discloses the volume of the Fund’s futures contracts activity during the year ended February 28, 2018 (amounts in thousands):
| | | | |
| | | Tax Free
Bond Fund | |
Futures Contracts: | | | | |
Average Notional Balance Short | | $ | 7,343 | |
Ending Notional Balance Short | | | 6,604 | |
The Fund’s futures contracts are not subject to master netting arrangements (the right to close out all transactions traded with a counterparty and net amounts owed or due across transactions).
D. Offering and Organizational Costs — Total offering costs of approximately $84,000 incurred in connection with the offering of shares of the Ultra-Short Municipal Fund were amortized on a straight line basis over 12 months from the date the Fund commenced operations. Costs incurred in connection with the organization of the Portfolio, if any, were recorded as an expense at the time the Fund commenced operations and are included as part of Professional fees. For the year ended February 28, 2018, total offering costs amortized were approximately $21,000.
E. Security Transactions and Investment Income — Investment transactions are accounted for on the trade date (the date the order to buy or sell is executed). Securities gains and losses are calculated on a specifically identified cost basis. Interest income is determined on the basis of coupon interest accrued using the effective interest method which adjusts for amortization of premiums and accretion of discounts. Dividend income net of foreign taxes withheld, if any, is recorded on the ex-dividend date or when a Fund first learns of the dividend.
F. Allocation of Income and Expenses — Expenses directly attributable to a fund are charged directly to that fund, while the expenses attributable to more than one fund of the Trusts are allocated among the respective funds. In calculating the NAV of each class, investment income, realized and unrealized gains and losses and expenses, other than class-specific expenses, are allocated daily to each class of shares based upon the proportion of net assets of each class at the beginning of each day.
Transfer agency fees are class-specific expenses and sub-transfer agency fees were class-specific expenses up through April 2, 2017. Effective April 3, 2017, the Funds ceased making direct payments to financial intermediaries for any applicable sub-transfer agency services. Payments to financial intermediaries for sub-transfer agency services are made by JPMorgan Distribution Services, Inc. from the Shareholder Servicing Fee,
| | | | | | |
| | | |
| 114 | | | | J.P. MORGAN MUNICIPAL BOND FUNDS | | FEBRUARY 28, 2018 |
which has been renamed as the Service Fee. The amount of transfer agency fees and sub-transfer agency fees charged to each class of the Funds for the year ended February 28, 2018 are as follows (amounts in thousands):
| | | | | | | | | | | | | | | | | | | | |
| | | Class A | | | Class C | | | Class I* | | | Class R6 | | | Total | |
Municipal Income Fund | | | | | | | | | | | | | | | | | | | | |
Transfer agency fees | | $ | 4 | | | $ | 1 | | | $ | 4 | | | $ | — | (a) | | $ | 9 | |
Sub-transfer agency fees | | | 1 | | | | 1 | | | | 1 | | | | — | | | | 3 | |
Short-Intermediate Municipal Bond Fund | | | | | | | | | | | | | | | | | | | | |
Transfer agency fees | | | 1 | | | | 1 | | | | 18 | | | | n/a | | | | 20 | |
Sub-transfer agency fees | | | — | (a) | | | 1 | | | | 16 | | | | n/a | | | | 17 | |
Tax Free Bond Fund | | | | | | | | | | | | | | | | | | | | |
Transfer agency fees | | | 13 | | | | 2 | | | | 4 | | | | n/a | | | | 19 | |
Sub-transfer agency fees | | | 3 | | | | 1 | | | | 1 | | | | n/a | | | | 5 | |
Ultra-Short Municipal Fund | | | | | | | | | | | | | | | | | | | | |
Transfer agency fees | | | 1 | | | | n/a | | | | 8 | | | | n/a | | | | 9 | |
Sub-transfer agency fees | | | — | (a) | | | n/a | | | | — | | | | n/a | | | | — | (a) |
| (a) | Amount rounds to less than 500. |
| * | Effective April 3, 2017, the Institutional Class of Short-Intermediate Municipal Bond Fund and the Select Class of Municipal Income Fund, Tax Free Bond Fund and Ultra-Short Municipal Fund were renamed Class I. |
G. Federal Income Taxes — Each Fund is treated as a separate taxable entity for Federal income tax purposes. Each Fund’s policy is to comply with the provisions of the Internal Revenue Code of 1986, as amended (the “Code”), applicable to regulated investment companies and to distribute to shareholders all of its distributable net investment income and net realized capital gains on investments. Accordingly, no provision for Federal income tax is necessary. Management has reviewed the Funds’ tax positions for all open tax years and has determined that as of February 28, 2018, no liability for income tax is required in the Funds’ financial statements for net unrecognized tax benefits. However, management’s conclusions may be subject to future review based on changes in, or the interpretation of, the accounting standards or tax laws and regulations. Each of the Funds’ Federal tax returns for the prior three fiscal years remains subject to examination by the Internal Revenue Service.
H. Distributions to Shareholders — Distributions from net investment income are generally declared and paid monthly and are declared separately for each class. No class has preferential dividend rights; differences in per share rates are due to differences in separate class expenses. Net realized capital gains, if any, are distributed by each Fund at least annually. The amount of distributions from net investment income and net realized capital gains is determined in accordance with Federal income tax regulations, which may differ from GAAP. To the extent these “book/tax” differences are permanent in nature (i.e., that they result from other than timing of recognition — “temporary differences”), such amounts are reclassified within the capital accounts based on their Federal tax-basis treatment.
There were no reclassifications for the year ended February 28, 2018.
3. Fees and Other Transactions with Affiliates
A. Investment Advisory Fee — Pursuant to Investment Advisory Agreements, the Adviser supervises the investments of each Fund and for such services is paid a fee. The fee is accrued daily and paid monthly based on each Fund’s respective average daily net assets. The annual rate for each Fund is as follows:
| | | | |
Municipal Income Fund | | | 0.30 | % |
Short-Intermediate Municipal Bond Fund | | | 0.25 | |
Tax Free Bond Fund | | | 0.30 | |
Ultra-Short Municipal Fund | | | 0.15 | |
The Adviser waived Investment Advisory fees and/or reimbursed expenses as outlined in Note 3.F.
B. Administration Fee — Pursuant to Administration Agreements, the Administrator provides certain administration services to the Funds. In consideration of these services, the Administrator receives a fee accrued daily and paid monthly at an annual rate of 0.15% of the first $25 billion of the average daily net assets of all funds in the J.P. Morgan Funds Complex covered by the Administration Agreement (excluding certain funds of funds and money market funds) and 0.075% of the average daily net assets in excess of $25 billion of all such funds. For the year ended February 28, 2018, the effective rate was 0.08% of each Fund’s average daily net assets, notwithstanding any fee waivers and/or expense reimbursements.
The Administrator waived Administration fees as outlined in Note 3.F.
JPMorgan Chase Bank, N.A. (“JPMCB”), a wholly-owned subsidiary of JPMorgan, serves as the Funds’ sub-administrator (the “Sub-administrator”). For its services as Sub-administrator, JPMCB receives a portion of the fees payable to the Administrator.
| | | | | | | | |
| | | |
| FEBRUARY 28, 2018 | | J.P. MORGAN MUNICIPAL BOND FUNDS | | | | | 115 | |
NOTES TO FINANCIAL STATEMENTS
AS OF FEBRUARY 28, 2018 (continued)
C. Distribution Fees — Pursuant to a Distribution Agreement, JPMorgan Distribution Services, Inc. (“JPMDS”), an indirect, wholly-owned subsidiary of JPMorgan, serves as the Trusts’ principal underwriter and promotes and arranges for the sale of each Fund’s shares.
The Board has adopted a Distribution Plan (the “Distribution Plan”) for Class A and Class C Shares of the Funds in accordance with Rule 12b-1 under the 1940 Act. Select Class Shares of Short-Intermediate Municipal Bond Fund, Class I Shares and Class R6 Shares do not charge a distribution fee. The Distribution Plan provides that each Fund shall pay distribution fees, including payments to JPMDS, at annual rates of the average daily net assets as shown in the table below:
| | | | | | |
| | | Class A | | Class C | |
| | 0.25% | | | 0.75 | % |
In addition, JPMDS is entitled to receive the front-end sales charges from purchases of Class A Shares and the CDSC from redemptions of Class C Shares and certain Class A Shares for which front-end sales charges have been waived. For the year ended February 28, 2018, JPMDS retained the following (amounts in thousands):
| | | | | | | | |
| | | Front-End Sales Charge | | | CDSC | |
Municipal Income Fund | | $ | 7 | | | $ | — | |
Short-Intermediate Municipal Bond Fund | | | 2 | | | | — | |
Tax Free Bond Fund | | | 11 | | | | 1 | |
D. Service Fees — The Trusts, on behalf of the Funds, have entered into a Shareholder Servicing Agreement with JPMDS under which JPMDS provides certain support services to the shareholders. For performing these services, JPMDS receives a fee, except for Class R6 Shares which do not charge a service fee, that is accrued daily and paid monthly equal to a percentage of the average daily net assets as shown in the table below:
| | | | | | | | | | | | | | | | |
| | | Class A | | | Class C | | | Class I* | | | Select Class | |
Municipal Income Fund | | | 0.25 | % | | | 0.25 | % | | | 0.25 | % | | | n/a | |
Short-Intermediate Municipal Bond Fund** | | | 0.25 | | | | 0.25 | | | | 0.25 | | | | 0.25 | % |
Tax Free Bond Fund | | | 0.25 | | | | 0.25 | | | | 0.25 | | | | n/a | |
Ultra-Short Municipal Fund | | | 0.25 | | | | n/a | | | | 0.25 | | | | n/a | |
| * | Effective April 3, 2017, the Institutional Class of Short-Intermediate Municipal Bond Fund and the Select Class of Municipal Income Fund, Tax Free Bond Fund and Ultra-Short Municipal Fund were renamed Class I. |
| ** | Prior to April 3, 2017, the service fee for Class I Shares for Short-Intermediate Municipal Bond Fund was 0.10%. |
JPMDS has entered into shareholder services contracts with affiliated and unaffiliated financial intermediaries who provide shareholder services and other related services to their clients or customers who invest in the Funds under which JPMDS will pay all or a portion of such fees earned to financial intermediaries for performing such services.
JPMDS waived service fees as outlined in Note 3.F.
E. Custodian and Accounting Fees — JPMCB provides portfolio custody and accounting services to the Funds. For performing these services, the Funds pay JPMCB transaction and asset-based fees that vary according to the number of transactions and positions, plus out-of-pocket expenses. The amounts paid directly to JPMCB by the Funds for custody and accounting services are included in Custodian and accounting fees on the Statements of Operations. Payments to the custodian may be reduced by credits earned by each Fund, based on uninvested cash balances held by the custodian. Such earnings credits, if any, are presented separately on the Statements of Operations.
Interest expense paid to the custodian related to cash overdrafts, if any, is included in Interest expense to affiliates on the Statements of Operations.
F. Waivers and Reimbursements — The Adviser, Administrator and/or JPMDS have contractually agreed to waive fees and/or reimburse the Funds to the extent that total annual operating expenses (excluding acquired fund fees and expenses other than certain money market fund fees as described below, dividend and interest expenses related to short sales, interest, taxes, expenses related to litigation and potential litigation and extraordinary expenses) exceed the percentages of the Funds’ respective average daily net assets as shown in the table below:
| | | | | | | | | | | | | | | | | | | | |
| | | Class A | | | Class C | | | Class I* | | | Class R6 | | | Select
Class | |
Municipal Income Fund | | | 0.70 | % | | | 1.25 | % | | | 0.45 | % | | | 0.35 | %** | | | n/a | |
Short-Intermediate Municipal Bond Fund | | | 0.70 | | | | 1.20 | | | | 0.25 | | | | n/a | | | | 0.25 | % |
Tax Free Bond Fund | | | 0.67 | | | | 1.25 | | | | 0.45 | | | | n/a | | | | n/a | |
Ultra-Short Municipal Fund | | | 0.45 | | | | n/a | | | | 0.25 | | | | n/a | | | | n/a | |
| * | Effective April 3, 2017, the Institutional Class of Short-Intermediate Municipal Bond Fund and the Select Class of the Municipal Income Fund, Tax Free Bond Fund and Ultra-Short Municipal Fund were renamed Class I. |
| ** | The contractual expense limitation percentage for Class R6 Shares of Municipal Income Fund in the table above is in place until at least November 2, 2018. |
| | | | | | |
| | | |
| 116 | | | | J.P. MORGAN MUNICIPAL BOND FUNDS | | FEBRUARY 28, 2018 |
Except as noted above, the expense limitation agreements were in effect for the year ended February 28, 2018 and the contractual expense limitation percentages in the table above are in place until at least October 31, 2018.
For the year ended February 28, 2018, the Funds’ service providers waived fees and/or reimbursed expenses for each of the Funds as follows (amounts in thousands). None of these parties expect the Funds to repay any such waived fees and/or reimbursed expenses in future years.
| | | | | | | | | | | | | | | | | | | | |
| | | Contractual Waivers | | | | |
| | | Investment
Advisory
Fees | | | Administration
Fees | | | Service
Fees | | | Total | | | Contractual
Reimbursement | |
Municipal Income Fund | | $ | 376 | | | $ | 201 | | | $ | 161 | | | $ | 738 | | | $ | 8 | |
Short-Intermediate Municipal Bond Fund | | | 2,271 | | | | 1,513 | | | | 4,223 | | | | 8,007 | | | | — | |
Tax Free Bond Fund | | | 469 | | | | 261 | | | | 191 | | | | 921 | | | | — | |
Ultra-Short Municipal Fund | | | 1,712 | | | | 928 | | | | 702 | | | | 3,342 | | | | 191 | |
Additionally, the Funds may invest in one or more money market funds advised by the Adviser or its affiliates (affiliated money market funds). The Adviser, Administrator and/or JPMDS, as shareholder servicing agent, have contractually agreed to waive fees and/or reimburse expenses in an amount sufficient to offset the respective net fees each collects from the affiliated money market fund on the applicable Fund’s investment in such affiliated money market fund.
The amounts of these waivers/reimbursements resulting from investments in these money market funds for the year ended February 28, 2018 were as follows (amounts in thousands):
| | | | |
Municipal Income Fund | | $ | 16 | |
Short-Intermediate Municipal Bond Fund | | | 181 | |
Tax Free Bond Fund | | | 22 | |
Ultra-Short Municipal Fund | | | 114 | |
G. Other — Certain officers of the Trusts are affiliated with the Adviser, the Administrator and JPMDS. Such officers, with the exception of the Chief Compliance Officer, receive no compensation from the Funds for serving in their respective roles.
The Board appointed a Chief Compliance Officer to the Funds in accordance with Federal securities regulations. Each Fund, along with other affiliated funds, makes reimbursement payments, on a pro-rata basis, to the Administrator for a portion of the fees associated with the Office of the Chief Compliance Officer. Such fees are included in Trustees’ and Chief Compliance Officer’s fees on the Statements of Operations.
The Trusts adopted a Trustee Deferred Compensation Plan (the “Plan”) which allows the Independent Trustees to defer the receipt of all or a portion of compensation related to performance of their duties as Trustees. The deferred fees are invested in various J.P. Morgan Funds until distribution in accordance with the Plan.
During the year ended February 28, 2018, the Funds purchased securities from an underwriting syndicate in which the principal underwriter or members of the syndicate were affiliated with the Adviser.
The Funds may use related party broker-dealers. For the year ended February 28, 2018, the Funds did not incur any brokerage commissions with broker-dealers affiliated with the Adviser.
The Securities and Exchange Commission (“SEC”) has granted an exemptive order permitting the Funds to engage in principal transactions with J.P. Morgan Securities, Inc., an affiliated broker, involving taxable money market instruments, subject to certain conditions.
4. Investment Transactions
During the year ended February 28, 2018, purchases and sales of investments (excluding short-term investments) were as follows (amounts in thousands):
| | | | | | | | |
| | | Purchases
(excluding U.S.
Government) | | | Sales
(excluding U.S.
Government) | |
Municipal Income Fund | | $ | 53,063 | | | $ | 101,181 | |
Short-Intermediate Municipal Bond Fund | | | 1,618,171 | | | | 1,852,795 | |
Tax Free Bond Fund | | | 125,889 | | | | 120,987 | |
Ultra-Short Municipal Fund | | | 2,296,851 | | | | 664,386 | |
During the year ended February 28, 2018, there were no purchases or sales of U.S. Government securities.
| | | | | | | | |
| | | |
| FEBRUARY 28, 2018 | | J.P. MORGAN MUNICIPAL BOND FUNDS | | | | | 117 | |
NOTES TO FINANCIAL STATEMENTS
AS OF FEBRUARY 28, 2018 (continued)
5. Federal Income Tax Matters
For Federal income tax purposes, the estimated cost and unrealized appreciation (depreciation) in value of investments held at February 28, 2018 were as follows (amounts in thousands):
| | | | | | | | | | | | | | | | |
| | | Aggregate
Cost | | | Gross
Unrealized
Appreciation | | | Gross
Unrealized
Depreciation | | | Net
Unrealized
Appreciation
(Depreciation) | |
Municipal Income Fund | | $ | 212,720 | | | $ | 4,249 | | | $ | 2,187 | | | $ | 2,062 | |
Short-Intermediate Municipal Bond Fund | | | 1,707,482 | | | | 9,003 | | | | 11,103 | | | | (2,100 | ) |
Tax Free Bond Fund | | | 300,273 | | | | 14,935 | | | | 2,349 | | | | 12,586 | |
Ultra-Short Municipal Fund | | | 2,049,065 | | | | 423 | | | | 3,427 | | | | (3,004 | ) |
The difference between book and tax basis appreciation (depreciation) on investments is primarily attributed to mark to market of futures contracts and wash sale loss deferrals.
The tax character of distributions paid during the year ended February 28, 2018 was as follows (amounts in thousands):
| | | | | | | | | | | | | | | | |
| | | Ordinary Income* | | | Tax Exempt Income | | | Net Long-Term Capital Gains | | | Total Distributions Paid | |
Municipal Income Fund | | $ | 63 | | | $ | 6,331 | | | $ | 1,741 | | | $ | 8,135 | |
Short-Intermediate Municipal Bond Fund | | | 572 | | | | 34,699 | | | | — | | | | 35,271 | |
Tax Free Bond Fund | | | 71 | | | | 10,635 | | | | — | | | | 10,706 | |
Ultra-Short Municipal Fund | | | 506 | | | | 9,639 | | | | — | | | | 10,145 | |
| * | Short-term gain distributions are treated as ordinary income for income tax purposes. |
The tax character of distributions paid during the year ended February 28, 2017 was as follows (amounts in thousands):
| | | | | | | | | | | | | | | | |
| | | Ordinary Income* | | | Tax Exempt Income | | | Net Long-Term Capital
Gains | | | Total Distributions Paid | |
Municipal Income Fund | | $ | 27 | | | $ | 7,728 | | | $ | 3,503 | | | $ | 11,258 | |
Short-Intermediate Municipal Bond Fund | | | 4,917 | | | | 32,366 | | | | 6,763 | | | | 44,046 | |
Tax Free Bond Fund | | | 3,209 | | | | 10,622 | | | | 3,637 | | | | 17,468 | |
Ultra-Short Municipal Fund | | | 5 | | | | 75 | | | | — | | | | 80 | |
| * | Short-term gain distributions are treated as ordinary income for income tax purposes. |
As of February 28, 2018, the estimated components of net assets (excluding paid-in-capital) on a tax basis were as follows (amounts in thousands):
| | | | | | | | | | | | |
| | | Tax Exempt Income | | | Current Distributable Long-Term Capital Gain or (Tax Basis Capital Loss Carryover) | | | Unrealized Appreciation (Depreciation) | |
Municipal Income Fund | | $ | 16 | | | $ | 906 | | | $ | 2,062 | |
Short-Intermediate Municipal Bond Fund | | | 81 | | | | (8,760 | ) | | | (2,100 | ) |
Tax Free Bond Fund | | | 39 | | | | (1,626 | ) | | | 12,573 | |
Ultra-Short Municipal Fund | | | 127 | | | | (1 | ) | | | (3,004 | ) |
For the Funds, the cumulative timing differences primarily consist of trustee deferred compensation, capital loss carryovers and post-October capital loss deferrals.
As of February 28, 2018, the following Funds had the following post-enactment net capital loss carryforwards (amounts in thousands):
| | | | | | | | |
| | | Capital Loss Carryforward Character | |
| | | Short-Term | | | Long-Term | |
Short-Intermediate Municipal Bond Fund | | $ | 8,193 | | | $ | 567 | |
Tax Free Bond Fund | | | 1,626 | | | | — | |
Ultra-Short Municipal Fund | | | 1 | | | | — | |
| | | | | | |
| | | |
| 118 | | | | J.P. MORGAN MUNICIPAL BOND FUNDS | | FEBRUARY 28, 2018 |
Net capital losses incurred after October 31 within the taxable year are deemed to arise on the first business day of the Funds’ next taxable year. For the year ended February 28, 2018, the following Funds deferred to March 1, 2018 the net capital losses of (amounts in thousands):
| | | | | | | | |
| | | Net Capital Loss | |
| | | Short-Term | | | Long-Term | |
Municipal Income Fund | | $ | 32 | | | $ | — | |
Short-Intermediate Municipal Bond Fund | | | 2,788 | | | | 7 | |
Tax Free Bond Fund | | | 92 | | | | 107 | |
Ultra-Short Municipal Fund | | | 57 | | | | — | |
6. Borrowings
The Funds rely upon an exemptive order granted by the SEC (the “Order”) permitting the establishment and operation of an Interfund Lending Facility (the “Facility”). The Facility allows the Funds to directly lend and borrow money to or from any other fund relying upon the Order at rates beneficial to both the borrowing and lending funds. Advances under the Facility are taken primarily for temporary or emergency purposes, including the meeting of redemption requests that otherwise might require the untimely disposition of securities, and are subject to each Fund’s borrowing restrictions. The Interfund loan rate is determined, as specified in the Order, by averaging the current repurchase agreement rate and the current bank loan rate. The Order was granted to JPM II and may be relied upon by the Funds because the Funds and the series of JPM II are all investment companies in the same “group of investment companies” (as defined in Section 12(d)(1)(G) of the 1940 Act).
The Trusts and JPMCB have entered into a financing arrangement. Under this arrangement, JPMCB provides an unsecured, uncommitted credit facility in the aggregate amount of $100 million to certain of the J.P. Morgan Funds, including the Funds. Advances under the arrangement are taken primarily for temporary or emergency purposes, including the meeting of redemption requests that otherwise might require the untimely disposition of securities, and are subject to each Fund’s borrowing restrictions. Interest on borrowings is payable at a rate determined by JPMCB at the time of borrowing. This agreement has been extended until November 5, 2018.
The Funds did not utilize the Credit Facility during the year ended February 28, 2018.
Interest expense paid as a result of borrowing from another fund or from the unsecured, uncommitted credit facility is included in Interest expense to affiliates on the Statements of Operations.
JPM II and JPM IV, each on behalf of certain funds, along with certain other trusts (“Borrowers”), have entered into a joint syndicated senior unsecured revolving credit facility totaling $1.5 billion (“Credit Facility”) with various lenders and The Bank of New York Mellon, as administrative agent for the lenders. This Credit Facility provides a source of funds to the Borrowers for temporary and emergency purposes, including the meeting of redemption requests that otherwise might require the untimely disposition of securities. Under the terms of the Credit Facility, a borrowing fund must have a minimum of $25,000,000 in adjusted net asset value and not exceed certain adjusted net asset coverage ratios prior to and during the time in which any borrowings are outstanding. If a fund does not comply with the aforementioned requirements, the fund must remediate within three business days with respect to the $25,000,000 minimum adjusted net asset value or within one business day with respect to certain asset coverage ratios or the administrative agent at the request of, or with the consent of, the lenders may terminate the Credit Facility and declare any outstanding borrowings to be due and payable immediately.
Interest associated with any borrowing under the Credit Facility is charged to the borrowing fund at a rate of interest equal to 1.00% plus the greater of the federal funds effective rate or one month LIBOR. The annual commitment fee to maintain the Credit Facility is 0.15% and is incurred on the unused portion of the Credit Facility and is allocated to all participating funds pro rata based on their respective net assets. Effective August 15, 2017, this agreement has been amended and restated for a term of 364 days, unless extended.
The Funds did not utilize the Credit Facility during the year ended February 28, 2018.
7. Risks, Concentrations and Indemnifications
In the normal course of business, the Funds enter into contracts that contain a variety of representations which provide general indemnifications. Each Fund’s maximum exposure under these arrangements is unknown. The amount of exposure would depend on future claims that may be made against each Fund that have not yet occurred. However, based on experience, the Funds expect the risk of loss to be remote.
| | | | | | | | |
| | | |
| FEBRUARY 28, 2018 | | J.P. MORGAN MUNICIPAL BOND FUNDS | | | | | 119 | |
NOTES TO FINANCIAL STATEMENTS
AS OF FEBRUARY 28, 2018 (continued)
As of February 28, 2018, the Funds had affiliated omnibus accounts which owned more than 10% of the respective Fund’s outstanding shares as follows:
| | | | | | | | |
| | | Number of
Affiliated
Omnibus
Accounts | | | % of the
Fund | |
Municipal Income Fund | | | 4 | | | | 70.6 | % |
Short-Intermediate Municipal Bond Fund | | | 3 | | | | 91.5 | |
Tax Free Bond Fund | | | 3 | | | | 62.3 | |
Ultra-Short Municipal Fund | | | 1 | | | | 96.4 | |
Significant shareholder transactions by these shareholders may impact the Funds’ performance.
Due to Municipal Income Fund investments in Underlying Funds, the Fund indirectly pays a portion of the expenses incurred by the underlying funds. As a result, the cost of investing in the Fund may be higher than the cost of investing in a mutual fund that invests directly in individual securities and financial instruments. The Fund is also subject to certain risks related to the Underlying Funds’ investments in securities and financial instruments such as fixed income securities, including high yield, asset-backed and mortgage-related securities, including collateralized mortgage obligations and stripped mortgage-backed securities, equity securities, foreign and emerging markets securities, and convertible securities. These securities are subject to risks specific to their structure, sector or market.
Derivatives may be riskier than other types of investments because they may be more sensitive to changes in economic and market conditions and could result in losses that significantly exceed the Funds’ original investment. Many derivatives create leverage thereby causing the Funds to be more volatile than they would have been if they had not used derivatives. Derivatives also expose the Funds to counterparty risk (the risk that the derivative counterparty will not fulfill its contractual obligations), including credit risk of the derivative counterparty.
The Funds are subject to interest rate and credit risk. The value of debt securities may decline as interest rates increase. The Funds could lose money if the issuer of a fixed income security is unable to pay interest or repay principal when it is due. The Funds invest in floating rate loans and other floating rate debt securities. Although these investments are generally less sensitive to interest rate changes than other fixed rate instruments, the value of floating rate loans and other floating rate investments may decline if their interest rates do not rise as quickly, or as much, as general interest rates. Many factors can cause interest rates to rise. Some examples include central bank monetary policy, rising inflation rates and general economic conditions. Given that the Federal Reserve has recently raised interest rates and may continue to do so, the Funds may face a heightened level of interest rate risk. The ability of the issuers of debt to meet their obligations may be affected by the economic and political developments in a specific industry or region.
Specific risks and concentrations present in the Underlying Funds are disclosed within their individual financial statements and registration statements, as appropriate.
The Funds invest primarily in a portfolio of debt obligations issued by states, territories and possessions of the United States and by the District of Columbia, and by their political subdivisions and duly constituted authorities. These debt obligations may be insured by private insurers who guarantee the payment of principal and interest in the event of issuer default. The value of these investments may be impacted by changes to bond insurers’ ratings and the Fund’s ability to collect principal and interest in the event of an issuer’s default may be limited if the private insurer does not have the wherewithal to satisfy its obligation.
8. Investment Company Reporting Modernization
In October 2016, the SEC adopted new rules and forms, and amendments to certain current rules and forms, to modernize the reporting and disclosure of information by registered investment companies. In part, the final rules amend Regulation S-X and require standardized, enhanced disclosures about derivatives in investment company financial statements, as well as other amendments. The amendments to Regulation S-X were applied to the Funds’ financial statements as of February 28, 2018. The adoption had no effect on the Funds’ net assets or results of operations.
9. New Accounting Pronouncement
In March 2017, the Financial Accounting Standards Board (“FASB”) issued Accounting Standards Update (“ASU”) 2017-08 (“ASU 2017-08”) Premium Amortization on Purchased Callable Debt Securities, which shortens the premium amortization period for purchased non-contingently callable debt securities. ASU 2017-08 requires that the premium be amortized to the earliest call date, for purchased non-contingently callable debt securities. ASU 2017-08 is effective for the fiscal years, and interim periods within those fiscal years, beginning after December 15, 2018. Management is currently evaluating the implications of these changes on the financial statements, if any.
| | | | | | |
| | | |
| 120 | | | | J.P. MORGAN MUNICIPAL BOND FUNDS | | FEBRUARY 28, 2018 |
REPORT OF INDEPENDENT REGISTERED PUBLIC ACCOUNTING FIRM
To the Board of Trustees of JPMorgan Trust II and JPMorgan Trust IV and Shareholders of JPMorgan Municipal Income Fund, JPMorgan Short-Intermediate Municipal Bond Fund, JPMorgan Tax Free Bond Fund and JPMorgan Ultra-Short Municipal Fund
Opinions on the Financial Statements
We have audited the accompanying statements of assets and liabilities, including the schedules of portfolio investments, of JPMorgan Municipal Income Fund, JPMorgan Short-Intermediate Municipal Bond Fund and JPMorgan Tax Free Bond Fund (three of the funds constituting JPMorgan Trust II) and JPMorgan Ultra-Short Municipal Fund (one of the funds constituting JPMorgan Trust IV) (hereafter collectively referred to as the “Funds”) as of February 28, 2018, the related statements of operations and the statements of changes in net assets for each of the periods indicated in the table below, including the related notes, and the financial highlights for each of the periods indicated therein (collectively referred to as the “financial statements”). In our opinion, the financial statements present fairly, in all material respects, the financial position of each of the Funds as of February 28, 2018, the results of each of their operations and the changes in each of their net assets for each of the periods indicated in the table below and each of the financial highlights for each of the periods indicated therein in conformity with accounting principles generally accepted in the United States of America.
| | |
| JPMorgan Municipal Income Fund, JPMorgan Short-Intermediate Municipal Bond Fund and JPMorgan Tax Free Bond Fund | | Statements of operations for the year ended February 28, 2018 and the statements of changes in net assets for each of the two years in the period ended February 28, 2018, |
| JPMorgan Ultra-Short Municipal Fund | | Statement of operations for the year ended February 28, 2018 and the statement of changes in net assets for the year ended February 28, 2018 and for the period May 31, 2016 (commencement of operations) through February 28, 2017 |
Basis for Opinions
These financial statements are the responsibility of the Funds’ management. Our responsibility is to express an opinion on the Funds’ financial statements based on our audits. We are a public accounting firm registered with the Public Company Accounting Oversight Board (United States) (“PCAOB”) and are required to be independent with respect to the Funds in accordance with the U.S. federal securities laws and the applicable rules and regulations of the Securities and Exchange Commission and the PCAOB.
We conducted our audits of these financial statements in accordance with the standards of the PCAOB. Those standards require that we plan and perform the audit to obtain reasonable assurance about whether the financial statements are free of material misstatement, whether due to error or fraud.
Our audits included performing procedures to assess the risks of material misstatement of the financial statements, whether due to error or fraud, and performing procedures that respond to those risks. Such procedures included examining, on a test basis, evidence regarding the amounts and disclosures in the financial statements. Our audits also included evaluating the accounting principles used and significant estimates made by management, as well as evaluating the overall presentation of the financial statements. Our procedures included physical inspection of securities owned as of February 28, 2018 and held by the custodian and confirmation of securities owned as of February 28, 2018 by correspondence with the custodian, transfer agent and brokers; when replies were not received from brokers, we performed other auditing procedures. We believe that our audits provide a reasonable basis for our opinions.
/s/PricewaterhouseCoopers LLP
New York, New York
April 26, 2018
We have served as the auditor of one or more investment companies in the JPMorgan Funds complex since 1993.
| | | | | | | | |
| | | |
| FEBRUARY 28, 2018 | | J.P. MORGAN MUNICIPAL BOND FUNDS | | | | | 121 | |
TRUSTEES
(Unaudited)
The Funds’ Statement of Additional Information includes additional information about the Funds’ Trustees and is available, without charge, upon request by calling 1-800-480-4111 or on the J.P. Morgan Funds’ website at www.jpmorganfunds.com.
| | | | | | |
Name (Year of Birth); Positions With the Funds (1) | | Principal Occupation During Past 5 Years | | Number of
Funds in Fund
Complex Overseen
by Trustee (2) | | Other Directorships Held During the Past 5 Years |
Independent Trustees | | |
| | | |
| John F. Finn (1947); Trustee of Trusts since 2005; Trustee of heritage One Group Mutual Funds since 1998. | | Chairman (1985-present), Chief Executive Officer, Gardner, Inc. (supply chain management company serving industrial and consumer markets) (1974-present). | | 138 | | Director, Greif, Inc. (GEF) (industrial package products and services) (2007-present); Trustee, Columbus Association for the Performing Arts (1988-present); Director, Cardinal Health, Inc. (CAH) (1994-2014). |
| | | |
| Dr. Matthew Goldstein (1941); Chairman since 2013; Trustee of Trusts since 2005; Trustee of heritage J.P. Morgan Funds since 2003. | | Chancellor Emeritus, City University of New York (2015-present); Professor, City University of New York (2013-present); Chancellor, City University of New York (1999-2013); President, Adelphi University (New York) (1998-1999). | | 138 | | Trustee, Museum of Jewish Heritage (2011-present); Trustee, National Museum of Mathematics (present); Chair, Association of College and University Administrators (present). |
| | | |
| Dennis P. Harrington* (1950); Trustee of Trusts since 2017. | | Retired; Partner, Deloitte LLP (1984-2012). | | 138 | | None |
| | | |
| Frankie D. Hughes (1952); Trustee of Trusts since 2008. | | President, Ashland Hughes Properties (property management) (2014-present); President and Chief Investment Officer, Hughes Capital Management, Inc. (fixed income asset management) (1993-2014). | | 138 | | None |
| | | |
Raymond Kanner** (1953); Trustee of Trusts since 2017. | | Retired; Managing Director & Chief Investment Officer, IBM Retirement Funds (2007-2016). | | 138 | | Director, Emerging Markets Growth Fund (1997-2016); Acting Executive Director, Committee on Investment of Employee Benefit Assets (CIEBA), 2016-17; Advisory Board Member, Betterment for Business (2016-present) (robo advisor); Advisory Board Member, Blue Star Indexes (2013-present) (index creator); Member, Russell Index Client Advisory Board (2001-2015). |
| | | |
| Peter C. Marshall (1942); Trustee of Trusts since 2005; Trustee of heritage One Group Mutual Funds since 1985. | | Self-employed business consultant
(2002-present). | | 138 | | None |
| | | |
| Mary E. Martinez (1960); Trustee of Trusts since 2013. | | Associate, Special Properties, a Christie’s International Real Estate Affiliate (2010-present); Managing Director, Bank of America (Asset Management) (2007-2008); Chief Operating Officer, U.S. Trust Asset Management, U.S. Trust Company (asset management) (2003-2007); President, Excelsior Funds (registered investment companies) (2004-2005). | | 138 | | None |
| | | |
| Marilyn McCoy*** (1948); Trustee of Trusts since 2005; Trustee of heritage One Group Mutual Funds since 1999. | | Vice President of Administration and Planning, Northwestern University (1985-present). | | 138 | | None |
| | | | | | |
| | | |
| 122 | | | | J.P. MORGAN MUNICIPAL BOND FUNDS | | FEBRUARY 28, 2018 |
| | | | | | |
Name (Year of Birth); Positions With the Funds (1) | | Principal Occupation During Past 5 Years | | Number of
Funds in Fund
Complex Overseen
by Trustee (2) | | Other Directorships Held During the Past 5 Years |
Independent Trustees (continued) | | |
| | | |
| Mitchell M. Merin (1953); Trustee of Trusts since 2013. | | Retired; President and Chief Operating Officer, Morgan Stanley Investment Management, Member Morgan Stanley & Co. Management Committee (registered investment adviser) (1985-2005). | | 138 | | Director, Sun Life Financial (SLF) (2007-2013) (financial services and insurance). |
| | | |
| Dr. Robert A. Oden, Jr. (1946); Trustee of Trusts since 2005; Trustee of heritage One Group Mutual Funds since 1997. | | Retired; President, Carleton College
(2002-2010); President, Kenyon College
(1995-2002). | | 138 | | Chairman, Dartmouth-Hitchcock Medical Center (2011-present); Trustee, American Schools of Oriental Research (2011-present); Trustee, American University in Cairo (1999-2014); Trustee, American Museum of Fly Fishing (2013-present). |
| | | |
| Marian U. Pardo**** (1946); Trustee of Trusts since 2013. | | Managing Director and Founder, Virtual Capital Management LLC (Investment Consulting) (2007-present); Managing Director, Credit Suisse Asset Management (portfolio manager) (2003-2006). | | 138 | | Member, Board of Governors, Columbus Citizens Foundation (not-for-profit supporting philanthropic and cultural programs) (2006-present). |
| | | |
| James J. Schonbachler (1943); Trustee of Trusts since 2005; Trustee of heritage J.P. Morgan Funds since 2001. | | Retired; Managing Director of Bankers Trust Company (financial services) (1968-1998). | | 138 | | None |
| (1) | The Trustees serve for an indefinite term, subject to the Trusts’ current retirement policy, which is age 78 for all Trustees. |
| (2) | A Fund Complex means two or more registered investment companies that hold themselves out to investors as related companies for purposes of investment and investor services or have a common investment adviser or have an investment adviser that is an affiliated person of the investment adviser of any of the other registered investment companies. The J.P. Morgan Funds Complex for which the Board of Trustees serves currently includes eleven registered investment companies (138 funds). |
| * | Two family members of Mr. Harrington are partner and managing director, respectively, of the Funds’ independent registered public accounting firm. Such firm has represented to the Board that those family members are not involved in the audit of the Funds’ financial statements and do not provide other services to the Funds. The Board has concluded that such association does not interfere with Mr. Harrington’s exercise of independent judgment as an Independent Trustee. |
| ** | A family member of Mr. Kanner is employed by JPMorgan Chase Bank, which is affiliated with JPMIM and JPMDS. In that capacity, this employee provides services to various JPMorgan affiliates including JPMIM and JPMDS and for which JPMIM and JPMDS bear some portion of the expense thereof. |
| *** | Two members of the Board of Trustees of Northwestern University are executive officers of registered investment advisers (not affiliated with JPMorgan) that are under common control with sub-advisers to certain J.P. Morgan Funds. |
| **** | In connection with prior employment with JPMorgan Chase, Ms. Pardo was the recipient of non-qualified pension plan payments from JPMorgan Chase in the amount of approximately $2,055 per month, which she irrevocably waived effective January 1, 2013, and deferred compensation payments from JPMorgan Chase in the amount of approximately $7,294 per year, which ended in January 2013. In addition, Ms. Pardo receives payments from a fully-funded qualified plan, which is not an obligation of JPMorgan Chase. |
The contact address for each of the Trustees is 270 Park Avenue, New York, NY 10017.
| | | | | | | | |
| | | |
| FEBRUARY 28, 2018 | | J.P. MORGAN MUNICIPAL BOND FUNDS | | | | | 123 | |
OFFICERS
(Unaudited)
| | |
Name (Year of Birth), Positions Held with the Trust (Since) | | Principal Occupations During Past 5 Years |
| |
Brian S. Shlissel (1964),
President and Principal Executive Officer (2016) | | Managing Director and Chief Administrative Officer for J.P. Morgan pooled vehicles, J.P. Morgan Investment Management Inc. (formerly JPMorgan Funds Management, Inc.) (2014 – present); Managing Director and Head of Mutual Fund Services, Allianz Global Investors; President and Chief Executive Officer, Allianz Global Investors Mutual Funds and PIMCO Closed-End Funds (1999-2014). |
| |
Timothy J. Clemens (1975), Treasurer and Principal Financial Officer (2018)* | | Executive Director, J.P. Morgan Investment Management Inc. (formerly JPMorgan Funds Management, Inc.) since February 2016; Vice President, JPMorgan Funds Management, Inc. from October 2013 to January 2016; Chief Financial Officer and Head of Valuation, Aberdeen Asset Management PLC (previously Artio Global Management (2009 to September 2013)). |
| |
Frank J. Nasta (1964),
Secretary (2008) | | Managing Director and Associate General Counsel, JPMorgan Chase since 2008. |
| |
Stephen M. Ungerman (1953),
Chief Compliance Officer (2005) | | Managing Director, JPMorgan Chase & Co.; Mr. Ungerman has been with JPMorgan Chase & Co. since 2000. |
| |
Elizabeth A. Davin (1964), Assistant Secretary (2005)** | | Executive Director and Assistant General Counsel, JPMorgan Chase since February 2012; formerly Vice President and Assistant General Counsel, JPMorgan Chase from 2005 to February 2012; Senior Counsel, JPMorgan Chase (formerly Bank One Corporation) from 2004 to 2005. |
| |
Jessica K. Ditullio (1962),
Assistant Secretary (2005)** | | Executive Director and Assistant General Counsel, JPMorgan Chase. Ms. Ditullio has been with JPMorgan Chase (formerly Bank One Corporation) since 1990. |
| |
John T. Fitzgerald (1975),
Assistant Secretary (2008) | | Executive Director and Assistant General Counsel, JPMorgan Chase. Mr. Fitzgerald has been with JPMorgan Chase since 2005. |
| |
Carmine Lekstutis (1980),
Assistant Secretary (2011) | | Executive Director and Assistant General Counsel, JPMorgan Chase since February 2015; formerly Vice President and Assistant General Counsel, JPMorgan Chase from 2011 to February 2015. |
| |
Gregory S. Samuels (1980),
Assistant Secretary (2010) | | Executive Director and Assistant General Counsel, JPMorgan Chase since 2014; formerly Vice President and Assistant General Counsel, JPMorgan Chase since 2010. |
| |
Pamela L. Woodley (1971),
Assistant Secretary (2012) | | Vice President and Assistant General Counsel, JPMorgan Chase since November 2004. |
| |
Zachary E. Vonnegut-Gabovitch (1986), Assistant Secretary (2017) | | Vice President and Assistant General Counsel, JPMorgan Chase since September 2016; Associate, Morgan, Lewis & Bockius (law firm) from 2012 to 2016. |
| |
Michael M. D’Ambrosio (1969),
Assistant Treasurer (2012) | | Managing Director, J.P. Morgan Investment Management Inc. (formerly JPMorgan Funds Management, Inc.) since May 2014; formerly Executive Director, JPMorgan Funds Management, Inc. from 2012 to May 2014. |
| |
Jeffrey D. House (1972), Assistant Treasurer (2017)** | | Vice President, J.P. Morgan Investment Management Inc. (formerly JPMorgan Funds Management, Inc.) since July 2006. |
| |
Lauren A. Paino (1973), Assistant Treasurer (2014)* | | Executive Director, J.P. Morgan Investment Management Inc. (formerly JPMorgan Funds Management, Inc.) since August 2013; formerly Director, Credit Suisse Asset Management from 2000-2013. |
| |
Joseph Parascondola (1963),
Assistant Treasurer (2011)* | | Vice President, J.P. Morgan Investment Management Inc. (formerly JPMorgan Funds Management, Inc.) since August 2006. |
| |
Matthew J. Plastina (1970), Assistant Treasurer (2011-2017)* | | Executive Director, J.P. Morgan Investment Management Inc. (formerly JPMorgan Funds Management, Inc.) since February 2016; Vice President, JPMorgan Funds Management, Inc. from 2010 to January 2016. |
| |
Gillian I. Sands (1969),
Assistant Treasurer (2012)* | | Vice President, J.P. Morgan Investment Management Inc. (formerly JPMorgan Funds Management, Inc.) since September 2012. |
The contact address for each of the officers, unless otherwise noted, is 270 Park Avenue, New York, NY 10017.
| * | The contact address for the officer is 4 New York Plaza, New York, NY 10004. |
| ** | The contact address for the officer is 1111 Polaris Parkway, Columbus, OH 43240. |
| | | | | | |
| | | |
| 124 | | | | J.P. MORGAN MUNICIPAL BOND FUNDS | | FEBRUARY 28, 2018 |
SCHEDULE OF SHAREHOLDER EXPENSES
(Unaudited)
Hypothetical $1,000 Investment
As a shareholder of the Funds, you incur two types of costs: (1) transaction costs, including sales charges (loads) on purchase payments and (2) ongoing costs, including investment advisory, fees, administration fees, distribution fees and other Fund expenses. The examples below are intended to help you understand your ongoing costs (in dollars) of investing in the Funds and to compare these ongoing costs with the ongoing costs of investing in other mutual funds. The examples assume that you had a $1,000 investment in each Class at the beginning of the reporting period, September 1, 2017, and continued to hold your shares at the end of the reporting period, February 28, 2018.
Actual Expenses
For each Class of each Fund in the table below, the first line provides information about actual account values and actual expenses. You may use the information in this line, together with the amount you invested, to estimate the expenses that you paid over the period. Simply divide your account value by $1,000 (for example, an $8,600 account value divided by $1,000 = 8.6), then multiply the result by the number in the first line of each Class under the heading entitled “Expenses Paid During the Period” to estimate the expenses you paid on your account during this period.
Hypothetical Example for Comparison Purposes
The second line of each Class in the table below provides information about hypothetical account values and hypothetical expenses based on the Class’ actual expense ratio and an assumed rate of return of 5% per year before expenses, which is not the Class’ actual return. The hypothetical account values and expenses may not be used to estimate the actual ending account balance or expenses you paid for the period. You may use this information to compare the ongoing costs of investing in the Class of the Fund and other funds. To do so, compare this 5% hypothetical example with the 5% hypothetical examples that appear in the shareholder reports of the other funds. Please note that the expenses shown in the table are meant to highlight your ongoing costs only and do not reflect any transaction costs, such as sales charges (loads) or redemption fees. Therefore, the second line for each Class in the table is useful in comparing ongoing costs only, and will not help you determine the relative total costs of owning different funds. In addition, if these transaction costs were included, your costs would have been higher. The examples also assume all dividends and distributions have been reinvested.
| | | | | | | | | | | | | | | | |
| | | Beginning Account Value September 1, 2017 | | | Ending Account Value February 28, 2018 | | | Expenses Paid During
the Period | | | Annualized Expense Ratio | |
Municipal Income Fund | | | | | | | | | | | | | | | | |
Class A | | | | | | | | | | | | | | | | |
Actual* | | $ | 1,000.00 | | | $ | 980.60 | | | $ | 3.39 | | | | 0.69 | % |
Hypothetical* | | | 1,000.00 | | | | 1,021.37 | | | | 3.46 | | | | 0.69 | |
Class C | | | | | | | | | | | | | | | | |
Actual* | | | 1,000.00 | | | | 977.70 | | | | 6.08 | | | | 1.24 | |
Hypothetical* | | | 1,000.00 | | | | 1,018.65 | | | | 6.21 | | | | 1.24 | |
Class I | | | | | | | | | | | | | | | | |
Actual* | | | 1,000.00 | | | | 981.70 | | | | 2.16 | | | | 0.44 | |
Hypothetical* | | | 1,000.00 | | | | 1,022.61 | | | | 2.21 | | | | 0.44 | |
Class R6 | | | | | | | | | | | | | | | | |
Actual** | | | 1,000.00 | | | | 985.80 | | | | 1.05 | | | | 0.34 | |
Hypothetical* | | | 1,000.00 | | | | 1,023.11 | | | | 1.71 | | | | 0.34 | |
| | | | |
Short-Intermediate Municipal Bond Fund | | | | | | | | | | | | | | | | |
Class A | | | | | | | | | | | | | | | | |
Actual* | | | 1,000.00 | | | | 985.50 | | | | 3.40 | | | | 0.69 | |
Hypothetical | | | 1,000.00 | | | | 1,021.37 | | | | 3.46 | | | | 0.69 | |
Class C | | | | | | | | | | | | | | | | |
Actual* | | | 1,000.00 | | | | 982.80 | | | | 5.85 | | | | 1.19 | |
Hypothetical* | | | 1,000.00 | | | | 1,018.89 | | | | 5.96 | | | | 1.19 | |
| | | | |
Class I (formerly Institutional Class) | | | | | | | | | | | | | | | | |
Actual* | | | 1,000.00 | | | | 987.70 | | | | 1.18 | | | | 0.24 | |
Hypothetical* | | | 1,000.00 | | | | 1,023.60 | | | | 1.20 | | | | 0.24 | |
| | | | | | | | |
| | | |
| FEBRUARY 28, 2018 | | J.P. MORGAN MUNICIPAL BOND FUNDS | | | | | 125 | |
SCHEDULE OF SHAREHOLDER EXPENSES
(Unaudited) (continued)
Hypothetical $1,000 Investment
| | | | | | | | | | | | | | | | |
| | | Beginning Account Value September 1, 2017 | | | Ending Account Value February 28, 2018 | | | Expenses Paid During
the Period | | | Annualized Expense Ratio | |
Tax Free Bond Fund | | | | | | | | | | | | | | | | |
Class A | | | | | | | | | | | | | | | | |
Actual* | | $ | 1,000.00 | | | $ | 990.30 | | | $ | 3.26 | | | | 0.66 | % |
Hypothetical* | | | 1,000.00 | | | | 1,021.52 | | | | 3.31 | | | | 0.66 | |
Class C | | | | | | | | | | | | | | | | |
Actual* | | | 1,000.00 | | | | 987.40 | | | | 6.11 | | | | 1.24 | |
Hypothetical* | | | 1,000.00 | | | | 1,018.65 | | | | 6.21 | | | | 1.24 | |
Class I (formerly Select Class) | | | | | | | | | | | | | | | | |
Actual* | | | 1,000.00 | | | | 991.40 | | | | 2.17 | | | | 0.44 | |
Hypothetical* | | | 1,000.00 | | | | 1,022.61 | | | | 2.21 | | | | 0.44 | |
| | | | |
Ultra-Short Municipal Fund | | | | | | | | | | | | | | | | |
Class A | | | | | | | | | | | | | | | | |
Actual* | | | 1,000.00 | | | | 1,001.20 | | | | 2.18 | | | | 0.44 | |
Hypothetical* | | | 1,000.00 | | | | 1,022.61 | | | | 2.21 | | | | 0.44 | |
Class I (formerly Select Class) | | | | | | | | | | | | | | | | |
Actual* | | | 1,000.00 | | | | 1,001.70 | | | | 1.19 | | | | 0.24 | |
Hypothetical* | | | 1,000.00 | | | | 1,023.60 | | | | 1.20 | | | | 0.24 | |
| * | Expenses are equal to each Class’ respective annualized expense ratio, multiplied by the average account value over the period, multiplied by 181/365 (to reflect the one-half year period). |
| ** | Expenses are equal to the Class’ respective annualized expense ratio, multiplied by the average account value over the period, multiplied by 114/365 (to reflect the actual period). Commencement of operations was November 6, 2017. |
| | | | | | |
| | | |
| 126 | | | | J.P. MORGAN MUNICIPAL BOND FUNDS | | FEBRUARY 28, 2018 |
TAX LETTER
(Unaudited)
Certain tax information for the J.P. Morgan Funds is required to be provided to shareholders based upon the Funds’ income and distributions for the taxable year ended February 28, 2018. The information and distributions reported in this letter may differ from the information and taxable distributions reported to the shareholders for the calendar year ending December 31, 2018. The information necessary to complete your income tax returns for the calendar year ending December 31, 2018 will be provided under separate cover.
Long Term Capital Gain
Each fund listed below distributed the following amount, or maximum allowable amount, of long-term capital gain dividends for the fiscal year ended February 28, 2018 (amounts in thousands):
| | | | |
| | | Long-Term
Capital Gain
Distribution | |
Municipal Income Fund | | $ | 1,741 | |
Tax-Exempt Income
Each fund listed below had the following amount, or maximum allowable amount, of dividends paid from investment income exempt from federal income tax for the fiscal year ended February 28, 2018 (amounts in thousands):
| | | | |
| | | Exempt Distributions Paid | |
Municipal Income Fund | | $ | 6,331 | |
Short-Intermediate Municipal Bond Fund | | | 34,699 | |
Tax Free Bond Fund | | | 10,635 | |
Ultra-Short Municipal Fund | | | 9,639 | |
| | | | | | | | |
| | | |
| FEBRUARY 28, 2018 | | J.P. MORGAN MUNICIPAL BOND FUNDS | | | | | 127 | |

Rev. January 2011
| | |
| FACTS | | WHAT DOES J.P. MORGAN FUNDS DO WITH YOUR PERSONAL INFORMATION? |
| | |
| Why? | | Financial companies choose how they share your personal information. Federal law gives consumers the right to limit some but not all sharing. Federal law also requires us to tell you how we collect, share, and protect your personal information. Please read this notice carefully to understand what we do. |
| | |
| What? | | The types of personal information we collect and share depend on the product or service you have with us. This information can include: ◾ Social Security number and account balances ◾ transaction history and account transactions ◾ checking account information and wire transfer instructions When you are no longer our customer, we continue to share your information as described in this notice. |
| | |
| How? | | All financial companies need to share customers’ personal information to run their everyday business. In the section below, we list the reasons financial companies can share their customers’ personal information; the reasons J.P. Morgan Funds chooses to share; and whether you can limit this sharing. |
| | | | |
| Reasons we can share your personal information | | Does J.P. Morgan
Funds share? | | Can you limit this
sharing? |
For our everyday business purposes — such as to process your transactions, maintain your account(s), respond to court orders and legal investigations, or report to credit bureaus | | Yes | | No |
For marketing purposes — to offer our products and services to you | | Yes | | No |
| For joint marketing with other financial companies | | No | | We don’t share |
For our affiliates’ everyday business purposes — information about your transactions and experiences | | No | | We don’t share |
For our affiliates’ everyday business purposes — information about your creditworthiness | | No | | We don’t share |
| For nonaffiliates to market to you | | No | | We don’t share |
| | |
| | |
| Questions? | | Call 1-800-480-4111 or go to www.jpmorganfunds.com |

| | |
| Who we are |
| Who is providing this notice? | | J.P. Morgan Funds |
| | |
| What we do |
| How does J.P. Morgan Funds protect my personal information? | | To protect your personal information from unauthorized access and use, we use security measures that comply with federal law. These measures include computer safeguards and secured files and buildings. We authorize our employees to access your information only when they need it to do their work and we require companies that work for us to protect your information. |
How does J.P. Morgan Funds collect my personal information? | | We collect your personal information, for example, when you: ◾ open an account or provide contact information ◾ give us your account information or pay us by check ◾ make a wire transfer We also collect your personal information from others, such as credit bureaus, affiliates and other companies. |
| Why can’t I limit all sharing? | | Federal law gives you the right to limit only ◾ sharing for affiliates’ everyday business purposes – information about your creditworthiness ◾ affiliates from using your information to market to you ◾ sharing for nonaffiliates to market to you State laws and individual companies may give you additional rights to limit sharing. |
| | |
| Definitions |
| Affiliates | | Companies related by common ownership or control. They can be financial and nonfinancial companies. ◾ J.P. Morgan Funds does not share with our affiliates. |
| Nonaffiliates | | Companies not related by common ownership or control. They can be financial and nonfinancial companies. ◾ J.P. Morgan Funds does not share with nonaffiliates so they can market to you. |
| Joint Marketing | | A formal agreement between nonaffiliated financial companies that together market financial products or services to you. ◾ J.P. Morgan Funds doesn’t jointly market. |
TRUSTEES
(Unaudited)
The Funds’ Statement of Additional Information includes additional information about the Funds’ Trustees and is available, without charge, upon request by calling 1-800-480-4111 or on the J.P. Morgan Funds’ website at www.jpmorganfunds.com.
| | | | | | |
Name (Year of Birth); Positions With the Funds (1) | | Principal Occupation During Past 5 Years | | Number of
Funds in Fund
Complex Overseen
by Trustee (2) | | Other Directorships Held During the Past 5 Years |
Independent Trustees | | |
| | | |
| John F. Finn (1947); Trustee of Trusts since 2005; Trustee of heritage One Group Mutual Funds since 1998. | | Chairman (1985-present), Chief Executive Officer, Gardner, Inc. (supply chain management company serving industrial and consumer markets) (1974-present). | | 138 | | Director, Greif, Inc. (GEF) (industrial package products and services) (2007-present); Trustee, Columbus Association for the Performing Arts (1988-present); Director, Cardinal Health, Inc. (CAH) (1994-2014). |
| | | |
| Dr. Matthew Goldstein (1941); Chairman since 2013; Trustee of Trusts since 2005; Trustee of heritage J.P. Morgan Funds since 2003. | | Chancellor Emeritus, City University of New York (2015-present); Professor, City University of New York (2013-present); Chancellor, City University of New York (1999-2013); President, Adelphi University (New York) (1998-1999). | | 138 | | Trustee, Museum of Jewish Heritage (2011-present); Trustee, National Museum of Mathematics (present); Chair, Association of College and University Administrators (present). |
| | | |
| Dennis P. Harrington* (1950); Trustee of Trusts since 2017. | | Retired; Partner, Deloitte LLP (1984-2012). | | 138 | | None |
| | | |
| Frankie D. Hughes (1952); Trustee of Trusts since 2008. | | President, Ashland Hughes Properties (property management) (2014-present); President and Chief Investment Officer, Hughes Capital Management, Inc. (fixed income asset management) (1993-2014). | | 138 | | None |
| | | |
Raymond Kanner** (1953); Trustee of Trusts since 2017. | | Retired; Managing Director & Chief Investment Officer, IBM Retirement Funds (2007-2016). | | 138 | | Director, Emerging Markets Growth Fund (1997-2016); Acting Executive Director, Committee on Investment of Employee Benefit Assets (CIEBA), 2016-17; Advisory Board Member, Betterment for Business (2016-present) (robo advisor); Advisory Board Member, Blue Star Indexes (2013-present) (index creator); Member, Russell Index Client Advisory Board (2001-2015). |
| | | |
| Peter C. Marshall (1942); Trustee of Trusts since 2005; Trustee of heritage One Group Mutual Funds since 1985. | | Self-employed business consultant
(2002-present). | | 138 | | None |
| | | |
| Mary E. Martinez (1960); Trustee of Trusts since 2013. | | Associate, Special Properties, a Christie’s International Real Estate Affiliate (2010-present); Managing Director, Bank of America (Asset Management) (2007-2008); Chief Operating Officer, U.S. Trust Asset Management, U.S. Trust Company (asset management) (2003-2007); President, Excelsior Funds (registered investment companies) (2004-2005). | | 138 | | None |
| | | |
| Marilyn McCoy*** (1948); Trustee of Trusts since 2005; Trustee of heritage One Group Mutual Funds since 1999. | | Vice President of Administration and Planning, Northwestern University (1985-present). | | 138 | | None |
| | | | | | |
Name (Year of Birth); Positions With the Funds (1) | | Principal Occupation During Past 5 Years | | Number of
Funds in Fund
Complex Overseen
by Trustee (2) | | Other Directorships Held During the Past 5 Years |
Independent Trustees (continued) | | |
| | | |
| Mitchell M. Merin (1953); Trustee of Trusts since 2013. | | Retired; President and Chief Operating Officer, Morgan Stanley Investment Management, Member Morgan Stanley & Co. Management Committee (registered investment adviser) (1985-2005). | | 138 | | Director, Sun Life Financial (SLF) (2007-2013) (financial services and insurance). |
| | | |
| Dr. Robert A. Oden, Jr. (1946); Trustee of Trusts since 2005; Trustee of heritage One Group Mutual Funds since 1997. | | Retired; President, Carleton College
(2002-2010); President, Kenyon College
(1995-2002). | | 138 | | Chairman, Dartmouth-Hitchcock Medical Center (2011-present); Trustee, American Schools of Oriental Research (2011-present); Trustee, American University in Cairo (1999-2014); Trustee, American Museum of Fly Fishing (2013-present). |
| | | |
| Marian U. Pardo**** (1946); Trustee of Trusts since 2013. | | Managing Director and Founder, Virtual Capital Management LLC (Investment Consulting) (2007-present); Managing Director, Credit Suisse Asset Management (portfolio manager) (2003-2006). | | 138 | | Member, Board of Governors, Columbus Citizens Foundation (not-for-profit supporting philanthropic and cultural programs) (2006-present). |
| | | |
| James J. Schonbachler (1943); Trustee of Trusts since 2005; Trustee of heritage J.P. Morgan Funds since 2001. | | Retired; Managing Director of Bankers Trust Company (financial services) (1968-1998). | | 138 | | None |
| (1) | The Trustees serve for an indefinite term, subject to the Trusts’ current retirement policy, which is age 78 for all Trustees. |
| (2) | A Fund Complex means two or more registered investment companies that hold themselves out to investors as related companies for purposes of investment and investor services or have a common investment adviser or have an investment adviser that is an affiliated person of the investment adviser of any of the other registered investment companies. The J.P. Morgan Funds Complex for which the Board of Trustees serves currently includes eleven registered investment companies (138 funds). |
| * | Two family members of Mr. Harrington are partner and managing director, respectively, of the Funds’ independent registered public accounting firm. Such firm has represented to the Board that those family members are not involved in the audit of the Funds’ financial statements and do not provide other services to the Funds. The Board has concluded that such association does not interfere with Mr. Harrington’s exercise of independent judgment as an Independent Trustee. |
| ** | A family member of Mr. Kanner is employed by JPMorgan Chase Bank, which is affiliated with JPMIM and JPMDS. In that capacity, this employee provides services to various JPMorgan affiliates including JPMIM and JPMDS and for which JPMIM and JPMDS bear some portion of the expense thereof. |
| *** | Two members of the Board of Trustees of Northwestern University are executive officers of registered investment advisers (not affiliated with JPMorgan) that are under common control with sub-advisers to certain J.P. Morgan Funds. |
| **** | In connection with prior employment with JPMorgan Chase, Ms. Pardo was the recipient of non-qualified pension plan payments from JPMorgan Chase in the amount of approximately $2,055 per month, which she irrevocably waived effective January 1, 2013, and deferred compensation payments from JPMorgan Chase in the amount of approximately $7,294 per year, which ended in January 2013. In addition, Ms. Pardo receives payments from a fully-funded qualified plan, which is not an obligation of JPMorgan Chase. |
The contact address for each of the Trustees is 270 Park Avenue, New York, NY 10017.

J.P. Morgan Asset Management is the marketing name for the asset management businesses of JPMorgan Chase & Co. Those businesses include, but are not limited to, J.P. Morgan Investment Management Inc., Security Capital Research & Management Incorporated and J.P. Morgan Alternative Asset Management, Inc.
| | | | |
| | © JPMorgan Chase & Co., 2018. All rights reserved. February 2018. | | AN-MUNIBOND-218 |
J.P. Morgan Income Funds
Annual Report
February 28, 2018
JPMorgan Flexible Long/Short Fund
JPMorgan High Yield Opportunities Fund
Contents
Investments in a Fund are not deposits or obligations of, or guaranteed or endorsed by, any bank and are not insured or guaranteed by the FDIC, the Federal Reserve Board or any other government agency. You could lose money if you sell when a Fund’s share price is lower than when you invested.
Past performance is no guarantee of future performance. The general market views expressed in this report are opinions based on market and other conditions through the end of the reporting period and are subject to change without notice. These views are not intended to predict the future performance of a Fund or the securities markets. References to specific securities and their issuers are for illustrative purposes only and are not intended to be, and should not be interpreted as, recommendations to purchase or sell such securities. Such views are not meant as investment advice and may not be relied on as an indication of trading intent on behalf of any Fund.
Prospective investors should refer to the Funds’ prospectuses for a discussion of the Funds’ investment objectives, strategies and risks. Call J.P. Morgan Funds Service Center at 1-800-480-4111 for a prospectus containing more complete information about a Fund including management fees and other expenses. Please read it carefully before investing.
CEO’S LETTER
March 29, 2018 (Unaudited)
Dear Shareholder,
The global economic expansion continued through its ninth consecutive year, supported by central bank policies, corporate earnings growth, consumer confidence and stable energy prices. Global equity and bond prices generally rose throughout the twelve months ended February 28, 2018, but fought to rebound from a sharp sell-off in early February.
During the reporting period, the U.S. Federal Reserve (the “Fed”) raised benchmark interest rates three times in response to a tightening labor market and early but muted signs of price inflation. Meanwhile, U.S. gross domestic product (GDP) surged to a better-than-expected 2.9% in the final quarter of 2017, and early indicators pointed to a continued seasonal pattern of weaker but positive GDP growth for the first quarter of 2018.
Labor markets in the U.S. continued to tighten, with the unemployment rate falling to 4.1% in October and remaining at that level through February. Labor force participation rates also rose somewhat but wage growth remained subdued.
Meanwhile, surging U.S. consumer confidence, record low volatility in financial markets and the December enactment of tax cut legislation appeared to provide additional fuel to the rally in equities that lasted from March through January. The Standard & Poor’s 500 Index (the “S&P 500”) reached record closing highs throughout the reporting period until February’s sell-off, which snapped a 15-month run of gains. Amid the sell-off, prices for government and corporate bonds plummeted.
Analysts largely attributed the sell-off to investor concerns that signs of rising inflation would prompt the Fed to accelerate the rollout of future interest rates increases. Historically high equity market valuations added fuel to the sell-off. While equity prices had somewhat rebounded by the end of February, bond prices remained under pressure.
In response to continued economic growth, the European Central Bank in January reduced its monthly asset purchases by half, though it left its benchmark interest rate unchanged at 0%. In November, the Bank of England raised interest rates for the first time in a decade and preparations for Britain’s exit from the European Union continued to move forward. Political uncertainty in Europe appeared to recede somewhat. In May, centrist politician Emmanuel Macron decisively defeated a challenge from far-right candidate Marine Le Pen to become France’s president. In October, a separatist movement in Spain’s Catalonia region was largely thwarted by the central government in Madrid. And at the end of the reporting period, German Chancellor Angela Merkel ended a political stalemate by successfully forming a governing coalition.
Emerging market nations continued to benefit from robust growth in China, rising commodity prices and strong global demand for goods. Emerging markets debt, which generated strong returns for investors during most of the reporting period, began to weaken late in 2017 amid a decline in the value of the U.S. dollar, which effectively raises export prices.
1
Key fundamental drivers of asset prices remain in place even as financial market volatility has risen from the historic lows seen throughout 2017. While leading central banks have edged toward policy normalization, they largely continue to be accommodative to financial markets. Corporate earnings have increased and business investment began to rise in the latter part of the reporting period. Consumer sentiment is buoyant and the global economy continued to expand in a synchronized fashion. Investors who hold a long-term outlook, while remaining fully invested in a well-diversified portfolio, will be best positioned, we believe, to navigate the current market environment.
We look forward to managing your investment needs for years to come. Should you have any questions, please visit www.jpmorganfunds.com or contact the J.P. Morgan Funds Service Center at 1-800-480-4111.
Sincerely yours,
George C.W. Gatch
CEO, Global Funds Management
J.P. Morgan Asset Management
2
JPMorgan Flexible Long/Short Fund
Fund Summary
Twelve Months Ended February 28, 2018 (Unaudited)
| | | | |
| Reporting Period Return: | | | |
| |
Fund (Class I Shares) 1,* | | | 3.28% | |
Bloomberg Barclays Multiverse Corporate Index | | | 6.22% | |
Net Assets as of 2/28/2018 (In Thousands) | | $ | 26,697,887 | |
Duration as of 2/28/2018 | | | 5.1 years | |
| |
INVESTMENT OBJECTIVE**
The JPMorgan Flexible Long/Short Fund (the “Fund”) seeks to provide total return.
HOW DID THE MARKET PERFORM?
During the reporting period, U.S. bond markets provided positive returns but largely underperformed U.S. equities, which were supported by rising corporate profits, continued low interest rates and synchronized economic growth. In early February 2018, a sharp sell-off pushed down prices for both fixed income and equity securities. Generally, investors blamed the sell-off on a surge in U.S. Treasury bond yields, which move in the opposite direction of bond prices, as well as uncertainty about U.S. Federal Reserve policy and historically high equity valuations.
While U.S. equity prices rebounded somewhat from the sell-off, yields on corporate bonds and U.S. Treasury bonds remained at elevated levels at the end of the reporting period. Within fixed income markets, high yield bonds (also known as “junk bonds”) continued to outperform investment grade corporate debt and U.S. Treasury bonds. However, bond prices overall were weighed down by expectations of accelerating inflation and rising interest rates as the U.S. economic expansion entered its ninth year.
WHAT WERE THE MAIN DRIVERS OF THE FUND’S PERFORMANCE?
For the twelve months ended February 28, 2018, the Fund’s Class I Shares underperformed the Bloomberg Barclays Multiverse Corporate Index (the “Index”).
Relative to the Index, the Fund’s overweight allocation to U.S. bank loan assignments was a leading detractor from performance, while the Fund’s overweight allocation to high yield corporate bonds (also known as “junk bonds”) was a leading contributor to relative performance.
HOW WAS THE FUND POSITIONED?
During the reporting period, the Fund’s managers employed an investment process based on both fundamental and quantitative research to determine asset allocations, security selection and hedging strategies within a portfolio of corporate debt instruments, loan assignments and derivatives.
| | | | | | |
PORTFOLIO COMPOSITION*** | | | | | | |
|
Corporate Bonds | | | 72.6% | | | |
Loan Assignments | | | 23.7 | | | |
Convertible Bonds | | | 1.6 | | | |
Others (each less than 1.0%) | | | 0.4 | | | |
Short-Term Investments | | | 1.7 | | | |
| | 1 | Effective April 3, 2017, the Fund’s Select Class Shares were renamed Class I Shares. |
| | * | The return shown is based on net asset values calculated for shareholder transactions and may differ from the return shown in the financial highlights, which reflects adjustments made to the net asset values in accordance with accounting principles generally accepted in the United States of America. |
| | ** | The adviser seeks to achieve the Fund’s objective. There can be no guarantee it will be achieved. |
| | *** | Percentages indicated are based on total investments as of February 28, 2018. The Fund’s portfolio composition is subject to change. |
3
JPMorgan Flexible Long/Short Fund
Fund Summary
Year Ended February 28, 2018 (Unaudited)
AVERAGE ANNUAL TOTAL RETURNS AS OF FEBRUARY 28, 2018
| | | | | | | | | | |
| | | INCEPTION DATE OF
CLASS | | 1 YEAR | | | SINCE
INCEPTION | |
| | | | | | |
CLASS A SHARES | | June 30, 2016 | | | | | | | | |
With Sales Charge* | | | | | (0.79)% | | | | 1.40% | |
Without Sales Charge | | | | | 3.05 | | | | 3.76 | |
CLASS C SHARES | | June 30, 2016 | | | | | | | | |
With CDSC** | | | | | 1.60 | | | | 3.27 | |
Without CDSC | | | | | 2.60 | | | | 3.27 | |
CLASS I SHARES | | | | | | | | | | |
(FORMERLY SELECT | | | | | | | | | | |
CLASS SHARES) | | June 30, 2016 | | | 3.28 | | | | 4.01 | |
CLASS R6 SHARES | | June 30, 2016 | | | 3.54 | | | | 4.26 | |
| * | Sales Charge for Class A Shares is 3.75%. |
| ** | Assumes a 1% CDSC (contingent deferred sales charge) for the one year period and 0% CDSC thereafter. |
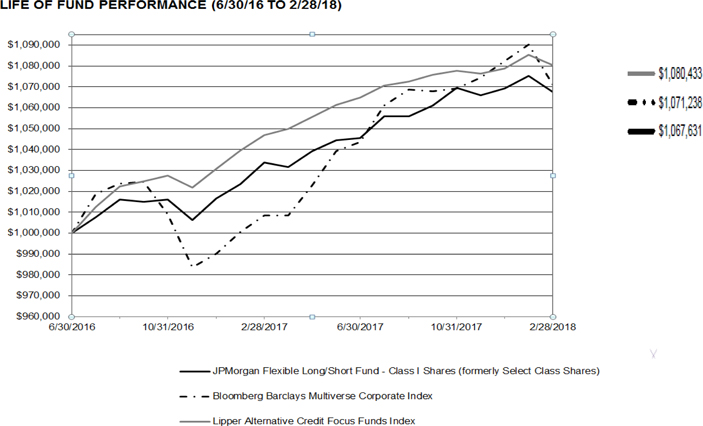
The performance quoted is past performance and is not a guarantee of future results. Mutual funds are subject to certain market risks. Investment returns and principal value of an investment will fluctuate so that an investor’s shares, when redeemed, may be worth more or less than their original cost. Current performance may be higher or lower than the performance data shown. For up-to-date, month-end performance information please call 1-800-480-4111.
4
The Fund commenced operations on June 30, 2016.
The graph illustrates comparative performance for $1,000,000 invested in Class I Shares of the JPMorgan Flexible Long/Short Fund, the Bloomberg Barclays Multiverse Corporate Index and the Lipper Alternative Credit Focus Funds Index from June 30, 2016 to February 28, 2018. The performance of the Fund assumes reinvestment of all dividends and capital gain distributions, if any, and does not include a sales charge. The performance of the Bloomberg Barclays Multiverse Corporate Index does not reflect the deduction of expenses or a sales charge associated with a mutual fund and approximates the minimum possible dividend reinvestment of the securities included in the benchmark, if applicable. The dividend is reinvested after deduction of withholding tax, applying the maximum rate to non-resident institutional investors who do not benefit from double taxation treaties. The Bloomberg Barclays Multiverse Corporate Index provides a broad-based measure of the international fixed-income bond market. The Lipper Alternative Credit Focus Funds Index represents the total returns of certain mutual funds within the Fund’s designated category as determined by Lipper, Inc. Investors cannot invest directly in an index.
Class I Shares have a $1,000,000 minimum initial investment.
Fund performance may reflect the waiver of the Fund’s fees and reimbursement of expenses for certain periods since the inception date. Without these waivers and reimbursements, performance would have been lower. Also, performance shown in this section does not reflect the deduction of taxes that a shareholder would pay on Fund distributions or redemptions of Fund shares.
The returns shown are based on net asset values calculated for shareholder transactions and may differ from the returns shown in the financial highlights, which reflect adjustments made to the net asset values in accordance with accounting principles generally accepted in the United States of America.
5
JPMorgan High Yield Opportunities Fund
Fund Summary
Twelve Months Ended February 28, 2018 (Unaudited)
| | | | |
| Reporting Period Return: | | | |
| |
Fund (Class I Shares)1,* | | | 4.39% | |
Bloomberg Barclays Global Aggregate Index (Hedged USD) | | | 1.57% | |
Net Assets as of 2/28/2018 (In Thousands) | | $ | 27,389,002 | |
Duration as of 2/28/2018 | | | 3.5 years | |
| |
INVESTMENT OBJECTIVE**
The JPMorgan High Yield Opportunities Fund (the “Fund”) seeks a high level of current income. Capital appreciation is a secondary objective.
HOW DID THE MARKET PERFORM?
During the reporting period, U.S. bond markets provided positive returns but largely underperformed U.S. equities, which were supported by rising corporate profits, continued low interest rates and synchronized economic growth. In early February 2018, a sharp sell-off pushed down prices for both fixed income and equity securities. Generally, investors blamed the sell-off on a surge in U.S. Treasury bond yields, which move in the opposite direction of bond prices, as well as uncertainty about U.S. Federal Reserve policy and historically high equity valuations.
While U.S. equity prices rebounded somewhat from the sell-off, yields on corporate bonds and U.S. Treasury bonds remained at elevated levels at the end of the reporting period. Within fixed income markets, high yield bonds (also known as “junk bonds”) continued to outperform investment grade corporate debt and U.S. Treasury bonds. However, bond prices overall were weighed down by expectations of accelerating inflation and rising interest rates as the U.S. economic expansion entered its ninth year.
WHAT WERE THE MAIN DRIVERS OF THE FUND’S PERFORMANCE?
For the twelve months ended February 28, 2018, the Fund’s Class I Shares outperformed the Bloomberg Barclays Global Aggregate Index (Hedged USD) (the “Benchmark”). During the reporting period, high yield bonds generally outperformed other sectors of the bond market.
Relative to the Benchmark, the Fund’s overweight position and security selection in consumer sector bonds and technology sector bonds were leading contributors to performance. The Fund’s overweight position and security selection in bonds rated CCC also contributed to relative performance as investors generally preferred lower rated bonds over higher rated bonds during the reporting period.
The Fund’s security selection in communication sector bonds and in bonds rated BBB was a leading detractor from performance relative to the Benchmark.
HOW WAS THE FUND POSITIONED?
The Fund’s portfolio managers sought to take specific, targeted credit risk based on their analysis of favorable risk/reward opportunities, while seeking to build a core of improving below-investment-grade investments across the quality spectrum. The managers continued to seek value in investment grade debt securities that they believed would benefit most from synchronized global growth, accelerating earnings and sound corporate balance sheets.
| | | | | | |
PORTFOLIO COMPOSITION*** | | | | | | |
|
Corporate Bonds | | | 87.6% | | | |
Loan Assignments | | | 4.4 | | | |
Convertible Bonds | | | 2.4 | | | |
Common Stocks | | | 0.8 | | | |
Short-Term Investment | | | 4.8 | | | |
| | 1 | On April 3, 2017, the Fund’s Select Class Shares were renamed Class I Shares |
| | * | The return shown is based on net asset values calculated for shareholder transactions and may differ from the return shown in the financial highlights, which reflects adjustments made to the net asset values in accordance with accounting principles generally accepted in the United States of America. |
| | ** | The adviser seeks to achieve the Fund’s objective. There can be no guarantee it will be achieved. |
| | *** | Percentages indicated are based on total investments as of February 28, 2018. The Fund’s portfolio composition is subject to change. |
6
JPMorgan High Yield Opportunities Fund
Fund Summary
Year Ended February 28, 2018 (Unaudited) (continued)
AVERAGE ANNUAL TOTAL RETURNS AS OF FEBRUARY 28, 2018
| | | | | | | | |
| | | INCEPTION DATE OF
CLASS | | | 1 YEAR | | SINCE
INCEPTION |
| | | | | | | | |
CLASS A SHARES | |
| November 1,
2016 |
| | | | |
With Sales Charge* | | | | | | 0.30% | | 3.78% |
Without Sales Charge | | | | | | 4.18 | | 6.82 |
CLASS C SHARES | |
| November 1,
2016 |
| | | | |
With CDSC** | | | | | | 2.61 | | 6.23 |
Without CDSC | | | | | | 3.61 | | 6.23 |
| | | |
CLASS I SHARES (FORMERLY SELECT CLASS SHARES) | |
| November 1,
2016 |
| | 4.39 | | 7.04 |
CLASS R6 SHARES | |
| November 1,
2016 |
| | 4.60 | | 7.25 |
| * | Sales Charge for Class A Shares is 3.75%. |
| ** | Assumes a 1% CDSC (contingent deferred sales charge) for the one year period and 0% CDSC thereafter. |
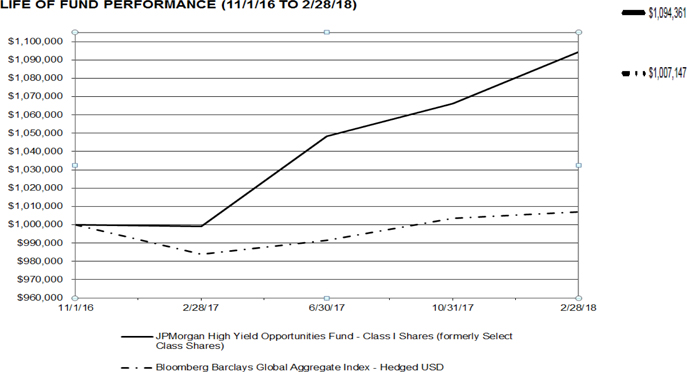
The performance quoted is past performance and is not a guarantee of future results. Mutual funds are subject to certain market risks. Investment returns and principal value of an investment will fluctuate so that an investor’s shares, when redeemed, may be worth more or less than their original cost. Current performance may be higher or lower than the performance data shown. For up-to-date, month-end performance information please call 1-800-480-4111.
7
The Fund commenced operations on November 1, 2016.
The graph illustrates comparative performance for $1,000,000 invested in Class I Shares of the JPMorgan High Yield Opportunities Fund and the Bloomberg Barclays Global Aggregate Index - Hedged USD from November 1, 2016 to February 28, 2018. The performance of the Fund assumes reinvestment of all dividends and capital gain distributions, if any, and does not include a sales charge. The performance of the Bloomberg Barclays Global Aggregate Index - Hedged USD does not reflect the deduction of expenses or a sales charge associated with a mutual fund and approximates the minimum possible dividend reinvestment of the securities included in the benchmark, if applicable. The dividend is reinvested after deduction of withholding tax, applying the maximum rate to non-resident institutional investors who do not benefit from double taxation treaties. The Bloomberg Barclays Global Aggregate Index - Hedged USD provides a broad-based measure of the international fixed-income bond market. Investors cannot invest directly in an index.
Class I Shares have a $1,000,000 minimum initial investment.
Fund performance may reflect the waiver of the Fund’s fees and reimbursement of expenses for certain periods since the inception date. Without these waivers and reimbursements, performance would have been lower. Also, performance shown in this section does not reflect the deduction of taxes that a shareholder would pay on Fund distributions or redemptions of Fund shares.
The returns shown are based on net asset values calculated for shareholder transactions and may differ from the returns shown in the financial highlights, which reflect adjustments made to the net asset values in accordance with accounting principles generally accepted in the United States of America.
8
JPMorgan Flexible Long/Short Fund
SCHEDULE OF PORTFOLIO INVESTMENTS
AS OF FEBRUARY 28, 2018
(Amounts in U.S. Dollars, unless otherwise noted)
| | | | | | | | |
| SHARES | | | SECURITY DESCRIPTION | | VALUE | |
| | |
| | Common Stock — 0.1% | | | | |
| | | | Information Technology — 0.1% | | | | |
| | | | Software — 0.1% | | | | |
| | 704 | | | Avaya Holdings Corp. (a) (Cost $11,708) | | | 14,777 | |
| | | | | | | | |
PRINCIPAL
AMOUNT | | | | | | |
| | |
| | Asset-Backed Securities — 0.2% | | | | |
| | 20,000 | | | American Airlines Pass-Through Trust, Series 2017-2, Class AA, 3.35%, 10/15/2029 | | | 19,497 | |
| | 52 | | | Continental Airlines Pass-Through Trust, Series 2003-ERJ1, 7.88%, 07/02/2018 | | | 53 | |
| | | | United Airlines Pass-Through Trust | | | | |
| | 15,000 | | | Series 2016-1, Class B, 3.65%, 01/07/2026 | | | 14,722 | |
| | 15,000 | | | Series 2016-2, Class B, 3.65%, 10/07/2025 | | | 14,654 | |
| | | | | | | | |
| | | | Total Asset-Backed Securities
(Cost $50,052) | | | 48,926 | |
| | | | | | | | |
| | Convertible Bonds — 1.6% | | | | |
| | |
| | | | Consumer Discretionary — 0.6% | | | | |
| | | | Internet & Direct Marketing Retail — 0.1% | |
| | 20,000 | | | Ctrip.com International Ltd., (China), 1.00%, 07/01/2020 | | | 21,382 | |
| | 10,000 | | | Liberty Expedia Holdings, Inc., 1.00%, 06/30/2047 (e) | | | 9,631 | |
| | | | | | | | |
| | | | | | | 31,013 | |
| | | | | | | | |
| | | | Media — 0.5% | | | | |
| | 10,000 | | | DISH Network Corp., 3.38%, 08/15/2026 | | | 10,061 | |
| | | | Liberty Interactive LLC, | | | | |
| | 88,911 | | | 3.75%, 02/15/2030 | | | 62,237 | |
| | 52,000 | | | 4.00%, 11/15/2029 | | | 36,660 | |
| | 25,000 | | | Live Nation Entertainment, Inc., 2.50%, 05/15/2019 | | | 33,420 | |
| | | | | | | | |
| | | | | | | 142,378 | |
| | | | | | | | |
| | | | Total Consumer Discretionary | | | 173,391 | |
| | | | | | | | |
| | | | Energy — 0.2% | | | | |
| | | | Energy Equipment & Services — 0.1% | |
| | 20,000 | | | Nabors Industries, Inc., 0.75%, 01/15/2024 (e) | | | 15,210 | |
| | | | | | | | |
| |
| | | | Oil, Gas & Consumable Fuels — 0.1% | |
| | 15,000 | | | Oasis Petroleum, Inc., 2.63%, 09/15/2023 | | | 15,455 | |
| | 10,000 | | | SM Energy Co., 1.50%, 07/01/2021 | | | 9,664 | |
| | | | | | | | |
| | | | | | | 25,119 | |
| | | | | | | | |
| | | | Total Energy | | | 40,329 | |
| | | | | | | | |
| | | | | | | | |
PRINCIPAL
AMOUNT | | | SECURITY DESCRIPTION | | VALUE | |
| | |
| |
| | | | Health Care — 0.0% (g) | |
| | | | Health Care Technology — 0.0% (g) | |
| | 5,000 | | | Medidata Solutions, Inc., 1.00%, 08/01/2018 | | | 5,840 | |
| | | | | | | | |
| | |
| | | | Information Technology — 0.8% | | | | |
| | | | Communications Equipment — 0.1% | |
| | 25,000 | | | Finisar Corp., 0.50%, 12/15/2036 | | | 22,964 | |
| | | | | | | | |
| |
| | | | Electronic Equipment, Instruments & Components — 0.1% | |
| | 20,000 | | | II-VI, Inc., 0.25%, 09/01/2022 (e) | | | 21,447 | |
| | | | | | | | |
| |
| | | | Internet Software & Services — 0.2% | |
| | 10,000 | | | Envestnet, Inc., 1.75%, 12/15/2019 | | | 10,809 | |
| | 20,000 | | | Nutanix, Inc., Zero Coupon, 01/15/2023 (e) | | | 20,555 | |
| | 20,000 | | | Zillow Group, Inc., 2.00%, 12/01/2021 | | | 23,242 | |
| | | | | | | | |
| | | | | | | 54,606 | |
| | | | | | | | |
| | | | Semiconductors & Semiconductor Equipment — 0.4% | |
| | 20,000 | | | Cypress Semiconductor Corp., 4.50%, 01/15/2022 | | | 28,724 | |
| | 25,000 | | | ON Semiconductor Corp., 1.00%, 12/01/2020 | | | 34,971 | |
| | 20,000 | | | Teradyne, Inc., 1.25%, 12/15/2023 | | | 30,358 | |
| | | | | | | | |
| | | | | | | 94,053 | |
| | | | | | | | |
| | | | Software — 0.0% (g) | |
| | 5,000 | | | Red Hat, Inc., 0.25%, 10/01/2019 | | | 10,014 | |
| | | | | | | | |
| | | | Total Information Technology | | | 203,084 | |
| | | | | | | | |
| | | | Total Convertible Bonds (Cost $392,583) | | | 422,644 | |
| | | | | | | | |
| Corporate Bonds — 70.5%
| | | | |
| | |
| | | | Consumer Discretionary — 10.1% | | | | |
| | | | Auto Components — 0.8% | | | | |
| | | | American Axle & Manufacturing, Inc., | | | | |
| | 32,000 | | | 6.25%, 04/01/2025 | | | 33,020 | |
| | 6,000 | | | 6.50%, 04/01/2027 | | | 6,195 | |
| | 7,000 | | | 6.63%, 10/15/2022 | | | 7,236 | |
| | 14,000 | | | Dana Financing Luxembourg SARL, 5.75%, 04/15/2025 (e) | | | 14,341 | |
| | 34,000 | | | Goodyear Tire & Rubber Co. (The), 4.88%, 03/15/2027 | | | 33,490 | |
| | EUR 100,000 | | | LKQ Italia Bondco SpA, Reg. S, 3.88%, 04/01/2024 | | | 130,693 | |
| | | | | | | | |
| | | | | | | 224,975 | |
| | | | | | | | |
| | | | Automobiles — 0.7% | |
| | 35,000 | | | General Motors Co., 4.00%, 04/01/2025 | | | 34,572 | |
SEE NOTES TO FINANCIAL STATEMENTS.
9
JPMorgan Flexible Long/Short Fund
SCHEDULE OF PORTFOLIO INVESTMENTS
AS OF FEBRUARY 28, 2018 (continued)
(Amounts in U.S. Dollars, unless otherwise noted)
| | | | | | | | |
PRINCIPAL
AMOUNT | | | SECURITY DESCRIPTION | | VALUE | |
| | |
| | Corporate Bonds — continued | | | | |
| |
| | | | Automobiles — continued | |
| | GBP 100,000 | | | Jaguar Land Rover Automotive plc, (United Kingdom), Reg. S, 3.88%, 03/01/2023 | | | 140,809 | |
| | 15,000 | | | Tesla, Inc., 5.30%, 08/15/2025 (e) | | | 14,287 | |
| | | | | | | | |
| | | | | | | 189,668 | |
| | | | | | | | |
| | | | Distributors — 0.0% (g) | |
| | 8,000 | | | Performance Food Group, Inc., 5.50%, 06/01/2024 (e) | | | 8,160 | |
| | 4,000 | | | Univar USA, Inc., 6.75%, 07/15/2023 (e) | | | 4,155 | |
| | | | | | | | |
| | | | | | | 12,315 | |
| | | | | | | | |
| | | | Diversified Consumer Services — 0.1% | |
| | 20,000 | | | Service Corp. International, 7.50%, 04/01/2027 | | | 23,300 | |
| | 10,000 | | | Sotheby’s, 4.88%, 12/15/2025 (e) | | | 9,700 | |
| | | | | | | | |
| | | | | | | 33,000 | |
| | | | | | | | |
| | | | Hotels, Restaurants & Leisure — 2.1% | |
| | 8,000 | | | 1011778 BC ULC, (Canada), 4.25%, 05/15/2024 (e) | | | 7,640 | |
| | 9,000 | | | Boyd Gaming Corp., 6.88%, 05/15/2023 | | | 9,495 | |
| | 31,000 | | | Choice Hotels International, Inc., 5.75%, 07/01/2022 | | | 33,170 | |
| | EUR 110,000 | | | Cirsa Funding Luxembourg SA, (Spain), Reg. S, 5.88%, 05/15/2023 | | | 138,794 | |
| | 3,000 | | | Downstream Development Authority of the Quapaw Tribe of Oklahoma, 10.50%, 02/15/2023 (e) | | | 3,078 | |
| | 5,000 | | | Eldorado Resorts, Inc., 6.00%, 04/01/2025 | | | 5,150 | |
| | 10,000 | | | Gateway Casinos & Entertainment Ltd., (Canada), 8.25%, 03/01/2024 (e) | | | 10,675 | |
| | 18,000 | | | GLP Capital LP, 5.38%, 11/01/2023 | | | 18,765 | |
| | 11,000 | | | Golden Nugget, Inc., 6.75%, 10/15/2024 (e) | | | 11,275 | |
| | EUR 125,000 | | | International Game Technology plc, Reg. S, 4.75%, 02/15/2023 | | | 169,098 | |
| | 4,000 | | | IRB Holding Corp., 6.75%, 02/15/2026 (e) KFC Holding Co., | | | 4,000 | |
| | 5,000 | | | 4.75%, 06/01/2027 (e) | | | 4,888 | |
| | 10,000 | | | 5.25%, 06/01/2026 (e) | | | 10,125 | |
| | 45,000 | | | McDonald’s Corp., 4.60%, 05/26/2045 | | | 46,755 | |
| | | | MGM Resorts International, | | | | |
| | 39,000 | | | 6.00%, 03/15/2023 | | | 41,486 | |
| | 30,000 | | | 8.63%, 02/01/2019 | | | 31,500 | |
| | 6,000 | | | Scientific Games International, Inc., 5.00%, 10/15/2025 (e) | | | 5,933 | |
| | 16,000 | | | Six Flags Entertainment Corp., 4.88%, 07/31/2024 (e) | | | 15,961 | |
| | 5,000 | | | Station Casinos LLC, 5.00%, 10/01/2025 (e) | | | 4,875 | |
| | | | | | | | |
| | | | | | | 572,663 | |
| | | | | | | | |
| | | | | | | | |
PRINCIPAL
AMOUNT | | | SECURITY DESCRIPTION | | VALUE | |
| | |
| | |
| | | | Household Durables — 0.5% | | | | |
| | 6,000 | | | American Greetings Corp., 7.88%, 02/15/2025 (e) | | | 6,135 | |
| | | | Lennar Corp., | | | | |
| | 33,000 | | | 4.50%, 06/15/2019 | | | 33,412 | |
| | 3,000 | | | 4.75%, 11/29/2027 (e) | | | 2,903 | |
| | 15,000 | | | 4.88%, 12/15/2023 | | | 15,206 | |
| | 10,000 | | | 5.88%, 11/15/2024 (e) | | | 10,625 | |
| | 8,000 | | | M/I Homes, Inc., 6.75%, 01/15/2021 | | | 8,240 | |
| | 10,000 | | | Mattamy Group Corp., (Canada), 6.50%, 10/01/2025 (e) | | | 10,450 | |
| | 9,000 | | | New Home Co., Inc. (The), 7.25%, 04/01/2022 | | | 9,337 | |
| | 15,000 | | | Tempur Sealy International, Inc., 5.50%, 06/15/2026 | | | 14,738 | |
| | 10,000 | | | Toll Brothers Finance Corp., 4.35%, 02/15/2028 | | | 9,450 | |
| | | | | | | | |
| | | | | | | 120,496 | |
| | | | | | | | |
| | | | Internet & Direct Marketing Retail — 0.1% | |
| | 15,000 | | | Amazon.com, Inc., 4.05%, 08/22/2047 (e) | | | 14,918 | |
| | 5,000 | | | Netflix, Inc., 4.88%, 04/15/2028 (e) | | | 4,913 | |
| | | | | | | | |
| | | | | | | 19,831 | |
| | | | | | | | |
| | | | Leisure Products — 0.0% (g) | |
| | | | Mattel, Inc., | | | | |
| | 3,000 | | | 3.15%, 03/15/2023 | | | 2,689 | |
| | 2,000 | | | 6.75%, 12/31/2025 (e) | | | 2,035 | |
| | | | | | | | |
| | | | | | | 4,724 | |
| | | | | | | | |
| | | | Media — 4.9% | |
| | EUR 200,000 | | | Altice Luxembourg SA, (Luxembourg), Reg. S, 6.25%, 02/15/2025 | | | 227,603 | |
| | 21,000 | | | AMC Networks, Inc., 5.00%, 04/01/2024 | | | 21,053 | |
| | | | Cablevision Systems Corp., | | | | |
| | 4,000 | | | 5.88%, 09/15/2022 | | | 4,000 | |
| | 17,000 | | | 8.00%, 04/15/2020 | | | 18,066 | |
| | 30,000 | | | Charter Communications Operating LLC, 6.48%, 10/23/2045 | | | 33,795 | |
| | 19,000 | | | Cinemark USA, Inc., 4.88%, 06/01/2023 | | | 18,881 | |
| | 16,000 | | | Clear Channel Worldwide Holdings, Inc., Series B, 7.63%, 03/15/2020 | | | 15,980 | |
| | | | Comcast Corp., | | | | |
| | 20,000 | | | 3.20%, 07/15/2036 | | | 17,673 | |
| | 30,000 | | | 4.75%, 03/01/2044 | | | 31,942 | |
| | | | Cox Communications, Inc., | | | | |
| | 65,000 | | | 3.35%, 09/15/2026 (e) | | | 61,860 | |
| | 60,000 | | | 3.50%, 08/15/2027 (e) | | | 57,346 | |
| | | | CSC Holdings LLC, | | | | |
| | 42,000 | | | 5.25%, 06/01/2024 | | | 40,425 | |
| | 2,000 | | | 6.75%, 11/15/2021 | | | 2,104 | |
SEE NOTES TO FINANCIAL STATEMENTS.
10
JPMorgan Flexible Long/Short Fund
SCHEDULE OF PORTFOLIO INVESTMENTS
AS OF FEBRUARY 28, 2018 (continued)
(Amounts in U.S. Dollars, unless otherwise noted)
| | | | | | | | |
PRINCIPAL
AMOUNT | | | SECURITY DESCRIPTION | | VALUE | |
| | |
| | Corporate Bonds — continued | | | | |
| |
| | | | Media — continued | |
| | | | Discovery Communications LLC, | | | | |
| | 35,000 | | | 2.95%, 03/20/2023 | | | 33,835 | |
| | 5,000 | | | 5.00%, 09/20/2037 | | | 4,992 | |
| | | | DISH DBS Corp., | | | | |
| | 9,000 | | | 5.00%, 03/15/2023 | | | 8,269 | |
| | 14,000 | | | 5.88%, 07/15/2022 | | | 13,650 | |
| | 7,000 | | | 5.88%, 11/15/2024 | | | 6,545 | |
| | 31,000 | | | 6.75%, 06/01/2021 | | | 31,852 | |
| | 10,000 | | | 7.75%, 07/01/2026 | | | 9,850 | |
| | 4,000 | | | EMI Music Publishing Group North America Holdings, Inc., 7.63%, 06/15/2024 (e) | | | 4,360 | |
| | 14,000 | | | EW Scripps Co. (The), 5.13%, 05/15/2025 (e) | | | 13,440 | |
| | 19,000 | | | Gray Television, Inc., 5.13%, 10/15/2024 (e) | | | 18,620 | |
| | 25,000 | | | iHeartCommunications, Inc.,
9.00%, 12/15/2019 (d) | | | 19,938 | |
| | 36,000 | | | Live Nation Entertainment, Inc.,
4.88%, 11/01/2024 (e) | | | 35,775 | |
| | 21,000 | | | Nexstar Broadcasting, Inc.,
6.13%, 02/15/2022 (e) | | | 21,630 | |
| | EUR 100,000 | | | SES SA, (Luxembourg), Reg. S, (EUR Swap Annual 5 Year + 4.66%),
4.62%, 01/02/2022 (x) (y) (aa) | | | 129,200 | |
| | | | Sinclair Television Group, Inc., | | | | |
| | 30,000 | | | 5.13%, 02/15/2027 (e) | | | 28,838 | |
| | 29,000 | | | 5.63%, 08/01/2024 (e) | | | 29,435 | |
| | | | Sirius XM Radio, Inc., | | | | |
| | 5,000 | | | 5.00%, 08/01/2027 (e) | | | 4,861 | |
| | 14,000 | | | 5.38%, 07/15/2026 (e) | | | 14,175 | |
| | GBP 50,000 | | | Sky plc, (United Kingdom), 6.00%, 05/21/2027 | | | 87,518 | |
| | 13,000 | | | TEGNA, Inc., 5.50%, 09/15/2024 (e) | | | 13,358 | |
| | EUR 100,000 | | | Unitymedia GmbH, (Germany), Reg. S, 3.75%, 01/15/2027 | | | 128,503 | |
| | 24,000 | | | Univision Communications, Inc.,
5.13%, 02/15/2025 (e) | | | 22,170 | |
| | | | Viacom, Inc., | | | | |
| | 4,000 | | | 4.38%, 03/15/2043 | | | 3,597 | |
| | 5,000 | | | (ICE LIBOR USD 3 Month + 3.90%), 5.88%, 02/28/2057 (aa) | | | 5,045 | |
| | 5,000 | | | (ICE LIBOR USD 3 Month + 3.90%), 6.25%, 02/28/2057 (aa) | | | 5,138 | |
| | | | Videotron Ltd., (Canada), | | | | |
| | 13,000 | | | 5.00%, 07/15/2022 | | | 13,390 | |
| | 14,000 | | | 5.13%, 04/15/2027 (e) | | | 14,124 | |
| | | | WMG Acquisition Corp., | | | | |
| | 5,000 | | | 5.00%, 08/01/2023 (e) | | | 5,069 | |
| | 3,000 | | | 5.50%, 04/15/2026 (e) (w) | | | 3,000 | |
| | | | | | | | |
PRINCIPAL
AMOUNT | | | SECURITY DESCRIPTION | | VALUE | |
| | |
| | |
| | | | Media — continued | | | | |
| | 7,000 | | | 5.63%, 04/15/2022 (e) | | | 7,157 | |
| | 15,000 | | | 6.75%, 04/15/2022 (e) | | | 15,572 | |
| | | | | | | | |
| | | | | | | 1,303,634 | |
| | | | | | | | |
| | | | Specialty Retail — 0.8% | |
| | EUR 100,000 | | | EVOCA SpA, (Italy), Reg. S, 7.00%, 10/15/2023 | | | 129,733 | |
| | 6,000 | | | L Brands, Inc., 5.25%, 02/01/2028 | | | 5,775 | |
| | | | PetSmart, Inc., | | | | |
| | 2,000 | | | 5.88%, 06/01/2025 (e) | | | 1,560 | |
| | 13,000 | | | 7.13%, 03/15/2023 (e) | | | 8,286 | |
| | 5,000 | | | 8.88%, 06/01/2025 (e) | | | 3,188 | |
| | 13,000 | | | Sally Holdings LLC, 5.50%, 11/01/2023 | | | 13,000 | |
| | | | Sonic Automotive, Inc., | | | | |
| | 27,000 | | | 5.00%, 05/15/2023 | | | 25,852 | |
| | 2,000 | | | 6.13%, 03/15/2027 | | | 1,975 | |
| | 25,000 | | | Staples, Inc., 8.50%, 09/15/2025 (e) | | | 24,000 | |
| | | | | | | | |
| | | | | | | 213,369 | |
| | | | | | | | |
| | | | Textiles, Apparel & Luxury Goods — 0.1% | |
| | 15,000 | | | Hanesbrands, Inc., 4.63%, 05/15/2024 (e) | | | 14,850 | |
| | | | | | | | |
| | | | Total Consumer Discretionary | | | 2,709,525 | |
| | | | | | | | |
| | | | Consumer Staples — 2.1% | | | | |
| | | | Beverages — 0.1% | | | | |
| | 30,000 | | | Anheuser-Busch InBev Finance, Inc., (Belgium), 4.90%, 02/01/2046 | | | 31,986 | |
| | 3,000 | | | Cott Holdings, Inc., (Canada),
5.50%, 04/01/2025 (e) | | | 2,988 | |
| | | | | | | | |
| | | | | | | 34,974 | |
| | | | | | | | |
| | | | Food & Staples Retailing — 0.4% | |
| | | | Albertsons Cos. LLC, | | | | |
| | 2,000 | | | 5.75%, 03/15/2025 | | | 1,740 | |
| | 21,000 | | | 6.63%, 06/15/2024 | | | 19,346 | |
| | 20,000 | | | Kroger Co. (The), 4.45%, 02/01/2047 | | | 18,817 | |
| | | | New Albertson’s, Inc., | | | | |
| | 4,000 | | | 7.45%, 08/01/2029 | | | 3,320 | |
| | 5,000 | | | 8.00%, 05/01/2031 | | | 4,288 | |
| | 8,000 | | | 8.70%, 05/01/2030 | | | 7,240 | |
| | | | SUPERVALU, Inc., | | | | |
| | 25,000 | | | 6.75%, 06/01/2021 | | | 24,688 | |
| | 31,000 | | | 7.75%, 11/15/2022 | | | 30,070 | |
| | | | | | | | |
| | | | | | | 109,509 | |
| | | | | | | | |
| | | | Food Products — 0.7% | |
| | 10,000 | | | B&G Foods, Inc., 5.25%, 04/01/2025 | | | 9,625 | |
| | 11,000 | | | Dean Foods Co., 6.50%, 03/15/2023 (e) | | | 10,752 | |
| | 11,000 | | | Dole Food Co., Inc., 7.25%, 06/15/2025 (e) | | | 11,522 | |
| | | | JBS USA LUX SA, (Brazil), | | | | |
| | 13,000 | | | 5.88%, 07/15/2024 (e) | | | 12,678 | |
SEE NOTES TO FINANCIAL STATEMENTS.
11
JPMorgan Flexible Long/Short Fund
SCHEDULE OF PORTFOLIO INVESTMENTS
AS OF FEBRUARY 28, 2018 (continued)
(Amounts in U.S. Dollars, unless otherwise noted)
| | | | | | | | |
PRINCIPAL
AMOUNT | | | SECURITY DESCRIPTION | | VALUE | |
| | |
| | Corporate Bonds — continued | | | | |
| |
| | | | Food Products — continued | |
| | 10,000 | | | 6.75%, 02/15/2028 (e) | | | 9,902 | |
| | 23,000 | | | 7.25%, 06/01/2021 (e) | | | 23,287 | |
| | 20,000 | | | Kraft Heinz Foods Co., 4.38%, 06/01/2046 | | | 18,169 | |
| | | | Lamb Weston Holdings, Inc., | | | | |
| | 3,000 | | | 4.63%, 11/01/2024 (e) | | | 3,015 | |
| | 3,000 | | | 4.88%, 11/01/2026 (e) | | | 3,000 | |
| | | | Pilgrim’s Pride Corp., | | | | |
| | 7,000 | | | 5.75%, 03/15/2025 (e) | | | 6,965 | |
| | 5,000 | | | 5.88%, 09/30/2027 (e) | | | 4,863 | |
| | | | Post Holdings, Inc., | | | | |
| | 18,000 | | | 5.00%, 08/15/2026 (e) | | | 17,100 | |
| | 4,000 | | | 5.50%, 03/01/2025 (e) | | | 4,025 | |
| | 4,000 | | | 5.75%, 03/01/2027 (e) | | | 3,950 | |
| | | | Smithfield Foods, Inc., | | | | |
| | 25,000 | | | 3.35%, 02/01/2022 (e) | | | 24,566 | |
| | 15,000 | | | 4.25%, 02/01/2027 (e) | | | 14,842 | |
| | | | | | | | |
| | | | | | | 178,261 | |
| | | | | | | | |
| | | | Household Products — 0.1% | |
| | 9,000 | | | Central Garden & Pet Co., 6.13%, 11/15/2023 | | | 9,394 | |
| | 4,000 | | | Kronos Acquisition Holdings, Inc., (Canada), 9.00%, 08/15/2023 (e) | | | 3,880 | |
| | 28,000 | | | Spectrum Brands, Inc., 6.13%, 12/15/2024 | | | 29,330 | |
| | | | | | | | |
| | | | | | | 42,604 | |
| | | | | | | | |
| | | | Personal Products — 0.1% | |
| | 9,000 | | | Prestige Brands, Inc., 6.38%, 03/01/2024 (e) | | | 9,281 | |
| | 12,000 | | | Revlon Consumer Products Corp., 6.25%, 08/01/2024 | | | 8,250 | |
| | | | | | | | |
| | | | | | | 17,531 | |
| | | | | | | | |
| | | | Tobacco — 0.7% | |
| | 50,000 | | | Altria Group, Inc., 4.25%, 08/09/2042 | | | 49,448 | |
| | | | BAT Capital Corp., (United Kingdom), | | | | |
| | 65,000 | | | 3.56%, 08/15/2027 (e) | | | 62,137 | |
| | 30,000 | | | 4.39%, 08/15/2037 (e) | | | 29,483 | |
| | | | Philip Morris International, Inc., | | | | |
| | 40,000 | | | 4.25%, 11/10/2044 | | | 39,817 | |
| | 10,000 | | | 4.38%, 11/15/2041 | | | 10,095 | |
| | | | | | | | |
| | | | | | | 190,980 | |
| | | | | | | | |
| | | | Total Consumer Staples | | | 573,859 | |
| | | | | | | | |
| | | | Energy — 5.7% | | | | |
| | | | Energy Equipment & Services — 0.5% | | | | |
| | 42,000 | | | Baker Hughes a GE Co. LLC, 3.34%, 12/15/2027 | | | 40,096 | |
| | 3,000 | | | Bristow Group, Inc.,
8.75%, 03/01/2023 (e) | | | 3,051 | |
| | | | | | | | |
PRINCIPAL
AMOUNT | | | SECURITY DESCRIPTION | | VALUE | |
| | |
| |
| | | | Energy Equipment & Services — continued | |
| | 5,000 | | | Diamond Offshore Drilling, Inc., 7.88%, 08/15/2025 | | | 5,075 | |
| | 2,000 | | | Ensco plc, 5.20%, 03/15/2025 | | | 1,660 | |
| | | | Nabors Industries, Inc., | | | | |
| | 13,000 | | | 5.50%, 01/15/2023 | | | 12,902 | |
| | 7,000 | | | 5.75%, 02/01/2025 (e) | | | 6,681 | |
| | 6,000 | | | Noble Holding International Ltd.,
(United Kingdom), 7.88%, 02/01/2026 (e) | | | 6,030 | |
| | 6,000 | | | Parker Drilling Co., 6.75%, 07/15/2022 | | | 4,980 | |
| | 3,000 | | | Precision Drilling Corp., (Canada), 7.13%, 01/15/2026 (e) | | | 3,026 | |
| | 8,000 | | | Rowan Cos., Inc., 7.38%, 06/15/2025 | | | 7,900 | |
| | 18,000 | | | Shelf Drilling Holdings Ltd., (United Arab Emirates), 8.25%, 02/15/2025 (e) | | | 18,135 | |
| | 11,700 | | | Transocean Proteus Ltd., 6.25%, 12/01/2024 (e) | | | 12,037 | |
| | | | Transocean, Inc., | | | | |
| | 5,000 | | | 6.80%, 03/15/2038 | | | 4,025 | |
| | 5,000 | | | 7.50%, 01/15/2026 (e) | | | 5,038 | |
| | 9,000 | | | 9.00%, 07/15/2023 (e) | | | 9,697 | |
| | 15,000 | | | Weatherford International Ltd., 6.75%, 09/15/2040 | | | 11,437 | |
| | | | | | | | |
| | | | | | | 151,770 | |
| | | | | | | | |
| | | | Oil, Gas & Consumable Fuels — 5.2% | |
| | 30,000 | | | Anadarko Petroleum Corp., 3.45%, 07/15/2024 | | | 29,369 | |
| | 10,000 | | | Antero Resources Corp., 5.13%, 12/01/2022 | | | 10,087 | |
| | 73,000 | | | Boardwalk Pipelines LP, 5.95%, 06/01/2026 | | | 78,988 | |
| | 40,000 | | | Buckeye Partners LP, 4.35%, 10/15/2024 | | | 40,275 | |
| | 4,000 | | | California Resources Corp., 8.00%, 12/15/2022 (e) | | | 3,165 | |
| | | | Cenovus Energy, Inc., (Canada), | | | | |
| | 35,000 | | | 5.20%, 09/15/2043 | | | 33,652 | |
| | 9,000 | | | 6.75%, 11/15/2039 | | | 10,320 | |
| | 13,000 | | | Chesapeake Energy Corp., 8.00%, 01/15/2025 (e) | | | 12,837 | |
| | 5,000 | | | CITGO Petroleum Corp., 6.25%, 08/15/2022 (e) | | | 5,006 | |
| | 10,000 | | | Concho Resources, Inc., 4.88%, 10/01/2047 | | | 10,326 | |
| | | | Continental Resources, Inc., | | | | |
| | 5,000 | | | 3.80%, 06/01/2024 | | | 4,856 | |
| | 5,000 | | | 4.38%, 01/15/2028 (e) | | | 4,860 | |
| | 22,000 | | | 4.50%, 04/15/2023 | | | 22,275 | |
| | 26,000 | | | DCP Midstream Operating LP, 3.88%, 03/15/2023 | | | 25,350 | |
SEE NOTES TO FINANCIAL STATEMENTS.
12
JPMorgan Flexible Long/Short Fund
SCHEDULE OF PORTFOLIO INVESTMENTS
AS OF FEBRUARY 28, 2018 (continued)
(Amounts in U.S. Dollars, unless otherwise noted)
| | | | | | | | |
PRINCIPAL
AMOUNT | | | SECURITY DESCRIPTION | | VALUE | |
| | |
| | Corporate Bonds — continued | | | | |
| |
| | | | Oil, Gas & Consumable Fuels — continued | |
| | 20,000 | | | Enbridge, Inc., (Canada), (ICE LIBOR USD 3 Month + 3.64%), 1.00%, 03/01/2078 (aa) | | | 20,042 | |
| | 21,000 | | | Energy Transfer Equity LP, 5.88%, 01/15/2024 | | | 22,260 | |
| | 65,000 | | | Enterprise Products Operating LLC, Series E, (ICE LIBOR USD 3 Month + 3.03%), 5.25%, 08/16/2077 (aa) | | | 62,725 | |
| | 16,000 | | | EP Energy LLC, 9.38%, 05/01/2024 (e) | | | 11,800 | |
| | 55,000 | | | EQT Corp., 3.00%, 10/01/2022 | | | 53,552 | |
| | 14,000 | | | Genesis Energy LP, 6.00%, 05/15/2023 | | | 13,961 | |
| | 2,000 | | | Gulfport Energy Corp.,
6.38%, 01/15/2026 (e) | | | 1,971 | |
| | 10,000 | | | Hess Corp., 6.00%, 01/15/2040 | | | 10,602 | |
| | 39,000 | | | Hilcorp Energy I LP, 5.00%, 12/01/2024 (e) | | | 39,195 | |
| | | | MEG Energy Corp., (Canada), | | | | |
| | 3,000 | | | 6.38%, 01/30/2023 (e) | | | 2,572 | |
| | 2,000 | | | 7.00%, 03/31/2024 (e) | | | 1,705 | |
| | 10,000 | | | MPLX LP, 5.20%, 03/01/2047 | | | 10,284 | |
| | 35,000 | | | Noble Energy, Inc., 3.85%, 01/15/2028 | | | 34,231 | |
| | 5,000 | | | Oasis Petroleum, Inc., 6.88%, 03/15/2022 | | | 5,122 | |
| | 45,000 | | | ONEOK Partners LP, 6.13%, 02/01/2041 | | | 51,235 | |
| | | | Petrobras Global Finance BV, (Brazil), | | | | |
| | 40,000 | | | Reg. S, 6.00%, 01/27/2028 | | | 39,400 | |
| | 6,000 | | | 6.85%, 06/05/2115 | | | 5,655 | |
| | 35,000 | | | Phillips 66 Partners LP, 3.75%, 03/01/2028 | | | 34,009 | |
| | | | QEP Resources, Inc., | | | | |
| | 20,000 | | | 5.25%, 05/01/2023 | | | 19,850 | |
| | 2,000 | | | 5.63%, 03/01/2026 | | | 1,967 | |
| | EUR 100,000 | | | Repsol International Finance BV, (Spain), Reg. S, (EUR Swap Annual 10 Year + 4.20%), 4.50%, 03/25/2075 (aa) | | | 134,710 | |
| | 15,000 | | | Rockies Express Pipeline LLC, 6.00%, 01/15/2019 (e) | | | 15,338 | |
| | 11,000 | | | SemGroup Corp., 5.63%, 07/15/2022 | | | 10,890 | |
| | 10,000 | | | SM Energy Co., 5.63%, 06/01/2025 | | | 9,500 | |
| | 10,000 | | | Summit Midstream Holdings LLC, 5.50%, 08/15/2022 | | | 10,088 | |
| | 25,000 | | | Sunoco Logistics Partners Operations LP, 5.30%, 04/01/2044 | | | 24,257 | |
| | | | Sunoco LP, | | | | |
| | 2,000 | | | 4.88%, 01/15/2023 (e) | | | 1,985 | |
| | 3,000 | | | 5.50%, 02/15/2026 (e) | | | 3,000 | |
| | 25,000 | | | Tallgrass Energy Partners LP, 5.50%, 09/15/2024 (e) | | | 25,750 | |
| | 5,000 | | | Targa Resources Partners LP, 5.00%, 01/15/2028 (e) | | | 4,856 | |
| | | | | | | | |
PRINCIPAL
AMOUNT | | | SECURITY DESCRIPTION | | VALUE | |
| | |
| | |
| | | | Oil, Gas & Consumable Fuels — continued | | | | |
| | 5,000 | | | 5.13%, 02/01/2025 | | | 4,982 | |
| | 31,000 | | | Tecpetrol SA, (Argentina), 4.88%, 12/12/2022 (e) | | | 30,109 | |
| | 21,000 | | | TerraForm Power Operating LLC, | | | 20,580 | |
| | | | 4.25%, 01/31/2023 (e) | | | | |
| | 5,000 | | | 5.00%, 01/31/2028 (e) | | | 4,839 | |
| | 48,000 | | | SUB, 6.63%, 06/15/2025 (e) | | | 51,960 | |
| | EUR 100,000 | | | TOTAL SA, (France), Reg. S, (EUR Swap Annual 5 Year + 1.86%), 2.25%, 02/26/2021 (x) (y) (aa) | | | 126,881 | |
| | | | Ultra Resources, Inc., | | | | |
| | 11,000 | | | 6.88%, 04/15/2022 (e) | | | 9,900 | |
| | 3,000 | | | 7.13%, 04/15/2025 (e) | | | 2,685 | |
| | 50,000 | | | Western Gas Partners LP, 4.65%, 07/01/2026 | | | 50,783 | |
| | | | Whiting Petroleum Corp., | | | | |
| | 8,000 | | | 5.75%, 03/15/2021 | | | 8,180 | |
| | 6,000 | | | 6.63%, 01/15/2026 (e) | | | 6,083 | |
| | 49,000 | | | Williams Cos., Inc. (The), 3.70%, 01/15/2023 | | | 47,591 | |
| | 40,000 | | | YPF SA, (Argentina), Reg. S, 8.75%, 04/04/2024 | | | 44,400 | |
| | | | | | | | |
| | | | | | | 1,382,851 | |
| | | | | | | | |
| | | | Total Energy | | | 1,534,621 | |
| | | | | | | | |
| | | | Financials — 21.3% | | | | |
| | | | Banks — 11.9% | | | | |
| | EUR 100,000 | | | Allied Irish Banks plc, (Ireland), Reg. S, (EUR Swap Annual 5 Year + 3.95%), 4.13%, 11/26/2025 (aa) | | | 131,707 | |
| | EUR 200,000 | | | Banco Bilbao Vizcaya Argentaria SA, (Spain), Reg. S, (EUR Swap Annual 5 Year + 9.18%), 8.88%, 04/14/2021 (x) (y) (aa) | | | 292,116 | |
| | | | Bank of America Corp., | | | | |
| | 55,000 | | | (ICE LIBOR USD 3 Month + 0.77%), 2.56%, 02/05/2026 (aa) | | | 54,591 | |
| | 55,000 | | | (ICE LIBOR USD 3 Month + 0.79%), 3.00%, 12/20/2023 (aa) (e) | | | 53,815 | |
| | 225,000 | | | Series X, (ICE LIBOR USD 3 Month + 3.71%), 6.25%, 09/05/2024 (x) (y) (aa) | | | 241,920 | |
| | EUR 100,000 | | | Bank of Ireland, (Ireland), Reg. S, (EUR Swap Annual 5 Year + 3.55%), 4.25%, 06/11/2024 (aa) | | | 127,547 | |
| | EUR 100,000 | | | Bankia SA, (Spain), Reg. S, (EUR Swap Annual 5 Year + 3.35%), 3.38%, 03/15/2027 (aa) | | | 129,371 | |
| | EUR 100,000 | | | Bankinter SA, (Spain), Reg. S, (EUR Swap Annual 5 Year + 2.40%), 2.50%, 04/06/2027 (aa) | | | 125,494 | |
SEE NOTES TO FINANCIAL STATEMENTS.
13
JPMorgan Flexible Long/Short Fund
SCHEDULE OF PORTFOLIO INVESTMENTS
AS OF FEBRUARY 28, 2018 (continued)
(Amounts in U.S. Dollars, unless otherwise noted)
| | | | | | | | |
PRINCIPAL
AMOUNT | | | SECURITY DESCRIPTION | | VALUE | |
| | |
| | Corporate Bonds — continued | | | | |
| | |
| | | | Banks — continued | | | | |
| | EUR 100,000 | | | CaixaBank SA, (Spain), Reg. S, (EUR Swap Annual 5 Year + 3.35%), 3.50%, 02/15/2027 (aa) | | | 130,169 | |
| | | | CIT Group, Inc., | | | | |
| | 24,000 | | | 5.00%, 08/15/2022 | | | 24,750 | |
| | 3,000 | | | 5.38%, 05/15/2020 | | | 3,101 | |
| | | | Citigroup, Inc., | | | | |
| | 60,000 | | | 4.30%, 11/20/2026 (x) (y) | | | 60,661 | |
| | 225,000 | | | Series P, (ICE LIBOR USD 3 Month + 3.91%), 5.95%, 05/15/2025 (x) (y) (aa) | | | 233,887 | |
| | 18,000 | | | Series R, (ICE LIBOR USD 3 Month + 4.48%), 6.13%, 11/15/2020 (x) (y) (aa) | | | 19,024 | |
| | EUR 50,000 | | | Commerzbank AG, (Germany), Reg. S, 4.00%, 03/23/2026 | | | 68,889 | |
| | 200,000 | | | Credit Agricole SA, (France), (USD Swap Semi 5 Year + 6.19%), 8.12%, 12/23/2025 (e) (x) (y) (aa) | | | 234,000 | |
| | 200,000 | | | HSBC Holdings plc, (United Kingdom), (USD ICE Swap Rate 5 Year + 5.51%), 6.87%, 06/01/2021 (x) (y) (aa) | | | 214,000 | |
| | 50,000 | | | Huntington Bancshares, Inc., Series E, (ICE LIBOR USD 3 Month + 2.88%), 5.70%, 04/15/2023 (x) (y) (aa) | | | 50,375 | |
| | | | ING Groep NV, (Netherlands), | | | | |
| | EUR 100,000 | | | (EUR Swap Annual 5 Year + 2.85%), 3.00%, 04/11/2028 (aa) | | | 132,613 | |
| | 200,000 | | | Reg. S, (USD Swap Semi 5 Year + 5.12%), 6.87%, 04/16/2022 (x) (y) (aa) | | | 212,977 | |
| | 200,000 | | | Intesa Sanpaolo SpA, (Italy), (USD Swap Semi 5 Year + 5.46%), 7.70%, 09/17/2025 (e) (x) (y) (aa) | | | 217,750 | |
| | 20,000 | | | Royal Bank of Scotland Group plc, (United Kingdom), 6.00%, 12/19/2023 | | | 21,354 | |
| | EUR 100,000 | | | Societe Generale SA, (France), Reg. S, (EUR Swap Annual 5 Year + 5.54%), 6.75%, 04/07/2021 (x) (y) (aa) | | | 137,403 | |
| | 65,000 | | | SunTrust Banks, Inc., Series H, (ICE LIBOR USD 3 Month + 2.79%), 5.13%, 12/15/2027 (x) (y) (aa) | | | 62,278 | |
| | 25,000 | | | Toronto-Dominion Bank (The), (Canada), (USD Swap Semi 5 Year + 2.21%), 3.62%, 09/15/2031 (aa) | | | 24,053 | |
| | EUR 100,000 | | | UniCredit SpA, (Italy), Reg. S, (EUR Swap Annual 5 Year + 4.32%), 4.38%, 01/03/2027 (aa) | | | 132,722 | |
| | 50,000 | | | Wells Fargo & Co., 4.75%, 12/07/2046 | | | 51,894 | |
| | | | | | | | |
| | | | | | | 3,188,461 | |
| | | | | | | | |
| | | | | | | | |
PRINCIPAL
AMOUNT | | | SECURITY DESCRIPTION | | VALUE | |
| | |
| | |
| | | | Capital Markets — 5.4% | | | | |
| | | | Bank of New York Mellon Corp. (The), | | | | |
| | 50,000 | | | Series E, (ICE LIBOR USD 3 Month + 3.42%), 4.95%, 06/20/2020 (x) (y) (aa) | | | 51,187 | |
| | 94,000 | | | Series F, (ICE LIBOR USD 3 Month + 3.13%), 4.62%, 09/20/2026 (x) (y) (aa) | | | 93,225 | |
| | 200,000 | | | Credit Suisse Group AG, (Switzerland), (USD Swap Semi 5 Year + 4.60%), 7.50%, 12/11/2023 (e) (x) (y) (aa) | | | 221,960 | |
| | | | Goldman Sachs Group, Inc. (The), | | | | |
| | 35,000 | | | (ICE LIBOR USD 3 Month + 1.16%), 3.81%, 04/23/2029 (aa) | | | 34,175 | |
| | 15,000 | | | (ICE LIBOR USD 3 Month + 1.37%), 4.02%, 10/31/2038 (aa) | | | 14,495 | |
| | 225,000 | | | Series M, (ICE LIBOR USD 3 Month + 3.92%), 5.38%, 05/10/2020 (x) (y) (aa) | | | 230,033 | |
| | 120,000 | | | Series P, (ICE LIBOR USD 3 Month + 2.87%), 5.00%, 11/10/2022 (x) (y) (aa) | | | 116,715 | |
| | 7,000 | | | LPL Holdings, Inc., 5.75%, 09/15/2025 (e) | | | 7,088 | |
| | | | Morgan Stanley, | | | | |
| | EUR 50,000 | | | 2.38%, 03/31/2021 | | | 64,934 | |
| | 30,000 | | | 3.13%, 07/27/2026 | | | 28,455 | |
| | 20,000 | | | (ICE LIBOR USD 3 Month + 1.14%), 3.77%, 01/24/2029 (aa) | | | 19,570 | |
| | 50,000 | | | 3.88%, 01/27/2026 | | | 50,122 | |
| | 225,000 | | | Series H, (ICE LIBOR USD 3 Month + 3.61%), 5.45%, 07/15/2019 (x) (y) (aa) | | | 230,288 | |
| | 18,000 | | | MSCI, Inc., 5.25%, 11/15/2024 (e) | | | 18,392 | |
| EUR
200,000 |
| | UBS Group AG, (Switzerland), Reg. S, (EUR Swap Annual 5 Year + 5.29%), 5.75%, 02/19/2022 (x) (y) (aa) | | | 274,167 | |
| | | | | | | | |
| | | | | | | 1,454,806 | |
| | | | | | | | |
| | |
| | | | Consumer Finance — 1.2% | | | | |
| | | | Ally Financial, Inc., | | | | |
| | 43,000 | | | 4.63%, 03/30/2025 | | | 43,215 | |
| | 10,000 | | | 8.00%, 11/01/2031 | | | 12,400 | |
| | 50,000 | | | Capital One Financial Corp., 3.75%, 04/24/2024 | | | 50,145 | |
| | 3,000 | | | FirstCash, Inc., 5.38%, 06/01/2024 (e) | | | 3,094 | |
| | 10,000 | | | General Motors Financial Co., Inc., 3.95%, 04/13/2024 | | | 9,976 | |
| EUR
100,000 |
| | Lincoln Finance Ltd., (Netherlands), Reg. S, 6.88%, 04/15/2021 | | | 126,785 | |
| | 42,000 | | | Springleaf Finance Corp., 8.25%, 12/15/2020 | | | 45,780 | |
| | 28,000 | | | Synchrony Financial, 3.95%, 12/01/2027 | | | 26,880 | |
| | | | | | | | |
| | | | | | | 318,275 | |
| | | | | | | | |
SEE NOTES TO FINANCIAL STATEMENTS.
14
JPMorgan Flexible Long/Short Fund
SCHEDULE OF PORTFOLIO INVESTMENTS
AS OF FEBRUARY 28, 2018 (continued)
(Amounts in U.S. Dollars, unless otherwise noted)
| | | | | | | | |
PRINCIPAL
AMOUNT | | | SECURITY DESCRIPTION | | VALUE | |
| | |
| | Corporate Bonds — continued | | | | |
| |
| | | | Diversified Financial Services — 1.9% | |
| | 10,000 | | | ACE Cash Express, Inc., 12.00%, 12/15/2022 (e) | | | 10,850 | |
| | 10,000 | | | CNG Holdings, Inc., 9.38%, 05/15/2020 (e) | | | 9,750 | |
| | 200,000 | | | EDP Finance BV, (Portugal), 5.25%, 01/14/2021 (e) | | | 210,467 | |
| | | | Nationstar Mortgage LLC, | | | | |
| | 37,000 | | | 6.50%, 07/01/2021 | | | 37,810 | |
| | 20,000 | | | 7.88%, 10/01/2020 | | | 20,525 | |
| | GBP 100,000 | | | Nationwide Building Society, (United Kingdom), Reg. S, (GBP Swap 5 Year + 4.88%), 6.88%, 06/20/2019 (x) (y) (aa) | | | 144,381 | |
| | 65,000 | | | Shell International Finance BV, (Netherlands), 4.13%, 05/11/2035 | | | 67,045 | |
| | | | | | | | |
| | | | | | | 500,828 | |
| | | | | | | | |
| | | | Insurance — 0.7% | | | | |
| | 130,000 | | | American International Group, Inc., 3.90%, 04/01/2026 | | | 129,347 | |
| | 5,000 | | | CNO Financial Group, Inc., 5.25%, 05/30/2025 | | | 5,075 | |
| | 30,000 | | | MetLife, Inc., 4.72%, 12/15/2044 | | | 32,372 | |
| | GBP 9,000 | | | Zurich Finance UK plc, (Switzerland), (U.K. Government Bonds 5 Year Note Generic Bid Yield + 2.85%), 6.62%, 10/02/2022 (x) (y) (aa) | | | 14,372 | |
| | | | | | | | |
| | | | | | | 181,166 | |
| | | | | | | | |
| | | | Thrifts & Mortgage Finance — 0.2% | |
| | 7,000 | | | Ladder Capital Finance Holdings LLLP, 5.25%, 03/15/2022 (e) | | | 7,052 | |
| | 3,000 | | | 5.25%, 10/01/2025 (e) | | | 2,918 | |
| | 21,000 | | | Quicken Loans, Inc., 5.75%, 05/01/2025 (e) | | | 21,158 | |
| | 14,000 | | | Radian Group, Inc., 4.50%, 10/01/2024 | | | 13,969 | |
| | | | | | | | |
| | | | | | | 45,097 | |
| | | | | | | | |
| | | | Total Financials | | | 5,688,633 | |
| | | | | | | | |
| | | | Health Care — 3.9% | | | | |
| | | | Biotechnology — 0.2% | | | | |
| | 40,000 | | | AbbVie, Inc., 4.30%, 05/14/2036 | | | 40,336 | |
| | | | | | | | |
| |
| | | | Health Care Equipment & Supplies — 0.2% | |
| | | | Hologic, Inc., | | | | |
| | 12,000 | | | 4.38%, 10/15/2025 (e) | | | 11,715 | |
| | 6,000 | | | 4.63%, 02/01/2028 (e) | | | 5,790 | |
| | | | Mallinckrodt International Finance SA, | | | | |
| | 35,000 | | | 3.50%, 04/15/2018 | | | 34,738 | |
| | 13,000 | | | 5.63%, 10/15/2023 (e) | | | 10,871 | |
| | | | | | | | |
| | | | | | | 63,114 | |
| | | | | | | | |
| | | | | | | | |
PRINCIPAL
AMOUNT | | | SECURITY DESCRIPTION | | VALUE | |
| | |
| |
| | | | Health Care Providers & Services — 2.1% | |
| | 25,000 | | | Acadia Healthcare Co., Inc., 6.50%, 03/01/2024 | | | 25,812 | |
| | | | Centene Corp., | | | | |
| | 5,000 | | | 4.75%, 01/15/2025 | | | 4,972 | |
| | 11,000 | | | 6.13%, 02/15/2024 | | | 11,550 | |
| | | | Community Health Systems, Inc., | | | | |
| | 3,000 | | | 5.13%, 08/01/2021 | | | 2,768 | |
| | 12,000 | | | 6.25%, 03/31/2023 | | | 10,920 | |
| | 5,000 | | | 7.13%, 07/15/2020 | | | 4,206 | |
| | EUR 100,000 | | | Constantin Investissement 3 SASU, (France), Reg. S, 5.38%, 04/15/2025 | | | 121,855 | |
| | | | DaVita, Inc., | | | | |
| | 50,000 | | | 5.00%, 05/01/2025 | | | 49,000 | |
| | 33,000 | | | 5.13%, 07/15/2024 | | | 32,773 | |
| | 24,000 | | | Envision Healthcare Corp., 5.63%, 07/15/2022 | | | 24,480 | |
| | | | HCA, Inc., | | | | |
| | 54,000 | | | 5.00%, 03/15/2024 | | | 55,013 | |
| | 10,000 | | | 5.50%, 06/15/2047 | | | 9,875 | |
| | 29,000 | | | 5.88%, 03/15/2022 | | | 30,740 | |
| | 21,000 | | | 5.88%, 05/01/2023 | | | 22,081 | |
| | 16,000 | | | 5.88%, 02/15/2026 | | | 16,560 | |
| | 20,000 | | | MPH Acquisition Holdings LLC, 7.13%, 06/01/2024 (e) | | | 21,050 | |
| | 7,000 | | | Polaris Intermediate Corp., , 8.50%, (cash), 12/01/2022(e) (v) | | | 7,127 | |
| | 20,000 | | | Team Health Holdings, Inc., 6.38%, 02/01/2025 (e) | | | 18,300 | |
| | | | Tenet Healthcare Corp., | | | | |
| | 20,000 | | | 4.38%, 10/01/2021 | | | 19,900 | |
| | 6,000 | | | 4.63%, 07/15/2024 (e) | | | 5,741 | |
| | 25,000 | | | 5.13%, 05/01/2025 (e) | | | 24,250 | |
| | 39,000 | | | 6.75%, 06/15/2023 | | | 39,000 | |
| | 2,000 | | | 7.00%, 08/01/2025 (e) | | | 1,995 | |
| | 10,000 | | | WellCare Health Plans, Inc., 5.25%, 04/01/2025 | | | 10,121 | |
| | | | | | | | |
| | | | | | | 570,089 | |
| | | | | | | | |
| | | | Health Care Technology — 0.5% | | | | |
| | | | Quintiles IMS, Inc., | | | | |
| | EUR 100,000 | | | Reg. S, 3.25%, 03/15/2025 | | | 123,075 | |
| | 11,000 | | | 4.88%, 05/15/2023 (e) | | | 11,302 | |
| | | | | | | | |
| | | | | | | 134,377 | |
| | | | | | | | |
| | | | Pharmaceuticals — 0.9% | | | | |
| | 40,000 | | | Allergan Funding SCS, 3.80%, 03/15/2025 | | | 39,471 | |
| | 2,000 | | | Catalent Pharma Solutions, Inc., 4.88%, 01/15/2026 (e) | | | 1,980 | |
| | 32,000 | | | Concordia International Corp., (Canada),
7.00%, 04/15/2023 (d) (e) | | | 2,880 | |
SEE NOTES TO FINANCIAL STATEMENTS.
15
JPMorgan Flexible Long/Short Fund
SCHEDULE OF PORTFOLIO INVESTMENTS
AS OF FEBRUARY 28, 2018 (continued)
(Amounts in U.S. Dollars, unless otherwise noted)
| | | | | | | | |
PRINCIPAL
AMOUNT | | | SECURITY DESCRIPTION | | VALUE | |
| | |
| | Corporate Bonds — continued | | | | |
| | |
| | | | Pharmaceuticals — continued | | | | |
| | 2,000 | | | 9.00%, 04/01/2022 (e) | | | 1,830 | |
| | 20,000 | | | Endo Finance LLC, 5.75%, 01/15/2022 (e) | | | 16,350 | |
| | 50,000 | | | Mylan NV, 3.95%, 06/15/2026 | | | 48,362 | |
| | 65,000 | | | Teva Pharmaceutical Finance Netherlands III BV, (Israel), 3.15%, 10/01/2026 | | | 52,731 | |
| | | | Valeant Pharmaceuticals International, Inc., | | | | |
| | 9,000 | | | 5.50%, 11/01/2025 (e) | | | 8,904 | |
| | 3,000 | | | 5.88%, 05/15/2023 (e) | | | 2,666 | |
| | 8,000 | | | 6.50%, 03/15/2022 (e) | | | 8,320 | |
| | 30,000 | | | 6.75%, 08/15/2021 (e) | | | 29,250 | |
| | 6,000 | | | 7.00%, 03/15/2024 (e) | | | 6,323 | |
| | 8,000 | | | 9.00%, 12/15/2025 (e) | | | 8,015 | |
| | | | | | | | |
| | | | | | | 227,082 | |
| | | | | | | | |
| | | | Total Health Care | | | 1,034,998 | |
| | | | | | | | |
| | | | Industrials — 7.9% | | | | |
| | | | Aerospace & Defense — 1.5% | | | | |
| | | | Arconic, Inc., | | | | |
| | 22,000 | | | 5.13%, 10/01/2024 | | | 22,687 | |
| | 94,000 | | | 5.90%, 02/01/2027 | | | 101,050 | |
| | 8,000 | | | 6.75%, 01/15/2028 | | | 9,120 | |
| | | | Bombardier, Inc., (Canada), | | | | |
| | 5,000 | | | 7.50%, 12/01/2024 (e) | | | 5,194 | |
| | 42,000 | | | 7.75%, 03/15/2020 (e) | | | 44,835 | |
| | 45,000 | | | Harris Corp., 5.05%, 04/27/2045 | | | 49,132 | |
| | EUR 100,000 | | | Leonardo SpA, (Italy), 4.88%, 03/24/2025 | | | 143,993 | |
| | | | TransDigm, Inc., | | | | |
| | 11,000 | | | 6.00%, 07/15/2022 | | | 11,261 | |
| | 11,000 | | | 6.38%, 06/15/2026 | | | 11,248 | |
| | | | | | | | |
| | | | | | | 398,520 | |
| | | | | | | | |
| | | | Airlines — 0.4% | | | | |
| | 79,743 | | | Continental Airlines Pass-Through Trust, Series 2012-2, Class A, 4.00%, 10/29/2024 | | | 81,538 | |
| | | | United Continental Holdings, Inc., | | | | |
| | 15,000 | | | 4.25%, 10/01/2022 | | | 14,953 | |
| | 15,000 | | | 5.00%, 02/01/2024 | | | 14,925 | |
| | | | | | | | |
| | | | | | | 111,416 | |
| | | | | | | | |
| | | | Building Products — 1.1% | | | | |
| | 3,000 | | | Airxcel, Inc., 8.50%, 02/15/2022 (e) | | | 3,124 | |
| | 5,000 | | | American Woodmark Corp., 4.88%, 03/15/2026 (e) | | | 4,962 | |
| | GBP 50,000 | | | Cie de Saint-Gobain, (France), Reg. S, 5.63%, 11/15/2024 | | | 82,695 | |
| | | | | | | | |
PRINCIPAL
AMOUNT | | | SECURITY DESCRIPTION | | VALUE | |
| | |
| | |
| | | | Building Products — continued | | | | |
| | | | Jeld-Wen, Inc., | | | | |
| | 2,000 | | | 4.63%, 12/15/2025 (e) | | | 1,955 | |
| | 2,000 | | | 4.88%, 12/15/2027 (e) | | | 1,940 | |
| | | | Masco Corp., | | | | |
| | 15,000 | | | 3.50%, 11/15/2027 | | | 14,325 | |
| | 65,000 | | | 4.38%, 04/01/2026 | | | 66,456 | |
| | | | Owens Corning, | | | | |
| | 45,000 | | | 3.40%, 08/15/2026 | | | 43,096 | |
| | 30,000 | | | 4.30%, 07/15/2047 | | | 27,602 | |
| | 22,000 | | | Standard Industries, Inc.,
6.00%, 10/15/2025 (e) | | | 23,238 | |
| | 19,000 | | | Summit Materials LLC, 6.13%, 07/15/2023 | | | 19,570 | |
| | | | | | | | |
| | | | | | | 288,963 | |
| | | | | | | | |
| | | | Commercial Services & Supplies — 0.8% | |
| | 3,000 | | | ACCO Brands Corp., 5.25%, 12/15/2024 (e) | | | 3,015 | |
| | 20,000 | | | ADT Corp. (The), 4.13%, 06/15/2023 | | | 19,450 | |
| | 8,000 | | | Aramark Services, Inc., 5.00%, 02/01/2028 (e) | | | 7,970 | |
| | 9,000 | | | Brink’s Co. (The), 4.63%, 10/15/2027 (e) | | | 8,527 | |
| | 15,000 | | | Covanta Holding Corp., 5.88%, 03/01/2024 | | | 15,038 | |
| | 25,000 | | | GW Honos Security Corp., (Canada), 8.75%, 05/15/2025 (e) | | | 26,906 | |
| | 24,000 | | | Prime Security Services Borrower LLC, 9.25%, 05/15/2023 (e) | | | 26,130 | |
| | EUR 90,000 | | | Verisure Holding AB, (Sweden), Reg. S, 6.00%, 11/01/2022 | | | 115,995 | |
| | | | | | | | |
| | | | | | | 223,031 | |
| | | | | | | | |
| | | | Construction & Engineering — 0.2% | |
| | 37,000 | | | AECOM, 5.88%, 10/15/2024 | | | 38,572 | |
| | 21,000 | | | Tutor Perini Corp., 6.88%, 05/01/2025 (e) | | | 22,050 | |
| | | | | | | | |
| | | | | | | 60,622 | |
| | | | | | | | |
| | | | Electrical Equipment — 0.8% | | | | |
| | 40,000 | | | Eaton Corp., 3.92%, 09/15/2047 | | | 37,867 | |
| | EUR 100,000 | | | Orano SA, (France), Reg. S, 3.13%, 03/20/2023 | | | 125,202 | |
| | | | Sensata Technologies BV, | | | | |
| | 5,000 | | | 4.88%, 10/15/2023 (e) | | | 5,075 | |
| | 19,000 | | | 5.63%, 11/01/2024 (e) | | | 20,312 | |
| | 33,000 | | | Vertiv Group Corp., 9.25%, 10/15/2024 (e) | | | 34,815 | |
| | | | | | | | |
| | | | | | | 223,271 | |
| | | | | | | | |
| | | | Industrial Conglomerates — 0.2% | | | | |
| | 60,000 | | | General Electric Co., 4.50%, 03/11/2044 | | | 59,436 | |
| | | | | | | | |
SEE NOTES TO FINANCIAL STATEMENTS.
16
JPMorgan Flexible Long/Short Fund
SCHEDULE OF PORTFOLIO INVESTMENTS
AS OF FEBRUARY 28, 2018 (continued)
(Amounts in U.S. Dollars, unless otherwise noted)
| | | | | | | | |
PRINCIPAL
AMOUNT | | | SECURITY DESCRIPTION | | VALUE | |
| | |
| | Corporate Bonds — continued | | | | |
| | |
| | | | Machinery — 0.3% | | | | |
| | 3,000 | | | Navistar International Corp., 6.63%, 11/01/2025 (e) | | | 3,090 | |
| | | | Novelis Corp., | | | | |
| | 5,000 | | | 5.88%, 09/30/2026 (e) | | | 5,037 | |
| | 10,000 | | | 6.25%, 08/15/2024 (e) | | | 10,225 | |
| | 7,000 | | | Oshkosh Corp., 5.38%, 03/01/2025 | | | 7,300 | |
| | 2,000 | | | RBS Global, Inc., 4.88%, 12/15/2025 (e) | | | 1,970 | |
| | 3,000 | | | Tennant Co., 5.63%, 05/01/2025 | | | 3,075 | |
| | 11,000 | | | Terex Corp., 5.63%, 02/01/2025 (e) | | | 11,110 | |
| | 17,000 | | | Wabash National Corp., 5.50%, 10/01/2025 (e) | | | 16,830 | |
| | 5,000 | | | Xylem, Inc., 4.38%, 11/01/2046 | | | 5,076 | |
| | | | | | | | |
| | | | | | | 63,713 | |
| | | | | | | | |
| | | | Professional Services — 0.6% | | | | |
| | 12,000 | | | AMN Healthcare, Inc., 5.13%, 10/01/2024 (e) | | | 12,120 | |
| | 6,000 | | | IHS Markit Ltd., 4.00%, 03/01/2026 (e) | | | 5,820 | |
| | EUR 100,000 | | | La Financiere Atalian SAS, (France), Reg. S, 4.00%, 05/15/2024 | | | 126,059 | |
| | | | | | | | |
| | | | | | | 143,999 | |
| | | | | | | | |
| | | | Road & Rail — 1.5% | | | | |
| | 5,000 | | | Avis Budget Car Rental LLC, 5.25%, 03/15/2025 (e) | | | 4,825 | |
| | | | DAE Funding LLC, (United Arab Emirates), | | | | |
| | 3,000 | | | 4.50%, 08/01/2022 (e) | | | 2,910 | |
| | 3,000 | | | 5.00%, 08/01/2024 (e) | | | 2,902 | |
| | EUR 125,000 | | | Europcar Groupe SA, (France), Reg. S, 5.75%, 06/15/2022 | | | 158,207 | |
| | GBP 39,985 | | | Great Rolling Stock Co. Ltd. (The), (United Kingdom), Reg. S, 6.88%, 07/27/2035 | | | 70,178 | |
| | EUR 100,000 | | | Loxam SAS, (France), Reg. S, 4.25%, 04/15/2024 | | | 128,971 | |
| | 15,000 | | | Norfolk Southern Corp., 4.15%, 02/28/2048 | | | 14,710 | |
| | | | Park Aerospace Holdings Ltd., (Ireland), | | | | |
| | 8,000 | | | 4.50%, 03/15/2023 (e) | | | 7,720 | |
| | 12,000 | | | 5.25%, 08/15/2022 (e) | | | 12,015 | |
| | | | | | | | |
| | | | | | | 402,438 | |
| | | | | | | | |
| | | | Trading Companies & Distributors — 0.4% | |
| | 18,000 | | | Aircastle Ltd., 7.63%, 04/15/2020 | | | 19,350 | |
| | 5,000 | | | H&E Equipment Services, Inc., 5.63%, 09/01/2025 (e) | | | 5,112 | |
| | 14,000 | | | HD Supply, Inc., 5.75%, 04/15/2024 (e) | | | 14,682 | |
| | | | United Rentals North America, Inc., | | | | |
| | 3,000 | | | 4.63%, 10/15/2025 | | | 2,925 | |
| | 5,000 | | | 4.88%, 01/15/2028 | | | 4,875 | |
| | 49,000 | | | 5.50%, 05/15/2027 | | | 50,152 | |
| | | | | | | | |
PRINCIPAL
AMOUNT | | | SECURITY DESCRIPTION | | VALUE | |
| | |
| | | | Trading Companies & Distributors — continued | |
| | 9,000 | | | WESCO Distribution, Inc., 5.38%, 06/15/2024 | | | 9,023 | |
| | | | | | | | |
| | | | | | | 106,119 | |
| | | | | | | | |
| | | | Transportation Infrastructure — 0.1% | |
| | GBP 15,000 | | | Autostrade per l’Italia SpA, (Italy), 6.25%, 06/09/2022 | | | 24,343 | |
| | | | | | | | |
| | | | Total Industrials | | | 2,105,871 | |
| | | | | | | | |
| | | | Information Technology — 2.1% | | | | |
| | | | Communications Equipment — 0.1% | |
| | 32,000 | | | Avaya, Inc., 7.00%, 04/01/2019 (d) (bb) | | | 3 | |
| | 17,000 | | | CommScope Technologies LLC, 5.00%, 03/15/2027 (e) | | | 16,575 | |
| | | | Nokia OYJ, (Finland), | | | | |
| | 5,000 | | | 3.38%, 06/12/2022 | | | 4,862 | |
| | 5,000 | | | 4.38%, 06/12/2027 | | | 4,800 | |
| | 12,000 | | | ViaSat, Inc., 5.63%, 09/15/2025 (e) | | | 11,730 | |
| | | | | | | | |
| | | | | | | 37,970 | |
| | | | | | | | |
| | | | Electronic Equipment, Instruments & Components — 0.4% | |
| | | | Anixter, Inc., | | | | |
| | 28,000 | | | 5.50%, 03/01/2023 | | | 29,190 | |
| | 32,000 | | | 5.63%, 05/01/2019 | | | 32,680 | |
| | 41,000 | | | CDW LLC, 5.50%, 12/01/2024 | | | 42,743 | |
| | 4,000 | | | Itron, Inc., 5.00%, 01/15/2026 (e) | | | 3,980 | |
| | | | | | | | |
| | | | | | | 108,593 | |
| | | | | | | | |
| | | | Internet Software & Services — 0.3% | |
| | 35,000 | | | Rackspace Hosting, Inc., 8.63%, 11/15/2024 (e) | | | 36,487 | |
| | | | Zayo Group LLC, | | | | |
| | 3,000 | | | 5.75%, 01/15/2027 (e) | | | 3,015 | |
| | 27,000 | | | 6.38%, 05/15/2025 | | | 28,249 | |
| | | | | | | | |
| | | | | | | 67,751 | |
| | | | | | | | |
| | | | IT Services — 0.3% | |
| | 30,000 | | | Alliance Data Systems Corp., 5.38%, 08/01/2022 (e) | | | 30,113 | |
| | | | First Data Corp., | | | | |
| | 30,000 | | | 5.00%, 01/15/2024 (e) | | | 30,188 | |
| | 20,000 | | | 5.75%, 01/15/2024 (e) | | | 20,350 | |
| | 10,000 | | | 7.00%, 12/01/2023 (e) | | | 10,512 | |
| | | | | | | | |
| | | | | | | 91,163 | |
| | | | | | | | |
| | | | Semiconductors & Semiconductor Equipment — 0.1% | |
| | 2,000 | | | Entegris, Inc., 4.63%, 02/10/2026 (e) | | | 1,965 | |
| | 10,000 | | | MagnaChip Semiconductor SA, (South Korea), 5.00%, 03/01/2021 | | | 13,530 | |
| | 6,000 | | | Micron Technology, Inc., 5.25%, 01/15/2024 (e) | | | 6,150 | |
SEE NOTES TO FINANCIAL STATEMENTS.
17
JPMorgan Flexible Long/Short Fund
SCHEDULE OF PORTFOLIO INVESTMENTS
AS OF FEBRUARY 28, 2018 (continued)
(Amounts in U.S. Dollars, unless otherwise noted)
| | | | | | | | |
PRINCIPAL
AMOUNT | | | SECURITY DESCRIPTION | | VALUE | |
| | |
| | Corporate Bonds — continued | | | | |
| |
| | | | Semiconductors & Semiconductor Equipment — continued | |
| | 4,000 | | | Versum Materials, Inc., 5.50%, 09/30/2024 (e) | | | 4,180 | |
| | | | | | | | |
| | | | | | | 25,825 | |
| | | | | | | | |
| | | | Software — 0.5% | |
| | 6,000 | | | Camelot Finance SA, 7.88%, 10/15/2024 (e) | | | 6,362 | |
| | | | CURO Financial Technologies Corp., | | | | |
| | 5,000 | | | 12.00%, 03/01/2022 (e) | | | 5,483 | |
| | 17,000 | | | Genesys Telecommunications Laboratories, Inc., 10.00%, 11/30/2024 (e) | | | 18,806 | |
| | 6,000 | | | Infor Software Parent LLC, , 7.13%, (cash), 05/01/2021 (e) (v) | | | 6,105 | |
| | 18,000 | | | Infor US, Inc., 6.50%, 05/15/2022 | | | 18,405 | |
| | 6,000 | | | Informatica LLC,
7.13%, 07/15/2023 (e) | | | 6,117 | |
| | 2,000 | | | j2 Cloud Services LLC, 6.00%, 07/15/2025 (e) | | | 2,070 | |
| | 65,000 | | | Oracle Corp., 3.25%, 11/15/2027 | | | 63,051 | |
| | | | | | | | |
| | | | | | | 126,399 | |
| | | | | | | | |
| | | | Technology Hardware, Storage & Peripherals — 0.4% | |
| | | | Dell International LLC, | | | | |
| | 3,000 | | | 5.88%, 06/15/2021 (e) | | | 3,067 | |
| | 3,000 | | | 7.13%, 06/15/2024 (e) | | | 3,240 | |
| | 23,000 | | | Diebold Nixdorf, Inc., 8.50%, 04/15/2024 | | | 24,265 | |
| | 25,000 | | | EMC Corp., 3.38%, 06/01/2023 | | | 23,027 | |
| | | | Western Digital Corp., | | | | |
| | 32,000 | | | 4.75%, 02/15/2026 | | | 32,240 | |
| | 10,000 | | | 7.38%, 04/01/2023 (e) | | | 10,870 | |
| | | | | | | | |
| | | | | | | 96,709 | |
| | | | | | | | |
| | | | Total Information Technology | | | 554,410 | |
| | | | | | | | |
| | | | Materials — 6.4% | | | | |
| | | | Chemicals — 1.8% | | | | |
| | 15,000 | | | Blue Cube Spinco, Inc., 10.00%, 10/15/2025 | | | 17,887 | |
| | | | CF Industries, Inc., | | | | |
| | 10,000 | | | 4.50%, 12/01/2026 (e) | | | 10,177 | |
| | 9,000 | | | 5.15%, 03/15/2034 | | | 8,820 | |
| | 6,000 | | | Chemours Co. (The), 5.38%, 05/15/2027 | | | 6,015 | |
| | 3,000 | | | Cornerstone Chemical Co., 6.75%, 08/15/2024 (e) | | | 3,041 | |
| | 43,000 | | | CVR Partners LP, 9.25%, 06/15/2023 (e) | | | 45,580 | |
| | 5,000 | | | FXI Holdings, Inc., 7.88%, 11/01/2024 (e) | | | 4,931 | |
| | 21,000 | | | Hexion, Inc., 6.63%, 04/15/2020 | | | 19,530 | |
| | EUR 100,000 | | | INEOS Finance plc, (Luxembourg), Reg. S, 4.00%, 05/01/2023 | | | 125,045 | |
| | | | | | | | |
PRINCIPAL
AMOUNT | | | SECURITY DESCRIPTION | | VALUE | |
| | |
| | |
| | | | Chemicals — continued | | | | |
| | EUR 100,000 | | | INEOS Group Holdings SA, (Luxembourg), Reg. S, 5.38%, 08/01/2024 | | | 128,833 | |
| | 7,000 | | | Ingevity Corp., 4.50%, 02/01/2026 (e) | | | 6,843 | |
| | 2,000 | | | Koppers, Inc., 6.00%, 02/15/2025 (e) | | | 2,070 | |
| | 15,000 | | | NOVA Chemicals Corp., (Canada), 4.88%, 06/01/2024 (e) | | | 14,813 | |
| | 17,000 | | | Olin Corp., 5.13%, 09/15/2027 | | | 16,734 | |
| | 9,000 | | | PolyOne Corp., 5.25%, 03/15/2023 | | | 9,090 | |
| | 2,000 | | | PQ Corp., 5.75%, 12/15/2025 (e) | | | 2,030 | |
| | 12,000 | | | Scotts Miracle-Gro Co. (The), 5.25%, 12/15/2026 | | | 12,146 | |
| | 4,000 | | | Trinseo Materials Operating SCA, 5.38%, 09/01/2025 (e) | | | 4,045 | |
| | 10,000 | | | Tronox Finance LLC, 7.50%, 03/15/2022 (e) | | | 10,375 | |
| | 18,000 | | | Tronox Finance plc, 5.75%, 10/01/2025 (e) | | | 17,865 | |
| | 16,000 | | | Valvoline, Inc., 4.38%, 08/15/2025 | | | 15,640 | |
| | 10,000 | | | Venator Finance SARL, 5.75%, 07/15/2025 (e) | | | 10,175 | |
| | | | | | | | |
| | | | | | | 491,685 | |
| | | | | | | | |
| | | | Construction Materials — 0.2% | | | | |
| | | | Martin Marietta Materials, Inc., | | | | |
| | 25,000 | | | 3.50%, 12/15/2027 | | | 24,016 | |
| | 11,000 | | | 4.25%, 12/15/2047 | | | 10,214 | |
| | 9,000 | | | US Concrete, Inc., 6.38%, 06/01/2024 | | | 9,563 | |
| | | | | | | | |
| | | | | | | 43,793 | |
| | | | | | | | |
| | | | Containers & Packaging — 2.8% | | | | |
| | EUR 125,000 | | | Ardagh Packaging Finance plc, (Ireland), Reg. S, 6.75%, 05/15/2024 | | | 166,416 | |
| | 12,000 | | | Ball Corp., 4.00%, 11/15/2023 | | | 11,880 | |
| | | | Berry Global, Inc., | | | | |
| | 3,000 | | | 4.50%, 02/15/2026 (e) | | | 2,917 | |
| | 16,000 | | | 6.00%, 10/15/2022 | | | 16,660 | |
| | 8,000 | | | Crown Americas LLC, 4.75%, 02/01/2026 (e) | | | 7,880 | |
| | EUR 100,000 | | | Crown European Holdings SA, Reg. S, 2.63%, 09/30/2024 | | | 123,200 | |
| | 3,000 | | | OI European Group BV, 4.00%, 03/15/2023 (e) | | | 2,903 | |
| | 7,000 | | | Owens-Brockway Glass Container, Inc., 5.00%, 01/15/2022 (e) | | | 7,140 | |
| | 33,919 | | | Reynolds Group Issuer, Inc., 5.75%, 10/15/2020 | | | 34,385 | |
| | 19,000 | | | Sealed Air Corp., 4.88%, 12/01/2022 (e) | | | 19,570 | |
| | EUR 125,000 | | | SIG Combibloc Holdings SCA, (Luxembourg), Reg. S, 7.75%, 02/15/2023 | | | 158,223 | |
SEE NOTES TO FINANCIAL STATEMENTS.
18
JPMorgan Flexible Long/Short Fund
SCHEDULE OF PORTFOLIO INVESTMENTS
AS OF FEBRUARY 28, 2018 (continued)
(Amounts in U.S. Dollars, unless otherwise noted)
| | | | | | | | |
PRINCIPAL
AMOUNT | | | SECURITY DESCRIPTION | | VALUE | |
| | |
| | Corporate Bonds — continued | | | | |
| | |
| | | | Containers & Packaging — continued | | | | |
| | EUR 150,000 | | | Verallia Packaging SASU, (France), Reg. S, 5.13%, 08/01/2022 | | | 189,420 | |
| | | | | | | | |
| | | | | | | 740,594 | |
| | | | | | | | |
| | | | Metals & Mining — 1.5% | | | | |
| | | | AK Steel Corp., | | | | |
| | 4,000 | | | 7.00%, 03/15/2027 | | | 4,068 | |
| | 9,000 | | | 7.50%, 07/15/2023 | | | 9,607 | |
| | 17,000 | | | Aleris International, Inc., 7.88%, 11/01/2020 | | | 17,000 | |
| | 10,000 | | | Commercial Metals Co., 4.88%, 05/15/2023 | | | 10,125 | |
| | | | FMG Resources August 2006 Pty. Ltd., (Australia), | | | | |
| | 4,000 | | | 4.75%, 05/15/2022 (e) | | | 3,997 | |
| | 5,000 | | | 5.13%, 05/15/2024 (e) | | | 4,986 | |
| | | | Freeport-McMoRan, Inc., | | | | |
| | 87,000 | | | 3.55%, 03/01/2022 | | | 84,634 | |
| | 17,000 | | | 3.88%, 03/15/2023 | | | 16,490 | |
| | 13,000 | | | 5.45%, 03/15/2043 | | | 12,480 | |
| | 10,000 | | | Hudbay Minerals, Inc., (Canada), 7.25%, 01/15/2023 (e) | | | 10,625 | |
| | 23,000 | | | Kaiser Aluminum Corp., 5.88%, 05/15/2024 | | | 24,099 | |
| | 9,000 | | | Lundin Mining Corp., (Canada), 7.88%, 11/01/2022 (e) | | | 9,518 | |
| | 10,000 | | | Newcrest Finance Pty. Ltd., (Australia), 5.75%, 11/15/2041 (e) | | | 10,864 | |
| | 20,000 | | | Southern Copper Corp., (Peru), 6.75%, | | | | |
| | | | 04/16/2040 | | | 24,950 | |
| | 22,000 | | | Steel Dynamics, Inc., 5.50%, 10/01/2024 | | | 22,770 | |
| | EUR 70,000 | | | thyssenkrupp AG, (Germany), Reg. S, | | | | |
| | | | 2.50%, 02/25/2025 | | | 90,567 | |
| | | | United States Steel Corp., | | | | |
| | 5,000 | | | 6.88%, 08/15/2025 | | | 5,250 | |
| | 12,000 | | | 8.38%, 07/01/2021 (e) | | | 12,870 | |
| | 21,000 | | | Vale Overseas Ltd., (Brazil), 6.25%, 08/10/2026 | | | 23,668 | |
| | | | | | | | |
| | | | | | | 398,568 | |
| |
| | | | Paper & Forest Products — 0.1% | |
| | 25,000 | | | Fibria Overseas Finance Ltd., (Brazil), 5.50%, 01/17/2027 | | | 26,190 | |
| | | | | | | | |
| | | | Total Materials | | | 1,700,830 | |
| | | | | | | | |
| |
| | | | Real Estate — 1.2% | |
| |
| | | | Equity Real Estate Investment Trusts (REITs) — 1.2% | |
| | 60,000 | | | American Tower Corp., 3.60%, 01/15/2028 | | | 56,949 | |
| | | | CyrusOne LP, | | | | |
| | 4,000 | | | 5.00%, 03/15/2024 | | | 4,030 | |
| | 12,000 | | | 5.38%, 03/15/2027 | | | 12,030 | |
| | | | | | | | |
PRINCIPAL
AMOUNT | | | SECURITY DESCRIPTION | | VALUE | |
| | |
| | |
| | | | Equity Real Estate Investment Trusts (REITs) — continued | | | | |
| | | | Equinix, Inc., | | | | |
| | EUR 100,000 | | | 2.88%, 10/01/2025 | | | 120,856 | |
| | 14,000 | | | 5.75%, 01/01/2025 | | | 14,630 | |
| | 10,000 | | | ESH Hospitality, Inc., 5.25%, | | | | |
| | | | 05/01/2025 (e) | | | 9,975 | |
| | | | Iron Mountain, Inc., | | | | |
| | 4,000 | | | 4.88%, 09/15/2027 (e) | | | 3,770 | |
| | 5,000 | | | 5.25%, 03/15/2028 (e) | | | 4,764 | |
| | 13,000 | | | SBA Communications Corp., 4.88%, | | | | |
| | | | 07/15/2022 | | | 13,162 | |
| | | | VEREIT Operating Partnership LP, | | | | |
| | 20,000 | | | 3.95%, 08/15/2027 | | | 18,956 | |
| | 67,000 | | | 4.60%, 02/06/2024 | | | 68,736 | |
| | | | | | | | |
| | | | Total Real Estate | | | 327,858 | |
| | | | | | | | |
| | | | Telecommunication Services — 5.9% | | | | |
| | | | Diversified Telecommunication Services — 3.5% | |
| | | | AT&T, Inc., | | | | |
| | 35,000 | | | 3.90%, 03/11/2024 | | | 35,299 | |
| | 25,000 | | | 3.90%, 08/14/2027 | | | 24,803 | |
| | 2,000 | | | 5.15%, 02/14/2050 | | | 1,996 | |
| | 40,000 | | | 5.25%, 03/01/2037 | | | 41,459 | |
| | | | CCO Holdings LLC, | | | | |
| | 49,000 | | | 5.13%, 05/01/2027 (e) | | | 47,101 | |
| | 10,000 | | | 5.50%, 05/01/2026 (e) | | | 10,000 | |
| | 16,000 | | | 5.75%, 02/15/2026 (e) | | | 16,220 | |
| | 18,000 | | | 5.88%, 04/01/2024 (e) | | | 18,613 | |
| | 8,000 | | | 5.88%, 05/01/2027 (e) | | | 8,130 | |
| | 5,000 | | | CenturyLink, Inc., Series T, 5.80%, 03/15/2022 | | | 4,931 | |
| | 21,000 | | | Cincinnati Bell, Inc., 7.00%, 07/15/2024 (e) | | | 19,929 | |
| | 10,000 | | | Consolidated Communications, Inc., | | | | |
| | | | 6.50%, 10/01/2022 | | | 8,750 | |
| | EUR 120,000 | | | eircom Finance DAC, (Ireland), Reg. S, | | | | |
| | | | 4.50%, 05/31/2022 | | | 149,987 | |
| | 36,000 | | | Embarq Corp., 8.00%, 06/01/2036 | | | 34,065 | |
| | | | Frontier Communications Corp., | | | | |
| | 14,000 | | | 9.25%, 07/01/2021 | | | 12,947 | |
| | 8,000 | | | 11.00%, 09/15/2025 | | | 6,270 | |
| | | | Intelsat Jackson Holdings SA, (Luxembourg), | | | | |
| | 12,000 | | | 5.50%, 08/01/2023 | | | 9,930 | |
| | 11,000 | | | 7.25%, 10/15/2020 | | | 10,244 | |
| | 10,000 | | | 7.50%, 04/01/2021 | | | 9,081 | |
| | 28,000 | | | 8.00%, 02/15/2024 (e) | | | 29,400 | |
| | 5,000 | | | 9.75%, 07/15/2025 (e) | | | 4,750 | |
| | 24,000 | | | Level 3 Financing, Inc., 5.38%, 05/01/2025 | | | 23,820 | |
SEE NOTES TO FINANCIAL STATEMENTS.
19
JPMorgan Flexible Long/Short Fund
SCHEDULE OF PORTFOLIO INVESTMENTS
AS OF FEBRUARY 28, 2018 (continued)
(Amounts in U.S. Dollars, unless otherwise noted)
| | | | | | | | |
PRINCIPAL
AMOUNT | | | SECURITY DESCRIPTION | | VALUE | |
| | |
| | Corporate Bonds — continued | | | | |
| |
| | | | Diversified Telecommunication Services — continued | |
| | | | Qwest Corp., | | | | |
| | 9,000 | | | 6.75%, 12/01/2021 | | | 9,613 | |
| | 30,000 | | | 7.13%, 11/15/2043 | | | 28,869 | |
| | EUR 110,000 | | | Telecom Italia SpA, (Italy), Reg. S, 2.50%, 07/19/2023 | | | 140,346 | |
| | | | Verizon Communications, Inc., | | | | |
| | 20,000 | | | (ICE LIBOR USD 3 Month + 1.00%), 2.60%, 03/16/2022 (aa) | | | 20,435 | |
| | 35,000 | | | 5.25%, 03/16/2037 | | | 37,093 | |
| | EUR 120,000 | | | Virgin Media Finance plc, (United Kingdom), Reg. S, 4.50%, 01/15/2025 | | | 150,397 | |
| | 12,000 | | | Windstream Services LLC, 8.75%, 12/15/2024 (e) | | | 7,680 | |
| | | | | | | | |
| | | | | | | 922,158 | |
| | | | | | | | |
| |
| | | | Wireless Telecommunication Services — 2.4% | |
| | 200,000 | | | Comunicaciones Celulares SA, (Guatemala), Reg. S, 6.88%, 02/06/2024 | | | 209,500 | |
| | 25,000 | | | Hughes Satellite Systems Corp., 5.25%, 08/01/2026 | | | 24,375 | |
| | EUR 100,000 | | | Matterhorn Telecom SA, (Luxembourg), Reg. S, 3.88%, 05/01/2022 | | | 123,830 | |
| | | | Sprint Communications, Inc., | | | | |
| | 18,000 | | | 9.00%, 11/15/2018 (e) | | | 18,675 | |
| | 21,000 | | | 9.25%, 04/15/2022 | | | 24,308 | |
| | | | Sprint Corp., | | | | |
| | 25,000 | | | 7.13%, 06/15/2024 | | | 24,609 | |
| | 20,000 | | | 7.63%, 02/15/2025 | | | 20,000 | |
| | 4,000 | | | 7.63%, 03/01/2026 | | | 3,980 | |
| | 9,000 | | | 7.88%, 09/15/2023 | | | 9,315 | |
| | EUR 100,000 | | | Telefonica Europe BV, (Spain), Reg. S, (EUR Swap Annual 8 Year + 5.59%), 7.63%, 09/18/2021 (x) (y) (aa) | | | 146,537 | |
| | | | T-Mobile USA, Inc., | | | | |
| | 3,000 | | | 4.50%, 02/01/2026 | | | 2,944 | |
| | 3,000 | | | 4.75%, 02/01/2028 | | | 2,926 | |
| | 25,000 | | | 6.63%, 04/01/2023 | | | 25,885 | |
| | 13,000 | | | 6.84%, 04/28/2023 | | | 13,487 | |
| | | | | | | | |
| | | | | | | 650,371 | |
| | | | | | | | |
| | | | Total Telecommunication Services | | | 1,572,529 | |
| | | | | | | | |
| | | | Utilities — 3.9% | |
| | | | Electric Utilities — 1.7% | |
| | 60,000 | | | Emera US Finance LP, (Canada), 3.55%, 06/15/2026 | | | 57,762 | |
| | GBP 100,000 | | | Enel SpA, (Italy), Reg. S, (GBP Swap 5 Year + 4.09%), 6.62%, 09/15/2076 (aa) | | | 156,462 | |
| | 25,000 | | | Exelon Corp., 4.45%, 04/15/2046 | | | 25,351 | |
| | | | FirstEnergy Corp., | | | | |
| | 30,000 | | | Series B, 3.90%, 07/15/2027 | | | 29,627 | |
| | | | | | | | |
PRINCIPAL
AMOUNT | | | SECURITY DESCRIPTION | | VALUE | |
| | |
| | |
| | | | Electric Utilities — continued | | | | |
| | 10,000 | | | Series C, 4.85%, 07/15/2047 | | | 10,511 | |
| | 15,000 | | | Fortis, Inc., (Canada), 3.06%, 10/04/2026 | | | 13,942 | |
| | GBP 50,000 | | | Iberdrola Finanzas SA, (Spain), 7.38%, 01/29/2024 | | | 88,357 | |
| | | | NextEra Energy Operating Partners LP, | | | | |
| | 4,000 | | | 4.25%, 09/15/2024 (e) | | | 3,945 | |
| | 3,000 | | | 4.50%, 09/15/2027 (e) | | | 2,887 | |
| | 35,000 | | | Pennsylvania Electric Co., 3.25%, 03/15/2028 (e) | | | 33,447 | |
| | 35,000 | | | PPL Capital Funding, Inc., 4.00%, 09/15/2047 | | | 33,357 | |
| | 4,000 | | | Terraform Global Operating LLC, 6.13%, 03/01/2026 (e) | | | 4,030 | |
| | | | | | | | |
| | | | | | | 459,678 | |
| | | | | | | | |
| | | | Gas Utilities — 0.0% (g) | |
| | 3,000 | | | AmeriGas Partners LP, 5.50%, 05/20/2025 | | | 2,977 | |
| | | | | | | | |
| | | | Independent Power and Renewable Electricity Producers — 1.3% | |
| | 9,000 | | | AES Corp., 5.50%, 03/15/2024 | | | 9,191 | |
| | 39,000 | | | Calpine Corp., 5.25%, 06/01/2026 (e) | | | 37,830 | |
| | | | Dynegy, Inc., | | | | |
| | 23,000 | | | 5.88%, 06/01/2023 | | | 23,575 | |
| | 4,000 | | | 8.13%, 01/30/2026 (e) | | | 4,380 | |
| | 200,000 | | | Empresa Electrica Angamos SA, (Chile), Reg. S, 4.88%, 05/25/2029 | | | 198,180 | |
| | 41,000 | | | GenOn Energy, Inc., 9.88%, 10/15/2020 (d) | | | 34,133 | |
| | | | NRG Energy, Inc., | | | | |
| | 4,000 | | | 5.75%, 01/15/2028 (e) | | | 3,949 | |
| | 20,000 | | | 6.63%, 01/15/2027 | | | 20,650 | |
| | 9,000 | | | NRG Yield Operating LLC, 5.38%, 08/15/2024 | | | 9,096 | |
| | | | | | | | |
| | | | | | | 340,984 | |
| | | | | | | | |
| | | | Multi-Utilities — 0.8% | |
| | GBP 15,000 | | | innogy Finance BV, (Germany), Reg. S, 5.63%, 12/06/2023 | | | 24,484 | |
| | GBP 100,000 | | | NGG Finance plc, (United Kingdom), Reg. S, (GBP Swap 12 Year + 3.48%), 5.63%, 06/18/2073 (aa) | | | 154,707 | |
| | 35,000 | | | Sempra Energy, 3.80%, 02/01/2038 | | | 33,159 | |
| | | | | | | | |
| | | | | | | 212,350 | |
| | | | | | | | |
SEE NOTES TO FINANCIAL STATEMENTS.
20
JPMorgan Flexible Long/Short Fund
SCHEDULE OF PORTFOLIO INVESTMENTS
AS OF FEBRUARY 28, 2018 (continued)
(Amounts in U.S. Dollars, unless otherwise noted)
| | | | | | | | |
PRINCIPAL
AMOUNT | | | SECURITY DESCRIPTION | | VALUE | |
| | |
| | Corporate Bonds — continued | | | | |
| | |
| | | | Water Utilities — 0.1% | | | | |
| | GBP 10,000 | | | Northumbrian Water Finance plc, (United Kingdom), Reg. S, 6.88%, 02/06/2023 | | | 16,854 | |
| | | | | | | | |
| | | | Total Utilities | | | 1,032,843 | |
| | | | | | | | |
| | | | Total Corporate Bonds (Cost $18,347,093) | | | 18,835,977 | |
| | | | | | | | |
| | U.S. Treasury Obligation — 0.1% | | | | |
| | 20,000 | | | U.S. Treasury Bonds, 2.75%, 11/15/2047 (Cost $18,426) | | | 18,530 | |
| | | | | | | | |
| | Loan Assignments — 23.0% (cc) | | | | |
| | | | Consumer Discretionary — 5.1% | |
| | | | Diversified Consumer Services — 0.6% | |
| | 12,100 | | | Altran Technologies Ltd., 1st Lien Term Loan B, (ICE LIBOR USD 3 Month + 2.75%), 3.75%, 01/30/2025 (aa) ^ | | | 12,176 | |
| | 148,114 | | | Spin Holdco, Term Loan B, (ICE LIBOR USD 1 Month + 3.25%), 5.49%, 11/14/2022 (aa) | | | 148,916 | |
| | | | | | | | |
| | | | | | | 161,092 | |
| | | | | | | | |
| | | | Hotels, Restaurants & Leisure — 0.6% | |
| | 81,384 | | | 1011778 BC ULC, 1st Lien Term Loan B, (Canada) (ICE LIBOR USD 1 Month + 2.25%; ICE LIBOR USD 3 Month + 2.25%), 3.92%, 02/16/2024 (aa) | | | 81,486 | |
| | 19,850 | | | Hilton Worldwide Finance LLC, Series B-2 Term Loan, (ICE LIBOR USD 1 Month + 2.00%), 3.62%, 10/25/2023 (aa) | | | 19,955 | |
| | 73,840 | | | Seminole Hard Rock Entertainment, Inc., Term Loan B, (ICE LIBOR USD 3 Month + 2.75%), 4.44%, 05/14/2020 (aa) | | | 74,209 | |
| | | | | | | | |
| | | | | | | 175,650 | |
| | | | | | | | |
| | | | Leisure Products — 0.5% | |
| | 131,829 | | | Delta 2 Sarl, 1st Lien Term loan B, (ICE LIBOR USD 1 Month + 2.50%), 4.15%, 02/01/2024 (aa) | | | 131,459 | |
| | 10,000 | | | FGI Operating Co. LLC, Term B Loan, (ICE LIBOR USD 1 Month + 4.25%), 5.82%, 04/19/2019 (aa) ^ | | | 2,500 | |
| | | | | | | | |
| | | | | | | 133,959 | |
| | | | | | | | |
| | | | Media — 3.2% | |
| | 89,550 | | | Altice US Finance I Corp., Term Loan, (ICE LIBOR USD 1 Month + 2.25%), 3.90%, 07/28/2025 (aa) | | | 89,400 | |
| | 99,000 | | | AMC Entertainment, Inc., Term Loan B, (ICE LIBOR USD 1 Month + 2.25%), 3.84%, 12/15/2023 (aa) | | | 99,217 | |
| | 138,950 | | | CSC Holdings LLC, 1st Lien, (ICE LIBOR USD 1 Month + 2.25%), 3.84%, 07/17/2025 (aa) | | | 138,533 | |
| | | | | | | | |
PRINCIPAL
AMOUNT | | | SECURITY DESCRIPTION | | VALUE | |
| | |
| | |
| | | | Media — continued | | | | |
| | 51,242 | | | Gray Television, Inc., 1st Lien Term Loan B, (ICE LIBOR USD 1 Month + 2.25%), 3.83%, 02/07/2024 (aa) | | | 51,509 | |
| | 34,913 | | | Red Ventures LLC, 1st Lien Term Loan, (ICE LIBOR USD 1 Month + 4.00%), 5.65%, 11/08/2024 (aa) | | | 35,116 | |
| | 70,081 | | | Sinclair Broadcast Group, Inc., 1st Lien Term Loan B, (ICE LIBOR USD 1 Month + 2.25%), 3.90%, 01/03/2024 (aa) | | | 70,103 | |
| | 74,724 | | | Tribune Media Co., 1st Lien Term Loan B, (ICE LIBOR USD 1 Month + 3.00%), 4.65%, 01/26/2024 (aa) | | | 74,747 | |
| | 98,397 | | | Univision Communications, Inc., 1st Lien Term Loan C-5, (ICE LIBOR USD 1 Month + 2.75%), 4.40%, 03/15/2024 (aa) | | | 97,153 | |
| | 76,805 | | | WMG Acquisition Corp., 1st Lien Term Loan E, (ICE LIBOR USD 1 Month + 2.25%), 3.83%, 11/01/2023 (aa) | | | 76,985 | |
| | 116,118 | | | Zuffa LLC, 1st Lien Guaranteed Senior Secured Term Loan, (ICE LIBOR USD 1 Month + 3.25%), 4.90%, 08/18/2023 (aa) | | | 116,644 | |
| | | | | | | | |
| | | | | | | 849,407 | |
| | | | | | | | |
| | | | Multiline Retail — 0.2% | |
| | 44,670 | | | JC Penney Corp., Term Loan B, (ICE LIBOR USD 3 Month + 4.25%), 6.23%, 06/23/2023 (aa) | | | 42,709 | |
| | | | | | | | |
| | | | Total Consumer Discretionary | | | 1,362,817 | |
| | | | | | | | |
| | | | Consumer Staples — 3.0% | |
| | | | Food & Staples Retailing — 1.3% | |
| | 99,251 | | | Albertson’s LLC, 1st Lien Term Loan, (ICE LIBOR USD 3 Month + 3.00%), 4.67%, 12/21/2022 (aa) | | | 97,943 | |
| | 99,000 | | | Moran Foods LLC, Term Loan B, (ICE LIBOR USD 1 Month + 6.00%), 7.65%, 12/05/2023 (aa) | | | 87,615 | |
| | 65,133 | | | SUPERVALU, Inc., Delayed Draw Term Loan, (ICE LIBOR USD 1 Month + 3.50%), 5.15%, 06/08/2024 (aa) | | | 64,471 | |
| | 108,555 | | | SUPERVALU, Inc., Term Loan B, (ICE LIBOR USD 1 Month + 3.50%), 5.15%, 06/08/2024 (aa) | | | 107,452 | |
| | | | | | | | |
| | | | | | | 357,481 | |
| | | | | | | | |
| | | | Food Products — 1.4% | |
| | 57,275 | | | Dole Food Co., 1st Lien Term Loan B, (ICE LIBOR USD 1 Month + 2.75%; ICE LIBOR USD 3 Month + 2.75%; US Prime Rate + 1.75%), 4.36%, 04/06/2024 (aa) | | | 57,480 | |
| | 147,704 | | | Hearthside Group Holdings LLC, 1st Lien Term Loan B, (ICE LIBOR USD 1 Month + 3.00%), 4.65%, 06/02/2021 (aa) | | | 148,073 | |
SEE NOTES TO FINANCIAL STATEMENTS.
21
JPMorgan Flexible Long/Short Fund
SCHEDULE OF PORTFOLIO INVESTMENTS
AS OF FEBRUARY 28, 2018 (continued)
(Amounts in U.S. Dollars, unless otherwise noted)
| | | | | | | | |
PRINCIPAL
AMOUNT | | | SECURITY DESCRIPTION | | VALUE | |
| | |
| | Loan Assignments — continued | | | | |
| | |
| | | | Food Products — continued | | | | |
| | 79,352 | | | JBS USA LLC, Term Loan B, (ICE LIBOR USD 3 Month + 2.50%), 4.10%, 10/30/2022 (aa) | | | 78,955 | |
| | 78,210 | | | Pinnacle Foods Finance LLC, Term Loan B, (ICE LIBOR USD 1 Month + 2.00%), 3.58%, 02/02/2024 (aa) | | | 78,654 | |
| | | | | | | | |
| | | | | | | 363,162 | |
| | | | | | | | |
| | | | Personal Products — 0.3% | |
| | 85,634 | | | Prestige Brands, Inc., 1st Lien Term Loan B-4, (ICE LIBOR USD 1 Month + 2.75%), 4.40%, 01/26/2024 (aa) | | | 86,109 | |
| | | | | | | | |
| | | | Total Consumer Staples | | | 806,752 | |
| | | | | | | | |
| | | | Energy — 1.7% | |
| | | | Oil, Gas & Consumable Fuels — 1.7% | |
| | 100,000 | | | California Resources Corp., Senior Secured First Out, (ICE LIBOR USD 1 Month + 4.75%), 6.34%, 12/31/2022 (aa) | | | 101,125 | |
| | 9,756 | | | Chesapeake Energy Corp., 1st Lien Last Out, (ICE LIBOR USD 3 Month + 7.50%), 9.44%, 08/23/2021 (aa) | | | 10,388 | |
| | 194,580 | | | Gulf Finance LLC, 1st Lien Term Loan B, (ICE LIBOR USD 3 Month + 5.25%), 6.95%, 08/25/2023 (aa) | | | 177,068 | |
| | 49,625 | | | MEG Energy Corp., 1st Lien Term B Loan, (ICE LIBOR USD 3 Month + 3.50%), 5.20%, 12/31/2023(Canada) (aa) | | | 49,607 | |
| | 23,000 | | | Summit Midstream Partners Holdings LLC, Senior Secured Term Loan, (ICE LIBOR USD 1 Month + 6.00%), 7.65%, 05/13/2022 (aa) | | | 23,359 | |
| | 17,000 | | | TerraForm Power Operating LLC, 1st Lien Term Loan B, (ICE LIBOR USD 1 Month + 2.75%), 4.33%, 11/08/2022 (aa) | | | 17,092 | |
| | 81,400 | | | Ultra Resources, Inc., Term Loan, (ICE LIBOR USD 1 Month + 3.00%), 4.59%, 04/12/2024 (aa) | | | 81,034 | |
| | | | | | | | |
| | | | Total Energy | | | 459,673 | |
| | | | | | | | |
| | | | Financials — 0.3% | |
| | | | Capital Markets — 0.3% | |
| | 75,965 | | | Camelot Finance LP, 1st Lien Term Loan, (ICE LIBOR USD 1 Month + 3.25%), 4.90%, 10/03/2023 (aa) | | | 76,467 | |
| | | | | | | | |
| | | | Health Care — 3.0% | |
| | | | Health Care Equipment & Supplies — 0.9% | |
| | 130,113 | | | Mallinckrodt International Finance, Term Loan B, (ICE LIBOR USD 3 Month + 2.75%), 4.44%, 09/24/2024 (aa) | | | 129,723 | |
| | | | | | | | |
PRINCIPAL
AMOUNT | | | SECURITY DESCRIPTION | | VALUE | |
| | |
| |
| | | | Health Care Equipment & Supplies — continued | |
| | 98,725 | | | Pharmaceutical Product Development LLC, 1st Lien Term Loan, (ICE LIBOR USD 1 Month + 2.75%; ICE LIBOR USD 3 Month + 2.75), 4.42%, 08/18/2022 (aa) | | | 98,972 | |
| | | | | | | | |
| | | | | | | 228,695 | |
| | | | | | | | |
| | | | Health Care Providers & Services — 1.2% | |
| | 51,213 | | | Community Health Systems, Inc., Incremental 2021 Term H Loan, (ICE LIBOR USD 3 Month + 3.00%), 4.98%, 01/27/2021 (aa) | | | 49,992 | |
| | 176,081 | | | MultiPlan, Inc., 1st Lien Term Loan B, (ICE LIBOR USD 3 Month + 3.00%), 4.69%, 06/07/2023 (aa) | | | 176,873 | |
| | 98,466 | | | National Mentor Holdings, Inc., Tranche B Term Loan, (ICE LIBOR USD 3 Month + 3.00%), 4.69%, 01/31/2021 (aa) | | | 99,143 | |
| | | | | | | | |
| | | | | | | 326,008 | |
| | | | | | | | |
| | | | Pharmaceuticals — 0.9% | |
| | 82,437 | | | Concordia Healthcare Corp., Initial Dollar Term Loan, (ICE LIBOR USD 1 Month + 4.25%), 5.90%, 10/21/2021 (aa) | | | 73,634 | |
| | 89,325 | | | Grifols Worldwide Operations Ltd., Term Loan B, (1 Week LIBOR + 2.25%), 3.72%, 01/31/2025 (aa) | | | 89,638 | |
| | 70,865 | | | Valeant Pharmaceuticals International, Inc., Series F-1 Tranche B Term Loan, (ICE LIBOR USD 1 Month + 3.50%), 5.08%, 04/01/2022 (aa) | | | 71,680 | |
| | | | | | | | |
| | | | | | | 234,952 | |
| | | | | | | | |
| | | | Total Health Care | | | 789,655 | |
| | | | | | | | |
| | | | Industrials — 0.9% | |
| | | | Commercial Services & Supplies — 0.9% | |
| | 85,004 | | | Garda World Security, 1st Lien Term Loan B, (US Prime Rate + 2.50%), 4.97%, 05/24/2024 (aa) | | | 85,730 | |
| | 148,629 | | | Prime Security Services Borrower LLC, Term B-1 Loan, (ICE LIBOR USD 1 Month + 2.75%), 4.40%, 05/02/2022 (aa) | | | 149,810 | |
| | | | | | | | |
| | | | | | | 235,540 | |
| | | | | | | | |
| | | | Machinery — 0.0% (g) | |
| | 19,800 | | | Zodiac Pool Solutions LLC, 1st Lien Term Loan, (ICE LIBOR USD 3 Month + 4.00%), 5.69%, 12/20/2023 (aa) | | | 19,801 | |
| | | | | | | | |
| | | | Total Industrials | | | 255,341 | |
| | | | | | | | |
SEE NOTES TO FINANCIAL STATEMENTS.
22
JPMorgan Flexible Long/Short Fund
SCHEDULE OF PORTFOLIO INVESTMENTS
AS OF FEBRUARY 28, 2018 (continued)
(Amounts in U.S. Dollars, unless otherwise noted)
| | | | | | | | |
PRINCIPAL
AMOUNT | | | SECURITY DESCRIPTION | | VALUE | |
| | |
| | Loan Assignments — continued | | | | |
| | |
| | | | Information Technology — 2.0% | | | | |
| | |
| | | | Internet Software & Services — 0.3% | | | | |
| | 79,401 | | | Rackspace Hosting, Inc., 1st Lien Term Loan B, (ICE LIBOR USD 2 Month + 3.00%; ICE LIBOR USD 3 Month + 3.00%), 4.79%, 11/03/2023 (aa) | | | 79,599 | |
| | | | | | | | |
| |
| | | | IT Services — 0.5% | |
| | 137,429 | | | First Data Corp., 1st Lien Term Loan, (ICE LIBOR USD 1 Month + 2.25%), 3.87%, 07/08/2022 (aa) | | | 137,647 | |
| | | | | | | | |
| |
| | | | Semiconductors & Semiconductor Equipment — 0.8% | |
| | 159,364 | | | Microsemi Corp., 1st Lien Term Loan B, (ICE LIBOR USD 2 Month + 2.00%), 3.74%, 01/15/2023 (aa) | | | 159,695 | |
| | 50,494 | | | ON Semiconductor Corp., 1st Lien Term Loan B, (ICE LIBOR USD 1 Month + 2.00%), 3.65%, 03/31/2023 (aa) | | | 50,722 | |
| | | | | | | | |
| | | | | | | 210,417 | |
| | | | | | | | |
| |
| | | | Software — 0.4% | |
| | 109,454 | | | Infor US, Inc., Tranche B-6 Term Loan, (ICE LIBOR USD 3 Month + 2.75%), 4.44%, 02/01/2022 (aa) | | | 109,542 | |
| | | | | | | | |
| | | | Total Information Technology | | | 537,205 | |
| | | | | | | | |
| |
| | | | Materials — 1.4% | |
| |
| | | | Chemicals — 0.8% | |
| | 98,000 | | | Axalta Coating Systems US Holdings, Inc., Term Loan B, (ICE LIBOR USD 3 Month + 2.00%), 3.69%, 06/01/2024 (aa) | | | 98,510 | |
| | 49,246 | | | PolyOne Corp., 1st Lien Term Loan B, (ICE LIBOR USD 1 Month + 2.00%), 3.59%, 11/11/2022 (aa) | | | 49,554 | |
| | | | Tronox Finance LLC, 1st Lien Term Loan B, | | | | |
| | 38,721 | | | (ICE LIBOR USD 3 Month + 3.00%), 4.69%, 09/23/2024 (aa) | | | 38,951 | |
| | 16,779 | | | (ICE LIBOR USD 3 Month + 3.00%), 4.69%, 09/23/2024 (aa) | | | 16,879 | |
| | | | | | | | |
| | | | | | | 203,894 | |
| | | | | | | | |
| |
| | | | Containers & Packaging — 0.6% | |
| | 100,000 | | | Berry Global, Inc., 1st Lien Term Loan P, (ICE LIBOR USD 1 Month + 2.00%), 3.58%, 01/06/2021 (aa) | | | 100,333 | |
| | 42,785 | | | Bway Holding Co., 1st Lien Term Loan B, (ICE LIBOR USD 2 Month + 3.25%; ICE LIBOR USD 3 Month + 3.25%), 4.96%, 04/03/2024 (aa) | | | 42,945 | |
| | 29,925 | | | Consolidated Container, 1st Lien Term Loan B, (ICE LIBOR USD 1 Month + 3.00%), 4.65%, 05/22/2024 (aa) | | | 30,075 | |
| | | | | | | | |
| | | | | | | 173,353 | |
| | | | | | | | |
| | | | Total Materials | | | 377,247 | |
| | | | | | | | |
| | | | | | | | |
PRINCIPAL
AMOUNT | | | SECURITY DESCRIPTION | | VALUE | |
| | |
| | |
| | | | Real Estate — 0.4% | | | | |
| | | | Equity Real Estate Investment Trusts (REITs) — 0.4% | |
| | 99,250 | | | GEO Group, Inc. (The), Term Loan, (ICE LIBOR USD 3 Month + 2.25%), 3.95%, 03/22/2024 (aa) | | | 99,548 | |
| | | | | | | | |
| | | | Telecommunication Services — 1.9% | |
| |
| | | | Diversified Telecommunication Services — 1.5% | |
| | 100,000 | | | Centurylink, Inc., 1st Lien Term Loan B, (ICE LIBOR USD 1 Month + 2.75%), 4.40%, 01/31/2025 (aa) | | | 98,225 | |
| | 97,013 | | | Hargray Communications Group, Inc., Senior Secured Term Loan B, (ICE LIBOR USD 1 Month + 3.00%), 4.65%, 05/16/2024 (aa) | | | 97,182 | |
| | 150,000 | | | Intelsat Jackson Holdings SA, 1st Lien Term Loan, (ICE LIBOR USD 3 Month + 3.75%), 5.71%, 11/27/2023 (aa) | | | 148,848 | |
| | 53,622 | | | Zayo Group LLC, Term B-2 Loan, (ICE LIBOR USD 1 Month + 2.25%), 3.87%, 01/19/2024 (aa) | | | 53,848 | |
| | | | | | | | |
| | | | | | | 398,103 | |
| | | | | | | | |
| |
| | | | Wireless Telecommunication Services — 0.4% | |
| | 100,000 | | | Syniverse Holdings, Inc., 1st Lien Term Loan, (ICE LIBOR USD 3 Month + 4.75%), 5.75%, 02/09/2023 (aa) ^ | | | 100,781 | |
| | | | | | | | |
| | | | Total Telecommunication Services | | | 498,884 | |
| | | | | | | | |
| |
| | | | Utilities — 3.3% | |
| |
| | | | Electric Utilities — 1.2% | |
| | 83,300 | | | Energy Future Intermediate Holding Co. LLC, DIP Term Loan, (ICE LIBOR USD 1 Month + 3.00%), 4.47%, 06/30/2018 (aa) | | | 83,290 | |
| | 45,649 | | | Lightstone Holdco LLC, 1st Lien Term Loan B, (ICE LIBOR USD 1 Month + 3.75%), 5.40%, 01/30/2024 (aa) | | | 45,902 | |
| | 2,899 | | | Lightstone Holdco LLC, 1st Lien Term Loan C, (ICE LIBOR USD 1 Month + 3.75%), 5.40%, 01/30/2024 (aa) | | | 2,915 | |
| | 161,229 | | | Texas Competitive Electric Holdings Co. LLC, Term Loan, (ICE LIBOR USD 1 Month + 2.50%), 4.15%, 08/04/2023 (aa) | | | 162,064 | |
| | 28,571 | | | Texas Competitive Electric Holdings Co. LLC, Term Loan C, (ICE LIBOR USD 1 Month + 2.50%), 4.15%, 08/04/2023 (aa) | | | 28,719 | |
| | | | | | | | |
| | | | | | | 322,890 | |
| | | | | | | | |
| |
| | | | Independent Power and Renewable Electricity Producers — 2.1% | |
| | 147,727 | | | Calpine Corp., Term Loan, (ICE LIBOR USD 3 Month + 2.50%), 4.20%, 01/15/2024 (aa) | | | 148,020 | |
SEE NOTES TO FINANCIAL STATEMENTS.
23
JPMorgan Flexible Long/Short Fund
SCHEDULE OF PORTFOLIO INVESTMENTS
AS OF FEBRUARY 28, 2018 (continued)
(Amounts in U.S. Dollars, unless otherwise noted)
| | | | | | | | |
PRINCIPAL
AMOUNT | | | SECURITY DESCRIPTION | | VALUE | |
| | |
| | Loan Assignments — continued | |
| | | | Independent Power and Renewable Electricity Producers — continued | | | | |
| | 136,136 | | | Dynegy, Inc., 1st Lien Term Loan C, (ICE LIBOR USD 1 Month + 2.75%), 4.35%, 02/07/2024 (aa) | | | 136,916 | |
| | 37,406 | | | ExGen Renewables I LLC, 1st Lien Term Loan, (ICE LIBOR USD 3 Month + 3.00%), 4.99%, 11/28/2024 (aa) | | | 37,734 | |
| | 147,750 | | | NRG Energy, Inc., Term Loan, (ICE LIBOR USD 3 Month + 2.25%), 3.94%, 06/30/2023 (aa) | | | 148,345 | |
| | 92,906 | | | Talen Energy Supply, Term Loan B-2, (ICE LIBOR USD 1 Month + 4.00%), 5.65%, 04/15/2024 (aa) | | | 93,039 | |
| | | | | | | | |
| | | | | | | 564,054 | |
| | | | | | | | |
| | | | Total Utilities | | | 886,944 | |
| | | | | | | | |
| | | | Total Loan Assignments
(Cost $6,137,868) | | | 6,150,533 | |
| | | | | | | | |
NUMBER OF
CONTRACTS | | | | | | |
| | |
| | Options Purchased — 0.0% (g) | | | | |
| | |
| | | | Call Options — 0.0% (g) | | | | |
| | | | Future Interest Rate Options — 0.0% (g) | |
| | 34 | | | U.S. Treasury 10 Year Note 03/23/2018 at USD 123.00, American Style (a) Notional Amount: USD 3,400,000 Exchange Traded | | | 1,063 | |
| | 34 | | | U.S. Treasury 10 Year Note 03/23/2018 at USD 121.50, American Style (a) Notional Amount: USD 3,400,000 Exchange Traded | | | 4,250 | |
| | | | | | | | |
| | |
| | | | Total Options Purchased (Cost $9,032) | | | 5,313 | |
| | | | | | | | |
| SHARES | | | | | | |
| | |
| | Short-Term Investments — 1.7% | | | | |
| | |
| | | | Investment Companies — 1.7% | | | | |
| | 400,760 | | | JPMorgan Prime Money Market Fund, Institutional Class Shares, 1.50% (b) (l) | | | 400,800 | |
| | 44,636 | | | JPMorgan U.S. Government Money Market Fund, Institutional Class Shares, 1.25% (b) (l) | | | 44,636 | |
| | | | | | | | |
| | | | Total Short-Term Investments (Cost $445,445) | | | 445,436 | |
| | | | | | | | |
| | |
| | | | Total Investments — 97.2% (Cost $25,412,207) | | | 25,942,136 | |
| | |
| | | | Other Assets in Excess of Liabilities — 2.8% | | | 755,751 | |
| | | | | | | | |
| | | | NET ASSETS — 100.0% | | $ | 26,697,887 | |
| | | | | | | | |
Percentages indicated are based on net assets.
SEE NOTES TO FINANCIAL STATEMENTS.
24
JPMorgan Flexible Long/Short Fund
SCHEDULE OF PORTFOLIO INVESTMENTS
AS OF FEBRUARY 28, 2018
(Amounts in U.S. Dollars, unless otherwise noted)
| | | | | | | | | | | | | | | | | | |
Over the Counter (“OTC “) Credit default swaptions purchased outstanding as of February 28, 2018: |
|
| Description | | Counterparty | | Expiration
Date | | Exercise Rate | | Pay Financing
Rate | | Receive Floating Rate Index | | Implied
Credit
Spread(%)(1) | | | Notional Amount | | Value ($) |
|
Call Contracts | | | | | | | | | | | | | | | | | | |
| Buy Protection on 5 Year Credit Default Swap Index, expiring 03/21/2018, European Style | | Goldman Sachs
International | | 03/21/18 | | 1.08% | | 5.00% | | CDX.NA.HY.29-V1.Dec.2022 | | | 3.27 | | | USD 1,350,000 | | 13,952 |
| Buy Protection on 5 Year Credit Default Swap Index, expiring 06/20/2018, European Style | | Goldman Sachs
International | | 06/20/18 | | 2.63% | | 5.00% | | iTraxx Europe Crossover Series 28 V1.Dec.2022 | | | 2.64 | | | EUR 650,000 | | 14,148 |
| | | | | | | | | | | | | | | | | | |
| Total OTC Swaptions Purchased (Premiums Paid $20,404) | | | | | | | | | | | | 28,100 |
| | | | | | | | | | | | | | | | | | |
OTC Credit default swaptions written outstanding as of February 28, 2018: |
|
| Description | | Counterparty | | Expiration
Date | | Exercise Rate | | Pay Financing
Rate | | Receive Floating Rate Index | | Implied
Credit
Spread(%)(1) | | | Notional Amount | | Value ($) |
|
Call Contracts | | | | | | | | | | | | | | | | | | |
| Buy Protection on 5 Year Credit Default Swap Index, expiring 03/21/2018, European Style | | Goldman Sachs
International | | 03/21/18 | | 1.06% | | 5.00% | | CDX.NA.HY.29-V1.Dec.2022 | | | 3.27 | | | USD 1,350,000 | | (3,690) |
| Buy Protection on 5 Year Credit Default Swap Index, expiring 06/20/2018, European Style | | Goldman Sachs
International | | 06/20/18 | | 3.13% | | 5.00% | | iTraxx Europe Crossover Series 28 V1.Dec.2022 | | | 2.64 | | | EUR 650,000 | | (8,443) |
| | | | | | | | | | | | | | | | | | |
| Total OTC Swaptions Purchased (Premiums Received $10,449) | | | | | | | | | | | | (12,133) |
| | | | | | | | | | | | | | | | | | |
(1) Implied credit spreads are an indication of the seller’s performance risk, related to the likelihood of a credit event occurring that would require a seller to make payment to a buyer. Implied credit spreads are used to determine the value of swap contracts and reflect the cost of buying/selling protection, which may include upfront payments made to enter into the contract. Therefore, higher spreads would indicate a greater likelihood that a seller will be obligated to perform (i.e.make payment) under the swap contract. Increasing values, in absolute terms and relative to notional amounts, are also indicative of greater performance risk. Implied credit spreads for credit default swaps on credit indices are linked to the weighted average spread across the underlying reference obligations included in a particular index.
SEE NOTES TO FINANCIAL STATEMENTS.
25
JPMorgan Flexible Long/Short Fund
SCHEDULE OF PORTFOLIO INVESTMENTS
AS OF FEBRUARY 28, 2018 (continued)
(Amounts in U.S. Dollars, unless otherwise noted)
Futures contracts outstanding as of February 28, 2018:
| | | | | | | | | | | | | | | | | | | | |
| Description | | Number of
Contracts | | | Expiration
Date | | | Trading Currency | | | Notional Amount
($) | | | Value and
Unrealized
Appreciation (Depreciation) ($) | |
| |
Long Contracts | | | | | | | | | | | | | | | | | | | | |
U.S. Treasury 10 Year Ultra | | | | | | | | | | | | | | | | | | | | |
Note | | | 1 | | | | 06/2018 | | | | USD | | | | 128,531 | | | | 1,068 | |
U.S. Treasury 2 Year Note | | | 3 | | | | 06/2018 | | | | USD | | | | 637,406 | | | | 135 | |
U.S. Treasury Long Bond | | | 1 | | | | 06/2018 | | | | USD | | | | 143,500 | | | | 1,802 | |
| | | | | | | | | | | | | | | | | | | | |
| | | | | | | | | | | | | | | | | | | 3,005 | |
| | | | | | | | | | | | | | | | | | | | |
| | | | | |
Short Contracts | | | | | | | | | | | | | | | | | | | | |
Euro-Bobl | | | (1) | | | | 03/2018 | | | | EUR | | | | (159,869) | | | | 1,676 | |
Euro-Bund | | | (1) | | | | 03/2018 | | | | EUR | | | | (194,517) | | | | (1,600) | |
Euro-Schatz | | | (3) | | | | 03/2018 | | | | EUR | | | | (409,810) | | | | 232 | |
Long Gilt | | | (3) | | | | 06/2018 | | | | GBP | | | | (500,072) | | | | (2,249) | |
U.S. Treasury 10 Year Note | | | (8) | | | | 06/2018 | | | | USD | | | | (960,625) | | | | (2,268) | |
U.S. Treasury 5 Year Note | | | (4) | | | | 06/2018 | | | | USD | | | | (455,750) | | | | (219) | |
U.S. Treasury Ultra Bond | | | (1) | | | | 06/2018 | | | | USD | | | | (155,906) | | | | (2,565) | |
| | | | | | | | | | | | | | | | | | | | |
| | | | | | | | | | | | | | | | | | | (6,993) | |
| | | | | | | | | | | | | | | | | | | | |
| | | | | | | | | | | | | | | | | | | (3,988) | |
| | | | | | | | | | | | | | | | | | | | |
Forward foreign currency exchange contracts outstanding as of February 28, 2018:
| | | | | | | | | | | | | | | | | | | | | | |
| Currency Purchased | | | Currency Sold | | | Counterparty | | Settlement
Date | | | Unrealized
Appreciation
(Depreciation) ($) | |
| |
EUR | | | 4,099 | | | | GBP | | | | 3,610 | | | Royal Bank of Canada | | | 03/05/2018 | | | | 31 | |
USD | | | 207,977 | | | | EUR | | | | 166,218 | | | Australia & New Zealand Banking Group Ltd. | | | 03/05/2018 | | | | 5,154 | |
USD | | | 6,159,213 | | | | EUR | | | | 4,936,793 | | | BNP Paribas | | | 03/05/2018 | | | | 135,204 | |
USD | | | 38,967 | | | | EUR | | | | 31,422 | | | Royal Bank of Canada | | | 03/05/2018 | | | | 626 | |
USD | | | 1,069,327 | | | | GBP | | | | 753,782 | | | BNP Paribas | | | 03/05/2018 | | | | 31,504 | |
USD | | | 6,182,859 | | | | EUR | | | | 5,048,143 | | | Australia & New Zealand Banking Group Ltd. | | | 04/04/2018 | | | | 7,426 | |
USD | | | 5,676 | | | | EUR | | | | 4,604 | | | Royal Bank of Canada | | | 04/04/2018 | | | | 44 | |
USD | | | 1,031,290 | | | | GBP | | | | 744,184 | | | HSBC Bank, N.A. | | | 04/04/2018 | | | | 5,068 | |
| | | | | | | | | | | | | | | | | | | | | | |
Total unrealized appreciation | | | | | | | | | | 185,057 | |
| | | | | | | | | | | | | | | | | | | | | | |
EUR | | | 5,048,143 | | | | USD | | | | 6,168,204 | | | Australia & New Zealand Banking Group Ltd. | | | 03/05/2018 | | | | (8,324) | |
EUR | | | 3,752 | | | | USD | | | | 4,674 | | | Barclays Bank plc | | | 03/05/2018 | | | | (95) | |
EUR | | | 8,168 | | | | USD | | | | 10,010 | | | BNP Paribas | | | 03/05/2018 | | | | (43) | |
EUR | | | 9,683 | | | | USD | | | | 12,034 | | | Goldman Sachs International | | | 03/05/2018 | | | | (218) | |
EUR | | | 8,337 | | | | USD | | | | 10,331 | | | HSBC Bank, N.A. | | | 03/05/2018 | | | | (159) | |
EUR | | | 52,251 | | | | USD | | | | 64,570 | | | Royal Bank of Canada | | | 03/05/2018 | | | | (812) | |
GBP | | | 1,563 | | | | USD | | | | 2,176 | | | BNP Paribas | | | 03/05/2018 | | | | (24) | |
GBP | | | 744,184 | | | | USD | | | | 1,029,732 | | | HSBC Bank, N.A. | | | 03/05/2018 | | | | (5,123) | |
GBP | | | 11,645 | | | | USD | | | | 16,458 | | | Royal Bank of Canada | | | 03/05/2018 | | | | (424) | |
EUR | | | 9,563 | | | | USD | | | | 11,814 | | | Australia & New Zealand Banking Group Ltd. | | | 04/04/2018 | | | | (116) | |
EUR | | | 18,906 | | | | USD | | | | 23,376 | | | BNP Paribas | | | 04/04/2018 | | | | (249) | |
EUR | | | 4,483 | | | | USD | | | | 5,537 | | | Royal Bank of Canada | | | 04/04/2018 | | | | (53) | |
| | | | | | | | | | | | | | | | | | | | | | |
Total unrealized depreciation | | | | | | | | | | (15,640) | |
| | | | | | | | | | | | | | | | | | | | | | |
Net unrealized appreciation | | | | | | | 169,417 | |
| | | | | | | | | | | | | | | | | | | | | | |
SEE NOTES TO FINANCIAL STATEMENTS.
26
JPMorgan Flexible Long/Short Fund
SCHEDULE OF PORTFOLIO INVESTMENTS
AS OF FEBRUARY 28, 2018 (continued)
(Amounts in U.S. Dollars, unless otherwise noted)
OTC Credit default swap contracts outstanding - buy protection(1) as of February 28, 2018:
| | | | | | | | | | | | | | | | | | | | | | | | | | | | | | | | |
Reference
Obligation/Index | | Financing
Rate Paid
by the Fund
(%) | | | Payment Frequency | | Counterparty | | Maturity
Date | | | Implied
Credit Spread (%)(3) | | | Notional
Amount(4) | | | Upfront
Payments
(Receipts)
($)(5) | | | Unrealized
Appreciation
(Depreciation) ($) | | | Value ($) | |
Baxter International,
Inc., 1.70%, 08/15/2021 | | | 1.00 | | | Quarterly | | Goldman Sachs International | | | 12/20/2022 | | | | 0.28 | | | | USD 250,000 | | | | (7,915) | | | | (718) | | | | (8,633) | |
| BMW Financial NV, 5.00%, 08/06/2018 | | | 1.00 | | | Quarterly | | Barclays Bank plc | | | 12/20/2022 | | | | 0.34 | | | | EUR 110,000 | | | | (3,139) | | | | (1,373) | | | | (4,512) | |
| Carrefour SA, 1.75%, 05/22/2019 | | | 1.00 | | | Quarterly | | Citibank, NA | | | 12/20/2022 | | | | 0.54 | | | | EUR 115,000 | | | | (2,996) | | | | (361) | | | | (3,357) | |
| Honeywell International, Inc., 5.70%, 03/15/2036 | | | 1.00 | | | Quarterly | | Goldman Sachs International | | | 12/20/2022 | | | | 0.32 | | | | USD 260,000 | | | | (8,478) | | | | (84) | | | | (8,562) | |
| HP, Inc., 4.65%, 09/12/2021 | | | 1.00 | | | Quarterly | | Barclays Bank plc | | | 12/20/2022 | | | | 0.43 | | | | USD 250,000 | | | | (4,766) | | | | (2,179) | | | | (6,945) | |
| Rolls-Royce plc, 6.75%, 04/30/2019 | | | 1.00 | | | Quarterly | | Goldman Sachs International | | | 12/20/2022 | | | | 0.64 | | | | EUR 110,000 | | | | (1,868) | | | | (715) | | | | (2,583) | |
| Unilever N.V., 1.75%, 08/05/2020 | | | 1.00 | | | Quarterly | | Barclays Bank plc | | | 12/20/2022 | | | | 0.29 | | | | EUR 65,000 | | | | (2,234) | | | | (651) | | | | (2,885) | |
| United Parcel Service, Inc., 8.38%, 04/01/2030 | | | 1.00 | | | Quarterly | | Goldman Sachs International | | | 12/20/2022 | | | | 0.29 | | | | USD 260,000 | | | | (8,971) | | | | 127 | | | | (8,844) | |
| Valero Energy Corp., 8.75%, 06/15/2030 | | | 1.00 | | | Quarterly | | Barclays Bank plc | | | 12/20/2022 | | | | 0.47 | | | | USD 200,000 | | | | (5,924) | | | | 724 | | | | (5,200) | |
| Vodafone Group plc, 5.00%, 06/04/2018 | | | 1.00 | | | Quarterly | | Goldman Sachs International | | | 12/20/2022 | | | | 0.65 | | | | EUR 65,000 | | | | (1,299) | | | | (185) | | | | (1,484) | |
| | | | | | | | | | | | | | | | | | | | | | | | |
| | | | | | | | | | | | | | | | | | | | | | | (47,590) | | | | (5,415) | | | | (53,005) | |
| | | | | | | | | | | | | | | | | | | | | | | | |
Centrally Cleared Credit default swap contracts outstanding - buy protection(1) as of February 28, 2018:
| | | | | | | | | | | | | | | | | | | | | | | | | | | | | | | | |
Reference Obligation/Index | | Financing
Rate Paid
by the Fund
(%) | | | Payment
Frequency | | | Maturity
Date | | | Implied
Credit
Spread
(%)(3) | | | Notional
Amount(4) | | | Upfront
Payments
(Receipts)
($)(5) | | | Unrealized
Appreciation
(Depreciation)
($) | | | Value ($) | |
CDX.NA.IG.29-V1 | | | 1.00 | | | | Quarterly | | | | 12/20/2022 | | | | 0.56 | | |
| USD
2,650,000 |
| | | (52,539) | | | | (5,321) | | | | (57,860) | |
iTraxx Europe 28.1 | | | 1.00 | | | | Quarterly | | | | 12/20/2022 | | | | 0.52 | | |
| EUR
1,050,000 |
| | | (34,423) | | | | 2,912 | | | | (31,511) | |
| | | | | | | | | | | | | | | | | | | | | | | | |
| | | | | | | | | | | | | | | | | | | | | | | (86,962) | | | | (2,409) | | | | (89,371) | |
| | | | | | | | | | | | | | | | | | | | | | | | |
OTC Credit default swap contracts outstanding - sell protection(2) as of February 28, 2018:
| | | | | | | | | | | | | | | | | | | | | | | | | | | | | | | | | | |
Reference Obligation/Index | | Financing
Rate
Received by
the Fund
(%) | | | Payment
Frequency | | | Counterparty | | Maturity
Date | | | Implied
Credit
Spread
(%)(3) | | | Notional
Amount(4) | | | Upfront
Payments
(Receipts)
($)(5) | | | Unrealized
Appreciation
(Depreciation)
($) | | | Value ($) | |
ArcelorMittal, 3.00%, 04/09/2021 | | | 5.00 | | | | Quarterly | | | Barclays Bank plc | | | 12/20/2022 | | | | 1.08 | | | | EUR 50,000 | | | | 9,028 | | | | 2,867 | | | | 11,895 | |
Telefonica SA, 2.74%, 05/29/2019 | | | 1.00 | | | | Quarterly | | | Goldman Sachs International | | | 12/20/2022 | | | | 0.76 | | | | EUR 50,000 | | | | 775 | | | | 51 | | | | 826 | |
| | | | | | | | | | | | | | | | | | | | | | | | | | |
| | | | | | | | | | | | | | | | | | | | | | | | | 9,803 | | | | 2,918 | | | | 12,721 | |
| | | | | | | | | | | | | | | | | | | | | | | | | | |
SEE NOTES TO FINANCIAL STATEMENTS.
27
JPMorgan Flexible Long/Short Fund
SCHEDULE OF PORTFOLIO INVESTMENTS
AS OF FEBRUARY 28, 2018 (continued)
(Amounts in U.S. Dollars, unless otherwise noted)
Centrally Cleared Credit default swap contracts outstanding - sell protection(2) as of February 28, 2018:
| | | | | | | | | | | | | | | | | | | | | | |
Reference
Obligation/Index | | Financing
Rate
Received by
the Fund (%) | | Payment
Frequency | | Maturity
Date | | Implied
Credit
Spread
(%)(3) | | Notional
Amount(4) | | Upfront
Payments
(Receipts)
($)(5) | | | Unrealized
Appreciation
(Depreciation)
($) | | | Value ($) | |
| |
CDX.NA.IG.29-V1 | | 1.00 | | Quarterly | | 12/20/2022 | | 0.56 | | USD 1,350,000 | | | 33,784 | | | | (4,309) | | | | 29,475 | |
CDX.NA.IG.29-V1 | | 1.00 | | Quarterly | | 12/20/2027 | | 0.98 | | USD 1,550,000 | | | (3,783) | | | | 9,762 | | | | 5,979 | |
iTraxx Europe 28.1 | | 1.00 | | Quarterly | | 12/20/2022 | | 0.52 | | EUR 110,000 | | | 2,655 | | | | 647 | | | | 3,302 | |
| | | | | | | | | | | | | | |
| | | | | | | | | | | | | 32,656 | | | | 6,100 | | | | 38,756 | |
| | | | | | | | | | | | | | |
Centrally Cleared Interest rate swap contracts outstanding as of February 28, 2018:
| | | | | | | | | | | | | | | | | | | | |
| Floating Rate Index (a) | | Fixed Rate | | Pay/
Receive
Floating
Rate | | Maturity
Date | | Notional
Amount | | Upfront
Payments(Receipts)
($) | | | Value and
Unrealized
Appreciation
(Depreciation)
($) | | | |
| | |
3 Month LIBOR quarterly | | 2.34% semi-annually | | Receive | | 04/10/2027 | | USD 450,000 | | | – | | | | 16,028 | | |
| | | | | | | | | | | | | |
| | | | | | | | | | | – | | | | 16,028 | | |
| | | | | | | | | | | | | |
| | | | |
| (a) | | – | | Value of floating rate index at February 28, 2018 was 2.02%. |
| (1) | | – | | The Fund, as a buyer of credit protection, is generally obligated to make periodic payments and may also pay or receive an upfront premium to or from the protection seller, in exchange for the right to receive a contingent payment, upon occurrence of a credit event with respect to an underlying reference obligation, as defined under the terms of individual swap contracts. |
| (2) | | – | | The Fund, as a seller of credit protection, receives periodic payments and may also receive or pay an upfront premium from or to the protection buyer, and is obligated to make a contingent payment, upon occurrence of a credit event with respect to an underlying reference obligation, as defined under the terms of individual swap contracts. |
| (3) | | – | | Implied credit spreads are an indication of the seller’s performance risk, related to the likelihood of a credit event occurring that would require a seller to make payment to a buyer. Implied credit spreads are used to determine the value of swap contracts and reflect the cost of buying/selling protection, which may include upfront payments made to enter into the contract. Therefore, higher spreads would indicate a greater likelihood that a seller will be obligated to perform (i.e. make payment) under the swap contract. Increasing values, in absolute terms and relative to notional amounts, are also indicative of greater performance risk. Implied credit spreads for credit default swaps on credit indices are linked to the weighted average spread across the underlying reference obligations included in a particular index. |
| (4) | | – | | The notional amount is the maximum amount that a seller of credit protection would be obligated to pay and a buyer of credit protection would receive, upon occurrence of a credit event. |
| (5) | | – | | Upfront payments and receipts generally represent premiums paid or received at the initiation of the agreement to compensate the differences between the stated terms of the swap agreement and current market conditions (credit spreads, interest rates and other relevant factors). |
SEE NOTES TO FINANCIAL STATEMENTS.
28
JPMorgan Flexible Long/Short Fund
SCHEDULE OF PORTFOLIO INVESTMENTS
AS OF FEBRUARY 28, 2018 (continued)
(Amounts in U.S. Dollars, unless otherwise noted)
Written Call Options Contracts as of February 28, 2018:
| | | | | | | | | | | | | | | | | | |
| Description | | Counterparty | | Number of
Contracts | | | Notional Amount | | Exercise Price | | Expiration
Date | | | Value ($) | |
U.S. Treasury 10 Year Note, American Style | | Exchange Traded | | | 68 | | | USD 6,800,000 | | USD 122.50 | | | 03/23/2018 | | | | (3,187 | ) |
| | | | | | | | | | | | | | | | | | |
Total Written Options Contracts (Premiums Received $5,844) | | | | | | | | | | | | | | | (3,187 | ) |
| | | | | | | | | | | | | | | | | | |
| | | | | | | | |
Summary of total swap contracts outstanding as of February 28, 2018: | | | | | | |
| | | Net Upfront
Payments
(Receipts) ($) | | | Value ($) | |
Assets | | | | | | | | |
OTC Credit default swap contracts outstanding - sell protection | | | 9,803 | | | | 12,721 | |
| | | | |
Total OTC swap contracts outstanding | | | 9,803 | | | | 12,721 | |
| | | | |
| | |
Liabilities | | | | | | | | |
OTC Credit default swap contracts outstanding - buy protection | | | (47,590) | | | | (53,005) | |
| | | | |
Total OTC swap contracts outstanding | | | (47,590) | | | | (53,005) | |
| | | | |
SEE NOTES TO FINANCIAL STATEMENTS.
29
JPMorgan High Yield Opportunities Fund
SCHEDULE OF PORTFOLIO INVESTMENTS
AS OF FEBRUARY 28, 2018 (continued)
(Amounts in U.S. Dollars, unless otherwise noted)
| | | | | | | | |
PRINCIPAL
AMOUNT | | | SECURITY DESCRIPTION | | VALUE | |
| | |
| Convertible Bonds — 2.3% | | | | |
| | | | Consumer Discretionary — 0.6% | |
| | | | Media — 0.6% | |
| | 40,000 | | | DISH Network Corp., 3.38%, 08/15/2026 | | | 40,243 | |
| | 100,000 | | | Live Nation Entertainment, Inc., 2.50%, 05/15/2019 | | | 133,680 | |
| | | | | | | | |
| | | | Total Consumer Discretionary | | | 173,923 | |
| | | | | | | | |
| | | | Energy — 0.1% | |
| | | | Oil, Gas & Consumable Fuels — 0.1% | |
| | 15,000 | | | Chesapeake Energy Corp., 5.50%, 09/15/2026 | | | 12,886 | |
| | | | | | | | |
| | | | Information Technology — 1.6% | |
| | | | Communications Equipment — 0.3% | |
| | 100,000 | | | Finisar Corp., 0.50%, 12/15/2036 | | | 91,855 | |
| | | | | | | | |
| | | | Electronic Equipment, Instruments & Components — 0.4% | |
| | 100,000 | | | II-VI, Inc., 0.25%, 09/01/2022 (e) | | | 107,238 | |
| | | | | | | | |
| | | | Semiconductors & Semiconductor Equipment — 0.9% | |
| | 100,000 | | | Cypress Semiconductor Corp., 2.00%, 02/01/2023 (e) | | | 109,681 | |
| | 100,000 | | | ON Semiconductor Corp., 1.00%, 12/01/2020 | | | 139,884 | |
| | | | | | | | |
| | | | | | | 249,565 | |
| | | | | | | | |
| | | | Total Information Technology | | | 448,658 | |
| | | | | | | | |
| | | | Total Convertible Bonds
(Cost $564,744) | | | 635,467 | |
| | | | | | | | |
| | Corporate Bonds — 86.9% | | | | |
| | | | Consumer Discretionary — 22.6% | |
| | | | Auto Components — 2.7% | |
| | EUR150,000 | | | Adient Global Holdings Ltd., Reg. S, 3.50%, 08/15/2024 | | | 187,575 | |
| | 20,000 | | | Allison Transmission, Inc., 5.00%, 10/01/2024 (e) | | | 20,275 | |
| | | | American Axle & Manufacturing, Inc., | | | | |
| | 75,000 | | | 6.25%, 04/01/2025 | | | 77,391 | |
| | 65,000 | | | 6.50%, 04/01/2027 | | | 67,112 | |
| | 40,000 | | | Cooper-Standard Automotive, Inc., 5.63%, 11/15/2026 (e) | | | 40,800 | |
| | 135,000 | | | Dana Financing Luxembourg SARL, 6.50%, 06/01/2026 (e) | | | 144,450 | |
| | 40,000 | | | Delphi Technologies plc, 5.00%, 10/01/2025 (e) | | | 39,662 | |
| | 100,000 | | | Goodyear Tire & Rubber Co. (The), 5.13%, 11/15/2023 | | | 102,375 | |
| | 57,000 | | | TI Group Automotive Systems LLC, (United Kingdom), 8.75%, 07/15/2023 (e) | | | 60,420 | |
| | | | | | | | |
| | | | | | | 740,060 | |
| | | | | | | | |
| | | | | | | | |
PRINCIPAL
AMOUNT | | | SECURITY DESCRIPTION | | VALUE | |
| | |
| |
| | | | Diversified Consumer Services — 0.4% | |
| | 100,000 | | | Service Corp. International, 7.50%, 04/01/2027 | | | 116,500 | |
| | | | | | | | |
| | | | Hotels, Restaurants & Leisure — 3.7% | |
| | EUR100,000 | | | Cirsa Funding Luxembourg SA, (Spain), Reg. S, 5.75%, 05/15/2021 | | | 126,178 | |
| | 45,000 | | | Constellation Merger Sub, Inc., 8.50%, 09/15/2025 (e) | | | 44,072 | |
| | 10,000 | | | Hilton Grand Vacations Borrower LLC, 6.13%, 12/01/2024 | | | 10,775 | |
| | | | Hilton Worldwide Finance LLC, | | | | |
| | 20,000 | | | 4.63%, 04/01/2025 | | | 20,075 | |
| | 10,000 | | | 4.88%, 04/01/2027 | | | 10,000 | |
| | 50,000 | | | Interval Acquisition Corp., 5.63%, 04/15/2023 | | | 51,500 | |
| | 80,000 | | | Jack Ohio Finance LLC, 6.75%, 11/15/2021 (e) | | | 83,358 | |
| | | | MGM Resorts International, | | | | |
| | 390,000 | | | 4.63%, 09/01/2026 | | | 381,221 | |
| | 30,000 | | | 6.00%, 03/15/2023 | | | 31,913 | |
| | 125,000 | | | Sabre GLBL, Inc., 5.38%, 04/15/2023 (e) | | | 125,937 | |
| | 20,000 | | | Scientific Games International, Inc., 7.00%, 01/01/2022 (e) | | | 21,050 | |
| | 100,000 | | | Wynn Las Vegas LLC, 5.50%, 03/01/2025 (e) | | | 101,375 | |
| | | | | | | | |
| | | | | | | 1,007,454 | |
| | | | | | | | |
| | | | Household Durables — 0.4% | | | | |
| | 120,000 | | | Tempur Sealy International, Inc., 5.63%, 10/15/2023 | | | 121,200 | |
| | | | | | | | |
| | | | Internet & Direct Marketing Retail — 0.7% | |
| | EUR97,701 | | | eDreams ODIGEO SA, (Spain), 8.50%, 08/01/2021 (e) | | | 127,241 | |
| | | | Netflix, Inc., | | | | |
| | 10,000 | | | 4.38%, 11/15/2026 | | | 9,600 | |
| | 45,000 | | | 4.88%, 04/15/2028 (e) | | | 44,212 | |
| | | | | | | | |
| | | | | | | 181,053 | |
| | | | | | | | |
| | | | Leisure Products — 0.7% | | | | |
| | 65,000 | | | Mattel, Inc., 6.75%, 12/31/2025 (e) | | | 66,137 | |
| | 130,000 | | | Vista Outdoor, Inc., 5.88%, 10/01/2023 | | | 128,538 | |
| | | | | | | | |
| | | | | | | 194,675 | |
| | | | | | | | |
| | | | Media — 10.9% | | | | |
| | | | Altice Luxembourg SA, (Luxembourg), | | | | |
| | 200,000 | | | 7.75%, 05/15/2022 (e) | | | 186,500 | |
| | EUR110,000 | | | Reg. S, 7.25%, 05/15/2022 | | | 129,397 | |
| | 95,000 | | | AMC Entertainment Holdings, Inc., 5.75%, 06/15/2025 | | | 92,387 | |
| | 55,000 | | | AMC Networks, Inc., 5.00%, 04/01/2024 | | | 55,137 | |
SEE NOTES TO FINANCIAL STATEMENTS.
30
JPMorgan High Yield Opportunities Fund
SCHEDULE OF PORTFOLIO INVESTMENTS
AS OF FEBRUARY 28, 2018 (continued)
(Amounts in U.S. Dollars, unless otherwise noted)
| | | | | | | | |
PRINCIPAL
AMOUNT | | | SECURITY DESCRIPTION | | VALUE | |
| | |
| Corporate Bonds — continued | | | | |
| | | | Media — continued | | | | |
| | 50,000 | | | CBS Radio, Inc., 7.25%, 11/01/2024 (e) | | | 51,490 | |
| | | | Clear Channel Worldwide Holdings, Inc., | | | | |
| | 305,000 | | | Series B, 6.50%, 11/15/2022 | | | 313,388 | |
| | 190,000 | | | Series B, 7.63%, 03/15/2020 | | | 189,762 | |
| | | | DISH DBS Corp., | | | | |
| | 60,000 | | | 5.00%, 03/15/2023 | | | 55,125 | |
| | 115,000 | | | 5.88%, 07/15/2022 | | | 112,125 | |
| | 465,000 | | | 5.88%, 11/15/2024 | | | 434,775 | |
| | 30,000 | | | 7.75%, 07/01/2026 | | | 29,550 | |
| | 35,000 | | | Meredith Corp., 6.88%, 02/01/2026 (e) | | | 36,094 | |
| | 55,000 | | | Midcontinent Communications, 6.88%, 08/15/2023 (e) | | | 57,956 | |
| | 50,000 | | | Regal Entertainment Group, 5.75%, 06/15/2023 | | | 51,375 | |
| | EUR100,000 | | | SES SA, (Luxembourg), Reg. S, (EUR Swap Annual 5 Year + 4.66%), 4.62%, 01/02/2022 (x) (y) (aa) | | | 129,200 | |
| | 100,000 | | | Sinclair Television Group, Inc., 5.63%, 08/01/2024 (e) | | | 101,500 | |
| | | | Sirius XM Radio, Inc., | | | | |
| | 10,000 | | | 5.00%, 08/01/2027 (e) | | | 9,722 | |
| | 270,000 | | | 5.38%, 04/15/2025 (e) | | | 274,388 | |
| | 25,000 | | | 6.00%, 07/15/2024 (e) | | | 26,187 | |
| | EUR100,000 | | | Unitymedia GmbH, (Germany), Reg. S, 3.75%, 01/15/2027 | | | 128,503 | |
| | 200,000 | | | UPCB Finance IV Ltd., (Netherlands), 5.38%, 01/15/2025 (e) | | | 198,124 | |
| | | | Videotron Ltd., (Canada), | | | | |
| | 25,000 | | | 5.13%, 04/15/2027 (e) | | | 25,222 | |
| | 200,000 | | | 5.38%, 06/15/2024 (e) | | | 207,000 | |
| | 90,000 | | | WMG Acquisition Corp., 5.63%, 04/15/2022 (e) | | | 92,025 | |
| | | | | | | | |
| | | | | | | 2,986,932 | |
| | | | | | | | |
| | | | Multiline Retail — 0.2% | | | | |
| | 83,800 | | | Neiman Marcus Group Ltd. LLC, 9.50% (PIK), 10/15/2021 (e) (v) | | | 44,318 | |
| | | | | | | | |
| | | | | | | |
| | | | Specialty Retail — 2.7% | | | | |
| | EUR100,000 | | | EVOCA SpA, (Italy), Reg. S, 7.00%, 10/15/2023 | | | 129,733 | |
| | EUR100,000 | | | Fnac Darty SA, (France), 3.25%, 09/30/2023 (e) | | | 127,012 | |
| | EUR100,000 | | | Hema Bondco II BV, (Netherlands), Reg. S, 8.50%, 01/15/2023 | | | 123,281 | |
| | EUR100,000 | | | Kirk Beauty One GmbH, (Germany), Reg. S, 8.75%, 07/15/2023 | | | 128,654 | |
| | | | PetSmart, Inc., | | | | |
| | 60,000 | | | 5.88%, 06/01/2025 (e) | | | 46,800 | |
| | 90,000 | | | 7.13%, 03/15/2023 (e) | | | 57,366 | |
| | | | | | | | |
PRINCIPAL
AMOUNT | | | SECURITY DESCRIPTION | | VALUE | |
| | |
| | |
| | | | Specialty Retail — continued | | | | |
| | 35,000 | | | 8.88%, 06/01/2025 (e) | | | 22,312 | |
| | 100,000 | | | Staples, Inc., 8.50%, 09/15/2025 (e) | | | 96,000 | |
| | | | | | | | |
| | | | | | | 731,158 | |
| | | | | | | | |
| | | | Textiles, Apparel & Luxury Goods — 0.2% | |
| | EUR54,000 | | | SMCP Group SAS, (China), Reg. S, 5.88%, 05/01/2023 | | | 70,419 | |
| | | | | | | | |
| | | | Total Consumer Discretionary | | | 6,193,769 | |
| | | | | | | | |
| | | | Consumer Staples — 3.1% | |
| | | | Food & Staples Retailing — 1.4% | |
| | | | Albertsons Cos. LLC, | | | | |
| | 5,000 | | | 5.75%, 03/15/2025 | | | 4,350 | |
| | 35,000 | | | 6.63%, 06/15/2024 | | | 32,244 | |
| | GBP100,000 | | | Iceland Bondco plc, (United Kingdom), Reg. S, 4.63%, 03/15/2025 | | | 127,255 | |
| | EUR122,000 | | | Picard Bondco SA, (Luxembourg), 5.50%, 11/30/2024 (e) | | | 150,433 | |
| | 75,000 | | | Rite Aid Corp., 6.13%, 04/01/2023 (e) | | | 75,562 | |
| | | | | | | | |
| | | | | | | 389,844 | |
| | | | | | | | |
| | | | Food Products — 0.4% | | | | |
| | | | Post Holdings, Inc., | | | | |
| | 15,000 | | | 5.50%, 03/01/2025 (e) | | | 15,093 | |
| | 25,000 | | | 5.63%, 01/15/2028 (e) | | | 24,344 | |
| | 10,000 | | | 5.75%, 03/01/2027 (e) | | | 9,875 | |
| | 50,000 | | | TreeHouse Foods, Inc., 6.00%, 02/15/2024 (e) | | | 50,938 | |
| | | | | | | | |
| | | | | | | 100,250 | |
| | | | | | | | |
| | | | Household Products — 1.2% | |
| | | | Central Garden & Pet Co., | | | | |
| | 25,000 | | | 5.13%, 02/01/2028 | | | 24,344 | |
| | 100,000 | | | 6.13%, 11/15/2023 | | | 104,375 | |
| | 50,000 | | | Energizer Holdings, Inc., 5.50%, 06/15/2025 (e) | | | 50,000 | |
| | 100,000 | | | HRG Group, Inc., 7.75%, 01/15/2022 | | | 104,312 | |
| | 30,000 | | | Kronos Acquisition Holdings, Inc., (Canada), 9.00%, 08/15/2023 (e) | | | 29,100 | |
| | | | | | | | |
| | | | | | | 312,131 | |
| | | | | | | | |
| | | | Personal Products — 0.1% | |
| | 40,000 | | | High Ridge Brands Co., 8.88%, 03/15/2025 (e) | | | 35,800 | |
| | | | | | | | |
| | | | Total Consumer Staples | | | 838,025 | |
| | | | | | | | |
| | | | Energy — 9.1% | | | | |
| | | | Energy Equipment & Services — 1.4% | |
| | | | Nabors Industries, Inc., | | | | |
| | 30,000 | | | 5.50%, 01/15/2023 | | | 29,775 | |
| | 10,000 | | | 5.75%, 02/01/2025 (e) | | | 9,544 | |
| | | | Precision Drilling Corp., (Canada), | | | | |
| | 30,000 | | | 7.13%, 01/15/2026 (e) | | | 30,262 | |
SEE NOTES TO FINANCIAL STATEMENTS.
31
JPMorgan High Yield Opportunities Fund
SCHEDULE OF PORTFOLIO INVESTMENTS
AS OF FEBRUARY 28, 2018 (continued)
(Amounts in U.S. Dollars, unless otherwise noted)
| | | | | | | | |
PRINCIPAL
AMOUNT | | | SECURITY DESCRIPTION | | VALUE | |
| | |
| Corporate Bonds — continued | | | | |
| | | | Energy Equipment & Services — continued | |
| | 35,000 | | | 7.75%, 12/15/2023 | | | 36,925 | |
| | EUR100,000 | | | Saipem Finance International BV, (Italy), Reg. S, 3.75%, 09/08/2023 | | | 129,930 | |
| | 30,000 | | | Transocean, Inc., 7.50%, 01/15/2026 (e) | | | 30,225 | |
| | EUR100,000 | | | Vallourec SA, (France), Reg. S, 2.25%, 09/30/2024 | | | 102,659 | |
| | 10,000 | | | Weatherford International Ltd., 9.88%, 02/15/2024 | | | 9,900 | |
| | | | | | | | |
| | | | | | | 379,220 | |
| | | | | | | | |
| | | | Oil, Gas & Consumable Fuels — 7.7% | |
| | 20,000 | | | Alta Mesa Holdings LP, 7.88%, 12/15/2024 | | | 21,300 | |
| | 20,000 | | | Andeavor Logistics LP, 5.25%, 01/15/2025 | | | 20,526 | |
| | 100,000 | | | Antero Midstream Partners LP, 5.38%, 09/15/2024 | | | 102,250 | |
| | 80,000 | | | Blue Racer Midstream LLC, 6.13%, 11/15/2022 (e) | | | 82,000 | |
| | 15,000 | | | Carrizo Oil & Gas, Inc., 8.25%, 07/15/2025 | | | 16,012 | |
| | | | Cheniere Corpus Christi Holdings LLC, | | | | |
| | 30,000 | | | 5.13%, 06/30/2027 | | | 30,338 | |
| | 35,000 | | | 5.88%, 03/31/2025 | | | 37,012 | |
| | | | Chesapeake Energy Corp., | | | | |
| | 70,000 | | | 8.00%, 12/15/2022 (e) | | | 74,462 | |
| | 95,000 | | | 8.00%, 01/15/2025 (e) | | | 93,813 | |
| | 60,000 | | | 8.00%, 06/15/2027 (e) | | | 57,525 | |
| | 90,000 | | | Continental Resources, Inc., 4.50%, 04/15/2023 | | | 91,125 | |
| | 30,000 | | | Covey Park Energy LLC, 7.50%, 05/15/2025 (e) | | | 30,450 | |
| | 48,000 | | | Denbury Resources, Inc., 9.25%, 03/31/2022 (e) | | | 49,200 | |
| | | | EP Energy LLC, | | | | |
| | 50,000 | | | 8.00%, 11/29/2024 (e) | | | 51,500 | |
| | 35,000 | | | 8.00%, 02/15/2025 (e) | | | 24,062 | |
| | 5,000 | | | 9.38%, 05/01/2024 (e) | | | 3,688 | |
| | 25,000 | | | Gulfport Energy Corp., 6.63%, 05/01/2023 | | | 25,687 | |
| | 55,000 | | | Halcon Resources Corp., 6.75%, 02/15/2025 | | | 55,550 | |
| | 20,000 | | | Hess Infrastructure Partners LP, 5.63%, 02/15/2026 (e) | | | 20,000 | |
| | | | MEG Energy Corp., (Canada), | | | | |
| | 25,000 | | | 6.38%, 01/30/2023 (e) | | | 21,437 | |
| | 45,000 | | | 6.50%, 01/15/2025 (e) | | | 44,156 | |
| | 145,000 | | | 7.00%, 03/31/2024 (e) | | | 123,613 | |
| | | | NGPL PipeCo LLC, | | | | |
| | 35,000 | | | 4.38%, 08/15/2022 (e) | | | 34,912 | |
| | 10,000 | | | 4.88%, 08/15/2027 (e) | | | 10,088 | |
| | 140,000 | | | Oasis Petroleum, Inc., 6.88%, 01/15/2023 | | | 143,062 | |
| | | | Parsley Energy LLC, | | | | |
| | 15,000 | | | 5.25%, 08/15/2025 (e) | | | 14,775 | |
| | | | | | | | |
PRINCIPAL
AMOUNT | | | SECURITY DESCRIPTION | | VALUE | |
| | |
| |
| | | | Oil, Gas & Consumable Fuels — continued | |
| | 20,000 | | | 5.63%, 10/15/2027 (e) | | | 19,838 | |
| | | | RSP Permian, Inc., | | | | |
| | 15,000 | | | 5.25%, 01/15/2025 | | | 15,113 | |
| | 40,000 | | | 6.63%, 10/01/2022 | | | 41,700 | |
| | | | SM Energy Co., | | | | |
| | 50,000 | | | 6.50%, 11/15/2021 | | | 50,750 | |
| | 25,000 | | | 6.50%, 01/01/2023 | | | 25,000 | |
| | | | Southwestern Energy Co., | | | | |
| | 30,000 | | | 4.10%, 03/15/2022 | | | 28,125 | |
| | 75,000 | | | 6.70%, 01/23/2025 | | | 73,500 | |
| | 20,000 | | | 7.50%, 04/01/2026 | | | 20,200 | |
| | 20,000 | | | 7.75%, 10/01/2027 | | | 20,400 | |
| | 25,000 | | | Summit Midstream Holdings LLC, 5.75%, 04/15/2025 | | | 25,000 | |
| | | | Sunoco LP, | | | | |
| | 10,000 | | | 4.88%, 01/15/2023 (e) | | | 9,925 | |
| | 15,000 | | | 5.50%, 02/15/2026 (e) | | | 15,000 | |
| | 60,000 | | | Tallgrass Energy Partners LP, 5.50%, 01/15/2028 (e) | | | 60,300 | |
| | | | Targa Resources Partners LP, | | | | |
| | 100,000 | | | 4.25%, 11/15/2023 | | | 97,500 | |
| | 30,000 | | | 5.00%, 01/15/2028 (e) | | | 29,138 | |
| | | | Whiting Petroleum Corp., | | | | |
| | 85,000 | | | 5.75%, 03/15/2021 | | | 86,913 | |
| | 15,000 | | | 6.63%, 01/15/2026 (e) | | | 15,206 | |
| | 50,000 | | | WildHorse Resource Development Corp., 6.88%, 02/01/2025 | | | 51,250 | |
| | | | WPX Energy, Inc., | | | | |
| | 75,000 | | | 6.00%, 01/15/2022 | | | 77,812 | |
| | 65,000 | | | 8.25%, 08/01/2023 | | | 73,613 | |
| | | | | | | | |
| | | | | | | 2,114,826 | |
| | | | | | | | |
| | | | Total Energy | | | 2,494,046 | |
| | | | | | | | |
| | | | Financials — 1.4% | |
| | | | Banks — 0.7% | |
| | 150,000 | | | Bank of America Corp., Series K, (ICE LIBOR USD 3 Month + 3.63%), 5.40%, 04/30/2018 (x) (y) (aa) | | | 150,225 | |
| | | | Citigroup, Inc., | | | | |
| | 20,000 | | | Series N, (ICE LIBOR USD 3 Month + 4.09%), 5.80%, 11/15/2019 (x) (y) (aa) | | | 20,704 | |
| | 25,000 | | | Series O, (ICE LIBOR USD 3 Month + 4.06%), 5.87%, 03/27/2020 (x) (y) (aa) | | | 25,906 | |
| | | | | | | | |
| | | | | | | 196,835 | |
| | | | | | | | |
| | | | Diversified Financial Services — 0.7% | |
| | 50,000 | | | Infinity Acquisition LLC, 7.25%, 08/01/2022 (e) | | | 50,125 | |
| | EUR100,000 | | | Worldpay Finance plc, (United Kingdom), Reg. S, 3.75%, 11/15/2022 | | | 131,654 | |
SEE NOTES TO FINANCIAL STATEMENTS.
32
JPMorgan High Yield Opportunities Fund
SCHEDULE OF PORTFOLIO INVESTMENTS
AS OF FEBRUARY 28, 2018 (continued)
(Amounts in U.S. Dollars, unless otherwise noted)
| | | | | | | | |
PRINCIPAL
AMOUNT | | | SECURITY DESCRIPTION | | VALUE | |
| | |
| Corporate Bonds — continued | | | | |
| | | | Diversified Financial Services — continued | |
| | | | | | | | |
| | | | | | | 181,779 | |
| | | | | | | | |
| | | | Total Financials | | | 378,614 | |
| | | | | | | | |
| | | | Health Care — 11.9% | |
| | | | Health Care Equipment & Supplies — 1.4% | |
| | EUR100,000 | | | Auris Luxembourg II SA, (Luxembourg), Reg. S, 8.00%, 01/15/2023 | | | 127,307 | |
| | 35,000 | | | Avantor, Inc., 6.00%, 10/01/2024 (e) | | | 35,000 | |
| | 100,000 | | | DJO Finco, Inc., 8.13%, 06/15/2021 (e) | | | 97,000 | |
| | 10,000 | | | Hill-Rom Holdings, Inc., 5.00%, 02/15/2025 (e) | | | 9,975 | |
| | 35,000 | | | Hologic, Inc., 4.38%, 10/15/2025 (e) | | | 34,169 | |
| | 100,000 | | | Mallinckrodt International Finance SA, 5.63%, 10/15/2023 (e) | | | 83,625 | |
| | | | | | | | |
| | | | | | | 387,076 | |
| | | | | | | | |
| | | | Health Care Providers & Services — 6.6% | |
| | 70,000 | | | Air Medical Group Holdings, Inc., 6.38%, 05/15/2023 (e) | | | 66,500 | |
| | EUR100,000 | | | Constantin Investissement 3 SASU, (France), Reg. S, 5.38%, 04/15/2025 | | | 121,855 | |
| | 50,000 | | | DaVita, Inc., 5.00%, 05/01/2025 | | | 49,000 | |
| | 100,000 | | | Encompass Health Corp., 5.75%, 11/01/2024 | | | 101,375 | |
| | | | HCA, Inc., | | | | |
| | 10,000 | | | 5.25%, 04/15/2025 | | | 10,275 | |
| | 685,000 | | | 5.38%, 02/01/2025 | | | 696,350 | |
| | 90,000 | | | 5.88%, 02/15/2026 | | | 93,150 | |
| | 90,000 | | | Kindred Healthcare, Inc., 8.75%, 01/15/2023 | | | 96,300 | |
| | EUR150,000 | | | Synlab Unsecured Bondco plc, (United Kingdom), Reg. S, 8.25%, 07/01/2023 | | | 196,009 | |
| | | | Tenet Healthcare Corp., | | | | |
| | 185,000 | | | 6.75%, 06/15/2023 | | | 185,000 | |
| | 20,000 | | | 7.00%, 08/01/2025 (e) | | | 19,950 | |
| | 25,000 | | | 7.50%, 01/01/2022 (e) | | | 26,406 | |
| | 145,000 | | | 8.13%, 04/01/2022 | | | 152,613 | |
| | | | | | | | |
| | | | | | | 1,814,783 | |
| | | | | | | | |
| | | | Health Care Technology — 0.2% | |
| | 50,000 | | | Quintiles IMS, Inc., 4.88%, 05/15/2023 (e) | | | 51,375 | |
| | | | | | | | |
| | | | Pharmaceuticals — 3.7% | |
| | 31,000 | | | inVentiv Group Holdings, Inc., 7.50%, 10/01/2024 (e) | | | 33,170 | |
| | EUR100,000 | | | Nidda BondCo GmbH, (Germany), Reg. S, 5.00%, 09/30/2025 | | | 120,798 | |
| | | | Valeant Pharmaceuticals International, Inc., | | | | |
| | 25,000 | | | 5.50%, 11/01/2025 (e) | | | 24,734 | |
| | 610,000 | | | 5.88%, 05/15/2023 (e) | | | 542,138 | |
| | 225,000 | | | 6.13%, 04/15/2025 (e) | | | 197,297 | |
| | 45,000 | | | 7.00%, 03/15/2024 (e) | | | 47,419 | |
| | | | | | | | |
PRINCIPAL
AMOUNT | | | SECURITY DESCRIPTION | | VALUE | |
| | |
| |
| | | | Pharmaceuticals — continued | |
| | 55,000 | | | 9.00%, 12/15/2025 (e) | | | 55,103 | |
| | | | | | | | |
| | | | | | | 1,020,659 | |
| | | | | | | | |
| | | | Total Health Care | | | 3,273,893 | |
| | | | | | | | |
| | | | Industrials — 8.6% | |
| | | | Aerospace & Defense — 1.7% | |
| | 150,000 | | | Arconic, Inc., 5.90%, 02/01/2027 | | | 161,250 | |
| | 70,000 | | | KLX, Inc., 5.88%, 12/01/2022 (e) | | | 72,100 | |
| | 25,000 | | | Kratos Defense & Security Solutions, Inc., 6.50%, 11/30/2025 (e) | | | 26,062 | |
| | EUR90,000 | | | Leonardo SpA, (Italy), 5.25%, 01/21/2022 | | | 127,142 | |
| | 90,000 | | | Triumph Group, Inc., 7.75%, 08/15/2025 | | | 93,038 | |
| | | | | | | | |
| | | | | | | 479,592 | |
| | | | | | | | |
| | | | Air Freight & Logistics — 0.4% | |
| | 100,000 | | | XPO Logistics, Inc., 6.50%, 06/15/2022 (e) | | | 103,925 | |
| | | | | | | | |
| | | | Building Products — 0.2% | |
| | 15,000 | | | American Woodmark Corp., 4.88%, 03/15/2026 (e) | | | 14,887 | |
| | | | Jeld-Wen, Inc., | | | | |
| | 25,000 | | | 4.63%, 12/15/2025 (e) | | | 24,438 | |
| | 10,000 | | | 4.88%, 12/15/2027 (e) | | | 9,700 | |
| | | | | | | | |
| | | | | | | 49,025 | |
| | | | | | | | |
| | | | Commercial Services & Supplies — 0.6% | |
| | 25,000 | | | ACCO Brands Corp., 5.25%, 12/15/2024 (e) | | | 25,125 | |
| | 30,000 | | | Aramark Services, Inc., 5.00%, 02/01/2028 (e) | | | 29,887 | |
| | EUR90,000 | | | Verisure Holding AB, (Sweden), Reg. S, 6.00%, 11/01/2022 | | | 115,995 | |
| | | | | | | | |
| | | | | | | 171,007 | |
| | | | | | | | |
| | | | Construction & Engineering — 0.1% | |
| | 25,000 | | | Great Lakes Dredge & Dock Corp., 8.00%, 05/15/2022 | | | 26,000 | |
| | | | | | | | |
| | | | Electrical Equipment — 0.2% | |
| | 65,000 | | | General Cable Corp., 5.75%, 10/01/2022 | | | 66,788 | |
| | | | | | | | |
| | | | Machinery — 1.8% | |
| | EUR100,000 | | | Galapagos SA, (Luxembourg), Reg. S, 5.38%, 06/15/2021 | | | 118,931 | |
| | 55,000 | | | Hillman Group, Inc. (The), 6.38%, 07/15/2022 (e) | | | 53,625 | |
| | 100,000 | | | Novelis Corp., 5.88%, 09/30/2026 (e) | | | 100,750 | |
| | 20,000 | | | RBS Global, Inc., 4.88%, 12/15/2025 (e) | | | 19,700 | |
| | 40,000 | | | Terex Corp., 5.63%, 02/01/2025 (e) | | | 40,400 | |
| | 20,000 | | | TriMas Corp., 4.88%, 10/15/2025 (e) | | | 19,706 | |
| | 25,000 | | | Wabash National Corp., 5.50%, 10/01/2025 (e) | | | 24,750 | |
| | 100,000 | | | Welbilt, Inc., 9.50%, 02/15/2024 | | | 111,000 | |
| | | | | | | | |
| | | | | | | 488,862 | |
| | | | | | | | |
SEE NOTES TO FINANCIAL STATEMENTS.
33
JPMorgan High Yield Opportunities Fund
SCHEDULE OF PORTFOLIO INVESTMENTS
AS OF FEBRUARY 28, 2018 (continued)
(Amounts in U.S. Dollars, unless otherwise noted)
| | | | | | | | |
PRINCIPAL
AMOUNT | | | SECURITY DESCRIPTION | | VALUE | |
| | |
| Corporate Bonds — continued | | | | |
| | | | Road & Rail — 2.4% | |
| | 125,000 | | | Avis Budget Car Rental LLC, 6.38%, 04/01/2024 (e) | | | 127,812 | |
| | EUR100,000 | | | Europcar Groupe SA, (France), Reg. S, 5.75%, 06/15/2022 | | | 126,565 | |
| | 97,000 | | | Herc Rentals, Inc., 7.75%, 06/01/2024 (e) | | | 105,701 | |
| | | | Hertz Corp. (The), | | | | |
| | 145,000 | | | 5.50%, 10/15/2024 (e) | | | 125,788 | |
| | 95,000 | | | 6.25%, 10/15/2022 | | | 89,983 | |
| | 70,000 | | | 7.63%, 06/01/2022 (e) | | | 72,100 | |
| | | | | | | | |
| | | | | | | 647,949 | |
| | | | | | | | |
| | | | Trading Companies & Distributors — 1.2% | |
| | EUR100,000 | | | Rexel SA, (France), Reg. S, 2.63%, 06/15/2024 | | | 125,209 | |
| | | | United Rentals North America, Inc., | | | | |
| | 55,000 | | | 4.88%, 01/15/2028 | | | 53,625 | |
| | 150,000 | | | 5.50%, 07/15/2025 | | | 154,500 | |
| | | | | | | | |
| | | | | | | 333,334 | |
| | | | | | | | |
| | | | Total Industrials | | | 2,366,482 | |
| | | | | | | | |
| | | | Information Technology — 5.9% | |
| | | | Communications Equipment — 0.7% | |
| | 150,000 | | | CommScope Technologies LLC, 6.00%, 06/15/2025 (e) | | | 154,920 | |
| | 40,000 | | | Riverbed Technology, Inc., 8.88%, 03/01/2023 (e) | | | 37,500 | |
| | | | | | | | |
| | | | | | | 192,420 | |
| | | | | | | | |
| | | | Internet Software & Services — 1.0% | |
| | 60,000 | | | Cogent Communications Group, Inc., 5.38%, 03/01/2022 (e) | | | 62,475 | |
| | 100,000 | | | Rackspace Hosting, Inc., 8.63%, 11/15/2024 (e) | | | 104,250 | |
| | 100,000 | | | Zayo Group LLC, 6.38%, 05/15/2025 | | | 104,625 | |
| | | | | | | | |
| | | | | | | 271,350 | |
| | | | | | | | |
| | | | IT Services — 1.2% | |
| | | | First Data Corp., | | | | |
| | 10,000 | | | 5.38%, 08/15/2023 (e) | | | 10,174 | |
| | 295,000 | | | 5.75%, 01/15/2024 (e) | | | 300,163 | |
| | 25,000 | | | Gartner, Inc., 5.13%, 04/01/2025 (e) | | | 25,625 | |
| | | | | | | | |
| | | | | | | 335,962 | |
| | | | | | | | |
| | | | Semiconductors & Semiconductor Equipment — 0.9% | |
| | 100,000 | | | Amkor Technology, Inc., 6.38%, 10/01/2022 | | | 102,875 | |
| | 45,000 | | | Entegris, Inc., 4.63%, 02/10/2026 (e) | | | 44,212 | |
| | 90,000 | | | Microsemi Corp., 9.13%, 04/15/2023 (e) | | | 99,675 | |
| | | | | | | | |
| | | | | | | 246,762 | |
| | | | | | | | |
| | | | Software — 1.7% | |
| | 100,000 | | | ACI Worldwide, Inc., 6.38%, 08/15/2020 (e) | | | 101,000 | |
| | | | | | | | |
PRINCIPAL
AMOUNT | | | SECURITY DESCRIPTION | | VALUE | |
| | |
| |
| | | | Software — continued | |
| | 20,000 | | | Ascend Learning LLC, 6.88%, 08/01/2025 (e) | | | 20,600 | |
| | 260,000 | | | Infor US, Inc., 6.50%, 05/15/2022 | | | 265,850 | |
| | 70,000 | | | Informatica LLC, 7.13%, 07/15/2023 (e) | | | 71,365 | |
| | | | | | | | |
| | | | | | | 458,815 | |
| | | | | | | | |
| | | | Technology Hardware, Storage & Peripherals — 0.4% | |
| | 100,000 | | | Western Digital Corp., 7.38%, 04/01/2023 (e) | | | 108,700 | |
| | | | | | | | |
| | | | Total Information Technology | | | 1,614,009 | |
| | | | | | | | |
| | | | Materials — 7.4% | |
| | | | Chemicals — 3.8% | |
| | 55,000 | | | Chemours Co. (The), 6.63%, 05/15/2023 | | | 57,819 | |
| | EUR100,000 | | | CTC BondCo GmbH, (Germany), 5.25%, 12/15/2025 (e) | | | 121,866 | |
| | 36,000 | | | Gates Global LLC, 6.00%, 07/15/2022 (e) | | | 36,654 | |
| | 100,000 | | | GCP Applied Technologies, Inc., 9.50%, 02/01/2023 (e) | | | 109,625 | |
| | 130,000 | | | Hexion, Inc., 6.63%, 04/15/2020 | | | 120,900 | |
| | 200,000 | | | INEOS Group Holdings SA, (Luxembourg), 5.63%, 08/01/2024 (e) | | | 203,250 | |
| | 100,000 | | | LSB Industries, Inc., SUB, 8.50%, 08/01/2019 | | | 99,750 | |
| | | | NOVA Chemicals Corp., (Canada), | | | | |
| | 45,000 | | | 4.88%, 06/01/2024 (e) | | | 44,437 | |
| | 20,000 | | | 5.25%, 06/01/2027 (e) | | | 19,550 | |
| | 60,000 | | | Rain CII Carbon LLC, 7.25%, 04/01/2025 (e) | | | 64,875 | |
| | | | Scotts Miracle-Gro Co. (The), | | | | |
| | 5,000 | | | 5.25%, 12/15/2026 | | | 5,061 | |
| | 100,000 | | | 6.00%, 10/15/2023 | | | 104,500 | |
| | 35,000 | | | Trinseo Materials Operating SCA, 5.38%, 09/01/2025 (e) | | | 35,394 | |
| | 25,000 | | | Venator Finance SARL, 5.75%, 07/15/2025 (e) | | | 25,438 | |
| | | | | | | | |
| | | | | | | 1,049,119 | |
| | | | | | | | |
| | | | Containers & Packaging — 3.2% | |
| | | | Ardagh Packaging Finance plc, (Ireland), | | | | |
| | EUR100,000 | | | Reg. S, 6.75%, 05/15/2024 | | | 133,132 | |
| | 200,000 | | | 7.25%, 05/15/2024 (e) | | | 214,250 | |
| | EUR100,000 | | | Horizon Parent Holdings SARL, (France), Reg. S, 8.25% (cash), 02/15/2022 (v) | | | 128,911 | |
| | | | Reynolds Group Issuer, Inc., | | | | |
| | 50,000 | | | (ICE LIBOR USD 3 Month + 3.50%), 5.22%, 07/15/2021 (e) (aa) | | | 50,563 | |
| | 96,911 | | | 5.75%, 10/15/2020 | | | 98,243 | |
| | EUR100,000 | | | SIG Combibloc Holdings SCA, (Luxembourg), Reg. S, 7.75%, 02/15/2023 | | | 126,579 | |
SEE NOTES TO FINANCIAL STATEMENTS.
34
JPMorgan High Yield Opportunities Fund
SCHEDULE OF PORTFOLIO INVESTMENTS
AS OF FEBRUARY 28, 2018 (continued)
(Amounts in U.S. Dollars, unless otherwise noted)
| | | | | | | | |
PRINCIPAL
AMOUNT | | | SECURITY DESCRIPTION | | VALUE | |
| | |
| | Corporate Bonds — continued | | | | |
| |
| | | | Containers & Packaging — continued | |
| | EUR100,000 | | | Silgan Holdings, Inc., 3.25%, 03/15/2025 | | | 124,416 | |
| | | | | | | | |
| | | | | | | 876,094 | |
| | | | | | | | |
| | | | Metals & Mining — 0.4% | | | | |
| | | | Freeport-McMoRan, Inc., | | | | |
| | 65,000 | | | 3.88%, 03/15/2023 | | | 63,050 | |
| | 40,000 | | | 4.55%, 11/14/2024 | | | 39,100 | |
| | | | | | | | |
| | | | | | | 102,150 | |
| | | | | | | | |
| | | | Total Materials | | | 2,027,363 | |
| | | | | | | | |
| | | | Real Estate — 2.4% | | | | |
| | | | Equity Real Estate Investment Trusts (REITs) — 2.4% | |
| | 75,000 | | | CoreCivic, Inc., 4.63%, 05/01/2023 | | | 74,625 | |
| | 100,000 | | | ESH Hospitality, Inc., 5.25%, 05/01/2025 (e) | | | 99,750 | |
| | 125,000 | | | GEO Group, Inc. (The), 5.13%, 04/01/2023 | | | 124,375 | |
| | | | MGM Growth Properties Operating Partnership LP, | | | | |
| | 10,000 | | | 4.50%, 01/15/2028 | | | 9,475 | |
| | 100,000 | | | 5.63%, 05/01/2024 | | | 103,450 | |
| | 50,000 | | | RHP Hotel Properties LP, 5.00%, 04/15/2021 | | | 50,187 | |
| | | | Uniti Group LP, | | | | |
| | 100,000 | | | 6.00%, 04/15/2023 (e) | | | 96,750 | |
| | 15,000 | | | 7.13%, 12/15/2024 (e) | | | 13,444 | |
| | 30,000 | | | 8.25%, 10/15/2023 | | | 27,975 | |
| | 53,880 | | | VICI Properties 1 LLC, 8.00%, 10/15/2023 | | | 59,807 | |
| | | | | | | | |
| | | | Total Real Estate | | | 659,838 | |
| | | | | | | | |
| | | | Telecommunication Services — 13.2% | | | | |
| | | | Diversified Telecommunication Services — 8.5% | |
| | | | CCO Holdings LLC, | | | | |
| | 75,000 | | | 5.00%, 02/01/2028 (e) | | | 70,829 | |
| | 35,000 | | | 5.13%, 05/01/2027 (e) | | | 33,644 | |
| | 20,000 | | | 5.50%, 05/01/2026 (e) | | | 20,000 | |
| | 370,000 | | | 5.75%, 02/15/2026 (e) | | | 375,087 | |
| | 240,000 | | | 5.88%, 04/01/2024 (e) | | | 248,172 | |
| | 155,000 | | | CenturyLink, Inc., 5.63%, 04/01/2025 | | | 140,275 | |
| | 100,000 | | | Frontier Communications Corp., 7.13%, 01/15/2023 | | | 67,000 | |
| | 30,000 | | | GCI, Inc., 6.88%, 04/15/2025 | | | 31,725 | |
| | | | Intelsat Jackson Holdings SA, (Luxembourg), | | | | |
| | 175,000 | | | 5.50%, 08/01/2023 | | | 144,813 | |
| | 145,000 | | | 7.25%, 10/15/2020 | | | 135,031 | |
| | 100,000 | | | 8.00%, 02/15/2024 (e) | | | 105,000 | |
| | 75,000 | | | 9.75%, 07/15/2025 (e) | | | 71,250 | |
| | | | | | | | |
PRINCIPAL
AMOUNT | | | SECURITY DESCRIPTION | | VALUE | |
| | |
| |
| | | | Diversified Telecommunication Services — continued | |
| | | | SFR Group SA, (France), | | | | |
| | EUR100,000 | | | Reg. S, 5.63%, 05/15/2024 | | | 123,512 | |
| | 200,000 | | | 7.38%, 05/01/2026 (e) | | | 193,060 | |
| | 245,000 | | | Sprint Capital Corp., 8.75%, 03/15/2032 | | | 265,825 | |
| | EUR100,000 | | | Telecom Italia SpA, (Italy), Reg. S, 3.63%, 05/25/2026 | | | 133,321 | |
| | | | Windstream Services LLC, | | | | |
| | 5,000 | | | 6.38%, 08/01/2023 | | | 2,925 | |
| | 10,000 | | | 7.75%, 10/15/2020 | | | 8,600 | |
| | 246,000 | | | 8.75%, 12/15/2024 (e) | | | 157,440 | |
| | | | | | | | |
| | | | | | | 2,327,509 | |
| | | | | | | | |
| | | | Wireless Telecommunication Services — 4.7% | |
| | EUR150,000 | | | Matterhorn Telecom Holding SA, (Luxembourg), Reg. S, 4.88%, 05/01/2023 | | | 184,848 | |
| | | | Sprint Corp., | | | | |
| | 650,000 | | | 7.63%, 02/15/2025 | | | 650,000 | |
| | 15,000 | | | 7.63%, 03/01/2026 | | | 14,925 | |
| | | | T-Mobile USA, Inc., | | | | |
| | 120,000 | | | 6.50%, 01/15/2024 | | | 125,700 | |
| | 160,000 | | | 6.50%, 01/15/2026 | | | 171,600 | |
| | 125,000 | | | United States Cellular Corp., 6.70%, 12/15/2033 | | | 131,250 | |
| | | | | | | | |
| | | | | | | 1,278,323 | |
| | | | | | | | |
| | | | Total Telecommunication Services | | | 3,605,832 | |
| | | | | | | | |
| | | | Utilities — 1.3% | | | | |
| | | | Electric Utilities — 0.5% | | | | |
| | EUR100,000 | | | EDP - Energias de Portugal SA, (Portugal), Reg. S, (EUR Swap Annual 5 Year + 5.04%),
5.38%, 09/16/2075 (aa) | | | 134,968 | |
| | | | | | | | |
| | | | Gas Utilities — 0.1% | | | | |
| | 30,000 | | | AmeriGas Partners LP, 5.50%, 05/20/2025 | | | 29,775 | |
| | | | | | | | |
| | | | Independent Power and Renewable Electricity
Producers — 0.6% | |
| | 50,000 | | | AES Corp., 4.88%, 05/15/2023 | | | 50,437 | |
| | 25,000 | | | Calpine Corp., 5.25%, 06/01/2026 (e) | | | 24,250 | |
| | | | Dynegy, Inc., | | | | |
| | 80,000 | | | 5.88%, 06/01/2023 | | | 82,000 | |
| | 10,000 | | | 8.00%, 01/15/2025 (e) | | | 10,863 | |
| | | | | | | | |
| | | | | | | 167,550 | |
| | | | | | | | |
| | | | Water Utilities — 0.1% | | | | |
| | 20,000 | | | Core & Main LP, 6.13%, 08/15/2025 (e) | | | 19,800 | |
| | | | | | | | |
| | | | Total Utilities | | | 352,093 | |
| | | | | | | | |
| | | | Total Corporate Bonds
(Cost $23,410,409) | | | 23,803,964 | |
| | | | | | | | |
SEE NOTES TO FINANCIAL STATEMENTS.
35
JPMorgan High Yield Opportunities Fund
SCHEDULE OF PORTFOLIO INVESTMENTS
AS OF FEBRUARY 28, 2018 (continued)
(Amounts in U.S. Dollars, unless otherwise noted)
| | | | | | |
SHARES | | SECURITY DESCRIPTION | | VALUE | |
| |
Common Stocks — 0.9% | |
| |
| | Consumer Discretionary — 0.3% | |
| | Hotels, Restaurants & Leisure — 0.3% | |
| 4,948 | | Caesars Entertainment Corp. (a) | | | 62,840 | |
| | | | | | |
| | Real Estate — 0.6% | | | | |
| | Equity Real Estate Investment Trusts (REITs) — 0.6% | |
| 8,395 | | VICI Properties, Inc. (a) | | | 164,122 | |
| | | | | | |
| | Total Common Stocks
(Cost $190,641) | | | 226,962 | |
| | | | | | |
PRINCIPAL
AMOUNT | | | | | |
| |
Loan Assignments — 4.3% (cc) | |
| | Consumer Discretionary — 2.5% | | | | |
| | Hotels, Restaurants & Leisure — 0.3% | | | | |
| 93,030 | | Club Corp Holdings, Inc., Term Loan B,
(ICE LIBOR USD 3 Month + 3.25%),
4.94%, 08/16/2024 (aa) | | | 93,546 | |
| | | | | | |
| | Leisure Products — 0.5% | | | | |
| 135,000 | | Steinway Musical Instruments, Inc., 1st Lien Term Loan B, (ICE LIBOR USD 3 Month + 3.75%), 3.75%, 02/13/2025 (aa) ^ | | | 135,337 | |
| | | | | | |
| | Media — 0.7% | | | | |
| 150,000 | | iHeartCommunications, Inc., Term Loan D,
(ICE LIBOR USD 3 Month + 6.75%),
8.44%, 01/30/2019 (aa) | | | 119,130 | |
| 70,000 | | Meredith Corp., 1st Lien Term Loan B,
(ICE LIBOR USD 3 Month + 3.00%),
4.66%, 01/18/2025 (aa) | | | 70,383 | |
| | | | | | |
| | | | | 189,513 | |
| | | | | | |
| | Multiline Retail — 0.4% | | | | |
| 113,814 | | Neiman Marcus Group, Inc., Other Term Loan, (ICE LIBOR USD 1 Month + 3.25%), 4.83%, 10/25/2020 (aa) | | | 96,291 | |
| | | | | | |
| | Specialty Retail — 0.6% | | | | |
| 87,565 | | J Crew Group, Inc., Initial Loan, (ICE LIBOR USD 1 Month + 3.22%; ICE LIBOR USD 3 Month + 3.22%), 4.88%, 03/05/2021 (aa) | | | 60,503 | |
| 109,725 | | Staples, Inc., 1st Lien Term Loan, (ICE LIBOR USD 3 Month + 4.00%), 5.79%, 09/12/2024 (aa) | | | 108,971 | |
| | | | | | |
| | | | | | |
PRINCIPAL
AMOUNT | | SECURITY DESCRIPTION | | VALUE | |
| |
| | Consumer Discretionary - continued | |
| | | | | | |
| | | | | | |
| | | | | 169,474 | |
| | | | | | |
| | Total Consumer Discretionary | | | 684,161 | |
| | | | | | |
| | Energy — 0.2% | | | | |
| | Oil, Gas & Consumable Fuels — 0.2% | | | | |
| 49,625 | | MEG Energy Corp., 1st Lien Term B Loan,
(ICE LIBOR USD 3 Month + 3.50%), 5.20%, 12/31/2023 (aa) | | | 49,607 | |
| | Health Care — 0.7% | | | | |
| | Health Care Equipment & Supplies — 0.3% | | | | |
| 98,721 | | Ortho-Clinical Diagnostics, Inc., Initial Term Loan, (ICE LIBOR USD 3 Month + 3.75%), 5.44%, 06/30/2021 (aa) | | | 99,462 | |
| | | | | | |
| | Health Care Providers & Services — 0.4% | |
| 105,000 | | Air Medical, 1st Lien Term Loan B, (ICE LIBOR USD 3 Month + 4.50%), 4.83%,
09/26/2024 (aa) ^ | | | 106,076 | |
| | | | | | |
| | Total Health Care | | | 205,538 | |
| | | | | | |
| | Industrials — 0.3% | | | | |
| | Machinery — 0.3% | | | | |
| 74,813 | | Accudyne Industries LLC, Term Loan B, (ICE LIBOR USD 1 Month + 3.75%), 5.40%, 08/18/2024 (aa) | | | 75,197 | |
| | | | | | |
| | Materials — 0.5% | | | | |
| | Containers & Packaging — 0.5% | |
| 109,450 | | Bway Holding Co., 1st Lien Term Loan, (ICE LIBOR USD 2 Month + 3.25%; ICE LIBOR USD 3 Month + 3.25%), 4.96%, 04/03/2024 (aa) | | | 109,860 | |
| 35,000 | | Crown Americas, 1st Lien Term Loan B, (ICE LIBOR USD 3 Month + 2.25%), 0.00%, 01/17/2025 (aa) ^ | | | 35,292 | |
| | | | | | |
| | Total Materials | | | 145,152 | |
| | | | | | |
| | Real Estate — 0.1% | | | | |
| | Real Estate Management & Development — 0.1% | |
| 24,875 | | CityCenter Holdings LLC, Term B Loan, (ICE LIBOR USD 1 Month + 2.50%), 4.15%, 04/18/2024 (aa) | | | 24,978 | |
| | | | | | |
| | Total Loan Assignments
(Cost $1,193,913) | | | 1,184,633 | |
| | | | | | |
| SHARES | | | | | |
| |
Short-Term Investment — 4.8% | |
| | Investment Company — 4.8% | | | | |
| 1,311,048 | | JPMorgan U.S. Government Money Market Fund, Institutional Class Shares, 1.25% (b) (l)
(Cost $1,311,048) | | | 1,311,048 | |
| | | | | | |
SEE NOTES TO FINANCIAL STATEMENTS.
36
JPMorgan High Yield Opportunities Fund
SCHEDULE OF PORTFOLIO INVESTMENTS
AS OF FEBRUARY 28, 2018 (continued)
(Amounts in U.S. Dollars, unless otherwise noted)
| | | | |
| | | SECURITY DESCRIPTION | | VALUE |
|
| | Total Investments — 99.2%
(Cost $26,670,755) | | 27,162,074 |
| | Other Assets in Excess of Liabilities — 0.8% | | 226,928 |
| | | | |
| | NET ASSETS — 100.0% | | $ 27,389,002 |
| | | | |
Percentages indicated are based on net assets.
Futures contracts outstanding as of February 28, 2018:
| | | | | | | | | | | | | | | | | | | | |
Description | | Number of
Contracts | | | Expiration Date | | | Trading Currency | | | Notional Amount ($) | | | Value and Unrealized
Appreciation
(Depreciation) ($) | |
Short Contracts | | | | | | | | | | | | | | | | | | | | |
U.S. Treasury 5 Year Note | | | (6 | ) | | | 6/2018 | | | | USD | | | | (683,625 | ) | | | (106) | |
U.S. Treasury 10 Year Note | | | (4 | ) | | | 6/2018 | | | | USD | | | | (480,313 | ) | | | (884) | |
| | | | | | | | | | | | | | | | | | | | |
| | | | | | | | | | | | | | | | | | | (990) | |
| | | | | | | | | | | | | | | | | | | | |
Forward foreign currency contracts outstanding as of February 28, 2018:
| | | | | | | | | | | | | | | | | | |
Currency Purchased | | | Currency Sold | | | Counterparty | | Settlement Date | | Unrealized
Appreciation
(Depreciation) ($) | |
USD | | | 4,558,420 | | | EUR | | | 3,654,770 | | | HSBC Bank, N.A. | | 3/5/2018 | | | 98,770 | |
USD | | | 31,224 | | | EUR | | | 25,256 | | | Royal Bank of Canada | | 3/5/2018 | | | 406 | |
USD | | | 139,482 | | | GBP | | | 98,489 | | | TD Bank Financial Group | | 3/5/2018 | | | 3,881 | |
USD | | | 10,260 | | | EUR | | | 8,378 | | | Royal Bank of Canada | | 4/4/2018 | | | 11 | |
USD | | | 4,394,749 | | | EUR | | | 3,588,121 | | | State Street Corp. | | 4/4/2018 | | | 5,373 | |
USD | | | 136,486 | | | GBP | | | 98,489 | | | HSBC Bank, N.A. | | 4/4/2018 | | | 671 | |
| | | | | | | | | | | | | | | | | | |
Total unrealized appreciation | | | | | | | | 109,112 | |
| | | | | | | | | | | | | | | | | | |
EUR | | | 35,080 | | | USD | | | 43,376 | | | Australia & New Zealand Banking Group Ltd. | | 3/5/2018 | | | (571) | |
EUR | | | 6,485 | | | USD | | | 8,037 | | | HSBC Bank, N.A. | | 3/5/2018 | | | (123) | |
EUR | | | 13,474 | | | USD | | | 16,643 | | | Merrill Lynch International | | 3/5/2018 | | | (202) | |
EUR | | | 36,867 | | | USD | | | 45,621 | | | Royal Bank of Canada | | 3/5/2018 | | | (636) | |
EUR | | | 3,588,121 | | | USD | | | 4,384,310 | | | State Street Corp. | | 3/5/2018 | | | (5,988) | |
GBP | | | 98,489 | | | USD | | | 136,280 | | | HSBC Bank, N.A. | | 3/5/2018 | | | (678) | |
| | | | | | | | | | | | | | | | | | |
Total unrealized depreciation | | | | | | | | | | | (8,198) | |
| | | | | | | | | | | | | | | | | | |
Net unrealized appreciation | | | | | | | | | | | 100,914 | |
| | | | | | | | | | | | | | | | | | |
Centrally Cleared Credit default swap contracts outstanding - buy protection(1) as of February 28, 2018:
| | | | | | | | | | | | | | | | | | | | | | | | | | | | | | | | |
Reference
Obligation/Index | | Financing Rate
Paid/(Received)
by the Fund
(%) | | | Payment
Frequency | | | Maturity
Date | | | Implied
Credit
Spread
(%)(2) | | | Notional
Amount(3) | | | Upfront
Payments
(Receipts)
($)(4) | | | Unrealized
Appreciation
(Depreciation) ($) | | | Value ($) | |
CDX.NA.HY.29-V1 | | | 5.00 | | | | Quarterly | | | | 12/20/2022 | | | | 3.31 | | | | USD 1,000,000 | | | | (71,365 | ) | | | (7,451 | ) | | | (78,816) | |
| | | | | | | | | | | | | | | | | | | | | | | | |
| | | | | | | | | | | | | | | | | | | | | | | (71,365 | ) | | | (7,451 | ) | | | (78,816) | |
| | | | | | | | | | | | | | | | | | | | | | | | |
| (1) | The Fund, as a buyer of credit protection, is generally obligated to make periodic payments and may also pay or receive an upfront premium to or from the protection seller, in exchange for the right to receive a contingent payment, upon occurrence of a credit event with respect to an underlying reference obligation, as defined under the terms of individual swap contracts. |
SEE NOTES TO FINANCIAL STATEMENTS.
37
JPMorgan High Yield Opportunities Fund
SCHEDULE OF PORTFOLIO INVESTMENTS
AS OF FEBRUARY 28, 2018 (continued)
| (2) | Implied credit spreads are an indication of the seller’s performance risk, related to the likelihood of a credit event occurring that would require a seller to make payment to a buyer. Implied credit spreads are used to determine the value of swap contracts and reflect the cost of buying/selling protection, which may include upfront payments made to enter into the contract. Therefore, higher spreads would indicate a greater likelihood that a seller will be obligated to perform (i.e. make payment) under the swap contract. Increasing values, in absolute terms and relative to notional amounts, are also indicative of greater performance risk. Implied credit spreads for credit default swaps on credit indices are linked to the weighted average spread across the underlying reference obligations included in a particular index. |
| (3) | The notional amount is the maximum amount that a seller of credit protection would be obligated to pay and a buyer of credit protection would receive, upon occurrence of a credit event. |
| (4) | Upfront payments and receipts generally represent premiums paid or received at the initiation of the agreement to compensate the differences between the stated terms of the swap agreement and current market conditions (credit spreads, interest rates and other relevant factors). |
38
J.P. Morgan Income Funds
NOTES TO SCHEDULES OF PORTFOLIO INVESTMENTS
AS OF FEBRUARY 28, 2018 (continued)
| | | | | | | | |
| CDX | | — | | Credit Derivative Index | | |
| DIP | | — | | Debtor-in-possession | | |
| EUR | | — | | Euro | | |
| GBP | | — | | British Pound | | |
| ICE | | — | | Intercontinental Exchange | | |
| LIBOR | | — | | London Interbank Offered Rate | | |
| MSCI | | — | | Morgan Stanley Capital International | | |
| Reg. S | | — | | Security was purchased pursuant to Regulation S under the Securities Act of 1933, as amended (the “Securities Act”), which exempts from registration securities offered and sold outside of the United States. Such a security cannot be sold in the United States without either an effective registration statement filed pursuant to the Securities Act, or pursuant to an exemption from registration. | | |
| SUB | | — | | Step-Up Bond. The interest rate shown is the rate in effect as of February 28, 2018. | | |
| USD | | — | | United States Dollar | | |
| (a) | | — | | Non-income producing security. | | |
| | | |
| (b) | | — | | Investment in affiliate. Money market fund is registered under the Investment Company Act of 1940, as amended, and advised by J.P. Morgan Investment Management Inc. | | |
| | | |
| (d) | | — | | Defaulted Security. Security has not paid its last interest payment and/or interest is not being accrued. | | |
| | | |
| (e) | | — | | Security is exempt from registration under Rule 144A of the Securities Act of 1933, as amended. Unless otherwise indicated, this security has been determined to be liquid under procedures established by the Board of Trustees and may be resold in transactions exempt from registration, normally to qualified institutional buyers. | | |
| | | |
| (g) | | — | | Amount rounds to less than 0.05%. | | |
| | | |
| (l) | | — | | The rate shown is the current yield as of February 28, 2018. | | |
| | | |
| (v) | | — | | Security has the ability to pay in kind (“PIK”) or pay income in cash. When applicable, separate rates of such payments are disclosed. | | |
| | | |
| (w) | | — | | All or a portion of the security is a when-issued security, delayed delivery security, or forward commitment. | | |
| | | |
| (x) | | — | | Security is perpetual and thus, does not have a predetermined maturity date. The coupon rate for this security is fixed for a period of time and may be structured to adjust thereafter. The date shown, if applicable, reflects the next call date. The coupon rate shown is the rate in effect as of February 28, 2018. | | |
| | | |
| (y) | | — | | Security is an interest bearing note with preferred security characteristics. | | |
| | | |
| (aa) | | — | | Variable or floating rate security, linked to the referenced benchmark. The interest rate shown is the current rate as of February 28, 2018. | | |
| | | |
| (bb) | | — | | Security has been valued using significant unobservable inputs. | | |
| | | |
| (cc) | | — | | Loan assignments are presented by obligor. Each series or loan tranche underlying each obligor may have varying terms. | | |
| | | |
| ^ | | — | | All or a portion of the security is unsettled as of February 28, 2018. Unless otherwise indicated, the coupon rate is undetermined. The coupon rate shown may not be accrued for the entire position. | | |
SEE NOTES TO FINANCIAL STATEMENTS.
39
STATEMENTS OF ASSETS AND LIABILITIES
AS OF FEBRUARY 28, 2018
| | | | | | | | | | | | |
| | | Flexible Long/Short
Fund | | | High Yield
Opportunities Fund | | | | |
| |
ASSETS: | | | | | | | | | | | | |
Investments in non-affiliates, at value | | $ | 25,491,387 | | | $ | 25,851,026 | | | | | |
Investments in affiliates, at value | | | 445,436 | | | | 1,311,048 | | | | | |
Options and swaptions purchased, at value | | | 33,413 | | | | — | | | | | |
Cash | | | 439,145 | | | | — | | | | | |
Foreign currency, at value | | | 7,378 | | | | 21,961 | | | | | |
Deposits at broker for futures contracts | | | 29,000 | | | | 30,000 | | | | | |
Deposits at broker for centrally cleared swaps | | | 42,629 | | | | 45,000 | | | | | |
Receivables: | | | | | | | | | | | | |
Investment securities sold | | | 76,838 | | | | — | | | | | |
Interest from non-affiliates | | | 302,977 | | | | 380,857 | | | | | |
Dividends from affiliates | | | 358 | | | | 983 | | | | | |
Tax reclaims | | | 135 | | | | — | | | | | |
Variation margin on centrally cleared swaps (net upfront receipts of $36,439 and $71,365, respectively) | | | — | | | | 2,935 | | | | | |
Unrealized appreciation on forward foreign currency exchange contracts | | | 185,057 | | | | 109,112 | | | | | |
Outstanding OTC swap contracts, at value (net upfront payments of $9,803 and $0, respectively) | | | 12,721 | | | | — | | | | | |
Due from Adviser | | | 36,784 | | | | 23,394 | | | | | |
| | | | |
Total Assets | | | 27,103,258 | | | | 27,776,316 | | | | | |
| | | | |
| | | |
LIABILITIES: | | | | | | | | | | | | |
Payables: | | | | | | | | | | | | |
Due to custodian | | | — | | | | 2,364 | | | | | |
Investment securities purchased | | | 210,136 | | | | 279,600 | | | | | |
Investment securities purchased - delayed delivery securities | | | 3,000 | | | | — | | | | | |
Variation margin on futures contracts | | | 1,579 | | | | 1,680 | | | | | |
Unrealized depreciation on forward foreign currency exchange contracts | | | 15,640 | | | | 8,198 | | | | | |
Outstanding options and swaptions written, at fair value | | | 15,320 | | | | — | | | | | |
Outstanding OTC swap contracts, at value (net upfront receipts of $47,590 and $0, respectively) | | | 53,005 | | | | — | | | | | |
Variation margin on centrally cleared swaps (net upfront receipts of $90,745 and $0, respectively) | | | 777 | | | | — | | | | | |
Accrued liabilities: | | | | | | | | | | | | |
Distribution fees | | | 16 | | | | 17 | | | | | |
Service fees | | | 5,115 | | | | 4,184 | | | | | |
Custodian and accounting fees | | | 16,638 | | | | 6,489 | | | | | |
Collateral management fees | | | 2,325 | | | | 589 | | | | | |
Trustees’ and Chief Compliance Officer’s fees | | | 124 | | | | 124 | | | | | |
Audit fees | | | 73,520 | | | | 71,534 | | | | | |
Other | | | 8,176 | | | | 12,535 | | | | | |
| | | | |
Total Liabilities | | | 405,371 | | | | 387,314 | | | | | |
| | | | |
Net Assets | | $ | 26,697,887 | | | $ | 27,389,002 | | | | | |
| | | | |
SEE NOTES TO FINANCIAL STATEMENTS.
40
STATEMENTS OF ASSETS AND LIABILITIES
AS OF FEBRUARY 28, 2018 (continued)
| | | | | | | | | | | | |
| | | Flexible Long/Short
Fund | | | High Yield
Opportunities Fund | | | | |
| |
NET ASSETS: | | | | | | | | | | | | |
Paid-in-Capital | | $ | 26,433,886 | | | $ | 27,107,628 | | | | | |
Accumulated undistributed (distributions in excess of) net investment income | | | (368,503 | ) | | | 65,371 | | | | | |
Accumulated net realized gains (losses) | | | (91,767 | ) | | | (368,046 | ) | | | | |
Net unrealized appreciation (depreciation) | | | 724,271 | | | | 584,049 | | | | | |
| | | | |
Total Net Assets | | $ | 26,697,887 | | | $ | 27,389,002 | | | | | |
| | | | |
| | | |
Net Assets: | | | | | | | | | | | | |
Class A | | $ | 21,270 | | | $ | 21,820 | | | | | |
Class C | | | 21,094 | | | | 21,660 | | | | | |
Class I (formerly Select Class) | | | 26,634,076 | | | | 27,323,588 | | | | | |
Class R6 | | | 21,447 | | | | 21,934 | | | | | |
| | | | |
Total | | $ | 26,697,887 | | | $ | 27,389,002 | | | | | |
| | | | |
| | | |
Outstanding units of beneficial interest (shares) | | | | | | | | | | | | |
($0.0001 par value; unlimited number of shares authorized): | | | | | | | | | | | | |
Class A | | | 2,105 | | | | 2,155 | | | | | |
Class C | | | 2,094 | | | | 2,139 | | | | | |
Class I (formerly Select Class) | | | 2,636,310 | | | | 2,698,627 | | | | | |
Class R6 | | | 2,123 | | | | 2,166 | | | | | |
| | | |
Net Asset Value (a): | | | | | | | | | | | | |
Class A - Redemption price per share | | $ | 10.10 | | | $ | 10.13 | | | | | |
Class C - Offering price per share (b) | | | 10.07 | | | | 10.13 | | | | | |
Class I (formerly Select Class) - Offering and redemption price per share | | | 10.10 | | | | 10.13 | | | | | |
Class R6 - Offering and redemption price per share | | | 10.10 | | | | 10.13 | | | | | |
Class A maximum sales charge | | | 3.75 | % | | | 3.75 | % | | | | |
Class A maximum public offering price per share | | | | | | | | | | | | |
[net asset value per share/(100% – maximum sales charge)] | | $ | 10.49 | | | $ | 10.52 | | | | | |
| | | | |
| | | |
Cost of investments in non-affiliates | | $ | 24,957,730 | | | $ | 25,359,707 | | | | | |
Cost of investments in affiliates | | | 445,445 | | | | 1,311,048 | | | | | |
Cost of options and swaptions purchased | | | 29,436 | | | | — | | | | | |
Cost of foreign currency | | | 7,391 | | | | 22,473 | | | | | |
Premiums received from options and swaptions written | | | 16,293 | | | | — | | | | | |
(a) Per share amounts may not recalculate due to rounding of net assets and/or shares outstanding.
(b) Redemption price for Class C Shares varies based upon length of time the shares are held.
SEE NOTES TO FINANCIAL STATEMENTS.
41
STATEMENTS OF OPERATIONS
FOR THE YEAR ENDED FEBRUARY 28, 2018
| | | | | | | | | | | | |
| | | Flexible
Long/Short
Fund | | | High Yield
Opportunities
Fund | | | | |
| |
INVESTMENT INCOME: | | | | | | | | | | | | |
Interest income from non-affiliates | | $ | 1,203,664 | | | $ | 1,591,980 | | | | | |
Interest income from affiliates | | | 227 | | | | — | | | | | |
Dividend income from non-affiliates | | | — | | | | 2,376 | | | | | |
Dividend income from affiliates | | | 8,416 | | | | 6,886 | | | | | |
Foreign taxes withheld | | | (2,872 | ) | | | (2,438 | ) | | | | |
| | | | |
Total investment income | | | 1,209,435 | | | | 1,598,804 | | | | | |
| | | | |
| | | |
EXPENSES: | | | | | | | | | | | | |
Investment advisory fees | | | 131,798 | | | | 161,406 | | | | | |
Administration fees | | | 21,470 | | | | 21,911 | | | | | |
Distribution fees: | | | | | | | | | | | | |
Class A | | | 52 | | | | 54 | | | | | |
Class C | | | 157 | | | | 160 | | | | | |
Service fees: | | | | | | | | | | | | |
Class A | | | 53 | | | | 54 | | | | | |
Class C | | | 52 | | | | 54 | | | | | |
Class I (formerly Select Class) | | | 65,741 | | | | 67,091 | | | | | |
Custodian and accounting fees | | | 57,654 | | | | 30,680 | | | | | |
Collateral management fees | | | 14,140 | | | | 3,536 | | | | | |
Interest expense to affiliates | | | 123 | | | | 253 | | | | | |
Professional fees | | | 133,113 | | | | 130,610 | | | | | |
Trustees’ and Chief Compliance Officer’s fees | | | 25,377 | | | | 25,273 | | | | | |
Printing and mailing costs | | | 13,293 | | | | 14,199 | | | | | |
Registration and filing fees | | | 2,592 | | | | 3,226 | | | | | |
Transfer agency fees (See Note 2.I.) | | | 1,346 | | | | 1,408 | | | | | |
Offering costs | | | 24,959 | | | | 28,282 | | | | | |
Other | | | 12,381 | | | | 13,860 | | | | | |
| | | | |
Total expenses | | | 504,301 | | | | 502,057 | | | | | |
| | | | |
Less fees waived | | | (155,405 | ) | | | (198,948 | ) | | | | |
Less expense reimbursements | | | (112,883 | ) | | | (89,189 | ) | | | | |
| | | | |
Net expenses | | | 236,013 | | | | 213,920 | | | | | |
| | | | |
Net investment income (loss) | | | 973,422 | | | | 1,384,884 | | | | | |
| | | | |
| | | |
REALIZED/UNREALIZED GAINS (LOSSES): | | | | | | | | | | | | |
Net realized gain (loss) on transactions from: | | | | | | | | | | | | |
Investments in non-affiliates | | | 138,023 | | | | 350,016 | | | | | |
Options and swaptions purchased | | | (17,502 | ) | | | — | | | | | |
Futures contracts | | | 6,615 | | | | 38,071 | | | | | |
Foreign currency transactions | | | 9,092 | | | | 39,171 | | | | | |
Forward foreign currency exchange contracts | | | (845,379 | ) | | | (611,809 | ) | | | | |
Swaps | | | (17,391 | ) | | | (5,958 | ) | | | | |
| | | | |
Net realized gain (loss) | | | (726,542 | ) | | | (190,509 | ) | | | | |
| | | | |
Change in net unrealized appreciation/depreciation on: | | | | | | | | | | | | |
Investments in non-affiliates | | | 450,957 | | | | (96,811 | ) | | | | |
Investments in affiliates | | | (9 | ) | | | — | | | | | |
Options and swaptions purchased | | | 3,977 | | | | — | | | | | |
Futures contracts | | | 17,012 | | | | (990 | ) | | | | |
Foreign currency translations | | | 3,616 | | | | 744 | | | | | |
Forward foreign currency exchange contracts | | | 117,743 | | | | 60,230 | | | | | |
Options and swaptions written | | | 973 | | | | — | | | | | |
Swaps | | | 17,571 | | | | (7,451 | ) | | | | |
| | | | |
Change in net unrealized appreciation/depreciation | | | 611,840 | | | | (44,278 | ) | | | | |
| | | | |
Net realized/unrealized gains (losses) | | | (114,702 | ) | | | (234,787 | ) | | | | |
| | | | |
Change in net assets resulting from operations | | $ | 858,720 | | | $ | 1,150,097 | | | | | |
| | | | |
SEE NOTES TO FINANCIAL STATEMENTS.
42
STATEMENTS OF CHANGES IN NET ASSETS
FOR THE PERIODS INDICATED
| | | | | | | | | | | | | | | | | | | | |
| | | Flexible Long/Short Fund | | | High Yield Opportunities Fund | | | | |
| | | | |
| | | Year Ended | | | Period Ended February | | | Year Ended | | | Period Ended February | | | | |
| | | February 28, 2018 | | | 28, 2017 (a) | | | February 28, 2018 | | | 28, 2017 (b) | | | | |
| |
CHANGE IN NET ASSETS RESULTING FROM OPERATIONS: | | | | | | | | | | | | | | | | | |
Net investment income (loss) | | $ | 973,422 | | | $ | 567,783 | | | $ | 1,384,884 | | | $ | 382,624 | | | | | |
Net realized gain (loss) | | | (726,542 | ) | | | 158,953 | | | | (190,509 | ) | | | 185,033 | | | | | |
Change in net unrealized appreciation/depreciation | | | 611,840 | | | | 112,431 | | | | (44,278 | ) | | | 628,327 | | | | | |
| | | | |
Change in net assets resulting from operations | | | 858,720 | | | | 839,167 | | | | 1,150,097 | | | | 1,195,984 | | | | | |
| | | | |
| | | | | |
DISTRIBUTIONS TO SHAREHOLDERS: | | | | | | | | | | | | | | | | | | | | |
Class A | | | | | | | | | | | | | | | | | | | | |
From net investment income | | | (549 | ) | | | (486 | ) | | | (1,108 | ) | | | (287 | ) | | | | |
From net realized gains | | | — | | | | (29 | ) | | | (196 | ) | | | — | | | | | |
Class C | | | | | | | | | | | | | | | | | | | | |
From net investment income | | | (495 | ) | | | (416 | ) | | | (986 | ) | | | (251 | ) | | | | |
From net realized gains | | | — | | | | (29 | ) | | | (194 | ) | | | — | | | | | |
Class I (formerly Select Class) | | | | | | | | | | | | | | | | | | | | |
From net investment income | | | (745,177 | ) | | | (651,711 | ) | | | (1,439,410 | ) | | | (376,112 | ) | | | | |
From net realized gains | | | — | | | | (35,914 | ) | | | (244,505 | ) | | | — | | | | | |
Class R6 | | | | | | | | | | | | | | | | | | | | |
From net investment income | | | (652 | ) | | | (555 | ) | | | (1,198 | ) | | | (314) | | | | | |
From net realized gains | | | — | | | | (29 | ) | | | (196 | ) | | | — | | | | | |
| | | | |
Total distributions to shareholders | | | (746,873 | ) | | | (689,169 | ) | | | (1,687,793 | ) | | | (376,964 | ) | | | | |
| | | | |
| | | | | |
CAPITAL TRANSACTIONS: | | | | | | | | | | | | | | | | | | | | |
Change in net assets resulting from capital transactions | | | 746,873 | | | | 25,689,169 | | | | 1,730,714 | | | | 25,376,964 | | | | | |
| | | | |
| | | | | |
NET ASSETS: | | | | | | | | | | | | | | | | | | | | |
Change in net assets | | | 858,720 | | | | 25,839,167 | | | | 1,193,018 | | | | 26,195,984 | | | | | |
Beginning of period | | | 25,839,167 | | | | — | | | | 26,195,984 | | | | — | | | | | |
| | | | |
End of period | | $ | 26,697,887 | | | $ | 25,839,167 | | | $ | 27,389,002 | | | $ | 26,195,984 | | | | | |
| | | | |
Accumulated undistributed (distributions in excess of) net investment income | | $ | (368,503 | ) | | $ | 95,601 | �� | | $ | 65,371 | | | $ | (13,628 | ) | | | | |
| | | | |
(a) Commencement of operations was June 30, 2016.
(b) Commencement of operations was November 1, 2016.
SEE NOTES TO FINANCIAL STATEMENTS.
43
STATEMENTS OF CHANGES IN NET ASSETS
FOR THE PERIODS INDICATED (continued)
| | | | | | | | | | | | | | | | | | | | |
| | | Flexible Long/Short Fund | | | High Yield Opportunities Fund | | | | |
| | | | |
| | | Year Ended | | | Period Ended February | | | Year Ended | | | Period Ended February | | | | |
| | | February 28, 2018 | | | 28, 2017 (a) | | | February 28, 2018 | | | 28, 2017 (b) | | | | |
| |
CAPITAL TRANSACTIONS: | | | | | | | | | | | | | | | | | |
Class A | | | | | | | | | | | | | | | | | | | | |
Proceeds from shares issued | | $ | — | | | $ | 20,000 | | | $ | — | | | $ | 20,000 | | | | | |
Distributions reinvested | | | 549 | | | | 515 | | | | 1,304 | | | | 287 | | | | | |
| | | | |
Change in net assets resulting from Class A capital transactions | | $ | 549 | | | $ | 20,515 | | | $ | 1,304 | | | $ | 20,287 | | | | | |
| | | | |
Class C | | | | | | | | | | | | | | | | | | | | |
Proceeds from shares issued | | $ | — | | | $ | 20,000 | | | $ | — | | | $ | 20,000 | | | | | |
Distributions reinvested | | | 495 | | | | 445 | | | | 1,180 | | | | 251 | | | | | |
| | | | |
Change in net assets resulting from Class C capital transactions | | $ | 495 | | | $ | 20,445 | | | $ | 1,180 | | | $ | 20,251 | | | | | |
| | | | |
Class I (formerly Select Class) | | | | | | | | | | | | | | | | | | | | |
Proceeds from shares issued | | $ | 892,665 | | | $ | 25,540,000 | | | $ | 1,298,571 | | | $ | 26,296,525 | | | | | |
Distributions reinvested | | | 745,177 | | | | 687,625 | | | | 1,683,915 | | | | 376,112 | | | | | |
Cost of shares redeemed | | | (892,665 | ) | | | (600,000 | ) | | | (1,255,650 | ) | | | (1,356,525 | ) | | | | |
| | | | |
Change in net assets resulting from Class I capital transactions | | $ | 745,177 | | | $ | 25,627,625 | | | $ | 1,726,836 | | | $ | 25,316,112 | | | | | |
| | | | |
Class R6 | | | | | | | | | | | | | | | | | | | | |
Proceeds from shares issued | | $ | — | | | $ | 20,000 | | | $ | — | | | $ | 20,000 | | | | | |
| | | | |
Distributions reinvested | | | 652 | | | | 584 | | | | 1,394 | | | | 314 | | | | | |
| | | | |
Change in net assets resulting from Class R6 capital transactions | | $ | 652 | | | $ | 20,584 | | | $ | 1,394 | | | $ | 20,314 | | | | | |
| | | | |
Total change in net assets resulting from capital transactions | | $ | 746,873 | | | $ | 25,689,169 | | | $ | 1,730,714 | | | $ | 25,376,964 | | | | | |
| | | | |
| | | | | |
SHARE TRANSACTIONS: | | | | | | | | | | | | | �� | | | | | | | |
Class A | | | | | | | | | | | | | | | | | | | | |
Issued | | | — | | | | 2,000 | | | | — | | | | 2,000 | | | | | |
Reinvested | | | 54 | | | | 51 | | | | 127 | | | | 28 | | | | | |
| | | | |
Change in Class A Shares | | | 54 | | | | 2,051 | | | | 127 | | | | 2,028 | | | | | |
| | | | |
Class C | | | | | | | | | | | | | | | | | | | | |
Issued | | | — | | | | 2,000 | | | | — | | | | 2,000 | | | | | |
Reinvested | | | 49 | | | | 45 | | | | 114 | | | | 25 | | | | | |
| | | | |
Change in Class C Shares | | | 49 | | | | 2,045 | | | | 114 | | | | 2,025 | | | | | |
| | | | |
Class I (formerly Select Class) | | | | | | | | | | | | | | | | | | | | |
Issued | | | 87,516 | | | | 2,554,060 | | | | 126,882 | | | | 2,626,993 | | | | | |
Reinvested | | | 73,657 | | | | 68,653 | | | | 163,503 | | | | 36,984 | | | | | |
Redeemed | | | (87,516 | ) | | | (60,060 | ) | | | (122,742 | ) | | | (132,993 | ) | | | | |
| | | | |
Change in Class I Shares | | | 73,657 | | | | 2,562,653 | | | | 167,643 | | | | 2,530,984 | | | | | |
| | | | |
Class R6 | | | | | | | | | | | | | | | | | | | | |
Issued | | | — | | | | 2,000 | | | | — | | | | 2,000 | | | | | |
Reinvested | | | 65 | | | | 58 | | | | 135 | | | | 31 | | | | | |
| | | | |
Change in Class R6 Shares | | | 65 | | | | 2,058 | | | | 135 | | | | 2,031 | | | | | |
| | | | |
(a) Commencement of operations was June 30, 2016.
(b) Commencement of operations was November 1, 2016.
SEE NOTES TO FINANCIAL STATEMENTS.
44
FINANCIAL HIGHLIGHTS
FOR THE PERIODS INDICATED
| | | | | | | | | | | | | | | | | | | | | | | | | | | | | | | | | | | | | | | | | | | | | | | | | | | | | | | | |
| | | | | | | | | Per share operating performance | | | | | | | | | | | | | | | Ratios/Supplemental data | | | | |
| | | | |
| | | | | | Investment operations | | | Distributions | | | | | | | | | | | | Ratios to average net assets (a) | | | | |
| | | Net asset
value,
beginning
of period | | | Net
investment
income
(loss) (b) | | | Net realized and
unrealized
gains (losses)
on investments | | | Total from
investment
operations
| | | Net
investment
income | | | Net
realized
gain | | | Total
distributions
| | | Net asset
value, end
of period | | | Total return
(excludes
sales charge)
(c)(d) | | | Net assets, end of period | | | Net expenses (e)(f) | | | Net investment income
(loss) (f) | | | Expenses without
waivers,
reimbursements
and earnings
credits (f) | | | Portfolio turnover
rate (c) | |
| | | | |
Flexible Long/Short Fund | | | | | | | | | | | | | | | | | | | | | | | | | | | | | | | | | | | | | | | | | | | | | | | | | | | | | | | | |
Class A | | | | | | | | | | | | | | | | | | | | | | | | | | | | | | | | | | | | | | | | | | | | | | | | | | | | | | | | |
Year Ended February 28, 2018 | | | $10.06 | | | | $0.35 | | | | $(0.05) | | | | $0.30 | | | | $(0.26 | ) | | | $ — | | | | $(0.26 | ) | | | $10.10 | | | | 3.05 % | | | | $21,270 | | | | 1.14 % | | | | 3.44 % | | | | 3.56 % | | | | 57 % | |
June 30, 2016 (g) through February 28, 2017 | | | 10.00 | | | | 0.21 | | | | 0.10 | | | | 0.31 | | | | (0.24 | ) | | | (0.01) | | | | (0.25 | ) | | | 10.06 | | | | 3.18 | | | | 20,638 | | | | 1.13 | | | | 3.11 | | | | 3.13 | | | | 30 | |
Class C | | | | | | | | | | | | | | | | | | | | | | | | | | | | | | | | | | | | | | | | | | | | | | | | | | | | | | | | |
Year Ended February 28, 2018 | | | 10.06 | | | | 0.30 | | | | (0.05) | | | | 0.25 | | | | (0.24 | ) | | | — | | | | (0.24 | ) | | | 10.07 | | | | 2.50 | | | | 21,094 | | | | 1.64 | | | | 2.94 | | | | 4.06 | | | | 57 | |
June 30, 2016 (g) through February 28, 2017 | | | 10.00 | | | | 0.17 | | | | 0.11 | | | | 0.28 | | | | (0.21 | ) | | | (0.01) | | | | (0.22 | ) | | | 10.06 | | | | 2.84 | | | | 20,568 | | | | 1.63 | | | | 2.61 | | | | 3.61 | | | | 30 | |
Class I (formerly Select Class) | | | | | | | | | | | | | | | | | | | | | | | | | | | | | | | | | | | | | | | | | | | | | | | | | | | | | | | | |
Year Ended February 28, 2018 | | | 10.06 | | | | 0.37 | | | | (0.04) | | | | 0.33 | | | | (0.29 | ) | | | — | | | | (0.29 | ) | | | 10.10 | | | | 3.28 | | | | 26,634,076 | | | | 0.89 | | | | 3.69 | | | | 1.91 | | | | 57 | |
June 30, 2016 (g) through February 28, 2017 | | | 10.00 | | | | 0.22 | | | | 0.11 | | | | 0.33 | | | | (0.26 | ) | | | (0.01) | | | | (0.27 | ) | | | 10.06 | | | | 3.37 | | | | 25,777,256 | | | | 0.88 | | | | 3.36 | | | | 2.01 | | | | 30 | |
Class R6 | | | | | | | | | | | | | | | | | | | | | | | | | | | | | | | | | | | | | | | | | | | | | | | | | | | | | | | | |
Year Ended February 28, 2018 | | | 10.06 | | | | 0.40 | | | | (0.05) | | | | 0.35 | | | | (0.31 | ) | | | — | | | | (0.31 | ) | | | 10.10 | | | | 3.54 | | | | 21,447 | | | | 0.64 | | | | 3.94 | | | | 3.05 | | | | 57 | |
June 30, 2016 (g) through February 28, 2017 | | | 10.00 | | | | 0.24 | | | | 0.10 | | | | 0.34 | | | | (0.27 | ) | | | (0.01) | | | | (0.28 | ) | | | 10.06 | | | | 3.53 | | | | 20,705 | | | | 0.63 | | | | 3.61 | | | | 2.61 | | | | 30 | |
| (a) | Annualized for periods less than one year, unless otherwise noted. |
| (b) | Calculated based upon average shares outstanding. |
| (c) | Not annualized for periods less than one year. |
| (d) | Includes adjustments in accordance with accounting principles generally accepted in the United States of America and as such, the net asset values for financial reporting purposes and the returns based upon those net asset values may differ from the net asset values and returns for shareholder transactions. |
| (e) | Includes earnings credits and interest expense, if applicable, each of which is less than 0.005% unless otherwise noted. |
| (f) | Certain non-recurring expenses incurred by the Fund were not annualized for the year ended February 28, 2018 and for the period ended February 28, 2017. |
| (g) | Commencement of operations. |
SEE NOTES TO FINANCIAL STATEMENTS.
45
FINANCIAL HIGHLIGHTS
FOR THE PERIODS INDICATED
| | | | | | | | | | | | | | | | | | | | | | | | | | | | | | | | | | | | | | | | | | | | | | | | | | | | | | | | |
| | | | | | Per share operating
performance | | | | | | | | | | | | | | | Ratios/Supplemental data | | | | | | | |
| | | | |
| | | | | | Investment operations | | | Distributions | | | | | | | | | Ratios to average net assets (a) | | | | |
| | | Net asset
value,
beginning
of period | | | Net
investment income (loss) (b) | | | Net realized and
unrealized gains
(losses) on
investments | | | Total from investment operations | | | Net investment income | | | Net realized gain | | | Total
distributions | | | Net asset
value, end of period | | | Total return (excludes sales charge)
(c) (d) | | | Net assets, end of period | | | Net expenses
(e)(f) | | | Net investment income (loss) (f) | | | Expenses without
waivers, reimbursements and earnings
credits (f) | | | Portfolio turnover
rate (c) | |
| | | | |
High Yield Opportunities Fund | | | | | | | | | | | | | | | | | | | | | | | | | | | | | | | | | | | | | | | | | | | | | | | | | | | | | | | | |
Class A | | | | | | | | | | | | | | | | | | | | | | | | | | | | | | | | | | | | | | | | | | | | | | | | | | | | | | | | |
Year Ended February 28, 2018 | | | $10.33 | | | | $0.51 | | | | $(0.09) | | | | $0.42 | | | | $(0.53) | | | | $(0.09) | | | | $(0.62) | | | | $10.13 | | | | 4.18 % | | | | $21,820 | | | | 0.99 % | | | | 4.95 % | | | | 3.60% | | | | 37 % | |
November 1, 2016 (g) through February 28, 2017 | | | 10.00 | | | | 0.15 | | | | 0.32 | | | | 0.47 | | | | (0.14) | | | | — | | | | (0.14) | | | | 10.33 | | | | 4.76 | | | | 20,944 | | | | 0.97 | | | | 4.41 | | | | 3.73 | | | | 6 | |
Class C | | | | | | | | | | | | | | | | | | | | | | | | | | | | | | | | | | | | | | | | | | | | | | | | | | | | | | | | |
Year Ended February 28, 2018 | | | 10.33 | | | | 0.45 | | | | (0.08) | | | | 0.37 | | | | (0.48) | | | | (0.09) | | | | (0.57) | | | | 10.13 | | | | 3.61 | | | | 21,660 | | | | 1.55 | | | | 4.40 | | | | 4.10 | | | | 37 | |
November 1, 2016 (g) through February 28, 2017 | | | 10.00 | | | | 0.13 | | | | 0.32 | | | | 0.45 | | | | (0.12) | | | | — | | | | (0.12) | | | | 10.33 | | | | 4.57 | | | | 20,906 | | | | 1.53 | | | | 3.87 | | | | 4.25 | | | | 6 | |
Class I (formerly Select Class) | | | | | | | | | | | | | | | | | | | | | | | | | | | | | | | | | | | | | | | | | | | | | | | | | | | | | | | | |
Year Ended February 28, 2018 | | | 10.33 | | | | 0.53 | | | | (0.09) | | | | 0.44 | | | | (0.55) | | | | (0.09) | | | | (0.64) | | | | 10.13 | | | | 4.39 | | | | 27,323,588 | | | | 0.79 | | | | 5.15 | | | | 1.86 | | | | 37 | |
November 1, 2016 (g) through February 28, 2017 | | | 10.00 | | | | 0.15 | | | | 0.33 | | | | 0.48 | | | | (0.15) | | | | — | | | | (0.15) | | | | 10.33 | | | | 4.83 | | | | 26,133,164 | | | | 0.78 | | | | 4.61 | | | | 2.67 | | | | 6 | |
Class R6 | | | | | | | | | | | | | | | | | | | | | | | | | | | | | | | | | | | | | | | | | | | | | | | | | | | | | | | | |
Year Ended February 28, 2018 | | | 10.33 | | | | 0.55 | | | | (0.09) | | | | 0.46 | | | | (0.57) | | | | (0.09) | | | | (0.66) | | | | 10.13 | | | | 4.60 | | | | 21,934 | | | | 0.59 | | | | 5.35 | | | | 3.08 | | | | 37 | |
November 1, 2016 (g) through February 28, 2017 | | | 10.00 | | | | 0.16 | | | | 0.33 | | | | 0.49 | | | | (0.16) | | | | — | | | | (0.16) | | | | 10.33 | | | | 4.90 | | | | 20,970 | | | | 0.58 | | | | 4.82 | | | | 3.24 | | | | 6 | |
| (a) | Annualized for periods less than one year, unless otherwise noted. |
| (b) | Calculated based upon average shares outstanding. |
| (c) | Not annualized for periods less than one year. |
| (d) | Includes adjustments in accordance with accounting principles generally accepted in the United States of America and as such, the net asset values for financial reporting purposes and the returns based upon those net asset values may differ from the net asset values and returns for shareholder transactions. |
| (e) | Includes earnings credits and interest expense, if applicable, each of which is less than 0.005% unless otherwise noted. |
| (f) | Certain non-recurring expenses incurred by the Fund were not annualized for year ended February 28, 2018 and for the period ended February 28, 2017. |
| (g) | Commencement of operations. |
SEE NOTES TO FINANCIAL STATEMENTS.
46
NOTES TO FINANCIAL STATEMENTS
AS OF FEBRUARY 28, 2018
1. Organization
JPMorgan Trust IV (the “Trust”) was formed on November 11, 2015, as a Delaware statutory trust, pursuant to a Declaration of Trust dated November 11, 2015 and is registered under the Investment Company Act of 1940, as amended (the “1940 Act”), as an open-end management investment company.
The following are 2 separate funds of the Trust (collectively, the “Funds”) covered by this report:
| | | | |
| | | Classes Offered | | Diversified/Non-Diversified |
| Flexible Long/Short Fund | | Class A, Class C, Class I^ and Class R6 | | Diversified |
| High Yield Opportunities Fund | | Class A, Class C, Class I^ and Class R6 | | Diversified |
^ Effective April 3, 2017, Select Class was renamed Class I.
The investment objective of the Flexible Long/Short Fund is to seek to provide total return.
The investment objective of the High Yield Opportunities Fund is to seek a high level of current income. Capital appreciation is a secondary objective.
The Flexible Long/Short Fund and High Yield Opportunities Fund commenced operations on June 30, 2016 and November 1, 2016, respectively. Currently, the Funds are not publicly offered for investment.
Class A Shares generally provide for a front-end sales charge while Class C Shares provide for a contingent deferred sales charge (“CDSC”). No sales charges are assessed with respect to Class I and Class R6 Shares. Certain Class A Shares, for which front-end sales charges have been waived, may be subject to a CDSC as described in the Funds’ prospectus. Beginning on November 14, 2017, Class C Shares automatically convert to Class A Shares after ten years. All classes of shares have equal rights as to earnings, assets and voting privileges, except that each class may bear different transfer agency, distribution and service fees and each class has exclusive voting rights with respect to its distribution plan and shareholder servicing agreements.
J.P. Morgan Investment Management Inc. (“JPMIM”), an indirect, wholly-owned subsidiary of JPMorgan Chase & Co. (“JPMorgan”), acts as Adviser (the “Adviser”) and Administrator (the “Administrator”) to the Funds.
2. Significant Accounting Policies
The following is a summary of significant accounting policies followed by the Funds in the preparation of their financial statements. The Funds are investment companies and, accordingly, follow the investment company accounting and reporting guidance of the Financial Accounting Standards Board Accounting Standards Codification Topic 946 - Investment Companies, which is part of U.S. generally accepted accounting principles (“GAAP”). The preparation of financial statements in conformity with GAAP requires management to make estimates and assumptions that affect the reported amounts of assets and liabilities and disclosure of contingent assets and liabilities at the date of the financial statements and the reported amounts of increases and decreases in net assets from operations during the reporting period. Actual results could differ from those estimates.
A. Valuation of Investments — The valuation of investments is in accordance with GAAP and the Funds’ valuation policies set forth by and under the supervision and responsibility of the Board of Trustees (the “Board”), which established the following approach to valuation, as described more fully below: (i) investments for which market quotations are readily available shall be valued at such unadjusted quoted prices and (ii) all other investments for which market quotations are not readily available shall be valued at their fair value as determined in good faith by the Board.
The Administrator has established the J.P. Morgan Asset Management Americas Valuation Committee (“AVC”) to assist the Board with the oversight and monitoring of the valuation of the Funds’ investments. The Administrator implements the valuation policies of the Funds’ investments, as directed by the Board. The AVC oversees and carries out the policies for the valuation of investments held in the Funds. This includes monitoring the appropriateness of fair values based on results of ongoing valuation oversight including, but not limited to, consideration of macro or security specific events, market events and pricing vendor and broker due diligence. The Administrator is responsible for discussing and assessing the potential impacts to the fair values on an ongoing basis, and at least on a quarterly basis with the AVC and the Board.
47
A market-based approach is primarily used to value the Funds’ investments. Investments for which market quotations are not readily available are fair valued by approved affiliated and unaffiliated pricing vendors or third party broker-dealers (collectively referred to as “Pricing Services”) or may be internally fair valued using methods set forth by the valuation policies approved by the Board. This may include related or comparable assets or liabilities, recent transactions, market multiples, book values and other relevant information for the investment to determine the fair value of the investment. An income-based valuation approach may be used in which the anticipated future cash flows of the investment are discounted to calculate the fair value. Discounts may also be applied due to the nature or duration of any restrictions on the disposition of the investments. Valuations may be based upon current market prices of securities that are comparable in coupon, rating, maturity and industry. It is possible that the estimated values may differ significantly from the values that would have been used, had a ready market for the investments existed, and such differences could be material.
Fixed income instruments are valued based on prices received from Pricing Services. The Pricing Services use multiple valuation techniques to determine the valuation of fixed income instruments. In instances where sufficient market activity exists, the Pricing Services may utilize a market-based approach through which trades or quotes from market makers are used to determine the valuation of these instruments. In instances where sufficient market activity may not exist, the Pricing Services also utilize proprietary valuation models which may consider market transactions in comparable securities and the various relationships between securities in determining fair value and/or market characteristics in order to estimate the relevant cash flows, which are then discounted to calculate the fair values.
Equities and other exchange-traded instruments are valued at the last sale price or official market closing price on the primary exchange on which the instrument is traded before the net asset values (“NAV”) of the Funds are calculated on a valuation date.
Investments in open-end investment companies (the “Underlying Funds”), are valued at each Underlying Fund’s NAV per share as of the report date.
Futures and options are generally valued on the basis of available market quotations. Swaps and forward foreign currency exchange contracts are valued utilizing market quotations from approved Pricing Services.
Valuations reflected in this report are as of the report date. As a result, changes in valuation due to market events and/or issuer related events after the report date and prior to issuance of the report are not reflected herein.
The various inputs that are used in determining the valuation of the Funds’ investments are summarized into the three broad levels listed below.
| • | | Level 1 — Unadjusted inputs using quoted prices in active markets for identical investments. |
| • | | Level 2 — Other significant observable inputs including, but not limited to, quoted prices for similar investments, inputs other than quoted prices that are observable for investments (such as interest rates, prepayment speeds, credit risk, etc.) or other market corroborated inputs. |
| • | | Level 3 — Significant inputs based on the best information available in the circumstances, to the extent observable inputs are not available (including the Funds’ assumptions in determining the fair value of investments). |
A financial instrument’s level within the fair value hierarchy is based on the lowest level of any input, both individually and in the aggregate, that is significant to the fair value measurement. The inputs or methodology used for valuing instruments are not necessarily an indication of the risk associated with investing in those instruments.
48
The following tables represent each valuation input as presented on the Schedules of Portfolio Investments (“SOIs”):
Flexible Long/Short Fund
| | | | | | | | | | | | | | | | | | | | | | | | |
| | | | | | Level 1
Quoted prices | | | | | Level 2
Other significant observable
inputs | | | | | Level 3
Significant unobservable
inputs | | | | | Total |
Investments in Securities | | | | | | | | | | | | | | | | | | | | | | | | |
Common Stock | | | | | | | | | | | | | | | | | | | | | | | | |
Information Technology | | | $ | | | 14,777 | | $ | | | | – | | $ | | | | – | | $ | | | | 14,777 |
Debt Securities | | | | | | | | | | | | | | | | | | | | | | | | |
Asset-Backed Securities | | | | | | – | | | | | | 48,926 | | | | | | – | | | | | | 48,926 |
Convertible Bonds | | | | | | | | | | | | | | | | | | | | | | | | |
Consumer Discretionary | | | | | | – | | | | | | 173,391 | | | | | | – | | | | | | 173,391 |
Energy | | | | | | – | | | | | | 40,329 | | | | | | – | | | | | | 40,329 |
Health Care | | | | | | – | | | | | | 5,840 | | | | | | – | | | | | | 5,840 |
Information Technology | | | | | | – | | | | | | 203,084 | | | | | | – | | | | | | 203,084 |
Total Convertible Bonds | | | | | | – | | | | | | 422,644 | | | | | | – | | | | | | 422,644 |
Corporate Bonds | | | | | | | | | | | | | | | | | | | | | | | | |
Consumer Discretionary | | | | | | – | | | | | | 2,709,525 | | | | | | – | | | | | | 2,709,525 |
Consumer Staples | | | | | | – | | | | | | 573,859 | | | | | | – | | | | | | 573,859 |
Energy | | | | | | – | | | | | | 1,534,621 | | | | | | – | | | | | | 1,534,621 |
Financials | | | | | | – | | | | | | 5,688,633 | | | | | | – | | | | | | 5,688,633 |
Health Care | | | | | | – | | | | | | 1,034,998 | | | | | | – | | | | | | 1,034,998 |
Industrials | | | | | | – | | | | | | 2,105,871 | | | | | | – | | | | | | 2,105,871 |
Information Technology | | | | | | – | | | | | | 554,407 | | | | | | 3 | | | | | | 554,410 |
Materials | | | | | | – | | | | | | 1,700,830 | | | | | | – | | | | | | 1,700,830 |
Real Estate | | | | | | – | | | | | | 327,858 | | | | | | – | | | | | | 327,858 |
Telecommunication Services | | | | | | – | | | | | | 1,572,529 | | | | | | – | | | | | | 1,572,529 |
Utilities | | | | | | – | | | | | | 1,032,843 | | | | | | – | | | | | | 1,032,843 |
Total Corporate Bonds | | | | | | – | | | | | | 18,835,974 | | | | | | 3 | | | | | | 18,835,977 |
U.S. Treasury Obligations | | | | | | – | | | | | | 18,530 | | | | | | – | | | | | | 18,530 |
Loan Assignments | | | | | | | | | | | | | | | | | | | | | | | | |
Consumer Discretionary | | | | | | – | | | | | | 1,362,817 | | | | | | – | | | | | | 1,362,817 |
Consumer Staples | | | | | | – | | | | | | 806,752 | | | | | | – | | | | | | 806,752 |
Energy | | | | | | – | | | | | | 459,673 | | | | | | – | | | | | | 459,673 |
Financials | | | | | | – | | | | | | 76,467 | | | | | | – | | | | | | 76,467 |
Health Care | | | | | | – | | | | | | 789,655 | | | | | | – | | | | | | 789,655 |
Industrials | | | | | | – | | | | | | 255,341 | | | | | | – | | | | | | 255,341 |
Information Technology | | | | | | – | | | | | | 537,205 | | | | | | – | | | | | | 537,205 |
Materials | | | | | | – | | | | | | 377,247 | | | | | | – | | | | | | 377,247 |
Real Estate | | | | | | – | | | | | | 99,548 | | | | | | – | | | | | | 99,548 |
Telecommunication Services | | | | | | – | | | | | | 498,884 | | | | | | – | | | | | | 498,884 |
Utilities | | | | | | – | | | | | | 886,944 | | | | | | – | | | | | | 886,944 |
Total Loan Assignments | | | | | | – | | | | | | 6,150,533 | �� | | | | | – | | | | | | 6,150,533 |
Options Purchased | | | | | | | | | | | | | | | | | | | | | | | | |
Future Interest Rate Call Options | | | | | | 5,313 | | | | | | – | | | | | | – | | | | | | 5,313 |
Short-Term Investments | | | | | | | | | | | | | | | | | | | | | | | | |
Investment Companies | | | | | | 445,436 | | | | | | – | | | | | | – | | | | | | 445,436 |
Total Investments in Securities | | | $ | | | 465,526 | | $ | | | | 25,476,607 | | $ | | | | 3* | | $ | | | | 25,942,136 |
| | | | | | | | | | | | | | | | | | | | | | | | |
Liabilities | | | | | | | | | | | | | | | | | | | | | | | | |
Appreciation in Other Financial Instruments | | | | | | | | | | | | | | | | | | |
Forward Foreign Currency Exchange | | | | | | | | | | | | | | | | | | | | | | | | |
Contracts | | | $ | | | – | | $ | | | | 185,057 | | $ | | | | – | | $ | | | | 185,057 |
Futures Contracts | | | | | | 4,913 | | | | | | – | | | | | | – | | | | | | 4,913 |
Swaptions Purchased | | | | | | – | | | | | | 28,100 | | | | | | – | | | | | | 28,100 |
Swaps | | | | | | – | | | | | | 33,118 | | | | | | – | | | | | | 33,118 |
Total Appreciation in Other Financial Instruments | | | $ | | | 4,913 | | $ | | | | 246,275 | | $ | | | | – | | $ | | | | 251,188 |
| | | | | | | | | | | | | | | | | | | | | | | | |
49
| | | | | | | | | | | | | | | | |
Flexible Long/Short Fund - continued | | | | | | | | | | | | | |
| | | Level 1 Quoted
prices | | | Level 2 Other significant observable
inputs | | | Level 3 Significant
unobservable
inputs | | | Total | |
Depreciation in Other Financial Instruments | | | | | | | | | | | | | |
Forward Foreign Currency Exchange Contracts | | $ | – | | | $ | (15,640 | ) | | $ | – | | | $ | (15,640) | |
Futures Contracts | | | (8,901 | ) | | | – | | | | – | | | | (8,901) | |
Options Written Call Options Written | | | (3,187 | ) | | | – | | | | – | | | | (3,187) | |
Swaptions Written | | | – | | | | (12,133 | ) | | | – | | | | (12,133) | |
Swaps | | | – | | | | (15,896 | ) | | | – | | | | (15,896) | |
Total Depreciation in Other Financial Instruments | | $ | (12,088 | ) | | $ | (43,669 | ) | | $ | – | | | $ | (55,757) | |
High Yield Opportunities Fund
| | | | | | | | | | | | | | | | |
| | | Level 1 Quoted
prices | | | Level 2 Other significant observable
inputs | | | Level 3 Significant unobservable inputs | | | Total | |
Investments in Securities | | | | | | | | | | | | | | | | |
Debt Securities | | | | | | | | | | | | | | | | |
Convertible Bonds | | | | | | | | | | | | | | | | |
| | | | |
Consumer Discretionary | | $ | – | | | $ | 173,923 | | | $ | – | | | $ | 173,923 | |
Energy | | | – | | | | 12,886 | | | | – | | | | 12,886 | |
| | | | |
Information Technology | | | | | | | 448,658 | | | | – | | | | 448,658 | |
Total Convertible Bonds | | | – | | | | 635,467 | | | | – | | | | 635,467 | |
Corporate Bonds | | | | | | | | | | | | | | | | |
| | | | |
Consumer Discretionary | | | – | | | | 6,193,769 | | | | – | | | | 6,193,769 | |
Consumer Staples | | | – | | | | 838,025 | | | | – | | | | 838,025 | |
Energy | | | – | | | | 2,494,046 | | | | – | | | | 2,494,046 | |
Financials | | | – | | | | 378,614 | | | | – | | | | 378,614 | |
Health Care | | | – | | | | 3,273,893 | | | | – | | | | 3,273,893 | |
Industrials | | | – | | | | 2,366,482 | | | | – | | | | 2,366,482 | |
| | | | |
Information Technology | | | – | | | | 1,614,009 | | | | – | | | | 1,614,009 | |
Materials | | | – | | | | 2,027,363 | | | | – | | | | 2,027,363 | |
Real Estate | | | – | | | | 659,838 | | | | – | | | | 659,838 | |
| | | | |
Telecommunication Services | | | – | | | | 3,605,832 | | | | – | | | | 3,605,832 | |
Utilities | | | – | | | | 352,093 | | | | – | | | | 352,093 | |
Total Corporate Bonds | | | – | | | | 23,803,964 | | | | – | | | | 23,803,964 | |
Common Stocks | | | | | | | | | | | | | | | | |
Consumer Discretionary | | | 62,840 | | | | – | | | | – | | | | 62,840 | |
Real Estate | | | 164,122 | | | | – | | | | – | | | | 164,122 | |
Total Common Stocks | | | 226,962 | | | | – | | | | – | | | | 226,962 | |
Loan Assignments | | | | | | | | | | | | | | | | |
Consumer Discretionary | | | – | | | | 684,161 | | | | – | | | | 684,161 | |
Energy | | | – | | | | 49,607 | | | | – | | | | 49,607 | |
Health Care | | | – | | | | 205,538 | | | | – | | | | 205,538 | |
Industrials | | | – | | | | 75,197 | | | | – | | | | 75,197 | |
Materials | | | – | | | | 145,152 | | | | – | | | | 145,152 | |
Real Estate | | | – | | | | 24,978 | | | | – | | | | 24,978 | |
Total Loan Assignments | | | – | | | | 1,184,633 | | | | – | | | | 1,184,633 | |
Short-Term Investment | | | – | | | | | | | | | | | | | |
Investment Company | | | 1,311,048 | | | | – | | | | – | | | | 1,311,048 | |
Total Investments in Securities | | | $ 1,538,010 | | | $ | 25,624,064 | | | $ | – | | | $ | 27,162,074 | |
50
High Yield Opportunities Fund - continued
| | | | | | | | | | | | | | | | |
| | | Level 1 Quoted prices | | | Level 2
Other significant observable
inputs | | | Level 3
Significant unobservable
inputs | | | Total | |
Appreciation in Other Financial Instruments | | | | | | | | | | | | | | | | |
| | | | |
Forward Foreign Currency Exchange Contracts | | $ | – | | | $ | 109,112 | | | $ | – | | | $ | 109,112 | |
| | | | |
Depreciation in Other Financial Instruments | | | | | | | | | | | | | | | | |
| | | | |
Forward Foreign Currency Exchange Contracts | | $ | – | | | $ | (8,198) | | | $ | – | | | $ | (8,198) | |
Futures Contracts | | | (990) | | | | – | | | | – | | | | (990) | |
Swaps | | | | | | | (7,451) | | | | – | | | | (7,451) | |
| | | | |
Total Depreciation in Other Financial Instruments | | $ | (990) | | | $ | (15,649) | | | $ | – | | | $ | (16,639) | |
| | | | |
* Level 3 securities are valued by brokers and pricing services. At February 28, 2018, the value of these securities was approximately $3 for Flexible Long/Short Fund. The inputs for these securities are not readily available or cannot be reasonably estimated and are generally those inputs described in Note 2.A. The appropriateness of fair values for these securities is monitored on an ongoing basis which may include results of back testing, results of broker and vendor due diligence, unchanged price review and consideration of macro or security specific events.
There were no transfers among any levels during the year ended February 28, 2018.
B. Restricted Securities — Certain securities held by the Funds may be subject to legal or contractual restrictions on resale. Restricted securities generally are resold in transactions exempt from registration under the Securities Act of 1933, as amended (the “Securities Act”). Disposal of these securities may involve time-consuming negotiations and expense. Prompt sale at the current valuation may be difficult and could adversely affect the net asset value of the Funds.
As of February 28, 2018, the Funds had no investments in restricted securities other than securities sold to the Funds under Rule 144A and/or Regulation S under the Securities Act.
C. Loan Assignments — The Funds invested in debt instruments that are interests in amounts owed to lenders or lending syndicates (a “Lender”) by corporate, governmental, or other borrowers (a “Borrower”). A loan is often administered by a bank or other financial institution (the “Agent”) that acts as Agent for all holders. The Agent administers the terms of the loan, as specified in the loan agreement. The Funds invest in loan assignments of all or a portion of the loans. When a fund purchases a loan assignment, the fund has direct rights against the Borrower on a loan, provided, however, the fund’s rights may be more limited than the Lender from which it acquired the assignment and the fund may be able to enforce its rights only through the Agent. As a result, a fund assumes the credit risk of the Borrower as well as any other persons interpositioned between the fund and the Borrower (“Intermediate Participants”). A fund may incur certain costs and delays in realizing payment on a loan assignment or suffer a loss of principal and/or interest if assets or interests held by the Agent or other Intermediate Participants are determined to be subject to the claims of the Agent’s or other Intermediate Participant’s creditors. In addition, it is unclear whether loan assignments and other forms of direct indebtedness offer securities law protections against fraud and misrepresentation. Also, because JPMIM may wish to invest in publicly traded securities of a Borrower, it may not have access to material non-public information regarding the Borrower to which other investors have access. Although certain loan assignments are secured by collateral, a fund could experience delays or limitations in realizing the value on such collateral or have its interest subordinated to other indebtedness of the Borrower. Loan assignments are vulnerable to market conditions such that economic conditions or other events may reduce the demand for assignments and certain assignments that were liquid, when purchased, may become illiquid and they may be difficult to value. In addition, the settlement period for loans is uncertain as there is no standardized settlement schedule applicable to such investments. Therefore, a fund may not receive the proceeds from a sale of such investments for a period after the sale.
Certain loan assignments are also subject to the risks associated with high yield securities described under Note 7.
D. Derivatives — The Funds used derivative instruments including futures, forward foreign currency exchange contracts, options (Flexible Long/Short Fund) and swaps, in connection with their investment strategies. Derivative instruments may be used as substitutes for securities in which the Funds can invest, to hedge portfolio investments or to generate income or gain to the Funds. Derivatives may also be used to manage duration, sector and yield curve exposures and credit and spread volatility.
The Funds may be subject to various risks from the use of derivatives including the risk that changes in the value of a derivative may not correlate perfectly with the underlying asset, rate or index; counterparty credit risk related to derivatives counterparties’ failure to perform under contract terms; liquidity risk related to the lack of a liquid market for these contracts allowing the Funds to close out their position(s); and documentation risk relating to disagreement over contract terms. Investing in certain derivatives also results in a form of leverage and as such, the Funds’ risk of loss associated with these instruments may exceed their value, as recorded on the Statements of Assets and Liabilities.
51
The Funds are party to various derivative contracts governed by International Swaps and Derivatives Association master agreements (“ISDA agreements”). The Funds’ ISDA agreements, which are separately negotiated with each dealer counterparty, may contain provisions allowing, absent other considerations, a counterparty to exercise rights, to the extent not otherwise waived, against the Funds in the event the Funds’ net assets decline over time by a pre-determined percentage or fall below a pre-determined floor. The ISDA agreements may also contain provisions allowing, absent other conditions, the Funds to exercise rights, to the extent not otherwise waived, against a counterparty (e.g., decline in a counterparty’s credit rating below a specified level). Such rights for both a counterparty and the Funds often include the ability to terminate (i.e., close out) open contracts at prices which may favor a counterparty, which could have an adverse effect on the Funds. The ISDA agreements give the Funds and a counterparty the right, upon an event of default, to close out all transactions traded under such agreements and to net amounts owed or due across all transactions and offset such net payable or receivable with collateral posted to a segregated account by one party to the other.
Counterparty credit risk may be mitigated to the extent a counterparty posts collateral for mark to market gains to the Funds.
Notes D(1) — D(4) below describe the various derivatives used by the Funds.
(1). Options — The Flexible Long/Short Fund purchased and sold (“wrote”) put and call options on various instruments including futures, securities and interest rate swaps (“swaptions”) to manage and hedge interest rate risks within its portfolio and also to gain long or short exposure to the underlying instrument, index, currency or rate. A purchaser of a put option has the right, but not the obligation, to sell the underlying instrument at an agreed upon price (“strike price”) to the option seller. A purchaser of a call option has the right, but not the obligation, to purchase the underlying instrument at the strike price from the option seller. Swaptions and Eurodollar options are settled for cash.
Options Purchased — Premiums paid by the Fund for options purchased are included on the Statements of Assets and Liabilities as options purchased. The option is adjusted daily to reflect the current market value of the option and the change is recorded as Change in net unrealized appreciation/depreciation on options purchased on the Statements of Operations. If the option is allowed to expire, the Fund will lose the entire premium they paid and record a realized loss for the premium amount. Premiums paid for options purchased which are exercised or closed are added to the amounts paid or will offset against the proceeds on the underlying investment transaction to determine the realized gain (loss) or cost basis of the underlying investment.
Options Written — Premiums received by the Fund for options written are included on the Statements of Assets and Liabilities as a liability. The amount of the liability is adjusted daily to reflect the current market value of the option written and the change is recorded as Change in net unrealized appreciation/depreciation of Options written on the Statements of Operations. Premiums received from options written that expire are treated as realized gains. If a written option is closed, the Fund records a realized gain or loss on options written based on whether the cost of the closing transaction exceeds the premium received. If a call option is exercised by the option buyer, the premium received by the Fund is added to the proceeds from the sale of the underlying security to the option buyer and compared to the cost of the closing transaction to determine whether there has been a realized gain or loss. If a put option is exercised by an option buyer, the premium received by the option seller reduces the cost basis of the purchased security.
Written uncovered call options subject the Fund to unlimited risk of loss. Written covered call options limit the upside potential of a security above the strike price. Written put options subject the Fund to risk of loss if the value of the security declines below the exercise price minus the put premium.
The Fund’s exchange traded option contracts are not subject to master netting arrangements (the right to close out all transactions traded with a counterparty and net amounts owed or due across transactions).
The Fund may be required to post or receive collateral for over the counter options.
(2). Futures Contracts — The Funds used treasury, index or other financial futures contracts to manage and hedge interest rate risk associated with portfolio investments. The Funds also used futures contracts to lengthen or shorten the duration of the overall investment portfolio.
Futures contracts provide for the delayed delivery of the underlying instrument at a fixed price or are settled for a cash amount based on the change in the value of the underlying instrument at a specific date in the future. Upon entering into a futures contract, the Funds is required to deposit with the broker, cash or securities in an amount equal to a certain percentage of the contract amount, which is referred to as the initial margin deposit. Subsequent payments, referred to as variation margin, are made or received by the Funds periodically and are based on changes in the market value of open futures contracts. Changes in the market value of open futures contracts are recorded as Change in net unrealized appreciation/depreciation on the Statements of Operations. Realized gains or losses, representing the difference between the value of the contract at the time it was opened and the value at the time it was closed, are reported on the Statements of Operations at the closing or expiration of the futures contract. Securities deposited as initial margin are designated on the SOI and cash deposited is recorded on the Statements of Assets and Liabilities. A receivable from and/or a payable to brokers for the daily variation margin is also recorded on the Statements of Assets and Liabilities.
The use of futures contracts exposes the Funds to interest rate risk. The Funds may be subject to the risk that the change in the value of the futures contract may not correlate perfectly with the underlying instrument. Use of long futures contracts subjects the Funds to risk of loss in excess of the amounts shown on the Statements of Assets and Liabilities, up to the notional amount of the futures contracts. Use of short futures contracts subjects the Funds to unlimited risk of loss. The Funds may enter into futures contracts only on exchanges or boards of trade. The exchange or board of trade acts as the counterparty to each futures transaction; therefore, the Funds’ credit risk is limited to failure of the exchange or board of trade. Under some circumstances, futures exchanges may establish daily limits on the amount that the price of a futures contract can vary from the previous day’s settlement price, which could effectively prevent liquidation of positions.
The Funds’ futures contracts are not subject to master netting arrangements (the right to close out all transactions traded with a counterparty and net amounts owed or due across transactions).
52
(3). Forward Foreign Currency Exchange Contracts — The Funds may be exposed to foreign currency risks with some or all of the portfolio investments and used forward foreign currency exchange contracts to hedge or manage certain of these exposures as part of an investment strategy. The Funds also bought forward foreign currency exchange contracts to gain exposure to currencies. Forward foreign currency exchange contracts represent obligations to purchase or sell foreign currency on a specified future date at a price fixed at the time the contracts are entered into. Non-deliverable forward foreign currency exchange contracts are settled with the counterparty in U.S. Dollar without the delivery of foreign currency.
The values of the forward foreign currency exchange contracts are adjusted daily based on the applicable exchange rate of the underlying currency. Changes in the value of these contracts are recorded as unrealized appreciation or depreciation until the contract settlement date. When the forward foreign currency exchange contract is closed, the Funds record a realized gain or loss equal to the difference between the value at the time the contract was opened and the value at the time it was closed. The Funds also record a realized gain or loss when a forward foreign currency exchange contract offsets another forward foreign currency exchange contract with the same counterparty upon settlement.
The Funds’ forward foreign currency exchange contracts are subject to master netting arrangements (the right to close out all transactions with a counterparty and net amounts owed or due across transactions). The Funds may be required to post or receive collateral for non-deliverable forward foreign currency exchange contracts. As of February 28, 2018, the Funds did not receive or post collateral for forward foreign currency exchange contracts.
(4). Swaps — The Funds engaged in various swap transactions, including credit default, interest rate and return swaps, to manage credit and interest rate (e.g., duration, yield curve) risks within its portfolio. The Funds also used swaps as alternatives to direct investments. Swap transactions are negotiated contracts over the counter (“OTC swaps”) between the fund and a counterparty or centrally cleared (“centrally cleared swaps”) with a central clearinghouse through a Futures Commission Merchant (“FCM”), to exchange investment cash flows, assets, foreign currencies or market-linked returns at specified, future intervals.
Upfront payments made and/or received are recorded as assets or liabilities, respectively, on the Statements of Assets and Liabilities and amortized over the term of the swap. The value of an OTC swap agreement is recorded as either an asset or a liability on the Statements of Assets and Liabilities at the beginning of the measurement period. Upon entering into a centrally cleared swap, the Funds is required to deposit with the FCM cash or securities, which is referred to as initial margin deposit. Securities deposited as initial margin are designated on the SOI and cash deposited is recorded on the Statements of Assets and Liabilities. Daily changes in valuation of centrally cleared swaps, if any, are recorded as a variation margin receivable or payable on the Statements of Assets and Liabilities. The change in the value of swaps, including accruals of periodic amounts of interest to be paid or received on swaps, is reported as Change in net unrealized appreciation/depreciation on the Statements of Operations. A realized gain or loss is recorded upon payment or receipt of a periodic payment or payment made upon termination of a swap agreement.
The Funds may be required to post or receive collateral for OTC Swaps.
The central clearing house acts as the counterparty to each centrally cleared swap transaction, therefore credit risk is limited to the failure of the clearing houses.
The Funds’ swap contracts (excluding centrally cleared swaps) are subject to master netting arrangements.
Credit Default Swaps
The Funds entered into credit default swaps to simulate long and short bond positions or to take an active long or short position with respect to the likelihood of a default or credit event by the issuer of the underlying reference obligation.
The underlying reference obligation may be a single issuer of corporate or sovereign debt, a basket of issuers or a credit index. A credit index is a list of credit instruments or exposures that reference a fixed number of obligors with shared characteristics that represents some part of the credit market as a whole. Index credit default swaps have standardized terms including a fixed spread and standard maturity dates. The composition of the obligations within a particular index changes periodically.
Credit default swaps involve one party, the protection buyer, making a stream of payments to another party, the protection seller, in exchange for the right to receive a contingent payment if there is a credit event related to the underlying reference obligation. In the event that the reference obligation matures prior to the termination date of the contract, a similar security will be substituted for the duration of the contract term. Credit events are defined under individual swap agreements and generally include bankruptcy, failure to pay, restructuring, repudiation/moratorium, obligation acceleration and obligation default.
If a credit event occurs, the Funds, as protection seller, would be obligated to make a payment, which may be either: (i) a net cash settlement equal to the notional amount of the swap less the auction value of the reference obligation or (ii) the notional amount of the swap in exchange for the delivery of the reference obligation. Selling protection effectively adds leverage to a Fund’s portfolio up to the notional amount of swap agreements. The notional amount represents the maximum potential liability under a contract and is not reflected on the Statements of Assets and Liabilities. Potential liabilities under these contracts may be reduced by: the auction rates of the underlying reference obligations; upfront payments received at the inception of a swap; and net amounts received from credit default swaps purchased with the identical reference obligation.
53
(5). Summary of Derivatives Information
The following table presents the value of derivatives held as of February 28, 2018, by their primary underlying risk exposure and respective location on the Statements of Assets and Liabilities:
Flexible Long-Short Fund
| | | | | | | | | | | | | | | | | | | | | | | | | | |
| Derivative Contracts | | | | | | | Statements of Assets and Liabilities Location | | | | | | | |
| Gross Assets: | | | | Options and
Swaptions (a) | | | Futures
Contracts (b) | | | Forward
Foreign
Currency
Exchange
Contracts | | | Centrally
Cleared
Swaps (c) | | | OTC
Swaps | | | Total | |
Interest rate contracts | | Receivables, Net Assets — Unrealized Appreciation | | $ | 5,313 | | | $ | 4,913 | | | $ | — | | | $ | 16,028 | | | $ | — | | | $ | 26,254 | |
Foreign exchange contracts | | Receivables | | | — | | | | — | | | | 185,057 | | | | — | | | | — | | | | 185,057 | |
Credit | | | | | | | | | | | | | | | | | | | | | | | | | | |
contracts | | Receivables | | | 28,100 | | | | — | | | | — | | | | 38,756 | | | | 12,721 | | | | 79,577 | |
| | | | | | | | | | | | | | | | | | | | | | | | | | |
| | | | $ | 33,413 | | | $ | 4,913 | | | $ | 185,057 | | | $ | 54,784 | | | $ | 12,721 | | | $ | 290,888 | |
| | | | | | | | | | | | | | |
| Gross Liabilities: | | | | | | | | | | | | | | | | | | | | | | | | | | |
Interest rate contracts | | Payables, Net Assets — Unrealized Depreciation | | $ | (3,187) | | | $ | (8,901) | | | $ | — | | | $ | — | | | $ | — | | | $ | (12,088) | |
Foreign exchange contracts | | Payables | | | — | | | | — | | | | (15,640) | | | | — | | | | — | | | | (15,640) | |
Credit contracts | | Payables | | | (12,133) | | | | — | | | | — | | | | (89,371) | | | | (53,005) | | | | (154,509) | |
| | | | | | | | | | | | | | |
Total | | | | $ | (15,320) | | | $ | (8,901) | | | $ | (15,640) | | | $ | (89,371) | | | $ | (53,005) | | | $ | (182,237) | |
| | | | | | | | | | | | | | |
| (a) | The market value of options purchased is reported as investments in non-affiliates, at value on the Statements of Assets and Liabilities. |
| (b) | This amount represents the cumulative appreciation (depreciation) of futures contracts as reported on the SOI. The Statements of Assets and Liabilities only reflect the current day variation margin receivable/payable from/to brokers. |
| (c) | This amount represents the value of centrally cleared swaps as reported on the SOI. The Statements of Assets and Liabilities only reflect the current day variation margin receivable/payable from/to brokers. |
The following table presents the value of derivatives held as of February 28, 2018, by their primary underlying risk exposure and respective location on the Statements of Assets and Liabilities:
High Yield Opportunities Fund
| | | | | | | | | | | | | | | | | | | | | | |
| Derivative Contracts | | | | | | | Statements of Assets and Liabilities Location | |
| Gross Assets: | | | | | | | Futures
Contracts (a) | | | Forward Foreign
Currency Exchange
Contracts | | | Centrally Cleared
Swaps (b) | | | Total | |
Foreign exchange
contracts | | Receivables | | | | | | $ | — | | | $ | 109,112 | | | $ | — | | | $ | 109,112 | |
| | | | | | | | | | | | | | | | | | |
| Gross Liabilities: | | | | | | | | | | | | | | | | | | | | | | |
Interest rate contracts | | Payables, Net Assets — Unrealized Depreciation | | | | | | $ | (990) | | | $ | — | | | $ | — | | | $ | (990) | |
Foreign exchange
contracts | | Payables | | | | | | | — | | | | (8,198) | | | | — | | | | (8,198) | |
Credit contracts | | Payables | | | | | | | — | | | | — | | | | (78,816) | | | | (78,816) | |
| | | | | | | | | | | | | | | | | | |
Total | | | | | | | | $ | (990) | | | $ | (8,198) | | | $ | (78,816) | | | $ | (88,004) | |
| | | | | | | | | | | | | | | | | | |
| (a) | This amount represents the cumulative appreciation (depreciation) of futures contracts as reported on the SOI. The Statements of Assets and Liabilities only reflect the current day variation margin receivable/payable from/to brokers. |
| (b) | This amount represents the value of centrally cleared swaps as reported on the SOI. The Statements of Assets and Liabilities only reflect the current day variation margin receivable/payable from/to brokers. |
54
The following table presents the Fund’s gross derivative assets and liabilities by counterparty net of amounts available for offset under netting arrangements and any related collateral received or posted by the Fund as of February 28, 2018:
Flexible Long/Short Fund
| | | | | | | | | | | | | | | | |
Counterparty | | Gross Amount of
Derivative Assets
Subject to Netting
Arrangements
Presented on the
Statements of
Assets and
Liabilities (a) | | | Derivatives
Available
for offset | | | Collateral
Received | | | Net Amount Due
From Counterparty
(Not less than
zero) | |
Australia & New Zealand Banking group Ltd. | | $ | 12,580 | | | $ | (8,440) | | | $ | — | | | $ | 4,140 | |
Barclays Bank plc. | | | 11,895 | | | | (11,895) | | | | — | | | | — | |
BNP Paribas | | | 166,708 | | | | (316) | | | | — | | | | 166,392 | |
Goldman Sachs International | | | 28,926 | | | | (28,926) | | | | — | | | | — | |
HSBC Bank, N.A. | | | 5,068 | | | | (5,068) | | | | — | | | | — | |
Royal Bank of Canada | | | 701 | | | | (701) | | | | — | | | | — | |
| | | | | | | | | | | | | | | | |
| | $ | 225,878 | | | $ | (55,346) | | | $ | — | | | $ | 170,532 | |
| | | | | | | | | | | | | | | | |
| | | | | | | | | | | | | | | | |
Counterparty | | Gross Amount of
Derivative Assets
Subject to Netting
Arrangements
Presented on the
Statements of
Assets and
Liabilities (a) | | | Derivatives
Available
for offset | | | Collateral
Posted | | | Net Amount Due To
Counterparty (Not
less than zero) | |
Australia & New Zealand Banking group Ltd. | | $ | 8,440 | | | $ | (8,440) | | | $ | — | | | $ | — | |
Barclays Bank plc. | | | 19,637 | | | | (11,895) | | | | — | | | | 7,742 | |
BNP Paribas | | | 316 | | | | (316) | | | | — | | | | — | |
CitiBank, N.A. | | | 3,357 | | | | — | | | | — | | | | 3,357 | |
Goldman Sachs International | | | 42,457 | | | | (28,926) | | | | — | | | | 13,531 | |
HSBC Bank, N.A. | | | 5,282 | | | | (5,068) | | | | — | | | | 214 | |
Royal Bank of Canada | | | 1,289 | | | | (701) | | | | — | | | | 588 | |
| | | | | | | | | | | | | | | | |
| | $ | 80,778 | | | $ | (55,346) | | | $ | — | | | $ | 25,432 | |
| | | | | | | | | | | | | | | | |
| (a) | For financial reporting purposes, the Fund does not offset derivative assets and derivative liabilities subject to master netting arrangements on the Statements of Assets and Liabilities. |
55
The following tables present the effect of derivatives on the Statements of Operations for the year ended February 28, 2018, by primary underlying risk exposure:
Flexible Long/Short Fund
| | | | | | | | | | | | | | | | | | | | |
| Amount of Realized Gain (Loss) on Derivatives Recognized on the Statements of Operations | |
Derivative Contracts | | Options and
Swaptions | | | Futures Contracts | | | Forward Foreign
Currency Exchange
Contracts | | | Swaps | | | Total | |
Interest rate contracts | | $ | — | | | $ | 6,615 | | | $ | — | | | $ | (4,662) | | | $ | 1,953 | |
Foreign exchange contracts | | | — | | | | — | | | | (845,379) | | | | — | | | | (845,379) | |
Credit contracts | | | (17,502) | | | | — | | | | — | | | | (12,729) | | | | (30,231) | |
| | | | | | | | | | | | | | | | | | | | |
Total | | $ | (17,502) | | | $ | 6,615 | | | $ | (845,379) | | | $ | (17,391) | | | $ | (873,657) | |
| | | | | | | | | | | | | | | | | | | | |
| | | | | | | | | | | | | | | | | | | | |
| Amount of Change in Unrealized Appreciation (Depreciation) on Derivatives Recognized on the Statements of Operations | |
Derivative Contracts | | Options and
Swaptions | | | Futures Contracts | | | Forward Foreign
Currency Exchange
Contracts | | | Swaps | | | Total | |
Interest rate contracts | | $ | (1,062) | | | $ | 17,012 | | | $ | — | | | $ | 16,028 | | | $ | 31,978 | |
Foreign exchange contracts | | | | | | | — | | | | 117,743 | | | | — | | | | 117,743 | |
Credit contracts | | | 6,012 | | | | — | | | | — | | | | 1,543 | | | | 7,555 | |
| | | | | | | | | | | | | | | | | | | | |
Total | | $ | 4,950 | | | $ | 17,012 | | | $ | 117,743 | | | $ | 17,571 | | | $ | 157,276 | |
| | | | |
High Yield Opportunities Fund
| | | | | | | | | | | | | | | | |
| Amount of Realized Gain (Loss) on Derivatives Recognized on the Statements of Operations | |
Derivative Contracts | | Futures Contracts | | | Forward Foreign
Currency Exchange
Contracts | | | Swaps | | | Total | |
Interest rate contracts | | $ | 38,071 | | | $ | — | | | $ | — | | | $ | 38,071 | |
Foreign exchange contracts | | | — | | | | (611,809) | | | | — | | | | (611,809) | |
Credit contracts | | | — | | | | — | | | | (5,958) | | | | (5,958) | |
| | | | | | | | | | | | |
Total | | $ | 38,071 | | | $ | (611,809) | | | $ | (5,958) | | | $ | (579,696) | |
| | | | | | | | | | | | |
| | | | | | | | | | | | | | | | | |
| | | | | | | | | | | | | | | | |
| Amount of Change in Unrealized Appreciation (Depreciation) on Derivatives Recognized on the Statements of Operations | |
Derivative Contracts | | Futures Contracts | | | Forward Foreign
Currency Exchange
Contracts | | | Swaps | | | Total | |
Interest rate contracts | | $ | (990) | | | $ | — | | | $ | — | | | $ | (990) | |
Foreign exchange contracts | | | — | | | | 60,230 | | | | — | | | | 60,230 | |
Credit contracts | | | — | | | | — | | | | (7,451) | | | | (7,451) | |
| | | | | | | | | | | | |
Total | | $ | (990) | | | $ | 60,230 | | | $ | (7,451) | | | $ | 51,789 | |
| | | | | | | | | | | | |
Derivatives Volume
The tables below disclose the volume of the Funds’ futures contracts, forward foreign currency exchange contracts, options and swaps activity during the period ended February 28, 2018. Please refer to the tables in the Summary of Derivatives Information for derivative-related gains and losses associated with volume activity.
56
| | | | | | | | |
| | | Flexible
Long/Short
Fund | | | High Yield
Opportunities
Fund | |
Futures Contracts: | | | | | | | | |
Average Notional Balance Long | | $ | 950,589 | (a) | | $ | — | |
Average Notional Balance Short | | | 2,929,134 | | | | 1,200,294 | (b) |
Ending Notional Balance Long | | | 909,437 | | | | — | |
Ending Notional Balance Short | | | 2,836,549 | | | | 1,163,938 | |
| | |
Forward Foreign Currency Exchange Contracts: | | | | | | | | |
Average Settlement Value Purchased | | | 2,625,113 | | | | 517,919 | (a) |
Average Settlement Value Sold | | | 10,525,830 | | | | 6,881,612 | |
Ending Settlement Value Purchased | | | 7,363,886 | | | | 4,634,267 | |
Ending Settlement Value Sold | | | 14,695,309 | | | | 9,270,621 | |
| | |
Credit Default Swaps: | | | | | | | | |
Average Notional Balance - Buy Protection | | | 3,515,219 | | | | 1,000,000 | (c) |
Average Notional Balance - Sell Protection | | | 1,638,905 | (b) | | | — | |
Ending Notional Balance - Buy Protection | | | 5,718,300 | | | | 1,000,000 | |
Ending Notional Balance - Sell Protection | | | 3,156,200 | | | | — | |
| | |
Exchange-Traded Options: | | | | | | | | |
Average Number of Contracts Purchased | | | 68 | (d) | | | — | |
Average Number of Contracts Written | | | 68 | (d) | | | — | |
Ending Number of Contracts Purchased | | | 68 | | | | — | |
Ending Number of Contracts Written | | | 68 | | | | — | |
| | |
Swaptions & OTC Options: | | | | | | | | |
Average Notional Balance Purchased | | | 4,687,500 | (e) | | | — | |
Average Notional Balance Written | | | 1,675,000 | (f) | | | — | |
Ending Notional Balance Purchased | | | 2,000,000 | | | | — | |
Ending Notional Balance Written | | | 2,000,000 | | | | — | |
| | |
Interest Rate-Related Swaps: | | | | | | | | |
Average Notional Balance — Pays Fixed Rate | | | 552,273 | (b) | | | — | |
Ending Notional Balance — Pays Fixed Rate | | | 450,000 | | | | — | |
(a) For the period March 1, 2017 through February 28, 2018.
(b) For the period April 1, 2017 through February 28, 2018.
(c) For the period October 1, 2017 through February 28, 2018.
(d) For the period February 1, 2018 through February 28, 2018.
(e) For the period May 1, 2017 through February 28, 2018.
(f) For the period January 1, 2018 through February 28, 2018.
The Funds may be required to post or receive collateral based on the net value of the Funds’ outstanding OTC swap contracts, non-deliverable Forward Foreign Currency Exchange Contracts and/or OTC options with the counterparty in the form of cash or securities. Daily movement of cash collateral is subject to minimum threshold amounts. Collateral posted by the Funds is held in a segregated account at the Funds’ custodian bank. For certain counterparties, cash collateral posted by the Funds is invested in an affiliated money market fund. Otherwise the cash collateral is included on the Statements of Assets and Liabilities as Restricted cash.
The Funds’ derivatives contracts held at February 28, 2018 are not accounted for as hedging instruments under GAAP.
E. When-Issued Securities, Delayed Delivery Securities and Forward Commitments — Flexible Long/Short Fund purchased when-issued securities, including To Be Announced (“TBA”) securities, and entered into contracts to purchase or sell securities for a fixed price that may be settled a month or more after the trade date, or purchased delayed delivery securities which generally settle seven days after the trade date. When-issued securities are securities that have been authorized, but not issued in the market. A forward commitment involves entering into a contract to purchase or sell securities for a fixed price at a future date that may be settled a month or more after the trade date. A delayed delivery security is agreed upon in advance between the buyer and the seller of the security and is generally delivered beyond seven days of the agreed upon date. The purchase of securities on a when-issued, delayed delivery or forward commitment basis involves the risk that the value of the security to be purchased declines before the settlement date. The sale of securities on a forward commitment basis involves the risk that the value of the securities
57
sold may increase before the settlement date. The Funds may be exposed to credit risk if the counterparty fails to perform under the terms of the transaction. Interest income for securities purchased on a when-issued, delayed delivery or forward commitment basis is not accrued until the settlement date.
Flexible Long/Short Fund had delayed delivery securities outstanding as of February 28, 2018. The values of these securities held at February 28, 2018 are detailed on the SOIs.
F. Foreign Currency Translation — The books and records of the Funds are maintained in U.S. dollars. Foreign currency amounts are translated into U.S. dollars at the prevailing exchange rates of such currencies against the U.S. dollar. The market value of investment securities and other assets and liabilities are translated at the exchange rate as of the valuation date. Purchases and sales of investment securities, income and expenses are translated at the exchange rate prevailing on the respective dates of such transactions.
The Funds do not isolate the effect of changes in foreign exchange rates from changes in market prices on securities held. Accordingly, such changes are included within Change in net unrealized appreciation/depreciation on investments on the Statements of Operations.
Reported realized foreign currency gains and losses arise from the disposition of foreign currency, currency gains or losses realized between the trade and settlement dates on securities transactions, and the difference between the amounts of dividends, interest and foreign withholding taxes recorded on each Fund’s books on the transaction date and the U.S. dollar equivalent of the amounts actually received or paid. These reported realized foreign currency gains and losses are included in Net realized gain (loss) on foreign currency transactions on the Statements of Operations. Unrealized foreign currency gains and losses arise from changes (due to changes in exchange rates) in the value of foreign currency and other assets and liabilities denominated in foreign currencies, which are held at year end are included in Change in net unrealized appreciation/depreciation on foreign currency translations on the Statements of Operations.
G. Offering and Organizational Costs — Total offering costs of $74,674 and $41,964 paid in connection with the offering of shares of the Flexible Long/Short Fund and High Yield Opportunities Fund, respectively, were amortized on a straight line basis over 12 months from the date the Funds commenced operations. Costs paid in connection with the organization of the Funds, if any, were recorded as an expense at the time the Funds commenced operations and are included as part of Professional fees on the Statements of Operations. For the year ended February 28, 2018, total offering costs amortized for each fund were $24,959 and $28,282, respectively.
H. Security Transactions and Investment Income — Investment transactions are accounted for on the trade date (the date the order to buy or sell is executed). Securities gains and losses are calculated on a specifically identified cost basis. Interest income and interest expense on securities sold short, if any, is determined on the basis of coupon interest accrued using the effective interest method which adjusts for amortization of premiums and accretion of discounts.
Dividend income net of foreign tax withheld, if any, is recorded on the ex-dividend date or when the Funds first learn of the dividend. Certain Funds may receive other income from investment in loan assignments and/or unfunded commitments, including amendment fees, consent fees and commitment fees. These fees are recorded as income when received by the Funds. These amounts are included in Interest Income on the Statements of Operations.
I. Foreign Taxes — The Funds may be subject to foreign taxes on income, gains on investments or currency purchases/repatriation, a portion of which may be recoverable. The Funds will accrue such taxes and recoveries as applicable, based upon their current interpretation of tax rules and regulations that exist in the markets in which they invest.
J. Allocation of Income and Expenses — Expenses directly attributable to a fund are charged directly to that fund, while the expenses attributable to more than one fund of the Trust are allocated among the respective funds. In calculating the NAV of each class, investment income, realized and unrealized gains and losses and expenses, other than class specific expenses, are allocated daily to each class of shares based upon the proportion of net assets of each class at the beginning of each day.
Transfer agency fees are class-specific expenses. The amount of the transfer agency fees charged to each class of the Funds for the year ended February 28, 2018 are as follows (amounts in thousands):
| | | | | | | | | | | | | | | | | | | | |
| | | Class A | | | Class C | | | Class I | | | Class R6 | | | Total | |
Flexible Long/Short Fund | | | $295 | | | | $295 | | | | $461 | | | | $295 | | | | $1,346 | |
High Yield Opportunities Fund | | | 319 | | | | 318 | | | | 452 | | | | 319 | | | | 1,408 | |
K. Federal Income Taxes — Each Fund is treated as a separate taxable entity for Federal income tax purposes. Each Fund’s policy is to comply with the provisions of the Internal Revenue Code of 1986, as amended (the “Code”), applicable to regulated investment companies and to distribute to shareholders all of its distributable net investment income and net realized capital gains on investments. Accordingly, no provision for Federal income tax is necessary. Management has reviewed the Funds’ tax positions for all open tax years and has determined that as of February 28, 2018, no liability for income tax is required in the Funds’ financial statements for net unrecognized tax benefits. However, management’s conclusions may be subject to future review based on changes in, or the interpretation of, the accounting standards or tax laws and regulations. Each of the Funds’ Federal tax returns for the prior three fiscal years, or since inception if shorter, remains subject to examination by the Internal Revenue Service.
L. Distributions to Shareholders — Distributions from net investment income are generally declared and paid monthly and are declared separately for each class. No class has preferential dividend rights; differences in per share rates are due to differences in separate class expenses. Net realized capital gains, if any, are distributed by each Fund at least annually. The amount of distributions from net investment income and net realized capital gains is determined in accordance with Federal income tax regulations, which may differ from GAAP. To the extent these “book/tax”
differences are permanent in nature (i.e., that they result from other than timing of recognition — “temporary differences”), such amounts are reclassified within the capital accounts based on their Federal tax-basis treatment.
58
The following amounts were reclassified within the capital accounts:
| | | | | | | | |
| | | Paid-in-Capital | | Accumulated
undistributed
(distributions in
excess of) net investment
income | | Accumulated
net realized
gains (losses) | |
Flexible Long/Short Fund | | $(2,105) | | $(690,653) | | | $692,758 | |
High Yield Opportunities Fund | | (1) | | 136,817 | | | (136,816) | |
The reclassifications for the Funds relate primarily to foreign currency gains or losses and investments in contingent payment debt instruments.
3. Fees and Other Transactions with Affiliates
A. Investment Advisory Fee — Pursuant to Investment Advisory Agreements, the Adviser supervises the investments of each Fund and for such services is paid a fee. The fee is accrued daily and paid monthly based on each Fund’s respective average daily net assets. The annual rate for each Fund is as follows:
| | | | |
Flexible Long/Short Fund | | | 0.50% | |
High Yield Opportunities Fund | | | 0.60 | |
The Adviser waived Investment Advisory fees and/or reimbursed expenses as outlined in Note 3.G.
B. Administration Fee — Pursuant to Administration Agreements, the Administrator provides certain administration services to the Funds. In consideration of these services, the Administrator receives a fee accrued daily and paid monthly at an annual rate of 0.15% of the first $25 billion of the average daily net assets of all funds in the J.P. Morgan Funds Complex covered by the Administration Agreement (excluding certain funds of funds and money market funds) and 0.075% of the average daily net assets in excess of $25 billion of all such funds. For the year ended February 28, 2018, the effective rate was 0.08% of each Fund’s average daily net assets, notwithstanding any fee waivers and/or expense reimbursements.
The Administrator waived Administration fees as outlined in Note 3.G.
JPMCB, a wholly-owned subsidiary of JPMorgan, serves as the Funds’ sub-administrator (the “Sub-administrator”). For its services as Sub-administrator, JPMCB receives a portion of the fees payable to the Administrator.
C. Distribution Fees — Pursuant to a Distribution Agreement, JPMorgan Distribution Services, Inc. (“JPMDS”), an indirect, wholly-owned subsidiary of JPMorgan, serves as the Trust’s exclusive underwriter and promotes and arranges for the sale of each Fund shares.
The Board has adopted a Distribution Plan (the “Distribution Plan”) for Class A and Class C Shares of the Funds in accordance with Rule 12b-1 under the 1940 Act. The Class I and Class R6 do not charge a distribution fee. The Distribution Plan provides that the Funds shall pay distribution fees, including payments to JPMDS, at annual rates of 0.25% and 0.75% of the average daily net assets of Class A and Class C Shares, respectively.
In addition, JPMDS is entitled to receive the front-end sales charges from purchases of Class A Shares and the CDSC from redemptions of Class C Shares and certain Class A Shares for which front-end sales charges have been waived. For the year ended February 28, 2018, JPMDS did not retain any front-end sales charges or CDSC.
D. Service Fees — The Trust, on behalf of the Funds, has entered into a Shareholder Servicing Agreement with JPMDS under which JPMDS provides certain support services to the shareholders. For performing these services, JPMDS receives a fee, except for Class R6 Shares which do not charge a service fee, that is accrued daily and paid monthly equal to a percentage of the average daily net assets as shown in the table below:
| | | | | | | | | | | | |
| | | Class A | | | Class C | | | Class I | |
| |
Flexible Long/Short Fund | | | 0.25 | % | | | 0.25 | % | | | 0.25% | |
High Yield Opportunities Fund | | | 0.25 | | | | 0.25 | | | | 0.25 | |
JPMDS has entered into shareholder services contracts with affiliated and unaffiliated financial intermediaries who provide shareholder services and other related services to their clients or customers who invest in the Funds under which JPMDS will pay all or a portion of such fees earned to financial intermediaries for performing such services.
JPMDS waived service fees as outlined in Note 3.G.
E. Custodian and Accounting Fees — JPMCB provides portfolio custody and accounting services to the Funds. For performing these services, the Funds pay JPMCB transaction and asset-based fees that vary according to the number of transactions and positions, plus out-of-pocket expenses. The amounts paid directly to JPMCB by the Funds for custody and accounting services are included in Custodian and accounting fees on the Statements of Operations. Payments to the custodian may be reduced by credits earned by the Funds, based on uninvested cash balances held by the custodian. Such earnings credits, if any, are presented separately on the Statements of Operations.
59
Interest income earned on cash balances at the custodian, if any, is included in Interest income from affiliates on the Statements of Operations.
Interest expense paid to the custodian related to cash overdrafts, if any, is included in Interest expense to affiliates on the Statements of Operations.
F. Collateral Management Fees — JPMCB provides derivatives collateral management services for the Funds. The amounts paid directly to JPMCB by the Funds for these services are included in Collateral management fees on the Statements of Operations.
G. Waivers and Reimbursements — The Adviser, Administrator and/or JPMDS have contractually agreed to waive fees and/or reimburse the Funds to the extent that total annual operating expenses (excluding acquired fund fees and expenses other than certain money market fund fees as described below, dividend and interest expenses related to short sales, interest, taxes, expenses related to litigation and potential litigation, and extraordinary expenses) exceed the percentages of the Funds’ average daily net assets as shown in the table below:
| | | | | | | | | | | | | | | | | | | | |
| | | Class A | | Class C | | Class I | | Class R6 |
Flexible Long/Short Fund | | 1.15% | | 1.65% | | 0.90% | | | | 0.65 | % |
High Yield Opportunities Fund | | 1.00 | | 1.55 | | 0.80 | | | | 0.60 | |
The expense limitation agreements were in effect for the year ended February 28, 2018 and are in place until at least June 30, 2018.
For the year ended February 28, 2018, the Funds’ service providers waived fees and/or reimbursed expenses for the Funds as follows. None of these parties expect the Funds to repay any such waived fees and/or reimbursed expenses in future years.
| | | | | | | | | | | | | | | | | | | | | | | | | |
| | | Contractual Waivers | | |
| | | Investment
Advisory Fees | | Administration
Fees | | Service Fees | | Total | | Contractual
Reimbursements |
Flexible Long/Short Fund | | | | $131,798 | | | | | $21,470 | | | | | $487 | | | | | $153,755 | | | | | $112,883 | |
High Yield Opportunities Fund | | | | 161,406 | | | | | 21,911 | | | | | 13,923 | | | | | 197,240 | | | | | 89,189 | |
Additionally, the Funds may invest in one or more money market funds advised by the Adviser or its affiliates (affiliated money market funds). The Adviser, Administrator and/or JPMDS, as shareholder servicing agent, have contractually agreed to waive fees and/or reimburse expense in an amount sufficient to offset the respective net fees each collects from the affiliated money market funds on the Funds’ investment in such affiliated money market funds.
The amounts of waivers resulting from investments in these money market funds for the year ended February 28, 2018 were as follows:
| | | | |
Flexible Long/Short Fund | | $ | 1,650 | |
High Yield Opportunities Fund | | | 1,708 | |
H. Other — Certain officers of the Trust are affiliated with the Adviser, the Administrator and JPMDS. Such officers, with the exception of the Chief Compliance Officer, receive no compensation from the Funds for serving in their respective roles.
The Board appointed a Chief Compliance Officer to the Funds in accordance with Federal securities regulations. Each Fund, along with other affiliated funds, makes reimbursement payments, on a pro-rata basis, to the Administrator for a portion of the fees associated with the Office of the Chief Compliance Officer. Such fees are included in Trustees’ and Chief Compliance Officer’s fees on the Statements of Operations.
The Trust adopted a Trustee Deferred Compensation Plan (the “Plan”) which allows the Independent Trustees to defer the receipt of all or a portion of compensation related to performance of their duties as Trustees. The deferred fees are invested in various J.P. Morgan Funds until distribution in accordance with the Plan.
During the year ended February 28, 2018, the Funds purchased securities from an underwriting syndicate in which the principal underwriter or members of the syndicate were affiliated with the Adviser.
The Funds may use related party broker-dealers. For the year ended February 28, 2018, the Funds did not incur any brokerage commissions with broker-dealers affiliated with the Adviser.
The Securities and Exchange Commission (“SEC”) has granted an exemptive order permitting the Funds to engage in principal transactions with J.P. Morgan Securities, Inc., an affiliated broker, involving taxable money market instruments, subject to certain conditions.
4. Investment Transactions During the year ended February 28, 2018, purchases and sales of investments (excluding short-term investments) were as follows:
60
| | | | | | | | | | | | | | | | | | | | |
| | | Purchases
(excluding
U.S. Government) | | Sales (excluding
U.S. Government) | | Purchases
of U.S.
Government | | Sales of U.S.
Government |
Flexible Long/Short Fund | | | | $14,482,554 | | | | | $14,274,080 | | | | | $227,765 | | | | | $280,230 | |
High Yield Opportunities Fund | | | | 10,658,825 | | | | | 9.529,677 | | | | | — | | | | | — | |
5. Federal Income Tax Matters
For Federal income tax purposes, the estimated cost and unrealized appreciation (depreciation) in value of investments held at February 28, 2018 were as follows:
| | | | | | | | | | | | | | | | | | | | |
| | | Aggregate
Cost | | Gross
Unrealized
Appreciation | | Gross
Unrealized
Depreciation | | Net Unrealized
Appreciation
(Depreciation) |
Flexible Long/Short Fund | | | | $25,540,260 | | | | | $962,952 | | | | | $457,738 | | | | | $505,214 | |
High Yield Opportunities Fund | | | | 26,701,762 | | | | | 895,021 | | | | | 413,601 | | | | | 481,420 | |
The difference between book and tax basis appreciation (depreciation) on investments is primarily attributed to mark to market of forward foreign currency contracts, investments in perpetual bonds and investments in contingent payment debt instruments.
The tax character of distributions paid during the year ended February 28, 2018 was as follows:
| | | | | | | | | | | | | | | | | | | | |
| | | Ordinary Income* | | Net
Long-Term
Capital Gains | | Total
Distributions
Paid | | |
Flexible Long/Short Fund | | | | $746,873 | | | | $ | - | | | | | $746,873 | | | |
High Yield Opportunities Fund | | | | 1,581,157 | | | | | 106,636 | | | | | 1,687,793 | | | |
* Short-term gain distributions are treated as ordinary income for income tax purposes.
The tax character of distributions paid during the period ended February 28, 2017 was as follows:
| | | | | | | | | | | | | | | | | | | | |
| | | Ordinary
Income* | | Net
Long-Term
Capital Gains | | Total
Distributions
Paid | | |
Flexible Long/Short Fund | | | | $684,969 | | | | | $4,200 | | | | | $689,169 | | | |
High Yield Opportunities Fund | | | | 376,964 | | | | | - | | | | | 376,964 | | | |
* Short-term gain distributions are treated as ordinary income for income tax purposes.
As of February 28, 2018, the estimated components of net assets (excluding paid-in-capital) on a tax basis were as follows:
| | | | | | | | | | | | | | | |
| | | Current
Distributable
Ordinary
Income | | Current
Distributable
Long-Term
Capital Gain or
(Tax Basis
Loss Carryover) | | Unrealized
Appreciation
(Depreciation) |
Flexible Long/Short Fund | | | $ | - | | | | $ | (38,721 | ) | | | $ | 508,132 | |
High Yield Opportunities Fund | | | | 74,429 | | | | | (177,390 | ) | | | | 481,676 | |
The cumulative timing differences primarily consist of post-October capital loss deferrals, late year ordinary loss deferrals, mark to market of forward foreign currency contracts, investments in perpetual bonds and investments in contingent payment debt instruments.
61
As of February 28, 2018, the following Funds had net capital loss carryforwards:
| | | | | | | | | | | | | | | |
| | | Capital Loss Carryforward Character |
| | | Short-Term | | | | Long-Term |
Flexible Long/Short Fund | | | | $ 38,721 | | | | | | | | | | $ - | |
High Yield Opportunities Fund | | | | - | | | | | | | | | | 177,390 | |
Specified ordinary losses and net capital losses incurred after October 31 within the taxable year are deemed to arise on the first business day of the Funds’ next taxable year. For the year ended February 28, 2018, the Funds deferred to March 1, 2018 the following specified ordinary losses and net capital losses of:
| | | | | | | | | | | | | | | |
| | | Net capital loss | | |
| | | Short-Term | | Long-Term | | Specified
Loss |
Flexible Long/Short Fund | | | $ | - | | | | $ | - | | | | $ | 196,440 | |
High Yield Opportunities Fund | | | | 43,552 | | | | | 46,926 | | | | | - | |
6. Borrowings
The Funds rely upon an exemptive order granted by the SEC (the “Order”) permitting the establishment and operation of an Interfund Lending Facility (the “Facility”). The Facility allows the Funds to directly lend and borrow money to or from any other fund relying upon the Order at rates beneficial to both the borrowing and lending funds. Advances under the Facility are taken primarily for temporary or emergency purposes, including the meeting of redemption requests that otherwise might require the untimely disposition of securities, and are subject to each Fund’s borrowing restrictions. The Interfund loan rate is determined, as specified in the Order, by averaging the current repurchase agreement rate and the current bank loan rate. The Order was granted to JPMorgan Trust II and may be relied upon by the Funds because the Funds and the series of JPMorgan Trust II are all investment companies in the same “group of investment companies” (as defined in Section 12(d)(1)(G) of the 1940 Act).
The Trust and JPMCB has entered into a financing arrangement. Under this arrangement, JPMCB provides an unsecured, uncommitted credit facility in the aggregate amount of $100 million to certain of the J.P. Morgan Funds, including the Funds. Advances under the arrangement are taken primarily for temporary or emergency purposes, including the meeting of redemption requests that otherwise might require the untimely disposition of securities, and are subject to each Fund’s borrowing restrictions. Interest on borrowings is payable at a rate determined by JPMCB at the time of borrowing. This agreement has been extended until November 5, 2018.
The Funds had no borrowings outstanding from another fund or from the unsecured, uncommitted credit facility during the year ended February 28, 2018.
7. Risks, Concentrations and Indemnifications
In the normal course of business, the Funds entered into contracts that contain a variety of representations which provide general indemnifications. Each Fund’s maximum exposure under these arrangements is unknown. The amount of exposure would depend on future claims that may be made against each Fund that have not yet occurred. However, based on experience, the Funds expect the risk of loss to be remote.
As of February 28, 2018, all the Funds’ shares were held by the Adviser.
The Funds’ investments in sovereign and corporate debt obligations within emerging market countries may be subject to potentially higher risks than investments in more developed markets and the prices of such investments may be volatile. The yields of emerging market debt obligations reflect, among other things, perceived credit risk. The consequences of political, social or economic instability in these markets may have disruptive effects on the market prices of the Funds’ investments and the income they generate, as well as the Funds’ ability to repatriate such amounts.
The Funds are subject to interest rate and credit risk. The value of debt securities may decline as interest rates increase. The Funds could lose money if the issuer of a fixed income security is unable to pay interest or repay principal when it is due. The Funds invest in floating rate loans and other floating rate debt securities. Although these investments are generally less sensitive to interest rate changes than other fixed rate instruments, the value of floating rate loans and other floating rate investments may decline if their interest rates do not rise as quickly, or as much, as general interest rates. Many factors can cause interest rates to rise. Some examples include central bank monetary policy, rising inflation rates and general economic conditions. Given that the Federal Reserve has begun to raise interest rates, the Funds may face a heightened level of interest rate risk. The ability of the issuers of debt to meet their obligations may be affected by the economic and political developments in a specific industry or region.
The Funds invest in high yield securities that are not rated or rated below investment grade (commonly known as “junk bonds”). These securities are considered to be high risk investments. Investments in lower-rated securities or unrated securities of comparable quality tend to be more sensitive to economic conditions than higher rated securities. Junk bonds involve a greater risk of default by the issuer because such securities are generally unsecured and are often subordinated to other creditors’ claims. The market price of these securities can change suddenly and unexpectedly. As a result, the Funds are intended for investors who are able and willing to assume a high degree of risk.
62
Flexible Long/Short Fund and High Yield Opportunities Fund invest in interest bearing notes with preferred security characteristics. These securities may include provisions that permit the issuer, in its discretion, to defer or omit distributions for a certain period of time.
Investing in securities of foreign countries may include certain risks and considerations not typically associated with investing in U.S. securities. These risks include revaluation of currencies, high rates of inflation, repatriation restrictions on income and currencies, and future and adverse political, social and economic developments.
Derivatives may be riskier than other types of investments because they may be more sensitive to changes in economic and market conditions and could result in losses that significantly exceed the Funds’ original investment. Many derivatives create leverage thereby causing the Funds to be more volatile than they would have been if they had not used derivatives. Derivatives also expose the Funds to counterparty risk (the risk that the derivative counterparty will not fulfill its contractual obligations), including credit risk of the derivative counterparty.
The Funds are also subject to counterparty credit risk, which is the risk that a counterparty fails to perform on agreements with the Funds such as swap and option contracts and forward foreign currency exchange contracts.
8. Investment Company Reporting Modernization
In October 2016, the SEC adopted new rules and forms, and amendments to certain current rules and forms, to modernize the reporting and disclosure of information by registered investment companies. In part, the final rules amend Regulation S-X and require standardized, enhanced disclosures about derivatives in investment company financial statements, as well as other amendments. The amendments to Regulation S-X were applied to the Funds’ financial statements as of February 28, 2018. The adoption had no effect on the Funds’ net assets or results of operations.
9. New Accounting Pronouncement
In March 2017, the FASB issued ASU 2017-08 (“ASU 2017-08”) Premium Amortization on Purchased Callable Debt Securities, which shortens the premium amortization period for purchased non-contingently callable debt securities. ASU 2017-08 requires that the premium to be amortized to the earliest call date, for purchased non-contingently callable debt securities. ASU 2017-08 is effective for the fiscal years, and interim periods within those fiscal years, beginning after December 15, 2018. Management is currently evaluating the implications of these changes on the financial statements, if any.
63
REPORT OF INDEPENDENT REGISTERED PUBLIC ACCOUNTING FIRM
To the Board of Trustees of JPMorgan Trust IV and the Shareholders of JPMorgan Flexible Long/Short Fund and JPMorgan High Yield Opportunities Fund:
Opinions on the Financial Statements
We have audited the accompanying statements of assets and liabilities, including the schedules of portfolio investments, of JPMorgan Flexible Long/Short Fund and JPMorgan High Yield Opportunities Fund (two of the funds constituting JPMorgan Trust IV, hereafter collectively referred to as the “Funds”) as of February 28, 2018, the related statements of operations for the year ended February 28, 2018, the statements of changes in net assets and the financial highlights for each of the periods indicated in the table below, including the related notes, (collectively referred to as the “financial statements”). In our opinion, the financial statements present fairly, in all material respects, the financial position of each of the Funds as of February 28, 2018, the results of each of their operations for the year then ended and the changes in each of their net assets and each of the financial highlights for each of the periods indicated in the table below in conformity with accounting principles generally accepted in the United States of America.
| | |
| JPMorgan Flexible Long/Short Fund | | Statement of changes in net assets and the financial |
| | | highlights for the year ended February 28, 2018 and for the |
| | | period June 30, 2016 (commencement of operations) through |
| | | February 28, 2017 |
| JPMorgan High Yield Opportunities Fund | | Statement of changes in net assets and the financial |
| | | highlights for the year ended February 28, 2018 and for the |
| | | period November 1, 2016 (commencement of operations) |
| | | through February 28, 2017 |
Basis for Opinions
These financial statements are the responsibility of the Funds’ management. Our responsibility is to express an opinion on the Funds’ financial statements based on our audits. We are a public accounting firm registered with the Public Company Accounting Oversight Board (United States) (“PCAOB”) and are required to be independent with respect to the Funds in accordance with the U.S. federal securities laws and the applicable rules and regulations of the Securities and Exchange Commission and the PCAOB.
We conducted our audits of these financial statements in accordance with the standards of the PCAOB. Those standards require that we plan and perform the audit to obtain reasonable assurance about whether the financial statements are free of material misstatement, whether due to error or fraud.
Our audits included performing procedures to assess the risks of material misstatement of the financial statements, whether due to error or fraud, and performing procedures that respond to those risks. Such procedures included examining, on a test basis, evidence regarding the amounts and disclosures in the financial statements. Our audits also included evaluating the accounting principles used and significant estimates made by management, as well as evaluating the overall presentation of the financial statements. Our procedures included confirmation of securities owned as of February 28, 2018 by correspondence with the custodian, transfer agent, agent banks and brokers; when replies were not received we performed other auditing procedures. We believe that our audits provide a reasonable basis for our opinions.
/s/PricewaterhouseCoopers LLP
New York, New York
April 26, 2018
We have served as the auditor of one or more investment companies in the JPMorgan Funds complex since 1993.
64
TRUSTEES
(Unaudited)
The Funds’ Statement of Additional Information includes additional information about the Funds’ Trustees and is available, without charge, upon request by calling 1-800-480-4111 or on the J.P. Morgan Funds’ website at www.jpmorganfunds.com.
| | | | | | |
Name (Year of Birth); Positions With the Funds (1) | | Principal Occupation During Past 5 Years | | Number of
Funds in Fund
Complex Overseen
by Trustee (2) | | Other Directorships Held During the Past 5 Years |
Independent Trustees | | |
| | | |
| John F. Finn (1947); Trustee of Trust since 2005; Trustee of heritage One Group Mutual Funds since 1998. | | Chairman (1985-present), Chief Executive Officer, Gardner, Inc. (supply chain management company serving industrial and consumer markets) (1974-present). | | 138 | | Director, Greif, Inc. (GEF) (industrial package products and services) (2007-present); Trustee, Columbus Association for the Performing Arts (1988-present); Director, Cardinal Health, Inc. (CAH) (1994-2014). |
| | | |
| Dr. Matthew Goldstein (1941); Chairman since 2013; Trustee of Trust since 2005; Trustee of heritage J.P. Morgan Funds since 2003. | | Chancellor Emeritus, City University of New York (2015-present); Professor, City University of New York (2013-present); Chancellor, City University of New York (1999-2013); President, Adelphi University (New York) (1998-1999). | | 138 | | Trustee, Museum of Jewish Heritage (2011-present) Trustee, National Museum of Mathematics (present); Chair, Association of College and University Administrators (present). |
| | | |
| Dennis P. Harrington* (1950); Trustee of Trust since 2017. | | Retired; Partner, Deloitte LLP (1984-2012). | | 138 | | None |
| | | |
| Frankie D. Hughes (1952); Trustee of Trust since 2008. | | President, Ashland Hughes Properties (property management) (2014-present); President and Chief Investment Officer, Hughes Capital Management, Inc. (fixed income asset management) (1993-2014). | | 138 | | None |
| | | |
Raymond Kanner** (1953); Trustee of Trust since 2017. | | Retired; Managing Director & Chief Investment Officer, IBM Retirement Funds (2007-2016). | | 138 | | Director, Emerging Markets Growth Fund (1997-2016); Acting Executive Director, Committee on Investment of Employee Benefit Assets (CIEBA), 2016-17; Advisory Board Member, Betterment for Business (2016-present) (robo advisor); Advisory Board Member, Blue Star Indexes (2013-present) (index creator); Member, Russell Index Client Advisory Board (2001-2015). |
| | | |
| Peter C. Marshall (1942); Trustee of Trust since 2005; Trustee of heritage One Group Mutual Funds since 1985. | | Self-employed business consultant
(2002-present). | | 138 | | None |
| | | |
| Mary E. Martinez (1960); Trustee of Trust since 2013. | | Associate, Special Properties, a Christie’s International Real Estate Affiliate (2010-present); Managing Director, Bank of America (Asset Management) (2007-2008); Chief Operating Officer, U.S. Trust Asset Management, U.S. Trust Company (asset management) (2003-2007); President, Excelsior Funds (registered investment companies) (2004-2005). | | 138 | | None |
| | | |
| Marilyn McCoy*** (1948); Trustee of Trust since 2005; Trustee of heritage One Group Mutual Funds since 1999. | | Vice President of Administration and Planning, Northwestern University (1985-present). | | 138 | | None |
65
| | | | | | |
Name (Year of Birth); Positions With the Funds (1) | | Principal Occupation During Past 5 Years | | Number of
Funds in Fund
Complex Overseen
by Trustee (2) | | Other Directorships Held During the Past 5 Years |
Independent Trustees (continued) | | |
| | | |
| Mitchell M. Merin (1953); Trustee of Trust since 2013. | | Retired; President and Chief Operating Officer, Morgan Stanley Investment Management, Member Morgan Stanley & Co. Management Committee (registered investment adviser) (1985-2005). | | 138 | | Director, Sun Life Financial (SLF) (2007-2013) (financial services and insurance). |
| | | |
| Dr. Robert A. Oden, Jr. (1946); Trustee of Trust since 2005; Trustee of heritage One Group Mutual Funds since 1997. | | Retired; President, Carleton College
(2002-2010); President, Kenyon College
(1995-2002). | | 138 | | Chairman, Dartmouth-Hitchcock Medical Center (2011-present); Trustee, American Schools of Oriental Research (2011-present); Trustee, American University in Cairo (1999-2014); Trustee, American Museum of Fly Fishing (2013-present). |
| | | |
| Marian U. Pardo**** (1946); Trustee of Trust since 2013. | | Managing Director and Founder, Virtual Capital Management LLC (Investment Consulting) (2007-present); Managing Director, Credit Suisse Asset Management (portfolio manager) (2003-2006). | | 138 | | Member, Board of Governors, Columbus Citizens Foundation (not-for-profit supporting philanthropic and cultural programs) (2006-present). |
| | | |
| James J. Schonbachler (1943); Trustee of Trust since 2005; Trustee of heritage J.P. Morgan Funds since 2001. | | Retired; Managing Director of Bankers Trust Company (financial services) (1968-1998). | | 138 | | None |
| (1) | The Trustees serve for an indefinite term, subject to the Trust’s current retirement policy, which is age 78 for all Trustees. |
| (2) | A Fund Complex means two or more registered investment companies that hold themselves out to investors as related companies for purposes of investment and investor services or have a common investment adviser or have an investment adviser that is an affiliated person of the investment adviser of any of the other registered investment companies. The J.P. Morgan Funds Complex for which the Board of Trustees serves currently includes eleven registered investment companies (138 funds). |
| * | Two family members of Mr. Harrington are partner and managing director, respectively, of the Funds’ independent registered public accounting firm. Such firm has represented to the Board that those family members are not involved in the audit of the Funds’ financial statements and do not provide other services to the Funds. The Board has concluded that such association does not interfere with Mr. Harrington’s exercise of independent judgment as an Independent Trustee. |
| ** | A family member of Mr. Kanner is employed by JPMorgan Chase Bank, which is affiliated with JPMIM and JPMDS. In that capacity, this employee provides services to various JPMorgan affiliates including JPMIM and JPMDS and for which JPMIM and JPMDS bear some portion of the expense thereof. |
| *** | Two members of the Board of Trustees of Northwestern University are executive officers of registered investment advisers (not affiliated with JPMorgan) that are under common control with sub-advisers to certain J.P. Morgan Funds. |
| **** | In connection with prior employment with JPMorgan Chase, Ms. Pardo was the recipient of non-qualified pension plan payments from JPMorgan Chase in the amount of approximately $2,055 per month, which she irrevocably waived effective January 1, 2013, and deferred compensation payments from JPMorgan Chase in the amount of approximately $7,294 per year, which ended in January 2013. In addition, Ms. Pardo receives payments from a fully-funded qualified plan, which is not an obligation of JPMorgan Chase. |
The contact address for each of the Trustees is 270 Park Avenue, New York, NY 10017.
66
OFFICERS
(Unaudited)
| | |
Name (Year of Birth), Positions Held with the Trust (Since) | | Principal Occupations During Past 5 Years |
| |
Brian S. Shlissel (1964),
President and Principal Executive Officer (2016) | | Managing Director and Chief Administrative Officer for J.P. Morgan pooled vehicles, J.P. Morgan Investment Management Inc. (formerly JPMorgan Funds Management, Inc.) (2014 – present); Managing Director and Head of Mutual Fund Services, Allianz Global Investors; President and Chief Executive Officer, Allianz Global Investors Mutual Funds and PIMCO Closed-End Funds (1999-2014). |
| |
Timothy J. Clemens (1975), Treasurer and Principal Financial Officer (2018)* | | Executive Director, J.P. Morgan Investment Management Inc. (formerly JPMorgan Funds Management, Inc.) since February 2016; Vice President, JPMorgan Funds Management, Inc. from October 2013 to January 2016; Chief Financial Officer and Head of Valuation, Aberdeen Asset Management PLC (previously Artio Global Management (2009 to September 2013)). |
| |
Frank J. Nasta (1964),
Secretary (2008) | | Managing Director and Associate General Counsel, JPMorgan Chase since 2008. |
| |
Stephen M. Ungerman (1953),
Chief Compliance Officer (2005) | | Managing Director, JPMorgan Chase & Co.; Mr. Ungerman has been with JPMorgan Chase & Co. since 2000. |
| |
Elizabeth A. Davin (1964), Assistant Secretary (2005)** | | Executive Director and Assistant General Counsel, JPMorgan Chase since February 2012; formerly Vice President and Assistant General Counsel, JPMorgan Chase from 2005 to February 2012; Senior Counsel, JPMorgan Chase (formerly Bank One Corporation) from 2004 to 2005. |
| |
Jessica K. Ditullio (1962),
Assistant Secretary (2005)** | | Executive Director and Assistant General Counsel, JPMorgan Chase. Ms. Ditullio has been with JPMorgan Chase (formerly Bank One Corporation) since 1990. |
| |
John T. Fitzgerald (1975),
Assistant Secretary (2008) | | Executive Director and Assistant General Counsel, JPMorgan Chase. Mr. Fitzgerald has been with JPMorgan Chase since 2005. |
| |
Carmine Lekstutis (1980),
Assistant Secretary (2011) | | Executive Director and Assistant General Counsel, JPMorgan Chase since February 2015; formerly Vice President and Assistant General Counsel, JPMorgan Chase from 2011 to February 2015. |
| |
Gregory S. Samuels (1980),
Assistant Secretary (2010) | | Executive Director and Assistant General Counsel, JPMorgan Chase since 2014; formerly Vice President and Assistant General Counsel, JPMorgan Chase since 2010. |
| |
Pamela L. Woodley (1971),
Assistant Secretary (2012) | | Vice President and Assistant General Counsel, JPMorgan Chase since November 2004. |
| |
Zachary E. Vonnegut-Gabovitch (1986), Assistant Secretary (2017) | | Vice President and Assistant General Counsel, JPMorgan Chase since September 2016; Associate, Morgan, Lewis & Bockius (law firm) from 2012 to 2016. |
| |
Michael M. D’Ambrosio (1969),
Assistant Treasurer (2012) | | Managing Director, J.P. Morgan Investment Management Inc. (formerly JPMorgan Funds Management, Inc.) since May 2014; formerly Executive Director, JPMorgan Funds Management, Inc. from 2012 to May 2014. |
| |
Jeffrey D. House (1972), Assistant Treasurer (2017)** | | Vice President, J.P. Morgan Investment Management Inc. (formerly JPMorgan Funds Management, Inc.) since July 2006. |
| |
Lauren A. Paino (1973), Assistant Treasurer (2014)* | | Executive Director, J.P. Morgan Investment Management Inc. (formerly JPMorgan Funds Management, Inc.) since August 2013; formerly Director, Credit Suisse Asset Management from 2000-2013. |
| |
Joseph Parascondola (1963),
Assistant Treasurer (2011)* | | Vice President, J.P. Morgan Investment Management Inc. (formerly JPMorgan Funds Management, Inc.) since August 2006. |
| |
Matthew J. Plastina (1970), Assistant Treasurer (2011-2017)* | | Executive Director, J.P. Morgan Investment Management Inc. (formerly JPMorgan Funds Management, Inc.) since February 2016; Vice President, JPMorgan Funds Management, Inc. from 2010 to January 2016. |
| |
Gillian I. Sands (1969),
Assistant Treasurer (2012)* | | Vice President, J.P. Morgan Investment Management Inc. (formerly JPMorgan Funds Management, Inc.) since September 2012. |
The contact address for each of the officers, unless otherwise noted, is 270 Park Avenue, New York, NY 10017.
| * | The contact address for the officer is 4 New York Plaza, New York, NY 10004. |
| ** | The contact address for the officer is 1111 Polaris Parkway, Columbus, OH 43240. |
67
As a shareholder of the Funds, you incur two types of costs: (1) transaction costs, including sales charges (loads) on purchase payments and (2) ongoing costs, including investment advisory fees, administration fees, distribution fees and other Fund expenses. The examples below are intended to help you understand your ongoing costs (in dollars) of investing in the Fund and to compare these ongoing costs with the ongoing costs of investing in other mutual funds. The examples assume that you had a $1,000 investment in each Class at the beginning of the reporting period, September 1, 2017, and continued to hold your shares at the end of the reporting period, February 28, 2018.
Actual Expenses
For each Class of each Fund in the table below, the first line provides information about actual account values and actual expenses. You may use the information in this line, together with the amount you invested, to estimate the expenses that you paid over the period. Simply divide your account value by $1,000 (for example, an $8,600 account value divided by $1,000 = 8.6), then multiply the result by the number in the first line of each Class under the heading entitled “Expenses Paid During the Period” to estimate the expenses you paid on your account during this period.
Hypothetical Example for Comparison Purposes
The second line of each Class in the table below provides information about hypothetical account values and hypothetical expenses based on the Class’ actual expense ratio and an assumed rate of return of 5% per year before expenses, which is not the Class’ actual return. The hypothetical account values and expenses may not be used to estimate the actual ending account balance or expenses you paid for the period. You may use this information to compare the ongoing costs of investing in the Class of the Fund and other funds. To do so, compare this 5% hypothetical example with the 5% hypothetical examples that appear in the shareholder reports of the other funds. Please note that the expenses shown in the table are meant to highlight your ongoing costs only and do not reflect any transaction costs, such as sales charges (loads) or redemption fees. Therefore, the second line for each Class in the table is useful in comparing ongoing costs only, and will not help you determine the relative total costs of owning different funds. In addition, if these transaction costs were included, your costs would have been higher. The examples also assume all dividends and distributions have been reinvested.
| | | | | | | | | | | | | | | | |
| | | Beginning
Account Value
September 1, 2017 | | | Ending
Account Value
February 28, 2018 | | | Expenses
Paid During the
Period* | | | Annualized
Expense
Ratio | |
Flexible Long/Short Fund | | | | | | | | | | | | | | | | |
Class A | | | | | | | | | | | | | | | | |
Actual | | | $1,000.00 | | | | $1,010.20 | | | | $5.73 | | | | 1.14 | % |
Hypothetical | | | 1,000.00 | | | | 1,019.09 | | | | 5.76 | | | | 1.15 | |
Class C | | | | | | | | | | | | | | | | |
Actual | | | 1,000.00 | | | | 1,007.60 | | | | 8.16 | | | | 1.64 | |
Hypothetical | | | 1,000.00 | | | | 1,016.66 | | | | 8.20 | | | | 1.64 | |
Class I (formerly Select Class) | | | | | | | | | | | | | | | | |
Actual | | | 1,000.00 | | | | 1,011.10 | | | | 4.49 | | | | 0.89 | |
Hypothetical | | | 1,000.00 | | | | 1,020.33 | | | | 4.51 | | | | 0.90 | |
Class R6 | | | | | | | | | | | | | | | | |
Actual | | | 1,000.00 | | | | 1,012.20 | | | | 3.19 | | | | 0.64 | |
Hypothetical | | | 1,000.00 | | | | 1,021.62 | | | | 3.21 | | | | 0.64 | |
68
| | | | | | | | | | | | | | | | |
| | | Beginning
Account Value
September 1, 2017 | | | Ending
Account Value
February 28, 2018 | | | Expenses
Paid During the
Period* | | | Annualized
Expense
Ratio | |
High Yield Opportunities Fund | | | | | | | | | | | | | | | | |
Class A | | | | | | | | | | | | | | | | |
Actual | | | $1,000.00 | | | | $1,014.30 | | | | $4.94 | | | | 0.99 | % |
Hypothetical | | | 1,000.00 | | | | 1,019.89 | | | | 4.96 | | | | 0.99 | |
Class C | | | | | | | | | | | | | | | | |
Actual | | | 1,000.00 | | | | 1,011.50 | | | | 7.73 | | | | 1.55 | |
Hypothetical | | | 1,000.00 | | | | 1,017.11 | | | | 7.75 | | | | 1.55 | |
Class I (formerly Select Class) | | | | | | | | | | | | | | | | |
Actual | | | 1,000.00 | | | | 1,015.30 | | | | 4.00 | | | | 0.79 | |
Hypothetical | | | 1,000.00 | | | | 1,020.83 | | | | 4.01 | | | | 0.80 | |
Class R6 | | | | | | | | | | | | | | | | |
Actual | | | 1,000.00 | | | | 1,016.30 | | | | 3.00 | | | | 0.59 | |
Hypothetical | | | 1,000.00 | | | | 1,021.82 | | | | 3.01 | | | | 0.60 | |
| * | Expenses are equal to each Class’ respective annualized expense ratio, multiplied by the average account value over the period, multiplied by 181/365 (to reflect the one-half year period). |
69
Tax Letter
(Unaudited)
Certain tax information for the J.P. Morgan Funds is required to be provided to shareholders based upon the Funds’ income and distributions for the taxable year ended February 28, 2018. The information and distributions reported in this letter may differ from the information and taxable distributions reported to the shareholders for the calendar year ending December 31, 2018. The information necessary to complete your income tax returns for the calendar year ending December 31, 2018 will be provided under separate cover.
Long-Term Capital Gain
The Fund listed below distributed the following amount, or maximum allowable amount, of long-term capital gain dividends for the fiscal year ended February 28, 2018:
| | | | |
| | | Long-Term | |
| | | Capital | |
| | | Gain | |
| | | Distribution | |
High Yield Opportunities Fund | | $ | 106,636 | |
70

Rev. January 2011
| | |
| FACTS | | WHAT DOES J.P. MORGAN FUNDS DO WITH YOUR PERSONAL INFORMATION? |
| | |
Why? | | Financial companies choose how they share your personal information. Federal law gives consumers the right to limit some but not all sharing. Federal law also requires us to tell you how we collect, share, and protect your personal information. Please read this notice carefully to understand what we do. |
| | |
What? | | The types of personal information we collect and share depend on the product or service you have with us. This information can include: ◾ Social Security number and account balances ◾ transaction history and account transactions ◾ checking account information and wire transfer instructions When you are no longer our customer, we continue to share your information as described in this notice. |
| | |
How? | | All financial companies need to share customers’ personal information to run their everyday business. In the section below, we list the reasons financial companies can share their customers’ personal information; the reasons J.P. Morgan Funds chooses to share; and whether you can limit this sharing. |
| | | | |
Reasons we can share your personal
information | | Does J.P. Morgan
Funds share? | | Can you limit this
sharing? |
For our everyday business purposes — such as to process your transactions, maintain your account(s), respond to court orders and legal investigations, or report to credit bureaus | | Yes | | No |
For marketing purposes — to offer our products and services to you | | Yes | | No |
For joint marketing with other financial companies | | No | | We don’t share |
For our affiliates’ everyday business purposes — information about your transactions and experiences | | No | | We don’t share |
For our affiliates’ everyday business purposes — information about your creditworthiness | | No | | We don’t share |
For nonaffiliates to market to you | | No | | We don’t share |
| | |
Questions? | | Call 1-800-480-4111 or go to www.jpmorganfunds.com |

| | |
| Who we are |
Who is providing this notice? | | J.P. Morgan Funds |
| | |
| What we do |
How does J.P. Morgan Funds protect my personal information? | | To protect your personal information from unauthorized access and use, we use security measures that comply with federal law. These measures include computer safeguards and secured files and buildings. We authorize our employees to access your information only when they need it to do their work and we require companies that work for us to protect your information. |
How does J.P. Morgan Funds collect my personal information? | | We collect your personal information, for example, when you: ◾ open an account or provide contact information ◾ give us your account information or pay us by check ◾ make a wire transfer We also collect your personal information from others, such as credit bureaus, affiliates and other companies. |
Why can’t I limit all sharing? | | Federal law gives you the right to limit only ◾ sharing for affiliates’ everyday business purposes – information about your creditworthiness ◾ affiliates from using your information to market to you ◾ sharing for nonaffiliates to market to you State laws and individual companies may give you additional rights to limit sharing. |
| | |
| Definitions |
Affiliates | | Companies related by common ownership or control. They can be financial and nonfinancial companies. ◾ J.P. Morgan Funds does not share with our affiliates. |
Nonaffiliates | | Companies not related by common ownership or control. They can be financial and nonfinancial companies. ◾ J.P. Morgan Funds does not share with nonaffiliates so they can market to you. |
Joint Marketing | | A formal agreement between nonaffiliated financial companies that together market financial products or services to you. ◾ J.P. Morgan Funds doesn’t jointly market. |
J.P. Morgan Funds are distributed by JPMorgan Distribution Services, Inc., which is an affiliate of JPMorgan Chase & Co. Affiliates of JPMorgan Chase & Co. receive fees for providing various services to the funds.
Contact JPMorgan Distribution Services, Inc. at 1-800-480-4111 for a fund prospectus. Investors should carefully consider the investment objectives and risk as well as charges and expenses of the mutual fund before investing. The prospectus contains this and other information about the mutual fund. Read the prospectus carefully before investing.
Investors may obtain information about the Securities Investor Protection Corporation (SIPC), including the SIPC brochure by visiting www.sipc.org or by calling SIPC at 202-371-8300.
Each Fund files a complete schedule of its fund holdings for the first and third quarters of its fiscal year with the SEC on Form N-Q. The Funds’ Forms N-Q are available on the SEC’s website at http://www.sec.gov and may be reviewed and copied at the SEC’s Public Reference Room in Washington, DC. Information on the operation of the SEC’s Public Reference Room may be obtained by calling 1-800-SEC-0330. Shareholders may request the Form N-Q without charge by calling 1-800-480-4111.
A description of each Fund’s policies and procedures with respect to the disclosure of each Fund’s holdings is available in the prospectus and Statement of Additional Information.
A copy of proxy policies and procedures is available without charge upon request by calling 1-800-480-4111. A description of such policies and procedures is on the SEC’s website at www.sec.gov. The Trustees have delegated the authority to vote proxies for securities owned by the Funds to the Adviser. A copy of the Funds’ voting record for the most recent 12-month period ended June 30 is available on the SEC’s website at www.sec.gov no later than August 31 of each year. The Funds’ proxy voting record will include, among other things, a brief description of the matter voted on for each fund security, and will state how each vote was cast, for example, for or against the proposal.
| | |
| © JPMorgan Chase & Co., 2018. All rights reserved. February 2018. | |  |
ITEM 2. CODE OF ETHICS.
Disclose whether, as of the end of the period covered by the report, the registrant has adopted a code of ethics that applies to the registrant’s principal executive officer, principal financial officer, principal accounting officer or controller, or persons performing similar functions, regardless of whether these individuals are employed by the registrant or a third party. If the registrant has not adopted such a code of ethics, explain why it has not done so.
The registrant must briefly describe the nature of any amendment, during the period covered by the report, to a provision of its code of ethics that applies to the registrant’s principal executive officer, principal financial officer, principal accounting officer or controller, or persons performing similar functions, regardless of whether these individuals are employed by the registrant or a third party, and that relates to any element of the code of ethics definition enumerated in paragraph (b) of this Item. The registrant must file a copy of any such amendment as an exhibit pursuant to Item 13(a)(1), unless the registrant has elected to satisfy paragraph (f) of this Item by positing its code of ethics on its website pursuant to paragraph (f)(2) of this Item, or by undertaking to provide its code of ethics to any person without charge, upon request, pursuant to paragraph (f)(3) of this Item.
If the registrant has, during the period covered by the report, granted a waiver, including an implicit waiver, from a provision of the code of ethics that applies to the registrant’s principal executive officer, principal financial officer, principal accounting officer or controller, or persons performing similar functions, regardless of whether these individuals are employed by the registrant or third party, that relates to one or more items set forth in paragraph (b) of this Item, the registrant must briefly describe the nature of the waiver, the name of the person to whom the waiver was granted, and the date of the waiver.
The Registrant has adopted a code of ethics that applies to the Registrant’s principal executive officer and principal financial officer. There were no amendments to the code of ethics or waivers granted with respect to the code of ethics in the period covered by the report.
ITEM 3. AUDIT COMMITTEE FINANCIAL EXPERT.
(a) (1) Disclose that the registrant’s board of directors has determined that the registrant either:
(i) Has at least one audit committee financial expert serving on its audit committee; or
(ii) Does not have an audit committee financial expert serving on its audit committee.
The Registrant’s Board of Trustees has determined that the Registrant has at least one audit committee financial expert serving on its audit committee. The Securities and Exchange Commission has stated that the designation or identification of a person as an audit committee financial expert pursuant to this Item 3 of Form N-CSR does not impose on such person any duties, obligations or liabilities that are greater than the duties, obligations and liabilities imposed on such person as a member of the Audit Committee and the Board of Trustees in the absence of such designation or identification.
(2) If the registrant provides the disclosure required by paragraph (a)(1)(i) of this Item, it must disclose the name of the audit committee financial expert and whether that person is “independent.” In order to be considered “independent” for purposes of this Item, a member of an audit committee may not, other than in his or her capacity as a member of the audit committee, the board of directors, or any other board committee:
(i) Accept directly or indirectly any consulting, advisory, or other compensatory fee from the issuer; or
(ii) Be an “interested person” of the investment company as defined in Section 2(a)(19) of the Act (15 U.S.C. 80a-2(a)(19)).
Effective October 31, 2017, Dennis P. Harrington replaced James Schonbachler as the audit committee financial expert. He is not an “interested person” of the Registrant and is also “independent” as defined by the U.S. Securities and Exchange Commission for purposes of audit committee financial expert determinations.
(3) If the registrant provides the disclosure required by paragraph (a)(1)(ii) of this Item, it must explain why it does not have an audit committee financial expert.
Not applicable.
ITEM 4. PRINCIPAL ACCOUNTANT FEES AND SERVICES.
(a) Disclose, under the caption Audit Fees, the aggregate fees billed for each of the last two fiscal years for professional services rendered by the principal accountant for the audit of the registrant’s annual financial statements or services that are normally provided by the accountant in connection with statutory and regulatory filings or engagements for those fiscal years.
AUDIT FEES
2018 – $267,837
2017 – $224,600
(b) Disclose, under the caption Audit-Related Fees, the aggregate fees billed in each of the last two fiscal years for assurance and related services by the principal accountant that are reasonably related to the performance of the audit of the registrant’s financial statements and are not reported under paragraph (a) of this Item. Registrants shall describe the nature of the services comprising the fees disclosed under this category.
AUDIT-RELATED FEES
2018 – $30,280
2017 – $22,263
Audit-related fees consists of semi-annual financial statement reviews and security count procedures performed as required under Rule 17f-2 of the Investment Company Act of 1940 during the Registrant’s fiscal year.
(c) Disclose, under the caption Tax Fees, the aggregate fees billed in each of the last two fiscal years for professional services rendered by the principal accountant for tax compliance, tax advice, and tax planning. Registrants shall describe the nature of the services comprising the fees disclosed under this category.
TAX FEES
2018 – $ 51,604
2017 – $39,405
The tax fees consist of fees billed in connection with preparing the federal regulated investment company income tax returns for the Registrant for the tax years ended February 28, 2018 and 2017, respectively.
For the last fiscal year, no tax fees were required to be approved pursuant to paragraph (c)(7)(ii) of Rule 2-01 of Regulation S-X.
(d) Disclose, under the caption All Other Fees, the aggregate fees billed in each of the last two fiscal years for products and services provided by the principal accountant, other than the services reported in paragraphs (a) through (c) of this Item. Registrants shall describe the nature of the services comprising the fees disclosed under this category.
ALL OTHER FEES
2018 – Not applicable
2017 – Not applicable
(e) (1) Disclose the audit committee’s pre-approval policies and procedures described in paragraph (c)(7) of Rule 2-01 of Regulation S-X.
Pursuant to the Registrant’s Audit Committee Charter and written policies and procedures for the pre-approval of audit and non-audit services (the “Pre-approval Policy”), the Audit Committee pre-approves all audit and non-audit services performed by the Registrant’s independent public registered accounting firm for the Registrant. In addition, the Audit Committee pre-approves the auditor’s engagement for non-audit services with the Registrant’s investment adviser (not including a sub-adviser whose role is primarily portfolio management and is sub-contracted or overseen by another investment adviser) and any Service Affiliate in accordance with paragraph (c)(7)(ii) of Rule 2-01 of Regulation S-X, if the engagement relates directly to the operations and financial reporting of the Registrant. Proposed services may be pre-approved either 1) without consideration of specific case-by-case services or 2) require the specific pre-approval of the Audit Committee. Therefore, initially the Pre-approval Policy listed a number of audit and non-audit services that have been approved by the Audit Committee, or which were not subject to pre-approval under the transition provisions of Sarbanes-Oxley Act of 2002 (the
“Pre-approval List”). The Audit Committee annually reviews and pre-approves the services included on the Pre-approval List that may be provided by the independent public registered accounting firm without obtaining additional specific pre-approval of individual services from the Audit Committee. The Audit Committee adds to, or subtracts from, the list of general pre-approved services from time to time, based on subsequent determinations. All other audit and non-audit services not on the Pre-approval List must be specifically pre-approved by the Audit Committee.
One or more members of the Audit Committee may be appointed as the Committee’s delegate for the purposes of considering whether to approve such services. Any pre-approvals granted by the delegate will be reported, for informational purposes only, to the Audit Committee at its next scheduled meeting. The Audit Committee’s responsibilities to pre-approve services performed by the independent public registered accounting firm are not delegated to management.
(2) Disclose the percentage of services described in each of paragraphs (b) through (d) of this Item that were approved by the audit committee pursuant to paragraph (c)(7)(i)(C) of Rule 2-01 of Regulation S-X.
2018 – 0.0%
2017 – 0.0%
(f) If greater than 50 percent, disclose the percentage of hours expended on the principal accountant’s engagement to audit the registrant’s financial statements for the most recent fiscal year that were attributed to work performed by persons other than the principal accountant’s full-time, permanent employees.
Not applicable - Less than 50%.
(g) Disclose the aggregate non-audit fees billed by the registrant’s accountant for services rendered to the registrant, and rendered to the registrant’s investment adviser (not including any sub-adviser whose role is primarily portfolio management and is subcontracted with or overseen by another investment adviser), and any entity controlling, controlled by, or under common control with the adviser that provides ongoing services to the registrant for each of the last two fiscal years of the registrant.
The aggregate non-audit fees billed by the independent registered public accounting firm for services rendered to the Registrant, and rendered to Service Affiliates, for the last two calendar year ends were:
2017 - $32.1 million
2016 - $28.4 million
(h) Disclose whether the registrant’s audit committee of the board of directors has considered whether the provision of non-audit services that were rendered to the registrant’s investment adviser (not including any subadviser whose role is primarily portfolio management and is subcontracted with or overseen by another investment adviser), and any entity controlling, controlled by, or under common control with the investment adviser that provides ongoing services to the registrant that were not pre-approved pursuant to paragraph (c)(7)(ii) of Rule 2-01 of Regulation S-X is compatible with maintaining the principal accountant’s independence.
The Registrant’s Audit Committee has considered whether the provision of the non-audit services that were rendered to Service Affiliates that were not pre-approved (not requiring pre-approval) is compatible with maintaining the independent public registered accounting firm’s independence. All services provided by the independent public registered accounting firm to the Registrant or to Service Affiliates that were required to be pre-approved were pre-approved as required.
ITEM 5. AUDIT COMMITTEE OF LISTED REGISTRANTS.
(a) If the registrant is a listed issuer as defined in Rule 10A-3 under the Exchange Act (17CFR 240.10A-3), state whether or not the registrant has a separately-designated standing audit committee established in accordance with Section 3(a)(58)(A) of the Exchange Act (15 U.S.C. 78c(a)(58)(A)). If the registrant has such a committee, however designated, identify each committee member. If the entire board of directors is acting as the registrant’s audit committee as specified in Section 3(a)(58)(B) of the Exchange Act
(15 U.S.C. 78c(a)(58)(B)), so state.
(b) If applicable, provide the disclosure required by Rule 10A-3(d) under the Exchange Act (17CFR 240.10A-3(d)) regarding an exemption from the listing standards for all audit committees.
Not applicable.
ITEM 6. INVESTMENTS.
File Schedule I – Investments in securities of unaffiliated issuers as of the close of the reporting period as set forth in Section 210.12-12 of Regulation S-X, unless the schedule is included as part of the report to shareholders filed under Item 1 of this Form.
Included in Item 1.
ITEM 7. DISCLOSURE OF PROXY VOTING POLICIES AND PROCEDURES FOR CLOSED-END MANAGEMENT INVESTMENT COMPANIES.
Not applicable.
ITEM 8. PORTFOLIO MANAGERS OF CLOSED-END MANAGEMENT INVESTMENT COMPANIES.
Not applicable.
ITEM 9. PURCHASE OF EQUITY SECURITIES BY CLOSED-END MANAGEMENT INVESTMENT COMPANY AND AFFILIATED PURCHASERS.
Not applicable.
ITEM 10. SUBMISSION OF MATTERS TO A VOTE OF SECURITY HOLDERS.
Describe any material changes to the procedures by which shareholders may recommend nominees to the registrant’s board of directors, where those changes were implemented after the registrant last provided disclosure in response to the requirements of
Item 7(d)(2)(ii)(G) of Schedule 14A (17 CFR 240.14a-101), or this Item.
No material changes to report.
ITEM 11. CONTROLS AND PROCEDURES.
(a) Disclose the conclusions of the registrant’s principal executive and principal financial officers, or persons performing similar functions, regarding the effectiveness of the registrant’s disclosure controls and procedures (as defined in Rule 30a-3(c) under the Act (17 CFR 270.30a-3(c))) as of a date within 90 days of the filing date of the report that includes the disclosure required by this paragraph, based on the evaluation of these controls and procedures required by Rule 30a-3(b) under the Act (17 CFR 270.30a-3(b)) and Rules 13a-15(b) or 15d-15(b) under the Exchange Act (17 CFR 240.13a-15(b) or 240.15d-15(b)).
The Registrant’s principal executive and principal financial officers have concluded, based on their evaluation of the Registrant’s disclosure controls and procedures as of a date within 90 days of the filing date of this report, that the Registrant’s disclosure controls and procedures are reasonably designed to ensure that information required to be disclosed by the Registrant on Form N-CSR is recorded, processed, summarized and reported within the required time periods and that information required to be disclosed by the Registrant in the reports that it files or submits on Form N-CSR is accumulated and communicated to the Registrant’s management, including its principal executive and principal financial officers, as appropriate to allow timely decisions regarding required disclosure.
(b) Disclose any change in the registrant’s internal control over financial reporting (as defined in Rule 30a-3(d) under the
Act (17 CFR 270.30a-3(d)) that occurred during the registrant’s second fiscal quarter of the period covered by this report that has materially affected, or is reasonably likely to materially affect, the registrant’s internal control over financial reporting.
There were no changes in the Registrant’s internal control over financial reporting that occurred during the last fiscal quarter covered by this report that have materially affected, or are reasonably likely to materially affect, the Registrant’s internal control over financial reporting.
ITEM 12. DISCLOSURE OF SECURITIES LENDING ACTIVITIES FOR CLOSED-END MANAGEMENT INVESTMENT COMPANIES.
Not applicable.
ITEM 13. EXHIBITS.
| | (a) | File the exhibits listed below as part of this Form. Letter or number the exhibits in the sequence indicated. |
(1) Any code of ethics, or amendment thereto, that is the subject of the disclosure required by Item 2, to the extent that the registrant intends to satisfy the Item 2 requirements through filing of an exhibit.
Code of Ethics applicable to its Principal Executive and Principal Financial Officers pursuant to Section 406 of the Sarbanes-Oxley Act of 2002 attached hereto.
(2) A separate certification for each principal executive officer and principal financial officer of the registrant as required by Rule 30a-2(a) under the Act (17 CFR 270.30a-2).
Certifications pursuant to Rule 30a-2(a) under the Investment Company Act of 1940 are attached hereto.
(3) Any written solicitation to purchase securities under Rule 23c-1 under the Act (17 CFR 270.23c-1) sent or given during the period covered by the report by or on behalf of the registrant to 10 or more persons.
Not applicable.
| | (b) | A separate or combined certification for each principal executive officer and principal officer of the registrant as required by Rule 30a-2(b) under the Act of 1940. |
Certifications pursuant to Rule 30a-2(b) under the Investment Company Act of 1940 are attached hereto.
SIGNATURES
Pursuant to the requirements of the Securities Exchange Act of 1934 and the Investment Company Act of 1940, the registrant has duly caused this report to be signed on its behalf by the undersigned, thereunto duly authorized.
JPMorgan Trust IV
| | |
| By: | | /s/ Brian S. Shlissel |
| | Brian S. Shlissel |
| | President and Principal Executive Officer |
| | May 2, 2018 |
Pursuant to the requirements of the Securities Exchange Act of 1934 and the Investment Company Act of 1940, this report has been signed below by the following persons on behalf of the registrant and in the capacities and on the dates indicated.
| | |
| By: | | /s/ Brian S. Shlissel |
| | Brian S. Shlissel |
| | President and Principal Executive Officer |
| | May 2, 2018 |
| | |
| By: | | /s/ Timothy J. Clemens |
| | Timothy J. Clemens |
| | Treasurer and Principal Financial Officer |
| | May 2, 2018 |