UNITED STATES
SECURITIES AND EXCHANGE COMMISSION
Washington, D.C. 20549
FORMN-CSR
CERTIFIED SHAREHOLDER REPORT OF REGISTERED
MANAGEMENT INVESTMENT COMPANIES
Investment Company Act file number:811-23117
JPMorgan Trust IV
(Exact name of registrant as specified in charter)
277 Park Avenue
New York, NY 10172
(Address of principal executive offices) (Zip code)
Gregory S. Samuels
277 Park Avenue
New York, NY 10172
(Name and Address of Agent for Service)
Registrant’s telephone number, including area code: (800)480-4111
Date of fiscal year end: June 30
Date of reporting period: July 1, 2018 through June 30, 2019
FormN-CSR is to be used by management investment companies to file reports with the Commission not later than 10 days after the transmission to stockholders of any report that is required to be transmitted to stockholders under Rule30e-1 under the Investment Company Act of 1940 (17 CFR270.30e-1). The Commission may use the information provided on FormN-CSR in its regulatory, disclosure review, inspection, and policymaking roles.
A registrant is required to disclose the information specified by FormN-CSR, and the Commission will make this information public. A registrant is not required to respond to the collection of information contained in FormN-CSR unless the Form displays a currently valid Office of Management and Budget (“OMB”) control number. Please direct comments concerning the accuracy of the information collection burden estimate and any suggestions for reducing the burden to Secretary, Securities and Exchange Commission, 450 Fifth Street, NW, Washington, DC 20549-0609. The OMB has reviewed this collection of information under the clearance requirements of 44 U.S.C. Section 3507.
ITEM 1. REPORTS TO STOCKHOLDERS.
The following is a copy of the report transmitted to shareholders pursuant to Rule30e-1 under the Investment Company Act of 1940 (17 CFR270.30e-1).
Annual Report
J.P. Morgan Funds
June 30, 2019
JPMorgan Equity Premium Income Fund
Beginning on January 1, 2021, as permitted by regulations adopted by the Securities and Exchange Commission, paper copies of the Fund’s annual and semi-annual shareholder reports will no longer be sent by mail, unless you specifically request paper copies of the reports. Instead, the reports will be made available on the Fund’s websitewww.jpmorganfunds.com and you will be notified by mail each time a report is posted and provided with a website to access the report. If you already elected to receive shareholder reports electronically, you will not be affected by this change and you need not take any action.
You may elect to receive shareholder reports and other communications from the Fund electronically anytime by contacting your financial intermediary (such as a broker dealer, bank, or retirement plan) or, if you are a direct investor, by going towww.jpmorganfunds.com/edelivery.
You may elect to receive paper copies of all future reports free of charge. Contact your financial intermediary or, if you invest directly with the Fund, email us atfunds.website.support@jpmorganfunds.com or call 1-800-480-4111. Your election to receive paper reports will apply to all funds held within your account(s).

CONTENTS
Investments in the Fund are not deposits or obligations of, or guaranteed or endorsed by, any bank and are not insured or guaranteed by the FDIC, the Federal Reserve Board or any other government agency. You could lose money if you sell when the Fund’s share price is lower than when you invested.
Past performance is no guarantee of future performance. The general market views expressed in this report are opinions based on market and other conditions through the end of the reporting period and are subject to change without notice. These views are not intended to predict the future performance of the Fund or the securities markets. References to specific securities and their issuers are for illustrative purposes only and are not intended to be, and should not be interpreted as, recommendations to purchase or sell such securities. Such views are not meant as investment advice and may not be relied on as an indication of trading intent on behalf of the Fund.
Prospective investors should refer to the Fund’s prospectuses for a discussion of the Fund’s investment objective, strategies and risks. Call J.P. Morgan Funds Service Center at1-800-480-4111 for a prospectus containing more complete information about the Fund, including management fees and other expenses. Please read it carefully before investing.
LETTER TO SHAREHOLDERS
July 31, 2019 (Unaudited)
Dear Shareholders,
Even as the pace of growth slowed, the global economic expansion continued and financial markets largely provided positive returns for the twelve months ended June 30, 2019. Central banks in the U.S. and elsewhere moved to support continued economic expansion in 2019, and low interest rates, growth in corporate profits and general investor optimism added further support to both equity and bond markets.
| | |
 | | “We believe that a well-diversified portfolio and a patient outlook may best allow investors to benefit from market opportunities presented by the current economic backdrop.”
— Andrea L. Lisher |
The U.S. economy generally outpaced other developed market nations throughout the twelve month reporting period and the U.S. expansion became the longest on record by the end of June 2019. However, growth in U.S. gross domestic product (GDP) slowed significantly to 2.1% in the second quarter of 2019 from 3.1% in the first quarter. At the same time, the U.S. unemployment rate remained below 4% for all but one month of the reporting period.
After reaching record highs in August and September 2018, U.S. equity prices tumbled sharply in December amid investor concerns about slowing global growth, unresolved U.S.-China trade tensions and expectations for further interest rate increases by the U.S. Federal Reserve (the “Fed”). For the month of December, the S&P 500 Index fell by 9.03%.
By the end of 2018, the Fed indicated it would enact fewer-than-expected interest rate increases in 2019. In January 2019, financial markets began to stabilize and started a rebound that would push equity prices back to record highs at the end of April and again by mid-June. For the twelve month reporting period, the S&P 500 returned 10.42%.
In certain other developed economies, economic growth remained sluggish. The 19-nation euro area experienced a decline in GDP growth from 1.2% in the first quarter of 2019 to 1.1% in the second quarter of 2019. Notably, manufacturing data weakened in 2019. However, unemployment continued to fall throughout the reporting period and the 7.5% euro area jobless rate by the end June 2019 was the lowest since the 2008-09 financial crisis.
In response to slowing economic expansion, the potential for slowing job growth and declining consumer confidence, European Central Bank President Mario Draghi said the bank would loosen monetary policy in the absence of improvement in the economy of the European Union. Meanwhile, the Bank of England held interest rates steady as U.K. GDP growth rebounded to 1.8% in the first quarter of 2019 from 1.4% in the final quarter of 2018. Political uncertainty surrounding negotiations for U.K.’s exit from the European Union continued throughout the reporting period and the inability of Theresa May to win Parliamentary support for her proposed Brexit plan preceded her resignation as prime minister in June. For the twelve month reporting period, the MSCI EAFE Index returned 1.60%.
Following signs of slowing growth, China unveiled a range of policies intended to stimulate domestic demand, including tax cuts, infrastructure spending and measures to support bank lending. However, slowing global demand and an increase in U.S. tariffs on Chinese-made goods continued to weigh on the economy of China as well certain of its trading partners across Asia. During the second half of the reporting period, emerging markets largely benefitted investor appetite for higher yielding assets. While the MSCI Emerging Markets Index returned 1.61% for reporting period, the Bloomberg Barclays Emerging Markets Aggregate Index returned 10.95%.
Subsequent to the end of the reporting period, the Fed cut its benchmark interest rate for the first time in eleven years. The central bank cited slowing global growth and “muted inflation pressures” in its accompanying statement.
We believe that a well-diversified portfolio and a patient outlook may best allow investors to benefit from market opportunities presented by the current economic backdrop. We look forward to managing your investment needs for years to come. Thank you for entrusting J.P. Morgan Asset Management to manage assets on your behalf. Should you have any questions, please visit www.jpmorganfunds.com or contact the J.P. Morgan Funds Service Center at 1-800-480-4111.
Sincerely yours,

Andrea L. Lisher
Head of Americas, J.P. Morgan Global Funds
J.P. Morgan Asset Management
| | | | | | | | |
| | | |
| JUNE 30, 2019 | | J.P. MORGAN FUNDS | | | | | 1 | |
JPMorgan Equity Premium Income Fund
FUND COMMENTARY
FOR THE PERIOD AUGUST 31, 2018 (inception date) THROUGH JUNE 30, 2019 (Unaudited)
| | | | |
| REPORTING PERIOD RETURN: | |
| Fund (Class I Shares)* | | | 6.15% | |
| S&P 500 Index | | | 3.10% | |
| ICE BofAML3-Month US Treasury Bill Index | | | 1.97% | |
| |
| Net Assets as of 6/30/2019 | | $ | 54,233,406 | |
INVESTMENT OBJECTIVE**
The JPMorgan Equity Premium Income Fund (the “Fund”) seeks current income while maintaining prospects for capital appreciation.
HOW DID THE MARKETS PERFORM?
Global equity prices rebounded from two sharp sell-offs and U.S. equity largely outperformed both developed and emerging markets equity during the reporting period. Bond markets also generally provided positive returns, particularly in emerging markets and U.S. corporate debt.
Growth in corporate profits, low interest rates and the continued growth in the global economy bolstered financial markets throughout the reporting period. However, investor concerns about the direction of U.S. interest rates and rising trade tensions and signs of slowing economic activity in China and Europe helped fuel significant market downturns in late 2018 and again in May 2019.
Leading equity indexes plummeted in the second half of December 2018 amid slowing global economic growth, unresolved U.S.-China trade tensions and investor concerns over rising interest rates.
However, financial market volatility stabilized in January and U.S. equity prices rebounded over the next few months and returned to record high levels by April 2019. Prices for emerging markets debt and high yield bonds (also known as junk bonds) benefitted from investor demand for higher yields in fixed income markets. Global equity markets slumped in May 2019 and leading indexes in the U.S. and Asian developed markets, as well as emerging markets, dropped by more than 6%. However, global equity prices rebounded again in June.
Within U.S. equity, large cap and mid cap stocks generally outperformed small cap stocks and growth stock continued to outperform value stocks. Within fixed income, emerging markets debt largely outperformed both U.S. investment grade debt and high yield bonds for the reporting period.
WHAT WERE THE MAIN DRIVERS OF THE FUND’S PERFORMANCE?
The Fund’s Class I Shares outperformed the S&P 500 Index (the “Benchmark”) and the ICE BofAML3-Month US Treasury Bill
Index for the ten month period ended June 30, 2019. Relative to the Benchmark, the Fund’s overweight position in the utilities sector and its security selection in the industrials sector were leading contributors to performance, while the Fund’s security selection in the materials sector and its allocation to cash and cash equivalents, such as short-term money market securities, were leading detractors from relative performance.
Relative to the Benchmark, leading individual contributors to the Fund’s performance included its underweight positions in Apple Inc. and Nvidia Corp. and its overweight position in Waste Management Inc. Shares of Apple, a maker of smartphones, computers and related devices and services, fell after the company reduced its revenue forecast for the first quarter of 2019 amid slowing demand for its iPhones and related products. Shares of Nvidia, a semiconductors manufacturer not held by the Fund, fell amid weak demand for its specialty semiconductors during the reporting period. Shares of Waste Management, a waste collection and transport company, rose after the company reported better-than-expected earnings and revenue for the first quarter of 2019.
Leading individual detractors from performance relative to the Benchmark included the Fund’s underweight position in Microsoft Corp. and its overweight positions in Conagra Brands Inc. and Altria Group Inc. Shares of Microsoft, a provider of software and services, rose amid continued growth in earnings and revenue and its continued expansion into cloud computing and other technologies. Shares of Conagra Brands, a maker of processed and packaged foods, fell amid lower-than-expected results in 2018 and investor concerns over the company’s $10.4 billion acquisition of Pinnacle Foods. Shares of Altria Group, a manufacturer of tobacco products, fell amid a decline in cigarette sales during the reporting period.
HOW WAS THE FUND POSITIONED?
The Fund seeks to generate income through a combination of selling options and investing in large cap stocks and delivering monthly income from associated option premiums and stock dividends. The Fund’s portfolio managers employed a proprietary research process designed to identify what they believed were overvalued and undervalued stocks with attractive risk/return characteristics.
| | | | | | |
| | | |
| 2 | | | | J.P. MORGAN FUNDS | | JUNE 30, 2019 |
| | | | | | | | |
| TOP TEN EQUITY HOLDINGS OF THE PORTFOLIO*** | |
| | 1. | | | BNP Paribas, ELN, 47.42%, 8/2/2019, (linked to S&P 500 Index) | | | 4.5 | % |
| | 2. | | | UBS AG, ELN, 39.9%, 7/26/2019, (linked to S&P 500 Index) | | | 4.5 | |
| | 3. | | | HSBC Bank USA, NA, ELN, 49.6%, 7/12/2019, (linked to S&P 500 Index) | | | 3.4 | |
| | 4. | | | Wells Fargo Bank, ELN, 40.5%, 7/8/2019, (linked to S&P 500 Index) | | | 3.4 | |
| | 5. | | | Xcel Energy, Inc. | | | 1.4 | |
| | 6. | | | PepsiCo, Inc. | | | 1.4 | |
| | 7. | | | Mondelez International, Inc., Class A | | | 1.4 | |
| | 8. | | | American Electric Power Co., Inc. | | | 1.4 | |
| | 9. | | | Honeywell International, Inc. | | | 1.4 | |
| | 10. | | | Microsoft Corp. | | | 1.4 | |
| | | | | | |
PORTFOLIO COMPOSITION BY SECTOR*** | |
| Convertible Bonds | | | 15.8 | % |
| Financials | | | 12.2 | |
| Industrials | | | 12.0 | |
| Information Technology | | | 9.9 | |
| Utilities | | | 9.8 | |
| Health Care | | | 9.8 | |
| Consumer Staples | | | 9.4 | |
| Consumer Discretionary | | | 7.7 | |
| Communication Services | | | 4.3 | |
| Real Estate | | | 3.8 | |
| Energy | | | 3.0 | |
| Materials | | | 2.3 | |
| * | | The return shown is based on net asset values calculated for shareholder transactions and may differ from the return shown in the financial highlights, which reflects adjustments made to the net asset values in accordance with accounting principles generally accepted in the United States of America. |
| ** | | The adviser seeks to achieve the Fund’s objective. There can be no guarantee it will be achieved. |
| *** | | Percentages indicated are based on total investments as of June 30, 2019. The Fund’s portfolio composition is subject to change. |
| | | | | | | | |
| | | |
| JUNE 30, 2019 | | J.P. MORGAN FUNDS | | | | | 3 | |
JPMorgan Equity Premium Income Fund
FUND COMMENTARY
FOR THE PERIOD AUGUST 31, 2018 (inception date) THROUGH JUNE 30, 2019 (Unaudited) (continued)
| | | | | | |
TOTAL RETURNSAS OFJUNE 30, 2019 | |
| | |
| | | INCEPTION DATE OF
CLASS | | SINCE
INCEPTION* | |
CLASS A SHARES | | August 31, 2018 | | | | |
With Sales Charge** | | | | | 0.46 | % |
Without Sales Charge | | | | | 6.02 | |
CLASS C SHARES | | August 31, 2018 | | | | |
With CDSC*** | | | | | 4.50 | |
Without CDSC | | | | | 5.50 | |
CLASS I SHARES | | August 31, 2018 | | | 6.15 | |
CLASS R5 SHARES | | August 31, 2018 | | | 6.28 | |
CLASS R6 SHARES | | August 31, 2018 | | | 6.37 | |
| ** | | Sales Charge for Class A Shares is 5.25%. |
| *** | | Assumes a 1% CDSC (contingent deferred sales charge) for the period. |
LIFE OF FUND PERFORMANCE(8/31/18 to 6/30/19)
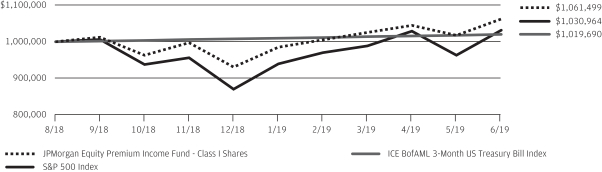
The performance quoted is past performance and is not a guarantee of future results. Mutual funds are subject to certain market risks. Investment returns and principal value of an investment will fluctuate so that an investor’s shares, when redeemed, may be worth more or less than their original cost. Current performance may be higher or lower than the performance data shown. For up-to-date month-end performance information please call 1-800-480-4111.
The Fund commenced operations on August 31, 2018.
The graph illustrates comparative performance for $1,000,000 invested in Class I Shares of the JPMorgan Equity Premium Income Fund, the S&P 500 Index and the ICE BofAML 3-Month US Treasury Bill Index from August 31, 2018 to June 30, 2019. The performance of the Fund assumes reinvestment of all dividends and capital gain distributions, if any, and does not include a sales charge. The performance of the S&P 500 Index and the ICE BofAML 3-Month US Treasury Bill Index does not reflect the deduction of expenses or a sales charge associated with a mutual fund and approximates the minimum possible dividend reinvestment of the securities included in the benchmarks, if applicable. These expenses are not identical to the expenses incurred by the Fund. The S&P 500 Index is an unmanaged index generally representative of the performance of large companies in the U.S. stock market. The ICE BofAML
3-Month US Treasury Bill Index is comprised of a single issue purchased at the beginning of the month and held for a full month. Each month the ICE BofAML 3-Month US Treasury Bill Index is rebalanced and the issue selected is the outstanding Treasury Bill that matures closest to, but not beyond, 3 months from the rebalancing date. Investors cannot invest directly in an index.
Class I Shares have a $1,000,000 minimum initial investment.
Subsequent to the inception date of the Fund and through April 7, 2019, the Fund did not experience any shareholder activity. If such shareholder activity had occurred, the Fund’s performance may have been impacted.
Fund performance may reflect the waiver of the Fund’s fees and reimbursement of expenses for certain periods since the inception date. Without these waivers and reimbursements, performance would have been lower. Also, performance shown in this section does not reflect the deduction of taxes that a shareholder would pay on Fund distributions or redemptions of Fund shares.
The returns shown are based on net asset values calculated for shareholder transactions and may differ from the returns shown in the financial highlights, which reflect adjustments made to the net asset values in accordance with accounting principles generally accepted in the United States of America.
| | | | | | |
| | | |
| 4 | | | | J.P. MORGAN FUNDS | | JUNE 30, 2019 |
JPMorgan Equity Premium Income Fund
SCHEDULE OF PORTFOLIO INVESTMENTS
AS OF JUNE 30, 2019
| | | | | | | | |
| INVESTMENTS | | SHARES | | | VALUE($) | |
Common Stocks — 82.6% | |
|
Aerospace & Defense — 3.1% | |
| | |
General Dynamics Corp. | | | 3,870 | | | | 703,644 | |
| | |
Northrop Grumman Corp. | | | 1,158 | | | | 374,161 | |
| | |
United Technologies Corp. | | | 4,814 | | | | 626,783 | |
| | | | | | | | |
| | |
| | | | | | | 1,704,588 | |
| | | | | | | | |
| | |
Banks — 0.8% | | | | | | | | |
| | |
BB&T Corp. | | | 9,057 | | | | 444,970 | |
| | | | | | | | |
| | |
Beverages — 2.7% | | | | | | | | |
| | |
Coca-Cola Co. (The) | | | 13,944 | | | | 710,029 | |
| | |
PepsiCo, Inc. | | | 5,833 | | | | 764,881 | |
| | | | | | | | |
| | |
| | | | | | | 1,474,910 | |
| | | | | | | | |
| | |
Capital Markets — 2.0% | | | | | | | | |
| | |
CME Group, Inc. | | | 1,977 | | | | 383,755 | |
| | |
Intercontinental Exchange, Inc. | | | 8,120 | | | | 697,833 | |
| | | | | | | | |
| | |
| | | | | | | 1,081,588 | |
| | | | | | | | |
| | |
Chemicals — 1.6% | | | | | | | | |
| | |
Celanese Corp. | | | 3,625 | | | | 390,775 | |
| | |
Linde plc (United Kingdom) | | | 1,589 | | | | 319,071 | |
| | |
RPM International, Inc. | | | 2,271 | | | | 138,781 | |
| | | | | | | | |
| | |
| | | | | | | 848,627 | |
| | | | | | | | |
| | |
Commercial Services & Supplies — 0.9% | | | | | | | | |
| | |
Waste Management, Inc. | | | 4,083 | | | | 471,056 | |
| | | | | | | | |
| | |
Consumer Finance — 0.8% | | | | | | | | |
| | |
American Express Co. | | | 3,660 | | | | 451,790 | |
| | | | | | | | |
| | |
Containers & Packaging — 0.7% | | | | | | | | |
| | |
Avery Dennison Corp. | | | 3,229 | | | | 373,531 | |
| | | | | | | | |
| | |
Diversified Financial Services — 1.0% | | | | | | | | |
| | |
Berkshire Hathaway, Inc., Class B* | | | 2,529 | | | | 539,107 | |
| | | | | | | | |
| |
Diversified Telecommunication Services — 1.2% | | | | | |
| | |
Verizon Communications, Inc. | | | 11,073 | | | | 632,601 | |
| | | | | | | | |
| | |
Electric Utilities — 5.9% | | | | | | | | |
| | |
American Electric Power Co., Inc. | | | 8,557 | | | | 753,102 | |
| | |
Edison International | | | 1,703 | | | | 114,799 | |
| | |
Exelon Corp. | | | 13,127 | | | | 629,308 | |
| | |
FirstEnergy Corp. | | | 6,213 | | | | 265,978 | |
| | |
NextEra Energy, Inc. | | | 3,310 | | | | 678,087 | |
| | |
Xcel Energy, Inc. | | | 12,887 | | | | 766,648 | |
| | | | | | | | |
| | |
| | | | | | | 3,207,922 | |
| | | | | | | | |
| | |
Electrical Equipment — 1.7% | | | | | | | | |
| | |
Eaton Corp. plc | | | 8,564 | | | | 713,210 | |
| | |
Emerson Electric Co. | | | 3,319 | | | | 221,444 | |
| | | | | | | | |
| | |
| | | | | | | 934,654 | |
| | | | | | | | |
| | | | | | | | |
| INVESTMENTS | | SHARES | | | VALUE($) | |
| | | | | | | | |
| | |
Entertainment — 1.1% | | | | | | | | |
| | |
Walt Disney Co. (The) | | | 4,347 | | | | 607,015 | |
| | | | | | | | |
|
Equity Real Estate Investment Trusts (REITs) — 3.7% | |
| | |
AvalonBay Communities, Inc. | | | 2,115 | | | | 429,726 | |
| | |
Boston Properties, Inc. | | | 3,500 | | | | 451,500 | |
| | |
Equity Residential | | | 2,805 | | | | 212,955 | |
| | |
Prologis, Inc. | | | 4,041 | | | | 323,684 | |
| | |
Public Storage | | | 1,141 | | | | 271,752 | |
| | |
VICI Properties, Inc. | | | 6,281 | | | | 138,433 | |
| | |
Vornado Realty Trust | | | 2,837 | | | | 181,852 | |
| | | | | | | | |
| | |
| | | | | | | 2,009,902 | |
| | | | | | | | |
| | |
Food & Staples Retailing — 0.6% | | | | | | | | |
| | |
Costco Wholesale Corp. | | | 1,270 | | | | 335,610 | |
| | | | | | | | |
| | |
Food Products — 2.4% | | | | | | | | |
| | |
General Mills, Inc. | | | 5,893 | | | | 309,500 | |
| | |
Hershey Co. (The) | | | 1,806 | | | | 242,058 | |
| | |
Mondelez International, Inc., Class A | | | 14,153 | | | | 762,847 | |
| | | | | | | | |
| | |
| | | | | | | 1,314,405 | |
| | | | | | | | |
| | |
Health Care Equipment & Supplies — 2.1% | | | | | | | | |
| | |
Becton Dickinson and Co. | | | 1,495 | | | | 376,755 | |
| | |
Medtronic plc | | | 4,319 | | | | 420,627 | |
| | |
Zimmer Biomet Holdings, Inc. | | | 2,783 | | | | 327,671 | |
| | | | | | | | |
| | |
| | | | | | | 1,125,053 | |
| | | | | | | | |
| | |
Health Care Providers & Services — 1.9% | | | | | | | | |
| | |
Cigna Corp. | | | 3,073 | | | | 484,151 | |
| | |
UnitedHealth Group, Inc. | | | 2,216 | | | | 540,726 | |
| | | | | | | | |
| | |
| | | | | | | 1,024,877 | |
| | | | | | | | |
| | |
Hotels, Restaurants & Leisure — 1.9% | | | | | | | | |
| | |
Darden Restaurants, Inc. | | | 2,255 | | | | 274,501 | |
| | |
McDonald’s Corp. | | | 1,306 | | | | 271,204 | |
| | |
Yum! Brands, Inc. | | | 4,553 | | | | 503,881 | |
| | | | | | | | |
| | |
| | | | | | | 1,049,586 | |
| | | | | | | | |
| | |
Household Products — 1.7% | | | | | | | | |
| | |
Kimberly-Clark Corp. | | | 1,743 | | | | 232,307 | |
| | |
Procter & Gamble Co. (The) | | | 6,462 | | | | 708,558 | |
| | | | | | | | |
| | |
| | | | | | | 940,865 | |
| | | | | | | | |
| | |
Industrial Conglomerates — 1.4% | | | | | | | | |
| | |
Honeywell International, Inc. | | | 4,298 | | | | 750,388 | |
| | | | | | | | |
| | |
Insurance — 7.3% | | | | | | | | |
| | |
Allstate Corp. (The) | | | 6,789 | | | | 690,374 | |
| | |
Arthur J Gallagher & Co. | | | 5,156 | | | | 451,614 | |
| | |
Axis Capital Holdings Ltd. | | | 6,137 | | | | 366,072 | |
| | |
Chubb Ltd. | | | 4,632 | | | | 682,247 | |
| | |
Everest Re Group Ltd. | | | 2,728 | | | | 674,307 | |
SEE NOTES TO FINANCIAL STATEMENTS.
| | | | | | | | |
| | | |
| JUNE 30, 2019 | | J.P. MORGAN FUNDS | | | | | 5 | |
JPMorgan Equity Premium Income Fund
SCHEDULE OF PORTFOLIO INVESTMENTS
AS OF JUNE 30, 2019 (continued)
| | | | | | | | |
| INVESTMENTS | | SHARES | | | VALUE($) | |
Common Stocks — continued | |
| | |
Insurance — continued | | | | | | | | |
| | |
Hartford Financial Services Group, Inc. (The) | | | 12,067 | | | | 672,373 | |
| | |
MetLife, Inc. | | | 8,817 | | | | 437,940 | |
| | | | | | | | |
| | |
| | | | | | | 3,974,927 | |
| | | | | | | | |
| | |
Interactive Media & Services — 1.2% | | | | | | | | |
| | |
Alphabet, Inc., Class A* | | | 609 | | | | 659,425 | |
| | | | | | | | |
|
IT Services — 5.6% | |
| | |
Accenture plc, Class A | | | 3,935 | | | | 727,070 | |
| | |
Automatic Data Processing, Inc. | | | 4,363 | | | | 721,335 | |
| | |
Fiserv, Inc.* | | | 6,831 | | | | 622,714 | |
| | |
Leidos Holdings, Inc. | | | 2,841 | | | | 226,854 | |
| | |
Mastercard, Inc., Class A | | | 1,084 | | | | 286,750 | |
| | |
Visa, Inc., Class A | | | 2,456 | | | | 426,239 | |
| | | | | | | | |
| | |
| | | | | | | 3,010,962 | |
| | | | | | | | |
|
Life Sciences Tools & Services — 0.7% | |
| | |
Thermo Fisher Scientific, Inc. | | | 1,282 | | | | 376,498 | |
| | | | | | | | |
|
Machinery — 2.6% | |
| | |
Cummins, Inc. | | | 1,607 | | | | 275,343 | |
| | |
Ingersoll-Rand plc | | | 5,014 | | | | 635,123 | |
| | |
PACCAR, Inc. | | | 3,483 | | | | 249,592 | |
| | |
Snap-on, Inc. | | | 1,396 | | | | 231,234 | |
| | | | | | | | |
| | |
| | | | | | | 1,391,292 | |
| | | | | | | | |
|
Media — 0.8% | |
| | |
Comcast Corp., Class A | | | 9,598 | | | | 405,803 | |
| | | | | | | | |
|
Multi-Utilities — 3.7% | |
| | |
CMS Energy Corp. | | | 11,763 | | | | 681,195 | |
| | |
Public Service Enterprise Group, Inc. | | | 11,061 | | | | 650,608 | |
| | |
Sempra Energy | | | 4,954 | | | | 680,878 | |
| | | | | | | | |
| | |
| | | | | | | 2,012,681 | |
| | | | | | | | |
|
Oil, Gas & Consumable Fuels — 2.9% | |
| | |
Chevron Corp. | | | 3,582 | | | | 445,744 | |
| | |
ONEOK, Inc. | | | 6,279 | | | | 432,058 | |
| | |
Phillips 66 | | | 4,692 | | | | 438,890 | |
| | |
TC Energy Corp. (Canada) | | | 5,280 | | | | 261,465 | |
| | | | | | | | |
| | |
| | | | | | | 1,578,157 | |
| | | | | | | | |
|
Pharmaceuticals — 5.0% | |
| | |
Eli Lilly & Co. | | | 5,882 | | | | 651,667 | |
| | |
Johnson & Johnson | | | 4,748 | | | | 661,301 | |
| | |
Merck & Co., Inc. | | | 8,262 | | | | 692,769 | |
| | |
Pfizer, Inc. | | | 15,612 | | | | 676,312 | |
| | | | | | | | |
| | |
| | | | | | | 2,682,049 | |
| | | | | | | | |
|
Road & Rail — 2.1% | |
| | |
Norfolk Southern Corp. | | | 3,523 | | | | 702,240 | |
| | |
Union Pacific Corp. | | | 2,566 | | | | 433,936 | |
| | | | | | | | |
| | |
| | | | | | | 1,136,176 | |
| | | | | | | | |
| | | | | | | | |
| INVESTMENTS | | SHARES | | | VALUE($) | |
| | | | | | | | |
|
Semiconductors & Semiconductor Equipment — 2.0% | |
| | |
Analog Devices, Inc. | | | 3,562 | | | | 402,043 | |
| | |
Texas Instruments, Inc. | | | 6,002 | | | | 688,790 | |
| | | | | | | | |
| | |
| | | | | | | 1,090,833 | |
| | | | | | | | |
|
Software — 2.1% | |
| | |
Microsoft Corp. | | | 5,546 | | | | 742,942 | |
| | |
Oracle Corp. | | | 7,324 | | | | 417,248 | |
| | | | | | | | |
| | |
| | | | | | | 1,160,190 | |
| | | | | | | | |
|
Specialty Retail — 5.4% | |
| | |
Advance Auto Parts, Inc. | | | 2,168 | | | | 334,176 | |
| | |
AutoZone, Inc.* | | | 606 | | | | 666,279 | |
| | |
Home Depot, Inc. (The) | | | 2,721 | | | | 565,886 | |
| | |
Ross Stores, Inc. | | | 6,878 | | | | 681,747 | |
| | |
TJX Cos., Inc. (The) | | | 12,951 | | | | 684,849 | |
| | | | | | | | |
| | |
| | | | | | | 2,932,937 | |
| | | | | | | | |
|
Textiles, Apparel & Luxury Goods — 0.3% | |
| | |
NIKE, Inc., Class B | | | 1,620 | | | | 135,999 | |
| | | | | | | | |
|
Tobacco — 1.7% | |
| | |
Altria Group, Inc. | | | 8,739 | | | | 413,792 | |
| | |
Philip Morris International, Inc. | | | 6,297 | | | | 494,503 | |
| | | | | | | | |
| | |
| | | | | | | 908,295 | |
| | | | | | | | |
| |
Total Common Stocks
(Cost $41,101,610) | | | | 44,779,269 | |
| | | | | | | | |
| | |
| | | PRINCIPAL
AMOUNT($) | | | | |
Equity-Linked Notes — 15.5% | | | | | | | | |
| | |
BNP Paribas, ELN, 47.42%, 8/2/2019, (linked to S&P 500 Index) (a) | | | 822 | | | | 2,385,356 | |
| | |
HSBC Bank USA, NA, ELN, 49.6%, 7/12/2019, (linked to S&P 500 Index) (a) | | | 713 | | | | 1,817,422 | |
| | |
UBS AG, ELN, 39.9%, 7/26/2019, (linked to S&P 500 Index) (a) | | | 823 | | | | 2,382,703 | |
| | |
Wells Fargo Bank, ELN, 40.5%, 7/8/2019, (linked to S&P 500 Index) (a) | | | 713 | | | | 1,815,888 | |
| | | | | | | | |
| |
Total Equity-Linked Notes
(Cost $8,796,230) | | | | 8,401,369 | |
| | | | | | | | |
Total Investments — 98.1%
(Cost $49,897,840) | | | | 53,180,638 | |
Other Assets Less Liabilities — 1.9% | | | | 1,052,768 | |
| | | | | | | | |
Net Assets — 100.0% | | | | 54,233,406 | |
| | | | | | | | |
Percentages indicated are based on net assets.
Abbreviations
| | |
| ELN | | Equity-Linked Note |
| |
| (a) | | Securities exempt from registration under Rule 144A or section 4(a)(2), of the Securities Act of 1933, as amended. |
| * | | Non-income producing security. |
SEE NOTES TO FINANCIAL STATEMENTS.
| | | | | | |
| | | |
| 6 | | | | J.P. MORGAN FUNDS | | JUNE 30, 2019 |
THIS PAGE IS INTENTIONALLY LEFT BLANK
| | | | | | | | |
| | | |
| JUNE 30, 2019 | | J.P. MORGAN FUNDS | | | | | 7 | |
STATEMENT OF ASSETS AND LIABILITIES
AS OF JUNE 30, 2019
| | | | |
| | |
JPMorgan
Equity Premium
Income Fund | |
ASSETS: | |
Investments in non-affiliates, at value | | $ | 53,180,638 | |
Cash | | | 856,108 | |
Receivables: | | | | |
Due from custodian | | | 2,398,086 | |
Investment securities sold | | | 347,880 | |
Fund shares sold | | | 1,549 | |
Interest from non-affiliates | | | 244,694 | |
Due from Adviser | | | 53,254 | |
Deferred offering costs | | | 4,942 | |
| | | | |
Total Assets | | | 57,087,151 | |
| | | | |
| |
LIABILITIES: | | | | |
Payables: | | | | |
Investment securities purchased | | | 2,822,235 | |
Fund shares redeemed | | | 53 | |
Accrued liabilities: | | | | |
Distribution fees | | | 36 | |
Service fees | | | 10,929 | |
Custodian and accounting fees | | | 7,719 | |
Other | | | 12,773 | |
| | | | |
Total Liabilities | | | 2,853,745 | |
| | | | |
Net Assets | | $ | 54,233,406 | |
| | | | |
SEE NOTES TO FINANCIAL STATEMENTS.
| | | | | | |
| | | |
| 8 | | | | J.P. MORGAN FUNDS | | JUNE 30, 2019 |
| | | | |
| | |
JPMorgan
Equity Premium
Income Fund | |
NET ASSETS: | |
Paid-in-Capital | | $ | 54,381,610 | |
Total distributable earnings (loss) (a) | | | (148,204 | ) |
| | | | |
Total Net Assets | | $ | 54,233,406 | |
| | | | |
| |
Net Assets: | | | | |
Class A | | $ | 125,306 | |
Class C | | | 21,100 | |
Class I | | | 54,044,471 | |
Class R5 | | | 21,256 | |
Class R6 | | | 21,273 | |
| | | | |
Total | | $ | 54,233,406 | |
| | | | |
| |
Outstanding units of beneficial interest (shares) | | | | |
($0.0001 par value; unlimited number of shares authorized): | | | | |
Class A | | | 8,397 | |
Class C | | | 1,414 | |
Class I | | | 3,622,443 | |
Class R5 | | | 1,425 | |
Class R6 | | | 1,426 | |
| |
Net Asset Value (b): | | | | |
Class A — Redemption price per share | | $ | 14.92 | |
Class C — Offering price per share (c) | | | 14.92 | |
Class I — Offering and redemption price per share | | | 14.92 | |
Class R5 — Offering and redemption price per share | | | 14.92 | |
Class R6 — Offering and redemption price per share | | | 14.92 | |
Class A maximum sales charge | | | 5.25 | % |
Class A maximum public offering price per share
[net asset value per share/(100% — maximum sales charge)] | | $ | 15.75 | |
| | | | |
| |
Cost of investments in non-affiliates | | $ | 49,897,840 | |
| (a) | Total distributable earnings have been aggregated to conform to the current presentation requirements for the adoption of the Securities and Exchange Commission’s Disclosure Update and Simplification Rule. See Note 8. |
| (b) | Per share amounts may not recalculate due to rounding of net assets and/or shares outstanding. |
| (c) | Redemption price for Class C Shares varies based upon length of time the shares are held. |
SEE NOTES TO FINANCIAL STATEMENTS.
| | | | | | | | |
| | | |
| JUNE 30, 2019 | | J.P. MORGAN FUNDS | | | | | 9 | |
STATEMENT OF OPERATIONS
FOR THE PERIOD ENDED JUNE 30, 2019
| | | | |
| |
| | |
JPMorgan
Equity Premium
Income Fund (a) | |
INVESTMENT INCOME: | |
Interest income from non-affiliates | | $ | 2,652,400 | |
Interest income from affiliates | | | 646 | |
Dividend income from non-affiliates | | | 811,882 | |
Dividend income from affiliates | | | 19,729 | |
| | | | |
Total investment income | | | 3,484,657 | |
| | | | |
| |
EXPENSES: | | | | |
Investment advisory fees | | | 102,606 | |
Administration fees | | | 31,755 | |
Distribution fees: | | | | |
Class A | | | 73 | |
Class C | | | 122 | |
Service fees: | | | | |
Class A | | | 73 | |
Class C | | | 41 | |
Class I | | | 102,410 | |
Class R5 | | | 17 | |
Custodian and accounting fees | | | 16,651 | |
Interest expense to affiliates | | | 1,519 | |
Professional fees | | | 99,479 | |
Trustees’ and Chief Compliance Officer’s fees | | | 18,830 | |
Printing and mailing costs | | | 11,011 | |
Registration and filing fees | | | 52,409 | |
Transfer agency fees (See Note 2.G.) | | | 1,608 | |
Offering costs | | | 22,389 | |
Other | | | 6,270 | |
| | | | |
Total expenses | | | 467,263 | |
| | | | |
Less fees waived | | | (132,802 | ) |
Less expense reimbursements | | | (88,276 | ) |
| | | | |
Net expenses | | | 246,185 | |
| | | | |
Net investment income (loss) | | | 3,238,472 | |
| | | | |
| |
REALIZED/UNREALIZED GAINS (LOSSES): | | | | |
Net realized gain (loss) on transactions from: | | | | |
Investments in non-affiliates | | | (3,431,726 | ) |
Investments in affiliates | | | 60 | |
| | | | |
Net realized gain (loss) | | | (3,431,666 | ) |
| | | | |
Change in net unrealized appreciation/depreciation on: | | | | |
Investments in non-affiliates | | | 3,282,798 | |
| | | | |
Net realized/unrealized gains (losses) | | | (148,868 | ) |
| | | | |
Change in net assets resulting from operations | | $ | 3,089,604 | |
| | | | |
| (a) | Commencement of operations was August 31, 2018. |
SEE NOTES TO FINANCIAL STATEMENTS.
| | | | | | |
| | | |
| 10 | | | | J.P. MORGAN FUNDS | | JUNE 30, 2019 |
STATEMENT OF CHANGES IN NET ASSETS
FOR THE PERIOD INDICATED
| | | | |
| | | JPMorgan
Equity Premium
Income Fund | |
| | | Period Ended
June 30, 2019 (a) | |
CHANGE IN NET ASSETS RESULTING FROM OPERATIONS: | |
Net investment income (loss) | | $ | 3,238,472 | |
Net realized gain (loss) | | | (3,431,666 | ) |
Change in net unrealized appreciation/depreciation | | | 3,282,798 | |
| | | | |
Change in net assets resulting from operations | | | 3,089,604 | |
| | | | |
| |
DISTRIBUTIONS TO SHAREHOLDERS: | | | | |
Class A | | | (2,321 | ) |
Class C | | | (1,172 | ) |
Class I | | | (3,248,055 | ) |
Class R5 | | | (1,324 | ) |
Class R6 | | | (1,340 | ) |
| | | | |
Total distributions to shareholders | | | (3,254,212 | ) |
| | | | |
| |
CAPITAL TRANSACTIONS: | | | | |
Change in net assets resulting from capital transactions | | | 54,398,014 | |
| | | | |
| |
NET ASSETS: | | | | |
Change in net assets | | | 54,233,406 | |
Beginning of period | | | — | |
| | | | |
End of period | | $ | 54,233,406 | |
| | | | |
CAPITAL TRANSACTIONS: | | | | |
Class A | | | | |
Proceeds from shares issued | | $ | 122,709 | |
Distributions reinvested | | | 2,321 | |
Cost of shares redeemed | | | (63 | ) |
| | | | |
Change in net assets resulting from Class A capital transactions | | $ | 124,967 | |
| | | | |
Class C | | | | |
Proceeds from shares issued | | $ | 20,000 | |
Distributions reinvested | | | 1,172 | |
| | | | |
Change in net assets resulting from Class C capital transactions | | $ | 21,172 | |
| | | | |
Class I | | | | |
Proceeds from shares issued | | $ | 51,119,943 | |
Distributions reinvested | | | 3,248,055 | |
Cost of shares redeemed | | | (158,787 | ) |
| | | | |
Change in net assets resulting from Class I capital transactions | | $ | 54,209,211 | |
| | | | |
Class R5 | | | | |
Proceeds from shares issued | | $ | 20,000 | |
Distributions reinvested | | | 1,324 | |
| | | | |
Change in net assets resulting from Class R5 capital transactions | | $ | 21,324 | |
| | | | |
Class R6 | | | | |
Proceeds from shares issued | | $ | 20,000 | |
Distributions reinvested | | | 1,340 | |
| | | | |
Change in net assets resulting from Class R6 capital transactions | | $ | 21,340 | |
| | | | |
Total change in net assets resulting from capital transactions | | $ | 54,398,014 | |
| | | | |
| (a) | Commencement of operations was August 31, 2018. |
SEE NOTES TO FINANCIAL STATEMENTS.
| | | | | | | | |
| | | |
| JUNE 30, 2019 | | J.P. MORGAN FUNDS | | | | | 11 | |
STATEMENT OF CHANGES IN NET ASSETS
FOR THE PERIOD INDICATED (continued)
| | | | |
| | | JPMorgan
Equity Premium
Income Fund | |
| | | Period Ended
June 30, 2019 (a) | |
SHARE TRANSACTIONS: | | | | |
Class A | | | | |
Issued | | | 8,242 | |
Reinvested | | | 159 | |
Redeemed | | | (4 | ) |
| | | | |
Change in Class A Shares | | | 8,397 | |
| | | | |
Class C | | | | |
Issued | | | 1,333 | |
Reinvested | | | 81 | |
| | | | |
Change in Class C Shares | | | 1,414 | |
| | | | |
Class I | | | | |
Issued | | | 3,409,348 | |
Reinvested | | | 224,215 | |
Redeemed | | | (11,120 | ) |
| | | | |
Change in Class I Shares | | | 3,622,443 | |
| | | | |
Class R5 | | | | |
Issued | | | 1,334 | |
Reinvested | | | 91 | |
| | | | |
Change in Class R5 Shares | | | 1,425 | |
| | | | |
Class R6 | | | | |
Issued | | | 1,333 | |
Reinvested | | | 93 | |
| | | | |
Change in Class R6 Shares | | | 1,426 | |
| | | | |
| (a) | Commencement of operations was August 31, 2018. |
SEE NOTES TO FINANCIAL STATEMENTS.
| | | | | | |
| | | |
| 12 | | | | J.P. MORGAN FUNDS | | JUNE 30, 2019 |
THIS PAGE IS INTENTIONALLY LEFT BLANK
| | | | | | | | |
| | | |
| JUNE 30, 2019 | | J.P. MORGAN FUNDS | | | | | 13 | |
FINANCIAL HIGHLIGHTS
FOR THE PERIODS INDICATED
| | | | | | | | | | | | | | | | | | | | | | | | | | | | |
| | | Per share operating performance | | | | |
| | | | | | Investment operations | | | Distributions | | | | | | | |
| | | Net asset
value,
beginning
of period | | | Net
investment
income
(loss) (b) | | | Net realized
and unrealized
gains
(losses) on
investments | | | Total from
investment
operations | | | Net
investment
income | | | Net asset
value,
end of
period | | | Total return
(excludes
sales charge) (c)(d) | |
JPMorgan Equity Premium Income Fund | | | | | | | | | | | | | | | | | | | | | | | | | | | | |
Class A | | | | | | | | | | | | | | | | | | | | | | | | | | | | |
August 31, 2018 (g) through June 30, 2019 | | $ | 15.00 | | | $ | 0.95 | | | $ | (0.11 | ) | | $ | 0.84 | | | $ | (0.92 | ) | | $ | 14.92 | | | | 5.95 | % |
| | | | | | | |
Class C | | | | | | | | | | | | | | | | | | | | | | | | | | | | |
August 31, 2018 (g) through June 30, 2019 | | | 15.00 | | | | 0.85 | | | | (0.07 | ) | | | 0.78 | | | | (0.86 | ) | | | 14.92 | | | | 5.50 | |
| | | | | | | |
Class I | | | | | | | | | | | | | | | | | | | | | | | | | | | | |
August 31, 2018 (g) through June 30, 2019 | | | 15.00 | | | | 0.94 | | | | (0.07 | ) | | | 0.87 | | | | (0.95 | ) | | | 14.92 | | | | 6.15 | |
| | | | | | | |
Class R5 | | | | | | | | | | | | | | | | | | | | | | | | | | | | |
August 31, 2018 (g) through June 30, 2019 | | | 15.00 | | | | 0.96 | | | | (0.08 | ) | | | 0.88 | | | | (0.96 | ) | | | 14.92 | | | | 6.28 | |
| | | | | | | |
Class R6 | | | | | | | | | | | | | | | | | | | | | | | | | | | | |
August 31, 2018 (g) through June 30, 2019 | | | 15.00 | | | | 0.97 | | | | (0.07 | ) | | | 0.90 | | | | (0.98 | ) | | | 14.92 | | | | 6.37 | |
| (a) | Annualized for periods less than one year, unless otherwise noted. |
| (b) | Calculated based upon average shares outstanding. |
| (c) | Not annualized for periods less than one year. |
| (d) | Includes adjustments in accordance with accounting principles generally accepted in the United States of America and as such, the net asset values for financial reporting purposes and the returns based upon those net asset values may differ from the net asset values and returns for shareholder transactions. |
| (e) | Includes earnings credits and interest expense, if applicable, each of which is less than 0.005% unless otherwise noted. |
| (f) | Certain non-recurring expenses incurred by the Fund were not annualized for the periods indicated. |
| (g) | Commencement of operations. |
SEE NOTES TO FINANCIAL STATEMENTS.
| | | | | | |
| | | |
| 14 | | | | J.P. MORGAN FUNDS | | JUNE 30, 2019 |
| | | | | | | | | | | | | | | | | | |
| | | Ratios/Supplemental data | |
| | | | Ratios to average net assets(a) | | | | |
Net assets,
end of
period | | | Net
expenses (e)(f) | | | Net
investment
income
(loss) (f) | | |
Expenses
without waivers,
reimbursements and
earnings credits (f) | | | Portfolio
turnover
rate (c) | |
| | | | | | | | | | | | | | | | | | |
| | | | | | | | | | | | | | | | | | |
| $ | 125,306 | | | | 0.85 | % | | | 7.90 | % | | | 1.80 | % | | | 43 | % |
| | | | |
| | | | | | | | | | | | | | | | | | |
| | 21,100 | | | | 1.35 | | | | 7.14 | | | | 2.26 | | | | 43 | |
| | | | |
| | | | | | | | | | | | | | | | | | |
| | 54,044,471 | | | | 0.60 | | | | 7.89 | | | | 1.13 | | | | 43 | |
| | | | |
| | | | | | | | | | | | | | | | | | |
| | 21,256 | | | | 0.45 | | | | 8.04 | | | | 1.36 | | | | 43 | |
| | | | |
| | | | | | | | | | | | | | | | | | |
| | 21,273 | | | | 0.35 | | | | 8.14 | | | | 1.26 | | | | 43 | |
SEE NOTES TO FINANCIAL STATEMENTS.
| | | | | | | | |
| | | |
| JUNE 30, 2019 | | J.P. MORGAN FUNDS | | | | | 15 | |
NOTES TO FINANCIAL STATEMENTS
AS OF JUNE 30, 2019
1. Organization
JPMorgan Trust IV (the “Trust”) was formed on November 11, 2015, as a Delaware statutory trust, pursuant to a Declaration of Trust dated November 11, 2015 and is registered under the Investment Company Act of 1940, as amended (the “1940 Act”), as an open-end management investment company.
The following is a separate fund of the Trust (the “Fund”) covered by this report:
| | | | |
| | | Classes Offered | | Diversified/ Non-Diversified |
| JPMorgan Equity Premium Income Fund | | Class A, Class C, Class I, Class R5 and Class R6 | | Diversified |
The investment objective of the Fund is to seek current income while maintaining prospects for capital appreciation.
The Fund commenced operations on August 31, 2018. Class A Shares generally provide for a front-end sales charge while Class C Shares provide for a contingent deferred sales charge (“CDSC”). No sales charges are assessed with respect to Class C, Class I, Class R5 and Class R6 Shares. Certain Class A Shares, for which front-end sales charges have been waived, may be subject to a CDSC as described in the Fund’s prospectus. All classes of shares have equal rights as to earnings, assets and voting privileges, except that each class may bear different transfer agency, distribution and service fees and each class has exclusive voting rights with respect to its distribution plan and shareholder servicing agreements.
J.P. Morgan Investment Management Inc. (“JPMIM”), an indirect, wholly-owned subsidiary of JPMorgan Chase & Co. (“JPMorgan”), acts as Adviser (the “Adviser”) and Administrator (the “Administrator”) to the Fund.
2. Significant Accounting Policies
The following is a summary of significant accounting policies followed by the Fund in the preparation of its financial statements. The Fund is an investment company and, thus, follows the investment company accounting and reporting guidance of the Financial Accounting Standards Board Accounting Standards Codification Topic 946 — Investment Companies, which is part of U.S. generally accepted accounting principles (“GAAP”). The preparation of financial statements in conformity with GAAP requires management to make estimates and assumptions that affect the reported amounts of assets and liabilities and disclosure of contingent assets and liabilities at the date of the financial statements and the reported amounts of increases and decreases in net assets from operations during the reporting period. Actual results could differ from those estimates.
A. Valuation of Investments — The valuation of investments is in accordance with GAAP and the Fund’s valuation policies set forth by and under the supervision and responsibility of the Board of Trustees (the “Board”), which established the following approach to valuation, as described more fully below: (i) investments for which market quotations are readily available shall be valued at their market value and (ii) all other investments for which market quotations are not readily available shall be valued at their fair value as determined in good faith by the Board.
The Administrator has established the J.P. Morgan Asset Management Americas Valuation Committee (“AVC”) to assist the Board with the oversight and monitoring of the valuation of the Fund’s investments. The Administrator implements the valuation policies of the Fund’s investments, as directed by the Board. The AVC oversees and carries out the policies for the valuation of investments held in the Fund. This includes monitoring the appropriateness of fair values based on results of ongoing valuation oversight including, but not limited to, consideration of macro or security specific events, market events and pricing vendor and broker due diligence. The Administrator is responsible for discussing and assessing the potential impacts to the fair values on an ongoing basis, and at least on a quarterly basis with the AVC and the Board.
Fixed income instruments are valued based on prices received from approved affiliated and unaffiliated pricing vendors or third party broker-dealers (collectively referred to as “Pricing Services”). The Pricing Services use multiple valuation techniques to determine the valuation of fixed income instruments. In instances where sufficient market activity exists, the Pricing Services may utilize a market-based approach through which trades or quotes from market makers are used to determine the valuation of these instruments. In instances where sufficient market activity may not exist, the Pricing Services also utilize proprietary valuation models which may consider market transactions in comparable securities and the various relationships between securities in determining fair value and/or market characteristics in order to estimate the relevant cash flows, which are then discounted to calculate the fair values.
Equities and other exchange-traded instruments are valued at the last sale price or official market closing price on the primary exchange on which the instrument is traded before the net asset values (“NAV”) of the Fund are calculated on a valuation date. Investments in open-end investment companies (“Underlying Funds”) are valued at each Underlying Fund’s NAV per share as of the report date.
Valuations reflected in this report are as of the report date. As a result, changes in valuation due to market events and/or issuer related events after the report date and prior to issuance of the report are not reflected herein.
The various inputs that are used in determining the valuation of the Fund’s investments are summarized into the three broad levels listed below.
| • | | Level 1 — Unadjusted inputs using quoted prices in active markets for identical investments. |
| • | | Level 2 — Other significant observable inputs including, but not limited to, quoted prices for similar investments, inputs other than quoted prices that are observable for investments (such as interest rates, prepayment speeds, credit risk, etc.) or other market corroborated inputs. |
| • | | Level 3 — Significant inputs based on the best information available in the circumstances, to the extent observable inputs are not available (including the Fund’s assumptions in determining the fair value of investments). |
| | | | | | |
| | | |
| 16 | | | | J.P. MORGAN FUNDS | | JUNE 30, 2019 |
A financial instrument’s level within the fair value hierarchy is based on the lowest level of any input, both individually and in the aggregate, that is significant to the fair value measurement. The inputs or methodology used for valuing instruments are not necessarily an indication of the risk associated with investing in those instruments.
The following table represents each valuation input as presented on the Schedule of Portfolio Investments (“SOI”):
| | | | | | | | | | | | | | | | |
| | | Level 1
Quoted prices | | | Level 2
Other significant
observable inputs | | | Level 3
Significant
unobservable inputs | | | Total | |
Total Investments in Securities(a) | | $ | 44,779,269 | | | $ | 8,401,369 | | | $ | – | | | $ | 53,180,638 | |
| | | | | | | | | | | | | | | | |
| (a) | Portfolio holdings designated as level 1 and level 2 are disclosed individually on the SOI. Level 2 consists of equity-linked notes. Please refer to the SOI for asset class specifics of portfolio holdings. |
There were no transfers into and out of level 3 for the period ended June 30, 2019.
B. Securities Lending — Effective October 5, 2018, the Fund became authorized to engage in securities lending in order to generate additional income. The Fund is able to lend to approved borrowers. Citibank N.A. (“Citibank”) serves as lending agent for the Fund, pursuant to a Securities Lending Agency Agreement (the “Securities Lending Agency Agreement”). Securities loaned are collateralized by cash equal to at least 100% of the market value plus accrued interest on the securities lent, which is invested in an affiliated money market fund. The Fund retains loan fees and the interest on cash collateral investments but is required to pay the borrower a rebate for the use of cash collateral. In cases where the lent security is of high value to borrowers, there may be a negative rebate (i.e. a net payment to the Fund). Upon termination of a loan, the Fund is required to return to the borrower an amount equal to the cash collateral, plus any rebate owed to the borrowers. The remaining maturities of the securities lending transactions are considered overnight and continuous. Loans are subject to termination by the Fund or the borrower at any time.
The net income earned on the securities lending (after payment of rebates and Citibank’s fee) is included on the Statement of Operations as Income from securities lending (net). The Fund also receives payments from the borrower during the period of the loan, equivalent to dividends and interest earned on the securities loaned, which are recorded as Dividend or Interest income, respectively, on the Statement of Operations.
Under the Securities Lending Agency Agreement, Citibank marks to market the loaned securities on a daily basis. In the event the cash received from the borrower is less than 102% of the value of the loaned securities (105% for loans of non-U.S. securities), Citibank requests additional cash from the borrower so as to maintain a collateralization level of at least 102% of the value of the loaned securities plus accrued interest (105% for loans of non-U.S. securities), subject to certain de minimis amounts.
The value of securities out on loan is recorded as an asset on the Statement of Assets and Liabilities. The value of the cash collateral received is recorded as a liability on the Statement of Assets and Liabilities and details of collateral investments are disclosed on the SOI.
The Fund bears the risk of loss associated with the collateral investments and is not entitled to additional collateral from the borrower to cover any such losses. To the extent that the value of the collateral investments declines below the amount owed to a borrower, the Fund may incur losses that exceed the amount it earned on lending the security. Upon termination of a loan, the Fund may use leverage (borrow money) to repay the borrower for cash collateral posted if the Adviser does not believe that it is prudent to sell the collateral investments to fund the payment of this liability. Securities lending activity is subject to master netting arrangements.
Securities lending also involves counterparty risks, including the risk that the loaned securities may not be returned in a timely manner or at all. Subject to certain conditions, Citibank has agreed to indemnify the Fund from losses resulting from a borrower’s failure to return a loaned security.
The Fund did not lend out any securities during the period August 31, 2018 through June 30, 2019.
| | | | | | | | |
| | | |
| JUNE 30, 2019 | | J.P. MORGAN FUNDS | | | | | 17 | |
NOTES TO FINANCIAL STATEMENTS
AS OF JUNE 30, 2019 (continued)
C. Investment Transactions with Affiliates — The Fund invested in an Underlying Fund which is advised by the Adviser or its affiliates. An issuer which is under common control with the Fund may be considered an affiliate. For the purposes of the financial statements, the Fund assumes the issuer listed in the table below to be an affiliated issuer. The Underlying Fund’s distributions may be reinvested into the Underlying Fund. Reinvestment amounts are included in the purchase cost amounts in the table below.
| | | | | | | | | | | | | | | | | | | | | | | | | | | | | | | | | | | | |
| | | For the period ended June 30, 2019 | |
| Security Description | | Value at
August 31,
2018 | | | Purchases at
Cost | | | Proceeds from Sales | | | Net
Realized
Gain (Loss) | | | Change in
Unrealized
Appreciation/
(Depreciation) | | | Value at
June 30,
2019 | | | Shares at
June 30,
2019 | | | Dividend
Income | | | Capital Gain
Distributions | |
JPMorgan Prime Money Market Fund Class IM Shares (a) | | $ | — | | | $ | 8,664,026 | | | $ | 8,664,086 | | | $ | 60 | | | $ | — | | | $ | — | | | | — | | | $ | 3,084 | | | $ | — | |
JPMorgan U.S. Government Money Market Fund Class Institutional Shares (a) | | | — | | | | 65,204,374 | | | | 65,204,374 | | | | — | | | | — | | | | — | | | | — | | | | 16,645 | | | | — | |
| | | | | | | | | | | | | | | | | | | | | | | | | | | | | | | | | | | | |
Total | | $ | — | | | $ | 73,868,400 | | | $ | 73,868,460 | | | $ | 60 | | | $ | — | | | $ | — | | | | | | | $ | 19,729 | | | $ | — | |
| | | | | | | | | | | | | | | | | | | | | | | | | | | | | | | | | | | | |
| (a) | Investment in an affiliated fund, which is registered under the Investment Company Act of 1940, as amended, and is advised by J.P. Morgan Investment Management Inc. |
D. Equity-Linked Notes — The Fund invested in Equity-Linked Notes (“ELNs”). These are hybrid instruments which combine both debt and equity characteristics into a single note form. ELNs values are linked to the performance of an underlying index. ELNs are unsecured debt obligations of an issuer and may not be publically listed or traded on an exchanged. ELNS are valued daily, under procedures adopted by the Board, based upon values provided by an approved pricing source. These notes have a coupon which is accrued and recorded as interest income on the Statement of Operations. Changes in the market value of ELNs are recorded as Change in net unrealized appreciation or depreciation on the Statement of Operations. The Fund records a realized gain or loss when ELN is sold or matures.
As of June 30, 2019, the Fund had outstanding ELNs as listed on the SOI.
E. Offering and Organizational Costs — Total offering costs of $27,331 incurred in connection with the offering of shares of the Fund are amortized on a straight line basis over 12 months from the date the Fund commenced operations. Costs paid in connection with the organization of the Fund, if any, are recorded as an expense at the time the Fund commenced operations. For the period ended June 30, 2019, total offering costs amortized were $22,389.
F. Security Transactions and Investment Income — Investment transactions are accounted for on the trade date (the date the order to buy or sell is executed). Securities gains and losses are calculated on a specifically identified cost basis. Interest income is determined on the basis of coupon interest accrued using the effective interest method which adjusts for amortization of premiums and accretion of discounts. Dividend income, net of foreign taxes withheld, if any, is recorded on the ex-dividend date or when the Fund first learns of the dividend.
G. Allocation of Income and Expenses — Expenses directly attributable to a fund are charged directly to that fund, while the expenses attributable to more than one fund of the Trust are allocated among the respective funds. In calculating the NAV of each class, investment income, realized and unrealized gains and losses and expenses, other than class-specific expenses, are allocated daily to each class of shares based upon the proportion of net assets of each class at the beginning of each day.
Transfer agency fees are class-specific expenses. The amount of the transfer agency fees charged to each share class of the Fund for the period ended June 30, 2019 are as follows:
| | | | | | | | | | | | | | | | | | | | | | | | |
| | | Class A | | | Class C | | | Class I | | | Class R5 | | | Class R6 | | | Total | |
| | $ | 65 | | | $ | 64 | | | $ | 1,349 | | | $ | 65 | | | $ | 65 | | | $ | 1,608 | |
H. Federal Income Taxes — The Fund is treated as a separate taxable entity for Federal income tax purposes. The Fund’s policy is to comply with the provisions of the Internal Revenue Code (the “Code”), applicable to regulated investment companies and to distribute to shareholders all of its distributable net investment income and net realized capital gains on investments. Accordingly, no provision for Federal income tax is necessary. Management has reviewed the Fund’s tax positions for all open tax years and has determined that as of June 30, 2019, no liability for Federal income tax is required in the Fund’s financial statements for net unrecognized tax benefits. However, management’s conclusions may be subject to future review based on changes in, or the interpretation of, the accounting standards or tax laws and regulations. The Fund’s Federal tax returns for the prior three fiscal years remain, or since inception if shorter, subject to examination by the Internal Revenue Service.
I. Distributions to Shareholders — Distributions from net investment income, if any, are generally declared and paid monthly and are declared separately for each class. No class has preferential dividend rights; differences in per share rates are due to differences in separate class expenses. Net realized capital gains, if any, are distributed at least annually. The amount of distributions from net investment income and net realized capital gains is determined in accordance with Federal income tax regulations, which may differ from GAAP. To the extent these “book/tax” differences are
| | | | | | |
| | | |
| 18 | | | | J.P. MORGAN FUNDS | | JUNE 30, 2019 |
permanent in nature (i.e., that they result from other than timing of recognition — “temporary differences”), such amounts are reclassified within the capital accounts based on their Federal tax-basis treatment.
The following amounts were reclassified within the capital accounts:
| | | | | | | | | | | | |
| | | Paid-in-Capital | | | Accumulated undistributed (distributions
in excess of) net investment income | | | Accumulated net realized gains (losses) | |
| | $ | (16,404 | ) | | $ | 9,597 | | | $ | 6,807 | |
The reclassifications for the Fund relate primarily to non-taxable dividends.
3. Fees and Other Transactions with Affiliates
A. Investment Advisory Fee — Pursuant to an Investment Advisory Agreement, the Adviser supervises the investments of the Fund and for such services is paid a fee. The fee is accrued daily and paid monthly at an annual rate of 0.25% of the Fund’s average daily net assets.
The Adviser waived Investment Advisory fees and/or reimbursed expenses as outlined in Note 3.F.
B. Administration Fee — Pursuant to an Administration Agreement, the Administrator provides certain administration services to the Fund. In consideration of these services, effective January 1, 2019, the Administrator receives a fee accrued daily and paid monthly at an annual rate of 0.075% of the first $10 billion of the Fund’s average daily net assets, plus 0.050% of the Fund’s average daily net assets between $10 billion and $20 billion, plus 0.025% of the Fund’s average daily net assets between $20 billion and $25 billion, plus 0.01% of the Fund’s average daily net assets in excess of $25 billion. Prior to January 1, 2019, the Administrator received a fee accrued daily and paid monthly at an annual rate of 0.15% of the first $25 billion of the average daily net assets of all funds in the J.P. Morgan Funds Complex covered by the Administration Agreement (excluding certain funds of funds and money market funds) and 0.075% of the average daily net assets in excess of $25 billion of all such funds. For the period ended June 30, 2019, the effective annualized rate was 0.08% of the Fund’s average daily net assets, notwithstanding any fee waivers and/or expense reimbursements.
The Administrator waived Administration fees as outlined in Note 3.F.
JPMorgan Chase Bank, N.A. (“JPMCB”), a wholly-owned subsidiary of JPMorgan, serves as the Fund’s sub-administrator (the “Sub-administrator”). For its services as Sub-administrator, JPMCB receives a portion of the fees payable to the Administrator.
C. Distribution Fees — Pursuant to a Distribution Agreement, JPMorgan Distribution Services, Inc. (“JPMDS”), an indirect, wholly-owned subsidiary of JPMorgan, serves as the Trust’s principal underwriter and promotes and arranges for the sale of the Fund’s shares.
The Board has adopted a Distribution Plan (the “Distribution Plan”) for Class A and Class C Shares of the Fund in accordance with Rule 12b-1 under the 1940 Act. Class I, Class R5 and Class R6 do not charge a distribution fee. The Distribution Plan provides that the Fund shall pay distribution fees, including payments to JPMDS, at annual rates of 0.25% and 0.75% of the average daily net assets of Class A and Class C Shares, respectively.
In addition, JPMDS is entitled to receive the front-end sales charges from purchases of Class A Shares and the CDSC from redemptions of Class C Shares and certain Class A Shares for which front-end sales charges have been waived. For the period ended June 30, 2019, JPMDS retained the following:
| | | | | | | | |
| | | Front-End Sales Charge | | | CDSC | |
| | $ | 147 | | | $ | — | |
D. Service Fees — The Trust, on behalf of the Fund, has entered into a Shareholder Servicing Agreement with JPMDS under which JPMDS provides certain support services to the shareholders. For performing these services, JPMDS receives a fee, except for Class R6 Shares which do not charge a service fee, that is accrued daily and paid monthly equal to a percentage of the average daily net assets as shown in the table below:
| | | | | | | | | | | | | | | | |
| | | Class A | | | Class C | | | Class I | | | Class R5 | |
| | | 0.25 | % | | | 0.25 | % | | | 0.25 | % | | | 0.10 | % |
JPMDS has entered into shareholder services contracts with affiliated and unaffiliated financial intermediaries who provide shareholder services and other related services to their clients or customers who invest in the Fund under which JPMDS will pay all or a portion of such fees earned to financial intermediaries for performing such services.
JPMDS waived service fees as outlined in Note 3.F.
E. Custodian and Accounting Fees — JPMCB provides portfolio custody and accounting services to the Fund. For performing these services, the Fund pays JPMCB transaction and asset-based fees that vary according to the number of transactions and positions, plus out-of-pocket expenses. The amounts paid directly to JPMCB by the Fund for custody and accounting services are included in Custodian and accounting fees on the Statement of Operations.
| | | | | | | | |
| | | |
| JUNE 30, 2019 | | J.P. MORGAN FUNDS | | | | | 19 | |
NOTES TO FINANCIAL STATEMENTS
AS OF JUNE 30, 2019 (continued)
Interest income earned on cash balances at the custodian, if any, is included in Interest income from affiliates in the Statement of Operations.
Interest expense paid to the custodian related to cash overdrafts, if any, is included in Interest expense to affiliates on the Statement of Operations.
F. Waivers and Reimbursements — The Adviser, Administrator and/or JPMDS have contractually agreed to waive fees and/or reimburse the Fund to the extent that total annual operating expenses (excluding acquired fund fees and expenses other than certain money market fund fees as described below, dividend and interest expenses related to short sales, interest, taxes, expenses related to litigation and potential litigation, expenses related to trustee elections and extraordinary expenses) exceed the percentages of the Fund’s respective average daily net assets as shown in the table below:
| | | | | | | | | | | | | | | | | | | | |
| | | Class A | | | Class C | | | Class I | | | Class R5 | | | Class R6 | |
| | | 0.85 | % | | | 1.35 | % | | | 0.60 | % | | | 0.45 | % | | | 0.35 | % |
The expense limitation agreement was in effect for the period ended June 30, 2019 and is in place until at least August 31, 2019.
For the period ended June 30, 2019, the Fund’s service providers waived fees and/or reimbursed expenses for the Fund as follows. None of these parties expect the Fund to repay any such waived fees and reimbursed expenses in future years.
| | | | | | | | | | | | | | | | | | | | |
| | | Contractual Waivers | | | | |
| | | Investment Advisory Fees | | | Administration
Fees | | | Service
Fees | | | Total | | | Contractual
Reimbursement | |
| | $ | 97,951 | | | $ | 31,742 | | | $ | 1,378 | | | $ | 131,071 | | | $ | 88,276 | |
Additionally, the Fund may invest in one or more money market funds advised by the Adviser or its affiliates (affiliated money market funds). The Adviser, Administrator and/or JPMDS, as shareholder servicing agent, have contractually agreed to waive fees and/or reimburse expenses in an amount sufficient to offset the respective net fees each collects from the affiliated money market fund on the respective Fund’s investment in such affiliated money market fund, except for investments of securities lending cash collateral.
The amount of waivers resulting from investments in these money market funds for the period ended June 30, 2019 was $1,731.
G. Other — Certain officers of the Trust are affiliated with the Adviser, the Administrator and JPMDS. Such officers, with the exception of the Chief Compliance Officer, receive no compensation from the Fund for serving in their respective roles.
The Board designated and appointed a Chief Compliance Officer to the Fund pursuant to Rule 38a-1 under the 1940 Act. The Fund, along with affiliated funds, makes reimbursement payments, on a pro-rata basis, to the Administrator for a portion of the fees associated with the office of the Chief Compliance Officer. Such fees are included in Trustees’ and Chief Compliance Officer’s fees on the Statement of Operations.
The Trust adopted a Trustee Deferred Compensation Plan (the “Plan”) which allows the Independent Trustees to defer the receipt of all or a portion of compensation related to performance of their duties as Trustees. The deferred fees are invested in various J.P. Morgan Funds until distribution in accordance with the Plan.
The Securities and Exchange Commission (“SEC”) has granted an exemptive order permitting the Fund to invest in certain financial instruments in addition to Underlying Funds and securities.
4. Investment Transactions
During the period ended June 30, 2019, purchases and sales of investments (excluding short-term investments) were as follows:
| | | | | | | | |
| | | Purchases (excluding U.S. Government) | | | Sales (excluding U.S. Government) | |
| | $ | 59,938,678 | | | $ | 18,203,457 | |
During the period ended June 30, 2019, there were no purchases or sales of U.S. Government securities.
5. Federal Income Tax Matters
For Federal income tax purposes, the estimated cost and unrealized appreciation (depreciation) in value of investments held at June 30, 2019 were as follows:
| | | | | | | | | | | | | | | | |
| | | Aggregate Cost | | | Gross
Unrealized
Appreciation | | | Gross
Unrealized
Depreciation | | | Net Unrealized
Appreciation
(Depreciation) | |
| | $ | 49,898,006 | | | $ | 4,162,601 | | | $ | 879,969 | | | $ | 3,282,632 | |
The difference between book and tax basis appreciation (depreciation) on investments is primarily attributed to wash sale loss deferrals.
| | | | | | |
| | | |
| 20 | | | | J.P. MORGAN FUNDS | | JUNE 30, 2019 |
The tax character of distributions paid during the period ended June 30, 2019 was as follows:
| | | | | | | | | | | | |
| | | Ordinary Income* | | | Net Long-Term Capital Gains | | | Total Distributions Paid | |
| | $ | 3,254,212 | | | $ | — | | | $ | 3,254,212 | |
| * | Short-term gain distributions are treated as ordinary income for income tax purposes. |
As of June 30, 2019, the estimated components of net assets (excluding paid-in-capital) on a tax basis were as follows:
| | | | | | | | | | | | |
| | | Current
Distributable
Ordinary
Income | | | Current
Distributable
Long-Term
Capital Gain or
(Tax Basis Capital
Loss Carryover) | | | Unrealized
Appreciation
(Depreciation) | |
| | $ | — | | | $ | (274,215 | ) | | $ | 3,282,632 | |
The cumulative timing differences primarily consist of post-October capital loss deferrals.
As of June 30, 2019, the Fund had the following net capital loss carryforwards:
| | | | | | |
| | | Capital Loss Carryforward Character | |
| | | Short-Term | | Long-Term | |
| | $274,215 | | $ | — | |
Net capital losses incurred after October 31, and within the taxable year are deemed to arise on the first business day of the Fund’s next taxable year. For the period ended June 30, 2019, the Fund deferred to July 1, 2019 the following net capital losses of:
| | | | | | |
| | | Net Capital Losses (Gains) | |
| | | Short-Term | | Long-Term | |
| | $3,157,846 | | $ | (7,369 | ) |
6. Borrowings
The Fund relies upon an exemptive order granted by the SEC (the “Order”) permitting the establishment and operation of an Interfund Lending Facility (the “Facility”). The Facility allows the Fund to directly lend and borrow money to or from any other fund relying upon the Order at rates beneficial to both the borrowing and lending funds. Advances under the Facility are taken primarily for temporary or emergency purposes, including the meeting of redemption requests that otherwise might require the untimely disposition of securities, and are subject to the Fund’s borrowing restrictions. The Interfund loan rate is determined, as specified in the Order, by averaging the current repurchase agreement rate and the current bank loan rate. The Order was granted to JPMorgan Trust II and may be relied upon by the Fund because the Fund and the series of JPMorgan Trust II are both investment companies in the same “group of investment companies” (as defined in Section 12(d)(1)(G) of the 1940 Act).
The Trust and JPMCB have entered into a financing arrangement. Under this arrangement, JPMCB provides an unsecured, uncommitted credit facility in the aggregate amount of $100 million to certain of the J.P. Morgan Funds, including the Fund. Advances under the arrangement are taken primarily for temporary or emergency purposes, including the meeting of redemption requests that otherwise might require the untimely disposition of securities, and are subject to the Fund’s borrowing restrictions. Interest on borrowings is payable at a rate determined by JPMCB at the time of borrowing. This agreement has been extended until November 4, 2019.
The Fund had no borrowings outstanding from another fund or from the unsecured, uncommitted credit facility during the period ended June 30, 2019.
The Trust, along with certain other trusts (“Borrowers”), have entered into a joint syndicated senior unsecured revolving credit facility totaling $1.5 billion (“Credit Facility”) with various lenders and The Bank of New York Mellon, as administrative agent for the lenders. Effective August 13, 2019, the Fund was added to the Credit Facility. This Credit Facility provides a source of funds to the Borrowers for temporary and emergency purposes, including the meeting of redemption requests that otherwise might require the untimely disposition of securities. Under the terms of the Credit Facility, a borrowing fund must have a minimum of $25,000,000 in adjusted net asset value and not exceed certain adjusted net asset coverage ratios prior to and during the time in which any borrowings are outstanding. If a fund does not comply with the aforementioned requirements, the fund must remediate within three business days with respect to the $25,000,000 minimum adjusted net asset value or within one business day with respect to certain asset coverage ratios or the administrative agent at the request of, or with the consent of, the lenders may terminate the Credit Facility and declare any outstanding borrowings to be due and payable immediately.
Interest associated with any borrowing under the Credit Facility is charged to the borrowing fund at a rate of interest equal to 1.00% plus the greater of the federal funds effective rate or one month LIBOR. The annual commitment fee to maintain the Credit Facility is 0.15% and is incurred on the unused portion of the Credit Facility and is allocated to all participating funds pro rata based on their respective net assets. Effective August 13, 2019, this agreement has been amended and restated for a term of 364 days, unless extended.
| | | | | | | | |
| | | |
| JUNE 30, 2019 | | J.P. MORGAN FUNDS | | | | | 21 | |
NOTES TO FINANCIAL STATEMENTS
AS OF JUNE 30, 2019 (continued)
7. Risks, Concentrations and Indemnifications
In the normal course of business, the Fund enters into contracts that contain a variety of representations which provide general indemnifications. The Fund’s maximum exposure under these arrangements is unknown. The amount of exposure would depend on future claims that may be brought against the Fund. However, based on experience, the Fund expects the risk of loss to be remote.
As of June 30, 2019, the Fund had one individual shareholder and/or affiliated omnibus account, which represented 97.9% of the Fund’s outstanding shares.
The Fund’s investments in ELNs entail varying degrees of risks. The Fund is subject to loss of their full principal amount. In addition, the ELNs are subject to a stated maximum return which may limit the payment at maturity. The fund may also be exposed to additional risks associated with structured notes including: counterparty credit risk related to the issuer’s ability to make payment at maturity; liquidity risk related to a lack of liquid market for these notes, preventing the funds from trading or selling the notes easily; and a greater degree of market risk than other types of debt securities because the investor bears the risk associated with the underlying financial instruments.
8. New Accounting Pronouncements
In August 2018, the Financial Accounting Standards Board (“FASB”) issuedAccounting Standard Update (“ASU”) 2018-13 (“ASU 2018-13”) Fair Value Measurement (Topic 820): Disclosure Framework — Changes to the Disclosure Requirements for Fair Value Measurement, which adds, removes, and modifies certain aspects of the fair value disclosure. ASU 2018-13 amendments are the result of a broader disclosure project, FASB Concepts StatementConceptual Framework for Financial Reporting — Chapter 8: Notes to Financial Statements, to improve the effectiveness of the fair value disclosure requirements. ASU 2018-13 is effective for the fiscal years, and interim periods within those fiscal years, beginning after December 15, 2019; early adoption is permitted. Management has evaluated the implications of these changes and the amendments are included in the financial statements, which had no effect to the Fund’s net assets or results of operation.
In August 2018, the SEC adopted the Disclosure Update and Simplification Rule (the “Rule”). The Rule is part of the SEC’s overall project to improve disclosure effectiveness by amending certain disclosure requirements that have become redundant, duplicative, overlapping, outdated, or superseded in light of other SEC disclosure requirements, U.S. GAAP, or changes in the information environment. The amendments are intended to facilitate the disclosure of information to investors and simplify compliance without significantly altering the total mix of information provided to investors. Management has evaluated the implications of these changes and the amendments are included in the financial statements, which had no effect on the Fund’s net assets or results of operation.
| | | | | | |
| | | |
| 22 | | | | J.P. MORGAN FUNDS | | JUNE 30, 2019 |
REPORT OF INDEPENDENT REGISTERED PUBLIC ACCOUNTING FIRM
Tothe Board of Trustees of JPMorgan Trust IV and Shareholders of JPMorgan Equity Premium Income Fund
Opinion on the Financial Statements
We have audited the accompanying statement of assets and liabilities, including the schedule of portfolio investments, of JPMorgan Equity Premium Income Fund (one of the funds constituting JPMorgan Trust IV, referred to hereafter as the “Fund”) as of June 30, 2019, and the related statements of operations and of changes in net assets, including the related notes, and the financial highlights for the period August 31, 2018 (commencement of operations) through June 30, 2019 (collectively referred to as the “financial statements”). In our opinion, the financial statements present fairly, in all material respects, the financial position of the Fund as of June 30, 2019, and the results of its operations, changes in its net assets and the financial highlights for the period August 31, 2018 (commencement of operations) through June 30, 2019 in conformity with accounting principles generally accepted in the United States of America.
Basis for Opinion
These financial statements are the responsibility of the Fund’s management. Our responsibility is to express an opinion on the Fund’s financial statements based on our audit. We are a public accounting firm registered with the Public Company Accounting Oversight Board (United States) (PCAOB) and are required to be independent with respect to the Fund in accordance with the U.S. federal securities laws and the applicable rules and regulations of the Securities and Exchange Commission and the PCAOB.
We conducted our audit of these financial statements in accordance with the standards of the PCAOB. Those standards require that we plan and perform the audit to obtain reasonable assurance about whether the financial statements are free of material misstatement, whether due to error or fraud.
Our auditincluded performing procedures to assess the risks of material misstatement of the financial statements, whether due to error or fraud, and performing procedures that respond to those risks. Such procedures included examining, on a test basis, evidence regarding the amounts and disclosures in the financial statements. Our auditalso included evaluating the accounting principles used and significant estimates made by management, as well as evaluating the overall presentation of the financial statements. Our procedures included confirmation of securities owned as of June 30, 2019by correspondence with the custodian, transfer agent and brokers; when replies were not received from brokers, we performed other auditing procedures. We believe that our auditprovides a reasonable basis for our opinion.
/s/PricewaterhouseCoopers LLP
New York, New York
August 23, 2019
We have served as the auditor of one or more investment companies in the JPMorgan Funds complex since 1993.
| | | | | | | | |
| | | |
| JUNE 30, 2019 | | J.P. MORGAN FUNDS | | | | | 23 | |
TRUSTEES
(Unaudited)
The Fund’s Statement of Additional Information includes additional information about the Fund’s Trustees and is available, without charge, upon request by calling1-800-480-4111 or on the J.P. Morgan Funds’ website at www.jpmorganfunds.com.
| | | | | | |
Name (Year of Birth); Positions With the Fund(1) | | Principal Occupation During Past 5 Years | | Number of
Funds in Fund
Complex Overseen
by Trustee (2) | | Other Directorships Held During the Past 5 Years |
Independent Trustees | | |
| | | |
| John F. Finn (1947); Trustee of Trust since 2005; Trustee of heritage One Group Mutual Funds since 1998. | | Chairman and Chief Executive Officer, Gardner, Inc. (supply chain management company serving industrial and consumer markets) (serving in various roles 1974-present). | | 134 | | Director, Greif, Inc. (GEF) (industrial package products and services)(2007-present); Trustee, Columbus Association for the Performing Arts (1988-present); Director, Cardinal Health, Inc. (CAH) (1994-2014). |
| | | |
| Stephen P. Fisher (1959); Trustee of Trust since 2018. | | Retired; Chairman and Chief Executive Officer, NYLIFE Distributors LLC (registered broker-dealer) (serving in various roles2008-2013); Chairman, NYLIM Service Company LLC (transfer agent) (2008-2017); New York Life Investment Management LLC (registered investment adviser) (serving in various roles 2005-2017); Chairman, IndexIQ Advisors LLC (registered investment adviser for ETFs)(2014-2017); President, MainStay VP Funds Trust (2007-2017), MainStay DefinedTerm Municipal Opportunities Fund (2011-2017) and MainStay Funds Trust (2007-2017) (registered investment companies). | | 134 | | Advisory Board Member, Scholarship Committee Member and Investment Committee Member, The First Tee of Plainfield(non-profit youth sports organization that provides need-based scholarships) (2014-present); Honors Program Advisory Board Member, The Zicklin School of Business, Baruch College, The City University of New York (2017-present). |
| | | |
| Kathleen M. Gallagher (1958); Trustee of the Trust since 2018. | | Retired; Chief Investment Officer — Benefit Plans, Ford Motor Company (serving in various roles 1985-2016). | | 134 | | Non-Executive Director, Legal & General Investment Management (Holdings) (2018-present); Non-Executive Director, Legal & General Investment Management America (financial services and insurance) (2017-present); Advisory Board Member, OCIO Board of State Street Global Advisors (2017-present); Member, Client Advisory Council, Financial Engines, LLC (registered investment adviser) (2011-2016); Director, Ford Pension Funds Investment Management Ltd.(2007-2016). |
| | | |
| Dr. Matthew Goldstein (1941); Chairman since 2013; Trustee of Trust since 2005; Trustee of heritage J.P. Morgan Funds since 2003. | | Chancellor Emeritus, City University of New York (2015-present); Professor, City University of New York (2013-present); Chancellor, City University of New York (1999-2013); President, Adelphi University (New York) (1998-1999). | | 134 | | Trustee, Museum of Jewish Heritage(2011-present); Trustee, National Museum of Mathematics (present); Chair, Association of College and University Administrators (present). |
| | | |
| Dennis P. Harrington* (1950); Trustee of Trust since 2017. | | Retired; Partner, Deloitte LLP (accounting firm) (serving in various roles 1984-2012). | | 134 | | None |
| | | |
| Frankie D. Hughes (1952); Trustee of Trust since 2008. | | President, Ashland Hughes Properties (property management) (2014-present); President and Chief Investment Officer, Hughes Capital Management, Inc. (fixed income asset management) (1993-2014). | | 134 | | None |
| | | | | | |
| | | |
| 24 | | | | J.P. MORGAN FUNDS | | JUNE 30, 2019 |
| | | | | | |
Name (Year of Birth); Positions With the Fund(1) | | Principal Occupation During Past 5 Years | | Number of
Funds in Fund
Complex Overseen
by Trustee (2) | | Other Directorships Held During the Past 5 Years |
Independent Trustees (continued) | | |
| | | |
Raymond Kanner** (1953); Trustee of Trust since 2017. | | Retired; Managing Director & Chief Investment Officer, IBM Retirement Funds (2007-2016). | | 134 | | Advisory Board Member, Los Angeles Capital (2018-present); Advisory Board Member, State Street Global Advisors OCIO Board (2017-present); Acting Executive Director, Committee on Investment of Employee Benefit Assets (CIEBA) (2016-2017); Advisory Board Member, Betterment for Business (robo advisor) (2016-2017); Advisory Board Member, Blue Star Indexes (index creator) (2013-2017); Director, Emerging Markets Growth Fund (registered investment company) (1997-2016); Member, Russell Index Client Advisory Board (2001-2015). |
| | | |
| Peter C. Marshall (1942); Trustee of Trust since 2005; Trustee of heritage One Group Mutual Funds since 1985. | | Self-employed business consultant
(2002-present). | | 134 | | None |
| | | |
| Mary E. Martinez (1960); Trustee of Trust since 2013. | | Associate, Special Properties, a Christie’s International Real Estate Affiliate(2010-present); Managing Director, Bank of America (Asset Management) (2007-2008); Chief Operating Officer, U.S. Trust Asset Management, U.S. Trust Company (asset management) (2003-2007); President, Excelsior Funds (registered investment companies) (2004-2005). | | 134 | | None |
| | | |
| Marilyn McCoy (1948); Trustee of Trust since 2005; Trustee of heritage One Group Mutual Funds since 1999. | | Vice President of Administration and Planning, Northwestern University (1985-present). | | 134 | | None |
| | | |
| Mitchell M. Merin (1953); Trustee of Trust since 2013. | | Retired; President and Chief Operating Officer, Morgan Stanley Investment Management, Member Morgan Stanley & Co. Management Committee (serving in various roles 1981-2006). | | 134 | | Director, Sun Life Financial (SLF) (financial services and insurance) (2007-2013). |
| | | |
| Dr. Robert A. Oden, Jr. (1946); Trustee of Trust since 2005; Trustee of heritage One Group Mutual Funds since 1997. | | Retired; President, Carleton College(2002-2010); President, Kenyon College(1995-2002). | | 134 | | Trustee, Trout Unlimited(2017-present); Trustee, American Museum of Fly Fishing (2013-present); Vice Chair, Dartmouth-Hitchcock Medical Center (2011-present); Trustee, American University in Cairo (1999-2014). |
| | | |
| Marian U. Pardo*** (1946); Trustee of Trust since 2013. | | Managing Director and Founder, Virtual Capital Management LLC (investment consulting)(2007-present); Managing Director, Credit Suisse Asset Management (portfolio manager)(2003-2006). | | 134 | | President and Member, Board of Governors, Columbus Citizens Foundation (not-for-profit supporting philanthropic and cultural programs) (2006-present). |
| | | | | | | | |
| | | |
| JUNE 30, 2019 | | J.P. MORGAN FUNDS | | | | | 25 | |
TRUSTEES
(Unaudited) (continued)
| (1) | The Trustees serve for an indefinite term, subject to the Trust’s current retirement policy, which is age 78 for all Trustees. |
| (2) | A Fund Complex means two or more registered investment companies that hold themselves out to investors as related companies for purposes of investment and investor services or have a common investment adviser or have an investment adviser that is an affiliated person of the investment adviser of any of the other registered investment companies. The J.P. Morgan Funds Complex for which the Board of Trustees serves currently includes eleven registered investment companies (134 funds). |
| * | Two family members of Mr. Harrington are partner and managing director, respectively, of the Fund’s independent registered public accounting firm. Such firm has represented to the Board that those family members are not involved in the audit of the Fund’s financial statements and do not provide other services to the Fund. The Board has concluded that such association does not interfere with Mr. Harrington’s exercise of independent judgment as an Independent Trustee. |
| ** | A family member of Mr. Kanner is employed by JPMorgan Chase Bank, which is affiliated with JPMIM and JPMDS. In that capacity, this employee provides services to various JPMorgan affiliates including JPMIM and JPMDS and for which JPMIM and JPMDS bear some portion of the expense thereof. |
| *** | In connection with prior employment with JPMorgan Chase, Ms. Pardo was the recipient ofnon-qualified pension plan payments from JPMorgan Chase in the amount of approximately $2,055 per month, which she irrevocably waived effective January 1, 2013, and deferred compensation payments from JPMorgan Chase in the amount of approximately $7,294 per year, which ended in January 2013. In addition, Ms. Pardo receives payments from a fully-funded qualified plan, which is not an obligation of JPMorgan Chase. |
The contact address for each of the Trustees is 277 Park Avenue, New York, NY 10172.
| | | | | | |
| | | |
| 26 | | | | J.P. MORGAN FUNDS | | JUNE 30, 2019 |
OFFICERS
(Unaudited)
| | |
Name (Year of Birth), Positions Held with the Trust (Since) | | Principal Occupations During Past 5 Years |
| |
Brian S. Shlissel (1964),
President and Principal Executive Officer (2016) | | Managing Director and Chief Administrative Officer for J.P. Morgan pooled vehicles, J.P. Morgan Investment Management Inc. (formerly JPMorgan Funds Management, Inc.) (from 2014 to present); Managing Director and Head of Mutual Fund Services, Allianz Global Investors; President and Chief Executive Officer, Allianz Global Investors Mutual Funds and PIMCO Closed-End Funds (from 1999 to 2014). |
| |
Timothy J. Clemens (1975), Treasurer and Principal Financial Officer (2018)* | | Executive Director, J.P. Morgan Investment Management Inc. (formerly JPMorgan Funds Management, Inc.) since February 2016; Vice President, JPMorgan Funds Management, Inc. from October 2013 to January 2016. |
| |
Gregory S. Samuels (1980),
Secretary (2019)* (formerly Assistant Secretary since 2010) | | Executive Director and Assistant General Counsel, JPMorgan Chase since 2014; formerly Vice President and Assistant General Counsel, JPMorgan Chase from 2010 to February 2014. |
| |
Stephen M. Ungerman (1953),
Chief Compliance Officer (2005) | | Managing Director, JPMorgan Chase & Co.; Mr. Ungerman has been with JPMorgan Chase & Co. since 2000. |
| |
Elizabeth A. Davin (1964), Assistant Secretary (2005)** | | Executive Director and Assistant General Counsel, JPMorgan Chase since February 2012; formerly Vice President and Assistant General Counsel, JPMorgan Chase from 2005 to February 2012; Senior Counsel, JPMorgan Chase (formerly Bank One Corporation) from 2004 to 2005. |
| |
Jessica K. Ditullio (1962),
Assistant Secretary (2005)** | | Executive Director and Assistant General Counsel, JPMorgan Chase. Ms. Ditullio has been with JPMorgan Chase (formerly Bank One Corporation) since 1990. |
| |
Anthony Geron (1971),
Assistant Secretary (2018)* | | Vice President and Assistant General Counsel, JPMorgan Chase since September 2018; Lead Director and Counsel, AXA Equitable Life Insurance Company from 2015 to 2018 and Senior Director and Counsel, AXA Equitable Life Insurance Company from 2014 to 2015; Associate, Willkie Farr & Gallagher (law firm) from 2007 to 2014. |
| |
Carmine Lekstutis (1980),
Assistant Secretary (2011)* | | Executive Director and Assistant General Counsel, JPMorgan Chase since February 2015; formerly Vice President and Assistant General Counsel, JPMorgan Chase from 2011 to February 2015. |
| |
Keri E. Riemer (1976),
Assistant Secretary (2019)* | | Executive Director and Assistant General Counsel, JPMorgan Chase since February 2019; Counsel, Seward & Kissel LLP (2016-2019); Associate, Seward & Kissel LLP (2011-2016). |
| |
Zachary E. Vonnegut-Gabovitch (1986), Assistant Secretary (2017)* | | Vice President and Assistant General Counsel, JPMorgan Chase since September 2016; Associate, Morgan, Lewis & Bockius (law firm) from 2012 to 2016. |
| |
Michael M. D’Ambrosio (1969),
Assistant Treasurer (2012) | | Managing Director, J.P. Morgan Investment Management Inc. (formerly JPMorgan Funds Management, Inc.) since May 2014; formerly Executive Director, JPMorgan Funds Management, Inc. from 2012 to May 2014. |
| |
Aleksandr Fleytekh (1972), Assistant Treasurer (2019)* | | Vice President, J.P. Morgan Investment Management Inc. (formerly JPMorgan Funds Management, Inc.) since February 2012. |
| |
Shannon Gaines (1977),
Assistant Treasurer (2018)** | | Vice President, J.P. Morgan Investment Management Inc. (formerly JPMorgan Funds Management, Inc.) since January 2014. |
| |
Jeffrey D. House (1972), Assistant Treasurer (2017)** | | Vice President, J.P. Morgan Investment Management Inc. (formerly JPMorgan Funds Management, Inc.) since July 2006. |
| |
Lauren A. Paino (1973), Assistant Treasurer (2014)* | | Executive Director, J.P. Morgan Investment Management Inc. (formerly JPMorgan Funds Management, Inc.) since August 2013. |
| |
Joseph Parascondola (1963),
Assistant Treasurer (2011)* | | Vice President, J.P. Morgan Investment Management Inc. (formerly JPMorgan Funds Management, Inc.) since August 2006. |
| |
Gillian I. Sands (1969),
Assistant Treasurer (2012)* | | Vice President, J.P. Morgan Investment Management Inc. (formerly JPMorgan Funds Management, Inc.) since September 2012. |
The contact address for each of the officers, unless otherwise noted, is 277 Park Avenue, New York, NY 10172.
| * | The contact address for the officer is 4 New York Plaza, New York, NY 10004. |
| ** | The contact address for the officer is 1111 Polaris Parkway, Columbus, OH 43240. |
| | | | | | | | |
| | | |
| JUNE 30, 2019 | | J.P. MORGAN FUNDS | | | | | 27 | |
SCHEDULE OF SHAREHOLDER EXPENSES
(Unaudited)
Hypothetical $1,000 Investment
As a shareholder of the Fund, you incur two types of costs: (1) transaction costs, including sales charges (loads) on purchase payments and (2) ongoing costs, including investment advisory fees, administration fees, distribution fees and other Fund expenses. The examples below are intended to help you understand your ongoing costs (in dollars) of investing in the Fund (not including expenses of the Underlying Funds) and to compare these ongoing costs with the ongoing costs of investing in other mutual funds. The examples assume that you had a $1,000 investment in each Class at the beginning of the reporting period, January 1, 2019, and continued to hold your shares at the end of the reporting period, June 30, 2019.
Actual Expenses
For each Class of the Fund in the table below, the first line provides information about actual account values and actual expenses. You may use the information in this line, together with the amount you invested, to estimate the expenses that you paid over the period. Simply divide your account value by $1,000 (for example, an $8,600 account value divided by $1,000 = 8.6), then multiply the result by the number in the first line of each Class under the heading entitled “Expenses Paid During the Period” to estimate the expenses you paid on your account during this period.
Hypothetical Example for Comparison Purposes
The second line of each Class in the table below provides information about hypothetical account values and hypothetical expenses based on the Class’ actual expense ratio and an assumed rate of return of 5% per year before expenses, which is not the Class’ actual return. The hypothetical account values and expenses may not be used to estimate the actual ending account balance or expenses you paid for the period. You may use this information to compare the ongoing costs of investing in the Class of the Fund and other funds. To do so, compare this 5% hypothetical example with the 5% hypothetical examples that appear in the shareholder reports of the other funds. Please note that the expenses shown in the table are meant to highlight your ongoing costs only and do not reflect any transaction costs, such as sales charges (loads) or redemption fees, and expenses of the Underlying Funds. Therefore, the second line for each Class in the table is useful in comparing ongoing costs only, and will not help you determine the relative total costs of owning different funds. In addition, if these transaction costs were included, your costs would have been higher. The examples also assume all dividends and distributions have been reinvested.
| | | | | | | | | | | | | | | | |
| | | Beginning
Account Value
January 1, 2019 | | | Ending
Account Value
June 30, 2019 | | | Expenses
Paid During
the Period* | | | Annualized
Expense
Ratio | |
JPMorgan Equity Premium Income Fund | | | | | | | | | | | | | | | | |
Class A | | | | | | | | | | | | | | | | |
Actual | | $ | 1,000.00 | | | $ | 1,139.90 | | | $ | 4.51 | | | | 0.85 | % |
Hypothetical | | | 1,000.00 | | | | 1,020.58 | | | | 4.26 | | | | 0.85 | |
Class C | | | | | | | | | | | | | | | | |
Actual | | | 1,000.00 | | | | 1,136.90 | | | | 7.15 | | | | 1.35 | |
Hypothetical | | | 1,000.00 | | | | 1,018.10 | | | | 6.76 | | | | 1.35 | |
Class I | | | | | | | | | | | | | | | | |
Actual | | | 1,000.00 | | | | 1,141.10 | | | | 3.19 | | | | 0.60 | |
Hypothetical | | | 1,000.00 | | | | 1,021.82 | | | | 3.01 | | | | 0.60 | |
Class R5 | | | | | | | | | | | | | | | | |
Actual | | | 1,000.00 | | | | 1,142.00 | | | | 2.39 | | | | 0.45 | |
Hypothetical | | | 1,000.00 | | | | 1,022.56 | | | | 2.26 | | | | 0.45 | |
Class R6 | | | | | | | | | | | | | | | | |
Actual | | | 1,000.00 | | | | 1,142.50 | | | | 1.86 | | | | 0.35 | |
Hypothetical | | | 1,000.00 | | | | 1,023.06 | | | | 1.76 | | | | 0.35 | |
| * | Expenses are equal to each Class’ respective annualized expense ratio, multiplied by the average account value over the period, multiplied by 181/365 (to reflect the one-half year period). |
| | | | | | |
| | | |
| 28 | | | | J.P. MORGAN FUNDS | | JUNE 30, 2019 |
TAX LETTER
(Unaudited)
Certain tax information for the J.P. Morgan Funds is required to be provided to shareholders based upon the Fund’s income and distributions for the taxable year ended June 30, 2019. The information and distributions reported in this letter may differ from the information and taxable distributions reported to the shareholders for the calendar year ending December 31, 2019. The information necessary to complete your income tax returns for the calendar year ending December 31, 2019 will be provided under separate cover.
Dividends Received Deduction (DRD)
The Fund had 20.44% or maximum allowable percentage, of ordinary income distributions eligible for the dividends received deduction for corporate rate shareholders for the fiscal year ended June 30, 2019.
Qualified Dividend Income (QDI)
The Fund had $759,074, or maximum allowable amount, of ordinary income distributions treated as qualified dividends for the fiscal year ended June 30, 2019.
| | | | | | | | |
| | | |
| JUNE 30, 2019 | | J.P. MORGAN FUNDS | | | | | 29 | |

Rev. January 2011
| | |
| | |
| FACTS | | WHAT DOES J.P. MORGAN FUNDS DO WITH YOUR PERSONAL INFORMATION? |
| | |
| Why? | | Financial companies choose how they share your personal information. Federal law gives consumers the right to limit some but not all sharing. Federal law also requires us to tell you how we collect, share, and protect your personal information. Please read this notice carefully to understand what we do. |
| | |
| What? | | The types of personal information we collect and share depend on the product or service you have with us. This information can include: ◾ Social Security number and account balances ◾ transaction history and account transactions ◾ checking account information and wire transfer instructions When you areno longer our customer, we continue to share your information as described in this notice. |
| | |
| How? | | All financial companies need to share customers’ personal information to run their everyday business. In the section below, we list the reasons financial companies can share their customers’ personal information; the reasons J.P. Morgan Funds chooses to share; and whether you can limit this sharing. |
| | | | |
| | | |
| Reasons we can share your personal information | | Does J.P. Morgan
Funds share? | | Can you limit this
sharing? |
For our everyday business purposes — such as to process your transactions, maintain your account(s), respond to court orders and legal investigations, or report to credit bureaus | | Yes | | No |
For marketing purposes — to offer our products and services to you | | Yes | | No |
| For joint marketing with other financial companies | | No | | We don’t share |
For our affiliates’ everyday business purposes — information about your transactions and experiences | | No | | We don’t share |
For our affiliates’ everyday business purposes — information about your creditworthiness | | No | | We don’t share |
| For nonaffiliates to market to you | | No | | We don’t share |
| | |
| | |
| Questions? | | Call1-800-480-4111 or go to www.jpmorganfunds.com |

| | |
| |
| Who we are |
| Who is providing this notice? | | J.P. Morgan Funds |
| | |
| |
| What we do |
| How does J.P. Morgan Funds protect my personal information? | | To protect your personal information from unauthorized access and use, we use security measures that comply with federal law. These measures include computer safeguards and secured files and buildings. We authorize our employees to access your information only when they need it to do their work and we require companies that work for us to protect your information. |
How does J.P. Morgan Funds collect my personal information? | | We collect your personal information, for example, when you: ◾ open an account or provide contact information ◾ give us your account information or pay us by check ◾ make a wire transfer We also collect your personal information from others, such as credit bureaus, affiliates and other companies. |
| Why can’t I limit all sharing? | | Federal law gives you the right to limit only ◾ sharing for affiliates’ everyday business purposes – information about your creditworthiness ◾ affiliates from using your information to market to you ◾ sharing for nonaffiliates to market to you State laws and individual companies may give you additional rights to limit sharing. |
| | |
| |
| Definitions |
| Affiliates | | Companies related by common ownership or control. They can be financial and nonfinancial companies. ◾ J.P. Morgan Funds does not share with our affiliates. |
| Nonaffiliates | | Companies not related by common ownership or control. They can be financial and nonfinancial companies. ◾ J.P. Morgan Funds does not share with nonaffiliates so they can market to you. |
| Joint Marketing | | A formal agreement between nonaffiliated financial companies that together market financial products or services to you. ◾ J.P. Morgan Funds doesn’t jointly market. |

J.P. Morgan Asset Management is the brand name for the asset management business of JPMorgan Chase & Co. and its affiliates worldwide.
| | | | |
| | © JPMorgan Chase & Co., 2019. All rights reserved. June 2019. | | AN-EPI-619 |
Annual Report
J.P. Morgan Funds
June 30, 2019
JPMorgan SmartSpendingSM 2050 Fund
Beginning on January 1, 2021, as permitted by regulations adopted by the Securities and Exchange Commission, paper copies of the Fund’s annual and semi-annual shareholder reports will no longer be sent by mail, unless you specifically request paper copies of the reports. Instead, the reports will be made available on the Fund’s websitewww.jpmorganfunds.com and you will be notified by mail each time a report is posted and provided with a website to access the report. If you already elected to receive shareholder reports electronically, you will not be affected by this change and you need not take any action.
You may elect to receive shareholder reports and other communications from the Fund electronically anytime by contacting your financial intermediary (such as a broker dealer, bank, or retirement plan) or, if you are a direct investor, by going towww.jpmorganfunds.com/edelivery.
You may elect to receive paper copies of all future reports free of charge. Contact your financial intermediary or, if you invest directly with the Fund, email us atfunds.website.support@jpmorganfunds.com or call 1-800-480-4111. Your election to receive paper reports will apply to all funds held within your account(s).

CONTENTS
Investments in the Fund are not deposits or obligations of, or guaranteed or endorsed by, any bank and are not insured or guaranteed by the FDIC, the Federal Reserve Board or any other government agency. You could lose money if you sell when the Fund’s share price is lower than when you invested.
Past performance is no guarantee of future performance. The general market views expressed in this report are opinions based on market and other conditions through the end of the reporting period and are subject to change without notice. These views are not intended to predict the future performance of the Fund or the securities markets. References to specific securities and their issuers are for illustrative purposes only and are not intended to be, and should not be interpreted as, recommendations to purchase or sell such securities. Such views are not meant as investment advice and may not be relied on as an indication of trading intent on behalf of the Fund.
Prospective investors should refer to the Fund’s prospectuses for a discussion of the Fund’s investment objective, strategies and risks. Call J.P. Morgan Funds Service Center at1-800-480-4111 for a prospectus containing more complete information about the Fund, including management fees and other expenses. Please read it carefully before investing.
LETTER TO SHAREHOLDERS
July 31, 2019 (Unaudited)
Dear Shareholders,
Even as the pace of growth slowed, the global economic expansion continued and financial markets largely provided positive returns for the twelve months ended June 30, 2019. Central banks in the U.S. and elsewhere moved to support continued economic expansion in 2019, and low interest rates, growth in corporate profits and general investor optimism added further support to both equity and bond markets.
| | |
 | | “We believe that a well-diversified portfolio and a patient outlook may best allow investors to benefit from market opportunities presented by the current economic backdrop.”
— Andrea L. Lisher |
The U.S. economy generally outpaced other developed market nations throughout the twelve month reporting period and the U.S. expansion became the longest on record by the end of June 2019. However, growth in U.S. gross domestic product (GDP) slowed significantly to 2.1% in the second quarter of 2019 from 3.1% in the first quarter. At the same time, the U.S. unemployment rate remained below 4% for all but one month of the reporting period.
After reaching record highs in August and September 2018, U.S. equity prices tumbled sharply in December amid investor concerns about slowing global growth, unresolved U.S.-China trade tensions and expectations for further interest rate increases by the U.S. Federal Reserve (the “Fed”). For the month of December, the S&P 500 Index fell by 9.03%.
By the end of 2018, the Fed indicated it would enact fewer-than-expected interest rate increases in 2019. In January 2019, financial markets began to stabilize and started a rebound that would push equity prices back to record highs at the end of April and again by mid-June. For the twelve month reporting period, the S&P 500 returned 10.42%.
In certain other developed economies, economic growth remained sluggish. The 19-nation euro area experienced a decline in GDP growth from 1.2% in the first quarter of 2019 to 1.1% in the second quarter of 2019. Notably, manufacturing data weakened in 2019. However, unemployment continued to fall throughout the reporting period and the 7.5% euro area jobless rate by the end June 2019 was the lowest since the 2008-09 financial crisis.
In response to slowing economic expansion, the potential for slowing job growth and declining consumer confidence, European Central Bank President Mario Draghi said the bank would loosen monetary policy in the absence of improvement in the economy of the European Union. Meanwhile, the Bank of England held interest rates steady as U.K. GDP growth rebounded to 1.8% in the first quarter of 2019 from 1.4% in the final quarter of 2018. Political uncertainty surrounding negotiations for U.K.’s exit from the European Union continued throughout the reporting period and the inability of Theresa May to win Parliamentary support for her proposed Brexit plan preceded her resignation as prime minister in June. For the twelve month reporting period, the MSCI EAFE Index returned 1.60%.
Following signs of slowing growth, China unveiled a range of policies intended to stimulate domestic demand, including tax cuts, infrastructure spending and measures to support bank lending. However, slowing global demand and an increase in U.S. tariffs on Chinese-made goods continued to weigh on the economy of China as well certain of its trading partners across Asia. During the second half of the reporting period, emerging markets largely benefitted investor appetite for higher yielding assets. While the MSCI Emerging Markets Index returned 1.61% for reporting period, the Bloomberg Barclays Emerging Markets Aggregate Index returned 10.95%.
Subsequent to the end of the reporting period, the Fed cut its benchmark interest rate for the first time in eleven years. The central bank cited slowing global growth and “muted inflation pressures” in its accompanying statement.
We believe that a well-diversified portfolio and a patient outlook may best allow investors to benefit from market opportunities presented by the current economic backdrop. We look forward to managing your investment needs for years to come. Thank you for entrusting J.P. Morgan Asset Management to manage assets on your behalf. Should you have any questions, please visit www.jpmorganfunds.com or contact the J.P. Morgan Funds Service Center at 1-800-480-4111.
Sincerely yours,

Andrea L. Lisher
Head of Americas, J.P. Morgan Global Funds
J.P. Morgan Asset Management
| | | | | | | | |
| | | |
| JUNE 30, 2019 | | J.P. MORGAN FUNDS | | | | | 1 | |
JPMorgan SmartSpendingSM 2050 Fund
FUND COMMENTARY
TWELVE MONTHS ENDED JUNE 30, 2019 (Unaudited)
| | | | |
| REPORTING PERIOD RETURN: | |
| Fund (Class I Shares)* | | | 5.68% | |
| Bloomberg Barclays U.S. Aggregate Index | | | 7.87% | |
| MSCI World Index (net of foreign withholding taxes) | | | 6.33% | |
| JPMorgan SmartSpending 2050 Fund Composite Benchmark | | | 7.64% | |
| |
| Net Assets as of 6/30/2019 | | $ | 30,549,011 | |
INVESTMENT OBJECTIVE**
The JPMorgan SmartSpending 2050 Fund (the “Fund”) seeks to provide total return consisting of current income and capital appreciation.
HOW DID THE MARKET PERFORM?
Global equity prices rebounded from two sharp sell-offs and U.S. equity largely outperformed both developed and emerging markets equity during the reporting period. Bond markets also generally provided positive returns, particularly in emerging markets and U.S. corporate debt.
Growth in corporate profits, low interest rates and the continued growth in the global economy bolstered financial markets throughout the reporting period. However, investor concerns about the direction of U.S. interest rates, rising trade tensions and signs of slowing economic activity in China and Europe helped fuel significant market downturns in late 2018 and again in May 2019.
Leading equity indexes plummeted in the second half of December 2018 amid slowing global economic growth, unresolved U.S.-China trade tensions and investor concerns over rising interest rates.
However, financial market volatility stabilized in January 2019 and U.S. equity prices rebounded over the next few months and returned to record high levels by April 2019. Prices for emerging markets debt and high yield bonds (also known as junk bonds) benefitted from investor demand for higher yields in fixed income markets. Global equity markets slumped in May 2019 and leading indexes in the U.S. and Asian developed markets as well as emerging markets dropping by more than 6%. However, global equity prices rebounded again in June 2019.
Within U.S. equity, large cap and mid cap stocks generally outperformed small cap stocks and growth stocks continued to outperform value stocks. Within fixed income, emerging markets debt largely outperformed both U.S. investment grade debt and high yield bonds (also known as junk bonds) for the reporting period.
WHAT WERE THE MAIN DRIVERS OF THE PORTFOLIO’S PERFORMANCE?
The Fund’s Class I Shares underperformed the Bloomberg Barclays U.S. Aggregate Index (the “Benchmark”) and the MSCI World Index (net of foreign withholding taxes) for the twelve months ended June 30, 2019. The Fund also underperformed the JPMorgan SmartSpending 2050 Fund Composite Benchmark (the “Composite Benchmark”), 40% MSCI World Index (net of foreign withholding taxes) and 60% Bloomberg Barclays U.S. Aggregate Index, over the same period.
Relative to the Benchmark, which does not include equity securities, the Fund’s allocation to global equity markets was a leading detractor from performance, mostly due to the underperformance of global equity relative to U.S. fixed income in the fourth quarter of 2018.
Relative to the MSCI World Index, which does not included debt securities, the Fund’s strategic allocation to fixed income securities and its tactical underweight position in global equity detracted from performance.
Relative to the Composite Benchmark, the Fund’s reduced exposure to global equity and its increased allocation to short-duration fixed income detracted from relative performance. Generally, bonds with shorter duration will experience a smaller increase in price when interest rates fall versus bonds with longer duration. The Fund’s move to an underweight position in global equity in the fourth quarter of 2018 helped relative performance.
HOW WAS THE PORTFOLIO POSITIONED?
The Fund invested in underlying J.P. Morgan Funds and third party exchange-traded funds to implement the Fund managers’ asset allocation decisions. The Fund’s portfolio managers used futures contracts in general to implement tactical asset allocations. The Fund’s tactical positioning resulted in an underweight exposure to global equity and increased exposure to allocation to high yield bonds and short duration fixed income. The Fund’s portfolio managers used a systematic screening and selection process to choose the underlying funds in their construction of the Fund’s portfolio. Relative to its Composite Benchmark, the Fund invested in a broader range of asset classes.
| | | | | | |
| | | |
| 2 | | | | J.P. MORGAN FUNDS | | JUNE 30, 2019 |
| | | | |
PORTFOLIO COMPOSITION BY ASSET CLASS*** | |
| Fixed Income | | | 75.3 | % |
| U.S. Equity | | | 14.2 | |
| International Equity | | | 6.2 | |
| Alternative Assets | | | 1.7 | |
| U.S. Treasury Obligations | | | 1.3 | |
| Short-Term Investments | | | 1.3 | |
| * | | The return shown is based on net asset values calculated for shareholder transactions and may differ from the return shown in the financial highlights, which reflects adjustments made to the net asset values in accordance with accounting principles generally accepted in the United States of America. |
| ** | | The adviser seeks to achieve the Fund’s objective. There can be no guarantee it will be achieved. |
| *** | | Percentages indicated are based on total investments as of June 30, 2019. The Fund’s portfolio composition is subject to change. |
| | | | | | | | |
| | | |
| JUNE 30, 2019 | | J.P. MORGAN FUNDS | | | | | 3 | |
JPMorgan SmartSpendingSM 2050 Fund
FUND COMMENTARY
TWELVE MONTHS ENDED JUNE 30, 2019 (Unaudited) (continued)
| | | | | | | | | | |
AVERAGE ANNUAL TOTAL RETURNSAS OF JUNE 30, 2019 | |
| | | |
| | | INCEPTION DATE OF
CLASS | | 1 YEAR | | | SINCE
INCEPTION | |
CLASS A SHARES | | December 30, 2016 | | | | | | | | |
With Sales Charge* | | | | | 0.69 | % | | | 3.92 | % |
Without Sales Charge | | | | | 5.45 | | | | 5.86 | |
CLASS I SHARES | | December 30, 2016 | | | 5.68 | | | | 6.12 | |
CLASS R2 SHARES | | December 30, 2016 | | | 5.05 | | | | 5.43 | |
CLASS R3 SHARES | | December 30, 2016 | | | 5.29 | | | | 5.70 | |
CLASS R4 SHARES | | December 30, 2016 | | | 5.53 | | | | 5.96 | |
CLASS R5 SHARES | | December 30, 2016 | | | 5.68 | | | | 6.11 | |
CLASS R6 SHARES | | December 30, 2016 | | | 5.84 | | | | 6.23 | |
| * | | Sales Charge for Class A Shares is 4.50%. |
LIFE OF FUND PERFORMANCE(12/30/16 to 6/30/19)
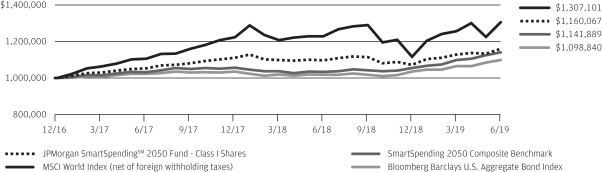
The performance quoted is past performance and is not a guarantee of future results. Mutual funds are subject to certain market risks. Investment returns and principal value of an investment will fluctuate so that an investor’s shares, when redeemed, may be worth more or less than their original cost. Current performance may be higher or lower than the performance data shown. For up-to-date month-end performance information please call 1-800-480-4111.
The Fund commenced operations on December 30, 2016.
The graph illustrates comparative performance for $1,000,000 invested in Class I Shares of the JPMorgan SmartSpendingSM 2050 Fund, the MSCI World Index (net of foreign withholding taxes), the Bloomberg Barclays U.S. Aggregate Bond Index and the SmartSpending 2050 Composite Benchmark from December 30, 2016 to June 30, 2019. The performance of the Fund may reflect the waiver of the Fund’s fees and reimbursement of expenses for certain periods since the inception date. Without these waivers and reimbursements, performance would have been lower. Also, performance shown in this section does not reflect the deduction of taxes that a shareholder would pay on Fund distributions or redemptions of Fund shares. The Bloomberg Barclays U.S. Aggregate Bond Index is an unmanaged index representingSEC-registered taxable and dollar denominated securities. It covers the U.S. investment grade
fixed rate bond market, with index components for government and corporate securities, mortgage pass-through, and asset-backed securities. The MSCI World Index (net of foreign withholding taxes) is a broad measure of the performance of developed countries’ equity markets. The JPMorgan SmartSpending 2050 Composite Benchmark is a composite benchmark of unmanaged indexes that includes 40% MSCI World Index (net of foreign withholding taxes) and 60% Bloomberg Barclays U.S. Aggregate Bond Index. Investors cannot invest directly in an index.
Class I Shares have a $1,000,000 minimum initial investment.
Fund performance may reflect the waiver of the Fund’s fees and reimbursement of expenses for certain periods. Without these waivers and reimbursements, performance would have been lower. Also, performance shown in this section does not reflect the deduction of taxes that a shareholder would pay on Fund distributions or redemptions of Fund shares.
The returns shown are based on net asset values calculated for shareholder transactions and may differ from the returns shown in the financial highlights, which reflect adjustments made to the net asset values in accordance with accounting principles generally accepted in the United States of America.
| | | | | | |
| | | |
| 4 | | | | J.P. MORGAN FUNDS | | JUNE 30, 2019 |
JPMorgan SmartSpendingSM 2050 Fund
SCHEDULE OF PORTFOLIO INVESTMENTS
AS OF JUNE 30, 2019
| | | | | | | | |
| INVESTMENTS | |
SHARES | | | VALUE($) | |
Investment Companies — 78.6% | |
|
Fixed Income — 62.4% | |
| | |
JPMorgan Core Bond Fund Class R6 Shares (a) | | | 533,425 | | | | 6,289,086 | |
| | |
JPMorgan Core Plus Bond Fund Class R6 Shares (a) | | | 504,606 | | | | 4,243,740 | |
| | |
JPMorgan Emerging Markets Strategic Debt Fund Class R6 Shares (a) | | | 124,236 | | | | 1,019,980 | |
| | |
JPMorgan High Yield Fund Class R6 Shares (a) | | | 382,859 | | | | 2,768,070 | |
| | |
JPMorgan Income Fund Class R6 Shares (a) | | | 128,545 | | | | 1,227,608 | |
| | |
JPMorgan Managed Income Fund Class L Shares (a) | | | 350,026 | | | | 3,517,759 | |
| | | | | | | | |
| | |
Total Fixed Income | | | | | | | 19,066,243 | |
| | | | | | | | |
|
International Equity — 3.5% | |
| | |
JPMorgan International Research Enhanced Equity Fund Class R6 Shares (a) | | | 60,367 | | | | 1,069,700 | |
| | | | | | | | |
|
U.S. Equity — 12.7% | |
| | |
JPMorgan Equity Index Fund Class R6 Shares (a) | | | 40,314 | | | | 1,813,340 | |
| | |
JPMorgan Growth Advantage Fund Class R6 Shares * (a) | | | 24,838 | | | | 574,999 | |
| | |
JPMorgan U.S. Equity Fund Class R6 Shares (a) | | | 58,761 | | | | 938,414 | |
| | |
JPMorgan Value Advantage Fund Class R6 Shares (a) | | | 15,291 | | | | 545,423 | |
| | | | | | | | |
| |
Total U.S. Equity | | | | 3,872,176 | |
| | | | | | | | |
| |
Total Investment Companies
(Cost $23,022,433) | | | | 24,008,119 | |
| | | | | |
Exchange Traded Funds — 19.0% | | | | | | | | |
|
Alternative Assets — 1.7% | |
| | |
Schwab U.S. REIT ETF | | | 11,922 | | | | 529,814 | |
| | | | | | | | |
|
Fixed Income — 13.0% | |
| | |
iShares Core U.S. Aggregate Bond ETF | | | 9,346 | | | | 1,040,677 | |
| | |
iShares TIPS Bond ETF | | | 25,452 | | | | 2,939,451 | |
| | | | | | | | |
| |
Total Fixed Income | | | | 3,980,128 | |
| | | | | | | | |
| | |
International Equity — 2.7% | | | | | | | | |
| | |
iShares Core MSCI EAFE ETF | | | 6,922 | | | | 425,011 | |
| | |
iShares Core MSCI Emerging Markets ETF | | | 7,657 | | | | 393,876 | |
| | | | | | | | |
| |
Total International Equity | | | | 818,887 | |
| | | | | | | | |
| | |
U.S. Equity — 1.6% | | | | | | | | |
| | |
iShares Russell 2000 ETF | | | 633 | | | | 98,431 | |
| | |
iShares Russell Mid-Cap ETF | | | 6,754 | | | | 377,346 | |
| | | | | | | | |
| |
Total U.S. Equity | | | | 475,777 | |
| | | | | | | | |
| |
Total Exchange Traded Funds
(Cost $5,499,188) | | | | 5,804,606 | |
| | | | | |
| | | | | | | | |
| INVESTMENTS | | PRINCIPAL
AMOUNT($) | | | VALUE($) | |
U.S. Treasury Obligations — 1.3% | |
| | |
U.S. Treasury Notes 2.00%, 1/31/2020 (b)
(Cost $403,712) | | | 405,000 | | | | 404,842 | |
| | | | | | | | |
| | |
| | | SHARES | | | | |
Short-term Investments — 1.3% | | | | | | | | |
| | |
Investment Companies — 1.3% | | | | | | | | |
| | |
JPMorgan U.S. Government Money Market Fund Class IM Shares, 2.31% (a) (c)
(Cost $393,354) | | | 393,354 | | | | 393,354 | |
| | | | | | | | |
Total Investments — 100.2%
(Cost $29,318,687) | | | | 30,610,921 | |
Liabilities in Excess of
Other Assets — (0.2)% | | | | (61,910 | ) |
| | | | | | | | |
NET ASSETS — 100.0% | | | | 30,549,011 | |
| | | | | | | | |
Percentages indicated are based on net assets.
Abbreviations
| | |
| EAFE | | Europe, Australasia and Far East |
| ETF | | Exchange Traded Fund |
| REIT | | Real Estate Investment Trust |
| TIPS | | Treasury Inflation Protected Security |
| |
| (a) | | Investment in an affiliated fund, which is registered under the Investment Company Act of 1940, as amended, and is advised by J.P. Morgan Investment Management Inc. |
| (b) | | All or a portion of this security is deposited with the broker as initial margin for futures contracts. |
| (c) | | The rate shown is the current yield as of June 30, 2019. |
| * | | Non-income producing security. |
Detailed information about investment portfolios of the underlying funds can be found in shareholder reports filed with the Securities and Exchange Commission (SEC) by each such underlying fundsemi-annually on Form N-CSR and in portfolio holdings filed quarterly on Form N-PORT, and are available for download from both the SEC’s as well as each respective underlying fund’s website. Detailed information about underlying J.P. Morgan Funds can also be found at www.jpmorganfunds.com or by calling1-800-480-4111.
SEE NOTES TO FINANCIAL STATEMENTS.
| | | | | | | | |
| | | |
| JUNE 30, 2019 | | J.P. MORGAN FUNDS | | | | | 5 | |
JPMorgan SmartSpendingSM 2050 Fund
SCHEDULE OF PORTFOLIO INVESTMENTS
AS OF JUNE 30, 2019 (continued)
| | | | | | | | | | | | | | | | | | | | |
| Futures contracts outstanding as of June 30, 2019: | |
| DESCRIPTION | | NUMBER OF
CONTRACTS | | | EXPIRATION
DATE | | | TRADING
CURRENCY | | | NOTIONAL
AMOUNT ($) | | | VALUE AND
UNREALIZED
APPRECIATION
(DEPRECIATION) ($) | |
|
Long Contracts | |
| | | | | |
| S&P 500E-Mini Index | | | 3 | | | | 09/2019 | | | | USD | | | | 441,600 | | | | 6,821 | |
| | | | | |
| S&P/TSX 60 Index | | | 2 | | | | 09/2019 | | | | CAD | | | | 298,240 | | | | 2,222 | |
| | | | | |
| U.S. Treasury 10 Year Note | | | 18 | | | | 09/2019 | | | | USD | | | | 2,302,313 | | | | 47,921 | |
| | | | | | | | | | | | | | | | | | | | |
| | | | | | | | | | | | | | | | | | | 56,964 | |
| | | | | | | | | | | | | | | | | | | | |
| | | | | |
Short Contracts | | | | | | | | | | | | | | | | | | | | |
| | | | | |
| Hang Seng Index | | | (1 | ) | | | 07/2019 | | | | HKD | | | | (182,540 | ) | | | (2,305 | ) |
| | | | | |
| EURO STOXX 50 Index | | | (16 | ) | | | 09/2019 | | | | EUR | | | | (630,293 | ) | | | (12,319 | ) |
| | | | | |
| SPI 200 Index | | | (2 | ) | | | 09/2019 | | | | AUD | | | | (230,694 | ) | | | (2,546 | ) |
| | | | | |
| TOPIX Index | | | (2 | ) | | | 09/2019 | | | | JPY | | | | (287,808 | ) | | | 826 | |
| | | | | | | | | | | | | | | | | | | | |
| | | | | | | | | | | | | | | | | | | (16,344 | ) |
| | | | | | | | | | | | | | | | | | | | |
| | | | | | | | | | | | | | | | | | | 40,620 | |
| | | | | | | | | | | | | | | | | | | | |
Abbreviations
| | |
| AUD | | Australian Dollar |
| CAD | | Canadian Dollar |
| EUR | | Euro |
| HKD | | Hong Kong Dollar |
| JPY | | Japanese Yen |
| SPI | | Australian Securities Exchange |
| TOPIX | | Tokyo Stock Price Index |
| TSX | | Tokyo Stock Exchange |
| USD | | United States Dollar |
SEE NOTES TO FINANCIAL STATEMENTS.
| | | | | | |
| | | |
| 6 | | | | J.P. MORGAN FUNDS | | JUNE 30, 2019 |
THIS PAGE IS INTENTIONALLY LEFT BLANK
| | | | | | | | |
| | | |
| JUNE 30, 2019 | | J.P. MORGAN FUNDS | | | | | 7 | |
STATEMENT OF ASSETS AND LIABILITIES
AS OF JUNE 30, 2019
| | | | |
| | | JPMorgan
SmartSpendingSM
2050 Fund | |
ASSETS: | | | | |
Investments innon-affiliates, at value | | $ | 6,209,448 | |
Investments in affiliates, at value | | | 24,401,473 | |
Receivables: | | | | |
Interest fromnon-affiliates | | | 7,318 | |
Dividends from affiliates | | | 12,589 | |
Variation margin on futures contracts | | | 59,656 | |
Due from Adviser | | | 43,879 | |
| | | | |
Total Assets | | | 30,734,363 | |
| | | | |
| |
LIABILITIES: | | | | |
Payables: | | | | |
Due to custodian | | | 11,918 | |
Fund shares redeemed | | | 130,652 | |
Accrued liabilities: | | | | |
Distribution fees | | | 23 | |
Service fees | | | 2,243 | |
Custodian and accounting fees | | | 8,971 | |
Audit fees | | | 17,190 | |
Printing & Postage fees | | | 13,490 | |
Other | | | 865 | |
| | | | |
Total Liabilities | | | 185,352 | |
| | | | |
Net Assets | | $ | 30,549,011 | |
| | | | |
SEE NOTES TO FINANCIAL STATEMENTS.
| | | | | | |
| | | |
| 8 | | | | J.P. MORGAN FUNDS | | JUNE 30, 2019 |
| | | | |
| | | JPMorgan
SmartSpendingSM
2050 Fund | |
NET ASSETS: | | | | |
Paid-in-Capital | | $ | 28,524,943 | |
Total distributable earnings (loss) (a) | | | 2,024,068 | |
| | | | |
Total Net Assets | | $ | 30,549,011 | |
| | | | |
| |
Net Assets: | | | | |
Class A | | $ | 23,058 | |
Class I | | | 30,410,614 | |
Class R2 | | | 22,822 | |
Class R3 | | | 22,964 | |
Class R4 | | | 23,108 | |
Class R5 | | | 23,193 | |
Class R6 | | | 23,252 | |
| | | | |
Total | | $ | 30,549,011 | |
| | | | |
| |
Outstanding units of beneficial interest (shares) | | | | |
($0.0001 par value; unlimited number of shares authorized): | | | | |
Class A | | | 1,444 | |
Class I | | | 1,901,984 | |
Class R2 | | | 1,432 | |
Class R3 | | | 1,439 | |
Class R4 | | | 1,446 | |
Class R5 | | | 1,451 | |
Class R6 | | | 1,454 | |
| |
Net Asset Value (b): | | | | |
Class A — Redemption price per share | | $ | 15.97 | |
Class I — Offering and redemption price per share | | | 15.99 | |
Class R2 — Offering and redemption price per share | | | 15.94 | |
Class R3 — Offering and redemption price per share | | | 15.96 | |
Class R4 — Offering and redemption price per share | | | 15.98 | |
Class R5 — Offering and redemption price per share | | | 15.99 | |
Class R6 — Offering and redemption price per share | | | 16.00 | |
Class A maximum sales charge | | | 4.50 | % |
Class A maximum public offering price per share
[net asset value per share/(100% — maximum sales charge)] | | $ | 16.72 | |
| | | | |
| |
Cost of investments innon-affiliates | | $ | 5,902,900 | |
Cost of investments in affiliates | | | 23,415,787 | |
| (a) | Total distributable earnings have been aggregated to conform to the current presentation requirements for the adoption of the Securities and Exchange Commission’s Disclosure Update and Simplification Rule. See Note 8. |
| (b) | Per share amounts may not recalculate due to rounding of net assets and/or shares outstanding. |
SEE NOTES TO FINANCIAL STATEMENTS.
| | | | | | | | |
| | | |
| JUNE 30, 2019 | | J.P. MORGAN FUNDS | | | | | 9 | |
STATEMENT OF OPERATIONS
FOR THE YEAR ENDED JUNE 30, 2019
| | | | |
| | | JPMorgan
SmartSpendingSM
2050 Fund | |
INVESTMENT INCOME: | | | | |
Interest income fromnon-affiliates | | $ | 8,955 | |
Dividend income fromnon-affiliates | | | 180,558 | |
Dividend income from affiliates | | | 703,742 | |
| | | | |
Total investment income | | | 893,255 | |
| | | | |
| |
EXPENSES: | | | | |
Investment advisory fees | | | 105,173 | |
Administration fees | | | 23,463 | |
Distribution fees: | | | | |
Class A | | | 55 | |
Class R2 | | | 109 | |
Class R3 | | | 55 | |
Service fees: | | | | |
Class A | | | 55 | |
Class I | | | 74,792 | |
Class R2 | | | 55 | |
Class R3 | | | 55 | |
Class R4 | | | 55 | |
Class R5 | | | 22 | |
Custodian and accounting fees | | | 25,555 | |
Professional fees | | | 46,735 | |
Trustees’ and Chief Compliance Officer’s fees | | | 25,112 | |
Printing and mailing costs | | | 25,907 | |
Registration and filing fees | | | 94,737 | |
Transfer agency fees (See Note 2.G.) | | | 285 | |
Other | | | 11,865 | |
| | | | |
Total expenses | | | 434,085 | |
| | | | |
Less fees waived | | | (176,344 | ) |
Less expense reimbursements | | | (201,580 | ) |
| | | | |
Net expenses | | | 56,161 | |
| | | | |
Net investment income (loss) | | | 837,094 | |
| | | | |
| |
REALIZED/UNREALIZED GAINS (LOSSES): | | | | |
Net realized gain (loss) on transactions from: | | | | |
Investments innon-affiliates | | | 174,950 | |
Investments in affiliates | | | 101,553 | |
Futures contracts | | | (32,453 | ) |
Foreign currency transactions | | | 1,385 | |
| | | | |
Net realized gain (loss) | | | 245,435 | |
| | | | |
Distributions of capital gains received from investment company affiliates | | | 196,507 | |
| | | | |
Change in net unrealized appreciation/depreciation on: | | | | |
Investments innon-affiliates | | | (128,626 | ) |
Investments in affiliates | | | 422,789 | |
Futures contracts | | | 94,931 | |
Foreign currency translations | | | 3,595 | |
| | | | |
Change in net unrealized appreciation/depreciation | | | 392,689 | |
| | | | |
Net realized/unrealized gains (losses) | | | 834,631 | |
| | | | |
Change in net assets resulting from operations | | $ | 1,671,725 | |
| | | | |
SEE NOTES TO FINANCIAL STATEMENTS.
| | | | | | |
| | | |
| 10 | | | | J.P. MORGAN FUNDS | | JUNE 30, 2019 |
STATEMENTS OF CHANGES IN NET ASSETS
FOR THE PERIODS INDICATED
| | | | | | | | |
| | | JPMorgan SmartSpendingSM 2050 Fund | |
| | | Year Ended
June 30, 2019 | | | Year Ended
June 30, 2018 | |
CHANGE IN NET ASSETS RESULTING FROM OPERATIONS: | |
Net investment income (loss) | | $ | 837,094 | | | $ | 767,397 | |
Net realized gain (loss) | | | 245,435 | | | | 575,667 | |
Distributions of capital gains received from investment company affiliates | | | 196,507 | | | | 191,218 | |
Change in net unrealized appreciation/depreciation | | | 392,689 | | | | (261,376 | ) |
| | | | | | | | |
Change in net assets resulting from operations | | | 1,671,725 | | | | 1,272,906 | |
| | | | | | | | |
| | |
DISTRIBUTIONS TO SHAREHOLDERS:(a) | | | | | | | | |
Class A | | | (975 | ) | | | (561 | ) |
Class C (b) | | | — | | | | (494 | ) |
Class I | | | (1,387,928 | ) | | | (848,963 | ) |
Class R2 | | | (889 | ) | | | (506 | ) |
Class R3 | | | (941 | ) | | | (539 | ) |
Class R4 | | | (993 | ) | | | (573 | ) |
Class R5 | | | (1,025 | ) | | | (590 | ) |
Class R6 | | | (1,046 | ) | | | (606 | ) |
| | | | | | | | |
Total distributions to shareholders | | | (1,393,797 | ) | | | (852,832 | ) |
| | | | | | | | |
|
CAPITAL TRANSACTIONS: | |
Change in net assets resulting from capital transactions | | | (182,975 | ) | | | (907,595 | ) |
| | | | | | | | |
|
NET ASSETS: | |
Change in net assets | | | 94,953 | | | | (487,521 | ) |
Beginning of period | | | 30,454,058 | | | | 30,941,579 | |
| | | | | | | | |
End of period | | $ | 30,549,011 | | | $ | 30,454,058 | |
| | | | | | | | |
| (a) | The prior period distributions have been reclassified to conform to current period presentation for the adoption of the Securities and Exchange Commission’s Disclosure Update and Simplification Rule. See Note 8. Prior period balances were as follows: |
| | | | |
Class A | | | | |
From net investment income | | $ | (324 | ) |
From net realized gains | | | (237 | ) |
Class C(b) | | | | |
From net investment income | | | (259 | ) |
From net realized gains | | | (235 | ) |
Class I | | | | |
From net investment income | | | (511,666 | ) |
From net realized gains | | | (337,297 | ) |
Class R2 | | | | |
From net investment income | | | (270 | ) |
From net realized gains | | | (236 | ) |
Class R3 | | | | |
From net investment income | | | (303 | ) |
From net realized gains | | | (236 | ) |
Class R4 | | | | |
From net investment income | | | (336 | ) |
From net realized gains | | | (237 | ) |
Class R5 | | | | |
From net investment income | | | (353 | ) |
From net realized gains | | | (237 | ) |
Class R6 | | | | |
From net investment income | | | (369 | ) |
From net realized gains | | | (237 | ) |
| (b) | Liquidated on February 26, 2018. |
SEE NOTES TO FINANCIAL STATEMENTS.
| | | | | | | | |
| | | |
| JUNE 30, 2019 | | J.P. MORGAN FUNDS | | | | | 11 | |
STATEMENTS OF CHANGES IN NET ASSETS
FOR THE PERIODS INDICATED (continued)
| | | | | | | | |
| | | JPMorgan SmartSpendingSM 2050 Fund | |
| | | Year Ended
June 30, 2019 | | | Year Ended
June 30, 2018 | |
CAPITAL TRANSACTIONS: | | | | | | | | |
Class A | | | | | | | | |
Distributions reinvested | | $ | 975 | | | $ | 561 | |
| | | | | | | | |
Change in net assets resulting from Class A capital transactions | | $ | 975 | | | $ | 561 | |
| | | | | | | | |
Class C(a) | | | | | | | | |
Distributions reinvested | | $ | — | | | $ | 494 | |
Cost of shares redeemed | | | — | | | | (22,085 | ) |
| | | | | | | | |
Change in net assets resulting from Class C capital transactions | | $ | — | | | $ | (21,591 | ) |
| | | | | | | | |
Class I | | | | | | | | |
Distributions reinvested | | $ | 1,387,928 | | | $ | 848,963 | |
Cost of shares redeemed | | | (1,576,772 | ) | | | (1,738,342 | ) |
| | | | | | | | |
Change in net assets resulting from Class I capital transactions | | $ | (188,844 | ) | | $ | (889,379 | ) |
| | | | | | | | |
Class R2 | | | | | | | | |
Distributions reinvested | | $ | 889 | | | $ | 506 | |
| | | | | | | | |
Change in net assets resulting from Class R2 capital transactions | | $ | 889 | | | $ | 506 | |
| | | | | | | | |
Class R3 | | | | | | | | |
Distributions reinvested | | $ | 941 | | | $ | 539 | |
| | | | | | | | |
Change in net assets resulting from Class R3 capital transactions | | $ | 941 | | | $ | 539 | |
| | | | | | | | |
Class R4 | | | | | | | | |
Distributions reinvested | | $ | 993 | | | $ | 573 | |
| | | | | | | | |
Change in net assets resulting from Class R4 capital transactions | | $ | 993 | | | $ | 573 | |
| | | | | | | | |
Class R5 | | | | | | | | |
Distributions reinvested | | $ | 1,025 | | | $ | 590 | |
| | | | | | | | |
Change in net assets resulting from Class R5 capital transactions | | $ | 1,025 | | | $ | 590 | |
| | | | | | | | |
Class R6 | | | | | | | | |
Distributions reinvested | | $ | 1,046 | | | $ | 606 | |
| | | | | | | | |
Change in net assets resulting from Class R6 capital transactions | | $ | 1,046 | | | $ | 606 | |
| | | | | | | | |
Total change in net assets resulting from capital transactions | | $ | (182,975 | ) | | $ | (907,595 | ) |
| | | | | | | | |
| (a) | Liquidated on February 26, 2018. |
SEE NOTES TO FINANCIAL STATEMENTS.
| | | | | | |
| | | |
| 12 | | | | J.P. MORGAN FUNDS | | JUNE 30, 2019 |
| | | | | | | | |
| | | JPMorgan SmartSpendingSM 2050 Fund | |
| | | Year Ended
June 30, 2019 | | | Year Ended
June 30, 2018 | |
SHARE TRANSACTIONS: | | | | | | | | |
Class A | | | | | | | | |
Reinvested | | | 65 | | | | 35 | |
| | | | | | | | |
Change in Class A Shares | | | 65 | | | | 35 | |
| | | | | | | | |
Class C(a) | | | | | | | | |
Reinvested | | | — | | | | 30 | |
Redeemed | | | — | | | | (1,371 | ) |
| | | | | | | | |
Change in Class C Shares | | | — | | | | (1,341 | ) |
| | | | | | | | |
Class I | | | | | | | | |
Reinvested | | | 92,616 | | | | 52,789 | |
Redeemed | | | (100,751 | ) | | | (108,604 | ) |
| | | | | | | | |
Change in Class I Shares | | | (8,135 | ) | | | (55,815 | ) |
| | | | | | | | |
Class R2 | | | | | | | | |
Reinvested | | | 59 | | | | 32 | |
| | | | | | | | |
Change in Class R2 Shares | | | 59 | | | | 32 | |
| | | | | | | | |
Class R3 | | | | | | | | |
Reinvested | | | 63 | | | | 33 | |
| | | | | | | | |
Change in Class R3 Shares | | | 63 | | | | 33 | |
| | | | | | | | |
Class R4 | | | | | | | | |
Reinvested | | | 66 | | | | 36 | |
| | | | | | | | |
Change in Class R4 Shares | | | 66 | | | | 36 | |
| | | | | | | | |
Class R5 | | | | | | | | |
Reinvested | | | 69 | | | | 36 | |
| | | | | | | | |
Change in Class R5 Shares | | | 69 | | | | 36 | |
| | | | | | | | |
Class R6 | | | | | | | | |
Reinvested | | | 70 | | | | 38 | |
| | | | | | | | |
Change in Class R6 Shares | | | 70 | | | | 38 | |
| | | | | | | | |
| (a) | Liquidated on February 26, 2018. |
SEE NOTES TO FINANCIAL STATEMENTS.
| | | | | | | | |
| | | |
| JUNE 30, 2019 | | J.P. MORGAN FUNDS | | | | | 13 | |
FINANCIAL HIGHLIGHTS
FOR THE PERIODS INDICATED
| | | | | | | | | | | | | | | | | | | | | | | | | | | | |
| | | Per share operating performance | |
| | | | | | Investment operations | | | Distributions | |
| | | Net asset
value,
beginning
of period | | | Net investment income (loss) (b)(c) | | | Net realized
and unrealized
gains
(losses) on
investments | | | Total from
investment
operations | | | Net
investment
income | | | Net
realized
gain | | | Total
distributions | |
JPMorgan SmartSpending 2050 Fund | | | | | | | | | | | | | | | | | | | | | | | | | | | | |
Class A | | | | | | | | | | | | | | | | | | | | | | | | | | | | |
Year Ended June 30, 2019 | | $ | 15.86 | | | $ | 0.39 | | | $ | 0.42 | | | $ | 0.81 | | | $ | (0.39 | ) | | $ | (0.31 | ) | | $ | (0.70 | ) |
Year Ended June 30, 2018 | | | 15.66 | | | | 0.35 | | | | 0.26 | | | | 0.61 | | | | (0.24 | ) | | | (0.17 | ) | | | (0.41 | ) |
December 30, 2016 (h) through June 30, 2017 | | | 15.00 | | | | 0.14 | | | | 0.64 | | | | 0.78 | | | | (0.12 | ) | | | — | | | | (0.12 | ) |
| | | | | | | |
Class I | | | | | | | | | | | | | | | | | | | | | | | | | | | | |
Year Ended June 30, 2019 | | | 15.87 | | | | 0.44 | | | | 0.42 | | | | 0.86 | | | | (0.43 | ) | | | (0.31 | ) | | | (0.74 | ) |
Year Ended June 30, 2018 | | | 15.66 | | | | 0.39 | | | | 0.25 | | | | 0.64 | | | | (0.26 | ) | | | (0.17 | ) | | | (0.43 | ) |
December 30, 2016 (h) through June 30, 2017 | | | 15.00 | | | | 0.16 | | | | 0.64 | | | | 0.80 | | | | (0.14 | ) | | | — | | | | (0.14 | ) |
| | | | | | | |
Class R2 | | | | | | | | | | | | | | | | | | | | | | | | | | | | |
Year Ended June 30, 2019 | | | 15.83 | | | | 0.33 | | | | 0.42 | | | | 0.75 | | | | (0.33 | ) | | | (0.31 | ) | | | (0.64 | ) |
Year Ended June 30, 2018 | | | 15.66 | | | | 0.29 | | | | 0.25 | | | | 0.54 | | | | (0.20 | ) | | | (0.17 | ) | | | (0.37 | ) |
December 30, 2016 (h) through June 30, 2017 | | | 15.00 | | | | 0.11 | | | | 0.64 | | | | 0.75 | | | | (0.09 | ) | | | — | | | | (0.09 | ) |
| | | | | | | |
Class R3 | | | | | | | | | | | | | | | | | | | | | | | | | | | | |
Year Ended June 30, 2019 | | | 15.85 | | | | 0.37 | | | | 0.42 | | | | 0.79 | | | | (0.37 | ) | | | (0.31 | ) | | | (0.68 | ) |
Year Ended June 30, 2018 | | | 15.66 | | | | 0.33 | | | | 0.25 | | | | 0.58 | | | | (0.22 | ) | | | (0.17 | ) | | | (0.39 | ) |
December 30, 2016 (h) through June 30, 2017 | | | 15.00 | | | | 0.13 | | | | 0.64 | | | | 0.77 | | | | (0.11 | ) | | | — | | | | (0.11 | ) |
| | | | | | | |
Class R4 | | | | | | | | | | | | | | | | | | | | | | | | | | | | |
Year Ended June 30, 2019 | | | 15.86 | | | | 0.41 | | | | 0.43 | | | | 0.84 | | | | (0.41 | ) | | | (0.31 | ) | | | (0.72 | ) |
Year Ended June 30, 2018 | | | 15.66 | | | | 0.37 | | | | 0.25 | | | | 0.62 | | | | (0.25 | ) | | | (0.17 | ) | | | (0.42 | ) |
December 30, 2016 (h) through June 30, 2017 | | | 15.00 | | | | 0.15 | | | | 0.64 | | | | 0.79 | | | | (0.13 | ) | | | — | | | | (0.13 | ) |
| | | | | | | |
Class R5 | | | | | | | | | | | | | | | | | | | | | | | | | | | | |
Year Ended June 30, 2019 | | | 15.87 | | | | 0.44 | | | | 0.42 | | | | 0.86 | | | | (0.43 | ) | | | (0.31 | ) | | | (0.74 | ) |
Year Ended June 30, 2018 | | | 15.66 | | | | 0.39 | | | | 0.25 | | | | 0.64 | | | | (0.26 | ) | | | (0.17 | ) | | | (0.43 | ) |
December 30, 2016 (h) through June 30, 2017 | | | 15.00 | | | | 0.16 | | | | 0.64 | | | | 0.80 | | | | (0.14 | ) | | | — | | | | (0.14 | ) |
| | | | | | | |
Class R6 | | | | | | | | | | | | | | | | | | | | | | | | | | | | |
Year Ended June 30, 2019 | | | 15.88 | | | | 0.45 | | | | 0.42 | | | | 0.87 | | | | (0.44 | ) | | | (0.31 | ) | | | (0.75 | ) |
Year Ended June 30, 2018 | | | 15.66 | | | | 0.41 | | | | 0.25 | | | | 0.66 | | | | (0.27 | ) | | | (0.17 | ) | | | (0.44 | ) |
December 30, 2016 (h) through June 30, 2017 | | | 15.00 | | | | 0.17 | | | | 0.64 | | | | 0.81 | | | | (0.15 | ) | | | — | | | | (0.15 | ) |
| (a) | Annualized for periods less than one year, unless otherwise noted. |
| (b) | Net investment income (loss) is affected by the timing of distributions from Underlying Funds. |
| (c) | Calculated based upon average shares outstanding. |
| (d) | Not annualized for periods less than one year. |
| (e) | Includes adjustments in accordance with accounting principles generally accepted in the United States of America and as such, the net asset values for financial reporting purposes and the returns based upon those net asset values may differ from the net asset values and returns for shareholder transactions. |
| (f) | Does not include expenses of Underlying Funds. |
| (g) | Certainnon-recurring expenses incurred by the Fund were not annualized for the periods indicated. |
| (h) | Commencement of operations. |
SEE NOTES TO FINANCIAL STATEMENTS.
| | | | | | |
| | | |
| 14 | | | | J.P. MORGAN FUNDS | | JUNE 30, 2019 |
| | | | | | | | | | | | | | | | | | | | | | | | | | |
| | | Ratios/Supplemental data | |
| | | | | | | | | | Ratios to average net assets (a) | | | | |
Net asset
value,
end of
period | | | Total return (excludes sales charge) (d)(e) | | | Net assets,
end of
period | | | Net
expenses (f) | | | Net
investment
income
(loss) (b) | | |
Expenses
without waivers,
reimbursements and
earnings credits (f) | | | Portfolio
turnover
rate (d) | |
| | | | | | | | | | | | | | | | | | | | | | | | | | |
| | | | | | | | | | | | | | | | | | | | | | | | | | |
| $ | 15.97 | | | | 5.45 | % | | $ | 23,058 | | | | 0.43 | % | | | 2.51 | % | | | 1.71 | % | | | 50 | % |
| | 15.86 | | | | 3.90 | | | | 21,866 | | | | 0.43 | (g) | | | 2.21 | (g) | | | 1.70 | (g) | | | 30 | |
| | 15.66 | | | | 5.23 | | | | 21,050 | | | | 0.45 | (g) | | | 1.85 | (g) | | | 3.76 | (g) | | | 8 | |
| | | | | | |
| | | | | | | | | | | | | | | | | | | | | | | | | | |
| | 15.99 | | | | 5.75 | | | | 30,410,614 | | | | 0.19 | | | | 2.79 | | | | 1.44 | | | | 50 | |
| | 15.87 | | | | 4.12 | | | | 30,322,835 | | | | 0.19 | (g) | | | 2.46 | (g) | | | 1.36 | (g) | | | 30 | |
| | 15.66 | | | | 5.36 | | | | 30,794,263 | | | | 0.19 | (g) | | | 2.09 | (g) | | | 1.26 | (g) | | | 8 | |
| | | | | | |
| | | | | | | | | | | | | | | | | | | | | | | | | | |
| | 15.94 | | | | 5.05 | | | | 22,822 | | | | 0.85 | | | | 2.13 | | | | 1.97 | | | | 50 | |
| | 15.83 | | | | 3.46 | | | | 21,731 | | | | 0.85 | (g) | | | 1.80 | (g) | | | 2.00 | (g) | | | 30 | |
| | 15.66 | | | | 5.02 | | | | 21,009 | | | | 0.84 | (g) | | | 1.44 | (g) | | | 4.09 | (g) | | | 8 | |
| | | | | | |
| | | | | | | | | | | | | | | | | | | | | | | | | | |
| | 15.96 | | | | 5.29 | | | | 22,964 | | | | 0.60 | | | | 2.38 | | | | 1.72 | | | | 50 | |
| | 15.85 | | | | 3.74 | | | | 21,813 | | | | 0.60 | (g) | | | 2.05 | (g) | | | 1.75 | (g) | | | 30 | |
| | 15.66 | | | | 5.15 | | | | 21,035 | | | | 0.59 | (g) | | | 1.69 | (g) | | | 3.82 | (g) | | | 8 | |
| | | | | | |
| | | | | | | | | | | | | | | | | | | | | | | | | | |
| | 15.98 | | | | 5.60 | | | | 23,108 | | | | 0.35 | | | | 2.63 | | | | 1.47 | | | | 50 | |
| | 15.86 | | | | 3.96 | | | | 21,895 | | | | 0.35 | (g) | | | 2.30 | (g) | | | 1.50 | (g) | | | 30 | |
| | 15.66 | | | | 5.27 | | | | 21,060 | | | | 0.35 | (g) | | | 1.94 | (g) | | | 3.57 | (g) | | | 8 | |
| | | | | | |
| | | | | | | | | | | | | | | | | | | | | | | | | | |
| | 15.99 | | | | 5.74 | | | | 23,193 | | | | 0.20 | | | | 2.78 | | | | 1.32 | | | | 50 | |
| | 15.87 | | | | 4.11 | | | | 21,942 | | | | 0.21 | (g) | | | 2.44 | (g) | | | 1.36 | (g) | | | 30 | |
| | 15.66 | | | | 5.35 | | | | 21,076 | | | | 0.20 | (g) | | | 2.09 | (g) | | | 3.43 | (g) | | | 8 | |
| | | | | | |
| | | | | | | | | | | | | | | | | | | | | | | | | | |
| | 16.00 | | | | 5.84 | | | | 23,252 | | | | 0.10 | | | | 2.88 | | | | 1.23 | | | | 50 | |
| | 15.88 | | | | 4.24 | | | | 21,976 | | | | 0.10 | (g) | | | 2.55 | (g) | | | 1.25 | (g) | | | 30 | |
| | 15.66 | | | | 5.40 | | | | 21,086 | | | | 0.10 | (g) | | | 2.19 | (g) | | | 3.33 | (g) | | | 8 | |
SEE NOTES TO FINANCIAL STATEMENTS.
| | | | | | | | |
| | | |
| JUNE 30, 2019 | | J.P. MORGAN FUNDS | | | | | 15 | |
NOTES TO FINANCIAL STATEMENTS
AS OF JUNE 30, 2019
1. Organization
JPMorgan Trust IV (the “Trust”) was formed on November 11, 2015, as a Delaware statutory trust, pursuant to a Declaration of Trust dated November 11, 2015 and is registered under the Investment Company Act of 1940, as amended (the “1940 Act”), as anopen-end management investment company.
The following is a separate fund of the Trust (the “Fund”) covered by this report:
| | | | |
| | | Classes Offered | | Diversified/Non-Diversified |
| JPMorgan SmartSpendingSM 2050 Fund | | Class A, Class I, Class R2, Class R3, Class R4, Class R5 and Class R6 | | Diversified |
The investment objective of the Fund is to seek to provide total return consisting of current income and capital appreciation.
The Fund commenced operations on December 30, 2016.
Class A Shares generally provide for afront-end sales charge. No sales charges are assessed with respect to Class I, Class R2, Class R3, Class R4, Class R5 and Class R6 Shares. Certain Class A Shares, for whichfront-end sales charges have been waived, may be subject to a CDSC as described in the Fund’s prospectus. All classes of shares have equal rights as to earnings, assets and voting privileges, except that each class may bear different transfer agency, distribution and service fees and each class has exclusive voting rights with respect to its distribution plan and shareholder servicing agreements.
J.P. Morgan Investment Management Inc. (“JPMIM”), an indirect, wholly-owned subsidiary of JPMorgan Chase & Co. (“JPMorgan”), acts as Adviser (the “Adviser”) and Administrator (the “Administrator”) to the Fund.
2. Significant Accounting Policies
The following is a summary of significant accounting policies followed by the Fund in the preparation of its financial statements. The Fund is an investment company and, thus, follows the investment company accounting and reporting guidance of the Financial Accounting Standards Board Accounting Standards Codification Topic 946 — Investment Companies, which is part of U.S. generally accepted accounting principles (“GAAP”). The preparation of financial statements in conformity with GAAP requires management to make estimates and assumptions that affect the reported amounts of assets and liabilities and disclosure of contingent assets and liabilities at the date of the financial statements and the reported amounts of increases and decreases in net assets from operations during the reporting period. Actual results could differ from those estimates.
A. Valuation of Investments — The valuation of investments is in accordance with GAAP and the Fund’s valuation policies set forth by and under the supervision and responsibility of the Board of Trustees (the “Board”), which established the following approach to valuation, as described more fully below: (i) investments for which market quotations are readily available shall be valued at their market value and (ii) all other investments for which market quotations are not readily available shall be valued at their fair value as determined in good faith by the Board.
The Administrator has established the J.P. Morgan Asset Management Americas Valuation Committee (“AVC”) to assist the Board with the oversight and monitoring of the valuation of the Fund’s investments. The Administrator implements the valuation policies of the Fund’s investments, as directed by the Board. The AVC oversees and carries out the policies for the valuation of investments held in the Fund. This includes monitoring the appropriateness of fair values based on results of ongoing valuation oversight including, but not limited to, consideration of macro or security specific events, market events and pricing vendor and broker due diligence. The Administrator is responsible for discussing and assessing the potential impacts to the fair values on an ongoing basis, and at least on a quarterly basis with the AVC and the Board.
Equities and other exchange-traded instruments are valued at the last sale price or official market closing price on the primary exchange on which the instrument is traded before the net asset values (“NAV”) of the Fund are calculated on a valuation date. Certain foreign equity instruments, as well as certain derivatives with equity reference obligations, are valued by applying international fair value factors provided by approved affiliated and unaffiliated pricing vendors or third party broker-dealers (collectively referred to as “Pricing Services”). The factors seek to adjust the local closing price for movements of local markets post closing, but prior to the time the NAVs are calculated.
Investments inopen-end investment companies, excluding exchange-traded funds (“ETFs”) (“Underlying Funds”), are valued at each Underlying Fund’s NAV per share as of the report date.
Fixed income instruments are valued based on prices received from approved affiliated and unaffiliated pricing vendors or third party broker-dealers (collectively referred to as “Pricing Services”). The Pricing Services use multiple valuation techniques to determine the valuation of fixed income instruments. In instances where sufficient market activity exists, the Pricing Services may utilize a market-based approach through which trades or quotes from market makers are used to determine the valuation of these instruments. In instances where sufficient market activity may not exist, the Pricing Services also utilize proprietary valuation models which may consider market transactions in comparable securities and the various relationships between securities in determining fair value and/or market characteristics in order to estimate the relevant cash flows, which are then discounted to calculate the fair values.
Futures contracts are generally valued on the basis of available market quotations.
Valuations reflected in this report are as of the report date. As a result, changes in valuation due to market events and/or issuer related events after the report date and prior to issuance of the report are not reflected herein.
| | | | | | |
| | | |
| 16 | | | | J.P. MORGAN FUNDS | | JUNE 30, 2019 |
The various inputs that are used in determining the valuation of the Fund’s investments are summarized into the three broad levels listed below.
| • | | Level 1 — Unadjusted inputs using quoted prices in active markets for identical investments. |
| • | | Level 2 — Other significant observable inputs including, but not limited to, quoted prices for similar investments, inputs other than quoted prices that are observable for investments (such as interest rates, prepayment speeds, credit risk, etc.) or other market corroborated inputs. |
| • | | Level 3 — Significant inputs based on the best information available in the circumstances, to the extent observable inputs are not available (including the Fund’s assumptions in determining the fair value of investments). |
A financial instrument’s level within the fair value hierarchy is based on the lowest level of any input, both individually and in the aggregate, that is significant to the fair value measurement. The inputs or methodology used for valuing instruments are not necessarily an indication of the risk associated with investing in those instruments.
The following table represents each valuation input as presented on the Schedule of Portfolio Investments (“SOI”):
| | | | | | | | | | | | | | | | |
| | | Level 1 Quoted prices | | | Level 2 Other significant
observable inputs | | | Level 3 Significant
unobservable inputs | | | Total | |
Total Investments in Securities(a) | | $ | 30,206,079 | | | $ | 404,842 | | | $ | — | | | $ | 30,610,921 | |
| | | | | | | | | | | | | | | | |
Appreciation in Other Financial Instruments | | | | | | | | | | | | | | | | |
Futures Contracts (a) | | $ | 57,790 | | | $ | — | | | $ | — | | | $ | 57,790 | |
| | | | | | | | | | | | | | | | |
Depreciation in Other Financial Instruments | | | | | | | | | | | | | | | | |
Futures Contracts (a) | | $ | (2,546 | ) | | $ | (14,624 | ) | | $ | — | | | $ | (17,170 | ) |
| | | | | | | | | | | | | | | | |
| (a) | All portfolio holdings designated in level 1 and level 2 are disclosed individually on the SOI. Level 2 consists of foreign futures with equity reference obligations and a U.S. Treasury Note held as initial margin for futures contracts. |
There were no transfers into and out of level 3 for the year ended June 30, 2019.
B. Futures Contracts — The Fund used treasury and index futures contracts to gain exposure to or to overweight or underweight allocations among various sectors or markets, maintain liquidity or minimize transaction costs. The Fund also buys futures contracts to invest incoming cash in the market or sells futures in response to cash outflows, thereby simulating an invested position in the underlying index while maintaining a cash balance for liquidity.
Futures contracts provide for the delayed delivery of the underlying instrument at a fixed price or are settled for a cash amount based on the change in the value of the underlying instrument at a specific date in the future. Upon entering into a futures contract, the Fund is required to deposit with the broker, cash or securities in an amount equal to a certain percentage of the contract amount, which is referred to as the initial margin deposit. Subsequent payments, referred to as variation margin, are made or received by the Fund periodically and are based on changes in the market value of open futures contracts. Changes in the market value of open futures contracts are recorded as Change in net unrealized appreciation/ depreciation on the Statement of Operations. Realized gains or losses, representing the difference between the value of the contract at the time it was opened and the value at the time it was closed, are reported on the Statement of Operations at the closing or expiration of the futures contract. Securities deposited as initial margin are designated in the SOIs, while cash deposited, which is considered restricted, is recorded on the Statement of Assets and Liabilities. A receivable from and/or a payable to brokers for the daily variation margin is also recorded on the Statement of Assets and Liabilities.
The use of futures contracts exposes the Fund to equity price and interest rate risks. The Fund may be subject to the risk that the change in the value of the futures contract may not correlate perfectly with the underlying instrument. Use of long futures contracts subjects the Fund to risk of loss in excess of the amounts shown on the Statement of Assets and Liabilities, up to the notional amount of the futures contracts. Use of short futures contracts subjects the Fund to unlimited risk of loss. The Fund may enter into futures contracts only on exchanges or boards of trade. The exchange or board of trade acts as the counterparty to each futures transaction; therefore, the Fund’s credit risk is limited to failure of the exchange or board of trade. Under some circumstances, futures exchanges may establish daily limits on the amount that the price of a futures contract can vary from the previous day’s settlement price, which could effectively prevent liquidation of positions.
| | | | | | | | |
| | | |
| JUNE 30, 2019 | | J.P. MORGAN FUNDS | | | | | 17 | |
NOTES TO FINANCIAL STATEMENTS
AS OF JUNE 30, 2019 (continued)
The table below discloses the volume of the Fund’s futures contracts activity during the year ended June 30, 2019:
| | | | | | | | |
| | | Average
Notional
Balance | | | Ending
Notional
Balance | |
Long Futures Contracts: | | | | | | | | |
Equity | | $ | 1,046,497 | | | $ | 739,840 | |
Interest Rate | | | 2,135,722 | | | | 2,302,313 | |
| | |
Short Futures Contracts: | | | | | | | | |
Equity | | | 825,930 | | | | 1,331,335 | |
Interest Rate | | | 1,048,048 | (a) | | | — | |
| (a) | For the period July 1, 2018 through January 31, 2019. |
The Fund’s futures contracts are not subject to master netting arrangements (the right to close out all transactions traded with a counterparty and net amounts owed or due across transactions).
C. Summary of Derivatives Information — The following table presents the value of derivatives held as of June 30, 2019, by their primary underlying risk exposure and respective location on the Statement of Assets and Liabilities:
| | | | | | |
| Derivative Contracts | | Statement of Assets and Liabilities Location | | | |
| Gross Assets: | | | | Futures Contracts (a) | |
Equity contracts | | Receivables, Net Assets — Unrealized Appreciation | | $ | 9,869 | |
Interest rate contracts | | Receivables, Net Assets — Unrealized Appreciation | | | 47,921 | |
| | | | | | |
Total | | | | $ | 57,790 | |
| | | | | | |
| | |
Gross Liabilities: | | | | | |
Equity contracts | | Payables, Net Assets — Unrealized Depreciation | | $ | (17,170 | ) |
| | | | | | |
| (a) | This amount represents the cumulative appreciation (depreciation) of futures contracts as reported on the SOI. The Statement of Assets and Liabilities only reflect the current day variation margin receivable/payable from/to brokers. |
The following tables present the effect of derivatives on the Statement of Operations for the year ended June 30, 2019, by primary underlying risk exposure:
| | | | |
| Amount of Realized Gain (Loss) on Derivatives Recognized in Statement of Operations | |
| Derivative Contracts | | Futures Contracts | |
Equity contracts | | $ | (123,650 | ) |
Interest rate contracts | | | 91,197 | |
| | | | |
Total | | $ | (32,453 | ) |
| | | | |
| | | | |
| Amount of Change in Unrealized Appreciation (Depreciation) on Derivatives Recognized in Statement of Operations | |
| Derivative Contracts | | Futures Contracts | |
Equity contracts | | $ | (107 | ) |
Interest rate contracts | | | 95,038 | |
| | | | |
Total | | $ | 94,931 | |
| | | | |
The Fund’s derivatives contracts held at June 30, 2019 are not accounted for as hedging instruments under GAAP.
D. Investment Transactions with Affiliates — The Fund invested in Underlying Funds which are advised by the Adviser or its affiliates. An issuer which is under common control with the Fund may be considered an affiliate. For the purposes of the financial statements, the Fund assumes the issuers listed in the table below to be affiliated issuers. Underlying Funds’ distributions may be reinvested into the Underlying Funds. Reinvestment amounts are included in the purchase cost amounts in the table below.
| | | | | | |
| | | |
| 18 | | | | J.P. MORGAN FUNDS | | JUNE 30, 2019 |
| | | | | | | | | | | | | | | | | | | | | | | | | | | | | | | | | | | | |
| | | For the year ended June 30, 2019 | |
| Security Description | | Value at
June 30, 2018 | | | Purchases
at Cost | | | Proceeds
from Sales | | | Net
Realized
Gain (Loss) | | | Change in
Unrealized
Appreciation/
(Depreciation) | | | Value at
June 30, 2019 | | | Shares at
June 30,
2019 | | | Dividend
Income | | | Capital Gain
Distributions | |
JPMorgan Commodities Strategy Fund Class R6 Shares* (a) | | $ | 494,851 | | | $ | — | | | $ | 476,265 | | | $ | (20,230 | ) | | $ | 1,644 | | | $ | — | | | | — | | | $ | — | | | $ | — | |
JPMorgan Core Bond Fund Class R6 Shares (a) | | | 5,828,240 | | | | 797,302 | | | | 606,867 | | | | (7,882 | ) | | | 278,293 | | | | 6,289,086 | | | | 533,425 | | | | 177,243 | | | | 5,601 | |
JPMorgan Core Plus Bond Fund Class R6 Shares (a) | | | 3,140,912 | | | | 1,265,441 | | | | 325,804 | | | | (5,289 | ) | | | 168,480 | | | | 4,243,740 | | | | 504,606 | | | | 113,554 | | | | — | |
JPMorgan Emerging Markets Strategic Debt Fund Class R6 Shares (a) | | | 907,176 | | | | 957,101 | | | | 878,198 | | | | (38,977 | ) | | | 72,878 | | | | 1,019,980 | | | | 124,236 | | | | 16,212 | | | | — | |
JPMorgan Equity Index Fund Class R6 Shares (a) | | | 2,193,385 | | | | 439,293 | | | | 955,369 | | | | 167,127 | | | | (31,096 | ) | | | 1,813,340 | | | | 40,314 | | | | 30,382 | | | | 4,778 | |
JPMorgan Floating Rate Income Fund Class R6 Shares (a) | | | 1,072,446 | | | | 1,249,690 | | | | 2,273,617 | | | | (60,293 | ) | | | 11,774 | | | | — | | | | — | | | | 49,583 | | | | — | |
JPMorgan Growth Advantage Fund Class R6 Shares* (a) | | | 645,666 | | | | 44,922 | | | | 125,883 | | | | 34,420 | | | | (24,126 | ) | | | 574,999 | | | | 24,838 | | | | — | | | | 44,922 | |
JPMorgan High Yield Fund Class R6 Shares (a) | | | 2,717,806 | | | | 810,778 | | | | 775,928 | | | | (22,093 | ) | | | 37,507 | | | | 2,768,070 | | | | 382,859 | | | | 163,831 | | | | — | |
JPMorgan Income Fund Class R6 Shares (a) | | | — | | | | 1,202,046 | | | | — | | | | — | | | | 25,562 | | | | 1,227,608 | | | | 128,545 | | | | 16,728 | | | | — | |
JPMorgan International Research Enhanced Equity Fund Class R6 Shares (a) | | | 1,450,397 | | | | 34,379 | | | | 364,181 | | | | 29,229 | | | | (80,124 | ) | | | 1,069,700 | | | | 60,367 | | | | 34,379 | | | | — | |
JPMorgan Managed Income Fund Class L Shares (a) | | | — | | | | 5,347,141 | | | | 1,848,124 | | | | 3,924 | | | | 14,818 | | | | 3,517,759 | | | | 350,026 | | | | 65,900 | | | | 745 | |
JPMorgan U.S. Equity Fund Class R6 Shares (a) | | | 1,050,823 | | | | 167,172 | | | | 251,289 | | | | 15,871 | | | | (44,163 | ) | | | 938,414 | | | | 58,761 | | | | 11,693 | | | | 111,431 | |
JPMorgan U.S. Government Money Market Fund Class IM Shares, 2.31% (a) (b) | | | 1,009,019 | | | | 3,709,448 | | | | 4,325,113 | | | | — | | | | — | | | | 393,354 | | | | 393,354 | | | | 12,553 | | | | — | |
JPMorgan Value Advantage Fund Class R6 Shares (a) | | | 567,227 | | | | 145,184 | | | | 164,076 | | | | 5,746 | | | | (8,658 | ) | | | 545,423 | | | | 15,291 | | | | 11,684 | | | | 29,030 | |
| | | | | | | | | | | | | | | | | | | | | | | | | | | | | | | | | | | | |
Total | | $ | 21,077,948 | | | $ | 16,169,897 | | | $ | 13,370,714 | | | $ | 101,553 | | | $ | 422,789 | | | $ | 24,401,473 | | | | | | | $ | 703,742 | | | $ | 196,507 | |
| | | | | | | | | | | | | | | | | | | | | | | | | | | | | | | | | | | | |
| * | Non-income producing security. |
| (a) | Investment in an affiliated fund, which is registered under the Investment Company Act of 1940, as amended, and is advised by J.P. Morgan Investment Management Inc. |
| (b) | The rate shown is the current yield as of June 30, 2019. |
E. Foreign Currency Translation — The books and records of the Fund are maintained in U.S. dollars. Foreign currency amounts are translated into U.S. dollars at the prevailing exchange rates of such currencies against the U.S. dollar. The market value of investment securities and other assets and liabilities are translated at the exchange rate as of the valuation date. Purchases and sales of investment securities, income and expenses are translated at the exchange rate prevailing on the respective dates of such transactions.
The Fund does not isolate the effect of changes in foreign exchange rates from changes in market prices on securities held. Accordingly, such changes are included within Change in net unrealized appreciation/depreciation on investments on the Statement of Operations.
Reported realized foreign currency gains and losses arise from the disposition of foreign currency, currency gains or losses realized between the trade and settlement dates on securities transactions, and the difference between the amounts of dividends, interest and foreign withholding taxes recorded on the Fund’s books on the transaction date and the U.S. dollar equivalent of the amounts actually received or paid. These reported realized foreign currency gains and losses are included in Net realized gain (loss) on foreign currency transactions on the Statement of Operations. Unrealized foreign currency gains and losses arise from changes (due to changes in exchange rates) in the value of foreign currency and other assets and liabilities denominated in foreign currencies, which are held at year end are included in Change in net unrealized appreciation/depreciation on foreign currency translations on the Statement of Operations.
| | | | | | | | |
| | | |
| JUNE 30, 2019 | | J.P. MORGAN FUNDS | | | | | 19 | |
NOTES TO FINANCIAL STATEMENTS
AS OF JUNE 30, 2019 (continued)
F. Security Transactions and Investment Income — Investment transactions are accounted for on the trade date (the date the order to buy or sell is executed). Securities gains and losses are calculated on a specifically identified cost basis. Interest income is determined on the basis of coupon interest accrued using the effective interest method which adjusts for amortization of premiums and accretion of discounts. Distributions of net investment income and realized capital gains from the Underlying Funds and ETFs, if any, are recorded on theex-dividend date.
G. Allocation of Income and Expenses — Expenses directly attributable to a fund are charged directly to that fund, while the expenses attributable to more than one fund of the Trust are allocated among the respective funds. In calculating the NAV of each class, investment income, realized and unrealized gains and losses and expenses, other than class-specific expenses, are allocated daily to each class of shares based upon the proportion of net assets of each class at the beginning of each day.
Transfer agency fees are class-specific expenses. The amount of the transfer agency fees charged to each share class of the Fund for the year ended June 30, 2019 are as follows:
| | | | | | | | | | | | | | | | | | | | | | | | | | | | | | | | |
| | | Class A | | | Class I | | | Class R2 | | | Class R3 | | | Class R4 | | | Class R5 | | | Class R6 | | | Total | |
Transfer agency fees | | $ | 8 | | | $ | 254 | | | $ | 4 | | | $ | 4 | | | $ | 4 | | | $ | 4 | | | $ | 7 | | | $ | 285 | |
The Fund invests in Underlying Funds and ETFs and, as a result, bears a portion of the expenses incurred by these Underlying Funds and ETFs. These expenses are not reflected in the expenses shown on the Statement of Operations and are not included in the ratios to average net assets shown in the Financial Highlights. Certain expenses of affiliated Underlying Funds and ETFs are waived as described in Note 3.F.
H. Federal Income Taxes — The Fund is treated as a separate taxable entity for Federal income tax purposes. The Fund’s policy is to comply with the provisions of the Internal Revenue Code (the “Code”), applicable to regulated investment companies and to distribute to shareholders all of its distributable net investment income and net realized capital gains on investments. Accordingly, no provision for Federal income tax is necessary. Management has reviewed the Fund’s tax positions for all open tax years and has determined that as of June 30, 2019, no liability for Federal income tax is required in the Fund’s financial statements for net unrecognized tax benefits. However, management’s conclusions may be subject to future review based on changes in, or the interpretation of, the accounting standards or tax laws and regulations. The Fund’s Federal tax returns for the prior three fiscal years remain, or since inception if shorter, subject to examination by the Internal Revenue Service.
I. Distributions to Shareholders — Distributions from net investment income are generally declared and paid annually and are declared separately for each class. No class has preferential dividend rights; differences in per share rates are due to differences in separate class expenses. Net realized capital gains, if any, are distributed at least annually. The amount of distributions from net investment income and net realized capital gains is determined in accordance with Federal income tax regulations, which may differ from GAAP. To the extent these “book/tax” differences are permanent in nature (i.e., that they result from other than timing of recognition — “temporary differences”), such amounts are reclassified within the capital accounts based on their Federaltax-basis treatment.
The following amounts were reclassified within the capital accounts:
| | | | | | | | | | | | |
| | | Paid-in-Capital | | | Accumulated
undistributed
(distributions in
excess of)
net investment
income | | | Accumulated
net realized
gains (losses) | |
| | $ | 1 | | | $ | 60,809 | | | $ | (60,810 | ) |
The reclassifications for the Fund relate primarily to foreign currency gains or losses and investments in regulated investment companies.
3. Fees and Other Transactions with Affiliates
A. Investment Advisory Fee — Pursuant to an Investment Advisory Agreement, the Adviser supervises the investments of the Fund and for such services is paid a fee. The fee is accrued daily and paid monthly at an annual rate of 0.35% of the Fund’s average daily net assets.
The Adviser waived Investment Advisory fees and/or reimbursed expenses as outlined in Note 3.F.
B. Administration Fee — Pursuant to an Administration Agreement, the Administrator provides certain administration services to the Fund. In consideration of these services, effective January 1, 2019, the Administrator receives a fee accrued daily and paid monthly at an annual rate of 0.075% of the first $10 billion of the Fund’s average daily net assets, plus 0.050% of the Fund’s average daily net assets between $10 billion and $20 billion, plus 0.025% of the Fund’s average daily net assets between $20 billion and $25 billion, plus 0.01% of the Fund’s average daily net assets in excess of $25 billion. Prior to January 1, 2019, the Administrator received a fee accrued daily and paid monthly at an annual rate of 0.15% of the first $25 billion of the average daily net assets of all funds in the J.P. Morgan Funds Complex covered by the Administration Agreement (excluding certain funds of funds and money market funds) and 0.075% of the average daily net assets in excess of $25 billion of all such funds. For the year ended June 30, 2019, the effective rate was 0.08% of the Fund’s average daily net assets, notwithstanding any fee waivers and/or expense reimbursements.
The Administrator waived Administration fees as outlined in Note 3.F.
| | | | | | |
| | | |
| 20 | | | | J.P. MORGAN FUNDS | | JUNE 30, 2019 |
JPMorgan Chase Bank, N.A. (“JPMCB”), a wholly-owned subsidiary of JPMorgan, serves as the Fund’ssub-administrator (the“Sub-administrator”). For its services asSub-administrator, JPMCB receives a portion of the fees payable to the Administrator.
C. Distribution Fees — Pursuant to a Distribution Agreement, JPMorgan Distribution Services, Inc. (“JPMDS”), an indirect, wholly-owned subsidiary of JPMorgan, serves as the Trust’s principal underwriter and promotes and arranges for the sale of the Fund’s shares.
The Board has adopted a Distribution Plan (the “Distribution Plan”) for Class A, Class R2 and Class R3 Shares of the Fund in accordance withRule 12b-1 under the 1940 Act. Class I, Class R4, Class R5 and Class R6 do not charge a distribution fee. The Distribution Plan provides that the Fund shall pay distribution fees, including payments to JPMDS, at annual rates of 0.25%, 0.50% and 0.25% of the average daily net assets of Class A, Class R2 and Class R3 Shares, respectively.
In addition, JPMDS is entitled to receive the front-end sales charges from purchases of Class A Shares and the CDSC from redemptions of certain Class A Shares for which front-end sales charges have been waived. For the year ended June 30, 2019, JPMDS did not retain any front-end sales charges or CDSC.
D. Service Fees — The Trust, on behalf of the Fund, has entered into a Shareholder Servicing Agreement with JPMDS under which JPMDS provides certain support services to the shareholders. For performing these services, JPMDS receives a fee, except for Class R6 Shares which do not charge a service fee, that is accrued daily and paid monthly equal to a percentage of the average daily net assets as shown in the table below:
| | | | | | | | | | | | | | | | | | | | | | |
| | | Class A | | Class I | | | R2 Class | | | R3 Class | | | R4 Class | | | R5 Class | |
| | 0.25% | | | 0.25 | % | | | 0.25 | % | | | 0.25 | % | | | 0.25 | % | | | 0.10 | % |
JPMDS has entered into shareholder services contracts with affiliated and unaffiliated financial intermediaries who provide shareholder services and other related services to their clients or customers who invest in the Fund under which JPMDS will pay all or a portion of such fees earned to financial intermediaries for performing such services.
JPMDS waived service fees as outlined in Note 3.F.
E. Custodian and Accounting Fees — JPMCB provides portfolio custody and accounting services to the Fund. For performing these services, the Fund pays JPMCB transaction and asset-based fees that vary according to the number of transactions and positions, plusout-of-pocket expenses. The amounts paid directly to JPMCB by the Fund for custody and accounting services are included in Custodian and accounting fees on the Statement of Operations.
Interest income earned on cash balances at the custodian, if any, is included in Interest income from affiliates on the Statement of Operations.
Interest expense paid to the custodian related to cash overdrafts, if any, is included in Interest expense to affiliates on the Statement of Operations.
F. Waivers and Reimbursements — The Adviser, Administrator and JPMDS have contractually agreed to waive fees and/or reimburse expenses to the extent that total annual operating expenses of the Fund, Underlying Funds and ETFs (excluding dividend and interest expenses related to short sales, interest, taxes, expenses related to litigation and potential litigation, expenses related to trustee elections and extraordinary expenses incurred by the Fund and any Underlying Fund and ETFs and acquired fund fees incurred by an Underlying Fund and ETFs) exceed the percentages of the Fund’s average daily net assets as shown in the table below:
| | | | | | | | | | | | | | | | | | | | | | | | | | | | |
| | | Class A | | | Class I | | | R2 Class | | | R3 Class | | | R4 Class | | | R5 Class | | | R6 Class | |
| | | 0.74 | % | | | 0.49 | % | | | 1.15 | % | | | 0.90 | % | | | 0.65 | % | | | 0.50 | % | | | 0.40 | % |
The expense limitation agreement was in effect for the year ended June 30, 2019 and is in place until at least October 31, 2019.
For the year ended June 30, 2019, the Fund’s service providers waived fees and/or reimbursed expenses for the Fund as follows. None of these parties expect the Fund to repay any such waived fees and reimbursed expenses in future years.
| | | | | | | | | | | | | | | | | | | | |
| | | Contractual Waivers | | | | |
| | | Investment
Advisory Fees | | | Administration
Fees | | | Service
Fees | | | Total | | | Contractual
Reimbursement | |
| | $ | 105,173 | | | $ | 23,455 | | | $ | 47,716 | | | $ | 176,344 | | | $ | 201,580 | |
The Underlying Funds may impose separate advisory and servicing fees. To avoid charging a servicing fee at an effective rate above 0.25% for Class A, Class I, Class R2, Class R3 and Class R4 Shares and above 0.10% for Class R5 Shares, JPMDS may waive servicing fees with respect to the Fund in an amount equal to the weighted averagepro-rata amount of servicing fees charged by the affiliated Underlying Funds. These waivers may be in addition to any waivers required to meet the Fund’s contractual expense limitations, but will not exceed the Fund’s servicing fees.
G. Other — Certain officers of the Trust are affiliated with the Adviser, the Administrator and JPMDS. Such officers, with the exception of the Chief Compliance Officer, receive no compensation from the Fund for serving in their respective roles.
The Board designated and appointed a Chief Compliance Officer to the Fund pursuant to Rule38a-1 under the 1940 Act. The Fund, along with affiliated funds, makes reimbursement payments, on apro-rata basis, to the Administrator for a portion of the fees associated with the office of the Chief Compliance Officer. Such fees are included in Trustees’ and Chief Compliance Officer’s fees on the Statement of Operations.
| | | | | | | | |
| | | |
| JUNE 30, 2019 | | J.P. MORGAN FUNDS | | | | | 21 | |
NOTES TO FINANCIAL STATEMENTS
AS OF JUNE 30, 2019 (continued)
The Trust adopted a Trustee Deferred Compensation Plan (the “Plan”) which allows the Independent Trustees to defer the receipt of all or a portion of compensation related to performance of their duties as Trustees. The deferred fees are invested in various J.P. Morgan Funds until distribution in accordance with the Plan.
The SEC has granted an exemptive order permitting the Fund to invest in certain financial instruments in addition to Underlying Funds and securities.
4. Investment Transactions
During the year ended June 30, 2019, purchases and sales of investments (excluding short-term investments) were as follows:
| | | | | | | | | | | | | | | | |
| | | Purchases
(excluding
U.S. Government) | | | Sales
(excluding
U.S. Government) | | | Purchases
of U.S.
Government | | | Sales
of U.S.
Government | |
| | $ | 14,660,711 | | | $ | 14,347,495 | | | $ | 402,674 | | | $ | 359,775 | |
5. Federal Income Tax Matters
For Federal income tax purposes, the estimated cost and unrealized appreciation (depreciation) in value of investments held at June 30, 2019 were as follows:
| | | | | | | | | | | | | | | | |
| | | Aggregate
Cost | | | Gross
Unrealized
Appreciation | | | Gross
Unrealized
Depreciation | | | Net Unrealized
Appreciation
(Depreciation) | |
| | $ | 29,377,663 | | | $ | 1,316,491 | | | $ | 42,613 | | | $ | 1,273,878 | |
The difference between book and tax basis appreciation (depreciation) on investments is primarily attributed to wash sale loss deferrals and mark to market of futures contracts.
The tax character of distributions paid during the year ended June 30, 2019 was as follows:
| | | | | | | | | | | | |
| | | Ordinary
Income* | | | Net
Long-Term
Capital Gains | | | Total
Distributions
Paid | |
| | $ | 1,078,615 | | | $ | 315,182 | | | $ | 1,393,797 | |
| * | Short-term gain distributions are treated as ordinary income for income tax purposes. |
The tax character of distributions paid during the year ended June 30, 2018 was as follows:
| | | | | | | | | | | | |
| | | Ordinary
Income* | | | Net
Long-Term
Capital Gains | | | Total
Distributions
Paid | |
| | $ | 774,083 | | | $ | 78,749 | | | $ | 852,832 | |
| * | Short-term gain distributions are treated as ordinary income for income tax purposes. |
As of June 30, 2019, the estimated components of net assets (excludingpaid-in-capital) on a tax basis were as follows:
| | | | | | | | | | | | |
| | | Current
Distributable
Ordinary
Income | | | Current
Distributable
Long-Term
Capital Gain or
(Tax Basis Capital
Loss Carryover) | | | Unrealized
Appreciation
(Depreciation) | |
| | $ | 405,267 | | | $ | 400,309 | | | $ | 1,234,385 | |
The cumulative timing differences primarily consist of wash sale loss deferrals, mark to market of futures contracts, trustee deferred compensation and straddle loss deferrals.
At June 30, 2019, the Fund did not have any net capital loss carryforwards.
Net capital losses incurred after October 31, and within the taxable year are deemed to arise on the first business day of the Fund’s next taxable year. For the year ended June 30, 2019 the Fund deferred to July 1, 2019 the following net capital losses of:
| | | | | | | | |
| | | Net Capital Losses | |
| | | Short-Term | | | Long-Term | |
| | $ | 417 | | | $ | — | |
| | | | | | |
| | | |
| 22 | | | | J.P. MORGAN FUNDS | | JUNE 30, 2019 |
6. Borrowings
The Fund relies upon an exemptive order granted by the SEC (the “Order”) permitting the establishment and operation of an Interfund Lending Facility (the “Facility”). The Facility allows the Fund to directly lend and borrow money to or from any other fund relying upon the Order at rates beneficial to both the borrowing and lending funds. Advances under the Facility are taken primarily for temporary or emergency purposes, including the meeting of redemption requests that otherwise might require the untimely disposition of securities, and are subject to the Fund’s borrowing restrictions. The Interfund loan rate is determined, as specified in the Order, by averaging the current repurchase agreement rate and the current bank loan rate. The Order was granted to JPMorgan Trust II and may be relied upon by the Fund because the Fund and the series of JPMorgan Trust II are both investment companies in the same “group of investment companies” (as defined in Section 12(d)(1)(G) of the 1940 Act).
The Trust and JPMCB have entered into a financing arrangement. Under this arrangement, JPMCB provides an unsecured, uncommitted credit facility in the aggregate amount of $100 million to certain of the J.P. Morgan Funds, including the Fund. Advances under the arrangement are taken primarily for temporary or emergency purposes, including the meeting of redemption requests that otherwise might require the untimely disposition of securities, and are subject to the Fund’s borrowing restrictions. Interest on borrowings is payable at a rate determined by JPMCB at the time of borrowing. This agreement has been extended until November 4, 2019.
The Fund had no borrowings outstanding from another fund or from the unsecured, uncommitted credit facility during the year ended June 30, 2019.
The Trust, along with certain other trusts (“Borrowers”), has entered into a joint syndicated senior unsecured revolving credit facility totaling $1.5 billion (“Credit Facility”) with various lenders and The Bank of New York Mellon, as administrative agent for the lenders. Effective August 14, 2018, the Fund was added to the Credit facility. This Credit Facility provides a source of funds to the Borrowers for temporary and emergency purposes, including the meeting of redemption requests that otherwise might require the untimely disposition of securities. Under the terms of the Credit Facility, a borrowing fund must have a minimum of $25,000,000 in adjusted net asset value and not exceed certain adjusted net asset coverage ratios prior to and during the time in which any borrowings are outstanding. If a fund does not comply with the aforementioned requirements, the fund must remediate within three business days with respect to the $25,000,000 minimum adjusted net asset value or within one business day with respect to certain asset coverage ratios or the administrative agent at the request of, or with the consent of, the lenders may terminate the Credit Facility and declare any outstanding borrowings to be due and payable immediately.
Interest associated with any borrowing under the Credit Facility is charged to the borrowing fund at a rate of interest equal to 1.00% plus the greater of the federal funds effective rate or one month LIBOR. The annual commitment fee to maintain the Credit Facility is 0.15% and is incurred on the unused portion of the Credit Facility and is allocated to all participating funds pro rata based on their respective net assets. Effective August 13, 2019, this agreement has been amended and restated for a term of 364 days, unless extended.
The Fund did not utilize the Credit Facility during the year ended June 30, 2019.
7. Risks, Concentrations and Indemnifications
In the normal course of business, the Fund enters into contracts that contain a variety of representations which provide general indemnifications. The Fund’s maximum exposure under these arrangements is unknown. The amount of exposure would depend on future claims that may be brought against the Fund. However, based on experience, the Fund expects the risk of loss to be remote.
As of June 30, 2019, all of the Fund’s shares were held by the Adviser.
Because of the Fund’s investments in the Underlying Funds and ETFs, the Fund indirectly pays a portion of the expenses incurred by the Underlying Funds and ETFs. As a result, the cost of investing in the Fund may be higher than the cost of investing in a mutual fund that invests directly in Individual securities and financial instruments. The Fund is also subject to certain risks related to the Underlying Funds’ and ETFs’ investments in securities and financial instruments such as equity securities, foreign and emerging markets securities and real estate securities. These securities are subject to risks specific to their structure, sector or market.
The Fund invests in unaffiliated ETFs. ETFs are pooled investment vehicles whose ownership interests are purchased and sold on a securities exchange. ETFs may be structured as investment companies, depositary receipts or other pooled investment vehicles and may be passively or actively managed. Passively managed ETFs generally seek to track the performance of a particular market index, including broad-based market indexes, as well as indexes relating to particular sectors, markets, regions or industries. Actively managed ETFs do not seek to track the performance of a particular market index. The price movement of an index-based ETF may not track the underlying index and may result in a loss. In addition, ETFs may trade at a price below or above their NAV (also known as a discount or premium, respectively).
In addition, the Underlying Funds and ETFs may use derivative instruments in connection with their individual investment strategies including futures contracts, forward foreign currency exchange contracts, options, swaps and other derivatives, which are also subject to specific risks related to their structure, sector or market and may be riskier than investments in other types of securities.
Derivatives may be riskier than other types of investments because they may be more sensitive to changes in economic and market conditions and could result in losses that significantly exceed the Fund’s original investment. Many derivatives create leverage thereby causing the Fund to be more volatile than they would have been if they had not used derivatives. Derivatives also expose the Fund to counterparty risk (the risk that the derivative counterparty will not fulfill its contractual obligations), including credit risk of the derivative counterparty. The possible lack of a liquid secondary market for derivatives and the resulting inability of the Fund to sell or otherwise close a derivatives position could expose the Fund to losses.
| | | | | | | | |
| | | |
| JUNE 30, 2019 | | J.P. MORGAN FUNDS | | | | | 23 | |
NOTES TO FINANCIAL STATEMENTS
AS OF JUNE 30, 2019 (continued)
Specific risks and concentrations present in the Underlying Funds and ETFs are disclosed within their individual financial statements and registration statements, as appropriate.
8. New Accounting Pronouncements
In August 2018, the Financial Accounting Standards Board (“FASB”) issuedAccounting Standard Update (“ASU”)2018-13 (“ASU2018-13”) Fair Value Measurement (Topic 820): Disclosure Framework — Changes to the Disclosure Requirements for Fair Value Measurement, which adds, removes, and modifies certain aspects of the fair value disclosure. ASU2018-13 amendments are the result of a broader disclosure project, FASB Concepts StatementConceptual Framework for Financial Reporting — Chapter 8: Notes to Financial Statements, to improve the effectiveness of the fair value disclosure requirements. ASU2018-13 is effective for the fiscal years, and interim periods within those fiscal years, beginning after December 15, 2019; early adoption is permitted. Management has evaluated the implications of these changes and the amendments are included in the financial statements, which had no effect to the Fund’s net assets or results of operation.
In August 2018, the SEC adopted the Disclosure Update and Simplification Rule (the “Rule”). The Rule is part of the SEC’s overall project to improve disclosure effectiveness by amending certain disclosure requirements that have become redundant, duplicative, overlapping, outdated, or superseded in light of other SEC disclosure requirements, U.S. GAAP, or changes in the information environment. The amendments are intended to facilitate the disclosure of information to investors and simplify compliance without significantly altering the total mix of information provided to investors. Management has evaluated the implications of these changes and the amendments are included in the financial statements, which had no effect on the Fund’s net assets or results of operation.
| | | | | | |
| | | |
| 24 | | | | J.P. MORGAN FUNDS | | JUNE 30, 2019 |
REPORT OF INDEPENDENT REGISTERED PUBLIC ACCOUNTING FIRM
Tothe Board of Trustees of JPMorgan Trust IV and Shareholders of JPMorgan SmartSpending 2050 Fund
Opinion on the Financial Statements
We have audited the accompanying statement of assets and liabilities, including the schedule of portfolio investments, of JPMorgan SmartSpending 2050 Fund (one of the funds constituting JPMorgan Trust IV, referred to hereafter the “Fund) as of June 30, 2019, the related statement of operations for the year ended June 30, 2019, the statements of changes in net assets for each of the two years in the period ended June 30, 2019, including the related notes,and the financial highlights for each of the two years in the period ended June 30, 2019 and for the period December 30, 2016 (commencement of operations) through June 30, 2017 (collectively referred to as the “financial statements”). In our opinion, the financial statements present fairly, in all material respects, the financial position of the Fund as of June 30, 2019, the results of its operations for the year then ended, the changes in its net assets for each of the two years in the period ended June 30, 2019and the financial highlights for each of the two years in the period ended June 30, 2019 and for the period December 30, 2016 (commencement of operations) through June 30, 2017in conformity with accounting principles generally accepted in the United States of America.
Basis for Opinion
These financial statements are the responsibility of the Fund’s management. Our responsibility is to express an opinion on the Fund’s financial statements based on our audits. We are a public accounting firm registered with the Public Company Accounting Oversight Board (United States) (PCAOB) and are required to be independent with respect to the Fund in accordance with the U.S. federal securities laws and the applicable rules and regulations of the Securities and Exchange Commission and the PCAOB.
We conducted our audits of these financial statements in accordance with the standards of the PCAOB. Those standards require that we plan and perform the audit to obtain reasonable assurance about whether the financial statements are free of material misstatement, whether due to error or fraud.
Our audits included performing procedures to assess the risks of material misstatement of the financial statements, whether due to error or fraud, and performing procedures that respond to those risks. Such procedures included examining, on a test basis, evidence regarding the amounts and disclosures in the financial statements. Our audits also included evaluating the accounting principles used and significant estimates made by management, as well as evaluating the overall presentation of the financial statements. Our procedures included confirmation of securities owned as of June 30, 2019by correspondence with the custodian, transfer agent and brokers; when replies were not received from brokers, we performed other auditing procedures. We believe that our audits provide a reasonable basis for our opinion.
/s/ PricewaterhouseCoopers LLP
New York, New York
August 23, 2019
We have served as the auditor of one or more investment companies in the JPMorgan Funds complex since 1993.
| | | | | | | | |
| | | |
| JUNE 30, 2019 | | J.P. MORGAN FUNDS | | | | | 25 | |
TRUSTEES
(Unaudited)
The Fund’s Statement of Additional Information includes additional information about the Fund’s Trustees and is available, without charge, upon request by calling1-800-480-4111 or on the J.P. Morgan Funds’ website at www.jpmorganfunds.com.
| | | | | | |
Name (Year of Birth); Positions With the Fund(1) | | Principal Occupation During Past 5 Years | | Number of
Funds in Fund
Complex Overseen
by Trustee (2) | | Other Directorships Held During the Past 5 Years |
Independent Trustees | | |
| | | |
| John F. Finn (1947); Trustee of Trust since 2005; Trustee of heritage One Group Mutual Funds since 1998. | | Chairman and Chief Executive Officer, Gardner, Inc. (supply chain management company serving industrial and consumer markets) (serving in various roles 1974-present). | | 134 | | Director, Greif, Inc. (GEF) (industrial package products and services)(2007-present); Trustee, Columbus Association for the Performing Arts (1988-present); Director, Cardinal Health, Inc. (CAH) (1994-2014). |
| | | |
| Stephen P. Fisher (1959); Trustee of Trust since 2018. | | Retired; Chairman and Chief Executive Officer, NYLIFE Distributors LLC (registered broker-dealer) (serving in various roles2008-2013); Chairman, NYLIM Service Company LLC (transfer agent) (2008-2017); New York Life Investment Management LLC (registered investment adviser) (serving in various roles 2005-2017); Chairman, IndexIQ Advisors LLC (registered investment adviser for ETFs)(2014-2017); President, MainStay VP Funds Trust (2007-2017), MainStay DefinedTerm Municipal Opportunities Fund (2011-2017) and MainStay Funds Trust (2007-2017) (registered investment companies). | | 134 | | Advisory Board Member, Scholarship Committee Member and Investment Committee Member, The First Tee of Plainfield(non-profit youth sports organization that provides need-based scholarships) (2014-present); Honors Program Advisory Board Member, The Zicklin School of Business, Baruch College, The City University of New York (2017-present). |
| | | |
| Kathleen M. Gallagher (1958); Trustee of the Trust since 2018. | | Retired; Chief Investment Officer — Benefit Plans, Ford Motor Company (serving in various roles 1985-2016). | | 134 | | Non-Executive Director, Legal & General Investment Management (Holdings) (2018-present); Non-Executive Director, Legal & General Investment Management America (financial services and insurance) (2017-present); Advisory Board Member, OCIO Board of State Street Global Advisors (2017-present); Member, Client Advisory Council, Financial Engines, LLC (registered investment adviser) (2011-2016); Director, Ford Pension Funds Investment Management Ltd.(2007-2016). |
| | | |
| Dr. Matthew Goldstein (1941); Chairman since 2013; Trustee of Trust since 2005; Trustee of heritage J.P. Morgan Funds since 2003. | | Chancellor Emeritus, City University of New York (2015-present); Professor, City University of New York (2013-present); Chancellor, City University of New York (1999-2013); President, Adelphi University (New York) (1998-1999). | | 134 | | Trustee, Museum of Jewish Heritage(2011-present); Trustee, National Museum of Mathematics (present); Chair, Association of College and University Administrators (present). |
| | | |
| Dennis P. Harrington* (1950); Trustee of Trust since 2017. | | Retired; Partner, Deloitte LLP (accounting firm) (serving in various roles 1984-2012). | | 134 | | None |
| | | |
| Frankie D. Hughes (1952); Trustee of Trust since 2008. | | President, Ashland Hughes Properties (property management) (2014-present); President and Chief Investment Officer, Hughes Capital Management, Inc. (fixed income asset management) (1993-2014). | | 134 | | None |
| | | | | | |
| | | |
| 26 | | | | J.P. MORGAN FUNDS | | JUNE 30, 2019 |
| | | | | | |
Name (Year of Birth); Positions With the Fund(1) | | Principal Occupation During Past 5 Years | | Number of
Funds in Fund
Complex Overseen
by Trustee (2) | | Other Directorships Held During the Past 5 Years |
Independent Trustees (continued) | | |
| | | |
Raymond Kanner** (1953); Trustee of Trust since 2017. | | Retired; Managing Director & Chief Investment Officer, IBM Retirement Funds (2007-2016). | | 134 | | Advisory Board Member, Los Angeles Capital (2018-present); Advisory Board Member, State Street Global Advisors OCIO Board (2017-present); Acting Executive Director, Committee on Investment of Employee Benefit Assets (CIEBA) (2016-2017); Advisory Board Member, Betterment for Business (robo advisor) (2016-2017); Advisory Board Member, Blue Star Indexes (index creator) (2013-2017); Director, Emerging Markets Growth Fund (registered investment company) (1997-2016); Member, Russell Index Client Advisory Board (2001-2015). |
| | | |
| Peter C. Marshall (1942); Trustee of Trust since 2005; Trustee of heritage One Group Mutual Funds since 1985. | | Self-employed business consultant
(2002-present). | | 134 | | None |
| | | |
| Mary E. Martinez (1960); Trustee of Trust since 2013. | | Associate, Special Properties, a Christie’s International Real Estate Affiliate(2010-present); Managing Director, Bank of America (Asset Management) (2007-2008); Chief Operating Officer, U.S. Trust Asset Management, U.S. Trust Company (asset management) (2003-2007); President, Excelsior Funds (registered investment companies) (2004-2005). | | 134 | | None |
| | | |
| Marilyn McCoy (1948); Trustee of Trust since 2005; Trustee of heritage One Group Mutual Funds since 1999. | | Vice President of Administration and Planning, Northwestern University (1985-present). | | 134 | | None |
| | | |
| Mitchell M. Merin (1953); Trustee of Trust since 2013. | | Retired; President and Chief Operating Officer, Morgan Stanley Investment Management, Member Morgan Stanley & Co. Management Committee (serving in various roles 1981-2006). | | 134 | | Director, Sun Life Financial (SLF) (financial services and insurance) (2007-2013). |
| | | |
| Dr. Robert A. Oden, Jr. (1946); Trustee of Trust since 2005; Trustee of heritage One Group Mutual Funds since 1997. | | Retired; President, Carleton College(2002-2010); President, Kenyon College(1995-2002). | | 134 | | Trustee, Trout Unlimited(2017-present); Trustee, American Museum of Fly Fishing (2013-present); Vice Chair, Dartmouth-Hitchcock Medical Center (2011-present); Trustee, American University in Cairo (1999-2014). |
| | | |
| Marian U. Pardo*** (1946); Trustee of Trust since 2013. | | Managing Director and Founder, Virtual Capital Management LLC (investment consulting)(2007-present); Managing Director, Credit Suisse Asset Management (portfolio manager)(2003-2006). | | 134 | | President and Member, Board of Governors, Columbus Citizens Foundation (not-for-profit supporting philanthropic and cultural programs) (2006-present). |
| | | | | | | | |
| | | |
| JUNE 30, 2019 | | J.P. MORGAN FUNDS | | | | | 27 | |
TRUSTEES
(Unaudited) (continued)
| (1) | The Trustees serve for an indefinite term, subject to the Trust’s current retirement policy, which is age 78 for all Trustees. |
| (2) | A Fund Complex means two or more registered investment companies that hold themselves out to investors as related companies for purposes of investment and investor services or have a common investment adviser or have an investment adviser that is an affiliated person of the investment adviser of any of the other registered investment companies. The J.P. Morgan Funds Complex for which the Board of Trustees serves currently includes eleven registered investment companies (134 funds). |
| * | Two family members of Mr. Harrington are partner and managing director, respectively, of the Fund’s independent registered public accounting firm. Such firm has represented to the Board that those family members are not involved in the audit of the Fund’s financial statements and do not provide other services to the Fund. The Board has concluded that such association does not interfere with Mr. Harrington’s exercise of independent judgment as an Independent Trustee. |
| ** | A family member of Mr. Kanner is employed by JPMorgan Chase Bank, which is affiliated with JPMIM and JPMDS. In that capacity, this employee provides services to various JPMorgan affiliates including JPMIM and JPMDS and for which JPMIM and JPMDS bear some portion of the expense thereof. |
| *** | In connection with prior employment with JPMorgan Chase, Ms. Pardo was the recipient ofnon-qualified pension plan payments from JPMorgan Chase in the amount of approximately $2,055 per month, which she irrevocably waived effective January 1, 2013, and deferred compensation payments from JPMorgan Chase in the amount of approximately $7,294 per year, which ended in January 2013. In addition, Ms. Pardo receives payments from a fully-funded qualified plan, which is not an obligation of JPMorgan Chase. |
The contact address for each of the Trustees is 277 Park Avenue, New York, NY 10172.
| | | | | | |
| | | |
| 28 | | | | J.P. MORGAN FUNDS | | JUNE 30, 2019 |
OFFICERS
(Unaudited)
| | |
Name (Year of Birth), Positions Held with the Trust (Since) | | Principal Occupations During Past 5 Years |
| |
Brian S. Shlissel (1964),
President and Principal Executive Officer (2016) | | Managing Director and Chief Administrative Officer for J.P. Morgan pooled vehicles, J.P. Morgan Investment Management Inc. (formerly JPMorgan Funds Management, Inc.) (from 2014 to present); Managing Director and Head of Mutual Fund Services, Allianz Global Investors; President and Chief Executive Officer, Allianz Global Investors Mutual Funds and PIMCO Closed-End Funds (from 1999 to 2014). |
| |
Timothy J. Clemens (1975), Treasurer and Principal Financial Officer (2018)* | | Executive Director, J.P. Morgan Investment Management Inc. (formerly JPMorgan Funds Management, Inc.) since February 2016; Vice President, JPMorgan Funds Management, Inc. from October 2013 to January 2016. |
| |
Gregory S. Samuels (1980),
Secretary (2019)* (formerly Assistant Secretary since 2010) | | Executive Director and Assistant General Counsel, JPMorgan Chase since 2014; formerly Vice President and Assistant General Counsel, JPMorgan Chase from 2010 to February 2014. |
| |
Stephen M. Ungerman (1953),
Chief Compliance Officer (2005) | | Managing Director, JPMorgan Chase & Co.; Mr. Ungerman has been with JPMorgan Chase & Co. since 2000. |
| |
Elizabeth A. Davin (1964), Assistant Secretary (2005)** | | Executive Director and Assistant General Counsel, JPMorgan Chase since February 2012; formerly Vice President and Assistant General Counsel, JPMorgan Chase from 2005 to February 2012; Senior Counsel, JPMorgan Chase (formerly Bank One Corporation) from 2004 to 2005. |
| |
Jessica K. Ditullio (1962),
Assistant Secretary (2005)** | | Executive Director and Assistant General Counsel, JPMorgan Chase. Ms. Ditullio has been with JPMorgan Chase (formerly Bank One Corporation) since 1990. |
| |
Anthony Geron (1971),
Assistant Secretary (2018)* | | Vice President and Assistant General Counsel, JPMorgan Chase since September 2018; Lead Director and Counsel, AXA Equitable Life Insurance Company from 2015 to 2018 and Senior Director and Counsel, AXA Equitable Life Insurance Company from 2014 to 2015; Associate, Willkie Farr & Gallagher (law firm) from 2007 to 2014. |
| |
Carmine Lekstutis (1980),
Assistant Secretary (2011)* | | Executive Director and Assistant General Counsel, JPMorgan Chase since February 2015; formerly Vice President and Assistant General Counsel, JPMorgan Chase from 2011 to February 2015. |
| |
Keri E. Riemer (1976),
Assistant Secretary (2019)* | | Executive Director and Assistant General Counsel, JPMorgan Chase since February 2019; Counsel, Seward & Kissel LLP (2016-2019); Associate, Seward & Kissel LLP (2011-2016). |
| |
Zachary E. Vonnegut-Gabovitch (1986), Assistant Secretary (2017)* | | Vice President and Assistant General Counsel, JPMorgan Chase since September 2016; Associate, Morgan, Lewis & Bockius (law firm) from 2012 to 2016. |
| |
Michael M. D’Ambrosio (1969),
Assistant Treasurer (2012) | | Managing Director, J.P. Morgan Investment Management Inc. (formerly JPMorgan Funds Management, Inc.) since May 2014; formerly Executive Director, JPMorgan Funds Management, Inc. from 2012 to May 2014. |
| |
Aleksandr Fleytekh (1972), Assistant Treasurer (2019)* | | Vice President, J.P. Morgan Investment Management Inc. (formerly JPMorgan Funds Management, Inc.) since February 2012. |
| |
Shannon Gaines (1977),
Assistant Treasurer (2018)** | | Vice President, J.P. Morgan Investment Management Inc. (formerly JPMorgan Funds Management, Inc.) since January 2014. |
| |
Jeffrey D. House (1972), Assistant Treasurer (2017)** | | Vice President, J.P. Morgan Investment Management Inc. (formerly JPMorgan Funds Management, Inc.) since July 2006. |
| |
Lauren A. Paino (1973), Assistant Treasurer (2014)* | | Executive Director, J.P. Morgan Investment Management Inc. (formerly JPMorgan Funds Management, Inc.) since August 2013. |
| |
Joseph Parascondola (1963),
Assistant Treasurer (2011)* | | Vice President, J.P. Morgan Investment Management Inc. (formerly JPMorgan Funds Management, Inc.) since August 2006. |
| |
Gillian I. Sands (1969),
Assistant Treasurer (2012)* | | Vice President, J.P. Morgan Investment Management Inc. (formerly JPMorgan Funds Management, Inc.) since September 2012. |
The contact address for each of the officers, unless otherwise noted, is 277 Park Avenue, New York, NY 10172.
| * | The contact address for the officer is 4 New York Plaza, New York, NY 10004. |
| ** | The contact address for the officer is 1111 Polaris Parkway, Columbus, OH 43240. |
| | | | | | | | |
| | | |
| JUNE 30, 2019 | | J.P. MORGAN FUNDS | | | | | 29 | |
SCHEDULE OF SHAREHOLDER EXPENSES
(Unaudited)
Hypothetical $1,000 Investment
As a shareholder of the Fund, you incur two types of costs: (1) transaction costs, including sales charges (loads) on purchase payments and (2) ongoing costs, including investment advisory fees, administration fees, distribution fees and other Fund expenses. The examples below are intended to help you understand your ongoing costs (in dollars) of investing in the Fund (not including expenses of the Underlying Funds) and to compare these ongoing costs with the ongoing costs of investing in other mutual funds. The examples assume that you had a $1,000 investment in each Class at the beginning of the reporting period, January 1, 2019, and continued to hold your shares at the end of the reporting period, June 30, 2019.
Actual Expenses
For each Class of the Fund in the table below, the first line provides information about actual account values and actual expenses. You may use the information in this line, together with the amount you invested, to estimate the expenses that you paid over the period. Simply divide your account value by $1,000 (for example, an $8,600 account value divided by $1,000 = 8.6), then multiply the result by the number in the first line of each Class under the heading entitled “Expenses Paid During the Period” to estimate the expenses you paid on your account during this period.
Hypothetical Example for Comparison Purposes
The second line of each Class in the table below provides information about hypothetical account values and hypothetical expenses based on the Class’ actual expense ratio and an assumed rate of return of 5% per year before expenses, which is not the Class’ actual return. The hypothetical account values and expenses may not be used to estimate the actual ending account balance or expenses you paid for the period. You may use this information to compare the ongoing costs of investing in the Class of the Fund and other funds. To do so, compare this 5% hypothetical example with the 5% hypothetical examples that appear in the shareholder reports of the other funds. Please note that the expenses shown in the table are meant to highlight your ongoing costs only and do not reflect any transaction costs, such as sales charges (loads) or redemption fees, and expenses of the Underlying Funds. Therefore, the second line for each Class in the table is useful in comparing ongoing costs only, and will not help you determine the relative total costs of owning different funds. In addition, if these transaction costs were included, your costs would have been higher. The examples also assume all dividends and distributions have been reinvested.
| | | | | | | | | | | | | | | | |
| | | Beginning
Account Value
January 1, 2019 | | | Ending
Account Value
June 30, 2019 | | | Expenses
Paid During
the Period* | | | Annualized
Expense
Ratio | |
JPMorgan SmartSpending 2050 Fund | | | | | | | | | | | | | | | | |
Class A | | | | | | | | | | | | | | | | |
Actual | | $ | 1,000.00 | | | $ | 1,080.50 | | | $ | 2.27 | | | | 0.44 | % |
Hypothetical | | | 1,000.00 | | | | 1,022.61 | | | | 2.21 | | | | 0.44 | |
Class I | | | | | | | | | | | | | | | | |
Actual | | | 1,000.00 | | | | 1,081.90 | | | | 0.98 | | | | 0.19 | |
Hypothetical | | | 1,000.00 | | | | 1,023.85 | | | | 0.95 | | | | 0.19 | |
Class R2 | | | | | | | | | | | | | | | | |
Actual | | | 1,000.00 | | | | 1,078.50 | | | | 4.38 | | | | 0.85 | |
Hypothetical | | | 1,000.00 | | | | 1,020.58 | | | | 4.26 | | | | 0.85 | |
Class R3 | | | | | | | | | | | | | | | | |
Actual | | | 1,000.00 | | | | 1,079.80 | | | | 3.09 | | | | 0.60 | |
Hypothetical | | | 1,000.00 | | | | 1,021.82 | | | | 3.01 | | | | 0.60 | |
Class R4 | | | | | | | | | | | | | | | | |
Actual | | | 1,000.00 | | | | 1,081.20 | | | | 1.81 | | | | 0.35 | |
Hypothetical | | | 1,000.00 | | | | 1,023.06 | | | | 1.76 | | | | 0.35 | |
Class R5 | | | | | | | | | | | | | | | | |
Actual | | | 1,000.00 | | | | 1,081.90 | | | | 1.03 | | | | 0.20 | |
Hypothetical | | | 1,000.00 | | | | 1,023.80 | | | | 1.00 | | | | 0.20 | |
Class R6 | | | | | | | | | | | | | | | | |
Actual | | | 1,000.00 | | | | 1,082.50 | | | | 0.52 | | | | 0.10 | |
Hypothetical | | | 1,000.00 | | | | 1,024.30 | | | | 0.50 | | | | 0.10 | |
| * | Expenses are equal to each Class’ respective annualized expense ratio, multiplied by the average account value over the period, multiplied by 181/365 (to reflect the one-half year period). |
| | | | | | |
| | | |
| 30 | | | | J.P. MORGAN FUNDS | | JUNE 30, 2019 |
TAX LETTER
(Unaudited)
Certain tax information for the J.P. Morgan Funds is required to be provided to shareholders based upon the Fund’s income and distributions for the taxable year ended June 30, 2019. The information and distributions reported in this letter may differ from the information and taxable distributions reported to the shareholders for the calendar year ending December 31, 2019. The information necessary to complete your income tax returns for the calendar year ending December 31, 2019 will be provided under separate cover.
Dividends Received Deduction (DRD)
The Fund had 6.04%, or maximum allowable percentage, of ordinary income distributions eligible for the dividends
received deduction for corporate shareholders for the fiscal year ended June 30, 2019.
Long-Term Capital Gain
The Fund distributed $315,182, or maximum allowable amount, of long-term capital gain dividends for the fiscal year ended June 30, 2019.
Qualified Dividend Income (QDI)
The Fund had $170,644, or maximum allowable amount, of ordinary income distributions treated as qualified dividends for the fiscal year ended June 30, 2019.
| | | | | | | | |
| | | |
| JUNE 30, 2019 | | J.P. MORGAN FUNDS | | | | | 31 | |

Rev. January 2011
| | |
| | |
| FACTS | | WHAT DOES J.P. MORGAN FUNDS DO WITH YOUR PERSONAL INFORMATION? |
| | |
| Why? | | Financial companies choose how they share your personal information. Federal law gives consumers the right to limit some but not all sharing. Federal law also requires us to tell you how we collect, share, and protect your personal information. Please read this notice carefully to understand what we do. |
| | |
| What? | | The types of personal information we collect and share depend on the product or service you have with us. This information can include: ◾ Social Security number and account balances ◾ transaction history and account transactions ◾ checking account information and wire transfer instructions When you areno longer our customer, we continue to share your information as described in this notice. |
| | |
| How? | | All financial companies need to share customers’ personal information to run their everyday business. In the section below, we list the reasons financial companies can share their customers’ personal information; the reasons J.P. Morgan Funds chooses to share; and whether you can limit this sharing. |
| | | | |
| | | |
| Reasons we can share your personal information | | Does J.P. Morgan
Funds share? | | Can you limit this
sharing? |
For our everyday business purposes — such as to process your transactions, maintain your account(s), respond to court orders and legal investigations, or report to credit bureaus | | Yes | | No |
For marketing purposes — to offer our products and services to you | | Yes | | No |
| For joint marketing with other financial companies | | No | | We don’t share |
For our affiliates’ everyday business purposes — information about your transactions and experiences | | No | | We don’t share |
For our affiliates’ everyday business purposes — information about your creditworthiness | | No | | We don’t share |
| For nonaffiliates to market to you | | No | | We don’t share |
| | |
| | |
| Questions? | | Call1-800-480-4111 or go to www.jpmorganfunds.com |

| | |
| |
| Who we are |
| Who is providing this notice? | | J.P. Morgan Funds |
| | |
| |
| What we do |
| How does J.P. Morgan Funds protect my personal information? | | To protect your personal information from unauthorized access and use, we use security measures that comply with federal law. These measures include computer safeguards and secured files and buildings. We authorize our employees to access your information only when they need it to do their work and we require companies that work for us to protect your information. |
How does J.P. Morgan Funds collect my personal information? | | We collect your personal information, for example, when you: ◾ open an account or provide contact information ◾ give us your account information or pay us by check ◾ make a wire transfer We also collect your personal information from others, such as credit bureaus, affiliates and other companies. |
| Why can’t I limit all sharing? | | Federal law gives you the right to limit only ◾ sharing for affiliates’ everyday business purposes – information about your creditworthiness ◾ affiliates from using your information to market to you ◾ sharing for nonaffiliates to market to you State laws and individual companies may give you additional rights to limit sharing. |
| | |
| |
| Definitions |
| Affiliates | | Companies related by common ownership or control. They can be financial and nonfinancial companies. ◾ J.P. Morgan Funds does not share with our affiliates. |
| Nonaffiliates | | Companies not related by common ownership or control. They can be financial and nonfinancial companies. ◾ J.P. Morgan Funds does not share with nonaffiliates so they can market to you. |
| Joint Marketing | | A formal agreement between nonaffiliated financial companies that together market financial products or services to you. ◾ J.P. Morgan Funds doesn’t jointly market. |
J.P. Morgan Funds are distributed by JPMorgan Distribution Services, Inc., which is an affiliate of JPMorgan Chase & Co. Affiliates of JPMorgan Chase & Co. receive fees for providing various services to the funds.
Contact JPMorgan Distribution Services, Inc. at1-800-480-4111 for a fund prospectus. You can also visit us at www.jpmorganfunds.com. Investors should carefully consider the investment objectives and risk as well as charges and expenses of the mutual fund before investing. The prospectus contains this and other information about the mutual fund. Read the prospectus carefully before investing.
Investors may obtain information about the Securities Investor Protection Corporation (SIPC), including the SIPC brochure, by visiting www.sipc.org or by calling SIPC at202-371-8300.
The Fund files a complete schedule of its fund holdings for the first and third quarters of its fiscal year with the SEC onForm N-PORT. Prior to March 31, 2019, the Fund filed a complete schedule of its fund holdings for the first and third quarters of its fiscal year with the SEC on Form N-Q. The Fund’s Form N-PORT and Form N-Q are available on the SEC’s website at http://www.sec.gov. The Fund’s quarterly holdings can be found by visiting the J.P. Morgan Funds’ website at www.jpmorganfunds.com.
A description of the Fund’s policies and procedures with respect to the disclosure of the Fund’s holdings is available in the prospectuses and Statement of Additional Information.
A copy of proxy policies and procedures is available without charge upon request by calling1-800-480-4111 and on the Fund’s website at www.jpmorganfunds.com. A description of such policies and procedures is on the SEC’s website at www.sec.gov. The Trustees have delegated the authority to vote proxies for securities owned by the Fund to the Adviser. A copy of the Fund’s voting record for the most recent12-month period ended June 30 is available on the SEC’s website at www.sec.gov or at the Fund’s website at www.jpmorganfunds.com no later than August 31 of each year. The Fund’s proxy voting record will include, among other things, a brief description of the matter voted on for each fund security, and will state how each vote was cast, for example, for or against the proposal.


J.P. Morgan Asset Management is the brand name for the asset management businesses of JPMorgan Chase & Co. and its affiliates worldwide.
| | | | |
| | © JPMorgan Chase & Co., 2019. All rights reserved. June 2019. | | AN-SS2050-619 |
J.P. Morgan Funds
Annual Report
June 30, 2019
JPMorgan Value Plus Fund
Contents
Investments in the Fund are not deposits or obligations of, or guaranteed or endorsed by, any bank and are not insured or guaranteed by the FDIC, the Federal Reserve Board or any other government agency. You could lose money if you sell when the Fund’s share price is lower than when you invested.
Past performance is no guarantee of future performance. The general market views expressed in this report are opinions based on market and other conditions through the end of the reporting period and are subject to change without notice. These views are not intended to predict the future performance of the Fund or the securities markets. References to specific securities and their issuers are for illustrative purposes only and are not intended to be, and should not be interpreted as, recommendations to purchase or sell such securities. Such views are not meant as investment advice and may not be relied on as an indication of trading intent on behalf of the Fund.
Prospective investors should refer to the Fund’s prospectus for a discussion of the Fund’s investment objective, strategy and risks. Call J.P. Morgan Funds Service Center at1-800-480-4111 for a prospectus containing more complete information about the Fund, including management fees and other expenses. Please read it carefully before investing.
LETTER TO SHAREHOLDERS
July 31, 2019 (Unaudited)
“We believe that a well-diversified portfolio and a patient outlook may best allow investors to benefit from market opportunities presented by the current economic backdrop.”
--Andrea L. Lisher
July 31, 2019
Dear Shareholders,
Even as the pace of growth slowed, the global economic expansion continued and financial markets largely provided positive returns for the twelve months ended June 30, 2019. Central banks in the U.S. and elsewhere moved to support continued economic expansion in 2019, and low interest rates, growth in corporate profits and general investor optimism added further support to both equity and bond markets.
The U.S. economy generally outpaced other developed market nations throughout the twelve month reporting period and the U.S. expansion became the longest on record by the end of June 2019. However, growth in U.S. gross domestic product (GDP) slowed significantly to 2.1% in the second quarter of 2019 from 3.1% in the first quarter. At the same time, the U.S. unemployment rate remained below 4% for all but one month of the reporting period.
After reaching record highs in August and September 2018, U.S. equity prices tumbled sharply in December amid investor concerns about slowing global growth, unresolved U.S.-China trade tensions and expectations for further interest rate increases by the U.S. Federal Reserve (the “Fed”). For the month of December, the S&P 500 Index fell by 9.03%.
By the end of 2018, the Fed indicated it would enact fewer-than-expected interest rate increases in 2019. In January 2019, financial markets began to stabilize and started a rebound that would push equity prices back to record highs at the end of April and again bymid-June. For the twelve month reporting period, the S&P 500 returned 10.42%.
In certain other developed economies, economic growth remained sluggish. The19-nation euro area experienced a decline in GDP growth from 1.2% in the first quarter of 2019 to 1.1% in the second quarter of 2019. Notably, manufacturing data weakened in 2019. However, unemployment continued to fall throughout the reporting period and the 7.5% euro area jobless rate by the end June 2019 was the lowest since the2008-09 financial crisis.
In response to slowing economic expansion, the potential for slowing job growth and declining consumer confidence, European Central Bank President Mario Draghi said the bank would loosen monetary policy in the absence of improvement in the economy of the European Union. Meanwhile, the Bank of England held interest rates steady as U.K. GDP growth rebounded to 1.8% in the first quarter of 2019 from 1.4% in the final quarter of 2018. Political uncertainty surrounding negotiations for U.K.’s exit from the European Union continued throughout the reporting period and the inability of Theresa May to win Parliamentary support for her proposed Brexit plan preceded her resignation as prime minister in June. For the twelve month reporting period, the MSCI EAFE Index returned 1.60%.
Following signs of slowing growth, China unveiled a range of policies intended to stimulate domestic demand, including tax cuts, infrastructure spending and measures to support bank lending. However, slowing global demand and an increase in U.S. tariffs on Chinese-made goods continued to weigh on the economy of China as well certain of its trading partners across Asia. During the second half of the reporting period, emerging markets largely benefitted investor appetite for higher yielding assets. While the MSCI Emerging Markets Index returned 1.61% for reporting period, the Bloomberg Barclays Emerging Markets Aggregate Index returned 10.95%.
1
Subsequent to the end of the reporting period, the Fed cut its benchmark interest rate for the first time in eleven years. The central bank cited slowing global growth and “muted inflation pressures” in its accompanying statement.
We believe that a well-diversified portfolio and a patient outlook may best allow investors to benefit from market opportunities presented by the current economic backdrop. We look forward to managing your investment needs for years to come. Thank you for entrusting J.P. Morgan Asset Management to manage assets on your behalf. Should you have any questions, please visit www.jpmorganfunds.com or contact the J.P. Morgan Funds Service Center at1-800-480-4111.
Sincerely yours,
Andrea L. Lisher
Head of Americas, J.P. Morgan Global Funds
J.P. Morgan Asset Management
2
JPMorgan Value Plus Fund
FUND SUMMARY
TWELVE MONTHS ENDED JUNE 30, 2019 (Unaudited)
| | | | |
REPORTING PERIOD RETURN: | | | | |
Fund (Class I Shares)* | | | 1.42% | |
Russell 1000 Value Index | | | 8.46% | |
| |
Net Assets as of 6/30/2019 | | | $ 13,510,554 | |
INVESTMENT OBJECTIVE**
The JPMorgan Value Plus Fund (the “Fund”) seeks to provide long-term capital appreciation.
HOW DID THE MARKETS PERFORM?
Equity prices rebounded from two sharp sell-offs and U.S. equity largely outperformed both developed and emerging markets equity during the reporting period.
Growth in corporate profits, low interest rates and the continued growth in the global economy bolstered financial markets throughout the reporting period. However, investor concerns about the direction of U.S. interest rates and rising trade tensions and signs of slowing economic activity in China and Europe helped fuel significant market downturns in late 2018 and again in May 2019.
Leading equity indexes plummeted in the second half of December 2018 amid slowing global economic growth, unresolved U.S.-China trade tensions and investor concerns over rising interest rates.
However, financial market volatility stabilized in January 2019 and U.S. equity prices rebounded over the next few months and returned to record high levels by April 2019. Global equity markets slumped in May 2019 and leading indexes in the U.S. and Asian developed markets, as well as in emerging markets, dropped by more than 6%. However, global equity prices rebounded again in June 2019.
Within U.S. equity, large cap and mid cap stocks generally outperformed small cap stocks and growth stocks continued to outperform value stocks.
WHAT WERE THE MAIN DRIVERS OF THE FUND’S PERFORMANCE?
The Fund’s Class I Shares underperformed the Russell 1000 Value Index (the “Benchmark”) for the twelve months ended June 30, 2019. Relative to the Benchmark, the Fund’s underweight position and security selection in the pharmaceuticals/medical technology sector and its security selection in the energy sector were leading detractors from performance. The Fund’s security selection in the telecommunications sector and the software & services sector was a leading contributor to relative performance.
Leading individual detractors from relative performance included the Fund’s overweight positions in U.S. Steel Corp., Mohawk Industries Inc. and Eastman Chemical Co. Shares of U.S. Steel, a steelmaker, fell amid investor expectations for slowing global economic growth and weakening demand for steel. Shares of Mohawk Industries, a maker of commercial and residential flooring, fell after the company reported lower-than-expected revenue for the first quarter of 2019. Shares of Eastman Chemical, a specialty chemical manufacturer, fell after the company reported lower-than-expected earnings and revenue for the first quarter of 2019.
3
JPMorgan Value Plus Fund
FUND SUMMARY
TWELVE MONTHS ENDED JUNE 30, 2019 (Unaudited) (continued)
Leading individual contributors to relative performance included the Fund’s overweight positions in FMC Corp. and Crown Holdings Inc. and its short position in Kroger Co. Shares of FMC, a diversified chemicals manufacturer, rose after the company raised its earnings and revenue forecasts for the second quarter and full year 2019. Shares of Crown Holdings, a consumer products packaging maker not held in the Benchmark, rose after the company reported earnings and revenue growth for the first quarter of 2019 and reaffirmed its forecast for the full year 2019. Shares of Kroger, a department store and supermarkets operator, fell after it reported lower-than-expected earnings for the fourth quarter of 2018.
HOW WAS THE FUND POSITIONED?
The Fund’s portfolio managers employed a research-driven approach to identify what they believed were undervalued securities in each sector of the U.S. equity market.
| | | | | | |
TOP TEN LONG POSITIONS OF THE PORTFOLIO*** |
| | | | | | |
1. FMC Corp. | | | 4.2 | % | | |
2. Comcast Corp., Class A | | | 4.1 | | | |
3. Pfizer, Inc. | | | 2.5 | | | |
4. Ventas, Inc. | | | 2.5 | | | |
5. Berkshire Hathaway, Inc., Class B | | | 2.4 | | | |
6. Anadarko Petroleum Corp. | | | 2.3 | | | |
7. Philip Morris International, Inc. | | | 2.3 | | | |
8. Cigna Corp. | | | 1.9 | | | |
9. Merck & Co., Inc. | | | 1.9 | | | |
10. Charter Communications, Inc., Class A | | | 1.8 | | | |
|
TOP TEN SHORT POSITIONS OF THE PORTFOLIO**** |
| | | | | | |
1. Westlake Chemical Corp. | | | 7.0 | % | | |
2. Kroger Co. (The) | | | 6.8 | | | |
3. LyondellBasell Industries NV, Class A | | | 5.5 | | | |
4. Acuity Brands, Inc. | | | 5.3 | | | |
5. Albemarle Corp. | | | 5.2 | | | |
6. Simon Property Group, Inc. | | | 4.7 | | | |
7. Torchmark Corp. | | | 4.1 | | | |
8. Walgreens Boots Alliance, Inc. | | | 3.6 | | | |
9. Starbucks Corp. | | | 3.1 | | | |
10. Ball Corp. | | | 2.6 | | | |
|
LONG POSITION PORTFOLIO COMPOSITION BY SECTOR*** |
| | | | | | |
Financials | | | 18.1 | % | | |
Health Care | | | 16.8 | | | |
Materials | | | 8.5 | | | |
Energy | | | 8.4 | | | |
Real Estate | | | 7.9 | | | |
Communication Services | | | 7.7 | | | |
Consumer Staples | | | 7.7 | | | |
Consumer Discretionary | | | 7.0 | | | |
Industrials | | | 5.7 | | | |
Utilities | | | 5.4 | | | |
Information Technology | | | 3.7 | | | |
Short-Term Investments | | | 3.1 | | | |
4
JPMorgan Value Plus Fund
FUND SUMMARY
TWELVE MONTHS ENDED JUNE 30, 2019 (Unaudited) (continued)
| | | | | | |
SHORT POSITION PORTFOLIO COMPOSITION BY SECTOR**** |
| | | | | | |
Materials | | | 23.9 | % | | |
Consumer Discretionary | | | 15.1 | | | |
Industrials | | | 14.9 | | | |
Consumer Staples | | | 10.4 | | | |
Information Technology | | | 8.9 | | | |
Health Care | | | 7.5 | | | |
Real Estate | | | 7.5 | | | |
Financials | | | 5.5 | | | |
Energy | | | 4.4 | | | |
Communication Services | | | 1.9 | | | |
| * | The return shown is based on net asset values calculated for shareholder transactions and may differ from the return shown in the financial highlights, which reflects adjustments made to the net asset values in accordance with accounting principles generally accepted in the United States of America. |
| ** | The adviser seeks to achieve the Fund’s objective. There can be no guarantee it will be achieved. |
| *** | Percentages indicated are based on total long investments as of June 30, 2019. The Fund’s portfolio composition is subject to change. |
| **** | Percentages indicated are based on total short investments as of June 30, 2019. The Fund’s portfolio composition is subject to change. |
5
JPMorgan Value Plus Fund
FUND SUMMARY
TWELVE MONTHS ENDED JUNE 30, 2019 (Unaudited) (continued)
AVERAGE ANNUAL TOTAL RETURNS AS OF JUNE 30, 2019
| | | | | | | | |
| | | INCEPTION DATE | | | | | |
| | | OF CLASS | | 1 YEAR | | SINCE INCEPTION | |
CLASS A SHARES | | August 31, 2016 | | | | | | |
With Sales Charge* | | | | (4.16)% | | | 8.87% | |
Without Sales Charge | | | | 1.14 | | | 10.96 | |
CLASS C SHARES | | August 31, 2016 | | | | | | |
With CDSC** | | | | (0.36) | | | 10.40 | |
Without CDSC | | | | 0.64 | | | 10.40 | |
CLASS I SHARES | | August 31, 2016 | | 1.42 | | | 11.24 | |
* Sales Charge for Class A Shares is 5.25%.
** Assumes a 1% CDSC (contingent deferred sales charge) for the one year periods and 0% CDSC thereafter.
LIFE OF FUND PERFORMANCE (8/31/16 TO 06/30/19)
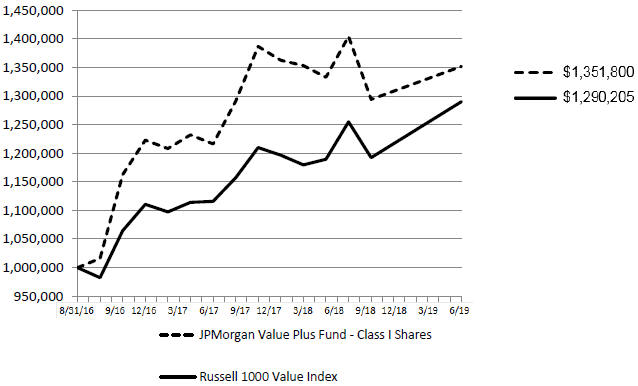
The performance quoted is past performance and is not a guarantee of future results. Mutual funds are subject to certain market risks. Investment returns and principal value of an investment will fluctuate so that an investor’s shares, when redeemed, may be worth more or less than their original cost. Current performance may be higher or lower than the performance data shown. For up-to-date month-end performance information please call 1-800-480-4111.
6
JPMorgan Value Plus Fund
FUND SUMMARY
TWELVE MONTHS ENDED JUNE 30, 2019 (Unaudited) (continued)
The Fund commenced operations on August 31, 2016.
The graph illustrates comparative performance for $1,000,000 invested in Class I Shares of the JPMorgan Value Plus Fund and the Russell 1000 Value Index from August 31, 2016 to June 30, 2019. The performance of the Fund assumes reinvestment of all dividends and capital gain distributions, if any, and does not include a sales charge. The performance of the Russell 1000 Value Index does not reflect the deduction of expenses or a sales charge associated with a mutual fund and approximates the minimum possible dividend reinvestment of the securities included in the benchmark, if applicable. The dividend is reinvested after deduction of withholding tax, applying the maximum rate tonon-resident institutional investors who do not benefit from double taxation treaties. The Russell 1000 Value Index is an unmanaged index, which measures the performance of those Russell 1000 companies with lowerprice-to-book ratios and lower forecasted growth values. Investors cannot invest directly in an index.
Class I Shares have a $1,000,000 minimum initial investment.
Since the Fund’s inception, it has not experienced any shareholder activity. If shareholder activity had occurred, the Fund’s performance may have been impacted.
Fund performance may reflect the waiver of the Fund’s fees and reimbursement of expenses for certain periods since the inception date. Without these waivers and reimbursements, performance would have been lower. Also, performance shown in this section does not reflect the deduction of taxes that a shareholder would pay on Fund distributions or redemptions of Fund shares.
The returns shown are based on net asset values calculated for shareholder transactions and may differ from the returns shown in the financial highlights, which reflect adjustments made to the net asset values in accordance with accounting principles generally accepted in the United States of America.
7
JPMorgan Value Plus Fund
SCHEDULE OF PORTFOLIO INVESTMENTS
AS OF JUNE 30, 2019
| | | | | | | | |
Investments | | Shares | | | Value ($) |
|
LONG POSITIONS - 120.2% | |
|
COMMON STOCKS - 116.4% | |
|
Aerospace & Defense - 3.4% | |
Arconic, Inc. | | | 2,500 | | | | 64,550 | |
General Dynamics Corp. | | | 1,432 | | | | 260,366 | |
Northrop Grumman Corp. | | | 400 | | | | 129,244 | |
| | | | | | | | |
| | | | | | | 454,160 | |
| | | | | | | | |
Airlines - 1.5% | | | | | | | | |
Southwest Airlines Co. | | | 4,073 | | | | 206,827 | |
| | | | | | | | |
| | |
Banks - 9.2% | | | | | | | | |
Bank of America Corp. | | | 8,900 | | | | 258,100 | |
Chemical Financial Corp. | | | 1,135 | | | | 46,660 | |
Citizens Financial Group, Inc. | | | 4,165 | | | | 147,274 | |
East West Bancorp, Inc. | | | 2,889 | | | | 135,119 | |
Huntington Bancshares, Inc. | | | 8,602 | | | | 118,880 | |
KeyCorp(a) | | | 12,270 | | | | 217,792 | |
Synovus Financial Corp. | | | 1,238 | | | | 43,330 | |
US Bancorp | | | 5,200 | | | | 272,480 | |
| | | | | | | | |
| | | | | | | 1,239,635 | |
| | | | | | | | |
Beverages - 2.1% | | | | | | | | |
Coca-Cola Co. (The) | | | 2,270 | | | | 115,588 | |
Constellation Brands, Inc., Class A | | | 825 | | | | 162,476 | |
| | | | | | | | |
| | | | | | | 278,064 | |
| | | | | | | | |
Biotechnology - 1.8% | | | | | | | | |
Alexion Pharmaceuticals, Inc.* | | | 310 | | | | 40,604 | |
Celgene Corp.* | | | 1,300 | | | | 120,172 | |
Gilead Sciences, Inc. | | | 1,300 | | | | 87,828 | |
| | | | | | | | |
| | | | | | | 248,604 | |
| | | | | | | | |
Building Products - 0.5% | | | | | | | | |
Owens Corning | | | 1,135 | | | | 66,057 | |
| | | | | | | | |
| | |
Capital Markets - 3.0% | | | | | | | | |
BlackRock, Inc. | | | 200 | | | | 93,860 | |
Intercontinental Exchange, Inc. | | | 722 | | | | 62,049 | |
Morgan Stanley(a) | | | 5,845 | | | | 256,069 | |
| | | | | | | | |
| | | | | | | 411,978 | |
| | | | | | | | |
Chemicals - 8.1% | | | | | | | | |
Celanese Corp. | | | 500 | | | | 53,900 | |
DuPont de Nemours, Inc. | | | 2,900 | | | | 217,703 | |
Eastman Chemical Co.(a) | | | 739 | | | | 57,516 | |
FMC Corp.(a) | | | 8,188 | | | | 679,194 | |
Linde plc (United Kingdom) | | | 413 | | | | 82,930 | |
| | | | | | | | |
| | | | | | | 1,091,243 | |
| | | | | | | | |
Consumer Finance - 1.2% | | | | | | | | |
Capital One Financial Corp. | | | 1,838 | | | | 166,780 | |
| | | | | | | | |
| | |
Containers & Packaging - 1.8% | | | | | | | | |
Crown Holdings, Inc.* | | | 4,024 | | | | 245,866 | |
| | | | | | | | |
| |
Diversified Financial Services - 2.9% | | | | | |
Berkshire Hathaway, Inc., Class B*(a) | | | 1,816 | | | | 387,117 | |
| | | | | | | | |
| | | | | | | | |
Investments | | Shares | | | Value ($) |
Diversified Telecommunication Services - 1.0% | | | | | |
Verizon Communications, Inc. | | | 2,300 | | | | 131,399 | |
| | | | | | | | |
| | |
Electric Utilities - 6.5% | | | | | | | | |
American Electric Power Co., Inc. | | | 2,532 | | | | 222,841 | |
Edison International | | | 2,573 | | | | 173,446 | |
Exelon Corp. | | | 3,500 | | | | 167,790 | |
NextEra Energy, Inc.(a) | | | 1,100 | | | | 225,346 | |
Xcel Energy, Inc. | | | 1,400 | | | | 83,286 | |
| | | | | | | | |
| | | | | | | 872,709 | |
| | | | | | | | |
Electrical Equipment - 0.4% | | | | | | | | |
Eaton Corp. plc | | | 603 | | | | 50,218 | |
| | | | | | | | |
|
Equity Real Estate Investment Trusts (REITs) - 9.5% | |
Empire State Realty Trust, Inc., Class A | | | 8,700 | | | | 128,847 | |
Equinix, Inc. | | | 100 | | | | 50,429 | |
Gaming and Leisure Properties, Inc. | | | 1,100 | | | | 42,878 | |
HCP, Inc. | | | 8,200 | | | | 262,236 | |
JBG SMITH Properties | | | 1,600 | | | | 62,944 | |
Public Storage | | | 300 | | | | 71,451 | |
SL Green Realty Corp. | | | 2,400 | | | | 192,888 | |
Ventas, Inc. | | | 6,000 | | | | 410,100 | |
VICI Properties, Inc. | | | 3,095 | | | | 68,214 | |
| | | | | | | | |
| | | | | | | 1,289,987 | |
| | | | | | | | |
Food & Staples Retailing - 1.7% | | | | | | | | |
Sprouts Farmers Market, Inc.* | | | 3,611 | | | | 68,212 | |
Walmart, Inc. | | | 1,500 | | | | 165,735 | |
| | | | | | | | |
| | | | | | | 233,947 | |
| | | | | | | | |
Food Products - 2.2% | | | | | | | | |
Conagra Brands, Inc. | | | 1,500 | | | | 39,780 | |
General Mills, Inc. | | | 2,000 | | | | 105,040 | |
Lamb Weston Holdings, Inc. | | | 2,300 | | | | 145,728 | |
| | | | | | | | |
| | | | | | | 290,548 | |
| | | | | | | | |
Health Care Equipment & Supplies - 5.9% | |
Becton Dickinson and Co. | | | 1,100 | | | | 277,211 | |
Boston Scientific Corp.* | | | 5,638 | | | | 242,321 | |
Zimmer Biomet Holdings, Inc.(a) | | | 2,347 | | | | 276,336 | |
| | | | | | | | |
| | | | | | | 795,868 | |
| | | | | | | | |
Health Care Providers & Services - 5.0% | |
Cigna Corp.(a) | | | 1,960 | | | | 308,798 | |
DaVita, Inc.* | | | 2,476 | | | | 139,300 | |
Laboratory Corp. of America Holdings* | | | 500 | | | | 86,450 | |
UnitedHealth Group, Inc. | | | 600 | | | | 146,406 | |
| | | | | | | | |
| | | | | | | 680,954 | |
| | | | | | | | |
Hotels, Restaurants & Leisure - 2.0% | |
Norwegian Cruise Line Holdings Ltd.* | | | 3,818 | | | | 204,759 | |
Yum! Brands, Inc. | | | 619 | | | | 68,505 | |
| | | | | | | | |
| | | | | | | 273,264 | |
| | | | | | | | |
Household Durables - 3.0% | | | | | | | | |
Lennar Corp., Class A(a) | | | 2,701 | | | | 130,891 | |
Mohawk Industries, Inc.* | | | 1,900 | | | | 280,193 | |
| | | | | | | | |
| | | | | | | 411,084 | |
| | | | | | | | |
Household Products - 0.5% | | | | | | | | |
Energizer Holdings, Inc. | | | 1,800 | | | | 69,552 | |
| | | | | | | | |
SEE NOTES TO FINANCIAL STATEMENTS.
8
JPMorgan Value Plus Fund
SCHEDULE OF PORTFOLIO INVESTMENTS
AS OF JUNE 30, 2019 (continued)
| | | | | | | | |
Investments | | Shares | | | Value ($) |
Insurance - 5.5% | | | | | | | | |
Everest Re Group Ltd. | | | 619 | | | | 153,005 | |
Hartford Financial Services Group, Inc. (The) | | | 1,032 | | | | 57,503 | |
MetLife, Inc. | | | 5,469 | | | | 271,645 | |
RenaissanceRe Holdings Ltd. (Bermuda) | | | 929 | | | | 165,371 | |
Travelers Cos., Inc. (The) | | | 613 | | | | 91,656 | |
| | | | | | | | |
| | | | | | | 739,180 | |
| | | | | | | | |
Interactive Media & Services - 0.8% | |
Alphabet, Inc., Class C* | | | 103 | | | | 111,334 | |
| | | | | | | | |
|
Internet & Direct Marketing Retail - 1.8% | |
Expedia Group, Inc. | | | 1,845 | | | | 245,440 | |
| | | | | | | | |
| | |
IT Services - 2.1% | | | | | | | | |
Cognizant Technology Solutions Corp., Class A | | | 3,400 | | | | 215,526 | |
Fidelity National Information Services, Inc. | | | 600 | | | | 73,608 | |
| | | | | | | | |
| | | | | | | 289,134 | |
| | | | | | | | |
Leisure Products - 0.7% | | | | | | | | |
Brunswick Corp. | | | 1,960 | | | | 89,944 | |
| | | | | | | | |
|
Life Sciences Tools & Services - 1.0% | |
PRA Health Sciences, Inc.* | | | 1,400 | | | | 138,810 | |
| | | | | | | | |
| | |
Machinery - 1.1% | | | | | | | | |
Stanley Black & Decker, Inc. | | | 1,035 | | | | 149,671 | |
| | | | | | | | |
| | |
Media - 7.5% | | | | | | | | |
Altice USA, Inc., Class A* | | | 2,137 | | | | 52,036 | |
Charter Communications, Inc., Class A*(a) | | | 722 | | | | 285,320 | |
Comcast Corp., Class A(a) | | | 15,945 | | | | 674,155 | |
| | | | | | | | |
| | | | | | | 1,011,511 | |
| | | | | | | | |
Metals & Mining - 0.3% | | | | | | | | |
Alumina Ltd., ADR (Australia) | | | 5,595 | | | | 36,479 | |
| | | | | | | | |
|
Oil, Gas & Consumable Fuels - 10.1% | |
Anadarko Petroleum Corp. | | | 5,300 | | | | 373,968 | |
Chevron Corp.(a) | | | 2,200 | | | | 273,768 | |
Concho Resources, Inc. | | | 2,373 | | | | 244,846 | |
Marathon Petroleum Corp. | | | 3,467 | | | | 193,736 | |
Phillips 66 | | | 700 | | | | 65,478 | |
Pioneer Natural Resources Co.(a) | | | 1,404 | | | | 216,020 | |
| | | | | | | | |
| | | | | | | 1,367,816 | |
| | | | | | | | |
Pharmaceuticals - 6.4% | | | | | | | | |
Allergan plc | | | 19 | | | | 3,181 | |
Bristol-Myers Squibb Co. | | | 1,300 | | | | 58,955 | |
Eli Lilly & Co. | | | 844 | | | | 93,507 | |
Merck & Co., Inc.(a) | | | 3,600 | | | | 301,860 | |
Pfizer, Inc.(a) | | | 9,536 | | | | 413,100 | |
| | | | | | | | |
| | | | | | | 870,603 | |
| | | | | | | | |
Semiconductors & Semiconductor Equipment - 0.5% | |
Teradyne, Inc. | | | 1,400 | | | | 67,074 | |
| | | | | | | | |
| | | | | | | | |
Investments | | Shares | | | Value ($) |
Software - 1.8% | | | | | | | | |
LogMeIn, Inc. | | | 400 | | | | 29,472 | |
Microsoft Corp. | | | 626 | | | | 83,859 | |
Oracle Corp. | | | 2,189 | | | | 124,707 | |
| | | | | | | | |
| | | | | | | 238,038 | |
| | | | | | | | |
Specialty Retail - 0.8% | | | | | | | | |
Advance Auto Parts, Inc. | | | 300 | | | | 46,242 | |
AutoNation, Inc.* | | | 1,548 | | | | 64,923 | |
| | | | | | | | |
| | | | | | | 111,165 | |
| | | | | | | | |
Tobacco - 2.8% | | | | | | | | |
Philip Morris International, Inc. | | | 4,745 | | | | 372,625 | |
| | | | | | | | |
| | |
TOTAL COMMON STOCKS (Cost $14,891,696) | | | | | | | 15,734,685 | |
| | | | | | | | |
|
SHORT-TERM INVESTMENTS - 3.8% | |
|
INVESTMENT COMPANIES - 3.8% | |
JPMorgan Prime Money Market Fund Class IM Shares, 2.46%(b)(c)(Cost $508,812) | | | 508,659 | | | | 508,862 | |
| | | | | | | | |
| | |
TOTAL LONG POSITIONS (Cost $15,400,508) | | | | | | | 16,243,547 | |
| | | | | | | | |
|
SHORT POSITIONS - (19.5)% | |
|
COMMON STOCKS - (19.5)% | |
|
Air Freight & Logistics - (0.3)% | |
CH Robinson Worldwide, Inc. | | | (420 | ) | | | (35,427 | ) |
| | | | | | | | |
| | |
Automobiles - (0.5)% | | | | | | | | |
Tesla, Inc.* | | | (292 | ) | | | (65,250 | ) |
| | | | | | | | |
| | |
Banks - (0.3)% | | | | | | | | |
First Financial Bankshares, Inc. | | | (1,200 | ) | | | (36,948 | ) |
| | | | | | | | |
| | |
Biotechnology - (0.3)% | | | | | | | | |
AbbVie, Inc. | | | (638 | ) | | | (46,395 | ) |
| | | | | | | | |
| | |
Chemicals - (3.7)% | | | | | | | | |
Albemarle Corp. | | | (1,935 | ) | | | (136,243 | ) |
LyondellBasell Industries NV, Class A | | | (1,670 | ) | | | (143,837 | ) |
PPG Industries, Inc. | | | (300 | ) | | | (35,013 | ) |
Westlake Chemical Corp. | | | (2,630 | ) | | | (182,680 | ) |
| | | | | | | | |
| | | | | | | (497,773 | ) |
| | | | | | | | |
Communications Equipment - (0.2)% | |
Cisco Systems, Inc. | | | (469 | ) | | | (25,668 | ) |
| | | | | | | | |
| | |
Containers & Packaging - (0.5)% | | | | | | | | |
Ball Corp. | | | (970 | ) | | | (67,890 | ) |
| | | | | | | | |
SEE NOTES TO FINANCIAL STATEMENTS.
9
JPMorgan Value Plus Fund
SCHEDULE OF PORTFOLIO INVESTMENTS
AS OF JUNE 30, 2019 (continued)
| | | | | | | | |
Investments | | Shares | | | Value ($) |
Electrical Equipment - (1.0)% | |
Acuity Brands, Inc. | | | (1,012 | ) | | | (139,565 | ) |
| | | | | | | | |
|
Energy Equipment & Services - (0.4)% | |
Helmerich & Payne, Inc. | | | (750 | ) | | | (37,965 | ) |
Schlumberger Ltd. | | | (475 | ) | | | (18,876 | ) |
| | | | | | | | |
| | | | | | | (56,841 | ) |
| | | | | | | | |
Equity Real Estate Investment Trusts (REITs) - (1.4)% | |
Simon Property Group, Inc. | | | (771 | ) | | | (123,175 | ) |
Tanger Factory Outlet Centers, Inc. | | | (2,304 | ) | | | (37,348 | ) |
Xenia Hotels & Resorts, Inc. | | | (1,722 | ) | | | (35,903 | ) |
| | | | | | | | |
| | | | | | | (196,426 | ) |
| | | | | | | | |
Food & Staples Retailing - (2.0)% | |
Kroger Co. (The) | | | (8,276 | ) | | | (179,672 | ) |
Walgreens Boots Alliance, Inc. | | | (1,716 | ) | | | (93,814 | ) |
| | | | | | | | |
| | | | | | | (273,486 | ) |
| | | | | | | | |
Health Care Equipment & Supplies - (1.1)% | |
Baxter International, Inc. | | | (618 | ) | | | (50,614 | ) |
Edwards Lifesciences Corp.* | | | (269 | ) | | | (49,695 | ) |
Stryker Corp. | | | (244 | ) | | | (50,162 | ) |
| | | | | | | | |
| | | | | | | (150,471 | ) |
| | | | | | | | |
Hotels, Restaurants & Leisure - (0.7)% | |
Chipotle Mexican Grill, Inc.* | | | (18 | ) | | | (13,192 | ) |
Starbucks Corp. | | | (977 | ) | | | (81,902 | ) |
| | | | | | | | |
| | | | | | | (95,094 | ) |
| | | | | | | | |
Insurance - (0.8)% | |
Torchmark Corp. | | | (1,199 | ) | | | (107,263 | ) |
| | | | | | | | |
|
Interactive Media & Services - (0.4)% | |
Snap, Inc., Class A* | | | (3,553 | ) | | | (50,808 | ) |
| | | | | | | | |
|
Internet & Direct Marketing Retail - (0.3)% | |
Booking Holdings, Inc.* | | | (19 | ) | | | (35,619 | ) |
| | | | | | | | |
|
IT Services - (0.3)% | |
Paychex, Inc. | | | (478 | ) | | | (39,335 | ) |
| | | | | | | | |
|
Machinery - (0.7)% | |
Caterpillar, Inc. | | | (449 | ) | | | (61,194 | ) |
Deere & Co. | | | (198 | ) | | | (32,811 | ) |
| | | | | | | | |
| | | | | | | (94,005 | ) |
| | | | | | | | |
Multiline Retail - (0.5)% | |
Kohl’s Corp. | | | (719 | ) | | | (34,189 | ) |
Target Corp. | | | (346 | ) | | | (29,967 | ) |
| | | | | | | | |
| | | | | | | (64,156 | ) |
| | | | | | | | |
Oil, Gas & Consumable Fuels - (0.4)% | |
ConocoPhillips | | | (999 | ) | | | (60,939 | ) |
| | | | | | | | |
|
Paper & Forest Products - (0.5)% | |
Domtar Corp. | | | (1,446 | ) | | | (64,390 | ) |
| | | | | | | | |
|
Road & Rail - (0.9)% | |
CSX Corp. | | | (694 | ) | | | (53,695 | ) |
Norfolk Southern Corp. | | | (132 | ) | | | (26,312 | ) |
Uber Technologies, Inc.* | | | (922 | ) | | | (42,762 | ) |
| | | | | | | | |
| | | | | | | (122,769 | ) |
| | | | | | | | |
| | | | | | | | |
Investments | | Shares | | | Value ($) |
Software - (0.8)% | |
Citrix Systems, Inc. | | | (655 | ) | | | (64,282 | ) |
Splunk, Inc.* | | | (316 | ) | | | (39,737 | ) |
| | | | | | | | |
| | | | | | | (104,019 | ) |
| | | | | | | | |
Specialty Retail - (0.4)% | |
Bed Bath & Beyond, Inc. | | | (4,589 | ) | | | (53,324 | ) |
| | | | | | | | |
|
Technology Hardware, Storage & Peripherals - (0.5)% | |
Apple, Inc. | | | (327 | ) | | | (64,720 | ) |
| | | | | | | | |
|
Textiles, Apparel & Luxury Goods - (0.6)% | |
Canada Goose Holdings, Inc. (Canada)* | | | (1,328 | ) | | | (51,433 | ) |
Lululemon Athletica, Inc.* | | | (184 | ) | | | (33,159 | ) |
| | | | | | | | |
| | | | | | | (84,592 | ) |
| | | | | | | | |
TOTAL COMMON STOCKS (Proceeds $(2,778,538)) | | | | | | | (2,633,173 | ) |
| | | | | | | | |
| | |
TOTAL SHORT POSITIONS (Proceeds $(2,778,538)) | | | | | | | (2,633,173 | ) |
| | | | | | | | |
| | |
Total Investments - 100.7%
(Cost $12,621,970) | | | | | | | 13,610,374 | |
Liabilities in Excess of
Other Assets - (0.7)% | | | | | | | (99,820 | ) |
| | | | | | | | |
| Net Assets - 100.0% | | | | | | | 13,510,554 | |
| | | | | | | | |
| | | | | |
Percentages indicated are based on net assets.
Abbreviations
| ADR | American Depositary Receipt |
| (a) | All or a portion of this security is segregated as collateral for short sales. The total value of securities segregated as collateral is $3,924,151. |
| (b) | Investment in an affiliated fund, which is registered under the Investment Company Act of 1940, as amended, and is advised by J.P. Morgan Investment Management Inc. |
| (c) | The rate shown is the current yield as of June 30, 2019. |
| * | Non-income producing security. |
SEE NOTES TO FINANCIAL STATEMENTS.
10
STATEMENT OF ASSETS AND LIABILITIES
AS OF JUNE 30, 2019
| | | | |
| | | JPMorgan
Value Plus Fund | |
| |
ASSETS: | | | | |
Investments innon-affiliates, at value | | $ | 15,734,685 | |
Investments in affiliates, at value | | | 508,862 | |
Cash | | | 1,153 | |
Receivables: | | | | |
Investment securities sold | | | 362,732 | |
Dividends fromnon-affiliates | | | 25,080 | |
Dividends from affiliates | | | 34 | |
Due from Adviser | | | 752 | |
| | | | |
Total Assets | | | 16,633,298 | |
| | | | |
| |
LIABILITIES: | | | | |
Payables: | | | | |
Securities sold short, at value | | | 2,633,173 | |
Dividend expense tonon-affiliates on securities sold short | | | 2,392 | |
Investment securities purchased | | | 441,338 | |
Interest expense tonon-affiliates on securities sold short | | | 1,116 | |
Accrued liabilities: | | | | |
Distribution fees | | | 21 | |
Service fees | | | 1,408 | |
Custodian and accounting fees | | | 9,771 | |
Other | | | 33,525 | |
| | | | |
Total Liabilities | | | 3,122,744 | |
| | | | |
Net Assets | | $ | 13,510,554 | |
| | | | |
| |
NET ASSETS: | | | | |
Paid-in-Capital | | $ | 12,706,427 | |
Total distributable earnings (loss) (a) | | | 804,127 | |
| | | | |
Total Net Assets | | $ | 13,510,554 | |
| | | | |
| |
Net Assets: | | | | |
Class A | | $ | 26,841 | |
Class C | | | 26,465 | |
Class I | | | 13,457,248 | |
| | | | |
Total | | $ | 13,510,554 | |
| | | | |
| |
Outstanding units of beneficial interest (shares) ($0.0001 par value; unlimited number of shares authorized): | | | | |
Class A | | | 1,649 | |
Class C | | | 1,633 | |
Class I | | | 825,223 | |
| |
Net Asset Value (b): | | | | |
Class A - Redemption price per share | | $ | 16.28 | |
Class C - Offering price per share (c) | | | 16.21 | |
Class I - Offering and redemption price per share | | | 16.31 | |
Class A maximum sales charge | | | 5.25% | |
Class A maximum public offering price per share
[net asset value per share/(100% – maximum sales charge)] | | $ | 17.18 | |
| | | | |
| |
Cost of investments innon-affiliates | | $ | 14,891,696 | |
Cost of investments in affiliates | | | 508,812 | |
Proceeds from securities sold short | | | 2,778,538 | |
(a) Total distributable earnings have been aggregated to conform to the current presentation requirements for the adoption of the Securities and Exchange Commission’s Disclosure Update and Simplification Rule. See Note 8.
(b) Per share amounts may not recalculate due to rounding of net assets and/or shares outstanding.
(c) Redemption price for Class C Shares varies based upon length of time the shares are held.
SEE NOTES TO FINANCIAL STATEMENTS.
11
STATEMENT OF OPERATIONS
FOR THE YEAR ENDED JUNE 30, 2019
| | | | |
| | | JPMorgan
Value Plus Fund | |
| |
INVESTMENT INCOME: | | | | |
Interest income fromnon-affiliates | | $ | 1 | |
Dividend income fromnon-affiliates | | | 314,796 | |
Dividend income from affiliates | | | 8,537 | |
| | | | |
Total investment income | | | 323,334 | |
| | | | |
| |
EXPENSES: | | | | |
Investment advisory fees | | | 99,767 | |
Administration fees | | | 10,389 | |
Distribution fees: | | | | |
Class A | | | 66 | |
Class C | | | 196 | |
Service fees: | | | | |
Class A | | | 66 | |
Class C | | | 66 | |
Class I | | | 33,124 | |
Custodian and accounting fees | | | 25,714 | |
Professional fees | | | 59,024 | |
Trustees’ and Chief Compliance Officer’s fees | | | 24,915 | |
Printing and mailing costs | | | 9,726 | |
Registration and filing fees | | | 237 | |
Transfer agency fees (See Note 2.G.) | | | 397 | |
Other | | | 4,948 | |
Dividend expense tonon-affiliates on securities sold short | | | 48,036 | |
Interest expense tonon-affiliates on securities sold short | | | 13,574 | |
| | | | |
Total expenses | | | 330,245 | |
| | | | |
Less fees waived | | | (135,863) | |
Less expense reimbursements | | | (6,865) | |
| | | | |
Net expenses | | | 187,517 | |
| | | | |
Net investment income (loss) | | | 135,817 | |
| | | | |
| |
REALIZED/UNREALIZED GAINS (LOSSES): | | | | |
Net realized gain (loss) on transactions from: | | | | |
Investments innon-affiliates | | | (71,402) | |
Investments in affiliates | | | 13 | |
Securities sold short | | | (117,457) | |
| | | | |
Net realized gain (loss) | | | (188,846) | |
| | | | |
Change in net unrealized appreciation/depreciation on: | | | | |
Investments innon-affiliates | | | 101,602 | |
Investments in affiliates | | | 50 | |
Securities sold short | | | 136,289 | |
| | | | |
Change in net unrealized appreciation/depreciation | | | 237,941 | |
| | | | |
Net realized/unrealized gains (losses) | | | 49,095 | |
| | | | |
Change in net assets resulting from operations | | $ | 184,912 | |
| | | | |
SEE NOTES TO FINANCIAL STATEMENTS.
12
STATEMENTS OF CHANGES IN NET ASSETS
FOR THE PERIODS INDICATED
| | | | | | | | |
| | | JPMorgan Value Plus Fund | |
| | | Year Ended | | | Year Ended | |
| | | June 30, 2019 | | | June 30, 2018 | |
| |
CHANGE IN NET ASSETS RESULTING FROM OPERATIONS: | | | | | | | | |
Net investment income (loss) | | $ | 135,817 | | | $ | 102,506 | |
Net realized gain (loss) | | | (188,846 | ) | | | 1,350,617 | |
Change in net unrealized appreciation/depreciation | | | 237,941 | | | | (447,809) | |
| | | | |
Change in net assets resulting from operations | | | 184,912 | | | | 1,005,314 | |
| | | | |
| | |
DISTRIBUTIONS TO SHAREHOLDERS:(a) | | | | | | | | |
Class A | | | (2,052 | ) | | | (3,178) | |
Class C | | | (1,909 | ) | | | (3,052) | |
Class I | | | (1,058,642 | ) | | | (1,614,779) | |
| | | | |
Total distributions to shareholders | | | (1,062,603 | ) | | | (1,621,009) | |
| | | | |
| | |
CAPITAL TRANSACTIONS: | | | | | | | | |
Change in net assets resulting from capital transactions | | | 1,058,247 | | | | 1,621,009 | |
| | | | |
| | |
NET ASSETS: | | | | | | | | |
Change in net assets | | | 180,556 | | | | 1,005,314 | |
Beginning of period | | | 13,329,998 | | | | 12,324,684 | |
| | | | |
End of period | | $ | 13,510,554 | | | $ | 13,329,998 | |
| | | | |
(a) The prior period distributions have been reclassified to conform to current period presentation for the adoption of the Securities and Exchange Commission’s Disclosure Update and Simplification Rule. See Note 8. Prior period balances were as follows:
| | | | |
Class A | | | | |
| |
From net investment income | | $ | (134 | ) |
| |
From net realized gains | | | (3,044 | ) |
| |
Class C | | | | |
| |
From net investment income | | | (11 | ) |
| |
From net realized gains | | | (3,041 | ) |
| |
Class I | | | | |
| |
From net investment income | | | (97,632 | ) |
| |
From net realized gains | | | (1,517,147 | ) |
SEE NOTES TO FINANCIAL STATEMENTS.
13
STATEMENTS OF CHANGES IN NET ASSETS
FOR THE PERIODS INDICATED (continued)
| | | | | | | | |
| | | JPMorgan Value Plus Fund | |
| | | Year Ended | | | Year Ended | |
| | | June 30, 2019 | | | June 30, 2018 | |
| |
CAPITAL TRANSACTIONS: | | | | | | | | |
Class A | | | | | | | | |
Distributions reinvested | | | 2,052 | | | | 3,178 | |
| | | | |
Change in net assets resulting from Class A capital transactions | | $ | 2,052 | | | $ | 3,178 | |
| | | | |
Class C | | | | | | | | |
Distributions reinvested | | | 1,909 | | | | 3,052 | |
| | | | |
Change in net assets resulting from Class C capital transactions | | $ | 1,909 | | | $ | 3,052 | |
| | | | |
Class I | | | | | | | | |
Proceeds from shares issued | | $ | 282,500 | | | $ | 792,738 | |
Distributions reinvested | | | 1,058,642 | | | | 1,614,779 | |
Cost of shares redeemed | | | (286,856 | ) | | | (792,738) | |
| | | | |
Change in net assets resulting from Class I capital transactions | | $ | 1,054,286 | | | $ | 1,614,779 | |
| | | | |
Total change in net assets resulting from capital transactions | | $ | 1,058,247 | | | $ | 1,621,009 | |
| | | | |
| | |
SHARE TRANSACTIONS: | | | | | | | | |
Class A | | | | | | | | |
Reinvested | | | 136 | | | | 178 | |
| | | | |
Change in Class A Shares | | | 136 | | | | 178 | |
| | | | |
Class C | | | | | | | | |
Reinvested | | | 127 | | | | 172 | |
| | | | |
Change in Class C Shares | | | 127 | | | | 172 | |
| | | | |
Class I | | | | | | | | |
Issued | | | 18,016 | | | | 41,701 | |
Reinvested | | | 69,919 | | | | 90,035 | |
Redeemed | | | (18,294 | ) | | | (41,701) | |
| | | | |
Change in Class I Shares | | | 69,641 | | | | 90,035 | |
| | | | |
SEE NOTES TO FINANCIAL STATEMENTS.
14
STATEMENT OF CASH FLOWS
FOR THE YEAR ENDED JUNE 30, 2019
| | | | |
| | | JPMorgan |
| | | Value Plus Fund |
| |
INCREASE (DECREASE) IN CASH | | | | |
Cash flows provided (used) by operating activities: | | | | |
Net increase in net assets resulting from operations | | $ | 184,912 | |
Adjustments to reconcile net increase/decrease in net assets resulting from operations to net cash provided (used) by operating activities: | | | | |
Purchase of investment securities | | | (31,593,185 | ) |
Proceeds from disposition of investment securities | | | 30,812,207 | |
Covers of investment securities sold short | | | (2,987,056 | ) |
Proceeds from investment securities sold short | | | 3,693,458 | |
Purchases of short-term investments — affiliates, net | | | (42,532 | ) |
Change in unrealized (appreciation)/depreciation on investments innon-affiliates | | | (101,602 | ) |
Change in unrealized (appreciation)/depreciation on investments in affiliates | | | (50 | ) |
Change in unrealized (appreciation)/depreciation on investment securities sold short | | | (136,289 | ) |
Net realized (gain)/loss on investments innon-affiliates | | | 71,402 | |
Net realized (gain)/loss on investments in affiliates | | | (13 | ) |
Net realized (gain)/loss on securities sold short | | | 117,457 | |
Decrease in dividends receivable from affiliates | | | 354 | |
Increase in dividends receivable fromnon-affiliates | | | (14,463 | ) |
Increase in due from Adviser | | | (752 | ) |
Decrease in dividend expense tonon-affiliates on securities sold short | | | (285 | ) |
Increase in interest expense tonon-affiliates on securities sold short | | | 71 | |
Decrease in investment advisory fees payable | | | (8,480 | ) |
Decrease in distribution fees payable | | | (1 | ) |
Increase in service fees payable | | | 1,408 | |
Increase in custodian and accounting fees payable | | | 5,157 | |
Increase in other accrued expenses payable | | | 3,792 | |
| | | | |
Net cash provided (used) by operating activities | | | 5,510 | |
| | | | |
| |
Cash flows provided (used) by financing activities: | | | | |
Decrease in due to custodian | | | (1 | ) |
Proceeds from shares issued | | | 282,500 | |
Payment for shares redeemed | | | (286,856 | ) |
| | | | |
Net cash provided (used) by financing activities | | | (4,357 | ) |
| | | | |
| |
Cash: | | | | |
Net increase (decrease) in unrestricted and restricted cash, foreign currency and deposits at broker | | | 1,153 | |
Restricted and unrestricted cash and foreign currency at beginning of period | | | - | |
| | | | |
Restricted and unrestricted cash and foreign currency at end of period | | $ | 1,153 | |
| | | | |
Supplemental disclosure of cash flow information:
For the year ended June 30, 2019 the Fund paid $13,503 in interest expense.
For purposes of reporting the Statement of Cash Flows, the Fund considers all cash accounts that are not subject to withdrawal restrictions or penalties to be cash equivalents.
Reconciliation of restricted and unrestricted cash at the end of period to the Statement of Assets and Liabilities:
| | | | | | | | |
| | | June 30, 2018 | | | June 30, 2019 | |
Cash | | | $ - | | | | $ 1,153 | |
SEE NOTES TO FINANCIAL STATEMENTS.
15
FINANCIAL HIGHLIGHTS
FOR THE PERIODS INDICATED
| | | | | | | | | | | | | | | | | | | | | | | | | | | | | | | | | | | | | | | | | | | | | | | | | | | | | | | | | | | | |
| | | Per share operating performance | | | Ratios/Supplemental data | |
| | | | | | Investment operations | | | Distributions | | | | | | | | | | | | Ratios to average net assets(a) | | | | | | | |
| |
| Net asset value,
beginning of
period |
| |
| Net investment
income (loss)
(b) |
| |
| Net realized and
unrealized gains
(losses) on
investments |
| |
| Total from
investment
operations |
| |
| Net
investment
income |
| |
| Net
realized
gain |
| |
| Total
distributions |
| |
| Net asset value,
end of period |
| |
| Total return
(excludes sales
charge) (c)(d) |
| |
| Net assets, end
of period |
| |
| Net expenses
(including
dividend and
interest
expense for securities sold short)
(e)(f) |
| |
| Net investment income
(loss) |
| |
| Expenses without
waivers,
reimbursements and
earnings credits
(including dividend
and interest expense for
securities sold short) (f) |
| |
| Portfolio
turnover rate
(excluding
securities
sold short) (c) |
| |
| Portfolio
turnover rate
(including
securities sold
short) (c) |
|
JPMorgan Value Plus Fund | | | | | | | | | | | | | | | | | | | | | | | | | | | | | | | | | | | | | | | | | | | | | | | | | | | | | | | | | | | | |
Class A | | | | | | | | | | | | | | | | | | | | | | | | | | | | | | | | | | | | | | | | | | | | | | | | | | | | | | | | | | | | |
Year Ended June 30, 2019 | | | $17.54 | | | | $0.13 | | | | $(0.04) | | | | $0.09 | | | | $(0.09) | | | | $ (1.26) | | | | $ (1.35) | | | | $16.28 | | | | 1.14% | | | | $26,841 | | | | 1.65% | | | | 0.77 % | | | | 3.05% | | | | 205 % | | | | 231 % | |
Year Ended June 30, 2018 | | | 18.42 | | | | 0.10 | | | | 1.39 | | | | 1.49 | | | | (0.09) | | | | (2.28) | | | | (2.37) | | | | 17.54 | | | | 7.89 | | | | 26,539 | | | | 1.58(g) | | | | 0.52 (g) | | | | 3.24(g) | | | | 115 | | | | 133 | |
August 31, 2016 (h) through June 30, 2017 | | | 15.00 | | | | 0.06 | | | | 3.39 | | | | 3.45 | | | | (0.03) | | | | — | | | | (0.03) | | | | 18.42 | | | | 22.99 | | | | 24,599 | | | | 1.58(g) | | | | 0.44 (g) | | | | 3.04(g) | | | | 91 | | | | 110 | |
Class C | | | | | | | | | | | | | | | | | | | | | | | | | | | | | | | | | | | | | | | | | | | | | | | | | | | | | | | | | | | | |
Year Ended June 30, 2019 | | | 17.46 | | | | 0.05 | | | | (0.03) | | | | 0.02 | | | | (0.01) | | | | (1.26) | | | | (1.27) | | | | 16.21 | | | | 0.64 | | | | 26,465 | | | | 2.16 | | | | 0.27 | | | | 3.55 | | | | 205 | | | | 231 | |
Year Ended June 30, 2018 | | | 18.36 | | | | — (i) | | | | 1.39 | | | | 1.39 | | | | (0.01) | | | | (2.28) | | | | (2.29) | | | | 17.46 | | | | 7.35 | | | | 26,298 | | | | 2.08(g) | | | | 0.03 (g) | | | | 3.75(g) | | | | 115 | | | | 133 | |
August 31, 2016 (h) through June 30, 2017 | | | 15.00 | | | | (0.01) | | | | 3.38 | | | | 3.37 | | | | (0.01) | | | | — | | | | (0.01) | | | | 18.36 | | | | 22.47 | | | | 24,497 | | | | 2.08(g) | | | | (0.06)(g) | | | | 3.50(g) | | | | 91 | | | | 110 | |
Class I | | | | | | | | | | | | | | | | | | | | | | | | | | | | | | | | | | | | | | | | | | | | | | | | | | | | | | | | | | | | |
Year Ended June 30, 2019 | | | 17.57 | | | | 0.17 | | | | (0.04) | | | | 0.13 | | | | (0.13) | | | | (1.26) | | | | (1.39) | | | | 16.31 | | | | 1.42 | | | | 13,457,248 | | | | 1.41 | | | | 1.02 | | | | 2.48 | | | | 205 | | | | 231 | |
Year Ended June 30, 2018 | | | 18.44 | | | | 0.14 | | | | 1.40 | | | | 1.54 | | | | (0.13) | | | | (2.28) | | | | (2.41) | | | | 17.57 | | | | 8.17 | | | | 13,277,161 | | | | 1.33(g) | | | | 0.77 (g) | | | | 2.37(g) | | | | 115 | | | | 133 | |
August 31, 2016 (h) through June 30, 2017 | | | 15.00 | | | | 0.10 | | | | 3.38 | | | | 3.48 | | | | (0.04) | | | | — | | | | (0.04) | | | | 18.44 | | | | 23.22 | | | | 12,275,588 | | | | 1.33(g) | | | | 0.69 (g) | | | | 2.65(g) | | | | 91 | | | | 110 | |
| (a) | Annualized for periods less than one year, unless otherwise noted. |
| (b) | Calculated based upon average shares outstanding. |
| (c) | Not annualized for periods less than one year. |
| (d) | Includes adjustments in accordance with accounting principles generally accepted in the United States of America and as such, the net asset values for financial reporting purposes and the returns based upon those net asset values may differ from the net asset values and returns for shareholder transactions. |
| (e) | Includes earnings credits and interest expense, if applicable, each of which is less than 0.005% unless otherwise noted. |
| (f) | The net expenses and expenses without waivers, reimbursements and earnings credits (excluding dividend and interest expense for securities sold short) for Class A are 1.19% and 2.59% for the year ended June 30, 2019, 1.20% and 2.86% for the year ended June 30, 2018 and 1.17% and 2.65% for the period ended June 30, 2017; for Class C are 1.70% and 3.09% for the year ended June 30, 2019, 1.70% and 3.37% for the year ended June 30, 2018 and 1.67% and 3.11% for the period ended June 30, 2017 and for Class I are 0.95% and 2.02% for the year ended June 30, 2019, 0.95% and 1.99% for the year ended June 30, 2018 and 0.93% and 2.26% for period ended June 30, 2017, respectively. |
| (g) | Certainnon-recurring expenses incurred by the Fund were not annualized for the periods indicated. |
| (h) | Commencement of operations. |
| (i) | Amount rounds to less than $0.005. |
SEE NOTES TO FINANCIAL STATEMENTS.
16
NOTES TO FINANCIAL STATEMENTS
AS OF JUNE 30, 2019
1. Organization
JPMorgan Trust IV (“JPM IV”) was formed on November 11, 2015, as a Delaware statutory trust, pursuant to a Declaration of Trust dated November 11, 2015, and is registered under the Investment Company Act of 1940, as amended (the “1940 Act”), as anopen-end management investment company.
The following is a separate fund of the Trust (the “Fund”) covered by this report:
| | | | |
| | | Classes Offered | | Diversified/ Non-Diversified |
| JPMorgan Value Plus Fund | | Class A, Class C and Class I | | Diversified |
The investment objective of the Fund is to seek to provide long-term capital appreciation.
The Fund commenced operations on August 31, 2016. Currently, the Fund is not publicly offered for investment.
Class A Shares generally provide for afront-end sales charge while Class C Shares provide for a contingent deferred sales charge (“CDSC”). No sales charges are assessed with respect to Class I. Certain Class A Shares, for whichfront-end sales charges have been waived, may be subject to a CDSC as described in the Fund’s prospectus. Beginning on November 14, 2017, Class C Shares automatically convert to Class A Shares after ten years. All classes of shares have equal rights as to earnings, assets and voting privileges, except that each class may bear different transfer agency, distribution and service fees and each class has exclusive voting rights with respect to its distribution plan and shareholder servicing agreements.
J.P. Morgan Investment Management Inc. (“JPMIM”), an indirect, wholly-owned subsidiary of JPMorgan Chase & Co. (“JPMorgan”), acts as Adviser (the “Adviser”) and Administrator (the “Administrator”) to the Fund.
2. Significant Accounting Policies
The following is a summary of significant accounting policies followed by the Fund in the preparation of their financial statements. The Fund is an investment company and, thus, follows the investment company accounting and reporting guidance of the Financial Accounting Standards Board Accounting Standards Codification Topic 946 - Investment Companies, which is part of U.S. generally accepted accounting principles (“GAAP”). The preparation of financial statements in conformity with GAAP requires management to make estimates and assumptions that affect the reported amounts of assets and liabilities and disclosure of contingent assets and liabilities at the date of the financial statements and the reported amounts of increases and decreases in net assets from operations during the reporting period. Actual results could differ from those estimates.
A. Valuation of Investments —The valuation of investments is in accordance with GAAP and the Fund’s valuation policies set forth by and under the supervision and responsibility of the Board of Trustees (the “Board”), which established the following approach to valuation, as described more fully below: (i) investments for which market quotations are readily available shall be valued at their market value and (ii) all other investments for which market quotations are not readily available shall be valued at their fair value as determined in good faith by the Board.
The Administrator has established the J.P. Morgan Asset Management Americas Valuation Committee (“AVC”) to assist the Board with the oversight and monitoring of the valuation of the Fund’s investments. The Administrator implements the valuation policies of the Fund’s investments, as directed by the Board. The AVC oversees and carries out the policies for the valuation of investments held in the Fund. This includes monitoring the appropriateness of fair values based on results of ongoing valuation oversight including, but not limited to, consideration of macro or security specific events, market events and pricing vendor and broker due diligence. The Administrator is responsible for discussing and assessing the potential impacts to the fair values on an ongoing basis, and at least on a quarterly basis with the AVC and the Board.
Equities and other exchange-traded instruments are valued at the last sale price or official market closing price on the primary exchange on which the instrument is traded before the net asset value (“NAV”) of the Fund is calculated on a valuation date.
Investments inopen-end investment companies (“Underlying Funds”) are valued at each Underlying Fund’s NAV per share as of the report date.
Valuations reflected in this report are as of the report date. As a result, changes in valuation due to market events and/or issuer related events after the report date and prior to issuance of the report are not reflected herein.
The various inputs that are used in determining the valuation of the Fund’s investments are summarized into the three broad levels listed below.
| • | | Level 1 — Unadjusted inputs using quoted prices in active markets for identical investments. |
| • | | Level 2 — Other significant observable inputs including, but not limited to, quoted prices for similar investments, inputs other than quoted prices that are observable for investments (such as interest rates, prepayment speeds, credit risk, etc.) or other market corroborated inputs. |
| • | | Level 3 — Significant inputs based on the best information available in the circumstances, to the extent observable inputs are not available (including the Fund’s assumptions in determining the fair value of investments). |
A financial instrument’s level within the fair value hierarchy is based on the lowest level of any input, both individually and in the aggregate, that is significant to the fair value measurement. The inputs or methodology used for valuing instruments are not necessarily an indication of the risk associated with investing in those instruments.
The following table represents each valuation input as presented on the Schedule of Portfolio Investments (“SOI”):
| | | | | | | | | | | | | | | | |
| | | | | | Level 2 | | | Level 3 | | | | |
| | | Level 1 | | | Other significant | | | Significant | | | | |
| | | Quoted prices | | | observable inputs | | | unobservable inputs | | | Total | |
| | | | |
Total Investments in Securities(a) | | | $ 16,243,547 | | | | $ – | | | | $ – | | | | $ 16,243,547 | |
| | | | |
Total Liabilities for Securities Sold Short(a) | | | $ (2,633,173) | | | | $ – | | | | $ – | | | | $ (2,633,173) | |
| | | | |
| (a) | Portfolio holdings designated as level 1 are disclosed individually on the SOI. Please refer to the SOI for industry specifics of portfolio holdings. |
17
There were no transfers into and out of level 3 for the year ended June 30, 2019.
B. Restricted Securities —Certain securities held by the Fund may be subject to legal or contractual restrictions on resale. Restricted securities generally are resold in transactions exempt from registration under the Securities Act of 1933, as amended (the “Securities Act”). Disposal of these securities may involve time-consuming negotiations and expense. Prompt sale at the current valuation may be difficult and could adversely affect the net asset value of the Fund.
As of June 30, 2019, the Fund had no investments in restricted securities.
C. Short Sales —The Fund engaged in short sales as part of its normal investment activities. In a short sale, the Fund sells securities it does not own in anticipation of a decline in the market value of those securities. In order to deliver securities to the purchaser, the Fund borrows securities from a broker. To close out a short position, the Fund delivers the same securities to the broker.
The Fund is required to pledge cash or securities to the broker as collateral for the securities sold short. Collateral requirements are calculated daily based on the current market value of the short positions. Cash collateral deposited with the broker is recorded as Deposits at broker for securities sold short, while cash collateral deposited at the Fund’s custodian for the benefit of the broker is recorded as Restricted cash for securities sold short on the Statement of Assets and Liabilities. Securities segregated as collateral are denoted on the SOI. The Fund may receive or pay the net of the following amounts: (i) a portion of the income from the investment of cash collateral; (ii) the broker’s fee on the borrowed securities (calculated daily based upon the market value of each borrowed security and a variable rate that is dependent on availability of the security); and (iii) a financing charge for the difference between the market value of the short position and cash collateral deposited with the broker. The net amounts of income or fees are included as Interest income or Interest expense on securities sold short on the Statement of Operations.
The Fund is obligated to pay the broker dividends declared on short positions when a position is open on the record date. Dividends on short positions are reported onex-dividend date on the Statement of Operations as Dividend expense on securities sold short. Liabilities for securities sold short are reported at market value on the Statement of Assets and Liabilities and the change in market value is recorded as Change in net unrealized appreciation (depreciation) on the Statement of Operations. Short sale transactions may result in unlimited losses as the security’s price increases and the short position loses value. There is no upward limit on the price a borrowed security could attain. The Fund is also subject to risk of loss if the broker were to fail to perform its obligations under the contractual terms.
The Fund will record a realized loss if the price of the borrowed security increases between the date of the short sale and the date on which the Fund replaces the borrowed security. The Fund will record a realized gain if the price of the borrowed security declines between those dates.
As of June 30, 2019, the Fund had outstanding short sales as listed on the SOI.
D. Securities Lending —Effective October 5, 2018, the Fund became authorized to engage in securities lending in order to generate additional income. The Fund is able to lend to approved borrowers. Citibank N.A. (“Citibank”) serves as lending agent for the Fund, pursuant to a Securities Lending Agency Agreement (the “Securities Lending Agency Agreement”). Securities loaned are collateralized by cash equal to at least 100% of the market value plus accrued interest on the securities lent, which is invested in an affiliated money market fund. The Fund retains loan fees and the interest on cash collateral investments but is required to pay the borrower a rebate for the use of cash collateral. In cases where the lent security is of high value to borrowers, there may be a negative rebate (i.e. a net payment to the Fund). Upon termination of a loan, the Fund is required to return to the borrower an amount equal to the cash collateral, plus any rebate owed to the borrowers. The remaining maturities of the securities lending transactions are considered overnight and continuous. Loans are subject to termination by the Fund or the borrower at any time.
The net income earned on the securities lending (after payment of rebates and Citibank’s fee) is included on the Statement of Operations as Income from securities lending (net). The Fund also receives payments from the borrower during the period of the loan, equivalent to dividends and interest earned on the securities loaned, which are recorded as Dividend or Interest income, respectively, on the Statement of Operations.
Under the Securities Lending Agency Agreement, Citibank marks to market the loaned securities on a daily basis. In the event the cash received from the borrower is less than 102% of the value of the loaned securities (105% for loans ofnon-U.S. securities), Citibank requests additional cash from the borrower so as to maintain a collateralization level of at least 102% of the value of the loaned securities plus accrued interest (105% for loans ofnon-U.S. securities), subject to certainde minimis amounts.
The value of securities out on loan is recorded as an asset on the Statement of Assets and Liabilities. The value of the cash collateral received is recorded as a liability on the Statement of Assets and Liabilities and details of collateral investments are disclosed on the SOI.
The Fund bears the risk of loss associated with the collateral investments and is not entitled to additional collateral from the borrower to cover any such losses. To the extent that the value of the collateral investments declines below the amount owed to a borrower, the Fund may incur losses that exceed the amount it earned on lending the security. Upon termination of a loan, the Fund may use leverage (borrow money) to repay the borrower for cash collateral posted if the Adviser does not believe that it is prudent to sell the collateral investments to fund the payment of this liability. Securities lending activity is subject to master netting arrangements.
Securities lending also involves counterparty risks, including the risk that the loaned securities may not be returned in a timely manner or at all. Subject to certain conditions, Citibank has agreed to indemnify the Fund from losses resulting from a borrower’s failure to return a loaned security.
The Fund did not lend out any securities during the year ended June 30, 2019.
E. Investment Transactions with Affiliates — The Fund invested in an Underlying Fund which is advised by the Adviser or its affiliates. An issuer which is under common control with the Fund may be considered an affiliate. For the purposes of the financial statements, the Fund assumes the issuer listed in the table below to be an affiliated issuer. Underlying Fund distributions may be reinvested into the Underlying Fund. Reinvestment amounts are included in the purchase cost amounts in the table below.
18
| | | | | | | | | | | | | | | | | | | | | | | | | | | | | | | | | | | | |
| For the year ended June 30, 2019 | |
| |
| | | | | | | | | | | | Net | | | Change in | | | | | | | | | | | | | |
| | | Value at | | | | | | | | | Realized | | | Unrealized | | | Value at | | | Shares | | | | | | | |
| | | June 30, | | | Purchases | | | Proceeds | | | Gain | | | Appreciation/ | | | June 30, | | | at June | | | Dividend | | | Capital Gain | |
| Security Description | | 2018 | | | at Cost | | | from Sales | | | (Loss) | | | (Depreciation) | | | 2019 | | | 30, 2019 | | | Income | | | Distributions | |
| |
JPMorgan Prime Money Market Fund Class IM Shares, 2.46%(a)(b) | | | $— | | | | $3,443,667 | | | | $2,934,868 | | | | $13 | | | | $50 | | | | $508,862 | | | | 508,659 | | | | $2,505 | | | | $— | |
JPMorgan U.S. Government Money Market Fund Class Institutional
Shares(a) | | | 466,266 | | | | 5,880,182 | | | | 6,346,448 | | | | — | | | | — | | | | — | | | | — | | | | 6,032 | | | | — | |
| | | | | | | | | | | | |
| | | | | | | | | |
Total | | | $466,266 | | | | $9,323,849 | | | | $9,281,316 | | | | $13 | | | | $50 | | | | $508,862 | | | | | | | | $8,537 | | | | $— | |
| | | | | | | | | | | | |
(a) Investment in affiliate fund, which is registered under the Investment Company Act of 1940, as amended, and is advised by J.P. Morgan Investment Management Inc.
(b) The rate shown is the current yield as of June 30, 2019.
F. Security Transactions and Investment Income —Investment transactions are accounted for on the trade date (the date the order to buy or sell is executed). Securities gains and losses are calculated on a specifically identified cost basis. Interest income and interest expense on securities sold short, if any, is determined on the basis of coupon interest accrued using the effective interest method which adjusts for amortization of premiums and accretion of discounts. Dividend income, net of foreign tax withheld, if any, and dividend expense on securities sold short, are recorded on theex-dividend date or when the Fund first learns of the dividend.
To the extent such information is publicly available, the Fund records distributions received in excess of income earned from underlying investments as a reduction of cost of investments and/or realized gain. Such amounts are based on estimates if actual amounts are not available and actual amounts of income, realized gain and return of capital may differ from the estimated amounts. The Fund adjusts the estimated amounts of the components of distributions (and consequently their net investment income) as necessary once the issuers provide information about the actual composition of the distributions.
G. Allocation of Income and Expenses — Expenses directly attributable to a fund are charged directly to that fund, while the expenses attributable to more than one fund of the Trust are allocated among the respective funds. In calculating the NAV of each class, investment income, realized and unrealized gains and losses and expenses, other than class specific expenses, are allocated daily to each class of shares based upon the proportion of net assets of each class at the beginning of each day.
Transfer agency fees are class-specific expenses. The amount of the transfer agency fees charged to each share class of the Fund for the year ended June 30, 2019 are as follows:
| | | | | | | | |
| | | Class A | | Class C | | Class I | | Total |
Transfer agency fees | | $ 86 | | $ 85 | | $ 226 | | $ 397 |
H. Federal Income Taxes —The Fund is treated as a separate taxable entity for Federal income tax purposes. The Fund’s policy is to comply with the provisions of the Internal Revenue Code (the “Code”), applicable to regulated investment companies and to distribute to shareholders all of its distributable net investment income and net realized capital gains on investments. Accordingly, no provision for Federal income tax is necessary. Management has reviewed the Fund’s tax positions for all open tax years and has determined that as of June 30, 2019, no liability for income tax is required in the Fund’s financial statements for net unrecognized tax benefits. However, management’s conclusions may be subject to future review based on changes in, or the interpretation of, the accounting standards or tax laws and regulations. The Fund’s Federal tax returns for the prior three fiscal years remain subject to examination by the Internal Revenue Service.
I. Distributions to Shareholders —Distributions from net investment income, if any, are generally declared and paid at least annually with respect to the Fund. Distributions are declared separately for each class. No class has preferential dividend rights; differences in per share rates are due to differences in separate class expenses. Net realized capital gains, if any, are distributed by the Fund at least annually. The amount of distributions from net investment income and net realized capital gains is determined in accordance with Federal income tax regulations, which may differ from GAAP. To the extent these “book/tax” differences are permanent in nature (i.e., that they result from other than timing of recognition — “temporary differences”), such amounts are reclassified within the capital accounts based on their Federaltax-basis treatment.
The following amounts were reclassified within the capital accounts:
| | | | | | | �� | | | | | |
| | | | | | Accumulated | | | | |
| | | | | | undistributed | | | | |
| | | | | | (distributions | | | | |
| | | | | | in excess of) | | | Accumulated | |
| | | Paid-in-Capital | | | net investment | | | net realized | |
| | | | | | income | | | gains (losses) | |
| | $ | (92 | ) | | $ | (6,035 | ) | | $ | 6,127 | |
The reclassifications for the Fund relate primarily tonon-taxable dividends.
19
3. Fees and Other Transactions with Affiliates
A. Investment Advisory Fee —Pursuant to an Investment Advisory Agreement, the Adviser supervises the investments of the Fund and for such services is paid a fee. The fee is accrued daily and paid monthly at an annual rate of 0.75% of the Fund’s average daily net assets. The Adviser waived Investment Advisory fees and/or reimbursed expenses as outlined in Note 3.F.
B. Administration Fee —Pursuant to an Administration Agreement, the Administrator provides certain administration services to the Fund. In consideration of these services, effective January 1, 2019, the Administrator receives a fee accrued daily and paid monthly at an annual rate of 0.075% of the first $10 billion of the Fund’s average daily net assets, plus 0.050% of the Fund’s average daily net assets between $10 billion and $20 billion, plus 0.025% of the Fund’s average daily net assets between $20 billion and $25 billion, plus 0.01% of the Fund’s respective average daily net assets in excess of $25 billion. Prior to January 1, 2019, the Administrator received a fee accrued daily and paid monthly at an annual rate of 0.15% of the first $25 billion of the average daily net assets of all funds in the J.P. Morgan Funds Complex covered by the Administration Agreement (excluding certain funds of funds and money market funds) and 0.075% of the average daily net assets in excess of $25 billion of all such funds. For the year ended June 30, 2019, the effective rate was 0.08% of the Fund’s average daily net assets, notwithstanding any fee waivers and/or expense reimbursements.
The Administrator waived Administration fees as outlined in Note 3.F.
JPMorgan Chase Bank, N.A. (“JPMCB”), a wholly-owned subsidiary of JPMorgan, serves as the Fund’ssub-administrator (the“Sub-administrator”). For its services asSub-administrator, JPMCB receives a portion of the fees payable to the Administrator.
C. Distribution Fees —Pursuant to a Distribution Agreement, JPMorgan Distribution Services, Inc. (“JPMDS”), an indirect, wholly-owned subsidiary of JPMorgan, serves as the Trust’s principal underwriter and promotes and arranges for the sale of the Fund’s shares.
The Board has adopted a Distribution Plan (the “Distribution Plan”) for Class A and Class C Shares of the Fund in accordance with Rule 12b-1 under the 1940 Act. The Class I Shares do not charge a distribution fee. The Distribution Plan provides that the Fund shall pay distribution fees, including payments to JPMDS, at annual rates of 0.25% and 0.75% of the average daily net assets of Class A and Class C Shares, respectively.
In addition, JPMDS is entitled to receive thefront-end sales charges from purchases of Class A Shares and the CDSC from redemptions of Class C Shares and certain Class A Shares for whichfront-end sales charges have been waived. For the year ended June 30, 2019, JPMDS did not retain anyfront-end sales charges or CDSC.
D. Service Fees —The Trust, on behalf of the Fund, has entered into a Shareholder Servicing Agreement with JPMDS under which JPMDS provides certain support services to the shareholders. For performing these services, JPMDS receives a fee that is accrued daily and paid monthly at an annual rate of 0.25% for Class A, Class C and Class I Shares.
JPMDS has entered into shareholder services contracts with affiliated and unaffiliated financial intermediaries who provide shareholder services and other related services to their clients or customers who invest in the Fund under which JPMDS will pay all or a portion of such fees earned to financial intermediaries for performing such services.
JPMDS waived service fees as outlined in Note 3.F.
E. Custodian and Accounting Fees —JPMCB provides portfolio custody and accounting services to the Fund. For performing these services, the Fund pays JPMCB transaction and asset-based fees that vary according to the number of transactions and positions, plusout-of-pocket expenses. The amounts paid directly to JPMCB by the Fund for custody and accounting services are included in Custodian and accounting fees on the Statement of Operations.
Interest income earned on cash balances at the custodian, if any, is included in Interest income from affiliates on the Statement of Operations.
Interest expense paid to the custodian related to cash overdrafts, if any, is included in Interest expense to affiliates on the Statement of Operations.
F. Waivers and Reimbursements— The Adviser, Administrator and/or JPMDS have contractually agreed to waive fees and/or reimburse the Fund to the extent that total annual operating expenses (excluding acquired fund fees and expenses other than certain money market fund fees as described below, dividend and interest expenses related to short sales, interest, taxes, expenses related to litigation and potential litigation, expenses related to trustee elections and extraordinary expenses) exceed the percentages of the Fund’s average daily net assets as shown in the table below:
| | | | | | | | | | | | | | | | |
| | | Class A | | | | Class C | | | | | Class I | | | |
| | 1.20% | | | | | 1.70 | % | | | | | 0.95 | % | | |
The expense limitation agreement was in effect for the year ended June 30, 2019 and is in place until at least October 31, 2019.
For the year ended June 30, 2019, the Fund’s service providers waived fees and/or reimbursed expenses for the Fund as follows. None of these parties expect the Fund to repay any such waived fees and/or reimbursed expenses in future years.
| | | | | | | | | | |
| | | Contractual Waivers | | |
| | | Investment | | | | | | | | |
| | | Advisory | | Administration | | Service | | | | |
| | | Fees | | Fees | | Fees | | Total | | Reimbursements |
| | $99,767 | | $10,386 | | $24,981 | | $135,134 | | $6,865 |
Additionally, the Fund may invest in one or more money market funds advised by the Adviser or its affiliates (affiliated money market funds). The Adviser, Administrator and/or JPMDS, as shareholder servicing agent, have contractually agreed to waive fees and/or reimburse expenses in an amount sufficient to offset the respective net fees each collects from the affiliated money market funds on the Fund’s investment in such affiliated money market funds, except for investments of securities lending cash collateral.
The amount of waivers resulting from investments in these money market funds for the year ended June 30, 2019 was $729.
20
G. Other —Certain officers of the Trust are affiliated with the Adviser, the Administrator and JPMDS. Such officers, with the exception of the Chief Compliance Officer, receive no compensation from the Fund for serving in their respective roles.
The Board designated and appointed a Chief Compliance Officer to the Fund pursuant to Rule 38a-1 under the 1940 Act. The Fund, along with affiliated funds, makes reimbursement payments, on apro-rata basis, to the Administrator for a portion of the fees associated with the office of the Chief Compliance Officer. Such fees are included in Trustees’ and Chief Compliance Officer’s fees on the Statement of Operations.
The Trust adopted a Trustee Deferred Compensation Plan (the “Plan”) which allows the Independent Trustees to defer the receipt of all or a portion of compensation related to performance of their duties as Trustees. The deferred fees are invested in various J.P. Morgan Funds until distribution in accordance with the Plan.
The Securities and Exchange Commission (“SEC”) has granted an exemptive order permitting the Fund to engage in principal transactions with J.P. Morgan Securities, Inc., an affiliated broker, involving taxable money market instruments, subject to certain conditions.
4. Investment Transactions
During the year ended June 30, 2019, purchases and sales of investments (excluding short-term investments) were as follows:
| | | | | | | | |
| | | Purchases | | Sales | | | | Covers on |
| | | (excluding | | (excluding | | Securities | | Securities |
| | | U.S. Government) | | U.S. Government) | | Sold Short | | Sold Short |
| | | | |
| | $ 31,909,246 | | $ 30,966,744 | | $ 3,895,237 | | $ 3,112,331 |
During the year ended June 30, 2019, there were no purchases or sales of U.S. Government securities.
5. Federal Income Tax Matters
For Federal income tax purposes, the estimated cost and unrealized appreciation (depreciation) in value of investments held at June 30, 2019 were as follows:
| | | | | | | | | | | | | | | | |
| | | | | | | Gross | | | | Gross | | | | Net Unrealized | | |
| | | Aggregate | | | | Unrealized | | | | Unrealized | | | | Appreciation | | |
| | | Cost* | | | | Appreciation | | | | Depreciation | | | | (Depreciation) | | |
| | | | | | | | |
| | $12,683,916 | | | | $1,317,592 | | | | $391,134 | | | | $926,458 | | |
*The tax cost includes the proceeds from short sales which may result in a net negative cost.
The difference between book and tax basis appreciation (depreciation) on investments is primarily attributed to wash sale loss deferrals.
The tax character of distributions paid during the year ended June 30, 2019 was as follows:
| | | | | | | | | | | | |
| | | Ordinary | | | | Net Long-Term | | | | Total | | |
| | | Income* | | | | Capital Gains | | | | Distributions Paid | | |
| | | | | | |
| | $ 429,183 | | | | $ 633,420 | | | | $ 1,062,603 | | |
* Short-term gain distributions are treated as ordinary income for income tax purposes.
The tax character of distributions paid during the year ended June 30, 2018 was as follows:
| | | | | | | | | | | | | | | | | | |
| | | Ordinary | | | | | Net Long-Term | | | | | Total | | | |
| | | Income* | | | | | Capital Gains | | | | | Distributions Paid | | | |
| | | | | | |
| | $ | 1,412,318 | | | | | $ | 208,691 | | | | | $ | 1,621,009 | | | |
* Short-term gain distributions are treated as ordinary income for income tax purposes.
As of June 30, 2019, the estimated components of net assets (excludingpaid-in-capital) on a tax basis were as follows:
| | | | | | | | | | | | |
| | | | | | Current | | | | |
| | | | | | Distributable | | | | |
| | | Current | | | Long-Term | | | | |
| | | Distributable | | | Capital Gain or | | | Unrealized | |
| | | Ordinary | | | (Tax Basis Capital | | | Appreciation | |
| | | Income | | | Loss Carryover) | | | (Depreciation) | |
| | | | | | | | | | |
| | $ | 83,881 | | | $ | (22,937 | ) | | $ | 920,600 | |
The cumulative timing differences primarily consist of wash sale loss deferrals, post-October capital loss deferrals and trustee deferred compensation.
21
As of June 30, 2019, the Fund had the following net capital loss carryforwards:
| | | | | | | | |
| | | Capital Loss Carryforward Character | |
| | | | |
| | | Short-Term | | | Long-Term | |
| | | | | | | |
| | $ | 22,937 | | | $ | — | |
Net capital losses incurred after October 31, and within the taxable year are deemed to arise on the first business day of the Fund’s next taxable year.
For the year ended June 30, 2019, the Fund deferred to July 1, 2019 the following net capital losses (gains) of:
| | | | | | | | |
| | | Net Capital Losses (Gains) | |
| | | | |
| | | Short-Term | | | Long-Term | |
| | | | | | | |
| | $ | 545,840 | | | $ | (385,813 | ) |
6. Borrowings
The Fund relies upon an exemptive order granted by the SEC (the “Order”) permitting the establishment and operation of an Interfund Lending Facility (the “Facility”). The Facility allows the Fund to directly lend and borrow money to or from any other fund relying upon the Order at rates beneficial to both the borrowing and lending funds. Advances under the Facility are taken primarily for temporary or emergency purposes, including the meeting of redemption requests that otherwise might require the untimely disposition of securities, and are subject to the Fund’s borrowing restrictions. The Interfund loan rate is determined, as specified in the Order, by averaging the current repurchase agreement rate and the current bank loan rate. The Order was granted to JPMorgan Trust II and may be relied upon by the Fund because the Fund and the series of JPMorgan Trust II are all investment companies in the same “group of investment companies” (as defined in Section 12(d)(1)(G) of the 1940 Act).
The Trust and JPMCB have entered into a financing arrangement. Under this arrangement, JPMCB provides an unsecured, uncommitted credit facility in the aggregate amount of $100 million to certain of the J.P. Morgan Funds, including the Fund. Advances under the arrangement are taken primarily for temporary or emergency purposes, including the meeting of redemption requests that otherwise might require the untimely disposition of securities, and are subject to the Fund’s borrowing restrictions. Interest on borrowings is payable at a rate determined by JPMCB at the time of borrowing. This agreement has been extended until November 4, 2019.
The Fund had no borrowings outstanding from another fund or from the unsecured, uncommitted credit facility during the year ended June 30, 2019.
7. Risks, Concentrations and Indemnifications
In the normal course of business, the Fund entered into contracts that contain a variety of representations which provide general indemnifications. The Fund’s maximum exposure under these arrangements is unknown. The amount of exposure would depend on future claims that may be brought against the Fund. However, based on experience, the Fund expects the risk of loss to be remote.
As of June 30, 2019, all of the Fund’s shares were held by the Adviser.
As of June 30, 2019, the Fund pledged a significant portion of its assets for securities sold short to Scotiabank.
Derivatives may be riskier than other types of investments because they may be more sensitive to changes in economic and market conditions and could result in losses that significantly exceed the Fund’s original investment. Many derivatives create leverage thereby causing the Fund to be more volatile than it would have been if it had not used derivatives. Derivatives also expose the Fund to counterparty risk (the risk that the derivative counterparty will not fulfill its contractual obligations), including credit risk of the derivative counterparty. The possible lack of a liquid secondary market for derivatives and the resulting inability of the Fund to sell or otherwise close a derivatives position could expose the Fund to losses.
8. New Accounting Pronouncements
In August 2018, the Financial Accounting Standards Board (“FASB”) issued Accounting Standard Update (“ASU”)2018-13 (“ASU2018-13”) Fair Value Measurement (Topic 820): Disclosure Framework — Changes to the Disclosure Requirements for Fair Value Measurement, which adds, removes, and modifies certain aspects of the fair value disclosure. ASU2018-13 amendments are the result of a broader disclosure project, FASB Concepts StatementConceptual Framework for Financial Reporting — Chapter 8: Notes to Financial Statements, to improve the effectiveness of the fair value disclosure requirements. ASU2018-13 is effective for the fiscal years, and interim periods within those fiscal years, beginning after December 15, 2019; early adoption is permitted. Management has evaluated the implications of these changes and the amendments are included in the financial statements, which had no effect to the Fund’s net assets or results of operation.
In August 2018, the SEC adopted the Disclosure Update and Simplification Rule (the “Rule”). The Rule is part of the SEC’s overall project to improve disclosure effectiveness by amending certain disclosure requirements that have become redundant, duplicative, overlapping, outdated, or superseded in light of other SEC disclosure requirements, U.S. GAAP, or changes in the information environment. The amendments are intended to facilitate the disclosure of information to investors and simplify compliance without significantly altering the total mix of information provided to investors. Management has evaluated the implications of these changes and the amendments are included in the financial statements, which had no effect on the Fund’s net assets or results of operation.
9. Subsequent Event
At their meeting in May 2019, the Board approved the liquidation of the Fund which is expected to occur on or about October 4, 2019.
22
Report of Independent Registered Public Accounting Firm
TotheBoard of Trustees ofJPMorgan Trust IVand Shareholders of JPMorgan Value Plus Fund
Opinion on the Financial Statements
We have audited the accompanying statement of assets and liabilities, including the schedule of portfolio investments, of JPMorgan Value Plus Fund (one of the funds constituting JPMorgan Trust IV, referred to hereafter as the “Fund”) as of June 30, 2019, the related statements of operations and cash flows for the year ended June 30, 2019, the statements of changes in net assets for each of the two years in the period ended June 30, 2019, including the related notes, and the financial highlights for each of the two years in the period ended June 30, 2019 and for the period August 31, 2016 (commencement of operations) through June 30, 2017 (collectively referred to as the “financial statements”). In our opinion, the financial statements present fairly, in all material respects, the financial position of the Fund as of June 30, 2019, the results of its operations and its cash flows for the year then ended, the changes in its net assets for each of the two years in the period ended June 30, 2019 and the financial highlights for each of the two years in the period ended June 30, 2019 and for the period August 31, 2016 (commencement of operations) through June 30, 2017 in conformity with accounting principles generally accepted in the United States of America.
Basis for Opinion
These financial statements are the responsibility of the Fund’s management. Our responsibility is to express an opinion on the Fund’s financial statements based on our audits. We are a public accounting firm registered with the Public Company Accounting Oversight Board (United States) (PCAOB) and are required to be independent with respect to the Fund in accordance with the U.S. federal securities laws and the applicable rules and regulations of the Securities and Exchange Commission and the PCAOB.
We conducted our audits of these financial statements in accordance with the standards of the PCAOB. Those standards require that we plan and perform the audit to obtain reasonable assurance about whether the financial statements are free of material misstatement, whether due to error or fraud.
Our audits included performing procedures to assess the risks of material misstatement of the financial statements, whether due to error or fraud, and performing procedures that respond to those risks. Such procedures included examining, on a test basis, evidence regarding the amounts and disclosures in the financial statements. Our audits also included evaluating the accounting principles used and significant estimates made by management, as well as evaluating the overall presentation of the financial statements. Our procedures included confirmation of securities owned as of June 30, 2019 by correspondence with the custodian, transfer agent and brokers; when replies were not received from brokers, we performed other auditing procedures. We believe that our audits provide a reasonable basis for our opinion.
As discussed in Note 9 to the financial statement, in May 2019, the Board of Trustees approved the liquidation of the Portfolio, which will occur on or about October 4, 2019.
/s/ PricewaterhouseCoopers LLP
New York, New York
August 23, 2019
We have served as the auditor of one or more investment companies in the JPMorgan Funds complex since 1993.
23
TRUSTEES
(Unaudited)
The Fund’s Statement of Additional Information includes additional information about the Fund’s Trustees and is available, without charge, upon request by calling1-800-480-4111.
| | | | | | |
Name (Year of Birth); Positions With the Fund(1) | | Principal Occupation During Past 5 Years | | Number of
Funds in Fund
Complex Overseen
by Trustee (2) | | Other Directorships Held During the Past 5 Years |
Independent Trustees | | |
| | | |
| John F. Finn (1947); Trustee of Trust since 2015; Trustee of heritage One Group Mutual Funds since 1998. | | Chairman and Chief Executive Officer, Gardner, Inc. (supply chain management company serving industrial and consumer markets) (serving in various roles 1974-present). | | 134 | | Director, Greif, Inc. (GEF) (industrial package products and services)(2007-present); Trustee, Columbus Association for the Performing Arts (1988-present); Director, Cardinal Health, Inc. (CAH) (1994-2014). |
| | | |
| Stephen P. Fisher (1959); Trustee of Trust since 2018. | | Retired; Chairman and Chief Executive Officer, NYLIFE Distributors LLC (registered broker-dealer) (serving in various roles2008-2013); Chairman, NYLIM Service Company LLC (transfer agent) (2008-2017); New York Life Investment Management LLC (registered investment adviser) (serving in various roles 2005-2017); Chairman, IndexIQ Advisors LLC (registered investment adviser for ETFs)(2014-2017); President, MainStay VP Funds Trust (2007-2017), MainStay DefinedTerm Municipal Opportunities Fund (2011-2017) and MainStay Funds Trust (2007-2017) (registered investment companies). | | 134 | | Advisory Board Member, Scholarship Committee Member and Investment Committee Member, The First Tee of Plainfield(non-profit youth sports organization that provides need-based scholarships) (2014-present); Honors Program Advisory Board Member, The Zicklin School of Business, Baruch College, The City University of New York (2017-present). |
| | | |
| Kathleen M. Gallagher (1958); Trustee of the Trust since 2018. | | Retired; Chief Investment Officer – Benefit Plans, Ford Motor Company (serving in various roles 1985-2016). | | 134 | | Non-Executive Director, Legal & General Investment Management (Holdings) (2018-present); Non-Executive Director, Legal & General Investment Management America (financial services and insurance) (2017-present); Advisory Board Member, OCIO Board of State Street Global Advisors (2017-present); Member, Client Advisory Council, Financial Engines, LLC (registered investment adviser) (2011-2016); Director, Ford Pension Funds Investment Management Ltd.(2007-2016). |
| | | |
| Dr. Matthew Goldstein (1941); Chairman since 2015; Trustee of Trust since 2015; Trustee of heritage J.P. Morgan Funds since 2003. | | Chancellor Emeritus, City University of New York (2015-present); Professor, City University of New York (2013-present); Chancellor, City University of New York (1999-2013); President, Adelphi University (New York) (1998-1999). | | 134 | | Trustee, Museum of Jewish Heritage(2011-present); Trustee, National Museum of Mathematics (present); Chair, Association of College and University Administrators (present). |
| | | |
| Dennis P. Harrington* (1950); Trustee of Trust since 2017. | | Retired; Partner, Deloitte LLP (accounting firm) (serving in various roles 1984-2012). | | 134 | | None |
| | | |
| Frankie D. Hughes (1952); Trustee of Trust since 2015. | | President, Ashland Hughes Properties (property management) (2014-present); President and Chief Investment Officer, Hughes Capital Management, Inc. (fixed income asset management) (1993-2014). | | 134 | | None |
| | | | | | |
Name (Year of Birth); Positions With the Fund(1) | | Principal Occupation During Past 5 Years | | Number of
Funds in Fund
Complex Overseen
by Trustee (2) | | Other Directorships Held During the Past 5 Years |
Independent Trustees (continued) | | |
| | | |
Raymond Kanner** (1953); Trustee of Trust since 2017. | | Retired; Managing Director & Chief Investment Officer, IBM Retirement Funds (2007-2016). | | 134 | | Advisory Board Member, Los Angeles Capital (2018-present); Advisory Board Member, State Street Global Advisors OCIO Board (2017-present); Acting Executive Director, Committee on Investment of Employee Benefit Assets (CIEBA) (2016-2017); Advisory Board Member, Betterment for Business (robo advisor) (2016-2017); Advisory Board Member, Blue Star Indexes (index creator) (2013-2017); Director, Emerging Markets Growth Fund (registered investment company) (1997-2016); Member, Russell Index Client Advisory Board (2001-2015). |
| | | |
| Peter C. Marshall (1942); Trustee of Trust since 2015; Trustee of heritage One Group Mutual Funds since 1985. | | Self-employed business consultant
(2002-present). | | 134 | | None |
| | | |
| Mary E. Martinez (1960); Trustee of Trust since 2015. | | Associate, Special Properties, a Christie’s International Real Estate Affiliate(2010-present); Managing Director, Bank of America (Asset Management) (2007-2008); Chief Operating Officer, U.S. Trust Asset Management, U.S. Trust Company (asset management) (2003-2007); President, Excelsior Funds (registered investment companies) (2004-2005). | | 134 | | None |
| | | |
| Marilyn McCoy (1948); Trustee of Trust since 2015; Trustee of heritage One Group Mutual Funds since 1999. | | Vice President of Administration and Planning, Northwestern University (1985-present). | | 134 | | None |
| | | |
| Mitchell M. Merin (1953); Trustee of Trust since 2015. | | Retired; President and Chief Operating Officer, Morgan Stanley Investment Management, Member Morgan Stanley & Co. Management Committee (serving in various roles 1981-2006). | | 134 | | Director, Sun Life Financial (SLF) (financial services and insurance) (2007-2013). |
| | | |
| Dr. Robert A. Oden, Jr. (1946); Trustee of Trust since 2015; Trustee of heritage One Group Mutual Funds since 1997. | | Retired; President, Carleton College(2002-2010); President, Kenyon College(1995-2002). | | 134 | | Trustee, Trout Unlimited (2017-present); Trustee, American Museum of Fly Fishing (2013-present); Vice Chair, Dartmouth-Hitchcock Medical Center (2011-present); Trustee, American University in Cairo (1999-2014). |
| | | |
| Marian U. Pardo*** (1946); Trustee of Trust since 2015. | | Managing Director and Founder, Virtual Capital Management LLC (investment consulting)(2007-present); Managing Director, Credit Suisse Asset Management (portfolio manager)(2003-2006). | | 134 | | President and Member, Board of Governors, Columbus Citizens Foundation (not-for-profit supporting philanthropic and cultural programs) (2006-present). |
| (1) | The Trustees serve for an indefinite term, subject to the Trust’s current retirement policy, which is age 78 for all Trustees. |
| (2) | A Fund Complex means two or more registered investment companies that hold themselves out to investors as related companies for purposes of investment and investor services or have a common investment adviser or have an investment adviser that is an affiliated person of the investment adviser of any of the other registered investment companies. The J.P. Morgan Funds Complex for which the Board of Trustees serves currently includes eleven registered investment companies (134 funds). |
| * | Two family members of Mr. Harrington are partner and managing director, respectively, of the Fund’s independent registered public accounting firm. Such firm has represented to the Board that those family members are not involved in the audit of the Fund’s financial statements and do not provide other services to the Fund. The Board has concluded that such association does not interfere with Mr. Harrington’s exercise of independent judgment as an Independent Trustee. |
| ** | A family member of Mr. Kanner is employed by JPMorgan Chase Bank, which is affiliated with JPMIM and JPMDS. In that capacity, this employee provides services to various JPMorgan affiliates including JPMIM and JPMDS and for which JPMIM and JPMDS bear some portion of the expense thereof. |
| *** | In connection with prior employment with JPMorgan Chase, Ms. Pardo was the recipient ofnon-qualified pension plan payments from JPMorgan Chase in the amount of approximately $2,055 per month, which she irrevocably waived effective January 1, 2013, and deferred compensation payments from JPMorgan Chase in the amount of approximately $7,294 per year, which ended in January 2013. In addition, Ms. Pardo receives payments from a fully-funded qualified plan, which is not an obligation of JPMorgan Chase. |
The contact address for each of the Trustees is 277 Park Avenue, New York, NY 10172.
26
OFFICERS
(Unaudited)
| | |
Name (Year of Birth), Positions Held with the Trust (Since) | | Principal Occupations During Past 5 Years |
| |
Brian S. Shlissel (1964), President and Principal Executive Officer (2016) | | Managing Director and Chief Administrative Officer for J.P. Morgan pooled vehicles, J.P. Morgan Investment Management Inc. (formerly JPMorgan Funds Management, Inc.) (from 2014 to present); Managing Director and Head of Mutual Fund Services, Allianz Global Investors; President and Chief Executive Officer, Allianz Global Investors Mutual Funds and PIMCOClosed-End Funds (from 1999 to 2014). |
| |
Timothy J. Clemens (1975), Treasurer and Principal Financial Officer (2018)* | | Executive Director, J.P. Morgan Investment Management Inc. (formerly JPMorgan Funds Management, Inc.) since February 2016; Vice President, JPMorgan Funds Management, Inc. from October 2013 to January 2016. |
| |
Gregory S. Samuels (1980), Secretary (2019)* (formerly Assistant Secretary since 2010) | | Executive Director and Assistant General Counsel, JPMorgan Chase since 2014; formerly Vice President and Assistant General Counsel, JPMorgan Chase from 2010 to February 2014. |
| |
Stephen M. Ungerman (1953), Chief Compliance Officer (2015) | | Managing Director, JPMorgan Chase & Co.; Mr. Ungerman has been with JPMorgan Chase & Co. since 2000. |
| |
Elizabeth A. Davin (1964), Assistant Secretary (2015)** | | Executive Director and Assistant General Counsel, JPMorgan Chase since February 2012; formerly Vice President and Assistant General Counsel, JPMorgan Chase from 2005 to February 2012; Senior Counsel, JPMorgan Chase (formerly Bank One Corporation) from 2004 to 2005. |
| |
Jessica K. Ditullio (1962), Assistant Secretary (2015)** | | Executive Director and Assistant General Counsel, JPMorgan Chase. Ms. Ditullio has been with JPMorgan Chase (formerly Bank One Corporation) since 1990. |
| |
Anthony Geron (1971), Assistant Secretary (2018)* | | Vice President and Assistant General Counsel, JPMorgan Chase since September 2018; Lead Director and Counsel, AXA Equitable Life Insurance Company from 2015 to 2018 and Senior Director and Counsel, AXA Equitable Life Insurance Company from 2014 to 2015; Associate, Willkie Farr & Gallagher (law firm) from 2007 to 2014. |
| |
Carmine Lekstutis (1980), Assistant Secretary (2015)* | | Executive Director and Assistant General Counsel, JPMorgan Chase since February 2015; formerly Vice President and Assistant General Counsel, JPMorgan Chase from 2011 to February 2015. |
| |
Keri E. Riemer (1976), Assistant Secretary (2019)* | | Executive Director and Assistant General Counsel, JPMorgan Chase since February 2019; Counsel, Seward & Kissel LLP (2016-2019); Associate, Seward & Kissel LLP (2011-2016). |
| |
Zachary E. Vonnegut-Gabovitch (1986), Assistant Secretary (2017)* | | Vice President and Assistant General Counsel, JPMorgan Chase since September 2016; Associate, Morgan, Lewis & Bockius (law firm) from 2012 to 2016. |
| |
Michael M. D’Ambrosio (1969), Assistant Treasurer (2015) | | Managing Director, J.P. Morgan Investment Management Inc. (formerly JPMorgan Funds Management, Inc.) since May 2014; formerly Executive Director, JPMorgan Funds Management, Inc. from 2012 to May 2014. |
| |
Aleksandr Fleytekh (1972), Assistant Treasurer (2019)* | | Vice President, J.P. Morgan Investment Management Inc. (formerly JPMorgan Funds Management, Inc.) since February 2012. |
| |
Shannon Gaines (1977), Assistant Treasurer (2018)** | | Vice President, J.P. Morgan Investment Management Inc. (formerly JPMorgan Funds Management, Inc.) since January 2014. |
| |
Jeffrey D. House (1972), Assistant Treasurer (2017)** | | Vice President, J.P. Morgan Investment Management Inc. (formerly JPMorgan Funds Management, Inc.) since July 2006. |
| |
Lauren A. Paino (1973), Assistant Treasurer (2015)* | | Executive Director, J.P. Morgan Investment Management Inc. (formerly JPMorgan Funds Management, Inc.) since August 2013. |
| |
Joseph Parascondola (1963), Assistant Treasurer (2015)* | | Vice President, J.P. Morgan Investment Management Inc. (formerly JPMorgan Funds Management, Inc.) since August 2006. |
| |
Gillian I. Sands (1969), Assistant Treasurer (2015)* | | Vice President, J.P. Morgan Investment Management Inc. (formerly JPMorgan Funds Management, Inc.) since September 2012. |
The contact address for each of the officers, unless otherwise noted, is 277 Park Avenue, New York, NY 10172.
* The contact address for the officer is 4 New York Plaza, New York, NY 10004.
** The contact address for the officer is 1111 Polaris Parkway, Columbus, OH 43240.
27
SCHEDULE OF SHAREHOLDER EXPENSES (Unaudited)
Hypothetical $1,000 Investment
As a shareholder of the Fund, you incur two types of costs: (1) transaction costs, including sales charges (loads) on purchase payments and (2) ongoing costs, including investment advisory fees, administration fees, distribution fees and other Fund expenses. The examples below are intended to help you understand your ongoing costs (in dollars) of investing in the Fund and to compare these ongoing costs with the ongoing costs of investing in other mutual funds. The examples assume that you had a $1,000 investment in each Class at the beginning of the reporting period, January 1, 2019 and continued to hold your shares at the end of the reporting period, June 30, 2019.
Actual Expenses
For each Class of the Fund in the table below, the first line provides information about actual account values and actual expenses. You may use the information in this line, together with the amount you invested, to estimate the expenses that you paid over the period. Simply divide your account value by $1,000 (for example, an $8,600 account value divided by $1,000 = 8.6), then multiply the result by the number in the first line of each Class under the heading entitled “Expenses Paid During the Period” to estimate the expenses you paid on your account during this period.
Hypothetical Example for Comparison Purposes
The second line of each Class in the table below provides information about hypothetical account values and hypothetical expenses based on the Class’ actual expense ratio and an assumed rate of return of 5% per year before expenses, which is not the Class’ actual return. The hypothetical account values and expenses may not be used to estimate the actual ending account balance or expenses you paid for the period. You may use this information to compare the ongoing costs of investing in the Class of the Fund and other funds. To do so, compare this 5% hypothetical example with the 5% hypothetical examples that appear in the shareholder reports of the other funds.
Please note that the expenses shown in the table are meant to highlight your ongoing costs only and do not reflect any transaction costs, such as sales charges (loads) or redemption fees. Therefore, the second line for each Class in the table is useful in comparing ongoing costs only, and will not help you determine the relative total costs of owning different funds. In addition, if these transaction costs were included, your costs would have been higher. The examples also assume all dividends and distributions have been reinvested.
| | | | | | | | | | | | | | | | |
| | | Beginning | | | Ending | | | Expenses | | | Annualized | |
| | | Account Value | | | Account Value | | | Paid During the | | | Expense | |
| | | January 1, 2019 | | | June 30, 2019 | | | Period* | | | Ratio | |
| | | | |
JPMorgan Value Plus Fund | | | | | | | | | | | | | | | | |
| | | | |
Class A | | | | | | | | | | | | | | | | |
| | | | |
Actual | | | $1,000.00 | | | | $1,142.50 | | | | $8.81 | | | | 1.66% | |
| | | | |
Hypothetical | | | 1,000.00 | | | | 1,016.57 | | | | 8.29 | | | | 1.66 | |
| | | | |
Class C | | | | | | | | | | | | | | | | |
| | | | |
Actual | | | 1,000.00 | | | | 1,139.90 | | | | 11.45 | | | | 2.16 | |
| | | | |
Hypothetical | | | 1,000.00 | | | | 1,014.09 | | | | 10.78 | | | | 2.16 | |
| | | | |
Class I | | | | | | | | | | | | | | | | |
| | | | |
Actual | | | 1,000.00 | | | | 1,144.60 | | | | 7.49 | | | | 1.41 | |
| | | | |
Hypothetical | | | 1,000.00 | | | | 1,017.81 | | | | 7.05 | | | | 1.41 | |
| * | Expenses are equal to each Class’ respective annualized expense ratio, multiplied by the average account value over the period, multiplied by 181/365 (to reflect theone-half year period). |
28
Tax Letter
(Unaudited)
Certain tax information for the J.P. Morgan Funds is required to be provided to shareholders based upon the Fund’s income and distributions for the taxable year ended June 30, 2019. The information and distributions reported in this letter may differ from the information and taxable distributions reported to the shareholders for the calendar year ending December 31, 2019. The information necessary to complete your income tax returns for the calendar year ending December 31, 2019 will be provided under separate cover.
Dividends Received Deduction (DRD)
The Fund had 57.65% or maximum allowable percentage, of ordinary income distributions eligible for the dividends received deduction for corporate rate shareholders for the fiscal year ended June 30, 2019.
Qualified Dividend Income (QDI)
The Fund had $258,875, or maximum allowable amount, of ordinary income distributions treated as qualified dividends for the fiscal year ended June 30, 2019.
Long-Term Capital Gain
The Fund distributed $633,420, or maximum allowable amount, of long-term capital gain dividends for the fiscal year ended June 30, 2019.
29

Rev. January 2011
| | | | |
| | | |
| FACTS | | WHAT DOES J.P. MORGAN FUNDS DO WITH YOUR PERSONAL INFORMATION? | | |
| | | | |
| Why? | | Financial companies choose how they share your personal information. Federal law gives consumers the right to limit some but not all sharing. Federal law also requires us to tell you how we collect, share, and protect your personal information. Please read this notice carefully to understand what we do. | | |
| | | | |
| What? | | The types of personal information we collect and share depend on the product or service you have with us. This information can include: ◾ Social Security number and account balances ◾ transaction history and account transactions ◾ checking account information and wire transfer instructions When you areno longer our customer, we continue to share your information as described in this notice. | | |
| | | | |
| How? | | All financial companies need to share customers’ personal information to run their everyday business. In the section below, we list the reasons financial companies can share their customers’ personal information; the reasons J.P. Morgan Funds chooses to share; and whether you can limit this sharing. | | |

| | | | | | |
| | | | |
Reasons we can share your personal
information | | Does J.P. Morgan
Funds share? | | Can you limit this
sharing? | | |
For our everyday business purposes – such as to process your transactions, maintain your
account(s), respond to court orders and legal investigations, or report to credit bureaus | | Yes | | No | | |
For marketing purposes – to offer our products and services to you | | Yes | | No | | |
For joint marketing with other financial companies | | No | | We don’t share | | |
For our affiliates’ everyday business purposes – information about your transactions and experiences | | No | | We don’t share | | |
For our affiliates’ everyday business purposes – information about your creditworthiness | | No | | We don’t share | | |
| For nonaffiliates to market to you | | No | | We don’t share | | |
| | | | |
| | | |
Questions? | | Call1-800-480-4111 or go to www.jpmorganfunds.com | | |
| | | | |
| | |
| Who we are | | |
| Who is providing this notice? | | J.P. Morgan Funds | | |
| | | | |
| | |
| What we do | | |
| How does J.P. Morgan Funds protect my personal information? | | To protect your personal information from unauthorized access and use, we use security measures that comply with federal law. These measures include computer safeguards and secured files and buildings. We authorize our employees to access your information only when they need it to do their work and we require companies that work for us to protect your information. | | |
How does J.P. Morgan Funds collect my personal information? | | We collect your personal information, for example, when you: ◾ open an account or provide contact information ◾ give us your account information or pay us by check ◾ make a wire transfer We also collect your personal information from others, such as credit bureaus, affiliates and other companies. | | |
| Why can’t I limit all sharing? | | Federal law gives you the right to limit only ◾ sharing for affiliates’ everyday business purposes - information about your creditworthiness ◾ affiliates from using your information to market to you ◾ sharing for nonaffiliates to market to you State laws and individual companies may give you additional rights to limit sharing. | | |
| | | | |
| | |
| Definitions | | |
| Affiliates | | Companies related by common ownership or control. They can be financial and nonfinancial companies. ◾ J.P. Morgan Funds does not share with our affiliates. | | |
| Nonaffiliates | | Companies not related by common ownership or control. They can be financial and nonfinancial companies. ◾ J.P. Morgan Funds does not share with nonaffiliates so they can market to you. | | |
| Joint Marketing | | A formal agreement between nonaffiliated financial companies that together market financial products or services to you. ◾ J.P. Morgan Funds doesn’t jointly market. | | |
J.P. Morgan Funds are distributed by JPMorgan Distribution Services, Inc., which is an affiliate of JPMorgan Chase & Co. Affiliates of JPMorgan Chase & Co. receive fees for providing various services to the funds.
Contact JPMorgan Distribution Services, Inc. at1-800-480-4111 for a fund prospectus. Investors should carefully consider the investment objectives and risk as well as charges and expenses of the mutual fund before investing. The prospectus contains this and other information about the mutual fund. Read the prospectus carefully before investing.
Investors may obtain information about the Securities Investor Protection Corporation (SIPC), including the SIPC brochure, by visiting www.sipc.org or by calling SIPC at202-371-8300.
The Fund files a complete schedule of its fund holdings for the first and third quarters of its fiscal year with the SEC on FormN-PORT. Prior to March 31, 2019, the Fund filed a complete schedule of its fund holdings for the first and third quarters of its fiscal year with the SEC on FormN-Q. The Fund’s FormN-PORT and FormN-Q are available on the SEC’s website at http://www.sec.gov.
A description of the Fund’s policies and procedures with respect to the disclosure of the Fund’s holdings is available in the prospectus and Statement of Additional Information.
A copy of proxy policies and procedures is available without charge upon request by calling1-800-480-4111. A description of such policies and procedures is on the SEC’s website at www.sec.gov. The Trustees have delegated the authority to vote proxies for securities owned by the Fund to the Adviser. A copy of the Fund’s voting record for the most recent12-month period ended June 30 is available on the SEC’s website at www.sec.gov no later than August 31 of each year. The Fund’s proxy voting record will include, among other things, a brief description of the matter voted on for each fund security, and will state how each vote was cast, for example, for or against the proposal.

ITEM 2. CODE OF ETHICS.
Disclose whether, as of the end of the period covered by the report, the registrant has adopted a code of ethics that applies to the registrant’s principal executive officer, principal financial officer, principal accounting officer or controller, or persons performing similar functions, regardless of whether these individuals are employed by the registrant or a third party. If the registrant has not adopted such a code of ethics, explain why it has not done so.
The registrant must briefly describe the nature of any amendment, during the period covered by the report, to a provision of its code of ethics that applies to the registrant’s principal executive officer, principal financial officer, principal accounting officer or controller, or persons performing similar functions, regardless of whether these individuals are employed by the registrant or a third party, and that relates to any element of the code of ethics definition enumerated in paragraph (b) of this Item. The registrant must file a copy of any such amendment as an exhibit pursuant to Item 13(a)(1), unless the registrant has elected to satisfy paragraph (f) of this Item by positing its code of ethics on its website pursuant to paragraph (f)(2) of this Item, or by undertaking to provide its code of ethics to any person without charge, upon request, pursuant to paragraph (f)(3) of this Item.
If the registrant has, during the period covered by the report, granted a waiver, including an implicit waiver, from a provision of the code of ethics that applies to the registrant’s principal executive officer, principal financial officer, principal accounting officer or controller, or persons performing similar functions, regardless of whether these individuals are employed by the registrant or third party, that relates to one or more items set forth in paragraph (b) of this Item, the registrant must briefly describe the nature of the waiver, the name of the person to whom the waiver was granted, and the date of the waiver.
The Registrant has adopted a code of ethics that applies to the Registrant’s principal executive officer and principal financial officer. There were no amendments to the code of ethics or waivers granted with respect to the code of ethics in the period covered by the report.
ITEM 3. AUDIT COMMITTEE FINANCIAL EXPERT.
(a) (1) Disclose that the registrant’s board of directors has determined that the registrant either:
(i) Has at least one audit committee financial expert serving on its audit committee; or
(ii) Does not have an audit committee financial expert serving on its audit committee.
The Registrant’s Board of Trustees has determined that the Registrant has at least one audit committee financial expert serving on its audit committee. The Securities and Exchange Commission has stated that the designation or identification of a person as an audit committee financial expert pursuant to this Item 3 of FormN-CSR does not impose on such person any duties, obligations or liabilities that are greater than the duties, obligations and liabilities imposed on such person as a member of the Audit Committee and the Board of Trustees in the absence of such designation or identification.
(2) If the registrant provides the disclosure required by paragraph (a)(1)(i) of this Item, it must disclose the name of the audit committee financial expert and whether that person is “independent.” In order to be considered “independent” for purposes of this Item, a member of an audit committee may not, other than in his or her capacity as a member of the audit committee, the board of directors, or any other board committee:
(i) Accept directly or indirectly any consulting, advisory, or other compensatory fee from the issuer; or
(ii) Be an “interested person” of the investment company as defined in Section 2(a)(19) of the Act (15 U.S.C.80a-2(a)(19)).
The audit committee financial expert is Dennis P. Harrington. He is not an “interested person” of the Registrant and is also “independent” as defined by the U.S. Securities and Exchange Commission for purposes of audit committee financial expert determinations.
(3) If the registrant provides the disclosure required by paragraph (a)(1)(ii) of this Item, it must explain why it does not have an audit committee financial expert.
Not applicable.
ITEM 4. PRINCIPAL ACCOUNTANT FEES AND SERVICES.
(a) Disclose, under the caption Audit Fees, the aggregate fees billed for each of the last two fiscal years for professional
services rendered by the principal accountant for the audit of the registrant’s annual financial statements or services that are normally provided by the accountant in connection with statutory and regulatory filings or engagements for those fiscal years.
AUDIT FEES
2019 – $125,734
2018 – $57,536
(b) Disclose, under the caption Audit-Related Fees, the aggregate fees billed in each of the last two fiscal years for assurance and related services by the principal accountant that are reasonably related to the performance of the audit of the registrant’s financial statements and are not reported under paragraph (a) of this Item. Registrants shall describe the nature of the services comprising the fees disclosed under this category.
AUDIT-RELATED FEES
2019 – $17,820
2018 – $11,680
Audit-related fees consists of semi-annual financial statement reviews and security count procedures performed as required under Rule17f-2 of the Investment Company Act of 1940 during the Registrant’s fiscal year.
(c) Disclose, under the caption Tax Fees, the aggregate fees billed in each of the last two fiscal years for professional services rendered by the principal accountant for tax compliance, tax advice, and tax planning. Registrants shall describe the nature of the services comprising the fees disclosed under this category.
TAX FEES
2019 – $40,118
2018 – $22,244
The tax fees consist of fees billed in connection with preparing the federal regulated investment company income tax returns for the Registrant for the tax years ended June 30, 2019 and 2018, respectively.
For the last fiscal year, no tax fees were required to be approved pursuant to paragraph (c)(7)(ii) of Rule2-01 of RegulationS-X.
(d) Disclose, under the caption All Other Fees, the aggregate fees billed in each of the last two fiscal years for products and services provided by the principal accountant, other than the services reported in paragraphs (a) through (c) of this Item. Registrants shall describe the nature of the services comprising the fees disclosed under this category.
ALL OTHER FEES
2019 – Not applicable
2018 – Not applicable
(e) (1) Disclose the audit committee’spre-approval policies and procedures described in paragraph (c)(7) of Rule2-01 of RegulationS-X.
Pursuant to the Registrant’s Audit Committee Charter and written policies and procedures for thepre-approval of audit andnon-audit services (the“Pre-approval Policy”), the Audit Committeepre-approves all audit andnon-audit services performed by the Registrant’s independent public registered accounting firm for the Registrant. In addition, the Audit Committeepre-approves the auditor’s engagement fornon-audit services with the Registrant’s investment adviser (not including asub-adviser whose role is primarily portfolio management and issub-contracted or overseen by another investment adviser) and any Service Affiliate in accordance with paragraph (c)(7)(ii) of Rule2-01 of RegulationS-X, if the engagement relates directly to the operations and financial reporting of the Registrant. Proposed services may bepre-approved either 1) without consideration of specificcase-by-case services or 2) require the specificpre-approval of the Audit Committee. Therefore, initially thePre-approval Policy listed a number of audit andnon-audit services that have been approved by the Audit Committee, or which were not subject topre-approval under the transition provisions of Sarbanes-Oxley Act of 2002 (the
“Pre-approval List”). The Audit Committee annually reviews andpre-approves the services included on thePre-approval List that may be provided by the independent public registered accounting firm without obtaining additional specificpre-approval of individual services from the Audit Committee. The Audit Committee adds to, or subtracts from, the list of generalpre-approved services from time to time, based on subsequent determinations. All other audit andnon-audit services not on thePre-approval List must be specificallypre-approved by the Audit Committee.
One or more members of the Audit Committee may be appointed as the Committee’s delegate for the purposes of considering whether to approve such services. Anypre-approvals granted by the delegate will be reported, for informational purposes only, to the Audit Committee at its next scheduled meeting. The Audit Committee’s responsibilities topre-approve services performed by the independent public registered accounting firm are not delegated to management.
(2) Disclose the percentage of services described in each of paragraphs (b) through (d) of this Item that were approved by the audit committee pursuant to paragraph (c)(7)(i)(C) of Rule2-01 of RegulationS-X.
2019 – 0.0%
2018 – 0.0%
(f) If greater than 50 percent, disclose the percentage of hours expended on the principal accountant’s engagement to audit the registrant’s financial statements for the most recent fiscal year that were attributed to work performed by persons other than the principal accountant’s full-time, permanent employees.
Not applicable - Less than 50%.
(g) Disclose the aggregatenon-audit fees billed by the registrant’s accountant for services rendered to the registrant, and rendered to the registrant’s investment adviser (not including anysub-adviser whose role is primarily portfolio management and is subcontracted with or overseen by another investment adviser), and any entity controlling, controlled by, or under common control with the adviser that provides ongoing services to the registrant for each of the last two fiscal years of the registrant.
The aggregatenon-audit fees billed by the independent registered public accounting firm for services rendered to the Registrant, and rendered to Service Affiliates, for the last two calendar year ends were:
2018 - $30.3 million
2017 - $32.0 million
(h) Disclose whether the registrant’s audit committee of the board of directors has considered whether the provision ofnon-audit services that were rendered to the registrant’s investment adviser (not including any subadviser whose role is primarily portfolio management and is subcontracted with or overseen by another investment adviser), and any entity controlling, controlled by, or under common control with the investment adviser that provides ongoing services to the registrant that were notpre-approved pursuant to paragraph (c)(7)(ii) of Rule2-01 of RegulationS-X is compatible with maintaining the principal accountant’s independence.
The Registrant’s Audit Committee has considered whether the provision of thenon-audit services that were rendered to Service Affiliates that were notpre-approved (not requiringpre-approval) is compatible with maintaining the independent public registered accounting firm’s independence. All services provided by the independent public registered accounting firm to the Registrant or to Service Affiliates that were required to bepre-approved werepre-approved as required.
ITEM 5. AUDIT COMMITTEE OF LISTED REGISTRANTS.
(a) If the registrant is a listed issuer as defined in Rule10A-3 under the Exchange Act (17CFR240.10A-3), state whether or not the registrant has a separately-designated standing audit committee established in accordance with Section 3(a)(58)(A) of the Exchange Act (15 U.S.C. 78c(a)(58)(A)). If the registrant has such a committee, however designated, identify each committee member. If the entire board of directors is acting as the registrant’s audit committee as specified in Section 3(a)(58)(B) of the Exchange Act (15 U.S.C. 78c(a)(58)(B)), so state.
(b) If applicable, provide the disclosure required by Rule10A-3(d) under the Exchange Act (17CFR240.10A-3(d)) regarding an exemption from the listing standards for all audit committees.
Not applicable.
ITEM 6. INVESTMENTS.
File Schedule I – Investments in securities of unaffiliated issuers as of the close of the reporting period as set forth inSection 210.12-12 of RegulationS-X, unless the schedule is included as part of the report to shareholders filed under Item 1 of this Form.
Included in Item 1.
ITEM 7. DISCLOSURE OF PROXY VOTING POLICIES AND PROCEDURES FORCLOSED-END MANAGEMENT INVESTMENT COMPANIES.
Not applicable.
ITEM 8. PORTFOLIO MANAGERS OFCLOSED-END MANAGEMENT INVESTMENT COMPANIES.
Not applicable.
ITEM 9. PURCHASE OF EQUITY SECURITIES BYCLOSED-END MANAGEMENT INVESTMENT COMPANY AND AFFILIATED PURCHASERS.
Not applicable.
ITEM 10. SUBMISSION OF MATTERS TO A VOTE OF SECURITY HOLDERS.
Describe any material changes to the procedures by which shareholders may recommend nominees to the registrant’s board of directors, where those changes were implemented after the registrant last provided disclosure in response to the requirements of Item 7(d)(2)(ii)(G) of Schedule 14A (17 CFR240.14a-101), or this Item.
No material changes to report.
ITEM 11. CONTROLS AND PROCEDURES.
(a) Disclose the conclusions of the registrant’s principal executive and principal financial officers, or persons performing similar functions, regarding the effectiveness of the registrant’s disclosure controls and procedures (as defined in Rule30a-3(c) under the Act (17 CFR270.30a-3(c))) as of a date within 90 days of the filing date of the report that includes the disclosure required by this paragraph, based on the evaluation of these controls and procedures required by Rule30a-3(b) under the Act (17 CFR270.30a-3(b)) and Rules13a-15(b) or15d-15(b) under the Exchange Act (17 CFR240.13a-15(b) or240.15d-15(b)).
The Registrant’s principal executive and principal financial officers have concluded, based on their evaluation of the Registrant’s disclosure controls and procedures as of a date within 90 days of the filing date of this report, that the Registrant’s disclosure controls and procedures are reasonably designed to ensure that information required to be disclosed by the Registrant on FormN-CSR is recorded, processed, summarized and reported within the required time periods and that information required to be disclosed by the Registrant in the reports that it files or submits on FormN-CSR is accumulated and communicated to the Registrant’s management, including its principal executive and principal financial officers, as appropriate to allow timely decisions regarding required disclosure.
(b) Disclose any change in the registrant’s internal control over financial reporting (as defined in Rule30a-3(d) under the Act (17 CFR270.30a-3(d)) that occurred during the registrant’s second fiscal quarter of the period covered by this report that has materially affected, or is reasonably likely to materially affect, the registrant’s internal control over financial reporting.
There were no changes in the Registrant’s internal control over financial reporting that occurred during the last fiscal quarter covered by this report that have materially affected, or are reasonably likely to materially affect, the Registrant’s internal control over financial reporting.
ITEM 12. DISCLOSURE OF SECURITIES LENDING ACTIVITIES FORCLOSED-END MANAGEMENT INVESTMENT COMPANIES.
Not applicable.
ITEM 13. EXHIBITS.
| | (a) | File the exhibits listed below as part of this Form. Letter or number the exhibits in the sequence indicated. |
(1) Any code of ethics, or amendment thereto, that is the subject of the disclosure required by Item 2, to the extent that the registrant intends to satisfy the Item 2 requirements through filing of an exhibit.
Code of Ethics applicable to its Principal Executive and Principal Financial Officers pursuant to Section 406 of the Sarbanes-Oxley Act of 2002 attached hereto.
(2) A separate certification for each principal executive officer and principal financial officer of the registrant as required by Rule30a-2(a) under the Act (17 CFR270.30a-2).
Certifications pursuant to Rule30a-2(a) under the Investment Company Act of 1940 are attached hereto.
(3) Any written solicitation to purchase securities under Rule23c-1 under the Act (17 CFR270.23c-1) sent or given during the period covered by the report by or on behalf of the registrant to 10 or more persons.
Not applicable.
| | (b) | A separate or combined certification for each principal executive officer and principal officer of the registrant as required by Rule30a-2(b) under the Act of 1940. |
Certifications pursuant to Rule30a-2(b) under the Investment Company Act of 1940 are attached hereto.
SIGNATURES
Pursuant to the requirements of the Securities Exchange Act of 1934 and the Investment Company Act of 1940, the registrant has duly caused this report to be signed on its behalf by the undersigned, thereunto duly authorized.
JPMorgan Trust IV
| | |
| By: | | /s/ Brian S. Shlissel |
| | Brian S. Shlissel |
| | President and Principal Executive Officer |
| | August 30, 2019 |
Pursuant to the requirements of the Securities Exchange Act of 1934 and the Investment Company Act of 1940, this report has been signed below by the following persons on behalf of the registrant and in the capacities and on the dates indicated.
| | |
| By: | | /s/ Brian S. Shlissel |
| | Brian S. Shlissel |
| | President and Principal Executive Officer |
| | August 30, 2019 |
| |
| By: | | /s/ Timothy J. Clemens |
| | Timothy J. Clemens |
| | Treasurer and Principal Financial Officer |
| | August 30, 2019 |